Attached files
| file | filename |
|---|---|
| EX-99.1 - EXHIBIT 99.1 - STONERIDGE INC | tm2034479d1_ex99-1.htm |
| 8-K - FORM 8-K - STONERIDGE INC | tm2034479d1_8k.htm |

Q3 2020 Results October 29, 2020 Exhibit 99.2

2 Forward - Looking Statements Statements in this presentation that are not historical facts are forward - looking statements, which involve risks and uncertaint ies that could cause actual events or results to differ materially from those expressed or implied by the statements. Important factors that ma y cause actual results to differ materially from those in the forward - looking statements include, among other factors, the impact of the global COVID - 19 pandemic on our business, results of operations and financial condition; the loss or bankruptcy of a major customer; the cost s a nd timing of facility closures, business realignment or similar actions; a significant change in automotive, commercial, off - highway, motorcy cle and agricultural vehicle production; our ability to achieve cost reductions that offset or exceed customer - mandated selling price re ductions; a significant change in general economic conditions in any of the various countries in which Stoneridge operates; labor disrupt ion s at Stoneridge’s facilities or at any of Stoneridge’s significant customers or suppliers; the ability of suppliers to supply Ston eri dge with parts and components at competitive prices on a timely basis; the amount of Stoneridge’s indebtedness and the restrictive covenants con tai ned in the agreements governing its indebtedness, including its revolving credit facility; customer acceptance of new products; capital ava ilability or costs, including changes in interest rates or market perceptions; the failure to achieve successful integration of any acquir ed company or business; the occurrence or non - occurrence of circumstances beyond Stoneridge’s control; and the items described in “Risk Factor s” and other uncertainties or risks discussed in Stoneridge’s periodic and current reports filed with the Securities and Exchange Co mmi ssion. Important factors that could cause the performance of the commercial vehicle and automotive industry to differ materially fro m t hose in the forward - looking statements include factors such as (1) continued economic instability or poor economic conditions in the United States and global markets, including as a result of the global COVID - 19 pandemic, (2) changes in economic conditions, housing prices, forei gn currency exchange rates, commodity prices, including shortages of and increases or volatility in the price of oil, (3) changes in laws an d regulations, (4) the state of the credit markets, (5) political stability, (6) international conflicts and (7) the occurrence of force maj eur e events. These factors should not be construed as exhaustive and should be considered with the other cautionary statements in Stonerid ge’ s filings with the Securities and Exchange Commission. Forward - looking statements are not guarantees of future performance; Stoneridge’s actual results of operations, financial condit ion and liquidity, and the development of the industry in which Stoneridge operates may differ materially from those described in or sug gested by the forward - looking statements contained in this presentation. In addition, even if Stoneridge’s results of operations, financial co ndition and liquidity, and the development of the industry in which Stoneridge operates are consistent with the forward - looking statements c ontained in this presentation, those results or developments may not be indicative of results or developments in subsequent periods. This presentation contains time - sensitive information that reflects management’s best analysis only as of the date of this prese ntation. Any forward - looking statements in this presentation speak only as of the date of this presentation, and Stoneridge undertakes no obl igation to update such statements. Comparisons of results for current and any prior periods are not intended to express any future tren ds or indications of future performance, unless expressed as such, and should only be viewed as historical data. Stoneridge does not undertake any obligation to publicly update or revise any forward - looking statement as a result of new infor mation, future events or otherwise, except as otherwise required by law. Rounding Disclosure: There may be slight immaterial differences between figures represented in our public filings compared t o w hat is shown in this presentation. The differences are the result of rounding due to the representation of values in millions rathe r t han thousands in public filings.

3 Overview of Achievements x Continued strong execution in Q3 on revenue that exceeded our expectations x Adjusted gross margin and adjusted operating margin improved by 80 bps and 140 bps, respectively, vs. Q1 x Q3 incremental adjusted contribution margin* of 35.8% vs. Q2 x Liquidity remains strong with net debt reduction of $10.3 million in Q3 (Q3 net debt / adjusted EBITDA of 2.4x) x Continued progress with MirrorEye retrofit and pre - wire applications – continuing preparations for OEM launches in 2021 x Pre - wire orders began end of Q3 - receiving orders from current fleet partners and fleets outside of current evaluation partners x Portfolio transformation continues x Previously announced planned exit of soot sensor product lines remains on track x Lease in place with premium tenant for vacated building in Canton, MA – evaluating divestiture opportunities for the building in 2021 x Strong 2021 outlook driven by expected revenue of at least $715 million (growth of 20%+ adjusted for the discontinued soot sensor business) Q 3 2020 Financial Performance Reported Adjusted Sales $175.8 million -- Gross Profit Margin $46.0 million 26.2% $46.7 million 26.5% Operating Income Margin $9.8 million 5.6% $8.2 million 4.7% Tax Rate 21.3% 28.9% EPS $0.25 $0.18 EBITDA Margin $18.5 million 10.5% $16.9 million 9.7% 2020 Updated Guidance Q4 2020 Guidance 2020 Adjusted Guidance Sales $165 – $175 million $624 – $634 million Gross Margin 25.0% – 26.0% 23.75% - 24.25% Operating Margin 0.0% – 2.0% (1.0%) – 0.0% Tax Rate ~$1.25 million expense nmf EPS ($0.05) - $0.05 ($0.22) – ($0.12) EBITDA Margin 5.5% - 7.5% 4.5% – 5.5% *Adjusted contribution margin is calculated as incremental adjusted operating income divided by incremental revenue

4 2020 Q3 Financial Highlights Sales Adjusted Gross Margin Adjusted Operating Margin $’s in USD Millions Revenue increase of 76.6% vs. Q2 Revenue outperformed previously outlined expectations due to accelerated ramp - up of global production levels, particularly in Control Devices Adjusted contribution margin of 35.8% in Q3 vs. Q2 exceeded previously outlined expectations for the quarter on improved revenue performance Adjusted gross margin improved by 80 basis points vs. Q1 Adjusted operating margin improved by 140 basis points vs. Q1 Incremental costs associated with COVID - 19 of approximately $0.8 million during the third quarter Q 3 Financial Highlights Efficient ramp - up of production and cost management led to an 80 basis point improvement in gross margin and a 140 basis point improvement in operating margin vs. Q1 $6.0 ($19.1) $8.2 3.3% - 19.2% 4.7% Q1 2020 Q2 2020 Q3 2020 $183.0 $99.5 $175.8 Q1 2020 Q2 2020 Q3 2020 $47.0 $14.4 $46.7 25.7% 14.5% 26.5% 0% 5% 10% 15% 20% 25% 30% $- $10.0 $20.0 $30.0 $40.0 $50.0 Q1 2020 Q2 2020 Q3 2020

5 0 5 10 15 20 Q3 Q4 2020 2021 4 th quarter weighted average end markets expected to remain approximately flat vs. Q3 Weighted average OEM end markets expected to increase by 13.5% in 2021 compared to 2020 2020 and 2021 Updated Volume Outlook Q2 Earnings Call Data Current Outlook Passenger Car Forecast (Millions of Units) Commercial Vehicle Forecast (Thousands of Units) North America 43.8% of 2019 Sales Europe 2.7% of 2019 Sales China 5.3% of 2019 Sales North America 9.0% of 2019 Sales Europe 19.0% of 2019 Sales China 0.7% of 2019 Sales 14.2 % 2.2 % 6 .1% 43.6 % 4.5% 2.6% 10 .0% 48.9 % 18.0 % 27.4% Sourc e: June 2020 IHS, September 2020 IHS, Q2 2020 LMC, Q3 2020 LMC 3.3 % 29.0 % 1.9 % 10.2 % 0 5 10 15 20 Q3 Q4 2020 2021 2.6 % 2.9 % 1 .9% 4.3 % 0.0 % 2 .4% 2.7% 2.7 % 0 5 10 15 20 25 Q3 Q4 2020 2021 85.2 % 90.5 % 0 200 400 600 Q3 Q4 2020 2021 0 200 400 600 Q3 Q4 2020 2021 0 500 1000 1500 2000 Q3 Q4 2020 2021

6 2021 Preliminary Revenue Outlook 2020 Adjusted Midpoint Guidance New Program Launches Including Incremental MirrorEye Retrofit Discontinued Soot Sensor Product Line $629m $715m+ Production forecasts and program launches expected to drive revenue of over $715 million in 2021 (growth of at least 20% adjusted for the discontinued soot sensor business) 2021 preliminary revenue outlook, adjusted for the impact of the discontinued soot sensor business (approximately $33 million in 2020), is expected to increase by at least 20% to over $715 million Production forecasts suggesting weighted - average end markets will improve by 13.5% in 2021 New program launches, including the annualization of park - by - wire programs, the launch of a global instrument cluster platform and the continued ramp - up of MirrorEye retrofit and pre - wire applications as well as our first OEM programs expected to drive incremental growth Based on our current outlook, Q3 2020 expected to be a good basis for 2021 performance and good comparison point for contribution margin on expected incremental revenue Contracted Price Downs Annual Price Downs Average (1 - 2%) Production Forecasts Weighted Average ~13.5% 2021 Revenue Outlook 2021 Preliminary Revenue Outlook 2020 Adjusted Midpoint Guidance (Ex. Soot) $596m Forecasted Currency Rates

7 MirrorEye Update Retrofit Current State ▸ Retrofit expansion with 3 fleet partners ▸ Pre - wire launched at end of Q3 with Daimler Truck North America ▸ Initial pre - wire orders came from existing fleet evaluation partner and fleets outside of current fleet partner network Retrofit Outlook ▸ Expecting continued ramp - up of pre - wire orders as well as traditional retrofit applications in 2021 ▸ Targeting additional OEMs for pre - wire applications in 2021 ▸ MirrorEye retrofit revenue expected to be ~$10 million in 2021 OEM Outlook ▸ 2021 OEM MirrorEye revenue expected to be $5 - $10 million based on a 10 - 15% penetration rate and current launch timing MirrorEye retrofit and pre - wire programs remain on - track Preparing for first OEM program launches in 2021 Note: North American portion of Program 3 expected in 2024 due to customer delay in North American platform launch OEM Program Expected SOP Estimated Peak Annual Revenue at Time of Award Estimated Take Rate at Time of Award Program 1 Q2 / Q3 2021 $11M 10% Program 2 Q4 2021 $16M ~15% Program 3 2023 (EU) 2024 (NA) $46M ~25% (EU) ~10% (NA) Program 4 2023 $4M <5% Total N/A $76M ~15%

8 Summary Summary x Strong execution as production volumes ramped back up globally x Adjusted gross margin and adjusted operating margin improved by 80 bps and 140 bps, respectively, vs. Q1 x Adjusted contribution margin exceeded 35% vs. Q2 x Efficient cash management drove net debt reduction in Q3 that approximately offset increase in Q2 x Focus remains on MirrorEye retrofit / pre - wire opportunities and preparation for first OEM program launches in 2021 2021 Outlook x Expecting continued strong recovery in our end markets based on forecasted production volumes x Weighted average end market growth of 13.5% forecasted in 2021 x Expecting program launches to contribute to revenue growth of 20%+ in 2021 (adjusting for the discontinued soot sensor business) x Based on current market conditions and outlook, expecting at least $715 million of revenue in 2021 Driving shareholder value by executing on variables within our control, responding to factors that are out of our control and executing on our long - term strategy to drive profitable growth

9 Financial Update
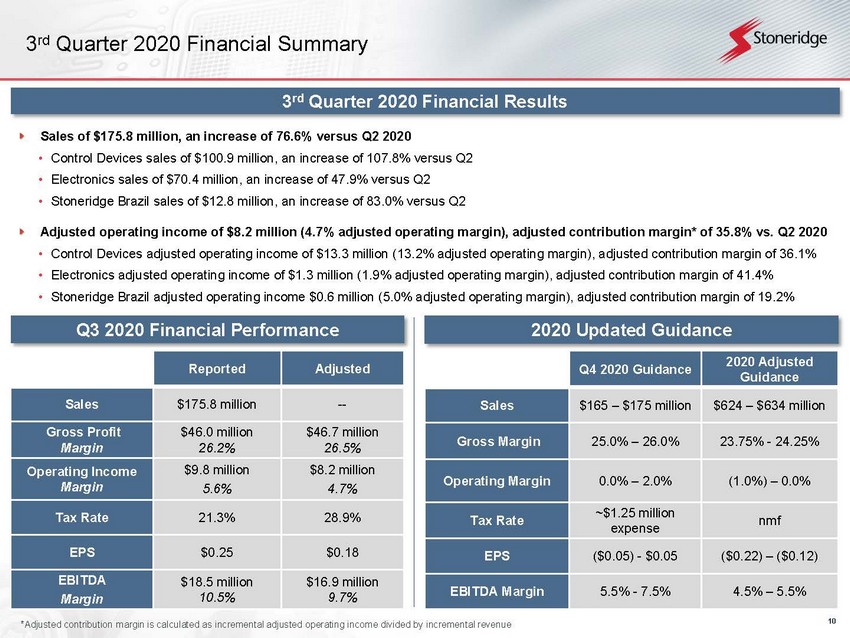
10 3 rd Quarter 2020 Financial Summary 3 rd Quarter 2020 Financial Results Sales of $175.8 million, an increase of 76.6% versus Q2 2020 • Control Devices sales of $100.9 million, an increase of 107.8% versus Q2 • Electronics sales of $70.4 million, an increase of 47.9% versus Q2 • Stoneridge Brazil sales of $12.8 million, an increase of 83.0% versus Q2 Adjusted operating income of $8.2 million (4.7% adjusted operating margin), adjusted contribution margin* of 35.8% vs. Q2 202 0 • Control Devices adjusted operating income of $13.3 million (13.2% adjusted operating margin), adjusted contribution margin of 36 .1% • Electronics adjusted operating income of $1.3 million (1.9% adjusted operating margin), adjusted contribution margin of 41.4% • Stoneridge Brazil adjusted operating income $0.6 million (5.0% adjusted operating margin), adjusted contribution margin of 19 .2% Q 3 2020 Financial Performance Reported Adjusted Sales $175.8 million -- Gross Profit Margin $46.0 million 26.2% $46.7 million 26.5% Operating Income Margin $9.8 million 5.6% $8.2 million 4.7% Tax Rate 21.3% 28.9% EPS $0.25 $0.18 EBITDA Margin $18.5 million 10.5% $16.9 million 9.7% 2020 Updated Guidance Q4 2020 Guidance 2020 Adjusted Guidance Sales $165 – $175 million $624 – $634 million Gross Margin 25.0% – 26.0% 23.75% - 24.25% Operating Margin 0.0% – 2.0% (1.0%) – 0.0% Tax Rate ~$1.25 million expense nmf EPS ($0.05) - $0.05 ($0.22) – ($0.12) EBITDA Margin 5.5% - 7.5% 4.5% – 5.5% *Adjusted contribution margin is calculated as incremental adjusted operating income divided by incremental revenue

11 2020 Q3 Financial Highlights (continued) $’s in USD Millions Every aspect of the P&L improved in Q3 vs. Q1 – continued focus on strategic priorities and management of externalities driving strong financial performance and outlook $96.6 $53.2 $92.4 52.8% 53.4% 52.6% 52% 52% 52% 53% 53% 53% 53% 53% 54% $- $20.0 $40.0 $60.0 $80.0 $100.0 $120.0 Q1 2020 Q2 2020 Q3 2020 $9.9 $6.2 $8.8 5.4% 6.2% 5.0% 0% 1% 2% 3% 4% 5% 6% 7% $- $2.0 $4.0 $6.0 $8.0 $10.0 $12.0 Q1 2020 Q2 2020 Q3 2020 Direct labor improved by 40 basis points vs. Q1 Direct material improved by 20 basis points vs. Q1 $29.4 $25.7 $27.8 16.1% 25.9% 15.8% 0% 5% 10% 15% 20% 25% 30% $23.0 $24.0 $25.0 $26.0 $27.0 $28.0 $29.0 $30.0 Q1 2020 Q2 2020 Q3 2020 Adjusted overhead improved by 30 basis points vs. Q1 $41.0 $33.5 $38.4 22.4% 33.7% 21.9% 0% 5% 10% 15% 20% 25% 30% 35% 40% 0.0 5.0 10.0 15.0 20.0 25.0 30.0 35.0 40.0 45.0 Q1 2020 Q2 2020 Q3 2020 Adjusted operating expenses improved by 50 basis points vs. Q1 Direct Material Direct Labor Adjusted Overhead Adjusted Operating Expenses

12 Control Devices Financial Performance Return to normalized production levels in Q4 and typical seasonality expected to reduce revenue vs. Q3 Control Devices Q4 Expectations Expecting return to normalized production levels in Q4 after ramp - up in Q3 that exceeded expectations – typical Q4 seasonality expected to contribute to moderate decline in revenue vs. Q3 Expecting unfavorable product mix and reduced leverage on fixed overhead driven by lower Q4 revenue to result in reduced Q4 gross margin vs. Q3 Quarterly Performance Sales Adjusted Operating Income $’s in USD Millions Control Devices Q3 Summary Revenue increase of 107.8% vs. Q2 driven by production ramp - ups at customer facilities in North America (particularly on light truck, SUV and CUV platforms) Adjusted operating margin improved by 310 basis points vs. Q1 Adjusted contribution margin of 36.1% vs. Q2 2020 $98.2 $48.6 $100.9 Q1 2020 Q2 2020 Q3 2020 $9.9 - $5.6 $13.3 10.1% - 11.5% 13.2% Q1 2020 Q2 2020 Q3 2020

13 Electronics Financial Performance Expecting continued revenue growth in Q4 Expecting strong revenue performance in 2021 Electronics Q4 Expectations and 2021 Outlook Expecting continued revenue growth in Q4 as global commercial vehicle production continues to ramp - up Q4 product mix expected to reduce gross margin while incremental SG&A and D&D in Q4 due to the reinstatement of certain wage and benefit programs and normalization of other operating expenses Incremental D&D expenses expected to continue to support launches of large programs in 2021 expected to reduce segment operating margin in Q4 before ramp - up of launched programs in 2021 2021 revenue expected to increase significantly, driven by the launch of a new global driver information system program and continued MirrorEye ramp - up Quarterly Performance Sales Adjusted Operating Income $’s in USD Millions Electronics Q3 Summary Revenue increase of 47.9% vs. Q2 driven by broad production ramp - ups at customer facilities in North America and Europe Continued focus on direct material cost reduction programs resulted in material cost improvement of 100 bps vs. Q1 Incremental adjusted contribution margin of 41.4% vs. Q2 2020 $79.8 $47.6 $70.4 Q1 2020 Q2 2020 Q3 2020 $2.9 - $8.1 $1.3 3.6% - 17.1% 1.9% Q1 2020 Q2 2020 Q3 2020

14 Stoneridge Brazil Financial Performance Continued macroeconomic challenges expected to result in stable Q4 performance and moderate revenue growth in 2021 Stoneridge Brazil Q4 Expectations and 2021 Outlook Expecting stable revenue and Q4 margin vs. Q3 as local COVID risk remains Expecting moderate revenue growth in 2021 despite continued macroeconomic challenges Stoneridge Brazil Q3 Summary Revenue increase of 83.0% versus Q2 Incremental adjusted contribution margin of 19.2% vs. Q2 2020 Quarterly Performance Sales Adjusted Operating Income $’s in USD Millions $0.4 - $0.5 $0.6 2.6% - 6.9% 5.0% Q1 2020 Q2 2020 Q3 2020 $14.6 $7.0 $12.8 Q1 2020 Q2 2020 Q3 2020
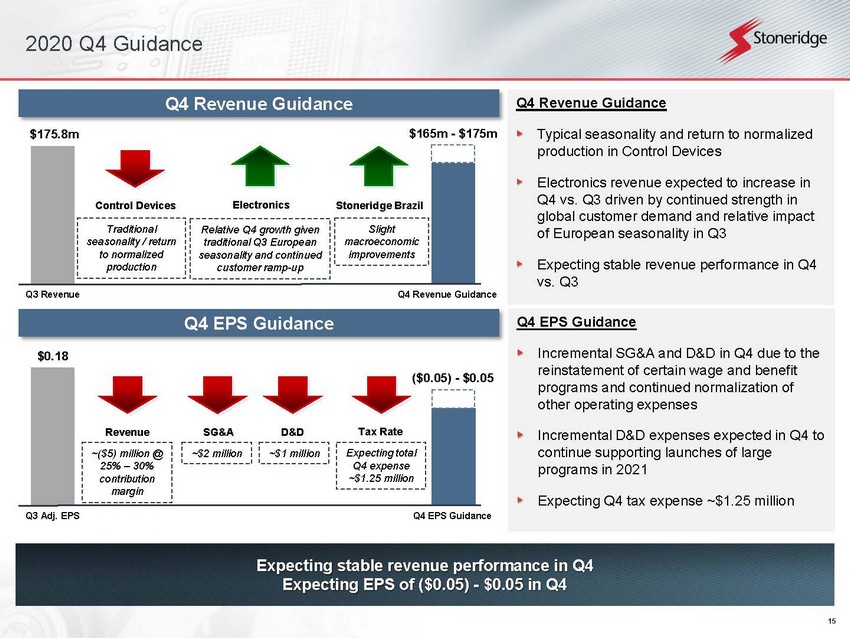
15 2020 Q4 Guidance Q3 Revenue Electronics Control Devices $175.8m Expecting stable revenue performance in Q4 Expecting EPS of ($0.05) - $0.05 in Q4 Q4 Revenue Guidance Typical seasonality and return to normalized production in Control Devices Electronics revenue expected to increase in Q4 vs. Q3 driven by continued strength in global customer demand and relative impact of European seasonality in Q3 Expecting stable revenue performance in Q4 vs. Q3 Q4 Revenue Guidance $165m - $175m Q4 EPS Guidance Incremental SG&A and D&D in Q4 due to the reinstatement of certain wage and benefit programs and continued normalization of other operating expenses Incremental D&D expenses expected in Q4 to continue supporting launches of large programs in 2021 Expecting Q4 tax expense ~$1.25 million Stoneridge Brazil Q3 Adj. EPS $0.18 Q4 EPS Guidance ($0.05) - $0.05 SG&A ~$2 million D&D ~$1 million Revenue ~($5) million @ 25% – 30% contribution margin Slight macroeconomic improvements Relative Q4 growth given traditional Q3 European seasonality and continued customer ramp - up Traditional seasonality / return to normalized production Tax Rate Expecting total Q4 expense ~$1.25 million Q 4 Revenue Guidance Q 4 EPS Guidance

16 Net Debt Update and Cash Flow Outlook Continued strong cash performance in Q3 Q3 Summary and Q4 Expectations Net debt decreased by approximately $10.3 million in Q3 Reduced revolving credit facility balance by $17.0 million during the quarter Q3 net debt / adjusted EBITDA of 2.4x Continue to manage cash and maintain a conservative balance sheet – Q4 net debt expected to be approximately in line with Q3 2.3x 1.1x 0.7x 0.6x Net Debt / Adjusted EBITDA 2.4x $55.3 $69.4 $81.3 $72.4 $68.3 $56.5 $59.7 $82.5 $93.6 $83.3 $111.8 $129.1 $163.8 $166.0 $151.6 Q3 2019 Q4 2019 Q1 2020 Q2 2020 Q3 2020 Cash Net Debt Net Debt and Leverage Ratio
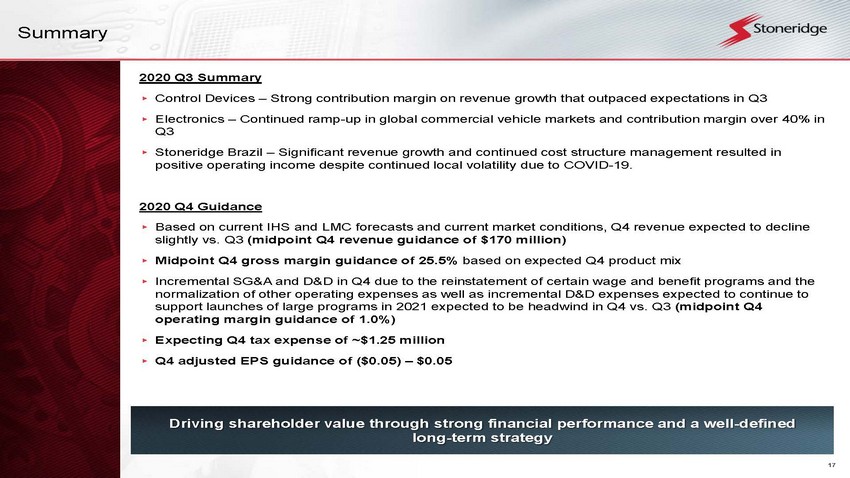
17 Summary 2020 Q3 Summary ▸ Control Devices – Strong contribution margin on revenue growth that outpaced expectations in Q3 ▸ Electronics – Continued ramp - up in global commercial vehicle markets and contribution margin over 40% in Q3 ▸ Stoneridge Brazil – Significant revenue growth and continued cost structure management resulted in positive operating income despite continued local volatility due to COVID - 19. 2020 Q4 Guidance ▸ Based on current IHS and LMC forecasts and current market conditions, Q4 revenue expected to decline slightly vs. Q3 (midpoint Q4 revenue guidance of $170 million) ▸ Midpoint Q4 gross margin guidance of 25.5% based on expected Q4 product mix ▸ Incremental SG&A and D&D in Q4 due to the reinstatement of certain wage and benefit programs and the normalization of other operating expenses as well as incremental D&D expenses expected to continue to support launches of large programs in 2021 expected to be headwind in Q4 vs. Q3 (midpoint Q4 operating margin guidance of 1.0%) ▸ Expecting Q4 tax expense of ~$1.25 million ▸ Q4 adjusted EPS guidance of ($0.05) – $0.05 Driving shareholder value through strong financial performance and a well - defined long - term strategy

18 Appendix

19 Income Statement CONDENSED CONSOLIDATED STATEMENTS OF OPERATIONS (Unaudited) (in thousands, except per share data) Net sales $ 175,764 $ 203,386 $ 458,275 $ 643,924 Costs and expenses: Cost of goods sold 129,769 151,531 353,629 474,389 Selling, general and administrative 24,414 30,978 81,610 94,088 Gain on disposal of Non-core Products, net - - - (33,599) Design and development 11,754 11,554 36,373 38,838 Operating income (loss) 9,827 9,323 (13,337) 70,208 Interest expense, net 1,882 1,149 4,322 3,153 Equity in earnings of investee (330) (318) (556) (1,230) Other (income) expense, net (253) 381 (1,879) (148) Income (loss) before income taxes 8,528 8,111 (15,224) 68,433 Provision (benefit) for income taxes 1,814 1,450 (3,694) 12,351 Net income (loss) $ 6,714 $ 6,661 $ (11,530) $ 56,082 Earnings (loss) per share: Basic $ 0.25 $ 0.24 $ (0.43) $ 2.01 Diluted $ 0.25 $ 0.24 $ (0.43) $ 1.97 Weighted-average shares outstanding: Basic 26,956 27,370 27,047 27,929 Diluted 27,223 27,796 27,047 28,425 Three months ended Nine months ended September 30, September 30, 2020 2019 2020 2019

20 Balance Sheet CONDENSED CONSOLIDATED BALANCE SHEETS (in thousands) (Unaudited) ASSETS Current assets: Cash and cash equivalents $ 68,288 $ 69,403 Accounts receivable, less reserves of $1,478 and $1,289, respectively 129,518 138,564 Inventories, net 88,144 93,449 Prepaid expenses and other current assets 33,865 29,850 Total current assets 319,815 331,266 Long-term assets: Property, plant and equipment, net 117,151 122,483 Intangible assets, net 52,030 58,122 Goodwill 37,499 35,874 Operating lease right-of-use asset 18,764 22,027 Investments and other long-term assets, net 36,691 32,437 Total long-term assets 262,135 270,943 Total assets $ 581,950 $ 602,209 LIABILITIES AND SHAREHOLDERS' EQUITY Current liabilities: Current portion of debt $ 7,515 $ 2,672 Accounts payable 76,716 80,701 Accrued expenses and other current liabilities 49,030 55,223 Total current liabilities 133,261 138,596 Long-term liabilities: Revolving credit facility 144,000 126,000 Long-term debt, net 59 454 Deferred income taxes 11,556 12,530 Operating lease long-term liability 15,142 17,971 Other long-term liabilities 13,560 16,754 Total long-term liabilities 184,317 173,709 Shareholders' equity: Preferred Shares, without par value, 5,000 shares authorized, none issued - - Common Shares, without par value, 60,000 shares authorized, 28,966 and 28,966 shares issued and 27,006 and 27,408 shares outstanding at September 30, 2020 and December 31, 2019, respectively, with no stated value - - Additional paid-in capital 232,060 225,607 Common Shares held in treasury, 1,960 and 1,558 shares at September 30, 2020 and December 31, 2019, respectively, at cost (60,482) (50,773) Retained earnings 195,012 206,542 Accumulated other comprehensive loss (102,218) (91,472) Total shareholders' equity 264,372 289,904 Total liabilities and shareholders' equity $ 581,950 $ 602,209 September 30, December 31, 2020 2019

21 Statement of Cash Flows CONDENSED CONSOLIDATED STATEMENTS OF CASH FLOWS (Unaudited) Nine months ended September 30 (in thousands) OPERATING ACTIVITIES: Net income (loss) $ (11,530) $ 56,082 Adjustments to reconcile net income to net cash provided by (used for) operating activities: Depreciation 20,030 18,227 Amortization, including accretion and write-off of deferred financing costs 4,153 5,035 Deferred income taxes (5,862) 4,374 Earnings of equity method investee (556) (1,230) Loss (gain) on sale of fixed assets 158 (132) Share-based compensation expense 3,535 4,699 Excess tax deficiency (benefit) related to share-based compensation expense 50 (655) Gain on disposal of Non-core Products, net - (33,599) Property, plant and equipment impairment charge 2,326 - Change in fair value of earn-out contingent consideration (3,045) 1,846 (Earnings) loss of venture capital fund (168) 16 Changes in operating assets and liabilities: Accounts receivable, net 7,107 (8,864) Inventories, net 3,683 (27,333) Prepaid expenses and other assets (2,599) (11,232) Accounts payable (2,303) 12,011 Accrued expenses and other liabilities (6,024) 1,277 Net cash provided by operating activities 8,955 20,522 2020 2019

22 Statement of Cash Flows (Cont.) INVESTING ACTIVITIES: Capital expenditures, including intangibles (24,331) (30,771) Proceeds from sale of fixed assets 43 329 Proceeds from disposal of Non-core Products - 34,386 Investment in venture capital fund (750) (1,200) Net cash (used for) provided by investing activities (25,038) 2,744 FINANCING ACTIVITIES: Revolving credit facility borrowings 71,500 81,500 Revolving credit facility payments (53,500) (69,000) Proceeds from issuance of debt 29,608 2,195 Repayments of debt (24,944) (1,300) Earn-out consideration cash payment - (3,394) Other financing costs (1,062) (1,346) Common Share repurchase program (4,995) (50,000) Repurchase of Common Shares to satisfy employee tax withholding (1,773) (4,037) Net cash provided by (used for) financing activities 14,834 (45,382) Effect of exchange rate changes on cash and cash equivalents 134 (3,713) Net change in cash and cash equivalents (1,115) (25,829) Cash and cash equivalents at beginning of period 69,403 81,092 Cash and cash equivalents at end of period $ 68,288 $ 55,263 Supplemental disclosure of cash flow information: Cash paid for interest $ 4,134 $ 3,210 Cash paid for income taxes, net $ 137 $ 11,858

23 Segment Financial Information Net Sales: Control Devices $ 99,942 $ 108,690 $ 243,797 $ 332,876 Inter-segment sales 971 1,185 3,877 5,124 Control Devices net sales 100,913 109,875 247,674 338,000 Electronics 62,995 78,154 180,071 260,560 Inter-segment sales 7,362 8,867 17,672 27,914 Electronics net sales 70,357 87,021 197,743 288,474 Stoneridge Brazil 12,827 16,542 34,407 50,488 Inter-segment sales - - - 6 Stoneridge Brazil net sales 12,827 16,542 34,407 50,494 Eliminations (8,333) (10,052) (21,549) (33,044) Total net sales $ 175,764 $ 203,386 $ 458,275 $ 643,924 Operating Income (Loss): Control Devices $ 12,450 $ 9,767 $ 10,116 $ 66,082 Electronics 647 7,661 (7,523) 24,247 Stoneridge Brazil 3,439 (451) 3,419 6,633 Unallocated Corporate (A) (6,709) (7,654) (19,349) (26,754) Total operating income (loss) $ 9,827 $ 9,323 $ (13,337) $ 70,208 Depreciation and Amortization: Control Devices $ 4,028 $ 3,310 $ 11,197 $ 9,601 Electronics 2,549 2,708 7,423 7,615 Stoneridge Brazil 973 1,571 3,696 4,791 Unallocated Corporate 500 297 1,522 726 Total depreciation and amortization (B) $ 8,050 $ 7,886 $ 23,838 $ 22,733 Interest Expense, net: Control Devices $ 99 $ 189 $ 269 $ 566 Electronics 103 79 503 198 Stoneridge Brazil 14 69 17 118 Unallocated Corporate 1,666 812 3,533 2,271 Total interest expense, net $ 1,882 $ 1,149 $ 4,322 $ 3,153 Capital Expenditures: Control Devices $ 2,833 $ 3,175 $ 8,496 $ 10,709 Electronics 1,618 5,473 9,678 12,567 Stoneridge Brazil 805 1,243 2,219 2,867 Unallocated Corporate (C) 524 683 1,201 1,910 Total capital expenditures $ 5,780 $ 10,574 $ 21,594 $ 28,053 2020 2019 Three months ended Nine months ended September 30, September 30, 2020 2019

24 Reconciliations to US GAAP

25 Reconciliations to US GAAP This document contains information about Stoneridge's financial results which is not presented in accordance with accounting principles generally accepted in the United States ("GAAP"). Such non - GAAP financial measures are reconciled to their closest GAAP financial measures in the appendix of this document. The provision of these non - GAAP financial measures is not intended to indicate that Stoneridge is explicitly or implicitly providing projections on those non - GAAP financial measures, and actual results for such measures are likely to vary from those presented. The reconciliations include all information reasonably available to the Company at the date of this document and the adjustments that management can reasonably predict.
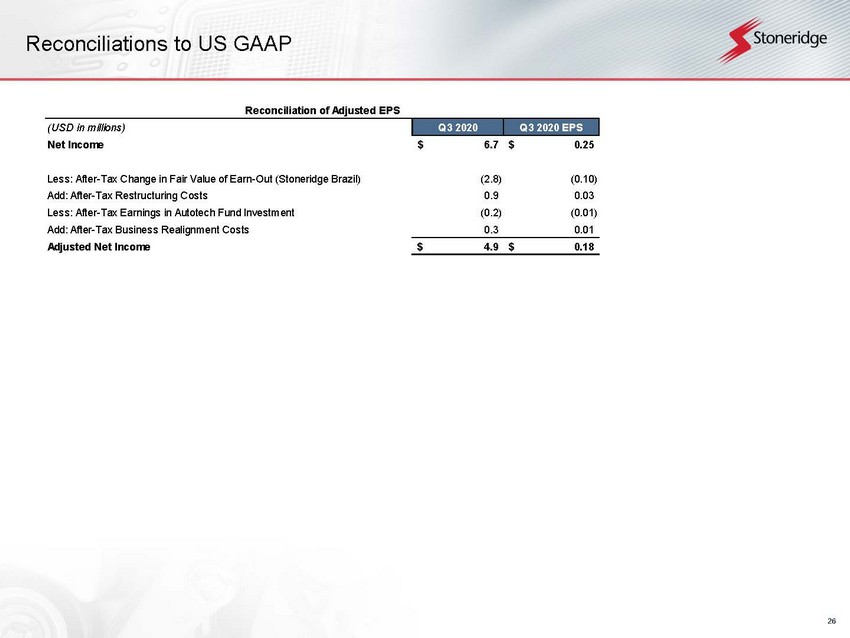
26 Reconciliations to US GAAP Reconciliation of Adjusted EPS (USD in millions) Q3 2020 Q3 2020 EPS Net Income 6.7$ 0.25$ Less: After-Tax Change in Fair Value of Earn-Out (Stoneridge Brazil) (2.8) (0.10) Add: After-Tax Restructuring Costs 0.9 0.03 Less: After-Tax Earnings in Autotech Fund Investment (0.2) (0.01) Add: After-Tax Business Realignment Costs 0.3 0.01 Adjusted Net Income 4.9$ 0.18$

27 Reconciliations to US GAAP Reconciliation of Adjusted Gross Profit (USD in millions) Q1 2020 Q2 2020 Q3 2020 Gross Profit 45.4$ 13.3$ 46.0$ Add: Pre-Tax Restructuring Costs 1.5 0.2 0.6 Add: Pre-Tax Business Realignment Costs 0.1 0.9 0.1 Adjusted Gross Profit 47.0$ 14.4$ 46.7$ Reconciliation of Adjusted Operating Income (Loss) (USD in millions) Q1 2020 Q2 2020 Q3 2020 Operating Income (Loss) 3.7$ (26.8)$ 9.8$ Add(Less): Pre-Tax Change in Fair Value of Earn-Out (Stoneridge Brazil) (0.6) 0.4 (2.8) Add(Less): Pre-Tax Loss (Earnings) in Autotech Fund Investment 0.0 0.1 (0.3) Add: Pre-Tax Restructuring Costs 2.2 4.6 1.1 Add: Pre-Tax Share-Based Comp Accelerated Vesting 0.1 0.0 - Add: Pre-Tax Business Realignment Costs 0.6 2.6 0.4 Adjusted Operating Income (Loss) 6.0$ (19.1)$ 8.2$ Reconciliation of Adjusted EBITDA (USD in millions) Q4 2018 Q1 2019 Q2 2019 Q3 2019 Q4 2019 Q1 2020 Q2 2020 Q3 2020 TTM Q3 2020 Income (Loss) Before Tax 12.7$ 11.5$ 48.8$ 8.1$ (0.0)$ 4.7$ (28.5)$ 8.5$ (15.3)$ Interest expense, net 1.0 1.0 1.0 1.1 1.2 1.0 1.4 1.9 5.5 Depreciation and amortization 7.4 7.2 7.6 7.9 8.1 8.1 7.9 8.1 32.2 EBITDA 21.2$ 19.7$ 57.4$ 17.1$ 9.3$ 13.8$ (19.2)$ 18.5$ 22.4$ Add(Less): Pre-Tax Change in Fair Value of Earn-Out (Stoneridge Brazil) (1.7) 0.5 0.5 0.9 0.4 (0.6) 0.4 (2.8) (2.6) Add(Less): Pre-Tax (Earnings) Loss in Autotech Fund Investment (0.0) 0.2 0.0 0.1 (0.3) 0.1 Add: Pre-Tax Restructuring Costs 3.4 2.8 3.6 3.7 3.4 2.2 4.6 1.1 11.4 Add: Pre-Tax Business Realignment Costs 1.1 0.4 0.3 0.6 2.6 0.4 3.9 Less: Pre-Tax Gain from Disposal of Non-Core Products (33.9) Less: Pre-Tax Recovery of Brazilian Indirect Taxes (6.5) Add: Pre-Tax Share-Based Comp Accelerated Vesting 0.5 0.2 0.1 0.0 - 0.1 Less: Pre-Tax Capitalized Software Development Expensed in Q1 and Q2 (0.8) Add: Pre-Tax Capitalized Software Development Capitalized in Q3 0.2 0.7 Less: Pre-Tax One-Time Sale of Non-Core Product Inventory (1.4) Adjusted EBITDA 22.9$ 24.2$ 20.9$ 21.5$ 13.7$ 16.1$ (11.4)$ 16.9$ 35.3$

28 Reconciliations to US GAAP *Adjusted operating expenses is equal to adjusted SG&A expenses plus adjusted D&D expenses. Reconciliation of Adjusted Overhead Expense (USD in millions) Q1 2020 Q2 2020 Q3 2020 Overhead Expense 31.0$ 26.9$ 28.5$ Less: Pre-Tax Restructuring Costs (1.5) (0.2) (0.6) Less: Pre-Tax Business Realignment Costs (0.1) (0.9) (0.1) Adjusted Operating Expense 29.4$ 25.7$ 27.8$ Reconciliation of Adjusted Operating Expenses* (USD in millions) Q1 2020 Q2 2020 Q3 2020 Operating Expenses 41.7$ 40.1$ 36.2$ Add(Less): Pre-Tax Change in Fair Value of Earn-Out (Stoneridge Brazil) 0.6 (0.4) 2.8 Add(Less): Pre-Tax Earnings (Loss) in Autotech Fund Investment (0.0) (0.1) 0.3 Less: Pre-Tax Restructuring Costs (0.7) (4.4) (0.5) Less: Pre-Tax Share-Based Comp Accelerated Vesting (0.1) (0.0) - Less: Pre-Tax Business Realignment Costs (0.5) (1.7) (0.3) Adjusted Operating Expenses 41.0$ 33.5$ 38.5$

29 Reconciliations to US GAAP

30 Reconciliations to US GAAP Reconciliation of Stoneridge Brazil Adjusted Operating Income (Loss) (USD in millions) Q1 2020 Q2 2020 Q3 2020 Stoneridge Brazil Operating Income (Loss) 0.9$ (0.9)$ 3.4$ Add(Less): Pre-Tax Change in Fair Value of Earn-Out (Stoneridge Brazil) (0.6) 0.4 (2.8) Add: Pre-Tax Business Realignment Costs 0.2 - 0.0 Stoneridge Brazil Adjusted Operating Income (Loss) 0.4$ (0.5)$ 0.6$ Reconciliation of Control Devices Adjusted Operating Income (Loss) (USD in millions) Q1 2020 Q2 2020 Q3 2020 Control Devices Operating Income (Loss) 7.3$ (9.7)$ 12.5$ Add: Pre-Tax Restructuring Costs 2.2 3.0 0.5 Add: Pre-Tax Business Realignment Costs 0.4 1.0 0.3 Control Devices Adjusted Operating Income (Loss) 9.9$ (5.6)$ 13.3$ Reconciliation of Electronics Adjusted Operating Income (Loss) (USD in millions) Q1 2020 Q2 2020 Q3 2020 Electronics Operating Income (Loss) 2.9$ (11.0)$ 0.6$ Add: Pre-Tax Restructuring Costs 0.0 1.6 0.6 Add: Pre-Tax Business Realignment Costs - 1.3 0.1 Electronics Adjusted Operating Income (Loss) 2.9$ (8.1)$ 1.3$