Attached files
| file | filename |
|---|---|
| EX-32.2 - EX-32.2 - Broadstone Net Lease, Inc. | ck1424182-ex322_9.htm |
| EX-32.1 - EX-32.1 - Broadstone Net Lease, Inc. | ck1424182-ex321_6.htm |
| EX-31.2 - EX-31.2 - Broadstone Net Lease, Inc. | ck1424182-ex312_7.htm |
| EX-31.1 - EX-31.1 - Broadstone Net Lease, Inc. | ck1424182-ex311_8.htm |
UNITED STATES
SECURITIES AND EXCHANGE COMMISSION
WASHINGTON, D.C. 20549
FORM 10-Q
|
☒ |
Quarterly report pursuant to Section 13 or 15(d) of the Securities Exchange Act of 1934 |
For the quarterly period ended June 30, 2020, or
|
☐ |
Transition report pursuant to section 13 or 15(d) of the Securities Exchange Act of 1934 |
Commission File Number 000-55774
BROADSTONE NET LEASE, INC.
(Exact name of registrant as specified in its charter)
|
Maryland |
26-1516177 |
|
(State or other jurisdiction of |
(I.R.S. Employer |
|
800 Clinton Square Rochester, New York |
14604 |
|
(Address of principal executive offices) |
(Zip Code) |
(585) 287-6500
(Registrant’s telephone number, including area code)
Securities registered pursuant to Section 12(b) of the Exchange Act:
|
Title of each class |
|
Trading Symbol(s) |
|
Name of each exchange on which registered |
|
None |
|
|
|
|
Indicate by check mark whether the registrant: (1) has filed all reports required to be filed by Section 13 or 15 (d) of the Securities Exchange Act of 1934 during the preceding 12 months (or for such shorter period that the registrant was required to file such reports), and (2) has been subject to such filing requirements for the past 90 days. Yes ☒ No ☐
Indicate by check mark whether the registrant has submitted electronically every Interactive Data File required to be submitted pursuant to Rule 405 of Regulation S-T (§232.405 of this chapter) during the preceding 12 months (or for such shorter period that the registrant was required to submit such files). Yes ☒ No ☐
Indicate by check mark whether the registrant is a large accelerated filer, an accelerated filer, a non-accelerated filer, a smaller reporting company, or an emerging growth company. See the definitions of “large accelerated filer,” “accelerated filer,” “smaller reporting company,” and “emerging growth company” in Rule 12b-2 of the Exchange Act.
|
Large accelerated filer |
|
☐ |
|
Accelerated filer |
|
☐ |
|
Non-accelerated filer |
|
☒ |
|
Smaller reporting company |
|
☐ |
|
Emerging growth company |
|
☒ |
|
|
|
|
If an emerging growth company, indicate by check mark if the registrant has elected not to use the extended transition period for complying with any new or revised financial accounting standards provided pursuant to Section 13(a) of the Exchange Act. ☒
Indicate by check mark whether the registrant is a shell company (as defined in Rule 12b-2 of the Exchange Act). Yes ☐ No ☒
There were 26,858,342.567 shares of the Registrant’s common stock, $0.001 par value per share, outstanding as of August 1, 2020.
TABLE OF CONTENTS
|
|
Page |
|
|
1 |
||
|
Item 1. |
1 |
|
|
|
1 |
|
|
|
Condensed Consolidated Statements of Income and Comprehensive Income (Loss) (Unaudited) |
2 |
|
|
Condensed Consolidated Statements of Stockholders’ Equity and Mezzanine Equity (Unaudited) |
3 |
|
|
5 |
|
|
|
Notes to the Condensed Consolidated Financial Statements (Unaudited) |
6 |
|
Item 2. |
Management’s Discussion and Analysis of Financial Condition and Results of Operations |
31 |
|
|
31 |
|
|
|
32 |
|
|
|
32 |
|
|
|
33 |
|
|
|
38 |
|
|
|
38 |
|
|
|
43 |
|
|
|
47 |
|
|
|
47 |
|
|
|
48 |
|
|
|
48 |
|
|
|
48 |
|
|
|
49 |
|
|
|
49 |
|
|
|
51 |
|
|
Item 3. |
52 |
|
|
Item 4. |
52 |
|
|
53 |
||
|
Item 1. |
53 |
|
|
Item 1A. |
53 |
|
|
Item 2. |
53 |
|
|
Item 3. |
54 |
|
|
Item 4. |
54 |
|
|
Item 5. |
54 |
|
|
Item 6. |
55 |
|
Broadstone Net Lease, Inc. and Subsidiaries
Condensed Consolidated Balance Sheets
(Unaudited)
(in thousands, except per share amounts)
|
|
|
June 30, 2020 |
|
|
December 31, 2019 |
|
||
|
Assets |
|
|
|
|
|
|
|
|
|
Accounted for using the operating method, net of accumulated depreciation |
|
$ |
3,346,792 |
|
|
$ |
3,415,400 |
|
|
Accounted for using the direct financing method |
|
|
30,953 |
|
|
|
41,890 |
|
|
Investment in rental property, net |
|
|
3,377,745 |
|
|
|
3,457,290 |
|
|
Cash and cash equivalents |
|
|
9,241 |
|
|
|
12,455 |
|
|
Accrued rental income |
|
|
90,545 |
|
|
|
84,534 |
|
|
Tenant and other receivables, net |
|
|
5,045 |
|
|
|
934 |
|
|
Prepaid expenses and other assets |
|
|
9,819 |
|
|
|
12,613 |
|
|
Interest rate swap, assets |
|
|
— |
|
|
|
2,911 |
|
|
Goodwill |
|
|
339,769 |
|
|
|
— |
|
|
Intangible lease assets, net |
|
|
298,741 |
|
|
|
331,894 |
|
|
Debt issuance costs – unsecured revolving credit facility, net |
|
|
1,782 |
|
|
|
2,380 |
|
|
Leasing fees, net |
|
|
11,368 |
|
|
|
12,847 |
|
|
Total assets |
|
$ |
4,144,055 |
|
|
$ |
3,917,858 |
|
|
|
|
|
|
|
|
|
|
|
|
Liabilities, mezzanine equity and equity |
|
|
|
|
|
|
|
|
|
Unsecured revolving credit facility |
|
$ |
248,300 |
|
|
$ |
197,300 |
|
|
Mortgages and notes payable, net |
|
|
109,512 |
|
|
|
111,793 |
|
|
Unsecured term notes, net |
|
|
1,673,092 |
|
|
|
1,672,081 |
|
|
Interest rate swap, liabilities |
|
|
85,678 |
|
|
|
24,471 |
|
|
Earnout liability |
|
|
37,975 |
|
|
|
— |
|
|
Accounts payable and other liabilities |
|
|
25,550 |
|
|
|
37,377 |
|
|
Accrued interest payable |
|
|
4,144 |
|
|
|
3,594 |
|
|
Intangible lease liabilities, net |
|
|
83,157 |
|
|
|
92,222 |
|
|
Total liabilities |
|
|
2,267,408 |
|
|
|
2,138,838 |
|
|
|
|
|
|
|
|
|
|
|
|
Commitments and contingencies (See Note 16) |
|
|
|
|
|
|
|
|
|
|
|
|
|
|
|
|
|
|
|
Mezzanine equity |
|
|
|
|
|
|
|
|
|
Common stock, 781 shares issued and outstanding at June 30, 2020 |
|
|
66,376 |
|
|
|
— |
|
|
Non-controlling interests |
|
|
112,159 |
|
|
|
— |
|
|
Total mezzanine equity |
|
|
178,535 |
|
|
|
— |
|
|
|
|
|
|
|
|
|
|
|
|
Equity |
|
|
|
|
|
|
|
|
|
Broadstone Net Lease, Inc. stockholders' equity: |
|
|
|
|
|
|
|
|
|
Preferred stock, $0.001 par value; 20,000 shares authorized, no shares issued or outstanding |
|
|
— |
|
|
|
— |
|
|
Common stock, $0.001 par value; 80,000 shares authorized, 26,077 and 26,001 shares issued and outstanding at June 30, 2020 and December 31, 2019, respectively |
|
|
26 |
|
|
|
26 |
|
|
Additional paid-in capital |
|
|
1,899,751 |
|
|
|
1,895,935 |
|
|
Cumulative distributions in excess of retained earnings |
|
|
(229,531 |
) |
|
|
(208,261 |
) |
|
Accumulated other comprehensive loss |
|
|
(78,613 |
) |
|
|
(20,086 |
) |
|
Total Broadstone Net Lease, Inc. stockholders’ equity |
|
|
1,591,633 |
|
|
|
1,667,614 |
|
|
Non-controlling interests |
|
|
106,479 |
|
|
|
111,406 |
|
|
Total equity |
|
|
1,698,112 |
|
|
|
1,779,020 |
|
|
Total liabilities, mezzanine equity and equity |
|
$ |
4,144,055 |
|
|
$ |
3,917,858 |
|
The accompanying notes are an integral part of these condensed consolidated financial statements.
1
Broadstone Net Lease, Inc. and Subsidiaries
Condensed Consolidated Statements of Income and Comprehensive Income (Loss)
(Unaudited)
(in thousands, except per share amounts)
|
|
|
For the three months ended June 30, |
|
|
For the six months ended June 30, |
|
||||||||||
|
|
|
2020 |
|
|
2019 |
|
|
2020 |
|
|
2019 |
|
||||
|
Revenues |
|
|
|
|
|
|
|
|
|
|
|
|
|
|
|
|
|
Lease revenues, net |
|
$ |
80,371 |
|
|
$ |
69,053 |
|
|
$ |
158,602 |
|
|
$ |
137,483 |
|
|
|
|
|
|
|
|
|
|
|
|
|
|
|
|
|
|
|
|
Operating expenses |
|
|
|
|
|
|
|
|
|
|
|
|
|
|
|
|
|
Depreciation and amortization |
|
|
39,921 |
|
|
|
25,287 |
|
|
|
71,140 |
|
|
|
49,597 |
|
|
Asset management fees |
|
|
— |
|
|
|
5,318 |
|
|
|
2,461 |
|
|
|
10,438 |
|
|
Property management fees |
|
|
— |
|
|
|
1,935 |
|
|
|
1,275 |
|
|
|
3,820 |
|
|
Property and operating expense |
|
|
4,190 |
|
|
|
3,252 |
|
|
|
8,305 |
|
|
|
7,642 |
|
|
General and administrative |
|
|
5,700 |
|
|
|
1,389 |
|
|
|
11,542 |
|
|
|
2,492 |
|
|
Provision for impairment of investment in rental properties |
|
|
534 |
|
|
|
— |
|
|
|
2,667 |
|
|
|
1,017 |
|
|
Total operating expenses |
|
|
50,345 |
|
|
|
37,181 |
|
|
|
97,390 |
|
|
|
75,006 |
|
|
|
|
|
|
|
|
|
|
|
|
|
|
|
|
|
|
|
|
Other income (expenses) |
|
|
|
|
|
|
|
|
|
|
|
|
|
|
|
|
|
Interest income |
|
|
11 |
|
|
|
— |
|
|
|
20 |
|
|
|
1 |
|
|
Interest expense |
|
|
(19,513 |
) |
|
|
(16,732 |
) |
|
|
(40,504 |
) |
|
|
(32,560 |
) |
|
Cost of debt extinguishment |
|
|
— |
|
|
|
(8 |
) |
|
|
(22 |
) |
|
|
(721 |
) |
|
Gain on sale of real estate |
|
|
1,046 |
|
|
|
2,787 |
|
|
|
8,665 |
|
|
|
4,187 |
|
|
Income taxes |
|
|
(402 |
) |
|
|
(305 |
) |
|
|
(951 |
) |
|
|
(748 |
) |
|
Internalization expenses |
|
|
(389 |
) |
|
|
(272 |
) |
|
|
(1,594 |
) |
|
|
(272 |
) |
|
Change in fair value of earnout liability |
|
|
6,321 |
|
|
|
— |
|
|
|
2,144 |
|
|
|
— |
|
|
Other losses |
|
|
(2 |
) |
|
|
— |
|
|
|
(24 |
) |
|
|
— |
|
|
Net income |
|
|
17,098 |
|
|
|
17,342 |
|
|
|
28,946 |
|
|
|
32,364 |
|
|
Net income attributable to non-controlling interests |
|
|
(1,745 |
) |
|
|
(1,208 |
) |
|
|
(2,777 |
) |
|
|
(2,292 |
) |
|
Net income attributable to Broadstone Net Lease, Inc. |
|
$ |
15,353 |
|
|
$ |
16,134 |
|
|
$ |
26,169 |
|
|
$ |
30,072 |
|
|
|
|
|
|
|
|
|
|
|
|
|
|
|
|
|
|
|
|
Weighted average number of common shares outstanding |
|
|
|
|
|
|
|
|
|
|
|
|
|
|
|
|
|
Basic |
|
|
26,856 |
|
|
|
23,204 |
|
|
|
26,691 |
|
|
|
22,770 |
|
|
Diluted |
|
|
29,912 |
|
|
|
24,941 |
|
|
|
29,482 |
|
|
|
24,507 |
|
|
Net earnings per common share |
|
|
|
|
|
|
|
|
|
|
|
|
|
|
|
|
|
Basic and diluted |
|
$ |
0.57 |
|
|
$ |
0.70 |
|
|
$ |
0.98 |
|
|
$ |
1.32 |
|
|
Comprehensive income (loss) |
|
|
|
|
|
|
|
|
|
|
|
|
|
|
|
|
|
Net income |
|
$ |
17,098 |
|
|
$ |
17,342 |
|
|
$ |
28,946 |
|
|
$ |
32,364 |
|
|
Other comprehensive loss |
|
|
|
|
|
|
|
|
|
|
|
|
|
|
|
|
|
Change in fair value of interest rate swaps |
|
|
(6,056 |
) |
|
|
(23,178 |
) |
|
|
(64,118 |
) |
|
|
(35,802 |
) |
|
Realized gain on interest rate swaps |
|
|
(41 |
) |
|
|
(41 |
) |
|
|
(83 |
) |
|
|
(122 |
) |
|
Comprehensive income (loss) |
|
|
11,001 |
|
|
|
(5,877 |
) |
|
|
(35,255 |
) |
|
|
(3,560 |
) |
|
Comprehensive (income) loss attributable to non-controlling interests |
|
|
(1,123 |
) |
|
|
409 |
|
|
|
2,897 |
|
|
|
242 |
|
|
Comprehensive income (loss) attributable to Broadstone Net Lease, Inc. |
|
$ |
9,878 |
|
|
$ |
(5,468 |
) |
|
$ |
(32,358 |
) |
|
$ |
(3,318 |
) |
The accompanying notes are an integral part of these condensed consolidated financial statements.
2
Broadstone Net Lease, Inc. and Subsidiaries
Condensed Consolidated Statements of Stockholders’ Equity and Mezzanine Equity
(Unaudited)
(in thousands, except per share amounts)
|
|
|
Common Stock |
|
|
Additional Paid-in Capital |
|
|
Cumulative Distributions in Excess of Retained Earnings |
|
|
Accumulated Other Comprehensive Loss |
|
|
Non- controlling Interests |
|
|
Total Stockholders' Equity |
|
|
|
Mezzanine Equity Common Stock |
|
|
Mezzanine Equity Non-controlling Interests |
|
|
Total Mezzanine Equity |
|
|||||||||
|
Balance, January 1, 2020 |
|
$ |
26 |
|
|
$ |
1,895,935 |
|
|
$ |
(208,261 |
) |
|
$ |
(20,086 |
) |
|
$ |
111,406 |
|
|
$ |
1,779,020 |
|
|
|
$ |
— |
|
|
$ |
— |
|
|
$ |
— |
|
|
Cumulative effect of accounting change (see Note 2) |
|
|
— |
|
|
|
— |
|
|
|
(323 |
) |
|
|
— |
|
|
|
— |
|
|
|
(323 |
) |
|
|
|
— |
|
|
|
— |
|
|
|
— |
|
|
Net income |
|
|
— |
|
|
|
— |
|
|
|
10,816 |
|
|
|
— |
|
|
|
710 |
|
|
|
11,526 |
|
|
|
|
— |
|
|
|
322 |
|
|
|
322 |
|
|
Issuance of 73 shares of common stock and 781 shares of mezzanine equity common stock |
|
|
— |
|
|
|
6,097 |
|
|
|
— |
|
|
|
— |
|
|
|
— |
|
|
|
6,097 |
|
|
|
|
66,376 |
|
|
|
— |
|
|
|
66,376 |
|
|
Issuance of 1,320 mezzanine non-controlling interests |
|
|
— |
|
|
|
— |
|
|
|
— |
|
|
|
— |
|
|
|
— |
|
|
|
— |
|
|
|
|
— |
|
|
|
112,159 |
|
|
|
112,159 |
|
|
Adjustment to carrying value of mezzanine equity non-controlling interests |
|
|
— |
|
|
|
(2,416 |
) |
|
|
— |
|
|
|
— |
|
|
|
— |
|
|
|
(2,416 |
) |
|
|
|
— |
|
|
|
2,416 |
|
|
|
2,416 |
|
|
Distributions declared ($0.44 per share January 2020 through March 2020) |
|
|
— |
|
|
|
— |
|
|
|
(35,299 |
) |
|
|
— |
|
|
|
(2,100 |
) |
|
|
(37,399 |
) |
|
|
|
— |
|
|
|
(1,161 |
) |
|
|
(1,161 |
) |
|
Change in fair value of interest rate swap agreements |
|
|
— |
|
|
|
— |
|
|
|
— |
|
|
|
(53,014 |
) |
|
|
(3,472 |
) |
|
|
(56,486 |
) |
|
|
|
— |
|
|
|
(1,576 |
) |
|
|
(1,576 |
) |
|
Realized gain on interest rate swap agreements |
|
|
— |
|
|
|
— |
|
|
|
— |
|
|
|
(38 |
) |
|
|
(2 |
) |
|
|
(40 |
) |
|
|
|
— |
|
|
|
(2 |
) |
|
|
(2 |
) |
|
Balance, March 31, 2020 |
|
$ |
26 |
|
|
$ |
1,899,616 |
|
|
$ |
(233,067 |
) |
|
$ |
(73,138 |
) |
|
$ |
106,542 |
|
|
$ |
1,699,979 |
|
|
|
$ |
66,376 |
|
|
$ |
112,158 |
|
|
$ |
178,534 |
|
|
Net income |
|
|
— |
|
|
|
— |
|
|
|
15,353 |
|
|
|
— |
|
|
|
992 |
|
|
|
16,345 |
|
|
|
|
— |
|
|
|
753 |
|
|
|
753 |
|
|
Issuance of three shares of common stock |
|
|
— |
|
|
|
232 |
|
|
|
— |
|
|
|
— |
|
|
|
— |
|
|
|
232 |
|
|
|
|
— |
|
|
|
— |
|
|
|
— |
|
|
Adjustment to carrying value of mezzanine equity non-controlling interests |
|
|
— |
|
|
|
(97 |
) |
|
|
— |
|
|
|
— |
|
|
|
— |
|
|
|
(97 |
) |
|
|
|
— |
|
|
|
97 |
|
|
|
97 |
|
|
Distributions declared ($0.44 per share in April 2020) |
|
|
— |
|
|
|
— |
|
|
|
(11,817 |
) |
|
|
— |
|
|
|
(701 |
) |
|
|
(12,518 |
) |
|
|
|
— |
|
|
|
(581 |
) |
|
|
(581 |
) |
|
Change in fair value of interest rate swap agreements |
|
|
— |
|
|
|
— |
|
|
|
— |
|
|
|
(5,438 |
) |
|
|
(351 |
) |
|
|
(5,789 |
) |
|
|
|
— |
|
|
|
(267 |
) |
|
|
(267 |
) |
|
Realized gain on interest rate swap agreements |
|
|
— |
|
|
|
— |
|
|
|
— |
|
|
|
(37 |
) |
|
|
(3 |
) |
|
|
(40 |
) |
|
|
|
— |
|
|
|
(1 |
) |
|
|
(1 |
) |
|
Balance, June 30, 2020 |
|
$ |
26 |
|
|
$ |
1,899,751 |
|
|
$ |
(229,531 |
) |
|
$ |
(78,613 |
) |
|
$ |
106,479 |
|
|
$ |
1,698,112 |
|
|
|
$ |
66,376 |
|
|
$ |
112,159 |
|
|
$ |
178,535 |
|
The accompanying notes are an integral part of these condensed consolidated financial statements.
3
Broadstone Net Lease, Inc. and Subsidiaries
Condensed Consolidated Statements of Stockholders’ Equity and Mezzanine Equity
(Unaudited)
(in thousands, except per share amounts)
|
|
|
Common Stock |
|
|
Additional Paid-in Capital |
|
|
Subscriptions Receivable |
|
|
Cumulative Distributions in Excess of Retained Earnings |
|
|
Accumulated Other Comprehensive Income |
|
|
Non- controlling Interests |
|
|
Total Stockholders' Equity |
|
|
|
Mezzanine Equity Common Stock |
|
|
Mezzanine Equity Non-controlling Interests |
|
|
Total Mezzanine Equity |
|
||||||||||
|
Balance, January 1, 2019 |
|
$ |
22 |
|
|
$ |
1,557,421 |
|
|
$ |
— |
|
|
$ |
(155,150 |
) |
|
$ |
14,806 |
|
|
$ |
111,821 |
|
|
$ |
1,528,920 |
|
|
|
$ |
— |
|
|
$ |
— |
|
|
$ |
— |
|
|
Net income |
|
|
— |
|
|
|
— |
|
|
|
— |
|
|
|
13,938 |
|
|
|
— |
|
|
|
1,084 |
|
|
|
15,022 |
|
|
|
|
— |
|
|
|
— |
|
|
|
— |
|
|
Issuance of 883 shares of common stock |
|
|
1 |
|
|
|
75,099 |
|
|
|
(225 |
) |
|
|
— |
|
|
|
— |
|
|
|
— |
|
|
|
74,875 |
|
|
|
|
— |
|
|
|
— |
|
|
|
— |
|
|
Other offering costs |
|
|
— |
|
|
|
(300 |
) |
|
|
— |
|
|
|
— |
|
|
|
— |
|
|
|
— |
|
|
|
(300 |
) |
|
|
|
— |
|
|
|
— |
|
|
|
— |
|
|
Distributions declared ($0.43 per share January 2019, $0.44 per share February through March 2019) |
|
|
— |
|
|
|
— |
|
|
|
— |
|
|
|
(29,635 |
) |
|
|
— |
|
|
|
(2,348 |
) |
|
|
(31,983 |
) |
|
|
|
— |
|
|
|
— |
|
|
|
— |
|
|
Change in fair value of interest rate swap agreements |
|
|
— |
|
|
|
— |
|
|
|
— |
|
|
|
— |
|
|
|
(11,713 |
) |
|
|
(911 |
) |
|
|
(12,624 |
) |
|
|
|
— |
|
|
|
— |
|
|
|
— |
|
|
Realized gain on interest rate swap agreements |
|
|
— |
|
|
|
— |
|
|
|
— |
|
|
|
— |
|
|
|
(75 |
) |
|
|
(6 |
) |
|
|
(81 |
) |
|
|
|
— |
|
|
|
— |
|
|
|
— |
|
|
Redemption of 21 shares of common stock |
|
|
— |
|
|
|
(1,803 |
) |
|
|
— |
|
|
|
— |
|
|
|
— |
|
|
|
— |
|
|
|
(1,803 |
) |
|
|
|
— |
|
|
|
— |
|
|
|
— |
|
|
Balance, March 31, 2019 |
|
$ |
23 |
|
|
$ |
1,630,417 |
|
|
$ |
(225 |
) |
|
$ |
(170,847 |
) |
|
$ |
3,018 |
|
|
$ |
109,640 |
|
|
$ |
1,572,026 |
|
|
|
$ |
— |
|
|
$ |
— |
|
|
$ |
— |
|
|
Net income |
|
|
— |
|
|
|
— |
|
|
|
— |
|
|
|
16,134 |
|
|
|
— |
|
|
|
1,208 |
|
|
|
17,342 |
|
|
|
|
— |
|
|
|
— |
|
|
|
— |
|
|
Issuance of 892 shares of common stock |
|
|
1 |
|
|
|
76,004 |
|
|
|
225 |
|
|
|
— |
|
|
|
— |
|
|
|
— |
|
|
|
76,230 |
|
|
|
|
— |
|
|
|
— |
|
|
|
— |
|
|
Other offering costs |
|
|
— |
|
|
|
(300 |
) |
|
|
— |
|
|
|
— |
|
|
|
— |
|
|
|
— |
|
|
|
(300 |
) |
|
|
|
— |
|
|
|
— |
|
|
|
|
|
|
Distributions declared ($0.44 per share April through June 2019) |
|
|
— |
|
|
|
— |
|
|
|
— |
|
|
|
(30,934 |
) |
|
|
— |
|
|
|
(2,297 |
) |
|
|
(33,231 |
) |
|
|
|
— |
|
|
|
— |
|
|
|
— |
|
|
Change in fair value of interest rate swap agreements |
|
|
— |
|
|
|
— |
|
|
|
— |
|
|
|
— |
|
|
|
(21,564 |
) |
|
|
(1,614 |
) |
|
|
(23,178 |
) |
|
|
|
— |
|
|
|
— |
|
|
|
— |
|
|
Realized gain on interest rate swap agreements |
|
|
— |
|
|
|
— |
|
|
|
— |
|
|
|
— |
|
|
|
(38 |
) |
|
|
(3 |
) |
|
|
(41 |
) |
|
|
|
— |
|
|
|
— |
|
|
|
— |
|
|
Redemption of 38 shares of common stock |
|
|
— |
|
|
|
(3,210 |
) |
|
|
— |
|
|
|
— |
|
|
|
— |
|
|
|
— |
|
|
|
(3,210 |
) |
|
|
|
— |
|
|
|
— |
|
|
|
— |
|
|
Balance, June 30, 2019 |
|
$ |
24 |
|
|
$ |
1,702,911 |
|
|
$ |
— |
|
|
$ |
(185,647 |
) |
|
$ |
(18,584 |
) |
|
$ |
106,934 |
|
|
$ |
1,605,638 |
|
|
|
$ |
— |
|
|
$ |
— |
|
|
$ |
— |
|
The accompanying notes are an integral part of these condensed consolidated financial statements.
4
Broadstone Net Lease, Inc. and Subsidiaries
Condensed Consolidated Statements of Cash Flows
(Unaudited)
(in thousands)
|
|
|
For the six months ended June 30, |
|
|||||
|
|
|
2020 |
|
|
2019 |
|
||
|
Operating activities |
|
|
|
|
|
|
|
|
|
Net income |
|
$ |
28,946 |
|
|
$ |
32,364 |
|
|
Adjustments to reconcile net income including non-controlling interests to net cash provided by operating activities: |
|
|
|
|
|
|
|
|
|
Depreciation and amortization including intangibles associated with investment in rental property |
|
|
71,020 |
|
|
|
48,142 |
|
|
Provision for impairment of investment in rental properties |
|
|
2,667 |
|
|
|
1,017 |
|
|
Amortization of debt issuance costs charged to interest expense |
|
|
1,637 |
|
|
|
1,079 |
|
|
Straight-line rent and financing lease adjustments |
|
|
(7,757 |
) |
|
|
(10,383 |
) |
|
Cost of debt extinguishment |
|
|
22 |
|
|
|
721 |
|
|
Gain on sale of real estate |
|
|
(8,665 |
) |
|
|
(4,187 |
) |
|
Change in fair value of earnout liability |
|
|
(2,144 |
) |
|
|
— |
|
|
Leasing fees paid |
|
|
— |
|
|
|
(435 |
) |
|
Adjustment to provision for credit losses |
|
|
(127 |
) |
|
|
— |
|
|
Other non-cash items |
|
|
228 |
|
|
|
185 |
|
|
Changes in assets and liabilities, net of acquisition: |
|
|
|
|
|
|
|
|
|
Tenant and other receivables |
|
|
(4,111 |
) |
|
|
897 |
|
|
Prepaid expenses and other assets |
|
|
(235 |
) |
|
|
(16 |
) |
|
Accounts payable and other liabilities |
|
|
(2,573 |
) |
|
|
2,534 |
|
|
Accrued interest payable |
|
|
550 |
|
|
|
(7,199 |
) |
|
Net cash provided by operating activities |
|
|
79,458 |
|
|
|
64,719 |
|
|
|
|
|
|
|
|
|
|
|
|
Investing activities |
|
|
|
|
|
|
|
|
|
Acquisition of rental property accounted for using the operating method, net of mortgages assumed of $0 and $49,782 in 2020 and 2019, respectively |
|
|
— |
|
|
|
(153,858 |
) |
|
Cash paid for Internalization |
|
|
(30,861 |
) |
|
|
— |
|
|
Capital expenditures and improvements |
|
|
(3,824 |
) |
|
|
(1,543 |
) |
|
Proceeds from disposition of rental property, net |
|
|
45,423 |
|
|
|
33,632 |
|
|
Change in deposits on investments in rental property |
|
|
— |
|
|
|
875 |
|
|
Net cash provided by (used in) investing activities |
|
|
10,738 |
|
|
|
(120,894 |
) |
|
|
|
|
|
|
|
|
|
|
|
Financing activities |
|
|
|
|
|
|
|
|
|
Proceeds from issuance of common stock, net |
|
|
131 |
|
|
|
120,190 |
|
|
Redemptions of common stock |
|
|
— |
|
|
|
(5,013 |
) |
|
Cash paid for deferred offering costs |
|
|
(1,055 |
) |
|
|
— |
|
|
Borrowings on mortgages, notes payable and unsecured term notes, net of mortgages assumed of $0 and $49,782 in 2020 and 2019, respectively |
|
|
60,000 |
|
|
|
300,000 |
|
|
Principal payments on mortgages, notes payable and unsecured term notes |
|
|
(152,533 |
) |
|
|
(307,672 |
) |
|
Borrowings on unsecured revolving credit facility |
|
|
192,000 |
|
|
|
55,800 |
|
|
Repayments on unsecured revolving credit facility |
|
|
(141,000 |
) |
|
|
(73,300 |
) |
|
Cash distributions paid to stockholders |
|
|
(52,779 |
) |
|
|
(29,572 |
) |
|
Cash distributions paid to non-controlling interests |
|
|
(5,307 |
) |
|
|
(4,627 |
) |
|
Debt issuance and extinguishment costs paid |
|
|
(122 |
) |
|
|
(5,902 |
) |
|
Net cash (used in) provided by financing activities |
|
|
(100,665 |
) |
|
|
49,904 |
|
|
Net decrease in cash and cash equivalents and restricted cash |
|
|
(10,469 |
) |
|
|
(6,271 |
) |
|
Cash and cash equivalents and restricted cash at beginning of period |
|
|
20,311 |
|
|
|
18,989 |
|
|
Cash and cash equivalents and restricted cash at end of period |
|
$ |
9,842 |
|
|
$ |
12,718 |
|
|
|
|
|
|
|
|
|
|
|
|
Reconciliation of cash and cash equivalents and restricted cash |
|
|
|
|
|
|
|
|
|
Cash and cash equivalents at beginning of period |
|
$ |
12,455 |
|
|
$ |
18,612 |
|
|
Restricted cash at beginning of period |
|
|
7,856 |
|
|
|
377 |
|
|
Cash and cash equivalents and restricted cash at beginning of period |
|
$ |
20,311 |
|
|
$ |
18,989 |
|
|
|
|
|
|
|
|
|
|
|
|
Cash and cash equivalents at end of period |
|
$ |
9,241 |
|
|
$ |
10,288 |
|
|
Restricted cash at end of period |
|
|
601 |
|
|
|
2,430 |
|
|
Cash and cash equivalents and restricted cash at end of period |
|
$ |
9,842 |
|
|
$ |
12,718 |
|
The accompanying notes are an integral part of these condensed consolidated financial statements.
5
Broadstone Net Lease, Inc. and Subsidiaries
Notes to the Condensed Consolidated Financial Statements (Unaudited)
(in thousands)
1. Business Description
Broadstone Net Lease, Inc. (the “Corporation”) is a Maryland corporation formed on October 18, 2007, that elected to be taxed as a real estate investment trust (“REIT”) commencing with the taxable year ended December 31, 2008. The Corporation focuses on investing in income-producing, net leased commercial properties, primarily in the United States. The Corporation leases industrial, healthcare, restaurant, office, retail, and other commercial properties under long-term lease agreements. At June 30, 2020, the Corporation owned a diversified portfolio of 632 individual commercial properties located in 41 states throughout the continental United States and one property in British Columbia, Canada.
Broadstone Net Lease, LLC (the Corporation’s operating company, or the “OP”), is the entity through which the Corporation conducts its business and owns (either directly or through subsidiaries) all of the Corporation’s properties. The Corporation is the sole managing member of the OP. The remaining membership units in the OP (“OP Units”), which are referred to as non-controlling interests, are held by members who acquired their interest by contributing real estate properties or other assets to the OP in exchange for OP Units. As the Corporation conducts substantially all of its operations through the OP, it is structured as what is referred to as an umbrella partnership real estate investment trust (“UPREIT”). The Corporation, the OP, and its consolidated subsidiaries are collectively referred to as the “Company”. The following table summarizes the outstanding equity and economic ownership interest of the Corporation and the OP:
|
|
|
June 30, 2020 |
|
|
December 31, 2019 |
|
||||||||||||||||||
|
(in thousands) |
|
Shares of Common Stock |
|
|
OP Units |
|
|
Total Diluted Shares |
|
|
Shares of Common Stock |
|
|
OP Units |
|
|
Total Diluted Shares |
|
||||||
|
Permanent equity |
|
|
26,077 |
|
|
|
1,737 |
|
|
|
27,814 |
|
|
|
26,001 |
|
|
|
1,737 |
|
|
|
27,738 |
|
|
Mezzanine equity |
|
|
781 |
|
|
|
1,320 |
|
|
|
2,101 |
|
|
|
— |
|
|
|
— |
|
|
|
— |
|
|
Total |
|
|
26,858 |
|
|
|
3,057 |
|
|
|
29,915 |
|
|
|
26,001 |
|
|
|
1,737 |
|
|
|
27,738 |
|
|
Percent Ownership of OP |
|
|
89.8 |
% |
|
|
10.2 |
% |
|
|
100.0 |
% |
|
|
93.7 |
% |
|
|
6.3 |
% |
|
|
100.0 |
% |
Refer to Note 14 for further discussion regarding the weighted average shares outstanding.
The Corporation operates under the direction of its board of directors (the “Board of Directors”), which is responsible for the management and control of the Company’s affairs. Prior to February 7, 2020, the Corporation was externally managed by Broadstone Real Estate, LLC (“BRE”) and Broadstone Asset Management, LLC (the “Asset Manager”) subject to the Board of Directors’ direction, oversight, and approval. The Asset Manager was a wholly owned subsidiary of BRE and all of the Corporation’s officers were employees of BRE. Accordingly, both BRE and the Asset Manager were related parties of the Company. Refer to Note 3 for further discussion concerning related parties and related party transactions.
On February 7, 2020, the Corporation, the OP, BRE, and certain of their respective subsidiaries and affiliates, completed through a series of mergers (the “Mergers”) the internalization of the external management functions previously performed for the Corporation and the OP by BRE and the Asset Manager (such transactions, collectively, the “Internalization”). Upon consummation of the Internalization, the Company’s management team and corporate staff, who were previously employed by BRE, became employees of an indirect subsidiary of the OP and the Company became internally managed. Upon Internalization, the prior Property Management Agreement and Asset Management Agreement were terminated. The Internalization was not considered a “Termination Event” under the terms of the agreements and therefore no fees were paid under them as a result of the Internalization. The Internalization consisted of the acquisition of BRE in accordance with the definitive merger agreement (the “Merger Agreement”). Refer to Note 4 for further discussion regarding the Internalization, including the associated payments related thereto.
2. Summary of Significant Accounting Policies
Interim Information
The accompanying Condensed Consolidated Financial Statements have been prepared in accordance with accounting principles generally accepted in the United States of America (“GAAP”) for interim financial information (Accounting Standards Codification (“ASC”) 270, Interim Reporting) and Article 10 of the Securities and Exchange Commission’s (“SEC”) Regulation S-X. Accordingly, the Corporation has omitted certain footnote disclosures which would substantially duplicate those contained within the audited consolidated financial statements for the year ended December 31, 2019, included in the Company’s 2019 Annual Report on Form 10-K, filed with the SEC on February 27, 2020. Therefore, the readers of this quarterly report should refer to those audited consolidated financial statements, specifically Note 2, Summary of Significant Accounting Policies, for further discussion of significant accounting policies and estimates. The Corporation believes all adjustments necessary for a fair presentation have been included in these interim Condensed Consolidated Financial Statements (which include only normal recurring adjustments).
6
The Condensed Consolidated Financial Statements include the accounts and operations of the Company. All intercompany balances and transactions have been eliminated in consolidation.
To the extent the Corporation has a variable interest in entities that are not evaluated under the variable interest entity (“VIE”) model, the Corporation evaluates its interests using the voting interest entity model. The Corporation has complete responsibility for the day-to-day management of, authority to make decisions for, and control of the OP. Based on consolidation guidance, the Corporation has concluded that the OP is a VIE as the members in the OP do not possess kick-out rights or substantive participating rights. Accordingly, the Corporation consolidates its interest in the OP. However, because the Corporation holds the majority voting interest in the OP, it qualifies for the exemption from providing certain disclosure requirements associated with investments in VIEs.
The portion of the OP not owned by the Corporation is presented as non-controlling interests as of and during the periods presented.
Basis of Accounting
The Condensed Consolidated Financial Statements have been prepared in accordance with GAAP.
Use of Estimates
The preparation of Condensed Consolidated Financial Statements in conformity with GAAP requires management to make certain estimates and assumptions that affect the reported amounts of assets and liabilities and disclosure of contingent assets and liabilities at the date of the Condensed Consolidated Financial Statements and the reported amounts of revenues and expenses during the reporting periods. Significant estimates include, but are not limited to, the allocation of purchase price between tangible and intangible assets acquired and liabilities assumed, the value of long-lived assets and goodwill, the provision for impairment, the depreciable lives of rental property, the amortizable lives of intangible assets and liabilities, the provisions for uncollectible rent and credit losses, the fair value of the earnout liability, the fair value of assumed debt and notes payable, the fair value of the Company’s interest rate swap agreements, and the determination of any uncertain tax positions. Accordingly, actual results may differ from those estimates.
The Company reviews long-lived assets, other than goodwill, to be held and used for possible impairment when events or changes in circumstances indicate that their carrying amounts may not be recoverable. If, and when, such events or changes in circumstances are present, an impairment exists to the extent the carrying value of the asset or asset group exceeds the sum of the undiscounted cash flows expected to result from the use of the asset or asset group and its eventual disposition. Such cash flows include expected future operating income, as adjusted for trends and prospects, as well as the effects of demand, competition, and other factors. An impairment loss is measured as the amount by which the carrying amount of the asset or asset group exceeds the fair value of the asset or asset group. A significant judgment is made as to if and when impairment should be taken. The Company’s assessment of impairment as of June 30, 2020 was based on the most current information available to the Company. Based upon current market conditions resulting from the COVID-19 pandemic (see Note 18), certain of the Company’s properties may have fair values less than their carrying amounts. However, based on the Company’s plans with respect to those properties, the Company believes that their carrying amounts are recoverable and therefore, under applicable GAAP guidance, no impairment charges were recognized other than those described below. If the operating conditions mentioned above deteriorate or if the Company’s expected holding period for assets changes, subsequent tests for impairments could result in additional impairment charges in the future.
Inputs used in establishing fair value for real estate assets generally fall within Level 3 of the fair value hierarchy, which are characterized as requiring significant judgment as little or no current market activity may be available for validation. The main indicator used to establish the classification of the inputs is current market conditions, as derived through the use of published commercial real estate market information. The Company determines the valuation of impaired assets using generally accepted valuation techniques including discounted cash flow analysis, income capitalization, analysis of recent comparable sales transactions, actual sales negotiations, and bona fide purchase offers received from third parties. Management may consider a single valuation technique or multiple valuation techniques, as appropriate, when estimating the fair value of its real estate.
During the three and six months ended June 30, 2020 and 2019, the Company recorded impairment charges of $534 and $0, and $2,667 and $1,017, respectively.
Restricted Cash
Restricted cash includes escrow funds the Company maintains pursuant to the terms of certain mortgages, notes payable, and lease agreements, and undistributed proceeds from the sale of properties under Section 1031 of the Internal Revenue Code of 1986, as amended (the “Code”), and is reported within Prepaid expenses and other assets in the Condensed Consolidated Balance Sheets.
7
Restricted cash consisted of the following:
|
|
|
June 30, |
|
|
December 31, |
|
||
|
(in thousands) |
|
2020 |
|
|
2019 |
|
||
|
Escrow funds and other |
|
$ |
601 |
|
|
$ |
2,311 |
|
|
Undistributed 1031 proceeds |
|
|
— |
|
|
|
5,545 |
|
|
|
|
$ |
601 |
|
|
$ |
7,856 |
|
Revenue Recognition
The Company accounts for leases in accordance with ASC 842, Leases. The Company commences revenue recognition on its leases based on a number of factors, including the initial determination that the contract is or contains a lease. Generally, all of the Company’s property related contracts are or contain leases, and therefore revenue is recognized when the lessee takes possession of or controls the physical use of the leased assets. In most instances this occurs on the lease commencement date. At the time of lease assumption or at the inception of a new lease, including new leases that arise from amendments, the Company assesses the terms and conditions of the lease to determine the proper lease classification.
Certain of the Company’s leases require tenants to pay rent based upon a percentage of the property’s net sales (“percentage rent”) or contain rent escalators indexed to future changes in the Consumer Price Index (“CPI”). Lease income associated with such provisions is considered variable lease income and is not included in the initial measurement of the lease receivable, or in the calculation of straight-line rent revenue. Such amounts are recognized as income when the amounts are determinable.
A lease is classified as an operating lease if none of the following criteria are met: (i) ownership transfers to the lessee at the end of the lease term, (ii) the lessee has a purchase option that is reasonably expected to be exercised, (iii) the lease term is for a major part of the economic life of the leased property, (iv) the present value of the future lease payments and any residual value guaranteed by the lessee that is not already reflected in the lease payments equals or exceeds substantially all of the fair value of the leased property, and (v) the leased property is of such a specialized nature that it is expected to have no future alternative use to the Company at the end of the lease term. If one or more of these criteria are met, the lease will generally be classified as a sales-type lease, unless the lease contains a residual value guarantee from a third party other than the lessee, in which case it would be classified as a direct financing lease under certain circumstances.
The Company accounts for the right to use land as a separate lease component, unless the accounting effect of doing so would be insignificant. Determination of significance requires management judgment. In determining whether the accounting effect of separately reporting the land component from other components for its real estate leases is significant, the Company assesses: (i) whether separating the land component impacts the classification of any lease component, (ii) the value of the land component in the context of the overall contract, and (iii) whether the right to use the land is coterminous with the rights to use the other assets.
Revenue recognition methods for operating leases, direct financing leases, and sales-type leases are described below:
Rental property accounted for under operating leases – Revenue is recognized as rents are earned on a straight-line basis over the non-cancelable terms of the related leases. For leases that have fixed and measurable rent escalations and collectability of the lease payments is probable, the difference between such rental income earned and the cash rent due under the provisions of the lease is recorded as Accrued rental income on the Condensed Consolidated Balance Sheets. If the Company determines that collectability of the lease payments is not probable, the Company records an adjustment to Lease revenues to reduce cumulative income recognized since lease commencement to the amount of cash collected from the lessee. Future revenue recognition is limited to amounts paid by the lessee.
Rental property accounted for under direct financing leases – The Company utilizes the direct finance method of accounting to record direct financing lease income. The net investment in the direct financing lease represents receivables for the sum of future lease payments to be received and the estimated residual value of the leased property, less unamortized unearned income (which represents the difference between undiscounted cash flows and discounted cash flows). Unearned income is deferred and amortized into income over the lease terms so as to produce a constant periodic rate of return on the Company’s net investment in the leases.
Rental property accounted for under sales-type leases – For leases accounted for as sales-type leases, the Company records selling profit arising from the lease at inception, along with the net investment in the lease. The Company leases assets through the assumption of existing leases or through sale-leaseback transactions, and records such assets at their fair value at the time of acquisition, which in most cases coincides with lease inception. As a result, the Company does not generally recognize selling profit on sales-type leases. The net investment in the sales-type lease represents receivables for the sum of future lease payments and the estimated unguaranteed residual value of the leased property, each measured at net present value. Interest income is recorded over the lease terms so as to produce a constant periodic rate of return on the Company’s net investment in the leases.
8
Certain of the Company’s lease contracts contain nonlease components (e.g., charges for management fees, common area maintenance, and reimbursement of third-party maintenance expenses) in addition to lease components (i.e., monthly rental charges). Services related to nonlease components are provided over the same period of time as, and billed in the same manner as, monthly rental charges. The Company elected to apply the practical expedient available under ASC 842, for all classes of assets, not to separate the lease components from the nonlease components when accounting for operating leases. Since the lease component is the predominant component under each of these leases, combined revenues from both the lease and nonlease components are reported as Lease revenues, net in the accompanying Condensed Consolidated Statements of Income and Comprehensive Income (Loss).
Refer below to the Recently Adopted Accounting Standards section of this Note regarding a question and answer document released by the Financial Accounting Standards Board (“FASB”) with guidance on the application of lease accounting guidance to lease concessions provided as a result of the COVID-19 pandemic.
Rent Received in Advance
Rent received in advance represents tenant payments received prior to the contractual due date, and is included in Accounts payable and other liabilities on the Condensed Consolidated Balance Sheets. Rent received in advance is as follows:
|
(in thousands) |
|
June 30, 2020 |
|
|
December 31, 2019 |
|
||
|
Rent received in advance |
|
$ |
11,360 |
|
|
$ |
13,368 |
|
Provision for Uncollectible Rent
In accordance with ASC 842, provisions for uncollectible rent are recorded as an offset to Lease revenues, net on the accompanying Condensed Consolidated Statements of Income and Comprehensive Income (Loss). The following table summarizes the changes in the provision for uncollectible rent:
|
|
|
For the three months ended June 30, |
|
|
For the six months ended June 30, |
|
||||||||||
|
(in thousands) |
|
2020 |
|
|
2019 |
|
|
2020 |
|
|
2019 |
|
||||
|
Beginning balance |
|
$ |
1,033 |
|
|
$ |
— |
|
|
$ |
— |
|
|
$ |
2,086 |
|
|
Provision for uncollectible rent |
|
|
1,190 |
|
|
|
— |
|
|
|
2,223 |
|
|
|
440 |
|
|
Write-offs |
|
|
(1 |
) |
|
|
— |
|
|
|
(1 |
) |
|
|
(2,526 |
) |
|
Ending balance |
|
$ |
2,222 |
|
|
$ |
— |
|
|
$ |
2,222 |
|
|
$ |
— |
|
Goodwill
Goodwill represents the excess of the amount paid over the fair value of the identifiable tangible and intangible assets acquired and liabilities assumed in a business combination and is assigned to one or more reporting units. The Company’s reporting unit is the same as its reportable segment. Goodwill has an indefinite life and is therefore not amortized. The Company evaluates goodwill for impairment when an event occurs or circumstances change that indicate the carrying value may not be recoverable, or at least annually. The Company will adopt an annual goodwill testing date during the fourth quarter of 2020.
Deferred Initial Public Offering Costs
The Company has incurred certain costs in connection with its anticipated initial public offering (“IPO”). The Company capitalizes such deferred IPO costs, which primarily consist of direct, incremental legal, professional, accounting and other third-party fees. The deferred IPO costs will be offset against IPO proceeds upon the consummation of an offering. Should the planned IPO be abandoned, the deferred IPO costs will be expensed immediately as a charge to operating expenses in the Condensed Consolidated Statement of Income and Comprehensive Income (Loss). At June 30, 2020 and December 31, 2019, deferred IPO costs were $1,282 and $668, respectively, and were included within Prepaid expenses and other assets on the Condensed Consolidated Balance Sheets.
Fair Value Measurements
ASC 820, Fair Value Measurements and Disclosures, defines fair value as the price that would be received for an asset or paid to transfer a liability (an exit price) in the principal or most advantageous market for the asset or liability in an orderly transaction between market participants on the measurement date. ASC 820 also establishes a three-tier fair value hierarchy, which prioritizes the inputs used in measuring fair value.
9
The Company has estimated that the carrying amount reported on the Condensed Consolidated Balance Sheets for Cash and cash equivalents, Prepaid expenses and other assets, Tenant and other receivables, net, Accrued interest payable, and Accounts payable and other liabilities, approximates their fair values due to their short-term nature.
Recurring Fair Value Measurements
The Company measures and records its interest rate swap assets and liabilities (see Note 11) and earnout liability at fair value, and discloses the fair value of its long-term debt, on a recurring basis.
Earnout Liability – In connection with the Internalization, the Company recognized an earnout liability that will be due and payable to the former owners of BRE if certain milestones are achieved during specified periods of time following the closing of the Internalization (the “Earnout Periods”) related to either (a) the 40-day dollar volume-weighted average price of a share of the Company’s common stock (“VWAP per REIT Share”), following the completion of an IPO of the Company’s common stock, or (b) the Company’s adjusted funds from operations (“AFFO”) per share, prior to the completion of an IPO (see Note 4).
The Company utilizes third-party valuation experts to assist in estimating the fair value of the earnout liability, and develops estimates by considering weighted-average probabilities of likely outcomes, and using a Monte Carlo simulation and discounted cash flow analysis. These estimates require the Company to make various assumptions about the timing of an IPO, share price volatility, and net asset prices, each of which are unobservable and are considered Level 3 inputs in the fair value hierarchy. A change in these inputs to a different amount might result in a significantly higher or lower fair value measurement at the reporting date. As shown in the tables below, the Company’s weighted average expected IPO date upon close of the Internalization was April 15, 2020, with a range from March 2020 to May 2020. Due to the subsequent market dislocation and uncertainty presented by the COVID-19 pandemic late in the first quarter of 2020, management determined that it was not prudent to pursue an IPO at that time. As a result of recent improvement in market conditions, as of June 30, 2020, management revised its weighted average expected IPO date to October 21, 2020, with a range of September 2020 to February 2021. The Company anticipates commencing its IPO when market conditions allow, which may be before October 21, 2020. To the extent the expected IPO date advances, there would be a corresponding increase in the earnout liability’s fair value given the earnout’s fixed time horizon. Peer share price volatilities are used to estimate the Company’s expected share price volatility, and the Company’s corresponding ability to achieve the earnout targets. An increase in peer share price volatility would result in an increase in the earnout liability’s fair value. An increase in the Company’s estimated net asset value per diluted share would result in an increase in the earnout liability’s fair value.
The table below provides a summary of the significant unobservable inputs used to estimate the fair value of the earnout liability as of February 7, 2020, the transaction date.
|
Significant Unobservable Inputs |
|
Weighted Average Assumption Used |
|
|
Range |
|
|
Expected IPO date |
|
April 15, 2020 |
|
|
March 2020 through May 2020 |
|
|
Peer stock price volatility |
|
20.0% |
|
|
16.22% to 23.09% |
|
|
Company's net asset value per diluted share |
|
$ |
85.21 |
|
|
(a) |
|
(a) |
The Company’s net asset value per diluted share is primarily based on the fair value of its real estate investment portfolio, together with the fair value of its other assets and liabilities. The fair value of the Company’s real estate investment portfolio as of the measurement date was determined using market capitalization rates that ranged between 6.05% and 7.09%. |
10
The table below provides a summary of the significant unobservable inputs used to estimate the fair value of the earnout liability as of June 30, 2020.
|
Significant Unobservable Inputs |
|
Weighted Average Assumption Used |
|
|
Range |
|
|
Expected IPO date |
|
October 21, 2020 |
|
|
September 2020 through February 2021 |
|
|
Peer stock price volatility |
|
35.0% |
|
|
25.67% to 58.92% |
|
|
Company's net asset value per diluted share |
|
$ |
71.06 |
|
|
(b) |
|
(b) |
The Company’s net asset value per diluted share is primarily based on the fair value of its real estate investment portfolio, together with the fair value of its other assets and liabilities. The fair value of the Company’s real estate investment portfolio as of the measurement date was determined using market capitalization rates that ranged between 6.11% and 7.17%. |
The following table presents a reconciliation of the change in the earnout liability during the three and six months ended June 30, 2020:
|
|
|
For the three months ended |
|
|
For the six months ended |
|
||
|
(in thousands) |
|
June 30, 2020 |
|
|
June 30, 2020 |
|
||
|
Beginning balance |
|
$ |
44,296 |
|
|
$ |
— |
|
|
Allocation of Internalization purchase price at February 7, 2020 |
|
|
— |
|
|
|
40,119 |
|
|
Change in fair value subsequent to Internalization |
|
|
(6,321 |
) |
|
|
(2,144 |
) |
|
Ending balance |
|
$ |
37,975 |
|
|
$ |
37,975 |
|
The decrease in the earnout liability fair value between March 31, 2020 and June 30, 2020 is primarily a result of a decrease in the estimated net asset value per share assumption used, partially offset by an increase in peer stock price volatility, both of which are attributable to changes in economic circumstances impacting global equity markets.
The balances of assets and liabilities measured at fair value on a recurring basis are as follows:
|
|
|
June 30, 2020 |
|
|||||||||||||
|
(in thousands) |
|
Total |
|
|
Level 1 |
|
|
Level 2 |
|
|
Level 3 |
|
||||
|
Interest rate swap, liabilities |
|
$ |
(85,678 |
) |
|
$ |
— |
|
|
$ |
(85,678 |
) |
|
$ |
— |
|
|
Earnout liability |
|
|
(37,975 |
) |
|
|
— |
|
|
|
— |
|
|
|
(37,975 |
) |
|
|
|
December 31, 2019 |
|
|||||||||||||
|
(in thousands) |
|
Total |
|
|
Level 1 |
|
|
Level 2 |
|
|
Level 3 |
|
||||
|
Interest rate swap, assets |
|
$ |
2,911 |
|
|
$ |
— |
|
|
$ |
2,911 |
|
|
$ |
— |
|
|
Interest rate swap, liabilities |
|
|
(24,471 |
) |
|
|
— |
|
|
|
(24,471 |
) |
|
|
— |
|
Long-term Debt – The fair value of the Company’s debt was estimated using Level 2 and Level 3 inputs based on recent financing transactions, estimates of the fair value of the property that serves as collateral for such debt, historical risk premiums for loans of comparable quality, current London Interbank Offered Rate (“LIBOR”), U.S. Treasury obligation interest rates, and on the discounted estimated future cash payments to be made on such debt. The discount rates estimated reflect the Company’s judgment as to the approximate current lending rates for loans or groups of loans with similar maturities and assumes that the debt is outstanding through maturity. Market information, as available, or present value techniques were utilized to estimate the amounts required to be disclosed. Since such amounts are estimates that are based on limited available market information for similar transactions and do not acknowledge transfer or other repayment restrictions that may exist on specific loans, it is unlikely that the estimated fair value of any such debt could be realized by immediate settlement of the obligation.
The following table summarizes the carrying amount reported on the Condensed Consolidated Balance Sheets and the Company’s estimate of the fair value of the Mortgages and notes payable, net, Unsecured term notes, net, and Unsecured revolving credit facility:
|
(in thousands) |
|
June 30, 2020 |
|
|
December 31, 2019 |
|
||
|
Carrying amount |
|
$ |
2,038,172 |
|
|
$ |
1,989,451 |
|
|
Fair value |
|
|
2,172,559 |
|
|
|
2,047,860 |
|
Non-recurring Fair Value Measurements
The Company’s non-recurring fair value measurements at June 30, 2020 and December 31, 2019 consisted of the fair value of impaired real estate assets that were determined using Level 3 inputs.
11
Right-of-Use Assets and Lease Liabilities
The Company is a lessee under non-cancelable operating leases associated with its corporate headquarters and other office spaces as well as with leases of land (“ground leases”). The Company records right-of-use assets and lease liabilities associated with these leases. The lease liability is equal to the net present value of the future payments to be made under the lease, discounted using estimates based on observable market factors. The right-of-use asset is generally equal to the lease liability plus initial direct costs associated with the leases. The Company includes in the recognition of the right-of-use asset and lease liability those renewal periods that are reasonably certain to be exercised, based on the facts and circumstances that exist at lease inception. Amounts associated with percentage rent provisions are considered variable lease costs and are not included in the initial measurement of the right-of-use asset or lease liability. The Company has made an accounting policy election, applicable to all asset types, to not separate lease from nonlease components when allocating contract consideration related to operating leases.
Right-of-use assets and lease liabilities associated with operating leases were included in the accompanying Condensed Consolidated Balance Sheets as follows:
|
|
|
|
|
June 30, |
|
|
December 31, |
|
||
|
(in thousands) |
|
Financial Statement Presentation |
|
2020 |
|
|
2019 |
|
||
|
Right-of-use assets |
|
Prepaid expenses and other assets |
|
$ |
3,313 |
|
|
$ |
1,614 |
|
|
Lease liabilities |
|
Accounts payable and other liabilities |
|
|
2,924 |
|
|
|
1,209 |
|
Earnout Liability
The Company’s earnout liability is payable in a combination of cash, common shares, and OP Units, in the same proportion as the initial consideration paid in the Internalization (see Note 4). The common shares and OP Units payable under the arrangement will be subject to a redemption rights agreement, whereby holders of the common shares and OP Units will have the right to require the Company to repurchase any or all of the common shares or OP Units if an IPO has not occurred on or before December 31, 2020 (see discussion of the redemption rights agreement in Note 4). The common shares and OP Units are deemed to be freestanding financial instruments that, at inception, embody an obligation to repurchase the Company’s common shares and OP Units, and therefore have been classified as liabilities together with the cash portion of the earnout. The fair value of the earnout liability at the time of the Internalization was recorded in Earnout liability on the Condensed Consolidated Balance Sheets as part of the purchase price allocation. The fair value of the earnout liability is remeasured each reporting period, with changes recorded as Change in fair value of earnout liability in the Condensed Consolidated Statements of Income and Comprehensive Income (Loss).
Mezzanine Equity
The Company issued common shares and OP Units as base consideration for the Internalization, each of which were subject to a redemption rights agreement, where the common shares (“mezzanine equity common stock”) and OP Units (“mezzanine equity non-controlling interests”) are economically equivalent to the permanent equity classified common shares and OP Units with the exception of certain contingent redemption rights that are not yet exercisable as of June 30, 2020 (see discussion of redemption rights agreement in Note 4). The Company presents the mezzanine equity common stock and mezzanine equity non-controlling interests as mezzanine equity in the Condensed Consolidated Balance Sheets as they are redeemable outside the Company’s control.
The Company subsequently records mezzanine equity common stock at redemption value each reporting period, with changes in carrying value recorded as a component of Additional paid-in capital on the Condensed Consolidated Balance Sheets.
The Company subsequently records mezzanine equity non-controlling interests at the greater of (i) carrying amount, increased or decreased for the non-controlling interests’ share of net income or loss, dividends and comprehensive income or loss or (ii) redemption value. Changes in carrying value of mezzanine equity non-controlling interests are recorded as a component of Additional paid-in capital on the Condensed Consolidated Balance Sheets.
Recently Adopted Accounting Standards
In June 2016, the FASB issued ASU 2016-13, Financial Instruments – Credit Losses which changed how entities measure credit losses for most financial assets. Financial assets that are measured at amortized cost are required to be presented at the net amount expected to be collected with a provision for credit losses deducted from the amortized cost basis. The guidance requires an entity to utilize broader information in estimating the expected credit loss, including forecasted information. In November 2018, the FASB issued ASU 2018-19, Codification Improvements to Topic 326, Financial Instruments – Credit Losses which clarified that operating lease receivables recorded by lessors are explicitly excluded from the scope of this guidance. ASU 2016-13 and ASU 2018-09 (collectively, “ASC 326”) were effective January 1, 2020, under a modified retrospective application. The new guidance applies to the Company’s investments in direct financing leases. Due to the nature of its activities, the Company’s lease portfolio has historically not included a significant number of direct financing leases, and as a result the adoption of ASC 326 did not have a material impact on its
12
financial statements. In connection with the adoption of ASC 326, the Company recorded a provision for credit losses of $323 with an offsetting cumulative-effect adjustment to the opening balance of retained earnings as of January 1, 2020.
In August 2018, the FASB issued ASU 2018-13, Fair Value Measurement (Topic 820) Disclosure Framework – Changes to the Disclosure Requirements for Fair Value Measurement. The amendments under ASU 2018-13 remove, add, and modify certain disclosure requirements on fair value measurements in ASC 820. The amendments were effective for fiscal years, and interim periods within those fiscal years, beginning after December 15, 2019, with early adoption permitted. The Company adopted the new standard on a prospective basis on January 1, 2020. The modifications and new disclosures required by the new standard primarily relate to disclosures concerning recurring Level 3 fair value measurements.
In April 2019, the FASB issued ASU 2019-04, Codification Improvements to Topic 326, Financial Instruments – Credit Losses, Topic 815, Derivatives and Hedging, and Topic 825, Financial Instruments which clarified and improved guidance within the recently issued standards on credit losses, hedging, and recognition and measurement of financial instruments. The Company assessed the impact of the changes to Topic 326 in connection with its adoption of ASU 2016-13 discussed above. The provisions of ASU 2019-04 relating to Topics 815 and 825 relate to clarifying the provisions of existing guidance that are not applicable to the Company.
In March 2020, the FASB issued ASU No. 2020-04, Reference Rate Reform (Topic 848): Facilitation of the Effects of Reference Rate Reform on Financial Reporting, which provides optional expedients and exceptions to the U.S. GAAP guidance on contract modifications and hedge accounting affected by reference rate reform if certain criteria are met. ASU 2020-04 contains practical expedients for reference rate reform related activities that impact debt, leases, derivatives and other contracts. The guidance in ASU 2020-04 is optional and may be elected over time as reference rate reform activities occur. During the first quarter of 2020, the Company elected to apply the hedge accounting expedients related to probability and the assessments of effectiveness for future LIBOR-indexed cash flows to assume that the index upon which future hedged transactions will be based matches the index on the corresponding derivatives. Application of these expedients preserves the presentation of derivatives consistent with past presentation. The Company continues to evaluate the impact of the guidance and may apply other elections as applicable as additional changes in the market occur.
In April 2020, the FASB staff issued a question and answer document (the “Lease Modification Q&A”) that focused on the application of lease accounting guidance to lease concessions provided as a result of the COVID-19 pandemic. Under ASC 842, economic relief that was agreed to or negotiated outside of the original lease agreement is typically considered a lease modification, in which case both the lessee and lessor would be required to apply the respective modification frameworks. However, if the lessee was entitled to the economic relief because of either contractual or legal rights, the relief would be accounted for outside of the modification framework. Although the original lease modification guidance in ASC 842 remains appropriate to address routine lease modifications, the Lease Modification Q&A established a different framework to account for certain lease concessions granted in response to the COVID-19 pandemic, if certain criteria have been met. The Lease Modification Q&A allows the Company to make an accounting policy election to account for COVID-19 related lease concessions as either a lease modification or a negative variable adjustment to rental revenue. Such election is required to be applied consistently to leases with similar characteristics and similar circumstances. Refer to Note 18, COVID-19 Pandemic regarding information on COVID-19 related concessions and the associated impact on the Company’s results of operations.
Reclassifications
The Company reclassified $305 and $748 of Income taxes from a component of Operating expenses to a component of Other income (expenses), on the Condensed Consolidated Statements of Income and Comprehensive Income (Loss) for the three and six months ended June 30, 2019, respectively, to conform with the current period presentation. The reclassification is a change from one acceptable presentation to another acceptable presentation.
The Company reclassified $272 of Internalization expenses from General and administrative expenses to a component of Other income (expenses) on the Condensed Consolidated Statements of Income and Comprehensive Income (Loss) for the three and six months ended June 30, 2019, to conform with the current period presentation. The reclassification is a change from one acceptable presentation to another acceptable presentation.
3. Related-Party Transactions
Prior to the Internalization on February 7, 2020, BRE, a related party in which certain directors of the Corporation had either a direct or indirect ownership interest, and the Asset Manager were considered to be related parties.
Property Management Agreement
The Corporation and the OP were parties to a property management agreement (as amended, the “Property Management Agreement”) with BRE. Under the terms of the Property Management Agreement, BRE managed and coordinated certain aspects of the leasing of the Corporation’s rental property.
13
In exchange for services provided under the Property Management Agreement, BRE received certain fees and other compensation as follows:
|
|
(i) |
3% of gross rentals collected each month from the rental property for property management services (other than one property, which called for 5% of gross rentals under the Property Management Agreement); and |
|
|
(ii) |
Re-leasing fees for existing rental property equal to one month’s rent for a new lease with an existing tenant and two months’ rent for a new lease with a new tenant. |
Upon completion of the Internalization, the Property Management Agreement was terminated and there will be no future property management fees payable to BRE. The Internalization was not considered a “Termination Event” under the Property Management Agreement, so no fees were payable to BRE as a result of the Internalization. See Note 4 for further discussion regarding the Internalization, including the associated payments related thereto.
Asset Management Agreement
The Corporation and the OP were parties to an asset management agreement (as amended, the “Asset Management Agreement”) with the Asset Manager, a single member limited liability company of which BRE was the sole member, and therefore a related party in which certain directors of the Corporation had an indirect ownership interest. Under the terms of the Asset Management Agreement, the Asset Manager was responsible for, among other things, the Corporation’s acquisition, initial leasing, and disposition strategies, financing activities, and providing support to the Corporation’s Independent Directors Committee (“IDC”) for its valuation functions and other duties. The Asset Manager also nominated two individuals to serve on the Board of Directors of the Corporation.
Under the terms of the Asset Management Agreement, the Asset Manager was compensated as follows:
|
|
(i) |
a quarterly asset management fee equal to 0.25% of the aggregate value of common stock, based on the per share value as determined by the IDC each quarter, on a fully diluted basis as if all interests in the OP had been converted into shares of the Corporation’s common stock; |
|
|
(ii) |
0.5% of the proceeds from future equity closings as reimbursement for offering, marketing, and brokerage expenses; |
|
|
(iii) |
1% of the gross purchase price paid for each rental property acquired (other than acquisitions described in (iv) below), including any property contributed in exchange for membership interests in the OP; |
|
|
(iv) |
2% of the gross purchase price paid for each rental property acquired in the event that the acquisition of a rental property required a new lease (as opposed to the assumption of an existing lease), such as a sale-leaseback transaction; |
|
|
(v) |
1% of the gross sale price received for each rental property disposition; and |
|
|
(vi) |
1% of the Aggregate Consideration, as defined in the Asset Management Agreement, received in connection with a disposition event, as defined in the Asset Management Agreement. |
Upon completion of the Internalization, the Asset Management Agreement was terminated and there will be no future asset management fees payable to the Asset Manager. The Internalization was not considered a “Termination Event” under the Asset Management Agreement, so no fees were payable to the Asset Manager as a result of the Internalization. See Note 4 for further discussion regarding the Internalization, including the associated payments related thereto.
Total fees incurred under the Property Management Agreement and Asset Management Agreement were as follows:
|
(in thousands) |
|
|
|
For the three months ended June 30, |
|
|
For the six months ended June 30, |
|
||||||||||
|
Type of Fee |
|
Financial Statement Presentation |
|
2020(a) |
|
|
2019 |
|
|
2020(a) |
|
|
2019 |
|
||||
|
Asset management fee |
|
Asset management fees |
|
$ |
— |
|
|
$ |
5,318 |
|
|
$ |
2,461 |
|
|
$ |
10,438 |
|
|
Property management fee |
|
Property management fees |
|
|
— |
|
|
|
1,935 |
|
|
|
1,275 |
|
|
|
3,820 |
|
|
Total management fee expense |
|
|
|
|
— |
|
|
|
7,253 |
|
|
|
3,736 |
|
|
|
14,258 |
|
|
|
|
|
|
|
|
|
|
|
|
|
|
|
|
|
|
|
|
|
|
Marketing fee (offering costs) |
|
Additional paid-in capital |
|
|
— |
|
|
|
300 |
|
|
|
— |
|
|
|
600 |
|
|
Acquisition fee |
|
Capitalized as a component of assets acquired |
|
|
— |
|
|
|
1,275 |
|
|
|
— |
|
|
|
2,005 |
|
|
Leasing fee and re-leasing fees |
|
Leasing fees, net |
|
|
— |
|
|
|
177 |
|
|
|
— |
|
|
|
435 |
|
|
Disposition fee |
|
Gain on sale of real estate |
|
|
— |
|
|
|
238 |
|
|
|
109 |
|
|
|
351 |
|
|
Total management fees |
|
|
|
$ |
— |
|
|
$ |
9,243 |
|
|
$ |
3,845 |
|
|
$ |
17,649 |
|
|
(a) |
Fees were payable under the Property Management Agreement and Asset Management Agreement from January 1, 2020 through February 6, 2020. The Internalization was effective February 7, 2020. |
14
There were no unpaid management fees at June 30, 2020 and December 31, 2019. All fees related to the Property Management Agreement and the Asset Management Agreement were paid for in cash within the Company’s normal payment cycle for vendors.
Tax Protection Agreement
Upon closing of the Internalization, the Company entered into an agreement with Amy L. Tait, the Company’s founder, and certain members of her family (“Founding Owners”), pursuant to which the OP agreed to indemnify the Founding Owners against the applicable income tax liabilities resulting from the sale, exchange, transfer or other disposal of the assets of BRE that the Company acquired in the Internalization, through February 7, 2030, or the Company’s failure to allocate specific types of the OP’s indebtedness to the Founding Owners (the “Founding Owners’ Tax Protection Agreement”). The maximum amount the Company may be liable for under the Founding Owners’ Tax Protection Agreement is $10,000.
Earnout Consideration
In connection with the Internalization, the Company incurred a contingent liability that would be payable to certain members of the Company’s Board of Directors and employees who had previously been owners and/or employees of BRE, upon the occurrence of certain events (see Note 4). The fair value of the earnout liability was $37,975 as of June 30, 2020.
Related Party Lease
In connection with the Internalization, the Company assumed the lease agreement relating to the Company’s principal executive office with Clinton Asset Holdings Associates, L.P., an affiliated third party, approximately 1.6% of which is indirectly owned by the Company’s Chairman and member of the Board of Directors. The lease of 24,072 square feet of office space expires on August 31, 2023, and contains two five-year renewal options. The annual rent for 2020 is approximately $547, with 2% annual increases thereafter. See further discussion in Note 16.
4. Internalization
On February 7, 2020, the Company completed the Internalization and the Company’s management team and corporate staff, who were previously employed by BRE, became employees of an indirect subsidiary of the OP.
The consideration paid at closing of the Internalization is summarized in the following table:
|
(in thousands) |
|
|
|
|
|
Issuance of 781 shares of common stock |
|
$ |
66,376 |
|
|
Issuance of 1,320 OP Units |
|
|
112,159 |
|
|
Cash |
|
|
30,981 |
|
|
Base consideration |
|
|
209,516 |
|
|
Initial estimate of fair value of earnout liability |
|
|
40,119 |
|
|
Total consideration |
|
$ |
249,635 |
|
15
The Company may be required to pay additional earnout consideration of up to $75,000 payable in four tranches of $10,000, $15,000, $25,000, and $25,000 if certain milestones related to either (a) the 40-day VWAP per REIT Share, following the completion of an IPO, or (b) the Company’s AFFO per share, prior to the completion of an IPO, (each, an “Earnout Trigger”) are achieved during the Earnout Periods. The consideration will consist of a combination of cash, shares of the Company’s common stock, and OP Units, based on the same proportions paid in the base consideration.
The earnout tranches, applicable 40-day VWAP of a REIT Share and AFFO per share, and the applicable Earnout Periods are as follows:
|
(in thousands, except per share amounts) |
|
If the Company has completed an IPO |
|
If the Company has not completed an IPO |
||||
|
Earnout Tranche(a) |
|
40-Day VWAP of a REIT Share |
|
Applicable Earnout Period |
|
AFFO per Share |
|
Applicable Earnout Period |
|
$10,000 |
|
$90.00 |
|
The two-year period beginning on the earlier of (i) the IPO closing date or (ii) December 31, 2020. |
|
$5.85 |
|
The two-year period consisting of the calendar years ended December 31, 2020 and December 31, 2021. |
|
$15,000 |
|
$95.00 |
|
The two-year period beginning on the earlier of (i) the IPO closing date or (ii) December 31, 2020. |
|
$5.95 |
|
The two-year period consisting of the calendar years ended December 31, 2020 and December 31, 2021. |
|
$25,000 |
|
$97.50 |
|
The four-year period beginning on the date that is exactly one year after the earnout period begins for the first and second tranches above. |
|
$6.30 |
|
The four-year period consisting of the calendar years ended December 31, 2021, December 31, 2022, December 31, 2023 and December 31, 2024. |
|
$25,000 |
|
$100.00 |
|
The four-year period beginning on the date that is exactly one year after the earnout period begins for the first and second tranches above. |
|
$6.70 |
|
The four-year period consisting of the calendar years ended December 31, 2021, December 31, 2022, December 31, 2023 and December 31, 2024. |
|
(a) |
Initial contractual value of applicable earnout tranche based on an $85.00 price per share/unit of common stock and OP Units. Does not take into account the actual per share price of common stock and OP Units at the time an applicable earnout tranche may be earned and paid. |
Should all earnout milestones be met, an additional 272 shares of common stock and an additional 465 OP Units would be issued, in addition to the payment of $12,349 in cash. As of the Internalization date, the Company estimated that the earnout liability had a fair value of $40,119, of which approximately $33,511 related to the potential issuance of common shares and OP Units and approximately $6,608 related to the potential payment of cash. The Company will estimate the fair value of the earnout liability at each reporting date during the contingency period and record any changes in estimated fair value in its Condensed Consolidated Statement of Income and Comprehensive Income (Loss).
Redemption Rights Agreement
The mezzanine equity common stock and mezzanine equity non-controlling interests issued in connection with the Internalization are economically equivalent to permanent equity common shares and OP Units with the exception of certain contingent redemption rights that are not yet exercisable as of June 30, 2020. If an IPO does not occur on or before December 31, 2020, then each holder of mezzanine equity common stock and mezzanine equity non-controlling interests shall have the right to require the Company to repurchase any or all of such holder’s shares and OP Units at a price equal to the greater of (i) the initial fair value of $85 of the common shares or OP Units at the date of the Internalization or (ii) the current fair value of such common shares or OP Units, as adjusted for interest and distributions. Such repurchases can occur during the period from January 1, 2021 until the earlier of 12 months thereafter or the date of an IPO; provided that the period shall not begin on January 1, 2021 if the Company, in connection with an IPO, shall have filed a registration statement with the SEC that has not been withdrawn as of January 1, 2021 (but the period shall begin immediately upon any such withdrawal and then continue until the earlier of 12 months thereafter or until the occurrence of an IPO); provided, further, that the period shall begin no later than July 1, 2021 (even if such registration statement shall not have been withdrawn as of July 1, 2021) and in such event shall continue until the earlier of twelve (12) months thereafter or the occurrence of an IPO. The Merger Agreement did not provide that the completion of an IPO is a condition to the closing of the Internalization. Subsequent to June 30, 2020, such repurchase rights have been irrevocably waived by each of the named executive officers.
If an IPO does not occur on or before the satisfaction of any Earnout Trigger, then each holder of common shares or OP Units issued under the earnout shall have the right to require the Company to repurchase any or all of such holder’s shares or OP Units at a price equal to the greater of (i) the initial fair value of $85 of the common shares at the date of the Internalization or (ii) the current fair value of such common shares, as adjusted for interest and distributions. Such repurchases can occur during the period from the date of
16
issuance of such earnout shares until the earlier of 12 months thereafter or the occurrence of an IPO; provided, further, that such period shall not begin on such date of issuance if the Company, in connection with an IPO, shall have filed a registration statement with the SEC that has not been withdrawn as of such date of issuance (but such period shall begin immediately upon any such withdrawal and then continue until the earlier of 12 months thereafter or the occurrence of an IPO; provided, further, that such period shall begin no later than six months after such date of issuance (even if such registration statement shall not have been withdrawn as of such date) and in such event shall continue until the earlier of 12 months thereafter or the occurrence of an IPO.
Allocation of Purchase Price
The Internalization was accounted for as a business combination and accordingly, the Company allocated the purchase price utilizing the acquisition method to record assets acquired and liabilities assumed at their estimated fair values.
The allocation of the purchase price has not been finalized and is based upon preliminary estimates of these fair values, which is the best available information at the current time. The final determination of the fair values of the assets and liabilities will be based on the actual valuations of the tangible and intangible assets and liabilities that existed as of the date of completion of the acquisition, including the valuation of the earnout liability. The Company expects to finalize the valuations during the measurement period, not to exceed one year from the date of the Internalization. Consequently, amounts preliminarily allocated to identifiable tangible and intangible assets and liabilities could change.
The following table summarizes the Company’s preliminary allocation of the purchase price associated with the Internalization:
|
(in thousands) |
|
|
|
|
|
Prepaid expenses and other assets |
|
$ |
1,336 |
|
|
Right-of-use assets |
|
|
1,898 |
|
|
Goodwill |
|
|
339,769 |
|
|
Accounts payable and other liabilities |
|
|
(986 |
) |
|
Operating lease liabilities |
|
|
(1,898 |
) |
|
Debt |
|
|
(90,484 |
) |
|
|
|
$ |
249,635 |
|
In connection with the Internalization, the Company recorded goodwill of $339,769 as a result of the consideration exceeding the fair value of the net liabilities acquired. Goodwill represents the synergies and costs savings expected from the acquired management functions and the Company’s ability to generate additional portfolio growth on a lower cost structure than when it was externally managed. The Company does not expect that the goodwill will be deductible for tax purposes.
In connection with the Internalization, the Company assumed $90,484 of debt which was subsequently repaid through a combination of borrowings under its Revolving Credit Facility (as defined below) and entering into a new $60,000 term loan agreement (see Note 9).
The Company incurred $389 and $1,594 in non-recurring costs associated with the Internalization during the three and six months ended June 30, 2020, respectively, and $272 of such costs during the three and six months ended June 30, 2019, which were classified as Internalization expenses in the Condensed Consolidated Statements of Income and Comprehensive Income (Loss).
The effect of the Internalization has been reflected in the Company’s operating results beginning on February 7, 2020. No incremental revenues were recorded as a result of the Internalization. Subsequent to the Internalization, during the three and six months ended June 30, 2020, the Company incurred $4,572 and $8,234, respectively, in expenses as a result of being internalized. Such amounts include general and administrative expenses associated with the Company’s performance of functions previously performed by BRE and the Asset Manager (primarily employee related costs), as well as interest expense associated with the borrowings related to the Internalization. These expenses do not include the Internalization expenses discussed above, or amounts recorded to reflect changes in the fair value of the earnout liability.
Condensed Pro Forma Financial Information
The following pro forma information summarizes selected financial information from the Company’s combined results of operations, as if the Internalization had occurred on January 1, 2019. These results contain certain adjustments totaling $389 and $6,137 of income, respectively, for the three and six months ended June 30, 2020 and $7,343 and $13,973 of income, respectively, for the three and six months ended June 30, 2019. These pro forma adjustments reflect the elimination of Internalization expenses and asset management, property management, and disposition fees between the Company and BRE and the Asset Manager in historic financial results, and adjustments to reflect incremental interest expense associated with the borrowing related to the Internalization. This pro forma information is presented for informational purposes only, and may not be indicative of what actual results of operations would have been had the Internalization occurred at the beginning of the period, nor does it purport to represent the results of future operations.
17
The condensed pro forma financial information is as follows for the three and six months ended June 30, 2020 and 2019:
|
|
|
For the three months ended June 30, |
|
|
For the six months ended June 30, |
|
||||||||||
|
(in thousands) |
|
2020 |
|
|
2019 |
|
|
2020 |
|
|
2019 |
|
||||
|
Revenues |
|
$ |
80,371 |
|
|
$ |
69,053 |
|
|
$ |
158,602 |
|
|
$ |
137,483 |
|
|
Net income |
|
|
17,487 |
|
|
|
19,026 |
|
|
|
31,340 |
|
|
|
36,964 |
|
5. Acquisitions of Rental Property
The Company did not complete any acquisitions of rental property during the six months ended June 30, 2020. The Company closed on the following acquisitions of rental property during the six months ended June 30, 2019:
|
(in thousands, except number of properties) |
|
Number of |
|
|
Real Estate |
|
|
||||
|
Date |
|
Property Type |
|
Properties |
|
|
Acquisition Price |
|
|
||
|
January 31, 2019 |
|
Healthcare |
|
|
1 |
|
|
$ |
4,747 |
|
|
|
March 12, 2019 |
|
Industrial |
|
|
1 |
|
|
|
10,217 |
|
|
|
March 15, 2019 |
|
Retail |
|
|
10 |
|
|
|
13,185 |
|
|
|
March 19, 2019 |
|
Retail |
|
|
14 |
|
|
|
19,128 |
|
|
|
March 26, 2019 |
|
Industrial |
|
|
1 |
|
|
|
25,801 |
|
|
|
April 30, 2019 |
|
Industrial |
|
|
1 |
|
|
|
76,000 |
|
(a) |
|
May 21, 2019 |
|
Retail |
|
|
2 |
|
|
|
6,500 |
|
|
|
May 31, 2019 |
|
Retail |
|
|
1 |
|
|
|
3,192 |
|
|
|
June 7, 2019 |
|
Office |
|
|
1 |
|
|
|
30,589 |
|
|
|
June 26, 2019 |
|
Industrial |
|
|
2 |
|
|
|
11,180 |
|
|
|
|
|
|
|
|
34 |
|
|
$ |
200,539 |
|
(b) |
|
(a) |
In conjunction with this acquisition, the Company assumed a mortgage with a principal balance of $49,782 with an interest rate of 4.92% and a maturity date of February 2028 (see Note 10). |
|
(b) |
Acquisition price does not include capitalized acquisition costs of $5,030. |
The Company allocated the purchase price of these properties to the fair value of the assets acquired and liabilities assumed. The following table summarizes the purchase price allocation for completed real estate acquisitions:
|
(in thousands) |
|
For the six months ended June 30, 2019 |
|
|
|
Land |
|
$ |
13,339 |
|
|
Land improvements |
|
|
16,758 |
|
|
Buildings and improvements |
|
|
154,107 |
|
|
Acquired in-place leases(c) |
|
|
19,942 |
|
|
Acquired above-market leases(d) |
|
|
2,281 |
|
|
Acquired below-market leases(e) |
|
|
(858 |
) |
|
Mortgage payable |
|
|
(49,782 |
) |
|
|
|
$ |
155,787 |
|
|
(c) |
The weighted average amortization period for acquired in-place leases is 15 years for acquisitions completed during the six months ended June 30, 2019. |
|
(d) |
The weighted average amortization period for acquired above-market leases is 17 years for acquisitions completed during the six months ended June 30, 2019. |
|
(e) |
The weighted average amortization period for acquired below-market leases is 12 years for acquisitions completed during the six months ended June 30, 2019. |
The above acquisitions were funded using a combination of available cash on hand, borrowings under the Company’s Revolving Credit Facility, and proceeds from equity issuances. All real estate acquisitions closed during the six months ended June 30, 2019, qualified as asset acquisitions and, as such, acquisition costs have been capitalized.
18
The Company closed on the following sales of real estate, none of which qualified as discontinued operations:
|
|
|
For the three months ended June 30, |
|
|
For the six months ended June 30, |
|
||||||||||
|
(in thousands, except number of properties) |
|
2020 |
|
|
2019 |
|
|
2020 |
|
|
2019 |
|
||||
|
Number of properties disposed |
|
|
3 |
|
|
|
5 |
|
|
|
13 |
|
|
|
9 |
|
|
Aggregate sale price |
|
$ |
10,538 |
|
|
$ |
23,809 |
|
|
$ |
47,723 |
|
|
$ |
35,100 |
|
|
Aggregate carrying value |
|
|
(8,994 |
) |
|
|
(20,233 |
) |
|
|
(36,758 |
) |
|
|
(29,445 |
) |
|
Additional sales expenses |
|
|
(498 |
) |
|
|
(789 |
) |
|
|
(2,300 |
) |
|
|
(1,468 |
) |
|
Gain on sale of real estate |
|
$ |
1,046 |
|
|
$ |
2,787 |
|
|
$ |
8,665 |
|
|
$ |
4,187 |
|
7. Investment in Rental Property and Lease Arrangements
The Company generally leases its investment rental property to established tenants in the industrial, healthcare, restaurant, office, retail, and other industries. At June 30, 2020, the Company had 615 real estate properties which were leased under leases that have been classified as operating leases and 11 that have been classified as direct financing leases. Of the 11 leases classified as direct financing leases, three include land portions which are accounted for as operating leases (see Revenue Recognition within Note 2). Substantially all leases have initial terms of 10 to 20 years. The Company’s leases generally provide for limited increases in rent as a result of fixed increases, increases in the CPI, or increases in the tenant’s sales volume. Generally, tenants are also required to pay all property taxes and assessments, substantially maintain the interior and exterior of the building, and maintain property and liability insurance coverage. The leases also typically provide for one or more multiple year renewal options, at the election of the tenant, and are subject to generally the same terms and conditions as the initial lease.
Investment in Rental Property – Accounted for Using the Operating Method
Rental property subject to non-cancelable operating leases with tenants was as follows:
|
(in thousands) |
|
June 30, 2020 |
|
|
December 31, 2019 |
|
||
|
Land |
|
$ |
545,984 |
|
|
$ |
548,911 |
|
|
Land improvements |
|
|
276,542 |
|
|
|
275,470 |
|
|
Buildings and improvements |
|
|
2,825,327 |
|
|
|
2,850,571 |
|
|
Equipment |
|
|
11,873 |
|
|
|
11,492 |
|
|
|
|
|
3,659,726 |
|
|
|
3,686,444 |
|
|
Less accumulated depreciation |
|
|
(312,934 |
) |
|
|
(271,044 |
) |
|
|
|
$ |
3,346,792 |
|
|
$ |
3,415,400 |
|
Depreciation expense on investment in rental property was as follows:
|
|
|
For the three months ended June 30, |
|
|
For the six months ended June 30, |
|
||||||||||
|
(in thousands) |
|
2020 |
|
|
2019 |
|
|
2020 |
|
|
2019 |
|
||||
|
Depreciation |
|
$ |
23,560 |
|
|
$ |
19,532 |
|
|
$ |
47,075 |
|
|
$ |
38,285 |
|
Estimated lease payments to be received under non-cancelable operating leases with tenants at June 30, 2020 are as follows:
|
(in thousands) |
|
|
|
|
|
Remainder of 2020 |
|
$ |
142,216 |
|
|
2021 |
|
|
289,046 |
|
|
2022 |
|
|
291,422 |
|
|
2023 |
|
|
294,357 |
|
|
2024 |
|
|
290,202 |
|
|
Thereafter |
|
|
2,229,760 |
|
|
|
|
$ |
3,537,003 |
|
Since lease renewal periods are exercisable at the option of the tenant, the above amounts only include future lease payments due during the initial lease terms. In addition, such amounts exclude any potential variable rent increases that are based on changes in the CPI or future variable rents which may be received under the leases based on a percentage of the tenant’s gross sales.
19
Investment in Rental Property – Direct Financing Leases
The Company’s net investment in direct financing leases was comprised of the following:
|
(in thousands) |
|
June 30, 2020 |
|
|
December 31, 2019 |
|
||
|
Undiscounted estimated lease payments to be received |
|
$ |
49,524 |
|
|
$ |
72,753 |
|
|
Estimated unguaranteed residual values |
|
|
16,049 |
|
|
|
20,358 |
|
|
Unearned income |
|
|
(34,424 |
) |
|
|
(51,221 |
) |
|
Reserve for credit losses |
|
|
(196 |
) |
|
|
— |
|
|
Net investment in direct financing leases |
|
$ |
30,953 |
|
|
$ |
41,890 |
|
Undiscounted estimated lease payments to be received under non-cancelable direct financing leases with tenants at June 30, 2020 are as follows:
|
(in thousands) |
|
|
|
|
|
Remainder of 2020 |
|
$ |
1,622 |
|
|
2021 |
|
|
3,304 |
|
|
2022 |
|
|
3,368 |
|
|
2023 |
|
|
3,433 |
|
|
2024 |
|
|
3,493 |
|
|
Thereafter |
|
|
34,304 |
|
|
|
|
$ |
49,524 |
|
The above rental receipts do not include future lease payments for renewal periods, potential variable CPI rent increases, or variable percentage rent payments that may become due in future periods.
The following table summarizes amounts reported as Lease revenues, net on the Condensed Consolidated Statements of Income and Comprehensive Income (Loss):
|
|
|
For the three months ended June 30, |
|
|
For the six months ended June 30, |
|
||||||||||
|
(in thousands) |
|
2020 |
|
|
2019 |
|
|
2020 |
|
|
2019 |
|
||||
|
Contractual rental amounts billed for operating leases |
|
$ |
67,342 |
|
|
$ |
60,294 |
|
|
$ |
140,170 |
|
|
$ |
118,713 |
|
|
Adjustment to recognize contractual operating lease billings on a straight-line basis |
|
|
8,276 |
|
|
|
5,269 |
|
|
|
9,941 |
|
|
|
10,440 |
|
|
Variable rental amounts earned |
|
|
51 |
|
|
|
— |
|
|
|
74 |
|
|
|
— |
|
|
Adjustment to revenue recognized for uncollectible rental amounts billed |
|
|
(1,190 |
) |
|
|
— |
|
|
|
(2,223 |
) |
|
|
(440 |
) |
|
Total operating lease rental revenues |
|
|
74,479 |
|
|
|
65,563 |
|
|
|
147,962 |
|
|
|
128,713 |
|
|
Earned income from direct financing leases |
|
|
855 |
|
|
|
1,004 |
|
|
|
1,842 |
|
|
|
2,009 |
|
|
Operating expenses billed to tenants |
|
|
4,335 |
|
|
|
2,486 |
|
|
|
8,067 |
|
|
|
6,761 |
|
|
Other income from real estate transactions |
|
|
702 |
|
|
|
— |
|
|
|
731 |
|
|
|
— |
|
|
Total Lease revenues, net |
|
$ |
80,371 |
|
|
$ |
69,053 |
|
|
$ |
158,602 |
|
|
$ |
137,483 |
|
20
8. Intangible Assets and Liabilities
The following is a summary of intangible assets and liabilities and related accumulated amortization:
|
(in thousands) |
|
June 30, 2020 |
|
|
December 31, 2019 |
|
||
|
Lease intangibles: |
|
|
|
|
|
|
|
|
|
Acquired above-market leases |
|
$ |
55,242 |
|
|
$ |
62,136 |
|
|
Less accumulated amortization |
|
|
(17,981 |
) |
|
|
(17,433 |
) |
|
Acquired above-market leases, net |
|
|
37,261 |
|
|
|
44,703 |
|
|
Acquired in-place leases |
|
|
334,590 |
|
|
|
349,645 |
|
|
Less accumulated amortization |
|
|
(73,110 |
) |
|
|
(62,454 |
) |
|
Acquired in-place leases, net |
|
|
261,480 |
|
|
|
287,191 |
|
|
Total intangible lease assets, net |
|
$ |
298,741 |
|
|
$ |
331,894 |
|
|
Acquired below-market leases |
|
$ |
107,645 |
|
|
$ |
113,862 |
|
|
Less accumulated amortization |
|
|
(24,488 |
) |
|
|
(21,640 |
) |
|
Intangible lease liabilities, net |
|
$ |
83,157 |
|
|
$ |
92,222 |
|
|
Leasing fees |
|
$ |
15,796 |
|
|
$ |
17,013 |
|
|
Less accumulated amortization |
|
|
(4,428 |
) |
|
|
(4,166 |
) |
|
Leasing fees, net |
|
$ |
11,368 |
|
|
$ |
12,847 |
|
Amortization of intangible lease assets and liabilities was as follows:
|
(in thousands) |
|
|
|
For the three months ended June 30, |
|
|
For the six months ended June 30, |
|
||||||||||
|
Intangible |
|
Financial Statement Presentation |
|
2020 |
|
|
2019 |
|
|
2020 |
|
|
2019 |
|
||||
|
Acquired in-place leases and leasing fees |
|
Depreciation and amortization |
|
$ |
16,339 |
|
|
$ |
5,755 |
|
|
$ |
24,034 |
|
|
$ |
11,312 |
|
|
Above-market and below-market leases |
|
Lease revenues, net |
|
|
(1,016 |
) |
|
|
720 |
|
|
|
124 |
|
|
|
1,460 |
|
Estimated future amortization of intangible assets and liabilities at June 30, 2020 is as follows:
|
(in thousands) |
|
|
|
|
|
Remainder of 2020 |
|
$ |
11,480 |
|
|
2021 |
|
|
22,648 |
|
|
2022 |
|
|
22,100 |
|
|
2023 |
|
|
21,773 |
|
|
2024 |
|
|
21,007 |
|
|
Thereafter |
|
|
127,944 |
|
|
|
|
$ |
226,952 |
|
21
9. Unsecured Credit Agreements
The following table summarizes the Company’s unsecured credit agreements:
|
|
|
Outstanding Balance |
|
|
|
|
|
|
|
|||||
|
(in thousands, except interest rates) |
|
June 30, 2020 |
|
|
December 31, 2019 |
|
|
Interest Rate(c) |
|
|
Maturity Date |
|||
|
2020 Unsecured Term Loan(a) |
|
$ |
240,000 |
|
|
$ |
300,000 |
|
|
one-month LIBOR + 1.25% |
|
|
Feb. 2021(d) |
|
|
Unsecured Revolving Credit and Term Loan Agreement(a) |
|
|
|
|
|
|
|
|
|
|
|
|
|
|
|
Revolving Credit Facility |
|
|
248,300 |
|
|
|
197,300 |
|
|
one-month LIBOR + 1.20% |
|
|
Jan. 2022 |
|
|
2023 Unsecured Term Loan |
|
|
265,000 |
|
|
|
265,000 |
|
|
one-month LIBOR + 1.35% |
|
|
Jan. 2023 |
|
|
2024 Unsecured Term Loan |
|
|
190,000 |
|
|
|
190,000 |
|
|
one-month LIBOR + 1.25% |
|
|
Jun. 2024 |
|
|
|
|
|
703,300 |
|
|
|
652,300 |
|
|
|
|
|
|
|
|
2022 Unsecured Term Loan(a) |
|
|
60,000 |
|
|
|
— |
|
|
one-month LIBOR + 1.25% |
|
|
Feb. 2022 |
|
|
2026 Unsecured Term Loan(a) |
|
|
450,000 |
|
|
|
450,000 |
|
|
one-month LIBOR + 1.85% |
|
|
Feb. 2026 |
|
|
Senior Notes(a) |
|
|
|
|
|
|
|
|
|
|
|
|
|
|
|
Series A |
|
|
150,000 |
|
|
|
150,000 |
|
|
4.84% |
|
|
Apr. 2027 |
|
|
Series B |
|
|
225,000 |
|
|
|
225,000 |
|
|
5.09% |
|
|
Jul. 2028 |
|
|
Series C |
|
|
100,000 |
|
|
|
100,000 |
|
|
5.19% |
|
|
Jul. 2030 |
|
|
|
|
|
475,000 |
|
|
|
475,000 |
|
|
|
|
|
|
|
|
Total |
|
|
1,928,300 |
|
|
|
1,877,300 |
|
|
|
|
|
|
|
|
Debt issuance costs, net(b) |
|
|
(6,908 |
) |
|
|
(7,919 |
) |
|
|
|
|
|
|
|
|
|
$ |
1,921,392 |
|
|
$ |
1,869,381 |
|
|
|
|
|
|
|
|
(a) |
The Company believes it was in compliance with all financial covenants for all periods presented. |
|
(b) |
Amounts presented include debt issuance costs, net, related to the unsecured term notes and senior notes only. |
|
(c) |
At June 30, 2020 and December 31, 2019, one-month LIBOR was 0.16% and 1.76%, respectively. |
|
(d) |
The 2020 Unsecured Term Loan was originally due in August 2020, and allows two six-month extensions, at the Company’s option, subject to the Company being in compliance with the debt covenants and customary representations and warranties, and payment of a fee equal to 0.05% of the outstanding principal balance at the time of extension. On May 5, 2020, the Company exercised the first of these options, effective on August 2, 2020, extending the maturity date of the 2020 Unsecured Term Loan to February 2, 2021. |
On February 7, 2020, the Company entered into a $60,000 term loan agreement maturing on February 28, 2022 (the “2022 Unsecured Term Loan”) with JP Morgan Chase, N.A. as administrative agent. The 2022 Unsecured Term Loan was fully funded at closing and used to repay a portion of the debt assumed by the Company as part of the Internalization. Borrowings under the 2022 Unsecured Term Loan are subject to interest only payments at variable rates equal to LIBOR plus a margin based upon the Company’s credit rating, ranging between 0.85% and 1.65% per annum. Based on the Company’s current credit rating the applicable margin was 1.25% as of June 30, 2020.
At June 30, 2020, the weighted average interest rate on all outstanding borrowings was 2.45%, exclusive of interest rate swap agreements. In addition, the Revolving Credit Facility is subject to a facility fee of 0.25% per annum.
For the six months ended June 30, 2019, the Company paid $5,229 in debt issuance costs associated with the 2026 Unsecured Term Loan and the Unsecured Revolving Credit and Term Loan Agreement. For each separate debt instrument, on a lender by lender basis, in accordance with ASC 470-50, Debt Modifications and Extinguishment, the Company performed an assessment of whether the transaction was deemed to be new debt, a modification of existing debt, or an extinguishment of existing debt. Debt issuance costs are either deferred and amortized over the term of the associated debt or expensed as incurred. Based on this assessment, $5,229 of the debt issuance costs incurred during the six months ended June 30, 2019, were deemed to be related to the issuance of new debt, or the modification of existing debt, and therefore have been deferred and are being amortized over the term of the associated debt. Additionally, $215 of unamortized debt issuance costs were expensed during the six months ended June 30, 2019, and included in Cost of debt extinguishment in the accompanying Condensed Consolidated Statements of Income and Comprehensive Income (Loss).
Debt issuance costs are amortized as a component of interest expense in the accompanying Condensed Consolidated Statements of Income and Comprehensive Income (Loss). The following table summarizes debt issuance cost amortization:
|
|
|
For the three months ended June 30, |
|
|
For the six months ended June 30, |
|
||||||||||
|
(in thousands) |
|
2020 |
|
|
2019 |
|
|
2020 |
|
|
2019 |
|
||||
|
Debt issuance costs amortization |
|
$ |
821 |
|
|
$ |
597 |
|
|
$ |
1,709 |
|
|
$ |
1,150 |
|
22
The Company is subject to various financial and operational covenants and financial reporting requirements pursuant to its unsecured credit agreements. These covenants require the Company to maintain certain financial ratios, including leverage, fixed charge coverage, and debt service coverage, among others. As of June 30, 2020, the Company believes it was in compliance with all of its loan covenants. The Company’s continued compliance with these covenants depends on many factors and could be impacted by current or future economic conditions associated with the COVID-19 pandemic (see Note 18), and thus there are no assurances that the Company will continue to be in compliance with its covenants. Failure to comply with the covenants would result in a default which, if the Company were unable to cure or obtain a waiver from the lenders, could accelerate the repayment of the obligations. Further, in the event of default, the Company may be restricted from paying dividends to its stockholders in excess of dividends required to maintain its REIT qualification. Accordingly, an event of default could have a material and adverse impact on the Company.
10. Mortgages and Notes Payable
The Company’s mortgages and notes payable consist of the following:
|
|
|
|
Origination |
|
Maturity |
|
|
|
|
|
|
|
|
|
|
|
|
|
|
|
(in thousands, except interest rates) |
|
Date |
|
Date |
|
Interest |
|
|
June 30, |
|
|
December 31, |
|
|
|
||||
|
Lender |
|
(Month/Year) |
|
(Month/Year) |
|
Rate |
|
|
2020 |
|
|
2019 |
|
|
|
||||
|
(1) |
Wilmington Trust National Association |
|
Apr-19 |
|
Feb-28 |
|
4.92% |
|
|
$ |
48,512 |
|
|
$ |
49,065 |
|
|
(a) (b) (c) (k) |
|
|
(2) |
Wilmington Trust National Association |
|
Jun-18 |
|
Aug-25 |
|
4.36% |
|
|
|
20,134 |
|
|
|
20,318 |
|
|
(a) (b) (c) (j) |
|
|
(3) |
PNC Bank |
|
Oct-16 |
|
Nov-26 |
|
3.62% |
|
|
|
17,693 |
|
|
|
17,885 |
|
|
(b) (c) |
|
|
(4) |
Sun Life |
|
Mar-12 |
|
Oct-21 |
|
5.13% |
|
|
|
10,681 |
|
|
|
10,888 |
|
|
(b) (f) |
|
|
(5) |
Aegon |
|
Apr-12 |
|
Oct-23 |
|
6.38% |
|
|
|
7,419 |
|
|
|
7,788 |
|
|
(b) (g) |
|
|
(6) |
M&T Bank |
|
Oct-17 |
|
Aug-21 |
|
one - month LIBOR+3% |
|
|
|
4,842 |
|
|
|
4,913 |
|
|
(b) (d) (h) (i) |
|
|
(7) |
Note holders |
|
Dec-08 |
|
Dec-23 |
|
6.25% |
|
|
|
591 |
|
|
|
750 |
|
|
(d) |
|
|
(8) |
Standard Insurance Co. |
|
Jul-10 |
|
Aug-30 |
|
6.75% |
|
|
|
— |
|
|
|
544 |
|
|
(b) (c) (d) (e) |
|
|
|
|
|
|
|
|
|
|
|
|
|
|
109,872 |
|
|
|
112,151 |
|
|
|
|
|
Debt issuance costs, net |
|
|
|
|
|
|
|
|
|
|
(360 |
) |
|
|
(358 |
) |
|
|
|
|
|
|
|
|
|
|
|
|
|
|
$ |
109,512 |
|
|
$ |
111,793 |
|
|
|
|
(a) |
Non-recourse debt includes the indemnification/guaranty of the Corporation and/or OP pertaining to fraud, environmental claims, insolvency and other matters. |
|
(b) |
Debt secured by related rental property and lease rents. |
|
(c) |
Debt secured by guaranty of the OP. |
|
(d) |
Debt secured by guaranty of the Corporation. |
|
(e) |
The interest rate represents the initial interest rate. The interest rate could have been adjusted at Standard Insurance’s discretion (based on prevailing rates) at 119 months from the first payment date. |
|
(f) |
Mortgage was assumed in March 2012 as part of an UPREIT transaction. The debt was recorded at fair value at the time of the assumption. |
|
(g) |
Mortgage was assumed in April 2012 as part of the acquisition of the related property. The debt was recorded at fair value at the time of the assumption. |
|
(h) |
The Company entered into an interest rate swap agreement in connection with the mortgage note, as further described in Note 11. |
|
(i) |
Mortgage was assumed in October 2017 as part of an UPREIT transaction. The debt was recorded at fair value at the time of the assumption. |
|
(j) |
Mortgage was assumed in June 2018 as part of the acquisition of the related property. The debt was recorded at fair value at the time of assumption. |
|
(k) |
Mortgage was assumed in April 2019 as part of the acquisition of the related property. The debt was recorded at fair value at the time of assumption. |
At June 30, 2020, investment in rental property of $175,714 was pledged as collateral against the Company’s mortgages and notes payable.
The following table summarizes the mortgages extinguished by the Company:
|
(in thousands, except number of mortgages) |
|
For the six months ended June 30, 2020 |
|
|
For the year ended December 31, 2019 |
|
||
|
Number of mortgages |
|
1 |
|
|
4 |
|
||
|
Outstanding balance of mortgages |
|
$ |
541 |
|
|
$ |
13,905 |
|
The following table summarizes the cost of mortgage extinguishment:
|
|
|
For the three months ended June 30, |
|
|
For the six months ended June 30, |
|
||||||||||
|
(in thousands) |
|
2020 |
|
|
2019 |
|
|
2020 |
|
|
2019 |
|
||||
|
Cost of mortgage extinguishment |
|
$ |
— |
|
|
$ |
8 |
|
|
$ |
22 |
|
|
$ |
506 |
|
23
Estimated future principal payments to be made under the above mortgage and note payable agreements, and the Company’s unsecured credit agreements (see Note 9) at June 30, 2020 are as follows:
|
(in thousands) |
|
|
|
|
|
Remainder of 2020 |
|
$ |
1,614 |
|
|
2021 |
|
|
258,006 |
|
|
2022 |
|
|
311,207 |
|
|
2023 |
|
|
273,173 |
|
|
2024 |
|
|
192,260 |
|
|
Thereafter |
|
|
1,001,912 |
|
|
|
|
$ |
2,038,172 |
|
Certain of the Company’s mortgage and note payable agreements provide for prepayment fees and can be terminated under certain events of default as defined under the related agreements. These prepayment fees are not reflected as part of the table above.
24
Interest rate swaps were entered into with certain financial institutions in order to mitigate the impact of interest rate variability over the term of the related debt agreements. The interest rate swaps are considered cash flow hedges. In order to reduce counterparty concentration risk, the Company has a diversification policy for institutions that serve as swap counterparties. Under these agreements, the Company receives monthly payments from the counterparties on these interest rate swaps equal to the related variable interest rates multiplied by the outstanding notional amounts. Certain interest rate swaps amortize on a monthly basis. In turn, the Company pays the counterparties each month an amount equal to a fixed rate multiplied by the related outstanding notional amounts. The intended net impact of these transactions is that the Company pays a fixed interest rate on its variable-rate borrowings.
The following is a summary of the Company’s outstanding interest rate swap agreements:
|
(in thousands, except interest rates) |
|
|
|
|
|
|
|
|
|
|
|
Fair Value |
|
|
|||||||
|
Counterparty |
|
Maturity Date |
|
Fixed Rate |
|
|
Variable Rate Index |
|
Notional Amount |
|
|
June 30, 2020 |
|
|
December 31, 2019 |
|
|
||||
|
Bank of America, N.A. |
|
November 2023 |
|
|
2.80 |
% |
|
one-month LIBOR |
|
$ |
25,000 |
|
|
$ |
(2,194 |
) |
|
$ |
(1,136 |
) |
|
|
Bank of Montreal |
|
July 2024 |
|
|
1.16 |
% |
|
one-month LIBOR |
|
|
40,000 |
|
|
|
(1,635 |
) |
|
|
740 |
|
|
|
Bank of Montreal |
|
January 2025 |
|
|
1.91 |
% |
|
one-month LIBOR |
|
|
25,000 |
|
|
|
(1,988 |
) |
|
|
(402 |
) |
|
|
Bank of Montreal |
|
July 2025 |
|
|
2.32 |
% |
|
one-month LIBOR |
|
|
25,000 |
|
|
|
(2,688 |
) |
|
|
(970 |
) |
|
|
Bank of Montreal |
|
January 2026 |
|
|
1.92 |
% |
|
one-month LIBOR |
|
|
25,000 |
|
|
|
(2,346 |
) |
|
|
(448 |
) |
|
|
Bank of Montreal |
|
January 2026 |
|
|
2.05 |
% |
|
one-month LIBOR |
|
|
40,000 |
|
|
|
(4,040 |
) |
|
|
(1,014 |
) |
|
|
Bank of Montreal |
|
December 2026 |
|
|
2.33 |
% |
|
one-month LIBOR |
|
|
10,000 |
|
|
|
(1,328 |
) |
|
|
(460 |
) |
|
|
Bank of Montreal |
|
December 2026 |
|
|
1.99 |
% |
|
one-month LIBOR |
|
|
25,000 |
|
|
|
(2,760 |
) |
|
|
(577 |
) |
|
|
Bank of Montreal |
|
December 2027 |
|
|
2.37 |
% |
|
one-month LIBOR |
|
|
25,000 |
|
|
|
(3,760 |
) |
|
|
(1,306 |
) |
|
|
Bank of Montreal |
|
May 2029 |
|
|
2.09 |
% |
|
one-month LIBOR |
|
|
25,000 |
|
|
|
(3,633 |
) |
|
|
(799 |
) |
|
|
Capital One, National Association |
|
December 2021 |
|
|
1.05 |
% |
|
one-month LIBOR |
|
|
15,000 |
|
|
|
(213 |
) |
|
|
143 |
|
|
|
Capital One, National Association |
|
December 2024 |
|
|
1.58 |
% |
|
one-month LIBOR |
|
|
15,000 |
|
|
|
(935 |
) |
|
|
10 |
|
|
|
Capital One, National Association |
|
January 2026 |
|
|
2.08 |
% |
|
one-month LIBOR |
|
|
35,000 |
|
|
|
(3,549 |
) |
|
|
(911 |
) |
|
|
Capital One, National Association |
|
April 2026 |
|
|
2.68 |
% |
|
one-month LIBOR |
|
|
15,000 |
|
|
|
(2,102 |
) |
|
|
(944 |
) |
|
|
Capital One, National Association |
|
July 2026 |
|
|
1.32 |
% |
|
one-month LIBOR |
|
|
35,000 |
|
|
|
(2,182 |
) |
|
|
720 |
|
|
|
Capital One, National Association |
|
December 2027 |
|
|
2.37 |
% |
|
one-month LIBOR |
|
|
25,000 |
|
|
|
(3,738 |
) |
|
|
(1,278 |
) |
|
|
M&T Bank |
|
August 2021 |
|
|
1.02 |
% |
|
one-month LIBOR |
|
|
4,841 |
|
|
|
(46 |
) |
|
|
41 |
|
(a), (b) |
|
M&T Bank |
|
September 2022 |
|
|
2.83 |
% |
|
one-month LIBOR |
|
|
25,000 |
|
|
|
(1,490 |
) |
|
|
(862 |
) |
|
|
M&T Bank |
|
November 2023 |
|
|
2.65 |
% |
|
one-month LIBOR |
|
|
25,000 |
|
|
|
(2,125 |
) |
|
|
(1,038 |
) |
|
|
Regions Bank |
|
May 2020 |
|
|
2.12 |
% |
|
one-month LIBOR |
|
|
50,000 |
|
|
|
— |
|
|
|
(104 |
) |
|
|
Regions Bank |
|
December 2023 |
|
|
1.18 |
% |
|
one-month LIBOR |
|
|
25,000 |
|
|
|
(962 |
) |
|
|
376 |
|
|
|
Regions Bank |
|
May 2029 |
|
|
2.11 |
% |
|
one-month LIBOR |
|
|
25,000 |
|
|
|
(3,753 |
) |
|
|
(827 |
) |
|
|
Regions Bank |
|
June 2029 |
|
|
2.03 |
% |
|
one-month LIBOR |
|
|
25,000 |
|
|
|
(3,579 |
) |
|
|
(651 |
) |
|
|
Truist Financial Corporation |
|
April 2024 |
|
|
1.99 |
% |
|
one-month LIBOR |
|
|
25,000 |
|
|
|
(1,749 |
) |
|
|
(451 |
) |
|
|
Truist Financial Corporation |
|
April 2025 |
|
|
2.20 |
% |
|
one-month LIBOR |
|
|
25,000 |
|
|
|
(2,403 |
) |
|
|
(781 |
) |
|
|
Truist Financial Corporation |
|
July 2025 |
|
|
1.99 |
% |
|
one-month LIBOR |
|
|
25,000 |
|
|
|
(2,244 |
) |
|
|
(524 |
) |
|
|
Truist Financial Corporation |
|
December 2025 |
|
|
2.30 |
% |
|
one-month LIBOR |
|
|
25,000 |
|
|
|
(2,848 |
) |
|
|
(993 |
) |
|
|
Truist Financial Corporation |
|
January 2026 |
|
|
1.93 |
% |
|
one-month LIBOR |
|
|
25,000 |
|
|
|
(2,339 |
) |
|
|
(458 |
) |
|
|
U.S. Bank National Association |
|
June 2029 |
|
|
2.03 |
% |
|
one-month LIBOR |
|
|
25,000 |
|
|
|
(3,553 |
) |
|
|
(681 |
) |
|
|
U.S. Bank National Association |
|
August 2029 |
|
|
1.35 |
% |
|
one-month LIBOR |
|
|
25,000 |
|
|
|
(2,021 |
) |
|
|
881 |
|
|
|
Wells Fargo Bank, N.A. |
|
February 2021 |
|
|
2.39 |
% |
|
one-month LIBOR |
|
|
35,000 |
|
|
|
(466 |
) |
|
|
(302 |
) |
|
|
Wells Fargo Bank, N.A. |
|
October 2024 |
|
|
2.72 |
% |
|
one-month LIBOR |
|
|
15,000 |
|
|
|
(1,642 |
) |
|
|
(795 |
) |
|
|
Wells Fargo Bank, N.A. |
|
April 2027 |
|
|
2.72 |
% |
|
one-month LIBOR |
|
|
25,000 |
|
|
|
(4,075 |
) |
|
|
(1,845 |
) |
|
|
Wells Fargo Bank, N.A. |
|
January 2028 |
|
|
2.37 |
% |
|
one-month LIBOR |
|
|
75,000 |
|
|
|
(11,292 |
) |
|
|
(3,914 |
) |
|
|
|
|
|
|
|
|
|
|
|
|
|
|
|
|
$ |
(85,678 |
) |
|
$ |
(21,560 |
) |
|
|
(a) |
Notional amount at December 31, 2019 was $4,912. |
|
(b) |
Interest rate swap was assumed in October 2017 as part of an UPREIT transaction. |
25
The total amounts recognized, and the location in the accompanying Condensed Consolidated Statements of Income and Comprehensive Income (Loss), from converting from variable rates to fixed rates under these agreements were as follows:
|
|
|
|
|
|
|
Reclassification from |
|
|
Total Interest Expense |
|
||||
|
|
|
Amount of Loss |
|
|
Accumulated Other |
|
|
Presented in the |
|
|||||
|
|
|
Recognized in |
|
|
Comprehensive Loss |
|
|
Consolidated Statements of |
|
|||||
|
(in thousands) |
|
Accumulated Other |
|
|
|
|
Amount of |
|
|
Income and Comprehensive |
|
|||
|
For the three months ended June 30, |
|
Comprehensive Loss |
|
|
Location |
|
(Loss) Gain |
|
|
Income (Loss) |
|
|||
|
2020 |
|
$ |
(6,056 |
) |
|
Interest expense |
|
$ |
(3,416 |
) |
|
$ |
19,513 |
|
|
2019 |
|
|
(23,178 |
) |
|
Interest expense |
|
|
778 |
|
|
|
16,732 |
|
|
|
|
|
|
|
|
Reclassification from |
|
|
Total Interest Expense |
|
||||
|
|
|
Amount of Loss |
|
|
Accumulated Other |
|
|
Presented in the |
|
|||||
|
|
|
Recognized in |
|
|
Comprehensive Loss |
|
|
Consolidated Statements of |
|
|||||
|
(in thousands) |
|
Accumulated Other |
|
|
|
|
Amount of |
|
|
Income and Comprehensive |
|
|||
|
For the six months ended June 30, |
|
Comprehensive Loss |
|
|
Location |
|
(Loss) Gain |
|
|
Income (Loss) |
|
|||
|
2020 |
|
$ |
(64,118 |
) |
|
Interest expense |
|
$ |
(4,301 |
) |
|
$ |
40,504 |
|
|
2019 |
|
|
(35,802 |
) |
|
Interest expense |
|
|
1,614 |
|
|
|
32,560 |
|
Amounts related to the interest rate swaps expected to be reclassified out of Accumulated other comprehensive loss to Interest expense during the next twelve months are estimated to be a loss of $16,221. The Company is exposed to credit risk in the event of non-performance by the counterparties of the swaps. The Company minimizes the risk exposure by limiting counterparties to major banks who meet established credit and capital guidelines.
12. Credit Risk Concentrations
The Company maintained bank balances that, at times, exceeded the federally insured limit during the six months ended June 30, 2020. The Company has not experienced losses relating to these deposits and management does not believe that the Company is exposed to any significant credit risk with respect to these amounts.
Prior to the Internalization on February 7, 2020, the Company’s rental property was managed by BRE and the Asset Manager as described in Note 3. Management fees paid to BRE and Asset Manager represented 0% and 4% of total operating expenses for the three and six months ended June 30, 2020, respectively, and 19% of total operating expenses for the three and six months ended June 30, 2019, respectively. These amounts do not include acquisition fees paid to the Asset Manager that were capitalized (see Note 3). The Company has mortgages and notes payable with three institutions that comprised 62%, 16%, and 10% of total mortgages and notes payable at June 30, 2020 and December 31, 2019. For the three and six months ended June 30, 2020 and 2019, the Company had no individual tenants or common franchises that accounted for more than 10% of total revenues.
13. Equity
Share Redemption Program
The Company’s Share Redemption Program was terminated effective February 10, 2020, and as a result there were no redemptions during the six months ended June 30, 2020. The following table summarizes redemptions under the Company’s Share Redemption Program:
|
(in thousands, except number of redemptions) |
|
For the three months ended June 30, 2019 |
|
|
For the six months ended June 30, 2019 |
|
||
|
Number of redemptions requested |
|
16 |
|
|
29 |
|
||
|
Number of shares |
|
38 |
|
|
59 |
|
||
|
Aggregate redemption price |
|
$ |
3,210 |
|
|
$ |
5,013 |
|
Distribution Reinvestment Plan
The Corporation had adopted a Distribution Reinvestment Plan (“DRIP”), pursuant to which the Corporation’s stockholders and holders of OP Units (other than the Corporation), could elect to have cash distributions reinvested in additional shares of the Corporation’s common stock. The DRIP was terminated effective February 10, 2020. At June 30, 2020 and December 31, 2019, a total of 3,075 and 3,005 shares of common stock, respectively, have been issued under the DRIP.
26
The following table summarizes the components used in the calculation of basic and diluted earnings per share (“EPS”):
|
|
|
For the three months ended June 30, |
|
|
For the six months ended June 30, |
|
||||||||||
|
(in thousands, except per share) |
|
2020 |
|
|
2019 |
|
|
2020 |
|
|
2019 |
|
||||
|
Basic earnings: |
|
|
|
|
|
|
|
|
|
|
|
|
|
|
|
|
|
Net earnings attributable to Broadstone Net Lease, Inc. |
|
$ |
15,353 |
|
|
$ |
16,134 |
|
|
$ |
26,169 |
|
|
$ |
30,072 |
|
|
Diluted earnings: |
|
|
|
|
|
|
|
|
|
|
|
|
|
|
|
|
|
Net earnings attributable to Broadstone Net Lease, Inc. |
|
$ |
15,353 |
|
|
$ |
16,134 |
|
|
$ |
26,169 |
|
|
$ |
30,072 |
|
|
Net earnings attributable to non-controlling interests |
|
|
1,745 |
|
|
|
1,208 |
|
|
|
2,777 |
|
|
|
2,292 |
|
|
|
|
$ |
17,098 |
|
|
$ |
17,342 |
|
|
$ |
28,946 |
|
|
$ |
32,364 |
|
|
|
|
|
|
|
|
|
|
|
|
|
|
|
|
|
|
|
|
Basic and diluted weighted average shares outstanding: |
|
|
|
|
|
|
|
|
|
|
|
|
|
|
|
|
|
Weighted average number of common shares outstanding used in basic earnings per share |
|
|
26,856 |
|
|
|
23,204 |
|
|
|
26,691 |
|
|
|
22,770 |
|
|
Effects of convertible membership units |
|
|
3,056 |
|
|
|
1,737 |
|
|
|
2,791 |
|
|
|
1,737 |
|
|
Weighted average number of common shares outstanding used in diluted earnings per share |
|
|
29,912 |
|
|
|
24,941 |
|
|
|
29,482 |
|
|
|
24,507 |
|
|
Basic and diluted net earnings per common share |
|
$ |
0.57 |
|
|
$ |
0.70 |
|
|
$ |
0.98 |
|
|
$ |
1.32 |
|
In the table above, outstanding OP Units are included in the diluted earnings per share calculation. However, because such OP Units would also require that the share of the OP income attributable to such OP Units also be added back to net income, there is no effect on EPS.
15. Supplemental Cash Flow Disclosures
Cash paid for interest was $38,400 and $38,802 for the six months ended June 30, 2020 and 2019, respectively. Cash paid for income taxes was $945 and $422 for the six months ended June 30, 2020 and 2019, respectively.
The following are non-cash transactions and have been excluded from the accompanying Condensed Consolidated Statements of Cash Flows:
|
|
• |
During the six months ended June 30, 2020 and 2019, the Corporation issued 69 and 358 shares, respectively, of common stock with a value of approximately $5,733 and $30,008, respectively, under the terms of the DRIP (see Note 13). |
|
|
• |
During the six months ended June 30, 2020, the Company issued shares of common stock and OP Units, with a total value of approximately $178,535, and earnout consideration with a fair value of $40,119 as consideration for the Internalization and assumed $90,484 of debt (see Note 4). |
|
|
• |
During the six months ended June 30, 2020, the Company adjusted the carrying value of mezzanine equity non-controlling interests by $2,513, with an offset to additional paid-in capital (see Note 2). |
|
|
• |
At June 30, 2019, dividend amounts declared and accrued but not yet paid amounted to $11,119. |
|
|
• |
During the six months ended June 30, 2020, the Company executed lease modifications that resulted in the lease classification changing from direct financing lease to operating lease for four properties. At the modification date, the net investment in the original lease, and therefore the carrying value of the assets recognized, amounted to $9,055. |
|
|
• |
In connection with real estate transactions conducted during the six months ended June 30, 2019, the Company accepted tenant improvement allowances of $1,727 in exchange for a reduction to the cash paid for the associated real estate assets. |
|
|
• |
Upon adoption of ASC 326 on January 1, 2020, described in Note 2, the Company recorded a transition adjustment to record a provision for credit losses associated with its net investment in direct financing leases of $323, with an equal amount recorded as a reduction in retained earnings. The provision for credit losses is included as a component of Investment in rental property, net accounted for using the direct financing method on the Condensed Consolidated Balance Sheets. |
|
|
• |
Upon adoption of ASC 842 on January 1, 2019, the Company recorded right-of-use assets of $1,687 and lease liabilities of $1,261 associated with ground leases where it is the lessee. The right-of-use asset was recorded net of a straight-line rent liability of $7 and ground lease intangible asset, net of $432 as of the date of adoption. |
27
16. Commitments and Contingencies
Litigation
From time to time, the Company is a party to various litigation matters incidental to the conduct of the Company’s business. While the resolution of such matters cannot be predicted with certainty, based on currently available information, the Company does not believe that the final outcome of any of these matters will have a material effect on its consolidated financial position, results of operations, or liquidity.
Property and Acquisition Related
In connection with ownership and operation of real estate, the Company may potentially be liable for costs and damages related to environmental matters. The Company is not aware of any non-compliance, liability, claim, or other environmental condition that would have a material effect on its consolidated financial position, results of operations, or liquidity.
Balances associated with tenant improvement allowances are included in Accounts payable and other liabilities on the Condensed Consolidated Balance Sheets as follows:
|
(in thousands) |
|
June 30, 2020 |
|
|
December 31, 2019 |
|
||
|
Tenant improvement allowances |
|
$ |
2,208 |
|
|
$ |
2,706 |
|
The Company is a party to three separate tax protection agreements with the contributing members of three distinct UPREIT transactions and to the Founding Owners’ Tax Protection Agreement in connection with the Internalization (see Note 3). The tax protection agreements require the Company to indemnify the beneficiaries in the event of a sale, exchange, transfer, or other disposal of the contributed property, or in the case of the Founding Owners’ Tax Protection Agreement, the entire Company, in a taxable transaction that would cause such beneficiaries to recognize a gain that is protected under the agreements, subject to certain exceptions. Based on values as of June 30, 2020, taxable sales of the applicable properties would trigger liability under the Agreements of approximately $22,300. Based on information available, the Company does not believe that the events resulting in damages as detailed above have occurred or are likely to occur in the foreseeable future.
Obligations Under Operating Leases
Subsequent to the Internalization (see Note 4), the Company leases office space for its corporate headquarters and other locations under non-cancellable operating leases with expiration dates ranging from 2020 to 2023. These leases contain provisions for fixed monthly payments, subject to rent escalations. None of the leases are subject to any sublease agreement. The lease for the corporate headquarters is with a related party (see Note 3).
The Company also leases land at certain properties under non-cancellable operating leases (“ground leases”) with initial lease terms ranging from 2034 to 2066. These leases contain provisions for fixed monthly payments, subject to rent escalations. One lease requires the Company to make annual rent payments calculated based upon sales generated at the property (“percentage rent”). None of the leases are subject to any sublease agreement.
The following table summarizes the total lease costs associated with operating leases:
|
|
|
|
|
For the three months ended June 30, |
|
|
For the six months ended June 30, |
|
||||||||||
|
(in thousands) |
|
Financial Statement Presentation |
|
2020 |
|
|
2019 |
|
|
2020 |
|
|
2019 |
|
||||
|
Operating lease costs |
|
|
|
|
|
|
|
|
|
|
|
|
|
|
|
|
|
|
|
Office leases |
|
General and administrative |
|
$ |
155 |
|
|
$ |
— |
|
|
$ |
207 |
|
|
$ |
— |
|
|
Ground leases |
|
Property and operating expense |
|
|
34 |
|
|
|
35 |
|
|
|
67 |
|
|
|
70 |
|
|
Variable lease costs |
|
|
|
|
|
|
|
|
|
|
|
|
|
|
|
|
|
|
|
Ground leases |
|
Property and operating expense |
|
|
12 |
|
|
|
11 |
|
|
|
30 |
|
|
|
23 |
|
|
Total lease costs |
|
|
|
$ |
201 |
|
|
$ |
46 |
|
|
$ |
304 |
|
|
$ |
93 |
|
28
The following table summarizes payments associated with obligations under operating leases, reported as Cash flows from operating activities on the accompanying Condensed Consolidated Statements of Cash Flows:
|
|
|
For the three months ended June 30, |
|
|
For the six months ended June 30, |
|
||||||||||
|
(in thousands) |
|
2020 |
|
|
2019 |
|
|
2020 |
|
|
2019 |
|
||||
|
Operating lease payments |
|
$ |
183 |
|
|
$ |
28 |
|
|
$ |
311 |
|
|
$ |
100 |
|
Estimated future lease payments required under non-cancelable operating leases at June 30, 2020, and a reconciliation to the lease liabilities, is as follows:
|
(in thousands) |
|
|
|
|
|
Remainder of 2020 |
|
$ |
355 |
|
|
2021 |
|
|
711 |
|
|
2022 |
|
|
686 |
|
|
2023 |
|
|
505 |
|
|
2024 |
|
|
120 |
|
|
Thereafter |
|
|
2,411 |
|
|
Total undiscounted cash flows |
|
|
4,788 |
|
|
Less imputed interest |
|
|
(1,864 |
) |
|
Lease liabilities |
|
$ |
2,924 |
|
The above rental payments include future minimum lease payments due during the initial lease terms. Such amounts exclude any contingent amounts associated with percentage rent that may become due in future periods.
17. Subsequent Events
On August 4, 2020, the Board of Directors voted to reinstate the Company’s distribution, announcing that the Company would transition to quarterly distribution payments. A quarterly distribution of $0.54 per share of the Company’s common stock and OP Unit for the third quarter of 2020 will be payable on or before October 15, 2020, to stockholders and unit holders of record as of September 30, 2020.
On August 4, 2020, the Board of Directors determined the share value for the Corporation’s common stock to be $82.00 per share for the period August 1, 2020 through October 31, 2020. However, on January 10, 2020, the Company suspended its private offering of shares of its common stock until further notice.
On August 4, 2020, the Board of Directors adopted the Broadstone Net Lease, Inc. 2020 Omnibus Equity and Incentive Plan (the “Equity and Incentive Plan”), under which equity awards may be made in respect of 2,250 shares of our common stock. On August 4, 2020, the Company awarded 85 shares of restricted stock under the Equity and Incentive Plan with a grant date fair value of $6,990 which will vest over a three or four year period in accordance with the terms of the individual award agreements.
29
Since its discovery in December 2019, a novel strain of coronavirus, which causes the viral disease known as COVID-19, has spread throughout most countries of the world, including the United States. The outbreak has been declared a pandemic by the World Health Organization, and the United States Secretary of Health and Human Services has declared a public health emergency in the United States. In response to the COVID-19 pandemic, many local, state and federal governments have instituted “stay at home” or “shelter in place” rules and restrictions on the types of businesses that may continue to operate, which resulted in closure of many businesses deemed to be non-essential. Many of the Company’s tenants, in particular those who operate in the retail and restaurant industries, depend on in-person interactions with customers to generate unit-level profitability, and have been negatively impacted by the pandemic, as have businesses who supply products and services to these industries. As a result, the Company received a number of requests for rent relief and ultimately granted relief to 15 tenants whose total contractual base rents represented approximately 9.7% of the Company’s annualized contractual base rent revenues as of June 30, 2020. All rent relief requests received through June 30, 2020 have been resolved.
For all but one of the 15 tenants granted relief, the Company granted relief in the form of a partial rent deferral. For the remaining tenant, the Company agreed to a partial abatement of rent over a nine-month period with the minimum required rent payable increasing during the period, in exchange for a three-year lease term extension and an upside percentage rent clause during the abatement period. Partial rent deferrals and the abatement represented 3.0% and 1.1% of total contractual base rents due for the three months ended June 30, 2020, respectively.
The partial rent deferrals ranged between two and six months of rent, with a weighted average deferral period of 3.4 months. Repayment periods range from three months to one year, with a weighted average payback period of 5.6 months beginning in July 2020.
For partial rent deferrals expected to be repaid within a short period of time where the deferral of payments made no substantive changes to the total consideration in the original lease agreement, the amount of straight-line lease revenue recognized in the financial statements was not impacted. Deferred rents due under the agreements are recorded as Tenant and other receivables, net in the Condensed Consolidated Balance Sheets. In certain circumstances, as part of the deferral agreements, the Company negotiated lease extensions or the early exercise of tenant renewal options, resulting in cash flows under the agreements being substantially in excess of the original lease terms. The Company evaluated these agreements on a lease by lease basis, and accounted for the relief under the modification framework of ASC 842, resulting in adjustments to the amount of straight-line lease revenue that will be recorded prospectively. The Company also accounted for the partial abatement under the lease modification framework of ASC 842.
As of and for the six months ended June 30, 2020, the impact of the COVID-19 pandemic on the Company’s financial condition, and results of operations has been limited to effects of the grants of rent relief discussed above. The full extent of the pandemic on the Company’s future financial conditions, results of operations, liquidity, and ability to pay distributions will ultimately depend on certain developments, including the duration and spread of the outbreak and its impact on the Company’s tenants, all of which are uncertain and cannot be predicted. For further discussion of risks associated with the COVID-19 outbreak, refer to Part I, Item 2, Management’s Discussion and Analysis of Financial Condition and Results of Operations of this Quarterly Report on Form 10-Q below.
30
Item 2.Management’s Discussion and Analysis of Financial Condition and Results of Operations
Except where the context suggests otherwise, as used in this Quarterly Report on Form 10-Q, the terms “BNL,” “we,” “us,” “our,” and “our company” refer to Broadstone Net Lease, Inc., a Maryland corporation incorporated on October 18, 2007, and, as required by context, Broadstone Net Lease, LLC, a New York limited liability company (the “OP”), which we refer to as the or our “OP,” and to their respective subsidiaries.
The following Management’s Discussion and Analysis of Financial Condition and Results of Operations (“MD&A”) is intended to help the reader understand our results of operations and financial condition. This MD&A is provided as a supplement to, and should be read in conjunction with, our Condensed Consolidated Financial Statements and the accompanying Notes to the Condensed Consolidated Financial Statements appearing elsewhere in this Quarterly Report on Form 10-Q.
Cautionary Note Regarding Forward-Looking Statements
This Quarterly Report on Form 10-Q contains forward-looking statements, which reflect our current views regarding our business, financial performance, growth prospects and strategies, market opportunities, and market trends, that are intended to be made pursuant to the safe harbor provisions of Section 27A of the Securities Act of 1933, as amended (the “Securities Act”) and Section 21E of the Securities Exchange Act of 1934, as amended (the “Exchange Act”). Forward-looking statements include all statements that are not historical facts. In some cases, you can identify these forward-looking statements by the use of words such as “outlook,” “believes,” “expects,” “potential,” “continues,” “may,” “will,” “should,” “could,” “seeks,” “approximately,” “projects,” “predicts,” “intends,” “plans,” “estimates,” “anticipates,” or the negative version of these words or other comparable words. All of the forward-looking statements included in this Quarterly Report on Form 10-Q are subject to various risks and uncertainties. Assumptions relating to the foregoing involve judgments with respect to, among other things, future economic, competitive and market conditions, and future business decisions, all of which are difficult or impossible to predict accurately and many of which are beyond our control. Although we believe that the expectations reflected in such forward-looking statements are based on reasonable assumptions, our actual results, performance, and achievements could differ materially from those expressed in or by the forward-looking statements and may be affected by a variety of risks and other factors. Accordingly, there are or will be important factors that could cause actual outcomes or results to differ materially from such forward-looking statements.
Factors that could cause actual results to differ materially from those expressed or implied in such forward-looking statements include, but are not limited to:
|
|
• |
Single-tenant leases involve significant risks of tenant default and tenant vacancies; |
|
|
• |
We have limited opportunities to increase rents under our long-term leases with tenants; |
|
|
• |
We may not be able to achieve growth through acquisitions at a rate that is comparable to our historical results, as a result of competition or other factors; |
|
|
• |
We may not be able to effectively manage our growth; |
|
|
• |
The departure of any of our key personnel with long-standing business relationships could materially and adversely affect us; |
|
|
• |
We may not be able to generate cash flows sufficient to pay our dividends or meet our debt service obligations; |
|
|
• |
Market conditions could adversely affect our ability to refinance existing indebtedness on acceptable terms or at all; |
|
|
• |
We are a holding company with no direct operations and rely on funds received from the OP to pay liabilities; |
|
|
• |
There are risks related to our recent Internalization, including our ability to effectively manage the Internalization and the outcome of any legal proceedings relating to the Internalization, and the risk that we may not realize the anticipated benefits from the Internalization or that such benefits are less than anticipated as a result of unexpected costs or liabilities that may arise from the Internalization; |
|
|
• |
Epidemics, pandemics, and other public health crises, including the ongoing COVID-19 pandemic; |
|
|
• |
Changing general business and economic conditions could impact us and our tenants, including those arising from natural disasters, acts of terrorism or war, as well as the recent coronavirus pandemic, fluctuating interest rates, and volatility and uncertainty in the credit markets and broader financial markets; and |
|
|
• |
Failure to qualify as a REIT for U.S. federal income tax purposes would materially and adversely affect us and the value of our stock. |
31
You are cautioned not to place undue reliance on any forward-looking statements included in this Quarterly Report on Form 10-Q. All forward-looking statements are made as of the date of this Quarterly Report on Form 10-Q and the risk that actual results, performance, and achievements will differ materially from the expectations expressed in or referenced by this Quarterly Report on Form 10-Q will increase with the passage of time. We undertake no obligation to publicly update or review any forward-looking statement, whether as a result of new information, future developments, or otherwise, except as required by law. Important factors that could cause results to differ materially from the forward-looking statements are described in Item 1. “Business,” Item 1A. “Risk Factors,” and Item 7. “Management’s Discussion and Analysis of Financial Condition and Results of Operations” in our 2019 Annual Report on Form 10-K, as filed with the SEC on February 27, 2020 and in Part II, Item 1A. “Risk Factors” of our Quarterly Report on Form 10-Q for the quarter ended March 31, 2020, as filed with the SEC on May 7, 2020.
Explanatory Note and Certain Defined Terms
Unless the context otherwise requires, the following terms and phrases are used throughout this Quarterly Report on Form 10-Q as described below:
|
|
• |
“annualized base rent” or “ABR” means the annualized contractual cash rent due for the last month of the reporting period, excluding the impacts of the short-term rent deferrals and abatements agreed to as a result of tenant requests for rent relief related to the global coronavirus (“COVID-19”) pandemic, and adjusted to remove rent from properties sold during the month and to include a full month of contractual cash rent for properties acquired during the last month. As discussed below, as a result of the COVID-19 pandemic, in 2020 we received requests for rent relief from several tenants and agreed to temporarily defer the receipt of rent, or in limited circumstances to abate rent, for a portion of the remaining lease terms. As a result of these requests, we agreed to partial rent relief requests for 15 tenants related to 93 properties whose total base rents represent approximately 9.7% of our June ABR. We have excluded the impact of these deferrals and abatements from the calculation of ABR because they are short term in nature relative to the length of our lease terms and relate to a discrete event, and therefore including them in the calculation would not provide an accurate measure of our relative portfolio composition. |
|
|
• |
“cash capitalization rate” represents the estimated first year cash yield to be generated on a real estate investment property, which was estimated at the time of investment based on the contractually specified cash base rent for the first full year after the date of the investment, divided by the purchase price for the property; |
|
|
• |
“CPI” means the Consumer Price Index for All Urban Consumers (CPI-U): U.S. City Average, All Items, as published by the U.S. Bureau of Labor Statistics, or other similar index which is a measure of the average change over time in the prices paid by urban consumers for a market basket of consumer goods and services; |
|
|
• |
“gross asset value” means the undepreciated book value of an asset, which represents the fair value of the asset as of the date it was acquired, less any subsequent writedowns due to impairment charges; |
|
|
• |
“occupancy” or a specified percentage of our portfolio that is “occupied” means the quotient of (1) the total square footage of our properties minus the square footage of our properties that are vacant and from which we are not receiving any rental payment, and (2) the total square footage of our properties as of a specified date; and |
|
|
• |
“Revolving Credit Facility” means our $600 million senior unsecured revolving credit facility, dated June 23, 2017, with Manufacturers and Traders Trust Company and the other lenders party thereto, as amended from time to time. |
We acquire, own, and manage primarily single-tenant commercial real estate properties that are net leased on a long-term basis to a diversified group of tenants. Since our inception in 2007, we have selectively invested in net leased assets in the industrial, healthcare, restaurant, office, and retail property types, and as of June 30, 2020, our portfolio has grown to 632 properties in 41 U.S. states and one property in Canada, with an aggregate gross asset value of approximately $4.0 billion.
We focus on investing in real estate that is operated by creditworthy single tenants in industries characterized by positive business drivers and trends, where the properties are an integral part of the tenants’ businesses and there are opportunities to secure long-term net leases. Through long-term net leases, our tenants are able to retain operational control of their strategically important locations, while allocating their debt and equity capital to fund their core business operations rather than real estate ownership.
|
|
- |
Diversified Portfolio. As of June 30, 2020, our portfolio comprised approximately 27.4 million rentable square feet of operational space, and was highly diversified based on property type, geography, tenant, and industry, and is cross-diversified within each (e.g., property-type diversification within a geographic concentration): |
32
|
|
concentrations in manufacturing, distribution and warehouse, clinical, casual dining, quick service restaurant, strategic operations, corporate headquarters, food processing, flex/research and development, and cold storage. |
|
|
o |
Geographic Diversity: Our properties are located in 41 U.S. states and British Columbia, Canada, with no single geographic concentration exceeding 10.4% of our ABR. |
|
|
o |
Tenant and Industry Diversity: Our properties are occupied by approximately 182 different commercial tenants who operate 168 different brands that are diversified across 54 differing industries, with no single tenant accounting for more than 2.5% of our ABR. |
|
|
- |
Strong In-Place Leases with Significant Remaining Lease Term. As of June 30, 2020, our portfolio was approximately 99.6% leased based on rentable square footage with an ABR weighted average remaining lease term of approximately 11.0 years, excluding renewal options. |
|
|
- |
Standard Contractual Base Rent Escalation. Approximately 98.2% of our leases have contractual rent escalations, with an ABR weighted average minimum increase of 2.1%. |
|
|
- |
Extensive Tenant Financial Reporting. Approximately 88.4% of our ABR is received from tenants that are required to provide us with specified financial information on a periodic basis. An additional 6.6% of our ABR is received from tenants that are public companies, which are required to file financial statements with the SEC, although they are not required to provide us with specified financial information under the terms of our lease. |
Recent Developments — COVID-19 Pandemic
The rapidly evolving circumstances related to the COVID-19 pandemic have resulted in deep economic uncertainty and far-reaching impacts on almost every business and industry. In response to the COVID-19 pandemic, many countries and U.S. states, including the areas in which we operate, adopted certain measures to mitigate the ongoing public health crises. Such measures included “shelter in place” or “stay at home” rules, restrictions on travel, and restrictions on the types of businesses that may continue to operate in many countries and U.S. states. Although such restrictions have been or were in the process of being lifted in several locations, the recent resurgence of COVID-19 cases has led to a reinstatement or partial reinstatement of restrictions in other locations. We cannot predict whether and to what extent the restrictions will be reinstated, whether additional states and cities will implement similar restrictions or when restrictions currently in place will expire. As a result, the COVID-19 pandemic is negatively impacting almost every industry directly or indirectly, including industries in which our tenants operate. Further, the impacts of a potential worsening of global economic conditions and the continued disruptions to, and volatility in, the credit and financial markets, and consumer spending, as well as other unanticipated consequences, remain unknown.
The sections below summarize the impacts of the COVID-19 pandemic on our results of operations, liquidity and capital resources, during the three and six months ended June 30, 2020, as well as management’s view of potential impacts on our future results of operations, liquidity and capital resources. For more discussion on the risks associated with the COVID-19 outbreak, see Part II, Item 1A. “Risk Factors” of our Quarterly Report on Form 10-Q for the quarter ended March 31, 2020, filed with the SEC on May 7, 2020.
Impact to Results of Operations
Our results of operations and financial condition are affected by numerous factors, many of which are beyond our control. Key factors that typically impact our results of operations and financial condition, which may be exacerbated by the COVID-19 pandemic, include rental rates and collections, property dispositions, lease renewals and occupancy, acquisition volume, net lease terms, interest expense, general and administrative expenses, tenant bankruptcies, and impairments.
Rental Rates and Collections
Our financial results depend on our ability to timely collect contractual rents due under our long-term net leases. The COVID-19 pandemic’s impact on us has primarily manifested through tenant requests for rent relief, which we started to receive in late March 2020. Although the requests ranged in scope, the most common request was for a full or partial rent deferment for three months, with repayment over a six- to twelve-month period following the reinstatement of regular rent payments. As of June 30, 2020, we had resolved all active outstanding requests for rent relief as of that time. In total, we granted partial rent relief requests to 15 tenants related to 93 properties whose total base contractual rents represent 9.7% of June ABR, compared with total requests received from 59 tenants related to 295 properties whose total base contractual rents represented 33.7% of June ABR.
We evaluated each request for rent relief as a unique situation, employing a rigorous credit and business analysis focusing on, among other things, industry circumstances, the tenant’s financial performance, liquidity position, lease structure, geographic location, and regulatory impacts on the tenant’s operations (e.g., stay-at-home orders, essential v. nonessential business designations). Based on our analyses, we granted relief on a select basis only to those tenants we determined to be most in need. In cases where we granted rent relief, we focused on negotiating the shortest possible repayment period and, when possible, lease enhancements (e.g. extensions of term). There were several tenants who requested rent relief that we believed were well positioned to continue making rent payments during the pandemic. Many of those tenants had strong balance sheets and liquidity positions, had applied for or received Paycheck Protection Program loan funding under the CARES Act, or are designated as essential businesses and can continue to operate despite
33
restrictions on other businesses. We declined to agree to any rent relief in those circumstances, and in all such cases the tenants continued to pay all rents due as of June 30, 2020.
The rent relief requests we granted included partial deferral of payment of rent with 14 tenants, and a partial abatement of rent with one tenant. The partial rent deferrals ranged in length between two and six months, with a weighted average deferral of 3.4 months. Amounts deferred will be repaid over periods ranging between three months to one year, with a weighted average repayment period of 5.6 months beginning in July 2020. The partial abatement represents a portion of rents due over a nine-month period, with the minimum required rent payable increasing during the abatement period. In exchange, we negotiated a three-year lease term extension and an upside percentage rent clause during the abatement period, which we expect to provide us with long-term value accretion. At June 30, 2020, we had received payment for the base amounts due for the second and third quarters of 2020 under the rent abatement agreement.
In circumstances where we agreed to a rent deferral that is to be repaid over a period of time, and where the terms of the lease and amounts paid under the lease are substantially the same, we will continue to recognize the same amount of GAAP lease revenue each period to the extent the amounts are probable of collection. The amounts we agreed to defer will impact our cash flows from operations.
Other than one tenant that had filed for bankruptcy, all but one tenant paid their rent due for the second quarter, either in full or in accordance with the terms of the agreed-upon rent relief agreements. Uncollected base rent not subject to deferment, abatement, or bankruptcy, represents less than 0.02% of base rents due for the three months ended June 30, 2020.
The following chart and tables summarize our second quarter 2020 rent collection, in total and by tenant industry and property type:
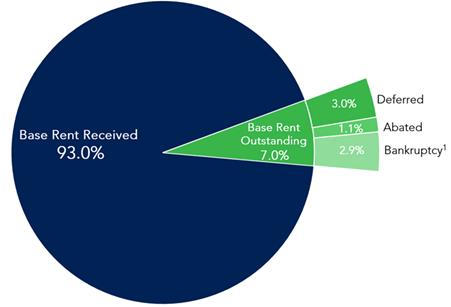
1 Relates to post-petition rents due from one tenant who had filed for bankruptcy.
|
|
|
|
|
|
% Base Rent Collected |
|
|
% Base Rent Not Collected |
|
|||||||||||||||
|
Tenant Industry |
% of June ABR |
|
|
April |
|
|
May |
|
|
June |
|
|
Q2 |
|
|
Deferred |
|
|
Abated |
|
|
Bankruptcy |
|
|
|
Restaurants |
15.8% |
|
|
97.0% |
|
|
84.0% |
|
|
83.9% |
|
|
88.7% |
|
|
4.4% |
|
|
6.9% |
|
|
— |
|
|
|
Home Furnishing Retail |
3.3% |
|
|
26.9% |
|
|
26.9% |
|
|
26.9% |
|
|
26.9% |
|
|
4.8% |
|
|
— |
|
|
68.3% |
|
|
|
Specialty Stores |
2.2% |
|
|
68.3% |
|
|
68.3% |
|
|
68.3% |
|
|
68.3% |
|
|
31.7% |
|
|
— |
|
|
— |
|
|
|
Industrial Machinery |
1.9% |
|
|
84.6% |
|
|
84.6% |
|
|
84.6% |
|
|
84.6% |
|
|
15.4% |
|
|
— |
|
|
— |
|
|
|
Home Furnishings |
1.8% |
|
|
72.9% |
|
|
72.9% |
|
|
72.9% |
|
|
72.9% |
|
|
27.1% |
|
|
— |
|
|
— |
|
|
|
Life Sciences Tools & Services |
1.4% |
|
|
81.8% |
|
|
81.8% |
|
|
81.8% |
|
|
81.8% |
|
|
18.2% |
|
|
— |
|
|
— |
|
|
|
Movies & Entertainment 2 |
1.1% |
|
|
100.0% |
|
|
50.0% |
|
|
50.0% |
|
|
66.7% |
|
|
33.3% |
|
|
— |
|
|
— |
|
|
|
All Other |
72.5% |
|
|
100.0% |
|
|
100.0% |
|
|
100.0% |
|
|
100.0% |
|
|
— |
|
|
— |
|
|
— |
|
|
|
Grand Total |
100.0% |
|
|
94.7% |
|
|
92.1% |
|
|
92.1% |
|
|
93.0% |
|
|
3.0% |
|
|
1.1% |
|
|
2.9% |
|
|
2 Industrial tenant.
34
|
|
|
|
|
% Base Rent Collected |
|
|
% Base Rent Not Collected |
|
||||||||||||||||
|
Property Type |
% of June ABR |
|
|
April |
|
|
May |
|
|
June |
|
|
Q2 |
|
|
Deferred |
|
|
Abated |
|
|
Bankruptcy |
|
|
|
Industrial |
44.1% |
|
|
96.2% |
|
|
95.0% |
|
|
95.0% |
|
|
95.4% |
|
|
4.6% |
|
|
— |
|
|
— |
|
|
|
Healthcare |
19.9% |
|
|
98.6% |
|
|
98.6% |
|
|
98.6% |
|
|
98.6% |
|
|
1.4% |
|
|
— |
|
|
— |
|
|
|
Restaurant |
15.5% |
|
|
97.0% |
|
|
83.8% |
|
|
83.7% |
|
|
88.4% |
|
|
4.5% |
|
|
7.1% |
|
|
— |
|
|
|
Office |
10.0% |
|
|
100.0% |
|
|
100.0% |
|
|
100.0% |
|
|
100.0% |
|
|
— |
|
|
— |
|
|
— |
|
|
|
Retail |
8.8% |
|
|
69.9% |
|
|
69.9% |
|
|
69.9% |
|
|
69.9% |
|
|
— |
|
|
— |
|
|
30.1% |
|
|
|
Other |
1.7% |
|
|
100.0% |
|
|
100.0% |
|
|
100.0% |
|
|
100.0% |
|
|
— |
|
|
— |
|
|
— |
|
|
|
Grand Total |
100.0% |
|
|
94.7% |
|
|
92.1% |
|
|
92.1% |
|
|
93.0% |
|
|
3.0% |
|
|
1.1% |
|
|
2.9% |
|
|
Rent collections have remained strong during the third quarter to date. As of the date of this filing, we had collected 96.5% of contractual base rents due for July 2020 as well as 100% of amounts due to be repaid in July 2020 under rent deferral agreements. Despite our continued strong rent collections subsequent to the outbreak of the COVID-19 pandemic, the duration of the pandemic and its impact on our tenants’ ability to return to business after governmental restrictions are fully lifted could have a significant negative impact on our ability to continue to collect future rents.
Property Dispositions
From time to time, we strategically dispose of properties, primarily when we believe the risk profile has changed and become misaligned with our then current risk-adjusted return objectives. The resulting gains or losses on dispositions may materially impact our operating results, and the recognition of a gain or loss on the sale of real estate varies from transaction to transaction based on fluctuations in asset prices and demand in the real estate market at the time a property is listed for sale. As a result of the COVID-19 pandemic, we have seen a significant slowdown in real estate transactions. In the short term, the slowdown in market activity may inhibit our ability to dispose of properties we have identified for disposition, including those that experience significant credit deterioration as a result of the COVID-19 pandemic, and the price at which we are able to sell the properties may be negatively impacted. We were able to dispose of certain properties at the end of the first quarter of 2020 and early in the second quarter 2020 that were already under contract and substantially along in the disposition process, and used the proceeds to bolster our liquidity position. We also disposed of a property subsequent to June 30, 2020 that had been vacant as of June 30, 2020. While we successfully disposed of these properties at advantageous prices, we will continue to monitor the pandemic’s impact and continue to selectively dispose of properties when advantageous to do so.
Lease Renewals and Occupancy
As of June 30, 2020, the ABR weighted average remaining term of our portfolio was approximately 11.0 years, excluding renewal options, and approximately 8.4% of our leases (based on ABR) will expire prior to January 1, 2025. The stability of the rental revenue generated by our properties depends principally on our tenants’ ability to pay rent and our ability to collect rents, renew expiring leases or re-lease space upon the expiration or other termination of leases, lease currently vacant properties, and maintain or increase rental rates at our leased properties. To the extent our properties become vacant, we would forego rental income while remaining responsible for the payment of property taxes and maintaining the property until it is re-leased, which could negatively impact our operating results. Our occupancy rates have remained strong during the COVID-19 pandemic, standing at 99.5% as of June 30, 2020 based on rentable square footage. Additionally, when negotiating COVID-19 related rent relief agreements, we have sought to extend lease terms where possible, to preserve the continuity of tenants and long-term cash flows derived from our portfolio. We continue to monitor the impact the COVID-19 pandemic is having on lease renewals and occupancy.
Acquisition Volume
Our historical growth in revenues and earnings has been achieved through rent escalations associated with existing in-place leases, coupled with rental income generated from accretive property acquisitions. Our ability to grow revenue will depend, to a significant degree, on our ability to identify and complete acquisitions that meet our investment criteria. Changes in capitalization rates, interest rates, or other factors may impact our acquisition opportunities in the future. Market conditions may also impact the total returns we can achieve on our investments. Our acquisition volume also depends on our ability to access third-party debt and equity financing. The COVID-19 pandemic caused a slowdown in acquisition volume, and we have not acquired any new properties in the first six months of 2020. We will continue to monitor the pandemic’s impact on capitalization rates, interest rates, and access and cost of equity and debt capital, and return to our focus on growth through acquisitions when it is prudent to do so.
Net Lease Terms
Substantially all of our leases are net leases pursuant to which our tenant generally is obligated to pay all expenses associated with the leased property including real estate taxes, insurance, maintenance, repairs, and capital costs. A limited number of leases require us to
35
pay some or all of the property expenses such as the cost of environmental liabilities, roof and structure repairs, real estate taxes, insurance, or certain non-structural repairs and maintenance. Additionally, we seek to use master lease structures where it fits market practice in the particular property type, pursuant to which we seek to lease multiple properties to a single tenant on an all or none basis. Master leases strengthen our ability to preserve rental revenue and prevent costs associated with vacancies for underperforming properties. We believe the master lease structure is most prevalent and applicable to leases in our restaurant and retail property types, while less relevant to our other property types, such as healthcare and industrial. As of June 30, 2020, master leases contributed approximately 34.4% of our overall ABR (our largest master lease by ABR related to 24 properties and contributed 2.5% of our ABR, and our smallest master lease by ABR related to two properties and contributed 0.1% of our ABR), 72.9% of our restaurant property ABR (161 of our 243 restaurant properties), and 52.8% of our retail property ABR (79 of our 128 retail properties).
In instances in which we granted rent relief, we generally preserved the rights afforded to us pursuant to our leases. We continue to monitor the impact the ongoing COVID-19 pandemic, which presents certain risks of modifications to our lease terms. These lease terms include certain rights we have under master leases and the risk of tenants’ failure to meet their lease obligations, including the risk that the prolonged economic downturn forces tenants into bankruptcy. An increase in the number of leases under which we are responsible for some or all of these expenses could negatively influence our operating results.
Interest Expense
We anticipate that we will continue to incur debt to fund future acquisition activity, which will increase the amount of interest expense we incur. In addition, although we attempt to limit our total floating-rate debt exposure, changes in the interest rate environment could either increase or decrease our weighted average interest rate in the future. Any changes to our debt structure or debt financing associated with property acquisitions, could materially influence our operating results depending on the terms of any such debt. A downgrade in our credit rating could also increase the amount of interest we pay under our debt agreements.
Interest rates have continued to decline as the U.S. federal government attempts to combat the economic impacts of the COVID-19 pandemic. We benefited from this dynamic to the extent our floating rate borrowings were unhedged during the second quarter. Our floating rate borrowings bear interest at variable rates equal to LIBOR plus a margin based on our credit rating. The one-month LIBOR rate decreased from 1.76% at December 31, 2019, to 0.16% at June 30, 2020. Additionally, as of July 31, 2020, the one-month LIBOR rate was 0.15%. Restrictions in credit markets have simultaneously resulted in an increase in borrowing spreads across the debt capital markets as compared to the end of 2019, although they narrowed during the second quarter of 2020. Approximately $240 million of borrowings under our 2020 Unsecured Term Loan were set to a mature in 2020. We exercised the first of two extension options available under the loan, effective as of August 2, 2020, and extended the maturity to February 2, 2021. As market conditions evolve and we return to executing against our growth strategy, additional changes in interest rates and our borrowing spreads could influence our operating results.
General and Administrative Expenses
Our general and administrative expenses primarily consist of compensation and related costs, third party legal, accounting, and consulting costs, travel and entertainment, and general office expenses. We transitioned to a work from home policy effective on March 16, 2020, successfully migrating approximately 73 employees out of the office. As of the date of this filing, the policy remains in effect. Given our limited headcount, we have not incurred a material amount of cash outlays on information technology or infrastructure to facilitate our remote workforce, and do not believe we will incur significant costs in the future. We expect a significant decrease in travel and entertainment expenses, as social distancing guidelines and restrictions have limited corporate travel. These benefits, however, may be outweighed by incremental third party legal, accounting, and consulting costs if the impacts of the COVID-19 pandemic worsen.
Tenant Bankruptcies
Adverse economic conditions, particularly those that affect the markets in which our properties are located, or downturns in our tenants’ industries could impair our tenants’ ability to meet their lease obligations to us and our ability to renew expiring leases or re-lease space. In particular, the bankruptcy of one or more of our tenants could adversely affect our ability to collect rents from such tenant and maintain our portfolio’s occupancy. At June 30, 2020, one of our tenants, representing less than 0.5% of June ABR, was subject to bankruptcy proceedings. To mitigate the negative impact of these bankruptcy proceedings, we successfully re-leased the majority of properties leased to this tenant at the end of the second quarter. We have yet to see the long-term effects of the pandemic and the extent to which it may impact our tenants in the future. A prolonged exposure to the negative economic impacts of the pandemic may result in additional tenant bankruptcies.
Impairments
We review long-lived assets to be held and used for possible impairment when events or changes in circumstances indicate that their carrying amounts may not be recoverable. If, and when, such events or changes in circumstances are present, an impairment exists to
36
the extent the carrying value of the asset or asset group exceeds the sum of the undiscounted cash flows expected to result from the use of the asset or asset group and its eventual disposition. Such cash flows include expected future operating income, as adjusted for trends and prospects, as well as the effects of demand, competition, and other factors. Significant judgment is made as to if and when impairment should be taken. If our strategy, or one or more of the assumptions described above were to change in the future, an impairment may need to be recognized. Indications of a tenant’s inability to continue as a going concern, changes in our view or strategy relative to a tenant’s business or industry as a result of the COVID-19 pandemic, or changes in our long-term hold strategies, could each be indicative of an impairment triggering event. For the three and six months ended June 30, 2020, we recognized $0.5 million of impairment associated with a lease modification as the result of a tenant’s request for rent relief. We face the risk of additional impairments depending on the long-term effects of the COVID-19 pandemic and the extent to which it may impact our tenants in the future.
Impact to Liquidity and Capital Resources
Given the economic uncertainty and evolving circumstances related to the COVID-19 pandemic and the potential for further tenant requests for rent relief, we continue to evaluate all options for strengthening our liquidity position. As previously disclosed, we bolstered our liquidity profile and cash on hand position at the end of the first quarter of 2020, partially through additional borrowings on our Revolving Credit Facility as well as through the suspension of our monthly dividend. Given the strength of our rent collections, better-than-expected liquidity in the financial markets, and careful expense management, we repaid a net $105 million on our Revolving Credit Facility during the second quarter, resulting in lower leverage while maintaining financial flexibility. As of June 30, 2020, the Revolving Credit Facility had an outstanding balance of $248.3 million, and cash and cash equivalents and restricted cash totaled $9.8 million. In addition, in light of the economic uncertainty and rapidly evolving circumstances related to the COVID-19 pandemic and then-current tenant rent relief requests, to preserve cash, strengthen our liquidity position, and manage our overall leverage profile, in May 2020 our board of directors determined that we would temporarily suspend our monthly distribution. At its August 4, 2020 meeting, the board of directors undertook a full review of our rent collection results for the second quarter of 2020, preliminary collection results for July 2020, our outlook for collections in future months, and our overall liquidity position. Based on our strong collection results and operating performance, the board voted to reinstate a distribution, announcing that the Company would transition to quarterly distribution payments beginning with the quarter ended September 30, 2020. With the continued uncertainty surrounding the COVID-19 pandemic’s long term impact to our tenants, and the recent resurgence in certain geographical hot spots, the board set a $0.54 distribution per common share and OP Unit to stockholders and OP Unit holders of record as of September 30, 2020, payable on or before October 15, 2020. The Company believes this quarter’s distribution is also an incrementally important step towards ensuring the Company satisfies its REIT distribution requirements for the year ended December 31, 2020.
In addition to our cash on hand, as of June 30, 2020, we also have $351.7 million of available capacity under our Revolving Credit Facility, and $100 million of available capacity in the form of an accordion feature on our 2026 Unsecured Term Loan. Under the terms of our credit agreements, we must maintain ratios of total indebtedness to total market value, and total unsecured indebtedness to total unencumbered eligible property value (together, “leverage covenant ratios”), of less than 60%, measured as of each quarter end. Taking into consideration our leverage covenant ratios, as of June 30, 2020 we had $148.8 million of available borrowing capacity under our covenants. Management believes we were in compliance with the terms of our covenants as of June 30, 2020.
We believe our cash on-hand, available capacity on our credit facilities, including the restrictions imposed by our covenant ratios, and our ability to manage distributions provide us with the ability to meet all current obligations and to maintain our REIT status, for at least the next four quarters. However, the COVID-19 pandemic’s ultimate impact to tenants is not yet known, and could result in significantly aged delinquencies and tenant defaults, which would have a direct impact on our leverage covenant ratios. See further discussion concerning our liquidity in Liquidity and Capital Resources below.
37
Internal Controls over Financial Reporting and Disclosure Controls
We have taken proactive steps to maintain an appropriate internal control environment while migrating our workforce to a work from home dynamic. Our access to technology and online communications has required minimal changes to controls, none of which we deem material. We believe our existing disclosure controls are appropriate to address the reporting complexities presented by the COVID-19 pandemic.
Recent Developments — Internalization
In order to benefit from increasing economies of scale as we continue to grow, our board of directors made the decision to internalize our management structure, which was completed on February 7, 2020. In connection with the Internalization, we terminated our management agreements with BRE, entered into employment agreements with each of our named executive officers, and began directly employing 71 former employees of BRE. Our historical results of operations through February 7, 2020, include the payment of management fees that we will no longer pay following the Internalization and do not include the direct compensation expense associated with our current 73 employees, or certain professional fees, consulting, portfolio servicing costs, and other general and administrative expenses not previously incurred based upon our externally managed structure. Additional details of the Internalization include the following:
|
|
• |
As consideration in the Internalization, we issued 780,893 shares of our common stock, and the OP issued 1,319,513 OP Units and we and the OP paid $31.0 million in cash, for aggregate consideration of approximately $209.5 million, and the OP assumed approximately $90.5 million of debt. Concurrent with the closing, we refinanced $60 million of the assumed debt with a new loan that is guaranteed by Amy L. Tait, our founder and Chairman, and certain members of her family (“Founding Owners”), and repaid the remaining $30.5 million using borrowings from our Revolving Credit Facility. |
|
|
• |
In addition to the consideration paid immediately following the Mergers, the Merger Agreement provides that additional “earnout” consideration of up to an aggregate of up to $75 million (payable in four tranches of $10 million, $15 million, $25 million, and $25 million) will be due and payable to the former owners of BRE if certain milestones related to either (a) the 40-day dollar volume-weighted average price of our common stock on the principal exchange or securities market (or over-the-counter market) on which our shares of common stock are then traded, following the completion of an IPO, or (b) our adjusted funds from operations per share, prior to the completion of an IPO, are achieved during specified periods of time following the completion of the Internalization. Should all earnout milestones be met, an additional 272,250 shares of common stock and 464,820 OP Units would be issued. The earnout liability had an estimated fair value of $40.1 million at the time of the Internalization. |
|
|
• |
We entered into a registration rights agreement with our founding owners and Trident BRE, LLC and its affiliates, and the Founding Owners’ Tax Protection Agreement. |
As of June 30, 2020, our real estate investment portfolio had a gross asset value of approximately $4.0 billion, consisting of investments in 632 commercial real estate properties with locations in 41 states and one real estate property located in British Columbia, Canada, and leased to tenants in various industries. All but seven of our properties were subject to a lease as of June 30, 2020.
Our historical results of operations for the six months ended June 30, 2020 and the three and six months ended June 30, 2019, discussed below, include the payment of asset and property management fees that we will no longer pay following the Internalization, and do not include the expected full impact of direct compensation expense associated with employees employed by us following the Internalization or incremental general and administrative expenses.
38
|
|
|
For the three months ended |
|
|
For the six months ended |
|
||||||||||||||||||||||||||
|
|
|
June 30, |
|
|
Increase/(Decrease) |
|
|
June 30, |
|
|
Increase/(Decrease) |
|
||||||||||||||||||||
|
(in thousands) |
|
2020 |
|
|
2019 |
|
|
$ |
|
|
% |
|
|
2020 |
|
|
2019 |
|
|
$ |
|
|
% |
|
||||||||
|
Contractual rental amounts billed for operating leases and straight-line rent adjustments |
|
$ |
75,618 |
|
|
$ |
65,563 |
|
|
$ |
10,055 |
|
|
|
15.3 |
% |
|
$ |
150,111 |
|
|
$ |
129,153 |
|
|
$ |
20,958 |
|
|
|
16.2 |
% |
|
Variable rental amounts earned |
|
|
51 |
|
|
|
— |
|
|
|
51 |
|
|
>100 |
% |
|
|
74 |
|
|
|
— |
|
|
|
74 |
|
|
>100 |
% |
||
|
Adjustment to revenue recognized for uncollectible rental amounts billed |
|
|
(1,190 |
) |
|
|
— |
|
|
|
(1,190 |
) |
|
>100 |
% |
|
|
(2,223 |
) |
|
|
(440 |
) |
|
|
(1,783 |
) |
|
>100 |
% |
||
|
Operating expenses billed to/reimbursed from tenants |
|
|
4,335 |
|
|
|
2,486 |
|
|
|
1,849 |
|
|
|
74.4 |
% |
|
|
8,067 |
|
|
|
6,761 |
|
|
|
1,306 |
|
|
|
19.3 |
% |
|
Other income from real estate transactions |
|
|
702 |
|
|
|
— |
|
|
|
702 |
|
|
>100 |
% |
|
|
731 |
|
|
|
— |
|
|
|
731 |
|
|
>100 |
% |
||
|
Total lease revenues from operating leases |
|
|
79,516 |
|
|
|
68,049 |
|
|
|
11,467 |
|
|
|
16.9 |
% |
|
|
156,760 |
|
|
|
135,474 |
|
|
|
21,286 |
|
|
|
15.7 |
% |
|
Earned income from direct financing leases |
|
|
855 |
|
|
|
1,004 |
|
|
|
(149 |
) |
|
|
(14.8) |
% |
|
|
1,842 |
|
|
|
2,009 |
|
|
|
(167 |
) |
|
|
(8.3) |
% |
|
Total Lease revenues, net |
|
$ |
80,371 |
|
|
$ |
69,053 |
|
|
$ |
11,318 |
|
|
|
16.4 |
% |
|
$ |
158,602 |
|
|
$ |
137,483 |
|
|
$ |
21,119 |
|
|
|
15.4 |
% |
The increase in Lease revenues, net for the three and six months ended June 30, 2020, was primarily attributable to the growth in our real estate portfolio, which was achieved through accretive property acquisitions during 2019, weighted towards the second half of the year, and continued strong portfolio operating performance. In 2019, we significantly increased the size of our portfolio, adding 74 new properties at an aggregate cost of approximately $1.0 billion, excluding capitalized acquisition costs. As of June 30, 2020, we had collected approximately 93% of second quarter rents due and our portfolio was 99.5% occupied (based on rentable square footage). As of June 30, 2020, the ABR weighted average annual rent increases on our properties was 2.1%.
Operating Expenses
|
|
|
For the three months ended |
|
|
For the six months ended |
|
||||||||||||||||||||||||||
|
|
|
June 30, |
|
|
Increase/(Decrease) |
|
|
June 30, |
|
|
Increase/(Decrease) |
|
||||||||||||||||||||
|
(in thousands) |
|
2020 |
|
|
2019 |
|
|
$ |
|
|
% |
|
|
2020 |
|
|
2019 |
|
|
$ |
|
|
% |
|
||||||||
|
Operating expenses |
|
|
|
|
|
|
|
|
|
|
|
|
|
|
|
|
|
|
|
|
|
|
|
|
|
|
|
|
|
|
|
|
|
Depreciation and amortization |
|
$ |
39,921 |
|
|
$ |
25,287 |
|
|
$ |
14,634 |
|
|
|
57.9 |
% |
|
$ |
71,140 |
|
|
$ |
49,597 |
|
|
$ |
21,543 |
|
|
|
43.4 |
% |
|
Asset management fees |
|
|
— |
|
|
|
5,318 |
|
|
|
(5,318 |
) |
|
|
(100.0) |
% |
|
|
2,461 |
|
|
|
10,438 |
|
|
|
(7,977 |
) |
|
|
(76.4) |
% |
|
Property management fees |
|
|
— |
|
|
|
1,935 |
|
|
|
(1,935 |
) |
|
|
(100.0) |
% |
|
|
1,275 |
|
|
|
3,820 |
|
|
|
(2,545 |
) |
|
|
(66.6) |
% |
|
Property and operating expense |
|
|
4,190 |
|
|
|
3,252 |
|
|
|
938 |
|
|
|
28.8 |
% |
|
|
8,305 |
|
|
|
7,642 |
|
|
|
663 |
|
|
|
8.7 |
% |
|
General and administrative |
|
|
5,700 |
|
|
|
1,389 |
|
|
|
4,311 |
|
|
>100 |
% |
|
|
11,542 |
|
|
|
2,492 |
|
|
|
9,050 |
|
|
>100 |
% |
||
|
Provision for impairment of investment in rental properties |
|
|
534 |
|
|
|
— |
|
|
|
534 |
|
|
>100 |
% |
|
|
2,667 |
|
|
|
1,017 |
|
|
|
1,650 |
|
|
>100 |
% |
||
|
Total operating expenses |
|
$ |
50,345 |
|
|
$ |
37,181 |
|
|
$ |
13,164 |
|
|
|
35.4 |
% |
|
$ |
97,390 |
|
|
$ |
75,006 |
|
|
$ |
22,384 |
|
|
|
29.8 |
% |
Depreciation and amortization
The increase in depreciation and amortization expense for the three and six months ended June 30, 2020, is primarily due to the growth in our real estate portfolio.
Asset management fees and Property management fees
Prior to the Internalization on February 7, 2020, we paid our third-party manager a quarterly fee equal to 0.25% of the aggregate value of our equity on a fully diluted basis, based on the determined share value established by our board of directors (“Determined Share Value”). Additionally, we paid our third-party manager a monthly fee equal to 3% of gross rentals collected from our real estate portfolio as compensation for its property management services. Upon completion of the Internalization, the agreements with the third-party manager were terminated, resulting in a decrease in these expenses as compared to the prior year period. Our management fees were replaced by compensation and related costs associated with an internalized management structure, and corresponding general and administrative expenses.
39
The increase in general and administrative expenses mainly reflects the impact of the Internalization, and our current employment of approximately 73 employees. Following the Internalization, our asset and property management fees were replaced with compensation and related expenses, which totaled $3.8 million and $6.6 million during the three and six months ended June 30, 2020, respectively, along with associated general and administrative expenses.
Provision for impairment of investment in rental properties
During the three and six months ended June 30, 2020, we recognized $0.5 million and $2.7 million, respectively, of impairment on our investments in rental properties. We review long-lived assets to be held and used for possible impairment when events or changes in circumstances indicate that their carrying amounts may not be recoverable. If and when such events or changes in circumstances are present, an impairment exists to the extent the carrying value of the asset or asset group exceeds the sum of the undiscounted cash flows expected to result from the use of the asset or asset group and its eventual disposition. The timing and amount of impairment fluctuates from period to period depending on the specific facts and circumstances.
Other income (expenses)
|
|
|
For the three months ended |
|
|
For the six months ended |
|
||||||||||||||||||||||||||
|
|
|
June 30, |
|
|
Increase/(Decrease) |
|
|
June 30, |
|
|
Increase/(Decrease) |
|
||||||||||||||||||||
|
(in thousands) |
|
2020 |
|
|
2019 |
|
|
$ |
|
|
% |
|
|
2020 |
|
|
2019 |
|
|
$ |
|
|
% |
|
||||||||
|
Other income (expenses) |
|
|
|
|
|
|
|
|
|
|
|
|
|
|
|
|
|
|
|
|
|
|
|
|
|
|
|
|
|
|
|
|
|
Interest income |
|
$ |
11 |
|
|
$ |
— |
|
|
$ |
11 |
|
|
>100 |
% |
|
$ |
20 |
|
|
$ |
1 |
|
|
$ |
19 |
|
|
>100 |
% |
||
|
Interest expense |
|
|
(19,513 |
) |
|
|
(16,732 |
) |
|
|
2,781 |
|
|
|
16.6 |
% |
|
|
(40,504 |
) |
|
|
(32,560 |
) |
|
|
7,944 |
|
|
|
24.4 |
% |
|
Cost of debt extinguishment |
|
|
— |
|
|
|
(8 |
) |
|
|
(8 |
) |
|
|
(100.0) |
% |
|
|
(22 |
) |
|
|
(721 |
) |
|
|
(699 |
) |
|
|
(96.9) |
% |
|
Gain on sale of real estate |
|
|
1,046 |
|
|
|
2,787 |
|
|
|
(1,741 |
) |
|
|
(62.5) |
% |
|
|
8,665 |
|
|
|
4,187 |
|
|
|
4,478 |
|
|
>100 |
% |
|
|
Income taxes |
|
|
(402 |
) |
|
|
(305 |
) |
|
|
97 |
|
|
|
31.8 |
% |
|
|
(951 |
) |
|
|
(748 |
) |
|
|
203 |
|
|
|
27.1 |
% |
|
Internalization expenses |
|
|
(389 |
) |
|
|
(272 |
) |
|
|
117 |
|
|
|
43.0 |
% |
|
|
(1,594 |
) |
|
|
(272 |
) |
|
|
1,322 |
|
|
>100 |
% |
|
|
Change in fair value of earnout liability |
|
|
6,321 |
|
|
|
— |
|
|
|
6,321 |
|
|
>100 |
% |
|
|
2,144 |
|
|
|
— |
|
|
|
(2,144 |
) |
|
>100 |
% |
||
|
Other losses |
|
|
(2 |
) |
|
|
— |
|
|
|
2 |
|
|
>100 |
% |
|
|
(24 |
) |
|
|
— |
|
|
|
24 |
|
|
>100 |
% |
||
Interest expense
The increased interest expense during the three and six months ended June 30, 2020, resulted primarily from an increase in average outstanding borrowings as compared to the three and six months ended June 30, 2019, due mainly to borrowings associated with a significant acquisition in the third quarter of 2019, and incremental borrowings associated with the Internalization, partially offset by a 75 basis point decrease in our weighted average cost of debt, inclusive of our interest rate swaps. We were able to take advantage of the decreasing interest rates since June 30, 2019, as our percentage of floating-rate debt increased concurrently with our funding of the aforementioned acquisition. We also amended our 2024 Unsecured Term Loan in July 2019 to reduce the applicable margin from 1.90% to 1.25%.
Gain on sale of real estate
Our recognition of a gain or loss on the sale of real estate varies from transaction to transaction based on fluctuations in asset prices and demand in the real estate market. During the three months ended June 30, 2020, we recognized gains of $1.0 million on the sale of three properties, compared to gains of $2.8 million on the sale of five properties during the three months ended June 30, 2019. During the six months ended June 30, 2020, we recognized gains of $8.7 million on the sale of 13 properties, compared to gains of $4.2 million on the sale of nine properties during the six months ended June 30, 2019.
Internalization expenses
During the three and six months ended June 30, 2020, we incurred $0.4 million and $1.6 million, respectively, of third-party fees and consulting expenses associated with the Internalization that closed on February 7, 2020, compared to $0.3 million of such expenses in the comparable prior year periods. We expect incremental internalization expenses in the future to be limited to third party legal and accounting fees related to residual work in connection with the transaction.
40
Change in fair value of earnout liability
As part of the Internalization we may be required to pay additional earnout consideration if certain milestones are achieved during the Earnout Periods. We record the fair value of this contingent consideration as an Earnout liability in the Condensed Consolidated Balance Sheets, and update the fair value at the end of each reporting period. We estimate the fair value of the earnout liability by considering weighted-average probabilities of likely outcomes, and using a Monte Carlo simulation and discounted cash flow analysis to estimate fair value. These estimates require the Company to make various assumptions about future share prices, timing of an IPO, and other items that are unobservable and are considered Level 3 inputs in the fair value hierarchy.
Upon closing of the Internalization, we recorded an earnout liability of $40.1 million through our preliminary purchase price allocation, which decreased to $38.0 million as of June 30, 2020. The decrease in fair value between March 31, 2020 and June 30, 2020 is primarily a result of a decrease in the estimated net asset value per share assumption used, partially offset by an increase in peer stock price volatility, both of which are attributable to changes in economic circumstances impacting global equity markets, as detailed in Note 2 to the Condensed Consolidated Financial Statements above.
Net Income and Non-GAAP Measures (FFO and AFFO)
Our reported results and net earnings per diluted share are presented in accordance with GAAP. We also disclose FFO and AFFO, each of which are non-GAAP measures. We believe the presentation of FFO and AFFO are useful to investors because they are widely accepted industry measures used by analysts and investors to compare the operating performance of REITs. FFO and AFFO should not be considered alternatives to net income as a performance measure or to cash flows from operations, as reported on our statement of cash flows, or as a liquidity measure, and should be considered in addition to, and not in lieu of, GAAP financial measures.
We compute FFO in accordance with the standards established by the Board of Governors of Nareit, the worldwide representative voice for REITs and publicly traded real estate companies with an interest in the U.S. real estate and capital markets. Nareit defines FFO as GAAP net income or loss adjusted to exclude net gains (losses) from sales of certain depreciated real estate assets, depreciation and amortization expense from real estate assets, gains and losses from change in control, and impairment charges related to certain previously depreciated real estate assets. To derive AFFO, we modify the Nareit computation of FFO to include other adjustments to GAAP net income related to certain non-cash and non-recurring revenues and expenses, including straight-line rents, cost of debt extinguishments, amortization of lease intangibles, amortization of debt issuance costs, amortization of net mortgage premiums, (gain) loss on interest rate swaps and other non-cash interest expense, realized gains or losses on foreign currency transactions, internalization expenses, extraordinary items, and other specified non-cash items. We believe that such items are not a result of normal operations and thus we believe excluding such items assists management and investors in distinguishing whether changes in our operations are due to growth or decline of operations at our properties or from other factors.
Our leases include cash rents that increase over the term of the lease to compensate us for anticipated increases in market rentals over time. Our leases do not include significant front-loading or back-loading of payments, or significant rent-free periods. Therefore, we find it useful to evaluate rent on a contractual basis as it allows for comparison of existing rental rates to market rental rates. In situations where we have granted short-term rent deferrals as a result of the COVID-19 pandemic, and such deferrals are probable of collection and expected to be repaid within a short term, we will continue to recognize the same amount of GAAP lease revenues each period. The amounts temporarily deferred are recorded in tenant receivables until they are repaid. Consistent with GAAP lease revenues, the short-term deferrals associated with COVID-19 will not impact our AFFO.
We further exclude costs or gains recorded on the extinguishment of debt, non-cash interest expense and gains, the amortization of debt issuance costs, net mortgage premiums, and lease intangibles, realized gains and losses on foreign currency transactions, and internalization expenses, as these items are not indicative of ongoing operational results. We use AFFO as a measure of our performance when we formulate corporate goals.
FFO is used by management, investors, and analysts to facilitate meaningful comparisons of operating performance between periods and among our peers, primarily because it excludes the effect of real estate depreciation and amortization and net gains on sales, which are based on historical costs and implicitly assume that the value of real estate diminishes predictably over time, rather than fluctuating based on existing market conditions. We believe that AFFO is a useful supplemental measure for investors to consider because it will help them to better assess our operating performance without the distortions created by non-cash revenues or expenses. FFO and AFFO may not be comparable to similarly titled measures employed by other REITs, and comparisons of our FFO and AFFO with the same or similar measures disclosed by other REITs may not be meaningful.
Neither the SEC nor any other regulatory body has passed judgment on the acceptability of the adjustments to FFO that we use to calculate AFFO. In the future, the SEC, Nareit or another regulatory body may decide to standardize the allowable adjustments across the REIT industry and in response to such standardization we may have to adjust our calculation and characterization of AFFO accordingly.
41
The following table presents our net income and our non-GAAP FFO and AFFO. Our measures of FFO and AFFO are computed on the basis of amounts attributable to both us and non-controlling interests. As the non-controlling interests share in our net income on a one-for-one basis, the basic and diluted per share amounts are the same.
|
|
|
For the three months ended |
|
|
For the six months ended |
|
||||||||||||||||||||||||||
|
|
|
June 30, |
|
|
Increase/(Decrease) |
|
|
June 30, |
|
|
Increase/(Decrease) |
|
||||||||||||||||||||
|
(in thousands, except per share data) |
|
2020 |
|
|
2019 |
|
|
$ |
|
|
% |
|
|
2020 |
|
|
2019 |
|
|
$ |
|
|
% |
|
||||||||
|
Net income |
|
$ |
17,098 |
|
|
$ |
17,342 |
|
|
$ |
(244 |
) |
|
|
(1.4) |
% |
|
$ |
28,946 |
|
|
$ |
32,364 |
|
|
$ |
(3,418 |
) |
|
|
(10.6) |
% |
|
Net earnings per diluted share |
|
|
0.57 |
|
|
|
0.70 |
|
|
|
(0.13 |
) |
|
|
(18.6) |
% |
|
|
0.98 |
|
|
|
1.32 |
|
|
|
(0.34 |
) |
|
|
(25.8) |
% |
|
FFO |
|
|
56,485 |
|
|
|
39,842 |
|
|
|
16,643 |
|
|
|
41.8 |
% |
|
|
94,057 |
|
|
|
78,791 |
|
|
|
15,266 |
|
|
|
19.4 |
% |
|
FFO per diluted share |
|
|
1.89 |
|
|
|
1.60 |
|
|
|
0.29 |
|
|
|
18.1 |
% |
|
|
3.19 |
|
|
|
3.22 |
|
|
|
(0.03 |
) |
|
|
(0.9) |
% |
|
AFFO |
|
|
46,056 |
|
|
|
34,637 |
|
|
|
11,419 |
|
|
|
33.0 |
% |
|
|
87,124 |
|
|
|
68,806 |
|
|
|
18,318 |
|
|
|
26.6 |
% |
|
AFFO per diluted share |
|
|
1.54 |
|
|
|
1.39 |
|
|
|
0.15 |
|
|
|
10.8 |
% |
|
|
2.96 |
|
|
|
2.81 |
|
|
|
0.15 |
|
|
|
5.3 |
% |
|
Diluted WASO(a) |
|
|
29,912 |
|
|
|
24,941 |
|
|
|
4,971 |
|
|
|
19.9 |
% |
|
|
29,482 |
|
|
|
24,507 |
|
|
|
4,975 |
|
|
|
20.3 |
% |
|
(a) |
Weighted average number of shares of our common stock and OP Units outstanding (“WASO”), computed in accordance with GAAP. |
Net income
For the three months ended June 30, 2020, compared to the three months ended June 30, 2019, net income decreased primarily due to a $14.6 million increase in depreciation and amortization expense associated with a larger real estate portfolio, a $2.8 million increase in interest expense associated with incremental borrowings used to partially fund our real estate acquisitions and the Internalization, and a $1.7 million decrease in gains on sale of real estate. These factors were partially offset by revenue growth of $11.3 million and the impact of a $6.3 million adjustment to the fair value of our earnout liability in 2020 with no comparable adjustment in the prior year. In addition, as a result of the Internalization, increased general and administrative expenses of $4.3 million were offset by $7.3 million lower asset management and property management fees. For the six months ended June 30, 2020, compared to the six months ended June 30, 2019, net income decreased primarily due to a $21.5 million increase in depreciation and amortization expense, a $7.9 million increase in interest expense, a $1.7 million increase in impairment charges, a $1.3 million increase in internalization expenses, and a $2.1 million adjustment to the fair value of our earnout liability in 2020 with no comparable adjustment in the prior year. These factors were partially offset by revenue growth of $21.1 million and increased gains on sale of real estate in the amount of $4.5 million. In addition, as a result of the Internalization, increased general and administrative expenses of $9.1 million were offset by $10.5 million lower asset management and property management fees.
GAAP net income includes items such as gain or loss on sale of real estate and provisions for impairment, among others, which can vary from quarter to quarter and impact period-over-period comparisons. These fluctuations, combined with the increase in our weighted average shares outstanding, contributed to the $0.13 decrease in net earnings per diluted share for the three months ended June 30, 2020 and a $0.34 decrease in net earnings per diluted share for the six months ended June 30, 2020.
AFFO
The increase in AFFO during the three and six months ended June 30, 2020, as compared to the same periods in 2019, was primarily driven by revenue growth, which resulted from rent escalations associated with our same property portfolio, accretive acquisitions and strong portfolio operating performance, as well as decreased asset and property management fees as a result of terminating the associated agreements in connection with the Internalization, discussed above. These factors were partially offset by increased general and administrative expense related to incremental compensation and related costs associated with an internalized management structure, combined with increased interest expense associated with incremental borrowings. We are realizing the cost savings associated with being internally managed. During the first six months of 2020, amounts incurred for general and administrative expenses were approximately $5.1 million less than the combined asset and property management fees that we would have paid under our previous external management structure. Approximately $3.5 million of these savings were realized during the second quarter of 2020, our first full quarter operating under an internally managed structure.
The $0.15 increase in AFFO per diluted share during the three and six months ended June 30, 2020, was primarily due to the factors discussed above, partially offset by an increase in BNL’s weighted average shares outstanding resulting from continued equity raises associated with our deleveraging plans subsequent to our Industrial Portfolio acquisition in the third quarter of 2019, combined with the common shares and OP Units issued in conjunction with the Internalization. The cost savings associated with an internalized management structure, combined with continued positive operating performance, more than offset the dilutive effect of the higher share count as compared to the three and six months ended June 30, 2019. We expect this accretion will continue to increase as we grow our portfolio and recognize economies of scale.
42
Reconciliation of Non-GAAP Measures
The following is a reconciliation of net income to FFO and AFFO, which are non-GAAP financial measures. Also presented are the diluted WASO and per diluted share amounts:
|
|
|
For the three months ended |
|
|
For the six months ended |
|
||||||||||
|
|
June 30, |
|
|
June 30, |
|
|||||||||||
|
|
|
2020 |
|
|
2019 |
|
|
2020 |
|
|
2019 |
|
||||
|
Net income |
|
$ |
17,098 |
|
|
$ |
17,342 |
|
|
$ |
28,946 |
|
|
$ |
32,364 |
|
|
Real property depreciation and amortization |
|
|
39,899 |
|
|
|
25,287 |
|
|
|
71,109 |
|
|
|
49,597 |
|
|
Gain on sale of real estate |
|
|
(1,046 |
) |
|
|
(2,787 |
) |
|
|
(8,665 |
) |
|
|
(4,187 |
) |
|
Provision for impairment on investment in rental properties |
|
|
534 |
|
|
|
— |
|
|
|
2,667 |
|
|
|
1,017 |
|
|
FFO |
|
$ |
56,485 |
|
|
$ |
39,842 |
|
|
$ |
94,057 |
|
|
$ |
78,791 |
|
|
Capital improvements / reserves |
|
|
— |
|
|
|
(48 |
) |
|
|
— |
|
|
|
(97 |
) |
|
Straight-line rent adjustment |
|
|
(6,151 |
) |
|
|
(5,240 |
) |
|
|
(7,763 |
) |
|
|
(10,383 |
) |
|
Adjustment to provision for credit losses |
|
|
(110 |
) |
|
|
— |
|
|
|
(127 |
) |
|
|
— |
|
|
Cost of debt extinguishment |
|
|
— |
|
|
|
8 |
|
|
|
22 |
|
|
|
721 |
|
|
Amortization of debt issuance costs |
|
|
821 |
|
|
|
597 |
|
|
|
1,709 |
|
|
|
1,150 |
|
|
Amortization of net mortgage premiums |
|
|
(37 |
) |
|
|
(36 |
) |
|
|
(72 |
) |
|
|
(71 |
) |
|
Gain on interest rate swaps and other non-cash interest expense |
|
|
(41 |
) |
|
|
(41 |
) |
|
|
(83 |
) |
|
|
(122 |
) |
|
Amortization of lease intangibles |
|
|
1,019 |
|
|
|
(717 |
) |
|
|
(119 |
) |
|
|
(1,455 |
) |
|
Internalization expenses |
|
|
389 |
|
|
|
272 |
|
|
|
1,594 |
|
|
|
272 |
|
|
Severance |
|
|
— |
|
|
|
— |
|
|
|
26 |
|
|
|
— |
|
|
Change in fair value of earnout liability |
|
|
(6,321 |
) |
|
|
— |
|
|
|
(2,144 |
) |
|
|
— |
|
|
Other losses |
|
|
2 |
|
|
|
— |
|
|
|
24 |
|
|
|
— |
|
|
AFFO |
|
$ |
46,056 |
|
|
$ |
34,637 |
|
|
$ |
87,124 |
|
|
$ |
68,806 |
|
|
|
|
|
|
|
|
|
|
|
|
|
|
|
|
|
|
|
|
Diluted WASO |
|
|
29,912 |
|
|
|
24,941 |
|
|
|
29,482 |
|
|
|
24,507 |
|
|
|
|
|
|
|
|
|
|
|
|
|
|
|
|
|
|
|
|
Net earnings per share, basic and diluted |
|
$ |
0.57 |
|
|
$ |
0.70 |
|
|
$ |
0.98 |
|
|
$ |
1.32 |
|
|
FFO per diluted share |
|
|
1.89 |
|
|
|
1.60 |
|
|
|
3.19 |
|
|
|
3.22 |
|
|
AFFO per diluted share |
|
|
1.54 |
|
|
|
1.39 |
|
|
|
2.96 |
|
|
|
2.81 |
|
Liquidity and Capital Resources
We acquire real estate using a combination of debt and equity capital and with cash from operations that is not otherwise distributed to our stockholders. Our focus is on maximizing the risk-adjusted return to our stockholders through an appropriate balance of debt and equity in our capital structure. We are committed to maintaining an investment grade balance sheet through active management of our leverage profile and overall liquidity position. We believe our leverage model has allowed us to take advantage of the lower cost of debt while simultaneously strengthening our balance sheet, as evidenced by our investment grade credit rating of Baa3 from Moody’s Investors Service (“Moody’s”), which Moody’s reaffirmed on July 31, 2020. As of June 30, 2020, our leverage ratio was 45.4% of the approximate market value of our assets, compared to 45.8% as of December 31, 2019.
Liquidity/REIT Requirements
Liquidity is a measure of our ability to meet potential cash requirements, including our ongoing commitments to repay debt, fund our operations, acquire properties, make distributions to our stockholders, and other general business needs. As a REIT, we are required to distribute to our stockholders at least 90% of our REIT taxable income determined without regard to the dividends paid deduction and excluding net capital gain, on an annual basis. As a result, it is unlikely that we will be able to retain substantial cash balances to meet our long-term liquidity needs, including repayment of debt and the acquisition of additional properties, from our annual taxable income. Instead, we expect to meet our long-term liquidity needs primarily by relying upon external sources of capital.
43
Short-term Liquidity Requirements
Our short-term liquidity requirements consist primarily of funds necessary to pay for our operating expenses, including our general and administrative expenses as well as interest payments on our outstanding debt and to pay distributions. Since our portfolio has a strong occupancy level and substantially all of our leases are net leases, we do not currently anticipate making significant capital expenditures or incurring other significant property costs. We expect to meet our short-term liquidity requirements primarily from cash and cash equivalents balances, net cash provided by operating activities, and borrowing under our Revolving Credit Facility. Additionally, on May 5, 2020 we exercised our first of two options, effective August 2, 2020, to extend the maturity date of our $240 million 2020 Unsecured Term Loan for a period of six months in exchange for a fee of $0.1 million. Refer to Recent Developments – COVID-19 Pandemic for additional discussion regarding the pandemic’s impact on our liquidity.
Long-term Liquidity Requirements
Our long-term liquidity requirements consist primarily of funds necessary to repay debt and invest in additional revenue generating properties. Debt capital is provided through unsecured term notes, revolving debt facilities, and senior unsecured notes.
The source and mix of our debt capital in the future will be impacted by market conditions as well as our continued focus on lengthening our debt maturity profile to better align with our portfolio’s lease terms, staggering debt maturities to reduce the risk that a significant amount of debt will mature in any single year in the future, and managing our exposure to interest rate risk.
We expect to meet our long-term liquidity requirements primarily from borrowings under our Revolving Credit Facility, future debt and equity financings, and proceeds from limited sales of our properties. Our ability to access these capital sources may be impacted by unfavorable market conditions, particularly in the debt and equity capital markets, that are outside of our control. In addition, our success will depend on our operating performance, our borrowing restrictions, our degree of leverage, and other factors. Our acquisition growth strategy significantly depends on our ability to obtain acquisition financing on favorable terms. We seek to reduce the risk that long-term debt capital may be unavailable to us by strengthening our balance sheet by investing in real estate with creditworthy tenants and lease guarantors, and by maintaining an appropriate mix of debt and equity capitalization. We also, from time to time, obtain or assume non-recourse mortgage financing from banks and insurance companies secured by mortgages on the corresponding specific property. Mortgages, however, are not currently a strategic focus of the active management of our leverage profile. Rather, we enter into mortgages and notes payable as ancillary business transactions on an as-needed basis, most often as the result of lease assumption transactions. Our fiscal strength has enabled us to build a portfolio that is approximately 95% unencumbered on a gross assets basis, with 627 unencumbered properties and approximately $109.3 million of mortgage debt on the remaining properties.
Equity capital for our real estate acquisition activity has historically been provided from the proceeds of our private offering, including distributions reinvested through our DRIP. We suspended our private offering on January 10, 2020, in connection with our confidential submission of a draft registration statement on Form S-11 with the SEC relating to a proposed IPO. Accordingly, we did not raise any equity through our private offering during the first six months of 2020. During the six months ended June 30, 2020, we raised approximately $5.9 million in equity capital through our DRIP. See Part II, Item 2. “Unregistered Sales of Equity Securities and Use of Proceeds” of this Quarterly Report on Form 10-Q for further information. We announced on January 10, 2020 that we were terminating our DRIP, effective February 10, 2020.
Credit Rating
We achieved our current investment grade credit rating of Baa3 based on our conservative leverage profile, diversified real estate investment portfolio, access to capital, and earnings stability provided by the creditworthiness of our tenants. Factors that could negatively impact our credit rating include, but are not limited to: a significant increase in our leverage on a sustained basis, a significant increase in the proportion of secured debt levels, a significant decline in our unencumbered asset base, weakening of our corporate governance structure, and a significant decline in our real estate portfolio diversification or the creditworthiness of our tenants. Factors that could positively impact our credit rating include, but are not limited to, continued growth in the portfolio, improvement in our leverage profile, lengthening of our debt maturity profile, and our Internalization. We have aligned our strategic growth priorities with these factors, as we believe the favorable debt pricing and access to multiple sources of debt capital resulting from our investment grade credit rating, provides us with an advantageous cost of capital and risk-adjusted return on investment for our stockholders.
44
The following table sets forth our outstanding Revolving Credit Facility, unsecured term loans and Senior Notes as of June 30, 2020.
|
(in thousands, except interest rates) |
|
Outstanding Balance |
|
|
Interest Rate |
|
|
Maturity Date |
||
|
2020 Unsecured Term Loan |
|
$ |
240,000 |
|
|
one-month LIBOR + 1.25% |
|
|
Feb. 2021 |
|
|
Unsecured Revolving Credit and Term Loan Agreement |
|
|
|
|
|
|
|
|
|
|
|
Revolving Credit Facility |
|
|
248,300 |
|
|
one-month LIBOR + 1.20% |
|
|
Jan. 2022 |
|
|
2023 Unsecured Term Loan |
|
|
265,000 |
|
|
one-month LIBOR + 1.35% |
|
|
Jan. 2023 |
|
|
2024 Unsecured Term Loan |
|
|
190,000 |
|
|
one-month LIBOR + 1.25% |
|
|
Jun. 2024 |
|
|
|
|
|
703,300 |
|
|
|
|
|
|
|
|
2022 Unsecured Term Loan |
|
|
60,000 |
|
|
one-month LIBOR + 1.25% |
|
|
Feb. 2022 |
|
|
2026 Unsecured Term Loan |
|
|
450,000 |
|
|
one-month LIBOR + 1.85% |
|
|
Feb. 2026 |
|
|
Senior Notes |
|
|
|
|
|
|
|
|
|
|
|
Series A |
|
|
150,000 |
|
|
4.84% |
|
|
Apr. 2027 |
|
|
Series B |
|
|
225,000 |
|
|
5.09% |
|
|
Jul. 2028 |
|
|
Series C |
|
|
100,000 |
|
|
5.19% |
|
|
Jul. 2030 |
|
|
|
|
|
475,000 |
|
|
|
|
|
|
|
|
Total |
|
|
1,928,300 |
|
|
|
|
|
|
|
|
Debt issuance costs, net |
|
|
(6,908 |
) |
|
|
|
|
|
|
|
|
|
$ |
1,921,392 |
|
|
|
|
|
|
|
2020 Unsecured Term Loan
The 2020 Unsecured Term loan had an initial maturity date of August 2020. Borrowings under the 2020 Unsecured Term Loan bear interest at variable rates based on LIBOR plus a margin based on our credit rating ranging between 0.85% and 1.65% per annum. Based on our current credit rating, the applicable margin is 1.25% as of June 30, 2020. The 2020 Unsecured Term Loan allows for two six-month extensions, at our option, subject to our being in compliance with the debt covenants and customary representations and warranties, and payment of a fee equal to 0.05% of the outstanding principal balance at the time of extension. We exercised the first of these options, effective as of August 2, 2020, extending the loan’s maturity to February 2021.
Revolving Credit Facility
The Revolving Credit Facility has a maximum availability of $600 million, and includes a $35 million sublimit for swingline loans and $20 million available for issuance of letters of credit. The Revolving Credit Facility has an initial maturity date of January 2022 and provides for one five-month extension, at our election, subject to certain conditions set forth in the agreement and payment of a 0.0625% fee on the revolving commitments. The Revolving Credit Facility contains an applicable facility fee ranging between 0.125% and 0.30% per annum, based on our credit rating. Based on our current credit rating of Baa3, the facility fee is 0.25% per annum as of June 30, 2020.
Borrowings on the Revolving Credit Facility bear interest at variable rates based on LIBOR plus a margin based on our credit rating ranging between 0.825% and 1.55% per annum. Based on our current credit rating, the applicable margin is 1.20% as of June 30, 2020.
2023 Unsecured Term Loan
The 2023 Unsecured Term loan has an initial maturity date of January 2023. Borrowings under the 2023 Unsecured Term Loan bear interest at variable rates based on LIBOR plus a margin based on our credit rating ranging between 0.90% and 1.75% per annum. Based on our current credit rating, the applicable margin is 1.35% as of June 30, 2020.
2024 Unsecured Term Loan
The 2024 Unsecured Term Loan has an initial maturity date of June 2024. Borrowings under the 2024 Unsecured Term Loan are subject to interest at variable rates based on LIBOR plus a margin based on our credit rating ranging between 0.85% and 1.65% per annum. Based on our current credit rating, the applicable margin is 1.25% as of June 30, 2020.
45
On February 7, 2020, we entered into a $60 million term loan agreement maturing in February 2022 with JP Morgan Chase Bank, N.A., as administrative agent. The 2022 Unsecured Term Loan was used to partially repay BRE debt that we assumed as part of the Internalization. Borrowings under the 2022 Unsecured Term Loan are subject to interest only payments at variable rates equal to LIBOR plus a margin based on our credit rating, ranging between 0.85% and 1.65% per annum. Based on our current credit rating, the applicable margin is 1.25% as of June 30, 2020.
2026 Unsecured Term Loan
The 2026 Unsecured Term Loan includes an accordion feature that provides for an increase in the facility size up to a total of $550 million of available capacity. Borrowings under the 2026 Unsecured Term Loan are payable interest only on a monthly basis during the term of the loan, with the principal amount due in February 2026. Borrowings under the 2026 Unsecured Term loan bear interest equal to LIBOR plus a margin based on our credit rating ranging between 1.45% and 2.40% per annum. Based on our current credit rating, the applicable margin is 1.85% as of June 30, 2020.
Senior Notes
To mitigate interest rate risk, we have strategically added unsecured, fixed-rate, interest-only senior promissory notes (“Senior Notes”) to our capital structure. The Senior Notes were issued in three series (Series A, B, and C) as described below.
Series A Notes
The Series A Notes are payable interest only semiannually during their term, bear interest at a fixed rate of 4.84% per annum, and mature on April 18, 2027.
Series B and Series C Notes
The Series B and Series C Notes are payable interest only semiannually during their term, and bear interest at fixed rates of 5.09% per annum and 5.19% per annum, respectively. The Series B Notes mature on July 2, 2028, and the Series C Notes mature on July 2, 2030.
46
We are subject to various covenants and financial reporting requirements pursuant to our debt facilities. The table below summarizes the applicable financial covenants, which are substantially the same across each of our debt facilities. As of June 30, 2020, we believe that we were in compliance with all of our covenants. In the event of default, either through default on payments or breach of covenants, we may be restricted from paying dividends to our stockholders in excess of dividends required to maintain our REIT qualification. For each of the previous three years, we paid dividends out of our cash flows from operations in excess of the distribution amounts required to maintain our REIT qualification. Refer to Recent Developments – COVID-19 Pandemic for additional discussion of the pandemic’s impact on our ability to satisfy our financial covenants.
|
Covenants |
|
Required |
|
Actual (as of June 30, 2020) |
|
|
|
Leverage Ratio(a) |
|
≤ 0.60 to 1.00 |
|
|
0.52 |
|
|
Secured Indebtedness Ratio(b) |
|
≤ 0.40 to 1.00 |
|
|
0.03 |
|
|
Unencumbered Coverage Ratio(c) |
|
≥ 1.75 to 1.00 |
|
|
4.44 |
|
|
Fixed Charge Coverage Ratio(d) |
|
≥ 1.50 to 1.00 |
|
|
3.23 |
|
|
Total Unsecured Indebtedness to Total Unencumbered Eligible Property Value(e) |
|
≤ 0.60 to 1.00 |
|
|
0.56 |
|
|
Dividends and Other Restricted Payments |
|
Only applicable in case of default |
|
Not Applicable |
|
|
|
(a) |
The leverage ratio is calculated as the ratio of total indebtedness to total market value. For debt covenant purposes, total market value is computed on a consolidated basis as the net operating income for the most recently completed fiscal quarter on properties owned for four consecutive quarters at a capitalization rate of 7.50%, multiplied by four, plus the acquisition price of properties acquired in the last four quarters, and the GAAP book value of mortgages receivable, development property, unimproved real estate, unrestricted cash and cash equivalents, and all other tangible assets (the latter subject to a cap of 5% of total market value). For purposes of determining total market value, net operating income from properties disposed of during the immediately preceding period of four consecutive fiscal quarters is excluded. |
|
(b) |
The secured indebtedness ratio is the ratio of secured indebtedness to total market value. Secured indebtedness represents outstanding mortgage borrowings. |
|
(c) |
The unencumbered coverage ratio is the ratio of net operating income for all eligible properties to unsecured interest expense for the most recent fiscal quarter. |
|
(d) |
The fixed charge coverage ratio is the ratio of adjusted EBITDA to fixed charges for the most recent fiscal quarter. Adjusted EBITDA is computed as net income adjusted for depreciation and amortization, interest expense, income tax expense and franchise tax expense, gains and losses from the sale of properties, equity in net income of unconsolidated subsidiaries, non-cash expenses related to mark to market exposure under derivatives contracts, straight-line rent adjustments, amortization of intangibles, gains and losses on early extinguishment of debt, non-cash severance and restructuring charges, transaction costs expensed, and reserves for replacements with respect to certain properties. Fixed charges are computed as interest expense, plus scheduled principal repayments of debt, excluding balloon payments if applicable, plus preferred dividends paid or accrued, if applicable. |
|
(e) |
The ratio is calculated as the ratio of total unsecured indebtedness to unencumbered property value. |
Cash and cash equivalents and restricted cash totaled $9.8 million and $12.7 million at June 30, 2020 and 2019, respectively. The table below shows information concerning cash flows for the six months ended June 30, 2020 and 2019:
|
|
|
For the six months ended |
|
|||||
|
|
June 30, |
|
||||||
|
(In thousands) |
|
2020 |
|
|
2019 |
|
||
|
Net cash provided by operating activities |
|
$ |
79,458 |
|
|
$ |
64,719 |
|
|
Net cash provided by (used in) investing activities |
|
|
10,738 |
|
|
|
(120,894 |
) |
|
Net cash (used in) provided by financing activities |
|
|
(100,665 |
) |
|
|
49,904 |
|
|
Decrease in cash and cash equivalents and restricted cash |
|
$ |
(10,469 |
) |
|
$ |
(6,271 |
) |
The increase in net cash provided by operating activities during the six months ended June 30, 2020 as compared to the six months ended June 30, 2019, was mainly due to growth in our real estate portfolio and cost savings associated with the Internalization.
The change in net cash provided (used in) by investing activities during the six months ended June 30, 2020 as compared to the six months ended June 30, 2019, was mainly due to decreased acquisition volume and increased proceeds from the disposal of properties in 2020, offset by cash paid in connection with the Internalization.
The change in net cash (used in) provided by financing activities during the six months ended June 30, 2020 as compared to the six months ended June 30, 2019, mainly reflects a decrease in proceeds from the issuance of our common stock and increased distributions resulting from an increase in the number of shares of common stock outstanding.
The leases in our portfolio are long-term in nature, with a current ABR weighted average remaining lease term of 11.0 years as of June 30, 2020. Our rental revenues may be impacted by inflation. Substantially all of our leases have contractual lease escalations, with an
47
ABR weighted average of 2.1% as of June 30, 2020. Many of our leases contain rent escalators that increase rent at a fixed amount and may not be sufficient during periods of high inflation. Leases that contributed approximately 15.7% of our ABR as of June 30, 2020, contained rent escalators based on increases in CPI and the associated increases in rental revenue may be limited during periods of low inflation. The impact of inflation on our property and operating expenses is limited since substantially all of our leases are net leases, and property-level expenses are generally paid by our tenants. To the extent we bear the cost of such expense, we attempt to limit our exposure to inflation through the use of warranties and other remedies that reduce the likelihood of a significant capital outlay. Inflation and increased costs may also have an adverse impact to our tenants and their creditworthiness if the increase in property-level expenses is greater than their increase in revenues.
Off-Balance Sheet Arrangements
We had no off-balance sheet arrangements as of June 30, 2020, or December 31, 2019.
The following table provides information with respect to our contractual commitments and obligations as of June 30, 2020 (in thousands).
|
Year of Maturity |
|
Term Loans(a) |
|
|
Revolving Credit Facility(b) |
|
|
Senior Notes |
|
|
Mortgages and Notes Payable |
|
|
Interest Expense(c) |
|
|
Tenant Improvement Allowances(d) |
|
|
Operating Leases |
|
|
Total |
|
||||||||
|
Remainder of 2020 |
|
$ |
— |
|
|
$ |
— |
|
|
$ |
— |
|
|
$ |
1,614 |
|
|
$ |
35,353 |
|
|
$ |
2,208 |
|
|
$ |
355 |
|
|
$ |
39,530 |
|
|
2021 |
|
|
240,000 |
|
|
|
— |
|
|
|
— |
|
|
|
18,006 |
|
|
|
66,288 |
|
|
|
— |
|
|
|
711 |
|
|
|
325,005 |
|
|
2022 |
|
|
60,000 |
|
|
|
248,300 |
|
|
|
— |
|
|
|
2,907 |
|
|
|
59,532 |
|
|
|
— |
|
|
|
686 |
|
|
|
371,425 |
|
|
2023 |
|
|
265,000 |
|
|
|
— |
|
|
|
— |
|
|
|
8,173 |
|
|
|
54,508 |
|
|
|
— |
|
|
|
505 |
|
|
|
328,186 |
|
|
2024 |
|
|
190,000 |
|
|
|
— |
|
|
|
— |
|
|
|
2,260 |
|
|
|
50,464 |
|
|
|
— |
|
|
|
120 |
|
|
|
242,844 |
|
|
Thereafter |
|
|
450,000 |
|
|
|
— |
|
|
|
475,000 |
|
|
|
76,912 |
|
|
|
129,118 |
|
|
|
— |
|
|
|
2,411 |
|
|
|
1,133,441 |
|
|
Total |
|
$ |
1,205,000 |
|
|
$ |
248,300 |
|
|
$ |
475,000 |
|
|
$ |
109,872 |
|
|
$ |
395,263 |
|
|
$ |
2,208 |
|
|
$ |
4,788 |
|
|
$ |
2,440,431 |
|
|
(a) |
The 2020 Unsecured Term Loan had an original maturity date of August 2020, and allows two six-month extensions, at our option, subject to our being in compliance with the debt covenants and customary representations and warranties, and payment of a fee equal to 0.05% of the outstanding principal balance at the time of extension. On May 5, 2020, we exercised the first of these options, effective on August 2, 2020, extending the maturity date of the 2020 Unsecured Term Loan to February 2, 2021. Accordingly, we have included principal repayment of this loan in 2021. |
|
(b) |
We may extend the Revolving Credit Facility once, for a five-month period, subject to certain conditions, including the payment of an extension fee equal to 0.0625% of the revolving commitments. |
|
(c) |
Interest expense is projected based on the outstanding borrowings and interest rates in effect as of June 30, 2020. This amount includes the impact of interest rate swap agreements. |
|
(d) |
We expect to pay tenant improvement allowances out of cash flows from operations or from additional borrowings. |
At June 30, 2020 and December 31, 2019, investment in rental property of $175.7 million and $178.7 million, respectively, was pledged as collateral against our mortgages and notes payable.
Additionally, we are a party to three separate tax protection agreements with the contributing members of three distinct UPREIT transactions and we entered into the Founding Owners’ Tax Protection Agreement with our founding owners in connection with the Internalization. The tax protection agreements require us to indemnify the beneficiaries in the event of a sale, exchange, transfer, or other disposal of the contributed property, or in the case of the Founding Owners’ Tax Protection Agreement, the entire Company, in a taxable transaction that would cause such beneficiaries to recognize a gain that is protected under the agreements, subject to certain exceptions. Based on values as of June 30, 2020, taxable sales of the applicable properties would trigger liability under the four agreements of approximately $22.3 million. Based on information available, we do not believe that the events resulting in damages as detailed above have occurred or are likely to occur in the foreseeable future. Accordingly, we have excluded these commitments from the contractual commitments table above.
This Management’s Discussion and Analysis of Financial Condition and Results of Operations is based upon our Condensed Consolidated Financial Statements, which have been prepared in accordance with GAAP. The preparation of these Condensed Consolidated Financial Statements requires management to make estimates and assumptions that affect the reported amounts of assets, liabilities, revenues, and expenses as well as other disclosures in the financial statements. On an ongoing basis, management evaluates its estimates and assumptions; however, actual results may differ from these estimates and assumptions, which in turn could have a material impact on our financial statements. A summary of our significant accounting policies and procedures are included in Note 2, “Summary of Significant Accounting Policies,” in the Notes to the Condensed Consolidated Financial Statements included in this Quarterly Report on Form 10-Q. We believe there have been no significant changes during the six months ended June 30, 2020, to the items that we disclosed as our critical accounting policies in our 2019 Annual Report on Form 10-K.
48
Impact of Recent Accounting Pronouncements
For information on the impact of recent accounting pronouncements on our business, see Note 2 of the Notes to the Condensed Consolidated Financial Statements included in this Quarterly Report on Form 10-Q.
Historically, we have sold shares of common stock in a private offering at a price equal to the Determined Share Value (“DSV”), which was established at least quarterly by the board of directors based on the net asset value (“NAV”, or “Private Enterprise NAV”) of our portfolio, input from management and third-party consultants, and such other factors as the board of directors may determine. The DSV was historically used for purchases, distribution reinvestment, and redemptions. On January 10, 2020, we suspended our private offering of our common stock effective immediately and until further notice, and terminated our dividend reinvestment plan (“DRIP”) and share redemption program, each effective as of February 10, 2020.
At its August 4, 2020, meeting, our board of directors voted to retain the determined share value (“DSV”) at $82.00 per share until October 31, 2020. The DSV is established in good faith by the board of directors based upon the net asset value (“NAV”) of our portfolio, input from management and third-party consultants, and such other factors as the board of directors may determine. The Company’s NAV calculation as of June 30, 2020, was calculated using its established valuation process, starting with an estimate of the fair value of the properties in the portfolio as of that date based upon, among other factors, the implied market price for each asset based upon a review of market capitalization rates.
Beginning with the NAV as of June 30, 2020, we revised our calculation to include only the portion of the earnout liability fair value expected to be paid in cash. We also adjusted the number of outstanding shares, including noncontrolling interests, used to compute NAV per diluted share, to include the portion of the earnout liability fair value expected to be paid in common stock and OP units. These adjustments reflect our expectation of how the earnout liability will be settled if earned.
Additional information regarding our valuation policy and procedures, including significant assumptions used to value our real estate portfolio, and the determination of the DSV by the board of directors, is available in Item 5. “Market for Registrant’s Common Equity, Related Stockholder Matters and Issuer Purchases of Equity Securities,” in our 2019 Annual Report on Form 10-K filed with the SEC on February 27, 2020, under the heading Determined Share Value.
|
Period |
|
NAV as of |
|
Private Enterprise NAV per diluted share |
|
|
Real Estate NAV per diluted share |
|
|
Determined Share Value |
|
|||
|
August 1, 2020 - October 31, 2020 |
|
June 30, 2020 |
|
$ |
82.28 |
|
|
$ |
71.06 |
|
|
$ |
82.00 |
|
|
May 1, 2020 - July 31, 2020 |
|
March 31, 2020 |
|
|
82.46 |
|
|
|
71.30 |
|
|
|
82.00 |
|
|
February 1, 2020 - April 30, 2020 |
|
December 31, 2019 |
|
|
85.21 |
|
|
|
85.21 |
|
|
|
85.00 |
|
The adjustments made to NAV per diluted share in arriving at the Determined Share Value for the periods presented above account for the inherent imprecision in the valuation estimates.
49
The following table provides a breakdown of the major components of our estimated NAV and NAV per diluted share amounts (in thousands, except per share amounts), and a reconciliation of the amounts previously reported as March 31, 2020 NAV, to the current methodology, which is provided for comparative purposes only:
|
|
|
|
|
|
|
March 31, 2020 |
|
|||||||||
|
(in thousands, except per share amounts) NAV as of: |
|
June 30, 2020 |
|
|
As Reported |
|
|
Adjustment for Earnout Shares and OP Units |
|
|
Current Methodology |
|
||||
|
Investment in rental property |
|
$ |
4,338,230 |
|
|
$ |
4,344,570 |
|
|
$ |
— |
|
|
$ |
4,344,570 |
|
|
Debt |
|
|
(2,172,559 |
) |
|
|
(2,233,159 |
) |
|
|
— |
|
|
|
(2,233,159 |
) |
|
Other assets and liabilities, net |
|
|
(13,430 |
) |
|
|
15,344 |
|
|
|
37,001 |
|
|
|
52,345 |
|
|
Real Estate NAV |
|
|
2,152,241 |
|
|
|
2,126,755 |
|
|
|
|
|
|
|
2,163,756 |
|
|
Goodwill |
|
|
339,769 |
|
|
|
339,769 |
|
|
|
— |
|
|
|
339,769 |
|
|
Private Enterprise NAV |
|
$ |
2,492,010 |
|
|
$ |
2,466,524 |
|
|
$ |
37,001 |
|
|
$ |
2,503,525 |
|
|
|
|
|
|
|
|
|
|
|
|
|
|
|
|
|
|
|
|
Number of outstanding shares, including non-controlling interests |
|
|
29,915 |
|
|
|
29,912 |
|
|
|
— |
|
|
|
29,912 |
|
|
Earnout shares and OP Units(a) |
|
|
373 |
|
|
|
— |
|
|
|
435 |
|
|
|
435 |
|
|
NAV shares |
|
|
30,288 |
|
|
|
29,912 |
|
|
|
435 |
|
|
|
30,347 |
|
|
|
|
|
|
|
|
|
|
|
|
|
|
|
|
|
|
|
|
Real Estate NAV per share |
|
$ |
71.06 |
|
|
N/A |
|
|
|
|
|
|
$ |
71.30 |
|
|
|
Private Enterprise NAV per share |
|
|
82.28 |
|
|
|
82.46 |
|
|
$ |
0.04 |
|
|
|
82.50 |
|
|
(a) |
Earnout shares and OP Units were calculated as the portion of the fair value of the earnout liability payable in shares or OP Units as of the appropriate date, divided by $85 per share. |
The following table details the implied market capitalization rates (shown on a weighted average basis) used to value the investment in rental property, by property type, as of June 30, 2020, and March 31, 2020, supporting the Determined Share Value in effect for the periods of August 1, 2020 through October 31, 2020, and May 1, 2020, through July 31, 2020, respectively:
|
Market capitalization rates, as of: |
|
Industrial |
|
|
Healthcare |
|
|
Restaurant |
|
|
Office |
|
|
Retail |
|
|
Other |
|
|
Portfolio Total |
|
|||||||
|
June 30, 2020 |
|
|
6.78 |
% |
|
|
6.75 |
% |
|
|
6.11 |
% |
|
|
7.17 |
% |
|
|
7.14 |
% |
|
|
6.32 |
% |
|
|
6.72 |
% |
|
March 31, 2020 |
|
|
6.75 |
% |
|
|
6.73 |
% |
|
|
6.09 |
% |
|
|
7.09 |
% |
|
|
8.02 |
% |
|
|
6.32 |
% |
|
|
6.76 |
% |
While we believe our assumptions are reasonable, a change in these assumptions would impact the calculation of the value of our real estate investments. For example, assuming all other factors remain unchanged, an increase in the weighted average implied market capitalization rate used as of June 30, 2020, of 0.25% would result in a decrease in the fair value of our investment in rental property of 3.6%, and our Real Estate NAV per diluted share and Private Enterprise NAV per diluted share would have been $65.92 and $77.14, respectively. Conversely, a decrease in the weighted average implied capitalization rate used as of June 30, 2020 of 0.25% would result in an increase in the fair value of our investment in rental property of 3.9%, and our Real Estate NAV per diluted share and Private Enterprise NAV per diluted share would have been $76.59 and $87.81, respectively.
The 0.04% decrease in the portfolio total implied market capitalization rate between March 31, 2020 and June 30, 2020, is primarily the result of our re-leasing certain properties previously subject to bankruptcy proceedings in the retail – home furnishings property type to a creditworthy tenant as of June 30, 2020. Additionally, the ongoing COVID-19 pandemic, together with the restrictions on travel and other measures enacted in response to the pandemic, has had and will continue to have a significant adverse impact on our tenants’ operations and the value of our properties for an unknown period of time. Due to the reliance on historical information when valuing a property and the number of unknown variables with respect to the COVID-19 pandemic at this time, the impact of the pandemic on a particular property will likely not be reflected in a property-level valuation for several calendar quarters. Additionally, when conducting property-level valuations, management and our third-party consultants and appraisers utilize available sales data, such as purchase price, from transactions involving comparable assets. Due to the current economic downturn and significant reduction in real estate transactions in the wake of the pandemic, it is difficult for the Company to obtain or utilize meaningful comparable sales data as part of its valuation process. Management expects this will continue to be the case for several calendar quarters. Accordingly, the current Determined Share Value does not accurately reflect the impact of the COVID-19 pandemic on the value of our shares as of the date of this filing. In estimating the fair value of its real estate assets as of June 30, 2020, the Company considered that the COVID-19 pandemic most significantly impacted tenants leasing properties for casual dining restaurants, retail furniture outlets, and corporate offices, and on a case by case basis, reduced its fair value estimate for certain of these properties as part of the determination of NAV. The board of directors will continue to utilize all available valuation information when setting the DSV in future periods as the impacts of the COVID-19 pandemic on real estate asset values continues to unfold.
50
Distributions and Distribution Reinvestment
In light of the economic uncertainty and rapidly evolving circumstances related to the COVID-19 pandemic and then-current tenant rent relief requests, to preserve cash, strengthen our liquidity position, and manage our overall leverage profile, in May 2020 our board of directors determined that we would temporarily suspend our monthly distribution. At its August 4, 2020 meeting, the board of directors undertook a full review of our rent collection results for the second quarter of 2020, preliminary collection results for July 2020, our outlook for collections in future months, and our overall liquidity position. Based on our strong collection results and operating performance, the board voted to reinstate a distribution, announcing that the Company would transition to quarterly distribution payments beginning with the quarter ended September 30, 2020. With the continued uncertainty surrounding the COVID-19 pandemic’s long term impact to our tenants, and the recent resurgence in certain geographical hot spots, the board set a $0.54 distribution per common share and OP Unit to stockholders and OP Unit holders of record as of September 30, 2020, payable on or before October 15, 2020. The Company believes this quarter’s distribution is also an incrementally important step towards ensuring the Company satisfies its REIT distribution requirements for the year ended December 31, 2020.
We terminated our DRIP and share redemption program, effective February 10, 2020. Prior to its termination, pursuant to the terms of our DRIP, stockholders and OP Unit holders (other than us) could elect to have cash distributions reinvested in additional shares of our common stock. Shares of our common stock acquired through our DRIP have the same rights and are subject to the same restrictions on transferability as all other shares of our common stock.
The following table summarizes distributions paid in cash and pursuant to our DRIP for the six months ended June 30, 2020 (in thousands).
|
Month |
|
Year |
|
Cash Distribution − Common Stockholders |
|
|
Cash Distribution − Membership Units |
|
|
Distribution Paid Pursuant to DRIP on Common Stock (a) |
|
|
Distribution Paid Pursuant to DRIP on Membership Units (a) |
|
|
Total Amount of Distribution |
|
|||||
|
January |
|
2020 |
|
$ |
5,663 |
|
|
$ |
632 |
|
|
$ |
5,734 |
|
|
$ |
133 |
|
|
$ |
12,162 |
|
|
February |
|
2020 |
|
|
11,472 |
|
|
|
764 |
|
|
|
— |
|
|
|
— |
|
|
|
12,236 |
|
|
March |
|
2020 |
|
|
11,815 |
|
|
|
1,345 |
|
|
|
— |
|
|
|
— |
|
|
|
13,160 |
|
|
April |
|
2020 |
|
|
11,815 |
|
|
|
1,345 |
|
|
|
— |
|
|
|
— |
|
|
|
13,160 |
|
|
May |
|
2020 |
|
|
11,816 |
|
|
|
1,345 |
|
|
|
— |
|
|
|
— |
|
|
|
13,161 |
|
|
June |
|
2020 |
|
|
– |
|
|
|
– |
|
|
|
— |
|
|
|
— |
|
|
|
— |
|
|
Total |
|
|
|
$ |
52,581 |
|
|
$ |
5,431 |
|
|
$ |
5,734 |
|
|
$ |
133 |
|
|
$ |
63,879 |
|
|
(a) |
Distributions are paid in shares of common stock. |
The following table summarizes our distributions paid, including the source of distributions and a comparison against FFO (in thousands). Refer to Net Income and Non-GAAP Measures (FFO and AFFO) below for further discussion of our FFO.
|
|
|
For the six months ended |
|
|||||
|
|
|
June 30, |
|
|||||
|
|
|
2020 |
|
|
2019 |
|
||
|
Distributions: |
|
|
|
|
|
|
|
|
|
Paid in cash |
|
$ |
58,145 |
|
|
$ |
33,525 |
|
|
Reinvested in shares |
|
|
5,734 |
|
|
|
30,008 |
|
|
Total Distributions |
|
$ |
63,879 |
|
|
$ |
63,533 |
|
|
Source of Distributions: |
|
|
|
|
|
|
|
|
|
Cash flow from operating activities |
|
$ |
63,879 |
|
|
$ |
63,533 |
|
|
FFO |
|
$ |
94,057 |
|
|
$ |
78,791 |
|
We intend to fund future distributions from cash generated by operations; however, we may fund distributions from the sale of assets, borrowings, or proceeds from the sale of our securities.
51
Item 3.Quantitative and Qualitative Disclosures About Market Risk
We are exposed to certain market risks, one of the most predominant of which is a change in interest rates. Increases in interest rates can result in increased interest expense under our Revolving Credit Facility and other variable-rate debt. Increases in interest rates can also result in increased interest expense when our fixed rate debt matures and needs to be refinanced. We attempt to manage interest rate risk by entering into long-term fixed rate debt or by entering into interest rate swaps to convert certain variable-rate debt to a fixed rate. The interest rate swaps have been designated by us as cash flow hedges for accounting purposes and are reported at fair value. We have not entered, and do not intend to enter, into derivative or interest rate transactions for speculative purposes. Further information concerning our interest rate swaps can be found in Note 11 in our Condensed Consolidated Financial Statements contained elsewhere in this Quarterly Report on Form 10-Q.
Our fixed-rate debt includes our Senior Notes, mortgages, and variable-rate debt converted to a fixed rate with the use of interest rate swaps. Our fixed-rate debt and outstanding interest rate swaps had carrying values and fair values of approximately $1.6 billion as of June 30, 2020. Changes in market interest rates impact the fair value of our fixed-rate debt and interest rate swaps, but they have no impact on interest incurred or on cash flows. For instance, if interest rates were to increase 1%, and the fixed-rate debt balance were to remain constant, we would expect the fair value of our debt to decrease, similar to how the price of a bond decreases as interest rates rise. A 1% increase in market interest rates would have resulted in a decrease in the fair value of our fixed-rate debt and interest rate swaps of approximately $85.9 million as of June 30, 2020.
Borrowings pursuant to our Revolving Credit Facility and other variable-rate debt bear interest at rates based on LIBOR plus an applicable margin, and totaled $1.5 billion as of June 30, 2020, of which $859.8 million was swapped to a fixed rate by our use of interest rate swaps. Taking into account the effect of our interest rate swaps, interest expense would have increased by approximately $3.1 million in the six months ended June 30, 2020, if the applicable LIBOR rate had been 1% higher.
With the exception of our interest rate swap transactions, we have not engaged in transactions in derivative financial instruments or derivative commodity instruments.
As of June 30, 2020, our financial instruments were not exposed to significant market risk due to foreign currency exchange risk.
Item 4.Controls and Procedures
Evaluation of Disclosure Controls and Procedures
We maintain disclosure controls and procedures (as defined in Rules 13a-15(e) and 15d-15(e) of the Exchange Act, that are designed to ensure that information required to be disclosed in our Exchange Act reports is recorded, processed, summarized, and reported within the time periods specified in the SEC’s rules and forms, and that such information is accumulated and communicated to our management, including our Chief Executive Officer and Chief Financial Officer, as appropriate, to allow timely decisions regarding required disclosure. As of and for the quarter ended June 30, 2020, we carried out an evaluation of the effectiveness of the design and operation of our disclosure controls and procedures, under the supervision and with the participation of management, including our Chief Executive Officer and Chief Financial Officer. Based on the foregoing, our Chief Executive Officer and Chief Financial Officer concluded that our disclosure controls and procedures were effective and were operating at a reasonable assurance level.
Changes in Internal Control over Financial Reporting
There have been no changes in our internal control over financial reporting during the quarter ended June 30, 2020 that have materially affected, or are reasonably likely to materially affect, our internal control over financial reporting.
52
We are subject to various legal proceedings and claims that arise in the ordinary course of our business. These matters are generally covered by insurance or are subject to our right to be indemnified by our tenants that we include in our leases. Management is not aware of any material pending legal proceedings to which we or any of our subsidiaries are a party or to which any of our property is subject, nor are we aware of any such legal proceedings contemplated by government agencies.
The risk factors relating to or impacted by the COVID-19 outbreak that were previously disclosed in our Quarterly Report on Form 10-Q for the three months ended March 31, 2020 contained certain financial-related information which has been updated for the three months ended June 30, 2020 in Part I, Item 2, Management’s Discussion and Analysis of Financial Condition and Results of Operations of this Quarterly Report on Form 10-Q.
Item 2.Unregistered Sales of Equity Securities and Use of Proceeds.
Sales of Common Stock and Issuance of OP Units
We commenced our private offering of shares of our common stock in 2007. The first closing of our private offering occurred on December 31, 2007, and we conducted additional closings at least once every calendar quarter through December 31, 2019. On January 10, 2020, we announced that we suspended until further notice our private offering of shares of our common stock.
As of June 30, 2020, there were 26.9 million shares of our common stock issued and outstanding, including 0.8 million mezzanine equity common shares, and 3.1 million OP Units issued and outstanding, including 1.3 million mezzanine equity non-controlling interests.
The following table provides information regarding the sale of shares of our common stock pursuant to our ongoing private offering during the six months ended June 30, 2020 (in thousands, except year and Determined Share Value amounts).
|
Month |
|
Year |
|
Common Shares Sold |
|
|
Weighted Average Determined Share Value — Common Shares |
|
|
Total Proceeds — Common Shares Sold |
|
|
Common Shares DRIP |
|
|
Weighted Average Determined Share Value — DRIP(a) |
|
|
Total Proceeds — Common Share DRIP(b) |
|
|
Total Proceeds |
|
|||||||
|
January |
|
2020 |
|
|
— |
|
|
$ |
— |
|
|
$ |
— |
|
|
|
70 |
|
|
$ |
83.30 |
|
|
$ |
5,865 |
|
|
$ |
5,865 |
|
|
(a) |
DRIP shares are purchased at a discounted price of 98% of the Determined Share Value. |
|
(b) |
For common shares reinvested under our DRIP there is no corresponding cash flow from the transaction. Refer to Note 13 to the Condensed Consolidated Financial Statements included in this Quarterly Report on Form 10-Q for further discussion. |
None of the shares of our common stock set forth in the table above were registered under the Securities Act in reliance upon the exemption from registration under the Securities Act provided by Rule 506(c) under Regulation D promulgated under the Securities Act. All of the shares of our common stock set forth in the table above were sold to persons each of whom represented to us in writing that such person qualified as an “Accredited Investor” as such term is defined by Regulation D promulgated under the Securities Act, and provided us with additional documentation to assist us in verifying such person’s status as an Accredited Investor.
In connection with property acquisitions that are structured as UPREIT transactions, the owner of a property will transfer its interest in the property to the OP in exchange for OP Units. There were no such OP Unit issuances during the six months ended June 30, 2020.
None of the OP Units have been registered under the Securities Act in reliance upon the exemptions from registration under the Securities Act provided by Rule 506(c) under Regulation D promulgated under the Securities Act and Section 4(a)(2) of the Securities Act. All of the OP Units were issued to persons who represented to us in writing that they qualified as an Accredited Investor, and provided us with additional documentation to assist us in verifying such person’s status as an Accredited Investor, including third-party verification as permitted under Regulation D.
Internalization Consideration
In connection with the closing of the Internalization, on February 7, 2020, we issued 780,893 shares of our common stock to certain owners of BRE as merger consideration for an aggregate value of $66.4 million.
In connection with the Internalization, on February 7, 2020, the OP issued 1,319,513 OP Units to certain owners of BRE as merger consideration for an aggregate value of $112.2 million.
53
In each case, the aforementioned securities were issued in reliance on the exemption set forth in Section 4(a)(2) of the Securities Act.
Repurchases of Equity Securities
We had adopted a share redemption program to provide an opportunity for our stockholders to have shares of our common stock repurchased, at the end of each quarter, subject to certain restrictions and limitations, at a price equal to or at a discount from the current Determined Share Value in effect as of the date the shares were tendered for redemption. Cash used to fund share redemptions had historically been provided through a combination of cash generated by operations, the sale of assets, and borrowings. On January 10, 2020, we announced that we terminated our share redemption program, effective as of February 10, 2020. Consequently, there were no redemptions of shares of our common stock during the six months ended June 30, 2020.
Item 3.Defaults Upon Senior Securities.
None.
Item 4.Mine Safety Disclosures.
Not applicable.
None.
54
|
No. |
|
Description |
|
|
|
|
|
3.1 |
|
|
|
|
|
|
|
3.2 |
|
|
|
|
|
|
|
4.1 |
|
|
|
|
|
|
|
31.1* |
|
|
|
|
|
|
|
|
||
|
|
|
|
|
32.1*† |
|
|
|
|
|
|
|
32.2*† |
|
|
|
|
|
|
|
101.1 |
|
The following materials from the Corporation’s Quarterly Report on Form 10-Q for the quarterly period ended June 30, 2020, formatted in XBRL (eXtensible Business Reporting Language): (i) Condensed Consolidated Balance Sheets, (ii) Condensed Consolidated Statements of Income and Comprehensive Income (Loss), (iii) Condensed Consolidated Statements of Stockholders’ Equity and Mezzanine Equity, (iv) Condensed Consolidated Statements of Cash Flows, and (v) Notes to Condensed Consolidated Financial Statements |
|
* |
Filed herewith. |
|
† |
In accordance with Item 601(b)(32) of Regulation S-K, this Exhibit is not deemed “filed” for purposes of Section 18 of the Exchange Act or otherwise subject to the liabilities of that section. Such certifications will not be deemed incorporated by reference into any filing under the Securities Act or the Exchange Act, except to the extent that the Registrant specifically incorporates it by reference. |
55
Pursuant to the requirements of the Securities Exchange Act of 1934, the registrant has duly caused this report to be signed on its behalf by the undersigned thereunto duly authorized.
|
|
|
BROADSTONE NET LEASE, INC. |
|
|
|
|
|
Date: August 4, 2020 |
|
/s/ Christopher J. Czarnecki |
|
|
|
Christopher J. Czarnecki |
|
|
|
Chief Executive Officer and President |
|
|
|
|
|
Date: August 4, 2020 |
|
/s/ Ryan M. Albano |
|
|
|
Ryan M. Albano |
|
|
|
Executive Vice President and Chief Financial Officer |
56