Attached files
| file | filename |
|---|---|
| EX-99.1 - EARNINGS RELEASE DATED JULY 30, 2020 - B. Riley Financial, Inc. | ea124743ex99-1_briley.htm |
| 8-K - CURRENT REPORT - B. Riley Financial, Inc. | ea124743-8k_brileyf.htm |
Exhibit 99.2

1 NASDAQ: RILY Second Quarter 2020 Supplemental Financial Data July 30, 2020
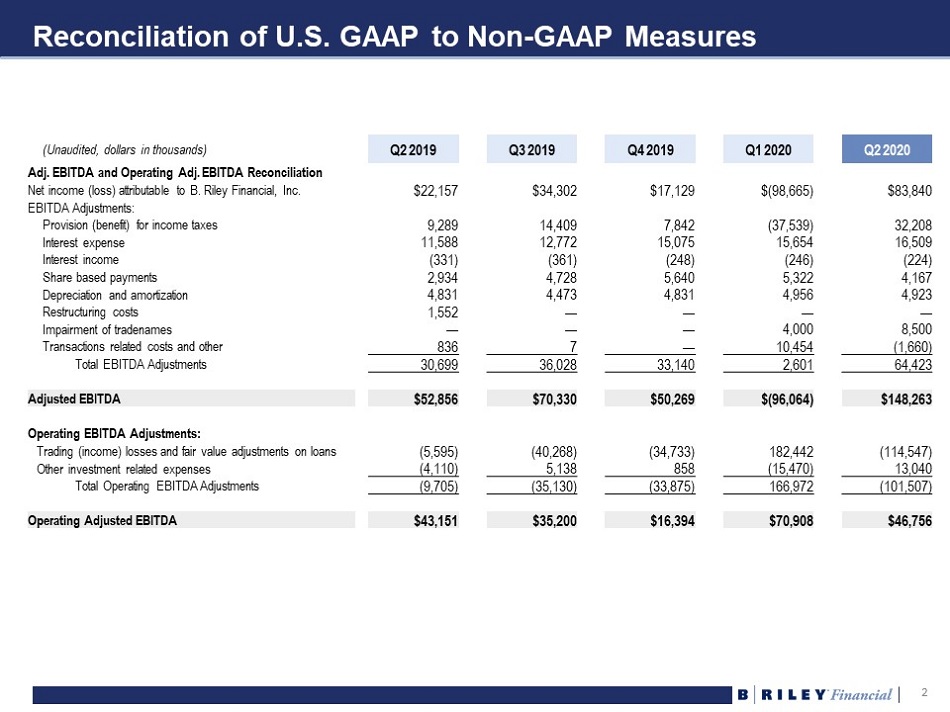
2 2 Reconciliation of U.S. GAAP to Non - GAAP Measures (Unaudited, dollars in thousands) Q2 2019 Q3 2019 Q4 2019 Q1 2020 Q2 2020 Adj. EBITDA and Operating Adj. EBITDA Reconciliation Net income (loss) attributable to B. Riley Financial, Inc. $22,157 $34,302 $17,129 $(98,665) $83,840 EBITDA Adjustments: Provision (benefit) for income taxes 9,289 14,409 7,842 (37,539) 32,208 Interest expense 11,588 12,772 15,075 15,654 16,509 Interest income (331) (361) (248) (246) (224) Share based payments 2,934 4,728 5,640 5,322 4,167 Depreciation and amortization 4,831 4,473 4,831 4,956 4,923 Restructuring costs 1,552 — — — — Impairment of tradenames — — — 4,000 8,500 Transactions related costs and other 836 7 — 10,454 (1,660) Total EBITDA Adjustments 30,699 36,028 33,140 2,601 64,423 Adjusted EBITDA $52,856 $70,330 $50,269 $(96,064) $148,263 Operating EBITDA Adjustments: Trading (income) losses and fair value adjustments on loans (5,595) (40,268) (34,733) 182,442 (114,547) Other investment related expenses (4,110) 5,138 858 (15,470) 13,040 Total Operating EBITDA Adjustments (9,705) (35,130) (33,875) 166,972 (101,507) Operating Adjusted EBITDA $43,151 $35,200 $16,394 $70,908 $46,756
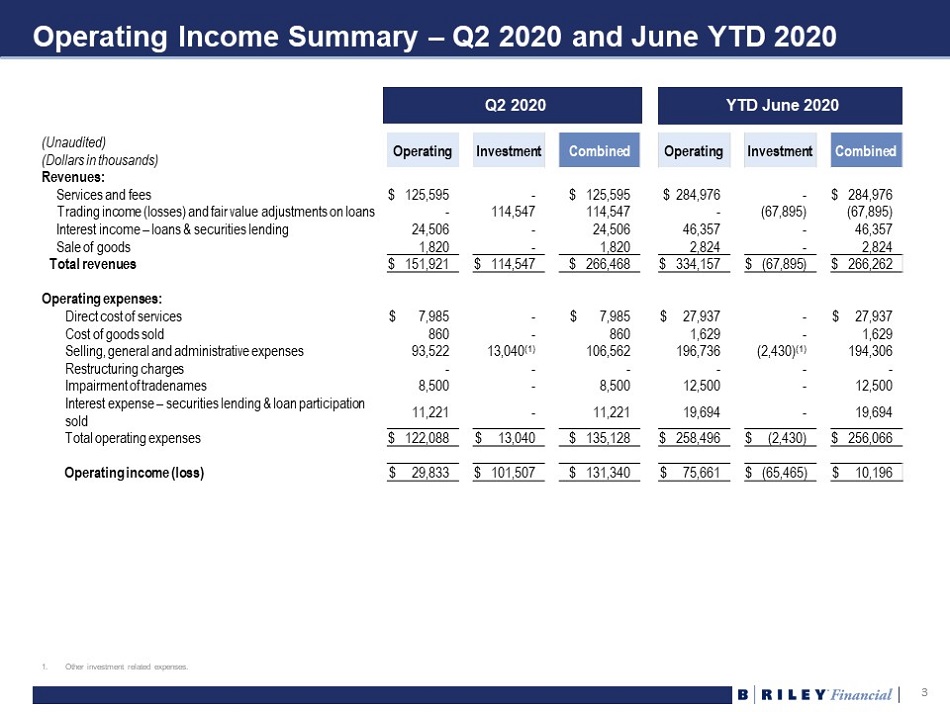
3 3 Operating Income Summary – Q2 2020 and June YTD 2020 1. Other investment related expenses. (Unaudited) (Dollars in thousands) Operating Investment Combined Operating Investment Combined Revenues: Services and fees $ 125,595 - $ 125,595 $ 284,976 - $ 284,976 Trading income (losses) and fair value adjustments on loans - 114,547 114,547 - (67,895) (67,895) Interest income – loans & securities lending 24,506 - 24,506 46,357 - 46,357 Sale of goods 1,820 - 1,820 2,824 - 2,824 Total revenues $ 151,921 $ 114,547 $ 266,468 $ 334,157 $ (67,895) $ 266,262 Operating expenses: Direct cost of services $ 7,985 - $ 7,985 $ 27,937 - $ 27,937 Cost of goods sold 860 - 860 1,629 - 1,629 Selling, general and administrative expenses 93,522 13,040 (1) 106,562 196,736 (2,430) (1) 194,306 Restructuring charges - - - - - - Impairment of tradenames 8,500 - 8,500 12,500 - 12,500 Interest expense – securities lending & loan participation sold 11,221 - 11,221 19,694 - 19,694 Total operating expenses $ 122,088 $ 13,040 $ 135,128 $ 258,496 $ (2,430) $ 256,066 Operating income (loss) $ 29,833 $ 101,507 $ 131,340 $ 75,661 $ (65,465) $ 10,196 Q2 2020 YTD June 2020
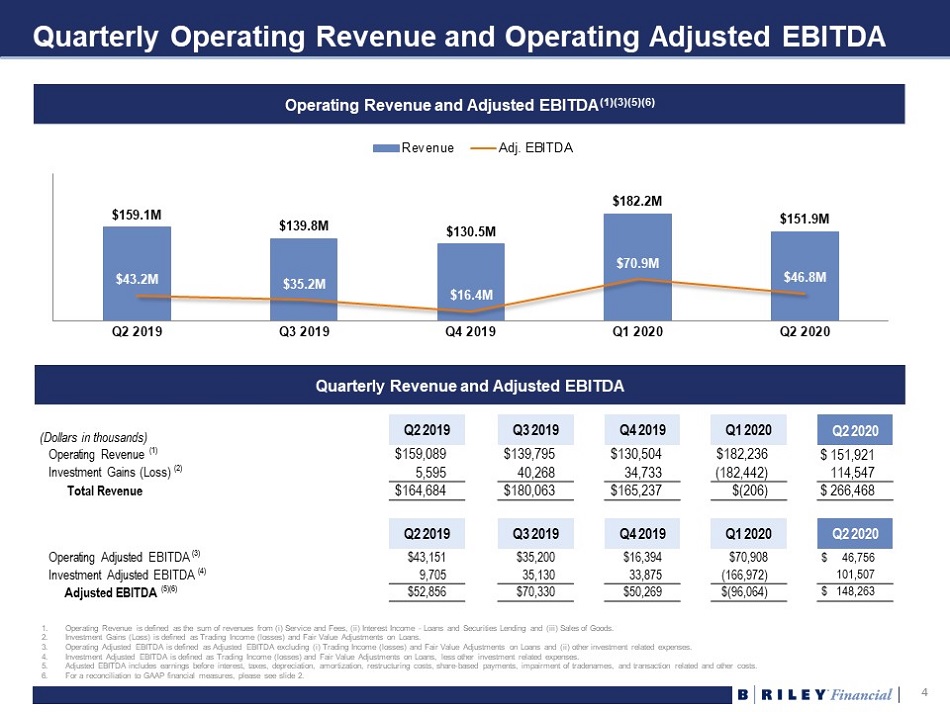
4 4 Quarterly Operating Revenue and Operating Adjusted EBITDA Operating Revenue and Adjusted EBITDA (1)(3)(5)(6) $159.1M $139.8M $130.5M $182.2M $151.9M $43.2M $35.2M $16.4M $70.9M $46.8M Q2 2019 Q3 2019 Q4 2019 Q1 2020 Q2 2020 Revenue Adj. EBITDA (Dollars in thousands) Q2 2019 Q3 2019 Q4 2019 Q1 2020 Q2 2020 Operating Revenue (1) $159,089 $139,795 $130,504 $182,236 $ 151,921 Investment Gains (Loss) (2) 5,595 40,268 34,733 (182,442) 114,547 Total Revenue $164,684 $180,063 $165,237 $(206) $ 266,468 Q2 2019 Q3 2019 Q4 2019 Q1 2020 Q2 2020 Operating Adjusted EBITDA (3) $43,151 $35,200 $16,394 $70,908 $ 46,756 Investment Adjusted EBITDA (4) 9,705 35,130 33,875 (166,972) 101,507 Adjusted EBITDA (5)(6) $52,856 $70,330 $50,269 $(96,064) $ 148,263 Quarterly Revenue and Adjusted EBITDA 1. Operating Revenue is defined as the sum of revenues from ( i ) Service and Fees, (ii) Interest Income - Loans and Securities Lending and (iii) Sales of Goods. 2. Investment Gains (Loss) is defined as Trading Income (losses) and Fair Value Adjustments on Loans. 3. Operating Adjusted EBITDA is defined as Adjusted EBITDA excluding ( i ) Trading Income (losses) and Fair Value Adjustments on Loans and (ii) other investment related expenses. 4. Investment Adjusted EBITDA is defined as Trading Income (losses) and Fair Value Adjustments on Loans, less other investment r ela ted expenses. 5. Adjusted EBITDA includes earnings before interest, taxes, depreciation, amortization, restructuring costs, share - based payments, impairment of tradenames, and transaction related and other costs. 6. For a reconciliation to GAAP financial measures, please see slide 2.
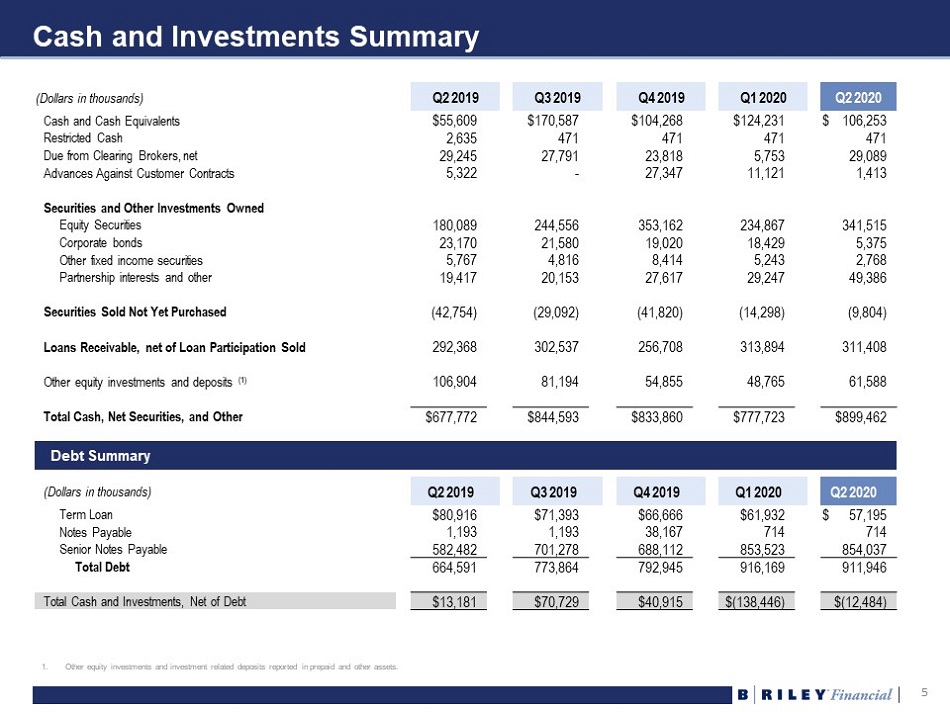
5 5 Cash and Investments Summary (Dollars in thousands) Q2 2019 Q3 2019 Q4 2019 Q1 2020 Q2 2020 Cash and Cash Equivalents $55,609 $170,587 $104,268 $124,231 $ 106,253 Restricted Cash 2,635 471 471 471 471 Due from Clearing Brokers, net 29,245 27,791 23,818 5,753 29,089 Advances Against Customer Contracts 5,322 - 27,347 11,121 1,413 Securities and Other Investments Owned Equity Securities 180,089 244,556 353,162 234,867 341,515 Corporate bonds 23,170 21,580 19,020 18,429 5,375 Other fixed income securities 5,767 4,816 8,414 5,243 2,768 Partnership interests and other 19,417 20,153 27,617 29,247 49,386 Securities Sold Not Yet Purchased (42,754) (29,092) (41,820) (14,298) (9,804) Loans Receivable, net of Loan Participation Sold 292,368 302,537 256,708 313,894 311,408 Other equity investments and deposits (1) 106,904 81,194 54,855 48,765 61,588 Total Cash, Net Securities, and Other $677,772 $844,593 $833,860 $777,723 $899,462 (Dollars in thousands) Q2 2019 Q3 2019 Q4 2019 Q1 2020 Q2 2020 Term Loan $80,916 $71,393 $66,666 $61,932 $ 57,195 Notes Payable 1,193 1,193 38,167 714 714 Senior Notes Payable 582,482 701,278 688,112 853,523 854,037 Total Debt 664,591 773,864 792,945 916,169 911,946 Total Cash and Investments, Net of Debt $13,181 $70,729 $40,915 $(138,446) $(12,484) 1. Other equity investments and investment related deposits reported in prepaid and other assets. Debt Summary
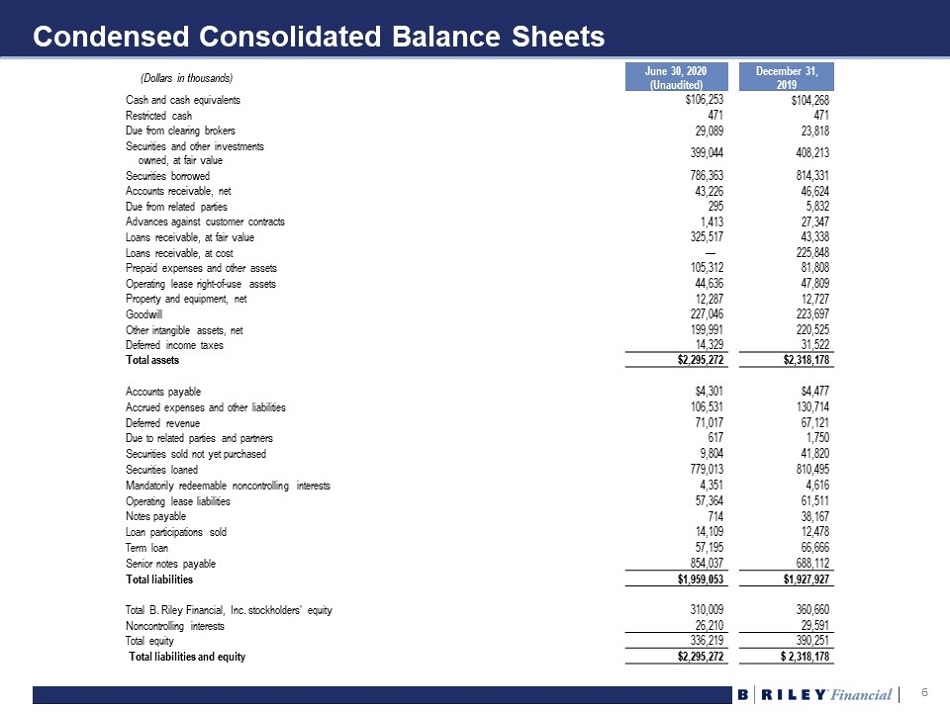
6 6 Condensed Consolidated Balance Sheets (Dollars in thousands) June 30, 2020 (Unaudited) December 31, 2019 Cash and cash equivalents $106,253 $104,268 Restricted cash 471 471 Due from clearing brokers 29,089 23,818 Securities and other investments owned, at fair value 399,044 408,213 Securities borrowed 786,363 814,331 Accounts receivable, net 43,226 46,624 Due from related parties 295 5,832 Advances against customer contracts 1,413 27,347 Loans receivable, at fair value 325,517 43,338 Loans receivable, at cost — 225,848 Prepaid expenses and other assets 105,312 81,808 Operating lease right - of - use assets 44,636 47,809 Property and equipment, net 12,287 12,727 Goodwill 227,046 223,697 Other intangible assets, net 199,991 220,525 Deferred income taxes 14,329 31,522 Total assets $2,295,272 $2,318,178 Accounts payable $4,301 $4,477 Accrued expenses and other liabilities 106,531 130,714 Deferred revenue 71,017 67,121 Due to related parties and partners 617 1,750 Securities sold not yet purchased 9,804 41,820 Securities loaned 779,013 810,495 Mandatorily redeemable noncontrolling interests 4,351 4,616 Operating lease liabilities 57,364 61,511 Notes payable 714 38,167 Loan participations sold 14,109 12,478 Term loan 57,195 66,666 Senior notes payable 854,037 688,112 Total liabilities $1,959,053 $1,927,927 Total B. Riley Financial, Inc. stockholders' equity 310,009 360,660 Noncontrolling interests 26,210 29,591 Total equity 336,219 390,251 Total liabilities and equity $2,295,272 $ 2,318,178
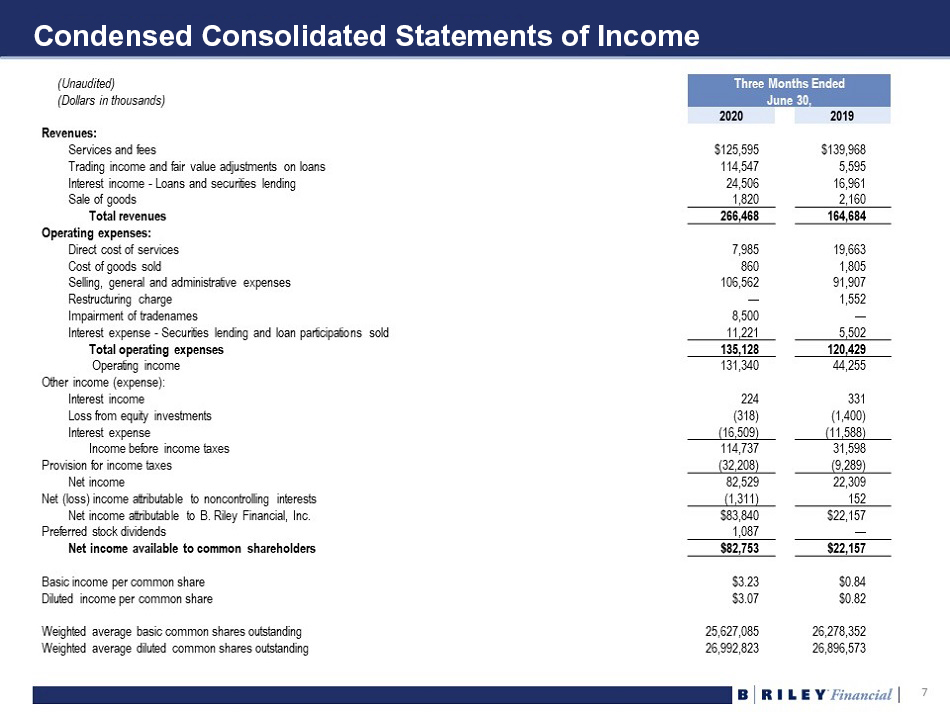
7 7 Consolidated Statements of Income (Unaudited) (Dollars in thousands) Three Months Ended June 30, 2020 2019 Revenues: Services and fees $125,595 $139,968 Trading income and fair value adjustments on loans 114,547 5,595 Interest income - Loans and securities lending 24,506 16,961 Sale of goods 1,820 2,160 Total revenues 266,468 164,684 Operating expenses: Direct cost of services 7,985 19,663 Cost of goods sold 860 1,805 Selling, general and administrative expenses 106,562 91,907 Restructuring charge — 1,552 Impairment of tradenames 8,500 — Interest expense - Securities lending and loan participations sold 11,221 5,502 Total operating expenses 135,128 120,429 Operating income 131,340 44,255 Other income (expense): Interest income 224 331 Loss from equity investments (318) (1,400) Interest expense (16,509) (11,588) Income before income taxes 114,737 31,598 Provision for income taxes (32,208) (9,289) Net income 82,529 22,309 Net (loss) income attributable to noncontrolling interests (1,311) 152 Net income attributable to B. Riley Financial, Inc. $83,840 $22,157 Preferred stock dividends 1,087 — Net income available to common shareholders $82,753 $22,157 Basic income per common share $3.23 $0.84 Diluted income per common share $3.07 $0.82 Weighted average basic common shares outstanding 25,627,085 26,278,352 Weighted average diluted common shares outstanding 26,992,823 26,896,573
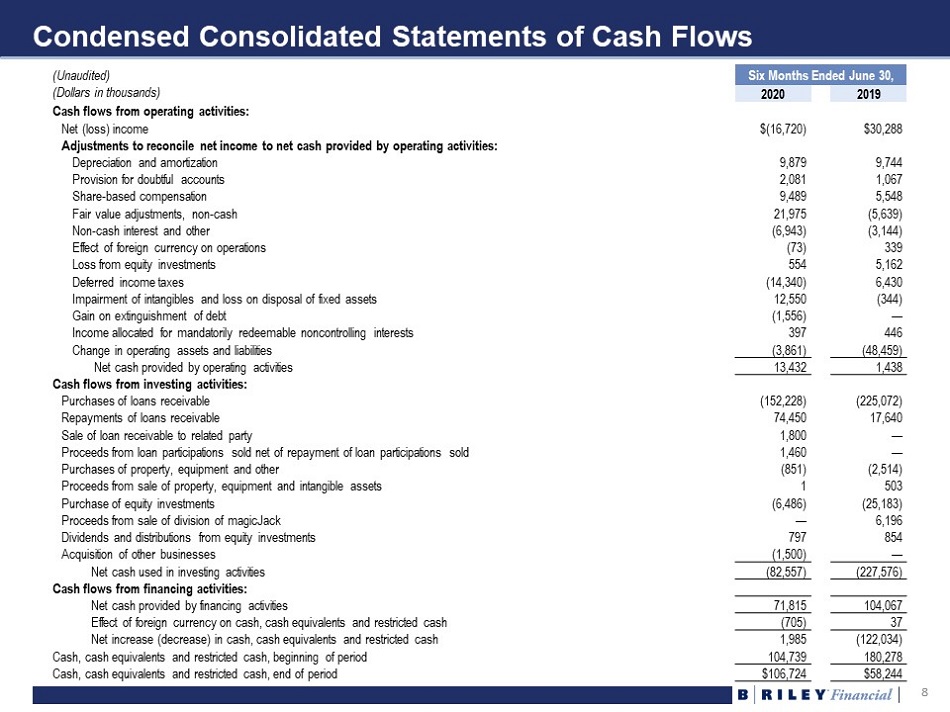
8 8 Condensed Consolidated Statements of Cash Flows (Unaudited) (Dollars in thousands) Six Months Ended June 30, 2020 2019 Cash flows from operating activities: Net (loss) income $(16,720) $30,288 Adjustments to reconcile net income to net cash provided by operating activities: Depreciation and amortization 9,879 9,744 Provision for doubtful accounts 2,081 1,067 Share - based compensation 9,489 5,548 Fair value adjustments, non - cash 21,975 (5,639) Non - cash interest and other (6,943) (3,144) Effect of foreign currency on operations (73) 339 Loss from equity investments 554 5,162 Deferred income taxes (14,340) 6,430 Impairment of intangibles and loss on disposal of fixed assets 12,550 (344) Gain on extinguishment of debt (1,556) — Income allocated for mandatorily redeemable noncontrolling interests 397 446 Change in operating assets and liabilities (3,861) (48,459) Net cash provided by operating activities 13,432 1,438 Cash flows from investing activities: Purchases of loans receivable (152,228) (225,072) Repayments of loans receivable 74,450 17,640 Sale of loan receivable to related party 1,800 — Proceeds from loan participations sold net of repayment of loan participations sold 1,460 — Purchases of property, equipment and other (851) (2,514) Proceeds from sale of property, equipment and intangible assets 1 503 Purchase of equity investments (6,486) (25,183) Proceeds from sale of division of magicJack — 6,196 Dividends and distributions from equity investments 797 854 Acquisition of other businesses (1,500) — Net cash used in investing activities (82,557) (227,576) Cash flows from financing activities: Net cash provided by financing activities 71,815 104,067 Effect of foreign currency on cash, cash equivalents and restricted cash (705) 37 Net increase (decrease) in cash, cash equivalents and restricted cash 1,985 (122,034) Cash, cash equivalents and restricted cash, beginning of period 104,739 180,278 Cash, cash equivalents and restricted cash, end of period $106,724 $58,244
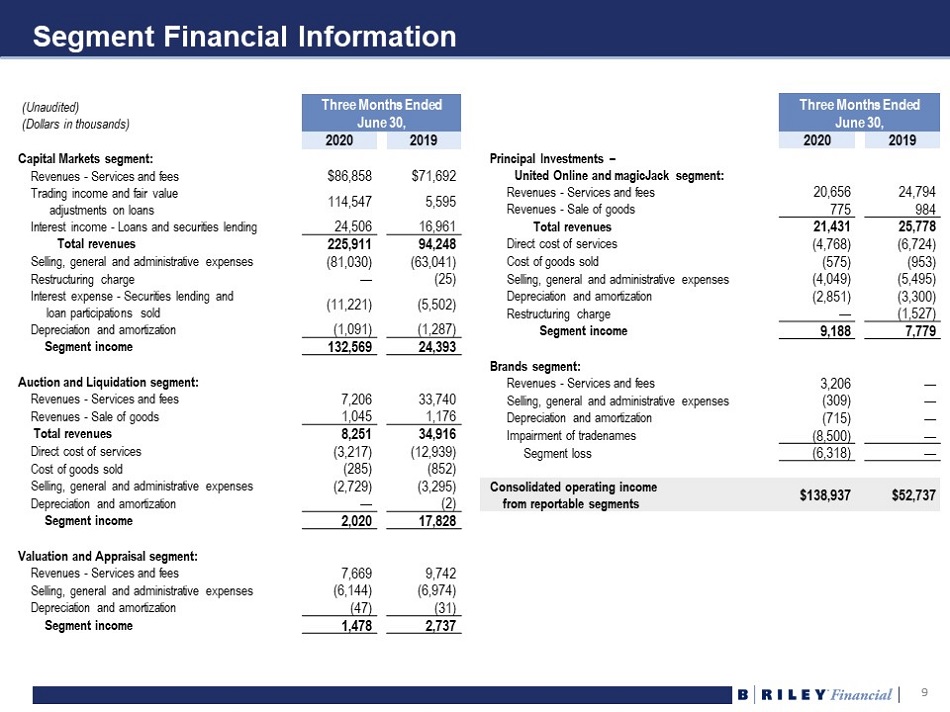
9 9 Segment Financial Information (Unaudited) (Dollars in thousands) Three Months Ended June 30, 2020 2019 Capital Markets segment: Revenues - Services and fees $86,858 $71,692 Trading income and fair value adjustments on loans 114,547 5,595 Interest income - Loans and securities lending 24,506 16,961 Total revenues 225,911 94,248 Selling, general and administrative expenses (81,030) (63,041) Restructuring charge — (25) Interest expense - Securities lending and loan participations sold (11,221) (5,502) Depreciation and amortization (1,091) (1,287) Segment income 132,569 24,393 Auction and Liquidation segment: Revenues - Services and fees 7,206 33,740 Revenues - Sale of goods 1,045 1,176 Total revenues 8,251 34,916 Direct cost of services (3,217) (12,939) Cost of goods sold (285) (852) Selling, general and administrative expenses (2,729) (3,295) Depreciation and amortization — (2) Segment income 2,020 17,828 Valuation and Appraisal segment: Revenues - Services and fees 7,669 9,742 Selling, general and administrative expenses (6,144) (6,974) Depreciation and amortization (47) (31) Segment income 1,478 2,737 Three Months Ended June 30, 2020 2019 Principal Investments – United Online and magicJack segment: Revenues - Services and fees 20,656 24,794 Revenues - Sale of goods 775 984 Total revenues 21,431 25,778 Direct cost of services (4,768) (6,724) Cost of goods sold (575) (953) Selling, general and administrative expenses (4,049) (5,495) Depreciation and amortization (2,851) (3,300) Restructuring charge — (1,527) Segment income 9,188 7,779 Brands segment: Revenues - Services and fees 3,206 — Selling, general and administrative expenses (309) — Depreciation and amortization (715) — Impairment of tradenames (8,500) — Segment loss (6,318) — Consolidated operating income from reportable segments $138,937 $52,737
10 10 Definition of US GAAP to Non - GAAP Financial Measures Certain of the information set forth herein, including operating revenue, adjusted EBITDA, operating adjusted EBITDA, and investment adjusted EBITDA may be considered non - GAAP financial measures . B . Riley Financial believes this information is useful to investors because it provides a basis for measuring the Company's available capital resources, the operating performance of its business and its revenues and cash flow, ( i ) excluding in the case of operating revenues, trading income (losses) and fair value adjustments on loans, (ii) excluding in the case of adjusted EBITDA, net interest expense, provisions for or benefit from income taxes, depreciation, amortization, fair value adjustment, restructuring costs, impairment of trade names, stock - based compensation and transaction and other expenses, (iii) excluding in the case of operating adjusted EBITDA, aforementioned adjustments for adjusted EBITDA, trading income (losses) and fair value adjustments on loans, and other investment related expenses, and (iv) in the case of investment adjusted EBITDA this includes trading income (losses) and fair value adjustments on loans, net of other investment related expenses, that would normally be included in the most directly comparable measures calculated and presented in accordance with Generally Accepted Accounting Principles ("GAAP") . In addition, the Company's management uses these non - GAAP financial measures along with the most directly comparable GAAP financial measures in evaluating the Company's operating performance, capital resources and cash flow . Non - GAAP financial measures should not be considered in isolation from, or as a substitute for, financial information presented in compliance with GAAP, and non - financial measures as reported by the Company may not be comparable to similarly titled amounts reported by other companies .