Attached files
| file | filename |
|---|---|
| 8-K - 8-K - PTC INC. | ptc-8k_20200729.htm |
| EX-99.1 - EX-99.1 - PTC INC. | ptc-ex991_216.htm |

PTC PREPARED REMARKS
THIRD QUARTER FISCAL 2020
July 29, 2020
Please refer to the “Important Information About Our Operating and Non-GAAP Financial Measures” below for important information about those measures, definitions and reconciliation to the nearest GAAP measures, and other important disclosures. Additional financial information is provided in the PTC Financial Data Tables posted with these prepared remarks to PTC’s Investor Relations website at investor.ptc.com.
Key Performance Measures
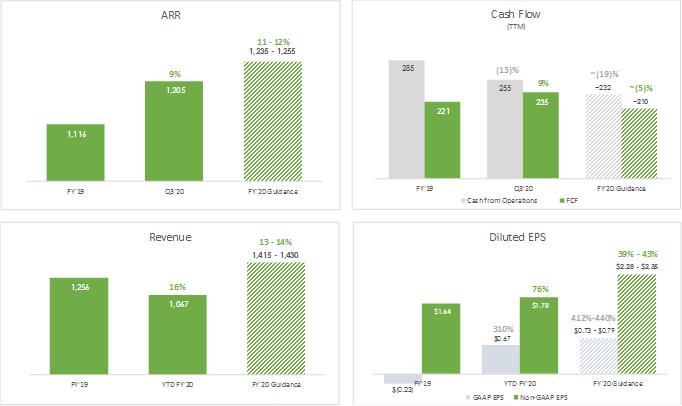
Revenue dollars and growth rates as reported.
Q3’19 and Q3’20 Cash from Operations and FCF are trailing twelve months.
Cash from Operations and FCF for the Q3’20 and Q3’19 trailing twelve months include restructuring payments of $38M and $22M, respectively.
Cash from Operations and FCF for the FY’20 Guidance and FY’19 include restructuring payments of $45M and $25M, respectively.
1
Key Highlights of Operating and Financial Measures
2
Operating Performance
Operating expense and operating margin are impacted by the adoption of ASC 606 and related business policy changes.
|
In millions |
Q3’20 |
YoY |
YoY CC |
Management Comments |
|
Operating Expense: GAAP
Non-GAAP |
$209
$179 |
3%
(3)% |
4%
(2)% |
•GAAP and non-GAAP operating expenses reflect continued financial discipline, and the impact of COVID-19 on travel, business meetings, and other related expenses. •Non-GAAP operating expenses were slightly below our expectation for the quarter due to timing of expenses. |
|
Operating Margin: GAAP
Non-GAAP |
18%
29% |
1,488 bps
1,663 bps |
1,497 bps
1,664 bps |
•Both GAAP and non-GAAP operating margin increased due to strong revenue growth, as described above, and continued financial discipline. |
3
ARR Performance by Product Group
|
In millions |
Q3’20 |
YoY |
YoY CC |
Management Comments |
|
Core (CAD & PLM) |
$869 |
9% |
10% |
•ARR growth YoY CC was above the high single-digit market growth rate for the 11th quarter in a row. •PLM delivered double-digit ARR growth with broad-based strength across all major geos. •CAD ARR growth was in the high-single digits, with notable strength in China as economic conditions stabilized. |
|
Growth (IoT, AR & Onshape) |
$160 |
23% |
24% |
•ARR growth was driven by strong growth in AR, most notably in Japan and Europe. •IoT ARR was again impacted by a slowdown in new customer acquisition and smaller average deal sizes due the ongoing impact of COVID-19, offset by solid expansion activity in the quarter. •Onshape continues to perform in line with expectations. |
|
Focused Solutions Group (FSG) |
$177 |
(1)% |
0% |
•Q3’20 ARR reflects modest growth in Europe and Japan, partially offset by performance in the Americas. |
ARR Performance by Region
|
In millions |
Q3’20 |
YoY |
YoY CC |
Management Comments |
|
Americas
|
$543 |
9% |
10% |
•America’s ARR growth was driven by mid-20’s ARR growth of our Growth products, and high-single digit growth of our Core products, partially offset by a modest decline in FSG. |
|
Europe |
$454 |
8% |
10% |
•Europe’s ARR growth was driven by low-20’s ARR growth of our Growth products and high single-digit ARR growth of our Core products. |
|
APAC |
$208 |
10% |
11% |
•APAC’s ARR growth was driven by high-teens ARR growth of Growth products and low-double digit ARR growth of our Core products. |
4
Software Revenue Performance by Product Group
|
In millions |
Q3’20 |
YoY |
YoY CC |
Management Comments |
|
Core (CAD & PLM) |
$230 |
33% |
34% |
•Software revenue growth for our Core products was driven by mid-30% growth in recurring software revenue. •Substantially all our Core product software revenue is recurring. •Software revenue growth also reflects ASC 606 and related business policy changes. |
|
Growth (IoT, AR & Onshape) |
$40 |
9% |
10% |
•Software revenue growth for our Growth products was driven by mid-teens growth in recurring software revenue, partially offset by a low-20% decline in perpetual license revenue. •Software revenue growth also reflects ASC 606 and related business policy changes. |
|
Focused Solutions Group (FSG) |
$47 |
8% |
9% |
•Software revenue growth for our FSG products was driven by high single-digit growth in recurring software revenue. •Software revenue growth also reflects ASC 606 and related business policy changes. |
Software Revenue Performance by Region
|
In millions |
Q3’20 |
YoY |
YoY CC |
Management Comments |
|
Americas
|
$142 |
30% |
31% |
•Americas software revenue growth was driven by mid-30% recurring software revenue growth, partially offset by a high-20% decline in perpetual license revenue. •Software revenue growth also reflects ASC 606 and related business policy changes. |
|
Europe |
$107 |
18% |
20% |
•Europe software revenue growth was driven by high-teens growth in recurring software revenue. •Software revenue growth also reflects ASC 606 and related business policy changes. |
|
APAC |
$68 |
28% |
28% |
•APAC software revenue growth was driven by ~30% growth in recurring software revenue. •Software revenue growth also reflects ASC 606 and related business policy changes. |
5
Other Highlights in Quarterly Operating Performance
|
|
• |
Cash, cash equivalents, and marketable securities totaled $435 million as of June 27, 2020. |
|
|
• |
Our aggregate interest rate on our senior debt is 3.8% for the two $500 million senior notes series we closed in early February with maturity dates in 2025 and 2028, respectively. We believe this is a very attractive and stable debt structure, especially considering the current economic backdrop. |
Revised Fiscal 2020 Outlook
Our revised fiscal 2020 financial outlook includes the following assumptions:
|
|
• |
New ACV bookings decline ~25% YoY at the midpoint of guidance in the back half of the year, compared to our previous guidance of a ~30% decline YoY. |
|
|
• |
Revenue growth slows quarter over quarter in Q4’20, to the mid-single digits, due primarily to the impact of ASC 606 and related business policy changes. |
|
|
• |
GAAP tax rate is expected to be 20%, Non-GAAP tax rate is expected to be 19%. |
6
|
|
|
|
|
|
|
In millions except per share amounts |
Previous Guidance |
Revised Guidance |
YoY |
Comments |
|
ARR |
$1,220 - $1,255 |
$1,235 - $1,255 |
11% - 12% |
Increased $7M at the midpoint to reflect modestly higher bookings at the low end and Fx, partially offset by churn. |
|
Cash from Operations |
~$222 |
~$232 |
~(19)% |
Increased $10M from previous guidance to reflect modestly higher expected ARR at the midpoint, and solid collections activity. |
|
Free cash flow (1) |
~$200 |
~$210 |
~(5)% |
Increased $10M from previous guidance for the reasons noted above. |
|
Revenue |
$1,400 - $1,430 |
$1,415 - $1,430 |
13% - 14% |
Increased $7M at the midpoint reflecting an increase in ARR and subscription revenue. |
|
GAAP Operating Margin |
13% - 14% |
13 - 14% |
800 - 900 bps |
No change |
|
Non-GAAP Operating Margin (2) |
27% - 28% |
27% - 28% |
700 - 800 bps |
No change |
|
GAAP EPS |
$0.70 - $0.84 |
$0.73 - $0.79 |
412% - 440% |
Decreased the midpoint of the range by $0.01 due to slightly higher non-operating expenses. |
|
Non-GAAP EPS (2) |
$2.20 - $2.35 |
$2.28 - $2.35 |
39% - 43% |
Increased low end of the range by $0.08, no change to high-end. Midpoint increases $0.04. |
|
|
(2) |
The FY’20 non-GAAP guidance excludes the estimated items outlined in the table below, as well as any tax effects and discrete tax items (which are not known nor reflected). |
|
In millions |
|
|
FY’20 |
|
|
|
|
|
|
Acquisition-related charges |
|
|
$8 |
|
Restructuring and other charges |
|
|
$32 |
|
Intangible asset amortization expense |
|
|
$56 |
|
Stock-based compensation expense |
|
|
$105 |
|
Write-off of debt issuance costs associated with extinguished debt |
|
|
$3 |
|
Debt early redemption premium |
|
|
$15 |
|
Total Estimated Pre-Tax GAAP adjustments |
|
|
$219 |
7
8
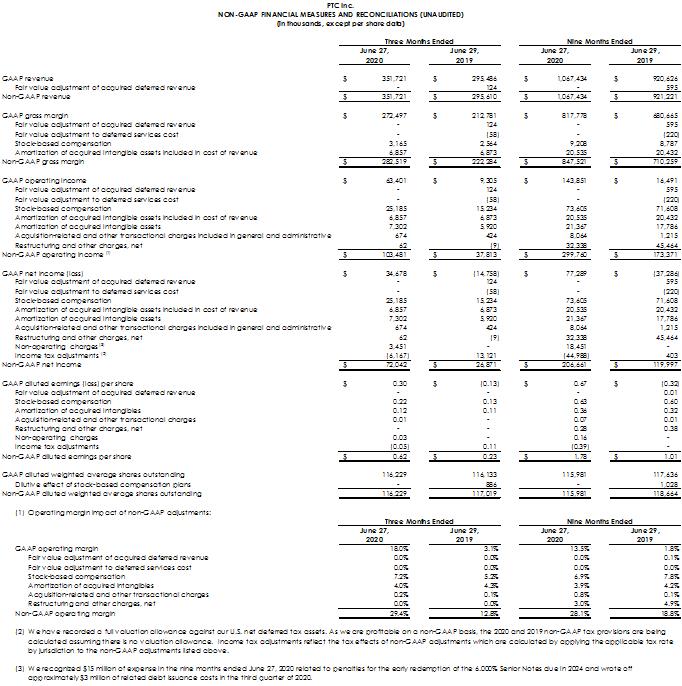
Important Information About Our Non-GAAP Financial Measures
PTC provides non-GAAP supplemental financial information to its financial results. We use these non-GAAP financial measures, and we believe that they assist our investors, to make period-to-period comparisons of our operational performance because they provide a view of our operating results without items that are not, in our view, indicative of our operating results. These, non-GAAP financial measures should not be construed as an alternative to GAAP results as the items excluded from the non-GAAP financial measures often have a material impact on our financial results and such items often recur. Management uses, and investors should consider, non-GAAP financial measures in conjunction with our GAAP results.
Non-GAAP revenue, non-GAAP operating expense, non-GAAP operating margin, non-GAAP gross profit, non-GAAP gross margin, non-GAAP net income and non-GAAP EPS exclude the effect of the following items: fair value of acquired deferred revenue, fair value adjustment to deferred services cost, stock-based compensation, amortization of acquired intangible assets, acquisition-related and other transactional charges included in general and administrative costs, restructuring and other charges, debt early redemption premium and write-off of issuance costs associated with the extinguished debt and income tax adjustments. We exclude the debt early redemption premium because, although paid in cash in May 2020, it was not modelled in our guidance for the year; excluding it enables investors to view our results in the context of our guidance. Additional information about the items we exclude from our non-GAAP financial measures and the reasons we exclude them can be found in “Non-GAAP Financial Measures” of our Annual Report on Form 10-K for the fiscal year ended September 30, 2019.
Free Cash Flow - PTC also provides information on “free cash flow” to enable investors to assess our ability to generate cash without incurring additional external financings and to evaluate our performance against our announced long-term goal of returning approximately 50% of our free cash flow to shareholders via stock repurchases. As a reminder, we suspended the share repurchase program for FY’20. Free cash flow is net cash provided by (used in) operating activities less capital expenditures. Free cash flow is not a measure of cash available for discretionary expenditures.
Constant Currency Metric - We present CC information for revenue, EPS, and ARR to provide a framework for assessing how our underlying business performed excluding the effects of foreign currency rate fluctuations. To present CC revenue, current and comparative prior period results for entities reporting in currencies other than United States dollars are converted into United States dollars using the foreign exchange rate as of September 30, 2019, excluding the effect of any hedging, rather than the actual exchange rates in effect during that period.
9
Operating Measure
ARR - To help investors understand and assess the performance of our business as on-premise subscription company, we provide an ARR operating measure. On September 5, 2019, we revised the ARR definition. ARR represents the annualized value of our portfolio of renewable customer arrangements as of the end of the reporting period, including subscription software, cloud, and support contracts. ARR includes IOT and AR orders placed under our Strategic Alliance Agreement with Rockwell Automation and may include orders placed to satisfy the contractual quarterly minimum ACV commitments. We believe ARR is a valuable operating metric to measure the health of a subscription business because it captures expected subscription and support cash generation from new customers, existing customer renewals and expansions and includes the impact of churn (gross churn net of pricing). Because this measure represents the annual contract value of renewable customer contracts as of the end of a reporting period, ARR does not represent revenue or billings for any particular period or remaining revenue that will be recognized in future periods.
Statements in this document that are not historic facts, including statements about our future financial and growth expectations and targets, are forward-looking statements that involve risks and uncertainties that could cause actual results to differ materially from those projected. These risks include: the COVID-19 pandemic impact on the global macroeconomic environment and our business could be more severe and prolonged than we expect; customers may continue to delay or reduce purchases of new software, to reduce the number of subscriptions they carry, or delay payments to us due to the COVID-19 pandemic, all of which would adversely affect ARR and our financial results, including cash flow; the macroeconomic and/or global manufacturing climates may deteriorate further due to, among other factors, the geopolitical environment, including the focus on technology transactions with non-U.S. entities and potential expanded prohibitions, and ongoing trade tensions and tariffs; our businesses, including our Internet of Things (IoT), Augmented Reality and Onshape businesses, may not expand and/or generate the revenue we expect if customers are slower to adopt those technologies than we expect or adopt competing technologies; orders associated with minimum purchase commitments under our Strategic Alliance Agreement with Rockwell Automation may not result in subscription contracts sold through to end-user customers, which could cause the ARR associated with those orders to churn in the future; our strategic initiatives and investments may not generate the revenue we expect; we may be unable to expand our partner ecosystem as we expect, and our partners may not generate the revenue we expect; we may be unable to generate sufficient operating cash flow to repay our outstanding debt when or as we expect or to return 50% of free cash flow to shareholders under our long-term capital allocation policy, and other uses of cash or our credit facility limits or other matters could preclude such repayments or share repurchases; we may be unable to expand our partner ecosystem as we expect; and our partners may not generate the revenue we expect. In addition, our assumptions concerning our future GAAP and non-GAAP effective income tax rates are based on estimates and other factors that could change, including the geographic mix of our revenue, expenses and profits. Other risks and uncertainties that could cause actual results to differ materially from those projected are detailed from time to time in reports we file with the Securities and Exchange Commission, including our most recent Annual Report on Form 10-K and Quarterly Reports on Form 10-Q.
10