Attached files
| file | filename |
|---|---|
| EX-32 - EXHIBIT 32 - PTC INC. | ptc9302018ex32.htm |
| EX-31.2 - EXHIBIT 31.2 - PTC INC. | ptc9302018ex312.htm |
| EX-31.1 - EXHIBIT 31.1 - PTC INC. | ptc9302018ex311.htm |
| EX-23.1 - EXHIBIT 23.1 - PTC INC. | ptc9302018ex231.htm |
| EX-21.1 - EXHIBIT 21.1 - PTC INC. | ptc93018ex10211.htm |
| EX-10.25 - EXHIBIT10.25 - PTC INC. | ptc93018ex1025.htm |
| EX-10.13 - EXHIBIT 10.13 - PTC INC. | ptc93018ex1013.htm |
UNITED STATES
SECURITIES AND EXCHANGE COMMISSION
Washington, D.C. 20549
FORM 10-K |
ANNUAL REPORT PURSUANT TO SECTIONS 13 OR 15(d) OF THE
SECURITIES EXCHANGE ACT OF 1934
For the Fiscal Year Ended: September 30, 2018
Commission File Number: 0-18059
PTC Inc.
(Exact name of registrant as specified in its charter)
Massachusetts | 04-2866152 | |
(State or other jurisdiction of incorporation or organization) | (I.R.S. Employer Identification Number) | |
140 Kendrick Street, Needham, MA 02494
(Address of principal executive offices, including zip code)
(781) 370-5000
(Registrant’s telephone number, including area code)
Securities registered pursuant to Section 12(b) of the Act:
Title of each class | Name of each exchange on which registered | |
Common Stock, $.01 par value per share | NASDAQ Global Select Market | |
Securities registered pursuant
to Section 12(g) of the Act:
None
(Title of Class)
Indicate by check mark whether the registrant is a well-known seasoned issuer, as defined in Rule 405 of the Securities Act. YES þ NO ¨
Indicate by check mark whether the registrant is not required to file reports pursuant to Section 13 or 15(d) of the Act. YES ¨ NO þ
Indicate by check mark whether the registrant: (1) has filed all reports required to be filed by Section 13 or 15(d) of the Securities Exchange Act of 1934 during the preceding 12 months (or for such shorter period that the registrant was required to file such reports) and (2) has been subject to such filing requirements for the past 90 days. YES þ NO ¨
Indicate by check mark whether the registrant has submitted electronically every Interactive Data File required to be posted pursuant to Rule 405 of Regulation S-T during the preceding 12 months (or for such shorter period that the registrant was required to post such files). YES þ NO ¨
Indicate by check mark if disclosure of delinquent filers pursuant to Item 405 of Regulation S-K is not contained herein and will not be contained, to the best of the registrant’s knowledge, in definitive proxy or information statements incorporated by reference in Part III of this Form 10-K or any amendment to this Form 10-K. þ
Indicate by check mark whether the registrant is a large accelerated filer, an accelerated filer, a non-accelerated filer or a smaller reporting company. See the definitions of “large accelerated filer,” “accelerated filer” and “smaller reporting company” in Rule 12b-2 of the Exchange Act.
Large Accelerated Filer þ | Accelerated Filer o | Non-accelerated Filer o | Smaller Reporting Company o |
Emerging growth company o | |||
If an emerging growth company, indicate by check mark if the registrant has elected not to use the extended transition period for complying with any new or revised financial accounting standards provided pursuant to Section 13(a) of the Exchange Act. ¨
Indicate by check mark whether the registrant is a shell company (as defined in Rule 12b-2 of the Act). YES ¨ NO þ
The aggregate market value of our voting stock held by non-affiliates was approximately $8,976,658,598 on April 1, 2018 based on the last reported sale price of our common stock on the Nasdaq Global Select Market on March 29, 2018. There were 116,337,920 shares of our common stock outstanding on that day and 118,675,240 shares of our common stock outstanding on November 15, 2018.
DOCUMENTS INCORPORATED BY REFERENCE
Portions of the definitive Proxy Statement in connection with the 2019 Annual Meeting of Stockholders (2019 Proxy Statement) are incorporated by reference into Part III.
PTC Inc.
ANNUAL REPORT ON FORM 10-K FOR FISCAL YEAR 2018
Table of Contents
Page | ||
Item 1. | ||
Item 1A. | ||
Item 1B. | ||
Item 2. | ||
Item 3. | ||
Item 4. | ||
Item 5. | ||
Item 6. | ||
Item 7. | ||
Item 7A. | ||
Item 8. | ||
Item 9. | ||
Item 9A. | ||
Item 9B. | ||
Item 10. | ||
Item 11. | ||
Item 12. | ||
Item 13. | ||
Item 14. | ||
Item 15. | ||
Item 16. | ||
Forward-Looking Statements
Statements in this Annual Report about our anticipated financial results and growth, as well as about the development of our products and markets, are forward-looking statements that are based on our current plans and assumptions. Important information about factors that may cause our actual results to differ materially from these statements is discussed in Item 1A. “Risk Factors” and generally throughout this Annual Report.
Unless otherwise indicated, all references to a year reflect our fiscal year that ends on September 30.
PART I
ITEM 1. | Business |
PTC is a global software and services company that delivers solutions to enable our industrial customers' digital transformations, helping them to better design, manufacture, operate, and service their products.
Our Internet of Things (IoT) solutions are focused on Smart Connected Operations (SCO), Smart Connected Products (SCP), and Smart Connect Systems, that enable companies to connect factories and plants, smart products, and enterprise systems, bridging the physical and digital worlds, to transform their businesses. Our Solutions portfolio of innovative Computer-Aided Design (CAD) and Product Lifecycle Management (PLM) solutions enable manufacturers to create, innovate, operate, and service products.
PTC | |||
IoT | Solutions | ||
Internet of Things (IoT) | Augmented Reality (AR) | Computer Aided Design (CAD) | Product Lifecycle Management (PLM) |
Industrial Innovation Platform enabling connectivity, rapid application development, and purpose-built solutions | Industrial AR solutions to increase efficiency and technical proficiency of skilled workers in manufacturing and service settings | Effective and collaborative product design across the globe | Efficient and consistent management of product information from concept to retirement across the enterprise processes and distributed teams |
Our Principal Products and Services
We generate revenue through the sale of software licenses, subscriptions (which include license access, support and cloud services for a period of time), support (which includes technical support and software updates when and if available), and services (which include consulting and implementation and training). We report revenue by line of business (subscription, support, perpetual license and professional services), by geographic region, and by segment (Software Products and Professional Services).
IoT
Our IoT products and solutions are focused on Smart Connected Operations such as plants and factories, Smart Connected Products, and Smart Connected Systems. With these products and solutions, industrial companies can drive their digital transformations across the enterprise, transforming how they run their plants and factories, how they service their products, and how they better leverage information across their enterprise to increase productivity, improve factory and plant efficiency, reduce operational risk, and achieve better system interoperability. Our solutions enable our customers to bridge their physical and digital worlds.
1
Our principal IoT products are described below.
 | Our ThingWorx® industrial innovation platform delivers tools, technologies, and solutions that empower companies to rapidly develop and deploy powerful industrial IoT applications, enabling customers to transform their operations, products and services and unlock new business models. ThingWorx enables customers to reduce the time, cost, and risk required to build and deploy IoT applications; connect devices, systems, and applications; manage connected products; and analyze industrial IoT data. Our ThingWorx solutions include cloud-based tools that allow customers to easily and more securely connect products and devices to the cloud, and intelligently process and store product and sensor data. Additionally, ThingWorx offers sophisticated artificial intelligence and machine learning technology that enables customers to simplify and automate complex analytical processes that enhance industrial IoT solutions through real-time insights, predictions and recommendations from information collected from smart, connected products. |
Our KEPServerEX® solution provides communications connectivity to industrial automation environments, enabling users to connect, manage, monitor, and control disparate devices and software applications, providing users with a single source of real-time industrial sensor and machine data to improve operations, accelerate troubleshooting, perform preventative maintenance, and improve productivity. | |
 | Our Vuforia Studio™ solution is a powerful, easy-to-use, cloud dependent tool that enables industrial enterprises to rapidly author and publish augmented reality experiences. These augmented reality experiences overlay important digital information from IoT onto the view of the physical things on which the user is working, including for example 3D step-by-step operating or repair instructions or a dashboard of analytics data. |
Solutions
Our principal Solutions products are described below.
CAD
Our CAD products enable users to create conceptual and detailed designs, analyze designs, perform engineering calculations and leverage the information created downstream using 2D, 3D, parametric and direct modeling. Our principal CAD products are described below.
2
 | Our Creo® interoperable suite of product design software provides a scalable set of packages for design engineers to meet a variety of specialized needs. Creo provides capabilities for design flexibility, advanced assembly design, piping and cabling design, advanced surfacing, comprehensive virtual prototyping and other essential design functions. Our Creo solutions include augmented and virtual reality through a native cloud dependent integration with our Vuforia® solution. With every seat of Creo, our customers can create and publish AR experiences and share their design instantly to collaborate with anyone in the world on any device. In 2019, we will launch a version of Creo that will include the Discovery Live real-time simulation technology from ANSYS. This solution will offer customers a unified modeling and simulation environment and provide design engineers with an interactive design experience that will enable them to create higher quality products, while reducing product and development costs. |
PLM
Our PLM products are designed to address common challenges that companies face over the life of their products, from concept to retirement. Our PLM products enable efficient and consistent product data management from inception through design, as well as communication and collaboration across the entire enterprise, including product development, manufacturing and the supply chain.
Our principal PLM products are described below.
 | Our Windchill® suite of PLM software provides product lifecycle management capabilities - from design to service. Windchill offers a single repository for all product information. As such, it is designed to create a “single source of truth” for all product-related content such as CAD models, documents, technical illustrations, embedded software, calculations and requirement specifications for all phases of the product lifecycle to help companies streamline enterprise-wide communication and make informed decisions. Additionally, our Windchill product family includes solutions that allow manufacturers, distributors and retailers to collaborate across product development and the supply chain, including sourcing and procurement, to identify an optimal set of parts, materials and suppliers. This functionality provides automated cost modeling and visibility into supply chain risk information to balance cost and quality, and enables customers to design products that meet compliance requirements and performance targets. With Windchill 11.1, we introduced augmented reality (AR) capabilities to Windchill customers. This cloud dependent functionality enables customers to build a digital product definition and publish the representation of the resulting product in AR. Using AR in the product development process enables companies to connect the digital model to the physical product to determine real-time behavior, conduct product design reviews in real-world environments, and share the product definition with disparate stakeholders. |
3
Our ThingWorx Navigate™ solution, a ThingWorx-based PLM offering launched in 2016, is a collection of focused, role-based applications that provides complete, contextual, up-to-date and accurate product information from Windchill and other systems of record. Leveraging ThingWorx technology, ThingWorx Navigate applications can easily be tailored and deployed to roles across an enterprise, and extended to include data from other systems of record and even data from smart, connected products. | |
Our Integrity™ solution provides a set of Application Lifecycle Management and Model Based Systems Engineering capabilities that enable users to manage system models, software configurations, test plans and defects. With Integrity, engineering teams can improve productivity and quality, streamline compliance, and gain greater product visibility, ultimately enabling them to bring more innovative products to market. | |
Other Solutions
 | Our Servigistics® suite enables more effective service parts management, enabling customers to continuously improve their products and services and increase customer satisfaction. |
Customer Success Solutions and Services
Our Customer Success solutions and services help customers unleash the full value of our software offerings. These include advisory services designed to provide strategic insights for operational, organizational and technological IoT transformation; implementation services; adoption services that include digital learning solutions and change enablement services; success management services that leverage data and systems to monitor and improve the customer experience; cloud services; and customer support resources and tools. Our principal Customer Success offerings are described below.
Global Support
We offer global support plans for our software products. Participating customers receive updates that we make generally available to our support customers and also have direct access to our global technical support team of certified engineers for issue resolution. We also provide self-service support tools that allow our customers access to extensive technical support information. When products are purchased as a subscription, support is included as part of the subscription.
Professional Services
We offer consulting, implementation, training and cloud services through our Global Professional Services Organization, with approximately 900 professionals worldwide, as well as through third-party resellers and other strategic partners. Our services help customers improve product development performance through technology enabled process improvement and multiple deployment paths. Our cloud services customers receive hosting and 24/7 application management.
Strategic Partners
Building an ecosystem of strategic partners will become increasingly important as we expand the capabilities of our core solutions, and IoT offerings and as we expand our addressable markets by leveraging our partner sales distribution channels. With this in mind, in 2018, we entered into the three strategic partner relationships below to jointly develop, market and sell integrated products and services.
We partnered with Rockwell Automation to align our respective smart factory technologies to address the market for smart, connected operations, with particular focus on the plant and factory setting. As part of this strategic alliance, we will align our ThingWorx® IoT, Kepware® industrial connectivity, and Vuforia® augmented reality (AR) platforms with Rockwell Automation’s
4
FactoryTalk® MES, FactoryTalk Analytics, and Industrial Automation platforms, and we both will offer these solutions in the market. During the term of the contract, Rockwell Automation has exclusive rights to resell certain of our solutions to certain customers and geographic regions. In connection with this strategic alliance, Rockwell Automation made a $1 billion equity investment in PTC.
We partnered with Microsoft to make the ThingWorx® Industrial Innovation Platform available on the Microsoft Azure cloud platform as our preferred cloud platform. By partnering with Microsoft, we are able to leverage the two companies’ complementary technologies and together pursue opportunities in industrial sectors. This integration enables us to deliver a combined and connected solution for industrial IoT and digital product lifecycle management that enable companies to bring new products to market faster, enhance customer service, and introduce new revenue streams, while reducing operating costs.
We partnered with ANSYS to enable us to embed Ansys' Discovery Live real-time simulation within Creo, enabling us to offer a fully-integrated CAD and real-time simulation solution.
Our Markets and How We Address Them
We compete in the Industrial IoT (IIoT) and augmented reality markets and the CAD and PLM markets. The markets we serve present different growth opportunities for us. We see greater opportunity for market growth for our IIoT and Augmented Reality solutions for the enterprise, followed by more moderate market growth for our CAD and PLM solutions.
We derive most of our sales from products and services sold directly by our sales force to end-user customers. Approximately 20% to 30% of our sales of products and services are through third-party resellers and other strategic partners. Our sales force focuses on large accounts, while our reseller channel provides a cost-effective means of covering the small- and medium-size business market. Our strategic services partners provide service offerings to help customers implement our product offerings. As we grow our IIoT business, we expect our go-to-market strategy will rely more on partners, including the types of strategic partners described above, and marketing directly to end users and developers.
Additional financial information about our segments and international and domestic operations may be found in Note Q. Segment Information of Notes to Consolidated Financial Statements in this Annual Report, which information is incorporated herein by reference.
Competition
We compete with a number of companies that offer solutions that address one or more specific functional areas covered by our solutions. In our IIoT business, we compete with large established companies like Amazon, IBM Corporation, Cisco, Oracle, SAP, and General Electric. There are also a number of small companies that compete in the market for IoT products. We believe our ThingWorx IoT platform is complementary to the offerings of many of our competitors and we have partnered with many of the named competitors. For enterprise CAD and PLM solutions, we compete with companies including Dassault Systèmes SA and Siemens AG; for discrete desktop CAD products, we compete with Autodesk, Siemens and Dassault Systèmes. For PLM solutions, we also compete with Oracle Corporation and SAP AG but we believe our products are more specifically targeted toward the business process challenges of manufacturing companies and offer broader and deeper functionality for those processes than ERP-based solutions.
Proprietary Rights
Our software products and related technical know-how, along with our trademarks, including our company names, product names and logos, are proprietary. We protect our intellectual property rights in these items by relying on copyrights, trademarks, patents and common law safeguards, including trade secret protection. The nature and extent of such legal protection depends in part on the type of intellectual property right and the relevant jurisdiction. In the U.S., we are generally able to maintain our trademark registrations for as long as the trademarks are in use and to maintain our patents for up to 20 years from the earliest effective filing date. We also use license management and other anti-piracy technology measures, as well as contractual restrictions, to curtail the unauthorized use and distribution of our products.
5
Our proprietary rights are subject to risks and uncertainties described under Item 1A. “Risk Factors” below. You should read that discussion, which is incorporated into this section by reference.
Deferred Revenue and Backlog (Unbilled Deferred Revenue)
Information about Deferred Revenue and Backlog (Unbilled Deferred Revenue) is discussed in Item 7. “Management’s Discussion and Analysis of Financial Condition and Results of Operations - Executive Overview” below. You should read that discussion, which is incorporated into this section by reference.
Employees
As of September 30, 2018, we had 6,110 employees, including 2,084 in product development; 1,676 in customer support, training, consulting, cloud services and product distribution; 1,642 in sales and marketing; and 708 in general and administration. Of these employees, 2,151 were located in the United States and 3,959 were located outside the United States.
Website Access to Reports and Code of Business Conduct and Ethics
We make available free of charge on our website at www.ptc.com the following reports as soon as reasonably practicable after electronically filing them with, or furnishing them to, the SEC: our Annual Reports on Form 10-K; our Quarterly Reports on Form 10-Q; our Current Reports on Form 8-K; and amendments to those reports filed or furnished pursuant to Sections 13(a) or 15(d) of the Securities Exchange Act of 1934. Our Proxy Statements for our Annual Meetings and Section 16 trading reports on SEC Forms 3, 4 and 5 also are available on our website. The reference to our website is not intended to incorporate information on our website into this Annual Report by reference.
Our Code of Ethics for Senior Executive Officers is embedded in our Code of Business Conduct and Ethics, which is also available on our website. Additional information about this code and amendments and waivers thereto can be found below in Part III, Item 10 of this Annual Report.
Executive Officers
Information about our executive officers is incorporated by reference from our 2019 Proxy Statement.
Corporate Information
PTC was incorporated in Massachusetts in 1985 and is headquartered in Needham, Massachusetts.
ITEM 1A. | Risk Factors |
The following are important factors we have identified that could affect our future results. You should consider them carefully when evaluating an investment in PTC securities or any forward-looking statements made by us, including those contained in this Annual Report, because these factors could cause actual results to differ materially from historical results or the performance projected in forward-looking statements. The risks described below are not the only risks we face. Additional risks and uncertainties not currently known to us or that we currently deem to be immaterial may also materially adversely affect our business, financial condition and/or operating results. Holders of the 6.00% Senior Notes due 2024 (the “2024 6% Notes”) that we issued in May 2016 should also consider the risk factors related to those notes described in the prospectus supplement we filed with the Securities and Exchange Commission on May 5, 2016, which are incorporated herein by reference.
I. Operational Considerations
Our operating results fluctuate from quarter to quarter, making future operating results difficult to predict; failure to meet market expectations could cause the price of our securities to decline.
Our quarterly operating results historically have fluctuated and are likely to continue to fluctuate depending on a number of factors, including:
6
• | a high percentage of our orders historically have been generated in the third month of each fiscal quarter and any failure to receive, complete or process orders at the end of any quarter could cause us to fall short of our revenue and bookings targets; |
• | our adoption of Accounting Standards Update 2014-09, Revenue from Contracts with Customers: Topic 606 in 2019 will create significant quarterly revenue volatility; |
• | a significant percentage of our orders comes from transactions with large customers, which tend to have long lead times that are less predictable; |
• | our mix of license, subscription and service revenues can vary from quarter to quarter, creating variability in our financial results; |
• | one or more industries that we serve may have weak or negative growth; |
• | our operating expenses are largely fixed in the short term and are based on expected revenues, so any failure to achieve our revenue targets could cause us to miss our earnings targets as well; |
• | because a significant portion of our revenue and expenses are generated from outside the U.S., shifts in foreign currency exchange rates could adversely affect our reported results; and |
• | we may incur significant expenses in a quarter in connection with corporate development initiatives, restructuring efforts or the investigation, defense or settlement of legal actions that would increase our operating expenses and reduce our earnings for the quarter in which those expenses are incurred. |
Accordingly, our quarterly results are difficult to predict prior to the end of the quarter and we may be unable to confirm or adjust expectations with respect to our operating results for a particular quarter until that quarter has closed. Any failure to meet our quarterly revenue or earnings targets could adversely impact the market price of our securities.
We now offer our solutions as subscriptions, which has adversely affected, and may continue to adversely affect, our revenue and earnings in the transition period and make predicting our revenue and earnings more difficult.
We began offering most of our solutions under a subscription option in 2015, in addition to a perpetual license option. Under a subscription, customers pay a periodic fee for the right to use our software and receive support, or to use our cloud services and have us manage the application for a specified period. Through 2018, under a subscription, revenue is recognized ratably over the term of the subscription while under a perpetual license, revenue is generally recognized upon purchase. A significant number of our customers have elected to purchase our solutions as subscriptions rather than under perpetual licenses. As a result, our license revenues have declined. Our support revenue (which comprises a significant portion of our revenue) has also decreased due to support services being included in the subscription offering and to customers converting their support contracts into subscriptions. We discontinued sales of perpetual licenses for most of our products in the Americas and Western Europe as of January 1, 2018 and intend to discontinue sales of such perpetual licenses in all remaining geographic regions as of January 2019, which will likely accelerate these effects on our revenue. As described in Management’s Discussion and Analysis of Financial Condition and Results of Operations, Revenue Sources and Recognition, and in Note B. Summary of Significant Accounting Policies in the Notes to Consolidated Financial Statements, we adopted ASC 606 effective October 1, 2018, which will change how we account for revenue transactions and will affect the timing of our revenue period to period.
We may not be able to predict subscription renewal rates and their impact on our future revenue and operating results.
Although our subscription solutions are designed to increase the number of customers that purchase our solutions as subscriptions and create a recurring revenue stream that increases and is more predictable over time, our customers are not required to renew their subscriptions for our solutions and they may elect not to renew when or as we expect. Customer renewal rates may decline or fluctuate due to a number of factors, including offering pricing, competitive offerings, customer satisfaction, and reductions in customer spending levels or customer activity due to economic downturns, the adverse impact of import tariffs, or other market uncertainty. If our customers do not renew their subscriptions when or as we expect, or if they renew on less favorable terms, our revenues and earnings may decline.
7
Our long range financial targets are predicated on bookings and revenue growth and operating margin improvements that we may fail to achieve, which could reduce our expected earnings and cause us to fail to meet the expectations of analysts or investors and cause the price of our securities to decline.
We are projecting long-term bookings, revenue and earnings growth. Our projections are based on the expected growth potential in the IoT and AR markets, as well as more modest growth in our core CAD and PLM markets. We may not achieve the expected bookings and revenue growth if the markets we serve do not grow at expected rates, if customers do not purchase, renew, or expand subscriptions as we expect, if we are not able to deliver solutions desired by customers and potential customers, and/or if acquired businesses do not generate the revenue growth that we expect.
Our long-term operating margin improvement targets are predicated on operating leverage as long-range revenue increases and on improved operating efficiencies, particularly within our sales organization, and on service margin improvements. Services margins are significantly lower than license and support margins. Future projected improvements in our operating margin as a percent of revenue are based in part on our ability to improve services margins by reducing the amount of direct services that we perform through expansion of our service partner program and improving the profitability of services that we perform. If our services revenue increases as a percentage of total revenue and/or if we are unable to improve our services margins, our overall operating margin may not increase to the levels we expect or may decrease. Additionally, if we do not achieve lower sales and marketing expenses as a percentage of revenue through productivity initiatives, we may not achieve our operating margin targets. If operating margins do not improve, our earnings could be adversely affected and the price of our securities could decline.
Our significant investment in our IoT business may not generate the revenues we expect, which could adversely affect our business and financial results.
We have made significant investments in recent years in our IoT business, including acquisitions totaling approximately $550 million.
The Internet of Things is a relatively new market and there are a significant number of competitors in the market. If the market does not expand as rapidly as we or others expect or if customers adopt competitive solutions rather than our solutions, our IoT business may not generate the revenues we expect. Further, our customers and potential customers often begin the process of implementing IoT with a proof-of-concept evaluation, in some cases with multiple different technology vendors. Our success in this emerging market will depend on our ability to engage with customers to ensure that their investment moves beyond planning to broader deployment and yields value at their desired speed and expected costs.
Further, one market for our IoT business is as a platform provider to a broad ecosystem of application and solutions providers. This market relies on an extensive and differentiated partner ecosystem to enable us to access markets and customers beyond our traditional markets, customers and buyers. We may be unable to expand our partner ecosystem as we expect and developers may not adopt our IoT solutions as we expect, which would adversely affect our ability to realize revenue from our investments in this business.
We depend on sales within the discrete manufacturing sector and our business could be adversely affected if manufacturing activity does not grow or if it contracts or if manufacturers are adversely affected by other economic factors.
A large amount of our sales are to customers in the discrete manufacturing sector. If this economic sector does not grow, or if it contracts, our customers in this sector may, as they have in the past, reduce or defer purchases of our products and services, which adversely affects our business. Further, U.S. manufacturers have been adversely affected by tariffs recently imposed on certain imported goods, which could cause them to reduce their purchases of our software, which would adversely affect our revenue and earnings.
Changes in accounting principles and guidance, or their interpretation or implementation, may materially adversely affect our reported results of operations or financial position.
We prepare our consolidated financial statements in accordance with accounting principles generally accepted in the U.S. These principles are subject to interpretation by the U.S. Securities and Exchange Commission and various bodies formed to create and interpret appropriate accounting
8
principles and guidance. A change in these principles or guidance, or in their interpretations, may have a significant effect on our reported results, as well as our processes and related controls.
For example, in May 2014, the Financial Accounting Standards Board issued Accounting Standards Update 2014-09, Revenue from Contracts with Customers: Topic 606 (ASC 606). This new standard is both technical and complex. ASC 606 became effective for us on October 1, 2018. We are adopting ASC 606 using the modified retrospective transition method. The adoption of this new standard will have a material impact on our consolidated financial statements, including the way we account for arrangements involving our term-based subscription licenses, deferred revenue and sales commissions. In connection with the adoption of ASC 606, we are implementing new processes, systems and internal controls. Such changes and any difficulties implementing such changes could materially adversely affect our reported financial results, our ability to comply with regulatory reporting requirements, and the effectiveness of our internal controls over financial reporting.
For a discussion of the potential impact that the implementation of ASC 606 is expected to have on our consolidated financial statements and related disclosures, see Note B. Summary of Significant Accounting Policies in the Notes to Consolidated Financial Statements in this Annual Report on Form 10-K.
We face significant competition, which may reduce our profits and limit or reduce our market share.
The market for product development solutions and IoT solutions is rapidly changing and characterized by vigorous competition, both by entry of competitors with innovative technologies and by consolidation of companies with complementary products and technologies. This competition could result in price reductions for our products and services, reduced margins, loss of customers and loss of market share. Our primary competition comes from:
• | larger companies that offer competitive solutions; |
• | larger, more well-known enterprise software providers with less product overlap, but greater financial, technical, sales and marketing, and other resources; and |
• | other vendors of various competitive point solutions or IoT platforms. |
In addition, barriers to entry into certain segments of the software industry have declined and the ability of customers to adopt software solutions has increased with the ability to offer software in the cloud and the increasing prevalence of subscription license models and customer acceptance of both those models. Because of these and other factors, competitive conditions in the industry are likely to intensify in the future.
Increased competition could result in price reductions, reduced revenue and profit margin and loss of market share, any of which would likely harm our business.
A breach of security in our products or computer systems, or those of our third-party service providers, could compromise the integrity of our products, harm our reputation, create additional liability and adversely impact our financial results.
We have implemented and continue to implement measures intended to maintain the security and integrity of our products, source code and computer systems. The potential consequences of a security breach or system disruption (particularly through cyber-attack or cyber-intrusion, including by computer hackers, foreign governments and cyber terrorists) have increased in scope as the number, intensity and sophistication of attempted attacks and intrusions from around the world have increased. Despite efforts to create security barriers to such threats, it is impossible for us to eliminate this risk, and, in fact, we deal with security issues on a regular basis and have experienced security incidents from time to time. Accordingly, there is a risk that we might encounter a material event or issue and that such an event or issue may occur. In addition, we offer cloud services to our customers and some of our products are hosted by third-party service providers, which expose us to additional risks as those repositories of our customers’ proprietary data may be targeted by such hackers. A significant breach of the security and/or integrity of our products or systems, or those of our third-party service providers, could prevent our products from functioning properly, could enable access to sensitive, proprietary or confidential information, including that of our customers, or could disrupt our business operations or those of our customers. This could require us to incur significant costs of investigation, remediation, harm our reputation, cause customers to stop buying our products, and cause us to face lawsuits and potential liability, which could have a material adverse effect on our financial condition and results of operations.
9
We may be unable to hire or retain personnel with the technical skills necessary to further develop our software products, which could adversely affect our ability to compete.
Our success depends upon our ability to attract and retain highly skilled technical personnel to develop our products. Competition for such personnel in our industry is intense, especially for personnel with augmented and virtual reality and analytics expertise as there are comparatively fewer persons with those skills. If we are unable to attract and retain technical personnel with the requisite skills, our product development efforts could be delayed, which could adversely affect our ability to compete and thereby adversely affect our revenues and profitability.
Our sales and operations are globally dispersed, which exposes us to additional compliance risks, which could adversely affect our business and financial results.
We sell and deliver software and services, and maintain support operations, in a large number of countries whose laws and practices differ from one another and are subject to unexpected changes. Managing these geographically dispersed operations requires significant attention and resources to ensure compliance with laws of those countries and those of the U.S. governing our activities in non-U.S. countries.
Those laws include, but are not limited to, anti-corruption laws and regulations (including the U.S. Foreign Corrupt Practices Act (FCPA) and the U.K. Bribery Act 2010), data privacy laws and regulations (including the European Union's General Data Privacy Regulation), and trade and economic sanctions laws and regulations (including laws administered by the U.S. Department of the Treasury’s Office of Foreign Assets Control, the U.S. State Department, the U.S. Department of Commerce, the United Nations Security Council and other relevant sanctions authorities). The FCPA and UK Bribery Act prohibit us and business partners or agents acting on our behalf from offering or providing anything of value to persons considered to be foreign officials under those laws for the purposes of obtaining or retaining business. The UK Bribery Act also prohibits commercial bribery and accepting bribes. Our compliance risks with these laws are heightened due to the global nature of our business, our go-to-market approach for our IoT business that relies heavily on expanding our partner ecosystem, the fact that we operate in, and are expanding into, countries with a higher incidence of corruption and fraudulent business practices than others, the fact that we deal with governments and state-owned business enterprises, the employees and representatives of which may be considered foreign officials for purposes of the FCPA and the UK Bribery Act, and the fact global enforcement of anti-corruption laws, data privacy laws, and other laws has significantly increased.
Accordingly, while we strive to maintain a comprehensive compliance program, we cannot guarantee that an employee, agent or business partner will not act in violation of our policies or U.S. or other applicable laws or that we may inadvertently violate such laws. Investigations of alleged violations of those laws can be expensive and disruptive. Violations of such laws can lead to civil and/or criminal prosecutions, substantial fines and other sanctions, including the revocation of our rights to continue certain operations, and also cause business and reputation loss, which could adversely affect our financial results and/or stock price.
Our international businesses present economic and operating risks, which could adversely affect our business and financial results.
We expect that our international operations will continue to expand and to account for a significant portion of our total revenue. Because we transact business in various foreign currencies, the volatility of foreign exchange rates has had and may in the future have a material adverse effect on our revenue, expenses and operating results.
Other risks inherent in our international operations include, but are not limited to, the following:
• | difficulties in staffing and managing foreign sales and development operations; |
• | possible future limitations upon foreign-owned businesses; |
• | increased financial accounting and reporting burdens and complexities; |
• | inadequate local infrastructure; and |
• | greater difficulty in protecting our intellectual property. |
10
Our inability to maintain or develop our strategic and technology relationships could adversely affect our business.
We have many strategic and technology relationships with other companies with which we work to offer complementary solutions and services, that market and sell our solutions, and that provide technologies that we embed in our solutions. We may not realize the expected benefits from these relationships and such relationships may be terminated by the other party. If these companies fail to perform or if a company terminates or substantially alters the terms of the relationship, we could suffer delays in product development, reduced sales or other operational difficulties and our business, results of operations and financial condition could be materially adversely affected.
We may be unable to adequately protect our proprietary rights, which could adversely affect our business and our ability to compete effectively.
Our software products are proprietary. We protect our intellectual property rights in these items by relying on copyrights, trademarks, patents and common law safeguards, including trade secret protection, as well as restrictions on disclosures and transferability contained in our agreements with other parties. Despite these measures, the laws of all relevant jurisdictions may not afford adequate protection to our products and other intellectual property. In addition, we frequently encounter attempts by individuals and companies to pirate our software. If our measures to protect our intellectual property rights fail, others may be able to use those rights, which could reduce our competitiveness and revenues.
In addition, any legal action to protect our intellectual property rights that we may bring or be engaged in could be costly, may distract management from day-to-day operations and may lead to additional claims against us, and we may not succeed, all of which would materially adversely affect our operating results.
Intellectual property infringement claims could be asserted against us, which could be expensive to defend and could result in limitations on our use of the claimed intellectual property.
The software industry is characterized by frequent litigation regarding copyright, patent and other intellectual property rights, as well as improper disclosure of confidential or proprietary information. If a lawsuit of this type is filed, it could result in significant expense to us and divert the efforts of our technical and management personnel. We cannot be sure that we would prevail against any such asserted claims. If we did not prevail, we could be prevented from using the claimed intellectual property or be required to enter into royalty or licensing agreements, which might not be available on terms acceptable to us. In addition to possible claims with respect to our proprietary products, some of our products contain technology developed by and licensed from third parties and we may likewise be susceptible to infringement claims with respect to these third-party technologies.
Businesses we acquire may not generate the revenue and earnings we anticipate and may otherwise adversely affect our business.
We have acquired, and intend to continue to acquire, new businesses and technologies. If we fail to successfully integrate and manage the businesses and technologies we acquire, or if an acquisition does not further our business strategy as we expect, our operating results will be adversely affected.
Moreover, business combinations involve a number of risks and uncertainties that can adversely affect our operations and operating results, including:
• | difficulties managing an acquired company’s technologies or lines of business or entering new markets where we have limited or no prior experience or where competitors may have stronger market positions; |
• | unanticipated operating difficulties in connection with the acquired entities, including potential declines in revenue of the acquired entity; |
• | failure to achieve the expected return on our investments, which could adversely affect our business or operating results and impair the assets that we recorded as a part of an acquisition, including intangible assets and goodwill; |
• | diversion of management and employee attention; |
• | loss of key personnel; |
11
• | assumption of unanticipated legal or financial liabilities or other unidentified issues with the acquired business; |
• | potential incompatibility of business cultures; |
• | significant increases in our interest expense, leverage and debt service requirements if we incur additional debt to pay for an acquisition; and |
• | if we were to issue a significant amount of equity securities in connection with future acquisitions, existing stockholders would be diluted and earnings per share would likely decrease. |
Our financial condition could be adversely affected if significant errors or defects are found in our software.
Sophisticated software can sometimes contain errors, defects, security vulnerabilities or other performance problems. If such items are discovered in our products, we may need to expend significant financial, technical and management resources, or divert some of our development resources, in order to resolve or work around those items, and we may not be able to correct them in a timely manner or provide an adequate response to our customers.
Errors, defects, security vulnerabilities or other performance problems in our products could also cause us to lose revenue, lose customers and lose market share, and could subject us to liability. Such items could also damage our business reputation and cause us to lose new business opportunities.
We may have exposure to additional tax liabilities and our effective tax rate may increase or fluctuate, which could increase our income tax expense and reduce our net income.
As a multinational organization, we are subject to income taxes as well as non-income based taxes in the U.S. and in various foreign jurisdictions. Significant judgment is required in determining our worldwide income tax provision and other tax liabilities. In the ordinary course of a global business, there are many intercompany transactions and calculations where the ultimate tax determination is uncertain. Our tax returns are subject to review by various taxing authorities. Although we believe that our tax estimates are reasonable, the final determination of tax audits or tax disputes could be different from what is reflected in our historical income tax provisions and accruals.
Our effective tax rate can be adversely affected by several factors, many of which are outside of our control, including:
• | changes in tax laws, regulations, and interpretations in multiple jurisdictions in which we operate; |
• | assessments, and any related tax interest or penalties, by taxing authorities; |
• | changes in the relative proportions of revenues and income before taxes in the various jurisdictions in which we operate that have differing statutory tax rates; |
• | changes to the financial accounting rules for income taxes; |
• | unanticipated changes in tax rates; and |
• | changes to a valuation allowance on net deferred tax assets, if any. |
On September 7, 2017, we entered into a lease for a new worldwide headquarters in the Boston Seaport District, beginning in January 2019. Because our current headquarters lease will not expire until November 2022, we are seeking to exit our current headquarters lease or sublease that space, but have not yet done so. If we are unable to do so, or unable to do so for an amount at least equal to our rent obligations under the current headquarters lease, we will bear overlapping rent obligations for those premises and will be required to record a charge related to any rent shortfall, which could adversely affect our financial condition.
Under our current headquarters lease, we pay approximately $7.4 million in annual base rent plus operating expenses (together "rent obligations," an aggregate annual total of approximately $12.0 million). We will begin paying rent under our new headquarters lease on July 1, 2020. Our rent under the new lease when we begin paying rent will be an annual base rent amount of $11.3 million plus our pro rata portions of building operating expenses and real estate taxes (approximately 63% of such amounts, estimated to be approximately $7.1 million in 2020). The base rent will increase by $0.3 million
12
each year over the term of the lease. Accordingly, we will be required to pay rent for both locations from July 1, 2020 until November 30, 2022 unless we can successfully negotiate an exit to our current lease or sublease our current premises. We may be unable to negotiate a financially desirable termination of our current lease or to sublease our current premises for an amount at least equal to our rent obligations under the current lease, which would require us to bear the overlapping rent obligations and to record a charge related to such shortfall, and could adversely affect our cash flow and financial condition. A charge for such shortfall will be recorded in the earlier of the period that we cease using the existing space (which will likely occur in the second quarter of our fiscal 2019) or the period we exit the lease contract.
II. Other Considerations
Our substantial indebtedness could adversely affect our business, financial condition and results of operations, as well as our ability to meet our payment obligations under our debt.
We have a significant amount of indebtedness. As of November 15, 2018, our total debt outstanding was approximately $728 million, approximately $228 million of which was under our $700 million secured credit facility (which matures in September 2023) and $500 million of which was associated with the 6% Senior Notes issued May 2016, which mature in May 2024 and are unsecured (see Liquidity and Capital Resources-Outstanding Notes in Item 7. "Management's Discussion and Analysis of Financial Condition and Results of Operations" of this Annual Report). All amounts outstanding under the credit facility and the notes will be due and payable in full on their respective maturity dates. As of November 15, 2018, we had unused commitments under our credit facility of approximately $472 million. PTC Inc. (the parent company) and one of our foreign subsidiaries are eligible borrowers under the credit facility and certain other foreign subsidiaries may become borrowers under our credit facility in the future, subject to certain conditions.
Notwithstanding the limits contained in the credit agreement governing our credit facility and the indenture governing our 2024 6% Notes, we may be able to incur substantial additional debt from time to time to finance working capital, capital expenditures, investments or acquisitions, or for other purposes. If we do so, the risks related to our high level of debt could intensify. Specifically, our high level of debt could:
• | make it more difficult for us to satisfy our debt obligations and other ongoing business obligations, which may result in defaults; |
• | result in an event of default if we fail to comply with the financial and other covenants contained in the agreements governing our debt instruments, which could result in all of our debt becoming immediately due and payable or require us to negotiate an amendment to financial or other covenants that could cause us to incur additional fees and expenses; |
• | limit our ability to obtain additional financing to fund future working capital, capital expenditures, acquisitions or other general corporate requirements; |
• | reduce the availability of our cash flow to fund working capital, capital expenditures, acquisitions and other general corporate purposes and limit our ability to obtain additional financing for these purposes; |
• | increase our vulnerability to the impact of adverse economic and industry conditions; |
• | expose us to the risk of increased interest rates as certain of our borrowings, including borrowings under the credit facility, are at variable rates of interest; |
• | limit our flexibility in planning for, or reacting to, and increasing our vulnerability to, changes in our business, the industries in which we operate, and the overall economy; |
• | place us at a competitive disadvantage compared to other, less leveraged competitors; and |
• | increase our cost of borrowing. |
Any of the above-listed factors could have an adverse effect on our business, financial condition and results of operations and our ability to meet our payment obligations under our debt agreements.
We may not be able to generate sufficient cash to service all of our indebtedness and may be forced to take other actions to satisfy our obligations under our indebtedness, which may not be successful.
13
Our ability to make scheduled payments on or refinance our debt obligations depends on our financial condition and operating performance, which are subject to prevailing economic and competitive conditions and to certain financial, business, legislative, regulatory and other factors some of which are beyond our control. We may be unable to maintain a level of cash flows from operating activities sufficient to permit us to pay the principal, premium, if any, and interest on our indebtedness.
If our cash flows and capital resources are insufficient to fund our debt service obligations, we could face substantial liquidity problems and could be forced to reduce or delay investments and capital expenditures or to dispose of material assets or operations, seek additional debt or equity capital or restructure or refinance our indebtedness. We may not be able to effect any such alternative measures, if necessary, on commercially reasonable terms or at all and, even if successful, those alternative actions may not allow us to meet our scheduled debt service obligations. Our debt agreements restrict our ability to dispose of assets and use the proceeds from those dispositions and may also restrict our ability to raise debt or equity capital to be used to repay other indebtedness when it becomes due. We may not be able to consummate those dispositions or to obtain proceeds in an amount sufficient to meet any debt service obligations then due.
Our inability to generate sufficient cash flows to satisfy our debt obligations, or to refinance our indebtedness on commercially reasonable terms or at all, would materially and adversely affect our financial position and results of operations and our ability to satisfy our debt obligations.
If we cannot make scheduled payments on our debt, we will be in default and the lenders under our credit facility could terminate their commitments to loan money, the lenders could foreclose against the assets securing their borrowings, the holders of our 2024 6% Notes could declare all outstanding principal, premium, if any, and interest to be due and payable, and we could be forced into bankruptcy or liquidation. All of these events could result in a loss of your investment.
We are required to comply with certain financial and operating covenants under our debt agreements. Any failure to comply with those covenants could cause amounts borrowed to become immediately due and payable and/or prevent us from borrowing under the credit facility.
We are required to comply with specified financial and operating covenants under our debt agreements and to make payments under our debt, which limit our ability to operate our business as we otherwise might operate it. Our failure to comply with any of these covenants or to meet any debt payment obligations could result in an event of default which, if not cured or waived, would result in any amounts outstanding, including any accrued interest and/or unpaid fees, becoming immediately due and payable. We might not have sufficient working capital or liquidity to satisfy any repayment obligations in the event of an acceleration of those obligations. In addition, if we are not in compliance with the financial and operating covenants under the credit facility at the time we wish to borrow funds, we will be unable to borrow funds.
In addition, the financial and operating covenants under the credit facility may limit our ability to borrow funds, including for strategic acquisitions and share repurchases.
We may be unable to meet our goal of returning 40% of free cash flow to shareholders through share repurchases, which could decrease your expected return on investment in PTC stock.
Our capital allocation strategy includes a long-term goal of returning approximately 40% of free cash flow (cash flow from operations less capital expenditures) to shareholders through share repurchases. Meeting this goal requires us to generate consistent free cash flow and have available capital in the years ahead in an amount sufficient to enable us to continue investing in organic and inorganic growth as well as to return a significant portion of the cash generated to stockholders in the form of share repurchases. We may not meet this goal if we do not generate the free cash flow we expect, if we use our available cash to satisfy other priorities, if we have insufficient funds available to make such repurchases, or if we are unable to borrow funds under our credit facility to make such repurchases.
Additionally, our cash flow fluctuates over the course of the year and over multiple years, so, although our goal is to return 40% of free cash flow to shareholders, that is an average over a longer term and the number of shares repurchased and amount of free cash flow returned in any given period will vary and may be more or less than 40% in any such period. Finally, the number of shares repurchased for a given amount of cash will vary based on PTC’s stock price, so the number of shares repurchased will not be a consistent or predictable number or percentage of outstanding stock.
14
Our stock price has been volatile, which may make it harder to resell shares at a favorable time and price.
Market prices for securities of software companies are generally volatile and are subject to significant fluctuations that may be unrelated or disproportionate to the operating performance of these companies. The trading prices and valuations of these stocks, and of ours, may not be predictable. Negative changes in the public’s perception of the prospects of software companies, or of PTC or the markets we serve, could depress our stock price regardless of our operating results.
Also, a large percentage of our common stock is held by institutional investors and by Rockwell Automation. Purchases and sales of our common stock by these investors could have a significant impact on the market price of the stock. For more information about those investors, please see our proxy statement with respect to our most recent annual meeting of stockholders and Schedules 13D and 13G filed with the SEC with respect to our common stock.
Our 2024 6% Notes are not listed on any national securities exchange or included in any automated quotation system, which could make it harder to resell the notes at a favorable time and price.
Our 2024 6% Notes are not listed on any national securities exchange or included in any automated quotation system. As a result, an active market for the notes may not exist or be maintained, which would adversely affect the market price and liquidity of the notes. In that case, holders may not be able to sell their notes at a particular time or at a favorable price.
The market for non-investment grade debt historically has been subject to severe disruptions that have caused substantial volatility in the prices of securities similar to the notes. The market, if any, for the notes may experience similar disruptions and any such disruptions may adversely affect the liquidity in that market or the prices at which the notes may be sold.
ITEM 1B. | Unresolved Staff Comments |
None.
ITEM 2. | Properties |
We currently have 76 primary office locations used in operations in the United States and internationally, predominately as sales and/or support offices and for research and development work. Of our total of approximately 1,698,000 square feet of leased facilities used in operations, approximately 837,000 square feet are located in the U.S., including 321,000 square feet at our headquarters facility located in Needham, Massachusetts, and approximately 297,000 square feet are located in India, where a significant amount of our research and development is conducted. In addition, we entered into a new lease in September 2017 for 250,000 square feet in the Boston Seaport District. We expect to relocate our headquarters to this location in the second quarter of 2019. We believe that our facilities are adequate for our present and foreseeable needs.
ITEM 3. | Legal Proceedings |
None.
ITEM 4. | Mine Safety Disclosures |
Not applicable.
PART II
ITEM 5. | Market for Registrant’s Common Equity, Related Stockholder Matters and Issuer Purchases of Equity Securities |
Our common stock is traded on the Nasdaq Global Select Market under the symbol "PTC."
On September 30, 2018, the close of our fiscal year, and on November 13, 2018, our common stock was held by 1,138 and 1,137 shareholders of record, respectively.
15
The table below shows the shares of our common stock we repurchased in the fourth quarter of 2018.
Period (1) | Total Number of Shares (or Units) Purchased | Average Price Paid per Share (or Unit) | Total Number of Shares (or Units) Purchased as Part of Publicly Announced Plans or Programs | Approximate Dollar Value of Shares (or Units) that May Yet Be Purchased Under the Plans or Programs | ||||
July 1, 2018 - July 28, 2018 | 8,244,873 | $97.03 | 8,244,873 | $400,000,000 (2)(3) | ||||
July 29, 2018 - August 25, 2018 | — | $— | — | $400,000,000 (2)(3) | ||||
August 26, 2018 - September 30, 2018 | — | $— | — | $400,000,000 (2)(3) | ||||
Total | 8,244,873 | $97.03 | 8,244,873 | $400,000,000 (2)(3) | ||||
(2) Our Board of Directors has authorized us to repurchase up to $1,500 million of our common stock for the period October 1, 2017 through September 30, 2020, which program we initially announced on September 19, 2017 and expanded in July 2018.
(3) In July 2018, we made a payment of $1,000 million to repurchase shares pursuant to an accelerated share repurchase agreement (ASR) with a major financial institution (Bank). Of that amount, 8,244,873 shares valued at $800 million were repurchased in July 2018, with the remaining $200 million held back by the Bank pending final settlement of the ASR.
ITEM 6. Selected Financial Data
Our five-year summary of selected financial data and quarterly financial data for the past two years is located on pages A-1 and A-2 at the end of this Form 10-K and incorporated herein by reference.
ITEM 7. | Management’s Discussion and Analysis of Financial Condition and Results of Operations |
Forward-Looking Statements
Statements in this Annual Report about anticipated financial results and growth, as well as about the development of our products and markets, are forward-looking statements that are based on our current plans and assumptions. Important information about the bases for these plans and assumptions and factors that may cause our actual results to differ materially from these statements is contained below and in Item 1A. “Risk Factors” of this Annual Report.
Unless otherwise indicated, all references to a year reflect our fiscal year that ends on September 30.
Operating and Non-GAAP Financial Measures
Our discussion of results includes discussion of our operating measures (including “license and subscription bookings” and other subscription-related measures) and non-GAAP financial measures. Our operating measures and non-GAAP financial measures, including the reasons we use those measures, are described below in Results of Operations - Operating Measures and Results of Operations - Non-GAAP Financial Measures, respectively. You should read those sections to understand those operating and non-GAAP financial measures.
Revenue Sources and Recognition
We sell subscription and perpetual licenses to our software, support for perpetual licenses, cloud services and professional services.
Subscription revenue is comprised of time-based licenses whereby customers use our software and receive related support for a specified term, and for which through 2018 revenue is recognized ratably over the term of the contract. Perpetual licenses are a perpetual right to use the software, for which revenue is generally recognized up front upon shipment to the customer. Support revenue is comprised
16
of contracts to maintain new and/or previously purchased perpetual licenses, for which revenue is recognized ratably over the term of the contract. Our subscription revenue includes an immaterial amount of Software as a Service (SaaS) and cloud services for which revenue is generally recognized ratably over the term of the contract. Consulting and training professional services engagements typically result from sales of new licenses, and for which revenue is recognized over the term of the engagement. Our revenue recognition practices are described below in “Critical Accounting Policies and Estimates” and in Note B. Summary of Significant Accounting Policies in the Notes to Consolidated Financial Statements in this Annual Report.
Beginning with 2019, we will recognize revenue under the Accounting Standards Update No. 2014-09, Revenue from Contracts with Customers: Topic 606 (ASC 606) revenue recognition standard, which differs significantly from the previous accounting rules. Under ASC 606, all performance obligations under the product that can be separately identified are, and revenue is recognized for each performance obligation. Accordingly, our on-premise subscription contracts will be unbundled into multiple performance obligations (i.e., license, cloud and support). The license portion of such subscription contracts (approximately 50% to 55%) will be recognized upfront and the cloud and support portions (approximately 45% to 50%) of such subscription contracts will be recognized ratably over the term. The effects of our adoption of ASC 606, including expected adjustments to retained earnings related to billed and unbilled deferred revenue, are described below in “Recent Accounting Pronouncements” and in Note B. Summary of Significant Accounting Policies in the Notes to Consolidated Financial Statements in this Annual Report.
Executive Overview
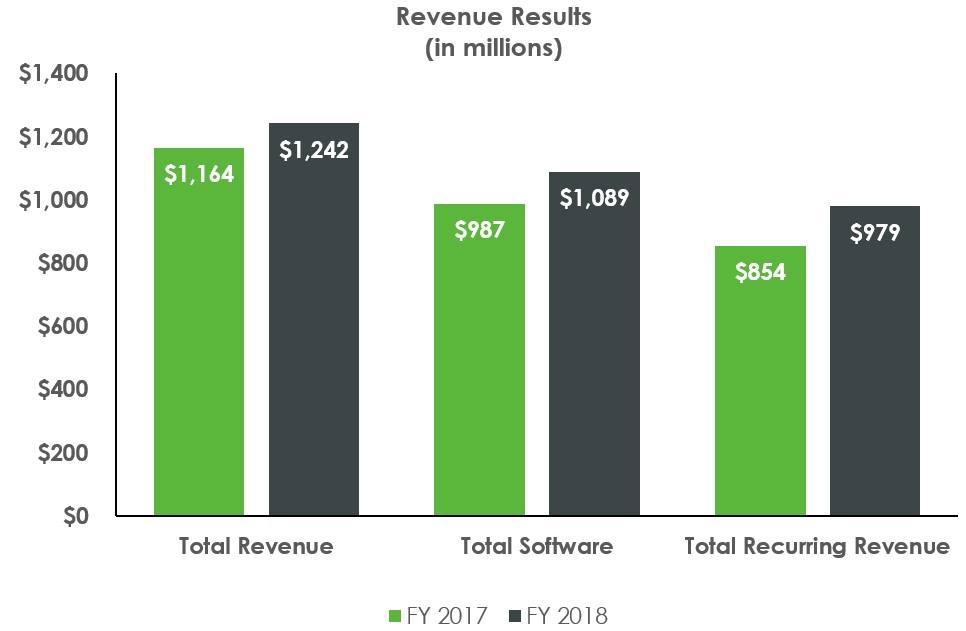
Our revenue results for the year reflect the adoption of subscription licensing by our customers and the compounding effect of the subscription business model as subscription revenue recurs and new subscription revenue is added in the year. Subscription revenue, software revenue and total revenue were all up over fiscal 2017, despite an 800 basis point increase in subscription mix year over year. Recurring software revenue represented approximately 90% of our software revenue in 2018, up from 86% a year ago. Our revenue results also drove our operating margin improvements for the year. Despite increases in sales and marketing and research and development expenses, operating margins and EPS were up over the prior year.
Our CAD and PLM businesses performed well in the year, our IoT business continued to grow as we added new customers and existing customers expanded their implementations, and interest in our augmented reality solutions increased. We made important strides in extending our market reach and further differentiating our technology with strategic relationships we entered into in 2018, including those with Rockwell Automation, Microsoft and ANSYS.
17
Constant Currency Change | |||||||||||||||
Year Ended September 30, | |||||||||||||||
Revenue | 2018 | 2017 | Change | ||||||||||||
(in millions) | |||||||||||||||
Subscription | $ | 482.0 | $ | 279.2 | 73 | % | 69 | % | |||||||
Support | 496.8 | 574.7 | (14 | )% | (16 | )% | |||||||||
Total recurring revenue | 978.9 | 853.9 | 15 | % | 12 | % | |||||||||
Perpetual license | 109.6 | 133.4 | (18 | )% | (20 | )% | |||||||||
Total subscription, support and license revenue | 1,088.5 | 987.3 | 10 | % | 8 | % | |||||||||
Professional services | 153.3 | 176.7 | (13 | )% | (16 | )% | |||||||||
Total revenue | $ | 1,241.8 | $ | 1,164.0 | 7 | % | 4 | % | |||||||
The increase in total revenue, subscription revenue and EPS reflects our transformation into a subscription software company. As our mix of subscription sales relative to perpetual license sales has increased, perpetual license revenue and support revenue have declined.
Our 2018 revenue results include the impact of a settlement of a customer dispute concerning a professional services receivable. The settlement, reached in September 2018, included partial payment of the receivable and new software purchases. The net revenue write-down recorded in the fourth quarter of 2018 was $9.3 million, comprised of a $14.5 million services revenue write-down, partially offset by subscription revenue of $5.2 million. Additionally, professional services revenue has declined in accordance with our strategy to migrate more services engagements to our partners and to deliver products that require less consulting and training services.
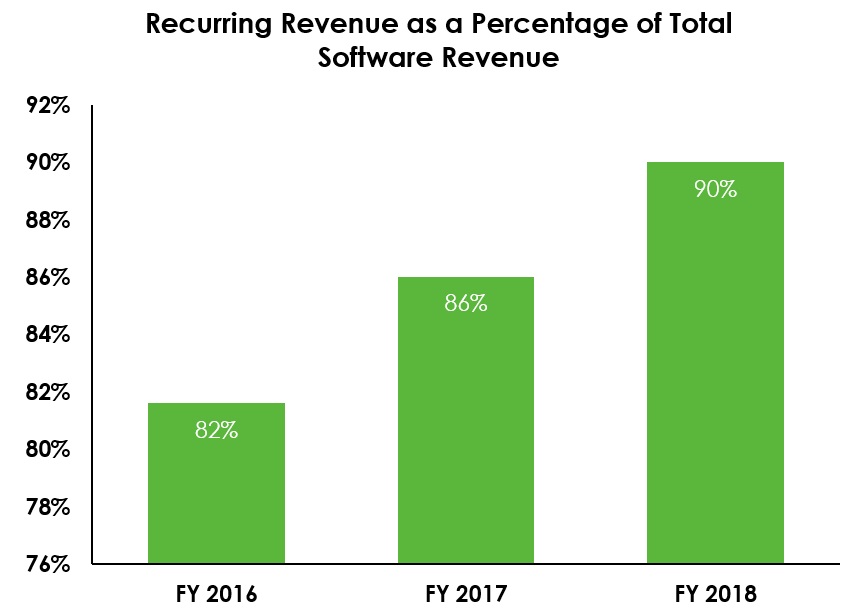
The increase in subscription revenue relative to perpetual license revenue has resulted in an increase in our recurring software revenue, with approximately 90% of our software revenue and 79% of our total revenue in 2018 from recurring software revenue streams, compared to 86% and 73% in 2017 and 82% and 68% in 2016.
18
Year Ended September 30, | ||||||||||||
Earnings Measures | 2018 | 2017 | Change | |||||||||
Operating Margin | 5.9 | % | 3.5 | % | 68 | % | ||||||
Earnings Per Share | $ | 0.44 | $ | 0.05 | 780 | % | ||||||
Non-GAAP Operating Margin(1) | 18.4 | % | 16.1 | % | 14 | % | ||||||
Non-GAAP EPS(1) | $ | 1.45 | $ | 1.17 | 24 | % | ||||||
(1) Non-GAAP measures are reconciled to GAAP results under Results of Operations - Non-GAAP Measures below. | ||||||||||||
GAAP and non-GAAP operating income in 2018 reflect maturity of our subscription program. An increase in gross margin is associated with higher subscription revenue and a lower mix of professional services revenue, which has lower margins than our software revenue. The increase in gross margins was partially offset by higher sales and marketing and research and development costs.
Our GAAP and non-GAAP earnings reflect a combination of revenue growth due to the strength of our subscription model and strong new bookings, as well as continued cost and expense discipline.
We ended 2018 with cash, cash equivalents and marketable securities of $316 million, down from $330 million at the end of 2017. We generated $248 million of cash from operations in 2018 compared to $135 million in 2017. In the fourth quarter of 2018, Rockwell Automation made a $1 billion equity investment in PTC as part of a strategic partnership. Using the cash proceeds from this investment, PTC entered into a $1,000 million accelerated share repurchase. We also used cash from operations to repurchase another $100 million of common stock and to repay a net $70 million of borrowings under our credit facility in 2018. At September 30, 2018, the balance outstanding under our credit facility was $148 million and total debt outstanding was $648 million.
Operating Measures
We provide these measures to help investors understand the progress of our subscription transition. These measures are not necessarily indicative of revenue for the period or any future period.
License and Subscription Bookings
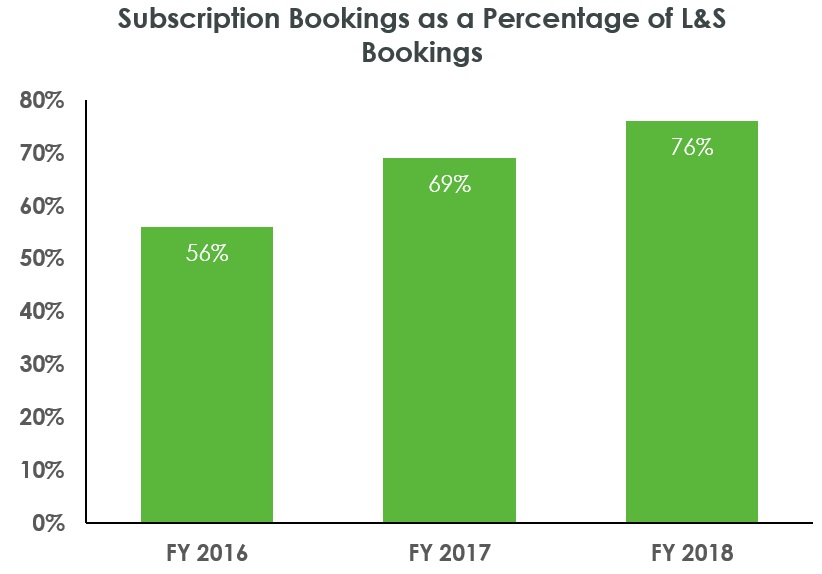
License and subscription bookings for 2018 were $466 million, up 11% over 2017 (up 9% on a constant currency basis) and up 16% over 2016. Over the past two years, CAD, core PLM and IoT have delivered bookings CAGRs at the high end of market growth rates, as CAD and PLM customers have converted existing license contracts to subscriptions and customers have adopted and expanded IoT implementations.
Subscription ACV
Subscription ACV increased 24% over 2017 to $177 million due to continued adoption of our subscription offerings around the globe.
19
Annualized Recurring Revenue (ARR)
ARR was approximately $1,012 million as of the fourth quarter of 2018, an increase of 12% compared to the fourth quarter of 2017 and the seventh consecutive quarter of double-digit year-over-year growth.
Deferred Revenue and Backlog (Unbilled Deferred Revenue)
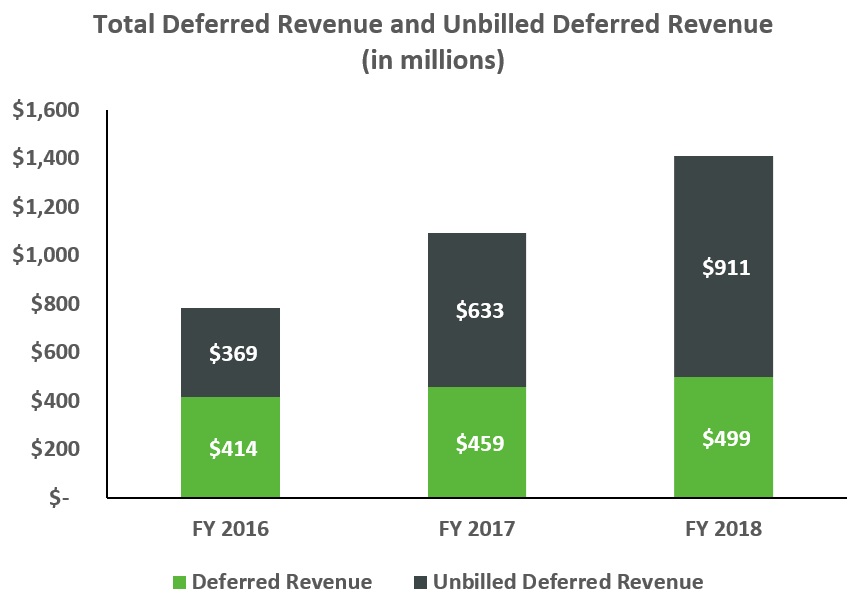
Deferred revenue primarily relates to software agreements invoiced to customers for which the revenue has not yet been recognized. Unbilled deferred revenue (backlog) is the aggregate of booked orders for license, support and subscription (including multi-year subscription contracts with start dates after October 1, 2018 that are subject to a limited annual cancellation right, of which approximately $50 million was cancellable at September 30, 2018) for which the associated revenue has not been recognized and the customer has not yet been invoiced. We do not record unbilled deferred revenue on our Consolidated Balance Sheets; such amounts are recorded as Deferred Revenue when we invoice the customer. We provide this view of Deferred Revenue and Backlog to enable investors to understand the significant contractual commitments we have to customers, and to provide a view of future revenue that we expect will be recognized, even if those commitments are not reflected on our balance sheet.
September 30, | |||||||||||
2018 | 2017 | 2016 | |||||||||
(Dollar amounts in millions) | |||||||||||
Deferred revenue | $ | 499 | $ | 459 | $ | 414 | |||||
Unbilled deferred revenue | 911 | 633 | 369 | ||||||||
Total | $ | 1,410 | $ | 1,092 | $ | 783 | |||||
Of the unbilled deferred revenue balance at September 30, 2018, we expect to invoice customers approximately $560 million within the next twelve months. Unbilled deferred revenue grew 44% year over year due to the high volume of new subscription bookings. Many of our subscription bookings are for multiple years and are typically billed annually at the start of each annual subscription period. The average contract duration was approximately 2 years for new subscription contracts in 2018 and 2017.
We expect that the amount of deferred revenue and unbilled deferred revenue will fluctuate from quarter to quarter due to the specific timing, duration and size of customer subscription and support agreements, varying billing cycles of such agreements, the specific timing of customer renewals, foreign currency fluctuations, the timing of when deferred revenue is recognized as revenue and the timing of our fiscal quarter ends.
20
The effects of our adoption of ASC 606, including expected adjustments to retained earnings related to billed and unbilled deferred revenue, are described below in “Recent Accounting Pronouncements” and in Note B. Summary of Significant Accounting Policies in the Notes to Consolidated Financial Statements.
Future Expectations, Strategies and Risks
Our transition to a subscription model has been a headwind for revenue and earnings in 2018 with an increase in our subscription mix of 800 basis points as compared to fiscal 2017. We expect a further increase in our subscription mix of 1100 to 1300 basis points, which will result in a further headwind for revenue and earnings in fiscal 2019. We expect the effect of the transition to moderate in fiscal 2020. A higher mix of subscription bookings is expected to benefit us over the long term, but results in lower revenue and lower earnings in the near term. We expect that IoT and AR adoption rates will continue to expand and will be the most significant driver to growth.
With the growth opportunity in Industrial Internet of Things and Augmented Reality, and other strategic initiatives we’ve undertaken, as well as our continued commitment to operating margin improvement, we are realigning our workforce in the beginning of 2019 to shift investment to support these strategic, high growth opportunities. This realignment will result in a restructuring charge of approximately $18 million in 2019, which consists principally of termination benefits, substantially all of which we expect will be paid in 2019. As this is a realignment of resources rather than a cost-savings initiative, we don’t expect this realignment will result in significant cost savings, and the effect of the realignment is reflected in our 2019 guidance.
In 2019, we will be moving into a new worldwide headquarters in the Boston Seaport District and we will be vacating our current headquarters space. Because our current headquarters lease will not expire until November 2022, we are seeking to sublease that space, but have not yet done so. If we are unable to sublease our current headquarters space for an amount at least equal to our rent obligations under the current headquarters lease, we will bear overlapping rent obligations for those premises and will be required to record a charge related to such rent shortfall. We currently pay approximately $12 million in annual base rent and operating expenses for our current headquarters. We expect to record a charge for any such shortfall in the earlier of the period that we cease using the space (which will likely occur in the second quarter of our fiscal 2019) or the period we sign sublease contracts. Additionally, we will incur other costs associated with the move which will be recorded as incurred.
We are adopting the new revenue recognition standard, ASC 606, effective October 1, 2018. ASC 606 will, among other things, materially impact the timing of our revenue recognition. Refer to Note B. Summary of Significant Accounting Policies in the Notes to Consolidated Financial Statements in this Form 10-K for additional information about the impact of adopting this guidance.
Our results have been impacted, and we expect will continue to be impacted, by our ability to close large transactions. The amount of bookings and revenue, particularly license and subscriptions, attributable to large transactions, and the number of such transactions, may vary significantly from quarter to quarter based on customer purchasing decisions and macroeconomic conditions. Such transactions may have long lead times as they often follow a lengthy product selection and evaluation process and, for existing customers, are influenced by contract expiration cycles. This may cause volatility in our results.
21
As we move into 2019, our three overriding goals continue to be:
 | Sustainable Growth | Our goals are predicated on continuing to drive bookings growth both in the high-growth IoT market and in our core CAD and PLM markets. |
 | Expand Subscription Licensing | Our goal is to increase the percentage of licenses sold as subscriptions to increase our recurring revenue. Effective January 1, 2018, new software licenses for our core solutions and ThingWorx solutions were available only by subscription in the Americas and Western Europe, and, effective January 1, 2019, new software licenses for those solutions will be available only by subscription worldwide. Kepware will continue to be available under perpetual licensing. |
 | Cost Controls and Margin Expansion | Our goal is to drive continued margin expansion over the long term. We continue to proactively manage our cost structure and invest in what we believe are high return opportunities in our business. We expect to deliver continued operating margin expansion in 2019 and beyond, as we realize the compounding benefit of our maturing subscription business. |
22
Results of Operations
The following table shows the financial measures that we consider the most significant indicators of the performance of our business. In addition to providing operating income, operating margin, and diluted earnings per share as calculated under generally accepted accounting principles (“GAAP”), it shows non-GAAP operating income, non-GAAP operating margin, and non-GAAP diluted earnings per share for the reported periods. These non-GAAP financial measures exclude the effect of a professional services revenue write-down and subscription revenue associated with the settlement of a previously disclosed disputed customer receivable, fair value adjustments related to acquired deferred revenue, acquired deferred costs, stock-based compensation expense, amortization of acquired intangible assets expense, acquisition-related and pension plan termination costs, restructuring charges, certain identified gains or charges included in non-operating other income (expense) and the related tax effects of the preceding items, as well as the tax items identified. These non-GAAP financial measures provide investors another view of our operating results that is aligned with management budgets and with performance criteria in our incentive compensation plans. Management uses, and investors should use, non-GAAP financial measures only in conjunction with our GAAP results.
Year ended September 30, | |||||||||||||||||||||||
2018 | 2017 | Percent change 2017 to 2018 | 2016 | Percent change 2016 to 2017 | |||||||||||||||||||
Actual | Constant Currency | Actual | Constant Currency | ||||||||||||||||||||
(Dollar amounts in millions, except per share data) | |||||||||||||||||||||||
Subscription | $ | 482.0 | $ | 279.2 | 73 | % | 69 | % | $ | 118.3 | 136 | % | 135 | % | |||||||||
Support | 496.8 | 574.7 | (14 | )% | (16 | )% | 651.8 | (12 | )% | (12 | )% | ||||||||||||
Total recurring revenue | 978.9 | 853.9 | 15 | % | 12 | % | 770.1 | 11 | % | 11 | % | ||||||||||||
Perpetual license | 109.6 | 133.4 | (18 | )% | (20 | )% | 173.5 | (23 | )% | (23 | )% | ||||||||||||
Total subscription, support and license revenue | 1,088.5 | 987.3 | 10 | % | 8 | % | 943.6 | 5 | % | 5 | % | ||||||||||||
Professional services | 153.3 | 176.7 | (13 | )% | (16 | )% | 196.9 | (10 | )% | (11 | )% | ||||||||||||
Total revenue | 1,241.8 | 1,164.0 | 7 | % | 4 | % | 1,140.5 | 2 | % | 2 | % | ||||||||||||
Total cost of revenue | 326.2 | 329.0 | (1 | )% | 325.7 | 1 | % | ||||||||||||||||
Gross margin | 915.6 | 835.0 | 10 | % | 814.9 | 2 | % | ||||||||||||||||
Operating expenses | 842.4 | 794.1 | 6 | % | 851.9 | (7 | )% | ||||||||||||||||
Total costs and expenses | 1,168.6 | 1,123.1 | 4 | % | 2 | % | 1,177.5 | (5 | )% | (4 | )% | ||||||||||||
Operating income (loss) | $ | 73.2 | $ | 40.9 | 79 | % | 57 | % | $ | (37.0 | ) | 211 | % | 214 | % | ||||||||
Non-GAAP operating income (1) | $ | 230.0 | $ | 188.4 | 22 | % | 16 | % | $ | 172.7 | 9 | % | 7 | % | |||||||||
Operating margin | 5.9 | % | 3.5 | % | (3.2 | )% | |||||||||||||||||
Non-GAAP operating margin (1) | 18.4 | % | 16.1 | % | 15.1 | % | |||||||||||||||||
Diluted earnings (loss) per share (2) | $ | 0.44 | $ | 0.05 | $ | (0.48 | ) | ||||||||||||||||
Non-GAAP diluted earnings per share (2) | $ | 1.45 | $ | 1.17 | $ | 1.19 | |||||||||||||||||
Cash flow from operations (3) | $ | 247.8 | $ | 135.2 | $ | 183.3 | |||||||||||||||||
(1) | See Non-GAAP Financial Measures below for a reconciliation of our GAAP results to our non-GAAP measures. |
(2) | We have a full valuation allowance against our U.S. net deferred tax assets and a valuation allowance against net deferred tax assets in certain foreign jurisdictions. As we are profitable on a non-GAAP basis, the 2018 and 2017 non-GAAP tax provisions are calculated assuming there is no valuation allowance. Income tax adjustments reflect the tax effects of non-GAAP adjustments which are calculated by applying the applicable tax rate by jurisdiction to the non-GAAP adjustments listed above. We recorded the impact of the Tax Cuts and Jobs Act in our 2018 GAAP earnings, resulting in a non-cash benefit of approximately $12 million. We have excluded this benefit from our non-GAAP results. |
23
(3) | Cash flow from operations for 2018 includes $3 million of restructuring payments. Cash flow from operations for 2017 includes $37 million of restructuring payments, a $12 million payment related to a Korea tax audit and $3 million of legal settlement payments. Cash flow from operations for 2016 includes $55 million of restructuring payments and a $28 million payment of a legal accrual recorded in 2015 related to the settlement of an investigation in China. |
Impact of Foreign Currency Exchange on Results of Operations
Approximately two thirds of our revenue and half of our expenses are transacted in currencies other than the U.S. dollar. Currency translation affects our reported results, which are in U.S. Dollars. If actual reported results were converted into U.S. dollars based on the corresponding prior year’s foreign currency exchange rates, 2018 and 2017 revenue would have been lower by $32 million and higher by $1 million, respectively, and expenses would have been lower by $20 million and higher by $3 million, respectively. The net impact on year-over-year results would have been a decrease in operating income of $12 million in 2018 and a decrease in operating income of $2 million in 2017. The results of operations, revenue by line of business and revenue by geographic region in the tables that follow present both actual percentage changes year over year and percentage changes on a constant currency basis.
Revenue
Revenue is reported below by line of business (subscription, support, perpetual license and professional services), by product area (Solutions and IoT) and by geographic region (Americas, Europe, Asia Pacific). Results include combined revenue from direct sales and our channel.
Revenue by Line of Business
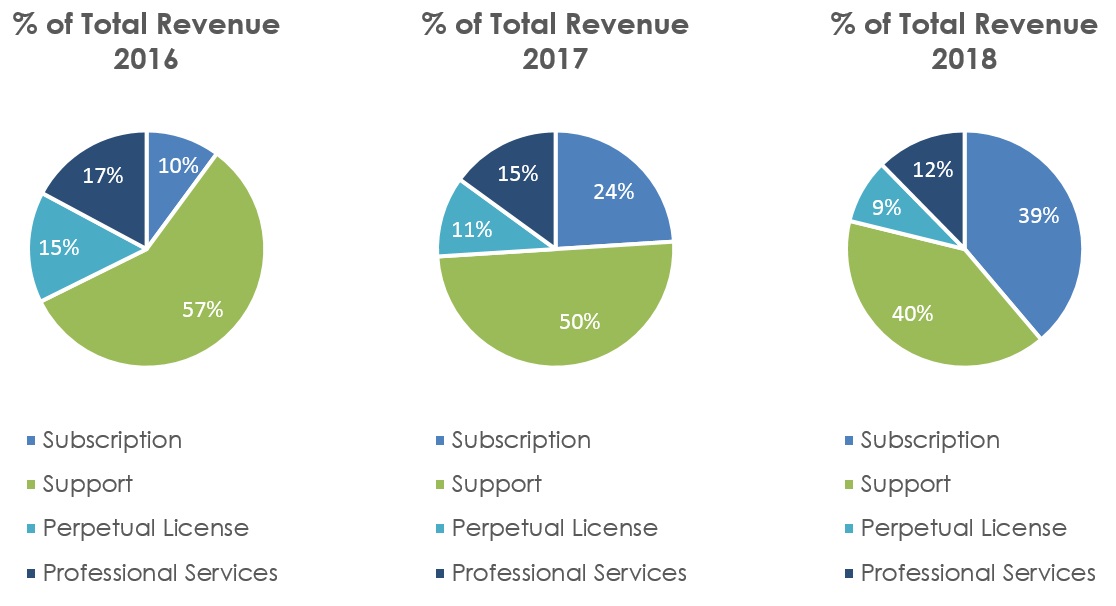
Software
As our mix of subscription sales relative to perpetual license sales has increased, perpetual license revenue and support revenue have declined and are expected to continue to decline as customers purchase our solutions as subscriptions and convert existing perpetual licenses with support contracts to subscriptions. As our subscription business matures, recurring software revenue growth is expected to continue due to the compounding benefit of a subscription business model.
Professional Services
Professional services revenue was down 13% (16% constant currency) in 2018 compared to 2017. Professional services revenue in 2018 reflects a $14.5 million write-down related to a settlement of a customer dispute concerning a receivable. These results are in line with our expectation that professional services revenue will trend flat-to-down over time due to our strategy to expand margins by migrating
24
more services engagements to our partners and delivering products that require less consulting and training services.
Revenue by Product
Year ended September 30, | |||||||||||||||||||||||
Percent Change | Percent Change | ||||||||||||||||||||||
2018 | Actual | Constant Currency | 2017 | Actual | Constant Currency | 2016 | |||||||||||||||||
(Dollar amounts in millions) | |||||||||||||||||||||||
Solutions Products | |||||||||||||||||||||||
Software revenue | $ | 964.6 | 8 | % | 5 | % | $ | 893.7 | 3 | % | 3 | % | $ | 871.2 | |||||||||
Professional services | 137.9 | (17 | )% | (20 | )% | 167.1 | (12 | )% | (12 | )% | 189.0 | ||||||||||||
Total revenue | $ | 1,102.5 | 4 | % | 1 | % | $ | 1,060.7 | — | % | — | % | $ | 1,060.2 | |||||||||
IoT Products | |||||||||||||||||||||||
Software revenue | $ | 123.9 | 32 | % | 31 | % | $ | 93.7 | 29 | % | 29 | % | $ | 72.4 | |||||||||
Professional services | 15.4 | 60 | % | 57 | % | 9.6 | 22 | % | 21 | % | 7.9 | ||||||||||||
Total revenue | $ | 139.3 | 35 | % | 33 | % | $ | 103.3 | 28 | % | 28 | % | $ | 80.3 | |||||||||
Solutions
Software revenue grew 8% in 2018 compared to 2017 as a result of strong CAD, PLM and global channel license and subscription bookings over the past several years, offset by a significant increase in the subscription mix in the current period. Subscription sales have increased in part due to our support conversion programs that we have been offering over the past few years whereby customers may convert existing perpetual licenses and support to a new subscription. Recurring software revenue grew 12% in 2018 over 2017, and has grown double-digits for seven consecutive quarters. As our transition matures, recurring software revenue growth is expected to continue due to the compounding benefit of a subscription business model.
Professional services revenue in 2018 includes a $14.5 million write-down related to a settlement of a previously disclosed customer dispute concerning a receivable. In addition, professional services revenue in 2018 declined compared to 2017 due to our strategy to limit the amount of professional services we provide.
IoT
Software revenue in 2018 increased by 32% compared to 2017 due to increases in license and subscription bookings over the past several years, offset by an 800 basis points increase in the subscription mix. Recurring software revenue grew 42% in 2018 over 2017 due to strong IoT bookings growth over the past several years. Software revenue includes $5.2 million of new subscription revenue related to the settlement of a customer dispute concerning a professional services receivable, which settlement included new subscription purchases.
Professional services revenue increased in 2018 compared to 2017 in part due to implementation and adoption services we provide to our IoT customers as part of our efforts to help their IoT initiatives be successful.
25
Revenue by Geographic Region
Total revenue grew in all regions for 2018 compared to 2017.
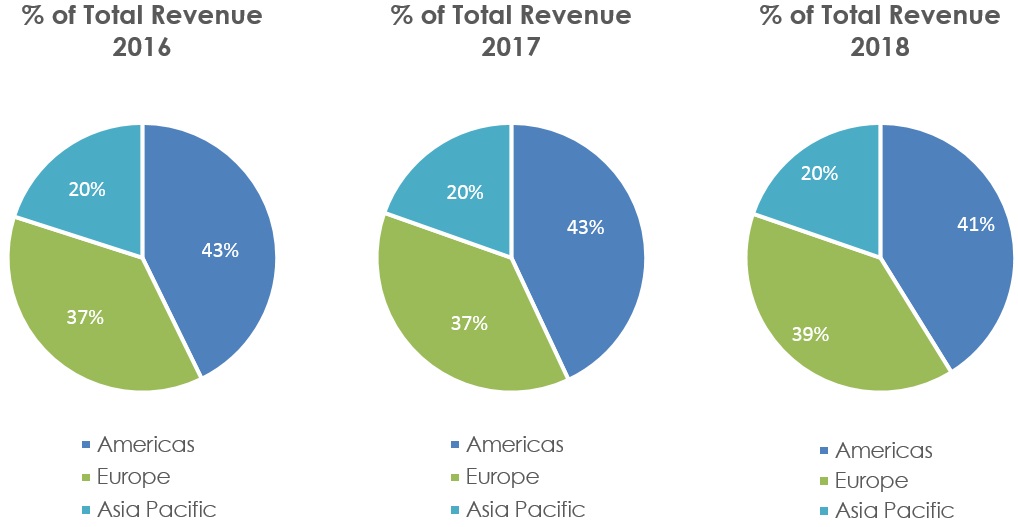
Year ended September 30, | |||||||||||||||||||||||
2018 | Percent Change | 2017 | Percent Change | 2016 | |||||||||||||||||||
Actual | Constant Currency | Actual | Constant Currency | ||||||||||||||||||||
(Dollar amounts in millions) | |||||||||||||||||||||||
Americas | |||||||||||||||||||||||
Software revenue | $ | 468.3 | 8 | % | 8 | % | $ | 433.7 | 5 | % | 4 | % | $ | 414.7 | |||||||||
Professional services revenue | 42.9 | (36 | )% | (36 | )% | 67.2 | (8 | )% | (9 | )% | 72.9 | ||||||||||||
Total Revenue | $ | 511.2 | 2 | % | 2 | % | $ | 500.9 | 3 | % | 2 | % | $ | 487.6 | |||||||||
Europe | |||||||||||||||||||||||
Software revenue | $ | 402.9 | 13 | % | 7 | % | $ | 356.5 | 6 | % | 7 | % | $ | 335.6 | |||||||||
Professional services revenue | 83.0 | 5 | % | (1 | )% | 78.7 | (11 | )% | (11 | )% | 88.7 | ||||||||||||
Total Revenue | $ | 485.9 | 12 | % | 5 | % | $ | 435.2 | 3 | % | 4 | % | $ | 424.3 | |||||||||
Asia Pacific | |||||||||||||||||||||||
Software revenue | $ | 217.3 | 10 | % | 8 | % | $ | 197.1 | 2 | % | — | % | $ | 193.3 | |||||||||
Professional services revenue | 27.4 | (11 | )% | (13 | )% | 30.9 | (13 | )% | (13 | )% | 35.4 | ||||||||||||
Total Revenue | $ | 244.7 | 7 | % | 5 | % | $ | 228.0 | — | % | (2 | )% | $ | 228.7 | |||||||||
Americas
Americas software revenue has benefited from strong license and subscription bookings growth over the past two years (10% CAGR). New license and subscriptions bookings were up 20% in 2018 compared to 2017, despite an 800 basis point increase in the subscription mix.
Europe
Europe constant currency year-over-year revenue growth reflects solid bookings growth over the past two years (8% CAGR). The increase in revenue in Europe in 2018 compared to 2017 was due to the strong bookings in 2017, when this region delivered 28% constant currency growth in bookings. Bookings in Europe declined 10% in 2018 compared to 2017 and were adversely affected in 2018 due to a $7 million deal which closed early in the fourth quarter of 2017 instead of the first quarter of 2018.
Year-over-year changes in foreign currency exchange rates, particularly the Euro, impacted European revenue favorably in 2018 by $28.2 million and unfavorably by $3.9 million in 2017.
Asia Pacific
26
Asia Pacific software revenue growth in the mid-teens reflects solid bookings performance in the broader region over the past two years (5% CAGR), despite the headwinds experienced in Japan in 2017.
Year-over-year changes in foreign currency exchange rates favorably impacted revenue by $4.2 million and $1.6 million in 2018 and 2017, respectively.
Gross Margin
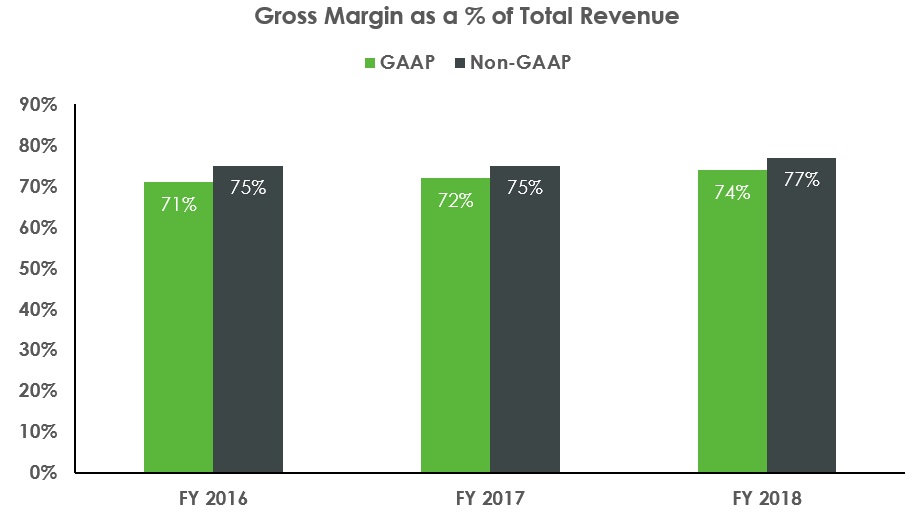
Year ended September 30, | |||||||||||||||||
2018 | Percent Change | 2017 | Percent Change | 2016 | |||||||||||||
(Dollar amounts in millions) | |||||||||||||||||
Gross margin | $ | 915.6 | 10 | % | $ | 835.0 | 2 | % | $ | 814.9 | |||||||
Non-GAAP gross margin | 964.0 | 10 | % | 876.5 | 3 | % | 853.2 | ||||||||||
Gross margin as a % of revenue: | |||||||||||||||||
License and subscription gross margin | 84 | % | 79 | % | 76 | % | |||||||||||
Support gross margin | 82 | % | 84 | % | 87 | % | |||||||||||
Professional Services | 6 | % | 15 | % | 14 | % | |||||||||||
Gross margin as a % of total revenue | 74 | % | 72 | % | 71 | % | |||||||||||
Non-GAAP gross margin as a % of total non-GAAP revenue | 77 | % | 75 | % | 75 | % | |||||||||||
The increase in total gross margin in 2018 compared to 2017 is due to total revenue growth and lower costs of professional services. Total revenue in 2018 grew 7% over 2017. Margins for license and subscription are beginning to expand as the subscription model matures and revenue that has been deferred begins to contribute to current periods. Support gross margins are down for 2018 compared to 2017 primarily due to the 14% decrease in support revenue associated with an increase in our subscription mix and the conversion of existing customers from support contracts to subscription. Support revenue comprised 40% of our total revenue in 2018 compared to 50% in 2017 and 57% in 2016. Professional services gross margin is down due to the $14.5 million revenue write-down related to a settlement of a customer dispute concerning a receivable. Without this revenue write-down, professional services gross margin would have been 15%.
27
Costs and Expenses
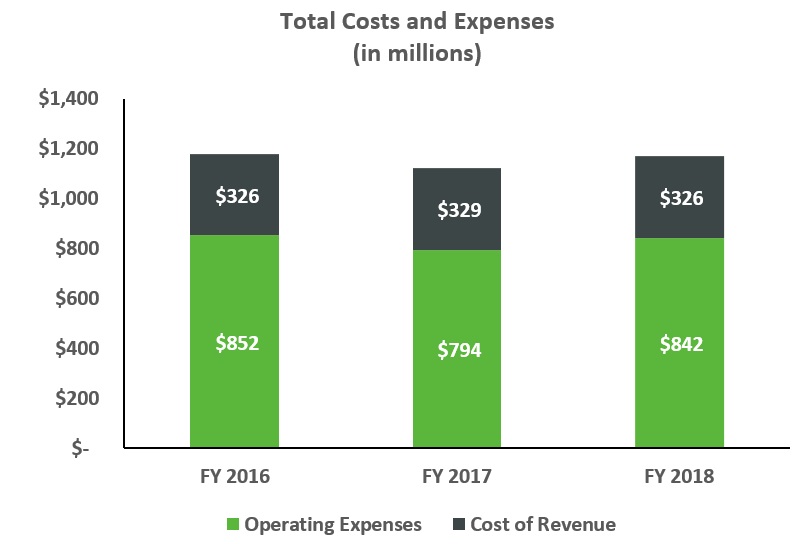
Year ended September 30, | |||||||||||||||||
2018 | Percent Change | 2017 | Percent Change | 2016 | |||||||||||||
Cost of license and subscription revenue | $ | 94.1 | 9 | % | $ | 86.0 | 23 | % | $ | 69.7 | |||||||
Cost of support revenue | 88.6 | (4 | )% | 92.2 | 8 | % | 85.7 | ||||||||||
Cost of professional services revenue | 143.5 | (5 | )% | 150.8 | (11 | )% | 170.2 | ||||||||||
Sales and marketing | 414.5 | 11 | % | 372.9 | 1 | % | 367.5 | ||||||||||
Research and development | 249.8 | 6 | % | 236.1 | 3 | % | 229.3 | ||||||||||
General and administrative | 143.0 | (1 | )% | 145.1 | — | % | 145.6 | ||||||||||
Amortization of acquired intangible assets | 31.4 | (2 | )% | 32.1 | (3 | )% | 33.2 | ||||||||||
Restructuring charges | 3.8 | (53 | )% | 7.9 | (90 | )% | 76.3 | ||||||||||
Total costs and expenses | $ | 1,168.6 | 4 | % | (1) | $ | 1,123.1 | (5 | )% | (1) | $ | 1,177.5 | |||||
Total headcount at end of period | 6,110 | 1 | % | 6,041 | 4 | % | 5,800 | ||||||||||
(1) | On a constant currency basis from the prior period, total costs and expenses increased 2% from 2017 to 2018 and decreased 4% from 2016 to 2017. |
2018 compared to 2017
Costs and expenses in 2018 compared to 2017 increased primarily as a result of the following:
• | an increase of approximately $45 million in compensation and related costs primarily due to annual salary merit and headcount increases, an increase in commissions expense and an increase in stock-based compensation expense due to over-achievement of certain operating performance targets; and |
• | an increase of $8.6 million in cloud services hosting costs; of which $3.7 million is included in cost of license and subscription revenue. |
The increases above were partially offset by:
• | a decrease of $8.9 million in restructuring charges. |
2017 compared to 2016
Costs and expenses in 2017 compared to 2016 decreased primarily as a result of the following:
• | substantial completion of restructuring activities in 2016, for which restructuring charges totaled $76.3 million in 2016 compared to $7.9 million in 2017; and |
28
• | a decrease in professional services costs primarily due to a decrease in headcount as we migrated more service engagements to our partners and we delivered products that required less consulting and training services. |
The decreases above were partially offset by increases due to:
• | an increase of $18.1 million in total cost of license, subscription and support compensation costs primarily driven by increased headcount; |
• | an increase of $8.7 million in cloud services hosting costs due to an increase in SaaS revenue and related expenses and an increase in applications hosted in the cloud that support our IT infrastructure. |
• | an increase of $5.0 million in total research and development compensation costs primarily driven by increased headcount; and |
• | annual merit salary increases. |
Cost of License and Subscription Revenue
Year ended September 30, | |||||||||||||||||
2018 | Percent Change | 2017 | Percent Change | 2016 | |||||||||||||
(Dollar amounts in millions) | |||||||||||||||||
Cost of license and subscription revenue | $ | 94.1 | 9 | % | $ | 86.0 | 23 | % | $ | 69.7 | |||||||
% of total revenue | 8 | % | 7 | % | 6 | % | |||||||||||
% of total license and subscription revenue | 16 | % | 21 | % | 24 | % | |||||||||||
Our cost of license and subscription includes cost of license, which consists of fixed and variable costs associated with reproducing and distributing software and documentation, as well as royalties paid to third parties for technology embedded in or licensed with our software products, and amortization of intangible assets associated with acquired products, and cost of subscription, which includes our cost of cloud services and software as a service revenue, including hosting fees. Costs associated with providing post-contract support such as providing software updates and technical support for both our subscription offerings and our perpetual licenses are included in cost of support revenue. Cost of license and subscription revenue as a percent of license and subscription revenue can vary depending on the subscription mix percentage, the product mix sold, the effect of fixed and variable royalties, headcount and the level of amortization of acquired software intangible assets.
Costs in 2018 compared to 2017 increased primarily as a result of a $3.7 million increase in cloud services hosting costs and a $2.5 million increase in total compensation, benefit and travel expense due to increases in salaries.
Costs in 2017 compared to 2016 increased primarily as a result of a $15.0 million increase in total compensation, benefit and travel expense due to increased headcount, primarily associated with supporting our Cloud products, and a $3.4 million increase in cloud services hosting costs.
Cost of Support Revenue
Year ended September 30, | |||||||||||||||||
2018 | Percent Change | 2017 | Percent Change | 2016 | |||||||||||||
(Dollar amounts in millions) | |||||||||||||||||
Cost of support | $ | 88.6 | (4 | )% | $ | 92.2 | 8 | % | $ | 85.7 | |||||||
% of total revenue | 7 | % | 8 | % | 8 | % | |||||||||||
% of total support revenue | 18 | % | 16 | % | 13 | % | |||||||||||
Cost of support revenue consists of costs such as salaries, benefits, and computer equipment and facilities associated with customer support and the release of support updates (including related royalty costs) associated with providing support for both our perpetual licenses and subscription licenses.
Costs and expense in 2018 compared to 2017 decreased primarily due to a decrease in headcount resulting in 3% ($1.9 million) lower total compensation, benefit and travel costs.
29
Costs and expense in 2017 compared to 2016 increased primarily due to a 5% ($3.1 million) increase in total compensation, benefit and travel costs.
Cost of Professional Services Revenue
Year ended September 30, | |||||||||||||||||
2018 | Percent Change | 2017 | Percent Change | 2016 | |||||||||||||
(Dollar amounts in millions) | |||||||||||||||||
Cost of professional services revenue | $ | 143.5 | (5 | )% | $ | 150.8 | (11 | )% | $ | 170.2 | |||||||
% of total revenue | 12 | % | 13 | % | 15 | % | |||||||||||
% of total professional services revenue | 94 | % | 85 | % | 86 | % | |||||||||||
Our cost of professional services revenue includes costs such as salaries, benefits, information technology costs and facilities expenses for our training and consulting personnel, and third-party subcontractor fees.
In 2018 compared to 2017, total compensation, benefit and travel expenses were decreased by $6.8 million primarily due to an 8% decrease in headcount.
In 2017 compared to 2016, total compensation, benefit costs and travel expenses decreased by $18.8 million. The cost of third-party consulting services was $4.7 million lower in 2017 compared to 2016.
As a result of decreases in professional services revenue in 2018, 2017 and 2016, we have reduced headcount, resulting in lower compensation-related costs. This is in line with our strategy to have our strategic services partners perform services for customers directly, which has decreased revenue and costs and improved services margins.
Sales and Marketing
Year ended September 30, | |||||||||||||||||
2018 | Percent Change | 2017 | Percent Change | 2016 | |||||||||||||
(Dollar amounts in millions) | |||||||||||||||||
Sales and marketing expenses | $ | 414.5 | 11 | % | $ | 372.9 | 1 | % | $ | 367.5 | |||||||
% of total revenue | 33 | % | 32 | % | 32 | % | |||||||||||
Our sales and marketing expenses primarily include salaries and benefits, sales commissions, advertising and marketing programs, travel, information technology costs and facility expenses.
Costs and expense in 2018 compared to 2017 increased primarily due to a $38.6 million increase in total compensation, benefit costs and travel expenses as a result of increases in headcount, salary increases, higher commissions costs and higher stock-based compensation.
In 2017 compared to 2016, event costs increased $3.1 million due to our LiveWorx event held in May 2017. Our compensation, benefits and travel costs were $3.5 million lower in 2017 compared to 2016 primarily due to lower commissions, which were higher in 2016 as a result of significantly higher than planned subscription bookings.
30
Research and Development
Year ended September 30, | |||||||||||||||||
2018 | Percent Change | 2017 | Percent Change | 2016 | |||||||||||||
(Dollar amounts in millions) | |||||||||||||||||
Research and development expenses | $ | 249.8 | 6 | % | $ | 236.1 | 3 | % | $ | 229.3 | |||||||
% of total revenue | 20 | % | 20 | % | 20 | % | |||||||||||
Our research and development expenses consist principally of salaries and benefits, information technology costs and facility expenses. Major research and development activities include developing new releases and updates of our software that enhance functionality and add features.
In 2018 compared to 2017, total compensation, benefit and travel expenses were higher by 6% ($12.0 million) due to an increase in headcount and salary increases.
In 2017 compared to 2016, total compensation, benefit and travel expenses were higher by 3% ($5.0 million) due to an increase in headcount and a $1.6 million increase in cloud services hosting costs as some product testing has moved to a cloud environment.
General and Administrative (G&A)
Year ended September 30, | |||||||||||||||||
2018 | Percent Change | 2017 | Percent Change | 2016 | |||||||||||||
(Dollar amounts in millions) | |||||||||||||||||
General and administrative | $ | 143.0 | (1 | )% | $ | 145.1 | — | % | $ | 145.6 | |||||||
% of total revenue | 12 | % | 12 | % | 13 | % | |||||||||||
Our G&A expenses include the costs of our corporate, finance, information technology, human resources, legal and administrative functions, as well as acquisition-related and other transactional charges, bad debt expense and outside professional services, including accounting and legal fees. Acquisition-related costs include direct costs of acquisitions and expenses related to acquisition integration activities, including transaction fees, due diligence costs, retention bonuses and severance, and professional fees, including legal and accounting costs, related to the acquisition. In addition, subsequent adjustments to our initial estimated amount of contingent consideration associated with specific acquisitions are included in acquisition-related charges. Other transactional charges include third-party costs related to structuring unusual transactions.
In 2018 compared to 2017, the cost of professional fees decreased $3.3 million, offset by an increase of $2.1 million in compensation due to headcount and merit increases.
In 2017 compared to 2016, total compensation, benefit and travel costs increased by $7.0 million primarily because of merit increases and increased severance costs, as well as higher stock-based compensation due to a higher attainment of performance-based awards, an award modification, and the launch of the employee stock purchase plan (ESPP) in the fourth quarter of 2016. Offsetting the increases, acquisition-related charges decreased $4.9 million because there were no significant acquisitions in the year, and tax and audit fees decreased $1.8 million during the year.
Amortization of Acquired Intangible Assets
Year ended September 30, | |||||||||||||||||
2018 | Percent Change | 2017 | Percent Change | 2016 | |||||||||||||
(Dollar amounts in millions) | |||||||||||||||||
Amortization of acquired intangible assets | $ | 31.4 | (2 | )% | $ | 32.1 | (3 | )% | $ | 33.2 | |||||||
% of total revenue | 3 | % | 3 | % | 3 | % | |||||||||||
Amortization of acquired intangible assets reflects the amortization of acquired non-product related intangible assets, primarily customer and trademark-related intangible assets, recorded in connection
31
with completed acquisitions. Amortization of intangible assets typically follows the economic benefit pattern of the acquired intangible assets.
The decrease in amortization of acquired intangible assets from 2016 to 2017 and from 2017 to 2018 is due to certain intangibles becoming fully amortized as well as the impact of foreign currency exchanges.
Restructuring and Other Charges, net
Year ended September 30, | |||||||||||
2018 | 2017 | 2016 | |||||||||
(Dollar amounts in millions) | |||||||||||
Restructuring charges (credits), net | $ | (1.0 | ) | $ | 7.9 | $ | 76.3 | ||||
Headquarters relocation charges | 4.8 | — | — | ||||||||
Restructuring and Other Charges, Net | $ | 3.8 | $ | 7.9 | $ | 76.3 | |||||
% of total revenue | — | % | 1 | % | 7 | % | |||||
In fiscal 2016, we committed to a plan to restructure our global workforce and consolidate select facilities to reduce our cost structure and to realign our investments with our identified growth opportunities. The restructuring was substantially completed in 2017 and resulted in a total restructuring charge of $84.5 million.
In 2018, we recorded restructuring credits of $1.0 million related to prior year restructuring actions and made cash payments related to restructuring charges of $2.8 million. At September 30, 2018, accrued restructuring totaled $2.4 million, of which we expect to pay $1.5 million within the next twelve months.
Restructuring charges for 2017 were $7.9 million, including $5.6 million of facility related charges and $2.4 million of employee termination-related costs. In 2017 we made cash payments related to restructuring charges of $37.1 million.
Headquarters relocation charges represent accelerated depreciation expense recorded in anticipation of our relocation to a new worldwide headquarters in the Boston Seaport district in 2019 and exiting our current headquarters facility. Because our current headquarters lease will not expire until November 2022, we are seeking to sublease that space but have not yet done so. If we are unable to sublease our current headquarters space for an amount at least equal to our rent obligations under the current headquarters lease (approximately $12 million per year), we will bear overlapping rent obligations for those premises and will be required to record additional headquarters relocation charges related to any rent shortfall. A charge for such shortfall will be recorded in the earlier of the period that we cease using the existing space (which will likely occur in the second quarter of our fiscal 2019) or the period we sign sublease contracts. Additionally, we will incur other costs associated with the move which will be recorded as incurred.
Interest Expense
Year ended September 30, | |||||||||
2018 | 2017 | 2016 | |||||||
(Dollar amounts in millions) | |||||||||
Interest expense | $ | (41.7 | ) | (42.4 | ) | (29.9 | ) | ||
The decrease in interest expense in 2018 compared to 2017 is primarily due to the write-off deferred financing fees of $1.2 million in March 2017 when we modified our credit facility and reduced the loan commitment to $600 million from $900 million, offset by an increase in interest expense of $0.4 million.
The increase in interest expense in 2017 compared to 2016 was due to a full year of interest being incurred on the $500 million 6% senior notes (the 2024 6% Notes) which were issued in the third quarter of 2016, and higher average interest rates on our revolving credit facility in 2017 compared to 2016.
The average interest rate on our total borrowings was 5.2% in 2018, 4.9% in 2017 and 3.0% in 2016.
32
Interest Income and Other Expense, net
Year ended September 30, | |||||||||||
2018 | 2017 | 2016 | |||||||||
(Dollar amounts in millions) | |||||||||||
Foreign currency losses, net | $ | (7.0 | ) | $ | (5.7 | ) | $ | (1.9 | ) | ||
Interest income | 3.8 | 3.2 | 3.4 | ||||||||
Other income (expense), net | 0.3 | 2.5 | (1.8 | ) | |||||||
$ | (2.9 | ) | $ | 0.1 | $ | (0.3 | ) | ||||
Foreign currency net losses include costs of hedging contracts, certain realized and unrealized foreign currency transaction gains or losses, and foreign exchange gains or losses resulting from the required period-end currency re-measurement of the assets and liabilities of our subsidiaries that use the U.S. dollar as their functional currency. Because a large portion of our revenue and expenses is transacted in foreign currencies, we engage in hedging transactions involving the use of foreign currency forward contracts to reduce our exposure to fluctuations in foreign exchange rates. Changes in the balance year over year are due to required period-end currency re-measurement of the assets and liabilities of our subsidiaries that use the U.S. Dollar as their functional currency. Hedging costs increased $2.0 million in 2018 compared to 2017 and $1.3 million in 2017 compared to 2016.
Interest income represents earnings on the investment of our available cash balances.
Other income (expense), net is primarily made up other non-operating gains and losses. In January 2017, we sold a cost method investment for a gain of $3.7 million.
Income Taxes
Tax Provision and Effective Income Tax Rate
Year ended September 30, | |||||||||||
2018 | 2017 | 2016 | |||||||||
(Dollar amounts in millions) | |||||||||||
Pre-tax income (loss) | $ | 28.7 | $ | (1.4 | ) | $ | (67.2 | ) | |||
Tax benefit | (23.3 | ) | (7.6 | ) | (12.7 | ) | |||||
Effective income tax rate | (81 | )% | 544 | % | 19 | % | |||||
On December 22, 2017, the United States enacted tax reform legislation through the Tax Cuts and Jobs Act, (the "Tax Act"), which significantly changed existing U.S. tax laws by a reduction of the corporate tax rate, the implementation of a new system of taxation for non-U.S. earnings, the imposition of a one-time tax on the deemed repatriation of undistributed earnings of non-U.S. subsidiaries, and by the expansion of the limitations on the deductibility of executive compensation and interest expense. As we have a September 30 fiscal year-end, a blended U.S. statutory federal rate of approximately 24.5% applies for our fiscal year ending September 30, 2018 and 21% for subsequent fiscal years. The Tax Act also provides that net operating losses generated in years ending after December 31, 2017 (our fiscal 2018) will be carried forward indefinitely and can no longer be carried back, and that net operating losses generated in years beginning after December 31, 2017 can only reduce taxable income by up to 80% when utilized in a future period.
We have provided no federal income taxes payable as a result of the deemed repatriation of undistributed earnings as the tax will be offset by a combination of current year losses and existing attributes which had a full valuation allowance recorded against the related deferred tax assets. We recorded a state income taxes payable on the deemed repatriation of $2.1 million. We also recorded a deferred tax benefit of $14.1 million for the impact of the Tax Act on our net U.S. deferred income tax balances. This was primarily attributable to the reduction of the federal tax rate on the net deferred tax liability in the U.S., and the ability to realize net operating losses from the reversal of existing deferred tax assets which can now be carried forward indefinitely and can therefore be netted against deferred tax liabilities for indefinite lived intangible assets.
The changes included in the Tax Act are broad and complex. The Securities Exchange Commission has issued rules that allow for a measurement period of up to one year after the enactment date of the
33
Tax Act to finalize the recording of the related tax impacts. We have finalized our accounting for the effects of the legislation with the exception of any additional guidance that may impact our provisional amounts recorded for the transition tax. We are not able to make reasonable estimates at this time of the effects of certain provisions of the Tax Act that will apply to us beginning in our fiscal year ending September 30, 2019, including the Global Intangible Low Tax Income tax (the "GILTI" tax) and any associated impact on our U.S. valuation allowance. We currently anticipate finalizing and recording any resulting adjustments in the quarter ending December 29, 2018.
In 2018 our effective tax rate was lower than the statutory federal income tax rate due to U.S. tax reform, as described above. In 2018, 2017 and 2016, our effective tax rate was materially impacted by our corporate structure in which our foreign taxes are at an effective tax rate lower than the U.S. A significant amount of our foreign earnings is generated by our subsidiaries organized in Ireland. In 2018, 2017 and 2016, the foreign rate differential predominantly relates to these Irish earnings. Additionally, we have a full valuation allowance against deferred tax assets in the U.S., primarily related to net operating loss, tax credit carryforwards, capitalized research and development expense and deferred revenue. As a result, we have not recorded a benefit related to ongoing U.S. losses. Our foreign rate differential in 2018 ,2017 and 2016 includes the continuing rate benefit from a business realignment completed on September 30, 2014 in which intellectual property was transferred between two wholly-owned foreign subsidiaries. The realignment allows us to more efficiently manage the distribution of our products to European customers. In 2018, this realignment resulted in a tax benefit of approximately $24 million and in 2017 and 2016, a benefit of approximately $28 million in each year. In 2017 and 2016, the change in valuation allowance primarily relates to U.S. losses not benefited, partially offset by the release of valuation allowances in foreign subsidiaries of $9.0 million and $3.1 million, respectively. We recorded foreign withholding taxes, an obligation of the U.S. parent of $2.7 million in 2018 and $2.0 million in 2017 and 2016, respectively.
Valuation Allowance
We have concluded, based on the weight of available evidence, that a full valuation allowance continues to be required against our U.S. net deferred tax assets as they are not more likely than not to be realized in the future. We will continue to reassess our valuation allowance requirements each financial reporting period.
Tax Audits and Examinations
In the normal course of business, PTC and its subsidiaries are examined by various taxing authorities, including the Internal Revenue Service (IRS) in the U. S. We regularly assess the likelihood of additional assessments by tax authorities and provide for these matters as appropriate. We are currently under audit by tax authorities in several jurisdictions. Audits by tax authorities typically involve examination of the deductibility of certain permanent items, transfer pricing, limitations on net operating losses and tax credits. Although we believe our tax estimates are appropriate, the final determination of tax audits and any related litigation could result in material changes in our estimates.
In the fourth quarter of 2016, we received an assessment of approximately $12 million from the tax authorities in Korea. The assessment relates to various tax issues, primarily foreign withholding taxes. We have appealed and intend to vigorously defend our positions. We believe that upon completion of a multi-level appeal process it is more likely than not that our positions will be sustained. Accordingly, we have not recorded a tax reserve for this matter. We paid this assessment in the first quarter of 2017, pending resolution of the appeal process.
Our Future Effective Income Tax Rate
Our future effective income tax rate may be materially impacted by the amount of income taxes associated with our foreign earnings, which are taxed at rates different from the U.S. federal statutory income tax rate, as well as the timing and extent of the realization of deferred tax assets and changes in the tax law. Further, our tax rate may fluctuate within a fiscal year, including from quarter to quarter, due to items arising from discrete events, including settlements of tax audits and assessments, the resolution or identification of tax position uncertainties, and acquisitions of other companies.
Operating Measures
Subscription Bookings and Subscription ACV
34
Given the difference in revenue recognition between the sale of a perpetual software license (revenue is recognized at the time of sale) and a subscription (revenue is recognized ratably over the subscription term), we use bookings for internal planning, forecasting and reporting of new license and subscription sales and cloud services transactions.
In order to normalize between perpetual and subscription licenses, we define subscription bookings as the subscription annualized contract value (subscription ACV) of new subscription bookings multiplied by a conversion factor of 2. We arrived at the conversion factor of 2 by considering many variables, including pricing, support, length of term, and renewal rates. In 2018 and 2017, the average subscription contract term was approximately two years.
We define subscription ACV as the total value of a new subscription booking divided by the term of the contract (in days), multiplied by 365. If the term of the subscription contract is less than a year, and is not associated with an existing contract, the ACV is equal to the total contract value. Beginning in the third quarter of 2018, minimum ACV commitments under our Strategic Alliance Agreement with Rockwell Automation are included in subscription ACV if the period-to-date minimum ACV commitment exceeds actual ACV sold under the Agreement.
We define license and subscription bookings as subscription bookings plus perpetual license bookings plus any monthly software rental bookings during the period.
Because subscription bookings is a metric we use to approximate the value of subscription sales if sold as perpetual licenses, it does not represent the actual revenue that will be recognized with respect to subscription sales or that would be recognized if the sales had been perpetual licenses.
Annualized Recurring Revenue (ARR)
Annualized Recurring Revenue (ARR) for a given quarter is calculated by dividing the non-GAAP subscription and support software revenue for the quarter by the number of days in the quarter and multiplying by 365. ARR should be viewed independently of revenue and deferred revenue as it is an operating measure and is not intended to be combined with or to replace either of those items. ARR is not a forecast and does not include perpetual license or professional services revenues.
Non-GAAP Financial Measures
The non-GAAP financial measures presented in the discussion of our results of operations and the respective most directly comparable GAAP measures are:
• | non-GAAP revenue—GAAP revenue |
• | non-GAAP gross margin—GAAP gross margin |
• | non-GAAP operating income—GAAP operating income |
• | non-GAAP operating margin—GAAP operating margin |
• | non-GAAP net income—GAAP net income |
• | non-GAAP diluted earnings per share—GAAP diluted earnings per share |
The non-GAAP financial measures exclude fair value adjustments related to acquired deferred revenue and deferred costs, stock-based compensation expense, amortization of acquired intangible assets expense, acquisition-related charges, pension plan termination-related costs, a legal accrual, restructuring charges, non-operating credit facility refinancing costs, identified discrete charges included in non-operating other expense, net and the related tax effects of the preceding items, and any other identified tax items.
These items are normally included in the comparable measures calculated and presented in accordance with GAAP. Our management excludes these items when evaluating our ongoing performance and/or predicting our earnings trends, and therefore excludes them when presenting non-GAAP financial measures. Management uses non-GAAP financial measures in conjunction with our GAAP results, as should investors.
Settlement Revenue Exclusions. In Q4'18, we settled a previously disclosed dispute with respect to a customer receivable. The settlement included partial payment of the receivable and new software purchases. The net revenue write-down recorded in Q4'18 was $9.3 million, comprised of a $14.5 million professional services revenue write-down, partially offset by new subscription revenue of $5.2 million. We
35
excluded the professional services revenue write-down because the write-down related to revenue that was recorded in periods prior to fiscal 2017 and is not reflective of current operating performance and excluded the new subscription revenue because it mitigated the impact of the professional services revenue write-down.
Fair value of acquired deferred revenue is a purchase accounting adjustment recorded to reduce acquired deferred revenue to the fair value of the remaining obligation, so our GAAP revenue after an acquisition does not reflect the full amount of revenue that would have been reported if the acquired deferred revenue was not written down to fair value. We believe excluding these adjustments to revenue from these contracts (and associated costs in fair value adjustment to deferred services cost) is useful to investors as an additional means to assess revenue trends of our business.
Stock-based compensation is a non-cash expense relating to stock-based awards issued to executive officers, employees and outside directors, consisting of restricted stock, stock options and restricted stock units. We exclude this expense as it is a non-cash expense and we assess our internal operations excluding this expense and believe it facilitates comparisons to the performance of other companies in our industry.
Amortization of acquired intangible assets is a non-cash expense that is impacted by the timing and magnitude of our acquisitions. We believe the assessment of our operations excluding these costs is relevant to our assessment of internal operations and comparisons to the performance of other companies in our industry.
Acquisition-related and other transactional charges included in general and administrative costs are
direct costs of potential and completed acquisitions and expenses related to acquisition integration
activities, including transaction fees, due diligence costs, severance and professional fees. Subsequent
adjustments to our initial estimated amount of contingent consideration associated with specific
acquisitions are also included within acquisition-related charges. Other transactional charges include
third-party costs related to structuring unusual transactions. We do not include these costs when
reviewing our operating results internally. The occurrence and amount of these costs will vary depending
on the timing and size of acquisitions.
U.S. pension plan termination-related costs include charges related to our plan that we began terminating in the second quarter of 2014. Costs associated with termination of the plan are not considered part of our regular operations.
Legal accrual includes amounts accrued to settle regulatory and other matters related to our SEC and DOJ FCPA investigation in China. We view these matters as non-ordinary course events and exclude the amounts when reviewing our operating performance.
Restructuring charges include severance costs and excess facility restructuring charges resulting from reductions of personnel driven by modifications to our business strategy. These costs may vary in size based on our restructuring plan.
Headquarters relocation charges include non-cash accelerated depreciation expense recorded in anticipation of exiting our current headquarters facility due to changes in the estimated useful lives of fixed assets. We do not include these costs when reviewing our operating results internally.
Non-operating credit facility refinancing costs are non-operating charges we record as a result of the refinancing of our credit facility. We assess our internal operations excluding these costs and believe it facilitates comparisons to the performance of other companies in our industry.
Income tax adjustments include the tax impact of the items above and assumes that we are profitable on a non-GAAP basis in the U.S. and one foreign jurisdiction, and eliminates the effect of the valuation allowance recorded against our net deferred tax assets in those jurisdictions. Additionally, we exclude other material tax items that we view as non-ordinary course.
We use these non-GAAP financial measures, and we believe that they assist our investors, to make period-to-period comparisons of our operational performance because they provide a view of our operating results without items that are not, in our view, indicative of our core operating results. We believe that these non-GAAP financial measures help illustrate underlying trends in our business, and we use the measures to establish budgets and operational goals (communicated internally and externally) for managing our business and evaluating our performance. We believe that providing non-GAAP financial measures affords investors a view of our operating results that may be more easily compared to the results of peer companies.
36
The items excluded from the non-GAAP financial measures often have a material impact on our financial results and such items often recur. Accordingly, the non-GAAP financial measures included in this Annual Report should be considered in addition to, and not as a substitute for or superior to, the comparable measures prepared in accordance with GAAP. The following tables reconcile each of these non-GAAP financial measures to its most closely comparable GAAP measure on our financial statements.
Year ended September 30, | |||||||||||
2018 | 2017 | 2016 | |||||||||
(in millions, except per share amounts) | |||||||||||
GAAP revenue | $ | 1,241.8 | $ | 1,164.0 | $ | 1,140.5 | |||||
Settlement revenue exclusion | 9.3 | — | — | ||||||||
Fair value of acquired deferred revenue | 1.3 | 2.7 | 3.5 | ||||||||
Non-GAAP revenue | $ | 1,252.4 | $ | 1,166.8 | $ | 1,144.0 | |||||
GAAP gross margin | $ | 915.6 | $ | 835.0 | $ | 814.9 | |||||
Settlement revenue exclusion | 9.3 | — | — | ||||||||
Fair value of acquired deferred revenue | 1.3 | 2.7 | 3.5 | ||||||||
Fair value to acquired deferred costs | (0.4 | ) | (0.4 | ) | (0.5 | ) | |||||
Stock-based compensation | 11.5 | 12.6 | 10.8 | ||||||||
Amortization of acquired intangible assets included in cost of revenue | 26.7 | 26.6 | 24.6 | ||||||||
Non-GAAP gross margin | $ | 964.0 | $ | 876.5 | $ | 853.2 | |||||
GAAP operating income (loss) | $ | 73.2 | $ | 40.9 | $ | (37.0 | ) | ||||
Settlement revenue exclusion | 9.3 | — | — | ||||||||
Fair value of acquired deferred revenue | 1.3 | 2.7 | 3.5 | ||||||||
Fair value to acquired deferred costs | (0.4 | ) | (0.4 | ) | (0.5 | ) | |||||
Stock-based compensation | 82.9 | 76.7 | 66.0 | ||||||||
Amortization of acquired intangible assets included in cost of revenue | 26.7 | 26.6 | 24.6 | ||||||||
Amortization of acquired intangible assets | 31.4 | 32.1 | 33.2 | ||||||||
Acquisition-related and other transactional charges included in general and administrative expenses | 1.9 | 1.6 | 3.5 | ||||||||
U.S. pension plan termination-related costs | — | 0.3 | — | ||||||||
Legal accrual | — | — | 3.2 | ||||||||
Restructuring charges (credits), net | (1.0 | ) | 7.9 | 76.3 | |||||||
Headquarters relocation charge | 4.8 | — | — | ||||||||
Non-GAAP operating income | $ | 230.0 | $ | 188.4 | $ | 172.7 | |||||
GAAP net income (loss) | $ | 52.0 | $ | 6.2 | $ | (54.5 | ) | ||||
Settlement revenue exclusion | 9.3 | — | — | ||||||||
Fair value of acquired deferred revenue | 1.3 | 2.7 | 3.5 | ||||||||
Fair value to acquired deferred costs | (0.4 | ) | (0.4 | ) | (0.5 | ) | |||||
Stock-based compensation | 82.9 | 76.7 | 66.0 | ||||||||
Amortization of acquired intangible assets included in cost of revenue | 26.7 | 26.6 | 24.6 | ||||||||
Amortization of acquired intangible assets | 31.4 | 32.1 | 33.2 | ||||||||
Acquisition-related and other transactional charges included in general and administrative expenses | 1.9 | 1.6 | 3.5 | ||||||||
U.S. pension plan termination-related costs | — | 0.3 | — | ||||||||
Legal accrual | — | — | 3.2 | ||||||||
Restructuring charges (credits), net | (1.0 | ) | 7.9 | 76.3 | |||||||
Headquarters relocation charge | 4.8 | — | — | ||||||||
Non-operating credit facility refinancing costs | — | 1.2 | 2.4 | ||||||||
Income tax adjustments (1) | (37.6 | ) | (17.4 | ) | (19.8 | ) | |||||
Non-GAAP net income | $ | 171.2 | $ | 137.6 | $ | 137.8 | |||||
GAAP diluted earnings (loss) per share | $ | 0.44 | $ | 0.05 | $ | (0.48 | ) | ||||
Settlement revenue exclusion | 0.08 | — | — | ||||||||
37
Fair value of acquired deferred revenue | 0.01 | 0.02 | 0.03 | ||||||||
Stock-based compensation | 0.70 | 0.65 | 0.57 | ||||||||
Total amortization of acquired intangible assets | 0.49 | 0.50 | 0.50 | ||||||||
Acquisition-related and other transactional charges included in general and administrative expenses | 0.02 | 0.01 | 0.03 | ||||||||
Legal accrual | — | — | 0.03 | ||||||||
Headquarters relocation charge | 0.04 | — | — | ||||||||
Restructuring charges (credits), net | (0.01 | ) | 0.07 | 0.66 | |||||||
Non-operating credit facility refinancing costs | — | 0.01 | 0.02 | ||||||||
Income tax adjustments (1) | (0.32 | ) | (0.15 | ) | (0.17 | ) | |||||
Non-GAAP diluted earnings per share (2) | $ | 1.45 | $ | 1.17 | $ | 1.19 | |||||
Year ended September 30, | |||||||||||
Operating margin impact of non-GAAP adjustments: | 2018 | 2017 | 2016 | ||||||||
GAAP operating margin | 5.9 | % | 3.5 | % | (3.2 | )% | |||||
Settlement revenue exclusion | 0.6 | % | — | % | — | % | |||||
Fair value of acquired deferred revenue | 0.1 | % | 0.2 | % | 0.3 | % | |||||
Stock-based compensation | 6.7 | % | 6.6 | % | 5.8 | % | |||||
Total amortization of acquired intangible assets | 4.7 | % | 5.0 | % | 5.1 | % | |||||
Acquisition-related and other transactional charges included in general and administrative expenses | 0.1 | % | 0.1 | % | 0.3 | % | |||||
Legal accrual | — | % | — | % | 0.3 | % | |||||
Headquarters relocation charge | 0.4 | % | — | % | — | % | |||||
Restructuring charges (credits), net | (0.1 | )% | 0.7 | % | 6.7 | % | |||||
Non-GAAP operating margin | 18.4 | % | 16.1 | % | 15.1 | % | |||||
(1) | We have a full valuation allowance against our U.S. net deferred tax assets and a valuation allowance against net deferred tax assets in certain foreign jurisdictions. As we are profitable on a non-GAAP basis, the 2018, 2017 and 2016 non-GAAP tax provisions are being calculated assuming there is no valuation allowance. Income tax adjustments reflect the tax effects of non-GAAP adjustments which are calculated by applying the applicable tax rate by jurisdiction to the non-GAAP adjustments listed above. We recorded the impact of the Tax Cuts and Jobs Act in 2018 GAAP earnings, resulting in a non-cash benefit of approximately $12 million. We have excluded these benefits from our non-GAAP results. Additionally, we recorded a tax benefit in 2016 for the write-off of a deferred tax liability that resulted from the change in tax status of a foreign subsidiary. This tax benefit has been excluded from non-GAAP tax expense. |
(2) | Diluted earnings per share impact of non-GAAP adjustments is calculated by dividing the dollar amount of the non-GAAP adjustment by the diluted weighted average shares outstanding for the respective year. |
Critical Accounting Policies and Estimates
We have prepared our consolidated financial statements in accordance with accounting principles generally accepted in the United States of America. In preparing our financial statements, we make estimates, assumptions and judgments that can have a significant impact on our reported revenues, results of operations, and net income, as well as on the value of certain assets and liabilities on our balance sheet. These estimates, assumptions and judgments are made based on our historical experience and on other assumptions that we believe to be reasonable under the circumstances. These estimates may change as new events occur or additional information is obtained, and we may periodically be faced with uncertainties, the outcomes of which are not within our control and may not be known for a prolonged period of time.
The accounting policies, methods and estimates used to prepare our financial statements are described generally in Note B. Summary of Significant Accounting Policies of Notes to Consolidated Financial Statements in this Annual Report. The most important accounting judgments and estimates that we made in preparing the financial statements involved:
• | revenue recognition; |
38
• | accounting for income taxes; |
• | valuation of assets and liabilities acquired in business combinations; |
• | valuation of goodwill; |
• | accounting for pensions; and |
• | legal contingencies. |
A critical accounting policy is one that is both material to the presentation of our financial statements and requires us to make subjective or complex judgments that could have a material effect on our financial condition and results of operations. Critical accounting policies require us to make assumptions about matters that are uncertain at the time of the estimate, and different estimates that we could have used, or changes in the estimates that are reasonably likely to occur, may have a material impact on our financial condition or results of operations. Because the use of estimates is inherent in the financial reporting process, actual results could differ from those estimates.
Accounting policies, guidelines and interpretations related to our critical accounting policies and estimates are generally subject to numerous sources of authoritative guidance and are often reexamined by accounting standards rule makers and regulators. These rule makers and/or regulators may promulgate interpretations, guidance or regulations that may result in changes to our accounting policies, which could have a material impact on our financial position and results of operations.
Revenue Recognition
Our sources of revenue include: (1) subscription, (2) support, (3) perpetual license and (4) professional services. Through 2018, we recorded revenues for software related deliverables in accordance with the guidance provided by ASC 985-605, Software-Revenue Recognition and revenues for non-software deliverables in accordance with ASC 605-25, Revenue Recognition, Multiple-Element Arrangements. Under those standards, revenue is recorded when the following criteria are met: (1) persuasive evidence of an arrangement exists, (2) delivery has occurred (generally, FOB shipping point or electronic distribution), (3) the fee is fixed or determinable, and (4) collection is probable. We exercise judgment and use estimates in connection with determining the amounts of software license and services revenues to be recognized in each accounting period. Our primary judgments involve the following:
• | determining whether collection is probable; |
• | assessing whether the fee is fixed or determinable; |
• | determining whether service arrangements, including modifications and customization of the underlying software, are not essential to the functionality of the licensed software and thus would result in the revenue for license and service elements of an agreement being recorded separately; and |
• | determining the fair value of services and support elements included in multiple-element arrangements, which is the basis for allocating and deferring revenue for such services and support. |
Our software is distributed primarily through our direct sales force. In addition, we have an indirect distribution channel through alliances with resellers. Revenue arrangements with resellers are generally recognized on a sell-through basis; that is, when we deliver the product to the end-user customer. We record consideration given to a reseller as a reduction of revenue to the extent we have recorded revenue from the reseller. We do not offer contractual rights of return, stock balancing, or price protection to our resellers, and actual product returns from them have been insignificant to date. As a result, we do not maintain reserves for reseller product returns.
At the time of each sale transaction, we must make an assessment of the collectability of the amount due from the customer. Revenue is only recognized at that time if management deems that collection is probable. In making this assessment, we consider customer credit-worthiness and historical payment experience. At that same time, we assess whether fees are fixed or determinable and free of contingencies or significant uncertainties. In assessing whether the fee is fixed or determinable, we consider the payment terms of the transaction, including transactions with payment terms that extend beyond our customary payment terms, and our collection experience in similar transactions without making concessions, among other factors. We have periodically provided financing to credit-worthy customers with payment terms up to 24 months. If the fee is determined not to be fixed or determinable, revenue is recognized only as payments become due from the customer, provided that all other revenue
39
recognition criteria are met. Our software license arrangements generally do not include customer acceptance provisions. However, if an arrangement includes an acceptance provision, we record revenue only upon the earlier of (1) receipt of written acceptance from the customer or (2) expiration of the acceptance period.
Generally, our contracts are accounted for individually. However, when contracts are closely interrelated and dependent on each other, it may be necessary to account for two or more contracts as one to reflect the substance of the group of contracts.
Subscription
Subscription revenue includes revenue from two primary sources: (1) subscription-based licenses, and (2) cloud services.
Subscription-based licenses include the right for a customer to use our on-premise licenses and receive related support for a specified term and revenue is recognized ratably over the term of the arrangement since we do not have vendor-specific objective evidence (“VSOE”) of fair value for our coterminous support. When sold in arrangements with other elements, VSOE of fair value is established for the subscription-based licenses through the use of a substantive renewal clause within the customer contract for a combined annual fee that includes the term-based license and related support.
Cloud services revenue (which in 2018, 2017 and 2016 represented less than 5% of our total revenue) includes fees for hosting and application management of customers’ perpetual or subscription-based licenses (hosting services) and fees for Software as a Service (SaaS) arrangements. When hosting services are sold as part of a multi-element transaction, revenue is allocated to hosting services based on VSOE, and recognized ratably over the contractual term beginning on the commencement dates of each contract, which is the date the services are made available to the customer. VSOE is established for hosting services either through a substantive stated renewal option or stated contractual overage rates, as these rates represent the value the customer is willing to pay on a standalone basis. We also offer cloud services under SaaS arrangements whereby customers access our software in the cloud. Under SaaS arrangements, customers cannot take possession of the software. Cloud services include set-up fees, which are recognized ratably over the contract term or the expected customer life, whichever is longer.
Support
Support contracts generally include rights to unspecified upgrades (when and if available), telephone and internet-based support, updates and bug fixes. Support revenue is recognized ratably over the term of the support contract on a straight-line basis.
Perpetual License
Under perpetual license arrangements, we generally recognize license revenue up front upon shipment to the customer. We use the residual method to recognize revenue from perpetual license software arrangements that include one or more elements to be delivered at a future date when evidence of the fair value of all undelivered elements exists, and the elements of the arrangement qualify for separate accounting as described below. Under the residual method, the fair value of the undelivered elements (i.e., support and services) based on our VSOE of fair value is deferred and the remaining portion of the total arrangement fee is allocated to the delivered elements (i.e., perpetual software license). If evidence of the fair value of one or more of the undelivered elements does not exist, all revenues are deferred and recognized when delivery of all of those elements has occurred or when fair values can be established. We determine VSOE of the fair value of services and support revenue based upon our recent pricing for those elements when sold separately. For certain transactions, VSOE is determined based on a substantive renewal clause within a customer contract. Our current pricing practices are influenced primarily by product type, purchase volume, sales channel and customer location. We review services and support sold separately on a periodic basis and update, when appropriate, our VSOE of fair value for such elements to ensure that it reflects our recent pricing experience.
Professional Services
Our software arrangements often include implementation, consulting and training services that are sold under consulting engagement contracts or as part of the software license arrangement. When we determine that such services are not essential to the functionality of the licensed software, we record revenue separately for the license and service elements of these arrangements, provided that
40
appropriate evidence of fair value exists for the undelivered services (i.e. VSOE of fair value). We consider various factors in assessing whether a service is not essential to the functionality of the software, including if the services may be provided by independent third parties experienced in providing such services (i.e. consulting and implementation) in coordination with dedicated customer personnel, and whether the services result in significant modification or customization of the software’s functionality. When professional services qualify for separate accounting, professional services revenues under time and materials billing arrangements are recognized as the services are performed. Professional services revenues under fixed-priced contracts are generally recognized as the services are performed using a proportionate performance model with hours or costs as the input method of attribution.
When we provide professional services that are considered essential to the functionality of the software, the arrangement does not qualify for separate accounting of the license and service elements, and the license revenue is recognized together with the consulting services using the percentage-of-completion method of contract accounting. Under such arrangements, consideration is recognized as the services are performed as measured by an observable input. In these circumstances, we separate license revenue from service revenue for income statement presentation by allocating VSOE of fair value of the consulting services as service revenue, and the residual portion as license revenue. Under the percentage-of-completion method, we estimate the stage of completion of contracts with fixed or “not to exceed” fees based on hours or costs incurred to date as compared with estimated total project hours or costs at completion. Adjustments to estimates to complete are made in the periods in which facts resulting in a change become known. When total cost estimates exceed revenues, we accrue for the estimated losses when identified. The use of the proportionate performance and percentage-of-completion methods of accounting require significant judgment relative to estimating total contract costs or hours (hours being a proxy for costs), including assumptions relative to the length of time to complete the project, the nature and complexity of the work to be performed and anticipated changes in salaries and other costs.
Reimbursements of out-of-pocket expenditures incurred in connection with providing consulting services are included in professional services revenue, with the offsetting expense recorded in cost of professional services revenue.
Training services include on-site and classroom training. Training revenues are recognized as the related training services are provided.
Accounting for Income Taxes
As part of the process of preparing our consolidated financial statements, we are required to calculate our income tax expense based on taxable income by jurisdiction. There are many transactions and calculations about which the ultimate tax outcome is uncertain; as a result, our calculations involve estimates by management. Some of these uncertainties arise as a consequence of revenue-sharing, cost-reimbursement and transfer pricing arrangements among related entities and the differing tax treatment of revenue and cost items across various jurisdictions. If we were compelled to revise or to account differently for our arrangements, that revision could affect our tax liability.
The income tax accounting process also involves estimating our actual current tax liability, together with assessing temporary differences resulting from differing treatment of items for tax and accounting purposes. These differences result in deferred tax assets and liabilities, which are included within our consolidated balance sheets. We must then assess the likelihood that our deferred tax assets will be recovered from future taxable income and, to the extent we believe that it is more likely than not that all or a portion of our deferred tax assets will not be realized, we must establish a valuation allowance as a charge to income tax expense.
As of September 30, 2018, we have a valuation allowance of $108.6 million against net deferred tax assets in the U.S. and a valuation allowance of $33.3 million against net deferred tax assets in certain foreign jurisdictions. We have concluded, based on the weight of available evidence, that a full valuation allowance continues to be required against our U.S. net deferred tax assets as they are not more likely than not to be realized in the future. We will continue to reassess our valuation allowance requirements each financial reporting period.
The valuation allowance recorded against net deferred tax assets of certain foreign jurisdictions is established primarily for our net operating loss carryforwards, the majority of which do not expire. There
41
are limitations imposed on the utilization of such net operating losses that could further restrict the recognition of any tax benefits.
Prior to the passage of the U.S. Tax Act, the Company asserted that substantially all of the undistributed earnings of its foreign subsidiaries were considered indefinitely invested and accordingly, no deferred taxes were provided. Pursuant to the provisions of the U.S. Tax Act, these earnings were subjected to a one-time transition tax. We maintain our assertion to permanently reinvest these earnings outside the U.S. unless repatriation can be done with no significant tax cost, with the exception of a foreign holding company formed in 2018 and our Taiwan subsidiary. If we decide to repatriate any additional non-U.S. earnings in the future, we may be required to establish a deferred tax liability on such earnings. The amount of unrecognized deferred tax liability on the undistributed earnings would not be material.
In the normal course of business, PTC and its subsidiaries are examined by various taxing authorities, including the Internal Revenue Service (IRS) in the U.S. We regularly assess the likelihood of additional assessments by tax authorities and provide for these matters as appropriate. We are currently under audit by tax authorities in several jurisdictions. Audits by tax authorities typically involve examination of the deductibility of certain permanent items, transfer pricing, limitations on net operating losses and tax credits. Although we believe our tax estimates are appropriate, the final determination of tax audits and any related litigation could result in material changes in our estimates.
Valuation of Assets and Liabilities Acquired in Business Combinations
In accordance with business combination accounting, we allocate the purchase price of acquired companies to the tangible and intangible assets acquired and liabilities assumed based on their estimated fair values. Determining these fair values requires management to make significant estimates and assumptions, especially with respect to intangible assets.
Our identifiable intangible assets acquired consist of developed technology, core technology, tradenames, customer lists and contracts, and software support agreements and related relationships. Developed technology consists of products that have reached technological feasibility. Core technology represents a combination of processes, inventions and trade secrets related to the design and development of acquired products. Customer lists and contracts and software support agreements and related relationships represent the underlying relationships and agreements with customers of the acquired company’s installed base. We have generally valued intangible assets using a discounted cash flow model. Critical estimates in valuing certain of the intangible assets include but are not limited to:
• | future expected cash flows from software license sales, customer support agreements, customer contracts and related customer relationships and acquired developed technologies and trademarks and trade names; |
• | expected costs to develop the in-process research and development into commercially viable products and estimating cash flows from the projects when completed; |
• | the acquired company’s brand awareness and market position, as well as assumptions about the period of time the acquired brand will continue to be used by the combined company; and |
• | discount rates used to determine the present value of estimated future cash flows. |
In addition, we estimate the useful lives of our intangible assets based upon the expected period over which we anticipate generating economic benefits from the related intangible asset.
Net tangible assets consist of the fair values of tangible assets less the fair values of assumed liabilities and obligations. Except for deferred revenues, net tangible assets were generally valued by us at the respective carrying amounts recorded by the acquired company, if we believed that their carrying values approximated their fair values at the acquisition date. The values assigned to deferred revenue reflect an amount equivalent to the estimated cost plus an appropriate profit margin to perform the services related to the acquired company’s software support contracts.
In addition, uncertain tax positions and tax related valuation allowances assumed in connection with a business combination are initially estimated as of the acquisition date and we reevaluate these items quarterly with any adjustments to our preliminary estimates being recorded to goodwill provided that we are within the measurement period (up to one year from the acquisition date) and we continue
42
to collect information in order to determine their estimated values. Subsequent to the measurement period or our final determination of the estimated value of uncertain tax positions or tax related valuation allowances, whichever comes first, changes to these uncertain tax positions and tax related valuation allowances will affect our provision for income taxes in our Consolidated Statements of Operations.
Our estimates of fair value are based upon assumptions believed to be reasonable at that time, but which are inherently uncertain and unpredictable. Assumptions may be incomplete or inaccurate, and unanticipated events and circumstances may occur, which may affect the accuracy or validity of such assumptions, estimates or actual results.
When events or changes in circumstances indicate that the carrying value of a finite-lived intangible asset may not be recoverable, we perform an assessment of the asset for potential impairment. This assessment is based on projected undiscounted future cash flows over the asset’s remaining life. If the carrying value of the asset exceeds its undiscounted cash flows, we record an impairment loss equal to the excess of the carrying value over the fair value of the asset, determined using projected discounted future cash flows of the asset.
Valuation of Goodwill
Our goodwill totaled $1,182.5 million and $1,182.8 million as of September 30, 2018 and 2017, respectively. We assess goodwill for impairment at the reporting unit level. Our reporting units are determined based on the components of our operating segments that constitute a business for which discrete financial information is available and for which operating results are regularly reviewed by segment management. We have two operating and reportable segments: (1) Software Products and (2) Professional Services.
As of September 30, 2018, goodwill and acquired intangible assets in the aggregate attributable to our Software Products and Professional Services segment was $1,352.4 million and $30.2 million, respectively. As of September 30, 2017, goodwill and acquired intangible assets in the aggregate attributable to our Software Products and Professional Services segment was $1,410.0 million and $30.6 million, respectively. We test goodwill for impairment in the third quarter of our fiscal year, or on an interim basis if an event occurs or circumstances change that would, more likely than not, reduce the fair value of a reporting segment below its carrying value. Factors we consider important (on an overall company basis and reportable segment basis, as applicable) that could trigger an impairment review include significant underperformance relative to historical or projected future operating results, significant changes in our use of the acquired assets or a significant change in the strategy for our business, significant negative industry or economic trends, a significant decline in our stock price for a sustained period, or a reduction of our market capitalization relative to net book value.
We completed our annual goodwill impairment review as of June 30, 2018 based on a qualitative assessment. Our qualitative assessment included company specific (financial performance and long-range plans), industry, and macroeconomic factors, and consideration of the fair value of each reporting unit, which was approximately double its carrying value or higher at July 2, 2016, the last valuation date. Based on our qualitative assessment, we believe it is more likely than not that the fair values of our reporting units exceed their carrying values and no further impairment testing is required.
Accounting for Pensions
We sponsor several international pension plans. We make assumptions that are used in calculating the expense and liability of these plans. These key assumptions include the expected long-term rate of return on plan assets and the discount rate used to determine the present value of benefit obligations. In selecting the expected long-term rate of return on assets, we consider the average future rate of earnings expected on the funds invested to provide for the benefits under the pension plan. This includes considering the plans' asset allocations and the expected returns likely to be earned over the life of the plans. The discount rate reflects the estimated rate at which an amount that is invested in a portfolio of high-quality debt instruments would provide the future cash flows necessary to pay benefits when they come due. The actuarial assumptions used by us may differ materially from actual results due to changing market and economic conditions or longer or shorter life spans of the participants. Our actual results could differ materially from those we estimated, which could require us to record a greater amount of pension expense in future years and/or require higher than expected cash contributions.
43
Accounting and reporting for these plans requires the use of country-specific assumptions for discount rates and expected rates of return on assets. We apply a consistent methodology in determining the key assumptions that, in addition to future experience assumptions such as mortality rates, are used by our actuaries to determine our liability and expense for each of these plans. The discount rate for Germany was selected with reference to a spot-rate yield curve based on the yields of AA-rated Euro-denominated corporate bonds. In addition, our actuarial consultants determine the expense and liabilities of the plan using other assumptions for future experience, such as mortality rates. In determining our pension cost for 2018, 2017, and 2016, we used weighted average discount rates of 1.8%, 1.3% and 2.2%, respectively, and weighted average expected returns on plan assets of 5.4%, 5.4% and 5.7%, respectively. In 2018, 2017 and 2016, our actual return (loss) on plan assets was $1.0 million, $6.3 million and $1.7 million, respectively. If actual returns are below our expected rates of return, it will impact the amount and timing of future contributions and expense for these plans.
As of September 30, 2018 and 2017, our plans in total were underfunded, representing the difference between our projected benefit obligation and fair value of plan assets, by $17.7 million and $16.7 million, respectively. The projected benefit obligation as of September 30, 2018 was determined using a weighted average discount rate of 1.9%. The most sensitive assumptions used in calculating the expense and liability of our pension plans are the discount rate and the expected return on plan assets. Total GAAP net periodic pension cost was $0.9 million in 2018 and we expect it to be approximately $1.2 million in 2019. A 50 basis point change to our discount rate and expected return on plan assets assumptions would have changed our pension expense for the year ended September 30, 2018 by approximately $1 million. A 50 basis point decrease in our discount rate assumptions would increase our projected benefit obligation as of September 30, 2018 by approximately $7 million.
Legal Contingencies
We are periodically subject to various legal claims and involved in various legal proceedings. We routinely review the status of each significant matter and assess our potential financial exposure. If the potential loss from any matter is considered probable and the amount can be reasonably estimated, we record a liability for the estimated loss. Significant judgment is required in both the determination of probability and the determination as to whether the amount of an exposure is reasonably estimable. Because of inherent uncertainties related to these legal matters, we base our loss accruals on the best information available at the time. Further, estimates of this nature are highly subjective, and the final outcome of these matters could vary significantly from the amounts that have been included in the accompanying Consolidated Financial Statements. As additional information becomes available, we reassess our potential liability and may revise our estimates. Such revisions could have a material impact on future quarterly or annual results of operations.
Liquidity and Capital Resources
September 30, | |||||||||||
2018 | 2017 | 2016 | |||||||||
(in thousands) | |||||||||||
Cash and cash equivalents | $ | 259,946 | $ | 280,003 | $ | 277,935 | |||||
Marketable securities | 55,951 | 50,315 | 49,616 | ||||||||
Total | $ | 315,897 | $ | 330,318 | $ | 327,551 | |||||
Activity for the year included the following: | |||||||||||
Cash provided by operating activities | $ | 247,811 | $ | 135,234 | $ | 183,261 | |||||
Cash used by investing activities | (49,212 | ) | (16,127 | ) | (237,156 | ) | |||||
Cash provided (used) by financing activities | (210,846 | ) | (118,105 | ) | 51,606 | ||||||
Cash and cash equivalents
We invest our cash with highly rated financial institutions and in diversified domestic and international money market mutual funds. Cash and cash equivalents include highly liquid investments with original
44
maturities of three months or less. In addition, we hold investments in marketable securities totaling approximately $56.0 million with an average maturity of 14 months. At September 30, 2018, cash and cash equivalents totaled $259.9 million, compared to $280.0 million at September 30, 2017, reflecting $247.8 million in operating cash flow, $1,015.7 million of proceeds from issuance of common stock, of which $1 billion was related to an investment in PTC by Rockwell Automation and the remainder of which relates to common stock issued under our employee stock purchase plan. The proceeds from the Rockwell Automation investment were used in part for repurchases of $1,100.0 million in common stock. In addition, we made $70.0 million of net repayments under our credit facility, $45.4 million was used to pay withholding taxes on stock-based awards that vested in the period, $36.0 million was used for capital expenditures, $8.9 million was used for the payment of contingent consideration, $6.0 million was used to purchase business and intangible assets, and $6.2 million was used to purchase marketable securities, net of proceeds from maturities.
Cash provided by operating activities
Cash provided by operating activities was $247.8 million in 2018 compared to $135.2 million in 2017 and $183.3 million in 2016. The increase in 2018 is primarily due to higher cash collection of accounts receivable of $129.0 million, an increase in net income of $45.7 million, lower restructuring payments ($34.3 million year over year) and a $12 million payment related to a Korean tax audit made in 2017.
The decrease in 2017 compared to 2016 was primarily due to an increase in bonus and commission payments of approximately $33 million, lower cash collections from accounts receivable of $27 million (due to higher 2016 collections of receivables with extended payment terms and a higher subscription mix in 2017), higher interest payments of approximately $26 million, and a $12 million payment related to a Korean tax audit, partially offset by a $35 million increase in cash flows from accounts payable and accrued expenses due to renegotiations with vendors and more effective utilization of available payment terms, $18 million of lower restructuring payments and $28 million paid in 2016 to resolve the regulatory investigation with respect to our China business.
Restructuring payments totaled $2.8 million in 2018, compared to $37.1 million in 2017 and $55.0 million in 2016. Cash paid for income taxes was $22.6 million, $35.4 million, and $25.5 million in 2018, 2017, and 2016, respectively.
Cash used by investing activities
Year ended September 30, | |||||||||||
2018 | 2017 | 2016 | |||||||||
(in thousands) | |||||||||||
Acquisitions of businesses, net of cash acquired | $ | (3,000 | ) | $ | (4,960 | ) | $ | (165,802 | ) | ||
Additions to property and equipment | (36,041 | ) | (25,444 | ) | (26,189 | ) | |||||
Purchases of short- and long-term marketable securities | (24,311 | ) | (19,726 | ) | (44,605 | ) | |||||
Proceeds from maturities of short- and long-term marketable securities | 18,140 | 18,785 | — | ||||||||
Proceeds from sales of investments | — | 15,218 | — | ||||||||
Purchase on intangible asset | (3,000 | ) | — | — | |||||||
Purchases of investments | (1,000 | ) | — | (560 | ) | ||||||
$ | (49,212 | ) | $ | (16,127 | ) | $ | (237,156 | ) | |||
The 2018 increase in property, plant and equipment payments is primarily attributable to expenditures made for construction of our new worldwide headquarters in the Boston Seaport District. We also used net $6 million to purchase additional marketable securities, $3 million to acquire developed software, $3 million for a small business acquisition and $1 million for a small investment in a technology company.
In 2017, we spent approximately $5 million on acquisitions and sold a minority investment in preferred stock for approximately $15 million.
In 2016, we acquired Kepware for $99.4 million, net of cash acquired, and Vuforia for $64.8 million, net of cash acquired. In 2016, we initiated an ongoing investment strategy whereby a portion of
45
available cash balances were used to purchase investment grade securities with maturities up to three years.
Our expenditures for property and equipment consist primarily of computer equipment, software, office equipment and facility improvements.
Cash provided (used) by financing activities
Year ended September 30, | |||||||||||
2018 | 2017 | 2016 | |||||||||
(in thousands) | |||||||||||
Borrowings under debt agreements | $ | 250,000 | $ | 150,000 | $ | 670,000 | |||||
Repayments of borrowings under credit facility | (320,000 | ) | (190,000 | ) | (580,000 | ) | |||||
Repurchases of common stock | (1,100,000 | ) | (50,991 | ) | — | ||||||
Proceeds from issuance of common stock | 1,015,654 | 10,778 | 21 | ||||||||
Payments of withholding taxes in connection with vesting of stock-based awards | (45,374 | ) | (26,654 | ) | (20,939 | ) | |||||
Excess tax benefits from stock-based awards | |||||||||||
Credit facility origination costs | (2,851 | ) | (184 | ) | (6,855 | ) | |||||
Contingent consideration | (8,275 | ) | (11,054 | ) | (10,621 | ) | |||||
$ | (210,846 | ) | $ | (118,105 | ) | $ | 51,606 | ||||
In 2018, we resumed our stock repurchase program and used $1,100.0 million to repurchase our common stock. For the repurchases made in 2018, we used $1 billion from an equity investment in PTC made by Rockwell Automation and $100 million in cash provided by operating activities. Proceeds from issuance of common stock of $1,015.7 million includes $1 billion from the Rockwell Automation investment in PTC and $15.7 million of proceeds from our employee stock purchase plan. In 2018, we repaid $70.0 million under our credit facility. In 2018, credit facility origination costs included costs associated with the modification of our credit facility.
Credit Agreement
In September 2018, we amended and restated our existing credit facility to increase the revolving loan commitment from $600 million to $700 million and amend other provisions. The credit facility is a multi-currency credit facility with a syndicate of sixteen banks for which JPMorgan Chase Bank, N.A. acts as Administrative Agent. Outstanding revolving loan amounts may be repaid in whole or in part, without penalty or premium, prior to the September 13, 2023 maturity date, when all remaining amounts outstanding will be due and payable in full.
We use the credit facility for general corporate purposes, including acquisitions of businesses, share repurchases and working capital requirements. As of September 30, 2018, we had $148.1 million in revolving loans outstanding under the credit facility, the fair value of which approximated its book value. As of September 30, 2018, we have approximately $552 million undrawn, of which $535 million would be available to borrow, the availability of which is reduced by letters of credit and certain other long-term liabilities.
Any borrowings by PTC Inc. or certain of our foreign subsidiaries under the credit facility would be guaranteed, respectively, by our material domestic subsidiaries that become parties to the subsidiary guaranty, if any, and/or by PTC Inc. Borrowings are also secured by first priority liens on property of PTC and certain of our material domestic subsidiaries, including 100% of the voting equity interests of certain of our domestic subsidiaries and 65% of our material first-tier foreign subsidiaries. Loans under the credit facility bear interest at variable rates that reset every 30 to 180 days depending on the rate and period selected by us and based upon our total leverage ratio. During 2018, the weighted average annual interest rate for all borrowings outstanding was 5.17% and, as of September 30, 2018, the rate on the credit facility was 3.8%. We also pay a quarterly commitment fee on the undrawn portion of the credit facility ranging from 0.175% to 0.30% per year based on our total leverage ratio.
The credit facility imposes customary covenants that limit our ability to incur liens or guarantee obligations, pay dividends and make other distributions, make investments and engage in certain other transactions. In addition, we and our material domestic subsidiaries may not invest in, or loan to, our
46
foreign subsidiaries in aggregate amounts exceeding $100 million for any purpose and an additional $200 million for acquisitions of businesses. We also must maintain the following financial ratios:
Ratio as of September 30, 2018 | |||
Total Leverage Ratio Ratio of consolidated total indebtedness to the consolidated trailing four quarters EBITDA, not to exceed 4.50 to 1.00 as of the last day of any fiscal quarter. | 2.36 | to | 1.00 |
Interest Coverage Ratio Ratio of consolidated trailing four quarters EBITDA to consolidated trailing four quarters cash basis interest expense, to be not less than 3.00 to 1.00. | 6.18 | to | 1.00 |
Senior Secured Leverage Ratio Ratio of senior consolidated total indebtedness (which excludes unsecured indebtedness) to consolidated trailing four quarters EBITDA as of the last day of any fiscal quarter, not to exceed 3.00 to 1.00. | 0.58 | to | 1.00 |
Any failure to comply with such covenants would prevent us from being able to borrow additional funds, and would constitute a default, permitting the lenders to, among other things, accelerate the amounts outstanding and terminate the credit facility. As of September 30, 2018, we were in compliance with all financial and operating covenants of the credit facility.
Outstanding Notes
On May 12, 2016, we issued $500 million of 6.00% Senior Notes due 2024 (the “2024 6% Notes”) in a registered offering and used the net proceeds to repay indebtedness under our senior credit facility. As of September 30, 2018, unamortized deferred financing fees associated with the offering and presented as a direct reduction from the carrying amount of the 2024 6% Notes were $4.9 million.
The 2024 6% Notes are unsecured, mature on May 15, 2024, and bear interest at a rate of 6.00% per annum, payable semi-annually (November and May). At any time before May 15, 2019, (i) we may redeem up to 40% of the aggregate principal amount of the 2024 6% Notes with the net cash proceeds of certain public equity offerings at a price equal to 106.00% of the aggregate principal amount redeemed plus accrued and unpaid interest, provided that at least 60% of the 2024 6% Notes that were originally issued remain outstanding immediately thereafter, and (ii) we may redeem some or all of the 2024 6% Notes at a price equal to 100% of the aggregate principal amount plus accrued and unpaid interest and a make-whole premium. On or after May 15, 2019, we may redeem some or all of the 2024 6% Notes at redemption prices specified in the 2024 6% Notes plus accrued and unpaid interest. In addition, if we undergo a change of control, we will be required to make an offer to purchase all the 2024 6% Notes at a price equal to 101% of the principal amount of the 2024 6% Notes plus accrued and unpaid interest.
The notes were issued under an indenture that contains customary covenants. Subject to certain exceptions, our ability to incur certain additional debt is limited unless, after giving pro forma effect to such incurrence and the application of the proceeds thereof, the ratio of our EBITDA to our Consolidated Fixed Charges (as both terms are defined in the indenture) is not greater than 2.00 to 1.00. The indenture also restricts our ability to incur liens, pay dividends or make certain other distributions, sell assets or engage in sale/leaseback transactions. Any failure to comply with these and other covenants included in the indenture could constitute an event of default that could result in the acceleration of the payment of the aggregate principal amount of 2024 6% Notes then outstanding and accrued interest. As of September 30, 2018, we were in compliance with all such covenants.
47
Share Repurchase Authorization
Our Articles of Organization authorize us to issue up to 500 million shares of our common stock. Our Board of Directors has authorized us to repurchase up to $1,500 million of our common stock for the October 1, 2017 through September 30, 2020 period. We intend to use cash from operations and borrowings under our credit facility to make such repurchases. All shares of our common stock repurchased are automatically restored to the status of authorized and unissued.
In 2018, we repurchased 9.4 million shares. The repurchases were made under two accelerated repurchase (ASR) agreements. We completed the $100 million ASR repurchase in the third quarter of 2018. We entered into a $1,000 million ASR in July 2018. Shares valued at $800 million in the aggregate were delivered to us upon entry into the ASR. The remaining $200 million represents the amount held back by the bank counterparty pending final settlement of the ASR, which is expected to occur in the second or third quarter of 2019. Upon settlement of the ASR, the total shares repurchased by us will equal $1,000 million divided by the average daily volume weighted-average price of our common stock during the term of the ASR program less a fixed per share discount. We used the $1 billion in proceeds from the Rockwell Automation equity investment in PTC and $100 million of cash from operations to make the repurchases.
In 2017, we repurchased 0.9 million shares at cost of $51.0 million. In 2016, we did not repurchase any shares due to our transition to a subscription business model and the near-term impact on free cash flow and EBITDA.
Expectations for Fiscal 2019
Our transition to a subscription licensing model has had, and will continue to have, an adverse impact on revenue, operating margin and EPS relative to periods in which we primarily sold perpetual licenses until the expected transition of our customer base to subscription is completed. This also affects consolidated EBITDA as calculated under our credit facility and, as a result of the Total Leverage Ratio under the facility, limits the amount we can borrow under the facility. Notwithstanding the effect of the subscription transition and those limitations, we believe that existing cash and cash equivalents, together with cash generated from operations and amounts available under the credit facility, will be sufficient to meet our working capital and capital expenditure requirements (which we expect to be $40 million in 2019) through at least the next twelve months and to meet our known long-term capital requirements.
Our expected uses of cash could change, our cash position could be reduced and we could incur additional debt obligations if we purchase our outstanding shares or retire debt or engage in strategic transactions, any of which could be commenced, suspended or completed at any time. Any such purchases or retirement of debt will depend on prevailing market conditions, our liquidity requirements, contractual restrictions and other factors. We also evaluate possible strategic transactions on an ongoing basis and at any given time may be engaged in discussions or negotiations with respect to possible strategic transactions. The amounts involved in any share or debt repurchases or strategic transactions may be material.
We ended 2018 with a cash balance of $260 million and marketable securities of $56 million. A significant portion of our cash is generated and held outside of the United States. At September 30, 2018, we had cash and cash equivalents of $29.6 million in the United States, $88.5 million in Europe, $95.6 million in the Pacific Rim (including India), $14.8 million in Japan and $31.4 million in other non-U.S. countries. All of the marketable securities are held in Europe. We have substantial cash requirements in the United States, but we believe that the combination of our existing U.S. cash and cash equivalents, marketable securities, and future U.S. operating cash flows and cash available under our credit facility, will be sufficient to meet our ongoing U.S. operating expenses and known capital requirements.
48
Contractual Obligations
At September 30, 2018, our contractual obligations were as follows:
Payments due by period | |||||||||||||||||||
Contractual Obligations | Total | Less than 1 year | 1-3 years | 3-5 years | More than 5 years | ||||||||||||||
(in millions) | |||||||||||||||||||
Debt (1) | $ | 863.2 | $ | 37.1 | $ | 74.2 | $ | 222.0 | $ | 530.0 | |||||||||
Operating leases (2) | 352.7 | 38.7 | 66.9 | 46.6 | 200.5 | ||||||||||||||
Purchase obligations (3) | 115.5 | 88.5 | 26.7 | 0.2 | — | ||||||||||||||
Pension liabilities (4) | 17.7 | 2.6 | 5.6 | 6.4 | 3.2 | ||||||||||||||
Unrecognized tax benefits (5) | 9.8 | ||||||||||||||||||
Total | $ | 1,358.9 | $ | 166.9 | $ | 173.4 | $ | 275.2 | $ | 733.7 | |||||||||
(1) | Includes required principal repayments and interest and commitment fees on our 2024 6% Notes and our revolving credit facility based on the balance outstanding as of September 30, 2017 and the interest rates in effect as of September 30, 2018, 6.0% for our 2024 6% Notes and 3.8% for our revolving credit facility. The credit facility matures on September 13, 2023, when all remaining amounts outstanding will be due and payable in full. Principal and interest on any additional borrowing that may be required to refinance the credit facility upon its maturity are not included in the contractual obligations above. |
(2) | The future minimum lease payments above include minimum future lease payments for excess facilities under non-cancelable operating leases. These leases qualify for operating lease accounting treatment and, as such, are not included on our balance sheet. See Note I. Commitments and Contingencies of Notes to Consolidated Financial Statements in this Annual Report for additional information regarding our operating leases. On September 7, 2017, we entered into a lease for approximately 250,000 square feet located at 121 Seaport Boulevard, Boston, Massachusetts. The term of the lease is expected to run from January 1, 2019 through June 30, 2037, subject to adjustment based on the initial occupancy date. Base rent for the first year of the lease is $11.0 million and will increase by $1 per square foot leased per year thereafter ($0.3 million per year). Base rent which first becomes payable on July 1, 2020, subject to adjustment based on the lease commencement date, is included in the operating lease obligations above. In addition to the base rent, PTC must pay its pro rata portions of building operating costs and real estate taxes (together, “Additional Rent”). Additional rent, equal to approximately 63% of total building operating costs and real estate taxes, is estimated to be approximately $5.9 million for the first year we begin paying rent and is not included in the operating lease payments above. |
(3) | Purchase obligations represent minimum commitments due to third parties, including royalty contracts, research and development contracts, telecommunication contracts, information technology maintenance contracts in support of internal-use software and hardware and other marketing and consulting contracts. Contracts for which our commitment is variable, based on volumes, with no fixed minimum quantities, and contracts that can be canceled without payment penalties have been excluded. The purchase obligations included above are in addition to amounts included in current liabilities and prepaid expenses recorded on our September 30, 2018 consolidated balance sheet. |
(4) | These obligations relate to our international pension plans and are not subject to fixed payment terms. Payments have been estimated based on the plans’ current funded status, planned employer contributions and actuarial assumptions. In addition, we may, at our discretion, make additional voluntary contributions to the plans. See Note M. Pension Plans of Notes to Consolidated Financial Statements in this Annual Report for further discussion. |
(5) | As of September 30, 2018, we had recorded total unrecognized tax benefits of $9.8 million. This liability is not subject to fixed payment terms and the amount and timing of payments, if any, which we will make related to this liability, are not known. See Note G. Income Taxes of Notes to Consolidated Financial Statements in this Annual Report for additional information. |
As of September 30, 2018, we had letters of credit and bank guarantees outstanding of approximately $15.5 million (of which $1.1 million was collateralized), primarily related to our corporate headquarters lease in Needham, Massachusetts.
49
Off-Balance Sheet Arrangements
We have not created, and are not party to, any special-purpose or off-balance sheet entities for the purpose of raising capital, incurring debt or operating parts of our business that are not consolidated (to the extent of our ownership interest therein) into our financial statements. We have not entered into any transactions with unconsolidated entities whereby we have subordinated retained interests, derivative instruments or other contingent arrangements that expose us to material continuing risks, contingent liabilities, or any other obligation under a variable interest in an unconsolidated entity that provides financing, liquidity, market risk or credit risk support to us.
Recent Accounting Pronouncements
In accordance with recently issued accounting pronouncements, we will be required to comply with certain changes in accounting rules and regulations. Refer to Note B. Summary of Significant Accounting Policies to the Condensed Consolidated Financial Statements in this Form 10-K for all recently issued accounting pronouncements. We are currently evaluating the impact of the new guidance on our consolidated financial statements. Outlined below are the recent accounting pronouncements that we believe will have the most significant impact on us.
Income Taxes
In October 2016, the FASB issued ASU 2016-16, Income Taxes (Topic 740): Intra-Entity Transfers of Assets Other Than Inventory (“ASU 2016-16”). The purpose of ASU 2016-16 is to simplify the income tax accounting of an intra-entity transfer of an asset other than inventory and to record its effect when the transfer occurs. The guidance is effective for annual reporting periods beginning after December 15, 2017 (our fiscal 2019) including interim reporting periods within those annual reporting periods and early adoption is permitted. We are currently evaluating the impact of the new guidance on our consolidated financial statements. We expect to record a net deferred tax asset of approximately $72 million upon adoption, primarily relating to deductible amortization of intangible assets in Ireland. Post adoption, our effective tax rate will no longer include the benefit of this amortization, which is reflected in our effective tax rate reconciliation under the current guidance.
Leases
In February 2016, the FASB issued ASU No. 2016-02, Leases (Topic 842), which will replace the existing guidance in ASC 840, Leases. The updated standard aims to increase transparency and comparability among organizations by requiring lessees to recognize lease assets and lease liabilities on the balance sheet and to disclose important information about leasing arrangements. ASU 2016-02 is effective for annual periods beginning after December 15, 2018 (our fiscal 2020) and interim periods within those annual periods. Early adoption is permitted and modified retrospective application is required. We are currently evaluating the impact of the new guidance on our consolidated financial statements.
Revenue Recognition
In May 2014, the FASB issued ASU No. 2014-09, Revenue from Contracts with Customers: Topic 606 (ASC 606). ASC 606 supersedes nearly all existing revenue recognition guidance under U.S. GAAP. The FASB has also issued additional standards to provide clarification and implementation guidance on ASC 606.
The core principle of ASC 606 is to recognize revenue when promised goods or services are transferred to a customer in an amount that reflects the consideration that is expected to be received for those goods or services. Under the new guidance, an entity is required to evaluate revenue recognition through a five-step process: (1) identifying a contract with a customer; (2) identifying the performance obligations in the contract; (3) determining the transaction price; (4) allocating the transaction price to the performance obligations in the contract; and (5) recognizing revenue when (or as) the entity satisfies a performance obligation. The standard also requires disclosure of the nature, amount, timing and uncertainty of revenue and cash flows arising from contracts with customers. In applying the principles of ASC 606, it is possible more judgment and estimates may be required within the revenue recognition process than is required under existing U.S. GAAP, including identifying performance obligations, estimating the amount of variable consideration to include in the transaction price, and estimating the value of each performance obligation to allocate the total transaction price to each separate performance obligation.
ASC 606 is effective for us in the first quarter of our fiscal 2019. Companies may adopt ASC 606 using either the retrospective method, under which each prior reporting period is presented under ASC 606,
50
with the option to elect certain permitted practical expedients, or the modified retrospective method, under which a company adopts ASC 606 from the beginning of the year of initial application with no restatement of comparative periods, with the cumulative effect of initially applying ASC 606 recognized at the date of initial application, and with certain additional required disclosures. We are adopting ASC 606 using the modified retrospective method.
While we are continuing to assess the impact of the new standard, we currently believe the most significant impact relates to accounting for our subscription arrangements that include term-based on-premise software licenses bundled with support and/or cloud services. Under current GAAP, the revenue attributable to these subscription licenses bundled with support is recognized ratably over the term of the arrangement because VSOE does not exist for the undelivered support element as it is not sold separately. Under the new standard, the requirement to have VSOE for undelivered elements to enable the separation of revenue for the delivered software licenses is eliminated. Accordingly, under the new standard we will be required to recognize as revenue a portion of the subscription fee upon delivery of the software license. For subscriptions arrangements that also include cloud services, the company assessed whether the cloud component was highly interrelated with the on-premise term software license. Other than a limited population of subscriptions, the cloud component is currently not deemed to be interrelated with the on-premise term software and as a result, cloud services will be accounted for as a separate distinct performance obligation. We do have a limited number of subscriptions that incorporate substantial cloud services where cloud services are not distinct from the on-premise term license in the context of the contracts as they are considered highly interrelated and represent a single performance obligation, for which the revenue will continue to be recognized over time. We currently expect revenue related to our perpetual license revenue and related support contracts, professional services and cloud offerings to remain substantially unchanged. Due to the complexity of certain of our contracts, the actual revenue recognition treatment required under the new standard may be dependent on contract-specific terms and, therefore, may vary in some instances.
Upon implementation of the new standard in fiscal 2019, we expect to make revisions to contract terms with our customers for new orders that will result in shortening the initial, non-cancellable term of our multi-year subscriptions to one year. This change will result in annual contractual periods for the majority of our software subscriptions, the license portion of which will be recognized at the beginning of each annual contract period upon delivery of the licenses and the support portion of which will be recognized ratably over the one year contractual period. As a result, we anticipate one year of subscription revenue will be recognized for each contract each year; however, more of the revenue will be recognized in the quarter that the contract period begins and less will be recognized in the subsequent three quarters of the contract than under the current accounting rules.
Under the modified retrospective method, we will evaluate each contract that is ongoing on the adoption date as if that contract had been accounted for under ASC 606 from contract inception. Some license revenue related to subscription arrangements that would have been recognized in future periods under current GAAP will be recast under ASC 606 as if the revenue had been recognized in prior periods. Under this transition method, we will not adjust historical reported revenue amounts. Instead, the revenue that would have been recognized under this method prior to the adoption date will be an adjustment to retained earnings and will not be recognized as revenue in future periods as previously planned. Because we expect that license revenue associated with subscription contracts will be recognized up front instead of over time under ASC 606, we expect approximately $350 million to $380 million will be adjusted to retained earnings upon adoption related to billed and unbilled deferred revenue. During the first year of adoption, we will disclose the amount of this retained earnings adjustment and intend to provide supplemental disclosure of how this revenue would have been recognized under the current rules.
Another significant provision under ASC 606 includes the capitalization and amortization of costs associated with obtaining and fulfilling a contract. Currently, substantially all of these costs are expensed in the period incurred. Under ASC 606, direct and incremental costs to acquire a contract are capitalized and amortized using a systematic basis over the pattern of transfer of the goods and services to which the asset relates. Under ASC 606, we estimate approximately $70 million of commission costs will be capitalized and amortized over the period the capitalized assets are expected to contribute to future cash flows.
Furthermore, we have made and will continue to make investments in systems and processes to enable timely and accurate reporting under the new standard. We are implementing operational and internal control structural changes.
51
ITEM 7A.Quantitative and Qualitative Disclosures about Market Risk
We face exposure to financial market risks, including adverse movements in foreign currency exchange rates and changes in interest rates. These exposures may change over time as business practices evolve and could have a material adverse impact on our financial results.
Foreign currency exchange risk
Our earnings and cash flows are subject to fluctuations due to changes in foreign currency exchange rates. Our most significant foreign currency exposures relate to Western European countries, Japan, Israel, China and Canada. We enter into foreign currency forward contracts to manage our exposure to fluctuations in foreign exchange rates that arise from receivables and payables denominated in foreign currencies. We do not enter into or hold foreign currency derivative financial instruments for trading or speculative purposes nor do we enter into derivative financial instruments to hedge future cash flow or forecast transactions.
Our non-U.S. revenues generally are transacted through our non-U.S. subsidiaries and typically are denominated in their local currency. In addition, expenses that are incurred by our non-U.S. subsidiaries typically are denominated in their local currency. In 2018, 2017, and 2016, approximately two-thirds of our revenue and half of our expenses were transacted in currencies other than the U.S. dollar. Currency translation affects our reported results because we report our results of operations in U.S. Dollars. Historically, our most significant currency risk has been changes in the Euro and Japanese Yen relative to the U.S. Dollar. Based on current revenue and expense levels (excluding restructuring charges and stock-based compensation), a $0.10 change in the USD to European exchange rates and a 10 Yen change in the Yen to USD exchange rate would impact operating income by approximately $16 million and $6 million, respectively.
Our exposure to foreign currency exchange rate fluctuations arises in part from intercompany transactions, with most intercompany transactions occurring between a U.S. dollar functional currency entity and a foreign currency denominated entity. Intercompany transactions typically are denominated in the local currency of the non-U.S. dollar functional currency subsidiary in order to centralize foreign currency risk. Also, both PTC (the parent company) and our non-U.S. subsidiaries may transact business with our customers and vendors in a currency other than their functional currency (transaction risk). In addition, we are exposed to foreign exchange rate fluctuations as the financial results and balances of our non-U.S. subsidiaries are translated into U.S. dollars (translation risk). If sales to customers outside of the United States increase, our exposure to fluctuations in foreign currency exchange rates will increase.
Our foreign currency risk management strategy is principally designed to mitigate the future potential financial impact of changes in the U.S. dollar value of balances denominated in foreign currency, resulting from changes in foreign currency exchange rates. Our foreign currency hedging program uses forward contracts to manage the foreign currency exposures that exist as part of our ongoing business operations. The contracts primarily are denominated in Canadian Dollars and European currencies, and have maturities of less than three months.
Generally, we do not designate foreign currency forward contracts as hedges for accounting purposes, and changes in the fair value of these instruments are recognized immediately in earnings. Because we enter into forward contracts only as an economic hedge, any gain or loss on the underlying foreign-denominated balance would be offset by the loss or gain on the forward contract. Gains and losses on forward contracts and foreign denominated receivables and payables are included in foreign currency net losses.
52
As of September 30, 2018 and 2017, we had outstanding forward contracts for derivatives not designated as hedging instruments with notional amounts equivalent to the following:
September 30, | |||||||
Currency Hedged | 2018 | 2017 | |||||
(in thousands) | |||||||
Canadian / U.S. Dollar | $ | 7,334 | $ | 12,809 | |||
Euro / U.S. Dollar | 297,730 | 244,000 | |||||
British Pound / U.S. Dollar | 7,074 | 907 | |||||
Israeli Sheqel / U.S. Dollar | 9,778 | 8,820 | |||||
Japanese Yen / Euro | — | 17,694 | |||||
Japanese Yen / U.S. Dollar | 37,456 | 3,198 | |||||
Swiss Franc / U.S. Dollar | 11,944 | 605 | |||||
Swiss Franc / Euro | — | 7,157 | |||||
Swedish Krona / U.S. Dollar | 18,207 | 4,627 | |||||
Chinese Yuan offshore / Euro | — | 10,423 | |||||
Singapore Dollar / U.S. Dollar | 1,314 | 1,186 | |||||
Chinese Renminbi/U.S. Dollar | 9,010 | — | |||||
All other | 6,109 | 7,093 | |||||
Total | $ | 405,956 | $ | 318,519 | |||
As of September 30, 2018 and 2017, we had outstanding forward contracts designated as cash flow hedges with notional amounts equivalent to the following:
September 30, | |||||||
Currency Hedged | 2018 | 2017 | |||||
(in thousands) | |||||||
Euro / U.S. Dollar | $ | 8,495 | $ | 64,831 | |||
Japanese Yen / U.S. Dollar | 2,193 | 22,675 | |||||
SEK / U.S. Dollar | 1,708 | 14,091 | |||||
Total | $ | 12,396 | $ | 101,597 | |||
Debt
In addition to amounts due under our 2024 6% Notes as described above, as of September 30, 2018, we had $148.1 million outstanding under our variable-rate credit facility. Loans under the credit facility bear interest at variable rates which reset every 30 to 180 days depending on the rate and period selected by us. These loans are subject to interest rate risk as interest rates will be adjusted at each rollover date to the extent such amounts are not repaid. As of September 30, 2018, the annual rate on the credit facility loans was 3.8%. If there was a hypothetical 100 basis point change in interest rates, the annual net impact to earnings and cash flows would be $1.5 million. This hypothetical change in cash flows and earnings has been calculated based on the borrowings outstanding at September 30, 2017 and a 100 basis point per annum change in interest rate applied over a one-year period.
Cash and cash equivalents
As of September 30, 2018, cash equivalents were invested in highly liquid investments with maturities of three months or less when purchased. We invest our cash with highly rated financial institutions in North America, Europe and Asia-Pacific and in diversified domestic and international money market mutual funds. At September 30, 2018, we had cash and cash equivalents of $29.6 million in the United States, $88.5 million in Europe, $95.6 million in the Pacific Rim (including India), $14.8 million in Japan and $31.4 million in other non-U.S. countries. Given the short maturities and investment grade quality of the portfolio holdings at September 30, 2018, a hypothetical 10% change in interest rates would not materially affect the fair value of our cash and cash equivalents.
53
Our invested cash is subject to interest rate fluctuations and, for non-U.S. operations, foreign currency risk. In a declining interest rate environment, we would experience a decrease in interest income. The opposite holds true in a rising interest rate environment. Over the past several years, the U.S. Federal Reserve Board, European Central Bank and Bank of England have changed certain benchmark interest rates, which have led to declines and increases in market interest rates. These changes in market interest rates have resulted in fluctuations in interest income earned on our cash and cash equivalents. Interest income will continue to fluctuate based on changes in market interest rates and levels of cash available for investment. Our consolidated cash balances were impacted favorably by $7.8 million and $1.1 million in 2018 and 2017, respectively and unfavorably by $6.8 million in 2016, due to changes in foreign currencies relative to the U.S. dollar, particularly the Euro and the Japanese Yen.
ITEM 8.Financial Statements and Supplementary Data
The consolidated financial statements and notes to the consolidated financial statements are attached as APPENDIX A.
ITEM 9.Changes in and Disagreements with Accountants on Accounting and Financial Disclosure
None.
ITEM 9A.Controls and Procedures
Evaluation of Disclosure Controls and Procedures
Our management maintains disclosure controls and procedures as defined in Rules 13a-15(e) and 15d-15(e) under the Securities Exchange Act of 1934, as amended (the “Exchange Act”) that are designed to provide reasonable assurance that information required to be disclosed in our reports filed or submitted under the Exchange Act is processed, recorded, summarized and reported within the time periods specified in the SEC’s rules and forms, and that such information is accumulated and communicated to our management, including our Chief Executive Officer and Chief Financial Officer (our principal executive officer and principal financial officer, respectively), as appropriate, to allow for timely decisions regarding required disclosure.
As required by SEC Rule 15d-15(b), we carried out an evaluation, under the supervision and with the participation of management, including our principal executive and principal financial officers, of the effectiveness of the design and operation of our disclosure controls and procedures as of the end of the period covered by this Annual Report. Based on this evaluation, we concluded that our disclosure controls and procedures were effective at the reasonable assurance level as of September 30, 2018.
Management’s Annual Report on Internal Control over Financial Reporting
Our management is responsible for establishing and maintaining adequate internal control over financial reporting. Internal control over financial reporting is defined in Rules 13a-15(f) and 15d-15(f) of the Exchange Act as a process designed by, or under the supervision of, our principal executive and principal financial officers and effected by our board of directors, management and other personnel, to provide reasonable assurance regarding the reliability of financial reporting and the preparation of financial statements for external purposes in accordance with generally accepted accounting principles and includes those policies and procedures that:
• | Pertain to the maintenance of records that in reasonable detail accurately and fairly reflect the transactions and dispositions of our assets; |
• | Provide reasonable assurance that transactions are recorded as necessary to permit preparation of financial statements in accordance with generally accepted accounting principles, and that our receipts and expenditures are being made only in accordance with authorizations of our management and directors; and |
• | Provide reasonable assurance regarding prevention or timely detection of unauthorized acquisition, use or disposition of our assets that could have a material effect on the financial statements. |
Because of its inherent limitations, internal control over financial reporting may not prevent or detect misstatements. Projections of any evaluation of effectiveness to future periods are subject to the risk that
54
controls may become inadequate because of changes in conditions, or that the degree of compliance with the policies or procedures may deteriorate.
Our management assessed the effectiveness of our internal control over financial reporting as of September 30, 2018 using the criteria set forth by the Committee of Sponsoring Organizations of the Treadway Commission (COSO) in Internal Control-Integrated Framework (2013). Based on this assessment and those criteria, our management concluded that, as of September 30, 2018, our internal control over financial reporting was effective.
The effectiveness of our internal control over financial reporting as of September 30, 2018 has been audited by PricewaterhouseCoopers LLP, an independent registered public accounting firm, as stated in their report, which appears under Item 8.
Change in Internal Control over Financial Reporting
There was no change in our internal control over financial reporting that occurred during the quarter ended September 30, 2018 that has materially affected, or is reasonably likely to materially affect, our internal control over financial reporting.
ITEM 9B.Other Information
None.
PART III
ITEM 10.Directors, Executive Officers and Corporate Governance
The information required by this item with respect to our directors and executive officers may be found in the sections captioned “Proposal 1: Election of Directors,” “Corporate Governance,” "Our Executive Officers," “Section 16(a) Beneficial Ownership Reporting Compliance,” and “Transactions With Related Persons” appearing in our 2019 Proxy Statement. Such information is incorporated into this Item 10 by reference.
Code of Ethics for Senior Executive Officers
We have adopted a Code of Ethics for Senior Executive Officers that applies to our Chief Executive Officer, President, Chief Financial Officer, and Controller, as well as others. The Code is embedded in our Code of Business Conduct and Ethics applicable to all employees. A copy of the Code of Business Conduct and Ethics is publicly available on our website at www.ptc.com. If we make any substantive amendments to, or grant any waiver from, including any implicit waiver, the Code of Ethics for Senior Executive Officers to or for our Chief Executive Officer, President, Chief Financial Officer or Controller, we will disclose the nature of such amendment or waiver in a current report on Form 8-K.
ITEM 11.Executive Compensation
Information with respect to director and executive compensation may be found under the headings “Director Compensation,” “Compensation Discussion and Analysis,” “Executive Compensation,” and “Compensation Committee Report” appearing in our 2019 Proxy Statement. Such information is incorporated herein by reference.
ITEM 12.Security Ownership of Certain Beneficial Owners and Management and Related Stockholder Matters
Information required by this item may be found under the headings “Information about PTC Common Stock Ownership” and "Equity Compensation Plan Information" in our 2019 Proxy Statement. Such information is incorporated herein by reference.
ITEM 13.Certain Relationships and Related Transactions, and Director Independence
Information with respect to this item may be found under the headings “Independence of Our Directors,” “Review of Transactions with Related Persons” and “Transactions with Related Persons” in our 2019 Proxy Statement. Such information is incorporated herein by reference.
ITEM 14.Principal Accounting Fees and Services
Information with respect to this item may be found under the headings “Engagement of Independent Auditor and Approval of Professional Services and Fees” and “PricewaterhouseCoopers LLP Professional Services and Fees” in our 2019 Proxy Statement. Such information is incorporated herein by reference.
55
PART IV
ITEM 15.Exhibits and Financial Statement Schedules
(a) Documents Filed as Part of Form 10-K
1. | Financial Statements | |
2. | Financial Statement Schedules | |
Schedules have been omitted since they are either not required, not applicable, or the information is otherwise included in the Financial Statements per Item 15(a)1 above. | ||
3. | Exhibits | |
The list of exhibits in the Exhibit Index is incorporated herein by reference. | ||
(b) Exhibits
We hereby file the exhibits listed in the attached Exhibit Index.
(c) Financial Statement Schedules
None.
ITEM 16.Form 10-K Summary
None
56
EXHIBIT INDEX
Exhibit Number | Exhibit | |
3.1 | — | |
3.2 | — | |
4.1 | — | |
4.2 | — | |
4.3 | — | |
10.1.1* | — | |
10.1.2* | — | |
10.1.3* | — | |
10.1.4 | — | |
10.1.5 | — | |
10.1.6* | — | |
10.1.7* | — | |
10.1.8* | — | |
10.1.9 | — | |
10.1.10 | — | |
10.1.11 | — | |
10.1.12 | — | |
57
10.1.13* | — | |
10.1.14 | — | |
10.1.15 | — | |
10.1.16* | — | |
10.1.17* | — | |
10.2* | — | |
10.3* | — | |
10.4* | — | |
10.5* | — | |
10.6* | — | |
10.7* | — | |
10.8* | — | |
10.9* | — | |
10.10* | — | |
10.11* | — | |
10.12* | — | |
10.13 | — | |
58
10.14 | — | |
10.15 | — | |
10.16 | — | |
10.22 | — | |
10.23 | — | |
10.24 | — | |
10.25 | — | |
10.26 | — | |
21.1 | — | |
23.1 | — | |
31.1 | — | |
31.2 | — | |
32** | — | |
101 | — | The following materials from PTC Inc.'s Annual Report on Form 10-K for the year ended September 30, 2018, formatted in XBRL (eXtensible Business Reporting Language): (i) Consolidated Balance Sheets as of September 30, 2018 and 2017; (ii) Consolidated Statements of Operations for the years ended September 30, 2018, 2017 and 2016; (iii) Consolidated Statements of Comprehensive Income for the years ended September 30, 2018, 2017 and 2016; (iv) Consolidated Statements of Cash Flows for the years ended September 30, 2018, 2017 and 2016; (v) Consolidated Statements of Stockholders’ Equity for the years ended September 30, 2018, 2017 and 2016; and (vi) Notes to Consolidated Financial Statements. |
* | Identifies a management contract or compensatory plan or arrangement in which an executive officer or director of PTC participates. |
** | Indicates that the exhibit is being furnished with this report and is not filed as a part of it. |
59
SIGNATURES
Pursuant to the requirements of Section 13 or 15(d) of the Securities Exchange Act of 1934, the Registrant has duly caused this report to be signed on its behalf by the undersigned, thereunto duly authorized on the 15th day of November, 2018.
PTC Inc. | ||
By: | /s/ JAMES HEPPELMANN | |
James Heppelmann President and Chief Executive Officer | ||
60
Pursuant to the requirements of the Securities Exchange Act of 1934, this report has been signed below by the following persons on behalf of the Registrant and in the capacities indicated below, on the 15th day of November, 2018.
Signature | Title | |
(i) Principal Executive Officer: | ||
/s/ JAMES HEPPELMANN | President and Chief Executive Officer | |
James Heppelmann | ||
(ii) Principal Financial and Accounting Officer: | ||
/s/ ANDREW MILLER | Executive Vice President and Chief Financial Officer | |
Andrew Miller | ||
(iii) Board of Directors: | ||
/s/ ROBERT SCHECHTER | Chairman of the Board of Directors | |
Robert Schechter | ||
/s/ JANICE CHAFFIN | Director | |
Janice Chaffin | ||
/s/ PHILLIP FERNANDEZ | Director | |
Phillip Fernandez | ||
/s/ DONALD GRIERSON | Director | |
Donald Grierson | ||
/s/ JAMES HEPPELMANN | Director | |
James Heppelmann | ||
/s/ KLAUS HOEHN | Director | |
Klaus Hoehn | ||
/s/ PAUL LACY | Director | |
Paul Lacy | ||
/s/ CORINNA LATHAN | Director | |
Corinna Lathan | ||
/s/ BLAKE MORET | Director | |
Blake Moret | ||
61
APPENDIX A
Report of Independent Registered Public Accounting Firm
To the Board of Directors and Shareholders of PTC Inc.:
Opinions on the Financial Statements and Internal Control over Financial Reporting
We have audited the accompanying consolidated balance sheets of PTC Inc. and its subsidiaries (the "Company") as of September 30, 2018 and September 30, 2017, and the related consolidated statements of operations, of comprehensive income (loss), of stockholders’ equity, and of cash flows for each of the three years in the period ended September 30, 2018, including the related notes (collectively referred to as the “consolidated financial statements”). We also have audited the Company's internal control over financial reporting as of September 30, 2018, based on criteria established in Internal Control - Integrated Framework (2013) issued by the Committee of Sponsoring Organizations of the Treadway Commission (COSO).
In our opinion, the consolidated financial statements referred to above present fairly, in all material respects, the financial position of the Company as of September 30, 2018 and September 30, 2017, and the results of its operations and its cash flows for each of the three years in the period ended September 30, 2018 in conformity with accounting principles generally accepted in the United States of America. Also in our opinion, the Company maintained, in all material respects, effective internal control over financial reporting as of September 30, 2018, based on criteria established in Internal Control - Integrated Framework (2013) issued by the COSO.
Basis for Opinions
The Company's management is responsible for these consolidated financial statements, for maintaining effective internal control over financial reporting, and for its assessment of the effectiveness of internal control over financial reporting, included in Management’s Annual Report on Internal Control over Financial Reporting appearing under Item 9A. Our responsibility is to express opinions on the Company’s consolidated financial statements and on the Company's internal control over financial reporting based on our audits. We are a public accounting firm registered with the Public Company Accounting Oversight Board (United States) (PCAOB) and are required to be independent with respect to the Company in accordance with the U.S. federal securities laws and the applicable rules and regulations of the Securities and Exchange Commission and the PCAOB.
We conducted our audits in accordance with the standards of the PCAOB. Those standards require that we plan and perform the audits to obtain reasonable assurance about whether the consolidated financial statements are free of material misstatement, whether due to error or fraud, and whether effective internal control over financial reporting was maintained in all material respects.
Our audits of the consolidated financial statements included performing procedures to assess the risks of material misstatement of the consolidated financial statements, whether due to error or fraud, and performing procedures that respond to those risks. Such procedures included examining, on a test basis, evidence regarding the amounts and disclosures in the consolidated financial statements. Our audits also included evaluating the accounting principles used and significant estimates made by management, as well as evaluating the overall presentation of the consolidated financial statements. Our audit of internal control over financial reporting included obtaining an understanding of internal control over financial reporting, assessing the risk that a material weakness exists, and testing and evaluating the design and operating effectiveness of internal control based on the assessed risk. Our audits also included performing such other procedures as we considered necessary in the circumstances. We believe that our audits provide a reasonable basis for our opinions.
Definition and Limitations of Internal Control over Financial Reporting
A company’s internal control over financial reporting is a process designed to provide reasonable assurance regarding the reliability of financial reporting and the preparation of financial statements for external purposes in accordance with generally accepted accounting principles. A company’s internal
F-1
control over financial reporting includes those policies and procedures that (i) pertain to the maintenance of records that, in reasonable detail, accurately and fairly reflect the transactions and dispositions of the assets of the company; (ii) provide reasonable assurance that transactions are recorded as necessary to permit preparation of financial statements in accordance with generally accepted accounting principles, and that receipts and expenditures of the company are being made only in accordance with authorizations of management and directors of the company; and (iii) provide reasonable assurance regarding prevention or timely detection of unauthorized acquisition, use, or disposition of the company’s assets that could have a material effect on the financial statements.
Because of its inherent limitations, internal control over financial reporting may not prevent or detect misstatements. Also, projections of any evaluation of effectiveness to future periods are subject to the risk that controls may become inadequate because of changes in conditions, or that the degree of compliance with the policies or procedures may deteriorate.
/s/ PricewaterhouseCoopers LLP
Boston, Massachusetts
November 15, 2018
We have served as the Company’s auditor since 1992.
F-2
PTC Inc.
CONSOLIDATED BALANCE SHEETS
(in thousands, except per share data)
September 30, | |||||||
2018 | 2017 | ||||||
ASSETS | |||||||
Current assets: | |||||||
Cash and cash equivalents | $ | 259,946 | $ | 280,003 | |||
Short-term marketable securities | 25,836 | 18,408 | |||||
Accounts receivable, net of allowance for doubtful accounts of $607 and $1,062 at September 30, 2018 and 2017, respectively | 129,297 | 152,299 | |||||
Prepaid expenses | 48,997 | 49,913 | |||||
Other current assets | 169,708 | 165,933 | |||||
Total current assets | 633,784 | 666,556 | |||||
Property and equipment, net | 80,613 | 63,600 | |||||
Goodwill | 1,182,457 | 1,182,772 | |||||
Acquired intangible assets, net | 200,202 | 257,908 | |||||
Long-term marketable securities | 30,115 | 31,907 | |||||
Deferred tax assets | 165,566 | 123,166 | |||||
Other assets | 36,285 | 34,475 | |||||
Total assets | $ | 2,329,022 | $ | 2,360,384 | |||
LIABILITIES AND STOCKHOLDERS’ EQUITY | |||||||
Current liabilities: | |||||||
Accounts payable | $ | 53,473 | $ | 35,160 | |||
Accrued expenses and other current liabilities | 74,388 | 80,761 | |||||
Accrued compensation and benefits | 101,784 | 110,957 | |||||
Accrued income taxes | 18,044 | 5,735 | |||||
Deferred revenue | 487,590 | 446,296 | |||||
Total current liabilities | 735,279 | 678,909 | |||||
Long-term debt, net of current portion | 643,268 | 712,406 | |||||
Deferred tax liabilities | 5,589 | 17,880 | |||||
Deferred revenue | 11,852 | 12,611 | |||||
Other liabilities | 58,445 | 53,142 | |||||
Total liabilities | 1,454,433 | 1,474,948 | |||||
Commitments and contingencies (Note I) | |||||||
Stockholders’ equity: | |||||||
Preferred stock, $0.01 par value; 5,000 shares authorized; none issued | — | — | |||||
Common stock, $0.01 par value; 500,000 shares authorized; 117,981 and 115,333 shares issued and outstanding at September 30, 2018 and 2017, respectively | 1,180 | 1,153 | |||||
Additional paid-in capital | 1,558,403 | 1,609,030 | |||||
Accumulated deficit | (599,409 | ) | (650,840 | ) | |||
Accumulated other comprehensive loss | (85,585 | ) | (73,907 | ) | |||
Total stockholders’ equity | 874,589 | 885,436 | |||||
Total liabilities and stockholders’ equity | $ | 2,329,022 | $ | 2,360,384 | |||
The accompanying notes are an integral part of these consolidated financial statements.
F-3
PTC Inc.
CONSOLIDATED STATEMENTS OF OPERATIONS
(in thousands, except per share data)
Year ended September 30, | |||||||||||
2018 | 2017 | 2016 | |||||||||
Revenue: | |||||||||||
Subscription | $ | 482,027 | $ | 279,246 | $ | 118,322 | |||||
Support | 496,826 | 574,680 | 651,807 | ||||||||
Total recurring revenue | 978,853 | 853,926 | 770,129 | ||||||||
Perpetual license | 109,634 | 133,390 | 173,467 | ||||||||
Total subscription, support and license revenue | 1,088,487 | 987,316 | 943,596 | ||||||||
Professional services | 153,337 | 176,723 | 196,937 | ||||||||
Total revenue | 1,241,824 | 1,164,039 | 1,140,533 | ||||||||
Cost of revenue: | |||||||||||
Cost of license and subscription revenue | 94,108 | 86,047 | 69,710 | ||||||||
Cost of support revenue | 88,575 | 92,202 | 85,729 | ||||||||
Total cost of software revenue | 182,683 | 178,249 | 155,439 | ||||||||
Cost of professional services revenue | 143,511 | 150,770 | 170,226 | ||||||||
Total cost of revenue | 326,194 | 329,019 | 325,665 | ||||||||
Gross margin | 915,630 | 835,020 | 814,868 | ||||||||
Operating expenses | |||||||||||
Sales and marketing | 414,524 | 372,946 | 367,465 | ||||||||
Research and development | 249,774 | 236,059 | 229,331 | ||||||||
General and administrative | 142,981 | 145,067 | 145,615 | ||||||||
Amortization of acquired intangible assets | 31,350 | 32,108 | 33,198 | ||||||||
Restructuring and other charges, net | 3,764 | 7,942 | 76,273 | ||||||||
Total operating expenses | 842,393 | 794,122 | 851,882 | ||||||||
Operating income (loss) | 73,237 | 40,898 | (37,014 | ) | |||||||
Foreign currency losses, net | (6,982 | ) | (5,686 | ) | (1,889 | ) | |||||
Interest income | 3,819 | 3,249 | 3,437 | ||||||||
Interest expense | (41,673 | ) | (42,400 | ) | (29,882 | ) | |||||
Other income (expense), net | 255 | 2,533 | (1,844 | ) | |||||||
Income (loss) before income taxes | 28,656 | (1,406 | ) | (67,192 | ) | ||||||
Benefit from income taxes | (23,331 | ) | (7,645 | ) | (12,727 | ) | |||||
Net income (loss) | $ | 51,987 | $ | 6,239 | $ | (54,465 | ) | ||||
Earnings (loss) per share—Basic | $ | 0.45 | $ | 0.05 | $ | (0.48 | ) | ||||
Earnings (loss) per share—Diluted | $ | 0.44 | $ | 0.05 | $ | (0.48 | ) | ||||
Weighted average shares outstanding—Basic | 116,390 | 115,523 | 114,612 | ||||||||
Weighted average shares outstanding—Diluted | 118,158 | 117,356 | 114,612 | ||||||||
The accompanying notes are an integral part of these consolidated financial statements.
F-4
PTC Inc.
CONSOLIDATED STATEMENTS OF COMPREHENSIVE INCOME (LOSS)
(in thousands)
Year ended September 30, | |||||||||||
2018 | 2017 | 2016 | |||||||||
Net income (loss) | $ | 51,987 | $ | 6,239 | $ | (54,465 | ) | ||||
Other comprehensive income (loss), net of tax: | |||||||||||
Unrealized hedge gain (loss) arising during the period, net of tax of $0.2 million in 2018, $0.1 million in 2017 and $0 million in 2016, respectively | 1,445 | (758 | ) | (3,375 | ) | ||||||
Net hedge (gain) loss reclassified into earnings, net of tax of ($0.1 million) in 2018, ($0.1 million) in 2017 and $0 million in 2016, respectively | 483 | 459 | 2,131 | ||||||||
Unrealized loss on hedging instruments | 1,928 | (299 | ) | (1,244 | ) | ||||||
Foreign currency translation adjustment, net of tax of $0 for all periods | (11,767 | ) | 16,593 | 408 | |||||||
Unrealized loss on marketable securities, net of tax of $0 for all periods | (269 | ) | (22 | ) | (122 | ) | |||||
Amortization of net actuarial pension loss included in net income, net of tax of ($0.7 million), ($1.0 million), and ($0.7 million) in 2018, 2017 and 2016, respectively | 1,629 | 2,392 | 1,609 | ||||||||
Pension net gain (loss) arising during the period net of tax of $1.5 million, ($3.6 million), and $3.5 million in 2018, 2017, and 2016, respectively | (3,787 | ) | 8,636 | (8,646 | ) | ||||||
Change in unamortized pension loss during the period related to changes in foreign currency | 588 | (1,254 | ) | (216 | ) | ||||||
Other comprehensive income (loss) | (11,678 | ) | 26,046 | (8,211 | ) | ||||||
Comprehensive income (loss) | $ | 40,309 | $ | 32,285 | $ | (62,676 | ) | ||||
The accompanying notes are an integral part of these consolidated financial statements.
F-5
PTC Inc.
CONSOLIDATED STATEMENTS OF CASH FLOWS
(in thousands)
Year ended September 30, | |||||||||||
2018 | 2017 | 2016 | |||||||||
Cash flows from operating activities: | |||||||||||
Net income (loss) | $ | 51,987 | $ | 6,239 | $ | (54,465 | ) | ||||
Adjustments to reconcile net income (loss) to net cash provided by operating activities: | |||||||||||
Stock-based compensation | 82,939 | 76,708 | 65,996 | ||||||||
Depreciation and amortization | 87,408 | 86,742 | 86,554 | ||||||||
Benefit from deferred income taxes | (56,556 | ) | (28,289 | ) | (44,182 | ) | |||||
Other non-cash costs, net | 534 | 2,272 | 966 | ||||||||
Changes in operating assets and liabilities, excluding the effects of acquisitions: | |||||||||||
Accounts receivable | 20,396 | 12,832 | 52,617 | ||||||||
Accounts payable and accrued expenses | 5,251 | 20,315 | (14,185 | ) | |||||||
Accrued compensation and benefits | (6,988 | ) | (34,846 | ) | 60,944 | ||||||
Deferred revenue | 56,141 | 5,808 | 16,232 | ||||||||
Accrued income taxes, net of income tax receivable | 10,323 | (798 | ) | 6,749 | |||||||
Other current assets and prepaid expenses | (10,583 | ) | 721 | 4,591 | |||||||
Other noncurrent assets and liabilities | 6,959 | (12,470 | ) | 1,444 | |||||||
Net cash provided by operating activities | 247,811 | 135,234 | 183,261 | ||||||||
Cash flows from investing activities: | |||||||||||
Additions to property and equipment | (36,041 | ) | (25,444 | ) | (26,189 | ) | |||||
Purchases of short- and long-term marketable securities | (24,311 | ) | (19,726 | ) | (44,605 | ) | |||||
Proceeds from maturities of short- and long-term marketable securities | 18,140 | 18,785 | — | ||||||||
Acquisitions of businesses, net of cash acquired | (3,000 | ) | (4,960 | ) | (165,802 | ) | |||||
Purchases of investments | (1,000 | ) | — | (560 | ) | ||||||
Proceeds from sales of investments | — | 15,218 | — | ||||||||
Purchase of intangible asset | (3,000 | ) | — | — | |||||||
Net cash used by investing activities | (49,212 | ) | (16,127 | ) | (237,156 | ) | |||||
Cash flows from financing activities: | |||||||||||
Borrowings under credit facility and senior notes | 250,000 | 150,000 | 670,000 | ||||||||
Repayments of borrowings under credit facility | (320,000 | ) | (190,000 | ) | (580,000 | ) | |||||
Repurchases of common stock | (1,100,000 | ) | (50,991 | ) | — | ||||||
Proceeds from issuance of common stock | 1,015,654 | 10,778 | 21 | ||||||||
Payments of withholding taxes in connection with vesting of stock-based awards | (45,374 | ) | (26,654 | ) | (20,939 | ) | |||||
Credit facility origination costs | (2,851 | ) | (184 | ) | (6,855 | ) | |||||
Contingent consideration | (8,275 | ) | (11,054 | ) | (10,621 | ) | |||||
Net cash provided (used) by financing activities | (210,846 | ) | (118,105 | ) | 51,606 | ||||||
Effect of exchange rate changes on cash and cash equivalents | (7,810 | ) | 1,066 | 6,807 | |||||||
Net increase (decrease) in cash and cash equivalents | (20,057 | ) | 2,068 | 4,518 | |||||||
Cash and cash equivalents, beginning of year | 280,003 | 277,935 | 273,417 | ||||||||
Cash and cash equivalents, end of year | $ | 259,946 | $ | 280,003 | $ | 277,935 | |||||
Supplemental disclosure of non-cash financing activities: | |||||||||||
Fair value of contingent consideration recorded for acquisitions | $ | 2,100 | $ | — | $ | 16,900 | |||||
The accompanying notes are an integral part of these consolidated financial statements.
F-6
PTC Inc.
CONSOLIDATED STATEMENTS OF STOCKHOLDERS’ EQUITY
(in thousands)
Common Stock | Additional Paid-in Capital | Accumulated Deficit | Accumulated Other Comprehensive Loss | Total Stockholders’ Equity | ||||||||||||||||||
Shares | Amount | |||||||||||||||||||||
Balance as of October 1, 2015 | 113,745 | $ | 1,137 | $ | 1,553,390 | $ | (602,614 | ) | $ | (91,742 | ) | $ | 860,171 | |||||||||
Common stock issued for employee stock-based awards | 1,820 | 18 | 3 | — | — | 21 | ||||||||||||||||
Shares surrendered by employees to pay taxes related to stock-based awards | (597 | ) | (5 | ) | (20,934 | ) | — | — | (20,939 | ) | ||||||||||||
Compensation expense from stock-based awards | — | — | 65,996 | — | — | 65,996 | ||||||||||||||||
Excess tax benefits from stock-based awards | — | — | 93 | — | — | 93 | ||||||||||||||||
Net loss | — | — | — | (54,465 | ) | — | (54,465 | ) | ||||||||||||||
Unrealized loss on hedging instruments, net of tax | — | — | — | — | (1,244 | ) | (1,244 | ) | ||||||||||||||
Foreign currency translation adjustment | — | — | — | — | 408 | 408 | ||||||||||||||||
Unrealized loss on available-for-sale securities, net of tax | — | — | — | — | (122 | ) | (122 | ) | ||||||||||||||
Change in pension benefits, net of tax | — | — | — | — | (7,253 | ) | (7,253 | ) | ||||||||||||||
Balance as of September 30, 2016 | 114,968 | $ | 1,150 | $ | 1,598,548 | $ | (657,079 | ) | $ | (99,953 | ) | $ | 842,666 | |||||||||
Common stock issued for employee stock-based awards | 1,586 | 15 | (15 | ) | — | — | — | |||||||||||||||
Shares surrendered by employees to pay taxes related to stock-based awards | (544 | ) | (5 | ) | (26,649 | ) | — | — | (26,654 | ) | ||||||||||||
Common stock issued for employee stock purchase plan | 269 | 3 | 10,775 | — | — | 10,778 | ||||||||||||||||
Compensation expense from stock-based awards | — | — | 76,708 | — | — | 76,708 | ||||||||||||||||
Excess tax benefits from stock-based awards | — | — | 644 | — | — | 644 | ||||||||||||||||
Net income | — | — | — | 6,239 | — | 6,239 | ||||||||||||||||
Repurchases of common stock | (946 | ) | (10 | ) | (50,981 | ) | — | — | (50,991 | ) | ||||||||||||
Unrealized loss on hedging instruments, net of tax | — | — | — | — | (299 | ) | (299 | ) | ||||||||||||||
Foreign currency translation adjustment | — | — | — | — | 16,593 | 16,593 | ||||||||||||||||
Unrealized loss on available-for-sale securities, net of tax | — | — | — | — | (22 | ) | (22 | ) | ||||||||||||||
Change in pension benefits, net of tax | — | — | — | — | 9,774 | 9,774 | ||||||||||||||||
Balance as of September 30, 2017 | 115,333 | $ | 1,153 | $ | 1,609,030 | $ | (650,840 | ) | $ | (73,907 | ) | $ | 885,436 | |||||||||
Common stock issued for employee stock-based awards | 1,830 | 18 | (18 | ) | — | — | — | |||||||||||||||
Shares surrendered by employees to pay taxes related to stock-based awards | (664 | ) | (6 | ) | (45,368 | ) | — | — | (45,374 | ) | ||||||||||||
Common stock issued | 10,582 | 106 | 995,394 | — | — | 995,500 | ||||||||||||||||
Common stock issued for employee stock purchase plan | 292 | 2 | 15,652 | — | — | 15,654 | ||||||||||||||||
Compensation expense from stock-based awards | — | — | 82,939 | — | — | 82,939 | ||||||||||||||||
ASU 2016-09 adoption | — | — | 681 | (556 | ) | — | 125 | |||||||||||||||
Net income | — | — | — | 51,987 | — | 51,987 | ||||||||||||||||
Repurchases of common stock | (9,392 | ) | (93 | ) | (1,099,907 | ) | — | — | (1,100,000 | ) | ||||||||||||
Unrealized loss on hedging instruments, net of tax | — | — | — | — | 1,928 | 1,928 | ||||||||||||||||
Foreign currency translation adjustment | — | — | — | — | (11,767 | ) | (11,767 | ) | ||||||||||||||
Unrealized loss on available-for-sale securities, net of tax | — | — | — | — | (269 | ) | (269 | ) | ||||||||||||||
Change in pension benefits, net of tax | — | — | — | — | (1,570 | ) | (1,570 | ) | ||||||||||||||
Balance as of September 30, 2018 | 117,981 | $ | 1,180 | $ | 1,558,403 | $ | (599,409 | ) | $ | (85,585 | ) | $ | 874,589 | |||||||||
The accompanying notes are an integral part of these consolidated financial statements.
F-7
PTC Inc.
NOTES TO CONSOLIDATED FINANCIAL STATEMENTS
A. Description of Business and Basis of Presentation
Business
PTC Inc. was incorporated in 1985 and is headquartered in Needham, Massachusetts. PTC is a global software and services company that delivers a technology platform and solutions to help companies design, manufacture, operate, and service things for a smart, connected world.
Basis of Presentation
Our fiscal year-end is September 30. The consolidated financial statements include PTC Inc. (the parent company) and its wholly owned subsidiaries, including those operating outside the U.S. All intercompany balances and transactions have been eliminated in the consolidated financial statements.
We prepare our financial statements under generally accepted accounting principles in the U.S. that require management to make estimates and assumptions that affect the amounts reported and the related disclosures. Actual results could differ from these estimates.
Reclassifications
Effective at the beginning of fiscal 2018, in accordance with the adoption of ASU 2016-09, Compensation - Stock Compensation (Topic 718): Improvements to Employee Share-Based Payment Accounting, excess tax benefits are now classified as an operating activity on the statement of cash flows rather than as a financing activity. The prior period excess tax benefits have been reclassified for comparability.
Effective with the beginning of the third quarter of 2017, we are reporting cost of license and subscription revenue separately from cost of support revenue and are presenting cost of revenue in three categories: 1) cost of license and subscription revenue, 2) cost of support revenue, and 3) cost of professional services revenue. Cost of license and subscription includes the cost of perpetual and subscription licenses; cost of support includes the cost of supporting both perpetual and subscription licenses. Costs of revenue for previous periods in the accompanying Consolidated Statements of Operations are presented on a basis consistent with the current period presentation.
Segments
In fiscal 2017, we had three operating and reportable segments: (1) the Solutions Group, which included license, subscription, support and cloud services revenue for our core CAD, SLM and PLM products; (2) the IoT Group, which included license, subscription, support and cloud services revenue for our IoT, analytics and augmented reality solutions; and (3) Professional Services, which included consulting, implementation and training revenue.
With a change in our organizational structure to streamline our operations, we merged our Solution Group segment with our IoT Group segment and revised the information that our chief executive officer, who is also our chief operating decision maker ("CODM"), regularly reviews for purposes of allocating resources and assessing performance. As a result, effective with the beginning of the first quarter of fiscal 2018, we changed our operating and reportable segments from three to two: (1) Software Products, which includes license, subscription and related support revenue (including updates and technical support) for all our products; and (2) Professional Services, which includes consulting, implementation and training services.
Revenue and operating income in Note Q. Segment Information have been reclassified to conform to the current period presentation.
B. Summary of Significant Accounting Policies
Foreign Currency Translation
For our non-U.S. operations where the functional currency is the local currency, we translate assets and liabilities at exchange rates in effect at the balance sheet date and record translation adjustments in stockholders’ equity. For our non-U.S. operations where the U.S. dollar is the functional currency, we remeasure monetary assets and liabilities using exchange rates in effect at the balance sheet date and nonmonetary assets and liabilities at historical rates and record resulting exchange gains or losses in
F-8
foreign currency net losses in the Consolidated Statements of Operations. We translate income statement amounts at average rates for the period. Transaction gains and losses are recorded in foreign currency net losses in the Consolidated Statements of Operations.
Revenue Recognition
Our sources of revenue include: (1) subscription, (2) support, (3) perpetual license and (4) professional services. Through 2018, we recorded revenues for software related deliverables in accordance with the guidance provided by ASC 985-605, Software-Revenue Recognition and revenues for non-software deliverables in accordance with ASC 605-25, Revenue Recognition, Multiple-Element Arrangements. Under those standards, revenue is recorded when the following criteria are met: (1) persuasive evidence of an arrangement exists, (2) delivery has occurred (generally, FOB shipping point or electronic distribution), (3) the fee is fixed or determinable, and (4) collection is probable. We exercise judgment and use estimates in connection with determining the amounts of software license and services revenues to be recognized in each accounting period. Our primary judgments involve the following:
• | determining whether collection is probable; |
• | assessing whether the fee is fixed or determinable; |
• | determining whether service arrangements, including modifications and customization of the underlying software, are not essential to the functionality of the licensed software and thus would result in the revenue for license and service elements of an agreement being recorded separately; and |
• | determining the fair value of services and support elements included in multiple-element arrangements, which is the basis for allocating and deferring revenue for such services and support. |
Our software is distributed primarily through our direct sales force. In addition, we have an indirect distribution channel through alliances with resellers. Revenue arrangements with resellers are generally recognized on a sell-through basis; that is, when we deliver the product to the end-user customer. We record consideration given to a reseller as a reduction of revenue to the extent we have recorded revenue from the reseller. We do not offer contractual rights of return, stock balancing, or price protection to our resellers, and actual product returns from them have been insignificant to date. As a result, we do not maintain reserves for reseller product returns.
At the time of each sale transaction, we must make an assessment of the collectability of the amount due from the customer. Revenue is only recognized at that time if management deems that collection is probable. In making this assessment, we consider customer credit-worthiness and historical payment experience. At that same time, we assess whether fees are fixed or determinable and free of contingencies or significant uncertainties. In assessing whether the fee is fixed or determinable, we consider the payment terms of the transaction, including transactions with payment terms that extend beyond our customary payment terms, and our collection experience in similar transactions without making concessions, among other factors. We have periodically provided financing to credit-worthy customers with payment terms up to 24 months. If the fee is determined not to be fixed or determinable, revenue is recognized only as payments become due from the customer, provided that all other revenue recognition criteria are met. Our software license arrangements generally do not include customer acceptance provisions. However, if an arrangement includes an acceptance provision, we record revenue only upon the earlier of (1) receipt of written acceptance from the customer or (2) expiration of the acceptance period.
Generally, our contracts are accounted for individually. However, when contracts are closely interrelated and dependent on each other, it may be necessary to account for two or more contracts as one to reflect the substance of the group of contracts.
Subscription
Subscription revenue includes revenue from two primary sources: (1) subscription-based licenses, and (2) cloud services.
Subscription-based licenses include the right for a customer to use our licenses on-premise and receive related support for a specified term and revenue is recognized ratably over the term of the arrangement since we do not have vendor-specific objective evidence (“VSOE”) of fair value for our coterminous support. When sold in arrangements with other elements, VSOE of fair value is established for
F-9
the subscription-based licenses through the use of a substantive renewal clause within the customer contract for a combined annual fee that includes the term-based license and related support.
Cloud services revenue (which in 2018, 2017 and 2016 represented less than 5% of our total revenue) includes fees for hosting and application management of customers’ perpetual or subscription-based licenses (hosting services) and fees for Software as a Service (SaaS) arrangements. When hosting services are sold as part of a multi-element transaction, revenue is allocated to hosting services based on VSOE, and recognized ratably over the contractual term beginning on the commencement dates of each contract, which is the date the services are made available to the customer. VSOE is established for hosting services either through a substantive stated renewal option or stated contractual overage rates, as these rates represent the value the customer is willing to pay on a standalone basis. We also offer cloud services under SaaS arrangements whereby customers access our software in the cloud. Under SaaS arrangements, customers cannot take possession of the software. Cloud services include set-up fees, which are recognized ratably over the contract term or the expected customer life, whichever is longer.
Support
Support contracts generally include rights to unspecified upgrades (when and if available), telephone and internet-based support, updates and bug fixes. Support revenue is recognized ratably over the term of the support contract on a straight-line basis.
Perpetual License
Under perpetual license arrangements, we generally recognize license revenue up front upon shipment to the customer. We use the residual method to recognize revenue from perpetual license software arrangements that include one or more elements to be delivered at a future date when evidence of the fair value of all undelivered elements exists, and the elements of the arrangement qualify for separate accounting as described below. Under the residual method, the fair value of the undelivered elements (i.e., support and services) based on our VSOE of fair value is deferred and the remaining portion of the total arrangement fee is allocated to the delivered elements (i.e., perpetual software license). If evidence of the fair value of one or more of the undelivered elements does not exist, all revenues are deferred and recognized when delivery of all of those elements has occurred or when fair values can be established. We determine VSOE of the fair value of services and support revenue based upon our recent pricing for those elements when sold separately. For certain transactions, VSOE is determined based on a substantive renewal clause within a customer contract. Our current pricing practices are influenced primarily by product type, purchase volume, sales channel and customer location. We review services and support sold separately on a periodic basis and update, when appropriate, our VSOE of fair value for such elements to ensure that it reflects our recent pricing experience.
Professional Services
Our software arrangements often include implementation, consulting and training services that are sold under consulting engagement contracts or as part of the software license arrangement. When we determine that such services are not essential to the functionality of the licensed software, we record revenue separately for the license and service elements of these arrangements, provided that appropriate evidence of fair value exists for the undelivered services (i.e. VSOE of fair value). We consider various factors in assessing whether a service is not essential to the functionality of the software, including if the services may be provided by independent third parties experienced in providing such services (i.e. consulting and implementation) in coordination with dedicated customer personnel, and whether the services result in significant modification or customization of the software’s functionality. When professional services qualify for separate accounting, professional services revenues under time and materials billing arrangements are recognized as the services are performed. Professional services revenues under fixed-priced contracts are generally recognized as the services are performed using a proportionate performance model with hours or costs as the input method of attribution.
When we provide professional services that are considered essential to the functionality of the software, the arrangement does not qualify for separate accounting of the license and service elements, and the license revenue is recognized together with the consulting services using the percentage-of-completion method of contract accounting. Under such arrangements, consideration is recognized as the services are performed as measured by an observable input. In these circumstances, we separate license revenue from service revenue for income statement presentation by allocating VSOE of fair value
F-10
of the consulting services as service revenue, and the residual portion as license revenue. Under the percentage-of-completion method, we estimate the stage of completion of contracts with fixed or “not to exceed” fees based on hours or costs incurred to date as compared with estimated total project hours or costs at completion. Adjustments to estimates to complete are made in the periods in which facts resulting in a change become known. When total cost estimates exceed revenues, we accrue for the estimated losses when identified. The use of the proportionate performance and percentage-of-completion methods of accounting require significant judgment relative to estimating total contract costs or hours (hours being a proxy for costs), including assumptions relative to the length of time to complete the project, the nature and complexity of the work to be performed and anticipated changes in salaries and other costs.
Reimbursements of out-of-pocket expenditures incurred in connection with providing consulting services are included in professional services revenue, with the offsetting expense recorded in cost of professional services revenue.
Training services include on-site and classroom training. Training revenues are recognized as the related training services are provided.
Deferred Revenue
Billed deferred revenue primarily relates to software subscription and support agreements billed to customers for which the services have not yet been provided. The liability associated with performing these services is included in deferred revenue and, if not yet paid, the related customer receivable is included in other current assets. Billed but uncollected support and subscription-related amounts included in other current assets at September 30, 2018 and 2017 were $153.6 million and $160.9 million, respectively. Deferred revenue consisted of the following:
September 30, | |||||||
2018 | 2017 | ||||||
(in thousands) | |||||||
Deferred subscription revenue | $ | 288,012 | $ | 193,376 | |||
Deferred support revenue | 196,684 | 256,999 | |||||
Deferred perpetual license revenue | 1,475 | 1,773 | |||||
Deferred professional services revenue | 13,272 | 6,759 | |||||
Total deferred revenue | $ | 499,443 | $ | 458,907 | |||
Cash Equivalents
Our cash equivalents are invested in money market accounts and time deposits of financial institutions. We have established guidelines relative to credit ratings, diversification and maturities that are intended to maintain safety and liquidity. Cash equivalents include highly liquid investments with maturity periods of three months or less when purchased.
Marketable Securities
Our investment portfolio consists of certificates of deposit, commercial paper, corporate notes/bonds and government securities that have a maximum maturity of three years. The longer the duration of these securities, the more susceptible they are to changes in market interest rates and bond yields. All unrealized losses are due to changes in market interest rates, bond yields and/or credit ratings.
We review our investments to identify and evaluate investments that have an indication of possible impairment. We concluded that, at September 30, 2018, the unrealized losses were temporary.
Cost Method Investments
We generally account for non-marketable equity investments under the cost method. We monitor non-marketable equity investments for events that could indicate that the investments are impaired, such as deterioration in the investee's financial condition and business forecasts, and lower valuations in recent or proposed financings. For an other-than-temporary impairment in the investment, we record a charge to other expense for the difference between the estimated fair value and the carrying value. The
F-11
carrying value of our non-marketable equity investments are recorded in noncurrent assets and totaled $1.7 million and $0.7 million as of September 30, 2018 and 2017, respectively. In 2017, we sold a cost method investment in a private company for $13.7 million for a gain of approximately $3.7 million.
Concentration of Credit Risk and Fair Value of Financial Instruments
The amounts reflected in the Consolidated Balance Sheets for cash and cash equivalents, accounts receivable and accounts payable approximate their fair value due to their short maturities. Financial instruments that potentially subject us to concentration of credit risk consist primarily of investments, trade accounts receivable and foreign currency derivative instruments. Our cash, cash equivalents, and foreign currency derivatives are placed with financial institutions with high credit standings. Our credit risk for derivatives is also mitigated due to the short-term nature of the contracts. Our customer base consists of large numbers of geographically diverse customers dispersed across many industries. No individual customer comprised more than 10% of our trade accounts receivable as of September 30, 2018 or 2017 or comprised more than 10% of our revenue for the years ended September 30, 2018, 2017 or 2016.
Fair Value Measurements
Fair value is defined as the price that would be received from selling an asset or paid to transfer a liability in an orderly transaction between market participants at the measurement date. When determining the fair value measurements for assets and liabilities required to be recorded at fair value, we consider the principal or most advantageous market in which we would transact and consider assumptions that market participants would use when pricing the asset or liability, such as inherent risk, transfer restrictions, and risk of nonperformance. Generally accepted accounting principles prescribe a fair value hierarchy that requires an entity to maximize the use of observable inputs and minimize the use of unobservable inputs when measuring fair value. A financial instrument’s categorization within the fair value hierarchy is based upon the lowest level of input that is significant to the fair value measurement. Three levels of inputs that may be used to measure fair value:
• | Level 1: quoted prices (unadjusted) in active markets for identical assets or liabilities; |
• | Level 2: inputs other than Level 1 that are observable, either directly or indirectly, such as quoted prices in active markets for similar assets or liabilities, quoted prices for identical or similar assets or liabilities in markets that are not active, or other inputs that are observable or can be corroborated by observable market data for substantially the full term of the assets or liabilities; or |
• | Level 3: unobservable inputs that are supported by little or no market activity and that are significant to the fair value of the assets or liabilities. |
A financial instrument’s level within the fair value hierarchy is based on the lowest level of any input that is significant to the fair value measurement.
Allowance for Doubtful Accounts
We maintain allowances for doubtful accounts for estimated losses resulting from the inability of our customers to make required payments. In determining the adequacy of the allowance for doubtful accounts, management specifically analyzes individual accounts receivable, historical bad debts, customer concentrations, customer credit-worthiness, current economic conditions, and accounts receivable aging trends. Our allowance for doubtful accounts on trade accounts receivable was $0.6 million as of September 30, 2018, $1.1 million as of September 30, 2017, $1.0 million as of September 30, 2016 and $1.0 million as of September 30, 2015. Uncollectible trade accounts receivable written-off, net of recoveries, were $1.0 million, $1.5 million and $0.3 million in 2018, 2017 and 2016, respectively. Bad debt expense was $0.5 million, $1.5 million and $0.3 million in 2018, 2017 and 2016, respectively, and is included in general and administrative expenses in the accompanying Consolidated Statements of Operations.
Allowance for Sales Credits
We record an allowance for sales credits that is established based on the evaluation of historical credits and is recorded as a reduction in accounts receivable and revenue. As of September 30, 2018, the allowance for sale credits was $2.0 million.
Derivatives
Generally accepted accounting principles require all derivatives, whether designated in a hedging relationship or not, to be recorded on the balance sheet at fair value. Our earnings and cash flows are subject to fluctuations due to changes in foreign currency exchange rates. Our most significant foreign currency exposures relate to Western European countries, Japan, China and Canada. Our foreign
F-12
currency risk management strategy is principally designed to mitigate the future potential financial impact of changes in the U.S. dollar value of anticipated transactions and balances denominated in foreign currency, resulting from changes in foreign currency exchange rates. We enter into derivative transactions, specifically foreign currency forward contracts, to manage the exposures to foreign currency exchange risk to reduce earnings volatility. We do not enter into derivatives transactions for trading or speculative purposes. For a description of our non-designated hedge and cash flow hedge activities see Note P. Derivative Financial Instruments.
Non-Designated Hedges
We hedge our net foreign currency monetary assets and liabilities primarily resulting from foreign currency denominated receivables and payables with foreign exchange forward contracts to reduce the risk that our earnings and cash flows will be adversely affected by changes in foreign currency exchange rates. These contracts have maturities of up to approximately three months. Generally, we do not designate these foreign currency forward contracts as hedges for accounting purposes and changes in the fair value of these instruments are recognized immediately in earnings. Gains or losses on the underlying foreign-denominated balance are offset by the loss or gain on the forward contract and are included in foreign currency losses, net.
Cash Flow Hedges
Our foreign exchange risk management program objective is to identify foreign exchange exposures and implement appropriate hedging strategies to minimize earnings fluctuations resulting from foreign exchange rate movements. We designate certain foreign exchange forward contracts as cash flow hedges of Euro, Yen and SEK denominated intercompany forecast revenue transactions (supported by third party sales). All foreign exchange forward contracts are carried at fair value on the Consolidated Balance Sheets and the maximum duration of foreign exchange forward contracts is 14 months.
Cash flow hedge relationships are designated at inception, and effectiveness is assessed prospectively and retrospectively using regression analysis on a monthly basis. As the forward contracts are highly effective in offsetting changes to future cash flows on the hedged transactions, we record the effective portion of changes in these cash flow hedges in accumulated other comprehensive income and subsequently reclassify into earnings in the same period during which the hedged transactions are recognized in earnings. Changes in the fair value of foreign exchange forward contracts due to changes in time value are included in the assessment of effectiveness. Our derivatives are not subject to any credit contingent features. We manage credit risk with counter-parties by trading among several counter-parties and we review our counter-parties’ credit at least quarterly.
Property and Equipment
Property and equipment are recorded at cost and depreciated using the straight-line method over their estimated useful lives. Computer hardware and software are typically amortized over three to five years, and furniture and fixtures over three to eight years. Leasehold improvements are amortized over the shorter of their useful lives or the remaining terms of the related leases. Property and equipment under capital leases are amortized over the lesser of the lease terms or their estimated useful lives. Maintenance and repairs are charged to expense when incurred; additions and improvements are capitalized. When an item is sold or retired, the cost and related accumulated depreciation is relieved, and the resulting gain or loss, if any, is recognized in income.
Software Development Costs
We incur costs to develop computer software to be licensed or otherwise marketed to customers. Research and development costs are expensed as incurred, except for costs of internally developed or externally purchased software that qualify for capitalization. Development costs for software to be sold externally incurred subsequent to the establishment of technological feasibility, but prior to the general release of the product, are capitalized and, upon general release, are amortized using the greater of either the straight-line method over the expected life of the related products or based upon the pattern in which economic benefits related to such assets are realized. The straight-line method is used if it approximates the same amount of expense as that calculated using the ratio that current period gross product revenues bear to total anticipated gross product revenues. No development costs for software to be sold externally were capitalized in 2018, 2017 or 2016. In 2018 and 2017, we acquired capitalized software of $0.8 million and $6.0 million, respectively. These assets are included in acquired intangible assets in the accompanying Consolidated Balance Sheets.
F-13
Goodwill, Acquired Intangible Assets and Long-lived Assets
Goodwill is the amount by which the purchase price in a business acquisition exceeds the fair values of net identifiable assets on the date of purchase.
Goodwill is evaluated for impairment annually, as of the end of the third quarter, or more frequently if events or changes in circumstances indicate that the asset might be impaired. Factors we consider important, on an overall company basis and reportable-segment basis, when applicable, that could trigger an impairment review include significant under-performance relative to historical or projected future operating results, significant changes in our use of the acquired assets or the strategy for our overall business, significant negative industry or economic trends, a significant decline in our stock price for a sustained period and a reduction of our market capitalization relative to net book value.
Our annual goodwill impairment test is based on either a qualitative (Step 0) or quantitative (Step 1) assessment, and is designed to determine whether we believe it is more likely than not that the fair values of our reporting units exceed their carrying values. A Step 0 assessment includes a review of qualitative factors including company specific (financial performance and long-range plans), industry, and macroeconomic factors, and a consideration of the fair value of each reporting unit at the last valuation date. A Step 1 assessment is a quantitative analysis that compares the fair value of the reporting unit to its carrying value. If the reporting unit’s carrying value exceeds its fair value, we record an impairment loss equal to the difference between the carrying value of goodwill and its implied fair value. We estimate the fair values of our reporting units using discounted cash flow valuation models. Those models require estimates of future revenues, profits, capital expenditures, working capital, terminal values based on revenue multiples, and discount rates for each reporting unit. We estimate these amounts by evaluating historical trends, current budgets, operating plans and industry data.
We completed our annual goodwill impairment review as of July 1, 2018 based on a Step 0 assessment and concluded that no impairment charge was required as of that date.
Long-lived assets primarily include property and equipment and acquired intangible assets with finite lives (including purchased software, customer lists and trademarks). Purchased software is amortized over periods up to 11 years, customer lists are amortized over periods up to 12 years and trademarks are amortized over periods up to 12 years. We review long-lived assets for impairment when events or changes in business circumstances indicate that the carrying amount of the assets may not be fully recoverable or that the useful lives of those assets are no longer appropriate. An impairment test is based on a comparison of the undiscounted cash flows to the recorded value of the asset or asset group. If impairment is indicated, the asset is written down to its estimated fair value based on a discounted cash flow analysis.
Advertising Expenses
Advertising costs are expensed as incurred. Total advertising expenses incurred were $2.9 million, $2.5 million and $2.1 million in 2018, 2017 and 2016, respectively and are included in sales and marketing expenses in the accompanying Consolidated Statements of Operations.
Income Taxes
Our income tax expense includes U.S. and international income taxes. Certain items of income and expense are not reported in tax returns and financial statements in the same year. The tax effects of these differences are reported as deferred tax assets and liabilities. Deferred tax assets are recognized for the estimated future tax effects of deductible temporary differences and tax operating loss and credit carryforwards. Changes in deferred tax assets and liabilities are recorded in the provision for income taxes. We assess the likelihood that our deferred tax assets will be recovered from future taxable income and, to the extent we believe that it is more likely than not that all or a portion of deferred tax assets will not be realized, we establish a valuation allowance. To the extent we establish a valuation allowance or increase this allowance in a period, we include an expense within the tax provision in the Consolidated Statements of Operations.
Comprehensive Income (Loss)
Comprehensive income (loss) consists of net income (loss) and other comprehensive income (loss), which includes foreign currency translation adjustments, changes in unrecognized actuarial gains and losses (net of tax) related to pension benefits, unrealized gains and losses on hedging instruments and unrealized gains and losses on marketable securities. For the purposes of comprehensive income disclosures, we do not record tax provisions or benefits for the net changes in the foreign currency
F-14
translation adjustment, as we intend to reinvest permanently undistributed earnings of our foreign subsidiaries. Accumulated other comprehensive loss is reported as a component of stockholders’ equity and, as of September 30, 2018 and 2017, was comprised of cumulative translation adjustment losses of $66.4 million and $54.6 million, respectively, unrecognized actuarial losses related to pension benefits of $27.0 million ($19.2 million net of tax) and $24.7 million ($17.6 million net of tax), respectively, unrecognized gain on hedging instruments of $0.4 million ($0.4 million net of tax) and unrecognized loss of $1.8 million ($1.5 million net of tax), respectively, and unrecognized losses on marketable securities of $0.4 million and $0.1 million, respectively.
Earnings per Share (EPS)
Basic EPS is calculated by dividing net income by the weighted average number of shares outstanding during the period. Unvested restricted shares, although legally issued and outstanding, are not considered outstanding for purposes of calculating basic earnings per share. Diluted EPS is calculated by dividing net income by the weighted average number of shares outstanding plus the dilutive effect, if any, of outstanding stock options, restricted shares and restricted stock units using the treasury stock method. The calculation of the dilutive effect of outstanding equity awards under the treasury stock method includes consideration of proceeds from the assumed exercise of stock options, unrecognized compensation expense and any tax benefits as additional proceeds. Due to the net loss generated in the year ended September 30, 2016, approximately 1.7 million restricted stock units have been excluded from the computation of diluted EPS in that year as the effect would have been anti-dilutive.
The following table presents the calculation for both basic and diluted EPS:
Year ended September 30, | |||||||||||
2018 | 2017 | 2016 | |||||||||
(in thousands, except per share data) | |||||||||||
Net income (loss) | $ | 51,987 | $ | 6,239 | $ | (54,465 | ) | ||||
Weighted average shares outstanding | 116,390 | 115,523 | 114,612 | ||||||||
Dilutive effect of employee stock options, restricted shares and restricted stock units | 1,768 | 1,833 | — | ||||||||
Diluted weighted average shares outstanding | 118,158 | 117,356 | 114,612 | ||||||||
Basic earnings (loss) per share | $ | 0.45 | $ | 0.05 | $ | (0.48 | ) | ||||
Diluted earnings (loss) per share | $ | 0.44 | $ | 0.05 | $ | (0.48 | ) | ||||
Stock-Based Compensation
We measure the compensation cost of employee services received in exchange for an award of equity instruments based on the grant-date fair value of the award. That cost is recognized over the period during which an employee is required to provide service in exchange for the award. See Note K. Equity Incentive Plan for a description of the types of stock-based awards granted, the compensation expense related to such awards and detail of equity-based awards outstanding. See Note G. Income Taxes for detail of the tax benefit related to stock-based compensation recognized in the Consolidated Statements of Operations.
Recently Adopted Accounting Pronouncements
Stock Compensation
In March 2016, the FASB issued ASU No. 2016-09, Compensation - Stock Compensation (Topic 718): Improvements to Employee Share-Based Payment Accounting. We adopted ASU No. 2016-09 in the first quarter of 2018.
Effective with the adoption, stock-based compensation excess tax benefits or deficiencies are reflected in the Consolidated Statements of Operations as a component of the provision for income taxes when the awards vest or are settled. Previously they were recognized in equity. Upon adoption, under the modified retrospective transition method, we recognized the previously unrecognized excess tax benefits of $37.0 million as increases in deferred tax assets for tax loss carryovers and tax credits, $36.9 million of which were offset by an increase in our U.S. valuation allowance.
Additionally, excess tax benefits from stock-based awards will no longer be separately classified on our Consolidated Statements of Cash Flows as a financing activity apart from other income tax, and will be presented as an operating activity. As a result of the adoption of ASU 2016-09, the Consolidated
F-15
Statement of Cash Flows was adjusted as follows: a $0.6 million and $0.1 million increase to net cash provided by operating activities for the periods ended September 30, 2017 and September 30, 2016, respectively, and a $0.6 million and $0.1 million decrease to net cash used in financing activities for the periods ended September 30, 2017 and September 30, 2016, respectively.
Finally, we have elected to account for forfeitures as they occur, rather than estimate expected forfeitures, which resulted in a cumulative effect adjustment of $0.7 million to reduce retained earnings as of October 1, 2017.
Pending Accounting Pronouncements
Derivative Financial Instruments
In August 2017, the Financial Accounting Standards Board (FASB) issued Accounting Standards Update (ASU) No. 2017-12, "Derivatives and Hedging (Topic 815) Targeted Improvements to Accounting for Hedging Activities", which amends and simplifies existing guidance in order to allow companies to more accurately present the economic effects of risk management activities in the financial statements. The guidance is effective for annual reporting periods beginning after December 15, 2018 (our fiscal 2020) including interim reporting periods within those annual reporting periods, and early adoption is permitted. We are currently evaluating the impact of the new guidance on our consolidated financial statements.
Income Taxes
In October 2016, the FASB issued ASU 2016-16, Income Taxes (Topic 740): Intra-Entity Transfers of Assets Other Than Inventory (“ASU 2016-16”). The purpose of ASU 2016-16 is to simplify the income tax accounting of an intra-entity transfer of an asset other than inventory and to record its effect when the transfer occurs. The guidance is effective for annual reporting periods beginning after December 15, 2017 (our fiscal 2019) including interim reporting periods within those annual reporting periods and early adoption is permitted. We are currently evaluating the impact of the new guidance on our consolidated financial statements. We expect to record a net deferred tax asset of approximately $72 million upon adoption, primarily relating to deductible amortization of intangible assets in Ireland. Post adoption, our effective tax rate will no longer include the benefit of this amortization, which is reflected in our effective tax rate reconciliation under the current guidance.
Leases
In February 2016, the FASB issued ASU No. 2016-02, Leases (Topic 842), which will replace the existing guidance in ASC 840, Leases. The updated standard aims to increase transparency and comparability among organizations by requiring lessees to recognize lease assets and lease liabilities on the balance sheet and to disclose important information about leasing arrangements. ASU 2016-02 is effective for annual periods beginning after December 15, 2018 (our fiscal 2020) and interim periods within those annual periods. Early adoption is permitted and modified retrospective application is required. We are currently evaluating the impact of the new guidance on our consolidated financial statements.
Revenue Recognition
In May 2014, the FASB issued ASU No. 2014-09, Revenue from Contracts with Customers: Topic 606 (ASC 606). ASC 606 supersedes nearly all existing revenue recognition guidance under U.S. GAAP. The FASB has also issued additional standards to provide clarification and implementation guidance on ASC 606.
The core principle of ASC 606 is to recognize revenue when promised goods or services are transferred to a customer in an amount that reflects the consideration that is expected to be received for those goods or services. Under the new guidance, an entity is required to evaluate revenue recognition through a five-step process: (1) identifying a contract with a customer; (2) identifying the performance obligations in the contract; (3) determining the transaction price; (4) allocating the transaction price to the performance obligations in the contract; and (5) recognizing revenue when (or as) the entity satisfies a performance obligation. The standard also requires disclosure of the nature, amount, timing and uncertainty of revenue and cash flows arising from contracts with customers. In applying the principles of ASC 606, it is possible more judgment and estimates may be required within the revenue recognition process than is required under existing U.S. GAAP, including identifying performance obligations, estimating the amount of variable consideration to include in the transaction price, and estimating the value of each performance obligation to allocate the total transaction price to each separate performance obligation.
F-16
ASC 606 is effective for us in the first quarter of our fiscal 2019. Companies may adopt ASC 606 using either the retrospective method, under which each prior reporting period is presented under ASC 606, with the option to elect certain permitted practical expedients, or the modified retrospective method, under which a company adopts ASC 606 from the beginning of the year of initial application with no restatement of comparative periods, with the cumulative effect of initially applying ASC 606 recognized at the date of initial application, and with certain additional required disclosures. We are adopting ASC 606 using the modified retrospective method.
While we are continuing to assess the impact of the new standard, we currently believe the most significant impact relates to accounting for our subscription arrangements that include term-based on-premise software licenses bundled with support and/or cloud services. Under current GAAP, the revenue attributable to these subscription licenses bundled with support is recognized ratably over the term of the arrangement because VSOE does not exist for the undelivered support element as it is not sold separately. Under the new standard, the requirement to have VSOE for undelivered elements to enable the separation of revenue for the delivered software licenses is eliminated. Accordingly, under the new standard we will be required to recognize as revenue a portion of the subscription fee upon delivery of the software license. For subscriptions arrangements that also include cloud services, the company assessed whether the cloud component was highly interrelated with the on-premise term software license. Other than a limited population of subscriptions, the cloud component is currently not deemed to be interrelated with the on-premise term software and as a result, cloud services will be accounted for as a separate distinct performance obligation. We do have a limited number of subscriptions that incorporate substantial cloud services where cloud services are not distinct from the on-premise term license in the context of the contracts as they are considered highly interrelated and represent a single performance obligation, for which the revenue will continue to be recognized over time. We currently expect revenue related to our perpetual license revenue and related support contracts, professional services and cloud offerings to remain substantially unchanged. Due to the complexity of certain of our contracts, the actual revenue recognition treatment required under the new standard may be dependent on contract-specific terms and, therefore, may vary in some instances.
Upon implementation of the new standard in fiscal 2019, we expect to make revisions to contract terms with our customers for new orders that will result in shortening the initial, non-cancellable term of our multi-year subscriptions to one year. This change will result in annual contractual periods for the majority of our software subscriptions, the license portion of which will be recognized at the beginning of each annual contract period upon delivery of the licenses and the support portion of which will be recognized ratably over the one year contractual period. As a result, we anticipate one year of subscription revenue will be recognized for each contract each year; however, more of the revenue will be recognized in the quarter that the contract period begins and less will be recognized in the subsequent three quarters of the contract than under the current accounting rules.
Under the modified retrospective method, we will evaluate each contract that is ongoing on the adoption date as if that contract had been accounted for under ASC 606 from contract inception. Some license revenue related to subscription arrangements that would have been recognized in future periods under current GAAP will be recast under ASC 606 as if the revenue had been recognized in prior periods. Under this transition method, we will not adjust historical reported revenue amounts. Instead, the revenue that would have been recognized under this method prior to the adoption date will be an adjustment to retained earnings and will not be recognized as revenue in future periods as previously planned. Because we expect that license revenue associated with subscription contracts will be recognized up front instead of over time under ASC 606, we expect approximately $350 million to $380 million will be adjusted to retained earnings upon adoption related to billed and unbilled deferred revenue. During the first year of adoption, we will disclose the amount of this retained earnings adjustment and intend to provide supplemental disclosure of how this revenue would have been recognized under the current rules.
Another significant provision under ASC 606 includes the capitalization and amortization of costs associated with obtaining and fulfilling a contract. Currently, substantially all of these costs are expensed in the period incurred. Under ASC 606, direct and incremental costs to acquire a contract are capitalized and amortized using a systematic basis over the pattern of transfer of the goods and services to which the asset relates. Under ASC 606, we estimate approximately $70 million of commission costs will be capitalized and amortized over the period the capitalized assets are expected to contribute to future cash flows.
F-17
Furthermore, we have made and will continue to make investments in systems and processes to enable timely and accurate reporting under the new standard. We are implementing operational and internal control structural changes.
C. Restructuring and Other Charges
Restructuring Charges (Credits)
In fiscal 2016, we initiated a plan to restructure our workforce and consolidate select facilities to reduce our cost structure and to realign our investments with what we believe to be our higher growth opportunities. The actions resulted in total restructuring charges of $84.5 million, primarily associated with termination benefits associated with approximately 800 employees. This restructuring plan was substantially completed in 2017.
In fiscal 2015, we committed to a plan to restructure our workforce and consolidate select facilities to realign our global workforce to increase investment in our IoT business and to reduce our cost structure through organizational efficiencies in the face of significant foreign currency depreciation relative to the U.S. Dollar and a more cautious outlook on global macroeconomic conditions. The actions resulted in total restructuring charges of $42.1 million, primarily associated with termination benefits associated with 411 employees. This restructuring plan was substantially completed in 2016.
In 2018, we recorded restructuring credits of $1.0 million ($0.2 million related to the 2016 restructuring and $0.8 million related to the 2015 restructuring). We made cash payments related to restructuring charges of $2.8 million ($2.6 million related to the 2016 restructuring and $0.2 million related to the 2015 restructuring). At September 30, 2018, accrued restructuring totaled $2.4 million related to the 2016 restructuring.
In 2017, we recorded restructuring charges of $7.9 million ($8.2 million of which related to the 2016 restructuring offset by $0.3 million related to the 2015 restructuring). We made cash payments related to restructuring charges of $37.1 million ($36.4 million of which related to the 2016 restructuring and $0.7 million related to the 2015 restructuring).
In 2016, we recorded restructuring charges of $76.3 million ($77.1 million of which related to the 2016 restructuring offset by $0.8 million credit related to the 2015 restructuring). We made cash payments related to restructuring charges of $55.0 million ($42.1 million of which related to the 2016 restructuring, $12.1 million related to the 2015 restructuring and $0.8 million related to prior restructuring plans).
The following table summarizes restructuring charges reserve activity for the three years ended September 30, 2018:
Employee Severance and Related Benefits | Facility Closures and Other Costs | Consolidated Total | |||||||||
(in thousands) | |||||||||||
Balance, October 1, 2015 | $ | 14,086 | $ | 1,168 | $ | 15,254 | |||||
Charges to operations | 74,929 | 1,344 | 76,273 | ||||||||
Cash disbursements | (53,966 | ) | (1,053 | ) | (55,019 | ) | |||||
Foreign currency impact | 128 | (28 | ) | 100 | |||||||
Balance, September 30, 2016 | 35,177 | 1,431 | 36,608 | ||||||||
Charges to operations | 2,373 | 5,569 | 7,942 | ||||||||
Cash disbursements | (35,069 | ) | (2,005 | ) | (37,074 | ) | |||||
Other non-cash charges | — | (704 | ) | (704 | ) | ||||||
Foreign currency impact | (745 | ) | 217 | (528 | ) | ||||||
Balance, September 30, 2017 | 1,736 | 4,508 | 6,244 | ||||||||
Charges (credits) to operations | (509 | ) | (494 | ) | (1,003 | ) | |||||
Cash disbursements | (1,247 | ) | (1,509 | ) | (2,756 | ) | |||||
Foreign currency impact | 20 | (90 | ) | (70 | ) | ||||||
Balance, September 30, 2018 | $ | — | $ | 2,415 | $ | 2,415 | |||||
F-18
Of the accrual for facility closures and related costs, as of September 30, 2018, $1.5 million is included in accrued expenses and other current liabilities and $0.9 million is included in other liabilities in the Consolidated Balance Sheets. The accrual for facility closures is net of assumed sublease income of $2.8 million. The accrual for employee severance and related benefits is included in accrued compensation and benefits in the Consolidated Balance Sheets.
Other - Headquarters relocation charges
Headquarters relocation charges represent accelerated depreciation expense recorded in anticipation of exiting our current headquarters facility. In 2019, we will be moving into a new worldwide headquarters in the Boston Seaport District, and we will be vacating our current headquarters space. Because our current headquarters lease will not expire until November 2022, we are seeking to sublease that space, but have not yet done so. If we are unable to sublease our current headquarters space for an amount at least equal to our rent obligations under the current headquarters lease (approximately $12 million per year), we will bear overlapping rent obligations for those premises and will be required to record additional headquarters relocation charges related to any rent shortfall. A charge for such shortfall will be recorded in the earlier of the period that we cease using the space (which will likely occur in the second quarter of our fiscal 2019) or the period we sign sublease contracts. Additionally, we will incur other costs associated with the move which will be recorded as incurred. In 2018, we recorded $4.8 million of accelerated depreciation expense related to shortening the estimated useful lives of leasehold improvements in our current facility.
D. Property and Equipment
Property and equipment consisted of the following:
September 30, | |||||||
2018 | 2017 | ||||||
(in thousands) | |||||||
Computer hardware and software | $ | 324,765 | $ | 286,380 | |||
Furniture and fixtures | 20,737 | 21,145 | |||||
Leasehold improvements | 47,272 | 47,658 | |||||
Gross property and equipment | 392,774 | 355,183 | |||||
Accumulated depreciation and amortization | (312,161 | ) | (291,583 | ) | |||
Net property and equipment | $ | 80,613 | $ | 63,600 | |||
Depreciation expense was $29.4 million, $28.0 million and $28.8 million in 2018, 2017 and 2016, respectively.
E. Acquisitions
In 2016, we completed the acquisitions of Kepware (on January 12, 2016) and Vuforia (on November 3, 2015). The results of operations of these acquired businesses have been included in our consolidated financial statements beginning on their respective acquisition dates. Our results of operations prior to these acquisitions, if presented on a pro forma basis, would not differ materially from our reported results.
These acquisitions have been accounted for as business combinations. Assets acquired and liabilities assumed have been recorded at their estimated fair values as of the respective acquisition date. The fair values of intangible assets for Kepware were based on valuations using an income approach, with estimates and assumptions provided by management of the acquired companies and PTC. The fair values of intangible assets for Vuforia were based on valuations using a cost approach which requires the use of significant estimates and assumptions, including estimating costs to reproduce an asset. The process for estimating the fair values of identifiable intangible assets as well as the Kepware contingent consideration liabilities requires the use of significant estimates and assumptions, including estimating future cash flows and developing appropriate discount rates. The excess of the purchase price over the tangible assets, identifiable intangible assets and assumed liabilities was recorded as goodwill.
F-19
Acquisition-related costs were $0.5 million, $1.6 million and $3.5 million in 2018, 2017 and 2016, respectively. Acquisition-related costs include direct costs of completing an acquisition (e.g., investment banker fees and professional fees, including legal and valuation services) and expenses related to acquisition integration activities (e.g., professional fees, severance, and retention bonuses). In addition, subsequent adjustments to our initial estimated amounts of contingent consideration, primarily net present value changes, are included within acquisition-related charges. These costs are classified in general and administrative expenses in the accompanying Consolidated Statements of Operations.
2016 Acquisitions
Kepware
On January 12, 2016, we acquired all of the ownership interest in Kepware, Inc. for $99.4 million in cash (net of cash acquired of $0.6 million) and, $16.9 million representing the fair value of contingent consideration payable upon achievement of targets described below. We borrowed $100.0 million under our existing credit facility in January of 2016 to fund the acquisition.
The acquisition of Kepware's KEPServerEX® communication platform enhanced our portfolio of Internet of Things (IoT) technology, and accelerated our entry into the factory setting and industrial IoT. At the time of the acquisition, Kepware had historical annualized revenues which were immaterial to our financial results. Kepware added approximately $16 million to our 2016 revenue and approximately $15 million in costs and expenses.
The purchase price allocation resulted in $77.1 million of goodwill, which will be deductible for income tax purposes. Intangible assets of $34.5 million includes purchased software of $28.7 million, customer relationships of $5.2 million and trademarks of $0.6 million, which are being amortized over useful lives of 10 years, 10 years and 6 years, respectively, based upon the pattern in which economic benefits related to such assets are expected to be realized.
The resulting amount of goodwill reflects our expectations of the following benefits: 1) Kepware’s protocol translators and connectivity platform strengthen the ThingWorx technology platform and accelerate our entry into the factory setting and Industrial IoT (IIoT); 2) cross-selling opportunities for our integrated technology platforms in the critical infrastructure markets to drive revenue growth; and 3) Kepware’s 20 years of manufacturing experience strengthens our manufacturing talent and domain expertise and provides support for our manufacturing strategy initiatives.
Vuforia
On November 3, 2015, pursuant to an Asset Purchase Agreement, we acquired the Vuforia business from Qualcomm Connected Experiences, Inc., a subsidiary of Qualcomm Incorporated, for $64.8 million in cash (net of cash acquired of $4.5 million). We borrowed $50.0 million under our credit facility to finance this acquisition.
The acquisition of Vuforia's augmented reality (AR) technology platform enhances our technology portfolio and accelerates our strategy as a leading provider of technologies and solutions that blend the digital and physical worlds. At the time of the acquisition, Vuforia had approximately 80 employees and historical annualized revenues which were immaterial to our financial results. The purchase price allocation resulted in $23.3 million of goodwill, which will be deductible for income tax purposes, $41.2 million of technology and $0.3 million of net tangible assets. The acquired technology is being amortized over a useful life of 6 years. The resulting amount of goodwill reflects the value of the synergies created by integrating Vuforia’s augmented technology platform into PTC’s IoT solutions.
F-20
The total purchase price for our 2016 acquisitions was allocated to assets and liabilities acquired as follows:
Purchase price allocation: | Kepware | Vuforia | |||||
(in thousands) | |||||||
Goodwill | $ | 77,081 | $ | 23,316 | |||
Identifiable intangible assets | 34,500 | 41,200 | |||||
Cash | 590 | 4,466 | |||||
Other assets and liabilities, net | 4,729 | 261 | |||||
Total allocation of purchase price consideration | 116,900 | 69,243 | |||||
Less: cash acquired | (590 | ) | (4,466 | ) | |||
Total purchase price allocation, net of cash acquired | 116,310 | 64,777 | |||||
Less: contingent consideration | (16,900 | ) | — | ||||
Net cash used for acquisitions of businesses | $ | 99,410 | $ | 64,777 | |||
F. Goodwill and Acquired Intangible Assets
In 2017, we had three operating and reportable segments: (1) Solutions Group, (2) IoT Group and (3) Professional Services. Effective with the beginning of the first quarter of 2018, we changed our operating and reportable segments from three to two: (1) Software Products and (2) Professional Services. We assess goodwill for impairment at the reporting unit level. Our reporting units are determined based on the components of our operating segments that constitute a business for which discrete financial information is available and for which operating results are regularly reviewed by segment management. Our reporting units are the same as our operating segments.
As of September 30, 2018, goodwill and acquired intangible assets in the aggregate attributable to our Software Products and Professional Services segment was $1,352.4 million and $30.2 million, respectively. As of September 30, 2017, goodwill and acquired intangible assets in the aggregate attributable to our Software Products and Professional Services segment was $1,410.0 million and $30.6 million, respectively.
Goodwill is tested for impairment annually, or on an interim basis if an event occurs or circumstances change that would, more likely than not, reduce the fair value of the reporting segment below its carrying value. We completed our annual goodwill impairment review as of June 30, 2018 and concluded that no impairment charge was required as of that date. We completed our annual goodwill impairment review as of June 30, 2018 based on a qualitative assessment. Our qualitative assessment included company specific (financial performance and long-range plans), industry, and macroeconomic factors, and consideration of the fair value of each reporting unit, which was approximately double its carrying value or higher at July 2, 2016, the last valuation date. Based on our qualitative assessment, we believe it is more likely than not that the fair values of our reporting units exceed their carrying values and no further impairment testing is required. Through September 30, 2018, there have not been any events or changes in circumstances that indicate that the carrying values of goodwill or acquired intangible assets may not be recoverable.
F-21
Goodwill and acquired intangible assets consisted of the following:
September 30, 2018 | September 30, 2017 | ||||||||||||||||||||||
Gross Carrying Amount | Accumulated Amortization | Net Book Value | Gross Carrying Amount | Accumulated Amortization | Net Book Value | ||||||||||||||||||
(in thousands) | |||||||||||||||||||||||
Goodwill (not amortized) | $ | 1,182,457 | $ | 1,182,772 | |||||||||||||||||||
Intangible assets with finite lives (amortized) (1): | |||||||||||||||||||||||
Purchased software | $ | 362,679 | $ | 254,059 | $ | 108,620 | $ | 362,955 | $ | 228,377 | $ | 134,578 | |||||||||||
Capitalized software | 22,877 | 22,877 | — | 22,877 | 22,877 | — | |||||||||||||||||
Customer lists and relationships | 357,586 | 270,272 | 87,314 | 359,932 | 241,554 | 118,378 | |||||||||||||||||
Trademarks and trade names | 19,054 | 14,786 | 4,268 | 19,138 | 14,186 | 4,952 | |||||||||||||||||
Other | 4,003 | 4,003 | — | 4,030 | 4,030 | — | |||||||||||||||||
$ | 766,199 | $ | 565,997 | $ | 200,202 | $ | 768,932 | $ | 511,024 | $ | 257,908 | ||||||||||||
Total goodwill and acquired intangible assets | $ | 1,382,659 | $ | 1,440,680 | |||||||||||||||||||
(1) The weighted average useful lives of purchased software, customer lists and relationships, and trademarks and trade names with a remaining net book value are 9 years, 10 years, and 11 years, respectively.
The changes in the carrying amounts of goodwill from October 1, 2017 to September 30, 2018 are due to the impact of acquisitions and to foreign currency translation adjustments related to those asset balances that are recorded in non-U.S. currencies.
Changes in goodwill presented by reportable segment were as follows:
Software Products | Professional Services | Total | |||||||||
(in thousands) | |||||||||||
Balance, September 30, 2016 | $ | 1,140,215 | $ | 29,598 | $ | 1,169,813 | |||||
Acquisition | 2,847 | — | 2,847 | ||||||||
Foreign currency translation adjustments | 9,855 | 257 | 10,112 | ||||||||
Balance, September 30, 2017 | $ | 1,152,917 | $ | 29,855 | $ | 1,182,772 | |||||
Acquisition | 4,350 | — | 4,350 | ||||||||
Foreign currency translation adjustments | (4,547 | ) | (118 | ) | (4,665 | ) | |||||
Balance, September 30, 2018 | $ | 1,152,720 | $ | 29,737 | $ | 1,182,457 | |||||
The aggregate amortization expense for intangible assets with finite lives recorded for the years ended September 30, 2018, 2017 and 2016 was reflected in our Consolidated Statements of Operations as follows:
Year ended September 30, | |||||||||||
2018 | 2017 | 2016 | |||||||||
(in thousands) | |||||||||||
Amortization of acquired intangible assets | $ | 31,350 | $ | 32,108 | $ | 33,198 | |||||
Cost of software revenue | 26,706 | 26,621 | 24,604 | ||||||||
Total amortization expense | $ | 58,056 | $ | 58,729 | $ | 57,802 | |||||
The estimated aggregate future amortization expense for intangible assets with finite lives remaining as of September 30, 2018 is $50.6 million for 2019, $47.8 million for 2020, $42.3 million for 2021, $29.1 million for 2022, $17.1 million for 2023 and $13.2 million thereafter.
F-22
G. Income Taxes
Our income (loss) before income taxes consisted of the following:
Year ended September 30, | |||||||||||
2018 | 2017 | 2016 | |||||||||
(in thousands) | |||||||||||
Domestic | $ | (114,591 | ) | $ | (140,150 | ) | $ | (156,166 | ) | ||
Foreign | 143,247 | 138,744 | 88,974 | ||||||||
Total income (loss) before income taxes | $ | 28,656 | $ | (1,406 | ) | $ | (67,192 | ) | |||
Our (benefit) provision for income taxes consisted of the following:
Year ended September 30, | |||||||||||
2018 | 2017 | 2016 | |||||||||
(in thousands) | |||||||||||
Current: | |||||||||||
Federal | $ | 3,009 | $ | 2,423 | $ | 2,417 | |||||
State | 2,003 | 340 | 571 | ||||||||
Foreign | 28,213 | 17,881 | 28,467 | ||||||||
33,225 | 20,644 | 31,455 | |||||||||
Deferred: | |||||||||||
Federal | (12,594 | ) | 4,911 | 965 | |||||||
State | (445 | ) | 877 | 515 | |||||||
Foreign | (43,517 | ) | (34,077 | ) | (45,662 | ) | |||||
(56,556 | ) | (28,289 | ) | (44,182 | ) | ||||||
Total provision (benefit) for income taxes | $ | (23,331 | ) | $ | (7,645 | ) | $ | (12,727 | ) | ||
On December 22, 2017, the United States enacted tax reform legislation through the Tax Cuts and Jobs Act, (the "Tax Act"), which significantly changed existing U.S. tax laws by a reduction of the corporate tax rate, the implementation of a new system of taxation for non-U.S. earnings, the imposition of a one-time tax on the deemed repatriation of undistributed earnings of non-U.S. subsidiaries, and the expansion of the limitations on the deductibility of executive compensation and interest expense. As we have a September 30 fiscal year-end, a blended U.S. statutory federal rate of approximately 24.5% applies for our fiscal year ending September 30, 2018 and 21% for subsequent fiscal years. The Tax Act also provides that net operating losses generated in years ending after December 31, 2017 (our fiscal 2018) will be carried forward indefinitely and can no longer be carried back, and that net operating losses generated in years beginning after December 31, 2017 can only reduce taxable income by up to 80% when utilized in a future period.
We have provided no federal income taxes payable as a result of the deemed repatriation of undistributed earnings as the tax will be offset by a combination of current year losses and existing attributes which had a full valuation allowance recorded against the related deferred tax assets. We recorded a state income taxes payable on the deemed repatriation of $2.1 million. We also recorded a deferred tax benefit of $14.1 million for the impact of the Tax Act on our net U.S. deferred income tax balances. This was primarily attributable to the reduction of the federal tax rate on the net deferred tax liability in the U.S., and the ability to realize net operating losses from the reversal of existing deferred tax assets which can now be carried forward indefinitely and can therefore be netted against deferred tax liabilities for indefinite lived intangible assets.
The changes included in the Tax Act are broad and complex. The Securities Exchange Commission has issued rules that allow for a measurement period of up to one year after the enactment date of the Tax Act to finalize the recording of the related tax impacts. We have finalized our accounting for the effects of the legislation with the exception of any additional guidance that may impact our provisional amounts recorded for the transition tax. We are not able to make reasonable estimates at this time of the effects of certain provisions of the Tax Act that will apply to us beginning in our fiscal year ending September 30, 2019, including the Global Intangible Low Tax Income tax (the "GILTI" tax) and any associated impact on our U.S. valuation allowance. We currently anticipate finalizing and recording any resulting adjustments in the quarter ending December 29, 2018.
F-23
Taxes computed at the statutory federal income tax rates are reconciled to the provision (benefit) for income taxes as follows (in thousands):
Year ended September 30, | ||||||||||||||||||||
2018 | 2017 | 2016 | ||||||||||||||||||
Statutory federal income tax rate | $ | 7,021 | 25 | % | $ | (492 | ) | (35 | )% | $ | (23,517 | ) | (35 | )% | ||||||
Change in valuation allowance | (181,047 | ) | (632 | )% | 17,334 | 1,233 | % | 37,996 | 57 | % | ||||||||||
Transition impact of U.S. Tax Act | 126,122 | 440 | % | — | — | — | — | |||||||||||||
Federal rate change | 69,648 | 243 | % | — | — | % | — | — | % | |||||||||||
State income taxes, net of federal tax benefit | 2,401 | 8 | % | 627 | 45 | % | (82 | ) | — | % | ||||||||||
Federal research and development credits | (3,058 | ) | (11 | )% | (2,182 | ) | (155 | )% | (5,981 | ) | (9 | )% | ||||||||
Resolution of uncertain tax positions | (4,646 | ) | (16 | )% | (3,840 | ) | (273 | )% | — | — | % | |||||||||
Foreign rate differences | (38,743 | ) | (135 | )% | (27,932 | ) | (1,987 | )% | (27,513 | ) | (41 | )% | ||||||||
Foreign tax on U.S. provision | 2,736 | 10 | % | 2,737 | 195 | % | 1,987 | 3 | % | |||||||||||
Excess tax benefits from restricted stock | (11,641 | ) | (41 | )% | — | — | — | — | ||||||||||||
Audits and settlements | 2,352 | 8 | % | — | — | — | — | |||||||||||||
U.S. permanent items | 5,408 | 19 | % | 6,030 | 429 | % | 2,886 | 4 | % | |||||||||||
Other, net | 116 | 1 | % | 73 | 4 | % | 1,497 | 2 | % | |||||||||||
Benefit for income taxes | $ | (23,331 | ) | (81 | )% | $ | (7,645 | ) | (544 | )% | $ | (12,727 | ) | (19 | )% | |||||
In 2018 our effective tax rate was lower than the statutory federal income tax rate due to U.S. tax reform, as described above. In 2018, 2017 and 2016, our effective tax rate was materially impacted by our corporate structure in which our foreign taxes are at an effective tax rate lower than the U.S. A significant amount of our foreign earnings is generated by our subsidiaries organized in Ireland. In 2018, 2017 and 2016, the foreign rate differential predominantly relates to these Irish earnings. Additionally, we have a full valuation allowance against deferred tax assets in the U.S., primarily related to net operating loss, tax credit carryforwards, capitalized research and development expense and deferred revenue. As a result, we have not recorded a benefit related to ongoing U.S. losses. Our foreign rate differential in 2018 ,2017 and 2016 includes the continuing rate benefit from a business realignment completed on September 30, 2014 in which intellectual property was transferred between two wholly-owned foreign subsidiaries. The realignment allows us to more efficiently manage the distribution of our products to European customers. In 2018, this realignment resulted in a tax benefit of approximately $24 million and in 2017 and 2016, a benefit of approximately $28 million in each year. In 2017 and 2016, the change in valuation allowance primarily relates to U.S. losses not benefited, partially offset by the release of valuation allowances in foreign subsidiaries of $9.0 million and $3.1 million, respectively. We recorded foreign withholding taxes, an obligation of the U.S. parent of $2.7 million in 2018 and $2.0 million in 2017 and 2016, respectively.
At September 30, 2018 and 2017, income taxes payable and income tax accruals recorded on the accompanying Consolidated Balance Sheets were $24.2 million ($18.0 million in accrued income taxes, $1.8 million in other current liabilities and $4.4 million in other liabilities) and $16.2 million ($5.7 million in accrued income taxes, $2.3 million in other current liabilities and $8.2 million in other liabilities), respectively. At September 30, 2018 and 2017, prepaid taxes recorded in prepaid expenses on the accompanying Consolidated Balance Sheets were $4.8 million and $7.1 million, respectively. We made net income tax payments of $22.6 million, $35.4 million and $25.5 million in 2018, 2017 and 2016, respectively.
F-24
The significant temporary differences that created deferred tax assets and liabilities are shown below:
September 30, | |||||||
2018 | 2017 | ||||||
(in thousands) | |||||||
Deferred tax assets: | |||||||
Net operating loss carryforwards | $ | 31,329 | $ | 143,793 | |||
Foreign tax credits | 2,201 | 21,099 | |||||
Capitalized research and development expense | 20,999 | 13,044 | |||||
Pension benefits | 12,296 | 12,107 | |||||
Prepaid expenses | 30,614 | 9,250 | |||||
Deferred revenue | 33,886 | 59,022 | |||||
Stock-based compensation | 11,622 | 25,360 | |||||
Other reserves not currently deductible | 13,588 | 16,905 | |||||
Amortization of intangible assets | 96,841 | 78,351 | |||||
Other tax credits | 55,760 | 42,652 | |||||
Depreciation | 4,364 | 3,095 | |||||
Capital loss carryforward | 33,024 | 33,535 | |||||
Deferred interest | 13,057 | 11,666 | |||||
Other | 1,152 | 6,599 | |||||
Gross deferred tax assets | 360,733 | 476,478 | |||||
Valuation allowance | (141,950 | ) | (279,683 | ) | |||
Total deferred tax assets | 218,783 | 196,795 | |||||
Deferred tax liabilities: | |||||||
Acquired intangible assets not deductible | (41,139 | ) | (70,570 | ) | |||
Pension prepayments | (2,362 | ) | (2,093 | ) | |||
Deferred revenue | (6,978 | ) | (6,214 | ) | |||
U.S taxes on unremitted foreign earnings | — | (11,440 | ) | ||||
Deferred income | (6,641 | ) | — | ||||
Other | (1,686 | ) | (1,192 | ) | |||
Total deferred tax liabilities | (58,806 | ) | (91,509 | ) | |||
Net deferred tax assets | $ | 159,977 | $ | 105,286 | |||
We have concluded, based on the weight of available evidence, that a full valuation allowance continues to be required against our U.S. net deferred tax assets as they are not more likely than not to be realized in the future. We will continue to reassess our valuation allowance requirements each financial reporting period.
For U.S. tax return purposes, net operating loss (NOL) carryforwards and tax credits are generally available to be carried forward to future years, subject to certain limitations. At September 30, 2018, we had U.S. federal NOL carryforwards from acquisitions of $4.1 million that expire in 2023 to 2029. The utilization of these NOL carryforwards is limited as a result of the change in ownership rules under Internal Revenue Code Section 382.
As of September 30, 2018, we had Federal R&D credit carryforwards of $30.0 million, which expire beginning in 2021 and ending in 2038, and Massachusetts R&D credit carryforwards of $22.4 million, which expire beginning in 2019 and ending in 2033. We also had foreign tax credits of $2.2 million, which expire beginning in 2026 and ending in 2027. A full valuation allowance is recorded against these carryforwards.
We also have NOL carryforwards in non-U.S. jurisdictions totaling $84.2 million, the majority of which do not expire. We also have non-U.S. tax credit carryforwards of $5.0 million that expire beginning in 2029 and ending in 2035. Additionally, we have interest and amortization carryforwards of $104.5 million and $709.3 million, respectively, in a foreign jurisdiction. There are limitations imposed on the utilization of such attributes that could restrict the recognition of any tax benefits.
As of September 30, 2018, we have a valuation allowance of $108.6 million against net deferred tax assets in the U.S. and a valuation allowance of $33.3 million against net deferred tax assets in certain
F-25
foreign jurisdictions. The valuation allowance recorded against net deferred tax assets of certain foreign jurisdictions is established primarily for our net operating loss carryforwards, the majority of which do not expire. However, there are limitations imposed on the utilization of such net operating losses that could restrict the recognition of any tax benefits.
The changes to the valuation allowance were primarily due to the following:
Year ended September 30, | |||||||||||
2018 | 2017 | 2016 | |||||||||
(in millions) | |||||||||||
Valuation allowance beginning of year | $ | 279.7 | $ | 235.5 | $ | 198.2 | |||||
Net release of valuation allowance (1) | (2.8 | ) | (9.1 | ) | (3.1 | ) | |||||
Net increase (decrease) in deferred tax assets with a full valuation allowance (2) | (134.9 | ) | 53.3 | 39.8 | |||||||
Establish valuation allowance in foreign jurisdictions | — | — | 0.6 | ||||||||
Valuation allowance end of year | $ | 142.0 | $ | 279.7 | $ | 235.5 | |||||
(1) | In 2018, 2017 and 2016, this is attributable to the release in foreign jurisdictions. |
(2) | This is primarily attributable to U.S. tax reform: the utilization of tax attributes used to offset the transition tax, the revaluation of the U.S. net deferred tax assets and liabilities, the ability to realize net operating losses from the reversal of existing deferred tax assets which can now be carried forward indefinitely and can therefore be netted against deferred tax liabilities for indefinite lived intangible. |
Our policy is to record estimated interest and penalties related to the underpayment of income taxes as a component of our income tax provision. In 2018 and 2017, we reduced interest expense by $0.6 million and $0.9 million, respectively, and in 2016, we recorded interest expense of $0.5 million. In 2018, 2017 and 2016, we had no tax penalty expense in our income tax provision. As of September 30, 2018 and 2017, we had accrued $0.5 million and $1.1 million, respectively, of net estimated interest expense related to income tax accruals. We had no accrued tax penalties as of September 30, 2018, 2017 or 2016.
Year ended September 30, | |||||||||||
Unrecognized tax benefits | 2018 | 2017 | 2016 | ||||||||
(in millions) | |||||||||||
Unrecognized tax benefit beginning of year | $ | 14.8 | $ | 15.5 | $ | 14.1 | |||||
Tax positions related to current year: | |||||||||||
Additions | 1.5 | 0.9 | 1.0 | ||||||||
Tax positions related to prior years: | |||||||||||
Additions | — | 1.0 | 0.4 | ||||||||
Reductions | (4.7 | ) | (1.6 | ) | — | ||||||
Settlements | — | (1 | ) | — | |||||||
Statute expirations | (1.8 | ) | — | — | |||||||
Unrecognized tax benefit end of year | $ | 9.8 | $ | 14.8 | $ | 15.5 | |||||
If all of our unrecognized tax benefits as of September 30, 2018 were to become recognizable in the future, we would record a benefit to the income tax provision of $9.8 million (which would be partially offset by an increase in the U.S. valuation allowance of $3.7 million). Although we believe our tax estimates are appropriate, the final determination of tax audits and any related litigation could result in favorable or unfavorable changes in our estimates. We believe it is reasonably possible that within the next 12 months the amount of unrecognized tax benefits related to the resolution of multi-jurisdictional tax positions could be reduced by up to $2 million as audits close and statutes of limitations expire.
In the fourth quarter of 2016, we received an assessment of approximately $12 million from the tax authorities in Korea. The assessment relates to various tax issues, primarily foreign withholding taxes. We have appealed and intend to vigorously defend our positions. We believe that upon completion of a multi-level appeal process it is more likely than not that our positions will be sustained. Accordingly, we
F-26
have not recorded a tax reserve for this matter. We paid this assessment in the first quarter of 2017 and have recorded the amount in other assets, pending resolution of the appeal process.
In the normal course of business, PTC and its subsidiaries are examined by various taxing authorities, including the IRS in the U.S. We regularly assess the likelihood of additional assessments by tax authorities and provide for these matters as appropriate. We are currently under audit by tax authorities in several jurisdictions. Audits by tax authorities typically involve examination of the deductibility of certain permanent items, transfer pricing, limitations on net operating losses and tax credits. Although we believe our tax estimates are appropriate, the final determination of tax audits and any related litigation could result in material changes in our estimates. As of September 30, 2018, we remained subject to examination in the following major tax jurisdictions for the tax years indicated:
Major Tax Jurisdiction | Open Years | |
United States | 2015 through 2018 | |
Germany | 2011 through 2018 | |
France | 2015 through 2018 | |
Japan | 2013 through 2018 | |
Ireland | 2014 through 2018 | |
Additionally, net operating loss and tax credit carryforwards from certain earlier periods in these jurisdictions may be subject to examination to the extent they are utilized in later periods.
We incurred expenses related to stock-based compensation in 2018, 2017 and 2016 of $82.9 million, $76.7 million and $66.0 million, respectively. Accounting for the tax effects of stock-based awards requires that we establish a deferred tax asset as the compensation is recognized for financial reporting prior to recognizing the tax deductions. The tax benefit recognized in the Consolidated Statements of Operations related to stock-based compensation totaled $28.3 million, $1.3 million and $0.7 million in 2018, 2017 and 2016, respectively. Upon the settlement of the stock-based awards (i.e., exercise or vesting), the actual tax deduction is compared with the cumulative financial reporting compensation cost and any excess tax deduction is considered a windfall tax benefit and is recorded to the tax provision. In 2018, windfall tax benefits of $13.2 million were recorded to the tax provision. Prior to the adoption of ASU 2016-09, windfall tax benefits were recorded to APIC when they resulted in a reduction in taxes payable. In 2017 and 2016, we recorded windfall tax benefits of $0.6 million and $0.1 million to APIC, respectively.
In the first quarter of 2018, as a result of the adoption of ASU 2016-09, we recognized previously unrecognized tax benefits of $37.0 million as increases in deferred tax assets for tax loss carryovers and tax credits, primarily in the U.S. A corresponding increase to the valuation allowance of $36.9 million was recorded to the extent that it was not more likely than not that these benefits would be realized.
Prior to the passage of the U.S. Tax Act, the Company asserted that substantially all of the undistributed earnings of its foreign subsidiaries were considered indefinitely invested and accordingly, no deferred taxes were provided. Pursuant to the provisions of the U.S. Tax Act, these earnings were subjected to U.S. federal taxation via a one-time transition tax, and there is therefore no longer a material cumulative basis difference associated with the undistributed earnings. We maintain our assertion of our intention to permanently reinvest these earnings outside the U.S. unless repatriation can be done substantially tax-free, with the exception of a foreign holding company formed in 2018 and our Taiwan subsidiary. If we decide to repatriate any additional non-U.S. earnings in the future, we may be required to establish a deferred tax liability on such earnings. The amount of unrecognized deferred tax liability on the undistributed earnings would not be material.
F-27
H. Debt
As of September 30, 2018 and 2017, we had the following long-term borrowing obligations:
September 30, | |||||||
2018 | 2017 | ||||||
(in thousands) | |||||||
6.000% Senior notes due 2024 | $ | 500,000 | $ | 500,000 | |||
Credit facility-revolver | 148,125 | 218,125 | |||||
Total debt | 648,125 | 718,125 | |||||
Unamortized debt issuance costs for the Senior notes (1) | (4,857 | ) | (5,719 | ) | |||
Total debt, net of issuance costs (2) | $ | 643,268 | $ | 712,406 | |||
(1) Unamortized debt issuance costs related to the credit facility were $3.8 million and $2.0 million as of September 30, 2018 and September 30, 2017, respectively, and were included in other assets. | |||||||
(2) As of September 30, 2018 and 2017, all debt was included in long-term debt. | |||||||
Senior Unsecured Notes
In May 2016, we issued $500 million in aggregate principal amount of 6.0% senior, unsecured long-term debt at par value, due in 2024. We used the net proceeds from the sale of the notes to repay a portion of our outstanding revolving loan under our current credit facility. Interest is payable semi-annually on November 15 and May 15. The debt indenture includes covenants that limit our ability to, among other things, incur additional debt, grant liens on our properties or capital stock, enter into sale and leaseback transactions or asset sales, and make capital distributions. We were in compliance with all of the covenants as of September 30, 2018.
On and after May 15, 2019, we may redeem the senior notes at any time in whole or from time to time in part at specified redemption prices. In certain circumstances constituting a change of control, we will be required to make an offer to repurchase the senior notes at a purchase price equal to 101% of the aggregate principal amount of the notes, plus accrued and unpaid interest. Our ability to repurchase the senior notes in such event may be limited by law, by the indenture associated with the senior notes, by our then-available financial resources or by the terms of other agreements to which we may be party at such time. If we fail to repurchase the senior notes as required by the indenture, it would constitute an event of default under the indenture which, in turn, may also constitute an event of default under other obligations.
As of September 30, 2018, the total estimated fair value of the Notes was approximately $521.2 million, which is based on quoted prices for the notes on that date.
Credit Agreement
We maintain a multi-currency credit facility with a syndicate of sixteen banks for which JPMorgan Chase Bank, N.A. acts as Administrative Agent. We use the credit facility for general corporate purposes, including acquisitions of businesses, share repurchases and working capital requirements. As of September 30, 2018, the fair value of our credit facility approximates its book value.
In September 2018, we amended and restated the credit facility to increase the revolving loan commitment from $600 million to $700 million and amend other provisions, including replacing the fixed charge coverage ratio with an interest coverage ratio. The revolving loan commitment does not require amortization of principal and may be repaid in whole or in part prior to the scheduled maturity date at our option without penalty or premium. The credit facility matures on September 13, 2023, when all remaining amounts outstanding will be due and payable in full.
PTC and certain eligible foreign subsidiaries are eligible borrowers under the credit facility. Any borrowings by PTC Inc. under the credit facility would be guaranteed by PTC Inc.’s material domestic subsidiaries that become parties to the subsidiary guaranty, if any. As of the filing of this Form 10-K, there are no subsidiary guarantors of the obligations under the credit facility. Any borrowings by eligible foreign subsidiary borrowers would be guaranteed by PTC Inc. and any subsidiary guarantors. As of the filing of this Form 10-K, $110.0 million were borrowed by an eligible foreign subsidiary borrower. In addition, owned property (including equity interests) of PTC and certain of its material domestic subsidiaries' owned property is subject to first priority perfected liens in favor of the lenders under this credit facility. 100% of
F-28
the voting equity interests of certain of PTC’s domestic subsidiaries and 65% of its material first-tier foreign subsidiaries are pledged as collateral for the obligations under the credit facility.
Loans under the credit facility bear interest at variable rates which reset every 30 to 180 days depending on the rate and period selected by PTC as described below. As of September 30, 2018, the annual rate for borrowing outstanding was 3.8%. Interest rates on borrowings outstanding under the credit facility range from 1.25% to 1.75% above an adjusted LIBO rate for Euro currency borrowings or would range from 0.25% to 0.75% above the defined base rate (the greater of the Prime Rate, the NYFRB rate plus 0.5%, or an adjusted LIBO rate plus 1%) for base rate borrowings, in each case based upon PTC’s total leverage ratio. Additionally, PTC may borrow certain foreign currencies at rates set in the same range above the respective London interbank offered interest rates for those currencies, based on PTC’s total leverage ratio. A quarterly commitment fee on the undrawn portion of the credit facility is required, ranging from 0.175% to 0.30% per annum, based upon PTC’s total leverage ratio.
The credit facility limits PTC’s and its subsidiaries’ ability to, among other things: incur liens or guarantee obligations; pay dividends (other than to PTC) and make other distributions; make investments and enter into joint ventures; dispose of assets; and engage in transactions with affiliates, except on an arms-length basis. Under the credit facility, PTC and its material domestic subsidiaries may not invest cash or property in, or loan to, PTC’s foreign subsidiaries in aggregate amounts exceeding $100 million for any purpose and an additional $200 million for acquisitions of businesses. In addition, under the credit facility, PTC and its subsidiaries must maintain the following financial ratios:
• | a total leverage ratio, defined as consolidated funded indebtedness to consolidated trailing four quarters EBITDA, not to exceed 4.50 to 1.00 as of the last day of any fiscal quarter; |
• | a senior secured leverage ratio, defined as senior consolidated total indebtedness (which excludes unsecured indebtedness) to the consolidated trailing four quarters EBITDA, not to exceed 3.00 to 1.00 as of the last day of any fiscal quarter; and |
• | an interest coverage ratio, defined as the ratio of consolidated trailing four quarters EBITDA to consolidated trailing our quarters of cash basis interest expense, of not less than 3.00 to 1.00 as of the last day of any fiscal quarter. |
As of September 30, 2018, our total leverage ratio was 2.36 to 1.00, our senior secured leverage ratio was 0.58 to 1.00 and our interest coverage ratio was 6.18 to 1.00 and we were in compliance with all financial and operating covenants of the credit facility.
Any failure to comply with the financial or operating covenants of the credit facility would prevent PTC from being able to borrow additional funds, and would constitute a default, permitting the lenders to, among other things, accelerate the amounts outstanding, including all accrued interest and unpaid fees, under the credit facility and to terminate the credit facility. A change in control of PTC, as defined in the agreement, also constitutes an event of default, permitting the lenders to accelerate the indebtedness and terminate the credit facility.
We incurred $2.9 million in financing costs in connection with the September 2018 credit facility amendment and restatement. These origination costs are recorded as deferred debt issuance costs and are included in other assets. We incurred $6.9 million in financing costs in connection with the Senior Notes in 2016. These origination costs are recorded as a direct reduction from the carrying amount of the related debt liability. Financing costs are expensed over the remaining term of the obligations.
In 2018, 2017 and 2016, we paid $39.8 million, $38.9 million and $13.3 million, respectively, of interest on our debt. The average interest rate on borrowings outstanding during 2018, 2017 and 2016 was approximately 5.2%, 4.9% and 3.0%, respectively.
I. Commitments and Contingencies
Leasing Arrangements
We lease office facilities under operating leases expiring at various dates through 2037. Certain leases require us to pay for taxes, insurance, maintenance and other operating expenses in addition to rent. Lease expense was $36.9 million, $35.8 million and $37.2 million in 2018, 2017 and 2016, respectively. At September 30, 2018, our future minimum lease payments under noncancellable operating leases are as follows:
F-29
Year ending September 30, | (in thousands) | ||
2019 | $ | 38,690 | |
2020 | 33,753 | ||
2021 | 33,109 | ||
2022 | 28,248 | ||
2023 | 18,336 | ||
Thereafter | 200,543 | ||
Total minimum lease payments | $ | 352,679 | |
Amounts above include future minimum lease payments for our corporate headquarters facility located in Needham, Massachusetts. The lease for our headquarters facility was renewed in the first quarter of 2011 for an additional 10 years (through November 2022) with a ten-year renewal option through November 2032. Under the terms of the lease, we are paying approximately $7.4 million in annual base rent plus operating expenses. Utilities related to this lease are excluded from the above table due to variability year to year. These costs were approximately $1.6 million in 2018. The amended lease provides for $12.8 million in landlord funding for leasehold improvements which we completed in 2014. We capitalized these leasehold improvements and will amortize them to expense over the shorter of the lease term or their expected useful life. The $12.8 million of funding by the landlord is not included in the table above and reduces rent expense over the lease term.
On September 7, 2017, we entered into a lease agreement with SCD L2 Seaport Square LLC for approximately 250,000 square feet located at 121 Seaport Boulevard, Boston, Massachusetts. Upon completion of construction of the new facility, we expect to move our headquarters from Needham to Boston. The term of the lease is expected to run from January 1, 2019 through June 30, 2037, subject to adjustment based on the initial occupancy date. Base rent for the first year of the lease is $11.0 million and will increase by $1 per square foot leased per year thereafter ($0.3 million per year). Base rent, which first becomes payable on July 1, 2020, subject to adjustment based on the lease commencement date, is included in the operating lease obligations above. In addition to the base rent, PTC shall pay its pro rata portions of building operating costs and real estate taxes (together, “Additional Rent”). Additional rent, equal to approximately 63% of total building operating costs and real estate taxes, is estimated to be approximately $7.1 million for the first year we begin paying rent and is not included in the operating lease payments above. The lease provides for up to approximately $25 million in landlord funding for leasehold improvements ($100 per square foot). We capitalize leasehold improvements as the assets are placed in service and amortize them to expense over the shorter of the lease term or their expected useful life. The $25 million of funding by the landlord is not included in the table above and reduces rent expense over the lease term.
As of September 30, 2018 and 2017, we had letters of credit and bank guarantees outstanding of $15.5 million (of which $1.1 million was collateralized) and $4.3 million (of which $1.2 million was collateralized), respectively, primarily related to our corporate headquarters lease.
Legal and Regulatory Matters
Korean Tax Audit
In July 2016, we received an assessment from the tax authorities in Korea related to an ongoing tax audit of approximately $12 million. See Note G. Income Taxes for additional information.
Legal Proceedings
We are subject to various legal proceedings and claims that arise in the ordinary course of business. We do not believe that resolving the legal proceedings and claims that we are currently subject to will have a material adverse impact on our financial condition, results of operations or cash flows. However, the results of legal proceedings cannot be predicted with certainty. Should any of these legal proceedings and claims be resolved against us, the operating results for a particular reporting period could be adversely affected.
Accruals
With respect to legal proceedings and claims, we record an accrual for a contingency when it is probable that a liability has been incurred and the amount of the loss can be reasonably estimated. For
F-30
legal proceedings and claims for which the likelihood that a liability has been incurred is more than remote but less than probable, we estimate the range of possible outcomes. As of September 30, 2018, we estimate approximately $0.7 million to $5.0 million in legal proceedings and claims, of which we had accrued $0.9 million. As of September 30, 2017, we had a legal proceedings and claims accrual of $0.3 million.
Accounts Receivable
Accounts receivable as of September 30, 2017 included an amount invoiced under a multi-year contract for which the period of performance, and related revenue recognized, spanned a number of years (with no revenue recognized since the first quarter of 2017). The invoiced amount was disputed by the customer. A settlement reached in September 2018 included partial payment of the receivable and new software purchases. The net revenue write-down recorded in the fourth quarter was $9.3 million, comprised of $14.5 million professional services revenue write-down, partially offset by new license revenue of $5.2 million.
Guarantees and Indemnification Obligations
We enter into standard indemnification agreements in the ordinary course of our business. Pursuant to such agreements with our business partners or customers, we indemnify, hold harmless, and agree to reimburse the indemnified party for losses suffered or incurred by the indemnified party, generally in connection with patent, copyright or other intellectual property infringement claims by any third party with respect to our products, as well as claims relating to property damage or personal injury resulting from the performance of services by us or our subcontractors. The maximum potential amount of future payments we could be required to make under these indemnification agreements is unlimited. Historically, our costs to defend lawsuits or settle claims relating to such indemnity agreements have been minimal and we accordingly believe the estimated fair value of liabilities under these agreements is immaterial.
We warrant that our software products will perform in all material respects in accordance with our standard published specifications in effect at the time of delivery of the licensed products for a specified period of time. Additionally, we generally warrant that our consulting services will be performed consistent with generally accepted industry standards. In most cases, liability for these warranties is capped. If necessary, we would provide for the estimated cost of product and service warranties based on specific warranty claims and claim history; however, we have not incurred significant cost under our product or services warranties. As a result, we believe the estimated fair value of these liabilities is immaterial.
J. Stockholders’ Equity
Preferred Stock
We may issue up to 5.0 million shares of our preferred stock in one or more series. 0.5 million of these shares are designated as Series A Junior Participating Preferred Stock. Our Board of Directors is authorized to fix the rights and terms for any series of preferred stock without additional shareholder approval.
Common Stock
Our Articles of Organization authorize us to issue up to 500 million shares of our common stock. As part of a strategic alliance, in the fourth quarter of 2018, Rockwell Automation made a $1 billion equity investment in PTC, by acquiring 10,582,010 shares at a price of $94.50 per share.
Our Board of Directors has authorized us to repurchase up to $1,500 million of our common stock for the October 1, 2017 through September 30, 2020 period.
We intend to use cash from operations and borrowings under our credit facility to make such repurchases. All shares of our common stock repurchased are automatically restored to the status of authorized and unissued.
In 2018, we repurchased 9.4 million shares. The repurchases were made under two accelerated repurchase (ASR) agreements. We completed the $100 million ASR repurchase in the third quarter of 2018. We entered into a $1,000 million ASR in July 2018. Shares valued at $800 million in the aggregate were delivered to us upon entry into the ASR. The remaining $200 million represents the amount held back by the bank counterparty pending final settlement of the ASR, which is expected to occur in the second or third quarter of 2019. Upon settlement of the ASR, the total shares repurchased by us will equal
F-31
$1,000 million divided by the average daily volume weighted-average price of our common stock during the term of the ASR program less a fixed per share discount. We used the $1 billion in proceeds from the Rockwell Automation investment in PTC and $100 million of cash from operations to make the repurchases.
In 2017, we repurchased 0.9 million shares at cost of $51.0 million. In 2016, we did not repurchase any shares due to our transition to a subscription business model and the near-term impact on free cash flow and EBITDA.
K. Equity Incentive Plan
Our 2000 Equity Incentive Plan (2000 Plan) provides for grants of nonqualified and incentive stock options, common stock, restricted stock, restricted stock units and stock appreciation rights to employees, directors, officers and consultants. We award restricted stock units as the principal equity incentive awards, including certain performance-based awards that are earned based on achieving performance criteria established by the Compensation Committee of our Board of Directors on or prior to the grant date. Each restricted stock unit represents the contingent right to receive one share of our common stock.
The fair value of restricted stock units granted in 2018, 2017 and 2016 was based on the fair market value of our stock on the date of grant. The weighted average fair value per share of restricted stock units granted in 2018, 2017 and 2016 was $76.17, $51.27 and $37.25, respectively. In 2018 and 2017, the weighted average fair value per share of restricted stock was increased by $4.35 and $2.27, respectively, by the additional shares earned for the 2016 TSR grant upon measurement on the vest date in 2017.
Beginning in the first quarter of 2018, we account for forfeitures as they occur, rather than estimate expected forfeitures.
The following table shows total stock-based compensation expense recorded from our stock-based awards as reflected in our Consolidated Statements of Operations:
Year ended September 30, | |||||||||||
2018 | 2017 | 2016 | |||||||||
(in thousands) | |||||||||||
Cost of license subscription revenue | $ | 1,801 | $ | 1,379 | $ | 805 | |||||
Cost of support revenue | 2,645 | 5,116 | 4,593 | ||||||||
Cost of professional services revenue | 7,079 | 6,116 | 5,393 | ||||||||
Sales and marketing | 24,893 | 15,373 | 14,659 | ||||||||
Research and development | 13,488 | 13,968 | 10,174 | ||||||||
General and administrative | 33,033 | 34,756 | 30,372 | ||||||||
Total stock-based compensation expense | $ | 82,939 | $ | 76,708 | $ | 65,996 | |||||
Stock-based compensation expense in 2018, 2017 and 2016 includes $4.3 million, $3.2 million, and $0.4 million respectively, related to our employee stock purchase plan (ESPP). The stock-based compensation expense in 2016 included $10 million of expense related to modifications of certain performance-based RSUs previously granted under our long-term incentive programs. The Compensation Committee of our Board of Directors amended these equity awards due to the impact of changes in our business model and strategy and foreign currency on our financial results.
As of September 30, 2018, total unrecognized compensation cost related to unvested restricted stock units expected to vest was approximately $144.5 million and the weighted average remaining recognition period for unvested awards was 28 months.
As of September 30, 2018, 2.3 million shares of common stock were available for grant under the 2000 Plan and 3.3 million shares of common stock were reserved for issuance upon the exercise of stock options and vesting of restricted stock units granted and outstanding.
Our ESPP, initiated in the fourth quarter of 2016, allows eligible employees to contribute up to 10% of their base salary, up to a maximum of $25,000 per year and subject to any other plan limitations, toward the purchase of our common stock at a discounted price. The purchase price of the shares on each purchase date is equal to 85% of the lower of the fair market value of our common stock on the first and
F-32
last trading days of each offering period. The ESPP is qualified under Section 423 of the Internal Revenue Code. We estimate the fair value of each purchase right under the ESPP on the date of grant using the Black-Scholes option valuation model and use the straight-line attribution approach to record the expense over the six-month offering period.
Shares | Weighted Average Grant Date Fair Value | Aggregate Intrinsic Value as of September 30, 2018 | ||||||||
Restricted stock unit activity for the year ended September 30, 2018 | (in thousands except grant date fair value data) | |||||||||
Balance of nonvested outstanding restricted stock units October 1, 2017 | 3,487 | $ | 45.57 | |||||||
Granted (1) | 2,190 | $ | 76.17 | |||||||
Vested | (1,829 | ) | $ | 43.91 | ||||||
Forfeited or not earned | (564 | ) | $ | 51.32 | ||||||
Balance of nonvested outstanding restricted stock units September 30, 2018 | 3,284 | $ | 65.93 | $ | 348,638 | |||||
(1) Restricted stock granted includes approximately 184,000 shares from prior period TSR awards that were earned upon achievement of the performance criteria and vested in November 2018.
Restricted Stock Units | ||||||
Restricted stock unit grants | Performance-based RSUs (1) | Service-based RSUs (2) | ||||
(Number of Units in thousands) | ||||||
Year ended September 30, 2018 | 961 | 1,045 | ||||
(1) Substantially all the performance-based RSUs were granted to our executive officers. Approximately 189,000 shares are eligible to vest based upon annual performance measures, measured over a three-year period. RSUs not earned for a period may be earned in the third period. An additional 250,000 shares are eligible to vest based upon a 2018 performance measure. To the extent earned, those performance-based RSUs will vest in three substantially equal installments on November 15, 2018, November 15, 2019 and November 15, 2020, or the date the Compensation Committee determines the extent to which the applicable performance criteria have been achieved for each performance period. An additional 500,000 shares are eligible to vest based upon annual performance measures, measured over a three-year period in fiscal years 2021, 2022 and 2023. RSUs not earned for a period may be earned in the third period.
(2) The service-based RSUs were granted to employees, our executive officers and our directors. All service-based RSUs will vest in three substantially equal annual installments on or about the anniversary of the date of grant.
Until July 2005, we generally granted stock options. For those options, the option exercise price was typically the fair market value at the date of grant, and they generally vested over four years and expired ten years from the date of grant. There were no options outstanding and exercisable at September 30, 2018, 2017 and 2016.
Year ended September 30, | |||||||||||
2018 | 2017 | 2016 | |||||||||
Value of stock option and stock-based award activity | (in thousands) | ||||||||||
Total intrinsic value of stock options exercised | $ | — | $ | — | $ | 88 | |||||
Total fair value of restricted stock unit awards vested | $ | 127,525 | $ | 78,573 | $ | 63,655 | |||||
In 2018, shares issued upon vesting of restricted stock units were net of 0.7 million shares retained by us to cover employee tax withholdings of $45.4 million. In 2017, shares issued upon vesting of restricted stock units were net of 0.5 million shares retained by us to cover employee tax withholdings of $26.7 million. In 2016, shares issued upon vesting of restricted stock and restricted stock units were net of 0.6 million shares retained by us to cover employee tax withholdings of $20.9 million.
L. Employee Benefit Plan
We offer a savings plan to eligible U.S. employees. The plan is intended to qualify under Section 401(k) of the Internal Revenue Code. Participating employees may defer a portion of their pre-tax
F-33
compensation, as defined, but not more than statutory limits. We contribute 50% of the amount contributed by the employee, up to a maximum of 3% of the employee’s earnings. Our matching contributions vest at a rate of 25% per year of service, with full vesting after 4 years of service. We made matching contributions of $5.8 million, $5.6 million, and $5.4 million in 2018, 2017 and 2016, respectively.
M. Pension Plans
We maintain several international defined benefit pension plans primarily covering certain employees of Computervision, which we acquired in 1998, and CoCreate, which we acquired in 2008, and covering employees in Japan. Benefits are based upon length of service and average compensation with vesting after one to five years of service. The pension cost was actuarially computed using assumptions applicable to each subsidiary plan and economic environment. We adjust our pension liability related to our plans due to changes in actuarial assumptions and performance of plan investments, as shown below. Effective in 1998, benefits under one of the international plans were frozen indefinitely.
The following table presents the actuarial assumptions used in accounting for the pension plans:
2018 | 2017 | 2016 | ||||||
Weighted average assumptions used to determine benefit obligations at September 30 measurement date: | ||||||||
Discount rate | 1.9 | % | 1.8 | % | 1.3 | % | ||
Rate of increase in future compensation | 3.0 | % | 2.8 | % | 2.8 | % | ||
Weighted average assumptions used to determine net periodic pension cost for fiscal years ended September 30: | ||||||||
Discount rate | 1.8 | % | 1.3 | % | 2.2 | % | ||
Rate of increase in future compensation | 2.8 | % | 2.8 | % | 3.0 | % | ||
Rate of return on plan assets | 5.4 | % | 5.4 | % | 5.7 | % | ||
In selecting the expected long-term rate of return on assets, we considered the current investment portfolio and the investment return goals in the plans’ investment policy statements. We, with input from the plans’ professional investment managers and actuaries, also considered the average rate of earnings expected on the funds invested or to be invested to provide plan benefits. This process included determining expected returns for the various asset classes that comprise the plans’ target asset allocation. This basis for selecting the long-term asset return assumptions is consistent with the prior year. Using generally accepted diversification techniques, the plans’ assets, in aggregate and at the individual portfolio level, are invested so that the total portfolio risk exposure and risk-adjusted returns best meet the plans’ long-term liabilities to employees. Plan asset allocations are reviewed periodically and rebalanced to achieve target allocation among the asset categories when necessary.
As of September 30, 2018, the weighted long-term rate of return assumption is 5.4%. These rates of return, together with the assumptions used to determine the benefit obligations as of September 30, 2018 in the table above, will be used to determine our 2019 net periodic pension cost, which we expect to be approximately $1.2 million.
The actuarially computed components of net periodic pension cost recognized in our Consolidated Statements of Operations for each year are shown below:
Year ended September 30, | |||||||||||
2018 | 2017 | 2016 | |||||||||
(in thousands) | |||||||||||
Interest cost of projected benefit obligation | $ | 1,260 | $ | 815 | $ | 1,374 | |||||
Service cost | 1,535 | 1,696 | 1,599 | ||||||||
Expected return on plan assets | (4,180 | ) | (3,327 | ) | (3,305 | ) | |||||
Amortization of prior service cost | (5 | ) | (5 | ) | (5 | ) | |||||
Recognized actuarial loss | 2,293 | 3,385 | 2,292 | ||||||||
Settlement loss | 9 | — | — | ||||||||
Net periodic pension cost | $ | 912 | $ | 2,564 | $ | 1,955 | |||||
F-34
The following tables display the change in benefit obligation and the change in the plan assets and funded status of the plans as well as the amounts recognized in our Consolidated Balance Sheets:
Year ended September 30, | |||||||
2018 | 2017 | ||||||
(in thousands) | |||||||
Change in benefit obligation: | |||||||
Projected benefit obligation—beginning of year | $ | 87,168 | $ | 92,695 | |||
Service cost | 1,535 | 1,696 | |||||
Interest cost | 1,260 | 815 | |||||
Actuarial loss (gain) | 2,157 | (8,496 | ) | ||||
Foreign exchange impact | (1,669 | ) | 2,379 | ||||
Participant contributions | 212 | 183 | |||||
Benefits paid | (1,637 | ) | (2,104 | ) | |||
Settlements | (1,162 | ) | — | ||||
Projected benefit obligation—end of year | $ | 87,864 | $ | 87,168 | |||
Change in plan assets and funded status: | |||||||
Plan assets at fair value—beginning of year | $ | 70,494 | $ | 61,935 | |||
Actual return on plan assets | 1,025 | 6,261 | |||||
Employer contributions | 2,459 | 2,036 | |||||
Participant contributions | 212 | 183 | |||||
Foreign exchange impact | (1,250 | ) | 2,183 | ||||
Settlements | (1,162 | ) | — | ||||
Benefits paid | (1,637 | ) | (2,104 | ) | |||
Plan assets at fair value—end of year | 70,141 | 70,494 | |||||
Projected benefit obligation—end of year | 87,864 | 87,168 | |||||
Underfunded status | $ | (17,723 | ) | $ | (16,674 | ) | |
Accumulated benefit obligation—end of year | $ | 85,103 | $ | 84,298 | |||
Amounts recognized in the balance sheet: | |||||||
Non-current liability | $ | (17,502 | ) | $ | (16,674 | ) | |
Current liability | $ | (221 | ) | $ | — | ||
Amounts in accumulated other comprehensive loss: | |||||||
Unrecognized actuarial loss | $ | 27,027 | $ | 24,738 | |||
We expect to recognize approximately $2.4 million of the unrecognized actuarial loss as of September 30, 2018 as a component of net periodic pension cost in 2019.
The following table shows change in accumulated other comprehensive loss:
Year ended September 30, | |||||||
2018 | 2017 | ||||||
(in thousands) | |||||||
Accumulated other comprehensive loss- beginning of year | $ | 24,738 | $ | 38,667 | |||
Recognized during year - net actuarial (losses) | (2,288 | ) | (3,380 | ) | |||
Occurring during year - settlement loss | (9 | ) | — | ||||
Occurring during year - net actuarial losses (gains) | 5,312 | (11,430 | ) | ||||
Foreign exchange impact | (726 | ) | 881 | ||||
Accumulated other comprehensive loss- end of year | $ | 27,027 | $ | 24,738 | |||
F-35
The following table shows the percentage of total plan assets for each major category of plan assets:
September 30, | |||||
2018 | 2017 | ||||
Asset category: | |||||
Equity securities | 35 | % | 23 | % | |
Fixed income securities | 46 | % | 57 | % | |
Commodities | 1 | % | 6 | % | |
Insurance company funds | 12 | % | 12 | % | |
Cash | 6 | % | 2 | % | |
100 | % | 100 | % | ||
We periodically review the pension plans’ investments in the various asset classes. The current asset allocation target is 60% equity securities and 40% fixed income securities for the CoCreate plan in Germany, and 100% fixed income securities for the other international plans. The fixed income securities for the other international plans primarily include investments held with insurance companies with fixed returns. The plans’ investment managers are provided specific guidelines under which they are to invest the assets assigned to them. In general, investment managers are expected to remain fully invested in their asset class with further limitations on risk as related to investments in a single security, portfolio turnover and credit quality.
The German CoCreate plan's investment policy prohibits the use of derivatives associated with leverage and speculation or investments in securities issued by PTC, except through index-related strategies and/or commingled funds. An investment committee oversees management of the pension plans’ assets. Plan assets consist primarily of investments in mutual funds invested in equity and fixed income securities.
In 2018, 2017 and 2016 our actual return on plan assets was $1.0 million, $6.3 million and $1.7 million, respectively.
Based on actuarial valuations and additional voluntary contributions, we contributed $2.5 million, $2.0 million, and $2.0 million in 2018, 2017 and 2016, respectively, to the plans.
As of September 30, 2018, benefit payments expected to be paid over the next ten years are outlined in the following table:
Future Benefit Payments | |||
(in thousands) | |||
Year ending September 30, | |||
2019 | $ | 2,721 | |
2020 | 2,989 | ||
2021 | 3,265 | ||
2022 | 3,871 | ||
2023 | 3,873 | ||
2024 to 2028 | 23,493 | ||
Fair Value of Plan Assets
The International Plan assets are comprised primarily of investments in a trust and an insurance company. The underlying investments in the trust are primarily publicly traded European DJ EuroStoxx50 equities and European governmental fixed income securities. They are classified as Level 1 because the underlying units of the trust are traded in open public markets. The fair value of the underlying investments in equity securities and fixed income are based upon publicly-traded exchange prices.
F-36
September 30, 2018 | |||||||||||||||
Level 1 | Level 2 | Level 3 | Total | ||||||||||||
(in thousands) | |||||||||||||||
Plan assets: | |||||||||||||||
Fixed income securities: | |||||||||||||||
Government | $ | 29,754 | $ | — | $ | — | $ | 29,754 | |||||||
European corporate investment grade | 2,499 | — | — | 2,499 | |||||||||||
European large capitalization stocks | 24,502 | — | — | 24,502 | |||||||||||
Commodities | 724 | — | — | 724 | |||||||||||
Insurance company funds (1) | — | 8,413 | — | 8,413 | |||||||||||
Cash | 4,249 | — | — | 4,249 | |||||||||||
$ | 61,728 | $ | 8,413 | $ | — | $ | 70,141 | ||||||||
September 30, 2017 | |||||||||||||||
Level 1 | Level 2 | Level 3 | Total | ||||||||||||
(in thousands) | |||||||||||||||
Plan assets: | |||||||||||||||
Fixed income securities: | |||||||||||||||
Government | $ | 29,445 | $ | — | $ | — | $ | 29,445 | |||||||
European corporate investment grade | 10,675 | — | — | 10,675 | |||||||||||
European large capitalization stocks | 16,164 | — | — | 16,164 | |||||||||||
Commodities | 3,966 | — | — | 3,966 | |||||||||||
Insurance company funds (1) | — | 8,714 | — | 8,714 | |||||||||||
Cash | 1,530 | — | — | 1,530 | |||||||||||
$ | 61,780 | $ | 8,714 | $ | — | $ | 70,494 | ||||||||
(1) These investments are comprised primarily of funds invested with an insurance company in Japan with a guaranteed rate of return. The insurance company invests these assets primarily in government and corporate bonds.
N. Fair Value Measurements
Money market funds, time deposits and corporate notes/bonds are classified within Level 1 of the fair value hierarchy because they are valued based on quoted market prices in active markets.
Certificates of deposit, commercial paper and certain U.S. government agency securities are classified within Level 2 of the fair value hierarchy. These instruments are valued based on quoted prices in markets that are not active or based on other observable inputs consisting of market yields, reported trades and broker/dealer quotes.
The principal market in which we execute our foreign currency contracts is the institutional market in an over-the-counter environment with a relatively high level of price transparency. The market participants are usually large financial institutions. Our foreign currency contracts’ valuation inputs are based on quoted prices and quoted pricing intervals from public data sources and do not involve management judgment. These contracts are typically classified within Level 2 of the fair value hierarchy.
The fair value of our contingent consideration arrangements is determined based on our evaluation as to the probability and amount of any earn-out that will be achieved based on expected future performances by the acquired entities. These arrangements are classified within Level 3 of the fair value hierarchy.
F-37
Our significant financial assets and liabilities measured at fair value on a recurring basis as of September 30, 2018 and 2017 were as follows:
September 30, 2018 | |||||||||||||||
Level 1 | Level 2 | Level 3 | Total | ||||||||||||
(in thousands) | |||||||||||||||
Financial assets: | |||||||||||||||
Cash equivalents (1) | $ | 93,058 | $ | — | $ | — | $ | 93,058 | |||||||
Marketable securities: | |||||||||||||||
Certificates of deposit | — | 219 | — | 219 | |||||||||||
Corporate notes/bonds | 54,737 | — | — | 54,737 | |||||||||||
U.S. government agency securities | — | 995 | — | 995 | |||||||||||
Forward contracts | — | 2,889 | — | 2,889 | |||||||||||
$ | 147,795 | $ | 4,103 | $ | — | $ | 151,898 | ||||||||
Financial liabilities: | |||||||||||||||
Contingent consideration related to acquisitions | $ | — | $ | — | $ | 1,575 | $ | 1,575 | |||||||
Forward contracts | — | 3,419 | — | 3,419 | |||||||||||
$ | — | $ | 3,419 | $ | 1,575 | $ | 4,994 | ||||||||
September 30, 2017 | |||||||||||||||
Level 1 | Level 2 | Level 3 | Total | ||||||||||||
(in thousands) | |||||||||||||||
Financial assets: | |||||||||||||||
Cash equivalents (1) | $ | 49,845 | $ | — | $ | — | $ | 49,845 | |||||||
Marketable securities: | |||||||||||||||
Certificates of deposit | — | 240 | — | 240 | |||||||||||
Corporate notes/bonds | 47,673 | — | — | 47,673 | |||||||||||
U.S. government agency securities | — | 2,402 | — | 2,402 | |||||||||||
Forward contracts | — | 1,163 | — | 1,163 | |||||||||||
$ | 97,518 | $ | 3,805 | $ | — | $ | 101,323 | ||||||||
Financial liabilities: | |||||||||||||||
Contingent consideration related acquisitions | $ | — | $ | — | $ | 8,400 | $ | 8,400 | |||||||
Forward contracts | — | 4,347 | — | 4,347 | |||||||||||
$ | — | $ | 4,347 | $ | 8,400 | $ | 12,747 | ||||||||
(1) Money market funds and time deposits.
Since 2015, we have had two major acquisitions resulting in contingent consideration: ColdLight and Kepware. Changes in the fair value of Level 3 contingent consideration liability associated with these acquisitions were as follows:
Contingent Consideration | |||||||||||||||
(in thousands) | |||||||||||||||
ColdLight | Kepware | Other | Total | ||||||||||||
Balance at October 1, 2016 | $ | 2,500 | $ | 17,070 | $ | — | $ | 19,570 | |||||||
Change in fair value of contingent consideration | — | 930 | — | 930 | |||||||||||
Payment of contingent consideration | (2,500 | ) | (9,600 | ) | — | (12,100 | ) | ||||||||
Balance at October 1, 2017 | $ | — | $ | 8,400 | $ | — | $ | 8,400 | |||||||
Contingent consideration at acquisition | — | — | 2,100 | 2,100 | |||||||||||
Payment of contingent consideration | — | (8,400 | ) | (525 | ) | (8,925 | ) | ||||||||
Balance at September 30, 2018 | $ | — | $ | — | $ | 1,575 | $ | 1,575 | |||||||
F-38
As of September 30, 2018, all contingent consideration liabilities are included in accrued expenses and other current liabilities. Contingent consideration is valued using a discounted cash flow method and a probability weighted estimate of achievement of the targets. Payments made against the original fair value ($8.3 million, $11.0 million and $10.6 million, in 2018, 2017 and 2016, respectively) were included in financing activities in the Consolidated Statement of Cash Flows. Payments related to changes in fair value after the respective acquisition dates are recorded in operating activities.
In connection with our acquisition of Kepware, the former shareholders were eligible to receive additional consideration of up to $18.0 million, which was contingent on the achievement of certain Financial Performance, Product Integration and Business Integration targets (as defined in the Stock Purchase Agreement) within 24 months from April 1, 2016. The estimated undiscounted range of outcomes for the contingent consideration was $16.9 million to $18.0 million at the acquisition date. As of September 30, 2018, we had made $18.0 million in payments and had no liability remaining.
O. Marketable Securities
The amortized cost and fair value of marketable securities as of September 30, 2018 and 2017 were as follows:
September 30, 2018 | |||||||||||||||
Amortized cost | Gross unrealized gains | Gross unrealized losses | Fair value | ||||||||||||
(in thousands) | |||||||||||||||
Certificates of deposit | $ | 220 | $ | — | $ | (1 | ) | $ | 219 | ||||||
Corporate notes/bonds | 55,140 | — | (403 | ) | 54,737 | ||||||||||
U.S. government agency securities | 1,004 | — | (9 | ) | 995 | ||||||||||
$ | 56,364 | $ | — | $ | (413 | ) | $ | 55,951 | |||||||
September 30, 2017 | |||||||||||||||
Amortized cost | Gross unrealized gains | Gross unrealized losses | Fair value | ||||||||||||
(in thousands) | |||||||||||||||
Certificates of deposit | $ | 240 | $ | — | $ | — | $ | 240 | |||||||
Corporate notes/bonds | 47,811 | 2 | (140 | ) | 47,673 | ||||||||||
U.S. government agency securities | 2,407 | — | (5 | ) | 2,402 | ||||||||||
$ | 50,458 | $ | 2 | $ | (145 | ) | $ | 50,315 | |||||||
The following tables summarize the fair value and gross unrealized losses aggregated by category and the length of time that individual securities have been in a continuous unrealized loss position as of September 30, 2018 and 2017.
September 30, 2018 | |||||||||||||||||||||||
Less than twelve months | Greater than twelve months | Total | |||||||||||||||||||||
Fair Value | Gross unrealized loss | Fair Value | Gross unrealized loss | Fair Value | Gross unrealized loss | ||||||||||||||||||
(in thousands) | |||||||||||||||||||||||
Certificates of deposit | $ | 219 | $ | (1 | ) | $ | — | $ | — | $ | 219 | $ | (1 | ) | |||||||||
Corporate notes/bonds | 24,067 | (70 | ) | 30,670 | (333 | ) | 54,737 | (403 | ) | ||||||||||||||
US government agency securities | — | — | 995 | (9 | ) | 995 | (9 | ) | |||||||||||||||
$ | 24,286 | $ | (71 | ) | $ | 31,665 | $ | (342 | ) | $ | 55,951 | $ | (413 | ) | |||||||||
F-39
September 30, 2017 | |||||||||||||||||||||||
Less than twelve months | Greater than twelve months | Total | |||||||||||||||||||||
Fair Value | Gross unrealized loss | Fair Value | Gross unrealized loss | Fair Value | Gross unrealized loss | ||||||||||||||||||
(in thousands) | |||||||||||||||||||||||
Certificates of deposit | $ | 240 | $ | — | $ | — | $ | — | $ | 240 | $ | — | |||||||||||
Corporate notes/bonds | 15,254 | (43 | ) | 28,885 | (97 | ) | 44,139 | (140 | ) | ||||||||||||||
US government agency securities | — | — | 2,402 | (5 | ) | 2,402 | (5 | ) | |||||||||||||||
$ | 15,494 | $ | (43 | ) | $ | 31,287 | $ | (102 | ) | $ | 46,781 | $ | (145 | ) | |||||||||
The following table presents our available-for-sale marketable securities by contractual maturity date, as of September 30, 2018 and 2017.
September 30, 2018 | September 30, 2017 | ||||||||||||||
Amortized cost | Fair value | Amortized cost | Fair value | ||||||||||||
(in thousands) | (in thousands) | ||||||||||||||
Due in one year or less | $ | 25,792 | $ | 25,670 | $ | 18,274 | $ | 18,244 | |||||||
Due after one year through three years | 30,572 | 30,281 | 32,184 | 32,071 | |||||||||||
$ | 56,364 | $ | 55,951 | $ | 50,458 | $ | 50,315 | ||||||||
P. Derivative Financial Instruments
As of September 30, 2018 and 2017, we had outstanding forward contracts for derivatives not designated as hedging instruments with notional amounts equivalent to the following:
September 30, | |||||||
Currency Hedged | 2018 | 2017 | |||||
(in thousands) | |||||||
Canadian / U.S. Dollar | $ | 7,334 | $ | 12,809 | |||
Euro / U.S. Dollar | 297,730 | 244,000 | |||||
British Pound / U.S. Dollar | 7,074 | 907 | |||||
Israeli Sheqel / U.S. Dollar | 9,778 | 8,820 | |||||
Japanese Yen / Euro | — | 17,694 | |||||
Japanese Yen / U.S. Dollar | 37,456 | 3,198 | |||||
Swiss Franc / U.S. Dollar | 11,944 | 605 | |||||
Swiss Franc / Euro | — | 7,157 | |||||
Swedish Krona / U.S. Dollar | 18,207 | 4,627 | |||||
Chinese Yuan offshore / Euro | — | 10,423 | |||||
Singapore Dollar / U.S. Dollar | 1,314 | 1,186 | |||||
Chinese Renminbi / U.S. Dollar | 9,010 | — | |||||
All other | 6,109 | 7,093 | |||||
Total | $ | 405,956 | $ | 318,519 | |||
F-40
The following table shows the effect of our non-designated hedges in the Consolidated Statements of Operations for the year ended September 30, 2018 and 2017:
Derivatives Not Designated as Hedging Instruments | Location of Gain or (Loss) Recognized in Income | Net realized and unrealized gain or (loss) (excluding the underlying foreign currency exposure being hedged) | ||||||||||||
Year ended September 30, | ||||||||||||||
2018 | 2017 | 2016 | ||||||||||||
(in thousands) | ||||||||||||||
Forward Contracts | Other income (expense), net | $ | (9,720 | ) | $ | 870 | $ | (883 | ) | |||||
As of September 30, 2018 and 2017, we had outstanding forward contracts designated as cash flow hedges with notional amounts equivalent to the following:
September 30, | |||||||
Currency Hedged | 2018 | 2017 | |||||
(in thousands) | |||||||
Euro / U.S. Dollar | $ | 8,495 | $ | 64,831 | |||
Japanese Yen / U.S. Dollar | 2,193 | 22,675 | |||||
SEK / U.S. Dollar | 1,708 | 14,091 | |||||
Total | $ | 12,396 | $ | 101,597 | |||
The following table shows the effect of our derivative instruments designated as cash flow hedges in the Consolidated Statements of Operations for the twelve months ended September 30, 2018 and 2017 (in thousands):
Derivatives Designated as Hedging Instruments | Gain or (Loss) Recognized in OCI-Effective Portion | Location of Gain or (Loss) Reclassified from OCI into Income-Effective Portion | Gain or (Loss) Reclassified from OCI into Income-Effective Portion | Location of Gain or (Loss) Recognized-Ineffective Portion | Gain or (Loss) Recognized-Ineffective Portion | ||||||||||||||||||||
Year ended September 30, | |||||||||||||||||||||||||
2018 | 2017 | 2018 | 2017 | 2018 | 2017 | ||||||||||||||||||||
Forward Contracts | $ | 1,652 | $ | (866 | ) | Software Revenue | $ | (552 | ) | $ | (524 | ) | Other Income (Expense) | $ | 21 | $ | (49 | ) | |||||||
As of September 30, 2018, we estimated that approximately all values reported in accumulated other comprehensive income will be reclassified to income within the next twelve months.
In the event the underlying forecast transaction does not occur, or it becomes probable that it will not occur, the related hedge gains and losses on the cash flow hedge would be immediately reclassified to “Other income (expense), net” on the Consolidated Statements of Operations. For the year ended September 30, 2018, there were no such gains or losses.
F-41
The following table shows our derivative instruments measured at gross fair value as reflected in the Consolidated Balance Sheets:
September 30, | |||||||||||||||
Fair Value of Derivatives Designated As Hedging Instruments | Fair Value of Derivatives Not Designated As Hedging Instruments | ||||||||||||||
2018 | 2017 | 2018 | 2017 | ||||||||||||
(in thousands) | (in thousands) | ||||||||||||||
Derivative assets (a): | |||||||||||||||
Forward Contracts | $ | 440 | $ | 540 | $ | 2,449 | $ | 623 | |||||||
Derivative liabilities (b): | |||||||||||||||
Forward Contracts | $ | — | $ | 2,352 | $ | 3,419 | $ | 1,995 | |||||||
(a) As of September 30, 2018, $2,889 thousand current derivative assets are recorded in other current assets, in the Consolidated Balance Sheets. As of September 30, 2017, $1,128 thousand current derivative assets are recorded in other current assets, and $35 thousand long-term derivative assets are recorded in other assets in the Consolidated Balance Sheets. | |||||||||||||||
(b) As of September 30, 2018, $3,419 thousand current derivative liabilities are recorded in accrued expenses and other current liabilities in the Consolidated Balance Sheets. As of September 30, 2017, $4,329 thousand current derivative liabilities are recorded in accrued expenses and other current liabilities, and $18 thousand long-term derivative liabilities are recorded in other liabilities in the Consolidated Balance Sheets. | |||||||||||||||
Offsetting Derivative Assets and Liabilities
We have entered into master netting arrangements which allow net settlements under certain conditions. Although netting is permitted, it is currently our policy and practice to record all derivative assets and liabilities on a gross basis in the Consolidated Balance Sheets.
The following table sets forth the offsetting of derivative assets as of September 30, 2018:
Gross Amounts Offset in the Consolidated Balance Sheets | Gross Amounts Not Offset in the Consolidated Balance Sheets | ||||||||||||||||||||||
September 30, 2018 | Gross Amount of Recognized Assets | Gross Amounts Offset in the Consolidated Balance Sheets | Net Amounts of Assets Presented in the Consolidated Balance Sheets | Financial Instruments | Cash Collateral Received | Net Amount | |||||||||||||||||
(in thousands) | |||||||||||||||||||||||
Forward Contracts | $ | 2,889 | $ | — | $ | 2,889 | $ | (2,889 | ) | $ | — | $ | — | ||||||||||
The following table sets forth the offsetting of derivative liabilities as of September 30, 2018:
Gross Amounts Offset in the Consolidated Balance Sheets | Gross Amounts Not Offset in the Consolidated Balance Sheets | ||||||||||||||||||||||
September 30, 2018 | Gross Amount of Recognized Liabilities | Gross Amounts Offset in the Consolidated Balance Sheets | Net Amounts of Liabilities Presented in the Consolidated Balance Sheets | Financial Instruments | Cash Collateral Pledged | Net Amount | |||||||||||||||||
(in thousands) | |||||||||||||||||||||||
Forward Contracts | $ | 3,419 | $ | — | $ | 3,419 | $ | (2,889 | ) | $ | — | $ | 530 | ||||||||||
Net gains and losses on foreign currency exposures, including realized and unrealized gains and losses on forward contracts, included in foreign currency net losses, were net losses of $7.0 million, $5.7 million and $1.9 million for 2018, 2017 and 2016, respectively. Net realized and unrealized gains and losses on forward contracts included in foreign currency net losses were a net loss of $7.5 million in 2018, a net gain of $1.8 million in 2017, and a net gain of $0.5 million in 2016.
F-42
Q. Segment Information
Effective with the beginning of fiscal 2018, we changed our segments, see Note A. Description of Business and Basis of Presentation for additional information. We operate within a single industry segment -- computer software and related services. Operating segments as defined under GAAP are components of an enterprise about which separate financial information is available that is evaluated regularly by the chief operating decision maker, or decision-making group, in deciding how to allocate resources and in assessing performance. Our chief operating decision maker is our President and Chief Executive Officer. We have two operating and reportable segments: (1) Software Products, which includes license, subscription and related support revenue (including updates and technical support) for all our products; and (2) Professional Services, which includes consulting, implementation and training services. We do not allocate sales & marketing or general and administrative expense to our operating segments as these activities are managed on a consolidated basis. Additionally, segment profit does not include stock-based compensation, amortization of intangible assets, restructuring charges and certain other identified costs that we do not allocate to the segments for purposes of evaluating their operational performance.
The revenue and profit attributable to our operating segments are summarized below. We do not produce asset information by reportable segment; therefore, it is not reported.
Year ended September 30, | |||||||||||
2018 | 2017 | 2016 | |||||||||
(in thousands) | |||||||||||
Software Products | |||||||||||
Revenue | $ | 1,088,487 | $ | 987,316 | $ | 943,596 | |||||
Operating Costs (1) | 387,817 | 367,224 | 344,594 | ||||||||
Profit | 700,670 | 620,092 | 599,002 | ||||||||
Professional Services | |||||||||||
Revenue | 153,337 | 176,723 | 196,937 | ||||||||
Operating Costs (2) | 136,816 | 145,091 | 165,325 | ||||||||
Profit | 16,521 | 31,632 | 31,612 | ||||||||
Total segment revenue | 1,241,824 | 1,164,039 | 1,140,533 | ||||||||
Total segment costs | 524,633 | 512,315 | 509,919 | ||||||||
Total segment profit | 717,191 | 651,724 | 630,614 | ||||||||
Unallocated operating expenses: | |||||||||||
Sales and marketing expenses | 389,631 | 357,573 | 352,806 | ||||||||
General and administrative expenses | 108,095 | 108,439 | 108,548 | ||||||||
Restructuring and headquarters relocation charges, net | 3,764 | 7,942 | 76,273 | ||||||||
Intangibles amortization | 58,056 | 58,729 | 57,802 | ||||||||
Stock-based compensation | 82,939 | 76,708 | 65,996 | ||||||||
Other unallocated operating expenses (3) | 1,469 | 1,435 | 6,203 | ||||||||
Total operating income | 73,237 | 40,898 | (37,014 | ) | |||||||
Interest expense | (41,673 | ) | (42,400 | ) | (29,882 | ) | |||||
Interest income and other expense, net | (2,908 | ) | 96 | (296 | ) | ||||||
Income (loss) before income taxes | $ | 28,656 | $ | (1,406 | ) | $ | (67,192 | ) | |||
(1) Operating costs for the Software Products segment includes all cost of software revenue and research and development costs, excluding stock-based compensation and intangible amortization. Operating costs for the Software Products segment includes depreciation of $5.1 million, $5.0 million and $4.7 million in 2018, 2017 and 2016, respectively.
F-43
(2) Operating costs for the Professional Services segment includes all cost of professional services revenue, excluding stock-based compensation, intangible amortization, and fair value adjustments for deferred services costs. The Professional Services segment includes depreciation of $1.6 million, $1.8 million and $2.0 million in 2018, 2017 and 2016, respectively.
(3) Other unallocated operating expenses include acquisition-related and other transactional costs, certain legal accrual expenses, pension plan termination-related costs and fair value adjustments for deferred services costs. Unallocated departments include depreciation of $22.7 million, $21.2 million and $22.1 million in 2018, 2017 and 2016, respectively.
We report revenue by the following four product areas:
• | CAD: Creo® and Mathcad®. |
• | PLM: PLM solutions (primarily Windchill®), Integrity™ and Atego®. |
• | IoT: ThingWorx®, Vuforia® and Kepware®. |
• | Other, including service parts management. |
Year ended September 30, | |||||||||||
2018 | 2017 | 2016 | |||||||||
(in thousands) | |||||||||||
CAD | $ | 499,772 | $ | 474,608 | $ | 462,307 | |||||
PLM | 483,327 | 454,299 | 456,285 | ||||||||
IoT | 139,278 | 103,359 | 80,297 | ||||||||
Other | 119,447 | 131,773 | 141,644 | ||||||||
Total revenue | $ | 1,241,824 | $ | 1,164,039 | $ | 1,140,533 | |||||
Revenue and long-lived tangible assets for the geographic regions in which we operate is presented below.
Year ended September 30, | |||||||||||
2018 | 2017 | 2016 | |||||||||
(in thousands) | |||||||||||
Revenue: | |||||||||||
Americas (1) | $ | 511,237 | $ | 500,879 | $ | 487,594 | |||||
Europe (2) | 485,851 | 435,183 | 424,268 | ||||||||
Asia-Pacific | 244,736 | 227,977 | 228,671 | ||||||||
Total revenue | $ | 1,241,824 | $ | 1,164,039 | $ | 1,140,533 | |||||
September 30, | |||||||||||
2018 | 2017 | 2016 | |||||||||
(in thousands) | |||||||||||
Long-lived tangible assets: | |||||||||||
Americas (3) | $ | 67,704 | $ | 47,055 | $ | 48,281 | |||||
Europe | 5,303 | 6,284 | 6,915 | ||||||||
Asia-Pacific | 7,606 | 10,261 | 11,917 | ||||||||
Total long-lived tangible assets | $ | 80,613 | $ | 63,600 | $ | 67,113 | |||||
(1) | Includes revenue in the United States totaling $487.3 million, $475.5 million and $463.1 million for 2018, 2017 and 2016, respectively. |
(2) | Includes revenue in Germany totaling $193.3 million, $164.7 million and $167.2 million for 2018, 2017 and 2016, respectively. |
(3) | Substantially all of the Americas long-lived tangible assets are located in the United States. |
F-44
Our international revenue is presented based on the location of our customer. We license products to customers worldwide. Our sales and marketing operations outside the United States are conducted principally through our international sales subsidiaries throughout Europe and the Asia-Pacific regions. Intercompany sales and transfers between geographic areas are accounted for at prices that are designed to be representative of unaffiliated party transactions.
R. Subsequent Events
Restructuring
In October 2018, we announced a restructuring charge of approximately $18 million, which consists principally of termination benefits, substantially all of which we expect will be paid in fiscal 2019. With the growth opportunity in front of us in the Industrial Internet of Things and Augmented Reality, other strategic initiatives we’ve undertaken, and our continued commitment to operating margin improvement, we are realigning our workforce to shift investment to support these strategic, high growth opportunities. As this is a realignment of resources rather than a cost-savings initiative, we don’t expect this realignment will result in significant cost savings.
Restricted Stock Unit Grants
In October and November 2018, we granted restricted stock units (RSUs) valued at approximately $73.5 million to employees, including $31.9 million target value of performance-based RSUs, of which $31.7 million was granted to our executives, and $41.6 million of time-based RSUs granted to employees and executives.
Substantially all of the executive performance-based RSUs are eligible to vest based upon annual performance measures. To the extent earned, these units will vest in three substantially equal installments on the later of November 15, 2019, 2020 and 2021, or the date the Compensation Committee determines the extent to which the applicable performance criteria have been achieved for each performance period. RSUs not earned for a period may be earned in the third period. The performance-based RSUs allow for upside based on 2019, 2020 and 2021 performance measures, and provide the opportunity to earn up to one times the number of performance-based RSUs (up to a maximum of 146,000 shares) if certain performance conditions are met.
The time-based RSUs will vest in three substantially equal annual installments on November 15, 2019, 2020 and 2021. The time-based RSUs granted to our executives allow for upside based on a 2019 performance measure. Executives have the opportunity to earn up to one times or, for our CEO, two times the number of time-based RSUs granted (up to a maximum of 197,000 shares) if the upside performance measure is achieved. Any upside RSUs earned will vest in three substantially equal installments at the same times as the base RSUs.
Borrowings
In November 2018, we borrowed $80 million under our credit facility to fund working capital requirements, including 2018 year end incentive-based compensation accruals.
F-45
SELECTED CONSOLIDATED FINANCIAL DATA
You should read the following selected consolidated financial data in conjunction with Item 7. “Management’s Discussion and Analysis of Financial Condition and Results of Operations” and our consolidated financial statements and the related notes appearing elsewhere in this Annual Report.
The Consolidated Statements of Operations data for the years ended September 30, 2018, 2017, and 2016 and the Consolidated Balance Sheets data as of September 30, 2018 and 2017 are derived from our audited consolidated financial statements appearing elsewhere in this Annual Report. The Consolidated Statements of Operations data for the years ended September 30, 2015 and 2014 and the Consolidated Balance Sheet data as of September 30, 2016, 2015 and 2014 are derived from our audited consolidated financial statements that are not included in this Annual Report. The historical results are not necessarily indicative of results in any future period.
FIVE-YEAR SUMMARY OF SELECTED FINANCIAL DATA (1)
(in thousands, except per share data)
2018 | 2017 | 2016 | 2015 | 2014 | |||||||||||||||
Revenue | $ | 1,241,824 | $ | 1,164,039 | $ | 1,140,533 | $ | 1,255,242 | $ | 1,356,967 | |||||||||
Gross margin | 915,630 | 835,020 | 814,868 | 920,508 | 983,284 | ||||||||||||||
Operating income (loss) (2) | 73,237 | 40,898 | (37,014 | ) | 41,616 | 196,576 | |||||||||||||
Net income (loss) (2) (3) | 51,987 | 6,239 | (54,465 | ) | 47,557 | 160,194 | |||||||||||||
Earnings (loss) per share—Basic (2) (3) | 0.45 | 0.05 | (0.48 | ) | 0.41 | 1.36 | |||||||||||||
Earnings (loss) per share—Diluted (2) (3) | 0.44 | 0.05 | (0.48 | ) | 0.41 | 1.34 | |||||||||||||
Total assets | 2,329,022 | 2,360,384 | 2,345,729 | 2,209,913 | 2,199,954 | ||||||||||||||
Working capital | (101,495 | ) | (12,353 | ) | (11,930 | ) | 87,419 | 105,500 | |||||||||||
Long-term liabilities | 719,154 | 796,039 | 848,544 | 732,482 | 719,398 | ||||||||||||||
Stockholders’ equity | 874,589 | 885,436 | 842,666 | 860,171 | 853,889 | ||||||||||||||
(1) | The consolidated financial position and results of operations data reflect our acquisitions of Kepware on January 12, 2016 for $99.4 million in cash, Vuforia on November 3, 2015 for $64.8 million in cash, ColdLight on May 7, 2015 for $98.6 million in cash, Axeda on August 11, 2014 for $165.9 million in cash, ThingWorx on December 30, 2013 for $111.5 million in cash as well as certain other less significant businesses during these periods. Results of operations for the acquired businesses have been included in the Consolidated Statements of Operations since their acquisition dates. |
(2) | Operating income (loss) and net income (loss) in 2016 includes pre-tax restructuring charges of $76.3 million. Operating income and net income in 2015 includes a pre-tax U.S pension settlement loss of $66.3 million, a $28.2 million charge related to a legal accrual and pre-tax restructuring charges of $43.4 million. Operating income and net income in 2014 includes pre-tax restructuring charges of $28.4 million. |
(3) | In 2015, net income includes an $18.7 million tax benefit related to settlement of our U.S pension plan. Net income in 2014 includes tax benefits totaling $18.1 million related to the reversal of a portion of the valuation allowance in the U.S. related to the impact on deferred taxes in accounting for acquisitions and accounting for the U.S. pension plan. |
A-1
QUARTERLY FINANCIAL INFORMATION (UNAUDITED)
(in thousands, except per share data)
September 30, 2018 | June 30, 2018 | March 31, 2018 | December 30, 2017 | ||||||||||||
Revenue | $ | 312,521 | $ | 314,777 | $ | 307,833 | $ | 306,644 | |||||||
Gross margin | 234,472 | 233,221 | 224,252 | 223,686 | |||||||||||
Operating income | 11,697 | 21,703 | 22,366 | 17,472 | |||||||||||
Net income | 13,191 | 16,997 | 7,922 | 13,877 | |||||||||||
Earnings per share: | |||||||||||||||
Basic | $ | 0.11 | $ | 0.15 | $ | 0.07 | $ | 0.12 | |||||||
Diluted | $ | 0.11 | $ | 0.14 | $ | 0.07 | $ | 0.12 | |||||||
September 30, 2017 | July 1, 2017 | April 1, 2017 | December 31, 2016 | ||||||||||||
Revenue | $ | 306,379 | $ | 291,293 | $ | 280,040 | $ | 286,327 | |||||||
Gross margin | 223,574 | 209,025 | 198,210 | 204,212 | |||||||||||
Operating income | 17,569 | 11,256 | 7,513 | 4,561 | |||||||||||
Net income (loss) | 17,435 | (951 | ) | (1,104 | ) | (9,141 | ) | ||||||||
Earnings (loss) per share: | |||||||||||||||
Basic | $ | 0.15 | $ | (0.01 | ) | $ | (0.01 | ) | $ | (0.08 | ) | ||||
Diluted | $ | 0.15 | $ | (0.01 | ) | $ | (0.01 | ) | $ | (0.08 | ) | ||||
A-2