Attached files
| file | filename |
|---|---|
| 8-K - 8-K - ASSOCIATED BANC-CORP | asb06302020form8-kpres.htm |
| EX-99.1 - EXHIBIT 99.1 - ASSOCIATED BANC-CORP | asb06302020ex991.htm |

Exhibit 99.2 SECOND QUARTER 2020 EARNINGS PRESENTATION July 23, 2020

FORWARD-LOOKING STATEMENTS Important note regarding forward-looking statements: Statements made in this presentation which are not purely historical are forward-looking statements, as defined in the Private Securities Litigation Reform Act of 1995. This includes any statements regarding management’s plans, objectives, or goals for future operations, products or services, and forecasts of its revenues, earnings, or other measures of performance. Such forward-looking statements may be identified by the use of words such as “believe,” “expect,” “anticipate,” “plan,” “estimate,” “should,” “will,” “intend,” "target," “outlook” or similar expressions. Forward-looking statements are based on current management expectations and, by their nature, are subject to risks and uncertainties. Actual results may differ materially from those contained in the forward-looking statements. Factors which may cause actual results to differ materially from those contained in such forward-looking statements include those identified in the Company’s most recent Form 10-K and subsequent SEC filings, and such factors are incorporated herein by reference. Trademarks: All trademarks, service marks, and trade names referenced in this material are official trademarks and the property of their respective owners. Presentation: Within the charts and tables presented, certain segments, columns and rows may not sum to totals shown due to rounding. Non-GAAP Measures: This presentation includes certain non-GAAP financial measures. These non-GAAP measures are provided in addition to, and not as substitutes for, measures of our financial performance determined in accordance with GAAP. Our calculation of these non-GAAP measures may not be comparable to similarly titled measures of other companies due to potential differences between companies in the method of calculation. As a result, the use of these non-GAAP measures has limitations and should not be considered superior to, in isolation from, or as a substitute for, related GAAP measures. Reconciliations of these non-GAAP financial measures to the most directly comparable GAAP financial measures can be found at the end of this presentation. 1

SECOND QUARTER 2020 UPDATE Associated remains well prepared to face the challenges ahead Associated Banc-Corp Reports Second Quarter 2020 Earnings of $0.94 Per Common Share Including the Gain on Sale of Associated Benefits and Risk Consulting ▪ We continue to support our ▪ 2Q20 net charge offs of $26 customers with our balance sheet million; year to date NCOs were 36 bps of avg total loans ▪ Total loans increased $467 million ▪ 6% EOP reserve on COVID-19 Supported Sound Credit affected loan portfolio Customers1 ▪ Total deposits increased $890 Position million ▪ 19% EOP reserve on oil and gas ▪ Granted fee waivers and loan ▪ Well reserved with ACLL to loan deferrals ratio of 1.73% (1.80% excl. PPP) EOP 2Q 2020 ▪ Loan-to-deposit ratio of 94% ▪ Share repurchases suspended (90% excluding PPP) EOP 2Q for the year 2020 ▪ Capital measures improved from ▪ Low-cost deposits accounted for the first quarter driven by the sale of Associated Benefits and Risk Substantial 61% of total deposits EOP 2Q Well 2020 Consulting (ABRC) Liquidity Capitalized ▪ Dividend payout ratio of 33.18% Ample liquidity available from ▪ for last 12 months funding sources ▪ Tangible book value per share ▪ Cost of interest bearing deposits increased 11%1 to $16.21 decreased to 25 bps in June 2020 12Q 2020 end of period (EOP) balances compared to 1Q 2020 EOP balances. 2

LOAN TRENDS PPP loans, funding of CRE commitments and unusually high line draws on commercial lines drove increases Average Quarterly Loans Average Loan Growth (1Q20 to 2Q20) ($ in billions) ($ in millions) $25.2 $23.4 $23.3 $22.8 $23.3 PPP $849 Mortgage warehouse $364 $10.0 $8.6 $8.5 $8.2 $8.4 General commercial $287 CRE investor $257 CRE construction $134 $5.1 $5.2 $5.2 $5.3 $5.7 REIT $121 Power & utilities $70 $(30) Oil & gas $8.4 $8.3 $8.2 $8.4 $8.3 $(37) Home equity & other consumer $(133) $1.2 $1.3 $1.2 $1.2 $1.2 Residential mortgage 2Q 2019 3Q 2019 4Q 2019 1Q 2020 2Q 2020 Commercial & business Commercial real estate Residential mortgage Home equity & other consumer lending 3

END OF PERIOD LOAN TRENDS $1 billion of PPP loans offset by repayment of commercial lines EOP Loan Change1 1Q20 to 2Q20 ($ in millions) Total loans +$467 million (+2%) . Commercial and Business Lending +$436 million (+5%) PPP $1,012 – PPP loans were the main driver for growth CRE construction $163 – General commercial balances declined as customers paid down lines drawn during March CRE investor $136 ▪ Commercial Real Estate Lending +$299 million (+5%) Mortgage warehouse $112 – Pipeline of commitments continues to fund as balances have grown each quarter since 3Q Power & utilities $15 2019 Oil & gas ▪ Total Consumer -$269 million (-3%) $(35) – The decline in residential mortgages is largely $(70) Home equity & other driven by loan refinances consumer – Home equity and consumer continued a $(108) REIT downward trend $(199) Residential mortgage $(559) General commercial 1 Excludes loans held for sale. 4

LOAN PORTFOLIO OVERVIEW We continue to monitor our COVID affected loan portfolios ($ in millions as of 6/30/2020) Key COVID June 30, Coml. Loan % of Total Deferred % of Total Nonaccrual % of Total 2020 Exposures Loans Loans Loans Loans Loans PPP Loans$ 1,012 $ - - $ - - $ - - Commercial and industrial 7,969 926 3.7% 45 0.2% 80 0.3% CRE - owner occupied 914 129 0.5% 138 0.6% 2 0.0% Commercial and business lending 9,895 1,055 4.2% 184 0.7% 82 0.3% CRE - investor 4,174 995 4.0% 606 2.4% 11 0.0% CRE - construction 1,708 144 0.6% 32 0.1% 1 0.0% Commercial real estate lending 5,882 1,138 4.6% 638 2.6% 12 0.0% Total commercial 15,777 2,193 8.8% 822 3.3% 94 0.4% Residential mortgage 7,934 - 0.0% 692 2.8% 67 0.3% Home equity 796 - 0.0% 31 0.1% 11 0.0% Other consumer 326 - 0.0% 2 0.0% 0 0.0% Total consumer 9,055 - 0.0% 725 2.9% 78 0.3% Total Loans$ 24,833 $ 2,193 8.8%$ 1,547 6.2%$ 172 0.7% . 35% of borrowers included in Key COVID Commercial Loan Exposures1 received a loan modification . 19% of borrowers included in Key COVID Commercial Loan Exposures1 received a PPP loan . 4% of borrowers included in Key COVID Commercial Loan Exposures1 received both . Less than 70 bps of loans are in non-accrual 1 Excluding Oil & Gas customers which have not received loan deferrals. 5

KEY COVID COMMERCIAL LOAN EXPOSURES1 Key COVID commercial loan exposures are spread across multiple industries without large concentrations ($ in millions) % of total C&BL Utilization CRE Utilization Total loans Retailers/Shopping Centers2 Retailers$ 97.9 45%$ 664.1 89%$ 762.0 3.07% Retail REITs 251.9 56% 146.7 100% 398.6 1.86% Subtotal 349.8 52% 810.8 90% 1,160.6 4.64% Oil & Gas Oil & Gas 431.7 71% - 0% 431.7 1.74% Subtotal 431.7 71% - 0% 431.7 1.74% Hotels, Amusement & Related Hotels 0.2 23% 224.4 77% 224.6 0.90% Parking Lots and Garages 22.6 61% 69.5 87% 92.1 0.37% Casinos 29.3 100% - 0% 29.3 0.12% Recreation & Entertainment 26.3 41% 6.9 99% 33.3 0.13% Movie Theaters 23.6 70% - 0% 23.6 0.10% Subtotal 102.0 62% 300.9 79% 402.9 1.62% Restaurants Full-Service 72.4 82% 12.9 100% 85.2 0.34% Limited-Service & Other 21.0 92% 13.8 97% 34.8 0.14% Subtotal 93.4 84% 26.7 98% 120.0 0.48% Transportation & Other Transportation Services 52.2 80% - 0% 52.2 0.21% Fracking Sand Mining 25.8 75% - 0% 25.8 0.10% Subtotal 78.1 78% - 0% 78.1 0.31% Total$ 1,054.9 64%$ 1,138.3 87%$ 2,193.3 8.83% 1 As of 6/30/2020. 2 C&BL excludes grocers, convenience stores, vehicle dealers, auto parts and tire dealers, direct and mail order retailers, and building material dealers; CRE excludes properties primarily anchored by grocers, self-storage facilities, and vehicle dealers. 6
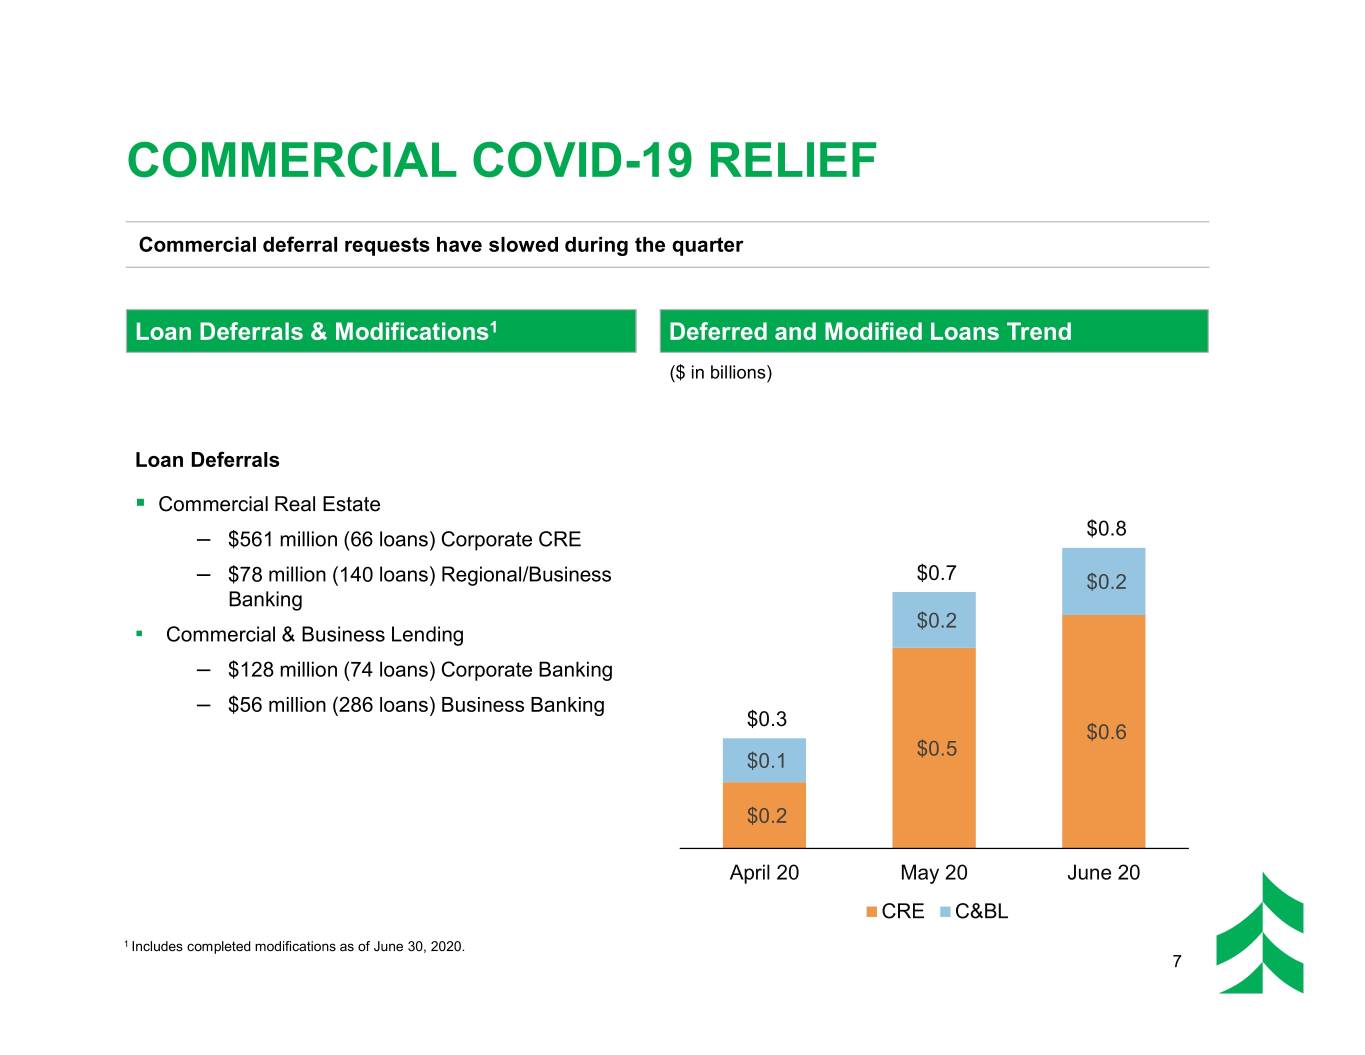
COMMERCIAL COVID-19 RELIEF Commercial deferral requests have slowed during the quarter Loan Deferrals & Modifications1 Deferred and Modified Loans Trend ($ in billions) Loan Deferrals . Commercial Real Estate $0.8 – $561 million (66 loans) Corporate CRE – $78 million (140 loans) Regional/Business $0.7 $0.2 Banking $0.2 ▪ Commercial & Business Lending – $128 million (74 loans) Corporate Banking – $56 million (286 loans) Business Banking $0.3 $0.6 $0.5 $0.1 $0.2 April 20 May 20 June 20 CRE C&BL 1 Includes completed modifications as of June 30, 2020. 7
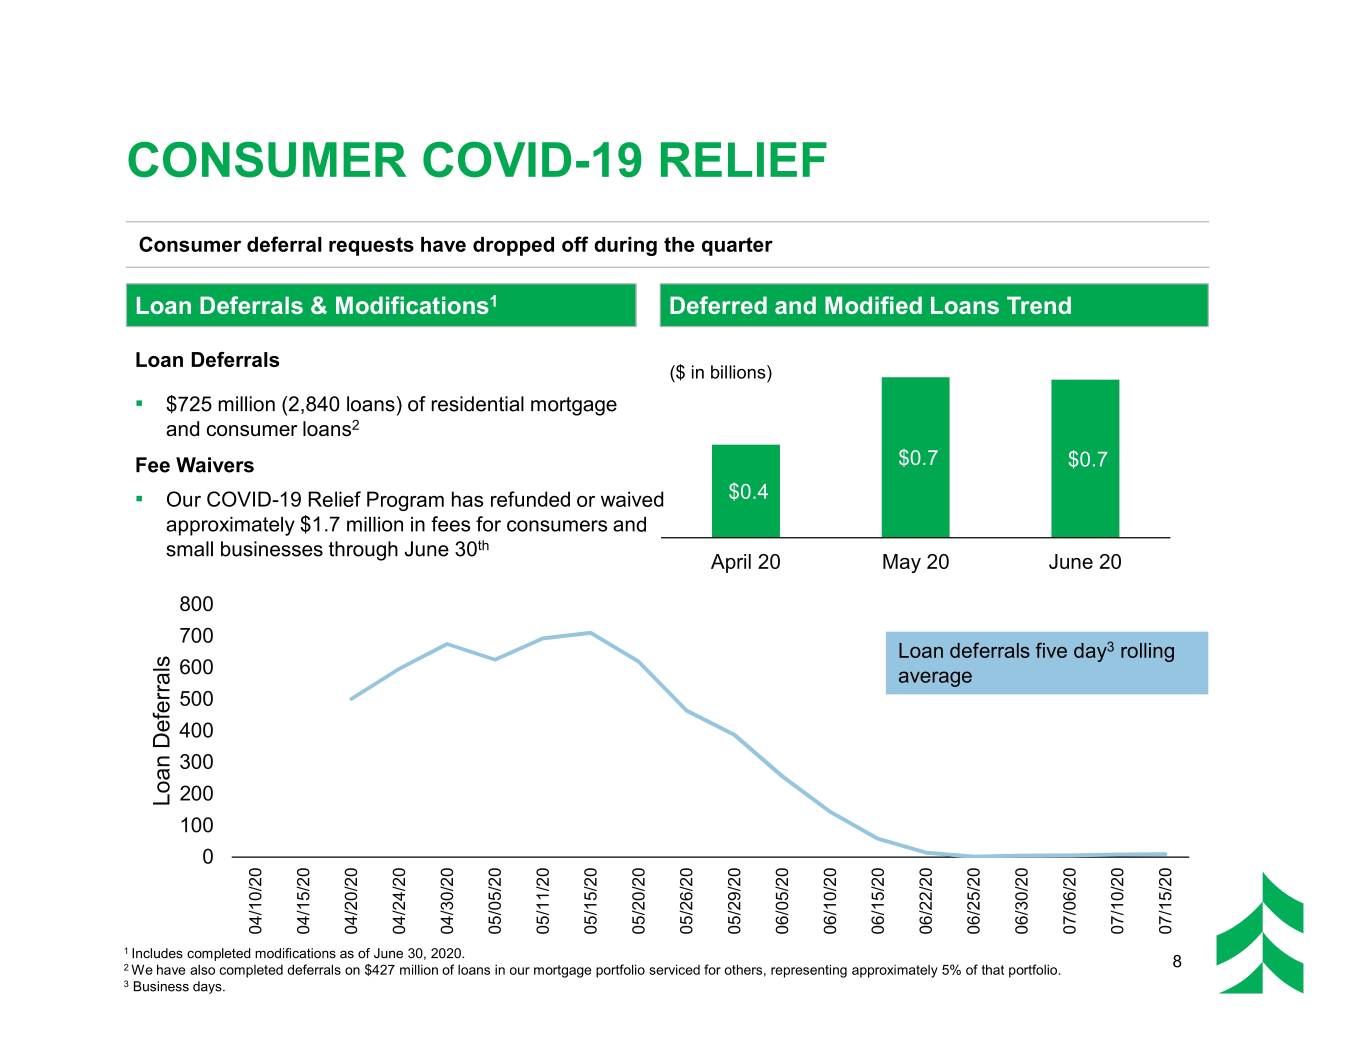
CONSUMER COVID-19 RELIEF Consumer deferral requests have dropped off during the quarter Loan Deferrals & Modifications1 Deferred and Modified Loans Trend Loan Deferrals ($ in billions) ▪ $725 million (2,840 loans) of residential mortgage and consumer loans2 Fee Waivers $0.7 $0.7 ▪ Our COVID-19 Relief Program has refunded or waived $0.4 approximately $1.7 million in fees for consumers and small businesses through June 30th April 20 May 20 June 20 800 700 Loan deferrals five day3 rolling 600 average 500 400 300 200 Loan DeferralsLoan 100 0 04/10/20 04/15/20 04/20/20 04/24/20 04/30/20 05/05/20 05/11/20 05/15/20 05/20/20 05/26/20 05/29/20 06/05/20 06/10/20 06/15/20 06/22/20 06/25/20 06/30/20 07/06/20 07/10/20 07/15/20 1 Includes completed modifications as of June 30, 2020. 2 We have also completed deferrals on $427 million of loans in our mortgage portfolio serviced for others, representing approximately 5% of that portfolio. 8 3 Business days.
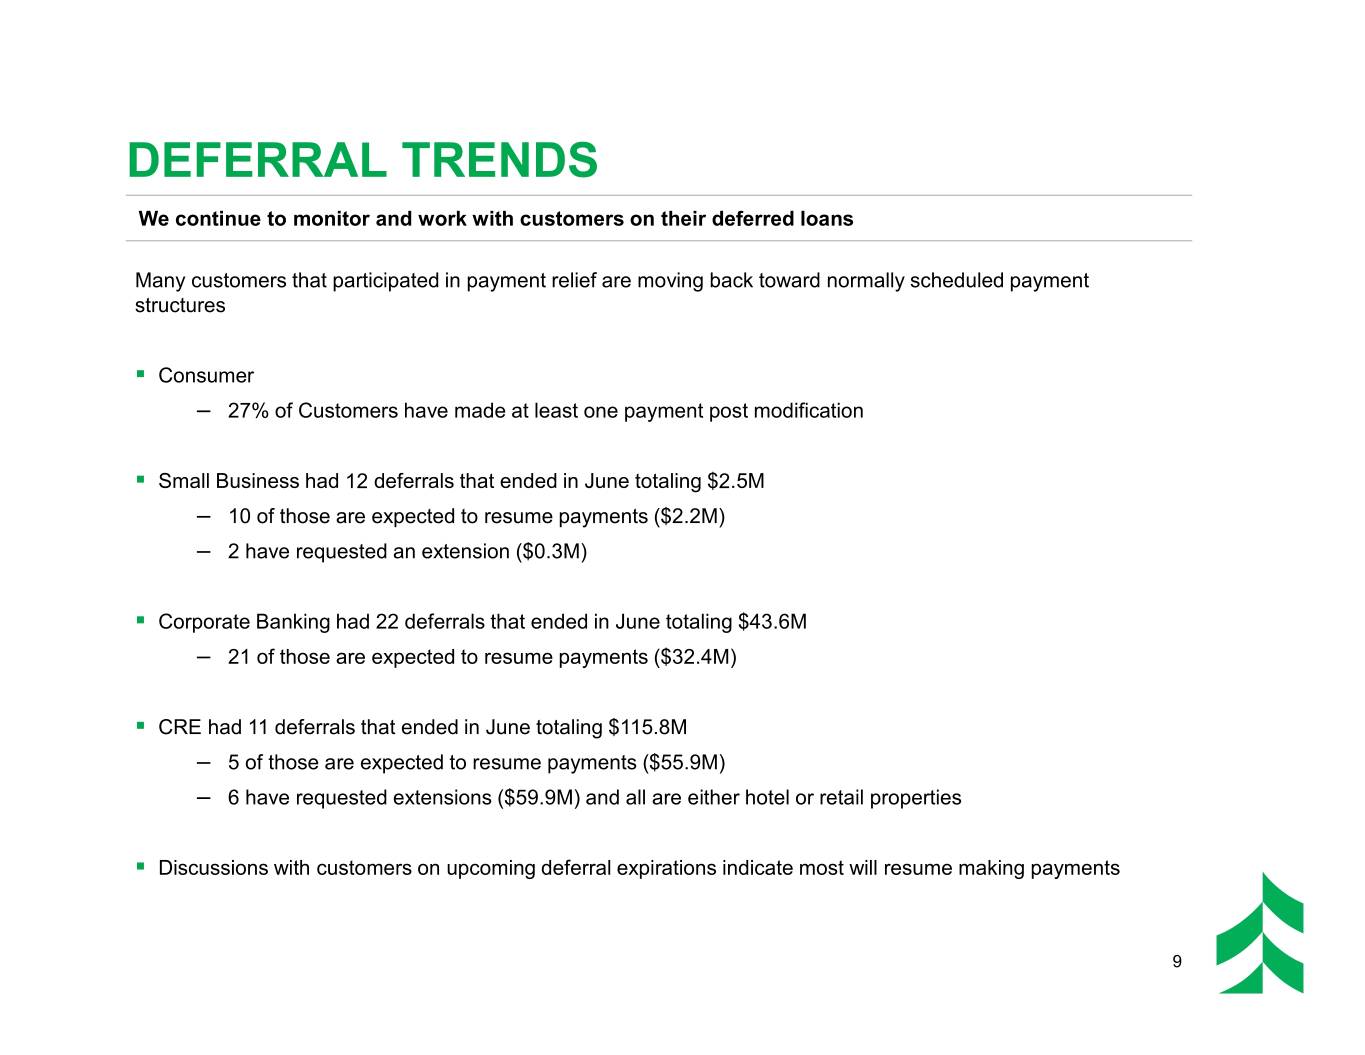
DEFERRAL TRENDS We continue to monitor and work with customers on their deferred loans Many customers that participated in payment relief are moving back toward normally scheduled payment structures . Consumer – 27% of Customers have made at least one payment post modification . Small Business had 12 deferrals that ended in June totaling $2.5M – 10 of those are expected to resume payments ($2.2M) – 2 have requested an extension ($0.3M) . Corporate Banking had 22 deferrals that ended in June totaling $43.6M – 21 of those are expected to resume payments ($32.4M) . CRE had 11 deferrals that ended in June totaling $115.8M – 5 of those are expected to resume payments ($55.9M) – 6 have requested extensions ($59.9M) and all are either hotel or retail properties . Discussions with customers on upcoming deferral expirations indicate most will resume making payments 9

ALLOWANCE UPDATE Second quarter ACLL2 covered 1.73% of total loans, an increase of 11 bps from the first quarter Second Quarter ACLL Loan Allowance Walkforward ($ in millions) ▪ Allowance for credit losses on loans (ACLL) increased $35 million, or 9%, at the end of 2Q 2020 from 1Q 2020 ▪ Assumptions based on Moody's Baseline scenarios As of 6/30/2020 ACLL2 ACLL2 / Loans Key COVID Coml. Exp.$ 136 6.21% Non-COVID Portfolio$ 293 1.35% ($ in millions) Day 1 Net 1Q Net 2Q 6/30/20 ACLL1 CECL Reserve ACLL2 Reserve ACLL2 ACLL2 / Loan Category 12/31/19 Adoption2 Build2 3/31/20 Build2 06/30/2020 Loans C&BL - excl. Oil & Gas$ 100,594 $ (8,390) $ 29,571 $ 121,775 $ 326 $ 122,101 1.44% C&BL Oil & Gas 13,226 55,460 8,880 77,567 6,025 83,592 19.36% PPP Loans - - - - 808 808 0.08% CRE - Investor 41,044 2,287 (785) 42,546 16,524 59,070 1.42% CRE - Construction 32,447 25,814 7,428 65,688 10,585 76,273 4.47% Residential Mortgage 16,960 33,215 (6,227) 43,947 (121) 43,826 0.55% Other Consumer 19,008 22,760 777 42,546 363 42,909 3.83% Total$ 223,278 $ 131,147 $ 39,643 $ 394,069 $ 34,510 $ 428,579 1.73% Total (excluding PPP Loans)$ 223,278 $ 131,147 $ 39,643 $ 394,069 $ 33,702 $ 427,770 1.80% ($ in thousands) 1 Includes ALLL and the allowance for unfunded commitments. 10 2 Includes funded and unfunded reserve for loans, excludes reserve for HTM securities.

CREDIT QUALITY – QUARTERLY TRENDS Reserve builds on key commercial exposures and oil and gas while credit metrics remain fairly stable Potential Problem Loans1 Nonaccrual Loans1 ($ in millions) ($ in millions) $307 $167 $172 $234 $63 $137 $129 $118 $50 $166 $161 $67 $63 $29 $4 $133 $36 $23 $32 $43 $244 $161 $167 $104 $93 $95 $109 $121 $101 $118 2Q 2019 3Q 2019 4Q 2019 1Q 2020 2Q 2020 2Q 2019 3Q 2019 4Q 2019 1Q 2020 2Q 2020 Oil and gas All other loans Oil and gas All other loans Net Charge Offs1 ACLL2 to Total Loans / Oil and Gas Loans1 ($ in millions) 19.36% 16.63% $26 $20 $17 $13 $14 $9 $25 3.87% 3.83% $10 $21 $10 2.69% 1.62% 1.73% $8 1.10% 1.04% 0.98% $4 $4 $2 2Q 2019 3Q 20193 4Q 2019 1Q 2020 2Q 2020 2Q 2019 3Q 2019 4Q 2019 1Q 2020 2Q 2020 Oil and gas All other loans Oil and gas ACLL / Oil and gas Loans ACLL / loans 1 At period end. 11 2 ACLL figure does not include ~$61,000 for HTM securities in 2Q20. 3 3Q 2019 included a net recovery of $1 million for all other loans.

DEPOSIT PORTFOLIO TRENDS Low-cost deposits continue to grow while reducing high-cost non-core funding Average Quarterly Deposits EOP Funding Change 1Q20 to 2Q20 ($ in billions) ($ in millions) $1,467 $26.1 Noninterest-bearing demand $25.1 $25.2 $24.1 $24.3 Savings $362 $5.1 $5.3 $6.9 Money Market $114 $5.5 $5.5 $(235) Network transaction deposits $(384) Time deposits $5.0 $5.5 $5.4 $5.1 $5.3 $(433) Interest-bearing demand $2.3 $2.6 $2.7 $2.9 $3.3 EOP Low-cost Deposit Mix Trend $7.1 61% $6.9 55% 56% 58% $6.6 $6.5 $6.5 52% 24% 29% 21% 23% 23% $3.5 $3.1 $2.7 $2.6 $2.5 21% 21% 21% 23% 20% $2.0 $1.8 $1.4 $1.4 $1.5 10% 11% 12% 12% 13% 2Q 2019 3Q 2019 4Q 2019 1Q 2020 2Q 2020 2Q 2019 3Q 2019 4Q 2019 1Q 2020 2Q 2020 Noninterest-bearing demand Savings Time deposits Interest-bearing demand Money market Network transaction deposits 12

NET INTEREST INCOME AND YIELD TRENDS Fed Funds rate cuts and increased liquidity have pressured year to date NIM down to 2.66% Net Interest Income and Net Interest Margin Average Yields ($ in millions) 4.41% 4.42% 2.88% 4.20% 2.81% 2.83% 2.84% 3.65% 4.05% 3.87% 3.65% 3.14% 2.49% 2.99% 3.07% 3.38% 3.37% 3.24% $214 3.04% 3.01% 2.94% $206 $203 $200 2.76% $190 2.52% 1.17% 1.18% 0.86% 0.61% 0.60% 0.57% 0.90% 0.91% 0.57% 0.30% 0.28% 0.25% 2Q 2019 3Q 2019 4Q 2019 1Q 2020 2Q 2020 Jan 20 Feb 20 Mar 20 Apr 20 May 20 Jun 20 Total interest-bearing Net interest income Net interest margin Commercial real estate loans liabilities Commercial and business Total interest- lending loans bearing deposits Total residential mortgage loans 13

NONINTEREST INCOME TRENDS Mortgage banking grew during the second quarter despite partially offsetting MSR impairment Noninterest Income Trend Gross Mortgage Banking Income ($ in millions) ($ in millions) $20 $15 $(8) $254 $11 $9 $101 $7 $(9) $96 $98 $93 $9 $11 $12 $7 $6 2Q 2019 3Q 2019 4Q 2019 1Q 2020 2Q 2020 $36 $41 $40 $35 $42 Mortgage banking, net MSR Impairment Capital Markets, Net ($ in millions) $15 $17 $16 $15 $11 $8 $8 $7 $21 $21 $22 $21 $21 $5 $4 $23 $21 $20 $23 $22 2Q 2019 3Q 2019 4Q 2019 1Q 2020 2Q 2020 2Q 2019 3Q 2019 4Q 2019 1Q 2020 2Q 2020 Insurance commissions Service charges and deposit Wealth management account fees Asset gains (losses), net Other 14

ASSET GAINS AND LOSSES Asset Gains of $157 million including the sale of ABRC Asset Gains (Losses) Walkforward ABRC Transaction Terms ($ in millions) Buyer $266 million¹ Purchase — 3x multiple of LTM revenue² Price — 18x multiple of LTM net income² Consideration 100% cash $163 million (net of transaction Net Gain expenses) Closing Closed 6/30/2020 1 Paid at closing and subject to customary adjustments. 15 2 Reflects pro forma revenue and net income of transferred entity as of LTM ended 3/31/2020.

CUSTOMER ACTIVITY UPDATE Customer activity is showing positive trends Debit and Credit Card Monthly Branch Activity1 Active Mobile Users3 Purchases2 Branch activity has ticked Customers are beginning to Active mobile users have back up but shifted to drive- use their cards again resulting increased 15% since January through; ~30% of transactions in debit and credit card are occurring in the lobby transactions increasing 23% in during June compared to June from April ~65% pre-COVID $510 $495 $456 $443 $432 $413 274 901 266 855 818 797 253 735 245 247 666 238 Jan Feb Mar Apr May Jun Jan Feb Mar Apr May Jun Jan Feb Mar Apr May Jun 2020 2020 2020 2020 2020 2020 2020 2020 2020 2020 2020 2020 2020 2020 2020 2020 2020 2020 DR Card CR Card 1 Monthly branch transactions displayed in thousands. 2 Debit and credit card spend displayed in millions. 16 3 Active mobile users represented as a 90 day average, displayed in thousands.

EXPENSE TRENDS Expense discipline remains a focus as the second quarter continues downward trend Noninterest Expense Business Development and Advertising ($ in millions) ($ in millions) $201 $204 $198 $8 $2 $192 $8 $4 $1 $183 $7 $2 $6 $1 $4 $71 $76 $82 $76 $72 2Q 2019 3Q 2019 4Q 2019 1Q 2020 2Q 2020 $1 $4 $2 Noninterest Expense2 / Average Assets 2.51% 2.37% 2.40% 2.37% $122 $123 $117 $114 $109 2.12% 2.31% 2.39% 2.45% 2.35% 2.09% 2Q 2019 3Q 2019 4Q 2019 1Q 2020 2Q 2020 2Q 2019 3Q 2019 4Q 2019 1Q 2020 2Q 2020 Adjusted personnel expense1 Other Adjusted noninterest Noninterest expense / Severance / Frontline Pay Acquisition related costs expense3 / average assets average assets 1 A non-GAAP financial measure, adjusted personnel expense excludes restructuring related costs and frontline pay. Please refer to the appendix for a reconciliation of personnel expense to adjusted personnel expense. 2 Annualized 17 3 A non-GAAP financial measure, adjusted noninterest expense excludes acquisition and restructuring related costs. Please refer to the appendix for a reconciliation of noninterest expense to adjusted noninterest expense.

STRONG CAPITAL POSITION Capital ratios improved during the second quarter bolstered by the sale of ABRC Highlights Capital Ratio Walkdowns ▪ Expect CET1 ratio to grow over balance of 2020 ▪ Regulatory capital ratios not expected to be impacted by PPP ▪ ABRC sale improved the TCE ratio2 by 27 bps Common Equity Tier 1 Ratio1 Regulatory Capital Ratios 13.84% 12.56% 11.62% 10.25% 10.35% 9.36% Tangible Common Equity Ratio2 Common Equity Tier 1 Tier 1 Capital Total Capital Capital 1Q 2020 2Q 2020 1 CET1 CECL adoption impact includes modified transition amount. 2 Tangible common equity / tangible assets. This is a non-GAAP financial measure. See Appendix for a reconciliation of non-GAAP financial measures to 18 GAAP financial measures.

2020 UPDATED OUTLOOK We are refining our guidance for the remainder of 2020 ▪ Expect loan to deposit ratio to be ▪ We expect a quarterly expense approximately 90%, excluding run rate of approximately $175M PPP for the rest of the year due to the $15M quarterly reduction of ▪ Target investments / total assets expenses from the sale of ABRC ratio of 15%, excluding PPP Balance Sheet Expense ▪ Full-year effective tax rate ▪ We expect PPP loans to pay expected to be 18% or less Management down mostly in Q4 and early Management 2021 ▪ Full year margin of 2.55% to 2.60% ▪ Mortgage banking expected to ▪ Expect capital to build over the remain elevated in Q3 balance of the year ▪ Service charges returning to ▪ Share repurchase program will normal levels over the second Capital & remain suspended until economic Fee half of the year Credit conditions improve and stabilize Businesses ▪ No insurance revenue in the Management Based on our current second half of the year due to ▪ assumptions, we expect loan loss sale of ABRC provision to be less in the second half of the year than the first half 19

APPENDIX

TOTAL LOANS OUTSTANDING BALANCES AS OF JUNE 30, 2020 Well diversified $24.8 billion loan portfolio ($ in millions) % of Total % of Total 06/30/20201 Loans 06/30/20201 Loans C&BL (by NAICS2) CRE (by property type code) Wholesale/Manufacturing$ 1,907 7.7% Multi-Family$ 1,841 7.4% Utilities 1,603 6.5% Office/Mixed 1,256 5.1% Finance and Insurance 1,387 5.6% Retail 981 4.0% Real Estate (includes REITs) 1,296 5.2% Industrial 934 3.8% Mining3 499 2.0% Single Family Construction 388 1.6% Construction 437 1.8% Hotel/Motel 224 0.9% Health Care and Social Assistance4 412 1.7% Land 107 0.4% Retail Trade 392 1.6% Farm Land 17 0.1% Professional, Scientific, and Tech. Serv. 342 1.4% Mobile Home Parks 16 0.1% Rental and Leasing Services 255 1.0% Other 118 0.5% Transportation and Warehousing 216 0.9% Total CRE$ 5,882 23.7% Waste Management 198 0.8% Accommodation and Food Services 176 0.7% Consumer Information 145 0.6% Residential Mortgage$ 7,934 31.9% Financial Investments & Related Activities 101 0.4% Home Equity 796 3.2% Management of Companies & Enterprises 86 0.3% Student Loans 124 0.5% Arts, Entertainment, and Recreation 72 0.3% Credit Cards 106 0.4% Educational Services 58 0.2% Other Consumer 96 0.4% Public Administration 28 0.1% Total Consumer$ 9,055 36.5% Agriculture, Forestry, Fishing and Hunting 8 0.0% Other 278 1.1% Total C&BL$ 9,895 39.8% Total Loans$ 24,833 100.0% 1 All values as of period end. 2 North American Industry Classification System. 3 Includes $432 million of oil and gas loans and one $26 million fracking sand mining company loan. 4 Includes $48 million of assisted living and continued care retirement communities. 21

LOAN STRATIFICATION OUTSTANDINGS AS OF JUNE 30, 2020 C&BL by Geography Total Loans1 CRE by Geography $9.9 billion $5.9 billion Minnesota 8% Illinois Illinois Minnesota Illinois 17% 10% 16% 25% 3 Minnesota Wisconsin Texas Other 10% 2 25% 8% Midwest Wisconsin Wisconsin 23% Other 29% Other 2 25% Midwest Midwest 2 10% 13% Other Texas Other Other 33% 8% 18% 16% Texas 5% C&BL by Industry Oil and Gas Lending4 CRE by Property Type $9.9 billion $432 million $5.9 billion Power & Utilities South Texas 16% & Eagle Retail Ford 17% 14% East Texas North Office / Mixed Manufacturing & Real Estate 13% Louisiana Use Wholesale Trade Arkansas Permian 21% 19% 16% Oil & Gas 29% Multi-Family 5% 31% Rockies Finance & 10% Industrial Insurance Marcellus 16% 14% Bakken Utica 2% Appalachia 11% Gulf Shallow Other 1-4 Family 2% 6% Construction Other Mid- 1 Hotel / Motel 5% Excludes $326 million Other consumer portfolio. (Onshore Continent 2 (primarily 4% Other Midwest includes Missouri, Indiana, Ohio, Michigan and Iowa. Lower 48) 22 3Principally reflects the oil and gas portfolio. 9% OK & KS) 4Chart based on commitments of $609 million. 7%

RECONCILIATION AND DEFINITIONS OF NON-GAAP ITEMS ($ IN MILLIONS) Adjusted Noninterest Expense Reconcilation1 2Q19 3Q19 4Q19 1Q20 2Q20 Noninterest expense $198 $201 $204 $192 $183 Acquisition related costs 4 2 1 2 1 Severance / Frontline pay 1 0 4 0 2 Adjusted noninterest expense $193 $199 $199 $190 $181 Adjusted Personnel Expense Reconcilation1 2Q19 3Q19 4Q19 1Q20 2Q20 Personnel expense $123 $123 $121 $114 $111 Severance / Frontline pay 1 0 4 0 2 Adjusted personnel expense $122 $123 $117 $114 $109 Tangible Common Equity and Tangible Assets Reconciliation2 1Q20 2Q20 Common equity $3,534 $3,671 Goodwill and other intangible assets, net (1,284) (1,181) Tangible common equity $2,250 $2,490 Total assets $33,908 $35,501 Goodwill and other intangible assets, net (1,284) (1,181) Tangible assets $32,624 $34,321 1 This is a non-GAAP financial measure. Management believes these measures are meaningful because they reflect adjustments commonly made by management, investors, regulators, and analysts to evaluate the adequacy of earnings per common share, provide greater understanding of ongoing operations and enhance comparability of results with prior periods. 2 The ratio tangible common equity to tangible assets excludes goodwill and other intangible assets, net. This financial measure has been included as it is 23 considered to be a critical metric with which to analyze and evaluate financial condition and capital strength.
