Attached files
| file | filename |
|---|---|
| EX-99.2 - EXHIBIT 99.2 - CION Investment Corp | tm2021158d1_ex99-2.htm |
| 8-K - FORM 8-K - CION Investment Corp | tm2021158d1_8k.htm |
Exhibit 99.1
FUND OVERVIEW
CION Investment Corporation (CIC) is a non-traded business development company, or BDC, that focuses on middle market loans. CIC seeks to generate current income, and to a lesser extent, capital appreciation.
TARGET INVESTMENTS
CIC offers investors the opportunity to invest primarily in:
• Senior secured debt
• Private and thinly-traded U.S. middle market companies
FUND FACT SHEET | Q1 2020
As of March 31, 2020
HISTORICAL TOTAL INVESTMENT RETURN-NET ASSET VALUE
2020 YTD SINCE INCEPTION (Cumulative)
-11.25% 45.13% 30.62%
WITHOUT SALES CHARGE WITH SALES CHARGE
Total investment return-net asset value is a measure of the change in total value for shareholders who held CIC’s common stock at the beginning and end of the period, including distributions paid or payable during the period. Total investment return-net asset value is presented on a “net” basis and reflects management and incentive fees, offering, organizational and other costs, interest expense on borrowed funds and other related expenses that are borne by investors.
Total investment return-net asset value is based on (i) the beginning period net asset value per share on the first day of the period, (ii) the net asset value per share on the last day of the period of
(A) one share plus (B) any fractional shares issued in connection with the reinvestment of monthly distributions, and (iii) the value of distributions payable, if any, on the last day of the period. The total investment return-net asset value calculation assumes that monthly cash distributions are reinvested in accordance with CIC’s distribution reinvestment plan then in effect. The total investment return-net asset value does not consider the effect of the sales charge from the sale of CIC’s common stock. The total investment return-net asset value includes the effect of the issuance of shares at a net offering price that is greater than net asset value per share, which causes an increase in net asset value per share. Total returns covering less than a full year are not annualized.
PORTFOLIO CHARACTERISTICS
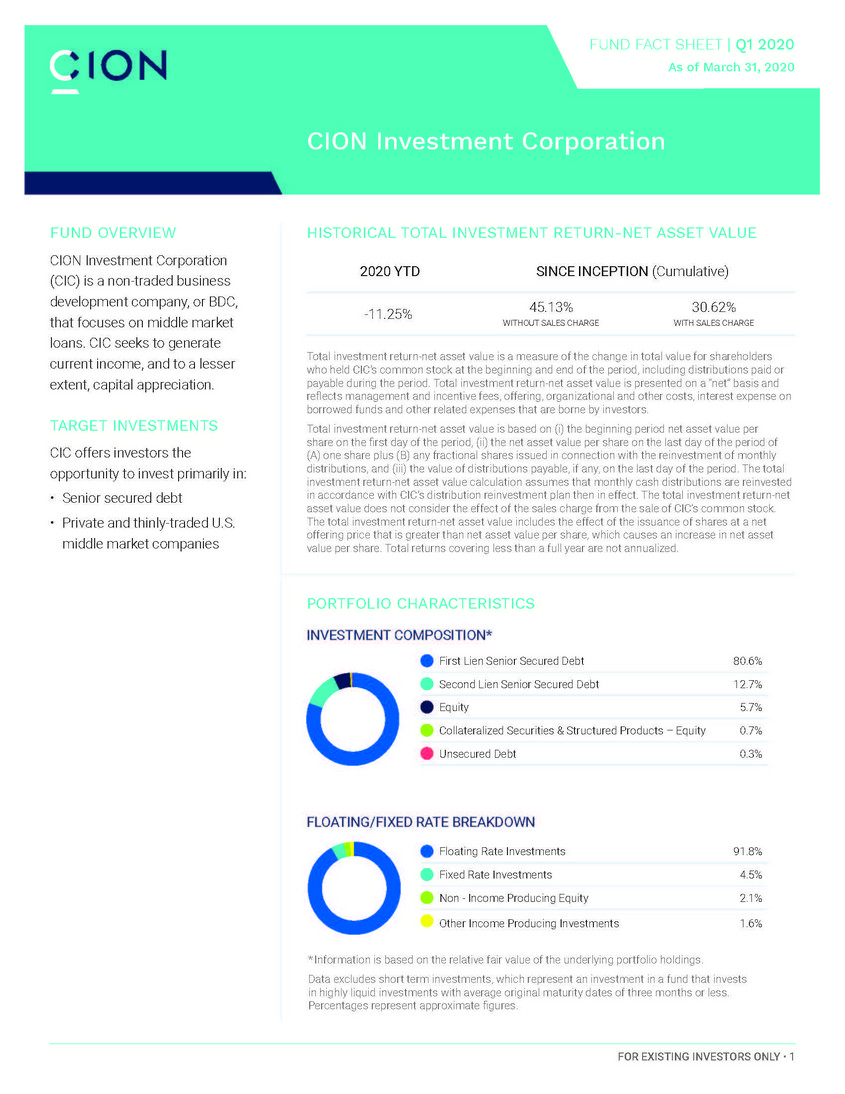
INVESTMENT COMPOSITION*
First Lien Senior Secured Debt 80.6%
Second Lien Senior Secured Debt 12.7%
Equity 5.7%
Collateralized Securities & Structured Products – Equity 0.7%
Unsecured Debt 0.3%
FLOATING/FIXED RATE BREAKDOWN
Floating Rate Investments 91.8%
Fixed Rate Investments 4.5%
Non - Income Producing Equity 2.1%
Other Income Producing Investments 1.6%
* Information is based on the relative fair value of the underlying portfolio holdings.
Data excludes short term investments, which represent an investment in a fund that invests in highly liquid investments with average original maturity dates of three months or less.
Percentages represent approximate figures.
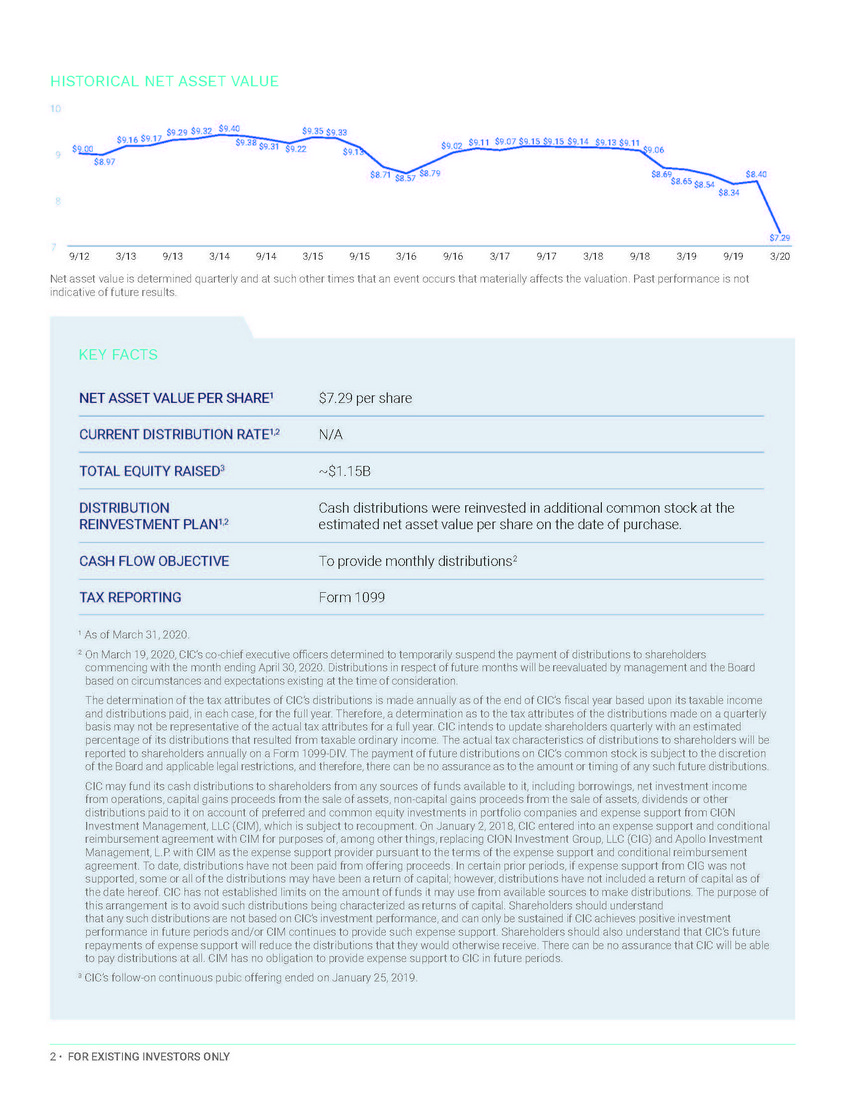
HISTORICAL NET ASSET VALUE
10
$9.16 $9.17 $9.29 $9.32 $9.40 $9.35 $9.33 $9.11 $9.07 $9.15 $9.15 $9.14 $9.13
9 $9.00 $9.38 $9.31 $9.22 $9.13 $9.02 $9.11 $9.06
$8.97
$8.71 $8.57 $8.79 $8.69$8.65 $8.54 $8.34 $8.40
8
7 $7.29
9/12 3/13 9/13 3/14 9/14 3/15 9/15 3/16 9/16 3/17 9/17 3/18 9/18 3/19 9/19 3/20
Net asset value is determined quarterly and at such other times that an event occurs that materially affects the valuation. Past performance is not indicative of future results.
KEY FACTS
NET ASSET VALUE PER SHARE1 $7.29 per share
CURRENT DISTRIBUTION RATE1,2 N/A
TOTAL EQUITY RAISED3 ~$1.15B
DISTRIBUTION Cash distributions were reinvested in additional common stock at the
REINVESTMENT PLAN1,2 estimated net asset value per share on the date of purchase.
CASH FLOW OBJECTIVE To provide monthly distributions2
TAX REPORTING Form 1099
1 As of March 31, 2020.
2 On March 19, 2020, CIC’s co-chief executive officers determined to temporarily suspend the payment of distributions to shareholders commencing with the month ending April 30, 2020. Distributions in respect of future months will be reevaluated by management and the Board based on circumstances and expectations existing at the time of consideration.
The determination of the tax attributes of CIC’s distributions is made annually as of the end of CIC’s fiscal year based upon its taxable income and distributions paid, in each case, for the full year. Therefore, a determination as to the tax attributes of the distributions made on a quarterly basis may not be representative of the actual tax attributes for a full year. CIC intends to update shareholders quarterly with an estimated percentage of its distributions that resulted from taxable ordinary income. The actual tax characteristics of distributions to shareholders will be reported to shareholders annually on a Form 1099-DIV. The payment of future distributions on CIC’s common stock is subject to the discretion of the Board and applicable legal restrictions, and therefore, there can be no assurance as to the amount or timing of any such future distributions.
CIC may fund its cash distributions to shareholders from any sources of funds available to it, including borrowings, net investment income from operations, capital gains proceeds from the sale of assets, non-capital gains proceeds from the sale of assets, dividends or other distributions paid to it on account of preferred and common equity investments in portfolio companies and expense support from CION Investment Management, LLC (CIM), which is subject to recoupment. On January 2, 2018, CIC entered into an expense support and conditional reimbursement agreement with CIM for purposes of, among other things, replacing CION Investment Group, LLC (CIG) and Apollo Investment
Management, L.P. with CIM as the expense support provider pursuant to the terms of the expense support and conditional reimbursement agreement. To date, distributions have not been paid from offering proceeds. In certain prior periods, if expense support from CIG was not supported, some or all of the distributions may have been a return of capital; however, distributions have not included a return of capital as of the date hereof. CIC has not established limits on the amount of funds it may use from available sources to make distributions. The purpose of this arrangement is to avoid such distributions being characterized as returns of capital. Shareholders should understand
that any such distributions are not based on CIC’s investment performance, and can only be sustained if CIC achieves positive investment performance in future periods and/or CIM continues to provide such expense support. Shareholders should also understand that CIC’s future repayments of expense support will reduce the distributions that they would otherwise receive. There can be no assurance that CIC will be able to pay distributions at all. CIM has no obligation to provide expense support to CIC in future periods.
3 CIC’s follow-on continuous pubic offering ended on January 25, 2019.
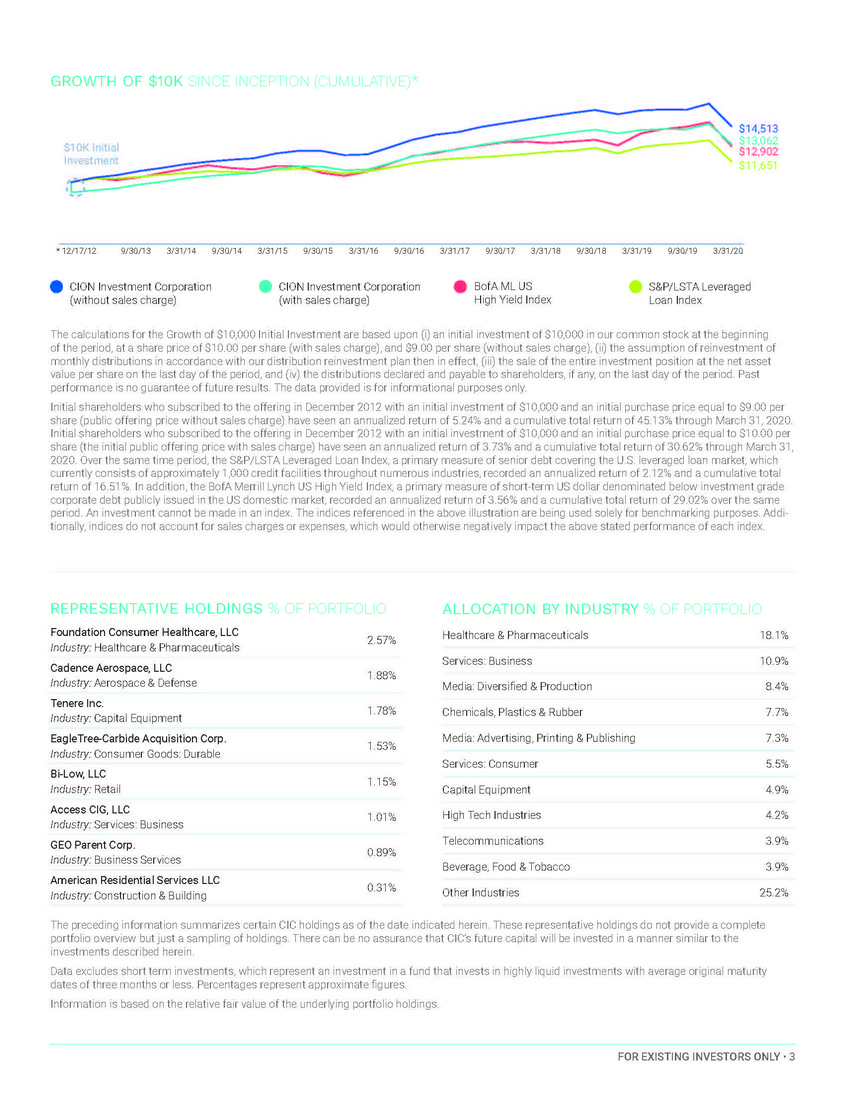
GROWTH OF $10K SINCE INCEPTION (CUMULATIVE)*
$14,513
$10K Initial $13,062
$12,902
Investment
$11,651
* 12/17/12 9/30/133/31/149/30/14 3/31/159/30/153/31/169/30/16 3/31/179/30/173/31/18 9/30/183/31/199/30/193/31/20
CION Investment Corporation CION Investment Corporation BofA ML US S&P/LSTA Leveraged
(without sales charge) (with sales charge) High Yield Index Loan Index
The calculations for the Growth of $10,000 Initial Investment are based upon (i) an initial investment of $10,000 in our common stock at the beginning of the period, at a share price of $10.00 per share (with sales charge), and $9.00 per share (without sales charge), (ii) the assumption of reinvestment of monthly distributions in accordance with our distribution reinvestment plan then in effect, (iii) the sale of the entire investment position at the net asset value per share on the last day of the period, and (iv) the distributions declared and payable to shareholders, if any, on the last day of the period. Past performance is no guarantee of future results. The data provided is for informational purposes only.
Initial shareholders who subscribed to the offering in December 2012 with an initial investment of $10,000 and an initial purchase price equal to $9.00 per share (public offering price without sales charge) have seen an annualized return of 5.24% and a cumulative total return of 45.13% through March 31, 2020.
Initial shareholders who subscribed to the offering in December 2012 with an initial investment of $10,000 and an initial purchase price equal to $10.00 per share (the initial public offering price with sales charge) have seen an annualized return of 3.73% and a cumulative total return of 30.62% through March 31, 2020. Over the same time period, the S&P/LSTA Leveraged Loan Index, a primary measure of senior debt covering the U.S. leveraged loan market, which currently consists of approximately 1,000 credit facilities throughout numerous industries, recorded an annualized return of 2.12% and a cumulative total return of 16.51%. In addition, the BofA Merrill Lynch US High Yield Index, a primary measure of short-term US dollar denominated below investment grade corporate debt publicly issued in the US domestic market, recorded an annualized return of 3.56% and a cumulative total return of 29.02% over the same period. An investment cannot be made in an index. The indices referenced in the above illustration are being used solely for benchmarking purposes. Addi-tionally, indices do not account for sales charges or expenses, which would otherwise negatively impact the above stated performance of each index.
REPRESENTATIVE HOLDINGS % OF PORTFOLIO
Foundation Consumer Healthcare, LLC 2.57%
Industry: Healthcare & Pharmaceuticals
Cadence Aerospace, LLC 1.88%
Industry: Aerospace & Defense
Tenere Inc. 1.78%
Industry: Capital Equipment
EagleTree-Carbide Acquisition Corp. 1.53%
Industry: Consumer Goods: Durable
Bi-Low, LLC 1.15%
Industry: Retail
Access CIG, LLC 1.01%
Industry: Services: Business
GEO Parent Corp. 0.89%
Industry: Business Services
American Residential Services LLC 0.31%
Industry: Construction & Building
ALLOCATION BY INDUSTRY % OF PORTFOLIO
Healthcare & Pharmaceuticals 18.1%
Services: Business 10.9%
Media: Diversified & Production 8.4%
Chemicals, Plastics & Rubber 7.7%
Media: Advertising, Printing & Publishing 7.3%
Services: Consumer 5.5%
Capital Equipment 4.9%
High Tech Industries 4.2%
Telecommunications 3.9%
Beverage, Food & Tobacco 3.9%
Other Industries 25.2%
ABOUT CION INVESTMENTS
CION Investments is a leading manager of investment solutions designed to redefine the way individual investors can build their portfolios and help meet their long-term investment goals. With more than 30 years of experience in the alternative asset management industry, CION strives to level the playing field. CION currently manages CION
Investment Corporation, a leading non-traded BDC, and sponsors, through CION Ares Management, CION Ares
Diversified Credit Fund, a globally diversified interval fund.
CION Investments
3 Park Avenue, 36th Floor
New York, NY 10016
cioninvestments.com
This fund fact sheet summarizes some of the features and transactions of CIC as of the date indicated above (unless otherwise indicated herein). There is no assurance that additional similar transactions will be available to CIC or that CIC’s investment portfolio composition going forward will be as described herein.