Attached files
| file | filename |
|---|---|
| EX-99.1 - EXHIBIT 99.1 - PLANTRONICS INC /CA/ | q420ex991earningsrelea.htm |
| 8-K - 8-K - PLANTRONICS INC /CA/ | q420earningsrelease8-k.htm |

POLY COMPANY OVERVIEW May 27, 2020 NYSE:PLT © 2020 Plantronics Inc. All rights reserved. 1

FORWARD LOOKING STATEMENTS This presentation contains forward-looking statements within the meaning of Section 27A of the Securities Act of 1933, as amended, and Section 21E of the Securities Exchange Act of 1934, as amended, including statements relating to our intentions, beliefs, projections, outlook, analyses or current expectations that are subject to many risks and uncertainties. Such forward-looking statements and the associated risks and uncertainties include, among others: (i) our beliefs with respect to the length and severity of the COVID-19 (coronavirus) outbreak, and its impact across our businesses, our operations and global supply chain, including (a) the potential impact on our ability to source necessary component parts from key suppliers and volatility in prices, including risks associated with our manufacturers which could continue to negatively affect our profitability and/or market share (b) our expectations that the virus has caused and will continue to cause, an increase in customer and partner demand, including increased demand in collaboration endpoints due to a global, work from anywhere workforce, (c) expectations related to our ability to timely supply the number of products to fulfill current and future customer demand, (d) the impact of the virus on our distribution partners, resellers, end-user customers and our production facilities, including our ability to obtain alternative sources of supply if our production facility or other suppliers are impacted by future shut downs, (e) the impact if global or regional economic conditions deteriorate further, on our customers and/or partners, including increased demand for pricing accommodations, delayed payments, delayed deployment plans, insolvency or other issues which may increase credit losses, and (f) the complexity of the forecast analysis, including scenario planning and the design and operation of internal controls; and (ii) our belief that we can manufacture or supply products in a timely manner to satisfy orders; (iii) expectations related to our customers’ purchasing decisions and our ability to match product production to demand, particularly given long lead times and the difficulty of forecasting unit volumes and acquiring the component parts and materials to meet demand without having excess inventory or incurring cancellation charges; (iv) risks associated with significant and abrupt changes in product demand which increases the complexity of management’s evaluation of potential excess or obsolete inventory; (v) risks associated with the bankruptcy or financial weakness of distributors or key customers, or the bankruptcy of or reduction in capacity of our key suppliers; (vi) risks associated with the potential interruption in the supply of sole- sourced critical components, our ability to move to a dual-source model, and the continuity of component supply at costs consistent with our plans; (vii) expectations that our current cash on hand, additional cash generated from operations, together with sources of cash through our credit facility, either alone or in combination with our election to defer debt repayment until after the first quarter of fiscal year 2021 and our election to suspend our dividend payments, will meet our liquidity needs during and following the unknown duration and impact of the COVID-19 pandemic; (viii) expectations relating to our ability to generate sufficient cash flow from operations to meet our debt covenants and timely repay all principal and interest amounts drawn under our credit facility as they become due; (ix) risks associated with our channel partners’ sales reporting, product inventories and product sell through since we sell a significant amount of products to channel partners who maintain their own inventory of our products; (x) risk and uncertainty related to the potential impact on our stock price and investor confidence as a result of the suspension of our dividend payment; (xi) our efforts to execute to drive sales and sustainable profitable revenue growth; (xii) our expectations for new products launches, the timing of their releases and their expected impact on future growth and on our existing products; (xiii) our belief that our new Partner Program will drive growth and profitability for both us and our partners through the sale of our product, services and solutions; (xiv) risks associated with forecasting sales and procurement demands, which are inherently difficult, particularly with continuing uncertainty in regional and global economic conditions; (xv) uncertainties attributable to currency fluctuations, including fluctuations in foreign exchange rates and/or new or greater tariffs on our products; (xvi) our expectations regarding our ability to control costs, streamline operations and successfully implement our various cost-reduction activities and realize anticipated cost savings under such cost- reduction initiatives; (xvii) expectations relating to our quarterly and annual earnings guidance, particularly as economic uncertainty due to COVID-19 puts further pressure on management judgments used to develop forward looking financial guidance and other prospective financial information; (xviii) estimates of GAAP and non-GAAP financial results for the fourth quarter and full Fiscal Year 2020, including net revenues, adjusted EBITDA, tax rates, intangibles amortization, impairment analysis, diluted weighted average shares outstanding and diluted EPS; (xix) our expectations of the impact of the acquisition of Polycom as it relates to our strategic vision and additional market and strategic partnership opportunities for our combined hardware, software and services offerings; (xx) our beliefs regarding the UC&C market, market dynamics and opportunities, and customer and partner behavior as well as our position in the market, including risks associated with the potential failure of our UC&C solutions to be adopted with the breadth and speed we anticipate; (xxi) our belief that the increased adoption of certain technologies and our open architecture approach has and will continue to increase demand for our solutions; (xxii) expectations related to the micro and macro-economic conditions in our domestic and international markets and their impact on our future business; (xxiii) our forecast and estimates with respect to tax matters, including expectations with respect to utilizing our deferred tax assets; (xxiv) our expectations regarding pending and potential future litigation, in addition to other matters discussed in this press release that are not purely historical data, and (xxv) our estimates regarding the amount of the goodwill and long-lived asset impairment charges to be recorded in our fourth quarter results, which are subject to change, including potentially materially, as the Company finalizes the impairment assessment, including the design and operation of internal controls. We do not assume any obligation to update or revise any such forward-looking statements, whether as the result of new developments or otherwise. For more information concerning these and other possible risks, please refer to our Annual Report on Form 10-K filed with the Securities and Exchange Commission on May 17, 2019 and other filings with the Securities and Exchange Commission, as well as recent press releases. © 2020 Plantronics Inc. All rights reserved. 2

USE OF NON-GAAP INFORMATION To supplement our condensed consolidated financial statements presented on a GAAP basis, we use non-GA A P, and where applicable, combined comparative measures of operating results, including non-GAAP net revenues, non-GAAP gross profit, non-GAAP operating expenses, non-GAAP operating income, adjusted EBITDA, and non-GAAP diluted EPS. These non-GAAP measures are adjusted from the most directly comparable GAAP measures to exclude, or include where applicable, the effect of purchase accounting on deferred revenue and inventory, charges associated with the optimization of our Consumer product line, stock-based compensation, acquisition related expenses, purchase accounting amortization and adjustments, restructuring and other related charges and credits, impairment charges, rebranding costs, other unusual and/or non-cash charges and credits, and the impact of participating securities, all net of any associated tax impact. We also exclude tax benefits from the release of tax reserves, discrete tax adjustments including transfer pricing, tax deduction and tax credit adjustments, and the impact of tax law changes. We adjust these amounts from our non-GAAP and combined comparative measures primarily because management does not believe they are consistent with the development of our target operating model. Combined comparative results refer to the results for periods prior to the acquisition of Polycom, which were prepared by combining the non-GAAP results of as if they had been combined during that period. These prior period results are presented on a non-GAAP as-reported basis, with immaterial adjustments to align the treatment of non- GAAP adjustments for comparative purposes. We believe that the use of non-GAAP and combined comparative financial measures provides meaningful supplemental information regarding our performance and liquidity and helps investors compare actual results with our historical and long-term target operating model goals as well as our performance as a combined company. We believe presenting non-GAAP net revenue provides meaningful supplemental information regarding how management views the performance of the business and underlying performance of our individual product categories. We believe that both management and investors benefit from referring to these non-GAAP and combined comparative financial measures in assessing our performance and when planning, forecasting and analyzing future periods; however, non-GAAP and combined comparative financial measures are not meant to be considered in isolation of, or as a substitute for, or superior to, net revenues, gross margin, operating expenses, operating income, operating margin, net income or EPS prepared in accordance with GAAP. A reconciliation between GAAP and Non-GAAP measures for all periods presented in this document is included as an appendix to this document and in our press release regarding our results for Q4 FY20 filed with the SEC on Form 8-K on May 27, 2020. Other historical reconciliations are available at investor.poly.com. © 2020 Plantronics Inc. All rights reserved. 3

OVERVIEW & STRATEGY © 2020 Plantronics Inc. All rights reserved. 4

Q4 FY20 SUMMARY BUSINESS OVERVIEW FINANCIAL OVERVIEW • Demand surge for enterprise headsets • GAAP Revenue of $403M Guidance range of $354M - $394M • In-house manufacturing and supply chain able to deliver revenue above guidance range • Non-GAAP Revenue of $409M Guidance range of $360M - $400M • Taking steps to maximize financial flexibility and liquidity • GAAP EPS of $(16.56) • Ended quarter with $226M in cash and short- • Non-GAAP EPS of $0.30 term investments Guidance range of $(0.36) - $0.19 • Non-cash impairment charge of $648M due to • Adjusted EBITDA of $60M decline in earnings, COVID-19, and decline in Guidance range of $20M - $45M share price, significantly impacted GAAP EPS © 2020 Plantronics Inc. All rights reserved. 5

OPERATIONAL UPDATE COVID-19 UPDATE • In-house manufacturing has resumed production after a shutdown for safety reconfiguration MARKET DEMAND • Continued periodic supply chain disruptions but • Continued strong demand for enterprise improving overall headsets • Expanding dual-sourcing and securing additional • Our endpoints are supporting customers capacity at certain contract manufacturers in key verticals impacted by COVID-19 • Prioritizing orders placed by first responders, such as first responders, governments, governments, and healthcare customers healthcare, and education • Following WHO and CDC guidance to safeguard • Delay in voice/video sales that require employee health and safety on-site personnel − 97% of non-factory workers currently working from • Paradigm shift towards “work from home anywhere” creates long-term opportunity − Employees well positioned for remote work given our technology and solutions © 2020 Plantronics Inc. All rights reserved. 6

A COMPELLING INVESTMENT OPPORTUNITY $41B UC&C1 Market UC&C Market Leader Strategic Innovator • We operate in a $41B UC&C market • Approximately $1.7B in annual • Reinventing the UC&C industry with strong growth drivers revenues and ~$300M TTM EBITDA through product integration, software and analytics • Rise in open architectures creates • Platform-agnostic, intelligent solutions need for a unified endpoint • Synergy execution complete • Valuable business insights available through unique software and analytics • Cloud deployments on rise with high demand for analytics and insights capabilities • We address an $8B Enterprise Endpoint market growing at 8% 1 Frost & Sullivan, May 2019. © 2020 Plantronics Inc. All rights reserved. 7

THREE FUNDAMENTAL INDUSTRY DRIVERS ON-PREMISE TO CLOUD UCC REMOTE WORK VIDEO COLLABORATION © 2020 Plantronics Inc. All rights reserved. 8

OUR STRATEGY Deliver a comprehensive set of endpoints for the UC&C market and differentiate through software Management Analytics Interoperability Video Conference Desktop Headsets Software Services © 2020 Plantronics Inc. All rights reserved. 9
BROADER UC MARKET AND ECOSYSTEM Key Partners Our platform agnostic and best-in-class unified endpoint strategy differentiates us © 2020 Plantronics Inc. All rights reserved. 10
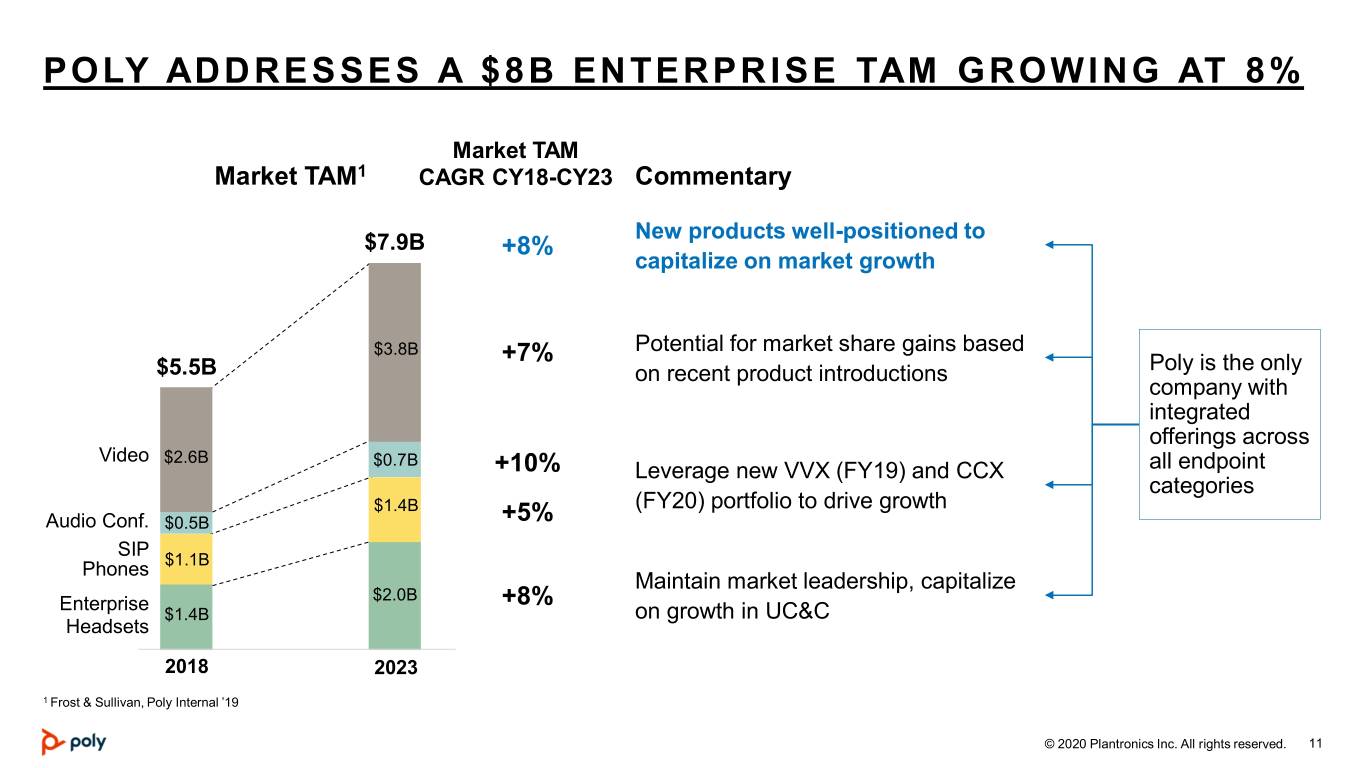
POLY ADDRESSES A $8B ENTERPRISE TAM GROWING AT 8% Market TAM Market TAM1 CAGR CY18-CY23 Commentary New products well-positioned to $7.9B +8% capitalize on market growth $3.8B +7% Potential for market share gains based $5.5B on recent product introductions Poly is the only company with integrated offerings across Video $2.6B $0.7B +10% Leverage new VVX (FY19) and CCX all endpoint categories $1.4B (FY20) portfolio to drive growth Audio Conf. $0.5B +5% SIP Phones $1.1B Maintain market leadership, capitalize Enterprise $2.0B +8% $1.4B on growth in UC&C Headsets 2018 2023 1 Frost & Sullivan, Poly Internal ’19 © 2020 Plantronics Inc. All rights reserved. 11

NEW PRODUCT & PARTNER ANNOUNCEMENTS © 2020 Plantronics Inc. All rights reserved. 12

POLY PARTNER PROGRAM GLOBAL IN SCOPE, LOCAL IN EXECUTION The new program, which brings together more than 15,000 partners around the world, is designed to support channel growth through the sale of Poly products, solutions, and services. This program is designed to drive mutual growth and profitability for both Poly and our partners. © 2020 Plantronics Inc. All rights reserved. 13

MAJOR PRODUCT ANNOUNCEMENTS IN Q4 FY20 ENTERPRISE/WFH HEADSETS AUDIO CONFERENCING PERSONAL SPEAKERPHONES Blackwire 8225, Voyager 4245 Trio C60 Calisto 5300 © 2020 Plantronics Inc. All rights reserved. 14

POLY LENS CLOUD-BASED INSIGHTS AND MANAGEMENT SERVICE Poly Lens combines seamless management and updating tools with powerful insight into how Poly devices are being used to offer greater control and simplicity to IT administrators. © 2020 Plantronics Inc. All rights reserved. 15
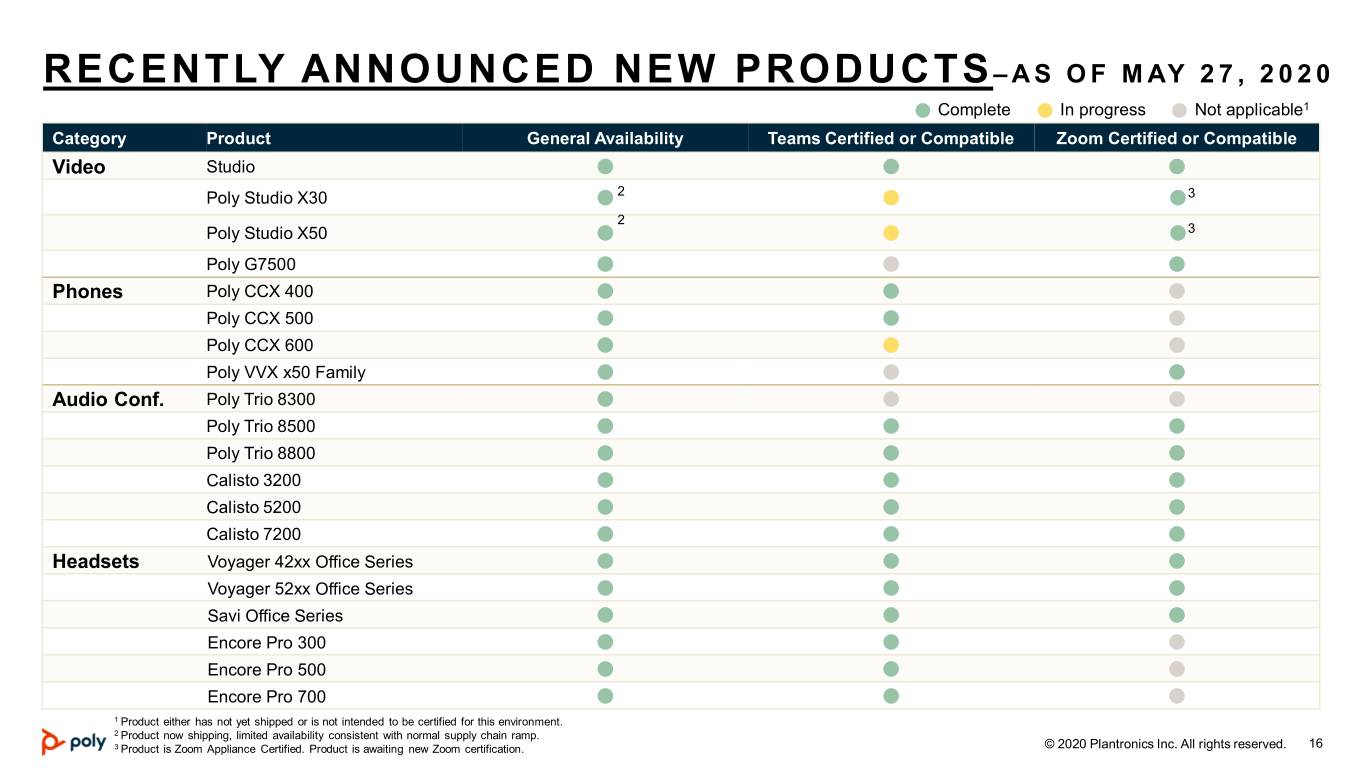
RECENTLY ANNOUNCED NEW PRODUCTS– AS OF MAY 27, 2020 ● Complete ● In progress ● Not applicable1 Category Product General Availability Teams Certified or Compatible Zoom Certified or Compatible Video Studio ⚫ ⚫ ⚫ Poly Studio X30 ⚫ 2 ⚫ ⚫3 2 Poly Studio X50 ⚫ ⚫ ⚫3 Poly G7500 ⚫ ⚫ ⚫ Phones Poly CCX 400 ⚫ ⚫ ⚫ Poly CCX 500 ⚫ ⚫ ⚫ Poly CCX 600 ⚫ ⚫ ⚫ Poly VVX x50 Family ⚫ ⚫ ⚫ Audio Conf. Poly Trio 8300 ⚫ ⚫ ⚫ Poly Trio 8500 ⚫ ⚫ ⚫ Poly Trio 8800 ⚫ ⚫ ⚫ Calisto 3200 ⚫ ⚫ ⚫ Calisto 5200 ⚫ ⚫ ⚫ Calisto 7200 ⚫ ⚫ ⚫ Headsets Voyager 42xx Office Series ⚫ ⚫ ⚫ Voyager 52xx Office Series ⚫ ⚫ ⚫ Savi Office Series ⚫ ⚫ ⚫ Encore Pro 300 ⚫ ⚫ ⚫ Encore Pro 500 ⚫ ⚫ ⚫ Encore Pro 700 ⚫ ⚫ ⚫ 1 Product either has not yet shipped or is not intended to be certified for this environment. 2 Product now shipping, limited availability consistent with normal supply chain ramp. 3 Product is Zoom Appliance Certified. Product is awaiting new Zoom certification. © 2020 Plantronics Inc. All rights reserved. 16

Q4 FY20 EARNINGS RESULTS © 2020 Plantronics Inc. All rights reserved. 17

Q4 FINANCIAL SUMMARY1 Non-GAAP Revenue of $409 million: • Strong demand for remote work solutions – primarily headsets • Rebound in voice revenues after channel inventory reduction in fiscal Q3 Non-GAAP gross margins of 49.4%, down 560 bps Y/Y: • Impacted by factory underutilization, incremental freight costs, and increased tariffs Non-GAAP operating expenses of $154 million, down $24 million Y/Y: • Primarily due to reduced variable compensation, hiring, and travel Non-GAAP operating margin of 11.8%, down 670 bps Y/Y, Adj. EBITDA of $60 million Non-GAAP diluted EPS of $0.30 1 Please refer to the appendix to this presentation and to our press release regarding our Q4 FY20 filed with the SEC on Form 8-K on May 27, 2020 for a reconciliation between GAAP and Non-GAAP measures. © 2020 Plantronics Inc. All rights reserved. 18
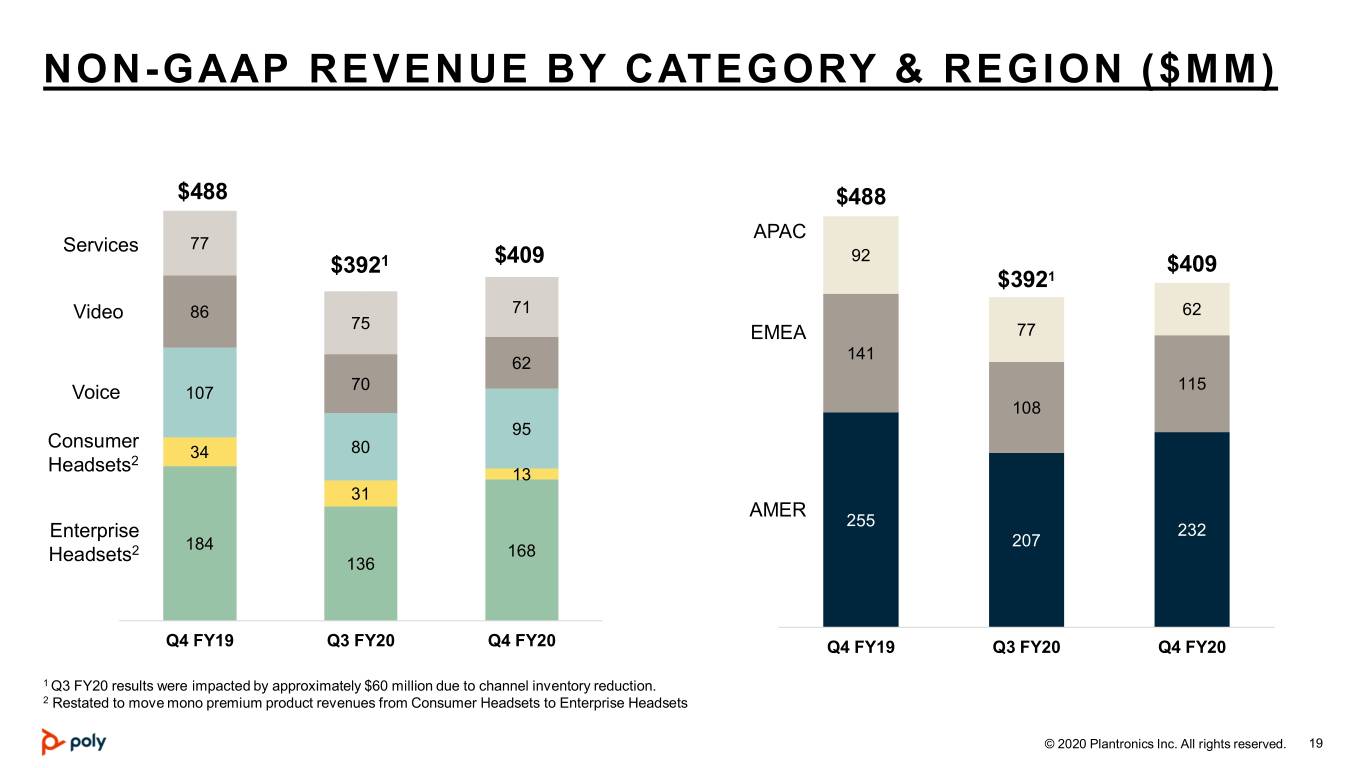
NON-GAAP REVENUE BY CATEGORY & REGION ($MM) $488 $488 APAC Services 77 92 $3921 $409 $409 $3921 Video 86 71 62 75 EMEA 77 141 62 70 115 Voice 107 108 95 Consumer 80 2 34 Headsets 13 31 AMER 255 232 Enterprise 207 2 184 168 Headsets 136 Q4 FY19 Q3 FY20 Q4 FY20 Q4 FY19 Q3 FY20 Q4 FY20 1 Q3 FY20 results were impacted by approximately $60 million due to channel inventory reduction. 2 Restated to move mono premium product revenues from Consumer Headsets to Enterprise Headsets © 2020 Plantronics Inc. All rights reserved. 19

NON-GAAP OPERATING DETAILS ($MM) $268 $90 $178 $202 $154 $48 55.0% 49.4% 18.5% 36.5% 37.6% 11.8% Q4 FY19 Q4 FY20 Q4 FY19 Q4 FY20 Q4 FY19 Q4 FY20 Gross Profit Operating Expenses Operating Income • Y/Y Decline of $66M or • Y/Y decline of $24M or 13% • Operating income decline 560 basis points due primarily to lower of $42M or 47% driven • Margins impacted by compensation, hiring, and primarily by lower revenue factory underutilization, travel and gross margin freight, and tariffs © 2020 Plantronics Inc. All rights reserved. 20

Restructuring Category ($MM) Q4 FY20 Severance $4.3 Q4 RESTRUCTURING Facility $1.1 DETAIL Legal Entity Rationalization + Other $1.7 Total $7.1 © 2020 Plantronics Inc. All rights reserved. 21

TRAILING TWELVE MONTHS ADJUSTED EBITDA ($MM) TTM EBITDA: $293M $102 $98 $93 $60 $43 Q4 FY19 Q1 FY20 Q2 FY20 Q3 FY20 Q4 FY20 © 2020 Plantronics Inc. All rights reserved. 22

CASH & INVESTMENTS BRIDGE Q3-Q4 FY20 ($MM) 226 172 © 2020 Plantronics Inc. All rights reserved. 23

Q1 FY21 GUIDANCE © 2020 Plantronics Inc. All rights reserved. 24

Q1 GUIDANCE (AS OF MAY 27, 2020) Q1 FY21 Guidance GAAP Net Revenue $330M - $365M Non-GAAP Net Revenue1 $335M - $370M Adjusted EBITDA2 $25M - $45M Non-GAAP Diluted EPS2,3 $(0.18) - $0.22 1 The non-GAAP revenue guidance range shown here excludes the $5.1 million impact of purchase accounting related to recording deferred revenue at fair value at the time of the acquisition. 2 Q1 Adjusted EBITDA and non-GAAP diluted EPS excludes estimated intangibles amortization expense of $32.4 million. 3 EPS Guidance assumes approximately 41 million diluted average weighted shares and a non-GAAP effective tax rate of 18% to 20%. Poly does not intend to update these targets during the quarter or to report on its progress toward these targets. Poly will not comment on these targets to analysts or investors except by its press release announcing its first quarter fiscal year 2021 results or by other public disclosure. Any statements by persons outside Poly speculating on the progress of the first quarter or full fiscal year 2021 will not be based on internal company information and should be assessed accordingly by investors. Please refer to the appendix in this presentation and to our press release regarding our Q4 FY20 filed with the SEC on Form 8-K on May 27, 2020 for a reconciliation between GAAP and Non-GAAP measures. With respect to adjusted EBITDA and diluted EPS guidance, the Company has determined that it is unable to provide quantitative reconciliations of these forward-looking non-GAAP measures to the most directly comparable forward-looking GAAP measures with a reasonable degree of confidence in their accuracy without unreasonable effort, as items including stock based compensation, acquisition and integration costs, litigation gains and losses, and impacts from discrete tax adjustments and tax laws are inherently uncertain and depend on various factors, many of which are beyond the Company's control. Our business is inherently difficult to forecast, particularly with continuing uncertainty in regional economic conditions, currency fluctuations, customer cancellations and rescheduling, and there can be no assurance that expectations of incoming orders over the balance of the current quarter will materialize. © 2020 Plantronics Inc. All rights reserved. 25

4 Quarter Rolling Q1 Q2 Q3 Q4 Forecast ($MM) FY21 FY21 FY21 FY21 Revenue–Deferred GAAP PURCHASE Revenue Fair Value $5.1 $4.2 $3.3 $1.8 Adjustment ACCOUNTING COGS–Intangibles FORECAST $18.2 $17.2 $16.5 $16.2 Amortization1 SG&A–Intangibles $14.2 $14.2 $14.2 $14.2 Amortization 1 Subject to change as In-Process technology assets are placed into service. © 2020 Plantronics Inc. All rights reserved. 26

SUPPLEMENTAL DATA & GAAP TO NON-GAAP RECONCILIATIONS © 2020 Plantronics Inc. All rights reserved. 27
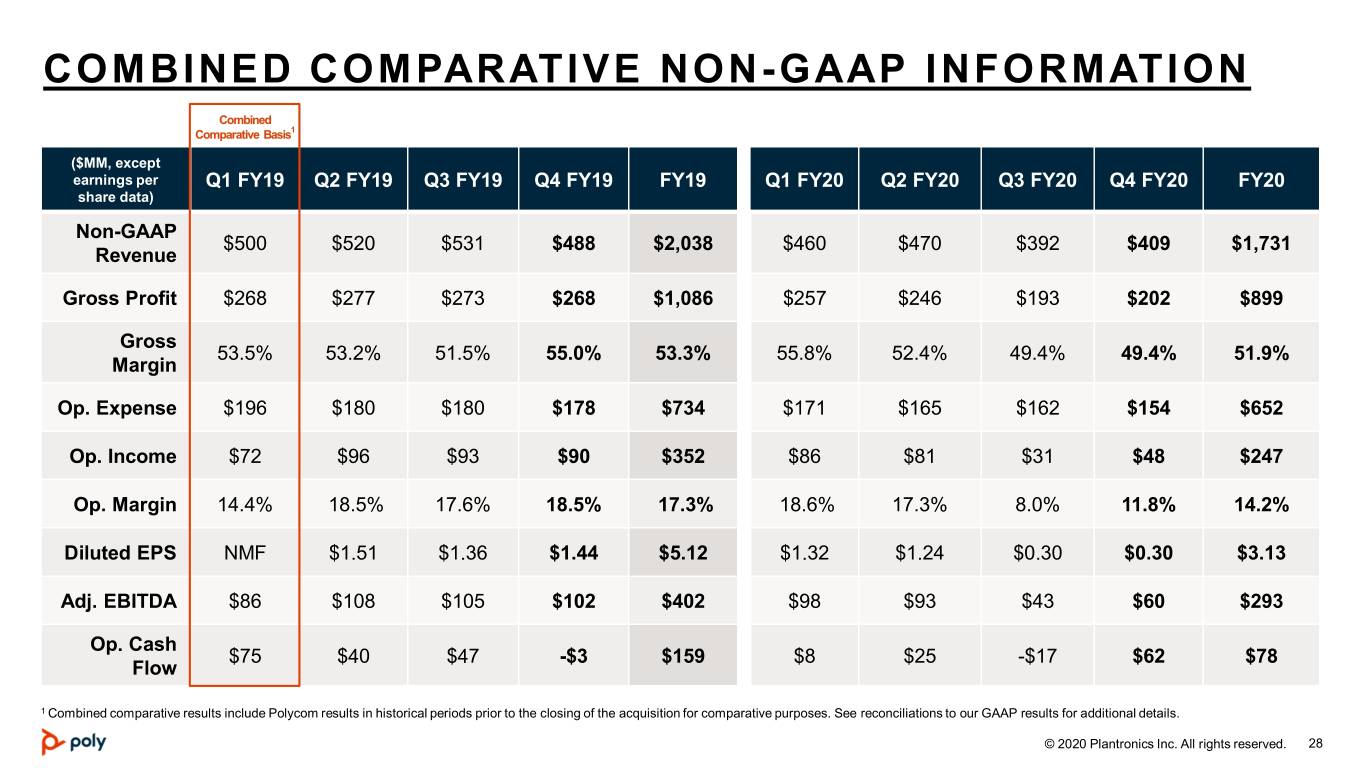
COMBINED COMPARATIVE NON-GAAP INFORMATION Combined Comparative Basis1 ($MM, except earnings per Q1 FY19 Q2 FY19 Q3 FY19 Q4 FY19 FY19 Q1 FY20 Q2 FY20 Q3 FY20 Q4 FY20 FY20 share data) Non-GAAP $500 $520 $531 $488 $2,038 $460 $470 $392 $409 $1,731 Revenue Gross Profit $268 $277 $273 $268 $1,086 $257 $246 $193 $202 $899 Gross 53.5% 53.2% 51.5% 55.0% 53.3% 55.8% 52.4% 49.4% 49.4% 51.9% Margin Op. Expense $196 $180 $180 $178 $734 $171 $165 $162 $154 $652 Op. Income $72 $96 $93 $90 $352 $86 $81 $31 $48 $247 Op. Margin 14.4% 18.5% 17.6% 18.5% 17.3% 18.6% 17.3% 8.0% 11.8% 14.2% Diluted EPS NMF $1.51 $1.36 $1.44 $5.12 $1.32 $1.24 $0.30 $0.30 $3.13 Adj. EBITDA $86 $108 $105 $102 $402 $98 $93 $43 $60 $293 Op. Cash $75 $40 $47 -$3 $159 $8 $25 -$17 $62 $78 Flow 1 Combined comparative results include Polycom results in historical periods prior to the closing of the acquisition for comparative purposes. See reconciliations to our GAAP results for additional details. © 2020 Plantronics Inc. All rights reserved. 28

AS-REPORTED NON-GAAP INFORMATION ($MM, except earnings per Q1 FY19 Q2 FY19 Q3 FY19 Q4 FY19 FY19 Q1 FY20 Q2 FY20 Q3 FY20 Q4 FY20 FY20 share data) Non-GAAP $221 $520 $531 $488 $1,759 $460 $470 $392 $409 $1,731 Revenue Gross Profit $111 $277 $273 $268 $929 $257 $246 $193 $202 $899 Gross 50.1% 53.2% 51.5% 55.0% 52.8% 55.8% 52.4% 49.4% 49.4% 51.9% Margin Op. Expense $75 $180 $180 $178 $613 $171 $165 $162 $154 $652 Op. Income $36 $96 $93 $90 $316 $86 $81 $31 $48 $247 Op. Margin 16.2% 18.5% 17.6% 18.5% 18.0% 18.6% 17.3% 8.0% 11.8% 14.2% Diluted EPS $0.74 $1.51 $1.36 $1.44 $5.12 $1.32 $1.24 $0.30 $0.30 $3.13 Adj. EBITDA $42 $108 $105 $102 $357 $98 $93 $43 $60 $293 Op. Cash $32 $40 $47 -$3M $116 $8 $25 -$17 $62 $78 Flow © 2020 Plantronics Inc. All rights reserved. 29

TRENDED NON-GAAP REVENUE DATA Non-GAAP Rev by Q1 FY19 Q2 FY19 Q3 FY19 Q4 FY19 FY19 Q1 FY20 Q2 FY20 Q3 FY20 Q4 FY20 FY20 Category ($MM) Voice1 $106 $121 $117 $107 $451 $104 $99 $80 $95 $377 Video1 $92 $89 $88 $86 $355 $61 $90 $70 $62 $284 Services1 $81 $81 $82 $77 $321 $77 $75 $75 $70 $297 Ent Headsets2 $182 $185 $188 $184 $739 $187 $176 $136 $169 $668 Cons Headsets2 $39 $43 $56 $34 $172 $31 $30 $30 $13 $105 Total Revenue $500 $520 $531 $488 $2,038 $460 $470 $392 $409 $1,731 Non-GAAP Revenue by Geography Americas $265 $284 $278 $255 $1,082 $261 $248 $207 $232 $948 EMEA $138 $138 $153 $142 $571 $119 $131 $108 $115 $473 APAC $97 $98 $99 $92 $386 $80 $91 $77 $62 $310 Total Revenue $500 $520 $531 $488 $2,038 $460 $470 $392 $409 $1,731 1 Combined comparative results include Polycom results in historical periods prior to the closing of the acquisition for comparative purposes. See reconciliations to our GAAP results for additional details. 2 Restated to move mono premium product revenues from Consumer Headsets to Enterprise Headsets © 2020 Plantronics Inc. All rights reserved. 30

THANK YOU ©2020 Plantronics, Inc. Poly and the propeller design are trademarks of Plantronics, Inc. 31

Unaudited Reconciliations of GAAP net revenue to non-GAAP net revenue ($ in thousands) Three Months Ended September 29, December 29, March 30, June 29, September 28, December 28, March 28, 2018 2018 2019 2019 2019 2019 2020 Net revenues from unaffiliated customers: Enterprise Headsets1 $ 185,380 $ 186,786 $ 184,181 $ 187,668 $ 176,031 $ 136,807 $ 168,002 Consumer Headsets1 42,651 56,358 34,034 30,982 30,261 30,473 12,962 Voice 121,309 116,700 106,577 103,847 98,453 79,494 95,265 Video 85,922 85,597 83,966 60,248 90,392 69,859 61,992 Services 47,807 56,228 59,730 65,022 66,572 67,838 64,822 Total GAAP net revenues $ 483,069 $ 501,669 $ 468,488 $ 447,767 $ 461,709 $ 384,471 $ 403,043 Deferred revenue purchase accounting2 36,585 28,923 19,316 12,159 8,524 7,131 6,138 Total non-GAAP net revenues $ 519,654 $ 530,592 $ 487,804 $ 459,926 $ 470,233 $ 391,602 $ 409,181 Net revenues by geographic area from unaffiliated customers: Americas $ 266,641 $ 265,119 $ 246,157 $ 255,940 $ 245,283 $ 204,910 $ 229,900 EMEA 128,957 146,388 137,955 116,979 128,973 105,931 113,738 APAC 87,471 90,162 84,376 74,848 87,453 73,630 59,405 Total GAAP net revenues $ 483,069 $ 501,669 $ 468,488 $ 447,767 $ 461,709 $ 384,471 $ 403,043 Deferred revenue purchase accounting2 36,585 28,923 19,316 12,159 8,524 7,131 6,138 Total non-GAAP net revenues $ 519,654 $ 530,592 $ 487,804 $ 459,926 $ 470,233 $ 391,602 $ 409,181 1 Restated to move mono premium product revenues from Consumer Headsets to Enterprise Headsets. 2 Represents the impact of fair value purchase accounting adjustments related to deferred revenue recorded in connection with the acquisition of Polycom on July 2, 2018. The Company’s deferred revenue primarily relates to Service revenue associated with non-cancelable maintenance support on hardware devices which are typically billed in advance and recognized ratably over the contract term as those services are delivered. This adjustment represents the amount of additional revenue that would have been recognized during the period absent the write-down to fair value required under purchase accounting guidelines.
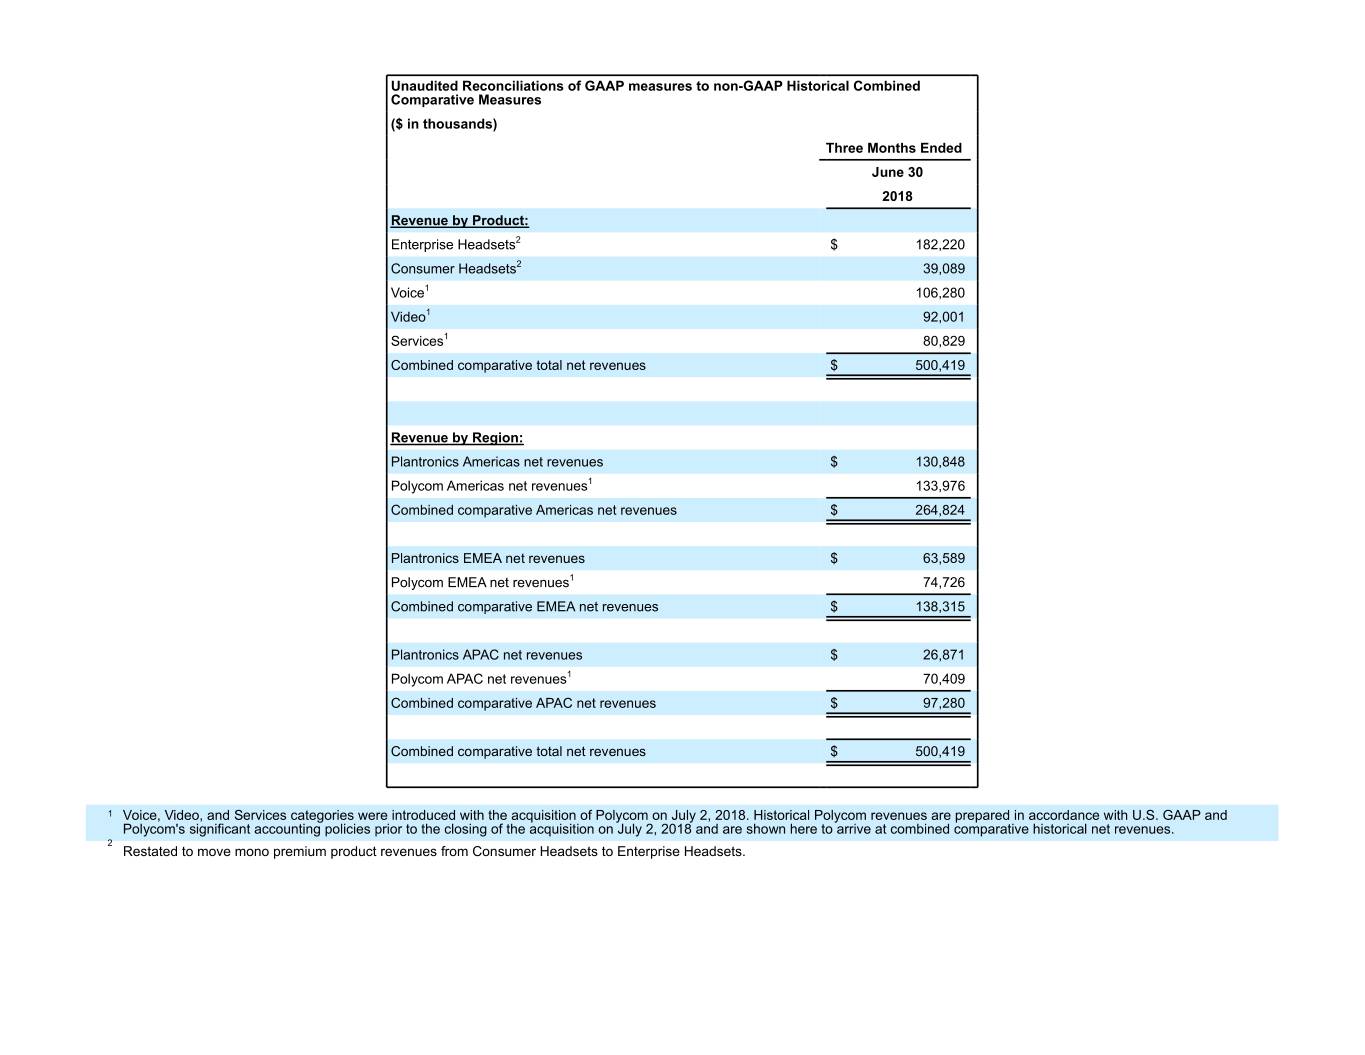
Unaudited Reconciliations of GAAP measures to non-GAAP Historical Combined Comparative Measures ($ in thousands) Three Months Ended June 30 2018 Revenue by Product: Enterprise Headsets2 $ 182,220 Consumer Headsets2 39,089 Voice1 106,280 Video1 92,001 Services1 80,829 Combined comparative total net revenues $ 500,419 Revenue by Region: Plantronics Americas net revenues $ 130,848 Polycom Americas net revenues1 133,976 Combined comparative Americas net revenues $ 264,824 Plantronics EMEA net revenues $ 63,589 Polycom EMEA net revenues1 74,726 Combined comparative EMEA net revenues $ 138,315 Plantronics APAC net revenues $ 26,871 Polycom APAC net revenues1 70,409 Combined comparative APAC net revenues $ 97,280 Combined comparative total net revenues $ 500,419 1 Voice, Video, and Services categories were introduced with the acquisition of Polycom on July 2, 2018. Historical Polycom revenues are prepared in accordance with U.S. GAAP and Polycom's significant accounting policies prior to the closing of the acquisition on July 2, 2018 and are shown here to arrive at combined comparative historical net revenues. 2 Restated to move mono premium product revenues from Consumer Headsets to Enterprise Headsets.

Unaudited Reconciliations of GAAP measures to non-GAAP Historical Combined Comparative Measures (continued) ($ in thousands) Plantronics GAAP gross profit $ 109,843 Polycom GAAP gross profit1 156,599 Combined comparative gross profit before adjustments $ 266,442 Stock-based compensation 963 Purchase accounting amortization 436 Other adjustments2 — Combined comparative adjusted gross profit $ 267,841 Combined comparative adjusted gross profit % 53.5% Plantronics GAAP operating income $ 20,649 Polycom GAAP operating income1 (30,589) Combined comparative operating income before adjustments $ (9,940) Amortization of Polycom goodwill and intangibles amortization 14,802 Stock-based compensation 8,150 Acquisition and integration fees 12,901 Restructuring and other related charges 2,847 Non-recurring legal-related and other adjustments2 43,446 Combined adjusted operating income $ 72,206 Combined adjusted operating profit % 14.4%

Unaudited Reconciliations of GAAP measures to Combined Comparative Adjusted EBITDA ($ in thousands) Three Months Ended June 30, 20181 Plantronics GAAP operating income $ 20,649 Polycom GAAP operating income2 (30,589) Combined comparative operating income before adjustments (9,940) Acquisition and integration fees 12,901 Stock-based compensation 8,150 Restructuring and other related charges 2,847 Other adjustments3 43,446 Depreciation and amortization4 29,231 Adjusted EBITDA 86,635 Unaudited Reconciliations of GAAP measures to non-GAAP Historical Combined Comparative Measures (continued) ($ in thousands) Three Months Ended June 30 2018 Plantronics Cash Flow from Operations $ 32,082 Polycom Cash Flow from Operations1 $ 43,059 Combined Comparative Cash Flow from Operations $ 75,141 1 Polycom results shown in these periods are prior to the close of the acquisition on July 2, 2018. These results are shown here to arrive at combined comparative historical results. 2 Prepared in accordance with U.S. GAAP and Polycom's significant accounting policies prior to the closing of the acquisition on July 2, 2018, and further adjusted in accordance with U.S. GAAP for subsequent events occurring after the balance sheet date of June 30, 2018. Refer to footnote 3 for further information. Includes losses from litigation settlements and immaterial adjustments to conform historical Polycom results to Plantronics non-GAAP policy. In the period ended June 30, 2018, this 3 includes litigation settlements of approximately $37 million related to the settlement of a previously disclosed FCPA matter and approximately $6 million related other legal settlements, both of which were recognized as subsequent events. More information on these and other legal matters is available in Note 7. Commitments and Contingencies within our Form 10-Q filed on February 6, 2019. 4 In the three months ending December 31, 2017, March 31, 2018, and June 30, 2018, depreciation and amortization includes amortization of Polycom goodwill in accordance with U.S. GAAP and Polycom's significant accounting policies prior to the closing of the acquisition on July 2, 2018.
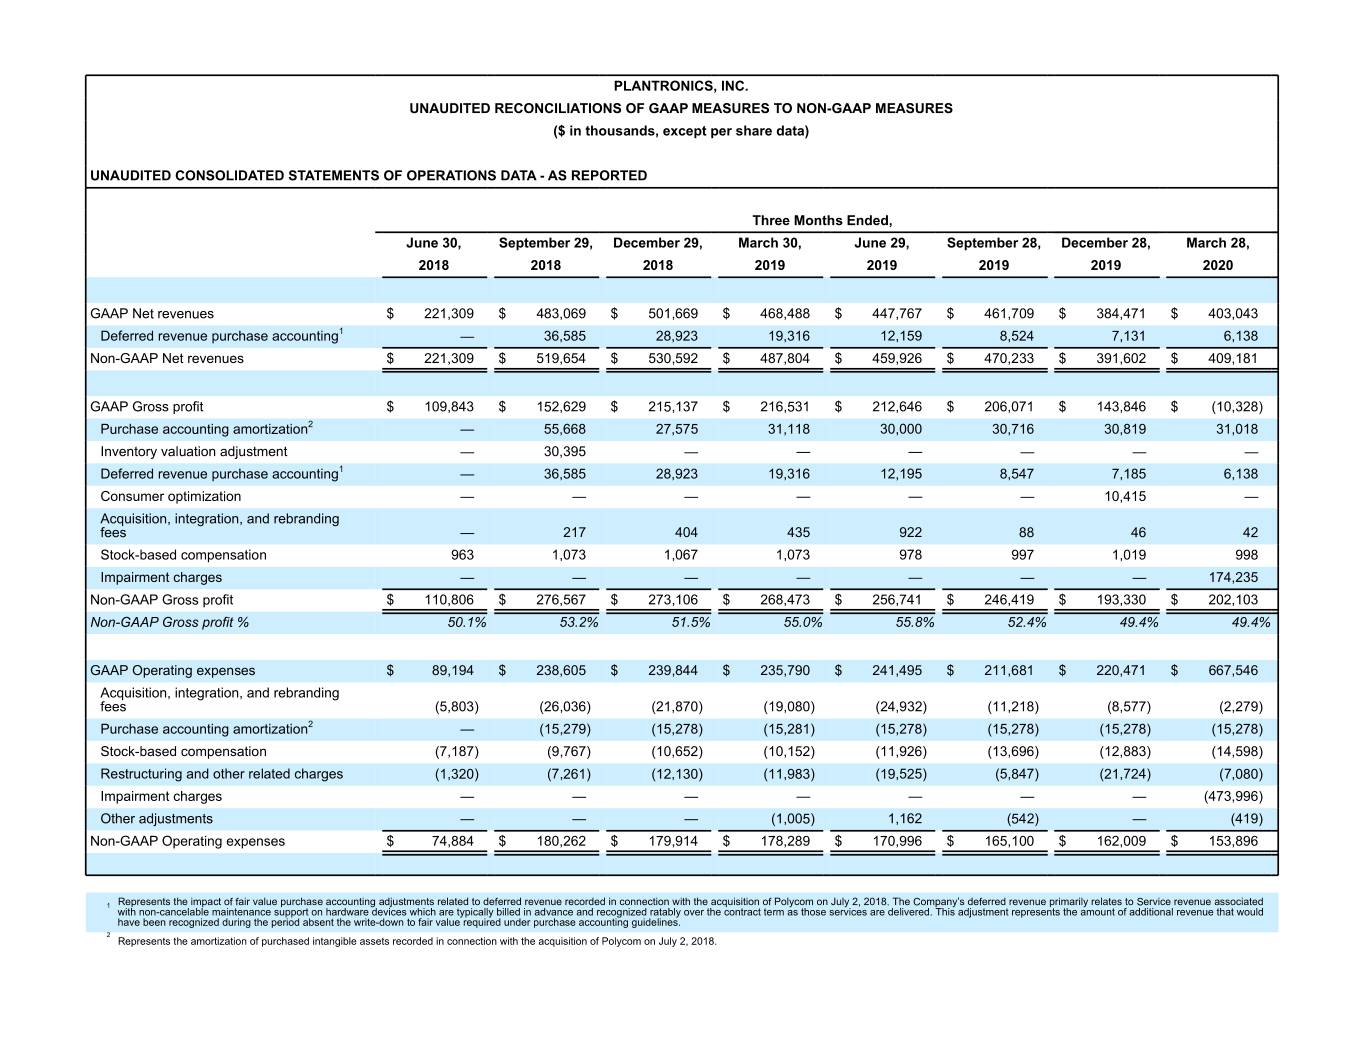
PLANTRONICS, INC. UNAUDITED RECONCILIATIONS OF GAAP MEASURES TO NON-GAAP MEASURES ($ in thousands, except per share data) UNAUDITED CONSOLIDATED STATEMENTS OF OPERATIONS DATA - AS REPORTED Three Months Ended, June 30, September 29, December 29, March 30, June 29, September 28, December 28, March 28, 2018 2018 2018 2019 2019 2019 2019 2020 GAAP Net revenues $ 221,309 $ 483,069 $ 501,669 $ 468,488 $ 447,767 $ 461,709 $ 384,471 $ 403,043 Deferred revenue purchase accounting1 — 36,585 28,923 19,316 12,159 8,524 7,131 6,138 Non-GAAP Net revenues $ 221,309 $ 519,654 $ 530,592 $ 487,804 $ 459,926 $ 470,233 $ 391,602 $ 409,181 GAAP Gross profit $ 109,843 $ 152,629 $ 215,137 $ 216,531 $ 212,646 $ 206,071 $ 143,846 $ (10,328) Purchase accounting amortization2 — 55,668 27,575 31,118 30,000 30,716 30,819 31,018 Inventory valuation adjustment — 30,395 — — — — — — Deferred revenue purchase accounting1 — 36,585 28,923 19,316 12,195 8,547 7,185 6,138 Consumer optimization — — — — — — 10,415 — Acquisition, integration, and rebranding fees — 217 404 435 922 88 46 42 Stock-based compensation 963 1,073 1,067 1,073 978 997 1,019 998 Impairment charges — — — — — — — 174,235 Non-GAAP Gross profit $ 110,806 $ 276,567 $ 273,106 $ 268,473 $ 256,741 $ 246,419 $ 193,330 $ 202,103 Non-GAAP Gross profit % 50.1% 53.2% 51.5% 55.0% 55.8% 52.4% 49.4% 49.4% GAAP Operating expenses $ 89,194 $ 238,605 $ 239,844 $ 235,790 $ 241,495 $ 211,681 $ 220,471 $ 667,546 Acquisition, integration, and rebranding fees (5,803) (26,036) (21,870) (19,080) (24,932) (11,218) (8,577) (2,279) Purchase accounting amortization2 — (15,279) (15,278) (15,281) (15,278) (15,278) (15,278) (15,278) Stock-based compensation (7,187) (9,767) (10,652) (10,152) (11,926) (13,696) (12,883) (14,598) Restructuring and other related charges (1,320) (7,261) (12,130) (11,983) (19,525) (5,847) (21,724) (7,080) Impairment charges — — — — — — — (473,996) Other adjustments — — — (1,005) 1,162 (542) — (419) Non-GAAP Operating expenses $ 74,884 $ 180,262 $ 179,914 $ 178,289 $ 170,996 $ 165,100 $ 162,009 $ 153,896 1 Represents the impact of fair value purchase accounting adjustments related to deferred revenue recorded in connection with the acquisition of Polycom on July 2, 2018. The Company’s deferred revenue primarily relates to Service revenue associated with non-cancelable maintenance support on hardware devices which are typically billed in advance and recognized ratably over the contract term as those services are delivered. This adjustment represents the amount of additional revenue that would have been recognized during the period absent the write-down to fair value required under purchase accounting guidelines. 2 Represents the amortization of purchased intangible assets recorded in connection with the acquisition of Polycom on July 2, 2018.

PLANTRONICS, INC. UNAUDITED RECONCILIATIONS OF GAAP MEASURES TO NON-GAAP MEASURES ($ in thousands, except per share data) UNAUDITED CONSOLIDATED STATEMENTS OF OPERATIONS DATA - AS REPORTED (CONTINUED) Three Months Ended June 30, September 29, December 29, March 30, June 29, September 28, December 28, March 28, 2018 2018 2018 2019 2019 2019 2019 2020 GAAP Operating income (loss) $ 20,649 $ (85,976) $ (24,707) $ (19,259) $ (28,849) $ (5,610) $ (76,625) $ (677,874) Purchase accounting amortization2 — 70,947 42,853 46,399 45,278 45,994 46,097 46,296 Inventory valuation adjustment — 30,395 — — — — — — Deferred revenue purchase accounting1 — 36,585 28,923 19,316 17,614 9,196 7,509 6,138 Consumer optimization — — — — — — 10,415 — Acquisition, integration, and rebranding fees 5,803 26,253 22,274 19,515 20,435 10,657 8,299 2,321 Stock-based compensation 8,150 10,840 11,719 11,225 12,904 14,693 13,902 15,596 Restructuring and other related charges 1,320 7,261 12,130 11,983 19,525 5,847 21,724 7,080 Impairment charges — — — — — — — 648,231 Other adjustments — — — 1,005 (1,162) 542 — 419 Non-GAAP Operating income $ 35,922 $ 96,305 $ 93,192 $ 90,184 $ 85,745 $ 81,319 $ 31,321 $ 48,207 GAAP Diluted earnings per common share $ 0.42 $ (2.21) $ (1.06) $ (0.55) $ (1.14) $ (0.65) $ (1.97) $ (16.56) Purchase accounting amortization2 — 1.78 1.08 1.17 1.15 1.16 1.16 1.15 Inventory valuation adjustment — 0.76 — — — — — — Deferred revenue purchase accounting1 — 0.92 0.73 0.49 0.31 0.21 0.18 0.15 Consumer optimization — — — — — — 0.26 — Stock-based compensation 0.24 0.27 0.30 0.28 0.33 0.37 0.35 0.39 Acquisition, integration, and rebranding fees 0.17 0.66 0.56 0.50 0.66 0.29 0.22 0.06 Restructuring and other related charges 0.04 0.18 0.31 0.30 0.49 0.15 0.54 0.18 Impairment charges — — — — — — — 16.11 Other adjustments — — — (0.04) (0.03) 0.01 — — Income tax effect (0.14) (0.89) (0.57) (0.73) (0.46) (0.32) (0.44) (1.18) Effect of participating securities 0.01 — — — — — — — Effect of anti-dilutive securities — 0.04 0.01 0.02 0.01 0.02 — — Non-GAAP Diluted earnings per common share $ 0.74 $ 1.51 $ 1.36 $ 1.44 $ 1.32 $ 1.24 $ 0.30 $ 0.30 Shares used in diluted earnings per common share calculation: GAAP 33,534 39,281 39,314 39,089 39,239 39,584 39,784 40,025 non-GAAP 33,534 39,920 39,712 39,523 39,523 39,664 39,870 40,235 1 Represents the impact of fair value purchase accounting adjustments related to deferred revenue recorded in connection with the acquisition of Polycom on July 2, 2018. The Company’s deferred revenue primarily relates to Service revenue associated with non-cancelable maintenance support on hardware devices which are typically billed in advance and recognized ratably over the contract term as those services are delivered. This adjustment represents the amount of additional revenue that would have been recognized during the period absent the write-down to fair value required under purchase accounting guidelines. 2 Represents the amortization of purchased intangible assets recorded in connection with the acquisition of Polycom on July 2, 2018.

PLANTRONICS, INC. UNAUDITED RECONCILIATIONS OF GAAP OPERATING INCOME TO ADJUSTED EBITDA ($ in thousands) UNAUDITED CONSOLIDATED STATEMENTS OF OPERATIONS DATA Twelve Months Three Months Ended Ended September December September December June 30, 29, 29, March 30, June 29, 28, 28, March 28, March 28, 2018 2018 2018 2019 2019 2019 2019 2020 2020 GAAP Net Income 14,471 (86,709) (41,734) $ (21,589) $ (44,871) $ (25,910) $ (78,483) $ (662,820) $ (812,084) Tax provision 847 (21,550) (7,880) (21,548) (7,577) (4,122) (19,708) (37,995) (69,402) Interest Expense 7,327 23,893 25,032 26,748 23,932 23,797 22,533 22,378 92,640 Other Income and Expense (1,996) (1,610) (125) (2,870) (333) 625 (967) 562 (113) Deferred revenue purchase accounting1 — 36,585 28,923 19,316 12,159 8,524 7,131 6,138 33,952 Inventory valuation adjustment — 30,395 — — — — — — — Acquisition, integration, and rebranding fees 5,803 26,253 22,274 19,515 25,890 11,329 8,677 2,321 48,217 Consumer optimization — — — — — — 10,415 — 10,415 Stock-based compensation 8,150 10,840 11,719 11,225 12,904 14,693 13,902 15,596 57,095 Restructuring and other related charges 1,320 7,261 12,130 11,983 19,525 5,847 21,724 7,080 54,176 Impairment charges — — — — — — — 648,231 648,231 Other adjustments — — — 1,005 (1,162) 542 — 419 (201) Depreciation and amortization 5,248 82,398 55,117 58,606 57,698 57,376 57,556 57,632 230,262 Adjusted EBITDA $ 41,170 $ 107,756 $ 105,456 $ 102,391 $ 98,165 $ 92,701 $ 42,780 $ 59,542 $ 293,188 1 Represents the impact of fair value purchase accounting adjustments related to deferred revenue recorded in connection with the acquisition of Polycom on July 2, 2018. The Company’s deferred revenue primarily relates to Service revenue associated with non-cancelable maintenance support on hardware devices which are typically billed in advance and recognized ratably over the contract term as those services are delivered. This adjustment represents the amount of additional revenue that would have been recognized during the period absent the write-down to fair value required under purchase accounting guidelines.
