Attached files
| file | filename |
|---|---|
| EX-32.1 - EXHIBIT 32.1 - PLANTRONICS INC /CA/ | q218ex321.htm |
| EX-31.2 - EXHIBIT 31.2 - PLANTRONICS INC /CA/ | q218ex312.htm |
| EX-31.1 - EXHIBIT 31.1 - PLANTRONICS INC /CA/ | q218ex311.htm |
| EX-10.4 - EXHIBIT 10.4 - PLANTRONICS INC /CA/ | a104jlemploymentagreement.htm |
| EX-10.1 - EXHIBIT 10.1 - PLANTRONICS INC /CA/ | a101dhseveranceagreement.htm |
UNITED STATES
SECURITIES AND EXCHANGE COMMISSION
Washington, D.C. 20549
FORM 10-Q
(Mark One)
x | QUARTERLY REPORT PURSUANT TO SECTION 13 OR 15(d) OF THE SECURITIES EXCHANGE ACT OF 1934 |
For the quarterly period ended September 30, 2017
or
o | TRANSITION REPORT PURSUANT TO SECTION 13 OR 15(d) OF THE SECURITIES EXCHANGE ACT OF 1934 |
For the transition period from ________to _________
Commission File Number: 001-12696
Plantronics, Inc.
(Exact name of registrant as specified in its charter)
Delaware | 77-0207692 |
(State or other jurisdiction of incorporation or organization) | (I.R.S. Employer Identification No.) |
345 Encinal Street
Santa Cruz, California 95060
(Address of principal executive offices)
(Zip Code)
(831) 426-5858
(Registrant's telephone number, including area code)
Indicate by check mark whether the registrant (1) has filed all reports required to be filed by Section 13 or 15(d) of the Securities Exchange Act of 1934 during the preceding 12 months (or for such shorter period that the registrant was required to file such reports), and (2) has been subject to such filing requirements for the past 90 days. Yes x No o
Indicate by check mark whether the registrant has submitted electronically and posted on its corporate Web site, if any, every Interactive Data File required to be submitted and posted pursuant to Rule 405 of Regulation S-T (§232.405 of this chapter) during the preceding 12 months (or for such shorter period that the registrant was required to submit and post such files). Yes x No o
Indicate by check mark whether the registrant is a large accelerated filer, an accelerated filer, a non-accelerated filer, a smaller reporting company or an emerging growth company. See the definitions of “large accelerated filer,” “accelerated filer,” “smaller reporting company” and "emerging growth company" in Rule 12b-2 of the Exchange Act.
Large accelerated filer x | Accelerated filer o | Non-accelerated filer o | Smaller reporting company o | Emerging growth company o |
(Do not check if a smaller reporting company) | ||||
If an emerging growth company, indicate by check mark if the registrant has elected not to use the extended transition period for complying with any new or revised financial accounting standards provided pursuant to Section 13(a) of the Exchange Act. o
Indicate by check mark whether the registrant is a shell company (as defined in Rule 12b-2 of the Exchange Act). Yes o No x
As of October 27, 2017, 33,066,132 shares of the registrant's common stock were outstanding.
1

Plantronics, Inc.
FORM 10-Q
TABLE OF CONTENTS
PART I. FINANCIAL INFORMATION | Page No. |
PART II. OTHER INFORMATION | |
Plantronics® and Simply Smarter Communications® are trademarks or registered trademarks of Plantronics, Inc.
DECT™ is a trademark of ETSI registered for the benefit of its members in France and other jurisdictions.
The Bluetooth name and the Bluetooth® trademarks are owned by Bluetooth SIG, Inc. and are used by Plantronics, Inc. under license. All other trademarks are the property of their respective owners.
2
Part I -- FINANCIAL INFORMATION
Management’s Discussion and Analysis of Financial Condition and Results of Operations
CERTAIN FORWARD-LOOKING INFORMATION:
This Quarterly Report on Form 10-Q contains forward-looking statements within the meaning of Section 27A of the Securities Act of 1933 ("Securities Act") and Section 21E of the Securities Exchange Act of 1934 ("Exchange Act"). Forward-looking statements may generally be identified by the use of such words as "anticipate," "believe," “could,” "expect," "intend," “may,” "plan," "potential," "shall," "will," “would,” or variations of such words and similar expressions, or the negative of these terms. Specific forward-looking statements contained within this Form 10-Q include, but are not limited to, statements regarding (i) our beliefs regarding the Enterprise market, market dynamics and customer behavior as well as our position in the market, (ii) our beliefs regarding the Consumer market, our new product introductions and the expected effect of such introductions, (iii) our belief that our "as-a-service" offerings will benefit our growth long-term but their contribution will not be material in the near term, (iv) our intention to provide customer data insight through software and service solutions, (v) the Unified Communications ("UC") market, including adoption of UC products, our position, and timing and growth expectations in this market, (vi) our plans regarding our "as a service" offerings including sales and marketing efforts, (vii) our intentions regarding investments in long-term growth opportunities and our core research and development efforts, in particular in the UC market, (viii) our intentions regarding the focus of our sales, marketing and customer services and support teams on UC, (ix) the future of UC technologies, including the transition of businesses to UC-supported systems and the effects on headset adoption and use, enterprises that adopt UC and our revenue opportunity and profit growth, (x) our expenses, including research, development and engineering expenses and selling, general and administrative expenses, (xi) fluctuations in our cash provided by operating activities as a result of various factors, including fluctuations in revenues and operating expenses, timing of product shipments, accounts receivable collections, inventory and supply chain management, and the timing and amount of taxes and other payments, (xii) our future tax rate and payments related to unrecognized tax benefits, (xiii) our anticipated range of capital expenditures for the remainder of Fiscal Year 2018 and the sufficiency of our cash, cash equivalents, and cash from operations to sustain future operations and discretionary cash requirements, (xiv) our ability to pay future stockholder dividends, (xv) our planned investment of and need for our foreign cash and our ability to repatriate that cash, (xvi) our ability to draw funds on our credit facility as needed, (xvii) future fluctuations in our cash provided by operating activities, (xvii) the sufficiency of our capital resources to fund operations, as well as other statements regarding our future operations, financial condition and prospects, and business strategies. Such forward-looking statements are based on current expectations and assumptions and are subject to risks and uncertainties that may cause actual results to differ materially from the forward-looking statements. Factors that could cause actual results and events to differ materially from such forward-looking statements are included, but not limited to, those discussed in this Quarterly Report on Form 10-Q; in Part I, "Item 1A. Risk Factors" of our Annual Report on Form 10-K for the fiscal year ended March 31, 2017, filed with the Securities and Exchange Commission (“SEC”) on May 10, 2017; and other documents we have filed with the SEC. We undertake no obligation to update or revise publicly any forward-looking statements, whether as a result of new information, future events, or otherwise, except as required by applicable law. Given these risks and uncertainties, readers are cautioned not to place undue reliance on such forward-looking statements.
OVERVIEW
We are a leading designer, manufacturer, and marketer of lightweight communications headsets, telephone headset systems, other communication endpoints, and accessories for the worldwide business and consumer markets under the Plantronics brand. Our major product categories are Enterprise, which includes headsets optimized for Unified Communications (“UC”), other corded and cordless communication headsets, audio processors, and telephone systems; and Consumer, which includes Bluetooth and corded products for mobile device applications and personal computer gaming headsets. Until July 1, 2017, we also offered specialty products marketed for hearing impaired individuals under our Clarity brand, which was included in our Consumer product category.
We ship our products to approximately 80 countries through a network of distributors, retailers, resellers, wireless carriers, original equipment manufacturers, and telephony service providers. We have well-developed distribution channels in North America, Europe, and in some parts of the Asia Pacific region where use of our products is widespread.
3
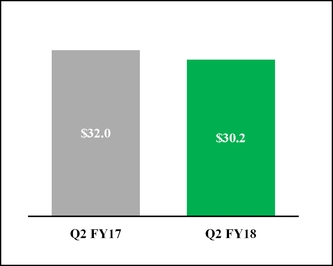
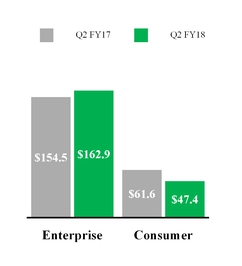
Net Revenues (in millions) | Operating Income (in millions) |

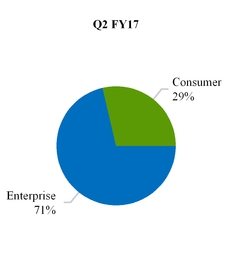
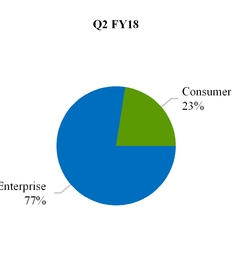
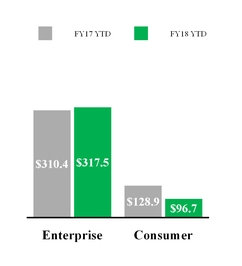
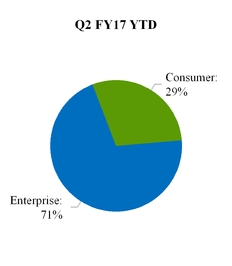
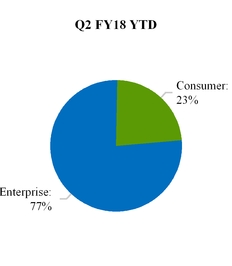
Compared to the second quarter of Fiscal Year 2017, net revenues decreased 2.7% to $210.3 million. The decrease in net revenues was driven by lower revenues within our Consumer product category, which declined 23.1%, or $14.2 million, from the year ago period. Of the declines in Consumer, $3.5 million related to the divestiture of Clarity in the first quarter of Fiscal Year 2018. These declines were partially offset by higher revenues within our Enterprise product category, which grew 5.4%, or $8.4 million from the year ago period.
Operating income for the second quarter of Fiscal Year 2018 was $30.2 million and 14.3% of net revenue, compared to $32.0 million and 14.8% of net revenue in the prior year period. The divestiture of Clarity had a negligible impact on operating income for the second quarter of Fiscal Year 2018, and we expect the impact to be negligible for the full Fiscal Year 2018.
Net income for the second quarter of Fiscal Year 2018 decreased 2.5% to $20.0 million, representing 9.5% of our net revenues, compared to $20.5 million and 9.5% in the year ago period.
Our primary focus, long-term growth opportunities, strategic initiatives, and majority of our revenue and profits are in our Enterprise business. Within the Enterprise product category, we anticipate the key driver of long-term revenue growth and profit opportunity will continue to be UC audio solutions. We believe enterprises are increasing adoption of UC systems to reduce costs, improve collaboration, and migrate technology from obsolete legacy systems. We expect growth of UC will increase overall headset adoption in enterprise environments, and we believe most of the growth in our Enterprise product category over the next three years will come from headsets designed for UC. As such, UC remains the central focus of our sales, marketing, and support functions, and we will continue investing in key strategic alliances and integrations with major UC vendors.
Our Enterprise revenues increased in the second quarter of Fiscal Year 2018 when compared to the same prior year period, resulting from strong growth in UC product sales, which is in line with our long-term growth expectations, partially offset by declines in sales of non-UC corded and cordless products. With respect to non-UC products, we have experienced a decline in headset sales normally associated with large telephony upgrade and implementation projects, most significantly in North America. We believe that this decline has been driven by a temporary pause in corporate purchasing decision cycles as customers evaluate new offerings and competitive shifts in telephony infrastructure providers. We believe our competitive and strategic position in Enterprise remains strong, and do not expect this disruption to persist in the long term. However, we are not able to predict what impact these conditions will have on our revenue in the short term or when these conditions will change.
Revenues from our Consumer products are seasonal and typically strongest in our third fiscal quarter, which includes the majority of the holiday shopping season. Additionally, other factors directly impact our Consumer product category performance, such as the market acceptance of new product introductions, product life-cycles (including the introduction and pace of adoption of new technology), consumer preferences and the competitive retail environment, changes in consumer confidence and other macroeconomic factors, and fluctuations in foreign currency rates relative to the U.S. Dollar ("USD"). In addition, the timing or non-recurrence of retailer placements can cause volatility in quarter-to-quarter results.
4
When compared to the same prior year period, the decline in Consumer revenues in the second quarter of Fiscal Year 2018 was primarily attributable to a decline in sales of our stereo Bluetooth products driven by the aging of our portfolio. Additionally, the divestiture of our Clarity line of business, and continued weakness in the mono Bluetooth market further impacted our Consumer results. We are currently refreshing our Consumer portfolio, having recently launched the BackBeat 300 and 500, refreshed BackBeat FIT Training and Boost editions, and RIG 800 series.
We continue to invest in new ideas and technology to create additional growth opportunities, such as our software-as-a-service ("SaaS") data insights offering introduced in Fiscal Year 2017, and our Habitat Soundscaping intelligent acoustic management solution launched in July 2017. While we anticipate these investments will benefit our growth in the long term, their contribution will not be material in the near term.
We remain cautious about the macroeconomic environment, based primarily on uncertainty around trade and fiscal policy in the U.S. and broader economic uncertainty in many parts of Europe and Asia Pacific. We will continue to monitor our expenditures and prioritize those that further our strategic long-term growth opportunities, such as innovative product development. UC and SaaS are the central focus of our sales force, marketing group, and other customer service and support teams as we continue investing in key strategic alliances and integrations with major UC vendors, and work to expand the market opportunity for our SaaS offering.
RESULTS OF OPERATIONS
The following graphs display net revenues by product category for the three and six months ended September 30, 2016 and 2017:
Net Revenues (in millions) Revenue by Product Category (percent)
5
Net revenues decreased in the three and six months ended September 30, 2017 compared to the prior year periods due primarily to lower revenues within our Consumer product category, partially offset by increases in our Enterprise product revenues driven by UC revenues.
Geographic Information (in millions) Revenue by Region (percent)
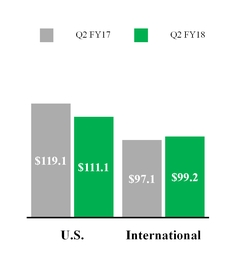
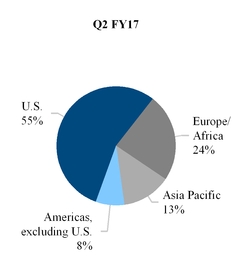
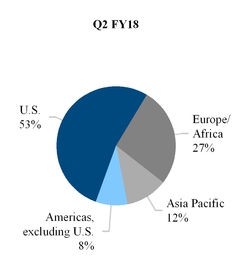
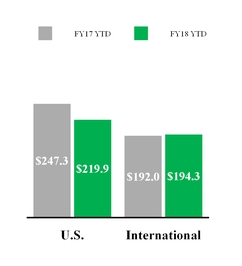
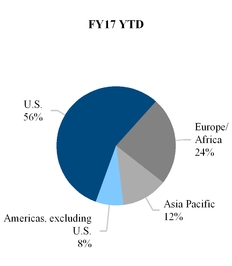
Compared to the prior year periods, U.S. net revenues decreased in the three and six months ended September 30, 2017 due primarily to a decline in Consumer product sales volumes, driven by the aging of our portfolio, an overall continuing decline in the mono Bluetooth market, the divestiture of our Clarity business, and the non-recurrence of certain royalty payments received in the year ago periods.
We typically generate approximately 40% to 45% of our revenues from international sales; therefore, the impact of currency movements on our net revenues can be significant. In addition, in some international locations where sales are denominated in USD, we also face additional pricing pressure, discounting, and lost business when a stronger USD negatively impacts buying decisions.
Changes in foreign exchange rates did not have a material impact on revenues for the three months ended September 30, 2017 compared to the same prior year quarter. For the six months ended September 30, 2017, changes in foreign exchange rates had a $2.7 million favorable impact on revenues, net of the effects of our hedging program, compared to the same prior year period.
6
International net revenues for the three and six months ended September 30, 2017 increased slightly from the same year ago periods due to growth in our Enterprise category, driven primarily by UC product sales and almost entirely offset by sales declines in our Consumer category.
COST OF REVENUES AND GROSS PROFIT
Cost of revenues consists primarily of direct manufacturing and contract manufacturer costs, warranty, freight, depreciation, and duties expense, charges for excess and obsolete inventory, royalties, and overhead expenses.
Three Months Ended | Six Months Ended | |||||||||||||||||||||||||||||
September 30, | Increase | September 30, | Increase | |||||||||||||||||||||||||||
(in thousands, except percentages) | 2016 | 2017 | (Decrease) | 2016 | 2017 | (Decrease) | ||||||||||||||||||||||||
Net revenues | $ | 216,183 | $ | 210,300 | $ | (5,883 | ) | (2.7 | )% | $ | 439,289 | $ | 414,226 | $ | (25,063 | ) | (5.7 | )% | ||||||||||||
Cost of revenues | 105,737 | 102,668 | (3,069 | ) | (2.9 | )% | 215,770 | 203,311 | (12,459 | ) | (5.8 | )% | ||||||||||||||||||
Gross profit | $ | 110,446 | $ | 107,632 | $ | (2,814 | ) | (2.5 | )% | $ | 223,519 | $ | 210,915 | $ | (12,604 | ) | (5.6 | )% | ||||||||||||
Gross profit % | 51.1 | % | 51.2 | % | 50.9 | % | 50.9 | % | ||||||||||||||||||||||
Compared to the same prior year periods, gross profit as a percentage of net revenues was flat in the three and six months ended September 30, 2017, due primarily to a product mix shift away from Consumer and product cost reductions, partially offset by an increase in channel partner incentives and the non-recurrence of certain royalty payments received in the year ago periods. Gross profit for the six months ended September 30, 2017 was also negatively impacted by the loss recorded on the sale of our Clarity division and the write-off of an indirect tax asset in our Brazilian entity, both of which are discussed in detail in Note 8, Restructuring and other related charges (credits), in the accompanying footnotes to the condensed consolidated financial statements.
There are significant variances in gross profit percentages between our higher and lower margin products; therefore, small variations in product mix, which can be difficult to predict, can have a significant impact on gross profit as a percentage of net revenues. Gross profit percentages may also vary based on distribution channel, return rates, and other factors.
RESEARCH, DEVELOPMENT, AND ENGINEERING
Research, development, and engineering costs are expensed as incurred and consist primarily of compensation costs, outside services, including legal fees associated with protecting our intellectual property, expensed materials, travel expenses, depreciation, and overhead expenses.
Three Months Ended | Six Months Ended | |||||||||||||||||||||||||||||
September 30, | Increase | September 30, | Increase | |||||||||||||||||||||||||||
(in thousands, except percentages) | 2016 | 2017 | (Decrease) | 2016 | 2017 | (Decrease) | ||||||||||||||||||||||||
Research, development, and engineering | $ | 22,379 | $ | 19,932 | $ | (2,447 | ) | (10.9 | )% | $ | 44,723 | $ | 41,145 | $ | (3,578 | ) | (8.0 | )% | ||||||||||||
% of net revenues | 10.4 | % | 9.5 | % | 10.2 | % | 9.9 | % | ||||||||||||||||||||||
During the three and six months ended September 30, 2017, research, development, and engineering expenses declined when compared to the prior year periods due primarily to lower compensation expenses, driven primarily by reduced funding of our variable compensation plans and cost reductions from our restructuring actions initiated in prior periods.
SELLING, GENERAL, AND ADMINISTRATIVE
Selling, general, and administrative expenses consist primarily of compensation costs, marketing costs, travel expenses, litigation and professional service fees, and overhead expenses.
Three Months Ended | Six Months Ended | |||||||||||||||||||||||||||||
September 30, | Increase | September 30, | Increase | |||||||||||||||||||||||||||
(in thousands, except percentages) | 2016 | 2017 | (Decrease) | 2016 | 2017 | (Decrease) | ||||||||||||||||||||||||
Selling, general, and administrative | $ | 56,875 | $ | 57,696 | $ | 821 | 1.4 | % | $ | 112,662 | $ | 113,929 | $ | 1,267 | 1.1 | % | ||||||||||||||
% of net revenues | 26.3 | % | 27.4 | % | 25.6 | % | 27.5 | % | ||||||||||||||||||||||
7
Compared to the same year ago period, selling, general, and administrative expenses increased in the three and six months ended September 30, 2017 due primarily to increased legal fees related to our litigation with GN Netcom. This litigation was resolved in October 2017 in favor of the Company on all counts, as discussed further in Note 6, Commitments and Contingencies, in the accompanying footnotes to the condensed consolidated financial statements. As such, we expect legal fees to decrease in future quarters. This increase was partially offset by lower compensation expenses, driven primarily by reduced funding of our variable compensation plans, lower executive transition costs, cost savings from cost control initiatives and prior period restructuring actions.
(GAIN) LOSS, NET FROM LITIGATION SETTLEMENTS
Three Months Ended | Six Months Ended | |||||||||||||||||||||||||||||
September 30, | Increase | September 30, | Increase | |||||||||||||||||||||||||||
(in thousands, except percentages) | 2016 | 2017 | (Decrease) | 2016 | 2017 | (Decrease) | ||||||||||||||||||||||||
(Gain) loss, net from litigation settlements | $ | (349 | ) | $ | (104 | ) | $ | 245 | (70.2 | )% | $ | 4,390 | $ | (280 | ) | $ | (4,670 | ) | (106.4 | )% | ||||||||||
% of net revenues | 0.2 | % | — | % | 1.0 | % | (0.1 | )% | ||||||||||||||||||||||
We recognized immaterial gains from litigation in the three months ended September 30, 2016 and 2017. In the six months ended September 30, 2017, we recognized immaterial gains compared to the prior year periods when we recognized a $4.9 million charge related to discovery sanctions in the GN Netcom litigation.
RESTRUCTURING AND OTHER RELATED CHARGES (CREDITS)
Three Months Ended | Six Months Ended | |||||||||||||||||||||||||||||
September 30, | Increase | September 30, | Increase | |||||||||||||||||||||||||||
(in thousands, except percentages) | 2016 | 2017 | (Decrease) | 2016 | 2017 | (Decrease) | ||||||||||||||||||||||||
Restructuring and other related charges (credits) | $ | (415 | ) | $ | (51 | ) | $ | 364 | (87.7 | )% | $ | (1,463 | ) | $ | 2,522 | $ | 3,985 | (272.4 | )% | |||||||||||
% of net revenues | 0.2 | % | — | % | (0.3 | )% | 0.6 | % | ||||||||||||||||||||||
In both the three months ended September 30, 2016 and 2017, we recognized net favorable adjustments resulting from changes to the estimates related to restructuring actions recorded in prior periods.
Compared to the prior year period, restructuring and other related charges (credits) increased in the six months ended September 30, 2017, due to restructuring actions initiated during the first quarter of Fiscal Year 2018. In the prior year period we recorded a net favorable adjustment resulting from changes to the estimates related to our restructuring actions recorded in Fiscal Year 2016.
For more information regarding restructuring activities, refer to Note 8, Restructuring and other related charges (credits), of the accompanying notes to condensed consolidated financial statements.
INTEREST EXPENSE
Interest expense for the three and six months ended September 30, 2016 and 2017 was $7.3 million and $14.6 million, respectively. These costs are primarily related to our 5.50% Senior Notes and include an immaterial amount in amortization of debt issuance costs.
OTHER NON-OPERATING INCOME AND (EXPENSE), NET
Three Months Ended | Six Months Ended | |||||||||||||||||||||||||||||
September 30, | Increase | September 30, | Increase | |||||||||||||||||||||||||||
(in thousands, except percentages) | 2016 | 2017 | (Decrease) | 2016 | 2017 | (Decrease) | ||||||||||||||||||||||||
Other non-operating income and (expense), net | $ | 1,340 | $ | 1,826 | $ | 486 | 36.3 | % | $ | 3,692 | $ | 2,740 | $ | (952 | ) | (25.8 | )% | |||||||||||||
% of net revenues | 0.6 | % | 0.9 | % | 0.8 | % | 0.7 | % | ||||||||||||||||||||||
Other non-operating income and (expense), net for the three months ended September 30, 2017 increased primarily due to an immaterial increase in interest income.
Other non-operating income and (expense), net for the six months ended September 30, 2017 decreased primarily due to immaterial net foreign currency losses compared to immaterial net foreign currency gains in the prior year.
8
INCOME TAX EXPENSE
Three Months Ended | Six Months Ended | |||||||||||||||||||||||||||||
September 30, | Increase | September 30, | Increase | |||||||||||||||||||||||||||
(in thousands except percentages) | 2016 | 2017 | (Decrease) | 2016 | 2017 | (Decrease) | ||||||||||||||||||||||||
Income before income taxes | $ | 26,039 | $ | 24,725 | $ | (1,314 | ) | (5.0 | )% | $ | 52,354 | $ | 41,776 | $ | (10,578 | ) | (20.2 | )% | ||||||||||||
Income tax expense | 5,565 | 4,772 | (793 | ) | (14.2 | )% | 11,493 | 2,995 | (8,498 | ) | (73.9 | )% | ||||||||||||||||||
Net income | $ | 20,474 | $ | 19,953 | $ | (521 | ) | (2.5 | )% | $ | 40,861 | $ | 38,781 | $ | (2,080 | ) | (5.1 | )% | ||||||||||||
Effective tax rate | 21.4 | % | 19.3 | % | 22.0 | % | 7.2 | % | ||||||||||||||||||||||
The decrease in the effective tax rate for the three and six months ended September 30, 2017 was due primarily to a shift in geographic mix of taxable income from higher tax jurisdictions to lower tax jurisdictions. The effective tax rate for the six months ended September 30, 2017 further decreased due to the adoption of new accounting guidance related to stock-based compensation.
We adopted the new stock-based compensation accounting guidance effective the beginning of Fiscal Year 2018. Excess tax benefits associated with employee equity plans were previously recorded in additional paid-in capital and the adoption of this guidance resulted in a reduction to our effective tax rate by 0.3 and 4.8 percentage points for the three and six months ended September 30, 2017, respectively. The amount of excess tax benefits or deficiencies will fluctuate from period-to-period based on the price of our stock, the volume of share-based instruments settled or vested, and the value assigned to employee equity awards under U.S. GAAP.
We recorded a correction to the geographic mix of income during the six months ended September 30, 2017 related to Fiscal Year 2017, which reduced income in a high tax jurisdiction and increased income in a low tax jurisdiction. This correcting adjustment had no impact on the three months ended September 30, 2017, but resulted in a reduction to our effective tax rate by 6.6 percentage points for the six months ended September 30, 2017 as compared to the prior year period. For additional details regarding this correction Refer to Note 1, Basis of Presentation, in the accompanying footnotes to the condensed consolidated financial statements.
We are subject to taxation in various foreign and state jurisdictions, including the U.S. Our Fiscal Year 2016 federal income tax return is currently under examination by the Internal Revenue Service. Foreign income tax matters for material tax jurisdictions have been concluded for tax years prior to Fiscal Year 2012.
FINANCIAL CONDITION
Operating Cash Flow (in millions) | Investing Cash Flow (in millions) | Financing Cash Flow (in millions) |
Our primary source of liquidity is cash provided by operating activities and, on occasion, financing obtained from capital markets and other financing sources, such as our revolving credit line. We believe that internally generated cash flows are generally sufficient to support our business operations, capital expenditures, restructuring activities, principal and interest payment of debt, income tax payments and the payment of stockholder dividends, in addition to investments and share repurchases. We expect that cash provided by operating activities will fluctuate in future periods as a result of a number of factors, including fluctuations in our revenues and operating expenses, the timing of product shipments during the quarter, accounts receivable collections, inventory and supply chain management, and the timing and amount of tax, interest, annual bonus, and other payments.
9
Operating Activities
Compared to the same year ago period, net cash provided by operating activities during the six months ended September 30, 2017 decreased primarily as a result of higher payouts during the period related to Fiscal Year 2017 variable compensation than payouts during the prior year period for Fiscal Year 2016 variable compensation, due to better achievements against Corporate targets in Fiscal Year 2017. In addition, we are in a higher prepaid income tax position than in the same year ago period, resulting primarily from the timing of tax payment remittances.
Investing Activities
Compared to the same year ago period, cash used for investing activities decreased during the six months ended September 30, 2017, due to a lower level of cash paid for capital expenditures and a net decrease in investment purchases, net of proceeds from the sale and maturity of investment securities.
We estimate total capital expenditures for Fiscal Year 2018 will be approximately $17.0 million to $22.0 million. Capital expenditures for the remainder of Fiscal Year 2018 are expected to consist primarily of IT investments, capital investment in our manufacturing capabilities, including tooling for new products, and facilities upgrades.
Financing Activities
Net cash used for financing activities during the six months ended September 30, 2017 increased from the prior year period resulting primarily from an increase in cash used for common stock repurchases due to a lower average stock price, partially offset by higher net proceeds from stock-based compensation plans.
On October 31, 2017, we announced that the Audit Committee of our Board ("the Audit Committee") had declared a cash dividend of $0.15 per share, payable on December 8, 2017 to stockholders of record at the close of business on November 20, 2017. We expect to continue paying a quarterly dividend of $0.15 per share; however, the actual declaration of dividends and the establishment of record and payment dates are subject to final determination by the Audit Committee each quarter after its review of our financial performance and financial position.
Liquidity and Capital Resources
Our primary discretionary cash requirements have historically been for repurchases of our common stock and to fund stockholder dividends. As a result of the issuance of the 5.50% Senior Notes in May 2015, we are required to make interest payments of approximately $13.8 million each November and May through the life of the notes. These payments require use of our domestic cash. For additional details, refer to Note 7, Debt, in the accompanying footnotes to the condensed consolidated financial statements.
At September 30, 2017, we had working capital of $620.3 million, including $500.4 million of cash, cash equivalents, and short-term investments, compared with working capital of $581.8 million, including $480.1 million of cash, cash equivalents, and short-term investments at March 31, 2017.
Our cash and cash equivalents as of September 30, 2017 consisted of bank deposits with third party financial institutions and Commercial Paper. We monitor bank balances in our operating accounts and adjust the balances as appropriate. Cash balances are held throughout the world, including substantial amounts held outside of the U.S. As of September 30, 2017, of our $500.4 million of cash, cash equivalents, and short-term investments, $26.4 million was held domestically while $474.0 million was held by foreign subsidiaries, approximately 90% of which were based in USD-denominated investments. The costs to repatriate our foreign earnings to the U.S. would be material; however, our intent is to indefinitely reinvest earnings from foreign operations and our current plans do not require us to repatriate earnings from foreign operations to fund our U.S. operations because we generate sufficient domestic operating cash flow and have access to external funding under our revolving credit facility.
Our short and long-term investments are intended to establish a high-quality portfolio that preserves principal and meets liquidity needs. As of September 30, 2017, our investments were composed of Mutual Funds, US Treasury Notes, Government Agency Securities, Commercial Paper, Corporate Bonds, and Certificates of Deposits ("CDs").
10
From time to time, depending on market conditions, our Board has authorized plans under which we may repurchase shares of our common stock in the open market or through privately negotiated transactions. During the six months ended September 30, 2017, we repurchased 841,249 shares of our common stock in the open market as part of these publicly announced repurchase programs. The total cost of these repurchases was $39.2 million, with an average price of $46.62 per share. In addition, we withheld 202,298 shares with a total value of $10.8 million in satisfaction of employee tax withholding obligations upon the vesting of restricted stock granted under our stock plans.
As of September 30, 2017, there remained 1,028,586 shares authorized for repurchase under the stock repurchase program approved by the Board on July 27, 2017. For more information regarding our stock repurchase programs, refer to Note 10, Common Stock Repurchases, of the accompanying notes to the condensed consolidated financial statements.
In May 2011, we entered into a credit agreement with Wells Fargo Bank, National Association ("the Bank"), which was most recently amended in April 2017 (as amended, the "Credit Agreement"). The Credit Agreement provides for a $100.0 million unsecured revolving credit facility. Revolving loans under the Credit Agreement will bear interest, at our election, at (i) the Bank’s announced prime rate less 1.20% per annum or (ii) a daily one-month LIBOR rate plus 1.40% per annum. Principal, together with all accrued and unpaid interest, on the revolving loans is due and payable on May 9, 2020. We are also obligated to pay a commitment fee of 0.37% per annum on the average daily unused amount of the revolving line of credit, which fee shall be payable quarterly in arrears. We may prepay the loans and terminate the commitments under the Credit Agreement at any time, without premium or penalty, subject to the reimbursement of certain costs. As of September 30, 2017, we had no outstanding borrowings under the line of credit. The line of credit requires us to comply with the following two financial covenant ratios, in each case at each fiscal quarter end and determined on a rolling four-quarter basis:
• | maximum ratio of funded debt to earnings before interest, taxes, depreciation and amortization ("EBITDA") of 3.25:1 (previously 3:1); and |
• | minimum EBITDA coverage ratio, which is calculated as interest payments divided by EBITDA. |
In addition, we and our subsidiaries are required to maintain unrestricted cash, cash equivalents, and marketable securities plus availability under the Credit Agreement at the end of each fiscal quarter of at least $300.0 million. The Credit Agreement contains customary events of default that include, among other things, payment defaults, covenant defaults, cross-defaults with certain other indebtedness, bankruptcy and insolvency defaults, and judgment defaults. The occurrence of an event of default could result in the acceleration of the obligations under the Credit Agreement. As of September 30, 2017, we were in compliance with all ratios and covenants.
During Fiscal Year 2016, we obtained $488.4 million in aggregate principal amount, net of issuance costs, from the issuance of our 5.50% Senior Notes. The Notes mature on May 31, 2023, and bear interest at a rate of 5.50% per annum, payable semi-annually on May 15 and November 15. A portion of the proceeds was used to repay all then-outstanding amounts under our revolving line of credit agreement with Wells Fargo Bank and the remaining proceeds were used primarily for share repurchases.
Our liquidity, capital resources, and results of operations in any period could be affected by repurchases of our common stock, the payment of cash dividends, the exercise of outstanding stock options, restricted stock grants under stock plans, and the issuance of common stock under our Employee Stock Purchase Plan ("ESPP"). We receive cash from the exercise of outstanding stock options under our stock plan and the issuance of shares under our ESPP. However, the resulting increase in the number of outstanding shares from these equity grants and issuances could affect our earnings per share. We cannot predict the timing or amount of proceeds from the sale or exercise of these securities or whether they will be exercised, forfeited, canceled, or will expire.
We believe that our current cash and cash equivalents, short-term investments, cash provided by operations, and the availability of additional funds under the Credit Agreement will be sufficient to fund operations for at least the next 12 months; however, any projections of future financial needs and sources of working capital are subject to uncertainty. Readers are cautioned to review the risks, uncertainties, and assumptions set forth in this Quarterly Report on Form 10-Q, including the section entitled "Certain Forward-Looking Information" and the risk factors set forth in our Annual Report on Form 10-K for the fiscal year ended March 31, 2017, filed with the SEC on May 10, 2017, and other periodic filings with the SEC, any of which could affect our estimates for future financial needs and sources of working capital.
OFF BALANCE SHEET ARRANGEMENTS AND CONTRACTUAL OBLIGATIONS
We have not entered into any transactions with unconsolidated entities giving rise to financial guarantees, subordinated retained interests, derivative instruments, or other contingent arrangements that expose us to material continuing risks, contingent liabilities, or any other obligation under a variable interest in an unconsolidated entity that provides us with financing and liquidity support, market risk, or credit risk support.
11
A substantial portion of the raw materials, components, and subassemblies used in our products are provided by our suppliers on a consignment basis. These consigned inventories are not recorded on our consolidated balance sheet until we take title to the raw materials, components, and subassemblies, which occurs when they are consumed in the production process. Prior to consumption in the production process, our suppliers bear the risk of loss and retain title to the consigned inventory. The terms of the agreements allow us to return parts in excess of maximum order quantities to the suppliers at the supplier’s expense. Returns for other reasons are negotiated with the suppliers on a case-by-case basis and to date have been immaterial. If our suppliers were to discontinue financing consigned inventory, it would require us to make cash outlays and we could incur expenses which, if material, could negatively affect our business and financial results. As of March 31, 2017 and September 30, 2017, we had off-balance sheet consigned inventories of $52.3 million and $52.7 million, respectively.
Unconditional Purchase Obligations
We utilize several contract manufacturers to procure raw materials, components, and subassemblies for our products. We provide these contract manufacturers with demand information that typically covers periods up to 13 weeks, and they use this information to acquire components and build products. We also obtain individual components for our products from a wide variety of individual suppliers. Consistent with industry practice, we acquire components through a combination of purchase orders, supplier contracts, and open orders based on projected demand information. As of September 30, 2017, we had outstanding off-balance sheet third-party manufacturing, component purchase, and other general and administrative commitments of $176.2 million, including off-balance sheet consigned inventories of $52.7 million as discussed above.
Except as described above, there have been no material changes in our contractual obligations as described in our Annual Report on Form 10-K for the fiscal year ended March 31, 2017.
CRITICAL ACCOUNTING ESTIMATES
For a complete description of what we believe to be the critical accounting estimates used in the preparation of our condensed consolidated financial statements, refer to our Annual Report on Form 10-K for the fiscal year ended March 31, 2017, filed with the SEC on May 10, 2017. There have been no changes to our critical accounting estimates during the six months ended September 30, 2017.
Recent Accounting Pronouncements
For more information regarding the Recent Accounting Pronouncements that may impact us, refer to Note 2, Recent Accounting Pronouncements, of the accompanying notes to the condensed consolidated financial statements.
12
Financial Statements.
PLANTRONICS, INC.
CONDENSED CONSOLIDATED BALANCE SHEETS
(in thousands)
(Unaudited)
March 31, 2017 | September 30, 2017 | ||||||
ASSETS | |||||||
Current assets: | |||||||
Cash and cash equivalents | $ | 301,970 | $ | 303,116 | |||
Short-term investments | 178,179 | 197,278 | |||||
Accounts receivable, net | 141,177 | 139,683 | |||||
Inventory, net | 55,456 | 60,999 | |||||
Other current assets | 22,195 | 33,310 | |||||
Total current assets | 698,977 | 734,386 | |||||
Long-term investments | 127,176 | 105,251 | |||||
Property, plant, and equipment, net | 150,307 | 146,830 | |||||
Goodwill and purchased intangibles, net | 15,577 | 15,498 | |||||
Deferred tax and other assets | 25,122 | 20,417 | |||||
Total assets | $ | 1,017,159 | $ | 1,022,382 | |||
LIABILITIES AND STOCKHOLDERS' EQUITY | |||||||
Current liabilities: | |||||||
Accounts payable | $ | 42,885 | $ | 45,619 | |||
Accrued liabilities | 74,285 | 68,434 | |||||
Total current liabilities | 117,170 | 114,053 | |||||
Long term debt, net of issuance costs | 491,059 | 491,784 | |||||
Long-term income taxes payable | 11,729 | 11,997 | |||||
Other long-term liabilities | 15,045 | 16,881 | |||||
Total liabilities | $ | 635,003 | $ | 634,715 | |||
Commitments and contingencies (Note 6) | |||||||
Stockholders' equity: | |||||||
Common stock | $ | 804 | $ | 813 | |||
Additional paid-in capital | 818,777 | 848,729 | |||||
Accumulated other comprehensive income | 4,694 | 1,531 | |||||
Retained earnings | 319,931 | 348,655 | |||||
Total stockholders' equity before treasury stock | 1,144,206 | 1,199,728 | |||||
Less: Treasury stock, at cost | (762,050 | ) | (812,061 | ) | |||
Total stockholders' equity | 382,156 | 387,667 | |||||
Total liabilities and stockholders' equity | $ | 1,017,159 | $ | 1,022,382 | |||
The accompanying notes are an integral part of these condensed consolidated financial statements.
13
PLANTRONICS, INC.
CONDENSED CONSOLIDATED STATEMENTS OF OPERATIONS
(in thousands, except per share data)
(Unaudited)
Three Months Ended September 30, | Six Months Ended September 30, | ||||||||||||||
2016 | 2017 | 2016 | 2017 | ||||||||||||
Net revenues | $ | 216,183 | $ | 210,300 | $ | 439,289 | $ | 414,226 | |||||||
Cost of revenues | 105,737 | 102,668 | 215,770 | 203,311 | |||||||||||
Gross profit | 110,446 | 107,632 | 223,519 | 210,915 | |||||||||||
Operating expenses: | |||||||||||||||
Research, development, and engineering | 22,379 | 19,932 | 44,723 | 41,145 | |||||||||||
Selling, general, and administrative | 56,875 | 57,696 | 112,662 | 113,929 | |||||||||||
(Gain) loss, net from litigation settlements | (349 | ) | (104 | ) | 4,390 | (280 | ) | ||||||||
Restructuring and other related charges (credits) | (415 | ) | (51 | ) | (1,463 | ) | 2,522 | ||||||||
Total operating expenses | 78,490 | 77,473 | 160,312 | 157,316 | |||||||||||
Operating income | 31,956 | 30,159 | 63,207 | 53,599 | |||||||||||
Interest expense | (7,257 | ) | (7,260 | ) | (14,545 | ) | (14,563 | ) | |||||||
Other non-operating income and (expense), net | 1,340 | 1,826 | 3,692 | 2,740 | |||||||||||
Income before income taxes | 26,039 | 24,725 | 52,354 | 41,776 | |||||||||||
Income tax expense | 5,565 | 4,772 | 11,493 | 2,995 | |||||||||||
Net income | $ | 20,474 | $ | 19,953 | $ | 40,861 | $ | 38,781 | |||||||
Earnings per common share: | |||||||||||||||
Basic | $ | 0.63 | $ | 0.59 | $ | 1.27 | $ | 1.16 | |||||||
Diluted | $ | 0.63 | $ | 0.59 | $ | 1.24 | $ | 1.14 | |||||||
Shares used in computing earnings per common share: | |||||||||||||||
Basic | 32,281 | 32,570 | 32,269 | 32,538 | |||||||||||
Diluted | 32,726 | 32,809 | 32,865 | 33,111 | |||||||||||
Cash dividends declared per common share | $ | 0.15 | $ | 0.15 | $ | 0.30 | $ | 0.30 | |||||||
The accompanying notes are an integral part of these condensed consolidated financial statements.
14
PLANTRONICS, INC.
CONDENSED CONSOLIDATED STATEMENTS OF COMPREHENSIVE INCOME
(in thousands)
(Unaudited)
Three Months Ended September 30, | Six Months Ended September 30, | ||||||||||||||
2016 | 2017 | 2016 | 2017 | ||||||||||||
Net income | $ | 20,474 | $ | 19,953 | $ | 40,861 | $ | 38,781 | |||||||
Other comprehensive income (loss): | |||||||||||||||
Foreign currency translation adjustments | 4 | 57 | (250 | ) | 257 | ||||||||||
Unrealized gains (losses) on cash flow hedges: | |||||||||||||||
Unrealized cash flow hedge gains (losses) arising during the period | (650 | ) | (2,302 | ) | 304 | (4,647 | ) | ||||||||
Net (gains) losses reclassified into income for revenue hedges | (825 | ) | 1,131 | (985 | ) | 1,149 | |||||||||
Net (gains) losses reclassified into income for cost of revenue hedges | 589 | (174 | ) | 1,316 | (132 | ) | |||||||||
Net unrealized gains (losses) on cash flow hedges | (886 | ) | (1,345 | ) | 635 | (3,630 | ) | ||||||||
Unrealized gains (losses) on investments: | |||||||||||||||
Unrealized holding gains (losses) during the period | (272 | ) | 133 | 42 | 209 | ||||||||||
Aggregate income tax benefit (expense) of the above items | 98 | (19 | ) | (26 | ) | 1 | |||||||||
Other comprehensive income (loss) | (1,056 | ) | (1,174 | ) | 401 | (3,163 | ) | ||||||||
Comprehensive income | $ | 19,418 | $ | 18,779 | $ | 41,262 | $ | 35,618 | |||||||
The accompanying notes are an integral part of these condensed consolidated financial statements.
15
PLANTRONICS, INC.
CONDENSED CONSOLIDATED STATEMENTS OF CASH FLOWS
(in thousands)
(Unaudited)
Six Months Ended | |||||||
September 30, | |||||||
2016 | 2017 | ||||||
CASH FLOWS FROM OPERATING ACTIVITIES | |||||||
Net income | $ | 40,861 | $ | 38,781 | |||
Adjustments to reconcile net income to net cash provided by operating activities: | |||||||
Depreciation and amortization | 10,265 | 10,743 | |||||
Amortization of debt issuance costs | 725 | 725 | |||||
Stock-based compensation | 16,316 | 18,018 | |||||
Deferred income taxes | 2,499 | 4,384 | |||||
Provision for excess and obsolete inventories | 1,674 | 900 | |||||
Restructuring and related charges (credits) | (1,463 | ) | 2,522 | ||||
Cash payments for restructuring charges | (3,736 | ) | (2,429 | ) | |||
Other operating activities | (849 | ) | (1,141 | ) | |||
Changes in assets and liabilities: | |||||||
Accounts receivable, net | (8,366 | ) | 1,246 | ||||
Inventory, net | (1,102 | ) | (5,844 | ) | |||
Current and other assets | (2,331 | ) | (4,539 | ) | |||
Accounts payable | 4,120 | 3,205 | |||||
Accrued liabilities | 10,444 | (9,388 | ) | ||||
Income taxes | (2,305 | ) | (7,890 | ) | |||
Cash provided by operating activities | 66,752 | 49,293 | |||||
CASH FLOWS FROM INVESTING ACTIVITIES | |||||||
Proceeds from sales of investments | 125,504 | 30,895 | |||||
Proceeds from maturities of investments | 63,853 | 106,661 | |||||
Purchase of investments | (192,349 | ) | (133,949 | ) | |||
Capital expenditures | (14,191 | ) | (6,752 | ) | |||
Cash used for investing activities | (17,183 | ) | (3,145 | ) | |||
CASH FLOWS FROM FINANCING ACTIVITIES | |||||||
Repurchase of common stock | (26,828 | ) | (39,222 | ) | |||
Employees' tax withheld and paid for restricted stock and restricted stock units | (9,123 | ) | (10,789 | ) | |||
Proceeds from issuances under stock-based compensation plans | 5,752 | 11,950 | |||||
Payment of cash dividends | (9,971 | ) | (10,057 | ) | |||
Other financing activity | 761 | — | |||||
Cash used for financing activities | (39,409 | ) | (48,118 | ) | |||
Effect of exchange rate changes on cash and cash equivalents | (971 | ) | 3,116 | ||||
Net increase in cash and cash equivalents | 9,189 | 1,146 | |||||
Cash and cash equivalents at beginning of period | 235,266 | 301,970 | |||||
Cash and cash equivalents at end of period | $ | 244,455 | $ | 303,116 | |||
SUPPLEMENTAL NON-CASH DISCLOSURES | |||||||
Accounts payable for purchases of property, plant, and equipment | $ | 2,718 | $ | 3,407 | |||
The accompanying notes are an integral part of these condensed consolidated financial statements.
16
PLANTRONICS, INC.
NOTES TO CONDENSED CONSOLIDATED FINANCIAL STATEMENTS
(Unaudited)
1. BASIS OF PRESENTATION
In the opinion of management, the accompanying unaudited condensed consolidated financial statements ("financial statements") of Plantronics, Inc. ("Plantronics" or "the Company") have been prepared on a basis materially consistent with the Company's March 31, 2017 audited consolidated financial statements and include all adjustments, consisting of normal recurring adjustments, necessary to fairly state the information set forth herein. Certain information and footnote disclosures normally included in financial statements prepared pursuant to the rules and regulations of the Securities and Exchange Commission ("SEC") applicable to interim financial information and in accordance with accounting principles generally accepted in the United States of America ("U.S. GAAP") have been condensed or omitted pursuant to such rules and regulations. The financial statements should be read in conjunction with the audited consolidated financial statements and notes thereto included in the Company's Annual Report on Form 10-K for the fiscal year ended March 31, 2017, which was filed with the SEC on May 10, 2017. The results of operations for the interim period ended September 30, 2017 are not necessarily indicative of the results to be expected for the entire fiscal year or any future period.
The financial statements include the accounts of the Company and its wholly owned subsidiaries. All intercompany balances and transactions have been eliminated.
The Company’s fiscal year ends on the Saturday closest to the last day of March. The Company’s current and prior fiscal years end on March 31, 2018 and April 1, 2017, respectively, and both consist of 52 weeks. The Company’s results of operations for the three and six months ended September 30, 2017 and October 1, 2016 both contain 13 weeks. For purposes of presentation, the Company has indicated its accounting year as ending on March 31 and its interim quarterly periods as ending on the applicable calendar month end.
Certain immaterial reclassifications to our previously reported financial information have been made to conform to the current period presentation. In addition, refer to Note 2, Recent Accounting Pronouncements, for details regarding reclassifications made in our condensed consolidated statements of cash flows pursuant to the adoption of new share-based payment accounting guidance in the first quarter of Fiscal Year 2018.
Earnings per common share:
The Company has a share-based compensation plan under which employees, non-employee directors, and consultants may be granted share-based payment awards, including shares of restricted stock on which non-forfeitable dividends are paid on unvested shares. As such, shares of restricted stock are considered participating securities under the two-class method of calculating earnings per share. Historically, the two-class method of calculating earnings per share did not have a material impact on the Company's earnings per share calculation under the treasury stock method. Beginning in the second quarter of Fiscal Year 2018, the Company applied the two-class method of calculating earnings per share because the ratio of participating securities to the weighted average number of common shares outstanding has increased as compared to the historical average, and this dilution will continue if the Company continues to repurchase its common stock at current levels. For further details refer to Note 14, Computation of Earnings Per Common Share.
Immaterial Out-of-Period Correction:
During the first quarter of Fiscal Year 2018, the Company recognized an out-of-period correction to its Fiscal Year 2017 geographic mix of taxable income, which resulted in an overstatement of Fiscal Year 2017 income tax expense by $2.8 million. The Company's correction, recognized in the quarter ended June 30, 2017, resulted in a $2.8 million benefit to income tax expense. The Company assessed the materiality of this error and concluded it was not material to Fiscal Year 2017 and is not expected to be material to the full Fiscal Year 2018.
17
2. RECENT ACCOUNTING PRONOUNCEMENTS
Recently Issued Pronouncements
In May 2014, the Financial Accounting Standards Board ("FASB") issued guidance regarding revenue from contracts with customers. While the standard supersedes existing revenue recognition guidance, it closely aligns with current U.S. GAAP. Under the new standard, revenue will be recognized at the time control of a good or service is transferred to a customer for the amount of consideration received or to be received for that specific good or service. Entities may use a full retrospective approach or report the cumulative effect as of the date of adoption. In March 2016, the FASB issued additional guidance concerning "Principal versus Agent" considerations (reporting revenue gross versus net); in April 2016, the FASB issued additional guidance on identifying performance obligations and licensing; and in May 2016, the FASB issued additional guidance on collectability, non-cash consideration, presentation of sales tax, and transition. These updates are intended to improve the operability and understandability of the implementation guidance and have the same effective date and transition requirements as the greater "contracts with customers" standard. The Company will adopt the standard, as amended, in the first quarter of its fiscal year ending March 31, 2019, utilizing the modified retrospective method of adoption. The Company has completed its initial review of the impact of this guidance, and does not anticipate a material impact on its revenue recognition practices. The Company will continue to assess all potential impacts of the standard, and currently believes the most significantly impacted areas are the following:
• | Software Revenue: The Company currently defers revenue for the value of software where vendor specific objective evidence ("VSOE") of fair value has not been established for undelivered items. Under Topic 606, revenue for such licenses will be recognized at the transfer of control, rather than ratably, as the VSOE requirement no longer applies and the value of the remaining services are not material in the context of the contract. At June 30, 2017, deferred revenue under Topic 605 for these licenses was $1.9 million. The Company expects the remaining balance of such deferred revenue will be eliminated as a cumulative effect adjustment of implementing Topic 606 in the first quarter of its fiscal year ending March 31, 2019. |
• | Marketing Development Funds: The Company frequently provides marketing development funds to its channel partners. Under topic 605, our marketing development funds are recognized as a reduction of revenue at the later of when the related revenue is recognized or when the program is offered to the channel partner. Applying the criteria of Topic 606, these marketing development programs qualify as variable consideration, and are assigned as a reduction of the transaction price of the contract. This results in a timing difference such that all or some of the funds related to a program may be recognized in different periods than under Topic 605, depending on the circumstances. Based on analysis of prior periods, we anticipate that this timing difference impacts revenue by immaterial amounts in a given period. The full impact of the adjustment is still being analyzed by the Company. |
• | Revenue Reserves: The Company establishes reserves for Discounts and Rebates and Sales Returns at the end of each fiscal period. These reserves are estimated based on current relevant and historical data, but there can be some variability associated with unforeseen changes in customer claim and return patterns. Under Topic 606, in cases where there is uncertainty around the variable consideration amount, a constraint, or an adjustment to ensure that a significant revenue reversal will not occur, on that consideration must be considered. Based on analysis of prior periods, we anticipate that impact of introducing this constraint will not materially impact revenue. The full impact of the adjustment is still being analyzed by the Company. |
In addition, the standard also requires new, expanded disclosures regarding revenue recognition. The Company will continue to monitor additional changes, modifications, clarifications or interpretations being undertaken by the FASB, which may impact its current conclusions.
In January 2016, the FASB issued guidance regarding the recognition and measurement of financial assets and liabilities. Changes to the current U.S. GAAP model primarily affect the accounting for equity investments, financial liabilities under the fair value option, and the presentation and disclosure requirements for financial instruments. In addition, the FASB clarified guidance related to the valuation allowance assessment when recognizing deferred tax assets resulting from unrealized losses on available-for-sale debt securities. The Company is required to adopt the standard in the first quarter of its fiscal year ending March 31, 2019, but may elect to adopt earlier as permitted under the standard. The Company is currently evaluating what impact, if any, the adoption of this standard will have on its consolidated financial statements and related disclosures.
18
In February 2016, the FASB issued guidance regarding both operating and financing leases, requiring lessees to recognize on their balance sheets "right-of-use assets" and corresponding lease liabilities, measured on a discounted basis over the lease term. Virtually all leases will be subject to this treatment except leases that meet the definition of a "short-term lease". For expense recognition, the dual model requiring leases to be classified as either operating or finance leases has been retained from the prior standard. Operating leases will result in straight-line expense while finance leases will result in a front-loaded expense pattern. Classification will use criteria very similar to those applied in current lease accounting, but without explicit bright lines. Extensive additional quantitative and qualitative disclosures, including significant judgments made by management, will be required to provide greater insight into the extent of expense recognized and expected to be recognized. The new lease guidance will essentially eliminate off-balance sheet financing. The guidance is effective for the Company's fiscal year ending March 31, 2020. The new standard must be adopted using a modified retrospective transition that provides for certain practical expedients and requires the new guidance to be applied at the beginning of the earliest comparative period presented. The Company expects adoption of this guidance will materially increase the assets and liabilities recorded on its Consolidated Balance Sheets, but is still evaluating the impact on its consolidated financial statements and related disclosures.
In June 2016, the FASB issued guidance regarding the measurement of credit losses on financial instruments, which changes the impairment model for most financial assets. The new model uses a forward-looking expected loss method, which will generally result in earlier recognition of allowances for losses. The guidance is effective for the Company's fiscal year ending March 31, 2021 with early adoption permitted beginning in the first quarter of Fiscal Year 2020. The Company is currently evaluating the impact the adoption of this standard will have on its consolidated financial statements and related disclosures.
In January 2017, the FASB issued guidance that revises the definition of a business, providing a more robust framework for determining when a set of assets and activities is deemed a business. The guidance is effective for the Company's fiscal year ending March 31, 2019, including interim periods within that year, and is not expected to have a significant impact on the Company's consolidated financial statements or related disclosures.
In January 2017, the FASB issued guidance that simplifies the process required to test goodwill for impairment. The guidance is effective for the Company's fiscal year ending March 31, 2021, and is not expected to have a significant impact on the Company's consolidated financial statements or related disclosures.
In March 2017, the FASB issued guidance related to the amortization of premiums on purchased callable debt securities. This guidance shortens the amortization period for certain callable debt securities purchased at a premium by requiring that the premium be amortized to the earliest call date instead of the maturity date. This guidance is effective for the Company's fiscal year ending March 31, 2020, including interim periods within that year. The Company is currently evaluating the impact the adoption of this standard will have on its consolidated financial statements and related disclosures, but expects the impact to be immaterial.
In May 2017, the FASB issued guidance that clarifies the scope of modification accounting with respect to changes to the terms or conditions of a share-based payment award. This guidance is effective for the Company's fiscal year ending March 31, 2019, including interim periods within that year. The Company is currently evaluating the impact the adoption of this standard will have on its consolidated financial statements and related disclosures, but expects the impact to be immaterial.
In August 2017, the FASB issued guidance that eliminates the requirement to separately measure and report hedge ineffectiveness and that generally requires, for qualifying hedges, the entire change in the fair value of a hedging instrument to be presented in the same income statement line as the hedged item. The guidance also modifies the accounting for components excluded from the assessment of hedge effectiveness, eases documentation and assessment requirements, and modifies certain disclosure requirements. The new standard must be adopted using a modified retrospective transition with a cumulative effect adjustment recorded to opening retained earnings as of the initial adoption date. This guidance is effective for the Company's fiscal year ending March 31, 2020, including interim periods within that year. The Company is currently evaluating the impact the adoption of this standard will have on its consolidated financial statements and related disclosures, but expects the impact to be immaterial.
19
Recently Adopted Pronouncement
Beginning Fiscal Year 2018, the Company adopted the FASB's new guidance, Improvements to Employee Share-Based Payment Accounting, which changes among other things, how the tax effects of share-based awards are recognized. This new guidance requires excess tax benefits and tax deficiencies to be recognized in the provision for income taxes as discrete items in the period when the awards vest or are settled, whereas previously such income tax effects were recorded as part of additional paid-in capital. The provision for income taxes for the three and six months ended September 30, 2017, included excess tax benefits of $0.1 million and $2.0 million, respectively, that reduced the Company's effective tax rate by 0.3 and 4.8 percentage points, respectively. The recognized excess tax benefits resulted from share-based compensation awards that vested or settled in the first three months of 2017. This guidance also eliminates the requirement to reclassify cash flows related to excess tax benefits from operating activities to financing activities on the consolidated statements of cash flows. The Company adopted this provision retrospectively by reclassifying $0.9 million of excess tax benefits from financing activities to operating activities in the condensed consolidated statement of cash flows for the six months ended September 30, 2016. The Company also excluded the related tax benefits when applying the treasury stock method for computing diluted shares outstanding on a prospective basis as required by this guidance. In addition, the Company elected to continue its current practice of estimating expected forfeitures. The Company made no changes to its presentation of withholding taxes on the settlement of share-based payment awards, which were already presented as financing activities. The amount of excess tax benefits and deficiencies recognized in the provision for income taxes will fluctuate from period-to-period based on the price of the Company’s stock, the volume of share-based instruments settled or vested, and the value assigned to share-based instruments under U.S. GAAP. Refer to additional discussion in Note 13, Income Taxes.
3. CASH, CASH EQUIVALENTS, AND INVESTMENTS
The following tables summarize the Company’s cash and available-for-sale securities’ amortized cost, gross unrealized gains, gross unrealized losses, and fair value by significant investment category recorded as cash and cash equivalents, short-term, or long-term investments as of September 30, 2017 and March 31, 2017 (in thousands):
September 30, 2017 | Amortized Cost | Gross Unrealized Gains | Gross Unrealized Losses | Fair Value | Cash & Cash Equivalents | Short-term investments (due in 1 year or less) | Long-term investments (due in 1 to 3 years) | |||||||||||||||||||||
Cash | $ | 290,429 | $ | — | $ | — | $ | 290,429 | $ | 290,429 | $ | — | $ | — | ||||||||||||||
Level 1: | ||||||||||||||||||||||||||||
Mutual Funds | 13,507 | 675 | (27 | ) | 14,155 | — | 14,155 | — | ||||||||||||||||||||
US Treasury Notes | 32,958 | — | (66 | ) | 32,892 | — | 20,084 | 12,808 | ||||||||||||||||||||
Subtotal | 46,465 | 675 | (93 | ) | 47,047 | — | 34,239 | 12,808 | ||||||||||||||||||||
Level 2: | ||||||||||||||||||||||||||||
Government Agency Securities | 47,851 | — | (139 | ) | 47,712 | — | 26,870 | 20,842 | ||||||||||||||||||||
Commercial Paper | 52,099 | — | — | 52,099 | 11,185 | 40,914 | — | |||||||||||||||||||||
Corporate Bonds | 146,781 | 126 | (95 | ) | 146,812 | — | 78,730 | 68,082 | ||||||||||||||||||||
Certificates of Deposits ("CDs") | 21,532 | 14 | — | 21,546 | 1,502 | 16,525 | 3,519 | |||||||||||||||||||||
Subtotal | 268,263 | 140 | (234 | ) | 268,169 | 12,687 | 163,039 | 92,443 | ||||||||||||||||||||
Total cash, cash equivalents and investments measured at fair value | $ | 605,157 | $ | 815 | $ | (327 | ) | $ | 605,645 | $ | 303,116 | $ | 197,278 | $ | 105,251 | |||||||||||||
20
March 31, 2017 | Amortized Cost | Gross Unrealized Gains | Gross Unrealized Losses | Fair Value | Cash & Cash Equivalents | Short-term investments (due in 1 year or less) | Long-term investments (due in 1 to 3 years) | |||||||||||||||||||||
Cash | $ | 295,877 | $ | — | $ | — | $ | 295,877 | $ | 295,877 | $ | — | $ | — | ||||||||||||||
Level 1: | ||||||||||||||||||||||||||||
Mutual Funds | 12,079 | 352 | (32 | ) | 12,399 | — | 12,399 | — | ||||||||||||||||||||
US Treasury Notes | 35,960 | — | (68 | ) | 35,892 | — | 17,560 | 18,332 | ||||||||||||||||||||
Subtotal | 48,039 | 352 | (100 | ) | 48,291 | — | 29,959 | 18,332 | ||||||||||||||||||||
Level 2: | ||||||||||||||||||||||||||||
Government Agency Securities | 54,415 | 20 | (164 | ) | 54,271 | — | 15,309 | 38,962 | ||||||||||||||||||||
Commercial Paper | 47,152 | — | — | 47,152 | 6,093 | 41,059 | — | |||||||||||||||||||||
Corporate Bonds | 141,508 | 64 | (224 | ) | 141,348 | — | 73,676 | 67,672 | ||||||||||||||||||||
Certificates of Deposits ("CDs") | 20,383 | 3 | — | 20,386 | — | 18,176 | 2,210 | |||||||||||||||||||||
Subtotal | 263,458 | 87 | (388 | ) | 263,157 | 6,093 | 148,220 | 108,844 | ||||||||||||||||||||
Total cash, cash equivalents and investments measured at fair value | $ | 607,374 | $ | 439 | $ | (488 | ) | $ | 607,325 | $ | 301,970 | $ | 178,179 | $ | 127,176 | |||||||||||||
As of September 30, 2017 and March 31, 2017, with the exception of assets related to the Company's deferred compensation plan, all of the Company's investments are classified as available-for-sale securities. The carrying value of available-for-sale securities included in cash equivalents approximates fair value because of the short maturity of those instruments. For more information regarding the Company's deferred compensation plan, refer to Note 4, Deferred Compensation.
The Company did not incur any material realized or unrealized gains or losses in the three and six months ended September 30, 2016 and 2017.
There were no transfers between fair value measurement levels during the three and six months ended September 30, 2016 and 2017.
All financial assets and liabilities are recognized or disclosed at fair value in the financial statements or the accompanying notes thereto. Fair value is estimated by applying the following hierarchy, which prioritizes the inputs used to measure fair value into three levels and bases the categorization within the hierarchy upon the lowest level of input that is available and significant to the fair value measurement:
Level 1
The Company's Level 1 financial assets consist of Mutual Funds and US Treasury Notes. The fair value of Level 1 financial instruments is measured based on the quoted market price of identical securities.
Level 2
The Company's Level 2 financial assets and liabilities consist of Government Agency Securities, Commercial Paper, Corporate Bonds, and Certificates of Deposits ("CDs"), derivative foreign currency contracts, and long-term debt. The fair value of Level 2 investment securities is determined based on other observable inputs, including multiple non-binding quotes from independent pricing services. Non-binding quotes are based on proprietary valuation models that are prepared by the independent pricing services and use algorithms based on inputs such as observable market data, quoted market prices for similar securities, issuer spreads, and internal assumptions of the broker. The Company corroborates the reasonableness of non-binding quotes received from the independent pricing services using a variety of techniques depending on the underlying instrument, including: (i) comparing them to actual experience gained from the purchases and maturities of investment securities, (ii) comparing them to internally developed cash flow models based on observable inputs, and (iii) monitoring changes in ratings of similar securities and the related impact on fair value. The fair value of Level 2 derivative foreign currency contracts is determined using pricing models that use observable market inputs. For more information regarding the Company's derivative assets and liabilities, refer to Note 12, Foreign Currency Derivatives. The fair value of Level 2 long-term debt is determined based on inputs that were observable in the market, including the trading price of the notes when available. For more information regarding the Company's 5.50% Senior Notes, refer to Note 7, Debt.
21
Level 3
The Company's unsecured revolving credit facility falls under the Level 3 hierarchy. The fair value of the Company’s line of credit approximates its carrying value because the interest rate is variable and approximates rates currently available to the Company.
4. DEFERRED COMPENSATION
As of September 30, 2017, the Company held bank deposits of $0.8 million and investments in mutual funds totaling $14.2 million, all of which related to debt and equity securities that are held in rabbi trusts under non-qualified deferred compensation plans. The total related deferred compensation liability was $15.5 million at September 30, 2017. As of March 31, 2017, the Company held bank deposits of $0.8 million and investments in mutual funds totaling $12.4 million. The total related deferred compensation liability at March 31, 2017 was $13.7 million.
The bank deposits are recorded on the condensed consolidated balance sheets under "cash and cash equivalents". The securities are classified as trading securities and are recorded on the condensed consolidated balance sheets under "short-term investments". The liability is recorded on the condensed consolidated balance sheets under "other long-term liabilities" and "accrued liabilities".
5. DETAILS OF CERTAIN BALANCE SHEET ACCOUNTS
Accounts receivable, net:
March 31, | September 30, | |||||||
(in thousands) | 2017 | 2017 | ||||||
Accounts receivable | $ | 184,068 | $ | 186,870 | ||||
Provisions for returns | (10,541 | ) | (9,865 | ) | ||||
Provisions for promotions, rebates, and other | (31,747 | ) | (36,513 | ) | ||||
Provisions for doubtful accounts and sales allowances | (603 | ) | (809 | ) | ||||
Accounts receivable, net | $ | 141,177 | $ | 139,683 | ||||
Inventory, net:
March 31, | September 30, | |||||||
(in thousands) | 2017 | 2017 | ||||||
Raw materials | $ | 20,260 | $ | 22,668 | ||||
Work in process | 215 | 237 | ||||||
Finished goods | 34,981 | 38,094 | ||||||
Inventory, net | $ | 55,456 | $ | 60,999 | ||||
Accrued Liabilities:
March 31, | September 30, | |||||||
(in thousands) | 2017 | 2017 | ||||||
Employee compensation and benefits | $ | 36,415 | $ | 22,278 | ||||
Accrued interest on 5.50% Senior Notes | 10,407 | 10,312 | ||||||
Warranty obligation | 6,863 | 6,739 | ||||||
VAT/Sales tax payable | 5,433 | 5,852 | ||||||
Derivative liabilities | 1,323 | 4,588 | ||||||
Accrued other | 13,844 | 18,665 | ||||||
Accrued liabilities | $ | 74,285 | $ | 68,434 | ||||
22
The Company's warranty obligation is included as a component of accrued liabilities on the condensed consolidated balance sheets. Changes in the warranty obligation during the six months ended September 30, 2016 and 2017 were as follows:
Six Months Ended September 30, | ||||||||
(in thousands) | 2016 | 2017 | ||||||
Warranty obligation at beginning of period | $ | 8,537 | $ | 8,697 | ||||
Warranty provision related to products shipped | 4,649 | 4,635 | ||||||
Deductions for warranty claims processed | (4,742 | ) | (5,080 | ) | ||||
Adjustments related to preexisting warranties | 96 | 405 | ||||||
Warranty obligation at end of period(1) | $ | 8,540 | $ | 8,657 | ||||
(1) Includes both short-term and long-term portion of warranty obligation; the prior table shows only the short-term portion included in accrued liabilities on our condensed consolidated balance sheet. The long-term portion is included in other long-term liabilities.
6. COMMITMENTS AND CONTINGENCIES
Unconditional Purchase Obligations
The Company purchases materials and services from a variety of suppliers and manufacturers. During the normal course of business and to manage manufacturing operations and general and administrative activities, the Company may enter into firm, non-cancelable, and unconditional purchase obligations for which amounts are not recorded on the consolidated balance sheets. As of September 30, 2017, the Company had outstanding off-balance sheet third-party manufacturing, component purchase, and other general and administrative commitments of $176.2 million.
Other Guarantees and Obligations
In the ordinary course of business, the Company may provide indemnifications of varying scope and terms to customers, vendors, lessors, business partners, purchasers of assets or subsidiaries and other parties with respect to certain matters, including, but not limited to, losses arising out of the Company's breach of agreements or representations and warranties made by the Company, services to be provided by the Company, intellectual property infringement claims made by third parties or, with respect to the sale of assets of a subsidiary, matters related to the Company's conduct of business and tax matters prior to the sale. From time to time, the Company indemnifies customers against combinations of loss, expense, or liability arising from various triggering events relating to the sale and use of its products and services.
In addition, the Company also provides indemnification to customers against claims related to undiscovered liabilities, additional product liability, or environmental obligations. The Company has also entered into indemnification agreements with its directors, officers and certain other personnel that will require the Company, among other things, to indemnify them against certain liabilities that may arise by reason of their status or service as directors or officers of the Company or certain of its affiliated entities. The Company maintains director and officer liability insurance, which may cover certain liabilities arising from its obligation to indemnify its directors, officers and certain other personnel in certain circumstances. It is not possible to determine the aggregate maximum potential loss under these agreements due to the limited history of prior claims and the unique facts and circumstances involved in each particular claim. Such indemnification obligations might not be subject to maximum loss clauses. Historically, the Company has not incurred material costs as a result of obligations under these agreements and it has not accrued any liabilities related to such indemnification obligations in the condensed consolidated financial statements.
23
Claims and Litigation
On October 12, 2012, GN Netcom, Inc. ("GN") sued the Company in the United States ("U.S.") District Court for the District of Delaware, alleging violations of the Sherman Act, the Clayton Act, and Delaware common law. In its complaint, GN specifically alleged four causes of action: monopolization, attempted monopolization, concerted action in restraint of trade, and tortious interference with business relations. GN claimed that the Company dominates the market for headsets sold into contact centers in the U.S. and that a critical channel for sales of headsets to contact centers is through a limited network of specialized independent distributors (“SIDs”). GN asserted that the Company attracts SIDs through exclusive distributor agreements and alleged that the use of these agreements is illegal. On July 6, 2016, the Court in GN Netcom, Inc. v. Plantronics, Inc. ordered the following sanctions against the Company as they relate to certain discovery matters in the litigation: (1) monetary sanctions in the form of reasonable fees and costs incurred by GN in connection with the discovery disputes leading to the motion for sanctions; (2) punitive sanctions in the amount of $3 million; (3) possible evidentiary sanctions; and (4) instructions to the jury that it may draw an adverse inference that emails destroyed by the Company would have been favorable to GN’s case and/or unfavorable to the Company's defense. As a result, during the three months ended June 30, 2016, the Company accrued $3 million for the punitive sanctions and an additional $2 million, representing the Company’s best estimate of reasonable fees and costs incurred by GN in connection with the disputes leading to the motion for sanctions, for a total of $5 million. The Company paid the $3 million in punitive damages to GN on or about September 1, 2016 and paid the remaining balance, which was reduced to $1.9 million, on December 7, 2016.
The parties conducted fact and expert discovery through December 2016. In February 2017, the court granted the Company’s request to file a summary judgment motion, which the Company subsequently filed in April 2017. The court denied that motion in August 2017. GN also filed a motion for sanctions, which the court denied in July 2017. Both sides also filed Daubert motions to exclude certain expert testimony; those motions were denied in August.
Trial of this matter commenced on October 11, 2017, subsequent to the Company's second quarter of Fiscal Year 2018. On October 18, 2017, the jury reached a verdict in favor of the Company on all counts, with no damages awarded to GN.
In a letter dated May 1, 2017, the Company received a Notice of Proposed Debarment from the General Services Administration ("GSA"). That matter was dismissed by the GSA upon a finding of no cause in August 2017.
In addition to the specific matter discussed above, the Company is involved in various legal proceedings arising in the normal course of conducting business. For such legal proceedings, where applicable, the Company has accrued an amount that reflects the aggregate liability deemed probable and estimable, but this amount is not material to the Company's financial condition, results of operations, or cash flows. With respect to proceedings for which no accrual has been made, the Company is not able to estimate an amount or range of any reasonably possible additional losses because of the preliminary nature of many of these proceedings, the difficulty in ascertaining the applicable facts relating to many of these proceedings, the variable treatment of claims made in many of these proceedings, and the difficulty of predicting the settlement value of many of these proceedings. However, based upon the Company's historical experience, the resolution of these proceedings is not expected to have a material effect on the Company's financial condition, results of operations or cash flows. The Company may incur substantial legal fees, which are expensed as incurred, in defending against these legal proceedings.
7. DEBT
5.50% Senior Notes
In May 2015, the Company issued $500.0 million aggregate principal amount of 5.50% senior notes (the “5.50% Senior Notes”). The 5.50% Senior Notes mature on May 31, 2023, and bear interest at a rate of 5.50% per annum, payable semi-annually on May 15 and November 15, commencing on November 15, 2015. The Company received net proceeds of $488.4 million from the issuance of the 5.50% Senior Notes, net of issuance costs of $11.6 million which are being amortized to interest expense over the term of the 5.50% Senior Notes using the effective interest method. A portion of the proceeds was used to repay all then-outstanding amounts under our revolving line of credit agreement with Wells Fargo Bank and the remaining proceeds were used primarily for share repurchases.
24
The fair value of the 5.50% Senior Notes was determined based on inputs that were observable in the market, including the trading price of the 5.50% Senior Notes when available (Level 2). The estimated fair value and carrying value of the 5.50% Senior Notes were as follows:
March 31, 2017 | September 30, 2017 | ||||||||||||||
(in thousands) | Fair Value | Carrying Value | Fair Value | Carrying Value | |||||||||||
5.50% Senior Notes | $ | 505,150 | $ | 491,059 | $ | 520,205 | $ | 491,784 | |||||||
The Company may redeem all or a part of the 5.50% Senior Notes, upon not less than 30 or more than a 60 day notice; however, the applicable redemption price will be determined as follows:
Redemption Period Requiring Payment of: | Redemption Up To 35% Using Cash Proceeds From An Equity Offering(3): | ||||||
Make-Whole(1) | Premium(2) | Date | Specified Price | ||||
5.50% Senior Notes | Prior to May 15, 2018 | On or after May 15, 2018 | Prior to May 15, 2018 | 105.500% | |||
(1) If the Company redeems the notes prior to the applicable date, the redemption price is principal plus a make-whole premium equal to the present value of the remaining scheduled interest payments as described in the applicable indenture, together with accrued and unpaid interest.
(2) If the Company redeems the notes on or after the applicable date, the price is principal plus a premium which declines over time as specified in the applicable indenture, together with accrued and unpaid interest.
(3) If the Company redeems the notes prior to the applicable date with net cash proceeds of one or more equity offerings, the price is equal to the amount specified above, together with accrued and unpaid interest, subject to a maximum redemption of 35% of the aggregate principal amount of the respective note being redeemed.
In addition, upon the occurrence of certain change of control triggering events, the Company may be required to repurchase the 5.50% Senior Notes, at a price equal to 101% of their principal amount, plus accrued and unpaid interest to the date of repurchase. The 5.50% Senior Notes contain restrictive covenants that, among other things, limit the Company's ability to create certain liens and enter into sale and leaseback transactions; create, assume, incur, or guarantee additional indebtedness of its subsidiaries without such subsidiary guaranteeing the 5.50% Senior Notes on an unsecured unsubordinated basis; and consolidate or merge with, or convey, transfer or lease all or substantially all of the assets of the Company and its subsidiaries to another person. As of September 30, 2017, the Company was in compliance with all covenants.
Revolving Credit Agreement
On May 9, 2011, the Company entered into a credit agreement with Wells Fargo Bank, National Association ("the Bank"), which was most recently amended on April 28, 2017 (as amended, the "Amended Credit Agreement") to extend the term of the Credit Agreement by one year to May 9, 2020, and to amend certain of the covenants, which are defined below.
The Amended Credit Agreement provides for a $100.0 million unsecured revolving credit facility. Revolving loans under the Credit Agreement will bear interest, at the Company’s election, at (i) the Bank’s announced prime rate less 1.20% per annum or (ii) a daily one-month LIBOR rate plus 1.40% per annum. Interest is payable quarterly in arrears on the first day of each of April, July, October and January. Principal, together with all accrued and unpaid interest, on the revolving loans is due and payable on May 9, 2020. The Company is also obligated to pay a commitment fee of 0.37% per annum on the average daily unused amount of the revolving line of credit, which fee shall be payable quarterly in arrears on the first day of each of April, July, October and January.
The Company may prepay the loans and terminate the commitments under the Credit Agreement at any time, without premium or penalty, subject to the reimbursement of certain costs. As of March 31, 2017 and September 30, 2017, the Company had no outstanding borrowings under the line of credit.
25
The Amended Credit Agreement contains customary affirmative and negative covenants, including, among other things, covenants limiting the ability of the Company to incur debt, make capital expenditures, grant liens, merge or consolidate, and make investments. The Amended Credit Agreement also requires the Company to comply with certain financial covenants, including (i) a maximum ratio of funded debt to EBITDA of 3.25:1 (previously 3:1) and (ii) a minimum EBITDA coverage ratio, in each case, tested as of each fiscal quarter and determined on a rolling four-quarter basis. In addition, the Company and its subsidiaries are required to maintain unrestricted cash, cash equivalents and marketable securities plus availability under the Amended Credit Agreement at the end of each fiscal quarter of at least $300.0 million. The Amended Credit Agreement contains customary events of default that include, among other things, payment defaults, covenant defaults, cross-defaults with certain other indebtedness, bankruptcy and insolvency defaults, and judgment defaults. The occurrence of an event of default could result in the acceleration of the obligations under the Amended Credit Agreement. As of March 31, 2017 and September 30, 2017, the Company was in compliance with all covenants.
8. RESTRUCTURING AND OTHER RELATED CHARGES (CREDITS)
During the first six months of Fiscal Year 2018 and as part of its ongoing effort to reduce costs, improve profitability, and focus on its key strategic initiatives, the Company executed an asset sale agreement to dispose of substantially all assets of its Clarity division, primarily inventories and tooling fixed assets, for an immaterial sales price. The buyer in this arrangement was a former employee of the Company, who acted as Clarity's President but who was not an executive officer or director of the Company. As part of the buyer's separation from Plantronics, the Company accelerated vesting on his outstanding restricted stock, resulting in an immaterial stock-compensation modification charge.
In connection with the sale, the Company is leasing the facility it owns in Chattanooga, Tennessee, to the buyer for a period of twelve months. The Company also entered into a transition services agreement with the buyer to provide customer support services on a cost-recovery basis, which are not expected to be material, for a period of one year. The Company also recorded immaterial impairment charges on assets previously used in Clarity operations that have no further value to the Company.
In addition to the sale of the Clarity division and the related restructuring actions, the Company reduced headcount in certain divisions and terminated a lease in the Netherlands before the end of its contractual term, resulting in a charge equal to the present value of the remaining future minimum lease payments. In connection with this exit, the Company wrote off certain fixed assets that will no longer be used. Finally, the Company reorganized its Brazilian operations and as a result, wrote off an unrecoverable indirect tax asset.
As of September 30, 2017, the remaining obligation related to severance amounts due is immaterial and will be settled within 12 months.
During the quarter ended September 30, 2017, we recorded an immaterial adjustment to restructuring and other related charges (credits) resulting from a change in estimate from amounts previously recorded.
The associated charges for the six months ended September 30, 2017 are recorded in restructuring and other related charges (credits), cost of revenues, and selling, general, and administrative expense in the condensed consolidated statements of operations, as follows:
Six months ended September 30, 2017 | ||||||||||||
(in millions) | Total Charges | Restructuring and Other Related Charges (Credits) | Cost of Revenues | Selling, General, and Administrative | ||||||||
Severance benefits from reduction-in-force | $ | 1.4 | $ | 1.4 | $ | — | $ | — | ||||
Lease exit charge and asset impairments in Netherlands | 0.7 | 0.7 | — | — | ||||||||
Write-off of unrecoverable indirect tax asset in Brazil | 0.7 | — | 0.7 | — | ||||||||
Asset impairments related to previous Clarity operations | 0.4 | 0.4 | — | — | ||||||||
Loss on Clarity asset sale | 0.9 | — | 0.9 | — | ||||||||
Accelerated vesting of restricted stock | 0.2 | — | — | 0.2 | ||||||||
Totals | $ | 4.3 | $ | 2.5 | $ | 1.6 | $ | 0.2 | ||||
26
9. STOCK-BASED COMPENSATION
The Company recognizes the grant-date fair value of stock-based compensation as compensation expense using the straight-line attribution approach over the service period for which the stock-based compensation is expected to vest. The following table summarizes the amount of stock-based compensation included in the condensed consolidated statements of operations:
Three Months Ended September 30, | Six Months Ended September 30, | |||||||||||||||
(in thousands) | 2016 | 2017 | 2016 | 2017 | ||||||||||||
Cost of revenues | $ | 778 | $ | 890 | $ | 1,620 | $ | 1,792 | ||||||||
Research, development, and engineering | 2,408 | 2,008 | 4,892 | 4,109 | ||||||||||||
Selling, general, and administrative | 4,717 | 5,864 | 9,804 | 12,117 | ||||||||||||
Stock-based compensation included in operating expenses | 7,125 | 7,872 | 14,696 | 16,226 | ||||||||||||
Total stock-based compensation | 7,903 | 8,762 | 16,316 | 18,018 | ||||||||||||
Income tax benefit | (2,877 | ) | (2,840 | ) | (5,649 | ) | (7,689 | ) | ||||||||
Total stock-based compensation, net of tax | $ | 5,026 | $ | 5,922 | $ | 10,667 | $ | 10,329 | ||||||||
10. COMMON STOCK REPURCHASES
From time to time, the Company's Board of Directors (the "Board") has authorized programs under which the Company may repurchase shares of its common stock, depending on market conditions, in the open market or through privately negotiated transactions. Repurchased shares are held as treasury stock until they are retired or re-issued. Repurchases by the Company pursuant to Board-authorized programs during the six months ended September 30, 2016 and 2017 are discussed below. As of September 30, 2017, there remained 1,028,586 shares authorized for repurchase under the repurchase programs approved by the Board on July 29, 2016 and July 27, 2017. There were no remaining shares authorized under previously approved programs.
In the six months ended September 30, 2016 and 2017, the Company repurchased 613,021 shares and 841,249 shares, respectively, of its common stock in the open market for a total cost of $26.8 million and $39.2 million, respectively, and at an average price per share of $43.76 and $46.62, respectively. In addition, the Company withheld shares valued at $9.1 million and $10.8 million in the six months ended September 30, 2016 and 2017, respectively, in satisfaction of employee tax withholding obligations upon the vesting of restricted stock granted under the Company's stock plans. The amounts withheld were equivalent to the employees' minimum statutory tax withholding requirements and are reflected as a financing activity within the Company's condensed consolidated statements of cash flows. These share withholdings have the same effect as share repurchases by the Company as they reduce the number of shares that would have otherwise been issued in connection with the vesting of shares subject to the restricted stock grants.
11. ACCUMULATED OTHER COMPREHENSIVE INCOME
The components of accumulated other comprehensive income ("AOCI"), net of immaterial tax effects, are as follows:
(in thousands) | March 31, 2017 | September 30, 2017 | |||||||
Accumulated unrealized gain (loss) on cash flow hedges (1) | $ | 529 | $ | (3,039 | ) | ||||
Accumulated foreign currency translation adjustments | 4,428 | 4,685 | |||||||
Accumulated unrealized gain (loss) on investments | (263 | ) | (115 | ) | |||||
Accumulated other comprehensive income | $ | 4,694 | $ | 1,531 | |||||
(1)Refer to Note 12, Foreign Currency Derivatives, which discloses the nature of the Company's derivative assets and liabilities as of March 31, 2017 and September 30, 2017.
27
12. FOREIGN CURRENCY DERIVATIVES
The Company's foreign currency derivatives consist primarily of foreign currency forward exchange contracts, option contracts, and cross-currency swaps. The Company does not purchase derivative financial instruments for speculative trading purposes. The derivatives expose the Company to credit risk to the extent the counterparties may be unable to meet the terms of the derivative instrument. The Company's maximum exposure to loss that it would incur due to credit risk if parties to derivative contracts failed completely to perform according to the terms of the contracts was equal to the carrying value of the Company's derivative assets as of September 30, 2017. The Company seeks to mitigate such risk by limiting its counterparties to large financial institutions. In addition, the Company monitors the potential risk of loss with any one counterparty resulting from this type of credit risk on an ongoing basis.
The Company enters into master netting arrangements with counterparties when possible to mitigate credit risk in derivative transactions. A master netting arrangement may allow each counterparty to net settle amounts owed between the Company and the counterparty as a result of multiple, separate derivative transactions. As of September 30, 2017, the Company had International Swaps and Derivatives Association (ISDA) agreements with four applicable banks and financial institutions which contained netting provisions. Plantronics has elected to present the fair value of derivative assets and liabilities on the Company's condensed consolidated balance sheet on a gross basis even when derivative transactions are subject to master netting arrangements and may otherwise qualify for net presentation. For each counterparty, if netted, the Company would offset the asset and liability balances of all derivatives at the end of the reporting period. Derivatives not subject to master netting agreements are not eligible for net presentation. As of March 31, 2017 and September 30, 2017, no cash collateral had been received or pledged related to these derivative instruments.
The gross fair value of the Company's outstanding derivative contracts at the end of each period was as follows:
(in thousands) | March 31, 2017 | September 30, 2017 | ||||||
Derivative Assets(1) | ||||||||
Non-designated hedges | $ | 86 | $ | 310 | ||||
Cash flow hedges | 2,034 | 505 | ||||||
Total Derivative Assets | $ | 2,120 | $ | 815 | ||||
Derivative Liabilities(2) | ||||||||
Non-designated hedges | $ | 286 | $ | 339 | ||||
Cash flow hedges | 1,109 | 4,346 | ||||||
Total Derivative Liabilities | $ | 1,395 | $ | 4,685 | ||||
(1) Short-term derivative assets are recorded in "other current assets" and long-term derivative assets are recorded in "deferred tax and other assets". As of September 30, 2017 the portion of derivative assets classified as long-term was immaterial.
(2) Short-term derivative liabilities are recorded in "accrued liabilities" and long-term derivative liabilities are recorded in "other long-term liabilities". As of September 30, 2017 the portion of derivative liabilities classified as long-term was immaterial.
Non-Designated Hedges
As of September 30, 2017, the Company had foreign currency forward contracts denominated in Euros ("EUR"), British Pound Sterling ("GBP"), Australian Dollars ("AUD"), and Canadian Dollars ("CAD"). The Company does not elect to obtain hedge accounting for these forward contracts. These forward contracts hedge against a portion of the Company’s foreign currency-denominated cash balances, receivables, and payables. The following table summarizes the notional value of the Company’s outstanding foreign exchange currency contracts and approximate U.S. Dollar ("USD") equivalent at September 30, 2017:
(in thousands) | Local Currency | USD Equivalent | Position | Maturity | |||||||
EUR | € | 33,900 | $ | 28,650 | Sell EUR | 1 month | |||||
GBP | £ | 5,000 | $ | 6,710 | Sell GBP | 1 month | |||||
AUD | A$ | 13,200 | $ | 10,352 | Sell AUD | 1 month | |||||
CAD | C$ | 2,700 | $ | 2,161 | Sell CAD | 1 month | |||||
28
Effect of Non-Designated Derivative Contracts on the Condensed Consolidated Statements of Operations
The effect of non-designated derivative contracts recognized in other non-operating income and (expense), net in the condensed consolidated statements of operations was as follows:
Three Months Ended September 30, | Six Months Ended September 30, | |||||||||||||||
(in thousands) | 2016 | 2017 | 2016 | 2017 | ||||||||||||
Gain (loss) on foreign exchange contracts | $ | (193 | ) | $ | 2,102 | $ | 1,750 | $ | 5,236 | |||||||
Cash Flow Hedges
Costless Collars
The Company hedges a portion of the forecasted EUR and GBP denominated revenues with costless collars. On a monthly basis, the Company enters into option contracts with a six to eleven month term. Collar contracts are scheduled to mature at the beginning of each fiscal quarter, at which time the instruments convert to forward contracts. The Company also enters into cash flow forwards with a three month term. Once the hedged revenues are recognized, the forward contracts become non-designated hedges to protect the resulting foreign monetary asset position for the Company.
The notional value of the Company's outstanding EUR and GBP option and forward contracts at the end of each period was as follows:
March 31, 2017 | September 30, 2017 | |||||||
(in millions) | EUR | GBP | EUR | GBP | ||||
Option contracts | €73.5 | £23.9 | €81.7 | £23.9 | ||||
Forward contracts | €11.2 | £3.3 | €13.4 | £3.6 | ||||
The Company will reclassify all amounts accumulated in other comprehensive income into earnings within the next twelve months.
Cross-currency Swaps
The Company hedges a portion of the forecasted Mexican Peso (“MXN”) denominated expenditures with a cross-currency swap. As of March 31, 2017 and September 30, 2017, the Company had foreign currency swap contracts of approximately MXN 287.2 million and MXN 134.2 million, respectively.
The following table summarizes the notional value of the Company’s outstanding MXN cross-currency swaps and approximate USD Equivalent at September 30, 2017:
(in thousands) | Local Currency | USD Equivalent | Position | Maturity | ||||||||
MXN | $ | 134,150 | $ | 6,978 | Buy MXN | Monthly over | 9 months | |||||
29
Effect of Designated Derivative Contracts on AOCI and Condensed Consolidated Statements of Operations
The following table presents the pre-tax effects of derivative instruments designated as cash flow hedges on accumulated other comprehensive income and the condensed consolidated statements of operations for the three and six months ended September 30, 2016 and 2017:
Three Months Ended September 30, | Six Months Ended September 30, | |||||||||||||||
(in thousands) | 2016 | 2017 | 2016 | 2017 | ||||||||||||
Gain (loss) included in AOCI as of beginning of period | $ | 415 | $ | (1,744 | ) | $ | (1,106 | ) | $ | 541 | ||||||
Amount of gain (loss) recognized in other comprehensive income (“OCI”) (effective portion) | (650 | ) | (2,302 | ) | 304 | (4,647 | ) | |||||||||
Amount of gain (loss) reclassified from OCI into net revenues (effective portion) | 825 | 1,131 | 985 | 1,149 | ||||||||||||
Amount of gain (loss) reclassified from OCI into cost of revenues (effective portion) | (589 | ) | (174 | ) | (1,316 | ) | (132 | ) | ||||||||
Total amount of gain (loss) reclassified from AOCI to income (loss) (effective portion) | 236 | 957 | (331 | ) | 1,017 | |||||||||||
Gain (loss) included in AOCI as of end of period | $ | (471 | ) | $ | (3,089 | ) | $ | (471 | ) | $ | (3,089 | ) | ||||
During the three and six months ended September 30, 2016 and 2017 the Company recognized an immaterial gain and immaterial loss on the ineffective portion of its cash flow hedges, respectively, which is reported in other non-operating income and (expense), net in the condensed consolidated statements of operations.
13. INCOME TAXES
The Company and its subsidiaries are subject to taxation in the U.S. and in various foreign and state jurisdictions. The effective tax rates for the three months ended September 30, 2016 and 2017 were 21.4% and 19.3%, respectively. The effective tax rates for the six months ended September 30, 2016 and 2017 were 22.0% and 7.2%, respectively.
The decrease in the effective tax rates for the three and six months ended September 30, 2017 is due primarily to a shift in geographic mix of taxable income from higher tax jurisdictions to lower tax jurisdictions. The effective tax rate for the six months ended September 30, 2017 further decreased due to the adoption of new guidance related to stock-based compensation.
The Company recorded a correction to the geographic mix of income during the three months ended June 30, 2017 related to Fiscal Year 2017 which reduced income in a high tax jurisdiction and increased income in a low tax jurisdiction. This correction resulted in a reduction to the Company’s effective tax rate by 6.6 percentage points for the six months ended September 30, 2017 as compared to the prior year period. It had no impact on the three months ended September 30, 2017. For additional details regarding this correction refer to Note 1, Basis of Presentation.
The Company adopted new stock-based compensation accounting guidance effective the beginning of Fiscal Year 2018. Excess tax benefits associated with employee equity plans were previously recorded in additional paid-in capital and the adoption of this guidance resulted in a reduction to the Company's effective tax rate by 0.3 and 4.8 percentage points for the three and six months ended September 30, 2017, respectively. The amount of excess tax benefits or deficiencies will fluctuate from period-to-period based on the price of the Company’s stock, the volume of share-based instruments settled or vested, and the value assigned to employee equity awards under U.S. GAAP.
Included in long-term income taxes payable in the condensed consolidated balance sheets as of March 31, 2017 and September 30, 2017 were unrecognized tax benefits of $12.9 million and $13.4 million, respectively, which would favorably impact the effective tax rate in future periods if recognized. The Company’s continuing practice is to recognize interest and/or penalties related to income tax matters in income tax expense in the condensed consolidated statements of operations. The accrued interest related to unrecognized tax benefits was $1.7 million and $1.6 million as of March 31, 2017 and September 30, 2017, respectively. No penalties have been accrued.
The Company and its subsidiaries are subject to taxation in the U.S. federal and various foreign and state jurisdictions. The Company’s Fiscal Year 2016 federal income tax return is currently under examination by the Internal Revenue Service. Foreign income tax matters for material tax jurisdictions have been concluded for tax years prior to Fiscal Year 2012.
30
The Company believes that an adequate provision has been made for any adjustments that may result from tax examinations; however, the outcome of such examinations cannot be predicted with certainty. If any issues addressed in the tax examinations are resolved in a manner inconsistent with the Company's expectations, the Company could be required to adjust its provision for income tax in the period such resolution occurs. The timing of any resolution and/or closure of tax examinations is not certain.
14. COMPUTATION OF EARNINGS PER COMMON SHARE
Basic and diluted earnings per share are computed using the two-class method. The two-class method is an earnings allocation formula that determines net income per share for each class of common stock and participating security according to dividends declared and participation rights in undistributed earnings. Per share amounts are computed by dividing net income attributable to common shareholders by the weighted average shares outstanding during each period.
The Company has a share-based compensation plan under which employees, non-employee directors, and consultants may be granted share-based awards, including shares of restricted stock on which non-forfeitable dividends are paid on unvested shares. As such, shares of restricted stock are considered participating securities under the two-class method of calculating earnings per share. Prior to the second quarter of Fiscal Year 2018, the impact of the two-class method was not considered material and therefore, earnings per share was reported as calculated under the treasury stock method. Had the Company reported earnings per share under the two-class method, basic and diluted earnings per share would have been $0.62 and $0.61, respectively, for the three months ended September 30, 2016 instead of the reported amounts of $0.63 and $0.63, respectively. For the six months ended September 30, 2016, basic and diluted earnings per share would have been $1.23 and $1.21, respectively, instead of the the reported amounts of $1.27 and $1.24, respectively.
31
The following table sets forth the computation of basic and diluted earnings per common share for the three and six months ended September 30, 2016 and 2017:
Three Months Ended September 30, | Six Months Ended September 30, | |||||||||||||||
(in thousands, except per share data) | 2016(1) | 2017 | 2016(1) | 2017 | ||||||||||||
Basic earnings per common share: | ||||||||||||||||
Numerator: | ||||||||||||||||
Net income | $ | 20,474 | $ | 19,953 | $ | 40,861 | $ | 38,781 | ||||||||
Income allocated to participating securities, basic | n/a | (597 | ) | n/a | (1,169 | ) | ||||||||||
Net income attributable to common shareholders, basic | $ | 20,474 | $ | 19,356 | $ | 40,861 | $ | 37,612 | ||||||||
Denominator: | ||||||||||||||||
Weighted average common shares, basic | 32,281 | 32,570 | 32,269 | 32,538 | ||||||||||||
Basic earnings per common share | $ | 0.63 | $ | 0.59 | $ | 1.27 | $ | 1.16 | ||||||||
Diluted earnings per common share: | ||||||||||||||||
Numerator: | ||||||||||||||||
Net income attributable to common shareholders, basic | $ | 20,474 | $ | 19,356 | $ | 40,861 | $ | 37,612 | ||||||||
Net effect of reallocating undistributed earnings of unvested shareholders | n/a | 3 | n/a | 15 | ||||||||||||
Net income attributable to common shareholders, diluted | $ | 20,474 | $ | 19,359 | $ | 40,861 | $ | 37,627 | ||||||||
Denominator: | ||||||||||||||||
Weighted average common shares-basic | 32,281 | 32,570 | 32,269 | 32,538 | ||||||||||||
Dilutive effect of employee equity incentive plans | 445 | 239 | 596 | 573 | ||||||||||||
Weighted average common shares, diluted | 32,726 | 32,809 | 32,865 | 33,111 | ||||||||||||
Diluted earnings per common share | $ | 0.63 | $ | 0.59 | $ | 1.24 | $ | 1.14 | ||||||||
Potentially dilutive securities excluded from diluted earnings per common share because their effect is anti-dilutive | 543 | 1,389 | 634 | 959 | ||||||||||||
(1) As previously disclosed in forms 10-Q and 10-K for Fiscal Year 2017, the two-class method of calculating earnings per share did not have a material impact on the Company's earnings per share calculation for the three and six months ended September 30. 2016; as such, these periods have not been adjusted to reflect the two-class method of calculating earnings per share in the above table.
15. REVENUE AND MAJOR CUSTOMERS
The Company designs, manufactures, markets, and sells headsets for business and consumer applications. With respect to headsets, the Company makes products for use in offices and contact centers and, with mobile devices, cordless phones, computers, and gaming consoles.
The following table presents net revenues by product group for the three and six months ended September 30, 2016 and 2017:
Three Months Ended September 30, | Six Months Ended September 30, | |||||||||||||||
(in thousands) | 2016 | 2017 | 2016 | 2017 | ||||||||||||
Net revenues from unaffiliated customers: | ||||||||||||||||
Enterprise | $ | 154,542 | $ | 162,907 | $ | 310,439 | $ | 317,512 | ||||||||
Consumer | 61,641 | 47,393 | 128,850 | 96,714 | ||||||||||||
Total net revenues | $ | 216,183 | $ | 210,300 | $ | 439,289 | $ | 414,226 | ||||||||
32
For reporting purposes, revenue is attributed to each geographic region based on the location of the customer. Other than the U.S., no country accounted for 10% or more of the Company's net revenues for the three and six months ended September 30, 2016 and 2017. The following table presents net revenues by geography:
Three Months Ended September 30, | Six Months Ended September 30, | |||||||||||||||
(in thousands) | 2016 | 2017 | 2016 | 2017 | ||||||||||||
Net revenues from unaffiliated customers: | ||||||||||||||||
U.S. | $ | 119,062 | $ | 111,095 | $ | 247,300 | $ | 219,905 | ||||||||
Europe and Africa | 51,422 | 56,325 | 105,489 | 111,141 | ||||||||||||
Asia Pacific | 28,588 | 24,227 | 54,815 | 48,111 | ||||||||||||
Americas, excluding U.S. | 17,111 | 18,653 | 31,685 | 35,069 | ||||||||||||
Total international net revenues | 97,121 | 99,205 | 191,989 | 194,321 | ||||||||||||
Total net revenues | $ | 216,183 | $ | 210,300 | $ | 439,289 | $ | 414,226 | ||||||||
One customer, Ingram Micro Group, accounted for 10.7% and 10.4% of net revenues for the three and six months ended September 30, 2016. One customer, Ingram Micro Group, accounted for 12.4% and 12.2% of net revenues for the three and six months ended September 30, 2017, respectively.
One customer, Ingram Micro Group, accounted for 17.6% of total net accounts receivable at March 31, 2017. Two customers, Ingram Micro Group and D&H Distributors, accounted for 15.4% and 11.5%, respectively, of total net accounts receivable at September 30, 2017.
16. SUBSEQUENT EVENTS
On October 31, 2017, the Company announced that its Audit Committee had declared and approved the payment of a dividend of $0.15 per share on December 8, 2017 to holders of record on November 20, 2017.
On October 18, 2017, the Company received a favorable verdict in the antitrust action brought by GN Netcom, Inc. in the U.S. District Court for the District of Delaware. For additional details, refer to Note 6, Commitments and Contingencies.
33
Quantitative and Qualitative Disclosures About Market Risk
The discussion of our exposure to market risk related to changes in interest rates and foreign currency exchange rates contains forward-looking statements that are subject to risks and uncertainties. Actual results could vary materially as a result of a number of factors including those discussed in Part I, "Item 1A. Risk Factors" in our Annual Report on Form 10-K for the fiscal year ended March 31, 2017, filed with the SEC on May 10, 2017.
INTEREST RATE RISK
We reported the following balances in cash and cash equivalents, short-term investments, and long-term investments as follows:
(in millions) | March 31, 2017 | September 30, 2017 | ||||||
Cash and cash equivalents | $ | 302.0 | $ | 303.1 | ||||
Short-term investments | $ | 178.2 | $ | 197.3 | ||||
Long-term investments | $ | 127.2 | $ | 105.3 | ||||
As of September 30, 2017, our investments were composed of Mutual Funds, US Treasury Notes, Government Agency Securities, Commercial Paper, Corporate Bonds, and Certificates of Deposits ("CDs").
Our investment policy and strategy are focused on preservation of capital and supporting our liquidity requirements. Our exposure to market risk for changes in interest rates relates primarily to our investment portfolio. Our investment policy generally limits the amount of credit exposure to any one issuer and requires investments to be high credit quality, primarily rated A or A2 and above, with the objective of minimizing the potential risk of principal loss. All highly liquid investments with initial maturities of three months or less at the date of purchase are classified as cash equivalents. We classify our investments as either short-term or long-term based on each instrument's underlying effective maturity date. All short-term investments have effective maturities of less than 12 months, while all long-term investments have effective maturities greater than 12 months or we do not currently have the ability to liquidate the investment. We may sell our investments prior to their stated maturities for strategic purposes, in anticipation of credit deterioration, or for duration management. No material realized or unrealized gains or losses were recognized during the three and six months ended September 30, 2016 and 2017.
Interest rates were relatively unchanged in the three and six months ended September 30, 2017 compared to the same period in the prior year. We generated $0.8 million and $1.7 million compared to $1.0 million and $2.0 million in interest income in the three and six months ended September 30, 2016 and 2017, respectively. We incurred no significant interest expense from our revolving line of credit in the three and six months ended September 30, 2017. The 5.50% Senior Notes are at a fixed interest rate and we have not elected the fair value option for these instruments; accordingly we are not exposed to any economic interest rate risk related to this indebtedness; however, the fair value of this instrument fluctuates as market interest rates change. The increase in interest expense caused by a 10 basis point increase in the interest rates of our variable-rate revolving line of credit indebtedness would not be significant. A hypothetical 10 basis points increase or decrease on market interest rates related to our investment portfolio would have an immaterial impact on our results of operations.
FOREIGN CURRENCY EXCHANGE RATE RISK
We are a net receiver of currencies other than the USD. Accordingly, changes in exchange rates, and in particular a strengthening of the USD, could negatively affect our net revenues and gross margins as expressed in USD. There is a risk that we will have to adjust local currency product pricing due to competitive pressures if there is significant volatility in foreign currency exchange rates.
The primary currency fluctuations to which we are exposed are the Euro ("EUR"), British Pound Sterling ("GBP"), Australian Dollar ("AUD"), Canadian Dollar ("CAD"), Mexican Peso ("MXN"), and the Chinese Renminbi ("RMB"). We use a hedging strategy to diminish, and make more predictable, the effect of currency fluctuations. All of our hedging activities are entered into with large financial institutions, which we periodically evaluate for credit risks. We hedge our balance sheet exposure by hedging EUR, GBP, AUD, and CAD denominated cash, accounts receivable, and accounts payable balances, and our economic exposure by hedging a portion of anticipated EUR and GBP denominated sales and our MXN denominated expenditures. We can provide no assurance that our strategy will be successful in the future or that exchange rate fluctuations will not materially adversely affect our business. We do not hold or issue derivative financial instruments for speculative trading purposes.
34
The impact of changes in foreign currency rates recognized in other income and (expense), net was immaterial in both the three and six months ended September 30, 2016 and 2017. Although we hedge a portion of our foreign currency exchange exposure, the weakening of certain foreign currencies, particularly the EUR and GBP in comparison to the USD, could result in material foreign exchange losses in future periods.
Non-designated Hedges
We hedge our EUR, GBP, AUD, and CAD denominated cash, accounts receivable, and accounts payable balances by entering into foreign exchange forward contracts. The table below presents the impact on the foreign exchange gain (loss) of a hypothetical 10% appreciation and a 10% depreciation of the USD against the forward currency contracts as of September 30, 2017 (in millions):
Currency - forward contracts | Position | USD Value of Net Foreign Exchange Contracts | Foreign Exchange Gain From 10% Appreciation of USD | Foreign Exchange Loss From 10% Depreciation of USD | |||||||||
EUR | Sell EUR | $ | 28.7 | $ | 3.4 | $ | (3.4 | ) | |||||
GBP | Sell GBP | $ | 6.7 | $ | 0.7 | $ | (0.7 | ) | |||||
AUD | Sell AUD | $ | 10.4 | $ | 1.0 | $ | (1.0 | ) | |||||
CAD | Sell CAD | $ | 2.2 | $ | 0.2 | $ | (0.2 | ) | |||||
Cash Flow Hedges
In the six months ended September 30, 2017, 47% of our net revenues were derived from sales outside of the U.S. and denominated primarily in EUR and GBP.
As of September 30, 2017, we had foreign currency put and call option contracts with notional amounts of approximately €81.7 million and £23.9 million denominated in EUR and GBP, respectively. Collectively, our option contracts hedge against a portion of our forecasted foreign currency denominated sales. If the USD is subjected to either a 10% appreciation or 10% depreciation versus these net exposed currency positions, we could realize a gain of $8.5 million or incur a loss of $10.5 million, respectively.
The table below presents the impact on the Black-Scholes valuation of our currency option contracts of a hypothetical 10% appreciation and a 10% depreciation of the USD against the indicated open option contract type for cash flow hedges as of September 30, 2017 (in millions):
Currency - option contracts | USD Value of Net Foreign Exchange Contracts | Foreign Exchange Gain From 10% Appreciation of USD | Foreign Exchange Loss From 10% Depreciation of USD | ||||||||
Call options | $ | 127.5 | $ | 6.0 | $ | (10.1 | ) | ||||
Put options | $ | 117.5 | $ | 2.5 | $ | (0.4 | ) | ||||
Forwards | $ | 20.2 | $ | 2.1 | $ | (2.0 | ) | ||||
Collectively, our swap contracts hedge against a portion of our forecasted MXN denominated expenditures. As of September 30, 2017, we had cross-currency swap contracts with notional amounts of approximately MXN 134.2 million.
The table below presents the impact on the valuation of our cross-currency swap contracts of a hypothetical 10% appreciation and a 10% depreciation of the USD as of September 30, 2017 (in millions):
Currency - cross-currency swap contracts | Position | USD Value of Net Foreign Exchange Contracts | Foreign Exchange Loss From 10% Appreciation of USD | Foreign Exchange Gain From 10% Depreciation of USD | ||||||||
MXN | Buy MXN | $ | 7.0 | $ | (0.9 | ) | $ | 0.5 | ||||
35
Controls and Procedures
(a) | Evaluation of disclosure controls and procedures |
Our management evaluated, with the participation of our Chief Executive Officer and our Chief Financial Officer, the effectiveness of our disclosure controls and procedures as of the end of the period covered by this Quarterly Report on Form 10-Q. Based on this evaluation, our Chief Executive Officer and our Chief Financial Officer have concluded that our disclosure controls and procedures are effective as of the end of the period covered by this report to ensure that information we are required to disclose in reports that we file or submit under the Securities Exchange Act of 1934 (i) is recorded, processed, summarized and reported within the time periods specified in Securities and Exchange Commission rules and forms, and (ii) is accumulated and communicated to our management, including our Chief Executive Officer and our Chief Financial Officer, as appropriate to allow timely decisions regarding required disclosure.
(b) | Changes in internal control over financial reporting |
There have not been any changes in the Company’s internal control over financial reporting during the period covered by this Quarterly Report on Form 10-Q that have materially affected, or are reasonably likely to materially affect, its internal control over financial reporting.
PART II -- OTHER INFORMATION
LEGAL PROCEEDINGS
We are presently engaged in various legal actions arising in the normal course of business. We believe that it is unlikely that any of these actions will have a material adverse impact on our operating results; however, because of the inherent uncertainties of litigation, the outcome of any of these actions could be unfavorable and could have a material adverse effect on our financial condition, results of operations or cash flows. For additional information about our material legal proceedings, please see Note 6, Commitments and Contingencies, of the accompanying notes to the condensed consolidated financial statements.
RISK FACTORS
You should carefully consider the risk factors discussed in Part I, "Item 1A. Risk Factors" in our Annual Report on Form 10-K for the fiscal year ended March 31, 2017, filed with the SEC on May 10, 2017, each of which could materially affect our business, financial position, or future results of operations.
The risks described in our Annual Report on Form 10-K for the fiscal year ended March 31, 2017 are not the only risks we face. Additional risks and uncertainties not currently known to us or that we currently deem to be immaterial also may materially adversely affect our business, financial position, or future results of operations.
36
UNREGISTERED SALES OF EQUITY SECURITIES AND USE OF PROCEEDS
Share Repurchase Programs
The following table presents a month-to-month summary of the stock purchase activity in the second quarter of fiscal year 2018:
Total Number of Shares Purchased 1 | Average Price Paid per Share 2 | Total Number of Shares Purchased as Part of Publicly Announced Plans or Programs 1 | Maximum Number of Shares that May Yet Be Purchased Under the Plans or Programs 6 | |||||||||
July 2, 2017 to July 28, 2017 | 11,024 | 3 | $ | 51.51 | 7,776 | 1,609,352 | ||||||
July 29, 2017 to August 25, 2017 | 305,380 | 4 | $ | 44.30 | 304,262 | 1,305,090 | ||||||
August 26, 2017 to September 30, 2017 | 278,426 | 5 | $ | 42.86 | 276,504 | 1,028,586 | ||||||
1 | On July 29, 2016 and July 27, 2017, respectively, the Board of Directors authorized programs to repurchase 1,000,000 shares of our common stock from time to time in the market or in privately negotiated repurchases as determined by management. | |
2 | "Average Price Paid per Share" reflects open market repurchases of common stock only. | |
3 | Includes 3,248 shares that were tendered to us in satisfaction of employee tax withholding obligations upon the vesting of restricted stock granted under our stock plans. | |
4 | Includes 1,118 shares that were tendered to us in satisfaction of employee tax withholding obligations upon the vesting of restricted stock granted under our stock plans. | |
5 | Includes 1,922 shares that were tendered to us in satisfaction of employee tax withholding obligations upon the vesting of restricted stock granted under our stock plans. | |
6 | These shares reflect the available shares authorized for repurchase under the programs approved by the Board on July 29, 2016 and July 27, 2017. | |
37
EXHIBITS
We have filed the following documents as Exhibits to this Form 10-Q:
Exhibit Number | Incorporation by Reference | Filed Herewith | ||||||||||
Exhibit Description | Form | File No. | Exhibit | Filing Date | ||||||||
X | ||||||||||||
X | ||||||||||||
X | ||||||||||||
X | ||||||||||||
8-K | 001-12696 | 10.1 | 8/4/2017 | |||||||||
8-K | 001-12696 | 10.2 | 8/4/2017 | |||||||||
X | ||||||||||||
101.INS | XBRL Instance Document | X | ||||||||||
101.SCH | XBRL Taxonomy Extension Schema Document | X | ||||||||||
101.CAL | XBRL Taxonomy Extension Calculation Linkbase Document | X | ||||||||||
101.LAB | XBRL Taxonomy Extension Label Linkbase Document | X | ||||||||||
101.PRE | XBRL Taxonomy Extension Presentation Linkbase Document | X | ||||||||||
101.DEF | XBRL Taxonomy Definition Linkbase Document | X | ||||||||||
* Indicates a management contract or compensatory plan, contract or arrangement in which any director or any executive officer participates.
38
Plantronics, Inc.
FORM 10-Q
CROSS REFERENCE TABLE
Item Number | Page(s) | ||
PART I. FINANCIAL INFORMATION | |||
- | |||
- | |||
- | |||
PART II. OTHER INFORMATION | |||
Signatures | |||
39
SIGNATURES
Pursuant to the requirements of the Securities Exchange Act of 1934, the registrant has duly caused this report to be signed on its behalf by the undersigned thereunto duly authorized.
PLANTRONICS, INC. | |||
Date: | October 31, 2017 | By: | /s/ Pamela Strayer |
Name: | Pamela Strayer | ||
Title: | Senior Vice President and Chief Financial Officer | ||
40