Attached files
| file | filename |
|---|---|
| EX-32.1 - EXHIBIT 32.1 - PLANTRONICS INC /CA/ | ex321fy18.htm |
| EX-31.2 - EXHIBIT 31.2 - PLANTRONICS INC /CA/ | ex312fy18.htm |
| EX-31.1 - EXHIBIT 31.1 - PLANTRONICS INC /CA/ | ex311fy18.htm |
| EX-23 - EXHIBIT 23 - PLANTRONICS INC /CA/ | ex23fy18.htm |
| EX-21 - EXHIBIT 21 - PLANTRONICS INC /CA/ | ex21fy18.htm |
UNITED STATES
SECURITIES AND EXCHANGE COMMISSION
Washington, D.C. 20549
FORM 10-K
(MARK ONE)
x | ANNUAL REPORT PURSUANT TO SECTION 13 OR 15(d) OF THE SECURITIES EXCHANGE ACT OF 1934 |
For the fiscal year ended March 31, 2018
OR
o | TRANSITION REPORT PURSUANT TO SECTION 13 OR 15(d) OF THE SECURITIES EXCHANGE ACT OF 1934 |
For the transition period from ___________ to _____________
Commission file number: 1-12696
Plantronics, Inc.
(Exact name of registrant as specified in its charter)
Delaware | 77-0207692 | |
(State or other jurisdiction of incorporation or organization) | (I.R.S. Employer Identification Number) | |
345 Encinal Street, Santa Cruz, California | 95060 | |
(Address of principal executive offices) | (Zip Code) | |
(831) 426-5858
(Registrant's telephone number, including area code)
Securities registered pursuant to Section 12(b) of the Act:
Title of each class | Name of each exchange on which registered | |
COMMON STOCK, $0.01 PAR VALUE | NEW YORK STOCK EXCHANGE | |
Securities registered pursuant to Section 12(g) of the Act:
NONE
(Title of Class)
Indicate by check mark if the Registrant is a well-known seasoned issuer, as defined in Rule 405 of the Securities Act.
Yes x No ¨
Indicate by check mark if the Registrant is not required to file reports pursuant to Section 13 or Section 15(d) of the Act.
Yes ¨ No x
Indicate by check mark whether the Registrant (1) has filed all reports required to be filed by Section 13 or 15(d) of the Securities Exchange Act of 1934 during the preceding 12 months (or for such shorter period that the Registrant was required to file such reports), and (2) has been subject to such filing requirements for the past 90 days. Yes x No ¨
Indicate by check mark whether the Registrant has submitted electronically and posted on its corporate Website, if any, every Interactive Data File required to be submitted and posted pursuant to Rule 405 of Regulation S-T during the preceding 12 months (or for such shorter period that the Registrant was required to submit and post such files). Yes x No ¨
Indicate by check mark if disclosure of delinquent filers pursuant to Item 405 of Regulation S-K is not contained herein, and will not be contained, to the best of the Registrant's knowledge, in definitive proxy or information statements incorporated by reference in Part III of this Form 10-K or any amendment to this Form 10-K. ¨
Indicate by check mark whether the Registrant is a large accelerated filer, an accelerated filer, a non-accelerated filer, or a smaller reporting company. See the definitions of “large accelerated filer,” “accelerated filer,” and “smaller reporting company” in Rule 12b-2 of the Exchange Act. (Check one).
Large Accelerated Filer x | Accelerated Filer ¨ |
Non-accelerated Filer ¨ (Do not check if a smaller reporting company) | Smaller Reporting Company ¨ |
Emerging Growth Company ¨ | |
If an emerging growth company, indicate by check mark if the registrant has elected not to use the extended transition period for complying with any new or revised financial accounting standards provided pursuant to Section 13(a) of the Exchange Act. ¨
Indicate by check mark whether the Registrant is a shell company (as defined in Rule 12b-2 of the Act). Yes ¨ No x
The aggregate market value of the common stock held by non-affiliates of the Registrant, based upon the closing price of $44.22 for shares of the Registrant's common stock on September 29, 2017, the last trading day of the Registrant’s most recently completed second fiscal quarter as reported by the New York Stock Exchange, was approximately $1,459,034,920. In calculating such aggregate market value, shares of common stock owned of record or beneficially by officers, directors, and persons known to the Registrant to own more than five percent of the Registrant's voting securities as of September 29, 2017 (other than such persons of whom the Registrant became aware only through the filing of a Schedule 13G filed with the Securities and Exchange Commission) were excluded because such persons may be deemed to be affiliates. This determination of affiliate status is for purposes of this calculation only and is not conclusive.
As of May 7, 2018, 49,290,493 shares of common stock were outstanding.
DOCUMENTS INCORPORATED BY REFERENCE
Portions of the Registrant's Proxy Statement for its 2018 Annual Meeting of Stockholders are incorporated by reference into Part III of this Form 10-K. Such proxy statement will be filed with the Securities and Exchange Commission within 120 days of the registrant’s fiscal year ended March 31, 2018.

Plantronics, Inc.
FORM 10-K
For the Year Ended March 31, 2018
TABLE OF CONTENTS
Part I. | Page | ||
Item 1. | |||
Item 1A. | |||
Item 1B. | |||
Item 2. | |||
Item 3. | |||
Item 4. | |||
Part II. | |||
Item 5. | |||
Item 6. | |||
Item 7. | |||
Item 7A. | |||
Item 8. | |||
Item 9. | |||
Item 9A. | |||
Item 9B. | |||
Part III. | |||
Item 10. | |||
Item 11. | |||
Item 12. | |||
Item 13. | |||
Item 14. | |||
Part IV. | |||
Item 15. | |||
Plantronics®, and Simply Smarter Communications® are trademarks or registered trademarks of Plantronics, Inc.
DECT™ is a trademark of ETSI registered for the benefit of its members in France and other jurisdictions.
The Bluetooth name and the Bluetooth® trademarks are owned by Bluetooth SIG, Inc. and are used by Plantronics, Inc. under license.
All other trademarks are the property of their respective owners.
PART I
This Form 10-K is filed with respect to our Fiscal Year 2018. Each of our fiscal years end on the Saturday closest to the last day of March. Fiscal years 2018 and 2017 each had 52 weeks and ended on March 31, 2018 and April 1, 2017, respectively. Fiscal Year 2016 had 53 weeks and ended on April 2, 2016. For purposes of consistent presentation, we have indicated in this report that each fiscal year ended "March 31" of the given year, even though the actual fiscal year end was on a different date.
CERTAIN FORWARD-LOOKING INFORMATION
This Form 10-K contains forward-looking statements within the meaning of Section 27A of the Securities Act of 1933, as amended (the “Securities Act”), and Section 21E of the Securities Exchange Act of 1934, as amended (the “Exchange Act”). These statements may generally be identified by the use of such words as "expect," "anticipate," "believe," "estimate," "intend," "predict," "project," or "will," or variations of such words and similar expressions are based on current expectations and entail various risks and uncertainties. Our actual results could differ materially from those anticipated in such forward-looking statements as a result of a number of factors, including, but not limited to, the factors discussed in the subsection entitled "Risk Factors" in Item 1A of this Form 10-K. This Form 10-K should be read in conjunction with these risk factors. We undertake no obligation to update or revise publicly any forward-looking statements, whether as a result of new information, future events, or otherwise, except as required by applicable law.
ITEM 1. BUSINESS
COMPANY BACKGROUND
Plantronics, Inc. (“Plantronics,” “Company,” “we,” “our,” or “us”) is a leading global designer, manufacturer, and marketer of lightweight communications headsets, audio solutions, telephone headset systems, other communication endpoints, and accessories for the business and consumer markets under the Plantronics brand. We operate our business as one segment.
Our headsets are communications tools that provide a hands-free connection to communication or entertainment devices and freedom of movement for our users. We use a variety of technologies to develop high quality products that meet our customers needs for communications or personal entertainment. Our headsets are widely used with applications such as Unified Communications & Collaboration ("UC&C"), in contact centers, offices and homes, with mobile devices and Internet Protocol (IP) telephony, for gaming, and for other specialty applications. Our major product categories are Enterprise, which includes corded and cordless communication headsets, audio processors, and telephone systems; and Consumer, which includes Bluetooth and corded products for mobile device applications, personal computer ("PC") and gaming headsets. We also offered specialty products marketed for hearing impaired individuals under our Clarity brand, which was included in our Consumer product category until the divestiture of Clarity on July 1, 2017.
We ship our products to approximately 80 countries through a network of distributors, retailers, resellers, wireless carriers, original equipment manufacturers (“OEMs”), and telephony and other service providers. We have well-developed distribution channels in North America, Europe, and some parts of the Asia Pacific region where use of our products is widespread. Our distribution channels in other geographic regions are less mature, and while we primarily serve the Enterprise markets in those regions, we continue to expand into mobile, gaming and computer audio, and other categories in those regions and other international locations. While not always the case, revenues from our Consumer category are typically seasonal, with the third fiscal quarter typically being the strongest due to the holiday shopping season.
Plantronics was founded and incorporated in 1961 and most recently became a public company in 1994. Plantronics is incorporated in the State of Delaware and is listed on the New York Stock Exchange ("NYSE") under the ticker symbol "PLT".
Our principal executive offices are located at 345 Encinal Street, Santa Cruz, California, 95060. Our telephone number is (831) 426-5858. Our Company website is www.plantronics.com.
In the Investor Relations section of our website, investor.plantronics.com, we provide free access to the following filings: our Annual Reports on Form 10-K, Quarterly Reports on Form 10-Q, Current Reports on Form 8-K, and all amendments to those reports filed or furnished pursuant to Section 13(a) or 15(d) of the Exchange Act. This access is provided directly or through a link on our website, shortly after these documents are electronically filed with, or furnished to, the Securities and Exchange Commission. In addition, documents regarding our corporate governance, code of conduct, and the charters of the standing committees of our Board of Directors are also accessible in the Investor Relations section of our website.
1
MARKET INFORMATION
General Industry Background
Plantronics operates predominantly in the electronics industry and focuses on the design, manufacture, and distribution of audio solutions for business and consumer applications. We develop enhanced communication products for offices, contact centers, mobile devices, cordless phones, computers and gaming consoles. We offer our products under one brand – Plantronics.
The proliferation of voice communications applications across people's daily lives makes communications headsets a key driver of efficiency, ergonomic comfort and safety for our users. The increased adoption of new and existing technologies, such as UC&C, Bluetooth, Voice over Internet Protocol ("VoIP"), Digital Signal Processing ("DSP"), and Digital Enhanced Cordless Telecommunications (“DECT™”), each of which is described below, has contributed to demand for our headsets and other audio solutions in new and evolving markets:
• | UC&C includes the categories of Unified Communications ("UC") (IP telephony, instant messaging, presence, unified messaging) as well as Team collaboration (persistent chat and team workspaces, integrated UC, application integrations) and Meetings (integrated audio, video and web conferencing). UC&C seeks to provide seamless connectivity and user experience for enterprise workers regardless of their location and environment, improve overall business efficiency and provide more effective collaboration among an increasingly distributed workforce. |
• | Bluetooth wireless technology is a short-range communications protocol intended to replace the cables connecting portable and/or fixed devices while maintaining high levels of security. The key features of Bluetooth technology are ubiquity, low power, and low cost. The Bluetooth specification defines a uniform structure for a wide range of devices to connect and communicate with each other. Bluetooth standard has achieved global acceptance such that any Bluetooth enabled device, almost anywhere in the world, can connect to other Bluetooth enabled devices in proximity. |
• | VoIP is a technology that allows a person to communicate using a broadband internet connection instead of a regular (or analog) telephone line. VoIP converts the voice signal into a digital signal that travels over the internet or other packet-switched networks and then converts it back at the other end so that the caller can speak to anyone with another VoIP connection or a regular (or analog) phone line. |
• | DSP is a technology that delivers acoustic protection and optimal sound quality through noise reduction, echo cancellation, and other algorithms which improve transmission quality. |
• | DECT is a wireless communications technology that optimizes audio quality, lowers interference with other wireless devices, and digitally encrypts communication for heightened call security. |
Solutions
UC&C solutions continue to represent our primary area of focus. Our portfolio of solutions, which combines hardware with highly innovative sensor technology and software functionality, provides the ability to reach people using the mode of communication that is most effective, on the device that is most convenient, and with control over when and how people can be reached. In addition we have recognized the importance of supporting remote and mobile work styles that are more prevalent in UC&C environments and the trend toward open plan offices which causes unique noise challenges for office-based work styles. We have invested in a full portfolio of solutions to manage noise including specially tuned noise-canceling microphones to minimize transmission of background noise on calls and headsets that feature active noise-canceling technology to reduce distractions in open plan environments. Finally, our solutions allow users to transition calls seamlessly between PCs, smartphones, tablets, and desk phones, without interrupting the conversation or reducing the audio quality. We believe we are still early in the UC&C solutions market adoption cycle and that UC&C systems will become more commonly adopted by enterprises to reduce costs and improve collaboration. We believe our solutions will be an important part of the UC&C environment through the offering of contextual intelligence, a full portfolio of products designed according to quantitatively researched global work styles, and a unique software-as-a-service solution that allows customers to manage Plantronics audio device assets as well as track UC&C adoption down to the endpoint level.
2
Our products enhance communications by providing the following benefits:
• | Sensor technology that allows calls to be answered automatically when the user wears the headset, switches the audio from the headset to a mobile device when the user removes the headset and, with some softphone applications, updates the user's presence |
• | Smarter Working capability through seamless communications and high quality audio across a mobile device, desk phone, and PC with a single audio endpoint which allows users to communicate from a wide array of physical locations and increases productivity when away from a traditional office environment |
• | A convenient means for connecting various applications and voice networks, whether between land lines and mobile devices, or between PC-based communications and other networks |
• | Better sound quality that provides clearer conversations on both ends of a call through a variety of features and technologies, including noise-canceling microphones, DSP, and more |
• | Wireless freedom, allowing people to be on calls without cords or cables and to easily switch from public to private spaces |
• | Multi-tasking benefits that allow people to use computers and mobile devices, including smartphones or other devices, while talking hands-free |
• | UC&C integration of telephony, mobile technologies, cloud-based communications, and PC applications, while providing privacy greater than traditional speakerphones |
• | Generating analytics our customers desire |
• | Compliance with hands-free legislation and enhanced roadway safety by allowing users to drive while talking on a mobile phone |
• | Voice command and control that allows users to take advantage of voice dialing and/or other voice-based features which make communications and the human/electronic interface more natural and convenient |
Product Categories
Our audio solutions are designed to meet the needs of offices (ranging from enterprise to remote working), contact centers, mobile devices (such as mobile phones, smartphones, and tablets), computer and gaming, residential, and other applications. Our customers' needs are increasingly overlapping as work styles and lifestyles change, and people use devices for multiple functions such as communication, music, and video entertainment. We serve our customers' needs through our product categories listed below.
Enterprise
The Enterprise market comprises our largest revenue stream and we believe it also represents our largest growth opportunity. We offer a broad range of audio communications solutions which include high-end, ergonomically designed headsets, audio processors, and other contact center systems. Our end-users comprise enterprise employees and small office, home office, and remote workers. Growth in this market comes from the following three main factors:
• | Increasing deployment of UC&C solutions |
• | Robust job market |
• | Growing awareness of the benefits of using headsets and the benefits of wireless solutions |
Contact centers are some of our most mature customers and, although they are adopting UC&C to help improve productivity and reduce costs, we expect contact center demand to grow slowly over the long-term. As UC&C adoption continues to increase, we expect to continue leading in new product performance by creating solutions that combine hardware and software for an improved customer experience.
3
Consumer
The consumer market for communications headsets is currently going through a transition. Large brands are dominating this space in several ways: high growth is being seen in music-first brands that also allow communications, as well as headsets or ear buds that are bundled with smart phones. Our strategy is to focus on consumer categories where audio quality and communications is important to the customer. The use of mono mobile headsets has experienced a notable decline in recent years, while the use of stereo Bluetooth technology has increased as individuals want to remain wireless without compromising on stereo sound quality. Our mono and stereo Bluetooth headsets merge technological innovations with style, because we believe style shapes consumers' purchasing decisions within the wearable technology space. A key focus in our stereo Bluetooth headsets is "noise-canceling" solutions which are increasingly popular and strengthen our relevance in premium immersive technology experiences. We are taking a disciplined approach in the consumer market by routinely refreshing our product offerings and being more selective in our product placement.
We believe future growth opportunities exist in gaming headsets where audio quality and communications are highly valued by customers. The current popularity of multi-player console games is driving secular growth in this space. We believe we are gaining solid traction in the console gaming space and have become a credible player in this category of the consumer market. Gaming headsets, whether used for interactive on-line or console gaming, or switching between music and phone calls for multi-functional devices, represent an opportunity in a distinct user market. As these users' needs converge, our headsets need to be compatible with PCs, mobile phones, tablets, gaming consoles, and various combinations of these devices.
FOREIGN OPERATIONS
In Fiscal Years 2016, 2017, and 2018, net revenues outside the U.S. accounted for approximately 44%, 45%, and 49%, respectively, of our total net revenues. Revenues derived from foreign sales are generally subject to additional risks, such as fluctuations in exchange rates, increased tariffs, the imposition of other trade restrictions or barriers, the impact of adverse global economic conditions, and potential currency restrictions. In Fiscal Year 2018, consolidated net revenues were favorably impacted by fluctuations in exchange rates resulting in an increase of approximate $9 million (net of the effects of hedging).
We continue to engage in hedging activities to limit our transaction and economic exposures, and to mitigate our exchange rate risks. We manage our economic exposure by hedging a portion of our anticipated Euro ("EUR") and British Pound Sterling ("GBP") denominated sales and our Mexican Peso ("MXN") denominated expenditures, which together constitute the most significant portion of our currency exposure. In addition, we manage our balance sheet exposure by hedging EUR, GBP, Australian Dollar ("AUD"), and Canadian Dollar ("CAD") denominated cash, accounts receivable, and accounts payable balances. Excess foreign currencies not required for local operations are converted into U.S. Dollars ("USD"). While our existing hedges cover a certain amount of exposure for Fiscal Year 2019, long-term strengthening of the USD relative to the currencies of other countries in which we sell may have a material adverse impact on our financial results. In addition, our results may be adversely impacted by future changes in foreign currency exchange rates relative to original hedging contracts generally secured 12 to 24 months prior. See further discussion on our business risks associated with foreign operations under the risk titled, "We are exposed to differences and frequent fluctuations in foreign currency exchange rates, which may adversely affect our revenues, gross profit, and profitability" within Item 1A Risk Factors in this Form 10-K.
Further information regarding our foreign operations, as required by Item 101(d) of Regulation S-K, can be found in Note 18, Geographic Information, of our Notes to Consolidated Financial Statements in this Form 10-K.
COMPETITION
The market for our products is competitive and some of our competitors have greater financial resources than we do, as well as more substantial production, marketing, engineering and other capabilities to develop, manufacture, market, and sell their products.
One of our primary competitors in the Enterprise market is GN Audio, a subsidiary of the GN Group, a Danish telecommunications conglomerate that competes with us in the Enterprise and Consumer markets and, to a lesser extent, in the gaming category. Other competitors in the Enterprise market include Sennheiser Communications, Logitech and regional companies who offer products for the computer, office and/or contact center. In addition, Apple, Bose, Logitech, LG, Motorola and Samsung are significant competitors in the consumer headset category. In addition, Turtle Beach, Logitech, and Razer are competitors in the gaming category.
4
We believe the principal factors to be successful and competitive in each of the markets we serve are as follows:
• | Understanding emerging trends and new communication technologies, such as UC&C, and our ability to react quickly to opportunities as they arise |
• | Alliances and integration/compatibility with major UC&C vendors |
• | Ability to design, manufacture, and sell products that deliver on performance, style, comfort, features, sound quality, simplicity, price, and reliability |
• | Ability to create and monetize software solutions from headset analytics that allow businesses to improve IT and employee performance through insights derived from the analytics |
• | Brand name recognition and reputation |
• | Superior global customer service, support, and warranty terms |
• | Effective and efficient global distribution channels |
We believe our products and strategy enable us to compete effectively based on these factors.
RESEARCH AND DEVELOPMENT
The success of our new products is dependent on a number of factors, including appropriate new product selection, timely completion and introduction, cost-effective manufacturing, quality and durability, acceptance of new technologies, and general market acceptance. See further discussion regarding our business risks associated with our manufacturers under the risk titled, "Our business will be materially adversely affected if we are unable to develop, manufacture, integrate and market new products in response to changing customer requirements and new technologies" within Item 1A Risk Factors in this Form 10-K.
During Fiscal Years 2016, 2017, and 2018, we incurred approximately $90.4 million, $88.3 million, and $84.2 million, respectively, in research, development, and engineering expenses. Historically, we have conducted most of our research, development, and engineering with an in-house staff and a limited use of contractors. Key locations for our research, development, and engineering staff are in the U.S., Mexico, China, and the United Kingdom.
During Fiscal Year 2018, we developed and introduced innovative products that enabled us to better address changing customer demands and emerging trends. Our goal is to bring the right products to customers at the right time utilizing best-in-class development processes.
The products we are developing require significant technological knowledge and the ability to rapidly develop the products in intensely competitive and transforming markets. We believe our deep technological knowledge and intellectual property gives us a competitive advantage. We furthermore continually strive to improve the efficiency of our development processes through, among other things, strategic architecting, common platforms, and increased use of software and test tools.
SALES AND DISTRIBUTION
We maintain a worldwide sales force to provide ongoing global customer support and service. To support our customers' needs, we have a well-established, multi-level distribution network in North America, Europe, and in some parts of the Asia Pacific region where use of our products is widespread. Our distribution channels in other regions are less mature and we primarily serve the Enterprise market in those regions.
Our global commercial sales channel includes technology and electronics distributors, and national and regional resellers. Our resellers typically offer a wide variety of products from multiple vendors to other resellers as well as end users. Our commercial distribution channel generally maintains an inventory of our products. Our distribution of specialty products includes distributors, retail, government programs, and health care professionals.
Our retail channel consists of both traditional and online consumer electronics retailers, consumer product retailers, office supply distributors, wireless carriers, catalog and mail order companies, and mass merchants. Our headsets are sold through retailers to corporate customers, small businesses, and individuals who use them for a variety of personal and professional purposes. Revenues from this channel are seasonal, with our third fiscal quarter typically being the strongest quarter due to holiday seasonality.
5
We have a diverse group of customers located throughout the world. Our principal channel partners are distributors, retailers, and carriers. Our commercial distributors and retailers represent our first and second largest sales channels in terms of net revenues, respectively. One customer, Ingram Micro Group, accounted for 10.9% of consolidated net revenues in each of Fiscal Years 2018 and 2017. No customer accounted for more than 10% of our consolidated net revenues in Fiscal Year 2016.
Our distributors, resellers, system integrators, managed service providers, e-commerce partners, telephony and computer equipment providers resell our commercial headsets and end point products. Wireless carriers, retailers, and e-commerce partners also sell our consumer headsets as Plantronics-branded products. Carriers purchase headset products from us for use by their own customer service representatives and in some cases, also offer headsets to their customers.
We have also established strong UC&C alliances with leading providers of UC&C software solutions, and these alliances enhance the sales and distribution of our products to large enterprises deploying UC&C solutions. In some cases, these partners also resell our solutions to customers as part of a broader communications solution.
Our products may also be purchased directly from our website at www.plantronics.com.
We continue to evaluate our logistics processes and implement new strategies to further reduce our transportation costs and improve lead-times to customers. Currently, we have distribution centers in the following locations:
• | Tijuana, Mexico, which provides logistics services for products destined for customers in the U.S., Canada, Asia Pacific, Middle East, and Latin America regions |
• | Prague, Czech Republic, which provides logistics services for products shipped to customers in our Europe and Africa regions |
• | Suzhou, China, which provides logistics services for products shipped to customers in Mainland China |
• | Melbourne, Australia, which provides logistics services for products shipped to the retail channel in Australia and New Zealand |
• | Tokyo, Japan, which provides logistics services for products shipped to customers in Japan |
With respect to the above locations, we use third party warehouses in the Czech Republic, Australia, and Japan. We also operate warehouse facilities in Mexico and China.
BACKLOG
Our backlog of unfilled orders was $18.6 million and $26.4 million at March 31, 2017 and 2018, respectively. We include all purchase orders scheduled for future delivery in backlog. We have a “book and ship” business model whereby we fulfill most orders within 48 hours of receipt. As a result, our net revenues in any fiscal year depend primarily on orders booked and shipped in that year. In addition, our backlog is occasionally subject to cancellation or rescheduling by the customer on short notice with little or no penalty. Therefore, there is a lack of meaningful correlation between backlog at the end of a fiscal year and the following fiscal year's net revenues. Similarly, there is a lack of meaningful correlation between year-over-year changes in backlog as compared with year-over-year changes in net revenues. As a result, we do not believe that backlog information is material to an understanding of our overall business.
MANUFACTURING AND SOURCES OF MATERIALS
Our manufacturing operations consist primarily of assembly, testing and packaging, which are performed in our facility in Tijuana, Mexico. We outsource the manufacturing of our Bluetooth products to third party manufacturers in China. We also outsource the manufacturing of a limited number of our other products to third parties, typically in China and other countries in Asia. For a further discussion of the business risks associated with our manufacturers see the risk titled, "We have significant manufacturing, assembly and packaging operations in Mexico and rely on third party manufacturers located outside of U.S., and a significant amount of our revenues are generated internationally, each of which subjects our business to risks of international operations" within Item 1A Risk Factors in this Annual Report on Form 10-K.
6
We purchase the components for our products primarily from suppliers in Asia, Mexico, and U.S., including proprietary custom integrated circuits, electrical and mechanical components, and sub-assemblies. A majority of the components and sub-assemblies used in our manufacturing operations are obtained, or are reasonably available, from dual-source suppliers, although we do have a number of sole-source suppliers.
We procure materials to meet forecasted customer requirements. Special products and certain large orders are quoted for delivery after receipt of orders at specific lead time. We maintain a minimum level of finished goods based on estimated market demand, in addition to inventories of raw materials, work in process, sub-assemblies, and components. In addition, a substantial portion of the raw materials, components, and sub-assemblies used in our products are provided by our suppliers on a consignment basis. Refer to “Off Balance Sheet Arrangements and Contractual Obligations”, within Item 7, Management's Discussion and Analysis, in this Annual Report on Form 10-K for additional details regarding consigned inventories. We write down inventory items determined to be either excess or obsolete to their net realizable value.
ENVIRONMENTAL MATTERS
We are subject to various federal, state, local, and foreign environmental laws and regulations, including those governing the use, discharge, and disposal of hazardous substances in the ordinary course of our manufacturing process. We believe that our current manufacturing and other operations comply in all material respects with applicable environmental laws and regulations. We are required to comply and we believe are currently in compliance with the European Union (“EU”) and other Directives on the Restrictions of the use of Certain Hazardous Substances in Electrical and Electronic Equipment (“RoHS”) and on Waste Electrical and Electronic Equipment (“WEEE”) requirements. Additionally, we believe we are compliant with the RoHS initiatives in China and Korea; however, it is possible that future environmental legislation may be enacted or current environmental legislation may be interpreted to create an environmental liability with respect to our facilities, operations, or products. See further discussion of our business risks associated with environmental legislation under the risk titled, "We are subject to environmental laws and regulations that expose us to a number of risks and could result in significant liabilities and costs" within Item 1A Risk Factors of this Form 10-K.
INTELLECTUAL PROPERTY
We obtain patent protection for our technologies when we believe it is commercially appropriate. As of March 31, 2018, we had approximately 800 worldwide utility and design patents in force, expiring between calendar years 2018 and 2042.
We intend to continue seeking patents on our inventions when commercially appropriate. Our success will depend in part on our ability to obtain patents and preserve other intellectual property rights covering the design and operation of our products. See further discussion of our business risks associated with our intellectual property under the risk titled, "Our intellectual property rights could be infringed on by others, and we may infringe on the intellectual property rights of others resulting in claims or lawsuits. Even if we prevail, claims and lawsuits are costly and time consuming to pursue or defend and may divert management's time from our business" within Item 1A Risk Factors of this Form 10-K.
We own trademark registrations in the U.S. and in a number of other countries with respect to the Plantronics trademarks, as well as the names of many of our products and product features. We currently have pending U.S. and foreign trademark applications in connection with certain new products and product features and may seek copyright protection where we believe it is applicable. We own a number of domain name registrations and intend to seek more as appropriate. We also attempt to protect our trade secrets and other proprietary information through comprehensive security measures, including agreements with customers and suppliers, and proprietary information agreements with employees and consultants. See further discussion of our business risks associated with intellectual property under the risk titled "Our intellectual property rights could be infringed on by others, and we may infringe on the intellectual property rights of others resulting in claims or lawsuits. Even if we prevail, claims and lawsuits are costly and time consuming to pursue or defend and may divert management’s time from our business."
POLYCOM ACQUISITION
On March 28, 2018, we announced a definitive Stock Purchase Agreement (the “Purchase Agreement”) with Triangle Private Holdings II, LLC (“Triangle”) and Polycom, Inc. (“Polycom”) a privately-held company, pursuant to which, subject to the satisfaction or waiver of certain conditions set forth therein, we will purchase from Triangle all of the issued and outstanding shares of capital stock of Polycom (the “Polycom Transaction”).
We believe this acquisition will enhance the Plantronics position with our channel partners, customers, and strategic alliance partners by allowing us to pursue additional opportunities across the UC&C market in both hardware end points and services. The addition of Polycom’s product and services portfolio, is expected to enable us to accelerate our strategic vision of becoming
7
a global leader in communications and collaboration experiences. We believe this acquisition will position us to capture additional opportunities through data analytics and insight services across a broad portfolio of communications endpoints.
EMPLOYEES
On March 31, 2018, we employed approximately 4,003 employees worldwide, including approximately 2,905 employees at our manufacturing facility in Tijuana, Mexico. To our knowledge, no employees are currently covered by collective bargaining agreements.
EXECUTIVE OFFICERS OF THE REGISTRANT
Set forth in the table below is certain information regarding the executive team of Plantronics:
NAME | AGE | POSITION | ||
Joe Burton | 53 | President and Chief Executive Officer | ||
Pamela Strayer | 49 | Senior Vice President and Chief Financial Officer | ||
Mary Huser | 54 | Senior Vice President, General Counsel and Corporate Secretary | ||
Jeff Loebbaka | 56 | Senior Vice President, Global Sales | ||
Shantanu Sarkar | 49 | Senior Vice President, Enterprise Line of Business | ||
Mr. Burton joined Plantronics in 2011 as Senior Vice President of Engineering and Development and Chief Technology Officer and was promoted to various positions including Executive Vice President and Chief Commercial Officer before being named President and Chief Executive Officer and appointed to our Board of Directors in 2016. Prior to joining Plantronics, Mr. Burton held various executive management, engineering leadership, strategy, and architecture-level positions. From 2010 to 2011, Mr. Burton was employed by Polycom, Inc., a global provider of unified communications solutions for telepresence, video, and voice, most recently as Executive Vice President, Chief Strategy and Technology Officer and, for a period of time, as General Manager, Service Provider concurrently with his technology leadership role. From 2001 to 2010, Mr. Burton was employed by Cisco Systems, Inc., a global provider of networking equipment, and served in various roles with increasing responsibility including Vice President and Chief Technology Officer for Unified Communications and Vice President, SaaS Platform Engineering, Collaboration Software Group. He holds a Bachelor of Science degree in Computer Information Systems from Excelsior College (formerly Regents College) and attended the Stanford Executive Program.
Ms. Strayer joined Plantronics in 2012 as Senior Vice President and Chief Financial Officer. She is responsible for all aspects of the Company's financial management, in addition to managing the information technology and investor relations organizations. Prior to joining Plantronics, from 2005 to 2012, Ms. Strayer held senior financial management roles at Autodesk, Inc., a world leading software design and services company. Most recently, Ms. Strayer served as Autodesk's Vice President of Finance, Corporate Controller, and Principal Accounting Officer. Prior to Autodesk, Ms. Strayer held senior finance positions at Epiphany, Inc., a developer of customer relationship management software and Informix Software, Inc., a developer of database software for computers. She also worked in audit services at KPMG, LLP. Ms. Strayer holds a bachelor's degree in Business Administration from The Ohio State University and is a California licensed Certified Public Accountant.
Ms. Huser joined Plantronics in March 2017 as Senior Vice President, General Counsel and Corporate Secretary. Prior to joining Plantronics, Ms. Huser served as Vice President, Deputy General Counsel at BlackBerry, a mobile-native security software and services company, and General Counsel of its Technology Solutions division from 2013 to 2014 and again during 2016 until she joined Plantronics. Before BlackBerry, during 2015, Ms. Huser was Senior Vice President, Legal for McKesson Corporation, a global healthcare supply chain, retail pharmacy, specialty care and information technology company. Prior to that time, she was a partner, office managing partner and practice group leader at Bingham McCutchen LLP, an international law firm, from 1988 to 2007 and again from 2010 to 2013. Ms. Huser also served as Vice President, Deputy General Counsel of eBay, Inc., an online global commerce leader, from 2008 to 2010. Ms. Huser graduated from the University of Wisconsin - Madison, with a Bachelor of Business Administration, Accounting and Marketing and holds a Juris Doctorate from Stanford Law School.
Mr. Loebbaka joined Plantronics in October 2017 as Senior Vice President, Global Sales. Prior to joining Plantronics, from March 2016 to June 2017, Mr. Loebbaka served as Chief Commercial Officer at Spruce Finance, Inc., a consumer finance company. Before Spruce Finance, he served as Senior Vice President, Global Sales, Marketing and Service, at Enphase Energy, an energy management and solutions technology company, from 2010 to 2015. Previously, he held roles of ever increasing responsibility in sales and marketing at Seagate Technology, PLC, an industry leading company focused on core elements of data storage in the enterprise and consumer markets, including Senior Vice President of Europe, Middle East and Africa and earlier as a Senior Vice President of Global Channel Sales and Corporate Marketing. Mr. Loebbaka has also held General Manager and other senior sales
8
and marketing management roles at Adaptec, a computer storage products company, Brunswick Corporation, a leading global designer, manufacturer and marketer of recreation products company, and Apple, Inc., a multinational technology company. Mr. Loebbaka holds an MBA from The Kellogg School of Management at Northwestern University and a Bachelor of Science degree in Mechanical Engineering from the University of Illinois at Urbana-Champaign.
Mr. Sarkar joined Plantronics in 2011 as Vice President, Software and Firmware and was promoted through ever increasing roles and responsibilities to his current role as Senior Vice President, Enterprise Line of Business. Before joining Plantronics, Mr. Sarkar led the Advanced Technology, Strategy and Corporate Development Team at Polycom in 2011 and worked at Cisco for 14 years leading engineering teams, strategy, worldwide UC standards engagement, mergers and acquisitions, advanced technology for collaboration, and product development in the Cisco Voice Technology Group. Mr. Sarkar holds a M.S. in Computer Science from The Ohio State University and a Bachelor of Science degree in Computer Science from the Indian Institute of Technology, Kharagpur, India.
Executive officers serve at the discretion of the Board of Directors. There are no family relationships between any of the directors and executive officers of Plantronics.
9
ITEM 1A. RISK FACTORS
You should carefully consider the following risk factors, which are not exhaustive, in connection with any investment in our stock. Our stock price will reflect the performance of our business relative to, among other things, our competition, expectations of securities analysts or investors, and general global and regional economic, market and industry conditions. Our business, financial condition, and results of operations could be materially adversely affected if any of the following risks occur. Accordingly, the trading price of our stock could decline, and investors could lose all or part of their investment.
Adverse or uncertain global and regional economic conditions may materially adversely affect us.
Our operations and financial performance are dependent on the global and regional economies as well as industry specific trends and events. Uncertainty regarding future economic conditions and the markets into which we sell makes it challenging both in the near and long-term to forecast operating results, make business decisions, and identify risks that may affect our business, sources and uses of cash, financial condition, and results of operations. Economic concerns, such as uncertain or inconsistent global or regional economic growth, stagnation or contraction, including the pace of economic growth in the United States in comparison to other geographic and economic regions, pressure on economic growth in Europe, uncertain growth prospects in the Asia Pacific region, as well as actual or potential geopolitical conflicts and their short and long-term economic impact, increase the uncertainty and unpredictability for our business as consumers, businesses and governmental agencies periodically and often unpredictably postpone or forego spending. A global economic downturn, changes in the industries to which we sell our products, or erratic or declining business or governmental spending or hiring may reduce sales of our products, increase sales cycles, slow adoption of new technologies, increase price competition, and cause customers and suppliers to default on their financial obligations.
Additionally, to the extent governments implement general or specific reductions in spending, demand for our products by those governmental agencies subject to the measures and by customers who derive all or a portion of their revenues from these agencies, may decline. Similarly, to the extent uncertainty regarding public debt limits or governmental budgets hinder spending by retail consumers, businesses or governmental agencies, sales of our products may be materially harmed or delayed.
Additionally, our customers suffer from their own financial and economic challenges. If global or regional economic conditions deteriorate, whether in general or in specific markets, customers may demand pricing accommodations, delay payments or become insolvent. It is impossible to reliably determine if and to what extent customers may suffer, whether we will be required to adjust our prices or face collection issues with customers or if customer bankruptcies will occur.
Our operating results are difficult to predict, and fluctuations may cause volatility in the trading price of our common stock.
Given the nature of the markets in which we compete, our revenues and profitability vary from quarter to quarter and are difficult to predict for many reasons, including the following:
•variations in the volume and timing of orders received during each quarter;
• | shifts in the particular types of products ordered and the geographic locations of the customers placing orders; |
• | the timing of customers' sales promotions and campaigns; |
• | the timing of large customer deployments, including UC&C infrastructure; |
• | the timing and market acceptance of new product introductions by us and our competitors and obsolescence or discontinuance of existing products; |
• | competition, including pricing pressure, promotions and campaigns by us, our competitors or our customers; |
• | failure to timely introduce new products within projected costs and reduce costs as production increases; |
• | changes in technology and desired product features, including whether those changes occur as and when anticipated; |
• | general economic conditions in the U.S. and our international markets, including foreign currency fluctuations; |
• | seasonality, particularly as related to our retail channels during the winter holiday season; |
• | customer cancellations and rescheduling; |
• | fluctuations in raw materials and components costs; |
• | investments in and the costs associated with strategic initiatives; and |
• | changes in accounting rules or their interpretation. |
Fluctuations in our operating results, including the failure to meet our expectations or the expectations of financial analysts, may cause volatility, including material decreases, in the trading price of our common stock.
10
The failure to successfully finance and close the Polycom acquisition and thereafter integrate their business and operations in the expected time frame may adversely affect our business and financial results or the business and financial result of the combined company.
We believe the acquisition of Polycom will result in certain benefits, including acceleration and expansion of our market opportunities, creation of a broad portfolio of communications and collaboration endpoints, significant expansion of services offerings, immediate financial accretion, and significant operational efficiencies and cost synergies. However, our ability to realize these anticipated benefits depends on closing of the acquisition and thereafter the successful integration of the businesses and financing of debt obligations. The combined company may fail to realize the anticipated benefits of the acquisition for a variety of reasons, including the following:
• | we may be unable to integrate Polycom's business within our own in a timely and cost-efficient manner or do so without adversely impacting operations, including new product launches; |
• | expected synergies or operating efficiencies may fail to materialize in whole or part or may not occur within expected time-frames; |
• | the acquisition may adversely impact ours or Polycom's relationships with respective customers, suppliers and strategic partners and their operating results and businesses generally (including the diversion of management time on transaction-related issues); |
• | each company may be unable to retain and hire all or a portion of their respective key personnel; |
• | legal and regulatory enforcement matters that are pending at Polycom may adversely impact the results of the combined company; |
• | financing that we obtain to consummate the acquisition is not on anticipated terms or is not available at all, which is magnified by the absence of a financing condition for the transaction; |
• | our increased leverage as a result of the transaction will be substantially greater than prior to the acquisition which may pose risks, including reduced flexibility to make changes in our operations in response to business or economic conditions, increased borrowing costs, as well as penalties or costs should we fail to comply with terms of the financial agreements such as debt ratios and financial and operation performance targets; |
• | negative effects on the market price of our common stock as a result of the transaction, particularly in light of the issuance of our stock in the transaction; |
• | our financial reporting including those resulting from the adoption of new accounting pronouncements and associated system implementations in the context of the transaction, our ability to forecast financial results of the combined company and that we may be unable to successfully integrate our reporting system causing an adverse impact to our ability to make timely and accurate filings with the SEC and other domestic and foreign governmental agencies; |
• | the potential impact of the transaction on our future tax rate and payments based on the consolidation global entity and our ability to quickly integrate foreign operations; |
• | the challenges of integrating the supply chains of the two companies; and |
• | the potential that our due diligence did not uncover risks and potential liabilities of Polycom. |
The actual integration may result in additional and unforeseen expenses or delays. If we are unable to successfully integrate Polycom's business and operations in a timely manner, the anticipated benefits of the acquisition may not be fully realized, or at all, or may take longer to realize than anticipated. Should any of the foregoing or other currently unanticipated risks arise, our business and results of operations may be materially adversely impacted.
Further, if the closing of the transaction is materially delayed beyond our expectations or if we are unable to close the transaction at all, our business may be adversely affected. We have incurred and will continue to incur significant transaction expenses in connection with the acquisition regardless of whether the transaction is completed. Furthermore, we may experience negative reactions from the financial markets, including negative impacts on our stock price, or negative reactions from our customers, suppliers or other business partners, should the acquisition not be completed.
The success of our business depends heavily on our ability to effectively market our Enterprise products, and our business could be materially adversely affected if markets do not develop as expected or we are unable to compete successfully.
Our Enterprise products represent our largest source of revenue, and we regard the market for products designed for UC&C as our greatest long-term opportunity in the Enterprise market. We believe the implementation of UC&C technologies by large enterprises will be a significant long-term driver of UC&C product adoption, and, as a result, a key long-term driver of our revenue and profit growth. Accordingly, we continue to invest in the development of new products and enhance existing products to be more appealing in functionality and design for the UC&C office market; however, there is no guarantee significant UC&C growth will occur, when it might occur, or that we will successfully take advantage of it if it does occur.
Our ability to realize and achieve positive financial results from Enterprise product sales, and UC&C sales in particular, could be adversely affected by a number of factors, including the following:
11
• | As UC&C becomes more widely adopted, competitors may offer solutions that effectively commoditize our products, which, in turn, may pressure us to reduce the prices of one or more of our products. |
• | The market success of major platform providers and strategic partners such as Microsoft Corporation, Cisco Systems, Inc., Avaya, Inc., Genesys, Amazon, and Huawei, and our influence over such providers with respect to the functionality of their platforms and product offerings, their rate of deployment, and their willingness to integrate their platforms and product offerings with our solutions, is limited. For example, Microsoft’s decision to transition from Lync to Skype for Business in early Fiscal Year 2016 proved to be a significant market transition that caused end customers to pause their deployment schemes or schedules while they assessed the implications of Microsoft’s decision. |
• | Failure to timely introduce solutions that are cost effective, feature-rich, stable, durable, and attractive to customers within forecasted development budgets. |
• | Failure to successfully implement and execute new and different processes involving the design, development, and manufacturing of complex electronic systems composed of hardware, firmware, and software that works seamlessly and continuously in a wide variety of environments and with multiple devices. |
• | Failure of UC&C solutions generally, or our solutions in particular, to be adopted with the breadth and speed we anticipate. For example, concerns about data privacy and the security of information and data stored over the Internet and wireless security in general, each of which is further enabled by UC&C solutions, including our products, have caused entities in various markets to reassess the data protection compliance and security safeguards of our devices. |
• | Failure of our sales model and expertise to support complex integration of hardware and software with UC&C infrastructure consistent with changing customer expectations. |
• | Increased competition for market share, particularly given that some competitors have superior technical and economic resources enabling them to take greater advantage of market opportunities. |
• | Sales cycles for more complex UC&C deployments are longer as compared to our traditional Enterprise products. |
• | Our inability to timely and cost-effectively adapt to changes and future business requirements may impact our profitability in this market and our overall margins. |
• | Failure to expand our technical support capabilities to support the complex and proprietary platforms in which our products are and will be integrated as well as increases in our support expenditures over time. |
If our investments in, and strategic focus on, Enterprise products and UC&C products, in particular, do not generate incremental revenue, our business, financial condition, and results of operations could be materially adversely affected.
If we fail to accurately forecast demand we may under or overestimate production requirements resulting in lost business or write offs of excess inventory which may materially harm our business, reputation and results of operations.
Our industry is characterized by rapid technological changes, evolving industry standards, frequent new product introductions, short-term customer commitments, decreasing product life cycles, and changes in demand. Production levels are generally forecasted based on non-binding customer forecasts and historic product demand and we often place orders with suppliers for materials, components and sub-assemblies (“materials and components”) as well as finished products 13 weeks or more in advance of projected customer orders. Actual customer demand depends on many factors and may vary significantly from forecasts. We will lose opportunities to increase revenues and profits and may incur increased costs and penalties including expedited shipping fees and late delivery penalties if we underestimate customer demand.
Conversely, overestimating demand may result in higher inventories of materials and components and finished products, which may later require us to write off all or a material portion of our inventories. We routinely review inventory for usage potential, including fulfillment of customer warranty obligations and spare part requirements, and we write down to the lower of cost or market value the excess and obsolete inventory, which may materially adversely affect our results of operations.
For instance, periodically, we or our competitors announce new products, capabilities, or technologies that replace or shorten the life cycles of legacy products or cause customers to defer or stop purchasing legacy products until new products become available. Additionally, new product announcements may incite customers to increase purchases of successful legacy products as part of a last-time buy strategy, thereby increasing sales in the short-term while decreasing future sales and delaying new product adoption. These risks increase the difficulty of accurately forecasting demand for discontinued and new products as well as the likelihood of inventory obsolescence, loss of revenue and associated gross profit.
If any of the above occur, our business, financial condition and results of operations could be materially harmed.
12
If our suppliers and sub-suppliers cannot timely deliver sufficient quantities of quality materials and components and finished products, our ability to fulfill customer demand may be adversely impacted and our growth, business, reputation and financial condition may be materially adversely affected.
Our growth and ability to meet customer demand depends in part on our ability to timely obtain sufficient quantities of materials and components as well as finished products of acceptable quality at acceptable prices. We buy materials and components from a variety of suppliers and assemble them into finished products. In addition, certain of our products and key portions of our products lines are manufactured for us by third party original design and contract manufacturers ("ODMs") who obtain materials and sub-components from long and often complex chains of sub-suppliers. The cost, quality, and availability of the services, materials and components and finished products these ODMs and third parties supply are essential to our success.
Our reliance on these ODMs and third parties therefore involves significant risks, including the following:
• | We rely on suppliers for critical aspects of our business. For instance, we obtain a majority of our Bluetooth products from GoerTek, Inc. Suppliers such as GoerTek may choose to discontinue supplying materials and components or finished products to us for a variety of reasons, including conflicting demands from their other customers, availability and price. |
• | The accelerating pace of technological advancement by our suppliers frequently makes it more difficult to continue to procure essential components like integrated circuits for those of our products already in the market. Any failure to obtain key components to meet customer demand may (i) require us to obtain a replacement supply of satisfactory quality which may be difficult, time-consuming, or costly, (ii) force us to redesign or end-of-life certain products, (iii) delay manufacturing, (iv) require us to make large last-time buys based on speculative long-term forecasts in excess of our short-term needs, holding materials and components or finished products in inventory for extended periods of time, or (v) being unable to meet customer demand. |
• | The lack of viable alternative sources of materials and components or the high development costs associated with existing and emerging wireless and other technologies may require us to work with a single source for silicon chips, chip-sets, or other materials and components in one or more products. Moreover, lead times are particularly long for silicon-based components incorporating radio frequency and digital signal processing technologies and such materials and components make up an increasingly larger portion of our product costs. Additionally, many orders for consumer products have shorter lead times than component lead times, making it necessary for us or our suppliers to carry more inventory in anticipation of orders, which may not materialize. |
• | A substantial portion of the materials and components used in our products are provided by our suppliers on consignment. As such, we do not take title to, or risk of loss of, these materials and components until they are consumed in the production process. Our supply agreements generally allow us to return parts in excess of maximum order quantities at the suppliers’ expense. Returns for other reasons are negotiated with suppliers on a case-by-case basis and are generally immaterial. If we are required or choose to purchase all or a material portion of the consigned materials and components or if a material number of our suppliers refuse to accept orders on consignment, our inventory turn rate may decline or we could incur material unanticipated expenses, including write-downs for excess and obsolete inventory. |
• | Rapid increases in production levels to meet product demand, whether or not forecasted, could result in shipment delays, higher costs for materials and components, increased expenditures for freight to expedite delivery of required materials, late delivery penalties, and higher overtime costs and other expenses, any of which could materially negatively impact our revenues, reduce profit margins, and harm relationships with affected customers. If constraints were to occur in existing or future product lines our ability to meet demand and our corresponding ability to sell affected products may be materially reduced. Moreover, our failure to timely deliver desirable products to meet demand may harm relationships with our customers. Further, if production is increased rapidly, manufacturing yields may decrease, which may also reduce our revenues or margins. |
Any of the foregoing could cause us to be able to timely meet customer demand and thereby materially and adversely affect our business, financial condition, and results of operations.
13
Prices of certain raw materials and components may rise depending upon global market conditions which may adversely affect our margins.
We have experienced and expect to continue to experience volatility in prices from our suppliers, particularly in light of price fluctuations for oil, gold, copper, and other materials and components in the U.S. and around the world, which could negatively affect our profitability or market share. If we are unable to pass cost increases on to our customers or achieve operating efficiencies that offset any increases, our business, financial condition, and results of operations may be materially and adversely affected.
We have strong competitors and expect to face additional competition from existing and new market participants in the future. If we are unable to compete effectively, our results of operations may be adversely affected.
All of the markets in which we sell our products are intensely competitive and market leadership may change as a result of new product and technology introductions, new market participants and pricing. We face pressure on our selling prices, sales terms and conditions, and in connection with product performance and functionality. Also, aggressive industry pricing practices may decrease margins. For a further description of our competitors and the markets in which we compete, see Item 1, Business, in this Form 10-K.
Many of our competitors are larger, offer broader product lines, may integrate their products with communications devices and adapters manufactured by them or others, offer products incompatible with our products, have established market positions, and have substantially greater financial, marketing, and other resources.
We also face competition from companies, principally located in or originating from the Asia Pacific region, which offer low cost products, including products modeled on, direct copies of, or counterfeits of our products. Online marketplaces make it easier for disreputable and fraudulent sellers to introduce their copies or counterfeit products into the stream of commerce by commingling legitimate products with copies and counterfeits; thereby making it extremely difficult to track and remove copies and counterfeits. The introduction of low cost alternatives, copies and counterfeits has resulted in and will continue to cause market pricing pressure, customer dissatisfaction and harm to our reputation and brand name. If product prices are substantially reduced by new or existing market participants, our business, financial condition, or results of operations could be materially and adversely affected.
Moreover, if we do not distinguish our products, through distinctive, technologically advanced features and design, as well as continue to build and strengthen our brand recognition, our products may become commoditized. In addition, failure to effectively market our products could lead to lower and more volatile revenue and earnings, excess inventory, and the inability to recover associated development costs, any of which could have a material adverse effect on our business, financial condition, results of operations, and cash flows.
The markets for our Consumer products are volatile and our ability to compete successfully in one or more of these categories is subject to many risks.
Competition in the markets for our Consumer products, which consist primarily of Bluetooth headsets, gaming, entertainment and computer audio headsets, is intense and presents significant manufacturing, marketing and operational risks and uncertainties. The risks include the following:
• | The global market for mono Bluetooth continues to decrease. The market for stereo Bluetooth headsets continues to grow, although it remains dominated by lifestyle brands. Our market share has been and is significantly larger in the mono Bluetooth than stereo Bluetooth market and thus far we have been unable to sufficiently increase share in the stereo Bluetooth market to offset decreases in the mono Bluetooth market. |
• | Reductions in the number of suppliers participating in the Bluetooth market has reduced our sourcing options and may in the future increase our costs at a time when our ability to offset higher costs with product price increases is limited. |
• | Difficulties retaining or obtaining shelf space and maintaining a robust and compelling eCommerce presence for our Consumer products in our sales channel, particularly with large "brick and mortar" retailers and Internet "etailers" as the market for mono Bluetooth headsets contracts. |
• | Relying on a dwindling number of retail customers that have significant market share in the shrinking mono Bluetooth category increases our exposure to pricing pressure, unexpected changes in demand and may result in unanticipated fluctuations in our revenues and margins. |
• | The varying pace and scale of economic activity in many regions of the world creates demand uncertainty and unpredictability for our Consumer products. |
• | The need to rapidly and frequently adopt new technology to keep pace with changing market trends. In particular, we anticipate a trend towards more integrated solutions that combine audio, video, and software functionality that we expect will further shorten product lifecycles. |
Failure to compete successfully in the Consumer business markets may have an adverse effect on our business, results of operations, and financial condition.
14
We are exposed to differences and frequent fluctuations in foreign currency exchange rates, which may adversely affect our revenues, gross profit, and profitability.
Fluctuations in foreign currency exchange rates impact our revenues and profitability because we report our financial statements in USD and purchase a majority of our component parts from our supply chain in USD, whereas a significant portion of our sales are transacted in other currencies, particularly the Euro and the British Pound Sterling ("GBP"). If the USD strengthens further, it could further harm our financial condition and operating results in the future. Furthermore, fluctuations in foreign currency rates impact our global pricing strategy, which may result in our lowering or raising selling prices in one or more currencies to minimize disparities with USD prices and to respond to currency-driven competitive pricing actions. Should the dollar remain strong or strengthen further against foreign currencies, principally the Euro and the GBP, we may be compelled to raise prices for customers in the affected regions. Price increases may be unacceptable to our customers who could choose to replace our products with less costly alternatives in which case our sales and market share will be adversely impacted. If we reduce prices to stay competitive in the affected regions, our profitability may be harmed.
Large or frequent fluctuations in foreign currency rates, coupled with the ease of identifying global price differences for our products via the Internet, increases pricing pressure and allows unauthorized third party “grey market” resellers to take advantage of price disparities, thereby undermining our premium brand image, established sales channels, and support and operations infrastructure. We also have significant manufacturing operations in Mexico and fluctuations in the Mexican Peso exchange rate can impact our gross profit and profitability. Additionally, the majority of our suppliers are located internationally, principally in Asia, and volatile or sustained increases or decreases in exchange rates between the U.S. Dollar and Asian currencies may result in increased costs or reductions in the number of suppliers qualified to meet our standards.
Although we hedge currency exchange rates exposures we deem material, changes in exchange rates may nonetheless still have a negative impact on our financial results. Among the factors that may affect currency values are trade balances, the level of short-term interest rates, differences in relative values of similar assets in different currencies, long-term opportunities for investment and capital appreciation, decisions and actions of central banks and political developments.
We hedge a portion of our Euro and GBP forecasted revenue exposures for the future, typically over 12-month periods. In addition, we hedge a portion of our Mexican Peso forecasted cost of revenues and maintain foreign currency forward contracts denominated in Euros, GBP, Australian and Canadian Dollars that hedge against a portion of our foreign-currency denominated assets and liabilities. Our foreign currency hedging contracts reduce, but do not eliminate, the impact of currency exchange rate movements, particularly if the fluctuations are significant or sustained, and we do not execute hedging contracts in all currencies in which we conduct business. There is no assurance that our hedging strategies will be effective. Additionally, even if our hedging techniques are successful in the periods during which the rates are hedged, our future revenues, gross profit, and profitability may be negatively affected both at current rates and by adverse fluctuations in currencies against the USD. See Item 7A for further quantitative information regarding potential foreign currency fluctuations.
In May 2015 we issued $500.0 million of 5.50% senior unsecured notes and entered into an Amended and Restated $100.0 million revolving line of credit facility. Issuance of the notes and any draws against the credit facility may adversely affect our future financial condition and financial results.
As of March 31, 2018, we had $500 million in 5.50% senior unsecured notes outstanding and the ability to draw up to $100.0 million against a revolving line of credit agreement with Wells Fargo Bank, National Association. Additionally, in connection with our proposed acquisition of Polycom, we estimate we will incur approximately $690 million in net debt including replacement of our existing line of credit agreement with a secured credit agreement. Risks relating to our long-term indebtedness include:
• | Requiring us to dedicate a portion of our cash flow from operations to payments on our currently existing or future indebtedness, thereby reducing the availability of cash flow to fund working capital, capital expenditures, acquisitions, investments and other general corporate purposes; |
• | Limiting our flexibility in planning for, or reacting to, changes in our business and the markets in which we operate including, without limitation, restricting our ability and the ability of our subsidiaries to incur liens or enter into certain types of transactions such as sale and lease-back transactions; |
• | Limiting our ability to borrow additional funds or to borrow funds at rates or on other terms we find acceptable; and |
• | Our inability to repay or refinance the then-outstanding principal balance of the Notes on maturity or to repay or refinance other future indebtedness. |
Periodically, we have drawn funds under our existing credit facilities in connection with our corporate return of capital policy and for other purposes which are subject to interest charges. Moreover, the credit agreement contains, and future debt instruments are expected to contain, affirmative and negative covenants with which we must comply in addition to those covenants in our 5.50% senior unsecured notes. These covenants do or will apply regardless of whether any loans under the credit agreement or any successor credit agreement are outstanding and could adversely impact how we operate our business, our ability to take advantage of strategic opportunities, our operating results, and ability to pay dividends or repurchase our common stock, which, in turn, may negatively impact our stock price.
15
In addition, if we borrow additional funds under our existing credit agreement or any successor agreement, we may be required to increase the borrowing limit or seek additional sources of borrowing. Given current credit and debt markets, there is no assurance that if we were to seek additional credit or debt, it would be available when needed or if it is available, the cost or terms and conditions would be acceptable.
If any of the foregoing risks occur, we may be unable to pay any indebtedness, including interest, when due, and may be required to curtail activities to comply with our obligations under the senior unsecured notes or other debt obligations. Additionally, changes by any rating agency to our credit rating may negatively impact the value and liquidity of both our debt and equity securities, as well as the potential costs associated with a refinancing of our debt. The rating agencies measure us by our performance against certain financial metrics. If we do not meet these metrics there is a risk the rating agencies may downgrade our rating. If our credit ratings are downgraded or other negative action is taken, our ability to obtain additional financing in the future could be diminished and could affect the terms of any such financing. If any of those things occur, our financial condition and results of operations may be adversely affected.
We cannot guarantee we will continue to repurchase our common stock pursuant to stock repurchase programs or that we will pay dividends at historic rates or at all. The repurchase of our common stock and the payment of dividends may require us to borrow against our credit agreement or incur indebtedness and may not achieve our objectives.
We have a history of recurring stock repurchase programs and payment of quarterly dividends. Any determination to continue to pay cash dividends at recent rates or at all, or authorization or continuance of any share repurchase programs is contingent on a variety of factors, including our financial condition, results of operations, business requirements, and our Board of Directors' continuing determination that such dividends or share repurchases are in the best interests of our stockholders and in compliance with all applicable laws and agreements. Furthermore, while any debt repayment obligations remain outstanding in connection with our acquisition of Polycom our ability to return capital to stockholders through stock repurchases, dividend declarations or otherwise may be limited in whole or in part.
Additionally, any future stock repurchases and dividend declarations may require us to draw against available funds under our credit agreement or incur additional indebtedness, any of which may obligate us to pay interest, require payment of other expenses, and may not be available to us or available on terms we deem acceptable. Accordingly, there is no assurance that we will continue to repurchase stock at recent historical levels or at all, or that our stock repurchase programs or dividend declarations will have a beneficial impact on our stock price.
We operate in multiple tax jurisdictions globally and our corporate tax rate may increase or we may incur additional income tax liabilities, which could adversely impact our cash flow, financial condition and results of operations.
We have significant operations in various tax jurisdictions throughout the world, and a substantial portion of our taxable income has historically been generated in jurisdictions outside of the U.S. Should there be changes in foreign tax laws that seek to impose withholding taxes on the repatriation of cash or increase foreign tax rates on overseas earnings our operating results could be materially adversely affected.
Various governmental tax authorities have recently increased their scrutiny of tax strategies employed by corporations and individuals. In addition, the Organization for Economic Cooperation and Development issued guidelines and proposals during Fiscal Year 2016 that may change how our tax obligations are determined in many of the countries in which we do business. If U.S. or other foreign tax authorities change applicable tax laws or successfully challenge the manner in which our profits are currently recognized, our overall taxes could increase, and our business, cash flow, financial condition, and results of operations could be materially adversely affected.
We are also subject to examination by the Internal Revenue Service ("IRS") and other tax authorities, including state revenue agencies and foreign governments. While we regularly assess the likelihood of favorable or unfavorable outcomes resulting from examinations by the IRS and other tax authorities to determine the adequacy of our provision for income taxes, there can be no assurance that the actual outcome resulting from these examinations will not materially adversely affect our financial condition and results of operations.
16
Changes in applicable tax regulations and resolutions of tax disputes could negatively affect our financial results.
The Company is subject to taxation in the U.S. and numerous foreign jurisdictions. On December 22, 2017, the U.S. government enacted comprehensive tax legislation commonly referred to as the Tax Cuts and Jobs Act (the “Tax Act”). The changes included in the Tax Act are broad and complex. As rule making bodies and new legislation is enacted to interpret the Tax Act, these changes may adjust the estimates provided in this report. The changes may possibly be material, due to, among other things, the Treasury Department’s promulgation of regulations and guidance that interpret the Tax Act, corrective technical legislative amendments that may change the Tax Act, any changes in accounting standards for income taxes or related interpretations in response to the Tax Act, or any updates or changes to estimates the company has utilized to calculate the transition impacts, including impacts from changes to current year earnings estimates and foreign exchange rates of foreign subsidiaries.
In addition, it is uncertain how each country where we do business may react to the Tax Act. Moreover, the evolving global tax landscape accompanying the adoption and guidance associated with the Base Erosion and Profit Shifting reporting requirements (“BEPS") recommended by the G8, G20 and Organization for Economic Cooperation and Development ("OECD") may require us to make adjustments to our financial results. As these and other tax laws and related regulations change, our financial results could be materially impacted. Given the unpredictability of these possible changes, it is difficult to assess whether the overall effect of these potential tax changes would be positive or negative for our earnings and cash flow, but such changes could adversely impact our financial results.
Our business will be materially adversely affected if we are unable to develop, manufacture, integrate and market new products in response to changing customer requirements and new technologies.
The technology used in our products is evolving more rapidly than in the past and we anticipate this trend will continue. Historically, new products primarily offered stylistic changes and quality improvements rather than significant new technologies. Our increasing reliance and focus on the UC&C market has resulted in a growing number of our products that integrate complex, state-of-the-art technology, increasing the risks associated with new product ramp-up, including product design, integration of third party intellectual property with our own or other third party applications, performance compliance with product specifications, and defects in the early stages of production.
Office phones have begun to incorporate Bluetooth functionality, which has opened the market to consumer Bluetooth headsets and reduced the demand for our traditional office telephony headsets and adapters, resulting in lost revenue and lower margins. Additionally, the advent of more and different types of mobile devices has decreased the need for traditional desk phones with a distinct headset and may limit sales of both corded and cordless headsets in the future. Moreover, the increasing adoption of wireless technologies has resulted in increased development costs associated with new and evolving wireless standards. If sales and margins on our traditional corded products decline and we are unable to successfully design, develop, and market alternatives at comparable margins, our revenue and profits may decrease.
In addition, innovative technologies have moved the platform for certain of our products from our customers' closed proprietary systems to open platforms such as the PC, smart phones and tablets. In turn, these devices have become more open as a result of technologies such as cloud computing and trends toward more open source software code development. As a result, the risk that current and potential competitors could enter our markets and commoditize our products by offering similar products has increased.
Moreover, the potential for new and emerging technologies to disrupt one or more of our material market categories continues to grow. We cannot assure that we will successfully anticipate or respond to new and emerging challenges in a timely or competitive basis or at all which could significantly harm our business and financial results.
The success of our products depends on several factors, including our ability to:
• | Anticipate technology and market trends; |
• | Develop innovative new products and service offerings and enhance existing offerings on a timely basis; |
• | Distinguish our products and services from those of our competitors; |
• | Create industrial designs that appeal to our customers and end-users; |
• | Create and monetize software solutions that allow businesses to improve IT and employee performance; |
• | Manufacture and deliver high-quality products that are simple to operate in sufficient volumes and acceptable margins; |
• | Offer and timely deliver services that are intuitive to use and provide the information and data customers desire; |
• | Price our products and services competitively; |
• | Hire and retain qualified personnel in the highly competitive field of software development; |
• | Provide timely, effective and accurate technical product support to our customers; or |
• | Leverage new and existing channel partners effectively. |
17
If we are unable to develop, manufacture, market, integrate and introduce enhanced or new products and services in a timely manner in response to changing market conditions or customer requirements, including new and disruptive technologies and changing fashion trends and styles, our business, financial condition, and results of operations will be materially adversely affected.
Our new and evolving service offerings, including Software-as-a-Service (SaaS), are strategically important to our future growth and profitability and our business may be harmed or our revenues and profitability materially hurt if we fail to successfully bring new offerings to market.
Our future growth and profitability are tied to our ability to successfully bring to market new and innovative services offerings like our SaaS subscription services. We are investing significant time, resources and money into our SaaS offerings with no expectation that they will provide material revenue in the near term and without any assurance they will succeed. Moreover, we expect that as we continue to explore, develop and refine new offerings they will continue to evolve, may not generate sufficient interest by end customers, may create channel conflicts with our existing hardware distribution partners, and we may be unable to compete effectively, generate significant revenues or achieve or maintain acceptable levels of profitability.
Additionally, our experience with cloud services offerings is limited. We are also substantively reliant on third party service providers for significant aspects of our offerings and over whom we have little or no market power regarding pricing, support, service levels and compliance. If we do not successfully execute our cloud strategy or anticipate the needs of our customers, our credibility as a cloud services provider could be questioned and our prospects for future revenue growth and profitability may never materialize.
Moreover, if our new and evolving business models offerings achieve market acceptance, differences in revenue recognition treatment may cause short-term revenue declines or increase expenditures for operational, administrative and technical support.
Accordingly, if we fail to successfully launch, manage and maintain our new and evolving services offerings future revenue growth and profitability may be limited our business significantly harmed.
We have significant manufacturing, assembly and packaging operations in Mexico and rely on third party manufacturers located outside of U.S., and a significant amount of our revenues are generated internationally, each of which subjects our business to risks of international operations.
We own and operate a manufacturing facility in Tijuana, Mexico, which is responsible for assembly of a significant portion of our Enterprise products from materials and components sourced from various suppliers in Asia and North America, and other suppliers. Additionally, our Tijuana facility is primarily responsible for the packaging and final processing of most of our Consumer products after manufacturing and assembly by third parties, many of which are located in Asia. Also, we generate a significant amount of our revenues from foreign customers.
Our international operations and sales expose us to various risks including, among others:
• | Fluctuations in foreign currency exchange rates; |
• | Cultural differences in the conduct of business; |
• | Greater difficulty in accounts receivable collection and longer collection periods; |
• | Impact of recessionary, volatile or adverse global economic conditions; |
• | Reduced intellectual property rights protections in some countries; |
• | Different and changing regulatory requirements; |
• | Implementation or expansion of trade restrictions, sanctions or other penalties against one or more countries, its citizens or industries; |
• | Unstable or uncertain political and economic situations such as the United Kingdom’s decision to leave the European Union; |
• | Tariffs, taxes and other trade barriers, including recent actions in the United States, China as well as historical regulations in developing nations such as Brazil, India, and others; |
• | Political conditions, health epidemics, civil unrest, or criminal activities within countries in which we operate; |
• | Management, operation, and expenses associated with an enterprise spread over various countries; |
• | Burden and administrative costs of complying with a wide variety of foreign laws and regulations; |
• | Currency restrictions; and |
• | Compliance with anti-bribery laws, including the United States Foreign Corrupt Practices Act and the United Kingdom's Bribery Act. |
Additionally, proposals to impose tariffs, border taxes, and other actions related to the importation of goods from Mexico as well as renegotiate the North American Free Trade Agreement with Mexico and Canada which have been suggested by the United States Government. Considering the nature and extent of our operations in Tijuana, our revenues and results of operations may be materially and adversely impacted should any legislation or executive actions take effect that limit or increase the cost of importing our products. Alternatively, if we deem it necessary to alter all or a portion of our domestic and international activities in response to such legislation or executive actions, our capital and operating costs may increase, possibly substantially.
18
The above listed and other inherent risks of international operations could materially and adversely affect regional economic activity and business operations in general, which in turn may harm our business, financial conditions, and results of operations.
Historically, we have sold our products through various distribution channels that can be volatile. As we expand our offerings to include more services, the nature and type of our distribution networks needed to effectively sell them are likely to diverge from our historical hardware channels. Any failure to establish and maintain successful relationships with our channel partners could materially adversely affect our business, financial condition, or results of operations. In addition, customer bankruptcies or financial difficulties may impact our business.
Historically, we have sold substantially all of our hardware products through distributors, retailers, OEMs, and telephony service providers. Effectively managing these relationships and avoiding channel conflicts is challenging. Our existing relationships with these parties are generally not exclusive and can be terminated by us or them without cause on short notice. These customers also sell or may sell products offered by our competitors. To the extent our competitors offer more favorable terms or more compelling products, our customers may not recommend, de-emphasize, or discontinue carrying our products. Moreover, our OEMs may elect to manufacture their own products similar to those we offer.
Additionally, it is becoming easier for small online sellers to enter the market unburdened with physical locations, employees and support personnel which can force our larger traditional brick and mortar resellers to reduce their selling prices. In turn, our traditional resellers may demand lower selling prices from us, more cooperative and marketing incentives, reduce their sales support needed to maintain our premium brand image, discontinue carrying our products and other similar adverse actions. As we begin to expand our offerings to include services, many of our historical channel partners may be unwilling or unable to market our services forcing us to establish new or different relationships. Further, increased competition among resellers may cause some of our resellers and partners to experience financial difficulties or force them to shut down, decreasing our channels to market. The inability to establish or maintain successful relationships with distributors, OEMs, retailers, and telephony service providers or to maintain quality distribution channels and sales models could materially adversely affect our business, financial condition, or results of operations.
Also, periodically we implement new incentive programs or modify existing programs to focus our sales channels or improve go-to-market efficiencies or we choose to end existing programs. The success or failure of these initiatives can vary and programs initially successful can prove less so over time or have unintended consequences, particularly if our partners deem them difficult, time-consuming or disruptive, or the terms of the programs or our agreements are unacceptable.
Moreover, we have an extensive global distribution network of distribution partners making it difficult to identify and enforce contractual breaches and violations of law including, without limitation, import and export violations, extraterritorial or “grey market” sales, sales to unauthorized, unqualified and disreputable resellers, copyright and trademark violations and other similar activities. The advent of global Internet-based commerce and sharp decreases in the cost to quickly ship products internationally has exacerbated the problem, increasing the likelihood of commoditization of our products and harming our premier image with reputable resellers and end user customers.
If we are unable to establish and maintain relationships with quality distributors and resellers for our existing and new offerings, our business, financial condition, and results of operations could be materially, adversely affected.
We have a number of large customers with substantial market power whose ability to demand pricing and promotion concessions as well as other unfavorable terms makes sales forecasting difficult and harms our profitability.
Our customer mix is changing, and certain retailers, OEMs, and wireless carriers are more significant. In particular, we have several large customers whose order patterns are difficult to predict. Offers and promotions by these customers may result in significant fluctuations in their purchasing activities over time, which may increase the volatility of our revenues. If we are unable to correctly anticipate the quantities and timing of their purchase requirements, our revenues may be adversely affected, or we may be left holding large volumes of inventory that cannot be sold to other customers.
Furthermore, many customers with whom we conduct business are quite large with substantial buying power or who have strategic importance to our product marketing objectives. Many use their buying power or strategic importance to mandate onerous terms and conditions to conduct business including unfavorable payment terms, late and inaccurate shipping fees and penalties, generous return rights, most favored pricing, and mandatory marketing and promotional fees. These terms are often non-negotiable and are frequently broad, ambiguous and inconsistent across customers making compliance complex and subject to interpretation. If our compliance with these or similar future provisions are incorrect or inadequate, we could be liable for breach of contract damages or our reputation with one or more key customers could be materially adversely harmed, either of which could have an adverse effect on our financial condition or results of operations.
19
The increased use of software in our products could impact the way we recognize revenue which, if material or done incorrectly, could adversely affect our financial results.
We are increasingly incorporating advanced software features and functionalities into our products, offering firmware and software fixes, updates, and upgrades and developing Internet based software-as-a-service offerings that provide additional value that complements our products. As the nature and extent of software integration in our products increases or if sales of standalone software applications or services become material, the way we report revenue related to our products and services could be significantly affected. For example, we are increasingly required to evaluate whether our revenue transactions include multiple deliverables and, as such, whether the revenue generated by each transaction should be recognized upon delivery, over a period of time or apportioned and recognized based on a combination of the two. Moreover, the software and services revenue recognition rules are complex and dynamic. If we fail to accurately apply these complex rules and policies, particularly to new and unique products or services offerings, we may incorrectly report revenues in one or more reporting periods, which could materially and adversely impact our results for the affected periods, cause our stock price to decline, and result in securities class actions or other similar litigation.
As we focus on growth opportunities, we are divesting or discontinuing non-strategic product categories and pursuing strategic acquisitions and investments, which could have an adverse impact on our business.
We continue to review our product portfolio and address our non-strategic product categories and products through various options including divestiture and cessation of operations like the sale of our Clarity division in 2017. If we are unable to effect sales on favorable terms or if realignment is more costly or distracting than we expect or has a negative effect on our organization, employees and retention, then our business and operating results may be adversely affected. Discontinuing products with service components may also cause us to continue to incur expenses to maintain services within the product life cycle or to adversely affect our customer and consumer relationships and brand. Divestitures may also involve warranties, indemnification or covenants that could restrict our business or result in litigation, additional expenses or liabilities. In addition, discontinuing product categories, even categories that we consider non-strategic, reduces the size and diversification of our business and causes us to be more dependent on a smaller number of product categories.
As we attempt to grow our business in strategic product categories and emerging market geographies, we will continue to consider growth through acquisitions or investments like the March 2018 announcement of our acquisition of Polycom as well as joint ventures. We will evaluate acquisition opportunities that could provide us with additional product or service offerings or with additional industry expertise, assets and capabilities. Such endeavors and acquisitions will involve significant risks and uncertainties which may include:
• | Distraction of management from current operations; |
• | Greater than expected liabilities and expenses; |
• | Inadequate return on capital; |
• | Insufficient sales and marketing expertise requiring costly and time-consuming development and training of internal sales and marketing personnel as well as new and existing distribution channels; |
• | Certain structures such as joint ventures may limit management or operational control because of the nature of their organizational structures; |
• | Difficulties integrating acquired operations, products, technology, internal controls, personnel and management teams; |
• | Dilutive issuances of our equity securities and incurrence of debt; |
• | Litigation; |
• | Prohibitive or ineffective intellectual property rights or protections; |
• | Unknown market expectations regarding pricing, branding and operational and logistical levels of support; |
• | Uncertain tax, legal and other regulatory compliance obligations and consequences; |
• | New and complex data collection, maintenance, privacy and security requirements; and |
• | Other unidentified issues not discovered in our investigations and evaluations. |
Moreover, any acquisitions may not be successful in achieving our desired strategic, product, financial or other objectives or expectations, which would also cause our business to suffer. Acquisitions can also lead to large non-cash charges that can have an adverse effect on our results of operations as a result of write-offs for items such as future impairments of intangible assets and goodwill or the recording of stock-based compensation.
Our new service offerings require significant upfront investments and may not be successful.
20
We have announced or are exploring new service offerings including SaaS and Soundscaping. These services are complex undertakings different in material respects from our historical hardware design, development and sales model. For example, while SaaS has become a familiar business model generally, recurring revenue subscription services are new to us and involve unique development, accounting and support. Moreover, these services remain in the early stages of development and will require significant time, effort and costs to develop before we can determine their likelihood of market success.
We do not expect significant contributions from these services in the near term. However, if we fail to anticipate the time, effort and cost to develop and maintain new business strategies, we do not timely meet market expectations for commercial availability, our service and support proves unreliable, or we are unable to offer new services at acceptable profit margins, our existing and future business, financial condition, and results of operations could be materially, adversely affected.
Our intellectual property rights could be infringed on by others, and we may infringe on the intellectual property rights of others resulting in claims or lawsuits. Even if we prevail, claims and lawsuits are costly and time consuming to pursue or defend and may divert management's time from our business.
Our success depends in part on our ability to protect our copyrights, patents, trademarks, trade dress, trade secrets, and other intellectual property, including our rights to certain domain names. We rely primarily on a combination of nondisclosure agreements and other contractual provisions as well as patent, trademark, trade secret, and copyright laws to protect our proprietary rights. Effective protection and enforcement of our intellectual property rights may not be available in every country in which our products and media properties are distributed to customers. The process of seeking intellectual property protection can be lengthy, expensive, and uncertain. Patents may not be issued in response to our applications, and any that may be issued may be invalidated, circumvented, or challenged by others. If we are required to enforce our intellectual property rights through litigation, the costs and diversion of management's attention could be substantial. Furthermore, we may be countersued by an actual or alleged infringer if we attempt to enforce our intellectual property rights, which may materially increase our costs, divert management attention, and result in injunctive or financial damages being awarded against us. In addition, existing patents, copyright registrations, trademarks, trade secrets and domain names may not provide competitive advantages or be adequate to safeguard and maintain our rights. If it is not feasible or possible to obtain, enforce, or protect our intellectual property rights, our business, financial condition, and results of operations could be materially, adversely affected.
Patents, copyrights, trademarks, and trade secrets are owned by third parties that may make claims or commence litigation based on allegations of infringement or other violations of intellectual property rights. These claims or allegations may relate to intellectual property that we develop or that is incorporated in the materials or components provided by one or more suppliers. As we have grown, intellectual property rights claims against us and our suppliers have increased. There has also been a general trend of increasing intellectual property infringement claims against corporations that make and sell products. Our products, technologies and the components and materials contained in our products may be subject to certain third-party claims and, regardless of the merits of the claim, intellectual property claims are often time-consuming and expensive to litigate, settle, or otherwise resolve. Many of our agreements with our distributors and resellers require us to indemnify them for certain third-party intellectual property infringement claims. To the extent claims against us or our suppliers are successful, we may have to pay substantial monetary damages or discontinue the manufacture and distribution of products that are found to be in violation of another party's rights. We also may have to obtain, or renew on less favorable terms, licenses to manufacture and distribute our products or materials or components included in those products, which may significantly increase our operating expenses. Discharging our indemnity obligations may involve time-consuming and expensive litigation and result in substantial settlements or damages awards, our products being enjoined, and the loss of a distribution channel or retail partner, any of which may have a material adverse impact on our operating results.
21
We must comply with various regulatory requirements, and changes in or new regulatory requirements may adversely impact our gross margins, reduce our ability to generate revenues if we are unable to comply, or decrease demand for our products if the actual or perceived quality of our products are negatively impacted.
Our products must meet existing and new requirements set by regulatory authorities in each jurisdiction in which we sell them. For example, certain of our Enterprise products must meet local phone system standards. Certain of our wireless products must work within existing permitted radio frequency ranges. Moreover, competition for limited radio frequency bandwidth as a result of an increasing use of wireless products increases the risk of interference or diminished product performance. For instance, in the U.S. the increase in the number of products operating in the unlicensed 903-928 megahertz radio frequency range using significantly higher power than our wireless products and those of many other users of the unlicensed frequency range may cause our wireless products to experience interference which, if material, may harm our reputation and adversely affect our sales.
As regulations and local laws change, new regulations are enacted, and competition increases, we may need to modify our products to address those changes, increasing the costs to design, manufacture, and sell our products, and thereby decreasing our margins or demand for our products if we attempt to pass along the costs. Regulations may also negatively adversely affect our ability to procure or manufacture raw materials and components necessary for our products. Compliance with regulatory restrictions and bandwidth limitations may impact the actual or perceived technical quality and capabilities of our products, reducing their marketability. In addition, if the products we supply to various jurisdictions fail to comply with the applicable local or regional regulations, if our customers or merchants transfer products into unauthorized jurisdictions or our products interfere with the proper operation of other devices, we or consumers purchasing our products may be responsible for the damages that our products cause; thereby causing us to alter the performance of our products, pay substantial monetary damages or penalties, cause harm to our reputation, or cause other adverse consequences.
We are regularly subject to a wide variety of litigation including commercial and employment litigation as well as claims related to alleged defects in the design and use of our products.
We are regularly subject to a wide variety of litigation including claims, lawsuits, and other similar proceedings involving our business practices and products including product liability claims, labor and employment claims, and commercial disputes. The number and significance of these disputes and inquiries have increased as we have grown larger, our business has expanded in scope and geographic reach, and our products and services have increased in complexity.
For instance, the sales of our products expose us to the risk of product liability, including hearing loss claims. Additionally, our mobile headsets are used with mobile telephones and there has been public controversy over whether the radio frequency emissions from mobile phones are harmful to users of mobile phones. Likewise, research could establish a link between radio frequency emissions and corded or wireless products or we could become a party to litigation claiming such a link.
There is also continuing public controversy over the use of mobile phones by operators of motor vehicles and we may be subject to allegations that use of a mobile phone in combination with a headset contributed to a motor vehicle accident.
In addition, we have been sued by employees regarding our employment practices and business partners regarding contractual rights and obligations. We have also been sued by a competitor, GN Netcom, Inc., regarding alleged violations of certain laws regulating competition and business practices, which lawsuit is more specifically described in Part II, Item 8, Note 8 (Commitments and Contingencies) of this Annual Report on Form 10-K. Should GN's appeal be successful, in whole or in part, we could be required to incur additional litigation fees and expenses, be subject to material damages and penalties and management's attention could be diverted, all of which could materially harm our results of operations.
Frequently, the outcome and impact of any claims, lawsuits, and other similar proceedings cannot be predicted with certainty. Moreover, regardless of the outcome such proceedings can have an adverse impact on us because of legal costs, diversion of management resources, and other factors. Determining reserves for our pending litigation is a complex, fact-intensive process that is subject to judgment. It is possible that a resolution of one or more such proceedings could require us to make substantial payments to satisfy judgments, penalties or to settle claims or proceedings, any of which could harm our business. These proceedings could also result in reputational harm, sanctions, consent decrees, or orders preventing us from offering certain products, or services, or requiring a change in our business practices in costly ways. Any of these consequences could materially harm our business.
We maintain product liability insurance, general liability and other forms of insurance in amounts we believe sufficient to cover reasonably anticipated claims, including some of those described above; however, the coverage provided under the policies could be inapplicable or insufficient to cover the full amount of any one or more claims. Consequently, claims brought against us, whether or not successful, could have a material adverse effect upon our business, financial condition, and results of operations.
22
Our business could be materially adversely affected if we lose the benefit of the services of key personnel or if we fail to attract, motivate and retain talented new personnel.
Our success depends to a large extent upon the services of a limited number of executive officers and other key employees. The loss of the services of one or more of our executive officers or key employees, whether or not anticipated, could have a material adverse effect upon our business, financial condition, and results of operations. We also believe that our future success will depend in large part upon our ability to attract, motivate and retain highly skilled technical, management, sales, and marketing personnel. Competition for such personnel is intense and the salary, benefits and other costs to employ the right personnel may make it difficult to achieve our financial goals. Consequently, we may not be successful in attracting, motivating and retaining such personnel, and our failure to do so could have a material adverse effect on our business, operating results, or financial condition.
We are subject to environmental laws and regulations that expose us to a number of risks and could result in significant liabilities and costs.
There are multiple regulatory initiatives in several jurisdictions regarding the removal of certain potential environmentally sensitive materials from our products to comply with Restrictions of the use of Certain Hazardous Substances in Electrical and Electronic Equipment (“RoHS”) and on Waste Electrical and Electronic Equipment (“WEEE”). If it is determined that our products do not comply with RoHs or WEEE, or additional new or existing domestic or international environmental laws or regulations are enacted or amended, we may be required to modify some or all of our products or replace one or more components in those products, which, if such modifications are possible, may be time-consuming, expensive to implement or decrease end-user demand, particularly if we increase prices to offset higher costs. If any of the foregoing were to happen, our ability to sell one or more of our products may be limited or prohibited causing a material negative effect on our financial results.
We are subject to various federal, state, local, and foreign environmental laws and regulations, including those governing the use, discharge, and disposal of hazardous substances in the ordinary course of our manufacturing process. It is possible that future environmental legislation may be enacted or current environmental legislation may be interpreted in any given country in a manner that creates environmental liability with respect to our facilities, operations, or products. We may also be required to implement new or modify existing policies, processes and procedures as they relate to the use and disposal of our products. To the extent any new or modified policies, processes or procedures are difficult, time-consuming or costly to implement or we incur claims for environmental matters exceeding reserves or insurance for environmental liability, our operating results could be negatively impacted.
We have $15.5 million of goodwill and other intangible assets recorded on our balance sheet. If the carrying value of our goodwill were to exceed its implied fair value, or if the carrying value of intangible assets were not recoverable, an impairment loss may be recognized, which would adversely affect our financial results.
As a result of past acquisitions, we have $15.5 million of goodwill and other intangible assets on our consolidated balance sheet as of March 31, 2018. It is impossible at this time to determine if any future impairment charge could occur or, if it does, whether such charge related to these assets would be material. If such a charge is necessary, it may have a material adverse effect our financial results.
Regulation and unauthorized disclosure of customer, end-user, business partner and employee data could materially harm our business and subject us to significant reputational, legal and operational liabilities.
We are subject to an innumerable and ever-increasing number of global laws relating to the collection, use, retention, security, and transfer of personally information about our customers, end-users of our products, business partners and employees globally. Data protection laws may be interpreted and applied inconsistently from country to country and often impose requirements that are inconsistent with one another. In many cases, these laws apply not only to third-party transactions, but also to transfers of information internally and by and between us and other parties with whom we have commercial relations. These laws continue to develop in ways we cannot predict and may materially increase our cost of doing business, particularly as we expand the nature and types of products and services we offer including, without limitation, our software-as-a-service and Soundscaping subscription services.
Regulatory scrutiny of privacy, data protection, use of data and data collection is increasing on a global basis. Complying with these varying requirements could cause us to incur substantial costs or require us to change our business practices in a manner adverse to our business and violations of privacy-related laws can result in significant damages, fines and penalties. For instance, in Europe, the General Data Protection Regulation (“GDPR”) was adopted in 2016 and will become fully effective on May 25, 2018. We have also self-certified to the U.S.-EU Privacy Shield developed by the U.S. Department of Commerce and the European Commission to provide U.S. companies with a valid data transfer mechanism under EU law to permit the transfer of personal data from the European Union to the United States.
23
The GDPR may affect our ability to reach current and prospective customers, to respond to both enterprise and individual customer requests under the laws (such as individual rights of access, correction, and deletion of their personal information), and to implement our business models cost effectively. The U.S.-EU Privacy Shield is subject to annual review, has faced challenges in European courts, and may be challenged, suspended or invalidated.
Complying with the GDPR or other laws, regulations, or other obligations relating to privacy, data protection, or information security have caused and will continue to cause us to incur substantial operational costs and may require us to periodically modify our data handling practices. Moreover, compliance may impact demand for our offerings and force us to bear the burden of more onerous obligations in our contracts. Non-compliance could result in proceedings against us by governmental entities or others, could result in substantial fines or other liability, and may otherwise adversely impact our business, financial condition and operating results.
In addition, compliance with these laws may restrict our ability to provide services our customers, business partners and employees find valuable. A determination that there have been violations of privacy laws relating to our practices could expose us to significant damage awards, fines and other penalties that could, individually or in the aggregate, materially harm our business and subject us to reputational, legal and operational liabilities.
We post on our websites our privacy policies and practices concerning the collection, use and disclosure of personal data. Any failure, or perceived failure, by us to comply with our posted policies or with any regulatory requirements or orders or other domestic or international privacy or consumer protection-related laws and regulations could result in proceedings or actions against us by governmental entities or others (e.g., class action litigation), subject us to significant penalties and negative publicity, require us to change our business practices, increase our costs and adversely affect our business. Data collection, privacy and security have become the subject of increasing public concern. If customers or end users were to reduce their use of our products and services as a result of these concerns, our business could be harmed. As noted above, we are also subject to the possibility of security breaches, which themselves may result in a violation of these laws.
If we are unable to protect our information systems against service interruption, internal and external misappropriation of data or breaches of security, our operations could be disrupted, our reputation may be damaged, and we may be financially liable for damages.
We rely on networks, information systems, and other technology (“information systems”), including the Internet and third-party hosted services, to support a variety of business activities, including our software-as-a-service, human resources, procurement, manufacturing, sales, distribution, invoicing, and collections. We use information systems to process and report financial information internally and to comply with regulatory reporting. In addition, we depend on information systems for communications with our suppliers, distributors, and customers. Consequently, our business may be impacted by system shutdowns or service disruptions during routine operations, such as system upgrades or user errors, as well as network or hardware failures, malicious software, hackers, natural disasters, communications interruptions, or other events (collectively, "network incidents"). Our computer systems have been, and will likely continue to be, subject to network incidents. While, to date, we have not experienced a network incident resulting in material impairment to our operations, nor have we experienced material intentional or inadvertent disclosure of our data or information or the information or data of our customers or vendors, future network incidents could result in unintended disruption of our operations or disclosure of sensitive information or assets. Furthermore, we may experience targeted attacks and although we continue to expend resources for personnel, technologies, and training to prepare for and reduce the adverse consequences of such attacks, these investments are expensive and do not guarantee that such attacks will be unsuccessful, either completely or partially.
If our information systems are disrupted or shutdown and we fail to timely and effectively resolve the issues, we could experience delays in reporting our financial results and we may lose revenue and profits. Misuse, leakage, or falsification of information could result in a violation of data privacy laws and regulations, damage our reputation, and have a negative impact on net operating results. In addition, we may suffer loss or misappropriation of our confidential information or assets, or those of our partners, customers, or suppliers which could cause financial damage and damage to our reputation. We could also be required to expend significant effort and incur financial costs to remedy security breaches or to repair or replace networks and information systems.
Additionally, regardless of the security measures we may employ, our systems and data remain vulnerable to theft, loss and destruction, fraud, unintentional disclosure, errors and similar disruptive activities from current and former employees. Although we have controls in place intended to discourage and detect these types of problems in accordance with industry standards, no system of controls is perfect and issues are likely to arise. If the problems are material, our reputation may be damaged, we may be exposed to litigation, and our sales may be harmed.
We maintain insurance intended to provide coverage for certain claims related to our information systems and practices including some of the risks discussed above. However, coverage under the policies is not exhaustive and exclusions may apply that limit their applicability or the amount of coverage may be insufficient to cover any one or more claims. As a result, were we to experience any of the risks above, our business and financial results could be adversely impacted.
24
War, terrorism, public health issues, natural disasters, or other business interruptions could disrupt supply, delivery, or demand of products, which could negatively affect our operations and performance.
War, terrorism, public health issues, natural disasters, or other business interruptions, whether in the U.S. or abroad, have caused or could cause damage or disruption to international commerce by creating economic and political uncertainties that may have a strong negative impact on the global economy, us, and our suppliers or customers. Our major business operations and those of many of our vendors and their sub-suppliers (collectively, "Suppliers") are subject to interruption by disasters, including, without limitation, earthquakes, floods, and volcanic eruptions or other natural or manmade disasters, fire, power shortages, terrorist attacks and other hostile acts, public health issues, flu or similar epidemics or pandemics, and other events beyond our control and the control of our Suppliers. Our corporate headquarters, information technology, manufacturing, certain research and development activities, and other critical business operations are located near major seismic faults or flood zones. While we are partially insured for earthquake-related losses or floods, our operating results and financial condition could be materially affected in the event of a major earthquake or other natural or manmade disaster.
Should any of the events above arise we could be negatively impacted by the need for more stringent employee travel restrictions, limitations in the availability of freight services, governmental actions limiting the movement of products between various regions, delays in production, and disruptions in the operations of our Suppliers. Our operating results and financial condition could be adversely affected by these events.
Provisions in our charter documents and Delaware law or a decision by our Board of Directors in the future may delay or prevent a third party from acquiring us, which could decrease the value of our stock.
Our Board of Directors has the authority to issue preferred stock and to determine the price, rights, preferences, privileges and restrictions, including voting and conversion rights, of those shares without any further vote or action by the stockholders. The issuance of our preferred stock could have the effect of making it more difficult for a third party to acquire us. In addition, we are subject to the anti-takeover provisions of Section 203 of the Delaware General Corporation Law, which could also have the effect of delaying or preventing our acquisition by a third party. Further, certain provisions of our Certificate of Incorporation and bylaws could delay or make more difficult a merger, tender offer or proxy contest, which could adversely affect the market price of our common stock.
Our stock price could become more volatile and your investment could lose value.
All of the factors discussed in this section could affect our stock price. The timing of announcements in the public market regarding new products, product enhancements or technological advances by our competitors or us and any announcements by us of acquisitions, major transactions, or management changes could also affect our stock price. Our stock price is subject to speculation by analysts and in the press, changes in recommendations or earnings estimates by financial analysts, changes in investors’ or analysts’ valuation measures for our stock, changes in or announcements regarding our forecasts and guidance, our credit ratings, market trends unrelated to our performance, and sales of our common stock by us, our officers or directors or unaffiliated third party investors, particularly considering the concentrated ownership of our common stock, that may limit the ability for investors to acquire or sell meaningful quantities of our stock or cause speculation as to the acquisition or sale of our stock. A significant drop in our stock price could also expose us to the risk of securities class action lawsuits, which could result in substantial costs and divert management’s attention and resources, which could adversely affect our business.
ITEM 1B. UNRESOLVED STAFF COMMENTS
None.
25
ITEM 2. PROPERTIES
Our principal executive offices are located in Santa Cruz, California. Our facilities are located throughout the Americas, Europe, and Asia. The table below lists the major facilities owned or leased as of March 31, 2018:
Location | Square Footage | Lease/Own | Primary Use |
Santa Cruz, California | 163,328 | Own | Sales & Marketing, Engineering, Administration |
Santa Cruz, California | 20,325 | Lease | Sales, Engineering, Administration |
Tijuana, Mexico | 792,304 | Own | Engineering, Assembly, Administration, Logistic and Distribution Center, Design Center, Call Center, and TAC. |
San Diego, California | 23,368 | Lease | Industrial and Office Space |
Chattanooga, Tennessee | 10,125 | Own | Currently leased to a third party. |
Hoofddorp, Netherlands | 57,985 | Own | Executive Briefing Center, Sales, Marketing, Administration, and TAC |
Suzhou, China | 42,012 | Lease | Sales, Administration, Design Center, Quality, TAC |
Wootton Bassett, UK | 21,824 | Own | Main Building Sales, Engineering, Administration, IT |
Wootton Bassett, UK | 15,970 | Own | Currently leased to a third party |
ITEM 3. LEGAL PROCEEDINGS
We are presently engaged in various legal actions arising in the normal course of business. We believe that it is unlikely that any of these actions will have a material adverse impact on our operating results; however, because of the inherent uncertainties of litigation, the outcome of any of these actions could be unfavorable and could have a material adverse effect on our financial condition, results of operations or cash flows. For additional information about our material legal proceedings, please see Note 8, Commitments and Contingencies, of the accompanying notes to the consolidated financial statements.
ITEM 4. MINE SAFETY DISCLOSURES
Not applicable.
26
PART II
ITEM 5. MARKET FOR REGISTRANT'S COMMON EQUITY, RELATED STOCKHOLDER MATTERS AND ISSUER REPURCHASES OF EQUITY SECURITIES
Price Range of Common Stock
Our common stock is publicly traded on the New York Stock Exchange ("NYSE") under the symbol “PLT”. The following table sets forth the low and high sales prices as reported on the NYSE for each period indicated:
Low | High | ||||||
Fiscal Year 2018 | |||||||
First Quarter | $ | 51.45 | $ | 58.27 | |||
Second Quarter | $ | 41.28 | $ | 54.85 | |||
Third Quarter | $ | 44.18 | $ | 53.62 | |||
Fourth Quarter | $ | 51.16 | $ | 61.86 | |||
Fiscal Year 2017 | |||||||
First Quarter | $ | 37.28 | $ | 45.40 | |||
Second Quarter | $ | 42.47 | $ | 52.33 | |||
Third Quarter | $ | 45.77 | $ | 55.65 | |||
Fourth Quarter | $ | 52.60 | $ | 57.47 | |||
As of May 7, 2018, there were approximately 37 holders of record of our common stock. Because many of our shares of common stock are held by brokers and other institutions on behalf of beneficial owners, we are unable to estimate the total number of beneficial owners, but we believe it is significantly higher than the number of record holders. On March 29, 2018, the last trading day of Fiscal Year 2018, the last sale reported on the NYSE for our common stock was $60.37 per share.
Cash Dividends
Quarterly dividends paid per share in Fiscal Years 2017 and 2018 were $0.15, resulting in total payments of $20.0 million in both years. On May 1, 2018, the Audit Committee approved the payment of a dividend of $0.15 per share on June 8, 2018 to holders of record on May 18, 2018. We expect to continue paying a quarterly dividend of $0.15 per share of our common stock; however, the actual declaration of dividends and the establishment of record and payment dates are subject to final determination by the Audit Committee of the Board of Directors each quarter after its review of our financial performance and financial position.
27
Share Repurchase Programs
The following table presents a month-to-month summary of the stock purchase activity in the fourth quarter of Fiscal Year 2018:
Total Number of Shares Purchased 1 | Average Price Paid per Share 2 | Total Number of Shares Purchased as Part of Publicly Announced Plans or Programs1 | Maximum Number of Shares that May Yet Be Purchased Under the Plans or Programs 5 | |||||||||
December 31, 2017 to January 27, 2018 | 2,126 | 3 | $ | 50.50 | 645 | 730,105 | ||||||
January 28, 2018 to February 24, 2018 | 1,327 | 4 | N/A | — | 730,105 | |||||||
February 25, 2018 to March 31, 2018 | 1,624 | 4 | N/A | — | 730,105 | |||||||
1 | On July 27, 2017, the Board of Directors authorized a program to repurchase 1,000,000 shares of our common stock. | |
2 | "Average Price Paid per Share" reflects only our open market repurchases of common stock. | |
3 | Includes 1,481 shares that were tendered to us in satisfaction of employee tax withholding obligations upon the vesting of restricted stock granted under our stock plans. | |
4 | Represents only shares that were tendered to us in satisfaction of employee tax withholding obligations upon the vesting of restricted stock grants under our stock plans. | |
5 | These shares reflect the available shares authorized for repurchase under the July 27, 2017 program. | |
Refer to Note 12, Common Stock Repurchases, of our Notes to Consolidated Financial Statements in this Annual Report on Form 10-K for more information regarding our stock repurchase programs.
28
ITEM 6. SELECTED FINANCIAL DATA
SELECTED FINANCIAL DATA
The information set forth below is not necessarily indicative of results of future operations and should be read in conjunction with Item 7, “Management’s Discussion and Analysis of Financial Condition and Results of Operations” and the Consolidated Financial Statements and notes thereto included in Item 8 of this Form 10-K in order to fully understand factors that may affect the comparability of the information presented below. Fiscal Year 2016 consisted of 53 weeks. All other fiscal years presented consisted of 52 weeks.
Fiscal Year Ended March 31, | |||||||||||||||||||
2014 | 20151 | 20162 | 2017 | 2018 | |||||||||||||||
STATEMENT OF OPERATIONS DATA: | |||||||||||||||||||
Net revenues | $ | 818,607 | $ | 865,010 | $ | 856,907 | $ | 881,176 | $ | 856,903 | |||||||||
Operating income | $ | 140,124 | $ | 149,085 | $ | 108,041 | $ | 125,076 | $ | 123,501 | |||||||||
Operating margin | 17.1 | % | 17.2 | % | 12.6 | % | 14.2 | % | 14.4 | % | |||||||||
Income before taxes | $ | 141,139 | $ | 145,251 | $ | 82,176 | $ | 101,665 | $ | 100,227 | |||||||||
Net income | $ | 112,417 | $ | 112,301 | $ | 68,392 | $ | 82,599 | $ | (869 | ) | ||||||||
Basic earnings per share | $ | 2.65 | $ | 2.69 | $ | 2.00 | $ | 2.56 | $ | (0.03 | ) | ||||||||
Diluted earnings per share | $ | 2.59 | $ | 2.63 | $ | 1.96 | $ | 2.51 | $ | (0.03 | ) | ||||||||
Cash dividends declared per common share | $ | 0.40 | $ | 0.60 | $ | 0.60 | $ | 0.60 | $ | 0.60 | |||||||||
Shares used in basic per share calculations | 42,452 | 41,723 | 34,127 | 32,279 | 32,345 | ||||||||||||||
Shares used in diluted per share calculations | 43,364 | 42,643 | 34,938 | 32,963 | 32,345 | ||||||||||||||
BALANCE SHEET DATA: | |||||||||||||||||||
Cash, cash equivalents, and short-term investments | $ | 335,421 | $ | 374,709 | $ | 395,317 | $ | 480,149 | $ | 659,974 | |||||||||
Total assets | $ | 811,815 | $ | 876,042 | $ | 933,437 | $ | 1,017,159 | $ | 1,076,887 | |||||||||
Long-term debt, net of issuance costs | $ | — | $ | — | $ | 489,609 | $ | 491,059 | $ | 492,509 | |||||||||
Revolving line of credit | $ | — | $ | 34,500 | $ | — | $ | — | $ | — | |||||||||
Other long-term obligations | $ | 15,544 | $ | 19,323 | $ | 23,994 | $ | 26,774 | $ | 105,894 | |||||||||
Total stockholders' equity | $ | 698,664 | $ | 727,397 | $ | 312,399 | $ | 382,156 | $ | 352,970 | |||||||||
OTHER DATA: | |||||||||||||||||||
Cash provided by operating activities3 | $ | 146,150 | $ | 157,958 | $ | 150,409 | $ | 139,387 | $ | 121,148 | |||||||||
1 | During Fiscal Year 2015, we recognized a gain of $6.5 million upon payment by a competitor to dismiss litigation involving the alleged infringement of a patent assigned to us. In addition, we recognized a gain of $2.2 million related to the resolution of an insurance coverage dispute with one of its insurance carriers. |
2 | We initiated a restructuring plan during the third quarter of Fiscal Year 2016. Under the plan, we reduced costs by eliminating certain positions in the US, Mexico, China, and Europe. The pre-tax charges of $16.2 million incurred during Fiscal Year 2016 were incurred for severance and related benefits. During Fiscal Year 2016, we recognized gains from litigation of $1.2 million, due primarily to a payment by a competitor to dismiss litigation involving the alleged infringement of a patent assigned to us. |
3 | Beginning Fiscal Year 2018, the Company adopted the FASB's new guidance, Improvements to Employee Share-Based Payment Accounting, which changes among other things, how the tax effects of share-based awards are recognized. This new guidance also eliminates the requirement to reclassify cash flows related to excess tax benefits from operating activities to financing activities on the consolidated statements of cash flows. The Company adopted this provision retrospectively by reclassifying excess tax benefits from financing activities to operating activities in the consolidated statement of cash flows for all prior periods presented. |
29
ITEM 7. MANAGEMENT'S DISCUSSION AND ANALYSIS OF FINANCIAL CONDITION AND RESULTS OF OPERATIONS
The following discussion and analysis is intended to help you understand our results of operations and financial condition. It is provided as a supplement to, and should be read in conjunction with, our Consolidated Financial Statements and related notes thereto included elsewhere in this report. This discussion contains forward-looking statements. Please see the sections entitled "Certain Forward Looking Information" and "Risk Factors" above for discussions of the uncertainties, risks, and assumptions associated with these statements. Our fiscal year-end financial reporting periods end on the Saturday closest to March 31st. Fiscal Years 2018 and 2017 each had 52 weeks and ended on March 31, 2018, and April 1, 2017, respectively. Fiscal Year 2016 had 53 weeks and ended on April 2, 2016. For purposes of presentation, we have indicated our accounting fiscal year as ending on March 31.
OVERVIEW
We are a leading designer, manufacturer, and marketer of lightweight communications headsets, telephone headset systems, other communication endpoints, and accessories for the worldwide business and consumer markets under the Plantronics brand. Until July 1, 2017, we manufactured and marketed specialty telephone products under our Clarity brand, such as telephones for the hearing impaired, and other related products for people with special communication needs. Our major product categories are Enterprise, which includes headsets optimized for Unified Communications & Collaboration (“UC&C”), other corded and cordless communication headsets, audio processors, and telephone systems; and Consumer, which includes Bluetooth and corded products for mobile device applications, personal computer ("PC"), and gaming headsets.
Net Revenues (in millions) | Operating Income (in millions) |
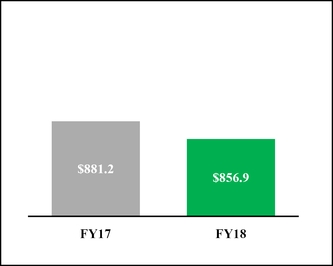
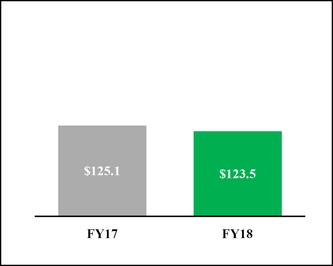
Compared to the prior fiscal year, net revenues decreased 2.8% to $856.9 million. The decrease in net revenues was primarily driven by lower revenues within our Consumer product category, which declined by 18.0% or $45.4 million from the prior fiscal year. Revenues within our Enterprise product category increased by 3.4% or $21.1 million from the prior fiscal year.
Operating profit decreased 1.3% from the prior year to $123.5 million or 14.4% of net revenues, primarily driven by recognition of third-party fees related to the Polycom Transaction and restructuring actions taken during Fiscal Year 2018 which were partially offset by the recognition of the GN Netcom litigation charge in 2017 and lower compensation expenses in Fiscal Year 2018.
On March 28, 2018, we entered into the Purchase Agreement to acquire Polycom for $2.0 billion. The Polycom transaction has been unanimously approved by the boards of directors of both companies, is subject to regulatory approvals and other customary closing conditions, and is expected to close by the end of the third calendar quarter of 2018. We believe this acquisition will better position Plantronics with our channel partners, customers, and strategic alliance partners by allowing us to pursue additional opportunities across the UC&C market in both hardware end points and services. The addition of Polycom’s product and services portfolio, is expected to enable us to accelerate our strategic vision of becoming a global leader in communications and collaboration experiences. We believe this acquisition will position us to capture additional opportunities through data analytics and insight services across a broad portfolio of communications endpoints.
30
Notwithstanding the Polycom Transaction, our primary focus for long-term growth opportunities, strategic initiatives, and the majority of our revenue and profits remain in our Enterprise business. Within the market for Enterprise products, we anticipate the key driver of growth over the next few years will be UC&C audio solutions. We believe enterprises are increasing adoption of UC&C systems to reduce costs, improve collaboration, and migrate technology from obsolete legacy systems. We expect growth of UC&C will increase overall headset adoption in enterprise environments, and we believe most of the growth in our Enterprise product category over the next three years will come from headsets designed for UC&C. As such, UC&C remains the central focus of our sales, marketing, and support functions, and we will continue investing in key strategic alliances and integrations with major UC&C vendors. We continue to invest in new ideas and technology to create additional growth opportunities, such as Plantronics Manager and Plantronics Manager Pro, our software-as-a-service ("SaaS") data insights offering introduced in Fiscal Year 2017, and Habitat Soundscaping, our intelligent acoustic management solution which launched in July 2017. While we anticipate these investments will prove beneficial in the long term, we do not expect their contributions to be material in the near term.
Revenues from our Consumer products channel are seasonal and typically strongest in our third fiscal quarter, which includes the majority of the holiday shopping season. Additionally, other factors directly impact our Consumer product category performance, product life cycles (including the introduction and pace of adoption of new technology), such as the market acceptance of new product introductions, consumer preferences and the competitive retail environment, changes in consumer confidence and other macroeconomic factors. While sales in the mono mobile headset market continues to decline, we believe future growth opportunities exist in gaming and stereo Bluetooth-headsets.
We remain cautious about the macroeconomic environment, based on uncertainty around trade and fiscal policy in the U.S. and broader economic uncertainty in many parts of Europe and Asia Pacific, which makes it difficult for us to gauge the economic impacts on our future business. We will continue to monitor our expenditures and prioritize expenditures that further our strategic long-term growth opportunities.
31
RESULTS OF OPERATIONS
Net revenues may vary due to seasonality, the timing of new product introductions and discontinuation of existing products, discounts and other incentives, and channel mix. Net revenues derived from sales of Consumer products into the retail channel typically account for a seasonal increase in net revenues in the third quarter of our fiscal year. The following graphs display net revenues by product category for Fiscal Years 2016, 2017, and 2018:
Net Revenues (in millions)
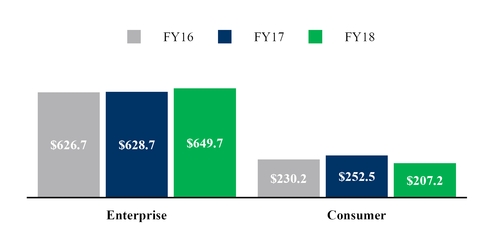
Revenue by Product Category (percent)
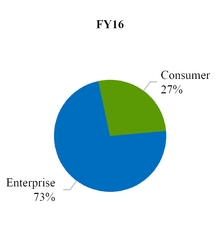
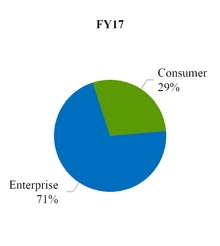
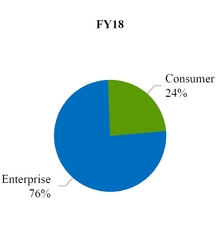
Net revenues decreased in Fiscal Year 2018 compared to the prior fiscal year primarily due to lower revenues within our Consumer product category which was partially offset by increases in our Enterprise product revenues driven by UC&C revenues. Fiscal Year 2018 net revenues were also favorably impacted by fluctuations in exchange rates which resulted in an increase of approximately $9 million in net revenues (net of the effects of hedging).
Net revenues increased in Fiscal Year 2017 compared to the prior fiscal year primarily due to higher revenues within our Consumer product category which was driven by the launch of new and updated products. Net revenues within our Enterprise product category slightly increased, driven by solid growth in our UC&C product category which was partially offset by a decline in our Core Enterprise product category. The impact to net revenues resulting from changes in foreign exchange rates was not material in Fiscal Year 2017.
32
The following graphs display net revenues by domestic and international split, as well as by percentage of total net revenue by major geographic region:
Geographic Information (in millions)
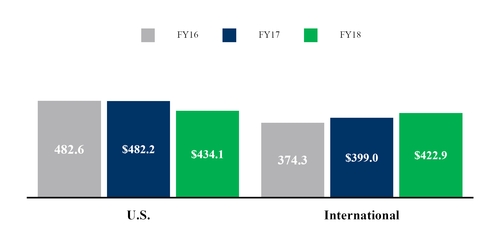
Revenue by Region (percent)
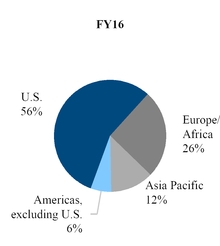
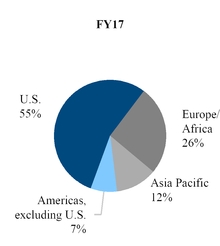
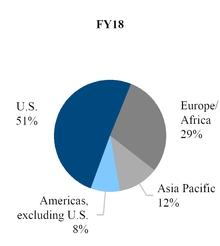
As a percentage of total net revenues, U.S. net revenues decreased in Fiscal Year 2018 from Fiscal Year 2017 due to a decline in sales of our Consumer and Core Enterprise products which were partially offset by increased sales of our UC&C products. International net revenues for Fiscal Year 2018 increased from the prior fiscal year due to increased sales of our UC&C products and the favorable impact of fluctuations in foreign exchange rates which were partially offset by lower sales of our Consumer products.
As a percentage of total net revenues, U.S. net revenues decreased slightly in Fiscal Year 2017 from Fiscal Year 2016 due to a decline in sales of our Core Enterprise products which was partially offset by increased sales of our UC&C products. International net revenues for Fiscal Year 2017 increased from the prior fiscal year due to increased sales of our UC&C products and Consumer products which were partially offset by lower sales in our Core Enterprise category.
33
Cost of Revenues and Gross Profit
Cost of revenues consists primarily of direct manufacturing and contract manufacturer costs, warranty costs, freight duties, excess and obsolete inventory costs, royalties, and overhead expenses.
Fiscal Year Ended | Fiscal Year Ended | |||||||||||||||||||||||||||
(in thousands, except percentages) | March 31, 2016 | March 31, 2017 | Change | March 31, 2017 | March 31, 2018 | Change | ||||||||||||||||||||||
Net revenues | $ | 856,907 | $ | 881,176 | $ | 24,269 | 2.8% | $ | 881,176 | $ | 856,903 | $ | (24,273 | ) | (2.8)% | |||||||||||||
Cost of revenues | 422,233 | 439,806 | $ | 17,573 | 4.2% | 439,806 | 417,788 | $ | (22,018 | ) | (5.0)% | |||||||||||||||||
Gross profit | $ | 434,674 | $ | 441,370 | $ | 6,696 | 1.5% | $ | 441,370 | $ | 439,115 | $ | (2,255 | ) | (0.5)% | |||||||||||||
Gross profit % | 50.7 | % | 50.1 | % | 50.1 | % | 51.2 | % | ||||||||||||||||||||
Compared to the prior fiscal year, profit as a percentage of net revenues increased in Fiscal Year 2018 primarily due to product cost reductions, the strengthening of foreign currencies relative to the USD which favorably impacted margins on our international product sales, and a favorable product mix shift away from our Consumer product category which carries lower margins.
Compared to the prior fiscal year, gross profit as a percentage of revenues decreased in Fiscal Year 2017 primarily due to a product mix shift from Enterprise to Consumer, the latter of which carries lower margins. In addition, within Enterprise there was a product mix shift from Core Enterprise to UC&C, the latter of which carries lower margins. These decreases were partially offset by reductions in the cost of materials.
There are significant variances in gross profit percentages between our higher and lower margin products; therefore, small variations in product mix, which can be difficult to predict, can have a significant impact on gross profit. Gross profit may also vary based on distribution channel, return rates, and other factors.
Research, Development, and Engineering
Research, development, and engineering costs are expensed as incurred and consist primarily of compensation costs, outside services, including legal fees associated with protecting our intellectual property, expensed materials, overhead expenses.
Fiscal Year Ended | Fiscal Year Ended | |||||||||||||||||||||||||||
(in thousands, except percentages) | March 31, 2016 | March 31, 2017 | Change | March 31, 2017 | March 31, 2018 | Change | ||||||||||||||||||||||
Research, development and engineering | $ | 90,408 | $ | 88,318 | $ | (2,090 | ) | (2.3)% | $ | 88,318 | $ | 84,193 | $ | (4,125 | ) | (4.7)% | ||||||||||||
% of total net revenues | 10.6% | 10.0% | 10.0% | 9.8% | ||||||||||||||||||||||||
The decrease in research, development, and engineering expenses in Fiscal Year 2018 compared to Fiscal Year 2017 was primarily due to lower compensation expenses, driven by reduced funding of our variable compensation plans and cost reductions from our restructuring actions initiated in current and prior fiscal periods.
The decrease in research, development, and engineering expenses in Fiscal Year 2017 compared to Fiscal Year 2016 was due primarily to cost reductions in the current year resulting from the restructuring action initiated at the end of our third quarter of fiscal year 2016, partially offset by an increase in funding for our variable compensation plans resulting from better achievement against corporate goals than in the prior fiscal year.
34
Selling, General, and Administrative
Selling, general, and administrative expense consists primarily of compensation costs, marketing costs, travel expenses, professional service fees, and overhead expenses.
Fiscal Year Ended | Fiscal Year Ended | |||||||||||||||||||||||||||
(in thousands, except percentages) | March 31, 2016 | March 31, 2017 | Change | March 31, 2017 | March 31, 2018 | Change | ||||||||||||||||||||||
Selling, general and administrative | $ | 221,299 | $ | 223,830 | $ | 2,531 | 1.1% | $ | 223,830 | $ | 229,390 | $ | 5,560 | 2.5% | ||||||||||||||
% of total net revenues | 25.8 | % | 25.4 | % | 25.4 | % | 26.8 | % | ||||||||||||||||||||
The increase in selling, general, and administrative expenses in Fiscal Year 2018 compared to Fiscal Year 2017 was primarily due to the recognition of third-party fees related to the Polycom Transaction and increases in legal fees related to our litigation with GN Netcom. These increases were partially offset by lower compensation expenses driven by reduced funding of our variable compensation plans, executive transition costs recognized in prior period as well as cost savings from cost control initiatives and prior period restructuring actions. For more information on the litigation with GN Netcom, refer to Note 8, Commitments and Contingencies, of the accompanying notes to consolidated financial statements.
The increase in selling, general, and administrative expenses in Fiscal Year 2017 compared to Fiscal Year 2016 was due primarily to an increase in funding for our variable compensation plans resulting from better achievement against corporate targets, partially offset by cost reductions achieved through the prior fiscal year restructuring action. In addition, Fiscal Year 2017 included executive transition costs that were not incurred in the prior fiscal year.
(Gain) Loss from Litigation Settlements
Fiscal Year Ended | Fiscal Year Ended | |||||||||||||||||||||||||||
(in thousands, except percentages) | March 31, 2016 | March 31, 2017 | Change | March 31, 2017 | March 31, 2018 | Change | ||||||||||||||||||||||
(Gain) loss, net from litigation settlements | $ | (1,234 | ) | $ | 4,255 | $ | 5,489 | (444.8)% | $ | 4,255 | $ | (420 | ) | $ | (4,675 | ) | (109.9)% | |||||||||||
% of net revenues | 0.1 | % | 0.5 | % | 0.5 | % | — | % | ||||||||||||||||||||
During Fiscal Year 2018 we recognized immaterial gains from litigation. During Fiscal Year 2017 we recorded a $4.9 million litigation charge related to discovery sanctions ordered by the court in the GN Netcom litigation, compared to net gains in the prior fiscal year. This charge was partially offset by immaterial gains from unrelated matters. For more information regarding on-going litigation, refer to Note 8, Commitments and Contingencies, of the accompanying notes to consolidated financial statements.
Restructuring and Other Related Charges
Fiscal Year Ended | Fiscal Year Ended | |||||||||||||||||||||||||||
(in thousands, except percentages) | March 31, 2016 | March 31, 2017 | Change | March 31, 2017 | March 31, 2018 | Change | ||||||||||||||||||||||
Restructuring and other related charges | $ | 16,160 | $ | (109 | ) | $ | (16,269 | ) | (100.7)% | $ | (109 | ) | $ | 2,451 | $ | 2,560 | 2,348.6% | |||||||||||
% of net revenues | 1.9 | % | — | % | — | % | 0.3 | % | ||||||||||||||||||||
During Fiscal Year 2018 restructuring and other related charges (credits) increased, due to additional restructuring actions taken during the first quarter of Fiscal Year 2018 as part of our ongoing efforts to reduce costs and focus on improving profitability. These restructuring actions included a reduction-in-workforce, charges to terminate a lease before the end of its contractual term and a loss on the sale of our Clarity division. For more information regarding these restructuring activities, refer to Note 10, Restructuring and other related charges (credits), of the accompanying notes to consolidated financial statements.
35
During Fiscal Year 2017 we recorded a net favorable adjustment resulting from changes to the estimates related to our restructuring actions recorded in Fiscal Year 2016. The favorable adjustment was partially offset by additional restructuring charges of approximately $1.3 million related to an action in fourth quarter of Fiscal Year 2017. The restructuring action taken in the fourth quarter of Fiscal Year 2017, while immaterial to consolidated results, was initiated to reduce the cost of our design and manufacturing processes, specifically in our Consumer product lines, as part of a broader strategic effort to improve our cost structure and consolidated profitability in subsequent Fiscal Years.
Interest Expense
Interest expense of $29.3 million and $29.2 million for Fiscal Years 2018 and 2017, respectively, was primarily related to the 5.50% Senior Notes and included $1.5 million in amortization of debt issuance costs for both Fiscal Years.
Other Non-Operating Income and (Expense), Net
Fiscal Year Ended | Fiscal Year Ended | |||||||||||||||||||||||||||
(in thousands, except percentages) | March 31, 2016 | March 31, 2017 | Change | March 31, 2017 | March 31, 2018 | Change | ||||||||||||||||||||||
Other non-operating income and (expense), net | $ | (716 | ) | $ | 5,819 | $ | 6,535 | 912.7% | $ | 5,819 | $ | 6,023 | $ | 204 | 3.5% | |||||||||||||
% of net revenues | 0.1 | % | 0.7 | % | 0.7 | % | 0.7 | % | ||||||||||||||||||||
During Fiscal Year 2018 other non-operating income and (expense), net increased slightly primarily due to favorable changes in foreign currency exchange rates and an increase in interest income from higher average yields on our investment portfolio which were mostly offset by a loss of $1.2 million on the sale of our long term investments.
During Fiscal Year 2017 other non-operating income and (expense), net increased primarily due to a net foreign currency gain of $1.0 million compared to a $2.3 million net foreign currency loss in Fiscal Year 2016 on more volatile foreign currency exchange rate fluctuations, driving a favorable increase in fiscal year 2017 of $3.3 million. In addition, interest income increased by $1.7 million compared to Fiscal Year 2016 due to slightly higher interest rates on a higher average investment portfolio. Finally, unrealized holding gains on investments underlying our deferred compensation plan increased by $1.0 million, driven by higher market values on the related investments in Fiscal Year 2017 as compared to Fiscal Year 2016. This had no impact to our consolidated net income because an equal and offsetting compensation expense attributable to the net increase in the value of the securities underling the deferred compensation plan is recorded as part of operating income.
Income Tax Expense
Fiscal Year Ended | Fiscal Year Ended | |||||||||||||||||||||||||||
(in thousands, except percentages) | March 31, 2016 | March 31, 2017 | Change | March 31, 2017 | March 31, 2018 | Change | ||||||||||||||||||||||
Income before income taxes | $ | 82,176 | $ | 101,665 | $ | 19,489 | 23.7% | $ | 101,665 | $ | 100,227 | $ | (1,438 | ) | (1.4)% | |||||||||||||
Income tax expense | $ | 13,784 | $ | 19,066 | $ | 5,282 | 38.3% | $ | 19,066 | $ | 101,096 | $ | 82,030 | 430.2% | ||||||||||||||
Net income | $ | 68,392 | $ | 82,599 | $ | 14,207 | 20.8% | $ | 82,599 | $ | (869 | ) | $ | (83,468 | ) | (101.1)% | ||||||||||||
Effective tax rate | 16.8 | % | 18.8 | % | 18.8 | % | 100.9 | % | ||||||||||||||||||||
The effective tax rate for Fiscal Year 2018 was higher than that in the previous year due primarily to the passage of the Tax Cuts and Jobs Act (H.R. 1) ("the Tax Act") on December 22, 2017. The Tax Act includes several changes to existing tax law, including, among other things, a permanent reduction in the corporate income tax rate from 35% to 21% and applying new taxes on certain foreign source earnings. In addition, we were subject to a one-time deemed repatriation of accumulated foreign subsidiary unremitted earnings (hereafter, the "toll charge"), which the Company expects to pay over an eight-year period as permitted under the Tax Act. The Company recorded a $79.7 million toll charge as part of income tax expense in the year ended March 31, 2018. For more information regarding the Tax Act and Income Tax Expense activities, refer to Note 16, Income Taxes, of the accompanying notes to consolidated financial statements.
The effective tax rate for Fiscal Year 2017 is higher than in the previous year due primarily to unwinding prior cost-sharing of stock based compensation for the engineering function, which impacted Fiscal Year 2016 but not Fiscal Year 2017. Our Fiscal Year 2016 tax provision reflected a $2.9 million tax benefit resulting from a U.S. Tax Court opinion involving an independent
36
third party, issued on December 28, 2015. Based on the findings of the U.S. Tax Court, we issued a reimbursement to our foreign subsidiaries for the share-based compensation element of certain intercompany charges made in prior periods. The increase in our tax rate in Fiscal Year 2017 over Fiscal Year 2016, resulting from the one-time reimbursement of costs, was partially offset by shift in the Company's geographic mix of income from higher tax jurisdictions to lower tax jurisdictions.
Our effective tax rate for Fiscal years 2016, 2017, and 2018 differs from the statutory rate due to the impact of foreign operations taxed at different statutory rates, income tax credits, state taxes, the Tax Act and other factors. Our future tax rate could be impacted by a shift in the mix of domestic and foreign income, tax treaties with foreign jurisdictions, changes in tax laws in the U.S. or internationally, or a change in estimate of future taxable income, which could result in a valuation allowance being required.
FINANCIAL CONDITION
Operating Cash Flow (in millions) | Investing Cash Flow (in millions) | Financing Cash Flow (in millions) |
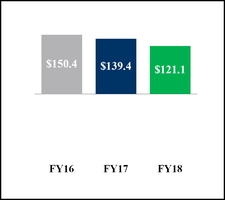
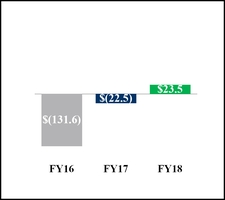
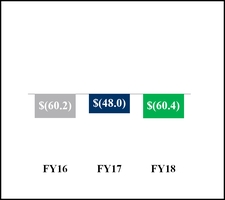
We use cash provided by operating activities as our primary source of liquidity. We expect that cash provided by operating activities will fluctuate in future periods as a result of a number of factors, including fluctuations in our revenues, the timing of product shipments during the quarter, accounts receivable collections, inventory and supply chain management, and the timing and amount of tax and other payments.
Operating Activities
Compared to Fiscal Year 2017, net cash provided by operating activities during Fiscal Year 2018 decreased primarily as a result of lower net income after adjusting for non-cash items and higher payouts in the first quarter of Fiscal Year 2018 related to Fiscal Year 2017 variable compensation than payouts during the prior year period, due to better achievements against corporate targets in Fiscal Year 2017.
Compared to Fiscal Year 2016, net cash provided by operating activities during Fiscal Year 2017 decreased from a reduced level of customer collections at the end of Fiscal Year 2017 and a higher level of inventory purchases for items not yet sold as of year-end. These decreases were partially offset by higher net income after adjusting for non-cash items, resulting primarily from higher net income, lower cash payments for restructuring activity, and lower cash payments related to our variable compensation plans than the prior fiscal year.
Investing Activities
Net cash used for investing activities during Fiscal Year 2018 decreased from the prior fiscal year due to an increase in proceeds from the sales and maturities of debt securities, net of new investment purchases. This increase was partially offset by lower capital expenditures.
Net cash used for investing activities during Fiscal Year 2017 decreased from the prior fiscal year due primarily to a significant increase in proceeds from the sales and maturities of debt securities, net of new purchases. In addition, we had a lower level of capital expenditures due to finalizing the outlay early in the year for our new facility in the Netherlands and a new manufacturing execution system in our Tijuana, Mexico facility, both of which drove higher capital expenditures throughout Fiscal Year 2016.
We will continue to evaluate new business opportunities and new markets; as a result, our future growth within the existing business or new opportunities and markets may dictate the need for additional facilities and capital expenditures to support that growth.
37
Financing Activities
Net cash used for financing activities during Fiscal Year 2018 increased from the prior fiscal year primarily due to an increase in cash used for common stock repurchases driven by a lower average stock price which was partially offset by higher net proceeds from stock-based compensation plans.
Net cash used for financing activities during Fiscal Year 2017 decreased from the prior fiscal year primarily due to significantly fewer common stock repurchases due to the non-recurrence of debt proceeds in Fiscal Year 2017 and a higher average stock price throughout Fiscal Year 2017; in addition, we repaid amounts due under our revolving line of credit in the prior fiscal year, compared to no activity in Fiscal Year 2017. These decreases in the use of cash for financing activities were partially offset by the non-recurrence of debt-related proceeds in Fiscal Year 2017 as described above, compared to a significant net inflow from our debt financing in the prior fiscal year.
On May 1, 2018, we announced that our Audit Committee of the Board of Directors ("the Audit Committee") declared a $0.15 cash dividend per share of common stock, payable on June 8, 2018 to stockholders of record at the close of business on May 18, 2018. We expect to continue paying a quarterly dividend of $0.15 per share of common stock; however, the actual declaration of dividends and the establishment of record and payment dates are subject to final determination by the Audit Committee each quarter after its review of our financial performance and financial position.
Liquidity and Capital Resources
Our primary discretionary cash uses have historically been for repurchases of our common stock and dividend payments. At March 31, 2018, we had working capital of $774.2 million, including $660.0 million of cash, cash equivalents, and short-term investments, compared to working capital of $581.8 million, including $480.1 million of cash, cash equivalents, and short-term investments at March 31, 2017. The increase in working capital at March 31, 2018 compared to March 31, 2017 resulted from the net increase in cash and cash equivalents, short-term investments, and accounts receivable, all due primarily to improved management of working capital. These increases were partially offset by working capital decreases resulting from a net increase in both accounts payable and accrued liabilities due to payment timing and better achievement against targets for our Fiscal Year 2018 variable compensation plan, respectively.
On March 28, 2018, we entered into the Purchase Agreement for the acquisition of Polycom at a purchase price of $2.0 billion, of which we expect approximately $1.6 billion will be paid in cash and the remaining $0.4 million will be paid in the form of shares of common stock of the Company representing a 19.1% equity interest in the Company before giving effect to the issuance (approximately 16.0% after giving effect to the issuance). The Purchase Agreement also contains a working capital adjustment. The Company has obtained $1.4 billion in committed debt financing consisting of a secured term loan facility and a secured revolving credit facility from Wells Fargo Bank, National Association and Wells Fargo Securities, LLC. This new committed debt financing combined with cash on hand, will enable the Company to consummate the Polycom Transaction. The Polycom Transaction is not subject to a financing condition. The Purchase Agreement includes representations, warranties and covenants of the respective parties. Completion of the transactions contemplated by the Purchase Agreement is subject to common closing conditions for transactions of this type including, among others: (1) the expiration or termination of the required waiting period under the Hart-Scott-Rodino Antitrust Improvements Act of 1976, as amended, (2) regulatory approval in certain specified jurisdictions, including antitrust regulatory approval in Germany and Russia, and (3) the binding of a representations and warranties insurance policy. The Polycom Transaction does not require approval by the stockholders of the Company. The Purchase Agreement also contains certain termination rights for each of the parties if any of the conditions to closing have not been satisfied or if the Polycom Transaction has not been consummated on or prior to September 28, 2018. In addition, the Purchase Agreement provides for indemnification rights in favor of the Company including with respect to certain specified liabilities, including those relating to certain legal and regulatory enforcement matters. We will recognize all contingent transaction fees upon successful completion of the Polycom Transaction.
Prior to Fiscal Year 2018, we did not recognize a deferred tax liability related to unremitted foreign subsidiary earnings because our plans did not require us to repatriate earnings from foreign operations to fund our U.S. operations. The enactment of the Tax Act in the U.S. on December 22, 2017, introduced, among other things, applying new taxes on certain foreign source earnings and imposed the toll charge. We recorded a $79.7 million toll charge as part of income tax expense in the year ended March 31, 2018, which we expect to pay over an eight-year period as permitted under the Tax Act. We expect to fund payment of the toll charge by repatriating a portion of our foreign earnings and as such, we recorded a deferred tax liability of $5 million related to state income taxes and foreign withholding taxes that will become due as we repatriate foreign earnings. For additional details, refer to Note 16, Income Taxes, of the accompanying notes to consolidated financial statements.
38
Our cash and cash equivalents as of March 31, 2018 consist of bank deposits with third party financial institutions and Commercial Paper. We monitor bank balances in our operating accounts and adjust the balances as appropriate. Cash balances are held throughout the world, including substantial amounts held outside of the U.S. As of March 31, 2018, of our $660.0 million of cash, cash equivalents, and short-term investments, $116.5 million is held domestically while 543.5 million is held by foreign subsidiaries, approximately 82% of which were based in U.S. dollar-denominated holdings. Our investments are intended to establish a high-quality portfolio that preserves principal and meets liquidity needs. As of March 31, 2018, our investments are composed of Mutual Funds, US Treasury Notes, Government Agency Securities, Commercial Paper, Corporate Bonds, and Certificates of Deposits ("CDs").
From time to time, our Board of Directors ("the Board") authorizes programs under which we may repurchase shares of our common stock, depending on market conditions, in the open market or through privately negotiated transactions, including accelerated stock repurchase agreements. As of March 31, 2018, there remained a total of 730,105 shares authorized for repurchase under the stock repurchase program approved by the Board on July 27, 2017. Refer to Note 12, Common Stock Repurchases, of the accompanying notes to consolidated financial statements in this Form 10-K for more information regarding our stock repurchase programs. We had no retirements of treasury stock in Fiscal Years 2016, 2017 and 2018.
In May 2015, we entered into an Amended and Restated Credit Agreement (the “Credit Agreement”) with Wells Fargo Bank, National Association (the “Bank”). The Credit Agreement amended and restated our prior credit agreement, dated as of May 2011. The Credit Agreement provides for a $100.0 million unsecured revolving credit facility to augment our financial flexibility. Our obligations under the Credit Agreement are required to be guaranteed by the Company’s domestic subsidiaries, subject to certain exceptions. The Credit Agreement was amended again in May 2016 and April 2017, as discussed below.
In May 2016, we executed a First Amendment to Amended and Restated Credit Agreement and Limited Waiver (the “Amendment”). The Amendment extended the term of the Credit Agreement by one year to May 9, 2019, and waived a default under the Credit Agreement in effect as of March 31, 2016 in which our debt to earnings before interest, tax, depreciation, and amortization ("EBITDA") ratio minimally exceeded the previously agreed upon ratio of 3:1. The covenant breach resulted primarily from our restructuring activities in the third and fourth quarters of Fiscal Year 2016. On May 2, 2016, we received a waiver from the lender for noncompliance with the minimum EBITDA covenant at March 31, 2016. Pursuant to the terms of the waiver and amendment to the Credit Agreement, the $16.2 million of restructuring charges recorded in our Fiscal Year 2016 was excluded from the lender’s rolling four-quarter EBITDA calculation. This breach was not considered to be a cross-default on our 5.50% Senior Notes and as such, had no impact on the amount or timing of the related amounts payable.
In April 2017, we executed a Second Amendment to Amended and Restated Credit Agreement (the "Amended Credit Agreement"). The Amended Credit Agreement redefined the term, "EBIDTA", to the original definition as it existed before the wavier we received last year, as described above, extended the term of the Credit Agreement by one year to May 9, 2020, and amended certain of the covenants, which are defined below.
Revolving loans under the Amended Credit Agreement will bear interest, at our election, at (i) the Bank’s announced prime rate less 1.20% per annum or (ii) a daily one-month LIBOR rate plus 1.40% per annum. Principal, together with all accrued and unpaid interest, on the revolving loans is due and payable on May 9, 2020. The Company is also obligated to pay a commitment fee of 0.37% per annum on the average daily unused amount of the revolving line of credit, which fee shall be payable quarterly in arrears. The Company may prepay the loans and terminate the commitments under the Amended Credit Agreement at any time, without premium or penalty, subject to the reimbursement of certain costs. As of March 31, 2018, the Company had no outstanding borrowings under the line of credit. The line of credit requires us to comply with the following covenant ratios at each fiscal quarter end and determined on a rolling four-quarter basis:
• | maximum ratio of funded debt to earnings before interest, taxes, depreciation, and amortization ("EBITDA") of 3.25:1; and |
• | minimum EBITDA coverage ratio, which is calculated as interest payments divided by EBITDA. |
In addition, we and our subsidiaries are required to maintain unrestricted cash, cash equivalents and marketable securities plus availability under the Amended Credit Agreement at the end of each fiscal quarter of at least $300.0 million. The Amended Credit Agreement contains customary events of default that include, among other things, payment defaults, covenant defaults, cross-defaults with certain other indebtedness, bankruptcy and insolvency defaults, and judgment defaults. The occurrence of an event of default could result in the acceleration of the obligations under the Amended Credit Agreement. The Company intends to replace the Amended Credit Agreement with a secured revolving credit facility included in the committed debt financing for the Polycom Transaction.
39
During the year ended March 31, 2016, we obtained $488.4 million from debt financing, net of issuance costs. The debt matures on May 31, 2023, and bears interest at a rate of 5.50% per annum, payable semi-annually on May 15 and November 15 of each year. A portion of the proceeds was used to repay all then-outstanding amounts under our revolving line of credit agreement with Wells Fargo Bank and the remaining proceeds were used primarily for share repurchases. Although under certain circumstances the Company is obligated to provide security for the unsecured notes, we do not expect that obligation to be triggered by the Polycom Transaction.
Our liquidity, capital resources, and results of operations in any period could be affected by repurchases of our common stock, the payment of cash dividends, the exercise of outstanding stock options, restricted stock grants under stock plans, and the issuance of common stock under our ESPP. We expect the Polycom Transaction to affect our liquidity and leverage ratios as we finalize the committed debt financing with Wells Fargo and other key terms of the transaction noted above. Therefore, we plan to return our liquidity and leverage ratios to pre-acquisition levels, through the curtailment of open market common stock repurchases. We receive cash from the exercise of outstanding stock options under our stock plan and the issuance of shares under our ESPP. However, the resulting increase in the number of outstanding shares from these equity grants and issuances could affect our earnings per share. We cannot predict the timing or amount of proceeds from the sale or exercise of these securities or whether they will be exercised, forfeited, canceled, or will expire.
We believe that our current cash and cash equivalents, short-term investments, cash provided by operations, and the availability of additional funds under the Amended Credit Agreement will be sufficient to fund operations for at least the next 12 months; however, any projections of future financial needs and sources of working capital are subject to uncertainty. Readers are cautioned to review the risks, uncertainties, and assumptions set forth in this Annual Report on Form 10-K, including the sections entitled “Certain Forward-Looking Information” and “Risk Factors” for factors that could affect our estimates for future financial needs and sources of working capital.
OFF BALANCE SHEET ARRANGEMENTS AND CONTRACTUAL OBLIGATIONS
We have not entered into any transactions with unconsolidated entities whereby we have financial guarantees, subordinated retained interests, derivative instruments, or other contingent arrangements that expose us to material continuing risks, contingent liabilities, or any other obligation under a variable interest in an unconsolidated entity that provides us with financing and liquidity support, market risk, or credit risk support.
A substantial portion of the raw materials, components, and subassemblies used in our products are provided by our suppliers on a consignment basis. These consigned inventories are not recorded on our consolidated balance sheet until we take title to the raw materials, components, and subassemblies, which occurs when they are consumed in the production process. Prior to consumption in the production process, our suppliers bear the risk of loss and retain title to the consigned inventory. The terms of the agreements allow the Company to return parts in excess of maximum order quantities to the suppliers at the supplier’s expense. Returns for other reasons are negotiated with the suppliers on a case-by-case basis and to date have been immaterial. If our suppliers were to discontinue financing consigned inventory, it would require us to make cash outlays and we could incur expenses which, if material, could negatively affect our business and financial results. As of March 31, 2017 and 2018, we had off-balance sheet consigned inventories of $52.3 million and $48.8 million, respectively.
The following table summarizes our future contractual obligations as of March 31, 2018 and the effect that such obligations are expected to have on our liquidity and cash flows in future periods:
Payments Due by Period | ||||||||||||||||||||
(in thousands) | Total | Less than 1 year | 1-3 years | 4-5 years | More than 5 years | |||||||||||||||
Operating leases | $ | 9,970 | $ | 2,556 | $ | 3,965 | $ | 2,145 | $ | 1,304 | ||||||||||
Unconditional purchase obligations | $ | 189,995 | $ | 180,861 | $ | 9,134 | $ | — | $ | — | ||||||||||
Long term debt (5.50% Senior Notes) | $ | 652,455 | $ | 27,500 | $ | 55,000 | $ | 55,000 | $ | 514,955 | ||||||||||
Toll charge | $ | 79,725 | $ | 6,378 | $ | 12,756 | $ | 12,756 | $ | 47,835 | ||||||||||
Total contractual cash obligations | $ | 932,145 | $ | 217,295 | $ | 80,855 | $ | 69,901 | $ | 564,094 | ||||||||||
Operating Leases
We lease certain facilities under operating leases expiring through our Fiscal Year 2026. Certain of these leases provide for renewal options for periods ranging from one to three years and in the normal course of business, we may exercise the renewal options.
40
Unconditional Purchase Obligations
We use several contract manufacturers to manufacture raw materials, components, and subassemblies for our products. We provide these contract manufacturers with demand information that typically covers periods up to 13 weeks, and they use this information to acquire components and build products. We also obtain individual components for our products from a wide variety of individual suppliers. Consistent with industry practice, we acquire components through a combination of purchase orders, supplier contracts, and open orders based on projected demand information. As of March 31, 2018, we had outstanding off-balance sheet third-party manufacturing commitments and component purchase commitments of $190.0 million, all of which we expect to consume in the normal course of business.
Toll Charge
During the year ended March 31, 2018, our short and long-term tax obligations increased due to introduction of the Tax Act which required the payment of the toll charge. As permitted under the Tax Act, we expect to pay the toll charge obligation over an 8-year period. For additional details regarding the Tax Act and the toll charge, refer to Note 16, Income Taxes, in the accompanying notes to the consolidated financial statements.
Unrecognized Tax Benefits
As of March 31, 2018, long-term income taxes payable reported on our consolidated balance sheet included unrecognized tax benefits and related interest of $12.6 million and $1.4 million, respectively. We are unable to reliably estimate the timing of future payments related to unrecognized tax benefits and they are not included in the contractual obligations table above. We do not anticipate any material cash payments associated with our unrecognized tax benefits to be made within the next twelve months.
CRITICAL ACCOUNTING ESTIMATES
Our consolidated financial statements are prepared in accordance with generally accepted accounting principles in the United States of America ("U.S. GAAP"). In connection with the preparation of our financial statements, we are required to make assumptions and estimates about future events, and apply judgments that affect the reported amounts of assets, liabilities, revenue, expenses and the related disclosures. We base our assumptions, estimates and judgments on historical experience, current trends, future expectations and other factors that management believes to be relevant at the time our consolidated financial statements are prepared. On an ongoing basis, we review the accounting policies, assumptions, estimates and judgments to ensure that our consolidated financial statements are presented fairly and in accordance with U.S. GAAP. Because future events and their effects cannot be determined with certainty, actual results could differ from our assumptions and estimates, and such differences could be material.
Our significant accounting policies are discussed in Note 2, Significant Accounting Policies, of the notes to consolidated financial statements in this Annual Report on Form 10-K. We believe the following accounting estimates are the most critical to aid in fully understanding and evaluating our reported financial results, and they require our most difficult, subjective, or complex judgments, resulting from the need to make estimates about the effect of matters that are inherently uncertain. We have reviewed these critical accounting estimates and related disclosures with the Audit Committee.
• | Revenue Recognition and Related Allowances |
• | Inventory Valuation |
• | Product Warranty Obligations |
• | Income Taxes |
Revenue Recognition and Related Allowances
We sell substantially all of our products to end users through distributors, retailers, and carriers. The Company recognizes revenue when persuasive evidence of an arrangement exists, delivery has occurred, the sales price is fixed or determinable, and collection is reasonably assured. For most of the Company’s product sales, these criteria are met at either the time the product is shipped or the customer has received the product. Commercial distributors and retailers represent our largest sources of net revenues. Sales through our distribution and retail channels are made primarily under agreements allowing for rights of return and include various sales incentive programs, such as back end rebates, discounts, marketing development funds, price protection, and other sales incentives. We have an established sales history for these arrangements and we record the estimated reserves and allowances at the time the related revenue is recognized. Customer sales returns are estimated based on historical data, relevant current data, and the monitoring of inventory build-up in the distribution channel.
41
The primary factors affecting our reserve for estimated customer sales returns include the general timing of historical returns and estimated return rates which we group by similar characteristics. With the exception of marketing development funds, the allowance for sales incentive programs is based on contractual terms and historical experience in the form of payments or sell-through credits redeemed by our customers. The allowance for marketing development funds is based on contractual terms or program guidelines, as applicable. Future market conditions or a changes to partner incentives may lead us to increase customer incentive offerings, possibly resulting in an incremental reduction of revenue.
We have not made any material changes in the accounting methodology we use to measure sales return reserves or incentive allowances during the past three fiscal years. Substantially all credits associated with these activities are processed within the following fiscal period, and therefore, do not require subjective long-term estimates; however, if actual results are not consistent with the assumptions and estimates used, we may be exposed to losses or gains that could be material. If we increased our estimate as of March 31, 2018 by a hypothetical 10%, our sales returns reserve and sales incentive allowance would have increased by approximately $1.0 million and $4.4 million, respectively. Net of the estimated value of the inventory that would be returned, this would have decreased gross profit and net income by approximately $5.3 million and $4.7 million, respectively.
When a sales arrangement contains multiple elements, such as hardware and software products and/or services, we allocate revenue to each element based on relative selling prices. The selling price for a deliverable is based on its vendor specific objective evidence ("VSOE"), if available, third party evidence ("TPE") if VSOE is not available, or estimated selling price ("ESP") if neither VSOE nor TPE are available. In multiple element arrangements where more-than-incidental software deliverables are included, we allocate revenue to each separate unit of accounting for each of the non-software deliverables and to the software deliverables as a group using the relative selling prices of each of the deliverables in the arrangement based on the aforementioned selling price hierarchy. Revenue recognized for the software portion of multiple element arrangements was less than 1% of total net revenues for the years ended March 31, 2017 and 2018. As of March 31, 2017 and 2018, total deferred revenue related to the software portion of multiple-element arrangements was $1.9 million and $2.3 million, respectively.
Inventory Valuation
Inventories are valued at the lower of cost or net realizable value. The Company writes down inventories that have become obsolete or are in excess of anticipated demand or net realizable value. Our estimate of write downs for excess and obsolete inventory is based on a detailed analysis of on-hand inventory and purchase commitments in excess of forecasted demand. Our products require long-lead time parts available from a limited number of vendors and, occasionally, last-time buys of raw materials for products with long lifecycles. The effects of demand variability, long-lead times, and last-time buys have historically contributed to inventory write-downs. Our demand forecast considers projected future shipments, market conditions, inventory on hand, purchase commitments, product development plans and product life cycle, inventory on consignment, and other competitive factors. Refer to "Off Balance Sheet Arrangements" in this Annual Report on Form 10-K for additional details regarding consigned inventories.
We have not made any material changes in the accounting methodology we use to estimate our inventory write-downs or adverse purchase commitments during the past three fiscal years. If the demand or market conditions for our products are less favorable than forecasted or if unforeseen technological changes negatively impact the utility of our inventory, we may be required to record additional inventory write-downs or adverse purchase commitments, which would negatively affect our results of operations in the period the write-downs or adverse purchase commitments were recorded. If we increased our inventory reserve and adverse purchase commitment reserve estimates as of March 31, 2018 by a hypothetical 10%, the reserves and cost of revenues would have each increased by approximately $0.5 million and our net income would have been reduced by approximately $0.4 million.
Product Warranty Obligations
The Company records a liability for the estimated costs of warranties at the time the related revenue is recognized. Factors that affect the warranty obligation include historical and projected product failure rates, estimated return rates, material usage, service related costs incurred in correcting product failure claims, and knowledge of specific product failures that are outside of the Company’s typical experience. If actual results are not consistent with our estimates or assumptions, we may be exposed to losses or gains that could be material. If we increased our warranty obligation estimate as of March 31, 2018 by a hypothetical 10%, our obligation and the associated cost of revenues would have each increased by approximately $0.8 million and our net income would have been reduced by approximately $0.6 million.
42
Income Taxes
We are subject to income taxes in the U.S. and foreign jurisdictions and our income tax returns are periodically audited by domestic and foreign tax authorities. These audits may include questions regarding our tax filing positions, including the timing and amount of deductions and the allocation of income among various tax jurisdictions. At any one time, multiple tax years may be subject to audit by various tax authorities. In evaluating the exposures associated with our various tax filing positions, we record a liability for such exposures. A number of years may elapse before a particular matter for which we have established a liability is audited and fully resolved or clarified.
To the extent we prevail in matters for which a liability has been established, or are required to pay amounts in excess of our established liability, our effective income tax rate in a given financial statement period could be materially affected. An unfavorable tax settlement would generally require use of our cash and may result in an increase in our effective income tax rate in the period of resolution. A favorable tax settlement would be recognized as a reduction in our effective income tax rate in the period of resolution.
We recognize the impact of an uncertain income tax position on income tax expense at the largest amount that is more-likely-than-not to be sustained. An unrecognized tax benefit will not be recognized unless it has a greater than 50% likelihood of being sustained. We adjust our tax liability for unrecognized tax benefits in the period in which an uncertain tax position is effectively settled, the statute of limitations expires for the relevant taxing authority to examine the tax position, or when more information becomes available. Our liability for unrecognized tax benefits contains uncertainties because management is required to make assumptions and apply judgment to estimate the exposures associated with our various filing positions.
On December 22, 2017, the Tax Act was passed in the United States. The Tax Act includes several changes to existing tax law, including, among other things, a permanent reduction in the corporate income tax rate from 35% to 21% and applying new taxes on certain foreign source earnings. In addition, we were subject to a one-time toll charge which the Company expects to pay over an eight-year period as permitted under the Tax Act.
The provisional estimate for the toll charge will be finalized when the Company completes its substantive review of unremitted foreign earnings through examination of statutory filings and tax returns of the Company's foreign subsidiaries and fiscal branches that span a 30-year period. The Company must also analyze the impact of foreign exchange rates and inflation on the historical information to support foreign tax credits available to offset the toll charge. In addition, the Company's estimate of the toll charge obligation may change due to legislative technical corrections, the IRS' promulgation of regulations to interpret the Tax Act, and changes in accounting standards for income taxes or related interpretations in response to the Tax Act. This review and finalization of the toll charge provisional estimate will be completed within a twelve month measurement period from the date of enactment.
RECENT ACCOUNTING PRONOUNCEMENTS
For a description of recent accounting pronouncements, including the expected dates of adoption and estimated effects, if any, on our consolidated financial statements, see Note 3, “Recent Accounting Pronouncements,” of the Notes to Consolidated Financial Statements.
43
ITEM 7A. QUANTITATIVE AND QUALITATIVE DISCLOSURES ABOUT MARKET RISK
The following discusses our exposure to market risk related to changes in interest rates and foreign currency exchange rates. This discussion contains forward-looking statements that are subject to risks and uncertainties. Actual results could vary materially as a result of a number of factors, including those set forth in Item 1A, Risk Factors.
INTEREST RATE AND MARKET RISK
As of March 31, 2017 and 2018, we reported the following balances in cash and cash equivalents, short-term investments, and long-term investments:
March 31, | ||||||||
(in millions) | 2017 | 2018 | ||||||
Cash and cash equivalents | $ | 302.0 | $ | 390.7 | ||||
Short-term investments | $ | 178.2 | $ | 269.3 | ||||
Long-term investments | $ | 127.2 | $ | — | ||||
As of March 31, 2018, our investments were composed of Mutual Funds, US Treasury Notes, Government Agency Securities, Commercial Paper, Corporate Bonds, and Certificates of Deposits ("CDs").
Our investment policy and strategy are focused on preservation of capital and supporting our liquidity requirements. Our exposure to market risk for changes in interest rates relates primarily to our investment portfolio. Our investment policy limits the amount of credit exposure to any one issuer and requires investments to be high credit quality, primarily rated A or A2 and above, with the objective of minimizing the potential risk of principal loss. All highly liquid investments with initial maturities of three months or less at the date of purchase are classified as cash equivalents. We classify our investments as either short-term or long-term based on each instrument's underlying effective maturity date. All short-term investments have effective maturities less than 12 months, while all long-term investments have effective maturities greater than 12 months or we do not currently have the ability to liquidate the investments. We may sell our investments prior to their stated maturities for strategic purposes, in anticipation of credit deterioration, or for duration management. During the year ended March, 31, 2018, we sold our long-term investments and recognized a loss on sale of approximately $1.2 million. No material realized or unrealized net gains or losses were recognized during the year ended March 31, 2017.
Interest rates were relatively unchanged during Fiscal Year 2018 compared to the prior fiscal year. During Fiscal Year 2018, we generated approximately $3.8 million of interest income from our portfolio of cash equivalents and investments, compared to $3.5 million in Fiscal Year 2017. During Fiscal Years 2017 and 2018, we did not incur a significant amount of interest expense due to outstanding balances under our revolving line of credit. The 5.50% Senior Notes are at a fixed interest rate and we have not elected the fair value option for these instruments; accordingly we are not exposed to any economic interest rate risk related to this indebtedness; however, the fair value of this instrument fluctuates as market interest rates change. The increase in interest expense caused by a 10 basis point increase in the interest rates of our variable-rate revolving line of credit indebtedness would not be significant. A hypothetical 10 basis points increase or decrease on market interest rates related to our investment portfolio would have an immaterial impact on our results of operations.
FOREIGN CURRENCY EXCHANGE RATE RISK
We are a net receiver of currencies other than the U.S. dollar ("USD"). Accordingly, changes in exchange rates, and in particular a strengthening of the USD, could negatively affect our net revenues and gross margins as expressed in U.S. dollars. There is a risk that we will have to adjust local currency product pricing due to competitive pressures if there is significant volatility in foreign currency exchange rates.
The primary currency fluctuations to which we are exposed are the Euro ("EUR"), British Pound Sterling ("GBP"), Australian Dollar ("AUD"), Canadian Dollar ("CAD"), Mexican Peso ("MXN"), and the Chinese Renminbi ("RMB"). We use a hedging strategy to diminish, and make more predictable, the effect of currency fluctuations. All of our hedging activities are entered into with large financial institutions, which we periodically evaluate for credit risks. We hedge our balance sheet exposure by hedging EUR, GBP, AUD, and CAD denominated cash, accounts receivable, and accounts payable balances, and our economic exposure by hedging a portion of anticipated EUR and GBP denominated sales and our MXN denominated expenditures. We can provide no assurance that our strategy will be successful in the future and that exchange rate fluctuations will not materially adversely affect our business. We do not hold or issue derivative financial instruments for speculative trading purposes.
44
We experienced $0.5 million in net foreign currency gains in the year ended March 31, 2018. Although we hedge a portion of our foreign currency exchange exposure, the weakening of certain foreign currencies, particularly the EUR and GBP in comparison to the USD, could result in material foreign exchange losses in future periods.
Non-designated Hedges
We hedge our EUR, GBP, AUD, and CAD denominated cash, accounts receivable, and accounts payable balances by entering into foreign exchange forward contracts. The table below presents the impact on the foreign exchange gain (loss) of a hypothetical 10% appreciation and a 10% depreciation of the USD against the forward currency contracts as of March 31, 2018 (in millions):
Currency - forward contracts | Position | USD Value of Net Foreign Exchange Contracts | Foreign Exchange Gain From 10% Appreciation of USD | Foreign Exchange (Loss) From 10% Depreciation of USD | |||||||||
EUR | Sell EUR | $ | 39.6 | $ | 4.0 | $ | (4.0 | ) | |||||
GBP | Sell GBP | $ | 15.3 | $ | 1.5 | $ | (1.5 | ) | |||||
AUD | Sell AUD | $ | 10.5 | $ | 1.0 | $ | (1.0 | ) | |||||
CAD | Sell CAD | $ | 1.9 | $ | 0.2 | $ | (0.2 | ) | |||||
Cash Flow Hedges
Costless Collars
The Company hedges a portion of the forecasted EUR and GBP denominated revenues with costless collars. On a monthly basis, the Company enters into option contracts with a 6 to 12 month term. Collar contracts are scheduled to mature at the beginning of each fiscal quarter, at which time the instruments convert to forward contracts. The Company also enters into cash flow forwards with a three month term. Once the hedged revenues are recognized, the forward contracts become non-designated hedges to protect the resulting foreign monetary asset position for the Company.
Approximately 44%, 45%, and 49% of net revenues in Fiscal Years 2016, 2017, and 2018, respectively, were derived from sales outside of the U.S., which were denominated primarily in EUR and GBP in each of the fiscal years.
As of March 31, 2018, we had foreign currency put and call option contracts with notional amounts of approximately €77.8 million and £23.7 million denominated in EUR and GBP, respectively. If the USD is subjected to either a 10% appreciation or 10% depreciation versus these net exposed currency positions, we could realize a gain of $8.1 million or incur a loss of $9.6 million, respectively. As of March 31, 2017, we also had foreign currency put and call option contracts with notional amounts of approximately €73.5 million and £23.9 million, denominated in EUR and GBP, respectively. Collectively, our option contracts hedge against a portion of our forecasted foreign currency denominated sales.
The table below presents the impact on the valuation of our currency option contracts of a hypothetical 10% appreciation and a 10% depreciation of the USD against the indicated option contract type for cash flow hedges as of March 31, 2018 (in millions):
Currency - option contracts | USD Value of Net Foreign Exchange Contracts | Foreign Exchange Gain From 10% Appreciation of USD | Foreign Exchange (Loss) From 10% Depreciation of USD | |||||||||
Call options | $ | 130.2 | $ | 4.5 | $ | (9.2 | ) | |||||
Put options | $ | 120.7 | $ | 3.6 | $ | (0.4 | ) | |||||
Forwards | $ | 25.6 | $ | 2.6 | $ | (2.6 | ) | |||||
Collectively, our swap contracts hedge against a portion of our forecasted MXN denominated expenditures. As of March 31, 2018, we had cross currency swap contracts with notional amounts of approximately MXN 31.8 million.
The table below presents the impact on the valuation of our cross-currency swap contracts of a hypothetical 10% appreciation and a 10% depreciation of the USD as of March 31, 2018 (in millions):
Currency - cross-currency swap contracts | USD Value of Cross-Currency Swap Contracts | Foreign Exchange (Loss) From 10% Appreciation of USD | Foreign Exchange Gain From 10% Depreciation of USD | |||||||||
Position: Buy MXN | $ | 1.6 | $ | (0.2 | ) | $ | 0.2 | |||||
45
ITEM 8. FINANCIAL STATEMENTS AND SUPPLEMENTARY DATA
REPORT OF INDEPENDENT REGISTERED PUBLIC ACCOUNTING FIRM
To the Board of Directors and Stockholders of Plantronics, Inc.:
Opinions on the Financial Statements and Internal Control over Financial Reporting
We have audited the accompanying consolidated balance sheets of Plantronics, Inc. and its subsidiaries (“the Company”) as of March 31, 2018 and April 1, 2017, and the related consolidated statements of operations, comprehensive income, stockholders' equity and cash flows for each of the three years in the period ended March 31, 2018, including the related notes and financial statement schedules listed in the index appearing under Item 15(a)(2) (collectively referred to as the “consolidated financial statements”). We also have audited the Company's internal control over financial reporting as of March 31, 2018, based on criteria established in Internal Control - Integrated Framework (2013) issued by the Committee of Sponsoring Organizations of the Treadway Commission (COSO).
In our opinion, the consolidated financial statements referred to above present fairly, in all material respects, the financial position of the Company as of March 31, 2018 and April 1, 2017, and the results of its operations and its cash flows for each of the three years in the period ended March 31, 2018 in conformity with accounting principles generally accepted in the United States of America. Also in our opinion, the Company maintained, in all material respects, effective internal control over financial reporting as of March 31, 2018, based on criteria established in Internal Control - Integrated Framework (2013) issued by the COSO.
Basis for Opinions
The Company's management is responsible for these consolidated financial statements, for maintaining effective internal control over financial reporting, and for its assessment of the effectiveness of internal control over financial reporting, included in the Management's Report on Internal Control over Financial Reporting. Our responsibility is to express opinions on the Company’s consolidated financial statements and on the Company's internal control over financial reporting based on our audits. We are a public accounting firm registered with the Public Company Accounting Oversight Board (United States) ("PCAOB") and are required to be independent with respect to the Company in accordance with the U.S. federal securities laws and the applicable rules and regulations of the Securities and Exchange Commission and the PCAOB.
We conducted our audits in accordance with the standards of the PCAOB. Those standards require that we plan and perform the audits to obtain reasonable assurance about whether the consolidated financial statements are free of material misstatement, whether due to error or fraud, and whether effective internal control over financial reporting was maintained in all material respects.
Our audits of the consolidated financial statements included performing procedures to assess the risks of material misstatement of the consolidated financial statements, whether due to error or fraud, and performing procedures that respond to those risks. Such procedures included examining, on a test basis, evidence regarding the amounts and disclosures in the consolidated financial statements. Our audits also included evaluating the accounting principles used and significant estimates made by management, as well as evaluating the overall presentation of the consolidated financial statements. Our audit of internal control over financial reporting included obtaining an understanding of internal control over financial reporting, assessing the risk that a material weakness exists, and testing and evaluating the design and operating effectiveness of internal control based on the assessed risk. Our audits also included performing such other procedures as we considered necessary in the circumstances. We believe that our audits provide a reasonable basis for our opinions.
Definition and Limitations of Internal Control over Financial Reporting
A company’s internal control over financial reporting is a process designed to provide reasonable assurance regarding the reliability of financial reporting and the preparation of financial statements for external purposes in accordance with generally accepted accounting principles. A company’s internal control over financial reporting includes those policies and procedures that (i) pertain to the maintenance of records that, in reasonable detail, accurately and fairly reflect the transactions and dispositions of the assets of the company; (ii) provide reasonable assurance that transactions are recorded as necessary to permit preparation of financial statements in accordance with generally accepted accounting principles, and that receipts and expenditures of the company are being made only in accordance with authorizations of management and directors of the company; and (iii) provide reasonable assurance regarding prevention or timely detection of unauthorized acquisition, use, or disposition of the company’s assets that could have a material effect on the financial statements.
46
Because of its inherent limitations, internal control over financial reporting may not prevent or detect misstatements. Also, projections of any evaluation of effectiveness to future periods are subject to the risk that controls may become inadequate because of changes in conditions, or that the degree of compliance with the policies or procedures may deteriorate.
/s/ PricewaterhouseCoopers LLP
San Jose, California
May 9, 2018
We have served as the Company’s auditor since 1988.
47
PLANTRONICS, INC.
CONSOLIDATED BALANCE SHEETS
(in thousands, except per share data)
March 31, | |||||||
2017 | 2018 | ||||||
ASSETS | |||||||
Current assets: | |||||||
Cash and cash equivalents | $ | 301,970 | $ | 390,661 | |||
Short-term investments | 178,179 | 269,313 | |||||
Accounts receivable, net | 141,177 | 152,888 | |||||
Inventory, net | 55,456 | 68,276 | |||||
Other current assets | 22,195 | 18,588 | |||||
Total current assets | 698,977 | 899,726 | |||||
Long-term investments | 127,176 | — | |||||
Property, plant, and equipment, net | 150,307 | 142,129 | |||||
Goodwill and purchased intangibles, net | 15,577 | 15,498 | |||||
Deferred tax and other assets | 25,122 | 19,534 | |||||
Total assets | $ | 1,017,159 | $ | 1,076,887 | |||
LIABILITIES AND STOCKHOLDERS' EQUITY | |||||||
Current liabilities: | |||||||
Accounts payable | $ | 42,885 | $ | 45,417 | |||
Accrued liabilities | 74,285 | 80,097 | |||||
Total current liabilities | 117,170 | 125,514 | |||||
Long term debt, net of issuance costs | 491,059 | 492,509 | |||||
Long-term income taxes payable | 11,729 | 87,328 | |||||
Other long-term liabilities | 15,045 | 18,566 | |||||
Total liabilities | 635,003 | 723,917 | |||||
Commitments and contingencies (Note 8) | |||||||
Stockholders' equity: | |||||||
Preferred stock, $0.01 par value per share; 1,000 shares authorized, no shares outstanding | — | — | |||||
Common stock, $0.01 par value per share; 100,000 shares authorized, 48,088 shares and 49,278 shares issued at 2017 and 2018, respectively | 804 | 816 | |||||
Additional paid-in capital | 818,777 | 876,645 | |||||
Accumulated other comprehensive income | 4,694 | 2,870 | |||||
Retained earnings | 319,931 | 299,066 | |||||
Total stockholders' equity before treasury stock | 1,144,206 | 1,179,397 | |||||
Less: Treasury stock (common: 14,672 shares and 16,027 shares at 2017 and 2018, respectively) at cost | (762,050 | ) | (826,427 | ) | |||
Total stockholders' equity | 382,156 | 352,970 | |||||
Total liabilities and stockholders' equity | $ | 1,017,159 | $ | 1,076,887 | |||
The accompanying notes are an integral part of these consolidated financial statements.
48
PLANTRONICS, INC.
CONSOLIDATED STATEMENTS OF OPERATIONS
(in thousands, except per share data)
Fiscal Year Ended March 31, | |||||||||||
2016 | 2017 | 2018 | |||||||||
Net revenues | $ | 856,907 | $ | 881,176 | $ | 856,903 | |||||
Cost of revenues | 422,233 | 439,806 | 417,788 | ||||||||
Gross profit | 434,674 | 441,370 | 439,115 | ||||||||
Operating expenses: | |||||||||||
Research, development, and engineering | 90,408 | 88,318 | 84,193 | ||||||||
Selling, general, and administrative | 221,299 | 223,830 | 229,390 | ||||||||
(Gain) loss, net from litigation settlements | (1,234 | ) | 4,255 | (420 | ) | ||||||
Restructuring and other related charges (credits) | 16,160 | (109 | ) | 2,451 | |||||||
Total operating expenses | 326,633 | 316,294 | 315,614 | ||||||||
Operating income | 108,041 | 125,076 | 123,501 | ||||||||
Interest expense | (25,149 | ) | (29,230 | ) | (29,297 | ) | |||||
Other non-operating income and (expense), net | (716 | ) | 5,819 | 6,023 | |||||||
Income before income taxes | 82,176 | 101,665 | 100,227 | ||||||||
Income tax expense | 13,784 | 19,066 | 101,096 | ||||||||
Net income | $ | 68,392 | $ | 82,599 | $ | (869 | ) | ||||
Earnings per common share: | |||||||||||
Basic | $ | 2.00 | $ | 2.56 | $ | (0.03 | ) | ||||
Diluted | $ | 1.96 | $ | 2.51 | $ | (0.03 | ) | ||||
Shares used in computing earnings per common share: | |||||||||||
Basic | 34,127 | 32,279 | 32,345 | ||||||||
Diluted | 34,938 | 32,963 | 32,345 | ||||||||
Cash dividends declared per common share | $ | 0.60 | $ | 0.60 | $ | 0.60 | |||||
The accompanying notes are an integral part of these consolidated financial statements.
49
PLANTRONICS, INC.
CONSOLIDATED STATEMENTS OF COMPREHENSIVE INCOME
(in thousands)
Fiscal Year Ended March 31, | ||||||||||||
2016 | 2017 | 2018 | ||||||||||
Net income | $ | 68,392 | $ | 82,599 | $ | (869 | ) | |||||
Other comprehensive income (loss): | ||||||||||||
Foreign currency translation adjustments | 376 | (311 | ) | 257 | ||||||||
Unrealized gains (losses) on cash flow hedges: | ||||||||||||
Unrealized cash flow hedge gains (losses) arising during the year | (3,786 | ) | 3,095 | (6,741 | ) | |||||||
Net (gains) losses reclassified into net revenues for revenue hedges (effective portion) | (7,826 | ) | (4,111 | ) | 4,715 | |||||||
Net (gains) losses reclassified into cost of revenues for cost of revenues hedges (effective portion) | 4,801 | 2,663 | (208 | ) | ||||||||
Net unrealized gains (losses) on cash flow hedges | $ | (6,811 | ) | $ | 1,647 | $ | (2,234 | ) | ||||
Unrealized gains (losses) on investments: | ||||||||||||
Unrealized holding gains (losses) during the year | (67 | ) | (516 | ) | 48 | |||||||
Aggregate income tax benefit (expense) of the above items | 141 | 115 | 105 | |||||||||
Other comprehensive income (loss) | (6,361 | ) | 935 | (1,824 | ) | |||||||
Comprehensive income (loss) | $ | 62,031 | $ | 83,534 | $ | (2,693 | ) | |||||
The accompanying notes are an integral part of these consolidated financial statements.
50
Fiscal Year Ended March 31, | |||||||||||
2016 | 2017 | 2018 | |||||||||
CASH FLOWS FROM OPERATING ACTIVITIES | |||||||||||
Net income | $ | 68,392 | $ | 82,599 | $ | (869 | ) | ||||
Adjustments to reconcile net income to net cash provided by operating activities: | |||||||||||
Depreciation and amortization | 20,142 | 20,977 | 21,178 | ||||||||
Amortization of debt issuance costs | 1,208 | 1,450 | 1,450 | ||||||||
Stock-based compensation | 33,265 | 33,539 | 33,959 | ||||||||
Deferred income taxes | (8,291 | ) | (657 | ) | 7,464 | ||||||
Provision for excess and obsolete inventories | 2,430 | 1,960 | 3,456 | ||||||||
Restructuring charges | 16,160 | (109 | ) | 2,451 | |||||||
Cash payments for restructuring charges | (10,385 | ) | (4,001 | ) | (2,942 | ) | |||||
Other operating activities | 7,680 | 2,948 | (305 | ) | |||||||
Changes in assets and liabilities: | |||||||||||
Accounts receivable | 8,445 | (13,894 | ) | (12,238 | ) | ||||||
Inventory | 1,357 | (3,791 | ) | (13,309 | ) | ||||||
Current and other assets | (605 | ) | 1,386 | (2,480 | ) | ||||||
Accounts payable | 5,407 | 4,377 | 2,884 | ||||||||
Accrued liabilities | 4,998 | 13,260 | (4,164 | ) | |||||||
Income taxes | 206 | (657 | ) | 84,613 | |||||||
Cash provided by operating activities | 150,409 | 139,387 | 121,148 | ||||||||
CASH FLOWS FROM INVESTING ACTIVITIES | |||||||||||
Proceeds from sales of investments | 102,517 | 157,066 | 197,575 | ||||||||
Proceeds from maturities of investments | 97,164 | 144,092 | 211,663 | ||||||||
Purchase of investments | (300,620 | ) | (300,434 | ) | (373,281 | ) | |||||
Capital expenditures | (30,661 | ) | (23,176 | ) | (12,468 | ) | |||||
Cash used for investing activities | (131,600 | ) | (22,452 | ) | 23,489 | ||||||
CASH FLOWS FROM FINANCING ACTIVITIES | |||||||||||
Repurchase of common stock | (497,393 | ) | (34,236 | ) | (52,948 | ) | |||||
Employees' tax withheld and paid for restricted stock and restricted stock units | (11,068 | ) | (9,736 | ) | (11,429 | ) | |||||
Proceeds from issuances under stock-based compensation plans | 15,384 | 15,202 | 23,927 | ||||||||
Payment of cash dividends | (21,061 | ) | (19,959 | ) | (19,996 | ) | |||||
Proceeds from revolving line of credit | 155,749 | — | 8,000 | ||||||||
Repayments of revolving line of credit | (190,249 | ) | — | (8,000 | ) | ||||||
Proceeds from bonds issuance, net of issuance costs | 488,401 | — | — | ||||||||
Other financing activity | — | 761 | — | ||||||||
Cash used for financing activities | (60,237 | ) | (47,968 | ) | (60,446 | ) | |||||
Effect of exchange rate changes on cash and cash equivalents | (156 | ) | (2,263 | ) | 4,500 | ||||||
Net increase (decrease) in cash and cash equivalents | (41,584 | ) | 66,704 | 88,691 | |||||||
Cash and cash equivalents at beginning of year | 276,850 | 235,266 | 301,970 | ||||||||
Cash and cash equivalents at end of year | $ | 235,266 | $ | 301,970 | $ | 390,661 | |||||
SUPPLEMENTAL DISCLOSURES | |||||||||||
Cash paid for income taxes | $ | 25,517 | $ | 20,948 | $ | 9,757 | |||||
Cash paid for interest | 12,833 | 27,783 | $ | 27,899 | |||||||
The accompanying notes are an integral part of these consolidated financial statements.
51
Common Stock | Additional Paid-In | Accumulated Other Comprehensive | Retained | Treasury | Total Stockholders' | |||||||||||||||||||||
Shares | Amount | Capital | Income | Earnings | Stock | Equity | ||||||||||||||||||||
Balances at March 31, 2015 | 41,601 | $ | 783 | $ | 717,848 | $ | 10,120 | $ | 209,960 | $ | (211,314 | ) | $ | 727,397 | ||||||||||||
Net income | — | — | — | — | 68,392 | — | 68,392 | |||||||||||||||||||
Foreign currency translation adjustments | — | — | — | 376 | — | — | 376 | |||||||||||||||||||
Net unrealized gains (losses) on cash flow hedges, net of tax | — | — | — | (6,680 | ) | — | — | (6,680 | ) | |||||||||||||||||
Net unrealized gains (losses) on investments, net of tax | — | — | — | (57 | ) | — | — | (57 | ) | |||||||||||||||||
Proceeds from issuances under stock-based compensation plans | 1,155 | 10 | 15,374 | — | — | — | 15,384 | |||||||||||||||||||
Repurchase of restricted common stock | (158 | ) | — | — | — | — | — | — | ||||||||||||||||||
Cash dividends | — | — | — | — | (21,061 | ) | — | (21,061 | ) | |||||||||||||||||
Stock-based compensation | — | — | 33,265 | — | — | — | 33,265 | |||||||||||||||||||
Tax benefit from stock-based awards | — | — | 3,515 | — | — | — | 3,515 | |||||||||||||||||||
Repurchase of common stock | (9,077 | ) | — | — | — | — | (497,393 | ) | (497,393 | ) | ||||||||||||||||
Employees' tax withheld and paid for restricted stock and restricted stock units | (201 | ) | — | — | — | — | (11,068 | ) | (11,068 | ) | ||||||||||||||||
Other equity changes related to compensation | — | — | (513 | ) | — | — | 842 | 329 | ||||||||||||||||||
Balances at March 31, 2016 | 33,320 | 793 | 769,489 | 3,759 | 257,291 | (718,933 | ) | 312,399 | ||||||||||||||||||
Net income | — | — | — | — | 82,599 | — | 82,599 | |||||||||||||||||||
Foreign currency translation adjustments | — | — | — | (311 | ) | — | — | (311 | ) | |||||||||||||||||
Net unrealized gains (losses) on cash flow hedges, net of tax | — | — | — | 1,616 | — | — | 1,616 | |||||||||||||||||||
Net unrealized gains (losses) on investments, net of tax | — | — | — | (370 | ) | — | — | (370 | ) | |||||||||||||||||
Proceeds from issuances under stock-based compensation plans | 1,125 | 11 | 15,193 | — | — | — | 15,204 | |||||||||||||||||||
Repurchase of restricted common stock | (47 | ) | — | — | — | — | — | — | ||||||||||||||||||
Cash dividends | — | — | — | — | (19,959 | ) | — | (19,959 | ) | |||||||||||||||||
Stock-based compensation | — | — | 33,539 | — | — | — | 33,539 | |||||||||||||||||||
Tax benefit from stock-based awards | — | — | 546 | — | — | — | 546 | |||||||||||||||||||
Repurchase of common stock | (764 | ) | — | — | — | — | (34,236 | ) | (34,236 | ) | ||||||||||||||||
Employees' tax withheld and paid for restricted stock and restricted stock units | (218 | ) | — | — | — | — | (9,736 | ) | (9,736 | ) | ||||||||||||||||
Other equity changes related to compensation | — | — | 10 | — | 855 | 865 | ||||||||||||||||||||
Balances at March 31, 2017 | 33,416 | 804 | 818,777 | 4,694 | 319,931 | (762,050 | ) | 382,156 | ||||||||||||||||||
Net income | — | — | — | — | (869 | ) | — | (869 | ) | |||||||||||||||||
Foreign currency translation adjustments | — | — | — | 257 | — | — | 257 | |||||||||||||||||||
Net unrealized gains (losses) on cash flow hedges, net of tax | — | — | — | (2,190 | ) | — | — | (2,190 | ) | |||||||||||||||||
Net unrealized gains (losses) on investments, net of tax | — | — | — | 109 | — | — | 109 | |||||||||||||||||||
Proceeds from issuances under stock-based compensation plans | 1,288 | 12 | 23,915 | — | — | — | 23,927 | |||||||||||||||||||
Repurchase of restricted common stock | (98 | ) | — | — | — | — | — | — | ||||||||||||||||||
Cash dividends | — | — | — | — | (19,996 | ) | — | (19,996 | ) | |||||||||||||||||
Stock-based compensation | — | — | 33,959 | — | — | 33,959 | ||||||||||||||||||||
Tax benefit from stock-based awards | — | — | — | — | — | — | ||||||||||||||||||||
Repurchase of common stock | (1,140 | ) | — | — | — | — | (52,948 | ) | (52,948 | ) | ||||||||||||||||
Employees' tax withheld and paid for restricted stock and restricted stock units | (215 | ) | — | — | — | — | (11,429 | ) | (11,429 | ) | ||||||||||||||||
Other equity changes related to compensation | — | — | (6 | ) | — | — | (6 | ) | ||||||||||||||||||
Balances at March 31, 2018 | 33,251 | $ | 816 | $ | 876,645 | $ | 2,870 | $ | 299,066 | $ | (826,427 | ) | $ | 352,970 | ||||||||||||
The accompanying notes are an integral part of these consolidated financial statements.
52
PLANTRONICS, INC.
NOTES TO CONSOLIDATED FINANCIAL STATEMENTS
1. | THE COMPANY |
Plantronics, Inc. (“Plantronics” or “the Company”) is a leading worldwide designer, manufacturer, and marketer of lightweight communications headsets, telephone headset systems, and accessories for the business and consumer markets under the Plantronics brand. The Company operates its business as one segment.
Founded in 1961, Plantronics is incorporated in the state of Delaware and trades on the New York Stock Exchange under the ticker symbol “PLT”.
2. | SIGNIFICANT ACCOUNTING POLICIES |
Management's Use of Estimates and Assumptions
The Company's consolidated financial statements are prepared in accordance with generally accepted accounting principles in the United States of America ("U.S. GAAP"). In connection with the preparation of our financial statements, the Company is required to make assumptions and estimates about future events, and apply judgments that affect the reported amounts of assets, liabilities, net revenues, expenses, and the related disclosures. The Company bases its assumptions, estimates, and judgments on historical experience, current trends, future expectations, and other factors that management believes to be relevant at the time the consolidated financial statements are prepared. On an ongoing basis, the Company reviews its accounting policies, assumptions, estimates, and judgments, including those related to revenue and related reserves and allowances, inventory valuation, product warranty obligations, the useful lives of long-lived assets including property, plant and equipment and intangible assets, investment fair values, stock-based compensation, goodwill, income taxes, contingencies, and restructuring charges, to ensure that the consolidated financial statements are presented fairly and in accordance with U.S. GAAP. Because future events and their effects cannot be determined with certainty, actual results could differ from the Company's assumptions and estimates.
Principles of Consolidation
The consolidated financial statements include the accounts of Plantronics and its wholly owned subsidiaries. The Company has included the results of operations of acquired companies from the date of acquisition. All intercompany balances and transactions have been eliminated.
Fiscal Year
The Company’s fiscal year ends on the Saturday closest to the last day of March. Fiscal Years 2018 and 2017 each had 52 weeks and ended on March 31, 2018 and April 1, 2017, respectively. Fiscal Year 2016 had 53 weeks and ended on April 2, 2016. For purposes of presentation, the Company has indicated its accounting fiscal year as ending on March 31.
Financial Instruments
Cash, Cash Equivalents and Investments
All highly liquid investments with initial stated maturities of three months or less at the date of purchase are classified as cash equivalents. The Company classifies its investments as either short-term or long-term based on each instrument's underlying effective maturity date and reasonable expectations with regard to sales and redemptions of the instruments. All short-term investments have effective maturities less than 12 months, while all long-term investments have effective maturities greater than 12 months. The Company may sell its investments prior to their stated maturities for strategic purposes, in anticipation of credit deterioration, or for duration management. During the year ended March, 31, 2018, we sold our long-term investments and recognized a loss on sale of approximately $1.2 million.
As of March 31, 2018, with the exception of assets related to the Company's deferred compensation plan and classified as trading securities, all investments were classified as available-for-sale, with unrealized gains and losses recorded as a separate component of accumulated other comprehensive income ("AOCI") in stockholders’ equity. The specific identification method is used to determine the cost of disposed securities, with realized gains and losses reflected in other non-operating income and (expense), net.
53
For investments with an unrealized loss, the factors considered in the review include the credit quality of the issuer, the duration that the fair value has been less than the adjusted cost basis, severity of impairment, reason for the decline in value and potential recovery period, the financial condition and near-term prospects of the investees, and whether the Company would be required to sell an investment due to liquidity or contractual reasons before its anticipated recovery.
Foreign Currency Derivatives
The Company accounts for its derivative instruments as either assets or liabilities and carries them at fair value. Derivative foreign currency contracts are valued using pricing models that use observable inputs. The accounting for changes in the fair value of a derivative depends on the intended use of the derivative and the resulting designation.
The Company enters into foreign exchange forward contracts to reduce the impact of foreign currency fluctuations on assets and liabilities denominated in currencies other than the functional currency of the reporting entity. The Company does not elect to obtain hedge accounting for these forward contracts. These forward contracts are carried at fair value with changes in the fair value recorded within other non-operating income and (expense), net in the consolidated statements of operations. Gains and losses on these contracts are intended to offset the impact of foreign exchange rate changes on the underlying foreign currency denominated assets and liabilities, and therefore, do not subject the Company to material balance sheet risk.
The Company has significant international revenues and costs denominated in foreign currencies, subjecting it to foreign currency risk. The Company purchases foreign currency option contracts and cross-currency swaps that qualify as cash flow hedges, with maturities of up to 24 months, to reduce the volatility of cash flows related primarily to forecasted revenue and expenses. All outstanding derivatives are recognized on the balance sheet at fair value. The effective portion of the designated derivative's gain or loss is initially reported as a component of AOCI and is subsequently reclassified into the financial statement line item in which the hedged item is recorded in the same period the forecasted transaction affects earnings.
The Company does not hold or issue derivative financial instruments for speculative trading purposes. The Company enters into derivatives only with counterparties that are among the largest United States ("U.S.") banks, ranked by assets, in order to minimize its credit risk and to date, no such counterparty has failed to meet its financial obligations under such contracts.
Provision for Doubtful Accounts
The Company maintains a provision for doubtful accounts for estimated losses resulting from the inability of its customers to make required payments. Plantronics regularly performs credit evaluations of its customers’ financial conditions and considers factors such as historical experience, credit quality, age of the accounts receivable balances, geographic or country-specific risks, and economic conditions that may affect a customer’s ability to pay.
Inventory and Related Reserves
Inventories are valued at the lower of cost or net realizable value. Cost is computed using standard cost, which approximates actual cost on a first-in, first-out basis. The Company writes down inventories that have become obsolete or are in excess of anticipated demand or net realizable value. Our estimate of write downs for excess and obsolete inventory is based on a detailed analysis of on-hand inventory and purchase commitments in excess of forecasted demand.
A substantial portion of the raw materials, components and subassemblies (together, “parts”) used in the Company's products are provided by its suppliers on a consignment basis. These consigned inventories are not recorded on the Company's consolidated balance sheet until it takes title to the parts, which occurs when they are consumed in the production process. The Company provides forecasts to its suppliers covering up to thirteen weeks of demand and places purchase orders when the parts are consumed in the production process, at which time all right, title, and interest in and to the parts transfers to the Company. Prior to consumption in the production process, the Company's suppliers bear the risk of loss and retain title to the consigned inventory.
The terms of the agreements allow the Company to return parts in excess of maximum order quantities to the suppliers at the supplier’s expense. Returns for other reasons are negotiated with the suppliers on a case-by-case basis and to date have been immaterial. As of March 31, 2018, the Company’s aggregate commitment to suppliers for parts used in the manufacture of the Company’s products was $190.0 million, which the Company expects to utilize in the normal course of business, net of an immaterial purchase commitments reserve. The Company’s purchase commitments reserve reflects the Company’s estimate of purchase commitments it does not expect to use in normal ongoing operations within the next twelve months. As of March 31, 2018 and 2017, the off-balance sheet consigned inventory balances were $48.8 million and $52.3 million, respectively.
54
Product Warranty Obligations
The Company records a liability for the estimated costs of warranties at the time the related revenue is recognized. The specific warranty terms and conditions range from one to two years starting from the delivery date to the end user and vary depending upon the product sold and the country in which the Company does business. Factors that affect the warranty obligations include product failure rates, estimated return rates, the amount of time lapsed from the date of sale to the date of return, material usage, service related costs incurred in correcting product failure claims, and knowledge of specific product failures that are outside of the Company’s typical experience.
Goodwill and Purchased Intangibles
Goodwill has been measured as the excess of the cost of acquisition over the amount assigned to tangible and identifiable intangible assets acquired less liabilities assumed. At least annually, in the fourth quarter of each fiscal year or more frequently if indicators of impairment exist, management performs a review to determine if the carrying value of goodwill is impaired. The identification and measurement of goodwill impairment involves the estimation of fair value at the Company’s reporting unit level. The Company determines its reporting units by assessing whether discrete financial information is available and if segment management regularly reviews the results of that component. The Company has determined it has one reporting unit.
The Company performs an initial assessment of qualitative factors to determine whether the existence of events and circumstances leads to a determination that it is more likely than not that the fair value of a reporting unit is less than its carrying amount. If, after assessing the totality of relevant events and circumstances, the Company determines that it is more likely than not that the fair value of the reporting unit exceeds its carrying value and there is no indication of impairment, no further testing is performed; however, if the Company concludes otherwise, the first step of the two-step impairment test must be performed by estimating the fair value of the reporting unit and comparing it with its carrying value, including goodwill.
Intangible assets other than goodwill are carried at cost and amortized over their estimated useful lives. The Company reviews identifiable finite-lived intangible assets to be held and used for impairment whenever events or changes in circumstances indicate that the carrying value of the assets may not be recoverable. Determination of recoverability is based on the lowest level of identifiable estimated undiscounted cash flows resulting from use of the asset and its ultimate disposition. Measurement of any impairment loss is based on the amount by which the carrying value of the asset exceeds its fair market value.
Property, Plant and Equipment
Property, plant and equipment is stated at cost less accumulated depreciation and amortization. Depreciation is calculated using the straight-line method over the estimated useful lives of the respective assets, which range from two to thirty years. Amortization of leasehold improvements is computed using the straight-line method over the shorter of the estimated useful lives of the assets or the remaining lease term. Capitalized software costs are amortized on a straight-line basis over the estimated useful life of the assets.
Property, plant and equipment is reviewed for impairment whenever events or changes in circumstances indicate that the carrying amount of such assets may not be recoverable. The Company recognizes an impairment charge in the event the net book value of such assets exceeds the future undiscounted cash flows attributable to the asset group. No material impairment losses were incurred in the periods presented.
Fair Value Measurements
All financial assets and liabilities are recognized or disclosed at fair value in the financial statements. Fair value is estimated by applying the following hierarchy, which prioritizes the inputs used to measure fair value into three levels and bases the categorization within the hierarchy upon the lowest level of input that is available and significant to the fair value measurement:
Level 1
The Company's Level 1 financial assets consist of Mutual Funds and US Treasury Notes. The fair value of Level 1 financial instruments is measured based on the quoted market price of identical securities.
Level 2
The Company's Level 2 financial assets and liabilities consist of derivative foreign currency contracts, Government Agency Securities, Commercial Paper, Corporate Bonds, Certificates of Deposits ("CDs"), and 5.50% senior notes (the "5.50% Senior Notes").
55
The fair value of Level 2 investment securities is determined based on other observable inputs, including multiple non-binding quotes from independent pricing services. Non-binding quotes are based on proprietary valuation models that are prepared by the independent pricing services and use algorithms based on inputs such as observable market data, quoted market prices for similar securities, issuer spreads, and internal assumptions of the broker. The Company corroborates the reasonableness of non-binding quotes received from the independent pricing services using a variety of techniques depending on the underlying instrument, including: (i) comparing them to actual experience gained from the purchases and maturities of investment securities, (ii) comparing them to internally developed cash flow models based on observable inputs, and (iii) monitoring changes in ratings of similar securities and the related impact on fair value.
The fair value of Level 2 derivative foreign currency contracts is determined using pricing models that use observable market inputs. The fair value of Level 2 long-term debt is determined based on inputs that were observable in the market, including the trading price of the notes when available.
The fair value of the Company's 5.50% Senior Notes is determined based on observable market inputs, including the trading price of the 5.50% Senior Notes.
Level 3
The Company's unsecured revolving credit facility falls under the Level 3 hierarchy. The fair value of the Company’s line of credit approximates its carrying value because the interest rate is a variable rate that approximates rates currently available to the Company.
Revenue Recognition
The Company sells substantially all of its products to end users through distributors, retailers, and carriers. The Company's revenue is derived from the sale of headsets, telephone headset systems, and accessories for the business and consumer markets and is recognized when persuasive evidence of an arrangement exists, delivery has occurred or services have been rendered, the sales price is fixed or determinable, and collection is reasonably assured. These criteria are usually met at the time of product shipment; however, the Company defers revenue when any significant obligations remain and for Fiscal Years 2016, 2017, and 2018 this accounted for less than 1% of the Company's net revenues. Customer contracts and/or purchase orders are used to determine the existence of an arrangement. Product is considered delivered once it has been shipped and title and risk of loss have been transferred to the customer. The Company assesses whether a price is fixed or determinable based upon the selling terms associated with the transaction and whether the sales price is subject to refund or adjustment. The Company assesses collectability based on a customer's credit quality, historical experience, and geographic or country-specific risks and economic conditions that may affect a customer's ability to pay.
Revenue is recorded net of taxes collected from customers that are remitted to governmental authorities, with the collected taxes recorded as current liabilities until remitted to the relevant government authority. Shipping and handling costs incurred in connection with the sale of products are included in cost of revenues.
Sales through retail and distribution channels are made primarily under agreements or commitments allowing for rights of return and include various sales incentive programs, such as back end rebates, discounts, marketing development funds, price protection, and other sales incentives. The Company can reasonably estimate back end rebates, discounts and similar incentives due to an established sales history with its customers and records the estimated reserves and allowances at the time the related revenue is recognized. The Company recognizes marketing development funds at the later of when the related revenue is recognized or the program is offered to the channel partner. The nature of the sales incentive programs offered to channel partners is such that the Company cannot identify a benefit that is sufficiently separable from the channel partners’ purchase of products, nor does it have the infrastructure to establish fair value for the multitude of activities supported by these programs. As a result, substantially all sales incentives to our channel partners in the form of cash consideration, are recorded as a reduction to revenue.
Sales return reserves are estimated based on historical data, relevant current data, and the monitoring of inventory build-up in the distribution channel.
When a sales arrangement contains multiple elements, such as hardware and software products and/or services, the Company allocates revenue to each element based on relative selling prices. The selling price for a deliverable is based on its vendor specific objective evidence ("VSOE"), if available, third party evidence ("TPE") if VSOE is not available, or estimated selling price ("ESP") if neither VSOE nor TPE is available. In multiple element arrangements where more-than-incidental software deliverables are included, the Company allocates revenue to each separate unit of accounting for each of the non-software deliverables and to the software deliverables as a group using the relative selling prices of each of the deliverables in the arrangement based on the aforementioned selling price hierarchy.
56
Advertising Costs
The Company expenses all advertising costs as incurred. Advertising expense for the years ended March 31, 2016, 2017, and 2018 was $2.0 million, $1.8 million, and $0.9 million, respectively.
Income Taxes
Deferred income taxes are determined based on the differences between the financial reporting and tax bases of assets and liabilities and are measured using the currently enacted tax rates and laws. The Company records a valuation allowance against particular deferred income tax assets if it is more likely than not that those assets will not be realized. The provision for income taxes comprises the Company's current tax liability and changes in deferred income tax assets and liabilities.
Significant judgment is required in evaluating the Company's uncertain tax positions and determining its provision for income taxes. The Company establishes reserves for tax-related uncertainties based on estimates of whether, and the extent to which, additional taxes will be due. These reserves are established when the Company believes that certain positions might be challenged despite its belief that its tax return positions are in accordance with applicable tax laws. The Company adjusts these reserves in light of changing facts and circumstances, such as the closing of a tax audit, new tax legislation, or the change of an estimate. To the extent that the final tax outcome of these matters is different than the amounts recorded, such differences will affect the provision for income taxes in the period in which such determination is made. The provision for income taxes includes the effect of reserve provisions and changes to reserves that are considered appropriate, as well as the related net interest and penalties.
The Company follows the tax law ordering to determine when excess tax benefits have been realized.
The Company is subject to income taxes in the U.S. and foreign jurisdictions. At any one time, multiple tax years are subject to audit by various tax authorities.
Earnings Per Share
The Company has a share-based compensation plan under which employees, non-employee directors, and consultants may be granted share-based payment awards, including shares of restricted stock on which non-forfeitable dividends are paid on unvested shares. As such, shares of restricted stock are considered participating securities under the two-class method of calculating earnings per share. Historically, the two-class method of calculating earnings per share did not have a material impact on the Company's earnings per share calculation under the treasury stock method. During periods of net loss, no effect is given to participating securities since they do not share in the losses of the Company. For further details refer to Note 17, Computation of Earnings Per Common Share.
Comprehensive Income
Comprehensive income consists of two components, net income and other comprehensive income. Other comprehensive income refers to income, expenses, gains, and losses that under U.S. GAAP are recorded as an element of stockholders’ equity but are excluded from net income. Accumulated other comprehensive income, as presented in the accompanying consolidated balance sheets, consists of foreign currency translation adjustments, unrealized gains and losses on derivatives designated as cash flow hedges, net of tax, and unrealized gains and losses on marketable securities classified as available-for-sale, net of tax.
Foreign Operations and Currency Translation
The Company's functional currency is the U.S. Dollar (“USD") . Assets and liabilities denominated in currencies other than the USD, are re-measured at the period-end rates for monetary assets and liabilities and at historical rates for non-monetary assets and liabilities. Revenues and expenses are re-measured at average monthly rates, which approximate actual rates. Currency transaction gains and losses are recognized in other non-operating income and (expense), net.
Stock-Based Compensation Expense
The Company applies the provisions of the Compensation - Stock Compensation Topic of the FASB ASC 718, which requires the measurement and recognition of compensation expense for all share-based payment awards made to employees and non-employee directors based on estimated fair values. The Company recognizes the grant-date fair value of stock-based compensation as compensation expense using the straight-line attribution approach over the service period for which the stock-based compensation is expected to vest.
57
The Company adopted the new stock-based compensation accounting guidance effective in Fiscal Year 2018. This new guidance requires excess tax benefits and tax deficiencies to be recognized in the provision for income taxes as discrete items in the period when the awards vest or are settled, whereas previously such income tax effects were recorded as part of additional paid-in capital. The adoption of this guidance had an immaterial impact on the Company's effective tax rate for the year ended March 31, 2018. The amount of excess tax benefits or deficiencies will fluctuate from period-to-period based on the price of the Company’s stock, the volume of share-based instruments settled or vested, and the value assigned to employee equity awards under U.S. GAAP. For further details refer to Note 16, Income Taxes.
Treasury Shares
From time to time, the Company repurchases shares of its common stock, depending on market conditions, in the open market or through privately negotiated transactions, in accordance with programs authorized by the Board of Directors. Repurchased shares are held as treasury stock until such time as they are retired or re-issued. Retirements of treasury stock are non-cash equity transactions in which the reacquired shares are returned to the status of authorized but unissued shares and the cost is recorded as a reduction to both retained earnings and treasury stock. The stock repurchase programs are intended to offset the impact of dilution resulting from the Company's stock-based compensation programs.
Concentration of Risk
Financial instruments that potentially subject the Company to concentrations of credit risk consist primarily of cash equivalents, short-term and long-term investments, and trade accounts receivable.
Plantronics’ investment policy limits investments to highly-rated securities. In addition, the Company limits the amount of credit exposure to any one issuer and restricts placement of these investments to issuers evaluated as creditworthy. As of March 31, 2017 and 2018 the Company's investments were composed of Mutual Funds, US Treasury Notes, Government Agency Securities, Commercial Paper, Corporate Bonds, and Certificates of Deposits ("CDs").
Concentrations of credit risk with respect to trade receivables are limited due to the large number of customers that comprise the Company’s customer base and their dispersion across different geographies and markets. One customer Ingram Micro Group accounted for 17.6% of total net accounts receivable as of March 31, 2017. Two customers, D & H Distributing Company and Ingram Micro Group, accounted for 13.0% and 12.4%, respectively, of total net accounts receivable as of March 31, 2018. The Company does not believe other significant concentrations of credit risk exist. Plantronics performs ongoing credit evaluations of its customers' financial condition and requires no collateral from its customers. The Company maintains a provision for doubtful accounts based upon expected collectibility of all accounts receivable.
Certain inventory components required by the Company are only available from a limited number of suppliers. The rapid rate of technological change and the necessity of developing and manufacturing products with short lifecycles may intensify these risks. The inability to obtain components as required, or to develop alternative sources, as required in the future, could result in delays or reductions in product shipments, which in turn could have a material adverse effect on the Company’s business, financial condition, results of operations and cash flows.
Immaterial Out-of-Period Correction:
During the first quarter of Fiscal Year 2018, the Company recognized an out-of-period correction to its Fiscal Year 2017 geographic mix of taxable income, which resulted in an overstatement of Fiscal Year 2017 income tax expense by $2.8 million. The Company's correction, recognized in the quarter ended June 30, 2017, resulted in a $2.8 million benefit to income tax expense. The Company assessed the materiality of this error and concluded it was not material to Fiscal Years 2017 and 2018.
Reclassifications
Certain prior year amounts have been reclassified for consistency with current year presentation. Each of the reclassifications was immaterial and had no effect on the Company's results of operations.
58
3. | RECENT ACCOUNTING PRONOUNCEMENTS |
Recently Issued Pronouncements
In May 2014, the Financial Accounting Standards Board ("FASB") issued guidance regarding revenue from contracts with customers. While the standard supersedes existing revenue recognition guidance, it closely aligns with current U.S. GAAP. Under the new standard, revenue will be recognized at the time control of a good or service is transferred to a customer for the amount of consideration received or to be received for that specific good or service. Entities may use a full retrospective approach or report the cumulative effect as of the date of adoption. In March 2016, the FASB issued additional guidance concerning "Principal versus Agent" considerations (reporting revenue gross versus net); in April 2016, the FASB issued additional guidance on identifying performance obligations and licensing; and in May 2016, the FASB issued additional guidance on collectability, non-cash consideration, presentation of sales tax, and transition. These updates are intended to improve the operability and understandability of the implementation guidance and have the same effective date and transition requirements as the greater "contracts with customers" standard. The Company will adopt the standard, as amended, in the first quarter of its fiscal year ending March 31, 2019, utilizing the modified retrospective method of adoption. The Company has substantially completed its review of the impact of this guidance, and does not anticipate a material impact on its revenue recognition policies. The Company will continue to assess all potential impacts of the standard, and currently believes the most significantly impacted areas are the following:
• | Software Revenue: The Company currently defers revenue for the value of software where vendor specific objective evidence ("VSOE") of fair value has not been established for undelivered items. Under Topic 606, revenue for such licenses will be recognized at the transfer of control, rather than ratably, as the VSOE requirement no longer applies and the value of the remaining services are not material in the context of the contract. At March 31, 2018, deferred revenue under Topic 605 for these licenses was $2.3 million. The Company expects the remaining balance of such deferred revenue will be eliminated as a cumulative effect adjustment to opening retained earnings upon implementing Topic 606 in the first quarter of its fiscal year ending March 31, 2019. |
• | Marketing Development Funds: The Company frequently provides marketing development funds to its channel partners. Under topic 605, our marketing development funds are recognized as a reduction of revenue at the later of when the related revenue is recognized or when the program is offered to the channel partner. Applying the criteria of Topic 606, these marketing development programs qualify as variable consideration, and are assigned as a reduction of the transaction price of the contract. This results in a timing difference such that all or some of the funds related to a program may be recognized in different periods than under Topic 605, depending on the circumstances. Based on analysis of prior periods, we anticipate that this timing difference impacts revenue by immaterial amounts in a given period. |
• | Revenue Reserves: The Company establishes reserves for Discounts and Rebates and Sales Returns at the end of each fiscal period. These reserves are estimated based on current relevant and historical data, but there can be some variability associated with unforeseen changes in customer claim and return patterns. Under Topic 606, an entity shall estimate an amount of variable consideration by using a prescribed method that best depicts the amount of consideration to which it will be entitled and is required to consider whether appropriate groupings with similar characteristics have been applied when leveraging the portfolio practical expedient. In cases where there is uncertainty around the variable consideration amount, a constraint, or an adjustment to ensure that a significant revenue reversal will not occur, on that consideration must be considered. Based on analysis of prior periods, we anticipate that impact of estimating variable consideration using one of the prescribed methods and introducing a constraint will not materially impact revenue. |
The standard also requires new, expanded disclosures regarding revenue recognition. The Company will continue to monitor additional changes, modifications, clarifications or interpretations being undertaken by the FASB, which may impact its current conclusions.
In January 2016, the FASB issued guidance regarding the recognition and measurement of financial assets and liabilities. Changes to the current U.S. GAAP model primarily affect the accounting for equity investments, financial liabilities under the fair value option, and the presentation and disclosure requirements for financial instruments. In addition, the FASB clarified guidance related to the valuation allowance assessment when recognizing deferred tax assets resulting from unrealized losses on available-for-sale debt securities. The Company is required to adopt the standard in the first quarter of its fiscal year ending March 31, 2019. The Company is currently evaluating what impact, if any, the adoption of this standard will have on its consolidated financial statements and related disclosures.
59
In February 2016, the FASB issued guidance regarding both operating and financing leases, requiring lessees to recognize on their balance sheets "right-of-use assets" and corresponding lease liabilities, measured on a discounted basis over the lease term. Virtually all leases will be subject to this treatment except leases that meet the definition of a "short-term lease". For expense recognition, the dual model requiring leases to be classified as either operating or finance leases has been retained from the prior standard. Operating leases will result in straight-line expense while finance leases will result in a front-loaded expense pattern. Classification will use criteria very similar to those applied in current lease accounting, but without explicit bright lines. Extensive additional quantitative and qualitative disclosures, including significant judgments made by management, will be required to provide greater insight into the extent of expense recognized and expected to be recognized. The new lease guidance will essentially eliminate off-balance sheet financing. The guidance is effective for the Company's fiscal year ending March 31, 2020. The new standard must be adopted using a modified retrospective transition that provides for certain practical expedients and requires the new guidance to be applied at the beginning of the earliest comparative period presented. The Company expects adoption of this guidance will materially increase the assets and liabilities recorded on its consolidated balance sheets, but is still evaluating the impact on its consolidated financial statements and related disclosures.
In June 2016, the FASB issued guidance regarding the measurement of credit losses on financial instruments, which changes the impairment model for most financial assets. The new model uses a forward-looking expected loss method, which will generally result in earlier recognition of allowances for losses. The guidance is effective for the Company's fiscal year ending March 31, 2021 with early adoption permitted beginning in the first quarter of Fiscal Year 2020. The Company is currently evaluating the impact the adoption of this standard will have on its consolidated financial statements and related disclosures.
In January 2017, the FASB issued guidance that revises the definition of a business, providing a more robust framework for determining when a set of assets and activities is deemed a business. The guidance is effective for the Company's fiscal year ending March 31, 2019, including interim periods within that year, and is not expected to have a material impact on the Company's consolidated financial statements or related disclosures.
In January 2017, the FASB issued guidance that simplifies the process required to test goodwill for impairment. The guidance is effective for the Company's fiscal year ending March 31, 2021, and is not expected to have a material impact on the Company's consolidated financial statements or related disclosures.
In March 2017, the FASB issued guidance related to the amortization of premiums on purchased callable debt securities. This guidance shortens the amortization period for certain callable debt securities purchased at a premium by requiring that the premium be amortized to the earliest call date instead of the maturity date. This guidance is effective for the Company's fiscal year ending March 31, 2020, including interim periods within that year. The Company expects the impact to be immaterial.
In May 2017, the FASB issued guidance that clarifies the scope of modification accounting with respect to changes to the terms or conditions of a share-based payment award. This guidance is effective for the Company's fiscal year ending March 31, 2019, including interim periods within that year. The Company is currently evaluating the impact the adoption of this standard will have on its consolidated financial statements and related disclosures, but expects the impact to be immaterial.
In August 2017, the FASB issued guidance that eliminates the requirement to separately measure and report hedge ineffectiveness and that generally requires, for qualifying hedges, the entire change in the fair value of a hedging instrument to be presented in the same income statement line as the hedged item. The guidance also modifies the accounting for components excluded from the assessment of hedge effectiveness, eases documentation and assessment requirements, and modifies certain disclosure requirements. The new standard must be adopted using a modified retrospective transition with a cumulative effect adjustment recorded to opening retained earnings as of the initial adoption date. This guidance is effective for the Company's fiscal year ending March 31, 2020, including interim periods within that year. The Company is currently evaluating the impact the adoption of this standard will have on its consolidated financial statements and related disclosures, but expects the impact to be immaterial.
60
Recently Adopted Pronouncement
Beginning Fiscal Year 2018, the Company adopted the FASB's new guidance, Improvements to Employee Share-Based Payment Accounting, which changes among other things, how the tax effects of share-based awards are recognized. This new guidance requires excess tax benefits and tax deficiencies to be recognized in the provision for income taxes as discrete items in the period when the awards vest or are settled, whereas previously such income tax effects were recorded as part of additional paid-in capital. The provision for income taxes for the year ended March 31, 2018 included excess tax benefits that did not materially reduce the Company's effective tax rate. The provision for income taxes for the year ended March 31, 2018 included excess tax benefits of $2.7 million. The recognized excess tax benefits resulted from share-based compensation awards that vested or settled in Fiscal Year 2018. This guidance also eliminates the requirement to reclassify cash flows related to excess tax benefits from operating activities to financing activities on the consolidated statements of cash flows. The Company adopted this provision retrospectively by reclassifying $3.5 million and $1.4 million of excess tax benefits from financing activities to operating activities in the consolidated statement of cash flows for the years ended March 31, 2016 and 2017. The Company also excluded the related tax benefits when computing diluted shares outstanding on a prospective basis as required by this guidance. In addition, the Company elected to continue its current practice of estimating expected forfeitures. The Company made no changes to its presentation of withholding taxes on the settlement of share-based payment awards, which were already presented as financing activities. The amount of excess tax benefits and deficiencies recognized in the provision for income taxes will fluctuate from period-to-period based on the price of the Company’s stock, the volume of share-based instruments settled or vested, and the value assigned to share-based instruments under U.S. GAAP. Refer to additional discussion in Note 13, Income Taxes.
61
4. | CASH, CASH EQUIVALENTS, AND INVESTMENTS |
The following tables summarize the Company’s cash, cash equivalents, and investments’ adjusted cost, gross unrealized gains, gross unrealized losses, and fair value by significant investment category recorded as cash and cash equivalents, short-term, or long-term investments as of March 31, 2017 and 2018 (in thousands):
March 31, 2017 | Amortized Cost | Gross Unrealized Gains | Gross Unrealized Losses | Fair Value | Cash & Cash Equivalents | Short-term investments (due in 1 year or less) | Long-term investments (due in 1 to 3 years) | |||||||||||||||||||||
Cash | $ | 295,877 | $ | — | $ | — | $ | 295,877 | $ | 295,877 | $ | — | $ | — | ||||||||||||||
Level 1: | ||||||||||||||||||||||||||||
Mutual Funds | 12,079 | 352 | (32 | ) | 12,399 | — | 12,399 | — | ||||||||||||||||||||
US Treasury Notes | 35,960 | — | (68 | ) | 35,892 | — | 17,560 | 18,332 | ||||||||||||||||||||
Subtotal | 48,039 | 352 | (100 | ) | 48,291 | — | 29,959 | 18,332 | ||||||||||||||||||||
Level 2: | ||||||||||||||||||||||||||||
Government Agency Securities | 54,415 | 20 | (164 | ) | 54,271 | — | 15,309 | 38,962 | ||||||||||||||||||||
Commercial Paper | 47,152 | — | — | 47,152 | 6,093 | 41,059 | — | |||||||||||||||||||||
Corporate Bonds | 141,508 | 64 | (224 | ) | 141,348 | — | 73,676 | 67,672 | ||||||||||||||||||||
Certificates of Deposits ("CDs") | 20,383 | 3 | — | 20,386 | — | 18,176 | 2,210 | |||||||||||||||||||||
Subtotal | 263,458 | 87 | (388 | ) | 263,157 | 6,093 | 148,220 | 108,844 | ||||||||||||||||||||
Total cash, cash equivalents and investments measured at fair value | $ | 607,374 | $ | 439 | $ | (488 | ) | $ | 607,325 | $ | 301,970 | $ | 178,179 | $ | 127,176 | |||||||||||||
March 31, 2018 | Amortized Cost | Gross Unrealized Gains | Gross Unrealized Losses | Fair Value | Cash & Cash Equivalents | Short-term investments (due in 1 year or less) | Long-term investments (due in 1 to 3 years) | |||||||||||||||||||||
Cash | $ | 308,734 | $ | — | $ | — | $ | 308,734 | $ | 308,734 | $ | — | $ | — | ||||||||||||||
Level 1: | ||||||||||||||||||||||||||||
Mutual Funds | 13,336 | 186 | (67 | ) | 13,455 | — | 13,455 | — | ||||||||||||||||||||
US Treasury Notes | 129,373 | 7 | (60 | ) | 129,320 | 30,178 | 99,142 | — | ||||||||||||||||||||
Money Market Funds | 344 | — | — | 344 | 344 | — | — | |||||||||||||||||||||
Subtotal | 143,053 | 193 | (127 | ) | 143,119 | 30,522 | 112,597 | — | ||||||||||||||||||||
Level 2: | ||||||||||||||||||||||||||||
Government Agency Securities | 46,354 | — | (56 | ) | 46,298 | 6,978 | 39,320 | — | ||||||||||||||||||||
Municipal Bonds | 3,591 | — | — | 3,591 | 3,591 | — | — | |||||||||||||||||||||
Commercial Paper | 84,512 | — | — | 84,512 | 40,836 | 43,676 | — | |||||||||||||||||||||
Corporate Bonds | 54,701 | — | (212 | ) | 54,489 | — | 54,489 | — | ||||||||||||||||||||
Certificates of Deposits ("CDs") | 19,231 | — | — | 19,231 | — | 19,231 | — | |||||||||||||||||||||
Subtotal | 208,389 | — | (268 | ) | 208,121 | 51,405 | 156,716 | — | ||||||||||||||||||||
Total cash, cash equivalents and investments measured at fair value | $ | 660,176 | $ | 193 | $ | (395 | ) | $ | 659,974 | $ | 390,661 | $ | 269,313 | $ | — | |||||||||||||
62
As of March 31, 2017 and 2018, with the exception of assets related to the Company's deferred compensation plan, all of the Company's investments are classified as available-for-sale securities. The carrying value of available-for-sale securities included in cash equivalents approximates fair value because of the short maturity of those instruments. During the year ended March, 31, 2018, we sold our long-term investments and recognized a loss on sale of approximately $1.2 million. The Company did not incur any material realized or unrealized gains or losses during Fiscal Year 2017.
There were no transfers between fair value measurement levels during Fiscal Years 2017 and 2018.
5. DEFERRED COMPENSATION
As of March 31, 2018, the Company held investments in mutual funds totaling $13.5 million, all of which related to debt and equity securities that are held in a rabbi trust under non-qualified deferred compensation plans. The total related deferred compensation liability was $14.1 million at March 31, 2018. As of March 31, 2017 the Company held bank deposits of $0.8 million and investments in mutual funds totaling $12.4 million, all of which related to debt and equity securities that are held in a rabbi trust under non-qualified deferred compensation plans. The total related deferred compensation liability at March 31, 2017 was $13.7 million.
The bank deposits are recorded on the consolidated balance sheets under "cash and cash equivalents". The securities are classified as trading securities and are recorded on the consolidated balance sheets under "short-term investments". The liability is recorded on the consolidated balance sheets under "other long-term liabilities" and "accrued liabilities".
6. | DETAILS OF CERTAIN BALANCE SHEET ACCOUNTS |
Accounts receivable, net:
March 31, | ||||||||
(in thousands) | 2017 | 2018 | ||||||
Accounts receivable | $ | 184,068 | $ | 202,270 | ||||
Provisions for returns | (10,541 | ) | (10,225 | ) | ||||
Provisions for promotions and rebates | (31,747 | ) | (38,284 | ) | ||||
Provisions for doubtful accounts and sales allowances | (603 | ) | (873 | ) | ||||
Accounts receivable, net | $ | 141,177 | $ | 152,888 | ||||
Inventory, net:
March 31, | ||||||||
(in thousands) | 2017 | 2018 | ||||||
Raw materials | $ | 20,260 | $ | 28,789 | ||||
Work in process | 215 | 450 | ||||||
Finished goods | 34,981 | 39,037 | ||||||
Inventory, net | $ | 55,456 | $ | 68,276 | ||||
Property, plant, and equipment, net:
March 31, | ||||||||
(in thousands) | 2017 | 2018 | ||||||
Land | $ | 16,418 | $ | 16,564 | ||||
Buildings and improvements (useful life: 7-30 years) | 115,909 | 115,401 | ||||||
Machinery and equipment (useful life: 2-10 years) | 108,477 | 112,719 | ||||||
Software (useful life: 5-10 years) | 46,806 | 50,631 | ||||||
Construction in progress | 6,899 | 5,428 | ||||||
Property, plant, and equipment, gross | 294,509 | 300,743 | ||||||
Accumulated depreciation and amortization | (144,202 | ) | (158,614 | ) | ||||
Property, plant, and equipment, net | $ | 150,307 | $ | 142,129 | ||||
63
Depreciation and amortization expense for Fiscal Years 2016, 2017, and 2018 was $19.9 million, $20.7 million, and $21.1 million, respectively.
Included in software are unamortized capitalized software costs relating to both purchased and internally developed software of $24.4 million and $23.6 million at March 31, 2017 and 2018, respectively. Amortization expense related to capitalized software costs in Fiscal Years 2016, 2017, and 2018 was $4.1 million, $4.4 million, and $4.9 million, respectively.
Included in construction in progress at March 31, 2018 was tooling for new products, machinery and equipment, building improvements at our U.S. headquarters, and IT-related expenditures. None of the items were individually material.
Accrued liabilities:
March 31, | ||||||||
(in thousands) | 2017 | 2018 | ||||||
Employee compensation and benefits | $ | 36,415 | $ | 28,599 | ||||
Accrued interest on 5.50% Senior Notes | 10,407 | 10,331 | ||||||
Warranty obligation, short-term portion | 6,863 | 7,550 | ||||||
VAT/Sales Tax Payable | 5,433 | 5,353 | ||||||
Derivative liabilities | 1,323 | 2,947 | ||||||
Accrued other | 13,844 | 25,317 | ||||||
Accrued liabilities | $ | 74,285 | $ | 80,097 | ||||
Changes in the warranty obligation, which are included as a component of accrued liabilities in the consolidated balance sheets, are as follows:
Year ended March 31, | ||||||||
(in thousands) | 2017 | 2018 | ||||||
Warranty obligation at beginning of year | $ | 8,537 | $ | 8,697 | ||||
Warranty provision related to products shipped | 9,451 | 9,923 | ||||||
Deductions for warranty claims processed | (9,824 | ) | (10,193 | ) | ||||
Adjustments related to preexisting warranties | 533 | 1,177 | ||||||
Warranty obligation at end of year 1 | $ | 8,697 | $ | 9,604 | ||||
1 Includes both short-term and long-term portion of warranty obligation; the prior table shows only the short-term portion included in accrued liabilities on our consolidated balance sheet. The long-term portion is included in other long-term liabilities.
7. | GOODWILL |
Goodwill as of March 31, 2017 and 2018 was $15.5 million, net of accumulated impairment of $54.6 million. In Fiscal Years 2017 and 2018, for purposes of the annual goodwill impairment test, the Company determined there to be no reporting units below its operating segment; therefore, the annual goodwill impairment analysis was performed at the segment level in both of these years. In the fourth quarter of Fiscal Years 2017 and 2018, the Company evaluated qualitative factors that may affect the fair value of the reporting unit and concluded there to be no indication of goodwill impairment.
64
8. | COMMITMENTS AND CONTINGENCIES |
Minimum Future Rental Payments
Minimum future rental payments under non-cancelable operating leases having remaining terms in excess of one year as of March 31, 2018 are as follows:
Fiscal Year Ending March 31, 2018 | (in thousands) | |||
2019 | $ | 2,556 | ||
2020 | 2,142 | |||
2021 | 1,823 | |||
2022 | 1,322 | |||
2023 | 823 | |||
Thereafter | 1,304 | |||
Total minimum future rental payments | $ | 9,970 | ||
Total rent expense for operating leases was approximately $2.9 million, $2.8 million, and $2.6 million in Fiscal Years 2016, 2017, and 2018, respectively.
Unconditional Purchase Obligations
The Company purchases services and components from a variety of suppliers and manufacturers. During the normal course of business and to manage manufacturing operations and general and administrative activities, the Company may enter into firm, non-cancelable, and unconditional purchase obligations for which amounts are not recorded on the consolidated balance sheets. As of March 31, 2018, the Company had outstanding off-balance sheet third-party manufacturing, component purchase, and other general and administrative commitments of $190.0 million.
Other Guarantees and Obligations
In the ordinary course of business, the Company may provide indemnifications of varying scope and terms to customers, vendors, lessors, business partners, purchasers of assets or subsidiaries and other parties with respect to certain matters, including, but not limited to, losses arising out of the Company's breach of agreements or representations and warranties made by the Company, services to be provided by the Company, intellectual property infringement claims made by third parties or, with respect to the sale of assets of a subsidiary, matters related to the Company's conduct of business and tax matters prior to the sale. From time to time, the Company indemnifies customers against combinations of loss, expense, or liability arising from various triggering events relating to the sale and use of its products and services.
In addition, the Company also provides indemnification to customers against claims related to undiscovered liabilities, additional product liability, or environmental obligations. The Company has also entered into indemnification agreements with its directors, officers and certain other personnel that will require the Company, among other things, to indemnify them against certain liabilities that may arise by reason of their status or service as directors or officers of the Company or certain of its affiliated entities. The Company maintains director and officer liability insurance, which may cover certain liabilities arising from its obligation to indemnify its directors, officers and certain other personnel in certain circumstances. It is not possible to determine the aggregate maximum potential loss under these agreements due to the limited history of prior claims and the unique facts and circumstances involved in each particular claim. Such indemnification obligations might not be subject to maximum loss clauses. Historically, the Company has not incurred material costs as a result of obligations under these agreements and it has not accrued any liabilities related to such indemnification obligations in the condensed consolidated financial statements.
Claims and Litigation
On October 12, 2012, GN Netcom, Inc. ("GN") filed a complaint against the Company in the United States District Court for the District of Delaware (“Court”), alleging violations of Sections 1 and 2 of the Sherman Act, Section 3 of the Clayton Act, and tortious interference with business relations in connection with the Company’s distribution of corded and wireless headsets. The case was assigned to Judge Leonard P. Stark. GN sought injunctive relief, total damages in an unspecified amount, plus attorneys’ fees and costs, as well as unspecified legal and equitable relief. GN generally alleged that the Company’s exclusive dealing arrangements with certain distributors stifled competition in the relevant market. In July 2016, the Court issued a sanctions order against Plantronics in the amount of approximately $4.9 million for allegations of spoliation of evidence.
The case was tried to a jury in October 2017, resulting in a verdict in favor of the Company. GN filed a motion for new trial in November 2017, and that motion was denied by the Court in January 2018. The Company filed a motion for attorneys’ fees in November 2017, and that motion was denied by the Court in January 2018. The Company also filed a motion for certain recoverable
65
costs, and the parties stipulated to an amount of approximately $0.2 million which GN paid the Company. If the jury verdict were to be appealed and later overturned on appeal, the Company would have to repay that amount to GN.
On February 12, 2018, GN filed a notice of intent to appeal both the denial of the new trial motion and the Court’s July 2016 spoliation order. The Court has set a briefing schedule for the parties to file their appellate briefs.
In a letter dated May 1, 2017, the Company received a Notice of Proposed Debarment from the General Services Administration ("GSA") informing the Company that the GSA has proposed that the Company be debarred from participation in Federal procurement and non-procurement programs based on a spoliation order issued in the GN litigation matter. The Company submitted a response to the GSA demonstrating that it is a responsible contractor and that a suspension or debarment is neither necessary to protect the government nor warranted. The GSA found “no cause” for debarment of Plantronics and terminated the proceeding against the Company in August 2017. The GSA required a letter of assurances be filed if additional issues arose, and that requirement was terminated following the successful jury verdict in October 2017.
In addition to the specific matter discussed above, the Company is involved in various legal proceedings arising in the normal course of conducting business. For such legal proceedings, where applicable, the Company has not accrued any amount because none have been deemed probable and estimable. The Company is not able to estimate an amount or range of any reasonably possible additional losses because of the preliminary nature of many of these proceedings, the difficulty in ascertaining the applicable facts relating to many of these proceedings, the variable treatment of claims made in many of these proceedings, and the difficulty of predicting the settlement value of many of these proceedings. However, based upon the Company's historical experience, the resolution of these proceedings is not expected to have a material effect on the Company's financial condition, results of operations or cash flows. The Company may incur substantial legal fees, which are expensed as incurred, in defending against these legal proceedings.
Polycom Acquisition
On March 28, 2018, we entered into the Purchase Agreement to acquire Polycom for $2.0 billion. The Polycom Transaction has been unanimously approved by the boards of directors of both companies, is subject to regulatory approvals and other customary closing conditions, and is expected to close by the end of the third calendar quarter of 2018.
9. DEBT
5.50% Notes
In May 2015, Plantronics issued $500.0 million aggregate principal amount of 5.50% Senior Notes. The 5.50% Senior Notes mature on May 31, 2023, and bear interest at a rate of 5.50% per annum, payable semi-annually on May 15 and November 15 of each year, commencing on November 15, 2015. The Company received net proceeds of $488.4 million from issuance of the 5.50% Senior Notes, net of issuance costs of $11.6 million, which are presented in our consolidated balance sheet as a reduction to the outstanding amount payable and are being amortized to interest expense, using the effective interest method, over the term of the 5.50% Senior Notes. A portion of the proceeds was used to repay all then-outstanding amounts under our revolving line of credit agreement with Wells Fargo Bank and the remaining proceeds were used primarily for share repurchases.
The fair value of the 5.50% Senior Notes was determined based on inputs that were observable in the market, including the trading price of the 5.50% Senior Notes when available (Level 2). The estimated fair value and carrying value of the 5.50% Senior Notes were as follows:
March 31, 2017 | March 31, 2018 | ||||||||||||||
(in thousands) | Fair Value | Carrying Value | Fair Value | Carrying Value | |||||||||||
5.50% Senior Notes | $ | 505,150 | $ | 491,059 | $ | 497,095 | $ | 492,509 | |||||||
The Company may redeem all or a part of the 5.50% Senior Notes, upon not less than 30 or more than a 60 day notice; however, the applicable redemption price will be determined as follows:
Redemption Period Requiring Payment of: | Redemption Up To 35% Using Cash Proceeds From An Equity Offering(3): | ||||||
Make-Whole(1) | Premium(2) | Date | Specified Price | ||||
5.50% Senior Notes | Prior to May 15, 2018 | On or after May 15, 2018 | Prior to May 15, 2018 | 105.50% | |||
66
(1) If the Company redeems the notes prior to the applicable date, the price is principal plus a make-whole premium equal to the present value of the remaining scheduled interest payments as described in the applicable indenture, together with accrued and unpaid interest.
(2) If the Company redeems the notes on or after the applicable date, the price is principal plus a premium which declines over time as specified in the applicable indenture, together with accrued and unpaid interest.
(3) If the Company redeems the notes prior to the applicable date with net cash proceeds of one or more equity offerings, the price is equal to the amount specified above, together with accrued and unpaid interest, subject to a maximum redemption of 35% of the aggregate principal amount of the respective note being redeemed.
In addition, upon the occurrence of certain change of control triggering events, the Company may be required to repurchase the 5.50% Senior Notes, at a price equal to 101% of their principal amount, plus accrued and unpaid interest to the date of repurchase. The 5.50% Senior Notes contain restrictive covenants that, among other things, limit Plantronics' ability to create certain liens and enter into sale and leaseback transactions; create, assume, incur, or guarantee additional indebtedness of Plantronics’ subsidiaries without such subsidiary guaranteeing the 5.50% Senior Notes on an unsecured unsubordinated basis; and consolidate or merge with, or convey, transfer or lease all or substantially all of the assets of Plantronics and its subsidiaries to another person. As of March 31, 2018, the Company was in compliance with all covenants.
Revolving Credit Agreement
On May 9, 2011, the Company entered into a credit agreement with Wells Fargo Bank, National Association ("the Bank"), which was most recently amended on April 28, 2017 (as amended, the "Amended Credit Agreement") to extend the term of the Credit Agreement by one year to May 9, 2020, and to amend certain of the covenants, which are defined below.
The Amended Credit Agreement provides for a $100.0 million unsecured revolving credit facility. Revolving loans under the Amended Credit Agreement will bear interest, at the Company’s election, at (i) the Bank’s announced prime rate less 1.20% per annum or (ii) a daily one-month LIBOR rate plus 1.40% per annum. Interest is payable quarterly in arrears on the first day of each April, July, October, and January, commencing July 1, 2015. Principal, together with all accrued and unpaid interest, on the revolving loans is due and payable on May 9, 2020. The Company is also obligated to pay a commitment fee of 0.37% per annum on the average daily unused amount of the revolving line of credit, which fee shall be payable quarterly in arrears on the first day of each April, July, October, and January, commencing July 1, 2015.
The Company may prepay the loans and terminate the commitments under the Amended Credit Agreement at any time, without premium or penalty, subject to the reimbursement of certain costs. As of March 31, 2018, the Company had no outstanding borrowings under the line of credit.
The Amended Credit Agreement contains customary affirmative and negative covenants, including, among other things, covenants limiting the ability of the Company to incur debt, make capital expenditures, grant liens, merge or consolidate, and make investments. The Amended Credit Agreement also requires the Company to comply with certain financial covenants, including (i) a maximum ratio of funded debt to EBITDA of 3.25:1 and (ii) a minimum EBITDA coverage ratio, in each case, tested as of each fiscal quarter and determined on a rolling four-quarter basis. In addition, the Company and its subsidiaries are required to maintain unrestricted cash, cash equivalents and marketable securities plus availability under the Amended Credit Agreement at the end of each fiscal quarter of at least $300.0 million. The Amended Credit Agreement contains customary events of default that include, among other things, payment defaults, covenant defaults, cross-defaults with certain other indebtedness, bankruptcy and insolvency defaults, and judgment defaults. The occurrence of an event of default could result in the acceleration of the obligations under the Amended Credit Agreement. As of March 31, 2018, the Company was in compliance with all covenants.
10. RESTRUCTURING AND OTHER RELATED CHARGES (CREDITS)
During Fiscal Year 2018 and as part of its ongoing effort to reduce costs, improve profitability, and focus on its key strategic initiatives, the Company executed an asset sale agreement to dispose of substantially all assets of its Clarity division, primarily inventories and tooling fixed assets, for an immaterial sales price. The buyer in this arrangement was a former employee of the Company, who acted as Clarity's President but who was not an executive officer or director of the Company. As part of the buyer's separation from Plantronics, the Company accelerated vesting on his outstanding restricted stock, resulting in an immaterial stock-compensation modification charge.
In connection with the sale, the Company is leasing the facility it owns in Chattanooga, Tennessee, to the buyer for a period of twelve months. The Company also entered into a transition services agreement with the buyer to provide customer support services on a cost-recovery basis, which are not expected to be material, for a period of one year. The Company also recorded immaterial impairment charges on assets previously used in Clarity operations that have no further value to the Company.
67
In addition to the sale of the Clarity division and the related restructuring actions, the Company reduced headcount in certain divisions and terminated a lease in the Netherlands before the end of its contractual term, resulting in a charge equal to the present value of the remaining future minimum lease payments. In connection with this exit, the Company wrote off certain fixed assets that will no longer be used. Finally, the Company reorganized its Brazilian operations and as a result, wrote off an unrecoverable indirect tax asset. As of March 31, 2018, the remaining obligation related to accrued severance is immaterial and is expected to be settled within 12 months.
The associated charges for year ended March 31, 2018 are recorded in restructuring and other related charges (credits), cost of revenues, and selling, general, and administrative expense in the condensed consolidated statements of operations, as follows:
Year ended March 31, 2018 | ||||||||||||
(in millions) | Total Charges | Restructuring and Other Related Charges (Credits) | Cost of Revenues | Selling, General, and Administrative | ||||||||
Severance benefits from reduction-in-force | $ | 1.4 | $ | 1.4 | $ | — | $ | — | ||||
Lease exit charges and asset impairments in Netherlands | 0.7 | 0.7 | — | — | ||||||||
Write-off of unrecoverable indirect tax asset in Brazil | 0.7 | — | 0.7 | — | ||||||||
Asset impairments related to previous Clarity operations | 0.4 | 0.4 | — | — | ||||||||
Loss on Clarity asset sale | 0.9 | — | 0.9 | — | ||||||||
Accelerated vesting of restricted stock | 0.2 | — | — | 0.2 | ||||||||
Totals | $ | 4.3 | $ | 2.5 | $ | 1.6 | $ | 0.2 | ||||
11. | STOCK PLANS AND STOCK-BASED COMPENSATION |
2003 Stock Plan
On May 5, 2003, the Board of Directors ("Board") adopted the Plantronics, Inc. 2003 Stock Plan ("2003 Stock Plan") which was approved by the stockholders in June 27, 2003. The 2003 Stock Plan, which will continue in effect until terminated by the Board, allows for the issuance of the Company's common stock through the granting of non-qualified stock options, restricted stock, and restricted stock units. As of March 31, 2018, there have been 15,900,000 shares of common stock (which number is subject to adjustment in the event of stock splits, reverse stock splits, recapitalization or certain corporate reorganizations) cumulatively reserved since inception of the 2003 Stock Plan for issuance to employees, non-employee directors, and consultants of Plantronics. The Company settles stock option exercises, grants of restricted stock, and releases of vested restricted stock units with newly issued common shares.
The exercise price of stock options may not be less than 100% of the fair market value of the Company's common stock on the date of grant. The term of an option may not exceed 7 years from the date it is granted. Stock options granted to employees vest over a three-year period, and stock options granted to non-employee directors vest over a four-year period.
No participant shall receive restricted stock or restricted stock units in any fiscal year having an aggregate initial value greater than $2.0 million. Restricted stock and restricted stock units granted to employees subsequent to May 2013 vest over a three-year period, and restricted stock and restricted stock units granted from May 2011 to April 2013 vest over a four-year period. Restricted stock granted to non-employee directors subsequent to August 2014 vests over a one-year period, and restricted stock granted from August 2001 to August 2013 vests over a four-year period.
At March 31, 2018, options to purchase 922,975 shares of common stock and 1,253,561 shares of unvested restricted stock and restricted stock units were outstanding. There were 2,297,174 shares available for future grant under the 2003 Stock Plan.
68
2002 ESPP
On June 10, 2002, the Board adopted the 2002 Employee Stock Purchase Plan ("ESPP"), which was approved by the stockholders on July 17, 2002, to provide eligible employees with an opportunity to purchase the Company's common stock through payroll deductions. The ESPP qualifies under Section 423 of the Internal Revenue Code. Under the ESPP, which is effective until terminated by the Board, the purchase price of the Company's common stock is equal to 85% of the lesser of the closing price of the common stock on (i) the first day of the offering period or (ii) the last day of the offering period. Each offering period is six months long. There were 168,948, 151,648, and 156,355 shares issued under the ESPP in Fiscal Years 2016, 2017, and 2018 respectively. At March 31, 2018, there were 274,323 shares reserved for future issuance under the ESPP. The total cash received from employees as a result of stock issuances under the ESPP during Fiscal Year 2018 was $5.7 million, net of taxes.
Stock-based Compensation
The following table summarizes the amount of stock-based compensation expense included in the consolidated statements of operations for the periods presented:
Fiscal Year Ended March 31, | ||||||||||||
(in thousands) | 2016 | 2017 | 2018 | |||||||||
Cost of revenues | $ | 3,306 | $ | 3,244 | $ | 3,622 | ||||||
Research, development and engineering | 9,908 | 8,616 | 8,071 | |||||||||
Selling, general and administrative | 20,051 | 21,679 | 22,266 | |||||||||
Stock-based compensation expense included in operating expenses | 29,959 | 30,295 | 30,337 | |||||||||
Total stock-based compensation | 33,265 | 33,539 | 33,959 | |||||||||
Income tax benefit | (10,950 | ) | (10,768 | ) | (7,880 | ) | ||||||
Total stock-based compensation expense, net of tax | $ | 22,315 | $ | 22,771 | $ | 26,079 | ||||||
Stock Plan Activity
Stock Options
The following is a summary of the Company’s stock option activity during Fiscal Year 2018:
Options Outstanding | ||||||||||||
Number of Shares | Weighted Average Exercise Price | Weighted Average Remaining Contractual Life | Aggregate Intrinsic Value | |||||||||
(in thousands) | (in years) | (in thousands) | ||||||||||
Outstanding at March 31, 2017 | 1,417 | $ | 43.41 | |||||||||
Options granted | 15 | $ | 52.11 | |||||||||
Options exercised | (505 | ) | $ | 36.04 | ||||||||
Options forfeited or expired | (4 | ) | $ | 53.23 | ||||||||
Outstanding at March 31, 2018 | 923 | $ | 47.53 | 3.8 | $ | 11,853 | ||||||
Vested or expected to vest at March 31, 2018 | 918 | $ | 47.54 | 3.8 | $ | 11,781 | ||||||
Exercisable at March 31, 2018 | 758 | $ | 47.69 | 3.5 | $ | 9,612 | ||||||
The total intrinsic values of options exercised during Fiscal Years 2016, 2017, and 2018 were $6.9 million, $5.5 million, and $9.4 million respectively. Intrinsic value is defined as the amount by which the fair value of the underlying stock exceeds the exercise price at the time of option exercise. The total cash received from employees as a result of employee stock option exercises during Fiscal Year 2018 was $18.2 million, net of taxes. The total net tax benefit attributable to stock options exercised during the year ended March 31, 2018 was $3.3 million.
As of March 31, 2018, the total unrecognized compensation cost related to unvested stock options was $1.6 million and is expected to be recognized over a weighted average period of 1.3 years.
69
Restricted Stock
Restricted stock consists of awards of restricted stock and restricted stock units ("RSUs"). The following is a summary of the Company’s restricted stock activity during Fiscal Year 2018:
Number of Shares | Weighted Average Grant Date Fair Value | |||||
(in thousands) | ||||||
Unvested at March 31, 2017 | 1,172 | $ | 47.86 | |||
Restricted stock granted | 784 | $ | 53.62 | |||
Restricted stock vested | (577 | ) | $ | 48.12 | ||
Restricted stock forfeited | (125 | ) | $ | 50.30 | ||
Non-vested at March 31, 2018 | 1,254 | $ | 51.09 | |||
The weighted average grant-date fair value of restricted stock is based on the quoted market price of the Company's common stock on the date of grant. The weighted average grant-date fair values of restricted stock granted during Fiscal Years 2016, 2017, and 2018 were $54.66, $44.82, and 53.62, respectively. The total grant-date fair values of restricted stock that vested during Fiscal Years 2016, 2017, and 2018 were $24.2 million, $28.9 million, and $27.8 million, respectively.
As of March 31, 2018, the total unrecognized compensation cost related to non-vested restricted stock awards was $36.7 million and is expected to be recognized over a weighted average period of 1.6 years.
Valuation Assumptions
The Company estimates the fair value of stock options and ESPP shares using a Black-Scholes option valuation model. At the date of grant, the Company estimated the fair value of each stock option grant and purchase right granted under the ESPP using the following weighted average assumptions:
Employee Stock Options | ESPP | |||||||||||||||||||||||
Fiscal Year Ended March 31, | 2016 | 2017 | 2018 | 2016 | 2017 | 2018 | ||||||||||||||||||
Expected volatility | 27.0 | % | 31.1 | % | 29.1 | % | 33.5 | % | 28.8 | % | 30.5 | % | ||||||||||||
Risk-free interest rate | 1.4 | % | 1.1 | % | 1.7 | % | 0.3 | % | 0.6 | % | 1.5 | % | ||||||||||||
Expected dividends | 1.1 | % | 1.4 | % | 1.2 | % | 1.4 | % | 1.1 | % | 1.2 | % | ||||||||||||
Expected life (in years) | 4.2 | 4.4 | 4.6 | 0.5 | 0.5 | 0.5 | ||||||||||||||||||
Weighted-average grant date fair value | $ | 11.39 | $ | 10.39 | $ | 12.58 | $ | 10.33 | $ | 12.03 | $ | 11.78 | ||||||||||||
The expected stock price volatility for the years ended March 31, 2016, 2017, and 2018 was determined based on an equally weighted average of historical and implied volatility. Implied volatility is based on the volatility of the Company’s publicly traded options on its common stock with terms of six months or less. The Company determined that a blend of implied volatility and historical volatility is more reflective of market conditions and a better indicator of expected volatility than using exclusively historical volatility. The expected life was determined based on historical experience of similar awards, giving consideration to the contractual terms of the stock-based awards, vesting schedules, and expectations of future employee behavior. The risk-free interest rate is based on the U.S. Treasury yield curve in effect at the time of grant for periods corresponding with the expected life of the option. The dividend yield assumption is based on our current dividend and the market price of our common stock at the date of grant.
12. COMMON STOCK REPURCHASES
From time to time, the Board authorizes programs under which the Company may repurchase shares of its common stock, depending on market conditions, in the open market or through privately negotiated transactions. Repurchased shares are held as treasury stock until such time they are retired or re-issued. During the years ended March 31, 2016, 2017, and 2018, the Company repurchased 9,077,223, 764,176, and 1,139,548 shares of its common stock, respectively, for a total cost of $497.4 million, $34.2 million, and $52.9 million respectively, at an average price per share of $54.80, $44.80, and $46.46, respectively.
70
The Company financed the repurchases using a combination of funds generated from operations and borrowings under its revolving line of credit. All repurchases in Fiscal Years 2016, 2017, and 2018 were made in the open market. As of March 31, 2018, there remained 730,105 shares authorized for repurchase under the program approved by the Board on July 27, 2017.
During the years ended March 31, 2016, 2017, and 2018, the Company withheld shares valued at $11.1 million, $9.7 million, and $11.4 million, respectively, in satisfaction of employee tax withholding obligations upon the vesting of restricted stock granted under the Company's stock plans. The amounts withheld were equivalent to the employees' minimum statutory tax withholding requirements and are reflected as a financing activity within the Company's consolidated statements of cash flows. These share withholdings have the effect of share repurchases by the Company because they reduce the number of shares outstanding as a result of the vesting.
There were no retirements of treasury stock during Fiscal Years 2016, 2017, and 2018.
13. ACCUMULATED OTHER COMPREHENSIVE INCOME
The components of accumulated other comprehensive income, net of associated tax impacts, were as follows:
March 31, | ||||||||
(in thousands) | 2017 | 2018 | ||||||
Accumulated unrealized gain (loss) on cash flow hedges (1) | $ | 529 | $ | (1,663 | ) | |||
Accumulated foreign currency translation adjustments | 4,428 | 4,685 | ||||||
Accumulated unrealized gain on investments | (263 | ) | (152 | ) | ||||
Accumulated other comprehensive income | $ | 4,694 | $ | 2,870 | ||||
(1) Refer to Note 15, Foreign Currency Derivatives, which discloses the nature of the Company's derivative assets and liabilities as of March 31, 2017 and March 31, 2018.
14. | EMPLOYEE BENEFIT PLANS |
The Company has a defined contribution benefit plan under Section 401(k) of the Internal Revenue Code, which covers substantially all U.S. employees. Eligible employees may contribute pre-tax amounts to the plan through payroll withholdings, subject to certain limitations. Under the plan, the Company currently matches 50% of the first 6% of employees' compensation and provides a non-elective Company contribution equal to 3% of base salary. All matching contributions are currently 100% vested immediately. The Company reserves the right to modify its policies at any time, including increasing, decreasing, or eliminating contribution matching and vesting requirements. Total Company contributions in Fiscal Years 2016, 2017, and 2018 were $4.7 million, $4.2 million, and $4.5 million, respectively.
15. | FOREIGN CURRENCY DERIVATIVES |
The Company's foreign currency derivatives consist primarily of foreign currency forward exchange contracts, option contracts, and cross-currency swaps. The derivatives expose the Company to credit risk to the extent the counterparties may be unable to meet the terms of the derivative instrument. The Company's maximum exposure to loss due to credit risk that it would incur if parties to derivative contracts failed completely to perform according to the terms of the Company's agreements was equal to the net asset value of the Company's derivatives as of March 31, 2018. The Company seeks to mitigate such risk by limiting its counterparties to several large financial institutions. In addition, the Company monitors the potential risk of loss with any single counterparty resulting from this type of credit risk on an ongoing basis.
The Company enters into master netting arrangements with counterparties when possible to mitigate credit risk in derivative transactions. A master netting arrangement may allow each counterparty to net settle amounts owed between Plantronics and the counterparty as a result of multiple, separate derivative transactions. As of March 31, 2018, the Company has International Swaps and Derivatives Association (ISDA) agreements with four applicable banks and financial institutions which contain netting provisions. Plantronics has elected to present the fair value of derivative assets and liabilities within the Company's consolidated balance sheet on a gross basis even when derivative transactions are subject to master netting arrangements and may otherwise qualify for net presentation. However, the following tables provide information as if the Company had elected to offset the asset and liability balances of derivative instruments, netted in accordance with various criteria in the event of default or termination as stipulated by the terms of netting arrangements with each of the counterparties.
71
For each counterparty, if netted, the Company would offset the asset and liability balances of all derivatives at the end of the reporting period. Derivatives not subject to master netting agreements are not eligible for net presentation. As of March 31, 2017 and March 31, 2018, no cash collateral had been received or pledged related to these derivative instruments.
Offsetting of Financial Assets/Liabilities under Master Netting Agreements with Derivative Counterparties
As of March 31, 2017:
Gross Amount of Derivative Assets Presented in the Consolidated Balance Sheets | Gross Amounts Not Offset in the Consolidated Balance Sheet that are Subject to Master Netting Agreements | |||||||||||
(in thousands) | Gross Amount of Eligible Offsetting Recognized Derivative Liabilities | Cash Collateral Received | Net Amount of Derivative Assets | |||||||||
Derivatives subject to master netting agreements | $ | 2,120 | $ | (1,395 | ) | $ | — | $ | 725 | |||
Derivatives not subject to master netting agreements | — | — | ||||||||||
Total | $ | 2,120 | $ | 725 | ||||||||
Gross Amount of Derivative Liabilities Presented in the Consolidated Balance Sheets | Gross Amounts Not Offset in the Consolidated Balance Sheet that are Subject to Master Netting Agreements | |||||||||||
(in thousands) | Gross Amount of Eligible Offsetting Recognized Derivative Assets | Cash Collateral Received | Net Amount of Derivative Liabilities | |||||||||
Derivatives subject to master netting agreements | $ | (1,395 | ) | $ | 1,395 | $ | — | $ | — | |||
Derivatives not subject to master netting agreements | — | — | ||||||||||
Total | $ | (1,395 | ) | $ | — | |||||||
As of March 31, 2018:
Gross Amount of Derivative Assets Presented in the Consolidated Balance Sheets | Gross Amounts Not Offset in the Consolidated Balance Sheet that are Subject to Master Netting Agreements | |||||||||||
(in thousands) | Gross Amount of Eligible Offsetting Recognized Derivative Liabilities | Cash Collateral Received | Net Amount of Derivative Assets | |||||||||
Derivatives subject to master netting agreements | $ | 772 | $ | (772 | ) | $ | — | $ | — | |||
Derivatives not subject to master netting agreements | — | — | ||||||||||
Total | $ | 772 | $ | — | ||||||||
Gross Amount of Derivative Liabilities Presented in the Consolidated Balance Sheets | Gross Amounts Not Offset in the Consolidated Balance Sheet that are Subject to Master Netting Agreements | |||||||||||
(in thousands) | Gross Amount of Eligible Offsetting Recognized Derivative Assets | Cash Collateral Received | Net Amount of Derivative Liabilities | |||||||||
Derivatives subject to master netting agreements | $ | (3,037 | ) | $ | 772 | $ | — | $ | (2,265 | ) | ||
Derivatives not subject to master netting agreements | — | — | ||||||||||
Total | $ | (3,037 | ) | $ | (2,265 | ) | ||||||
The Company's derivative instruments are measured using Level 2 fair value inputs.
72
Non-Designated Hedges
As of March 31, 2018, the Company had foreign currency forward contracts denominated in Euros ("EUR"), British Pound Sterling ("GBP"), Australian Dollars ("AUD"), and Canadian Dollars ("CAD"). The Company does not elect to obtain hedge accounting for these forward contracts. These forward contracts hedge against a portion of the Company’s foreign currency-denominated cash balances, receivables, and payables. The following table summarizes the notional value of the Company’s outstanding foreign exchange currency contracts and approximate U.S. Dollar ("USD") equivalent at March 31, 2018:
Local Currency | USD Equivalent | Position | Maturity | ||||||||
(in thousands) | (in thousands) | ||||||||||
EUR | € | 32,050 | $ | 39,557 | Sell EUR | 1 month | |||||
GBP | £ | 10,900 | $ | 15,313 | Sell GBP | 1 month | |||||
AUD | A$ | 13,600 | $ | 10,456 | Sell AUD | 1 month | |||||
CAD | C$ | 2,500 | $ | 1,939 | Sell CAD | 1 month | |||||
Effect of Non-Designated Derivative Contracts on the Consolidated Statements of Operations
The effect of non-designated derivative contracts on results of operations recognized in other non-operating income and (expense), net in the consolidated statements of operations was as follows:
Fiscal Year Ended March 31, | ||||||||||||
(in thousands) | 2016 | 2017 | 2018 | |||||||||
Gain on foreign exchange contracts | $ | 494 | $ | 4,599 | $ | 7,405 | ||||||
Cash Flow Hedges
Costless Collars
The Company hedges a portion of the forecasted EUR and GBP denominated revenues with costless collars. On a monthly basis, the Company enters into option contracts with a 6 to 12 month term. Collar contracts are scheduled to mature at the beginning of each fiscal quarter, at which time the instruments convert to forward contracts. The Company also enters into cash flow forwards with a three month term. Once the hedged revenues are recognized, the forward contracts become non-designated hedges to protect the resulting foreign monetary asset position for the Company.
The notional value of the Company's outstanding EUR and GBP option and forward contracts at the end of each period was as follows:
(in millions) | March 31, 2017 | March 31, 2018 | ||||||
EUR | GBP | EUR | GBP | |||||
Option contracts | €73.5 | £23.9 | €77.8 | £23.7 | ||||
Forward contracts | €11.2 | £3.3 | €16.7 | £3.7 | ||||
There were no material gains or losses in AOCI as of March 31, 2018 to be recognized during the next 12 months due to the recognition of the hedged forecasted revenue.
Cross-currency Swaps
The Company hedges a portion of the forecasted Mexican Peso (“MXN”) denominated expenditures with a cross-currency swap. There were no material gains or losses in AOCI as of March 31, 2018 to be recognized during the next 12 months due to the recognition of the hedged forecasted expenses. As of March 31, 2017 and 2018, the Company had foreign currency swap contracts of approximately MXN 287.2 million and MXN 31.8 million, respectively.
73
The following table summarizes the notional value of the Company's outstanding MXN currency swaps and approximate USD Equivalent at March 31, 2018:
Local Currency | USD Equivalent | Position | Maturity | |||||||||
(in thousands) | (in thousands) | |||||||||||
MX$ | 31,830 | $ | 1,599 | Buy MXN | Monthly over | 3 months | ||||||
Effect of Designated Derivative Contracts on AOCI and Consolidated Statements of Operations
The following table presents the pre-tax effects of derivative instruments designated as cash flow hedges on AOCI and the consolidated statements of operations for fiscal years ended March 31, 2016, 2017, and 2018:
(in thousands) | 2016 | 2017 | 2018 | |||||||||
Gain (loss) included in AOCI as of beginning of period | $ | 5,705 | $ | (1,106 | ) | $ | 541 | |||||
Amount of gain (loss) recognized in OCI (effective portion) | (3,786 | ) | 3,095 | (6,741 | ) | |||||||
Amount of (gain) loss reclassified from OCI into net revenues (effective portion) | (7,826 | ) | (4,111 | ) | 4,715 | |||||||
Amount of (gain) loss reclassified from OCI into cost of revenues (effective portion) | 4,801 | 2,663 | (208 | ) | ||||||||
Total amount of (gain) loss reclassified from AOCI to consolidated statements of operations (effective portion) | (3,025 | ) | (1,448 | ) | 4,507 | |||||||
Gain (loss) included in AOCI as of end of period | $ | (1,106 | ) | $ | 541 | $ | (1,693 | ) | ||||
The Company recognized immaterial loss in the consolidated statements of operations on the ineffective portion of the cash flow hedges reported in other non-operating income and (expense), net during the year ended March 31, 2018 and 2016 compared to an immaterial gain in Fiscal Year 2017.
16. | INCOME TAXES |
Income tax expense for Fiscal Years 2016, 2017, and 2018 consisted of the following:
Fiscal Year Ended March 31, | ||||||||||||
(in thousands) | 2016 | 2017 | 2018 | |||||||||
Current: | ||||||||||||
Federal | $ | 15,702 | $ | 10,591 | $ | 82,523 | ||||||
State | 1,934 | 457 | 4,274 | |||||||||
Foreign | 4,644 | 7,731 | 6,860 | |||||||||
Total current provision for income taxes | 22,280 | 18,779 | 93,657 | |||||||||
Deferred: | ||||||||||||
Federal | (7,767 | ) | 1,022 | 9,002 | ||||||||
State | (1,103 | ) | (117 | ) | (1,585 | ) | ||||||
Foreign | 374 | (618 | ) | 22 | ||||||||
Total deferred income tax expense (benefit) | (8,496 | ) | 287 | 7,439 | ||||||||
Income tax expense | $ | 13,784 | $ | 19,066 | $ | 101,096 | ||||||
74
The components of income before income taxes for Fiscal Years 2016, 2017, and 2018 are as follows:
Fiscal Year Ended March 31, | ||||||||||||
(in thousands) | 2016 | 2017 | 2018 | |||||||||
United States | $ | 42,184 | $ | 43,377 | $ | 17,654 | ||||||
Foreign | 39,992 | 58,288 | 82,573 | |||||||||
Income before income taxes | $ | 82,176 | $ | 101,665 | $ | 100,227 | ||||||
The following is a reconciliation between statutory federal income taxes and the income tax expense for Fiscal Years 2016, 2017, and 2018:
Fiscal Year Ended March 31, | ||||||||||||
(in thousands) | 2016 | 2017 | 2018 | |||||||||
Tax expense at statutory rate | $ | 28,762 | $ | 35,583 | $ | 31,631 | ||||||
Foreign operations taxed at different rates | (9,478 | ) | (13,183 | ) | (17,970 | ) | ||||||
State taxes, net of federal benefit | 831 | 340 | 2,689 | |||||||||
Research and development credit | (3,133 | ) | (3,119 | ) | (2,023 | ) | ||||||
Unwind of stock based compensation cost sharing | (2,855 | ) | — | — | ||||||||
Impact of Tax Act | — | — | 87,790 | |||||||||
Stock based compensation | (487 | ) | (365 | ) | (1,771 | ) | ||||||
Other, net | 144 | (190 | ) | 750 | ||||||||
Income tax expense | $ | 13,784 | $ | 19,066 | $ | 101,096 | ||||||
Deferred tax assets and liabilities represent the tax effects of temporary differences between the carrying amounts of assets and liabilities for financial reporting and income tax purposes.
Significant components of the Company's deferred tax assets and liabilities as of March 31, 2017 and 2018 are as follows:
March 31, | ||||||||
(in thousands) | 2017 | 2018 | ||||||
Accruals and other reserves | $ | 8,526 | $ | 4,809 | ||||
Deferred Compensation | 4,859 | 3,467 | ||||||
Net operating loss carry forward | 2,221 | 1,540 | ||||||
Stock compensation | 12,821 | 8,384 | ||||||
Tax credits | 4,530 | 6,504 | ||||||
Other deferred tax assets | 1,711 | 1,070 | ||||||
Valuation allowance | (2,209 | ) | (2,514 | ) | ||||
Total deferred tax assets | 32,459 | 23,260 | ||||||
Deferred gains on sales of properties | (1,771 | ) | (1,160 | ) | ||||
Unremitted earnings of certain subsidiaries | — | (1,976 | ) | |||||
Fixed asset depreciation | (7,351 | ) | (4,150 | ) | ||||
Total deferred tax liabilities | (9,122 | ) | (7,286 | ) | ||||
Net deferred tax assets(1) | $ | 23,337 | $ | 15,974 | ||||
(1) The Company's deferred tax assets for the fiscal year ending March 31, 2017 and March 31, 2018, are included as a component of other assets on the consolidated balance sheets.
The Company has California research and development credit carryforwards for income tax purposes of $10.4 million that can be carried forward indefinitely. The Company has Chinese net operating losses of $4.3 million that expire in different periods through Fiscal Year 2024.
75
The Company evaluates its deferred tax assets, including a determination of whether a valuation allowance is necessary, based upon its ability to utilize the assets using a more likely than not analysis. Deferred tax assets are only recorded to the extent that they are realizable based upon past and future income. The Company has a long-established earnings history with taxable income in its carryback years and forecasted future earnings. The Company has concluded that no valuation allowance is required, except for the specific items discussed below.
The valuation allowance of $2.5 million as of March 31, 2018 was related to the net operating losses of a foreign subsidiary with an insufficient recent history of earnings to support the realization of their deferred tax assets, as well as to excess California research credit carryforwards. The valuation allowance of $2.2 million as of March 31, 2017 was related to the net operating losses of foreign subsidiaries with an insufficient history of recent earnings to support the realization of their deferred tax assets, as well as to excess California research credit carryforwards. During the year ending March 31, 2018, the valuation allowance increased by $0.3 million, which was mostly related to California research credit carryforwards that were generated during the year ending March 31, 2018 and for which it is more likely than not these deferred tax assets will not be realized.
The impact of an uncertain income tax position on income tax expense must be recognized at the largest amount that is more likely than not to be sustained. An uncertain income tax position will not be recognized unless it has a greater than 50% likelihood of being sustained. As of March 31, 2016, 2017, and 2018, the Company had $12.7 million, $12.9 million, and $12.6 million, respectively, of unrecognized tax benefits. The unrecognized tax benefits as of March 31, 2018 would favorably impact the effective tax rate in future periods if recognized.
A reconciliation of the change in the amount of gross unrecognized income tax benefits for the periods is as follows:
March 31, | ||||||||||||
(in thousands) | 2016 | 2017 | 2018 | |||||||||
Balance at beginning of period | $ | 12,821 | $ | 12,692 | $ | 12,854 | ||||||
Increase (decrease) of unrecognized tax benefits related to prior fiscal years | (598 | ) | (2 | ) | (1,310 | ) | ||||||
Increase of unrecognized tax benefits related to the current year | 2,252 | 2,195 | 3,085 | |||||||||
Reductions to unrecognized tax benefits related to settlements with taxing authorities | (149 | ) | — | (115 | ) | |||||||
Reductions to unrecognized tax benefits related to lapse of applicable statute of limitations | (1,634 | ) | (2,031 | ) | (1,902 | ) | ||||||
Balance at end of period | $ | 12,692 | $ | 12,854 | $ | 12,612 | ||||||
The Company's continuing practice is to recognize interest and penalties related to income tax matters in income tax expense. The interest related to unrecognized tax benefits was $1.7 million and $1.4 million as of March 31, 2017 and 2018, respectively. No penalties have been accrued.
The Company and its subsidiaries are subject to taxation in various foreign and state jurisdictions, including the U.S. All federal tax matters have been concluded for tax years prior to Fiscal Year 2014. Foreign and State income tax matters for material tax jurisdictions have been concluded for tax years prior to Fiscal Year 2011 and Fiscal Year 2013, respectively.
The Company believes that an adequate provision has been made for any adjustments that may result from tax examinations; however, the outcome of such examinations cannot be predicted with certainty. If any issues addressed in the tax examinations are resolved in a manner inconsistent with the Company's expectations, the Company could be required to adjust its provision for income tax in the period such resolution occurs. The timing of any resolution and/or closure of tax examinations is not certain.
On December 22, 2017, the Tax Cuts and Jobs Act (H.R. 1) (the “Act”) was signed into law in the United States. The Act includes several changes to existing tax law, including, among other things, a permanent reduction in the corporate income tax rate from 35% to 21% and applying new taxes on certain foreign source earnings.
In addition, we were subject to a one-time deemed repatriation of accumulated foreign subsidiary unremitted earnings (hereafter, the "toll charge"), which the Company will elect to pay over an eight-year period as permitted under the Act. The Company recorded a 79.7 million toll charge as part of income tax expense for the Fiscal year ended March 31, 2018, representing a provisional estimate based on a 15.5% tax applied to foreign unremitted cash and cash equivalents and an 8% tax applied to permanently reinvested foreign assets. As part of the Act, the Company also completed its re-measurement of deferred tax assets as of March 31, 2018 to the new future federal tax rate of 21%, thereby reducing the Company’s deferred tax assets by $4.6 million. The Company expects to repatriate substantially all of its unremitted foreign subsidiary earnings and has recorded income tax expenses of $5.0 million related to state income taxes and foreign withholding taxes that will become due over the repatriation period.
76
Finally, the Company files its federal tax return on a fiscal year-end and is therefore required to pro-rate the new and old tax rates during Fiscal Year 2018. The blended, annualized tax rate applied to Fiscal Year 2018 income is 31.56%.
In accordance with SAB 118, the provisional estimate for the toll charge will be finalized when the Company completes its substantive review of unremitted foreign earnings through examination of statutory filings and tax returns of the Company's foreign subsidiaries and fiscal branches that span a 30-year period. The Company must also analyze the impact of foreign exchange rates and inflation on the historical information to support foreign tax credits available to offset the toll charge. In addition, the Company's estimate of the toll charge obligation may change due to legislative technical corrections, the IRS' promulgation of regulations to interpret the Act, and changes in accounting standards for income taxes or related interpretations in response to the Act. This review and finalization of the toll charge provisional estimate will be completed within a twelve month measurement period from the date of enactment.
The Company recorded a correction to the geographic mix of income during the three months ended June 30, 2017 related to Fiscal Year 2017, which reduced income in a high tax jurisdiction and increased income in a low tax jurisdiction. This correction resulted in a reduction of $2.8 million to the Company’s income tax expense for the year ended March 31, 2018 as compared to the prior fiscal year end. For additional details regarding this correction refer to Note 2, Significant accounting Policies.
The Company adopted new stock-based compensation accounting guidance effective the beginning of Fiscal Year 2018. Excess tax benefits associated with employee equity plans were previously recorded in additional paid-in capital and the adoption of this guidance had an immaterial impact on the Company's effective tax rate for the three months ended December 31, 2017, but resulted in a $2.7 million reduction to income tax expense for the twelve months ended March 31, 2018. The amount of excess tax benefits or deficiencies will fluctuate from period-to-period based on the price of the Company’s stock, the volume of share-based instruments settled or vested, and the value assigned to employee equity awards under U.S. GAAP.
17. | COMPUTATION OF EARNINGS PER COMMON SHARE |
The Company has a share-based compensation plan under which employees, non-employee directors, and consultants may be granted share-based awards, including shares of restricted stock on which non-forfeitable dividends are paid on unvested shares. As such, shares of restricted stock are considered participating securities under the two-class method of calculating earnings per share.
Prior to the second quarter of Fiscal Year 2018, the impact of the two-class method was not considered material and therefore, earnings per share was reported as calculated under the treasury stock method. During periods of net loss, no effect is given to participating securities since they do not share in the losses of the Company.
The following table sets forth the computation of basic and diluted earnings per common share for the years ended March 31, 2018, 2017 and 2016:
(in thousands, except earnings per share data) | Fiscal Year Ended March 31, | |||||||||||
2016 | 2017 | 2018 | ||||||||||
Numerator: | ||||||||||||
Net income | $ | 68,392 | $ | 82,599 | $ | (869 | ) | |||||
Denominator: | ||||||||||||
Weighted average common shares-basic | 34,127 | 32,279 | 32,345 | |||||||||
Dilutive effect of employee equity incentive plans | 811 | 684 | — | |||||||||
Weighted average shares-diluted | 34,938 | 32,963 | 32,345 | |||||||||
Basic earnings per common share | $ | 2.00 | $ | 2.56 | $ | (0.03 | ) | |||||
Diluted earnings per common share | $ | 1.96 | $ | 2.51 | $ | (0.03 | ) | |||||
Potentially dilutive securities excluded from diluted earnings per share because their effect is anti-dilutive | 326 | 574 | 543 | |||||||||
77
18. | GEOGRAPHIC INFORMATION |
The Company designs, manufactures, markets, and sells headsets for business and consumer applications. With respect to headsets, it makes products for use in offices and contact centers, with mobile devices, cordless phones, and with computers and gaming consoles. Major product categories include Enterprise, which includes corded and cordless communication headsets, audio processors, and telephone systems; and Consumer, which includes Bluetooth and corded products for mobile device applications, personal computer ("PC") and gaming headsets.
The following table presents net revenues by product group:
Fiscal Year Ended March 31, | ||||||||||||
(in thousands) | 2016 | 2017 | 2018 | |||||||||
Net revenues from unaffiliated customers: | ||||||||||||
Enterprise | $ | 626,666 | $ | 628,654 | $ | 649,739 | ||||||
Consumer | 230,241 | 252,522 | 207,164 | |||||||||
Total net revenues | $ | 856,907 | $ | 881,176 | $ | 856,903 | ||||||
For reporting purposes, revenue is attributed to each geographic region based on the location of the customer. Other than the U.S., no country accounted for 10% or more of the Company's net revenues for the years ended March 31, 2016, 2017, and 2018.
The following table presents net revenues by geography:
Fiscal Year Ended March 31, | ||||||||||||
(in thousands) | 2016 | 2017 | 2018 | |||||||||
Net revenues from unaffiliated customers: | ||||||||||||
U.S. | $ | 482,622 | $ | 482,215 | $ | 434,053 | ||||||
Europe and Africa | 217,633 | 226,620 | 250,763 | |||||||||
Asia Pacific | 105,687 | 106,295 | 99,779 | |||||||||
Americas, excluding U.S. | 50,965 | 66,046 | 72,308 | |||||||||
Total International net revenues | 374,285 | 398,961 | 422,850 | |||||||||
Total net revenues | $ | 856,907 | $ | 881,176 | $ | 856,903 | ||||||
One customer, Ingram Micro Group, accounted for 10.9% of total net revenues in Fiscal Year 2018 and 2017. No customer accounted for 10% or more of total net revenues in Fiscal Years 2016
The following table presents long-lived assets by geographic area on a consolidated basis:
Fiscal Year Ended March 31, | ||||||||
(in thousands) | 2017 | 2018 | ||||||
U.S. | $ | 69,085 | $ | 64,975 | ||||
Mexico | 42,923 | 41,036 | ||||||
The Netherlands | 22,637 | 20,752 | ||||||
Other countries | 15,662 | 15,366 | ||||||
Total long-lived assets | $ | 150,307 | $ | 142,129 | ||||
19. | SUBSEQUENT EVENTS |
On May 1, 2018, the Audit Committee approved the payment of a dividend of $0.15 per share on June 8, 2018 to holders of record on May 18, 2018.
78
SUPPLEMENTARY QUARTERLY FINANCIAL DATA
(Unaudited)
Each of the Company's fiscal years ends on the Saturday closest to the last day of March. The Company's Fiscal Year 2018 and Fiscal Year 2017 consisted of 52 weeks. Our interim fiscal quarters for the first, second, third, and fourth quarter of Fiscal Year 2018 ended on July 1 2017, September 30, 2017, December 30, 2017, and March 31, 2018, respectively, and our interim fiscal quarters for the first, second, third, and fourth quarter of Fiscal Year 2017 ended on July 2, 2016, October 1, 2016, December 31, 2016, and April 1, 2017, respectively. All interim fiscal quarters presented below consisted of 13 weeks. For purposes of presentation, the Company has indicated its accounting fiscal year as ending on March 31 and our interim quarterly periods as ending on the last calendar day of the applicable month end.
(in thousands, except per share data) | Quarter Ended | ||||||||||||||
June 30, 2017 | September 30, 2017 | December 31, 2017 | March 31, 2018 | ||||||||||||
Net revenues | $ | 203,926 | $ | 210,300 | $ | 226,534 | $ | 216,143 | |||||||
Gross profit | $ | 103,283 | $ | 107,632 | $ | 114,125 | $ | 114,075 | |||||||
Net income | $ | 18,828 | $ | 19,953 | $ | (49,504 | ) | $ | 9,854 | ||||||
Basic net income per common share | $ | 0.58 | $ | 0.59 | $ | (1.54 | ) | $ | 0.30 | ||||||
Diluted net income per common share | $ | 0.57 | $ | 0.59 | $ | (1.54 | ) | $ | 0.29 | ||||||
Cash dividends declared per common share | $ | 0.15 | $ | 0.15 | $ | 0.15 | $ | 0.15 | |||||||
(in thousands, except per share data) | Quarter Ended | ||||||||||||||
June 30, 2016 | September 30, 2016 | December 31, 2016 | March 31, 2017 | ||||||||||||
Net revenues | $ | 223,106 | $ | 216,183 | $ | 232,933 | $ | 208,954 | |||||||
Gross profit | $ | 113,073 | $ | 110,446 | $ | 110,180 | $ | 107,671 | |||||||
Net income | $ | 20,387 | $ | 20,474 | $ | 22,221 | $ | 19,517 | |||||||
Basic net income per common share | $ | 0.63 | $ | 0.63 | $ | 0.69 | $ | 0.60 | |||||||
Diluted net income per common share | $ | 0.62 | $ | 0.63 | $ | 0.68 | $ | 0.59 | |||||||
Cash dividends declared per common share | $ | 0.15 | $ | 0.15 | $ | 0.15 | $ | 0.15 | |||||||
ITEM 9. CHANGES IN AND DISAGREEMENTS WITH ACCOUNTANTS ON ACCOUNTING AND FINANCIAL DISCLOSURE
There have been no disagreements with accountants on any matter of accounting principles and practices or financial disclosure.
ITEM 9A. CONTROLS AND PROCEDURES
Evaluation of disclosure controls and procedures
Our management evaluated, with the participation of our Chief Executive Officer and our Chief Financial Officer, the effectiveness of our disclosure controls and procedures as of the end of the period covered by this Form 10-K. Based on this evaluation, our Chief Executive Officer and our Chief Financial Officer have concluded that our disclosure controls and procedures are effective at the reasonable assurance level to ensure that information we are required to disclose in reports that we file or submit under the Securities Exchange Act of 1934 (i) is recorded, processed, summarized and reported within the time periods specified in Securities and Exchange Commission rules and forms, and (ii) is accumulated and communicated to Plantronics’ management, including our Chief Executive Officer and our Chief Financial Officer, as appropriate, to allow timely decisions regarding required disclosure.
Our disclosure controls and procedures are designed to provide reasonable assurance that such information is accumulated and communicated to our management. Our disclosure controls and procedures include components of our internal control over financial reporting. Management’s assessment of the effectiveness of our internal control over financial reporting is expressed at the level of reasonable assurance because a control system, no matter how well designed and operated, can provide only reasonable, but not absolute, assurance that the control system’s objectives will be met.
79
Management’s Report on Internal Control Over Financial Reporting
Our management is responsible for establishing and maintaining adequate internal control over financial reporting (as defined in Rule 13a-15(f) under the Securities Exchange Act of 1934, as amended). Our management conducted an evaluation of the effectiveness of our internal control over financial reporting based on the criteria set forth in Internal Control-Integrated Framework (2013) issued by the Committee of Sponsoring Organizations of the Treadway Commission (“COSO”). Based on this evaluation, our management has concluded that our internal control over financial reporting was effective as of March 31, 2018. The Company’s independent registered public accounting firm, PricewaterhouseCoopers LLP, has issued a report on our internal control over financial reporting, which appears on page 46 of this Form 10-K.
Changes in internal control over financial reporting
There has been no change in our internal control over financial reporting during the fourth quarter of Fiscal Year 2018 that has materially affected, or is reasonably likely to materially affect, our internal control over financial reporting.
ITEM 9B. OTHER INFORMATION
None.
80
PART III
ITEM 10. DIRECTORS, EXECUTIVE OFFICERS AND CORPORATE GOVERNANCE
The information regarding the identification and business experience of our directors under the captions "Nominees" and “Business Experience of Directors” under the main caption "Proposal One – Election of Directors" in our definitive 2018 Proxy Statement for the 2018 Annual Meeting of Stockholders (“2018 Proxy Statement”), is incorporated in this Item 10 by reference. For information regarding the identification and business experience of our executive officers, see "Executive Officers of the Registrant" at the end of Item 1 in Part I of this Form 10-K. Information regarding the audit committee and names of the financial expert(s) serving on the audit committee, under the caption "Corporate Governance” subhead “Audit Committee" in our 2018 Proxy Statement is incorporated into this Item 10 by reference. Information concerning filing requirements applicable to our executive officers and directors under the caption "Section 16(a) Beneficial Ownership Reporting Compliance” in our 2018 Proxy Statement is incorporated into this Item 10 by reference.
There have been no materials changes to the procedures by which stockholders can recommend nominees to the Company's board of directors.
ITEM 11. EXECUTIVE COMPENSATION
The information required under this item is included under the captions "Executive Compensation", "Compensation of Directors", “Report of the Compensation Committee of the Board of Directors” and “Compensation Committee Interlocks and Insider Participation” in our 2018 Proxy Statement and is incorporated herein by reference.
ITEM 12. SECURITY OWNERSHIP OF CERTAIN BENEFICIAL OWNERS AND MANAGEMENT AND RELATED STOCKHOLDER MATTERS
The information required by this item is included under the captions “Equity Compensation Plan Information” and "Security Ownership of Principal Stockholders and Management" under the main caption "Additional Information" in our 2018 Proxy Statement and is incorporated into this Item 12 by this reference.
ITEM 13. CERTAIN RELATIONSHIPS AND RELATED TRANSACTIONS, AND DIRECTOR INDEPENDENCE
The information required by this item is included under the caption "Corporate Governance” subheading “Director Independence and Certain Relationships and Related Transactions" in the 2018 Proxy Statement and is incorporated into this Item 13 by this reference.
ITEM 14. PRINCIPAL ACCOUNTING FEES AND SERVICES
The information required by this item is included under the caption "Proposal Three - Ratification of Appointment of Independent Registered Public Accounting Firm" in our 2018 Proxy Statement and is incorporated in this Item 14 by this reference.
81
PART IV
ITEM 15. EXHIBITS AND FINANCIAL STATEMENT SCHEDULES
(a) The following documents are filed as part of this Form 10-K:
(1) | Financial Statements. The following consolidated financial statements and supplementary information and Report of Independent Registered Public Accounting Firm are included in Part II of this Report. |
INDEX TO CONSOLIDATED FINANCIAL STATEMENTS
Page | |
82
(2) | Financial Statement Schedule. |
PLANTRONICS, INC.
SCHEDULE II: VALUATION AND QUALIFYING
ACCOUNTS
(in thousands)
Balance at Beginning of Year | Charged to Expenses or Other Accounts | Deductions | Balance at End of Year | |||||||||||||
Provision for doubtful accounts and sales allowances: | (1) | |||||||||||||||
Year ended March 31, 2016 | $ | 1,221 | $ | 719 | $ | (1,376 | ) | $ | 564 | |||||||
Year ended March 31, 2017 | 564 | 621 | (582 | ) | 603 | |||||||||||
Year ended March 31, 2018 | $ | 603 | $ | 784 | $ | (514 | ) | $ | 873 | |||||||
Provision for returns: | (2) | |||||||||||||||
Year ended March 31, 2016 | $ | 6,194 | $ | 27,635 | $ | (26,515 | ) | $ | 7,314 | |||||||
Year ended March 31, 2017 | 7,314 | 35,485 | (32,258 | ) | 10,541 | |||||||||||
Year ended March 31, 2018 | $ | 10,541 | $ | 30,472 | $ | (30,788 | ) | $ | 10,225 | |||||||
Provision for promotions and rebates: | (3) | |||||||||||||||
Year ended March 31, 2016 | $ | 15,401 | $ | 111,244 | $ | (98,908 | ) | $ | 27,737 | |||||||
Year ended March 31, 2017 | 27,737 | 150,085 | (146,075 | ) | 31,747 | |||||||||||
Year ended March 31, 2018 | $ | 31,747 | $ | 183,929 | $ | (177,392 | ) | $ | 38,284 | |||||||
Valuation allowance for deferred tax assets: | (4) | |||||||||||||||
Year ended March 31, 2016 | $ | 1,940 | $ | 1,962 | $ | (1,940 | ) | $ | 1,962 | |||||||
Year ended March 31, 2017 | 1,962 | 1,130 | (883 | ) | 2,209 | |||||||||||
Year ended March 31, 2018 | $ | 2,209 | $ | 981 | $ | (676 | ) | $ | 2,514 | |||||||
(1) | Amounts charged to expenses or other accounts are reflected in the consolidated statements of operations as part of selling, general, and administrative expenses for doubtful accounts and as a reduction to net revenues for sales allowances. |
(2) | Amounts charged to expenses or other accounts are reflected in the consolidated statements of operations as a reduction to net revenues. |
(3) | Amounts charged to expenses or other accounts are reflected in the consolidated statements of operations as a reduction to net revenues. |
(4) | Amounts charged to expenses or other accounts are reflected in the consolidated statements of operations as a component of income tax expense. |
All other schedules have been omitted because the required information is either not present or not present in the amounts sufficient to require submission of the schedule, or because the information required is included in the consolidated financial statements or notes thereto.
(3) Exhibits. See Item 15(b) below.
(b) Exhibits
We have filed, or incorporated by reference into this Report, the exhibits listed on the accompanying Index to Exhibits immediately following the signature page of this Form 10-K.
(c) Financial Statement Schedules
See Items 8 and 15(a) (2) above.
83
SIGNATURES
Pursuant to the requirements of the Securities Exchange Act of 1934, the registrant has duly caused this report to be signed on its behalf by the undersigned hereunto duly authorized.
May 9, 2018 | PLANTRONICS, INC. | ||
By: | /s/ Joe Burton | ||
Name: | Joe Burton | ||
Title: | Chief Executive Officer and Director | ||
POWER OF ATTORNEY
KNOW ALL PERSONS BY THESE PRESENTS:
That the undersigned officers and directors of Plantronics, Inc., a Delaware corporation, do hereby constitute and appoint Joe Burton and Pamela Strayer, or either of them, the lawful attorney-in-fact, with full power of substitution, for him in any and all capacities, to sign any amendments to this report on Form 10-K and to file the same, with exhibits thereto and other documents in connection therewith, with the Securities and Exchange Commission, hereby ratifying and confirming all that said attorney-in-fact or his substitute or substitutes may do or cause to be done by virtue hereof.
Pursuant to the requirements of the Securities Exchange Act of 1934, this report has been signed below by the following persons on behalf of the Registrant and in the capacities and on the dates indicated.
Signature | Title | Date |
/s/ Joe Burton | ||
(Joe Burton) | President, Chief Executive Officer and Director (Principal Executive Officer) | May 9, 2018 |
/s/ Pamela Strayer | ||
(Pamela Strayer) | Senior Vice President and Chief Financial Officer (Principal Financial Officer and Principal Accounting Officer) | May 9, 2018 |
/s/ Robert Hagerty | ||
(Robert Hagerty) | Chairman of the Board and Director | May 9, 2018 |
/s/ Marv Tseu | ||
(Marv Tseu) | Vice Chairman of the Board and Director | May 9, 2018 |
/s/ Brian Dexheimer | ||
(Brian Dexheimer) | Director | May 9, 2018 |
/s/ Gregg Hammann | ||
(Gregg Hammann) | Director | May 9, 2018 |
/s/ John Hart | ||
(John Hart) | Director | May 9, 2018 |
/s/ Marshall Mohr | ||
(Marshall Mohr) | Director | May 9, 2018 |
/s/ Guido Karel Maria Jouret | ||
(Guido Karel Maria Jouret) | Director | May 9, 2018 |
84
EXHIBITS INDEX
Incorporation by Reference | ||||||||||||
Exhibit Number | Exhibit Description | Form | File No. | Exhibit | Filing Date | Filed Herewith | ||||||
8-K | 001-12696 | 2.1 | 3/28/2018 | |||||||||
8-K | 001-12696 | 3(i) | 1/20/2009 | |||||||||
8-K | 001-12696 | 3.1 | 6/20/2011 | |||||||||
8-K | 001-12696 | 4.1 | 6/3/2015 | |||||||||
8-K | 001-12696 | 4.2 | 6/3/2015 | |||||||||
10-K | 001-12696 | 10.2 | 5/31/2005 | |||||||||
8-K | 001-12696 | 10.2 | 8/4/2017 | |||||||||
8-K | 001-12696 | 10.1 | 8/4/2017 | |||||||||
8-K | 001-12696 | 10.1 | 8/8/2016 | |||||||||
S-8 | 333-19351 | 4.6 | 3/25/1997 | |||||||||
S-8 | 333-19351 | 4.7 | 3/25/1997 | |||||||||
S-8 | 333-188868 | 4.1 | 5/24/2013 | |||||||||
8-K | 001-12696 | 10.2 | 8/2/2016 | |||||||||
8-K/A | 001-12696 | 10.1 | 8/8/2012 | |||||||||
10-K | 001-12696 | 10.11 | 5/10/2017 | |||||||||
10-K | 001-12696 | 10.12 | 5/10/2017 | |||||||||
10-Q | 001-12696 | 10.1 | 10/31/2017 | |||||||||
10-Q | 001-12696 | 10.1 | 7/29/2014 | |||||||||
10-K | 001-12696 | 10.13.6 | 5/26/2009 | |||||||||
8-K | 001-12696 | 10.1 | 5/1/2017 | |||||||||
8-K | 001-12696 | 10.2 | 5/1/2017 | |||||||||
10-Q | 001-12696 | 10.1 | 2/2/2012 | |||||||||
8-K | 001-12696 | 10.2 | 5/26/2015 | |||||||||
X | ||||||||||||
X | ||||||||||||
24.1 | Power of Attorney – Power of Attorney (incorporated by reference to the signature page of this Annual Report on Form 10-K.) | |||||||||||
X | ||||||||||||
X | ||||||||||||
X | ||||||||||||
101 INS | XBRL Instance Document | X | ||||||||||
101 SCH | XBRL Taxonomy Extension Schema Document | X | ||||||||||
101 CAL | XBRL Taxonomy Extension Calculation Linkbase Document | X | ||||||||||
101 LAB | XBRL Taxonomy Extension Label Linkbase Document | X | ||||||||||
101 PRE | XBRL Taxonomy Extension Presentation Linkbase Document | X | ||||||||||
101 DEF | XBRL Taxonomy Definition Linkbase Document | X | ||||||||||
* | Indicates a management contract or compensatory plan, contract or arrangement in which any Director or any Executive Officer participates. | |||||||||||
** | Confidential treatment has been granted with respect to certain portions of this Exhibit. | |||||||||||
85
86