Attached files
| file | filename |
|---|---|
| 8-K - 8-K - Professional Holding Corp. | pfhd-20200515x8k.htm |
| EX-99.1 - EX-99.1 - Professional Holding Corp. | pfhd-20200515xex99d1.htm |
Exhibit 99.2
| FIRST QUARTER 2020 EARNINGS PRESENTATION PAGE 1 EARNINGS PRESENTATION FIRST QUARTER 2020 PFHD:NASDAQ |

| FIRST QUARTER 2020 EARNINGS PRESENTATION PAGE 2 FORWARD LOOKING STATEMENTS ! This slide presentation contains forward-looking statements involving significant risks and uncertainties. Several important factors could cause actual results to differ materially from those in the forward- looking statements. Those factors include the duration and extent of the COVID-19 pandemic, general economic and financial market conditions, potential business uncertainties as we integrate Marquis Bancorp (MBI) into our operations, expectations concerning and the actual timing and amount of interest rate movements, competition, our ability to execute business plans, geopolitical developments, legislative and regulatory developments, inflation or deflation, market fluctuations, natural disasters (including pandemics such as COVID-19), critical accounting estimates, and other factors listed in our Form 10-K for the year ended December 31, 2019 and other filings with the Securities and Exchange Commission. The Company disclaims any obligations to update any such factors or to publicly announce the results of any revisions to any of the forward-looking statements included herein to reflect future events or developments or changes in expectations, except as may be required by law. |
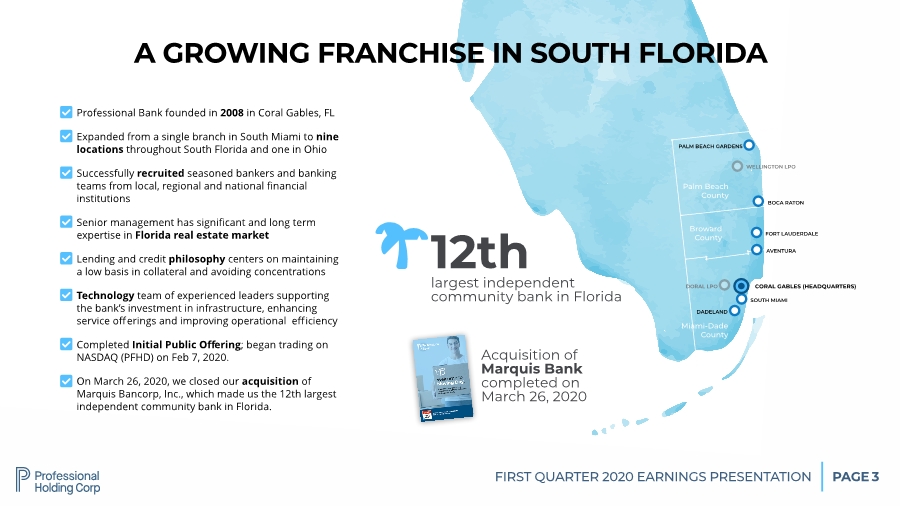
| FIRST QUARTER 2020 EARNINGS PRESENTATION PAGE CORAL GABLES (HEADQUARTERS) SOUTH MIAMI FORT LAUDERDALE BOCA RATON WELLINGTON LPO DADELAND PALM BEACH GARDENS DORAL LPO Palm Beach County Broward County Miami-Dade County 3 A GROWING FRANCHISE IN SOUTH FLORIDA 12th largest independent community bank in Florida ! Acquisition of Marquis Bank completed on March 26, 2020 Professional Bank founded in 2008 in Coral Gables, FL Expanded from a single branch in South Miami to nine locations throughout South Florida and one in Ohio Successfully recruited seasoned bankers and banking teams from local, regional and national financial institutions Senior management has significant and long term expertise in Florida real estate market Lending and credit philosophy centers on maintaining a low basis in collateral and avoiding concentrations Technology team of experienced leaders supporting the bank’s investment in infrastructure, enhancing service offerings and improving operational efficiency Completed Initial Public Offering; began trading on NASDAQ (PFHD) on Feb 7, 2020. On March 26, 2020, we closed our acquisition of Marquis Bancorp, Inc., which made us the 12th largest independent community bank in Florida. " " " " " " " " AVENTURA |
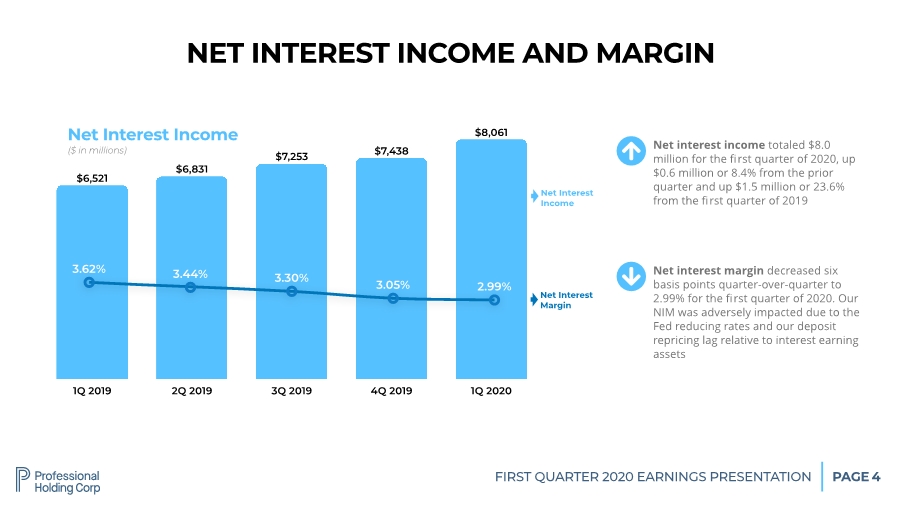
| FIRST QUARTER 2020 EARNINGS PRESENTATION PAGE 4 1Q 2019 2Q 2019 3Q 2019 4Q 2019 1Q 2020 $8,061 $7,438 $7,253 $6,831 $6,521 NET INTEREST INCOME AND MARGIN Net Interest Income ($ in millions) Net Interest Income Net Interest Margin " Net interest income totaled $8.0 million for the first quarter of 2020, up $0.6 million or 8.4% from the prior quarter and up $1.5 million or 23.6% from the first quarter of 2019 2.99% 3.05% 3.30% 3.44% 3.62% # Net interest margin decreased six basis points quarter-over-quarter to 2.99% for the first quarter of 2020. Our NIM was adversely impacted due to the Fed reducing rates and our deposit repricing lag relative to interest earning assets |
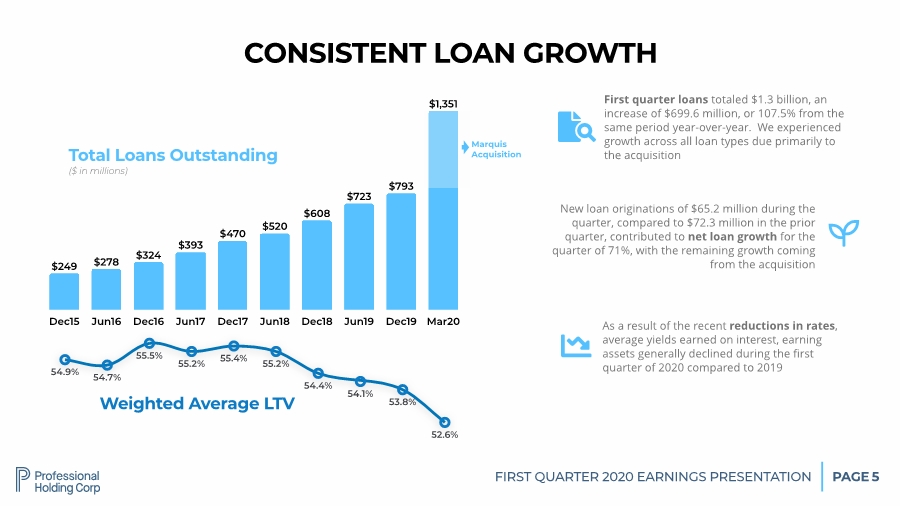
| FIRST QUARTER 2020 EARNINGS PRESENTATION PAGE 5 Dec15 Jun16 Dec16 Jun17 Dec17 Jun18 Dec18 Jun19 Dec19 Mar20 $1,351 $793 $723 $608 $520 $470 $393 $324 $278 $249 CONSISTENT LOAN GROWTH Total Loans Outstanding ($ in millions) # First quarter loans totaled $1.3 billion, an increase of $699.6 million, or 107.5% from the same period year-over-year. We experienced growth across all loan types due primarily to the acquisition 52.6% 53.8% 54.1% 54.4% 55.2% 55.4% 55.2% 55.5% 54.7% 54.9% Weighted Average LTV ! New loan originations of $65.2 million during the quarter, compared to $72.3 million in the prior quarter, contributed to net loan growth for the quarter of 71%, with the remaining growth coming from the acquisition $ As a result of the recent reductions in rates, average yields earned on interest, earning assets generally declined during the first quarter of 2020 compared to 2019 Marquis Acquisition |
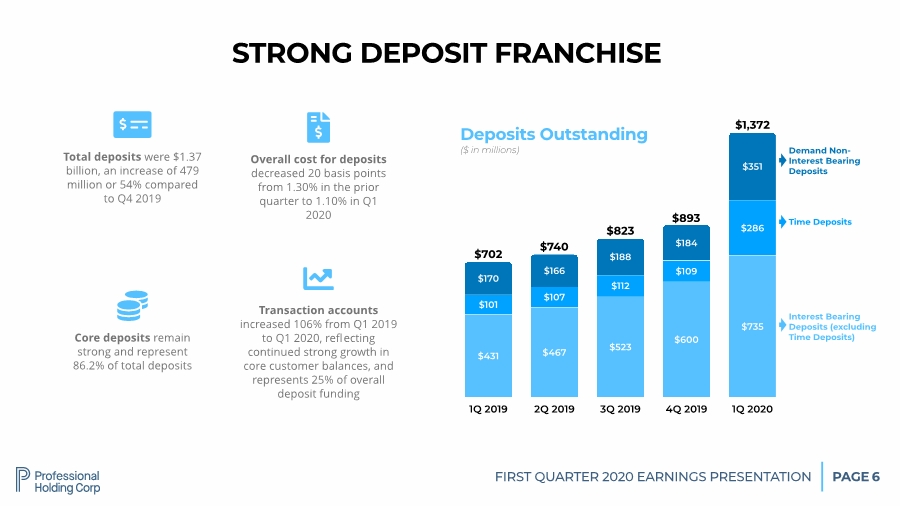
| FIRST QUARTER 2020 EARNINGS PRESENTATION PAGE 6 1Q 2019 2Q 2019 3Q 2019 4Q 2019 1Q 2020 $351 $184 $188 $166 $170 $286 $109 $112 $107 $101 $735 $600 $523 $467 $431 STRONG DEPOSIT FRANCHISE Deposits Outstanding ($ in millions) $702 $740 $823 $893 $1,372 Interest Bearing Deposits (excluding Time Deposits) Time Deposits Demand Non- Interest Bearing Deposits $ Total deposits were $1.37 billion, an increase of 479 million or 54% compared to Q4 2019 Overall cost for deposits decreased 20 basis points from 1.30% in the prior quarter to 1.10% in Q1 2020 % Core deposits remain strong and represent 86.2% of total deposits & Transaction accounts increased 106% from Q1 2019 to Q1 2020, reflecting continued strong growth in core customer balances, and represents 25% of overall deposit funding ' |
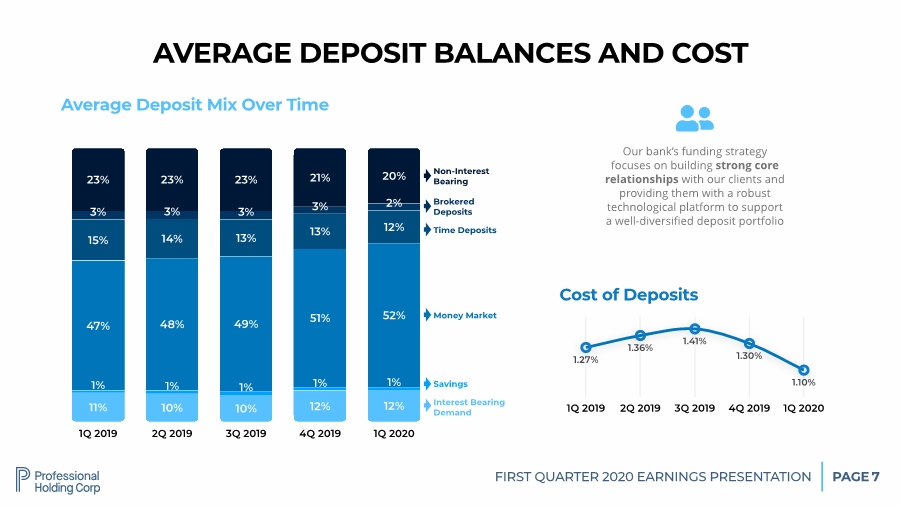
| FIRST QUARTER 2020 EARNINGS PRESENTATION PAGE 7 1Q 2019 2Q 2019 3Q 2019 4Q 2019 1Q 2020 20% 21% 23% 23% 23% 2% 3% 3% 3% 3% 12% 13% 13% 14% 15% 52% 51% 49% 48% 47% 1% 1% 1% 1% 1% 12% 12% 10% 10% 11% Average Deposit Mix Over Time Interest Bearing Demand Savings Money Market Our bank’s funding strategy focuses on building strong core relationships with our clients and providing them with a robust technological platform to support a well-diversified deposit portfolio ( 1Q 2019 2Q 2019 3Q 2019 4Q 2019 1Q 2020 1.10% 1.30% 1.41% 1.36% 1.27% Cost of Deposits Time Deposits Brokered Deposits Non-Interest Bearing AVERAGE DEPOSIT BALANCES AND COST |
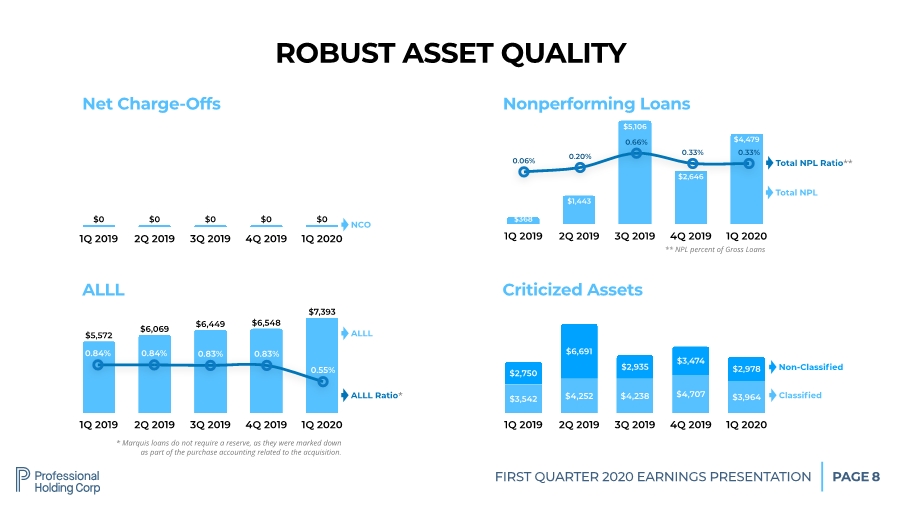
| FIRST QUARTER 2020 EARNINGS PRESENTATION PAGE 8 1Q 2019 2Q 2019 3Q 2019 4Q 2019 1Q 2020 $7,393 $6,548 $6,449 $6,069 $5,572 ALLL ALLL ALLL Ratio* 0.55% 0.83% 0.83% 0.84% 0.84% ROBUST ASSET QUALITY 1Q 2019 2Q 2019 3Q 2019 4Q 2019 1Q 2020 $0 $0 $0 $0 $0 Net Charge-Offs NCO 1Q 2019 2Q 2019 3Q 2019 4Q 2019 1Q 2020 $2,978 $3,474 $2,935 $6,691 $2,750 $3,964 $4,707 $4,238 $4,252 $3,542 Criticized Assets Classified Non-Classified 1Q 2019 2Q 2019 3Q 2019 4Q 2019 1Q 2020 $4,479 $2,646 $5,106 $1,443 $368 Nonperforming Loans Total NPL Total NPL Ratio** 0.33% 0.33% 0.66% 0.20% 0.06% * Marquis loans do not require a reserve, as they were marked down as part of the purchase accounting related to the acquisition. ** NPL percent of Gross Loans |
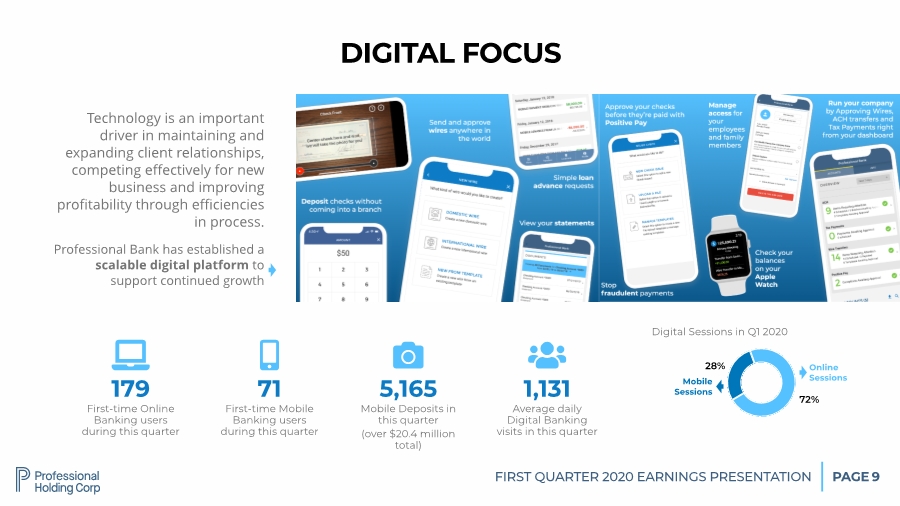
| FIRST QUARTER 2020 EARNINGS PRESENTATION PAGE 9 DIGITAL FOCUS Technology is an important driver in maintaining and expanding client relationships, competing effectively for new business and improving profitability through efficiencies in process. Professional Bank has established a scalable digital platform to support continued growth 179 First-time Online Banking users during this quarter ) 71 First-time Mobile Banking users during this quarter * 5,165 Mobile Deposits in this quarter (over $20.4 million total) + 1,131 Average daily Digital Banking visits in this quarter , 28% 72% Online Sessions Mobile Sessions Digital Sessions in Q1 2020 |
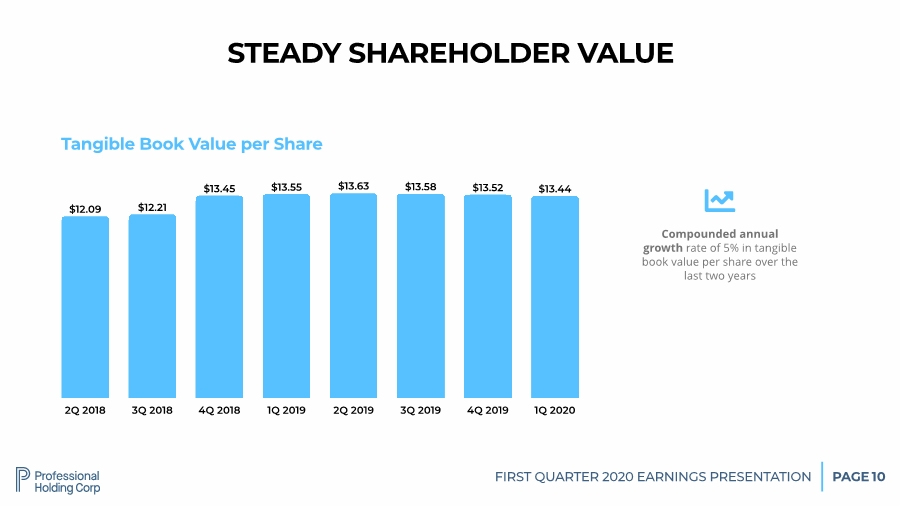
| FIRST QUARTER 2020 EARNINGS PRESENTATION PAGE 10 2Q 2018 3Q 2018 4Q 2018 1Q 2019 2Q 2019 3Q 2019 4Q 2019 1Q 2020 $13.44 $13.52 $13.58 $13.63 $13.55 $13.45 $12.21 $12.09 STEADY SHAREHOLDER VALUE Tangible Book Value per Share % Compounded annual growth rate of 5% in tangible book value per share over the last two years |
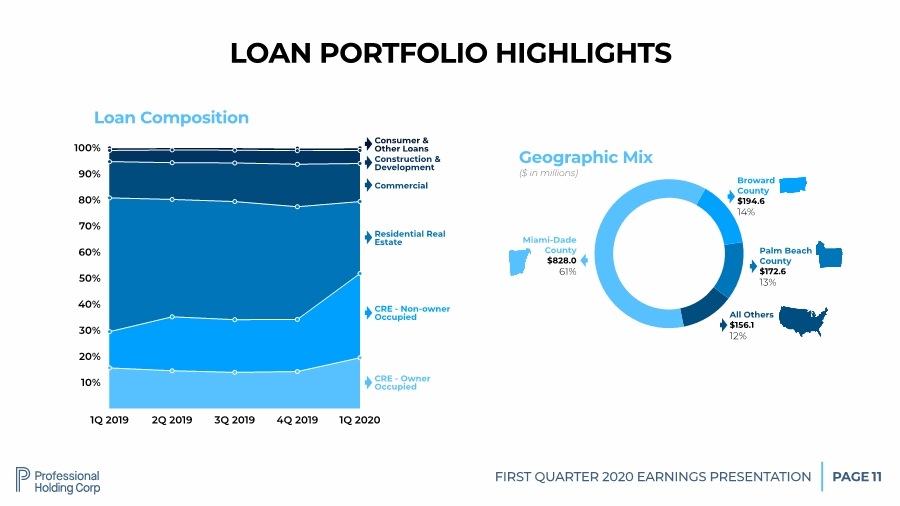
| FIRST QUARTER 2020 EARNINGS PRESENTATION PAGE 11 Geographic Mix ($ in millions) Miami-Dade County $828.0 61% Broward County $194.6 14% Palm Beach County $172.6 13% LOAN PORTFOLIO HIGHLIGHTS 10% 20% 30% 40% 50% 60% 70% 80% 90% 100% 1Q 2019 2Q 2019 3Q 2019 4Q 2019 1Q 2020 Loan Composition CRE - Owner Occupied CRE - Non-owner Occupied Residential Real Estate Commercial Construction & Development Consumer & Other Loans All Others $156.1 12% |
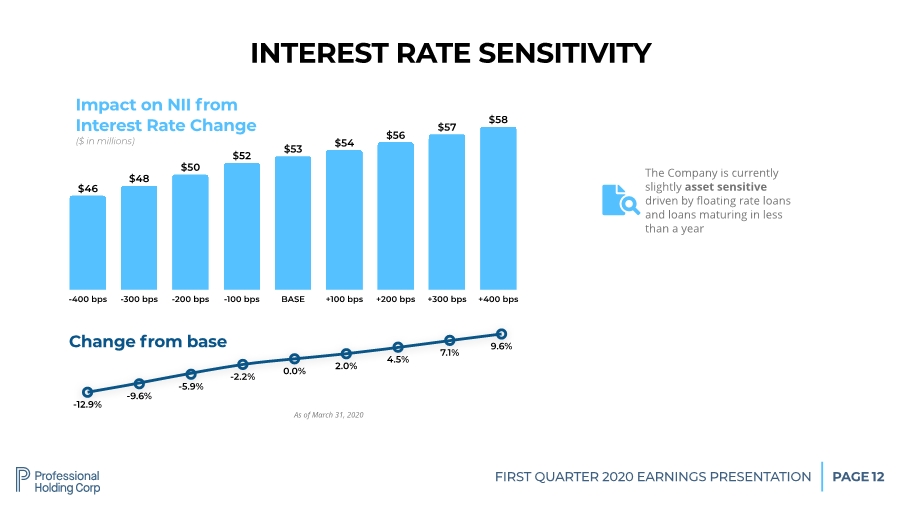
| FIRST QUARTER 2020 EARNINGS PRESENTATION PAGE 12 -400 bps -300 bps -200 bps -100 bps BASE +100 bps +200 bps +300 bps +400 bps $58 $57 $56 $54 $53 $52 $50 $48 $46 INTEREST RATE SENSITIVITY Impact on NII from Interest Rate Change ($ in millions) # The Company is currently slightly asset sensitive driven by floating rate loans and loans maturing in less than a year 9.6% 7.1% 4.5% 2.0% 0.0% -2.2% -5.9% -9.6% -12.9% Change from base As of March 31, 2020 |
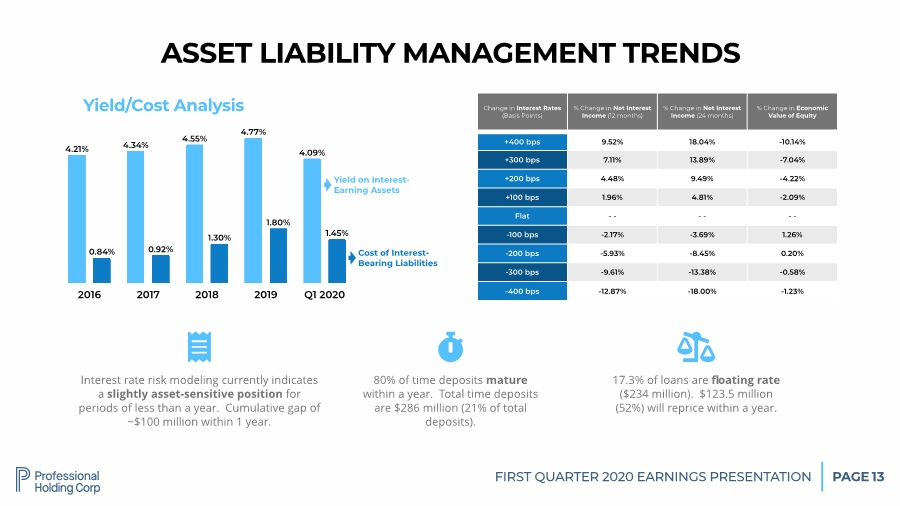
| FIRST QUARTER 2020 EARNINGS PRESENTATION PAGE 13 Interest rate risk modeling currently indicates a slightly asset-sensitive position for periods of less than a year. Cumulative gap of ~$100 million within 1 year. & ASSET LIABILITY MANAGEMENT TRENDS 17.3% of loans are floating rate ($234 million). $123.5 million (52%) will reprice within a year. ' 80% of time deposits mature within a year. Total time deposits are $286 million (21% of total deposits). ( 2016 2017 2018 2019 Q1 2020 1.45% 1.80% 1.30% 0.92% 0.84% 4.09% 4.77% 4.55% 4.34% 4.21% Yield/Cost Analysis Yield on Interest- Earning Assets Cost of Interest- Bearing Liabilities Change in Interest Rates (Basis Points) % Change in Net Interest Income (12 months) % Change in Net Interest Income (24 months) % Change in Economic Value of Equity +400 bps 9.52% 18.04% -10.14% +300 bps 7.11% 13.89% -7.04% +200 bps 4.48% 9.49% -4.22% +100 bps 1.96% 4.81% -2.09% Flat - - - - - - -100 bps -2.17% -3.69% 1.26% -200 bps -5.93% -8.45% 0.20% -300 bps -9.61% -13.38% -0.58% -400 bps -12.87% -18.00% -1.23% |
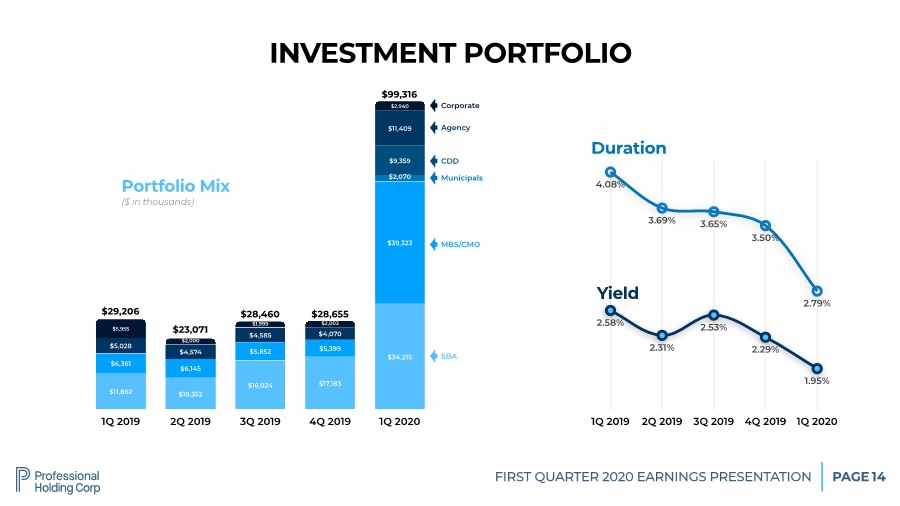
| FIRST QUARTER 2020 EARNINGS PRESENTATION PAGE 14 1Q 2019 2Q 2019 3Q 2019 4Q 2019 1Q 2020 $2,940 $2,003 $1,999 $2,000 $5,955 $11,409 $4,070 $4,585 $4,574 $5,028 $9,359 $2,070 $39,323 $5,399 $5,852 $6,145 $6,361 $34,215 $17,183 $16,024 $10,352 $11,862 Portfolio Mix ($ in thousands) SBA MBS/CMO Municipals CDD Agency INVESTMENT PORTFOLIO 1Q 2019 2Q 2019 3Q 2019 4Q 2019 1Q 2020 1.95% 2.29% 2.53% 2.31% 2.58% 2.79% 3.50% 3.65% 3.69% 4.08% Yield Duration Corporate $29,206 $23,071 $28,460 $28,655 $99,316 |
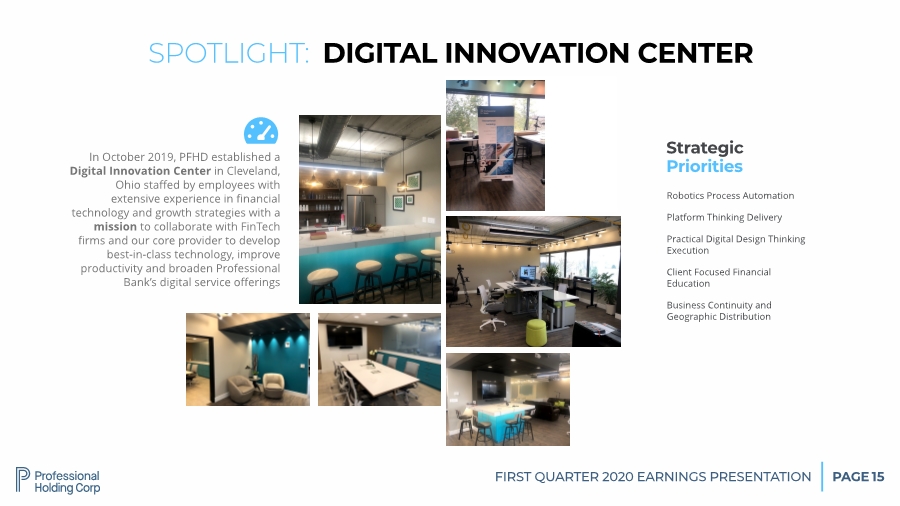
| FIRST QUARTER 2020 EARNINGS PRESENTATION PAGE Professional Bank’s new Digital Innovation Center is designed as a flexible space to test new technologies, craft user experiences and push the boundaries of financial innovation. 15 SPOTLIGHT: DIGITAL INNOVATION CENTER Robotics Process Automation Platform Thinking Delivery Practical Digital Design Thinking Execution Client Focused Financial Education Business Continuity and Geographic Distribution Strategic Priorities In October 2019, PFHD established a Digital Innovation Center in Cleveland, Ohio staffed by employees with extensive experience in financial technology and growth strategies with a mission to collaborate with FinTech firms and our core provider to develop best-in-class technology, improve productivity and broaden Professional Bank’s digital service offerings ) |
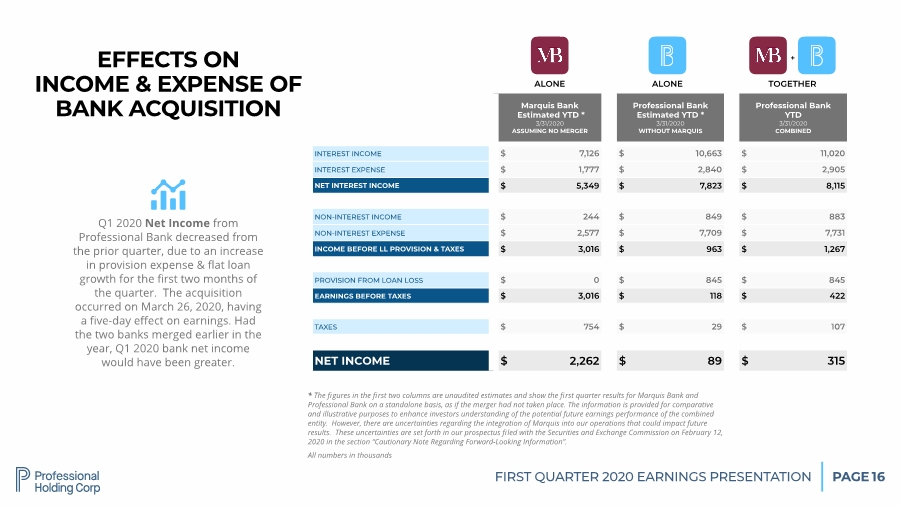
| FIRST QUARTER 2020 EARNINGS PRESENTATION PAGE 16 EFFECTS ON INCOME & EXPENSE OF BANK ACQUISITION Marquis Bank Estimated YTD * 3/31/2020 ASSUMING NO MERGER Professional Bank Estimated YTD * 3/31/2020 WITHOUT MARQUIS Professional Bank YTD 3/31/2020 COMBINED INTEREST INCOME $ 7,126 $ 10,663 $ 11,020 INTEREST EXPENSE $ 1,777 $ 2,840 $ 2,905 NET INTEREST INCOME $ 5,349 $ 7,823 $ 8,115 NON-INTEREST INCOME $ 244 $ 849 $ 883 NON-INTEREST EXPENSE $ 2,577 $ 7,709 $ 7,731 INCOME BEFORE LL PROVISION & TAXES $ 3,016 $ 963 $ 1,267 PROVISION FROM LOAN LOSS $ 0 $ 845 $ 845 EARNINGS BEFORE TAXES $ 3,016 $ 118 $ 422 TAXES $ 754 $ 29 $ 107 NET INCOME $ 2,262 $ 89 $ 315 Q1 2020 Net Income from Professional Bank decreased from the prior quarter, due to an increase in provision expense & flat loan growth for the first two months of the quarter. The acquisition occurred on March 26, 2020, having a five-day effect on earnings. Had the two banks merged earlier in the year, Q1 2020 bank net income would have been greater. * ALONE ALONE TOGETHER + * The figures in the first two columns are unaudited estimates and show the first quarter results for Marquis Bank and Professional Bank on a standalone basis, as if the merger had not taken place. The information is provided for comparative and illustrative purposes to enhance investors understanding of the potential future earnings performance of the combined entity. However, there are uncertainties regarding the integration of Marquis into our operations that could impact future results. These uncertainties are set forth in our prospectus filed with the Securities and Exchange Commission on February 12, 2020 in the section “Cautionary Note Regarding Forward-Looking Information”. All numbers in thousands |
| OPERATIONAL RESPONSE AND BANK PREPAREDNESS COVID-19 |

| PAGE FIRST QUARTER 2020 EARNINGS PRESENTATION COVID-19 18 Implementation of critical operating functions (Deposit Operations, Treasury Management, BSA, Credit Administration, Loan Closing, Loan Operations, Compliance and Human Resources) Since March 16th, Executives and other key officers have been relocated and working from home Wire Desk operators working remotely successfully Loan closings, fundings and operations working remotely successfully Treasury Management is working remotely and onboarding clients to the digital platform, including remote RDC installations Assisted clients by waiving service charges, where applicable and in a controlled environment Successfully managed client expectations, employee requests, key vendors to the operation of the bank, and all social media outlets " OPERATIONAL RESPONSE & PREPAREDNESS " " " " " " |
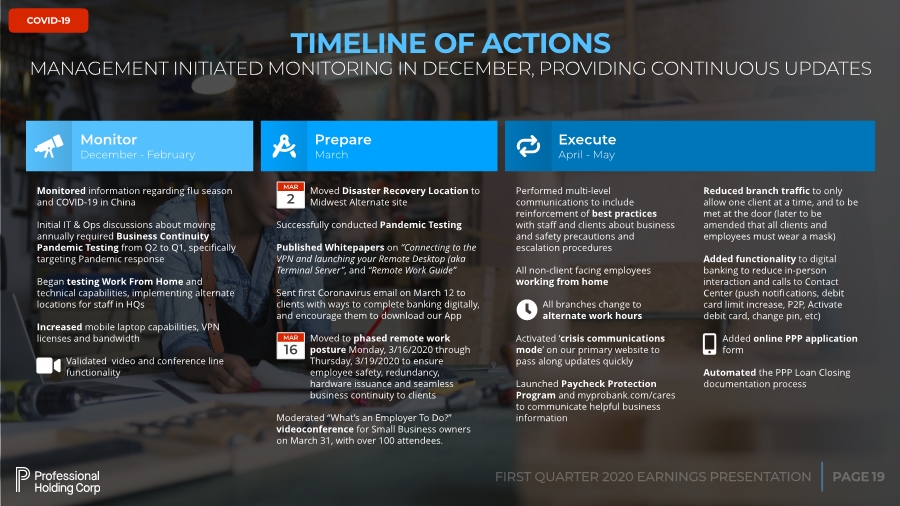
| PAGE FIRST QUARTER 2020 EARNINGS PRESENTATION COVID-19 19 TIMELINE OF ACTIONS MANAGEMENT INITIATED MONITORING IN DECEMBER, PROVIDING CONTINUOUS UPDATES Monitor December - February Prepare March Execute April - May 菉 , - Monitored information regarding flu season and COVID-19 in China Initial IT & Ops discussions about moving annually required Business Continuity Pandemic Testing from Q2 to Q1, specifically targeting Pandemic response Began testing Work From Home and technical capabilities, implementing alternate locations for staff in HQs Increased mobile laptop capabilities, VPN licenses and bandwidth Validated video and conference line functionality Moved Disaster Recovery Location to Midwest Alternate site Successfully conducted Pandemic Testing Published Whitepapers on “Connecting to the VPN and launching your Remote Desktop (aka Terminal Server”, and “Remote Work Guide” Sent first Coronavirus email on March 12 to clients with ways to complete banking digitally, and encourage them to download our App Moved to phased remote work posture Monday, 3/16/2020 through Thursday, 3/19/2020 to ensure employee safety, redundancy, hardware issuance and seamless business continuity to clients Moderated “What’s an Employer To Do?” videoconference for Small Business owners on March 31, with over 100 attendees. 2 MAR Performed multi-level communications to include reinforcement of best practices with staff and clients about business and safety precautions and escalation procedures All non-client facing employees working from home All branches change to alternate work hours Activated ‘crisis communications mode’ on our primary website to pass along updates quickly Launched Paycheck Protection Program and myprobank.com/cares to communicate helpful business information Reduced branch traffic to only allow one client at a time, and to be met at the door (later to be amended that all clients and employees must wear a mask) Added functionality to digital banking to reduce in-person interaction and calls to Contact Center (push notifications, debit card limit increase, P2P, Activate debit card, change pin, etc) Added online PPP application form Automated the PPP Loan Closing documentation process 16 MAR - * . |
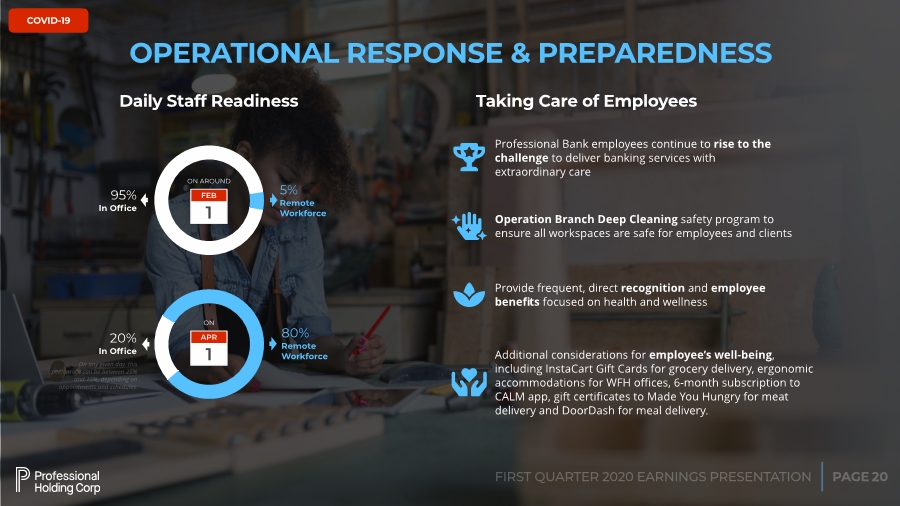
| PAGE FIRST QUARTER 2020 EARNINGS PRESENTATION COVID-19 20 Daily Staff Readiness 5% Remote Workforce 95% In Office OPERATIONAL RESPONSE & PREPAREDNESS . Professional Bank employees continue to rise to the challenge to deliver banking services with extraordinary care Taking Care of Employees 諾 Operation Branch Deep Cleaning safety program to ensure all workspaces are safe for employees and clients 0 Provide frequent, direct recognition and employee benefits focused on health and wellness 1 Additional considerations for employee’s well-being, including InstaCart Gift Cards for grocery delivery, ergonomic accommodations for WFH offices, 6-month subscription to CALM app, gift certificates to Made You Hungry for meat delivery and DoorDash for meal delivery. 1 FEB ON AROUND 1 APR ON On any given day, this percentage can be between 25% and 15%, depending on appointments and schedules. 80% Remote Workforce 20% In Office |
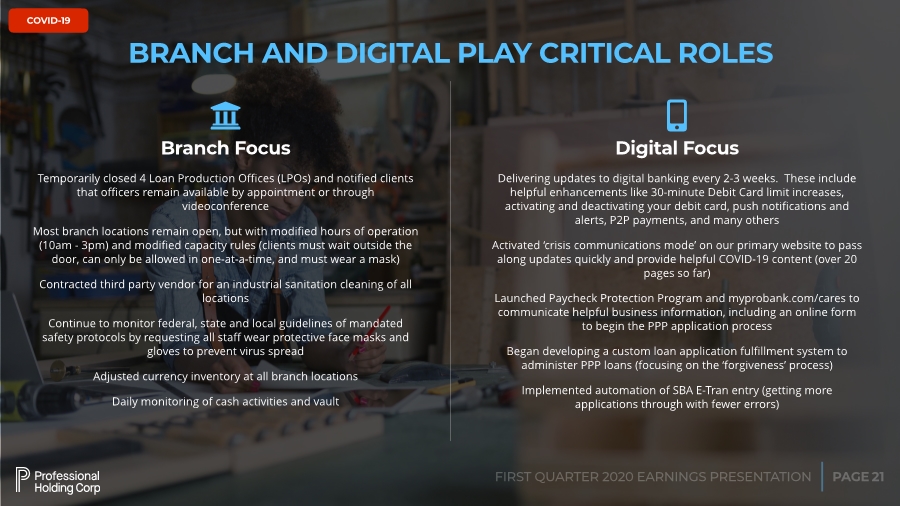
| PAGE FIRST QUARTER 2020 EARNINGS PRESENTATION COVID-19 21 BRANCH AND DIGITAL PLAY CRITICAL ROLES 2 Temporarily closed 4 Loan Production Offices (LPOs) and notified clients that officers remain available by appointment or through videoconference Most branch locations remain open, but with modified hours of operation (10am - 3pm) and modified capacity rules (clients must wait outside the door, can only be allowed in one-at-a-time, and must wear a mask) Contracted third party vendor for an industrial sanitation cleaning of all locations Continue to monitor federal, state and local guidelines of mandated safety protocols by requesting all staff wear protective face masks and gloves to prevent virus spread Adjusted currency inventory at all branch locations Daily monitoring of cash activities and vault Branch Focus Digital Focus 3 Delivering updates to digital banking every 2-3 weeks. These include helpful enhancements like 30-minute Debit Card limit increases, activating and deactivating your debit card, push notifications and alerts, P2P payments, and many others Activated ‘crisis communications mode’ on our primary website to pass along updates quickly and provide helpful COVID-19 content (over 20 pages so far) Launched Paycheck Protection Program and myprobank.com/cares to communicate helpful business information, including an online form to begin the PPP application process Began developing a custom loan application fulfillment system to administer PPP loans (focusing on the ‘forgiveness’ process) Implemented automation of SBA E-Tran entry (getting more applications through with fewer errors) |
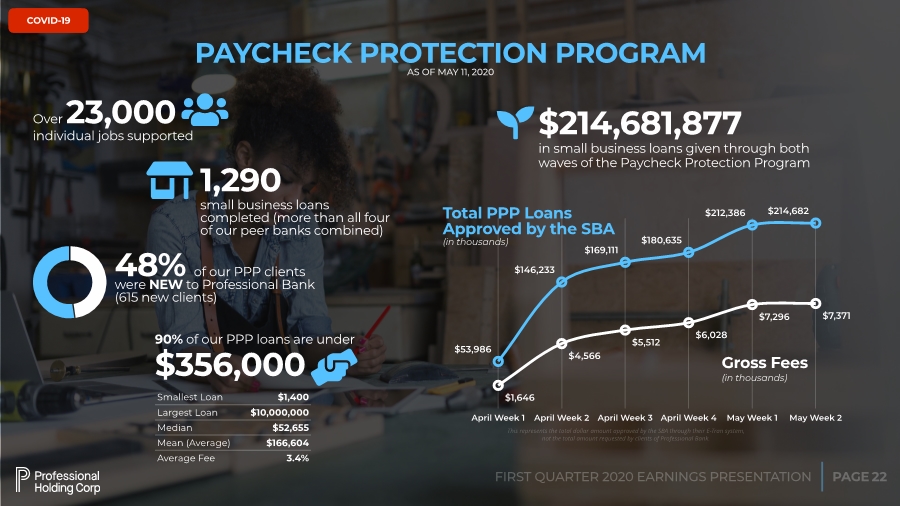
| PAGE FIRST QUARTER 2020 EARNINGS PRESENTATION COVID-19 22 Over 23,000 individual jobs supported , PAYCHECK PROTECTION PROGRAM AS OF MAY 11, 2020 1,290 small business loans completed (more than all four of our peer banks combined) / COVID-19 $214,681,877 in small business loans given through both waves of the Paycheck Protection Program 0 48% of our PPP clients were NEW to Professional Bank (615 new clients) Total PPP Loans Approved by the SBA (in thousands) $7,371 $7,296 $6,028 $5,512 $4,566 $1,646 Gross Fees (in thousands) April Week 1 April Week 2 April Week 3 April Week 4 May Week 1 May Week 2 $214,682 $212,386 $180,635 $169,111 $146,233 $53,986 This represents the total dollar amount approved by the SBA through their E-Tran system, not the total amount requested by clients of Professional Bank. 90% of our PPP loans are under $356,000 1 Smallest Loan $1,400 Largest Loan $10,000,000 Median $52,655 Mean (Average) $166,604 Average Fee 3.4% |
| PAGE FIRST QUARTER 2020 EARNINGS PRESENTATION COVID-19 23 COVID-19 I can tell you honestly, that your work impacts not only the work that we do here for our clients, but by your assistance with this program, you’ve touched our families as well. I just wanted to take a second to thank you for welcoming me to Professional Bank. It’s been refreshing to see that the best practices of the old-school banking relationships are still alive and well. After applying for and receiving a PPP loan my organization's staff and board expressed their gratitude for the effort put into getting the relief funds. My reply to the gratitude is always the same: it's really all thanks to our banker for making this happen. From the moment the application opened he was in communication with me to see the submission through. We had 24 emails between us in two days. He literally held my hand through the entire process, his email response time was light-speed, and if it weren't for his expertise in an ever-changing environment I would have been lost. If I was already impressed with the Professional team, today I am astonished! The team has gone above the call of duty during this crisis. They have not stopped and have been very responsive. I am beyond amazed and you know I don’t mince words. On behalf of myself and my team thank you for your help. I’m looking forward to a long and productive relationship with Professional Bank! I wanted to take a moment in this crazy time we are all in to say: “Thank You” for being the Bank/Banker that we built our company on, and it has been a pleasure to have the entire Professional Bank Team as our partner over the last few years. This COVID 19 pandemic will pass but it’s the support and partnerships that you have during these times that stay with us forever. I have nothing but positive comments about you and your team. You all have been available and professional. I am looking forward to a long lasting banking relationship and will refer you and your bank to all of my colleagues. Had it not been for you and your staff’s prompt and professional help I would have not been able to so rapidly obtain my payroll protection funds. You are and will be from here on my Bank for personal and professional needs. I can tell you in no uncertain terms that Professional Bank's application process and underwriting process has been better than all the other banks that family, clients or friends used. I appreciate beyond words your professionalism, efficiency and hard work! You and your team made a huge difference for our organization. Word is getting out about how terrific you guys have been. These comments were a sampling of dozens of emails received from our clients after they received their PPP Loan funds, and have been lightly edited to remove personal information and misspellings. Client Feedback Highlights PAYCHECK PROTECTION PROGRAM 4 |
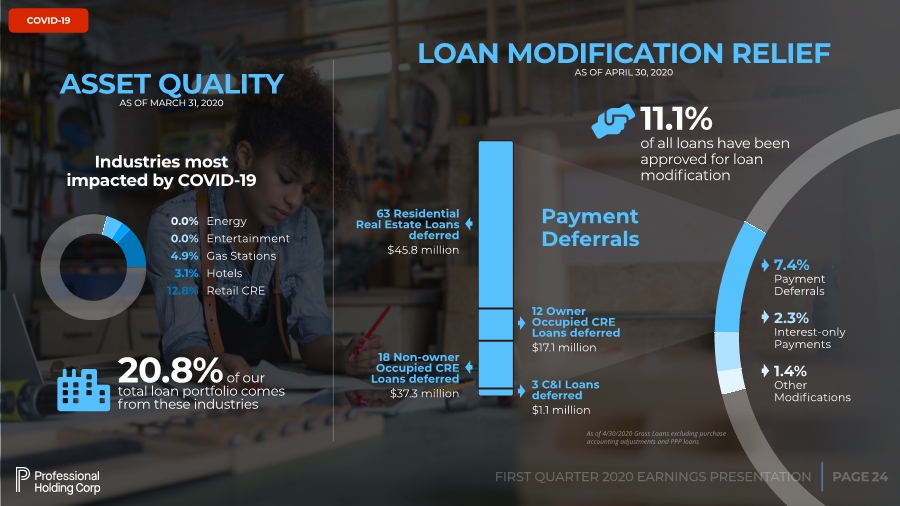
| PAGE FIRST QUARTER 2020 EARNINGS PRESENTATION COVID-19 24 ASSET QUALITY AS OF MARCH 31, 2020 Energy Entertainment Gas Stations Hotels Retail CRE Industries most impacted by COVID-19 20.8% of our total loan portfolio comes from these industries 2 0.0% 0.0% 4.9% 3.1% 12.8% 11.1% of all loans have been approved for loan modification Payment Deferrals 18 Non-owner Occupied CRE Loans deferred $37.3 million 63 Residential Real Estate Loans deferred $45.8 million 12 Owner Occupied CRE Loans deferred $17.1 million 3 C&I Loans deferred $1.1 million LOAN MODIFICATION RELIEF AS OF APRIL 30, 2020 7.4% Payment Deferrals 2.3% Interest-only Payments 1.4% Other Modifications 1 As of 4/30/2020 Gross Loans excluding purchase accounting adjustments and PPP loans |
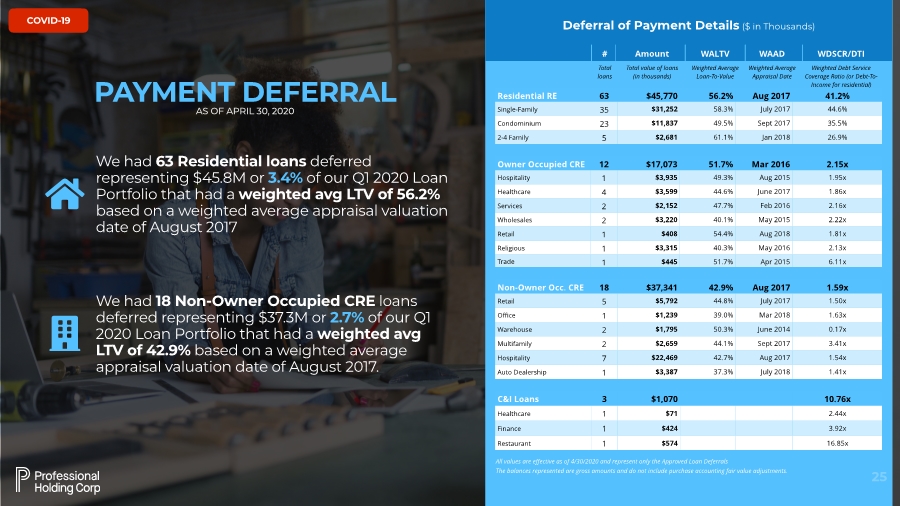
| PAGE FIRST QUARTER 2020 EARNINGS PRESENTATION COVID-19 25 C&I Loans 3 $1,070 10.76x Healthcare 1 $71 2.44x Finance 1 $424 3.92x Restaurant 1 $574 16.85x All values are effective as of 4/30/2020 and represent only the Approved Loan Deferrals The balances represented are gross amounts and do not include purchase accounting fair value adjustments. # Amount WALTV WAAD WDSCR/DTI Total loans Total value of loans (in thousands) Weighted Average Loan-To-Value Weighted Average Appraisal Date Weighted Debt Service Coverage Ratio (or Debt-To- Income for residential) Non-Owner Occ. CRE 18 $37,341 42.9% Aug 2017 1.59x Retail 5 $5,792 44.8% July 2017 1.50x Office 1 $1,239 39.0% Mar 2018 1.63x Warehouse 2 $1,795 50.3% June 2014 0.17x Multifamily 2 $2,659 44.1% Sept 2017 3.41x Hospitality 7 $22,469 42.7% Aug 2017 1.54x Auto Dealership 1 $3,387 37.3% July 2018 1.41x Owner Occupied CRE 12 $17,073 51.7% Mar 2016 2.15x Hospitality 1 $3,935 49.3% Aug 2015 1.95x Healthcare 4 $3,599 44.6% June 2017 1.86x Services 2 $2,152 47.7% Feb 2016 2.16x Wholesales 2 $3,220 40.1% May 2015 2.22x Retail 1 $408 54.4% Aug 2018 1.81x Religious 1 $3,315 40.3% May 2016 2.13x Trade 1 $445 51.7% Apr 2015 6.11x Residential RE 63 $45,770 56.2% Aug 2017 41.2% Single-Family 35 $31,252 58.3% July 2017 44.6% Condominium 23 $11,837 49.5% Sept 2017 35.5% 2-4 Family 5 $2,681 61.1% Jan 2018 26.9% Deferral of Payment Details ($ in Thousands) PAYMENT DEFERRAL AS OF APRIL 30, 2020 We had 63 Residential loans deferred representing $45.8M or 3.4% of our Q1 2020 Loan Portfolio that had a weighted avg LTV of 56.2% based on a weighted average appraisal valuation date of August 2017 3 We had 18 Non-Owner Occupied CRE loans deferred representing $37.3M or 2.7% of our Q1 2020 Loan Portfolio that had a weighted avg LTV of 42.9% based on a weighted average appraisal valuation date of August 2017. 4 |