Attached files
| file | filename |
|---|---|
| EX-99.1 - PRESS RELEASE - Vertex Energy Inc. | ex99-1.htm |
| 8-K - CURRENT REPORT - Vertex Energy Inc. | vtnr-8k_051420.htm |
Exhibit 99.2

May 14, 2020 1Q20 Conference Call

Disclaimer This document may contain forward - looking statements including words such as “may,” “can,” “could,” “should,” “predict,” “aim,” “potential,” “continue,” “opportunity,” “intend,” “goal,” “estimate,” “expect,” “expectations,” “project,” “projections,” “plans,” “anticipates,” “believe,” “think,” “confident,” “scheduled,” or similar expressions, as well as information about management’s view of Vertex Energy’s future expectations, plans and prospects, within the safe harbor provisions under the Private Securities Litigation Reform Act of 1995 . These statements involve known and unknown risks, uncertainties and other factors which may cause the results of Vertex Energy, its divisions and concepts to be materially different than those expressed or implied in such statements . These risk factors and others are included from time to time in documents Vertex Energy files with the Securities and Exchange Commission, including, but not limited to, its Form 10 - Ks, Form 10 - Qs and Form 8 - Ks , available at the SEC’s website at www . sec . gov . Other unknown or unpredictable factors also could have material adverse effects on Vertex Energy’s future results . The forward - looking statements included in this presentation are made only as of the date hereof . Vertex Energy cannot guarantee future results, levels of activity, performance or achievements . Accordingly, you should not place undue reliance on these forward - looking statements . Finally, Vertex Energy undertakes no obligation to update these statements after the date of this presentation, except as required by law, and also undertakes no obligation to update or correct information prepared by third parties that are not paid for by Vertex Energy . Industry Information Information regarding market and industry statistics contained in this presentation is based on information available to us that we believe is accurate . It is generally based on publications that are not produced for investment or economic analysis . 2

1Q20 Business Update

COVID - 19 Business Response Sufficient Liquidity On Hand, Focused on Business Continuity 4 Covid - 19 Mitigation Actions Balance Sheet Optionality Operational Continuity > We have adopted all U.S. CDC guidelines on virus - prevention to help ensure the continued welfare and safety of our employees and contractors > We have executed on business contingency plans, consistent with our emergency response protocols > At 3/31/20, we had $20.3 million in cash and available liquidity under our revolving credit facility maturing in February 2022; and we remain in compliance with all bank covenants > We have introduced targeted cost reductions, including significant reductions to full - year capital expenditures; and anticipate $1.8 million in cost savings between now and year - end 2020 > We have applied for and received approximately $4.2 million of funding under the SBA’s PPP Loan program > Our business is deemed essential critical infrastructure by the U.S. Department of Homeland Security; we remain fully operational at this time > Given reduced economic activity, travel has declined, resulting in lower availability of UMO (used motor oil), our primary feedstock > Given reduced feedstock availability, we have chosen to conduct planned maintenance at our Marrero facility that began on 5/10/20

1Q20 Performance & Outlook Executive Summary 5 1 4 6 5 Strong Operational Performance > Total UMO collections increased 12% y/y to 8.9 million gallons > Marrero and Heartland both operated at peak nameplate capacity in 1Q20 > 15% y/y increase in middle distillate (marine fuel) production at Marrero > Continued to leverage relationship with Bunker One USA Record Financial Results > Record net income to Vertex Energy of $2.8 million > Results benefited from a $4.2 million realized gain on derivatives instruments > Generated TTM free cash flow of $5.5 million vs. $2.6 million in year - ago period > Adjusted EBITDA of $1.6 million vs. ($0.5) million in 1Q19 Near - Term Strategic Priorities > Focused on growing collections to support anticipated post - COVID - 19 resumption in demand > Managing operating expenses to conserve liquidity and enhance profitability > Maintain balance sheet optionality – net cash positive at 3/31/20 Key Performance Drivers > Bunker One USA continues to purchase the entirety of our middle distillate production > Long - term base oil contracts offset near - term volatility in base oil demand/pricing > Built inventories of UMO in 4Q19 – allowed us to operate our refineries into April 2020 > Expect to see a recovery in travel exiting 2Q20, bringing additional UMO supply into the market

Key Financial Metrics First Quarter 2020 6 Total Revenues ($MM) Gross Profit ($MM) Operating Income (Loss) ($MM) Net Income (Loss) Attributable to Vertex (1) ($MM) > Gross profit margin of 25.8% in 1Q20 vs. 11.4% in 1Q19 driven by both spread and volume growth Significant Margin Growth $39.3 $36.2 $178.7 $160.2 1Q19 1Q20 TTM 1Q19 TTM 1Q20 $4.5 $9.4 $27.6 $33.5 1Q19 1Q20 TTM 1Q19 TTM 1Q20 ($2.6) $1.0 ($1.1) $0.9 1Q19 1Q20 TTM 1Q19 TTM 1Q20 ($5.0) $2.8 ($4.9) $2.7 1Q19 1Q20 TTM 1Q19 TTM 1Q20 > $7.6 million y/y improvement in profitability between 1Q19 and 1Q20 Improved Profitability (1) First quarter 2020 and TTM 1Q20 results exclude the impact of the Tensile transaction

Key Financial Metrics (Continued) First Quarter 2020 7 Adjusted EBITDA ($MM) Free Cash Flow (1) ($MM) (1) Free cash flow defined as Adjusted EBITDA less total capital expenditures in the period > Broad - based demand at both Marrero and Heartland refineries; derivative gain not included in Adj EBITDA TTM Adj. EBITDA +58% y/y > Growth in Adjusted EBITDA and continued CAPEX discipline drove the TTM increase TTM FCF +111% y/y ($0.5) $1.6 $5.7 $9.0 1Q19 1Q20 TTM 1Q19 TTM 1Q20 $2.6 $5.5 TTM 1Q19 TTM 1Q20

Exceptional Operating Performance in 1Q20 Began Extended Turnaround at Marrero on 5/10/20 8 (1) Utilization defined as total refinery throughputs divided by nameplate capacity of the refinery Marrero Refinery Capacity Utilization Rate (1) Heartland Refinery Capacity Utilization Rate (1) 96% 97% 98% 95% 1Q19 1Q20 TTM 1Q19 TTM 1Q20 100% 103% 102% 103% 1Q19 1Q20 TTM 1Q19 TTM 1Q20 > Near - record production of middle distillates in 1Q20; Bunker One USA taking 100% of production under 9 - year supply agreement Marrero Update > Base oil spread improved in the period on Group I and II+; Group III supply contracts lend stability in volatile market Heartland Update

UMO Collections Strong in 1Q20, Challenged in 2Q20 COVID - Related Decline In Travel Has Reduced Supplies of UMO at Generators 9 Total UMO Collections Solid Collections Growth in 1Q20 and on a TTM Basis (UMO Gallons in Millions) Low Gasoline Price Expected to Stimulate Travel As Shelter - In - Place Orders Are Lifted (Avg. Monthly Gasoline RBOB LA $/gal) (2) > Total direct collections increased 12% y/y to 8.9 mm gallons in 1Q20 Direct Collections > Starting to see early indications of recovery in UMO supply on the street as regional economies reopen UMO Supply Improving $0.00 $1.00 $2.00 $3.00 May-15 Oct-15 Mar-16 Aug-16 Jan-17 Jun-17 Nov-17 Apr-18 Sep-18 Feb-19 Jul-19 Dec-19 > We have moved to a charge - for - oil model in response to lower oil prices Charge - For - Oil Market 21.0 23.6 85.4 88.3 1Q19 1Q20 TTM 1Q19 TTM 1Q20 272 221 Mar-19 Apr-19 May-19 Jun-19 Jul-19 Aug-19 Sep-19 Oct-19 Nov-19 Dec-19 Jan-20 Feb-20 Mar-20 U.S. Vehicle Miles Traveled Declined Nearly 20% y/y in March 2020 (1) (Billions of Road Vehicle Miles Traveled) (1) Source: US DOT (May 2020) (2) Source: Factset

Bridging To Improved Performance Positive Spread/Volume Impact More Than Offsets SG&A and Metals 10 1Q19 vs. 1Q20 Adj. EBITDA Bridge Results Benefited From Higher Utilization at Marrero and Heartland (1) $0.5 million of y/y increase in SG&A is related to the implementation of an enterprise resource planning (ERP) solution und er the Company’s digital transformation initiative that is expected to reach completion at the end of 2Q20 (1)

MANAGEMENT OUTLOOK

Futures Strip Implies A Return To Normal By Early 3Q20 High Sulfur Fuel Oil Continues To Trade At a Discount Below WTI NYMEX 12 USGC 3% High Sulfur Fuel Oil Less West Texas Intermediate (WTI) Crude Oil ($/Barrel) High Sulfur Fuel Oil is a Proxy for UMO Price; WTI is a Proxy For Product Prices Source: CME Group (May 2020) Spreads Gradually Recover… …Stabilizing Closer Toward Long - Term Averages ($4) ($5) ($5) ($6) ($6) ($6) ($7) ($7) ($7) ($7) ($7) ($7) ($7) May-20 Jun-20 Jul-20 Aug-20 Sep-20 Oct-20 Nov-20 Dec-20 Jan-21 Feb-21 Mar-21 Apr-21 May-21

Base Oil Prices Have Tracked WTI Lower YTD 2020 Our Long - Term Base Oil Supply Contracts Help To Offset Some Volatility 13 Group 1, Group 2 Base Oil Prices vs. WTI Crude Oil (1,2) COVID - 19 Created a Short - Term Demand Shock; OPEC Production Levels Created a Short - Term Supply Shock 0% 20% 40% 60% 80% 100% 120% Apr-19 May-19 Jun-19 Jul-19 Aug-19 Sep-19 Oct-19 Nov-19 Dec-19 Jan-20 Feb-20 Mar-20 Apr-20 Group I Group II/II+ WTI Crude Oil (1) Source: Argus; Group 1 and Group 2 base oil prices are the average across all grades (2) Source: Platts
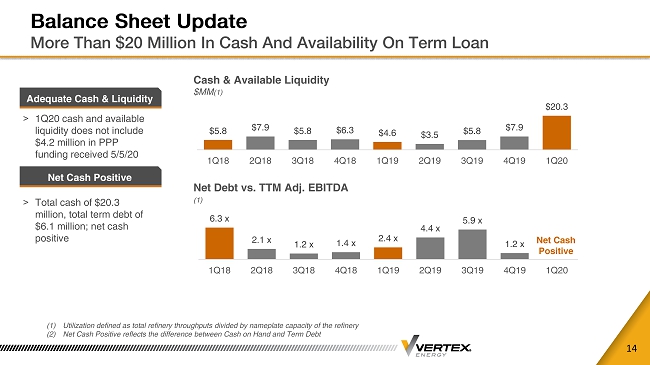
Balance Sheet Update More Than $20 Million In Cash And Availability On Term Loan 14 (1) Utilization defined as total refinery throughputs divided by nameplate capacity of the refinery (2) Net Cash Positive reflects the difference between Cash on Hand and Term Debt Cash & Available Liquidity $MM (1) Net Debt vs. TTM Adj. EBITDA (1) > 1Q20 cash and available liquidity does not include $4.2 million in PPP funding received 5/5/20 Adequate Cash & Liquidity > Total cash of $20.3 million, total term debt of $6.1 million; net cash positive Net Cash Positive $5.8 $7.9 $5.8 $6.3 $4.6 $3.5 $5.8 $7.9 $20.3 1Q18 2Q18 3Q18 4Q18 1Q19 2Q19 3Q19 4Q19 1Q20 6.3 x 2.1 x 1.2 x 1.4 x 2.4 x 4.4 x 5.9 x 1.2 x 1Q18 2Q18 3Q18 4Q18 1Q19 2Q19 3Q19 4Q19 1Q20 Net Cash Positive

Investment Catalysts Near - Term Management Focus Exiting COVID - 19 15 Return of UMO Supply Marine Fuel Demand Growth Stable Base Oil Contracts > Regional economies have begun to reopen, allowing for more road travel > Low fuel prices will support increased vehicle miles traveled > Access to UMO supply will allow us to realize economies of scale as we return the Marrero facility to normal utilization rates; The Heartland facility remains largely unaffected, given sufficient regional supply of UMO > Shipping demand remains uninterrupted, creating steady demand for our bunker oil products > Surety of off - take for the next 9 - years on all marine fuel production through our long - term bunkering partner > Global demand for base oil remains weak, but we continue to benefit from guaranteed off - take through long - term supply contracts > We are beginning to see more rational pricing in the group 3/3+ categories

APPENDIX

Corporate Overview Vertically - Integrated Specialty Refiner of Alternative Feedstocks 17 > ~100 collection trucks > Operations in 15 states > Internal collections strategy Collections Operations > Middle distillates and high - purity base oils > Marrero (LA) - Marine Fuel production > Heartland (OH) - Base oil production > Baytown (TX) – Houston ship channel terminal Refining Operations Executive Summary > Established producer of petroleum - based specialty products from recycled used motor oils and petrochemical streams > Own and operate one of the largest independent used motor oil collections (UMO) operations in the United States (1) > Produce/market IMO - compliant marine fuels, Group II & III Base Oils and fuel blend stocks for industrial applications > Proven track record of safe, reliable operations that optimize utilization at owned production facilities > Major ongoing capital projects offer potential to increase production of high - value specialty products > Experienced management team w/ high insider ownership (1) Vertex Energy owns/operates one of the largest used motor oil (UMO) collection and aggregation networks in the United Sta tes

Used Motor Oil Recycling Value Chain Direct and Third - Party UMO Collections Used As Refining Feedstock 18 UMO Generators Collectors Aggregators Processors Consumers Oil Change Shops, Car Dealerships 1.3 billion gal/ yr U.S. – fragmented industry Collect UMO to self - process or for sale Refined into higher - value finished products Consume middle distillates, base oils

We Own Advantaged Refining Assets In Strategic Markets Vertically Integrated Model Processes Collected UMO as Feedstock 19 > 4,800 bpd nameplate capacity > Feedstock: UMO > Production: Middle distillates > Opportunity: Demand for IMO - compliant marine fuel Marrero Refinery Marrero, Louisiana > 1,500 bpd nameplate capacity > Feedstock: UMO > Production: Group II+ base oil > Opportunity: Global transition to higher - purity base oils Heartland Refinery Columbus, Ohio > Waterfront facility w/ 100,000 barrels of storage on - site > Refining supply / distribution > Strategically located on the Houston ship channel Baytown Terminal Baytown, Texas Refining Operations Overview > Direct and third - party collections of UMO provide the feedstock for both Marrero and Heartland > Marrero and Heartland operating near peak utilization given strong demand for middle distillates and Group II base oils > Production slate includes middle distillates, base oils, asphalt, condensate and fuel oil (1) (bpd) barrels per day

We Are Focused On High - Grading Our Production Slate Multi - Year Transition From Commodity To Branded Products 20 Realized Gross Margin Capture Product Portfolio Evolution Commodity Products Specialty Products Vacuum Gas Oil IMO Marine Fuels High Purity Base Oils Niche Lubricants

CAFE Standards Drive Demand For Higher Purity Base Oils Corporate Average Fleet Economy (CAFE) Standard Requires Lower Emissions 21 Executive Summary Drivers of Group II+/III Demand CAFE Standard Fuel Economy By Year 6% CAGR In Required MPG Fuel Economy > CAFE standard requires increased fuel economy and lower emissions > Lower viscosity lubricants yield better fuel economy and lower emissions > High purity base oils are the primary base stock for premium synthetic lubricants used in CAFE - compliant higher performance engines > Base oil production from UMO is more efficient than from crude oil > Electrification of vehicle fleet is a long - term factor, but not material to the forecast until after 2030 North American Base Oil Capacity Shift (1) Trend Toward Higher Viscosity Base Oil Capacity 2% 56% 21% 21% 6% 23% 54% 17% Re-refined Group I Group II and III Naphthenic 2008 2018 (1) Source: LNG Lubricants Industry Factbook (2018 - 2019) 35 41 55 CY 2017 CY 2021 CY 2025
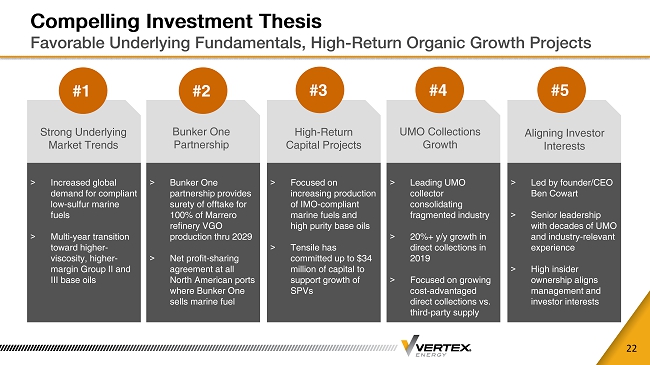
Compelling Investment Thesis Favorable Underlying Fundamentals, High - Return Organic Growth Projects 22 > Increased global demand for compliant low - sulfur marine fuels > Multi - year transition toward higher - viscosity, higher - margin Group II and III base oils Strong Underlying Market Trends > Bunker One partnership provides surety of offtake for 100% of Marrero refinery VGO production thru 2029 > Net profit - sharing agreement at all North American ports where Bunker One sells marine fuel Bunker One Partnership > Leading UMO collector consolidating fragmented industry > 20%+ y/y growth in direct collections in 2019 > Focused on growing cost - advantaged direct collections vs. third - party supply UMO Collections Growth > Focused on increasing production of IMO - compliant marine fuels and high purity base oils > Tensile has committed up to $34 million of capital to support growth of SPVs High - Return Capital Projects y > Led by founder/CEO Ben Cowart > Senior leadership with decades of UMO and industry - relevant experience > High insider ownership aligns management and investor interests Aligning Investor Interests #1 #2 #3 #4 #5

Our Strategic Focus Path Toward Profitable Growth Through The Cycle 23 > Direct collections are significantly cost - advantaged over third - party purchased collections > By increasing direct collections as % of total collections, we significantly reduce feedstock costs Drive Direct Collections Growth > Safe, reliable operations drive profitable growth > Focused on reducing feedstock overhead and reducing direct OPEX per gal sold Optimize Refining Asset Base > Shift from production of commodity intermediates toward higher value finished products > Be recognized as leading producer of IMO compliant marine fuel and high - purity base oils High - Grade Production Slate Identify high - return organic growth projects within existing asset base Partner with one or more venture investors on a project by project basis to support project CAPEX Growth CAPEX / Private Funding y > Generate Adj. EBITDA growth – use free cash flow to maintain conservative net leverage profile > Continue to diversify EBITDA across end - markets, geographies and customers Profitable Growth Through Cycle