Attached files
| file | filename |
|---|---|
| EX-99.1 - PRESS RELEASE - LHC Group, Inc | exh_991.htm |
| 8-K - FORM 8-K - LHC Group, Inc | f8k_050720.htm |
Exhibit 99.2
Supplemental Financial Information First Quarter Ended March 31, 2020 May 7, 2020

Forward - Looking Statements This presentation contains “forward - looking statements” (as defined in the Securities Litigation Reform Act of 1995 ) regarding, among other things, future events or the future financial performance of the Company . Words such as “anticipate,” “expect,” “project,” “intend,” “believe,” “will,” “estimate,” “may,” “could,” “should,” “outlook,” and “guidance” and words and terms of similar substance used in connection with any discussion of future plans, actions, events or results identify forward - looking statements . Forward - looking statements are based on information currently available to the Company and involve estimates, expectations and p rojections. Investors are cautioned that all such forward - looking statements are subject to risks and uncertainties that could cause actual events or results to differ materially from th e events or results described in the forward - looking statements, including, but not limited to, the risks and uncertainties related to the COVID - 19 pandemic and those otherwise described in our filings with the Securities and Exchange Commission, including our most recent Annual Report on Form 10 - K and subsequent Quarterly Reports on Form 10 - Q and Current Reports on Form 8 - K. Many o f these risks, uncertainties and assumptions are beyond the Company’s ability to control or predict. Because of these risks, uncertainties and assumptions, investors should not plac e u ndue reliance on these forward - looking statements. Non - GAAP Financial Information This presentation includes certain financial measures that were not prepared in accordance with U . S . generally accepted accounting principles (“GAAP”), including EBITDA and Adjusted EBITDA . The company uses these non - GAAP financial measures in operating its business because management believes they are less susceptible to variances in actual operating performance that can result from the excluded items . The company presents these financial measures to investors because they believe they are useful to investors in evaluating the primary factors that drive the company's operating performance . The items excluded from these non - GAAP measures are important in understanding LHC Group’s financial performance, and any non - GAAP measures presented should not be considered in isolation of, or as an alternative to, GAAP financial measures . Since these non - GAAP financial measures are not measures determined in accordance with GAAP, have no standardized meaning prescribed by GAAP and are susceptible to varying calculations, these measures, as presented, may not be comparable to other similarly titled measures of other companies . EBITDA of LHC Group is defined as net income (loss) before income tax benefit (expense), interest expense, and depreciation and amortization expense . Adjusted EBITDA of LHC Group is defined as net income (loss) before income tax expense benefit (expense), depreciation and amortization expense, and transaction costs related to previous transactions . 2 Please visit the Investors section on our website at Investor.LHCgroup.com for additional information on LHC Group and the industry. Nasdaq: LHCG
Table of Contents 3 Company overview ………………………………………………………………………… .................... … 4 - 5 COVID - 19 Update ……………………………………………………………… .. ……………………… .......... 6 - 9 Consolidated results ……………………………………………………………… ........................ … .. 10 - 11 Adjustments to net income …………………………………………………………………………… ......... 12 Segment results …………………………………………………………………………………………… ..... 13 - 18 Quality data………………………………………………………………………………………………….…….….19 Debt and liquidity metrics……………………………………………………………………………………...20 Focus for 2020………………………………………………………………………………………………….….…21 Non - GAAP reconciliations……………………………………………………………………………......22 - 23
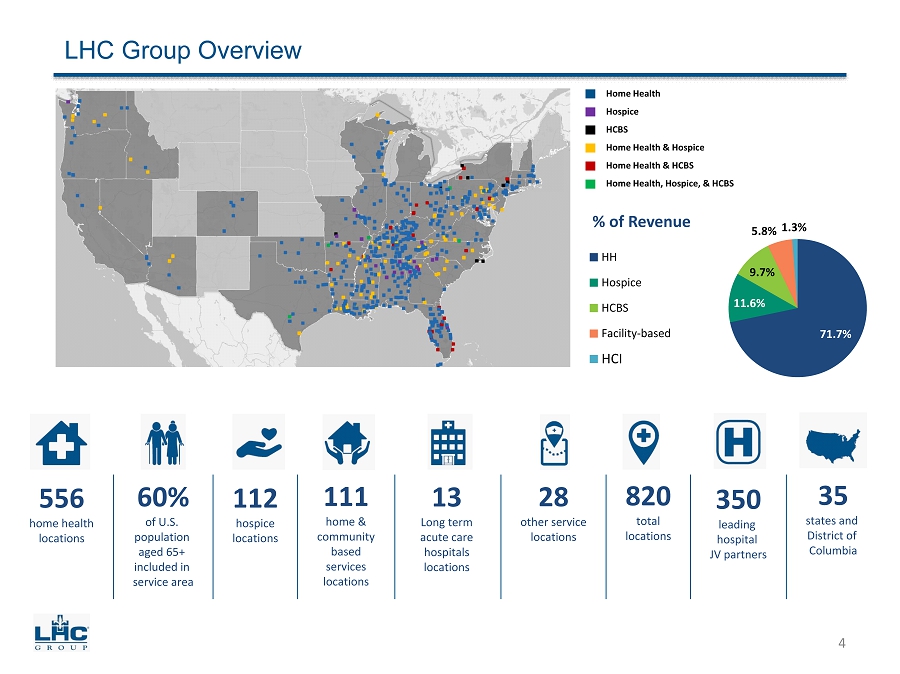
Home Health Hospice HCBS Home Health & Hospice Home Health & HCBS Home Health, Hospice, & HCBS LHC Group Overview 71.7% 11.6% 9.7% 5.8% 1.3% % of Revenue HH Hospice HCBS Facility-based HCI 4 556 home health locations 60% of U.S. population aged 65+ included in service area 112 hospice locations 111 home & community based services locations 13 Long term acute care hospitals locations 28 other service locations 820 total locations 350 leading hospital JV partners 35 states and District of Columbia
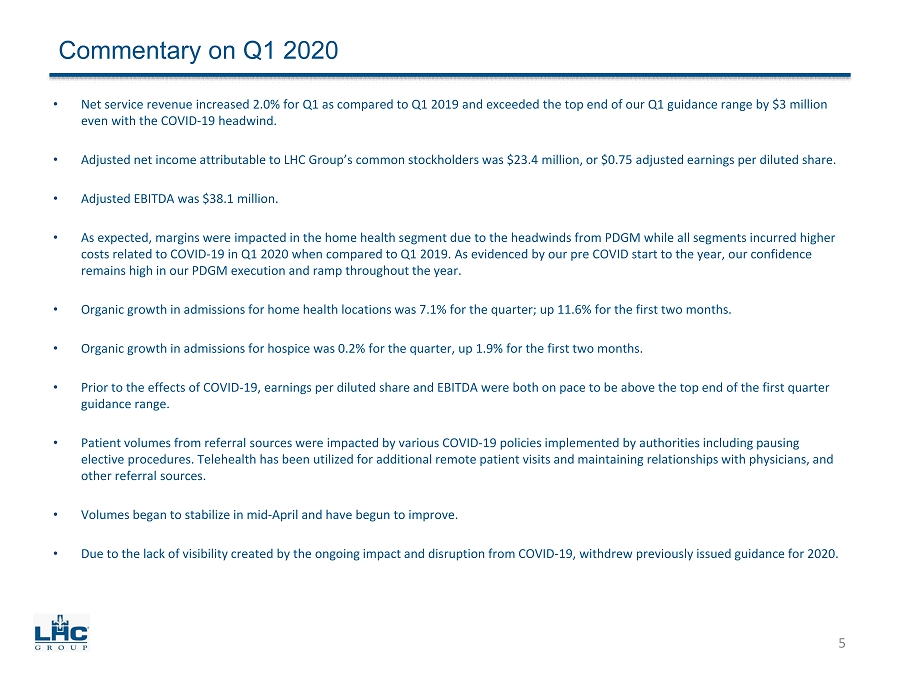
• Net service revenue increased 2.0% for Q1 as compared to Q1 2019 and exceeded the top end of our Q1 guidance range by $3 mill ion even with the COVID - 19 headwind. • Adjusted net income attributable to LHC Group’s common stockholders was $23.4 million, or $0.75 adjusted earnings per diluted sh are. • Adjusted EBITDA was $38.1 million. • As expected, margins were impacted in the home health segment due to the headwinds from PDGM while all segments incurred high er costs related to COVID - 19 in Q1 2020 when compared to Q1 2019. As evidenced by our pre COVID start to the year, our confidence remains high in our PDGM execution and ramp throughout the year. • Organic growth in admissions for home health locations was 7.1% for the quarter; up 11.6% for the first two months. • Organic growth in admissions for hospice was 0.2% for the quarter, up 1.9% for the first two months. • Prior to the effects of COVID - 19, earnings per diluted share and EBITDA were both on pace to be above the top end of the first q uarter guidance range. • Patient volumes from referral sources were impacted by various COVID - 19 policies implemented by authorities including pausing elective procedures. Telehealth has been utilized for additional remote patient visits and maintaining relationships with phy sic ians, and other referral sources. • Volumes began to stabilize in mid - April and have begun to improve. • Due to the lack of visibility created by the ongoing impact and disruption from COVID - 19, withdrew previously issued guidance fo r 2020. Commentary on Q1 2020 5

• Formed a multi - disciplinary internal COVID - 19 task force in early March to lead our response to the pandemic. • Every employee is screened daily based on CDC guidelines, and every patient (regardless of condition) is seen by a clinician with at least face mask and gloves while COVID patients (actual or suspect) are seen by a clinician with full PPE. • LHC Group successfully sourced PPE, directly and through normal channels, and has established sourcing for future orders to ensure adequate supplies. • Introduced programs to support employees, including a pandemic grant program under our 501(c)(3) LHC Group Purpose Fund, retirement plan amendments, special cash - in opportunities for accumulated paid time off, expanded offerings in our employee assistance program, and a wage supplement program for front line direct patient care - giving employees. • Implemented cost containment initiatives such as eliminating non - essential travel and expenses, select employee furloughs and workforce reduction and flex time. • Liquidity remains strong with over $385.4 million from cash and availability on the revolving credit facility. • In April 2020, we received CARES Act stimulus funds totaling $87.5 million. • On March 30, 2020, we applied for accelerated Medicare payments under the CARES Act. During April, we received funds totaling $307.6 million under this program. CMS will begin to recoup these accelerated payments beginning 120 days after receipt by the provider. • The pandemic has reinforced the preferred setting of care in the home among referring physicians, hospitals, families and patients. COVID - 19 Update 6

Pre COVID - 19 Trends Compared with Current Trends 7 Same Store Organic Admission Growth by 2020 Period over Same Period in 2019 Jan. 1 – Feb. 29 Jan. 1 – Mar. 14 Mar. 15 – Mar. 31 Apr. 1 – Apr. 15 Apr. 16 – Apr. 30 Home Health 11.6% 9.8% - 8.8% - 20.1% - 9.7% Hospice 1.9% 2.4% - 8.5% - 11.4% 1.5% Florida HH Division 15.2% 15.7% - 6.3% - 9.2% - 0.5%

Pre COVID - 19 Trends Compared with Current Trends continued 8 Weekly Home Health, Hospice and HCBS Trends COVID - 19 Period Week Ending Feb. 29, 2020 Mar. 7, 2020 Mar. 14, 2020 Mar. 21, 2020 Mar. 28, 2020 Apr. 4, 2020 Apr. 11, 2020 Apr. 18, 2020 Apr. 25, 2020 May 2, 2020 Home Health : Average weekly census 78,807 79,341 79,255 78,689 77,767 76,466 75,375 74,936 75,152 76,068 Average weekly admissions 8,904 8,419 8,277 8,071 6,979 6,172 6,257 6,169 6,634 6,700 Admission of COVID - 19 positive patients - - 59 58 76 115 219 311 468 627 Patient declined admission due to COVID - 19 concern - 51 259 336 279 225 133 89 111 52 Missed visits due to COVID - 19 - 14 412 5,984 8,585 8,332 6,837 4,627 3,117 1,937 Weekly LUPA % 8.4% 8.6% 8.7% 8.8% 10.8% 12.5% 11.2% 10.2% 10.0% 7.9% Virtual visits and Telehealth 14,320 14,400 14,163 16,984 22,159 21,990 19,487 17,881 17,154 16,533 Institutional vs Community admission 64.5% 66.4% 66.9% 70.4% 65.6% 61.4% 58.5% 57.4% 55.3% 56.1% Hospice: Hospice weekly admissions 370 367 372 376 330 350 310 350 332 382 Hospice average weekly census 4,261 4,242 4,251 4,306 4,309 4,304 4,311 4,310 4,307 4,295 HCBS: HCBS billable hours 180,118 177,150 178,541 176,850 173,108 171,042 168,755 167,820 168,065 168,710 HCBS billable hours missed due to COVID - 19 24 84 292 2,016 7,343 11,707 14,253 14,044 13,902 12,004

CARES Act Policy Implications 9 Near - term financial benefits are substantial Estimated 2020 financial impact $100 Billion Emergency Funding On April 10, 2020, LHC Group, without application, received $87.5 million from the CARES Act provider relief fund as a formulaic calculation applied to LHC Group’s 2019 Medicare fee - for - service revenue. The ability of LHC Group to retain and utilize the full $87.5 million from the relief fund will depend on the magnitude, timing and nature of the economic impact of COVID - 19 within LHC Group as well as the guidelines and rules of the federal relief program. Advanced Accelerated Payment LHC Group received funds totaling $307.6 million under the Medicare Accelerated and Advance Payment Program. The accelerated Medicare payments are interest free and the program currently requires that the Centers for Medicare and Medicaid Services (“CMS”) recoup the accelerated payments beginning 120 days after receipt by the provider, by withholding future Medicare fee - for service payments for claims until such time as the full accelerated payment has been recouped. The program currently requires Medicare Part A providers to repay the funds within 210 days of receipt. Payroll tax deferral The CARES Act permits employers to defer the deposit and payment of the employer's portion of social security taxes that otherwise would be due between March 27, 2020, and December 31, 2020. The law permits employers instead to deposit half of these deferred payments by the end of 2021 and the other half by the end of 2022. We estimate the cash benefit to us at $50 million to $55 million in 2020. Sequestration holiday The CARES Act temporarily suspends Medicare sequestration for the period of May 1 through December 31, 2020. As a result, health care providers can expect to receive an increase in fee - for - service Medicare payments by approximately 2% which we estimate to be an approximately $15 million to $20 million positive impact to revenue for us during this period. Potential benefits that could lead to new homecare policies post - COVID - 19 Nurse Practioners and Physician Assistants are permanently authorized to order and certify home health services. Nurse Practitioners and Physician Assistants can order and follow a home health plan of care and conduct face to face visits. HHS is directed to encourage the use of telehealth, including remote patient monitoring in the home. While not yet a separately reimbursed benefit, it’s a step in the right direction and gives us increased flexibilities for technology in the home. Nurse Practioners and Physician Assistants are permitted to conduct face to face recertification for hospice eligibility via telehealth. Creates greater regulatory flexibilities and greater benefit to our patients in the home.
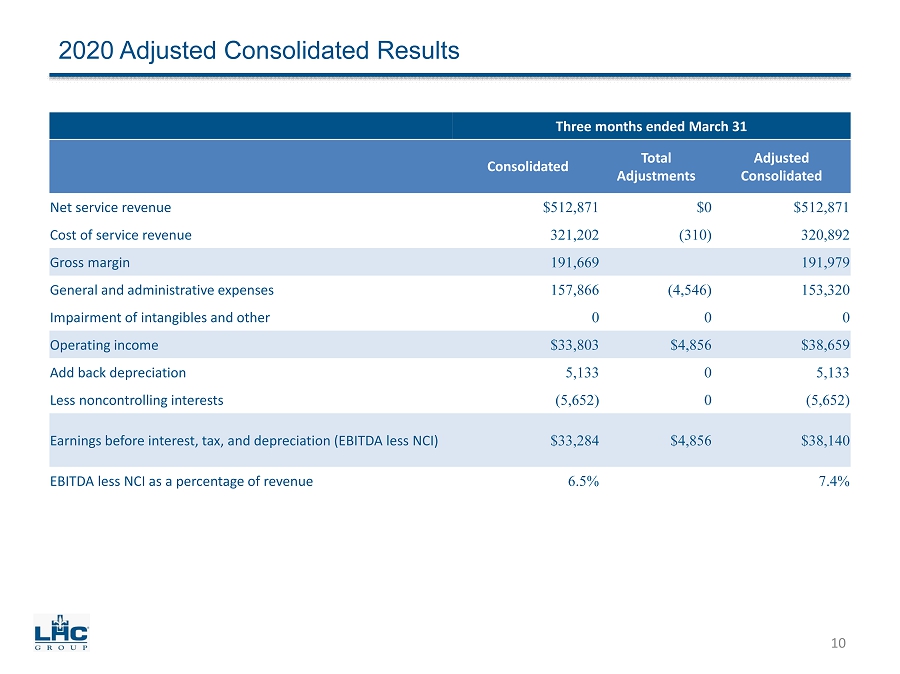
2020 Adjusted Consolidated Results Three months ended March 31 Consolidated Total Adjustments Adjusted Consolidated Net service revenue $512,871 $0 $512,871 Cost of service revenue 321,202 (310) 320,892 Gross margin 191,669 191,979 General and administrative expenses 157,866 (4,546) 153,320 Impairment of intangibles and other 0 0 0 Operating income $33,803 $4,856 $38,659 Add back depreciation 5,133 0 5,133 Less noncontrolling interests (5,652) 0 (5,652) Earnings before interest, tax, and depreciation (EBITDA less NCI) $33,284 $4,856 $38,140 EBITDA less NCI as a percentage of revenue 6.5% 7.4% 10
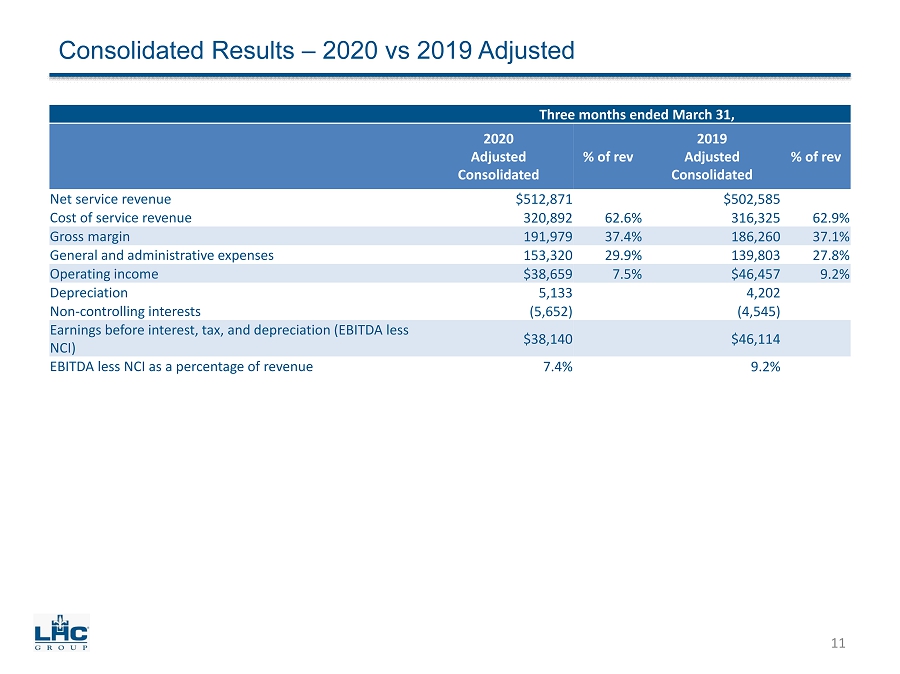
Consolidated Results – 2020 vs 2019 Adjusted Three months ended March 31, 2020 Adjusted Consolidated % of rev 2019 Adjusted Consolidated % of rev Net service revenue $512,871 $502,585 Cost of service revenue 320,892 62.6% 316,325 62.9% Gross margin 191,979 37.4% 186,260 37.1% General and administrative expenses 153,320 29.9% 139,803 27.8% Operating income $38,659 7.5% $46,457 9.2% Depreciation 5,133 4,202 Non - controlling interests (5,652) (4,545) Earnings before interest, tax, and depreciation (EBITDA less NCI) $38,140 $46,114 EBITDA less NCI as a percentage of revenue 7.4% 9.2% 11
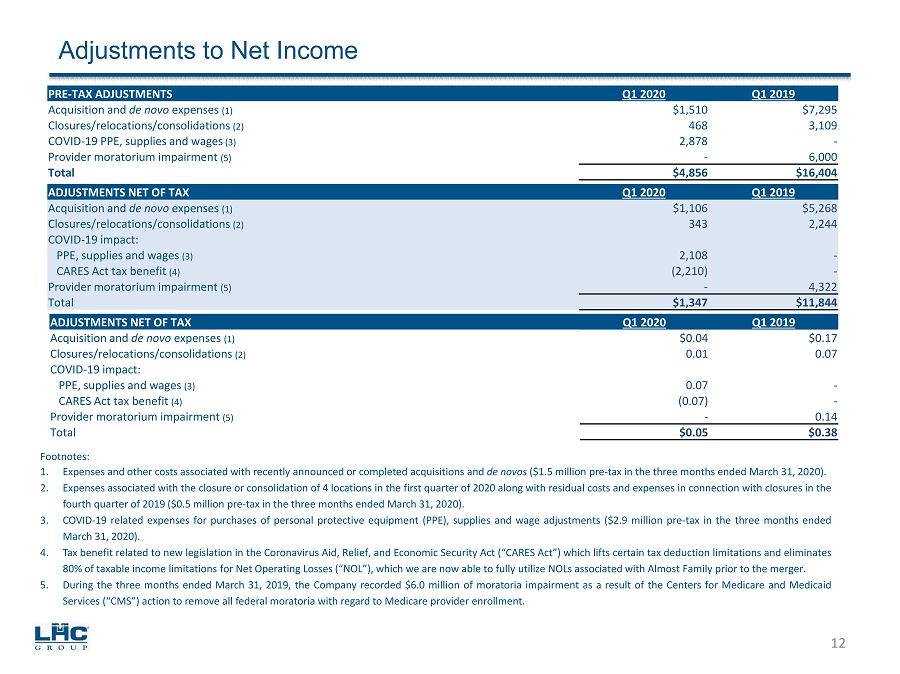
Adjustments to Net Income ADJUSTMENTS NET OF TAX Q1 2020 Q1 2019 A cquisition and de novo expenses (1) $1,106 $5,268 Closures/relocations/consolidations (2) 343 2,244 COVID - 19 impact: PPE, supplies and wages (3) 2,108 - CARES Act tax benefit (4) (2,210) - Provider moratorium impairment (5) - 4,322 Total $1,347 $11,844 12 PRE - TAX ADJUSTMENTS Q1 2020 Q1 2019 Acquisition and de novo expenses (1) $1,510 $7,295 Closures/relocations/consolidations (2) 468 3,109 COVID - 19 PPE, supplies and wages (3) 2,878 - Provider moratorium impairment (5) - 6,000 Total $4,856 $16,404 ADJUSTMENTS NET OF TAX Q1 2020 Q1 2019 A cquisition and de novo expenses (1) $0.04 $0.17 Closures/relocations/consolidations (2) 0.01 0.07 COVID - 19 impact: PPE, supplies and wages (3) 0.07 - CARES Act tax benefit (4) (0.07) - Provider moratorium impairment (5) - 0.14 Total $0.05 $0.38 Footnotes: 1. Expenses and other costs associated with recently announced or completed acquisitions and de novos ( $ 1 . 5 million pre - tax in the three months ended March 31 , 2020 ) . 2. Expenses associated with the closure or consolidation of 4 locations in the first quarter of 2020 along with residual costs and expenses in connection with closures in the fourth quarter of 2019 ( $ 0 . 5 million pre - tax in the three months ended March 31 , 2020 ) . 3. COVID - 19 related expenses for purchases of personal protective equipment (PPE), supplies and wage adjustments ( $ 2 . 9 million pre - tax in the three months ended March 31 , 2020 ) . 4. Tax benefit related to new legislation in the Coronavirus Aid, Relief, and Economic Security Act (“CARES Act”) which lifts certain tax deduction limitations and eliminates 80 % of taxable income limitations for Net Operating Losses (“NOL”), which we are now able to fully utilize NOLs associated with Almost Family prior to the merger . 5. During the three months ended March 31 , 2019 , the Company recorded $ 6 . 0 million of moratoria impairment as a result of the Centers for Medicare and Medicaid Services (“CMS”) action to remove all federal moratoria with regard to Medicare provider enrollment .

Three Months Ended March 31, 2020 Adjusted Segment Results Home health services Adjustments Adjusted Home health services Hospice services Adjustments Adjusted Hospice services HCBS services Adjustments Adjusted HCBS services Net service revenue $367,821 $367,821 $60,531 $60,531 $48,464 $48,464 Cost of service revenue 220,440 (248) 220,192 38,034 (62) 37,972 38,453 38,453 Gross margin 147,381 147,629 22,497 22,559 10,011 10,011 General and administrative expenses 116,023 (3,094) 112,929 16,626 (512) 16,114 11,459 (393) 11,066 Impairment of intangibles and other 0 0 0 0 0 0 0 0 0 Operating income $31,358 $3,342 $34,700 $5,871 $574 $6,445 ($1,448) $393 ($1,055) Add back depreciation 3,001 3,001 515 515 391 391 Less noncontrolling interests (4,606) (4,606) (967) (967) 155 155 Earnings before interest, tax, and depreciation (EBITDA less NCI) $29,753 $3,342 $33,095 $5,419 $574 $5,993 ($902) $393 ($509) EBITDA less NCI as a percentage of revenue 8.1% 9.0% 9.0% 9.9% - 1.9% - 1.0% Facility - based services Adjustments Adjusted Facility - based services HCI Adjustments Adjusted HCI services Net service revenue $29,681 $29,681 $6,374 $6,374 Cost of service revenue 20,342 20,342 3,933 3,933 Gross margin 9,339 9,339 2,441 2,441 General and administrative expenses 10,380 (547) 9,833 3,378 3,378 Impairment of intangibles and other 0 0 0 0 0 0 Operating income ($1,041) $547 ($494) ($937) $0 ($937) Add back depreciation 931 931 295 295 Less noncontrolling interests (243) (243) 9 9 Earnings before interest, tax, and depreciation (EBITDA less NCI) ($353) $547 $194 ($633) $0 ($633) EBITDA less NCI as a percentage of revenue - 1.2% 0.7% - 9.9% - 9.9% 13

Three months ended March 31, 2020 Adjusted Home Health Services % of rev 2019 Adjusted Home Health Services % of rev Net service revenue $367,821 $363,035 Cost of service revenue 220,192 59.9% 222,720 61.3% Gross margin 147,629 40.1% 140,315 38.7% General and administrative expenses 112,929 30.7% 101,190 27.9% Operating income $34,700 9.4% $39,125 10.8% Depreciation 3,001 2,403 Noncontrolling interests (4,606) (3,780) Earnings before interest, tax, and depreciation (EBITDA less NCI) $33,095 $37,748 EBITDA less NCI as a percentage of revenue 9.0% 10.4% 14 Home Health Segment Adjusted Segment Results – 2020 vs 2019 • For the three months ended March 31, 2020, consolidated Adjusted Earnings Before Interest, Taxes, Depreciation, and Amortizat ion (EBITDA) decreased 140 basis points as a percentage of revenue. The decrease is due to an approximately 3% rate reduction on Med icare PDGM episodes in the first quarter and volume decline due to COVID - 19 in late March.

Three months ended March 31, 2020 Adjusted Hospice Services % of rev 2019 Adjusted Hospice Services % of rev Net service revenue $60,531 $51,736 Cost of service revenue 37,972 62.7% 32,975 63.7% Gross margin 22,559 37.3% 18,761 36.3% General and administrative expenses 16,114 26.6% 13,928 26.9% Operating income $6,445 10.6% $4,833 9.3% Depreciation 515 426 Noncontrolling interests (967) (601) Earnings before interest, tax, and depreciation (EBITDA less NCI) $5,993 $4,658 EBITDA less NCI as a percentage of revenue 9.9% 9.0% • For the three months ended March 31, 2020, Adjusted EBITDA increased 90 basis points due to improved gross margin driven by g row th in average daily census resulting in higher patient days. 15 Hospice Segment Adjusted Segment Results – 2020 vs 2019

Three months ended March 31, 2020 Adjusted HCBS Services % of rev 2019 Adjusted HCBS Services % of rev Net service revenue $48,464 $51,785 Cost of service revenue 38,453 79.3% 39,661 76.6% Gross margin 10,011 20.7% 12,124 23.4% General and administrative expenses 11,066 22.8% 10,696 20.7% Operating income (loss) ($1,055) - 2.2% $1,428 2.8% Depreciation 391 310 Noncontrolling interests 155 310 Earnings before interest, tax, and depreciation (EBITDA less NCI) ($509) $2,048 EBITDA less NCI as a percentage of revenue - 1.0% 4.0% • For the three months ended March 31, 2020, Adjusted EBITDA decreased 500 basis points due to disruption associated with the conversion to a new billing and operational platform in the fourth quarter of 2019 along with a $500,000 reduction to revenu e associated with prior year revenue. We also experienced impact related to COVID - 19 with a reduction to billable hours during Mar ch 15 – March 30, 2020. 16 Home and Community Based Services Segment Adjusted Segment Results – 2020 vs 2019

Facility - Based Services Segment Adjusted Segment Results – 2020 vs 2019 Three months ended March 31, 2020 Adjusted Facility - based Services % of rev 2019 Adjusted Facility - based Services % of rev Net service revenue $29,681 $27,701 Cost of service revenue 20,342 68.5% 17,574 63.4% Gross margin 9,339 31.5% 10,127 36.6% General and administrative expenses 9,833 33.1% 8,980 32.4% Operating income (loss) ($494) - 1.7% $1,147 4.1% Depreciation 931 756 Noncontrolling interests (243) (481) Earnings before interest, tax and depreciation (EBITDA less NCI) $194 $1,422 EBITDA less NCI as a percentage of revenue 0.7% 5.1% 17 • For the three months ended March 31, 2020, Adjusted EBITDA decreased 440 basis points. This was due to low occupancy rate of 65% due to the effect of COVID - 19. Occupancy has improved to a current rate of approximately 80% in April.
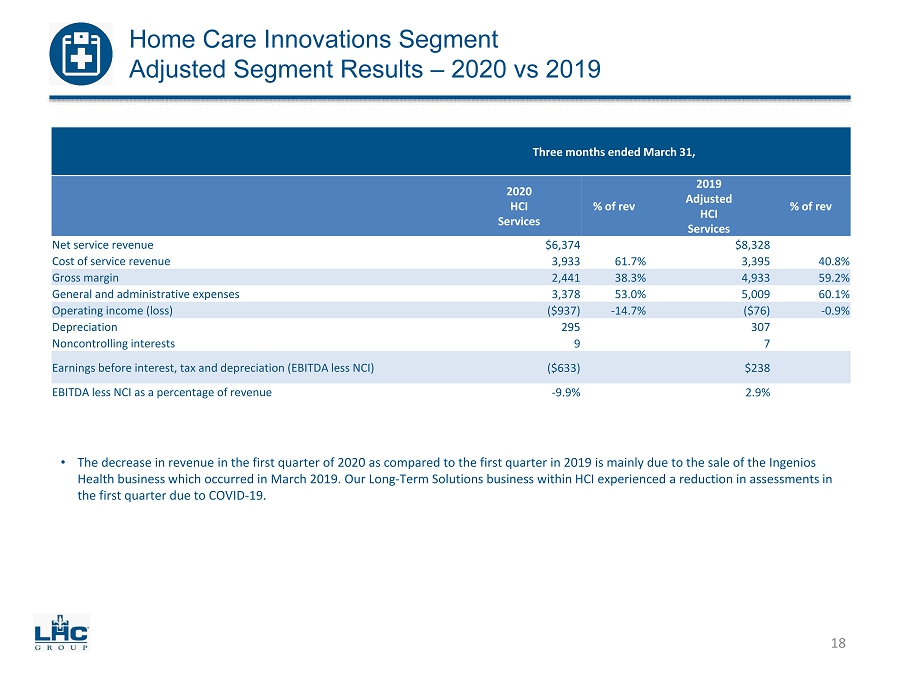
Home Care Innovations Segment Adjusted Segment Results – 2020 vs 2019 Three months ended March 31, 2020 HCI Services % of rev 2019 Adjusted HCI Services % of rev Net service revenue $6,374 $8,328 Cost of service revenue 3,933 61.7% 3,395 40.8% Gross margin 2,441 38.3% 4,933 59.2% General and administrative expenses 3,378 53.0% 5,009 60.1% Operating income (loss) ($937) - 14.7% ($76) - 0.9% Depreciation 295 307 Noncontrolling interests 9 7 Earnings before interest, tax and depreciation (EBITDA less NCI) ($633) $238 EBITDA less NCI as a percentage of revenue - 9.9% 2.9% 18 • The decrease in revenue in the first quarter of 2020 as compared to the first quarter in 2019 is mainly due to the sale of th e Ingenios Health business which occurred in March 2019. Our Long - Term Solutions business within HCI experienced a reduction in assessments in the first quarter due to COVID - 19.
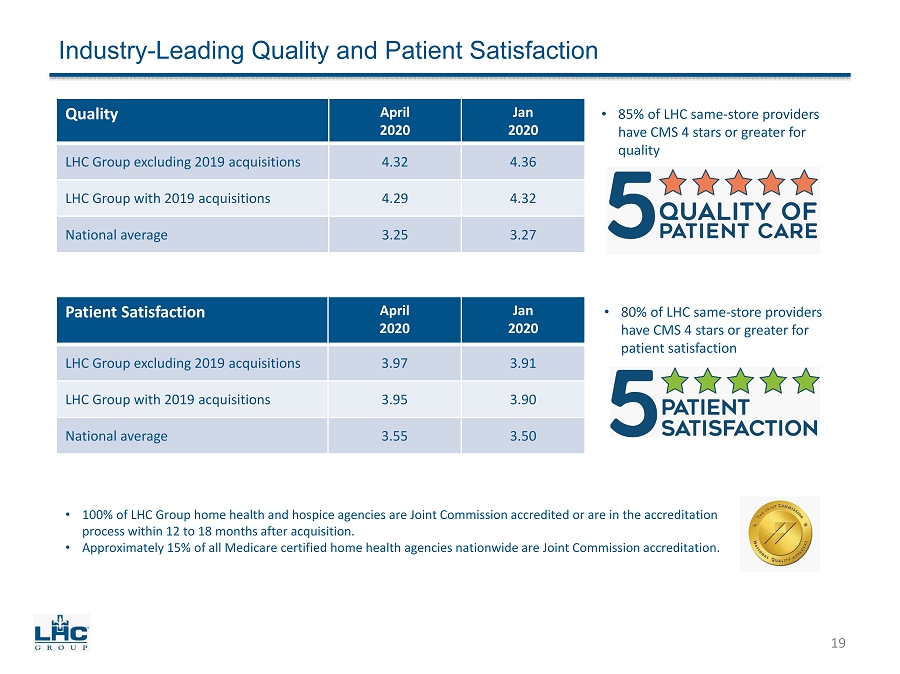
Industry - Leading Quality and Patient Satisfaction • 85 % of LHC same - store providers have CMS 4 stars or greater for quality 19 Quality April 2020 Jan 2020 LHC Group excluding 2019 acquisitions 4.32 4.36 LHC Group with 2019 acquisitions 4.29 4.32 National average 3.25 3.27 Patient Satisfaction April 2020 Jan 2020 LHC Group excluding 2019 acquisitions 3.97 3.91 LHC Group with 2019 acquisitions 3.95 3.90 National average 3.55 3.50 • 100% of LHC Group home health and hospice agencies are Joint Commission accredited or are in the accreditation process within 12 to 18 months after acquisition. • Approximately 15% of all Medicare certified home health agencies nationwide are Joint Commission accreditation. • 80 % of LHC same - store providers have CMS 4 stars or greater for patient satisfaction

Debt and Liquidity Metrics Outstanding Debt ( amounts in thousands ) As of Mar. 31, 2020 Total Debt – Balance Sheet $298,071 Less: Cash $8,308 Net Debt $289,763 Net debt to estimated TTM adjusted EBITDA ratio 1.4x Credit Facility ( amounts in thousands ) As of Mar. 31, 2020 Revolver Size $500,000 Less: Outstanding Revolver $298,071 Less: Letters of Credit $24,900 Available Revolver $177,029 Plus: Cash $8,308 Plus: Accordion $200,000 Total Liquidity $385,377 Cash Flow ( amounts in thousands ) As of Mar. 31, 2020 Free Cash Flow (3 Months Ended) ($42,469) + Cash adjustments net of tax to 2020 EBITDA 3,555 = Adjusted Free Cash Flow (3 Months Ended) ($38,914) DSO’s 62 days 20

Focus for 2020 Successful execution of our PDGM clinical pathway and efficiency plan Maintain disciplined capital allocation with new joint ventures and other M&A activity Accelerate plans for unlocking untapped potential of co - location strategy Maximize value of Healthcare Innovations business Maintain proactive posture to COVID - 19 pandemic response Continue to lead the industry in quality and patient satisfaction scores Capture market share gains and incremental contributions from recent joint ventures and other acquisitions 21 Capture opportunistic share in each market from anticipated consolidation caused by PDGM and RAP elimination Continue our focus as an industry leader in key areas around employee recruitment and retention including vacancy rate and voluntary turnover Prioritize the safety and protection of our employees, patients and communities we serve

Non - GAAP Reconciliations (Amounts in thousands, unaudited) RECONCILIATION OF ADJUSTED NET INCOME ATTRIBUTABLE TO LHC GROUP Three Months Ended March 31, Three Months Ended March 31, 2020 2019 Net income attributable to LHC Group, Inc.’s common stockholders $22,024 $18,856 Add (net of tax): Acquisition and de novo expenses (1) 1,106 5,268 Closures/relocations/consolidations (2) 343 2,244 COVID - 19 impact: PPE, supplies and wages (3) 2,108 - CARES Act tax benefit (4) (2,210) - Provider moratorium impairment (5) - 4,332 Adjusted net income attributable to LHC Group, Inc.’s common stockholders $23,371 $30,700 22 Footnotes are on page 23 RECONCILIATION OF ADJUSTED NET INCOME ATTRIBUTABLE TO LHC GROUP PER DILUTED SHARE Three Months Ended March 31, Three Months Ended March 31, 2020 2019 Net income attributable to LHC Group, Inc.’s common stockholders $0.70 $0.60 Add (net of tax): Acquisition and de novo expenses (1) 0.04 0.17 Closures/relocations/consolidations (2) 0.01 0.07 COVID - 19 impact: PPE, supplies and wages (3) 0.07 - CARES Act tax benefit (4) (0.07) - Provider moratorium impairment (5) - 0.14 Adjusted net income attributable to LHC Group, Inc.’s common stockholders $0.75 $0.98

Three Months Ended March 31, Three Months Ended March 31, 2020 2019 Net income $22,024 $18,856 Add: Income tax expense 3,359 3,600 Interest expense, net 2,768 3,052 Depreciation and amortization 5,133 4,202 Adjustment items (*) 4,856 16,404 Adjusted EBITDA $38,140 $46,114 (*) Adjustment items (pre - tax): Acquisition and de novo expenses (1) $1,510 $7,295 Closures/relocations/consolidations (2) 468 3,109 COVID - 19 PPE, supplies and wages (3) 2,878 3,109 Provider moratorium impairment (5) - 6,000 Total adjustments $4,856 $16,404 Non - GAAP Reconciliations (Amounts in thousands, unaudited) 23 Adjusted Earnings Before Interest, Taxes, Depreciation and Amortization (Adjusted EBITDA) Footnotes: 1. Expenses and other costs associated with recently announced or completed acquisitions and de novos ( $ 1 . 5 million pre - tax in the three months ended March 31 , 2020 ) . 2. Expenses associated with the closure or consolidation of 4 locations in the first quarter of 2020 along with residual costs and expenses in connection with closures in the fourth quarter of 2019 ( $ 0 . 5 million pre - tax in the three months ended March 31 , 2020 ) . 3. COVID - 19 related expenses for purchases of personal protective equipment (PPE), supplies and wage adjustments ( $ 2 . 9 million pre - tax in the three months ended March 31 , 2020 ) . 4. Tax benefit related to new legislation in the Coronavirus Aid, Relief, and Economic Security Act (“CARES Act”) which lifts certain tax deduction limitations and eliminates 80 % of taxable income limitations for Net Operating Losses (“NOL”), which we are now able to fully utilize NOLs associated with Almost Family prior to the merger . 5. During the three months ended March 31 , 2019 , the Company recorded $ 6 . 0 million of moratoria impairment as a result of the Centers for Medicare and Medicaid Services (“CMS”) action to remove all federal moratoria with regard to Medicare provider enrollment .
