Attached files
| file | filename |
|---|---|
| 8-K - 8-K - KITE REALTY GROUP TRUST | form8k05062020.htm |
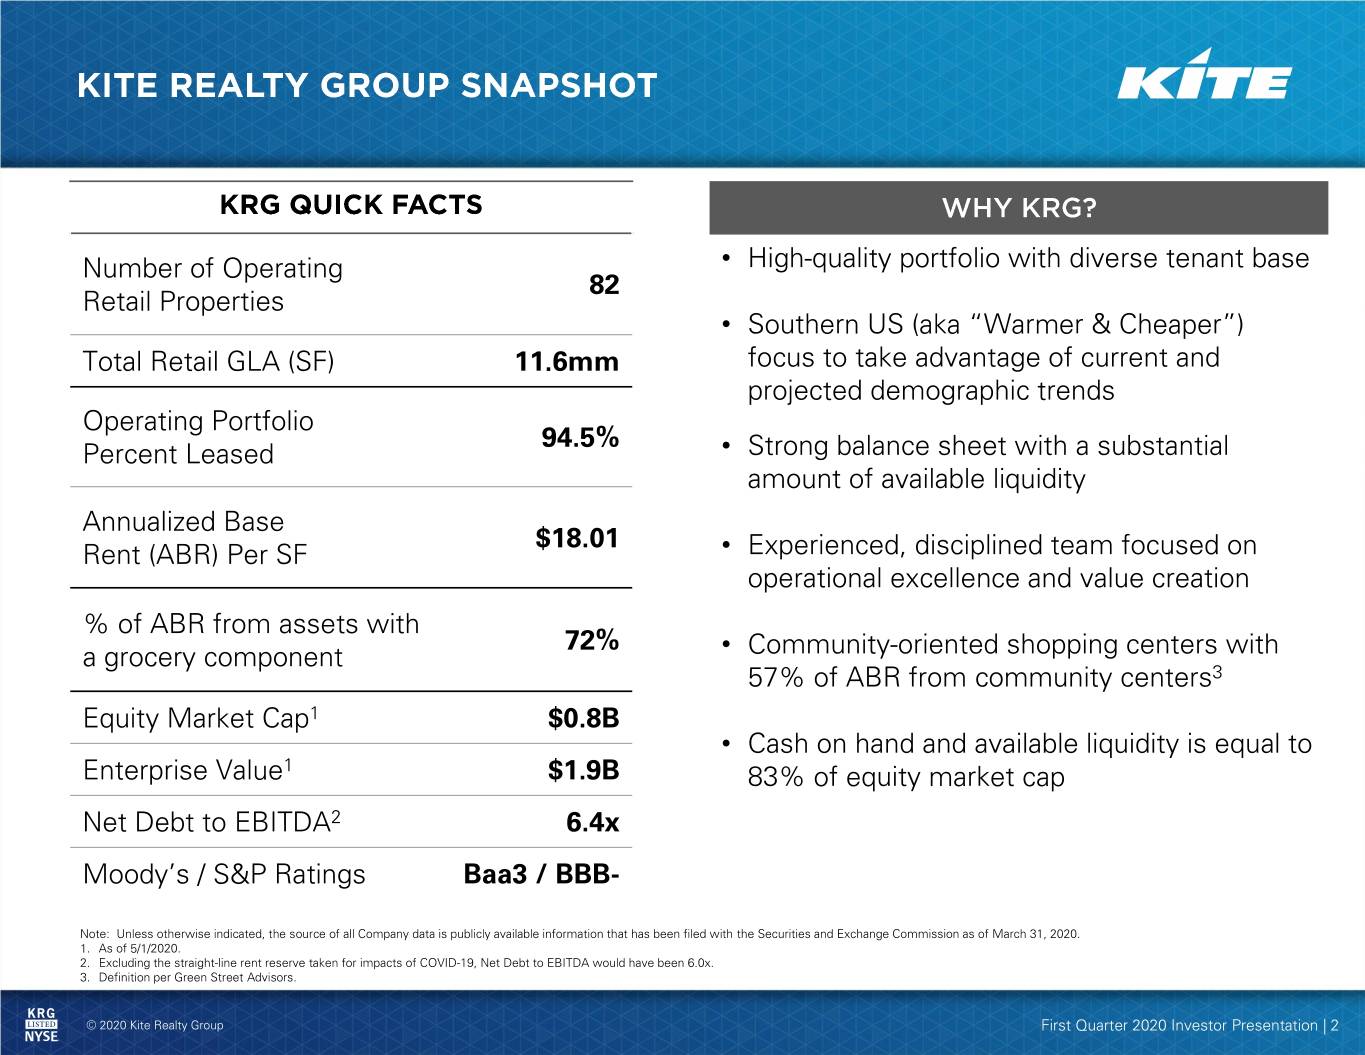
Number of Operating • High-quality portfolio with diverse tenant base 82 Retail Properties • Southern US (aka “Warmer & Cheaper”) Total Retail GLA (SF) 11.6mm focus to take advantage of current and projected demographic trends Operating Portfolio 94.5% Percent Leased • Strong balance sheet with a substantial amount of available liquidity Annualized Base $18.01 Rent (ABR) Per SF • Experienced, disciplined team focused on operational excellence and value creation % of ABR from assets with 72% a grocery component • Community-oriented shopping centers with 57% of ABR from community centers3 Equity Market Cap1 $0.8B • Cash on hand and available liquidity is equal to Enterprise Value1 $1.9B 83% of equity market cap Net Debt to EBITDA2 6.4x Moody’s / S&P Ratings Baa3 / BBB- Note: Unless otherwise indicated, the source of all Company data is publicly available information that has been filed with the Securities and Exchange Commission as of March 31, 2020. 1. As of 5/1/2020. 2. Excluding the straight-line rent reserve taken for impacts of COVID-19, Net Debt to EBITDA would have been 6.0x. 3. Definition per Green Street Advisors. © 2020 Kite Realty Group First Quarter 2020 Investor Presentation | 2
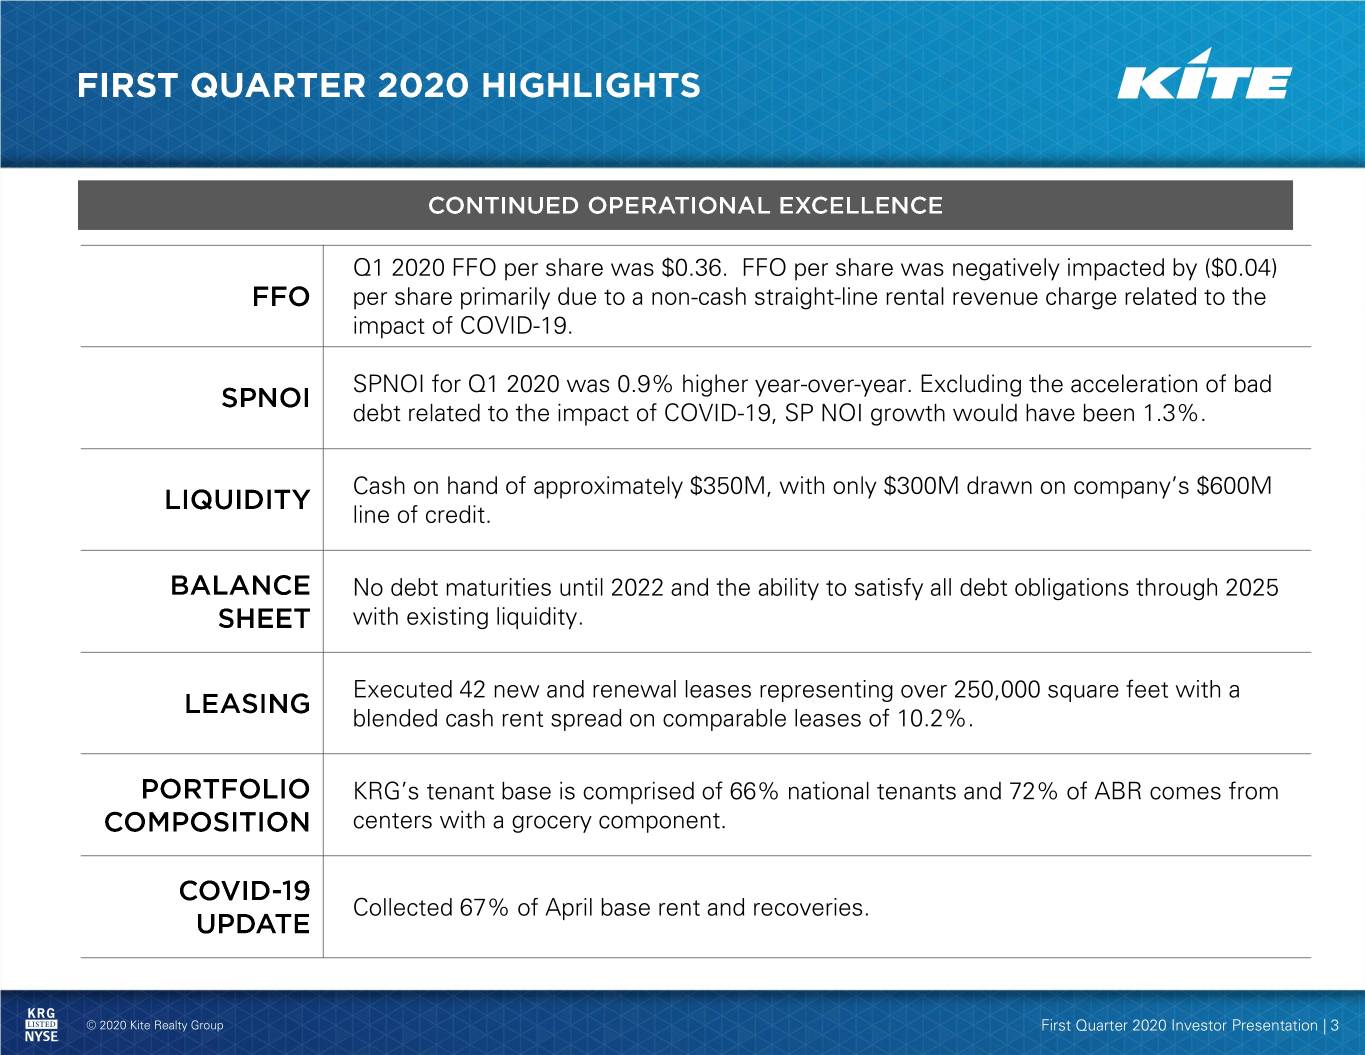
Q1 2020 FFO per share was $0.36. FFO per share was negatively impacted by ($0.04) per share primarily due to a non-cash straight-line rental revenue charge related to the impact of COVID-19. SPNOI for Q1 2020 was 0.9% higher year-over-year. Excluding the acceleration of bad debt related to the impact of COVID-19, SP NOI growth would have been 1.3%. Cash on hand of approximately $350M, with only $300M drawn on company’s $600M line of credit. No debt maturities until 2022 and the ability to satisfy all debt obligations through 2025 with existing liquidity. Executed 42 new and renewal leases representing over 250,000 square feet with a blended cash rent spread on comparable leases of 10.2%. KRG’s tenant base is comprised of 66% national tenants and 72% of ABR comes from centers with a grocery component. Collected 67% of April base rent and recoveries. © 2020 Kite Realty Group First Quarter 2020 Investor Presentation | 3
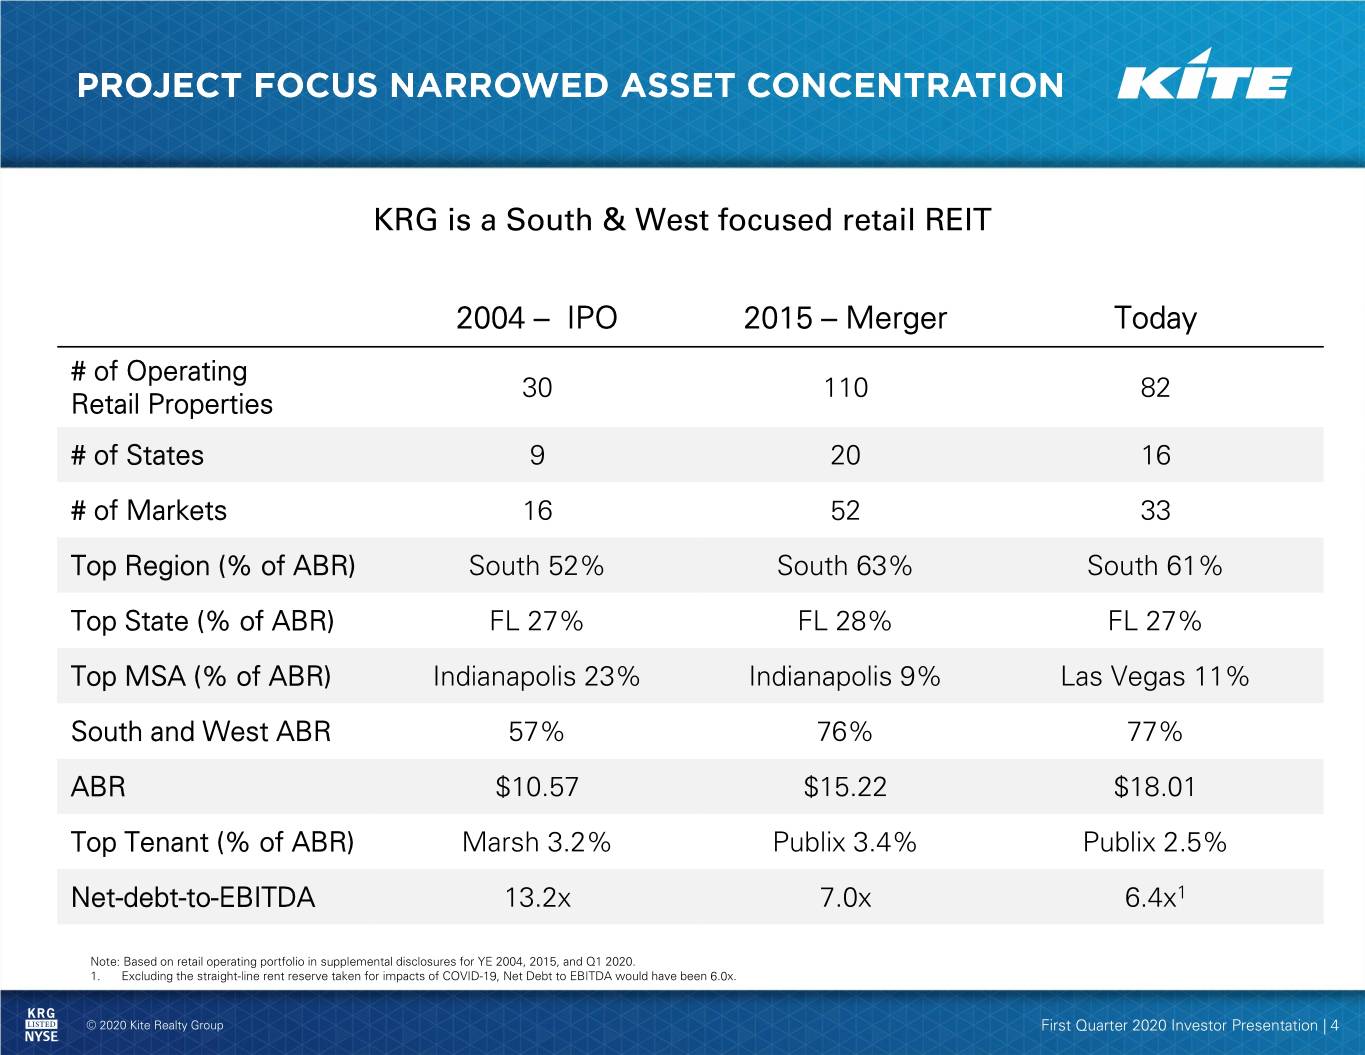
KRG is a South & West focused retail REIT 2004 – IPO 2015 – Merger Today # of Operating 30 110 82 Retail Properties # of States 9 20 16 # of Markets 16 52 33 Top Region (% of ABR) South 52% South 63% South 61% Top State (% of ABR) FL 27% FL 28% FL 27% Top MSA (% of ABR) Indianapolis 23% Indianapolis 9% Las Vegas 11% South and West ABR 57% 76% 77% ABR $10.57 $15.22 $18.01 Top Tenant (% of ABR) Marsh 3.2% Publix 3.4% Publix 2.5% Net-debt-to-EBITDA 13.2x 7.0x 6.4x1 Note: Based on retail operating portfolio in supplemental disclosures for YE 2004, 2015, and Q1 2020. 1. Excluding the straight-line rent reserve taken for impacts of COVID-19, Net Debt to EBITDA would have been 6.0x. © 2020 Kite Realty Group First Quarter 2020 Investor Presentation | 4
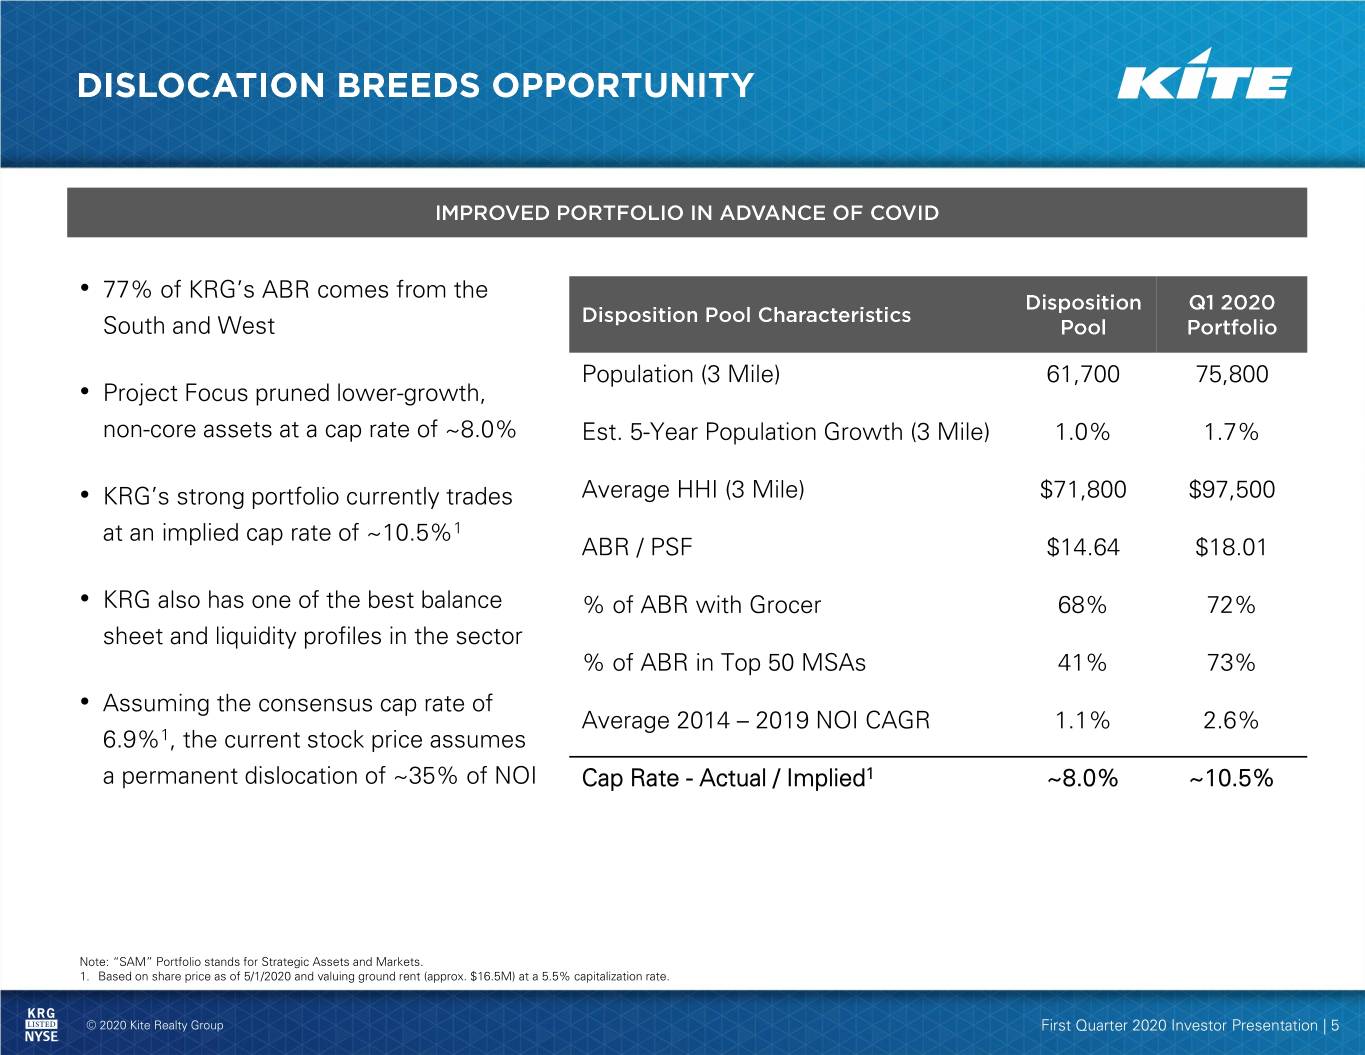
• 77% of KRG’s ABR comes from the South and West Population (3 Mile) 61,700 75,800 • Project Focus pruned lower-growth, non-core assets at a cap rate of ~8.0% Est. 5-Year Population Growth (3 Mile) 1.0% 1.7% • KRG’s strong portfolio currently trades Average HHI (3 Mile) $71,800 $97,500 at an implied cap rate of ~10.5%1 ABR / PSF $14.64 $18.01 • KRG also has one of the best balance % of ABR with Grocer 68% 72% sheet and liquidity profiles in the sector % of ABR in Top 50 MSAs 41% 73% • Assuming the consensus cap rate of Average 2014 – 2019 NOI CAGR 1.1% 2.6% 6.9%1, the current stock price assumes a permanent dislocation of ~35% of NOI Cap Rate - Actual / Implied1 ~8.0% ~10.5% Note: “SAM” Portfolio stands for Strategic Assets and Markets. 1. Based on share price as of 5/1/2020 and valuing ground rent (approx. $16.5M) at a 5.5% capitalization rate. © 2020 Kite Realty Group First Quarter 2020 Investor Presentation | 5

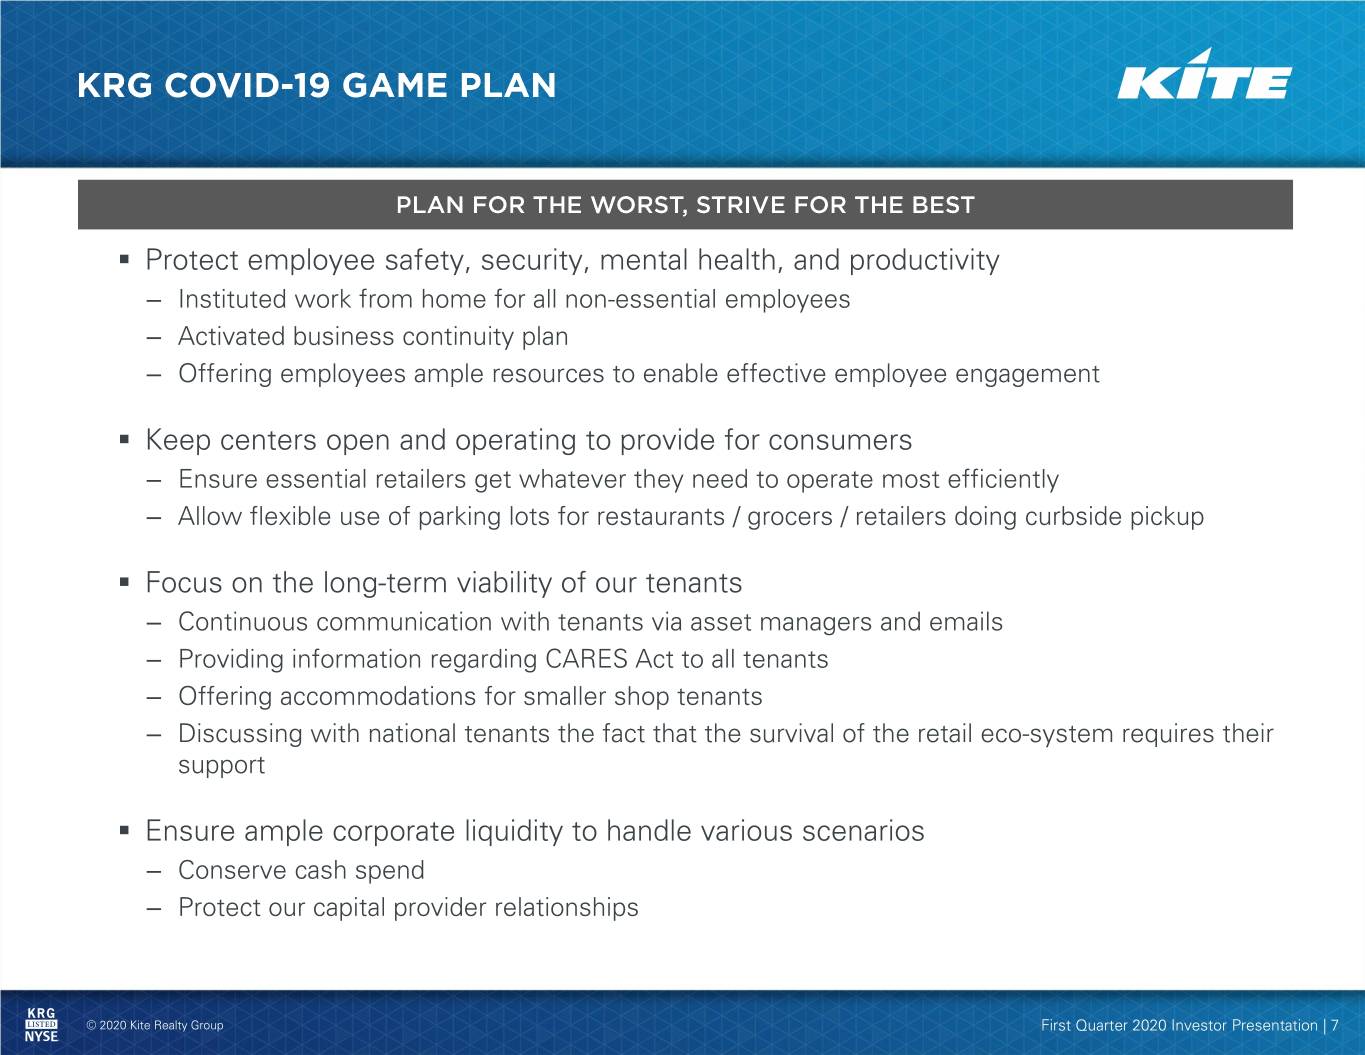
▪ Protect employee safety, security, mental health, and productivity – Instituted work from home for all non-essential employees – Activated business continuity plan – Offering employees ample resources to enable effective employee engagement ▪ Keep centers open and operating to provide for consumers – Ensure essential retailers get whatever they need to operate most efficiently – Allow flexible use of parking lots for restaurants / grocers / retailers doing curbside pickup ▪ Focus on the long-term viability of our tenants – Continuous communication with tenants via asset managers and emails – Providing information regarding CARES Act to all tenants – Offering accommodations for smaller shop tenants – Discussing with national tenants the fact that the survival of the retail eco-system requires their support ▪ Ensure ample corporate liquidity to handle various scenarios – Conserve cash spend – Protect our capital provider relationships © 2020 Kite Realty Group First Quarter 2020 Investor Presentation | 7
▪ The best scientific minds in the world are racing to find a cure/vaccine and one of our core values is optimism ▪ The list of people that warrant a “thank you for your service” is expanding to include health care workers, cashiers at our necessity-based retailers, delivery drivers, restaurant workers fulfilling “to go” orders, public sanitation workers, remote school teachers, etc. – it’s their dedication that allows many of us to shelter at home ▪ At this time, we believe there isn’t such thing as “too much” communication – Frequent disclosure to ALL our stakeholders including employees, tenants and investors ▪ There is no doubt the landscape will be different when we reach the other side – Some challenged retailers will close, others will emerge stronger, and new ones will be born ▪ When we look back at this time, it will bring a new appreciation for many of the things we took for granted: – Dinner with friends and family at a restaurant – Casually strolling through the produce aisle – Getting a haircut – Going to the movies – Back-to-school shopping – Happy hour with colleagues © 2020 Kite Realty Group First Quarter 2020 Investor Presentation | 8
▪ Delivered food to local hospitals, purchased from KRG small business tenants ▪ Donated to the Indiana Restaurant & Lodging Association to assist furloughed workers ▪ Supported a KRG restaurant tenant in their effort to deliver meals to elderly and at-risk citizens ▪ Provided KRG employees a stipend to support local businesses for #TakeoutTuesday ▪ Partnered with grocer tenants to deliver groceries to the families of quarantined police offices ▪ Provided land to a farmers market in need of greater space to allow for proper social distancing ▪ Partnered to launch a multi-organizational food drive benefitting Gleaners Food Bank, a member of Feeding America © 2020 Kite Realty Group First Quarter 2020 Investor Presentation | 9
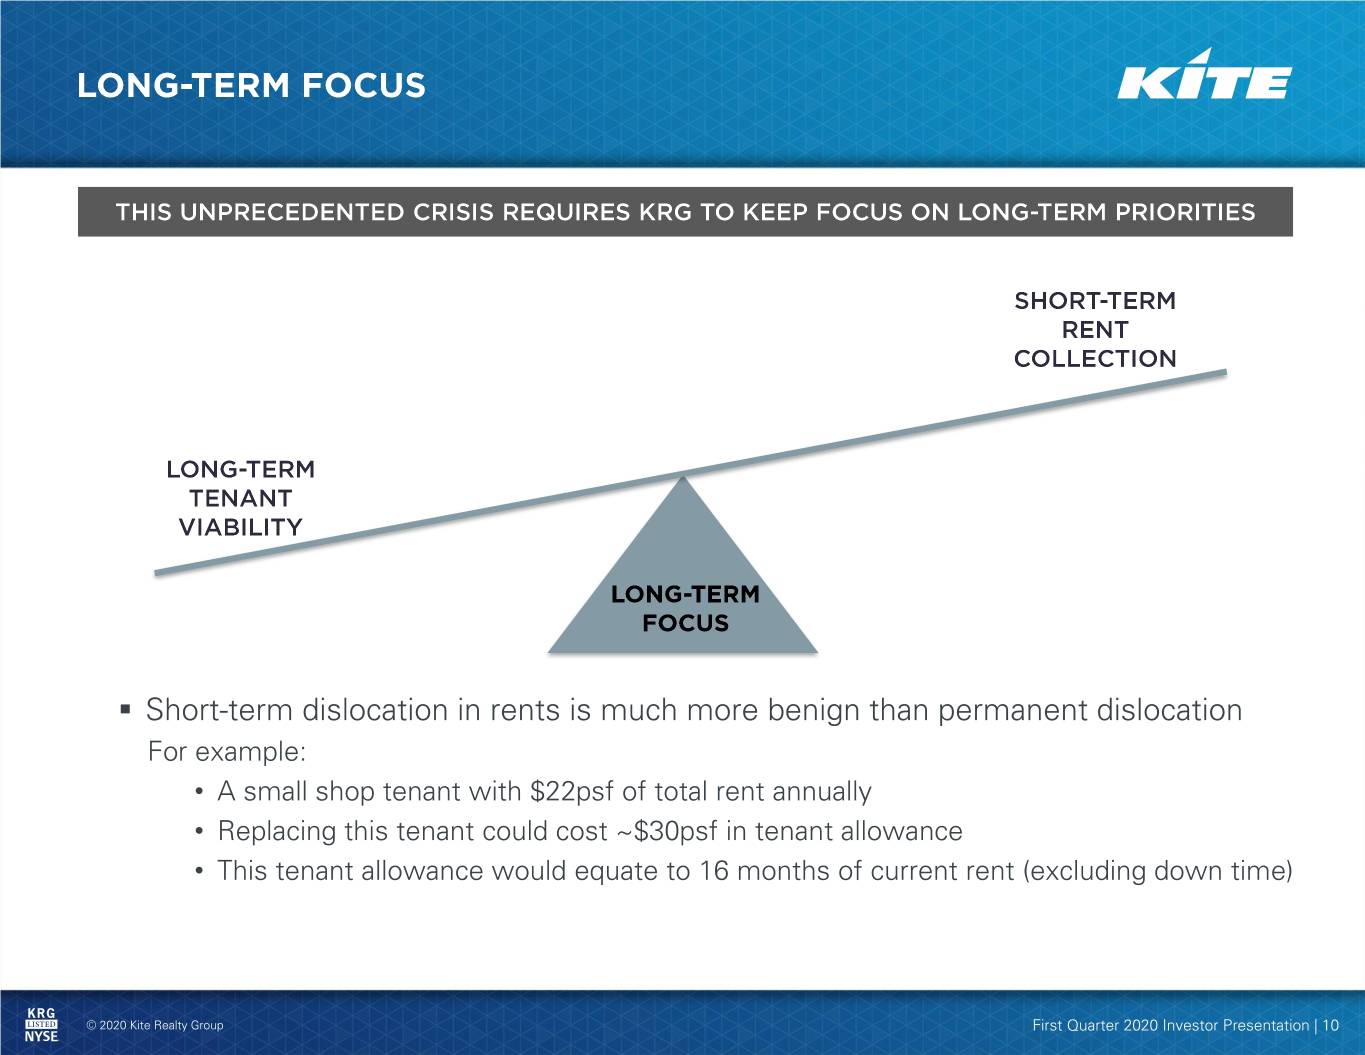
▪ Short-term dislocation in rents is much more benign than permanent dislocation For example: • A small shop tenant with $22psf of total rent annually • Replacing this tenant could cost ~$30psf in tenant allowance • This tenant allowance would equate to 16 months of current rent (excluding down time) © 2020 Kite Realty Group First Quarter 2020 Investor Presentation | 10
Small shop tenants are the backbone of the US economy and we are working to help them in this time of need ▪ In constant communication with our small shop tenants ▪ Provided tenants with summaries, weblinks, and lender contacts to assist with their SBA applications in conjunction with the CARES Act ▪ We are providing financial assistance to our most vulnerable small shop tenants ▪ In reaction to the complications and backlog associated with the CARES Act programs, KRG has established an independent small business lending program for our tenants (aggregate up to $5 million) © 2020 Kite Realty Group First Quarter 2020 Investor Presentation | 11
▪ 2020 & 2021 debt maturities = $0 ▪ Scaling back capital expenditures ▪ Outstanding committed development spend for remainder of 2020 = $3.5M ▪ Outstanding committed Big Box spend for remainder of 2020 = $9M ▪ Borrowed $300 million from our $600 million revolving credit facility ▪ Cash on hand as of 3/31/2020 = ~$350 million ▪ Paid all April and May debt obligations © 2020 Kite Realty Group First Quarter 2020 Investor Presentation | 12
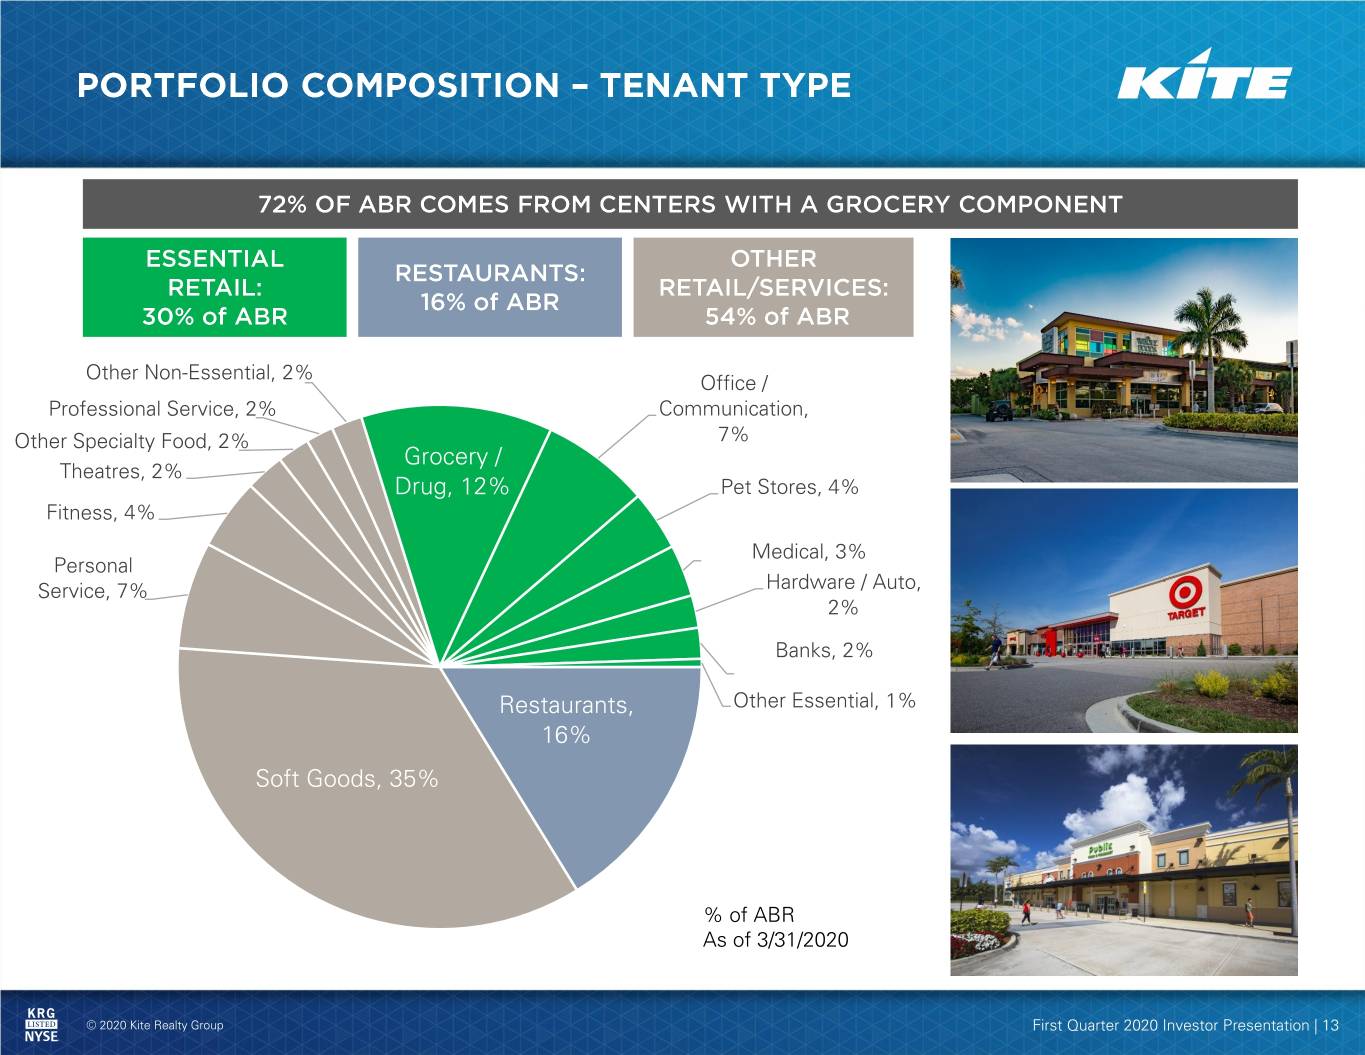
Other Non-Essential, 2% Office / Professional Service, 2% Communication, Other Specialty Food, 2% 7% Grocery / Theatres, 2% Drug, 12% Pet Stores, 4% Fitness, 4% Medical, 3% Personal Service, 7% Hardware / Auto, 2% Banks, 2% Restaurants, Other Essential, 1% 16% Soft Goods, 35% % of ABR As of 3/31/2020 © 2020 Kite Realty Group First Quarter 2020 Investor Presentation | 13
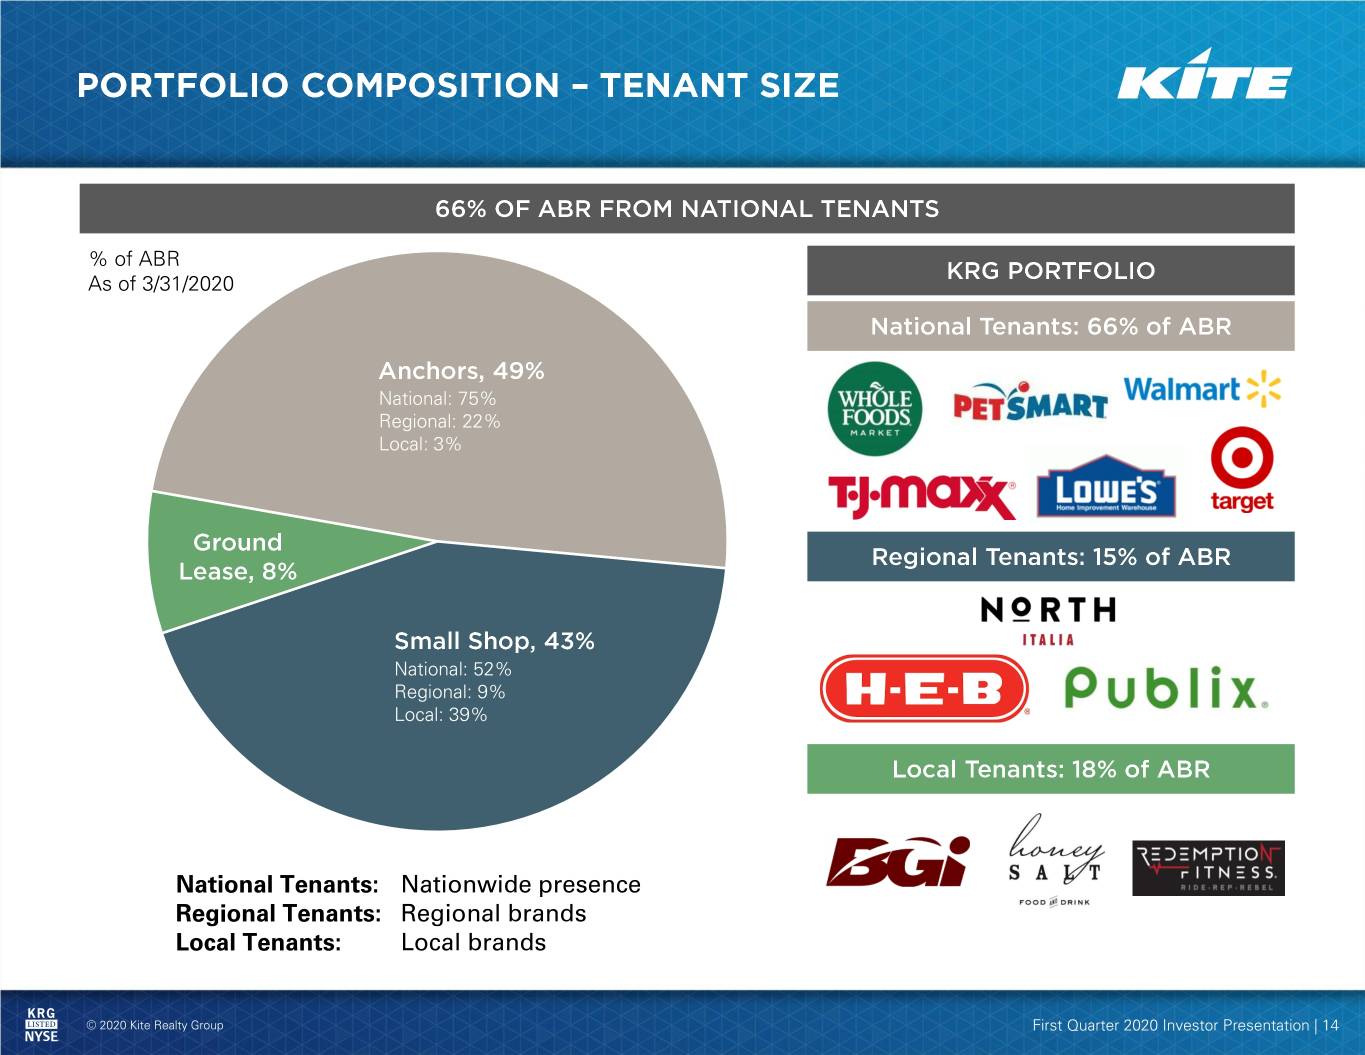
% of ABR As of 3/31/2020 National: 75% Regional: 22% Local: 3% National: 52% Regional: 9% Local: 39% National Tenants: Nationwide presence Regional Tenants: Regional brands Local Tenants: Local brands © 2020 Kite Realty Group First Quarter 2020 Investor Presentation | 14
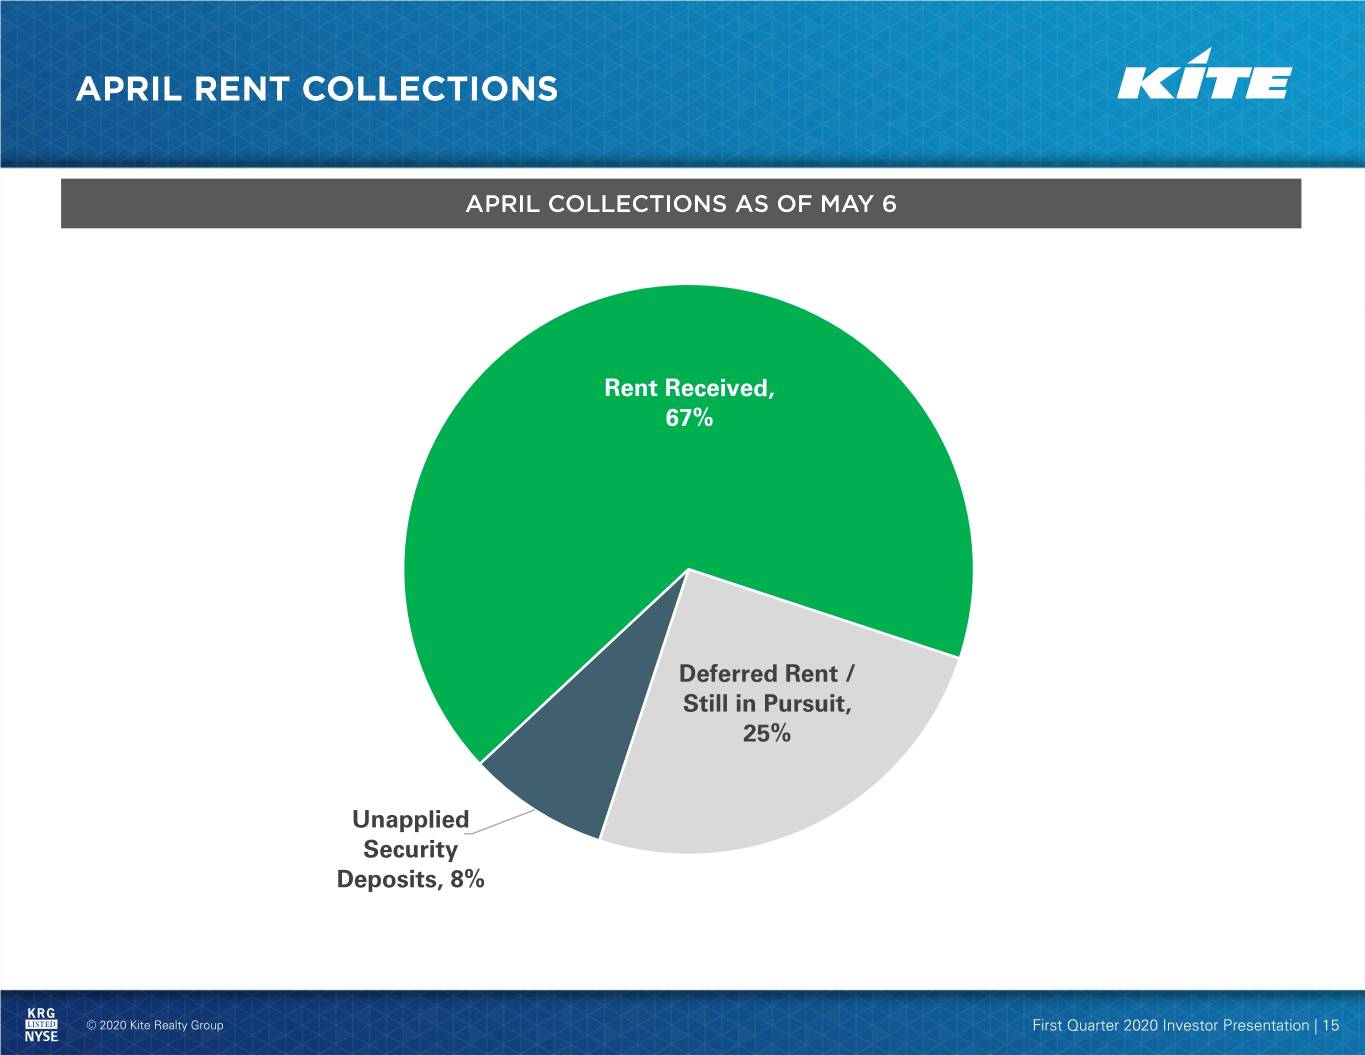
Rent Received, 67% Deferred Rent / Still in Pursuit, 25% Unapplied Security Deposits, 8% © 2020 Kite Realty Group First Quarter 2020 Investor Presentation | 15
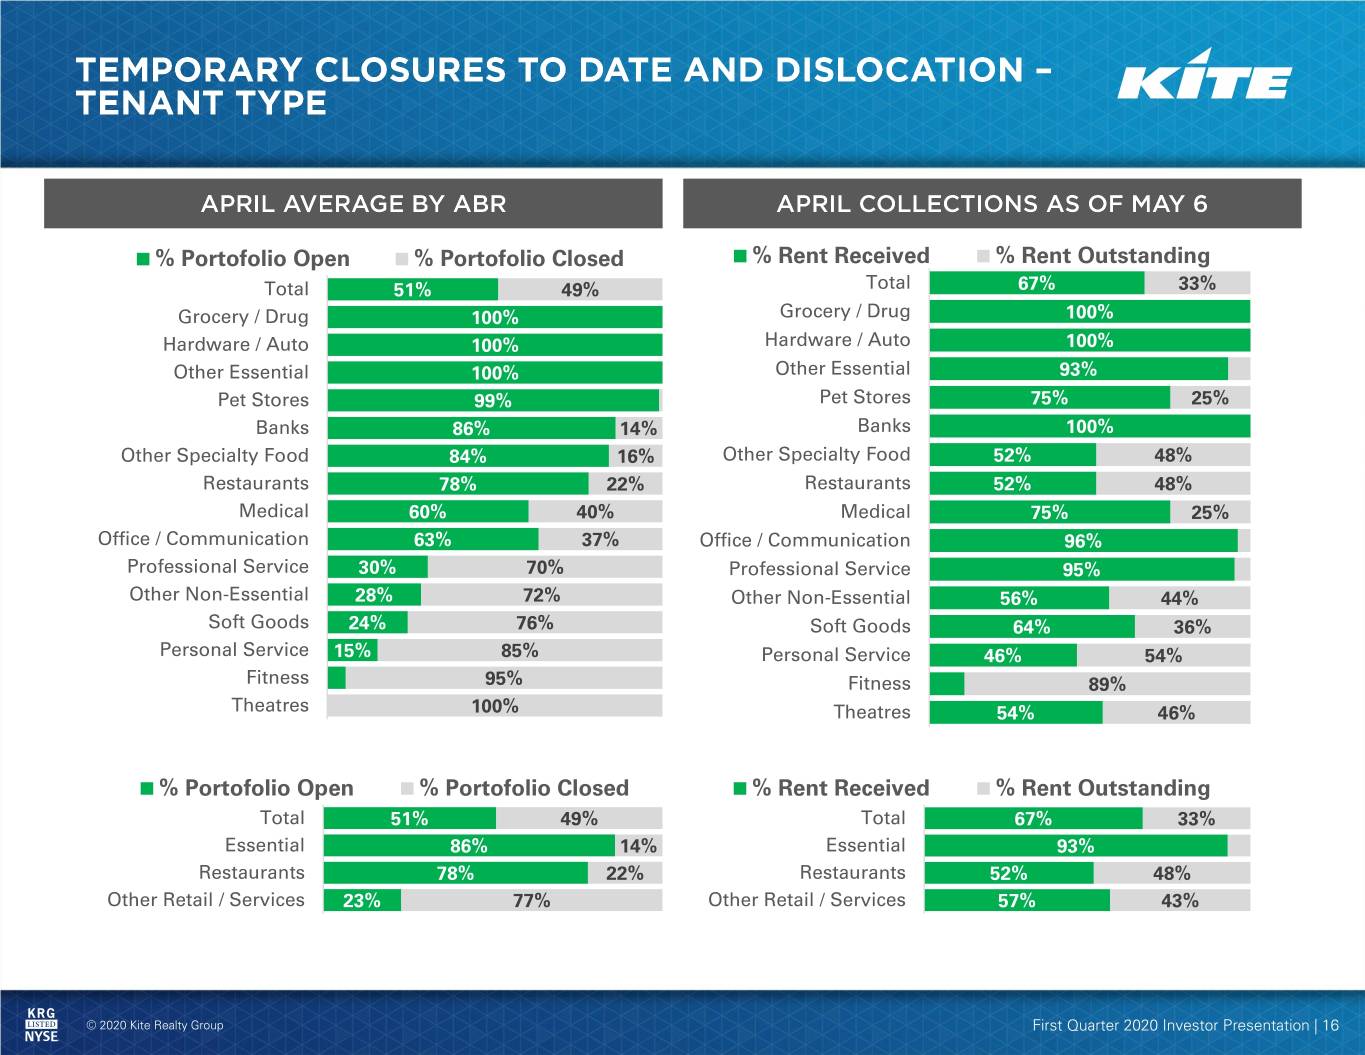
% Portofolio Open % Portofolio Closed % Rent Received % Rent Outstanding Total 51% 49% Total 67% 33% Grocery / Drug 100% Grocery / Drug 100% Hardware / Auto 100% Hardware / Auto 100% Other Essential 100% Other Essential 93% Pet Stores 99% Pet Stores 75% 25% Banks 86% 14% Banks 100% Other Specialty Food 84% 16% Other Specialty Food 52% 48% Restaurants 78% 22% Restaurants 52% 48% Medical 60% 40% Medical 75% 25% Office / Communication 63% 37% Office / Communication 96% Professional Service 30% 70% Professional Service 95% Other Non-Essential 28% 72% Other Non-Essential 56% 44% Soft Goods 24% 76% Soft Goods 64% 36% Personal Service 15% 85% Personal Service 46% 54% Fitness 95% Fitness 89% Theatres 100% Theatres 54% 46% % Portofolio Open % Portofolio Closed % Rent Received % Rent Outstanding Total 51% 49% Total 67% 33% Essential 86% 14% Essential 93% Restaurants 78% 22% Restaurants 52% 48% Other Retail / Services 23% 77% Other Retail / Services 57% 43% © 2020 Kite Realty Group First Quarter 2020 Investor Presentation | 16
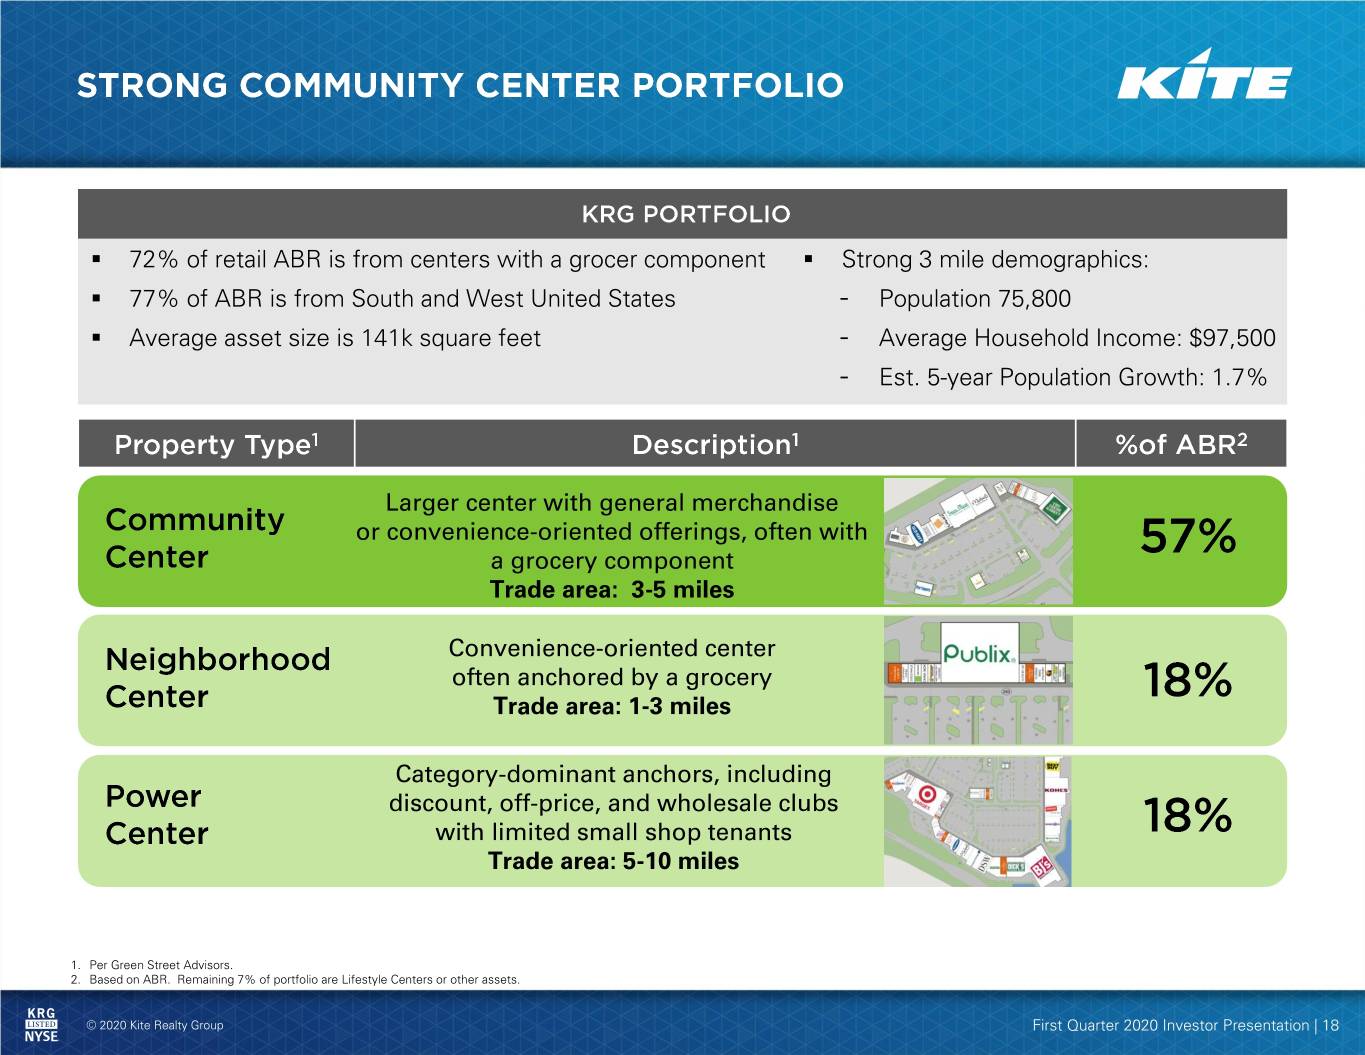
▪ 72% of retail ABR is from centers with a grocer component ▪ Strong 3 mile demographics: ▪ 77% of ABR is from South and West United States - Population 75,800 ▪ Average asset size is 141k square feet - Average Household Income: $97,500 - Est. 5-year Population Growth: 1.7% Larger center with general merchandise or convenience-oriented offerings, often with a grocery component Trade area: 3-5 miles Convenience-oriented center often anchored by a grocery Trade area: 1-3 miles Category-dominant anchors, including discount, off-price, and wholesale clubs with limited small shop tenants Trade area: 5-10 miles 1. Per Green Street Advisors. 2. Based on ABR. Remaining 7% of portfolio are Lifestyle Centers or other assets. © 2020 Kite Realty Group First Quarter 2020 Investor Presentation | 18
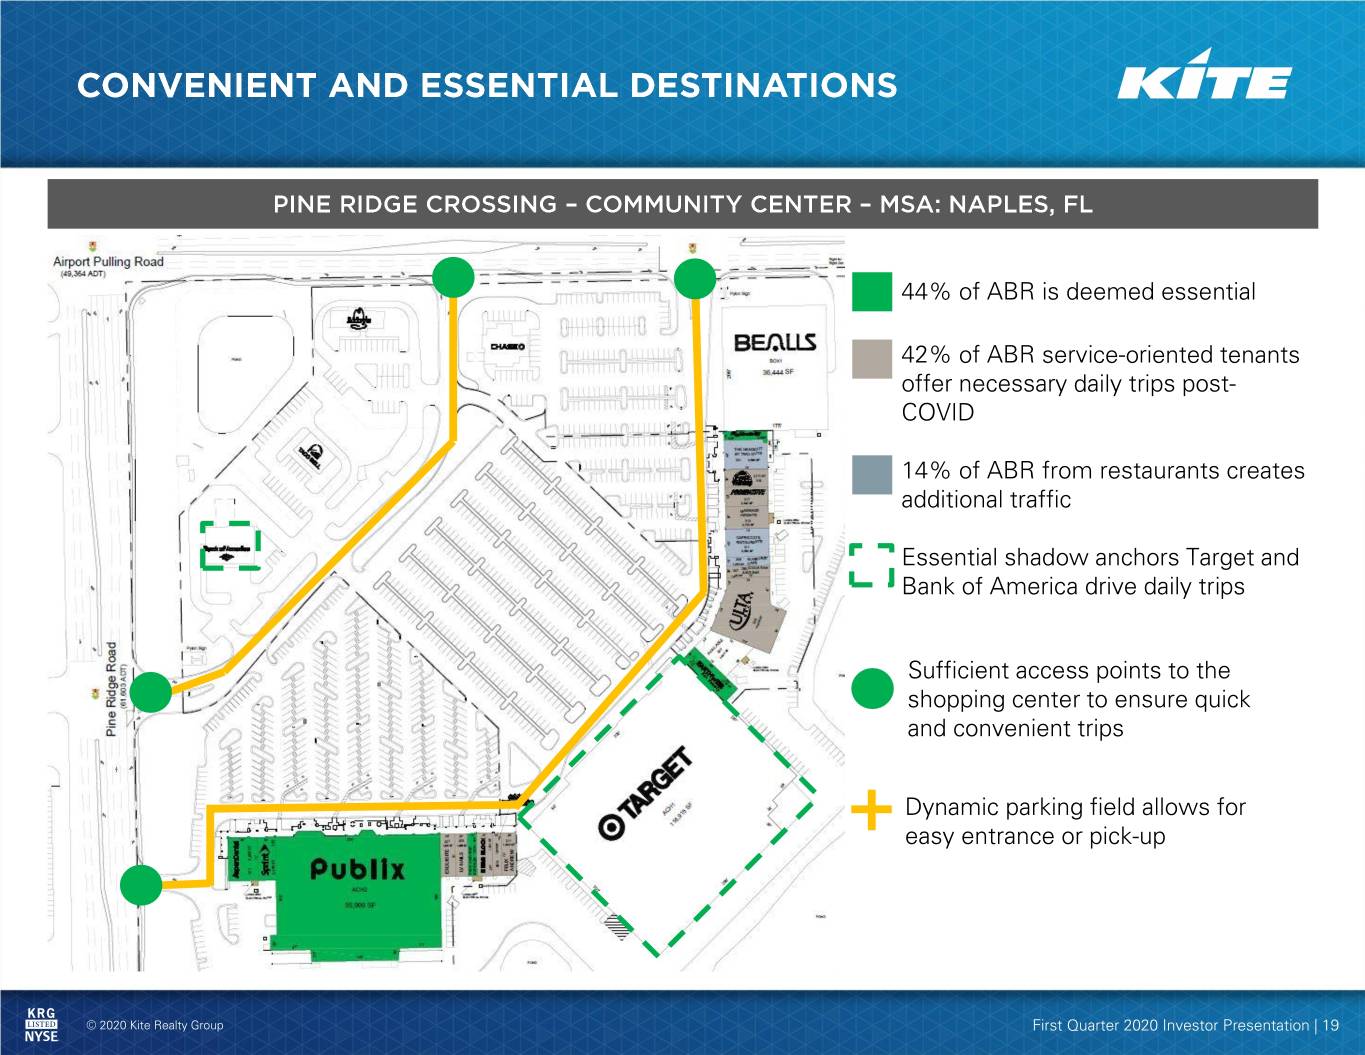
• 44% of ABR is deemed essential • 42% of ABR service-oriented tenants offer necessary daily trips post- COVID • 14% of ABR from restaurants creates additional traffic • Essential shadow anchors Target and Bank of America drive daily trips Sufficient access points to the shopping center to ensure quick and convenient trips Dynamic parking field allows for easy entrance or pick-up © 2020 Kite Realty Group First Quarter 2020 Investor Presentation | 19
© 2020 Kite Realty Group First Quarter 2020 Investor Presentation | 20
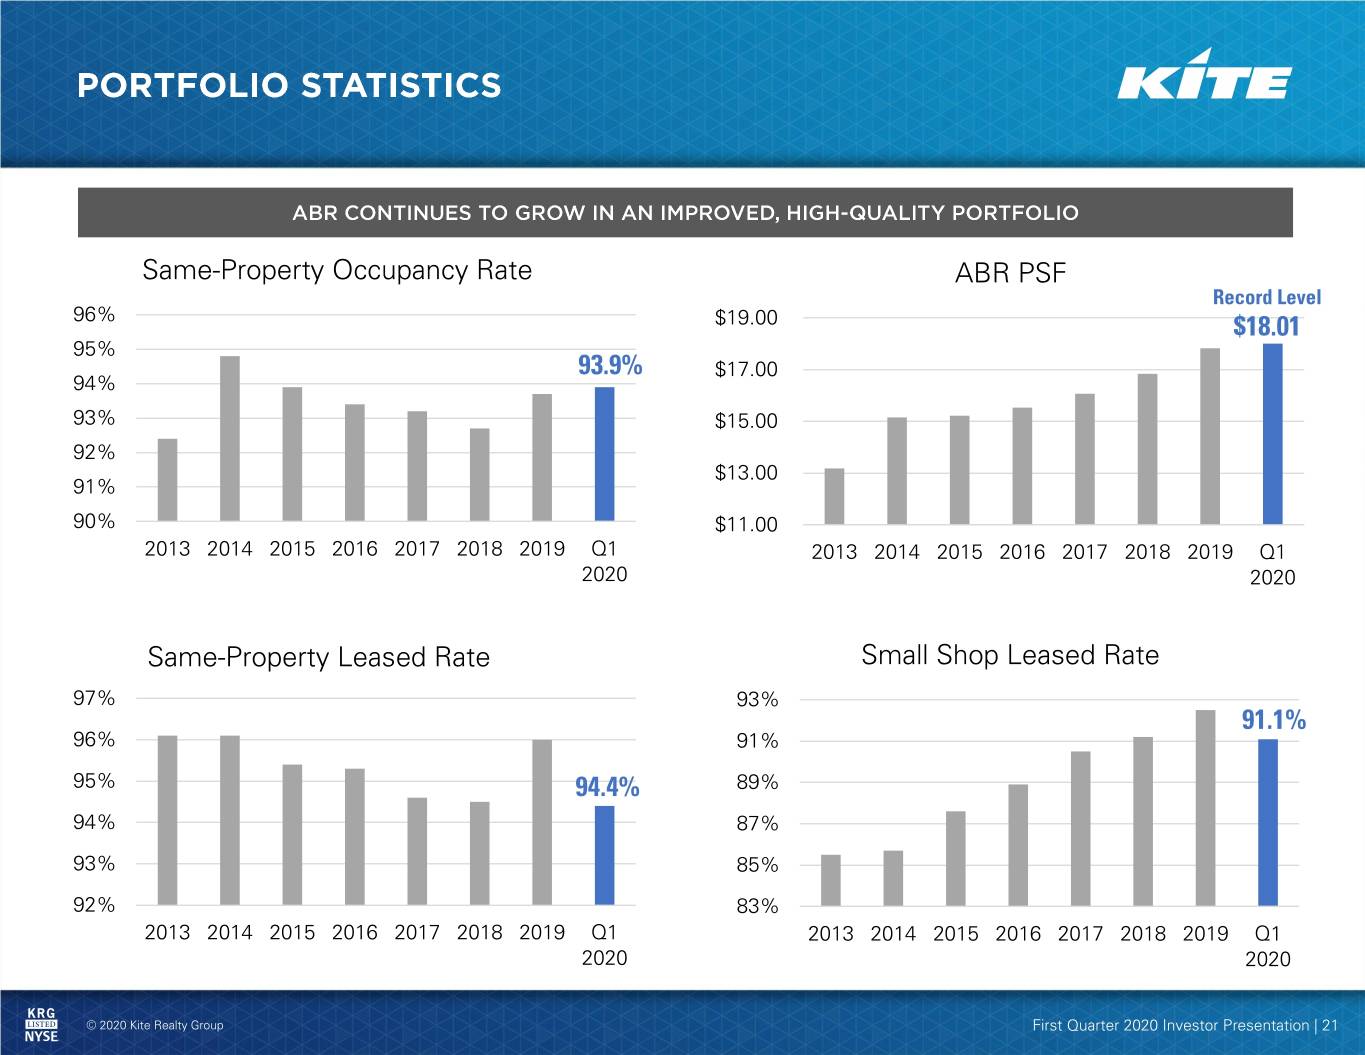
Same-Property Occupancy Rate ABR PSF Record Level 96% $19.00 $18.01 95% 93.9% $17.00 94% 93% $15.00 92% $13.00 91% 90% $11.00 2013 2014 2015 2016 2017 2018 2019 Q1 2013 2014 2015 2016 2017 2018 2019 Q1 2020 2020 Same-Property Leased Rate Small Shop Leased Rate 97% 93% 91.1% 96% 91% 95% 94.4% 89% 94% 87% 93% 85% 92% 83% 2013 2014 2015 2016 2017 2018 2019 Q1 2013 2014 2015 2016 2017 2018 2019 Q1 2020 2020 © 2020 Kite Realty Group First Quarter 2020 Investor Presentation | 21
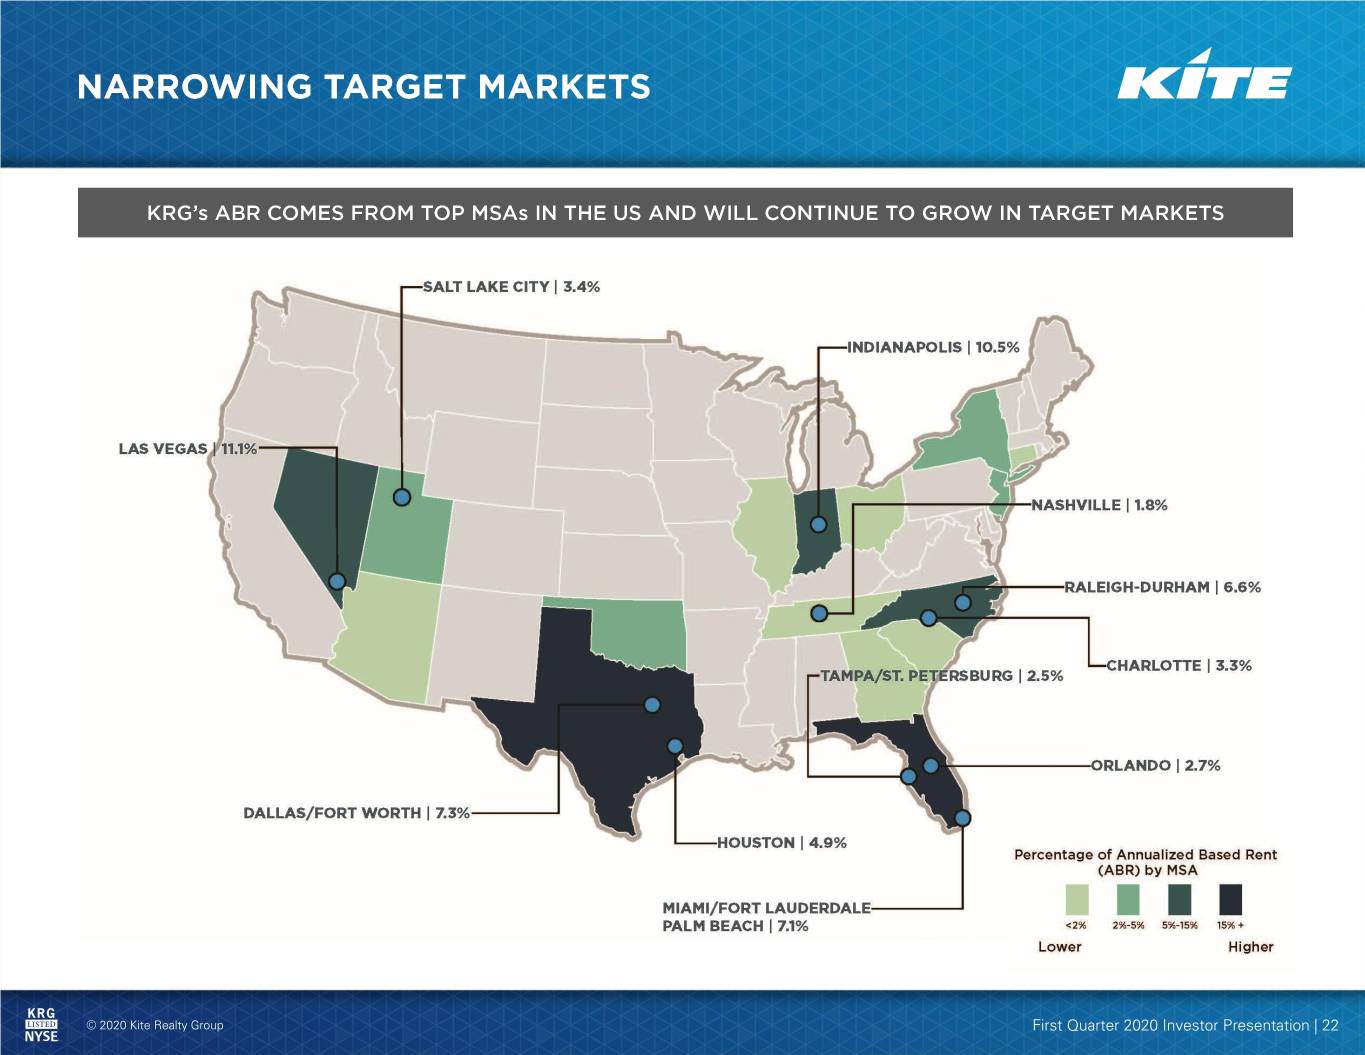
© 2020 Kite Realty Group First Quarter 2020 Investor Presentation | 22
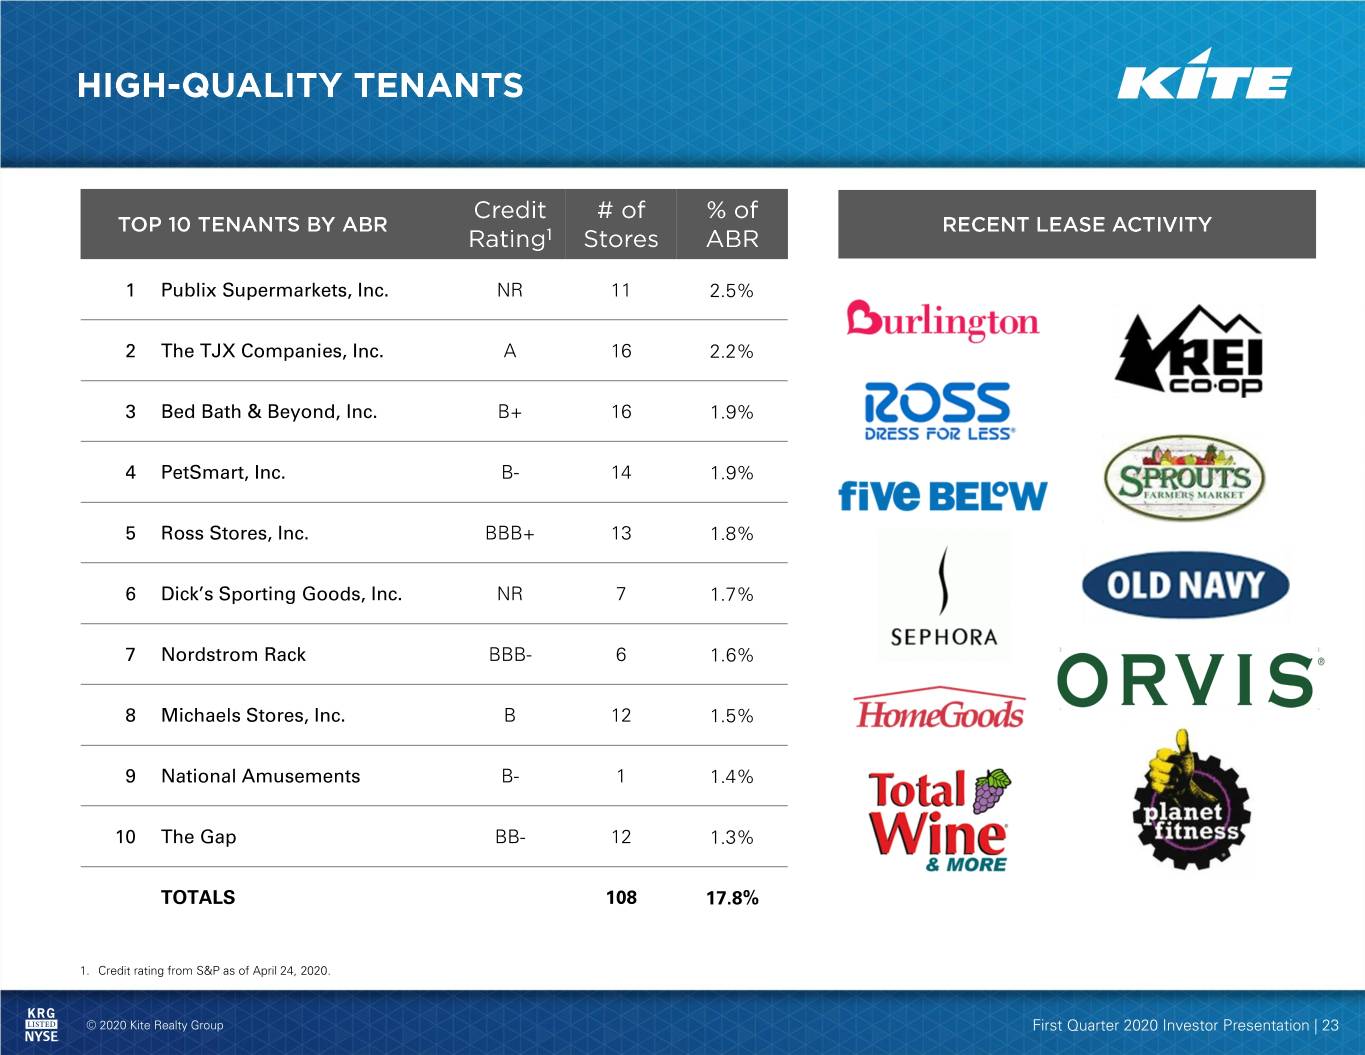
1 Publix Supermarkets, Inc. NR 11 2.5% 2 The TJX Companies, Inc. A 16 2.2% 3 Bed Bath & Beyond, Inc. B+ 16 1.9% 4 PetSmart, Inc. B- 14 1.9% 5 Ross Stores, Inc. BBB+ 13 1.8% 6 Dick’s Sporting Goods, Inc. NR 7 1.7% 7 Nordstrom Rack BBB- 6 1.6% 8 Michaels Stores, Inc. B 12 1.5% 9 National Amusements B- 1 1.4% 10 The Gap BB- 12 1.3% TOTALS 108 17.8% 1. Credit rating from S&P as of April 24, 2020. © 2020 Kite Realty Group First Quarter 2020 Investor Presentation | 23
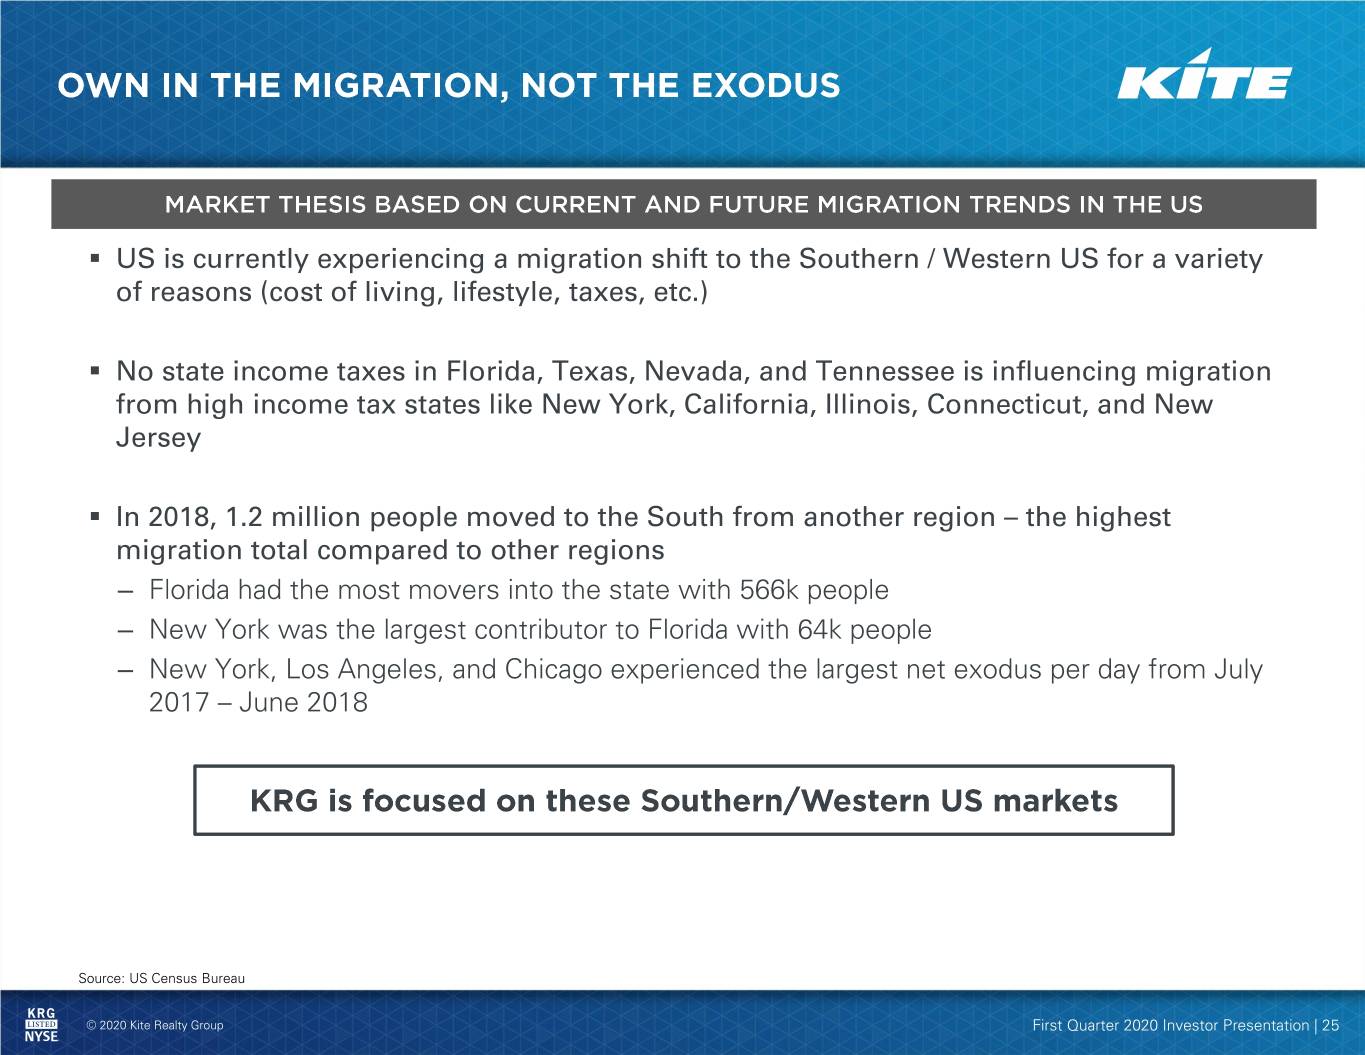
▪ US is currently experiencing a migration shift to the Southern / Western US for a variety of reasons (cost of living, lifestyle, taxes, etc.) ▪ No state income taxes in Florida, Texas, Nevada, and Tennessee is influencing migration from high income tax states like New York, California, Illinois, Connecticut, and New Jersey ▪ In 2018, 1.2 million people moved to the South from another region – the highest migration total compared to other regions – Florida had the most movers into the state with 566k people – New York was the largest contributor to Florida with 64k people – New York, Los Angeles, and Chicago experienced the largest net exodus per day from July 2017 – June 2018 Source: US Census Bureau © 2020 Kite Realty Group First Quarter 2020 Investor Presentation | 25
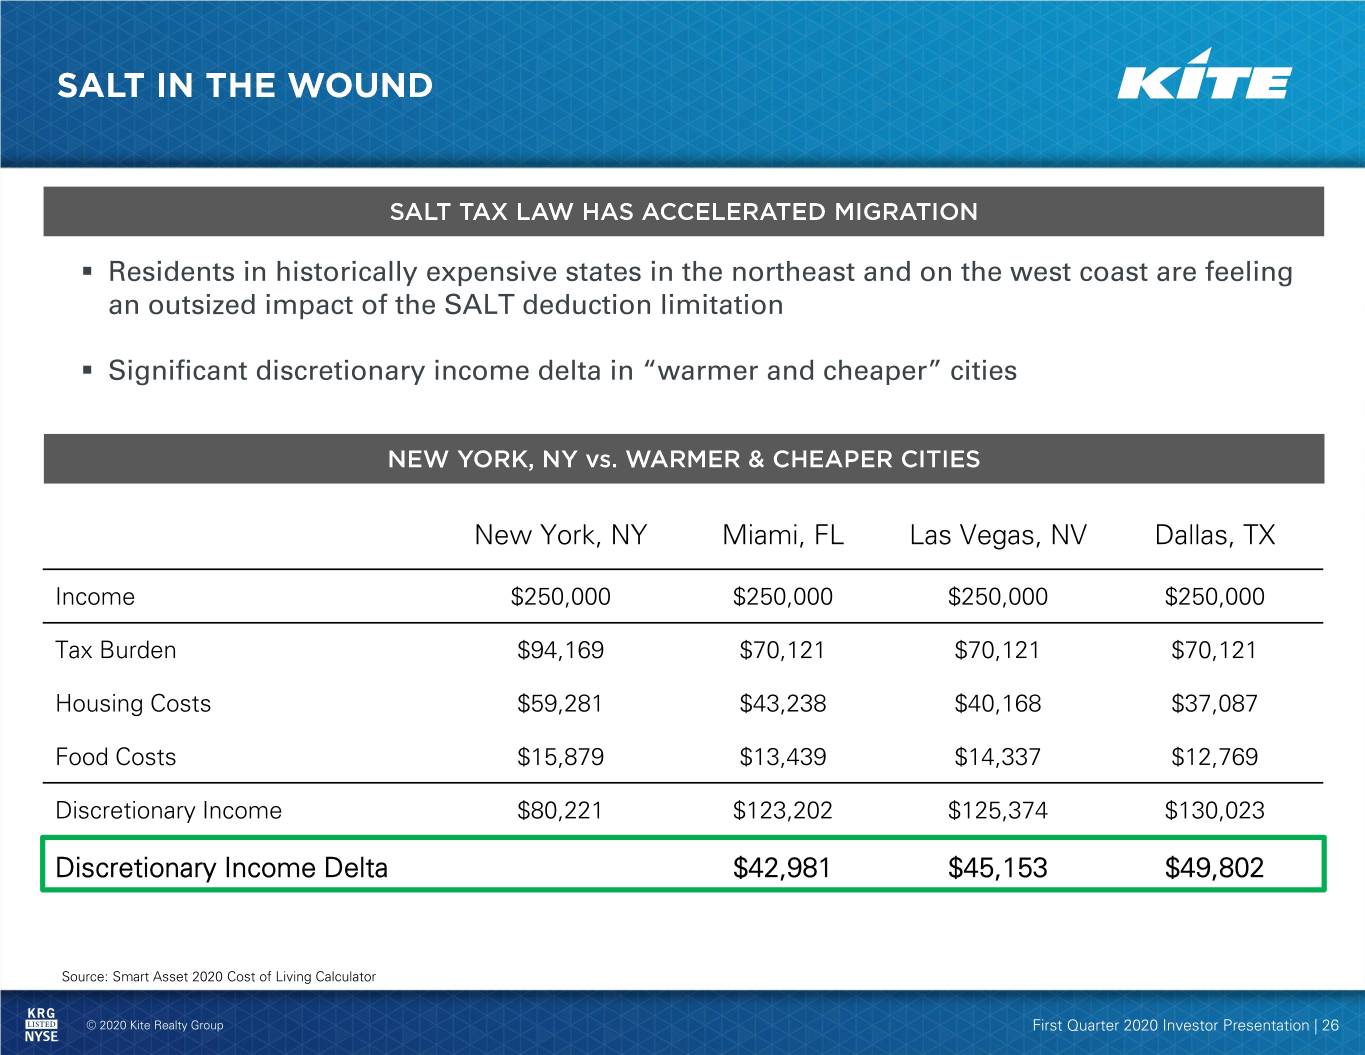
▪ Residents in historically expensive states in the northeast and on the west coast are feeling an outsized impact of the SALT deduction limitation ▪ Significant discretionary income delta in “warmer and cheaper” cities New York, NY Miami, FL Las Vegas, NV Dallas, TX Income $250,000 $250,000 $250,000 $250,000 Tax Burden $94,169 $70,121 $70,121 $70,121 Housing Costs $59,281 $43,238 $40,168 $37,087 Food Costs $15,879 $13,439 $14,337 $12,769 Discretionary Income $80,221 $123,202 $125,374 $130,023 Discretionary Income Delta $42,981 $45,153 $49,802 Source: Smart Asset 2020 Cost of Living Calculator © 2020 Kite Realty Group First Quarter 2020 Investor Presentation | 26
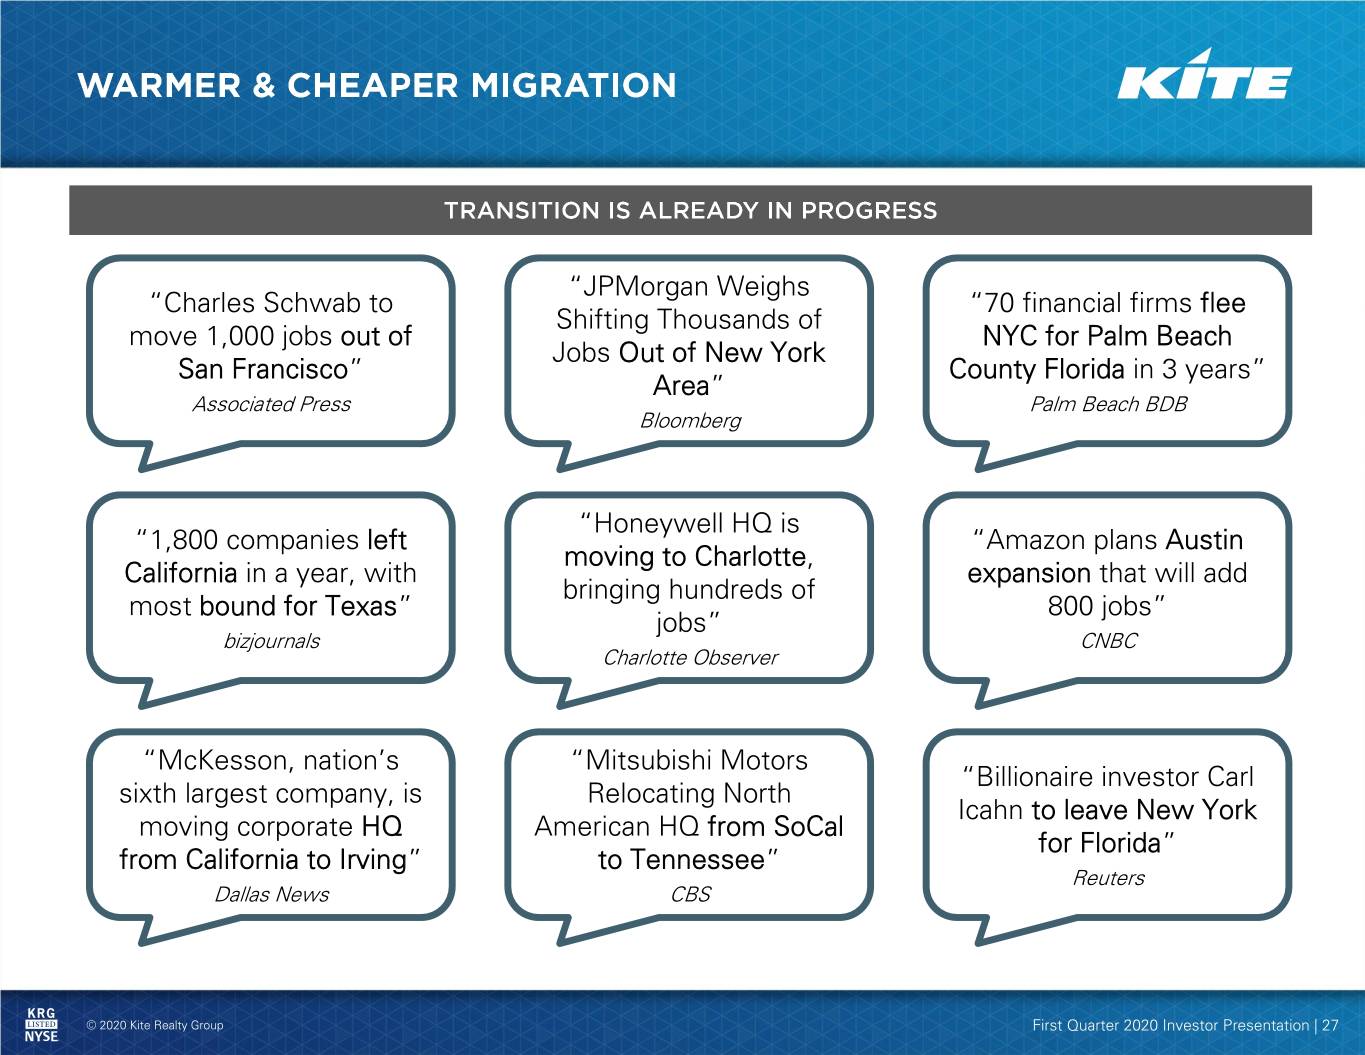
“JPMorgan Weighs “Charles Schwab to “70 financial firms flee Shifting Thousands of move 1,000 jobs out of NYC for Palm Beach Jobs Out of New York San Francisco” County Florida in 3 years” Area” Associated Press Palm Beach BDB Bloomberg “Honeywell HQ is “1,800 companies left “Amazon plans Austin moving to Charlotte, California in a year, with expansion that will add bringing hundreds of most bound for Texas” 800 jobs” jobs” bizjournals CNBC Charlotte Observer “McKesson, nation’s “Mitsubishi Motors “Billionaire investor Carl sixth largest company, is Relocating North Icahn to leave New York moving corporate HQ American HQ from SoCal for Florida” from California to Irving” to Tennessee” Reuters Dallas News CBS © 2020 Kite Realty Group First Quarter 2020 Investor Presentation | 27
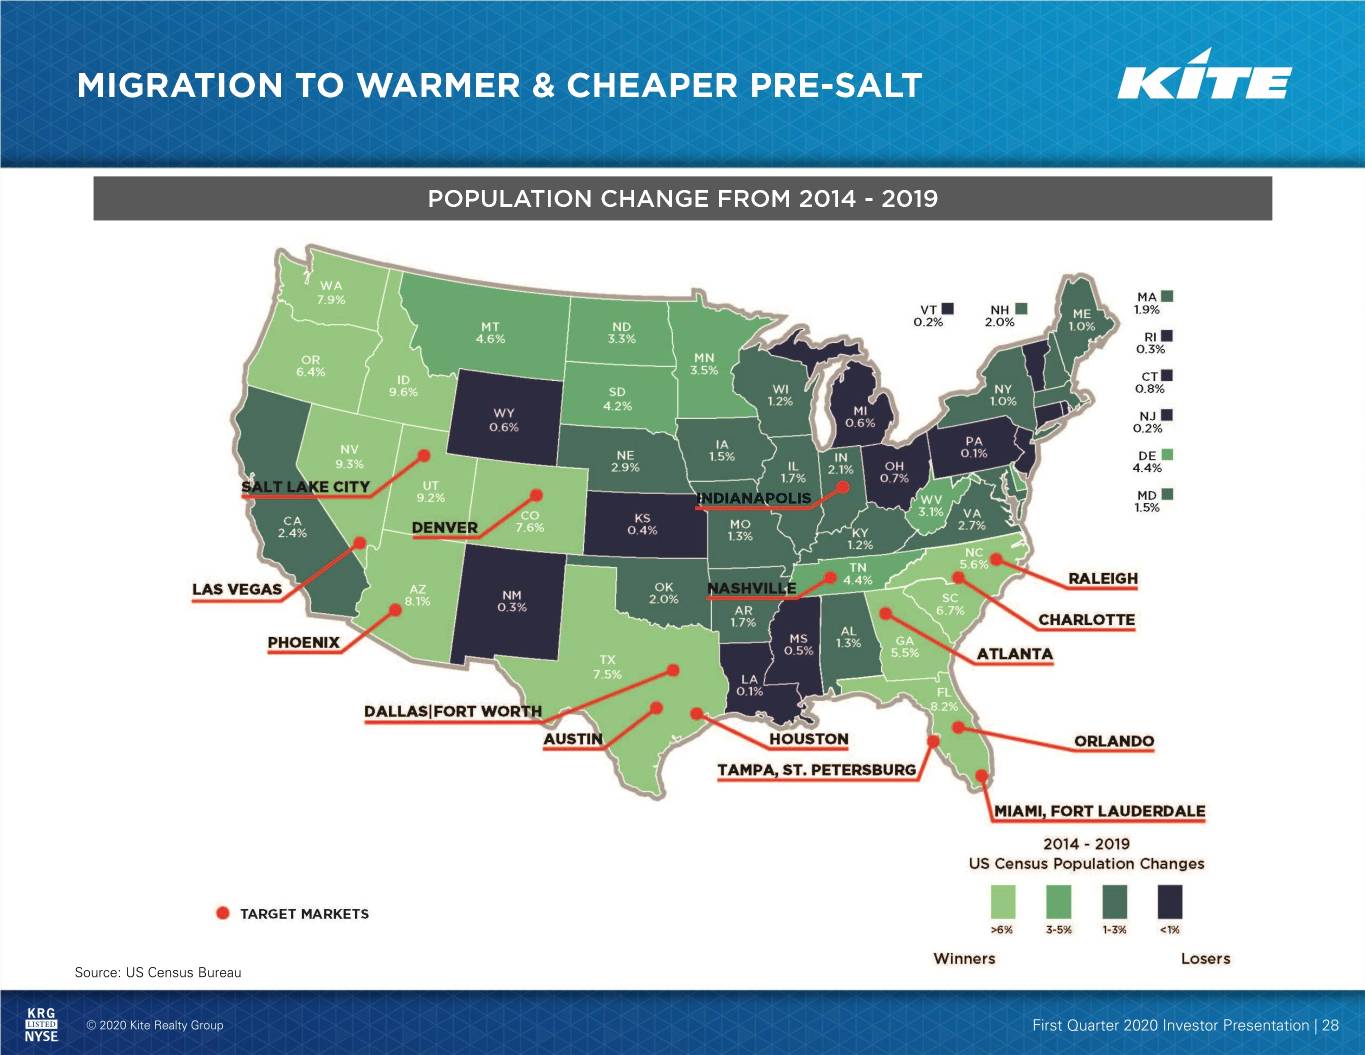
Source: US Census Bureau © 2020 Kite Realty Group First Quarter 2020 Investor Presentation | 28
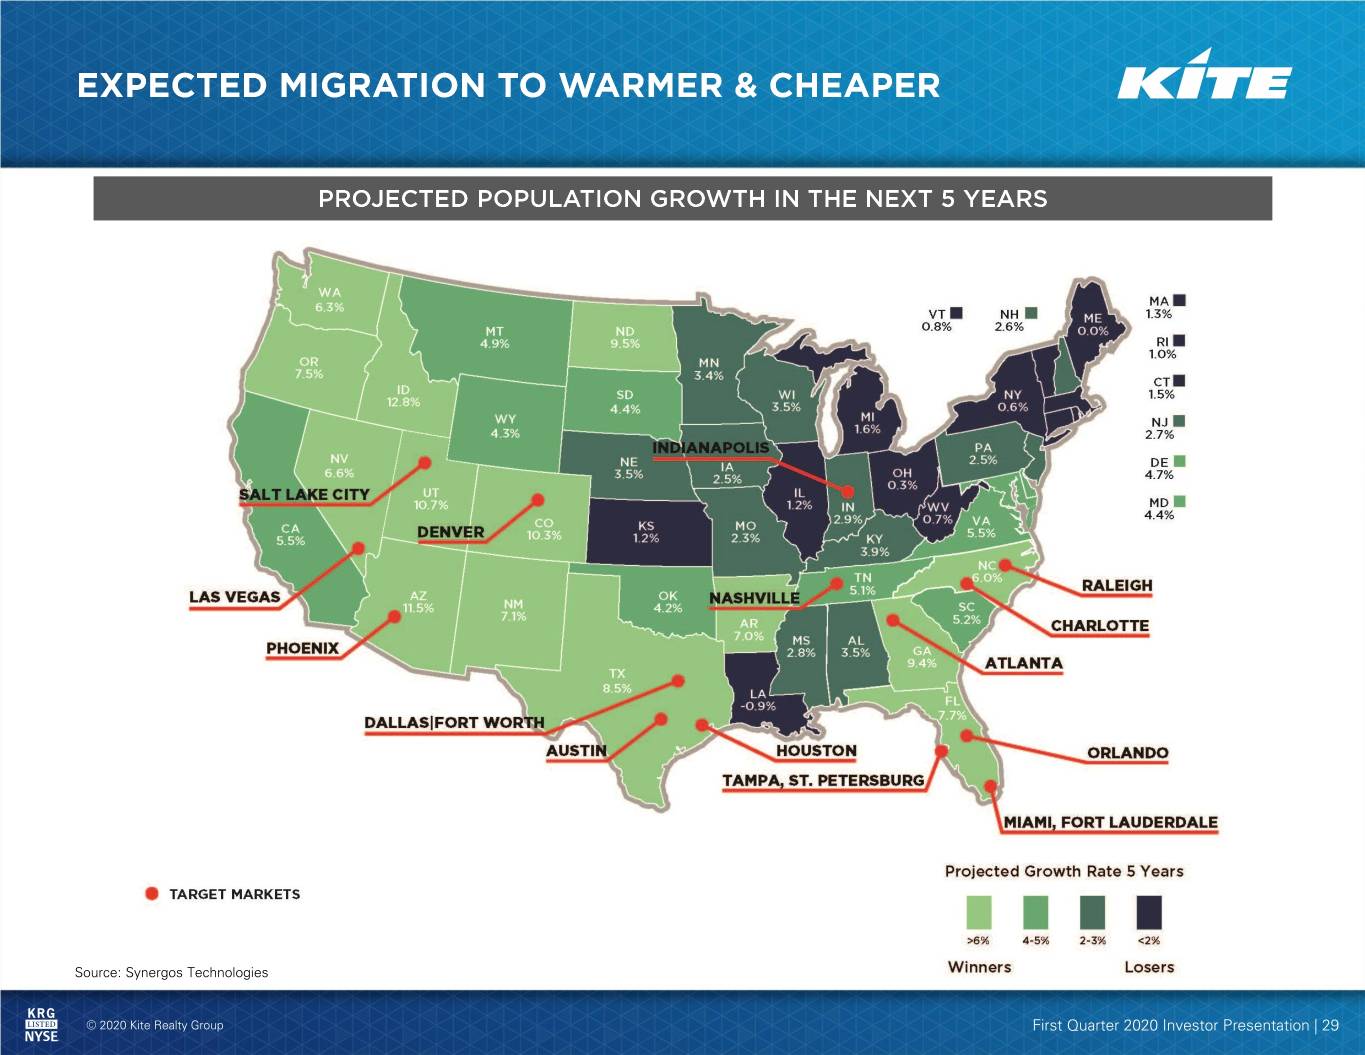
Source: Synergos Technologies © 2020 Kite Realty Group First Quarter 2020 Investor Presentation | 29
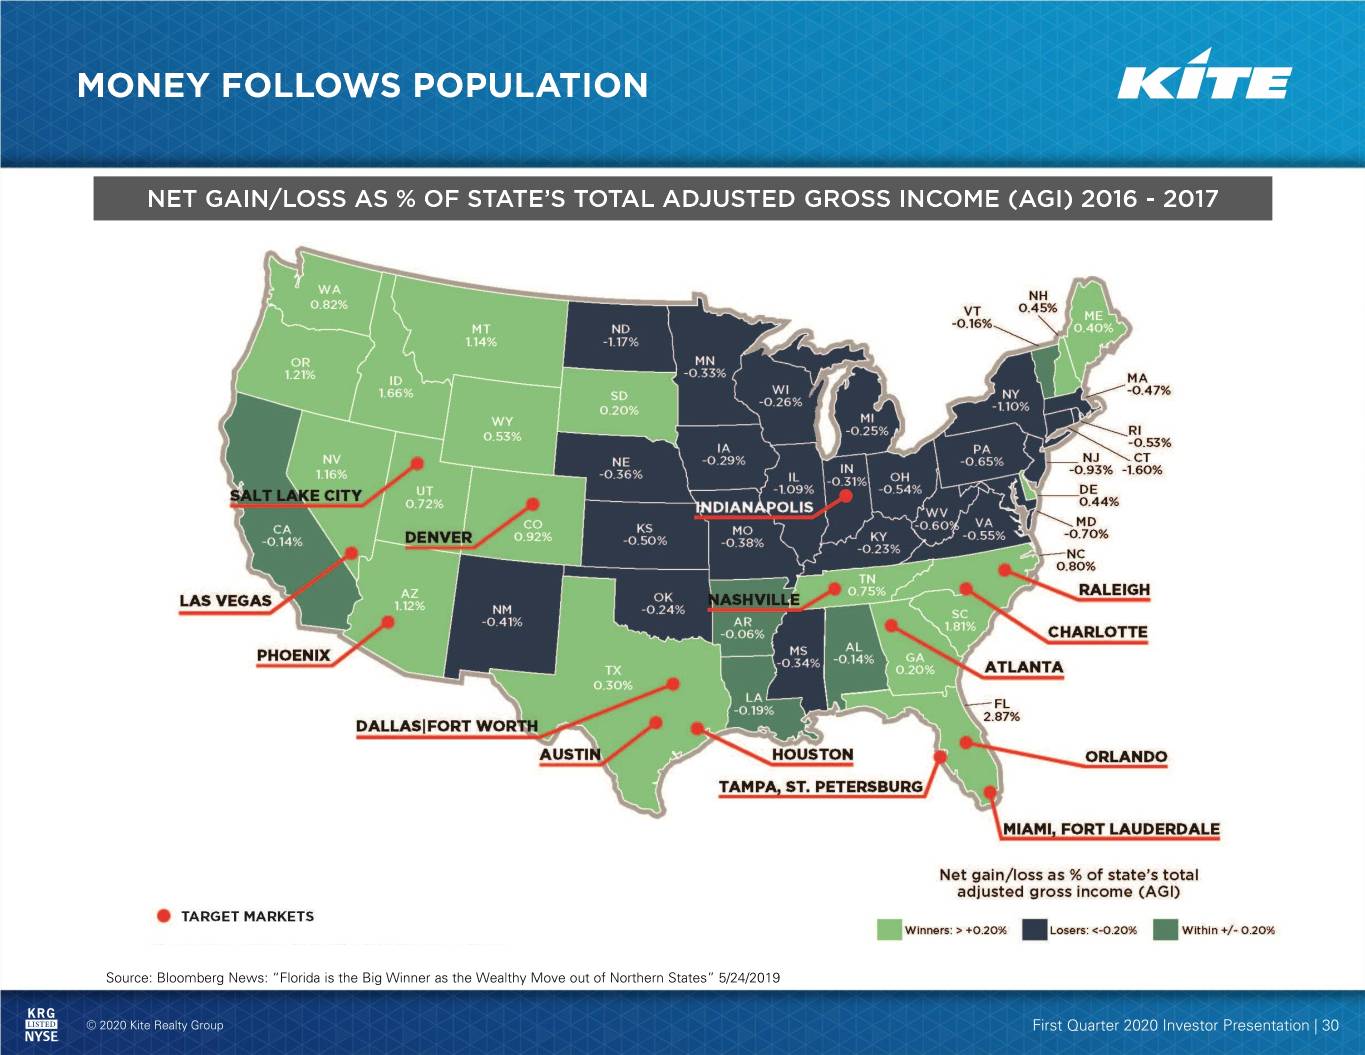
Source: Bloomberg News: “Florida is the Big Winner as the Wealthy Move out of Northern States” 5/24/2019 © 2020 Kite Realty Group First Quarter 2020 Investor Presentation | 30
Forward-Looking Statements This supplemental information package, together with other statements and information publicly disseminated by us, contains certain forward-looking statements within the meaning of Section 27A of the Securities Act of 1933 and Section 21E of the Securities Exchange Act of 1934. Such statements are based on assumptions and expectations that may not be realized and are inherently subject to risks, uncertainties and other factors, many of which cannot be predicted with accuracy and some of which might not even be anticipated. Future events and actual results, performance, transactions or achievements, financial or otherwise, may differ materially from the results, performance, transactions or achievements, financial or otherwise, expressed or implied by the forward-looking statements. Currently, one of the most significant factors that could cause actual outcomes to differ materially from the forward-looking statements is the potential adverse effect of the current pandemic of the novel coronavirus, or COVID-19, on the financial condition, result of operations, cash flows and performance of the Company and its tenants, the real estate market and the global economy and financial markets. The effects of COVID-19 have caused many of the Company’s tenants to close stores, reduce hours or significantly limit service, making it difficult for them to meet their obligations, and therefore will significantly impact the Company for the foreseeable future. The extent to which the COVID-19 pandemic impacts the Company and its tenants will depend on future developments, which are highly uncertain and cannot be predicted with confidence, including the scope, severity and duration of the pandemic, the actions taken to contain the pandemic or mitigate its impact, and the direct and indirect economic effects of the pandemic and containment measure, and possible short-term and long-term effects of the pandemic on consumer behavior, among others. Moreover, investors are cautioned to interpret many of the risks identified under the section titled “Risk Factors” in the Company’s Annual Report on Form 10-K for the fiscal year ended December 31, 2019 as being heightened as a result of the ongoing and numerous adverse impacts of the COVID-19 pandemic. Additional risks, uncertainties and other factors that might cause such differences, some of which could be material, include but are not limited to: • National and local economic, business, real estate and other market conditions, particularly in connection with low or negative growth in the U.S. economy as well as economic uncertainty; • Financing risks, including the availability of, and costs associated with, sources of liquidity; • Our ability to refinance, or extend the maturity dates of, our indebtedness; • The level and volatility of interest rates; • the financial stability of tenants, including their ability to pay rent and the risk of tenant insolvency and bankruptcy; • the competitive environment in which the Company operates; • acquisition, disposition, development and joint venture risks; • property ownership and management risks; • our ability to maintain our status as a real estate investment trust for U.S. federal income tax purposes; • potential environmental and other liabilities; • impairment in the value of real estate property the Company owns; • the actual and perceived impact of e-commerce on the value of shopping center assets; • risks related to the geographical concentration of our properties in Florida, Indiana, Texas, Nevada and North Carolina; • Civil unrest, acts of terrorism or war, acts of God, climate change, epidemics, pandemics (including COVID-19), natural disasters and severe weather conditions such as hurricanes, tropical storms, tornadoes, earthquakes, droughts, floods and fires that may result in underinsured or uninsured losses; • Changes in laws and government regulations; • Governmental orders affecting the use of our properties or the ability of our tenants to operate; • Insurance costs and coverage; • Risks associated with cybersecurity attacks and the loss of confidential information and other business disruptions; • Other factors affecting the real estate industry generally; and • Other risks identified in reports the Company files with the Securities and Exchange Commission (“the SEC”) or in other documents that it publicly disseminates, including, in particular, the section titled “Risk Factors” in our Annual Report on Form 10-K for the fiscal year ended December 31, 2019, and in our quarterly reports on Form 10-Q. The Company undertakes no obligation to publicly update or revise these forward-looking statements, whether as a result of new information, future events or otherwise. © 2020 Kite Realty Group First Quarter 2020 Investor Presentation | 31
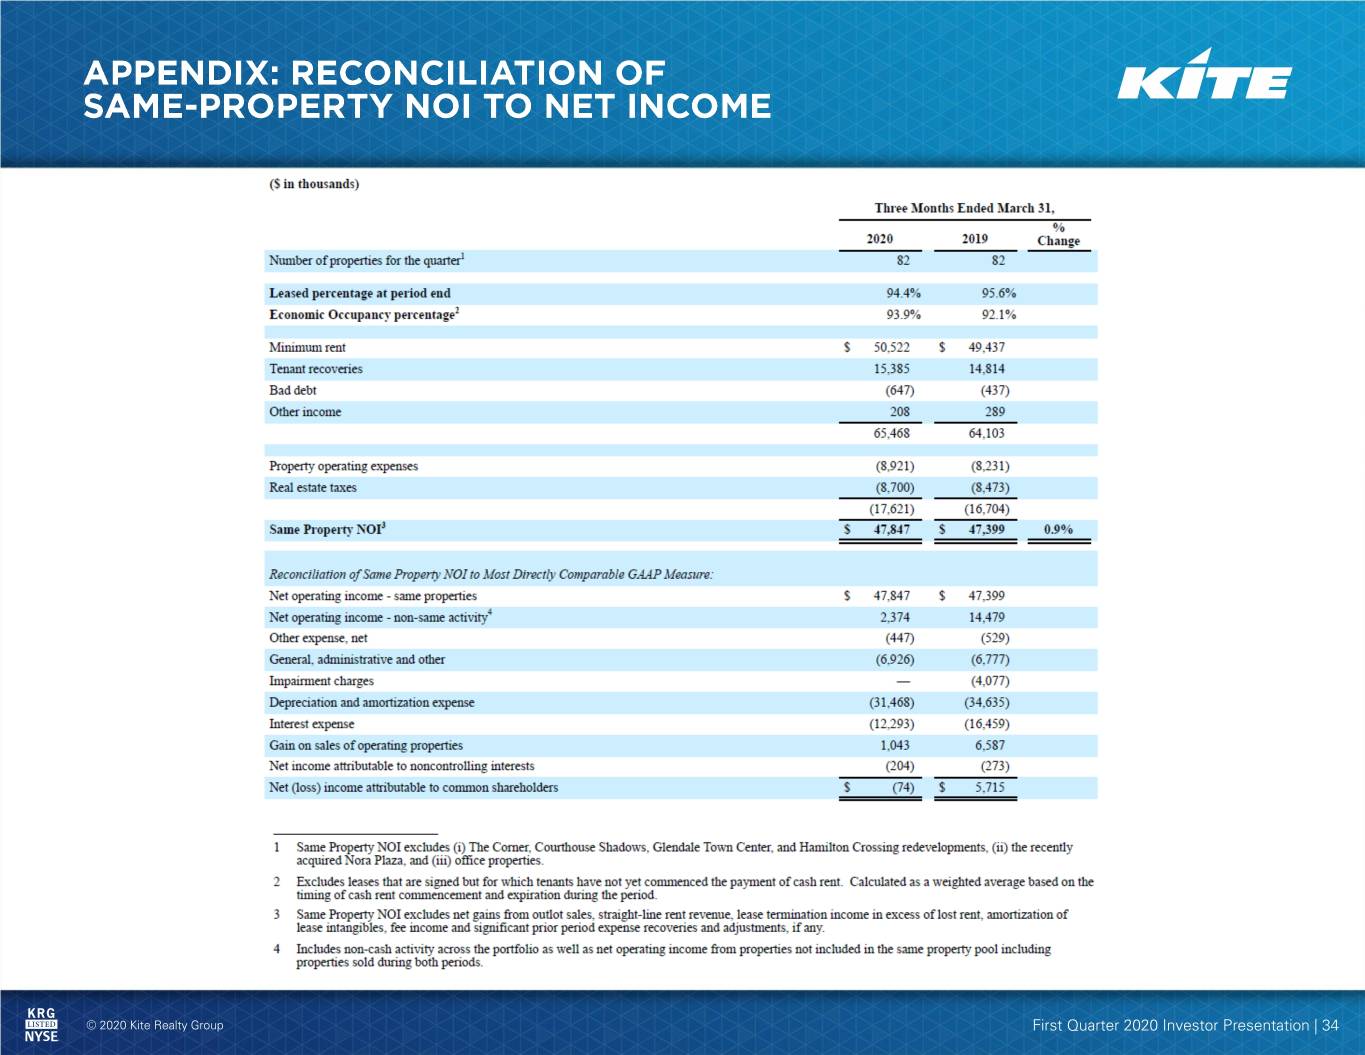
NET OPERATING INCOME AND SAME PROPERTY NET OPERATING INCOME The Company uses property net operating income (“NOI”), a non-GAAP financial measure, to evaluate the performance of our properties. The Company defines NOI as income from our real estate, including lease termination fees received from tenants, less our property operating expenses. NOI excludes amortization of capitalized tenant improvement costs and leasing commissions and certain corporate level expenses. The Company believes that NOI is helpful to investors as a measure of our operating performance because it excludes various items included in net income that do not relate to or are not indicative of our operating performance, such as depreciation and amortization, interest expense, and impairment, if any. The Company also uses same property NOI ("Same Property NOI"), a non-GAAP financial measure, to evaluate the performance of our properties. Same Property NOI excludes properties that have not been owned for the full period presented. It also excludes net gains from outlot sales, straight-line rent revenue, lease termination income in excess of lost rent, amortization of lease intangibles and significant prior period expense recoveries and adjustments, if any. When a lease is terminated in consideration for settlement, Same Property NOI will include the monthly rent until the earlier of 12 months or the start date of a replacement tenant. The Company believes that Same Property NOI is helpful to investors as a measure of our operating performance because it includes only the NOI of properties that have been owned and fully operational for the full quarters presented. The Company believes such presentation eliminates disparities in net income due to the acquisition or disposition of properties during the particular periods presented and thus provides a more consistent comparison of our properties. Same Property NOI includes the results of properties that have been owned for the entire current and prior year reporting periods. NOI and Same Property NOI should not, however, be considered as alternatives to net income (calculated in accordance with GAAP) as indicators of our financial performance. Our computation of NOI and Same Property NOI may differ from the methodology used by other REITs, and therefore may not be comparable to such other REITs. When evaluating the properties that are included in the same property pool, the Company has established specific criteria for determining the inclusion of properties acquired or those recently under development. An acquired property is included in the same property pool when there is a full quarter of operations in both years subsequent to the acquisition date. Development and redevelopment properties are included in the same property pool four full quarters after the properties have been transferred to the operating portfolio. A redevelopment property is first excluded from the same property pool when the execution of a redevelopment plan is likely and the Company a) begins recapturing space from tenants or b) the contemplated plan significantly impacts the operations of the property. For the quarter ended March 31, 2020, the Company excluded four redevelopment properties from the same property pool that met these criteria and were owned in both comparable periods. In addition, the Company excluded one recently acquired property from the same property pool. © 2020 Kite Realty Group First Quarter 2020 Investor Presentation | 32
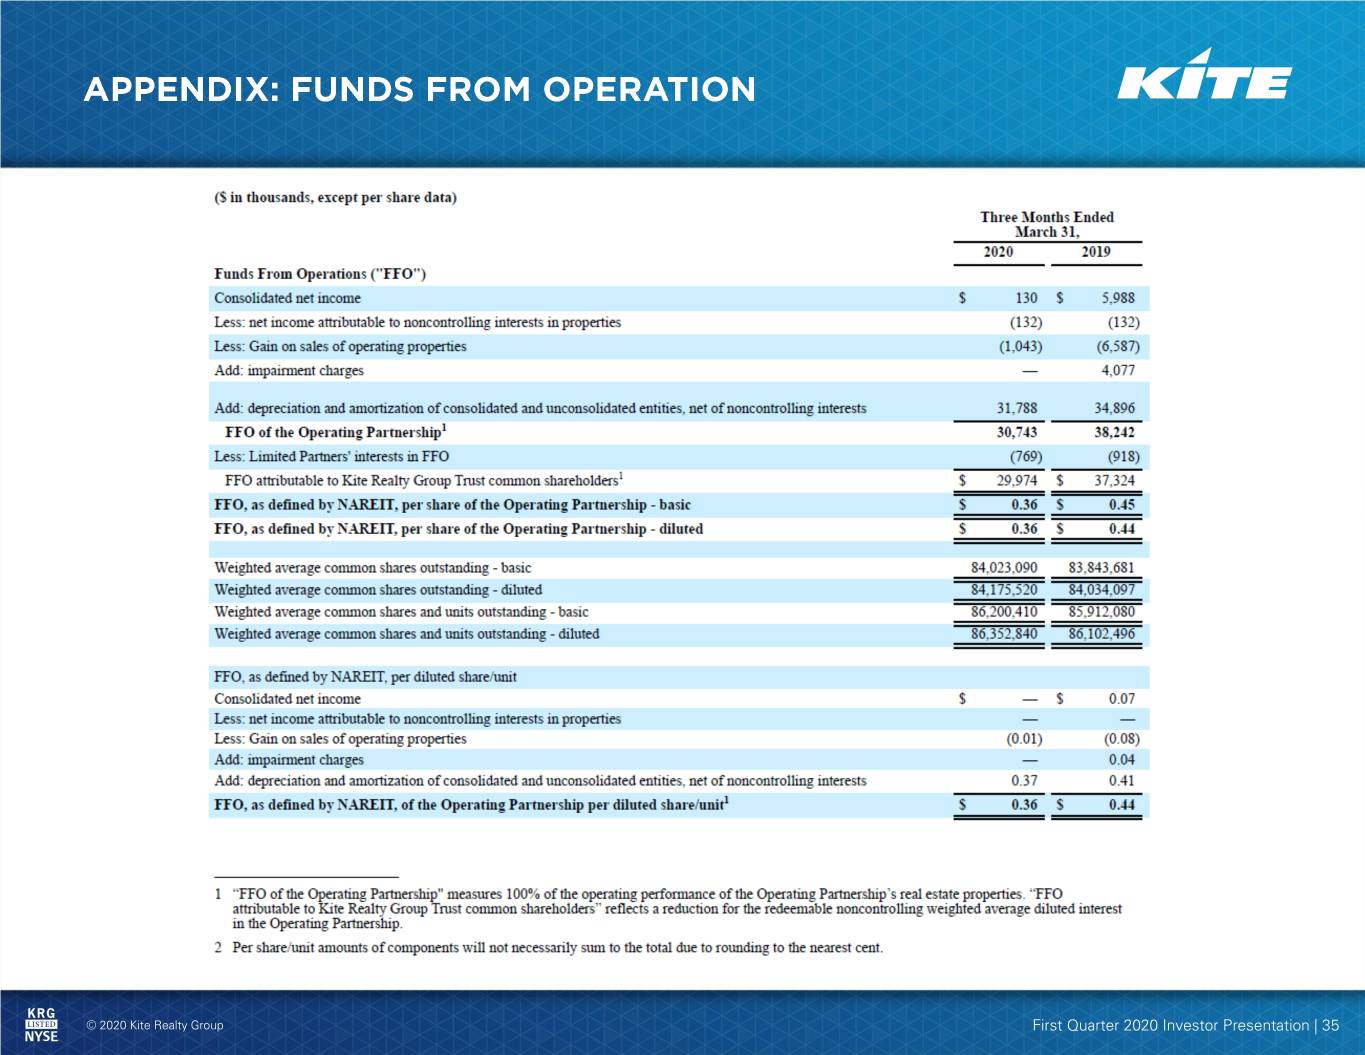
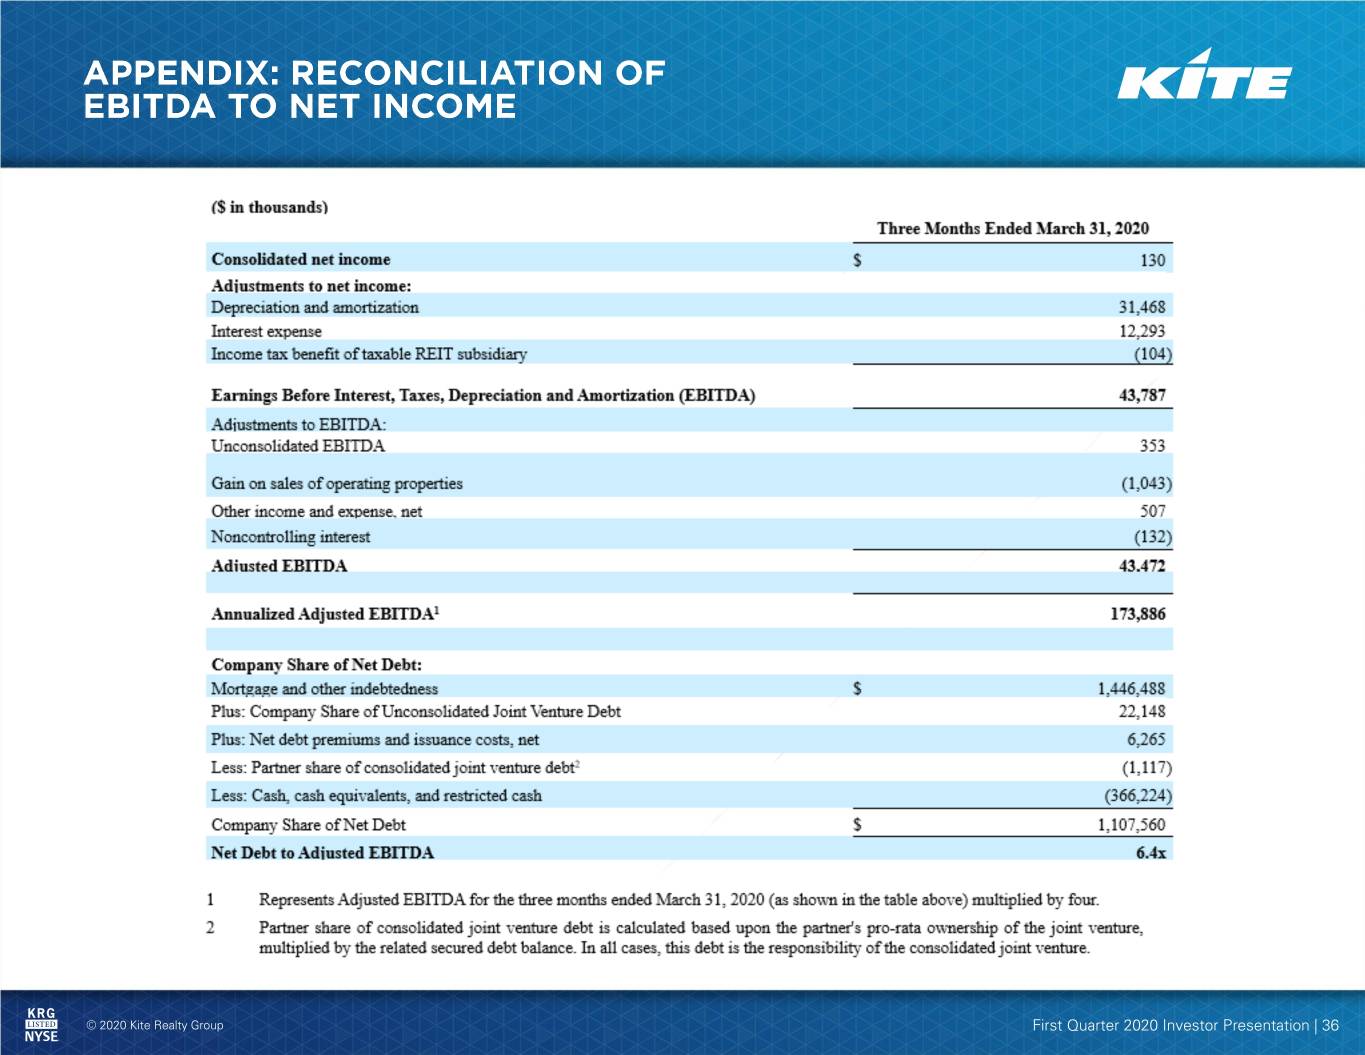
EBITDA The Company defines EBITDA, a non-GAAP financial measure, as net income before depreciation and amortization, interest expense and income tax expense of taxable REIT subsidiary. For informational purposes, the Company has also provided Adjusted EBITDA, which the Company defines as EBITDA less (i) EBITDA from unconsolidated entities, (ii) gains on sales of operating properties or impairment charges, (iii) other income and expense, (iv) noncontrolling interest EBITDA and (v) other non-recurring activity or items impacting comparability from period to period. Annualized Adjusted EBITDA is Adjusted EBITDA for the most recent quarter multiplied by four. Net Debt to Adjusted EBITDA is the Company's share of net debt divided by Annualized Adjusted EBITDA. EBITDA, Adjusted EBITDA, Annualized Adjusted EBITDA and Net Debt to Adjusted EBITDA, as calculated by us, are not comparable to EBITDA and EBITDA-related measures reported by other REITs that do not define EBITDA and EBITDA-related measures exactly as we do. EBITDA, Adjusted EBITDA and Annualized Adjusted EBITDA do not represent cash generated from operating activities in accordance with GAAP, and should not be considered alternatives to net income as an indicator of performance or as alternatives to cash flows from operating activities as an indicator of liquidity. Considering the nature of our business as a real estate owner and operator, the Company believes that EBITDA, Adjusted EBITDA and the ratio of Net Debt to Adjusted EBITDA are helpful to investors in measuring our operational performance because they exclude various items included in net income that do not relate to or are not indicative of our operating performance, such as gains or losses from sales of depreciated property and depreciation and amortization, which can make periodic and peer analyses of operating performance more difficult. For informational purposes, the Company has also provided Annualized Adjusted EBITDA, adjusted as described above. The Company believes this supplemental information provides a meaningful measure of our operating performance. The Company believes presenting EBITDA and the related measures in this manner allows investors and other interested parties to form a more meaningful assessment of our operating results. FUNDS FROM OPERATIONS Funds from Operations (FFO) is a widely used performance measure for real estate companies and is provided here as a supplemental measure of operating performance. The Company calculates FFO, a non-GAAP financial measure, in accordance with the best practices described in the April 2002 National Policy Bulletin of the National Association of Real Estate Investment Trusts ("NAREIT"), as restated in 2018. The NAREIT white paper defines FFO as net income (calculated in accordance with GAAP), excluding depreciation and amortization related to real estate, gains and losses from the sale of certain real estate assets, gains and losses from change in control, and impairment write-downs of certain real estate assets and investments in entities when the impairment is directly attributable to decreases in the value of depreciable real estate held by the entity. Considering the nature of our business as a real estate owner and operator, the Company believes that FFO is helpful to investors in measuring our operational performance because it excludes various items included in net income that do not relate to or are not indicative of our operating performance, such as gains or losses from sales of depreciated property and depreciation and amortization, which can make periodic and peer analyses of operating performance more difficult. FFO (a) should not be considered as an alternative to net income (calculated in accordance with GAAP) for the purpose of measuring our financial performance, (b) is not an alternative to cash flow from operating activities (calculated in accordance with GAAP) as a measure of our liquidity, and (c) is not indicative of funds available to satisfy our cash needs, including our ability to make distributions. Our computation of FFO may not be comparable to FFO reported by other REITs that do not define the term in accordance with the current NAREIT definition or that interpret the current NAREIT definition differently than we do. For informational purposes, we have also provided FFO adjusted for loss on debt extinguishment. A reconciliation of net income (calculated in accordance with GAAP) to FFO is included elsewhere in this Financial Supplement. From time to time, the Company may report or provide guidance with respect to “NAREIT FFO as adjusted” which removes the impact of certain non-recurring and non- operating transactions or other items the Company does not consider to be representative of its core operating results including without limitation, gains or losses associated with the early extinguishment of debt, gains or losses associated with litigation involving the Company that is not in the normal course of business, the impact on earnings from executive separation, and the excess of redemption value over carrying value of preferred stock redemption, which are not otherwise adjusted in the Company’s calculation of FFO. © 2020 Kite Realty Group First Quarter 2020 Investor Presentation | 33
© 2020 Kite Realty Group First Quarter 2020 Investor Presentation | 34
© 2020 Kite Realty Group First Quarter 2020 Investor Presentation | 35
© 2020 Kite Realty Group First Quarter 2020 Investor Presentation | 36
