Attached files
| file | filename |
|---|---|
| 8-K - 8-K - KIMBALL INTERNATIONAL INC | kbal-20200505.htm |
| EX-99.1 - KIMBALL INTERNATIONAL, INC. EX-99.1 - KIMBALL INTERNATIONAL INC | a8kexhibit991pressrele.htm |
Exhibit 99.2 Q3 FY20 Earnings and Strategy Update May 6, 2020
Certain statements contained within this release are considered forward- Safe Harbor looking under the Private Securities Litigation Reform Act of 1995. These statements generally can be identified by the use of words or Statement phrases, including, but not limited to, “intend,” “anticipate,” “believe,” “estimate,” “project,” “target,” “plan,” “expect,” “setting up,” “beginning to,” “will,” “should,” “would,” “resume” or similar statements. We caution that forward-looking statements are subject to known and unknown risks and uncertainties that may cause the Company’s actual future results and performance to differ materially from expected results including, but not limited to, the risk that any projections or guidance, including revenues, margins, earnings, or any other financial results are not realized, adverse changes in the global economic conditions, the impact of changes in tariffs, increased global competition, significant reduction in customer order patterns, loss of key suppliers, loss of or significant volume reductions from key contract customers, financial stability of key customers and suppliers, relationships with strategic customers and product distributors, availability or cost of raw materials and components, changes in the regulatory environment, global health concerns (including the impact of the COVID-19 outbreak), or similar unforeseen events. Additional cautionary statements regarding other risk factors that could have an effect on the future performance of the Company are contained in the Company’s Form 10-K filing for the fiscal year ended June 30, 2019 and other filings with the Securities and Exchange Commission. 2
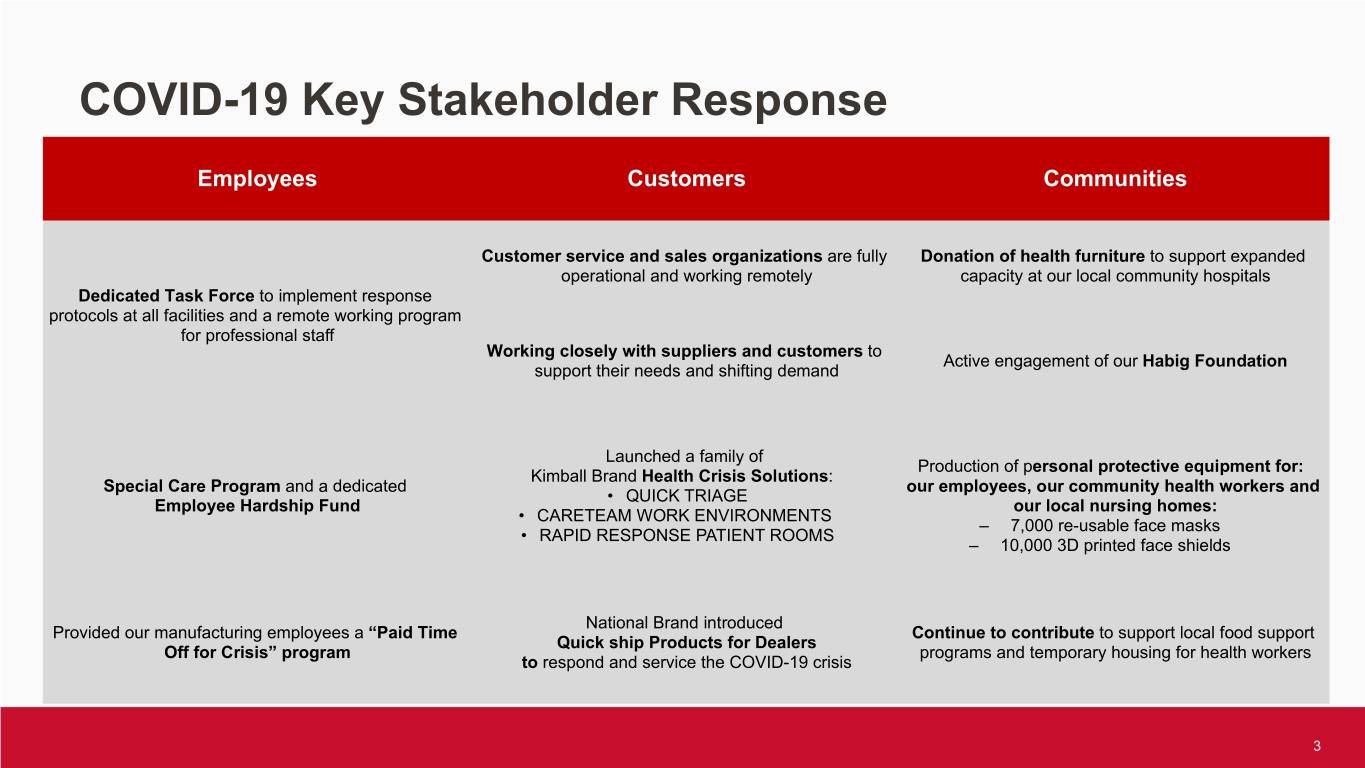
COVID-19 Key Stakeholder Response Employees Customers Communities Customer service and sales organizations are fully Donation of health furniture to support expanded operational and working remotely capacity at our local community hospitals Dedicated Task Force to implement response protocols at all facilities and a remote working program for professional staff Working closely with suppliers and customers to Active engagement of our Habig Foundation support their needs and shifting demand Launched a family of Production of personal protective equipment for: Kimball Brand Health Crisis Solutions: Special Care Program and a dedicated our employees, our community health workers and • QUICK TRIAGE Employee Hardship Fund our local nursing homes: • CARETEAM WORK ENVIRONMENTS – 7,000 re-usable face masks • RAPID RESPONSE PATIENT ROOMS – 10,000 3D printed face shields National Brand introduced Provided our manufacturing employees a “Paid Time Continue to contribute to support local food support Quick ship Products for Dealers Off for Crisis” program programs and temporary housing for health workers to respond and service the COVID-19 crisis 3
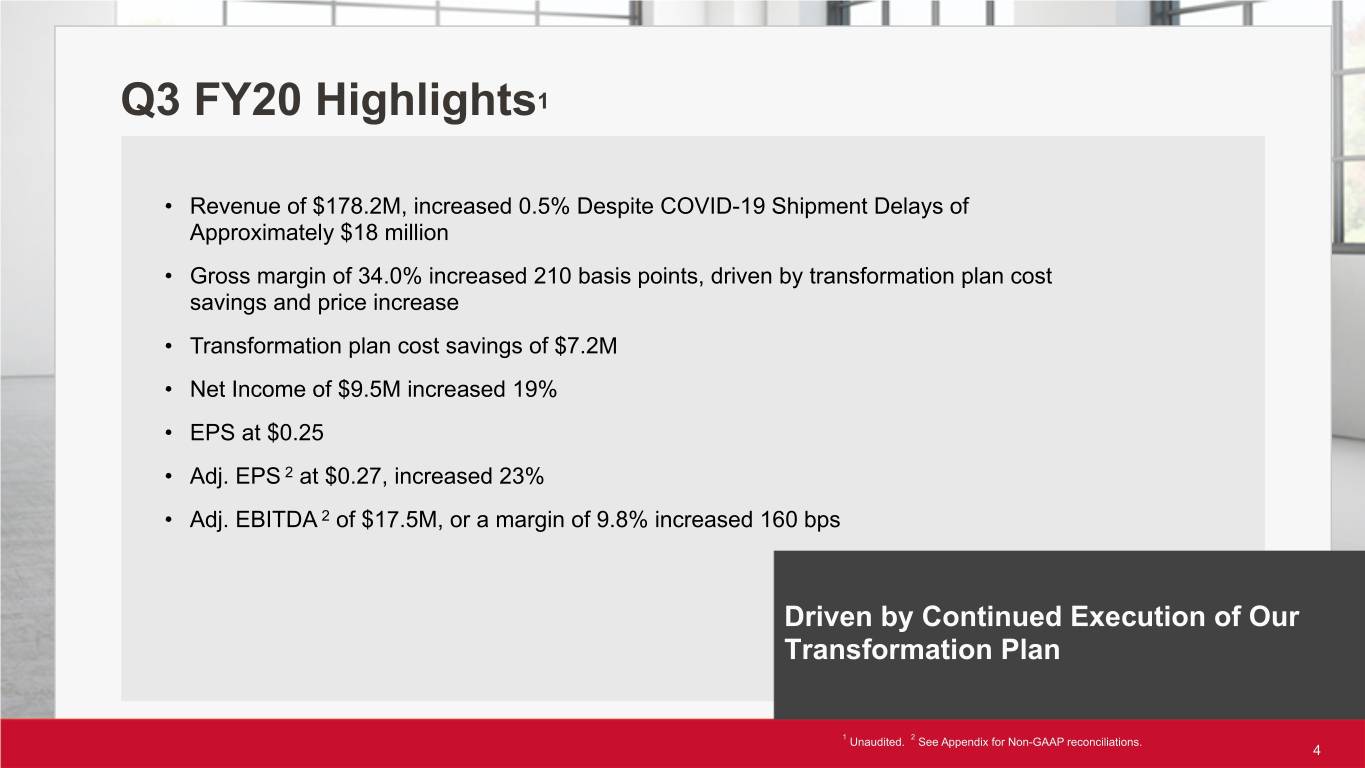
Q3 FY20 Highlights1 • Revenue of $178.2M, increased 0.5% Despite COVID-19 Shipment Delays of Approximately $18 million • Gross margin of 34.0% increased 210 basis points, driven by transformation plan cost savings and price increase • Transformation plan cost savings of $7.2M • Net Income of $9.5M increased 19% • EPS at $0.25 • Adj. EPS 2 at $0.27, increased 23% • Adj. EBITDA 2 of $17.5M, or a margin of 9.8% increased 160 bps Driven by Continued Execution of Our Transformation Plan 1 Unaudited. 2 See Appendix for Non-GAAP reconciliations. 4
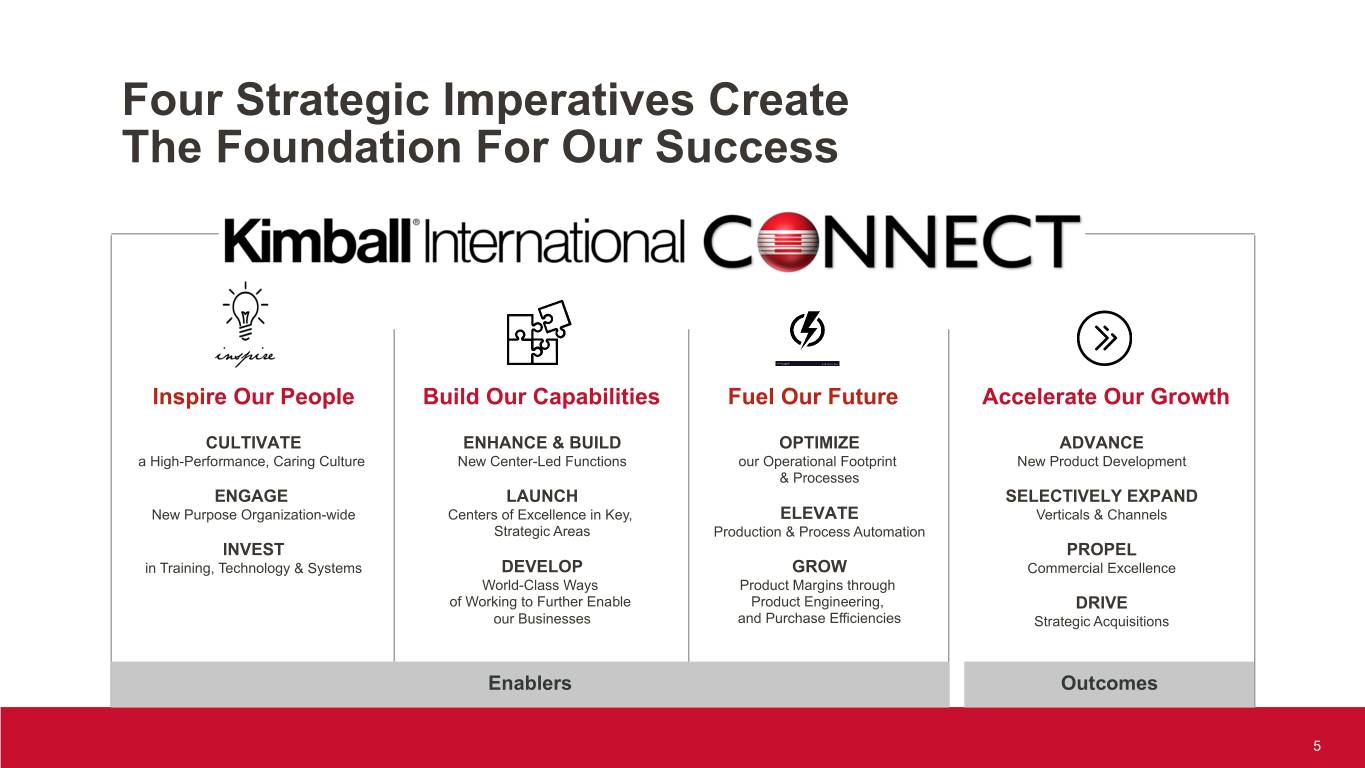
Four Strategic Imperatives Create The Foundation For Our Success Inspire Our People Build Our Capabilities Fuel Our Future Accelerate Our Growth CULTIVATE ENHANCE & BUILD OPTIMIZE ADVANCE a High-Performance, Caring Culture New Center-Led Functions our Operational Footprint New Product Development & Processes ENGAGE LAUNCH SELECTIVELY EXPAND New Purpose Organization-wide Centers of Excellence in Key, ELEVATE Verticals & Channels Strategic Areas Production & Process Automation INVEST PROPEL in Training, Technology & Systems DEVELOP GROW Commercial Excellence World-Class Ways Product Margins through of Working to Further Enable Product Engineering, DRIVE our Businesses and Purchase Efficiencies Strategic Acquisitions Enablers Outcomes 5
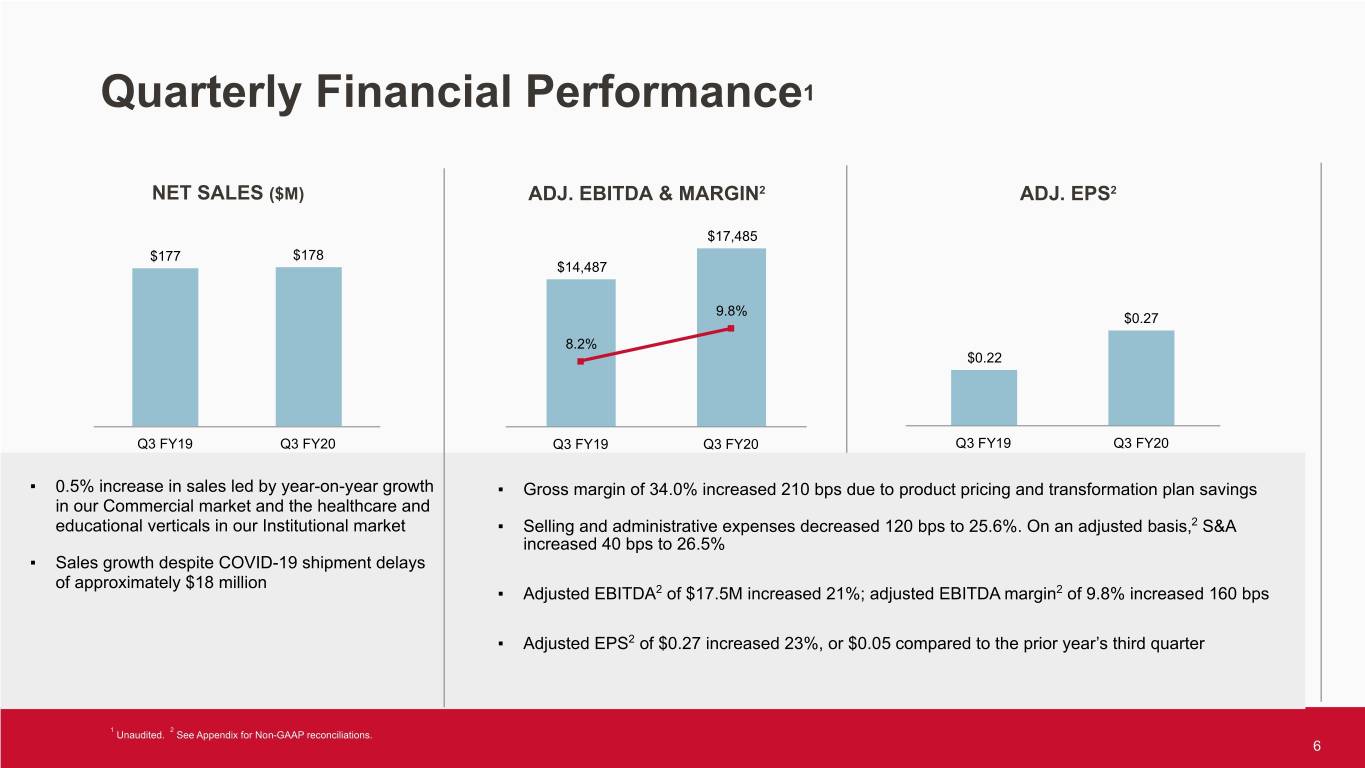
Quarterly Financial Performance1 NET SALES ($M) ADJ. EBITDA & MARGIN2 ADJ. EPS2 $17,485 $177 $178 $14,487 9.8% $0.27 8.2% $0.22 Q3 FY19 Q3 FY20 Q3 FY19 Q3 FY20 Q3 FY19 Q3 FY20 ▪ 0.5% increase in sales led by year-on-year growth ▪ Gross margin of 34.0% increased 210 bps due to product pricing and transformation plan savings in our Commercial market and the healthcare and educational verticals in our Institutional market ▪ Selling and administrative expenses decreased 120 bps to 25.6%. On an adjusted basis,2 S&A increased 40 bps to 26.5% ▪ Sales growth despite COVID-19 shipment delays of approximately $18 million ▪ Adjusted EBITDA2 of $17.5M increased 21%; adjusted EBITDA margin2 of 9.8% increased 160 bps ▪ Adjusted EPS2 of $0.27 increased 23%, or $0.05 compared to the prior year’s third quarter 1 2 Unaudited. See Appendix for Non-GAAP reconciliations. 6
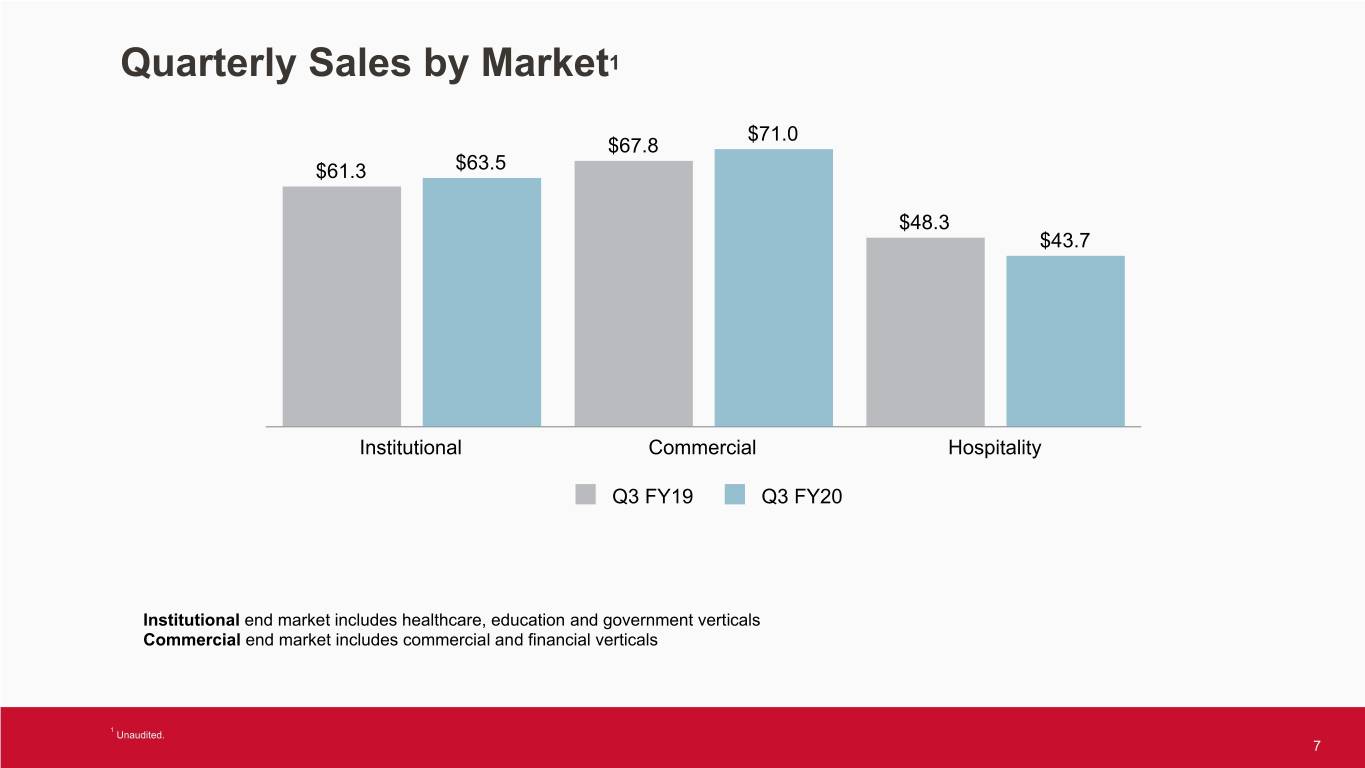
Quarterly Sales by Market1 $71.0 $67.8 $61.3 $63.5 $48.3 $43.7 Institutional Commercial Hospitality Q3 FY19 Q3 FY20 Institutional end market includes healthcare, education and government verticals Commercial end market includes commercial and financial verticals 1 Unaudited. 7
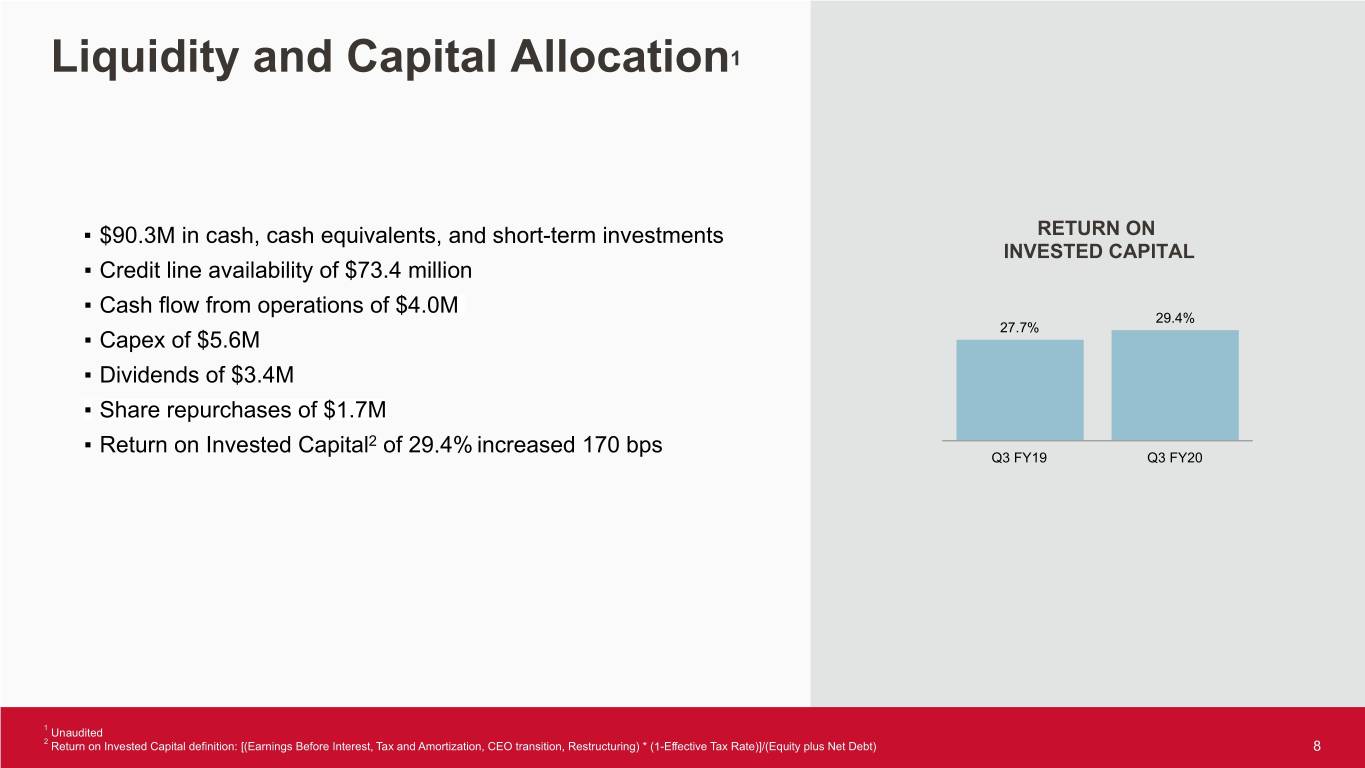
Liquidity and Capital Allocation1 ▪ $90.3M in cash, cash equivalents, and short-term investments RETURN ON INVESTED CAPITAL ▪ Credit line availability of $73.4 million ▪ Cash flow from operations of $4.0M 29.4% 27.7% ▪ Capex of $5.6M ▪ Dividends of $3.4M ▪ Share repurchases of $1.7M ▪ Return on Invested Capital2 of 29.4% increased 170 bps Q3 FY19 Q3 FY20 1 Unaudited 2 Return on Invested Capital definition: [(Earnings Before Interest, Tax and Amortization, CEO transition, Restructuring) * (1-Effective Tax Rate)]/(Equity plus Net Debt) 8
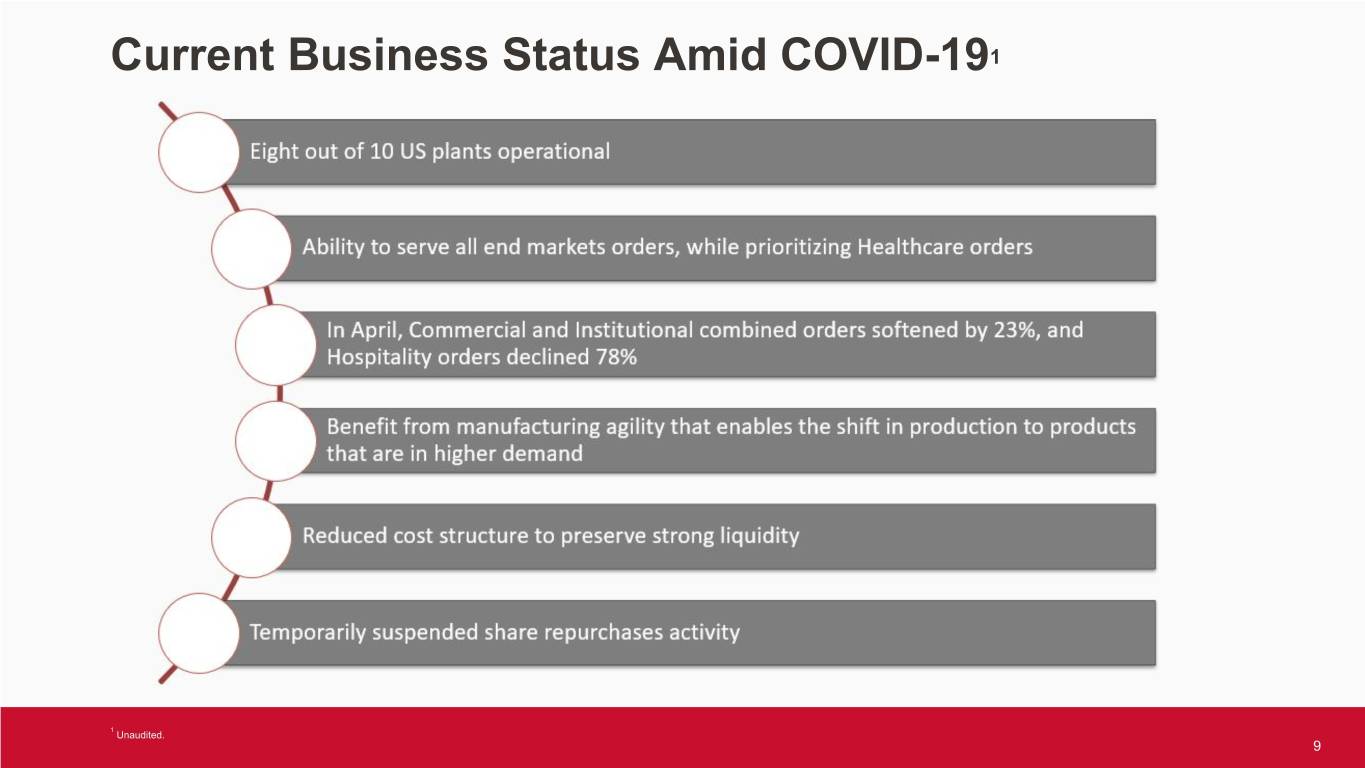
Current Business Status Amid COVID-191 1 Unaudited. 9
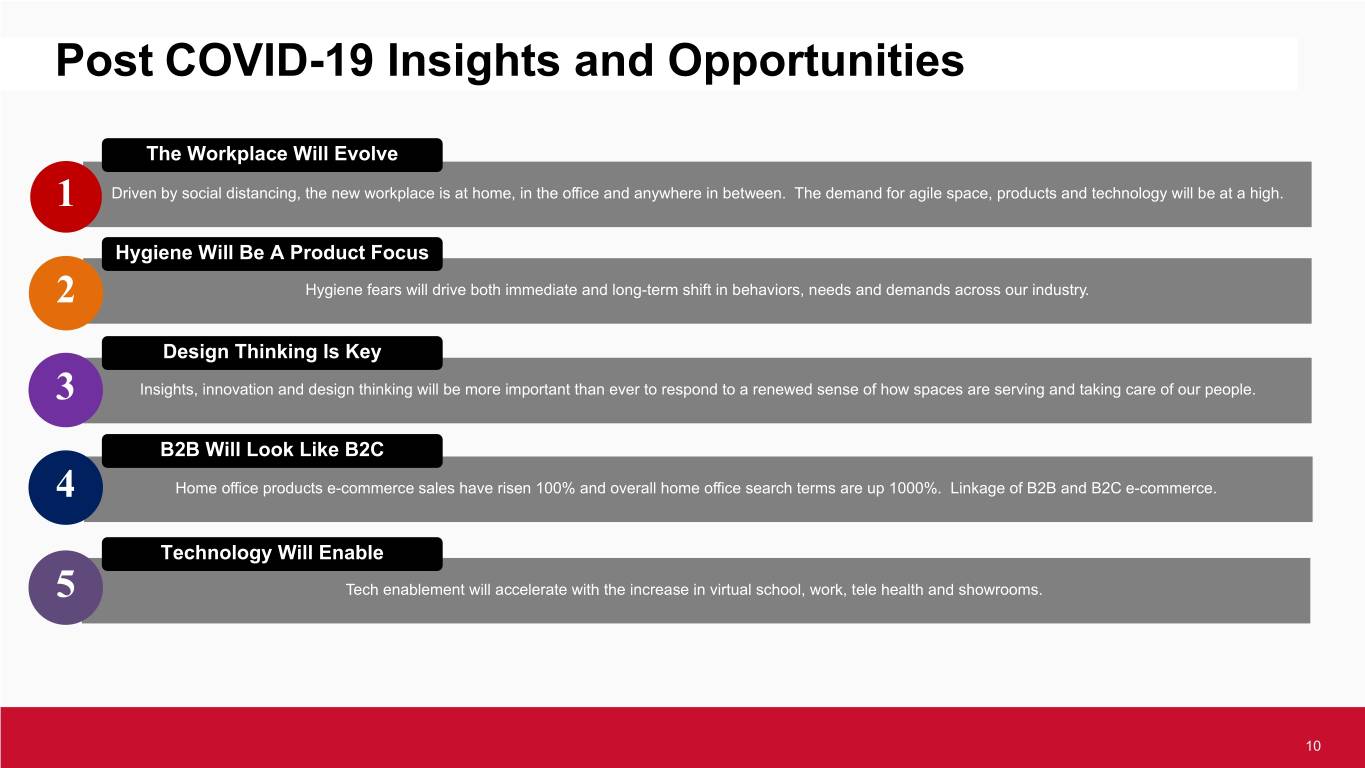
Post COVID-19 Insights and Opportunities The Workplace Will Evolve 1 Driven by social distancing, the new workplace is at home, in the office and anywhere in between. The demand for agile space, products and technology will be at a high. Hygiene Will Be A Product Focus 2 Hygiene fears will drive both immediate and long-term shift in behaviors, needs and demands across our industry. Design Thinking Is Key 3 Insights, innovation and design thinking will be more important than ever to respond to a renewed sense of how spaces are serving and taking care of our people. B2B Will Look Like B2C 4 Home office products e-commerce sales have risen 100% and overall home office search terms are up 1000%. Linkage of B2B and B2C e-commerce. Technology Will Enable 5 Tech enablement will accelerate with the increase in virtual school, work, tele health and showrooms. 10
Appendix 11
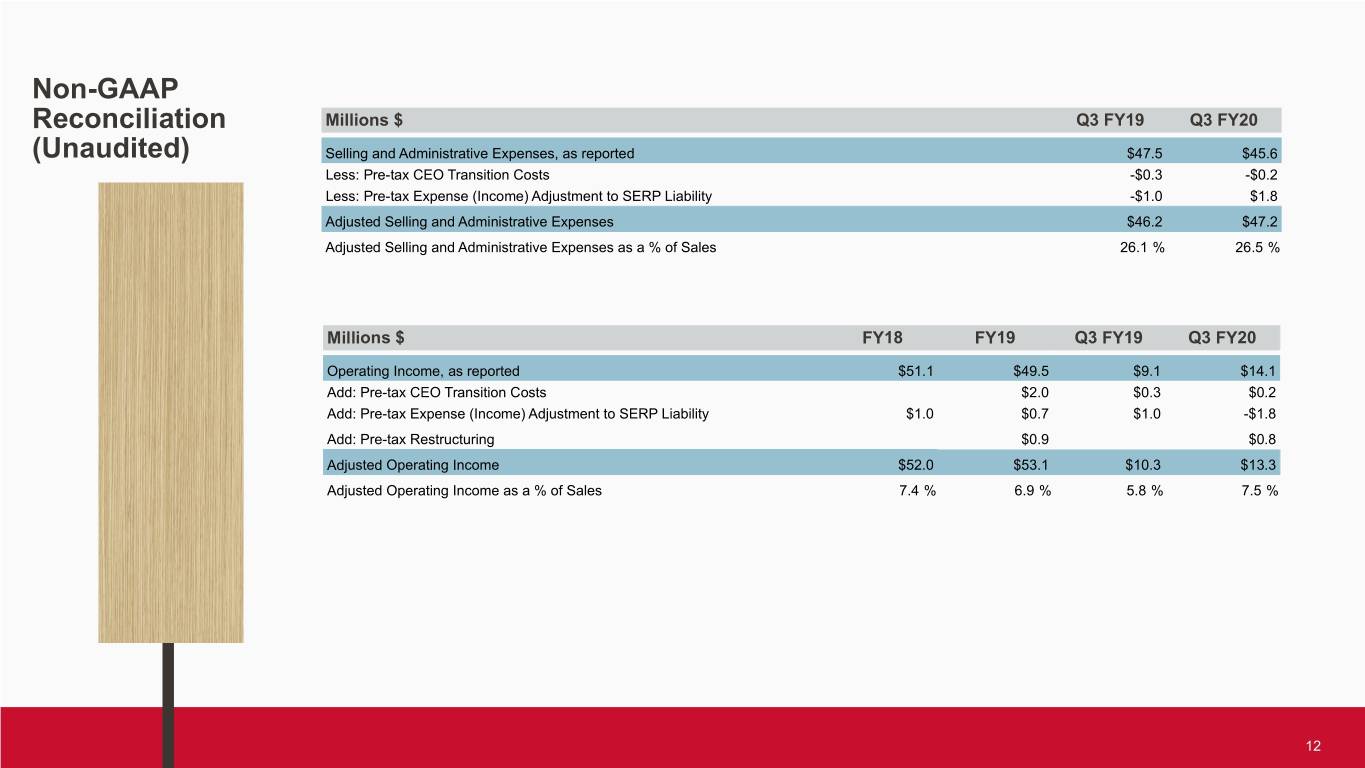
Non-GAAP Reconciliation Millions $ Q3 FY19 Q3 FY20 (Unaudited) Selling and Administrative Expenses, as reported $47.5 $45.6 Less: Pre-tax CEO Transition Costs -$0.3 -$0.2 Less: Pre-tax Expense (Income) Adjustment to SERP Liability -$1.0 $1.8 Adjusted Selling and Administrative Expenses $46.2 $47.2 Adjusted Selling and Administrative Expenses as a % of Sales 26.1 % 26.5 % Millions $ FY18 FY19 Q3 FY19 Q3 FY20 Operating Income, as reported $51.1 $49.5 $9.1 $14.1 Add: Pre-tax CEO Transition Costs $2.0 $0.3 $0.2 Add: Pre-tax Expense (Income) Adjustment to SERP Liability $1.0 $0.7 $1.0 -$1.8 Add: Pre-tax Restructuring $0.9 $0.8 Adjusted Operating Income $52.0 $53.1 $10.3 $13.3 Adjusted Operating Income as a % of Sales 7.4 % 6.9 % 5.8 % 7.5 % 12
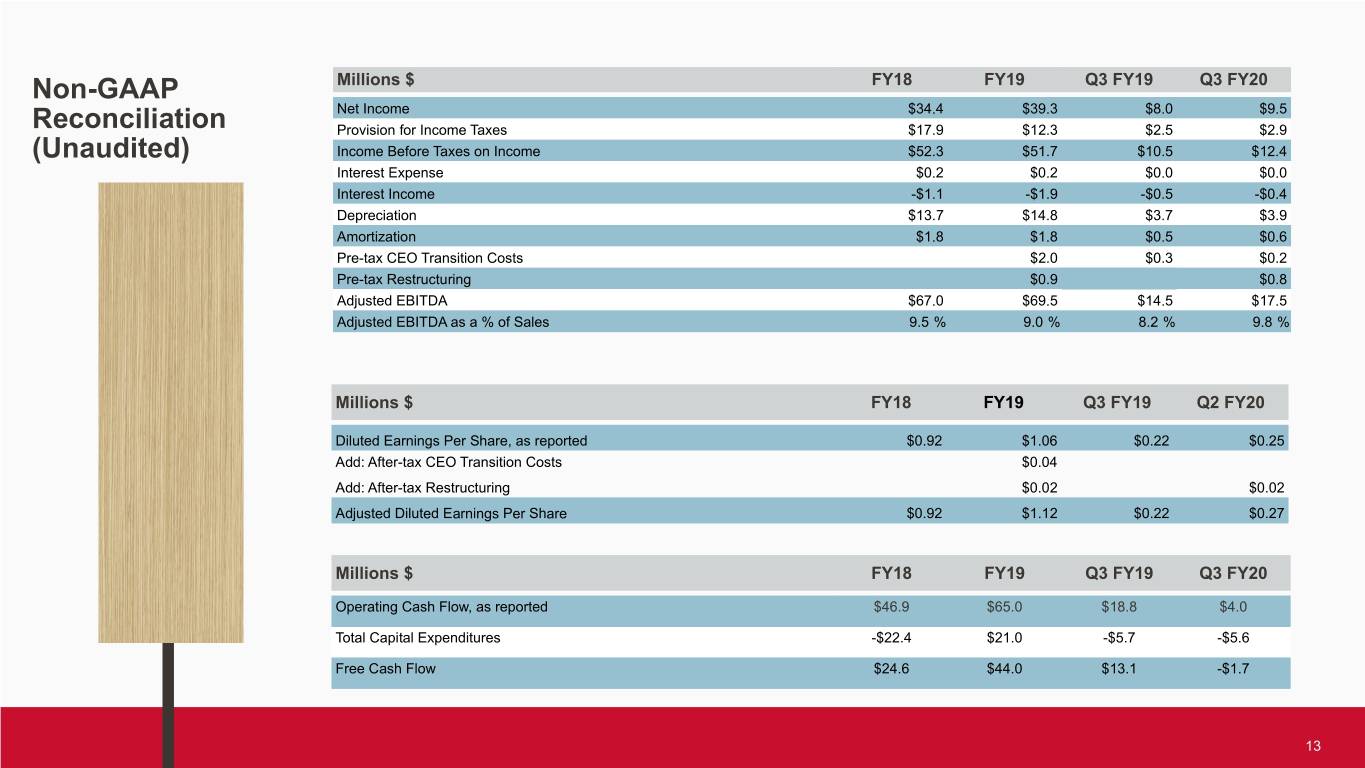
Non-GAAP Millions $ FY18 FY19 Q3 FY19 Q3 FY20 Net Income $34.4 $39.3 $8.0 $9.5 Reconciliation Provision for Income Taxes $17.9 $12.3 $2.5 $2.9 (Unaudited) Income Before Taxes on Income $52.3 $51.7 $10.5 $12.4 Interest Expense $0.2 $0.2 $0.0 $0.0 Interest Income -$1.1 -$1.9 -$0.5 -$0.4 Depreciation $13.7 $14.8 $3.7 $3.9 Amortization $1.8 $1.8 $0.5 $0.6 Pre-tax CEO Transition Costs $2.0 $0.3 $0.2 Pre-tax Restructuring $0.9 $0.8 Adjusted EBITDA $67.0 $69.5 $14.5 $17.5 Adjusted EBITDA as a % of Sales 9.5 % 9.0 % 8.2 % 9.8 % Millions $ FY18 FY19 Q3 FY19 Q2 FY20 Diluted Earnings Per Share, as reported $0.92 $1.06 $0.22 $0.25 Add: After-tax CEO Transition Costs $0.04 Add: After-tax Restructuring $0.02 $0.02 Adjusted Diluted Earnings Per Share $0.92 $1.12 $0.22 $0.27 Millions $ FY18 FY19 Q3 FY19 Q3 FY20 Operating Cash Flow, as reported $46.9 $65.0 $18.8 $4.0 Total Capital Expenditures -$22.4 $21.0 -$5.7 -$5.6 Free Cash Flow $24.6 $44.0 $13.1 -$1.7 13
