Attached files
UNITED STATES SECURITIES AND EXCHANGE COMMISSION
WASHINGTON, D.C. 20549
FORM 10-K
(Mark One)
x ANNUAL REPORT PURSUANT TO SECTION 13 OR 15(d) OF THE SECURITIES EXCHANGE ACT OF 1934
For the fiscal year ended June 30, 2018
OR
o TRANSITION REPORT PURSUANT TO SECTION 13 OR 15(d) OF THE SECURITIES EXCHANGE ACT OF 1934
For the transition period from to
Commission File Number 0-3279

KIMBALL INTERNATIONAL, INC. | ||
(Exact name of registrant as specified in its charter) | ||
Indiana | 35-0514506 | |
(State or other jurisdiction of | (I.R.S. Employer Identification No.) | |
incorporation or organization) | ||
1600 Royal Street, Jasper, Indiana | 47549-1001 | |
(Address of principal executive offices) | (Zip Code) | |
(812) 482-1600 | ||
Registrant’s telephone number, including area code | ||
Securities registered pursuant to Section 12(b) of the Act: | ||
Title of each Class | Name of each exchange on which registered | |
Class B Common Stock, par value $0.05 per share | The NASDAQ Stock Market LLC | |
Securities registered pursuant to Section 12(g) of the Act: None | ||
Indicate by check mark if the registrant is a well-known seasoned issuer, as defined in Rule 405 of the Securities Act. Yes o No x |
Indicate by check mark if the registrant is not required to file reports pursuant to Section 13 or 15(d) of the Act. Yes o No x |
Indicate by check mark whether the registrant (1) has filed all reports required to be filed by Section 13 or 15(d) of the Securities Exchange Act of 1934 during the preceding 12 months (or for such shorter period that the registrant was required to file such reports), and (2) has been subject to such filing requirements for the past 90 days. Yes x No o |
Indicate by check mark whether the registrant has submitted electronically and posted on its corporate Web site, if any, every Interactive Data File required to be submitted and posted pursuant to Rule 405 of Regulation S-T (Section 232.405 of this chapter) during the preceding 12 months (or for such shorter period that the registrant was required to submit and post such files). Yes x No o |
Indicate by check mark if disclosure of delinquent filers pursuant to Item 405 of Regulation S-K (Section 229.405 of this chapter) is not contained herein, and will not be contained, to the best of registrant’s knowledge, in definitive proxy or information statements incorporated by reference in Part III of this Form 10-K or any amendment to this Form 10-K. x |
Indicate by check mark whether the registrant is a large accelerated filer, an accelerated filer, a non-accelerated filer, a smaller reporting company, or an emerging growth company. See the definitions of “large accelerated filer,” “accelerated filer,” “smaller reporting company,” and “emerging growth company” in Rule 12b-2 of the Exchange Act. Large accelerated filer o Accelerated filer x Non-accelerated filer o Smaller reporting company o Emerging growth company o (Do not check if a smaller reporting company) |
If an emerging growth company, indicate by check mark if the registrant has elected not to use the extended transition period for complying with any new or revised financial accounting standards provided pursuant to Section 13(a) of the Exchange Act. o |
Indicate by check mark whether the registrant is a shell company (as defined in Rule 12b-2 of the Exchange Act). Yes o No x |
Class A Common Stock is not publicly traded and, therefore, no market value is available, but it is convertible on a one-for-one basis into Class B Common Stock. The aggregate market value of the Class B Common Stock held by non-affiliates, as of December 29, 2017 (the last business day of the Registrant’s most recently completed second fiscal quarter) was $676.1 million, based on 97.2% of Class B Common Stock held by non-affiliates.
The number of shares outstanding of the Registrant’s common stock as of August 27, 2018 was:
Class A Common Stock - 263,991 shares
Class B Common Stock - 36,898,278 shares
DOCUMENTS INCORPORATED BY REFERENCE
Portions of the Proxy Statement for the Annual Meeting of Shareowners to be held on October 30, 2018, are incorporated by reference into Part III.
KIMBALL INTERNATIONAL, INC.
FORM 10-K INDEX
Page No. | ||
PART I | ||
PART II | ||
PART III | ||
PART IV | ||
2
PART I
Forward-Looking Statements
This document contains certain forward-looking statements as defined in the Private Securities Litigation Reform Act of 1995, Section 27A of the Securities Act of 1933, as amended (the “Securities Act”) and Section 21E of the Securities Exchange Act of 1934, as amended (the “Exchange Act”). These are statements made by management, using their best business judgment based upon facts known at the time of the statements or reasonable estimates, about future results, plans, or future performance and business of the Company. Such statements involve risk and uncertainty, and their ultimate validity is affected by a number of factors, both specific and general. They should not be construed as a guarantee that such results or events will, in fact, occur or be realized as actual results may differ materially from those expressed in these forward-looking statements. The statements may be identified by the use of words such as “believes,” “anticipates,” “expects,” “intends,” “plans,” “projects,” “estimates,” “forecasts,” “seeks,” “likely,” “future,” “may,” “might,” “should,” “would,” “will,” and similar expressions. It is not possible to foresee or identify all factors that could cause actual results to differ from expected or historical results. We make no commitment to update these factors or to revise any forward-looking statements for events or circumstances occurring after the statement is issued, except as required in current and quarterly periodic reports filed with the Securities and Exchange Commission (“SEC”) or otherwise by law. These forward-looking statements are subject to risks and uncertainties including, but not limited to, the outcome of a governmental review of our subcontractor reporting practices, adverse changes in global economic conditions, the impact of changes in tariffs, increased global competition, significant reduction in customer order patterns, loss of key suppliers, loss of, or significant volume reductions from, key contract customers, financial stability of key customers and suppliers, relationships with strategic customers and product distributors, availability or cost of raw materials, components, or services, changes in the regulatory environment, or similar unforeseen events. Additional risks and uncertainties discussed in Item 1A - Risk Factors of this report could also cause our results to differ materially from those expressed in forward-looking statements. There may be other risks and uncertainties that we are unable to predict at this time or that we currently do not expect to have a material adverse effect on our business. Any such risks could cause our results to differ materially from those expressed in forward-looking statements.
At any time when we make forward-looking statements, we desire to take advantage of the “safe harbor” which is afforded such statements under the Private Securities Litigation Reform Act of 1995 where factors could cause actual results to differ materially from forward-looking statements.
Item 1 - Business
As used herein, the terms “Company,” “Kimball International,” “we,” “us,” or “our” refer to Kimball International, Inc., the Registrant, and its subsidiaries. Reference to a year relates to a fiscal year, ended June 30 of the year indicated, rather than a calendar year unless the context indicates otherwise. Additionally, references to the first, second, third, and fourth quarters refer to those respective quarters of the fiscal year indicated.
Overview
Kimball International was incorporated in Indiana in 1939. Our corporate headquarters is located at 1600 Royal Street, Jasper, Indiana.
We create design driven, innovative furnishings sold through our family of brands: Kimball, National, and Kimball Hospitality. Our diverse portfolio offers solutions for the workplace, learning, healing, and hospitality environments. Our values and integrity are demonstrated daily by living our Guiding Principles and creating a culture of caring that establishes us as an employer of choice. “We Build Success” by establishing long-term relationships with customers, employees, suppliers, shareowners and the communities in which we operate.
We have been in the furniture business since 1950. Our core markets include the commercial, hospitality, healthcare, education, government, and finance markets. Through each of our brands, we offer a wide range of possibilities for creating functional environments that convey just the right image for each unique setting, as furniture solutions are tailored to the end user’s needs and demands. The workplace model is evolving to optimize human interaction, and Kimball and National provide furniture solutions which create spaces where people can connect. Our rich wood heritage and craftsmanship remain, while new products and mixed materials are integrated into our product portfolio, satisfying the marketplace’s need for multifunctional, open accommodations throughout all industries. Our furniture solutions are used in collaborative and open work space areas, conference and meeting/huddle rooms, training rooms, private offices, learning areas, classrooms, lobby/reception areas, and dining/café areas with a vast mix of wood, metal, laminate, paint, fabric, solid surface, and plastic options. In addition, we offer products designed specifically for the healthcare market such as patient/exam room and lounge seating and casegoods. In the hospitality industry, Kimball Hospitality works with leading designers, purchasing agents, and hotel owners to create furniture
3
which extends the unique ambiance of a property into guest rooms and public spaces by providing furniture solutions for hotel properties and mixed use developments, including commercial and residential. Hospitality products include, but are not limited to, headboards, tables, seating, vanities, casegoods, lighting, and products that are enhanced with technology features with a broad mix of wood, metal, stone, laminate, finish, glass, and fabric options.
Production currently occurs in Company-owned or leased facilities located in the United States and Mexico. We also engage with third-party manufacturers within the U.S. as well as internationally to produce select finished goods and accessories for our brands. In the United States, we have manufacturing facilities and showrooms in nine states and the District of Columbia. Financial information by geographic area for each of the three years in the period ended June 30, 2018 is included in Note 14 - Geographic Information of Notes to Consolidated Financial Statements and is incorporated herein by reference.
Spin-Off of Kimball Electronics
On October 31, 2014 (“Distribution Date”), we completed the spin-off of our Electronic Manufacturing Services (“EMS”) segment by distributing the related shares of Kimball Electronics, Inc. (“Kimball Electronics”), on a pro rata basis, to our shareowners of record as of October 22, 2014. After the Distribution Date, we no longer beneficially own any Kimball Electronics shares and Kimball Electronics is an independent publicly traded company. Kimball International, Inc. trades on the Nasdaq Stock Market LLC (“Nasdaq”) under the ticker symbol “KBAL” and Kimball Electronics, Inc. trades on Nasdaq under the ticker symbol “KE”.
The disclosures within this Part I describe the continuing operations of Kimball International, Inc. after the spin-off.
Recent Business Changes
Acquisition of D’style, Inc.
During the second quarter of fiscal year 2018, we acquired certain assets of D’style, Inc. (“D’style”), headquartered in Chula Vista, California. This acquisition expanded our reach into hospitality public spaces and added an attractive product portfolio of solutions for the residential market through the acquired Allan Copley Designs brand. These offerings enable us to take advantage of the trend where hospitality, residential and commercial designs are merging. As part of this acquisition, we also acquired all of the capital stock of Diseños de Estilo S.A. de C.V. headquartered in Tijuana, Mexico, another member of the D’style group which manufactures exclusively for D’style, strengthening our North American manufacturing footprint and serving as a distribution channel to the Mexico and Latin America hospitality markets. The cash paid for the acquisition totaled $18.2 million. An earn-out of up to $2.2 million may be paid, which is contingent based upon fiscal year 2018 and 2019 D’style, Inc. operating income compared to a predetermined target for each fiscal year. See Note 2 - Acquisition of Notes to Consolidated Financial Statements for more information on the acquisition.
Capacity Utilization Restructuring Plan
In November 2014, we announced a capacity utilization restructuring plan which included the consolidation of our metal fabrication production from an operation located in Post Falls, Idaho, into existing production facilities in Indiana, and the reduction of our Company plane fleet from two jets to one.
The transfer of work from our Idaho facility involved the start-up of metal fabrication capabilities in an existing Company-owned facility, along with the transfer of certain assembly operations into two additional existing Company-owned facilities, all located in southern Indiana. All production was transferred out of the Idaho facility as of March 2016, after which work continued in the Indiana facilities to train employees, ramp up production and eliminate the inefficiencies associated with the start-up of production in these facilities. The improvement of customer delivery, supply chain dynamics, and reduction of transportation costs began to generate pre-tax annual savings of approximately $5 million in fiscal year 2017. In addition, during the first quarter of fiscal year 2017, we sold our Post Falls, Idaho facility and land. See Note 4 - Property and Equipment of Notes to Consolidated Financial Statements for more information on the sale of the Idaho facility.
The reduction of our plane fleet from two jets to one reduced our cost structure while aligning the plane fleet size with our needs following the spin-off of Kimball Electronics on October 31, 2014. Previously, one of our jets was used primarily for the successful strategy of transporting customers to visit our showrooms, offices, research and development center, and manufacturing locations, while the remaining jet was used primarily for management travel. The plane used primarily for management travel was sold in the third quarter of fiscal year 2015, and as a result, we began realizing the expected annual pre-tax savings of $0.8 million. We believe that our location in rural Jasper, Indiana and the location of our manufacturing locations in small towns away from major metropolitan areas necessitates the need for the remaining jet to efficiently transport customers.
4
Outsourcing of Shipping Function
During fiscal year 2018 we outsourced the remainder of our outbound shipping that was previously transported by our Company-owned shipping fleet to a dedicated freight provider and sold our fleet of over-the-road tractors and trailers. The outsourcing to a dedicated freight provider is expected to partially mitigate increasing transportation costs from non-dedicated freight carriers. In addition, we expect to minimize risks associated with operating an internal shipping fleet and to increase utilization of the outsourced transportation fleet over our previous internal fleet which was being impacted by driver shortages. The dedicated freight provider operates transportation equipment with our Company branding. We continue to operate Company-owned tractors and trailers to move products between our production facilities and distribution warehouses.
Seasonality
The impact of seasonality on our revenue includes lower sales in the third quarter of our fiscal year due to the buying season of the government, lower sales to educational institutions during our second and third fiscal quarters, and lower sales of hospitality furniture during times of high hotel occupancy such as the summer months.
Locations
As of June 30, 2018, our products were primarily produced at eleven plants: seven located in Indiana, two in Kentucky, one in Virginia, and one in Mexico. In addition, select finished goods are purchased from domestic and foreign sources. As described above, our facility in Idaho was sold in fiscal year 2017. We continually assess manufacturing capacity and adjust such capacity as necessary.
A facility in Indiana which housed an education center for dealer and employee training, a research and development center, and a product showroom was sold near the end of fiscal year 2017. We leased a portion of the facility back until December 2017 to facilitate the transition of those functions to other existing Indiana locations. Furniture showrooms are currently maintained in eight cities in the United States. Office space is leased in Dongguan, Guangdong, China and Ho Chi Minh City, Vietnam to facilitate sourcing of select finished goods and components from the Asia Pacific Region. As a result of the acquisition of D’style, we also lease office and manufacturing space in Chula Vista, California and Tijuana, Mexico.
Marketing Channels
Our furniture is marketed to end users by both independent and employee sales representatives, office furniture dealers, wholesalers, brokers, designers, purchasing companies, and catalog houses throughout North America and on an international basis. Customers can access our products globally through a variety of distribution channels.
We categorize our sales by the following vertical markets:
Commercial - The largest portion of our business is in the commercial market. We are a full-facility provider offering products for a variety of commercial applications including: office, collaborative and open plan, lobby-lounge, conferencing and meeting/huddle, training, dining/café, learning, lobby and reception, and other public spaces.
Education - Whether K-12, higher education, vocational training or any other learning institution, we understand that furniture for education needs to enhance learning and social environments. We offer flexible, collaborative, and technology-driven furnishings designed to make students and faculty more productive and comfortable.
Healthcare - We are focused on better outcomes for patients, their families, the staff that heals them, and the environments surrounding them by offering products to value-conscious healthcare customers, including hospitals, clinics, physician office buildings, long-term care facilities, and assisted living facilities throughout the country.
Hospitality - We offer a complete package of products for guest rooms and public spaces plus service support to the hospitality industry. We partner with the most recognized hotel brands to meet their specific requirements for properties throughout the world by working with a worldwide manufacturing base to offer the best solution to fulfill the project.
Finance - Banking and financial offices require affordable, functional, and stylish environments. Our versatile and customizable furnishings offer sophisticated styles for reception areas, employee work spaces, executive offices, and boardrooms.
Government - We supply office furniture including desks, tables, seating, bookcases and filing and storage units for federal, state, and local government offices, as well as other government related entities. We hold two Federal Supply Service contracts with the General Services Administration (“GSA”) that are subject to government subcontract reporting requirements. We also partner with multiple general purchasing organizations which assist public agencies such as state and local governments with furniture purchases. The U.S. government, as well as state and local governments, can typically terminate or modify their contracts with us either at their discretion or if we default by failing to perform under the terms of the applicable contract, which could expose us to liability and impede our ability to compete in the future for contracts and orders. During fiscal year
5
2018, sales related to our GSA contracts were approximately 7.5% of our consolidated sales, with one contract accounting for approximately 5.3% of our consolidated sales and the other contract accounting for approximately 2.2% of our consolidated sales.
A table showing our net sales by end market vertical is included in Part II, Item 7 - Management’s Discussion and Analysis of Financial Condition and Results of Operations.
Major Competitive Factors
Our products are sold in the contract furniture and hospitality furniture industries. These industries have similar major competitive factors which include price in relation to quality and appearance, product design, the utility of the product, supplier lead time, reliability of on-time delivery, sustainability, and the ability to respond to requests for special and non-standard products. We offer payment terms similar to industry standards and in unique circumstances may grant alternate payment terms.
Certain industries are more price sensitive than others, but all expect on-time, damage-free delivery. In addition to the many options available on our standard furniture products, custom furniture is produced to customer specifications and shipping timelines on a project basis.
Competitors
There are numerous furniture manufacturers competing within the marketplace, with a significant number of competitors offering similar products.
Our competition includes furniture manufacturers such as Steelcase Inc., Herman Miller, Inc., Knoll, Inc., HNI Corporation, and a large number of smaller privately-owned furniture manufacturers, both domestic and foreign-based.
Working Capital
We do not believe that we, or the industry in general, have any special practices or special conditions affecting working capital items that are significant for understanding our furniture business. We do receive advance payments from customers on select furniture projects primarily in the hospitality industry.
Raw Material Availability
Certain components used in the production of furniture are manufactured internally and are generally readily available, as are other raw materials used in the production of wood and non-wood furniture. Certain fabricated seating components, wood frame assemblies as well as finished furniture products, electrical components, stone, fabrics, and fabricated metal components, which are generally readily available, are sourced on a global scale in an effort to provide quality products at the lowest total cost. The cost and availability of both domestic and foreign sourced product could be impacted if tariffs are imposed on such products.
Order Backlog
The aggregate sales price of products pursuant to open orders, which may be canceled by the customer, was as follows:
(Amounts in Millions) | June 30, 2018 | June 30, 2017 | |||||
Order Backlog | $ | 148.9 | $ | 131.6 | |||
Of the order backlog increase, $7.5 million was due to orders of D’style products in fiscal year 2018, and $2.0 million was due to the acceleration of orders into the fourth quarter of fiscal year 2018 in connection with a pricing increase for one of our brands announced during the fourth quarter of fiscal year 2018 that took effect on July 2, 2018. The open orders as of June 30, 2018 are expected to be filled within the next fiscal year. Open orders may not be indicative of future sales trends.
Research and Development
Research and development activities include the development of manufacturing processes, engineering and testing procedures, major process and technology improvements, new product development and product redesign, and information technology initiatives.
6
Research and development costs were approximately:
Year Ended June 30 | |||||
(Amounts in Millions) | 2018 | 2017 | 2016 | ||
Research and Development Costs | $7 | $7 | $6 | ||
Intellectual Property
In connection with our business operations, we hold both trademarks and patents in various countries and continuously have additional pending trademarks and patents. The intellectual property which we believe to be the most significant to the Company includes: Kimball, National, D’style, Fringe, Waveworks, Xsite, Narrate, Pairings, and Dock, which are all registered trademarks. Our patents expire at various times depending on the patent’s date of issuance.
Environment and Energy Matters
Our operations are subject to various federal, state, local, and foreign laws and regulations with respect to environmental matters. We believe that we are in substantial compliance with present laws and regulations and that there are no material liabilities related to such items.
We are dedicated to excellence, leadership, and stewardship in matters of protecting the environment and communities in which we have operations. Reinforcing our commitment to the environment, six of our showrooms and one non-manufacturing location were designed under the guidelines of the U.S. Green Building Council’s LEED (Leadership in Energy and Environmental Design) for Commercial Interiors program. One manufacturing facility was designed under the LEED Operations and Maintenance program guidelines. Our National brand headquarters is Fitwel certified, which is a building certification that supports healthier workplace environments to improve occupant health and productivity.
We believe that continued compliance with foreign, federal, state, and local laws and regulations which have been enacted relating to the protection of the environment will not have a material effect on our capital expenditures, earnings, or competitive position. We believe capital expenditures for environmental control equipment during the next two fiscal years ending June 30, 2020, will not represent a material portion of total capital expenditures during those years.
Our manufacturing operations require the use of natural gas and electricity. Federal and state regulations may control the allocation of fuels available to us, but to date we have experienced no interruption of production due to such regulations. In our wood furniture manufacturing plants, a portion of energy requirements are satisfied internally by the use of our own scrap wood produced during the manufacturing of product.
Employees
June 30 2018 | June 30 2017 | ||||
United States | 2,921 | 3,024 | |||
Foreign Countries | 153 | 65 | |||
Total Employees | 3,074 | 3,089 | |||
Our U.S. operations are not subject to collective bargaining arrangements. Outside of the U.S., approximately 52 employees are represented by worker’s unions that operate to promote the interests of workers. We believe that our employee relations are good.
Available Information
We make available free of charge through our website, https://www.kimballinternational.com/public-filings, our annual reports on Form 10-K, quarterly reports on Form 10-Q, current reports on Form 8-K, proxy statements, and all amendments to those reports as soon as reasonably practicable after such material is electronically filed with, or furnished to, the SEC. All reports we file with the SEC are also available via the SEC website, http://www.sec.gov, or may be read and copied at the SEC Public Reference Room located at 100 F Street, N.E., Washington, D.C. 20549. Information on the operation of the Public Reference Room may be obtained by calling the SEC at 1-800-SEC-0330. Our Internet website and the information contained on, or accessible through, such website is not incorporated into this Annual Report on Form 10-K.
7
Item 1A - Risk Factors
The following important risk factors could affect future results and events, causing results and events to differ materially from those expressed or implied in forward-looking statements made in this report and presented elsewhere by management from time to time. Such factors may have a material adverse effect on our business, financial condition, and results of operations and should be carefully considered before deciding to invest in, or retain, shares of our common stock. Additional risks and uncertainties that we do not currently know about, we currently believe are immaterial or we have not predicted may also affect our business, financial condition, or results of operations. Because of these and other factors, past performance should not be considered an indication of future performance.
Changes to government regulations may significantly increase our operating costs in the United States and abroad. Legislative and regulatory reforms by the U.S. federal and foreign governments could significantly impact our profitability by burdening us with forced cost choices that are difficult to recover with increased pricing. For example:
• | We depend on suppliers globally to provide materials, parts, finished goods, and components for use in our products. We utilize both steel and aluminum in our products, most of which is sourced domestically. The U.S. recently imposed tariffs of 25% on steel and 10% on aluminum imported from several countries which could adversely impact our input costs. The government has also recently proposed to expand its list of products subject to tariffs to include furniture products, parts, and components, and if approved, the landed cost of our products could increase materially, which would reduce our net income if we are unable to mitigate the additional cost. Additional tariffs or changes in global trade agreements or in U.S. governmental import/export regulations could have an adverse impact on our financial condition, results of operations, or cash flows. |
• | We conduct business with entities in Canada and Mexico; therefore, a modification or withdrawal from the North American Free Trade Agreement by the U.S. federal government could have an adverse impact on our financial condition, results of operations, or cash flows. |
• | We import a portion of our wooden furniture products and are thus subject to an anti-dumping tariff specifically on wooden bedroom furniture supplied from China. The tariffs are subject to review and could result in retroactive and prospective tariff rate increases which could have an adverse impact on our financial condition, results of operations, or cash flows. |
• | State and foreign regulations are increasing in many areas such as hazardous waste disposal, labor relations, employment practices and data privacy, such as the California Consumer Privacy Act. Compliance with these regulations could require us to update our processes and could have an adverse impact on our financial condition, results of operations, or cash flows. |
We may be unable to purchase a sufficient amount of materials, parts, and components for use in our products at a competitive price, in a timely manner, or at all. We depend on suppliers globally to provide timely delivery of materials, parts, and components for use in our products. We monitor the financial stability of suppliers when feasible, as the loss of a significant supplier could have an adverse impact on our operations. Certain finished products and components we purchase are primarily manufactured in select regions of the world and issues in those regions could cause manufacturing delays. In addition, delays can occur related to the transport of products and components via container ships, which load and unload through various U.S. ports which sometimes experience congestion. Price increases of commodity components could have an adverse impact on our profitability if we cannot offset such increases with other cost reductions or by price increases to customers. New tariffs or trade regulations which have been and could be imposed by the U.S. federal government may adversely impact our access, price, and delivery of finished products and components from foreign sources, and therefore adversely affect our profitability. Materials we utilize are generally available, but future availability is unknown and could impact our ability to meet customer order requirements. If suppliers fail to meet commitments to us in terms of price, delivery, or quality, it could interrupt our operations and negatively impact our ability to meet commitments to customers.
Uncertain macroeconomic and industry conditions, or a sustained slowdown or significant downturn in our markets, could adversely impact demand for our products and adversely affect operating results. Market demand for our products, which impacts revenues and gross profit, is influenced by a variety of economic and industry factors such as:
• | global consumer confidence; |
• | volatility and the cyclical nature of worldwide economic conditions; |
• | weakness in the global financial markets; |
• | general corporate profitability of the end markets to which we sell; |
• | credit availability to the end markets to which we sell; |
• | service-sector unemployment rates; |
• | commercial property vacancy rates; |
8
• | new office construction and refurbishment rates; |
• | deficit status of many governmental entities which may result in declining purchases of office furniture; |
• | uncertainty surrounding potential reform of the Affordable Care Act; and |
• | new hotel and casino construction and refurbishment rates. |
We must make decisions based on order volumes in order to achieve manufacturing efficiency. These decisions include determining what level of additional business to accept, production schedules, component procurement commitments, and personnel requirements, among various other considerations. We must constantly monitor the changing economic landscape and may modify our strategic direction accordingly. If we do not react quickly enough to the changes in market or economic conditions, it could result in lost customers, decreased market share, and increased operating costs.
A shortage of capacity in the trucking industry could drive increases in freight costs. We outsource inbound and outbound shipping to third-party contract carriers, including a dedicated freight provider that operates transportation equipment with our Company branding, and other commercial contract carriers. We have experienced pressure on freight costs as the demand exceeds the capacity of available trucking fleets, particularly for commercial contract carriers. If capacity remains tight, and we are unable to mitigate a freight cost increase through our supply chain planning or by increasing prices on our products, it could adversely affect our profitability.
Changes in U.S. fiscal and tax policies may adversely affect our business. On December 22, 2017, the Tax Cuts and Jobs Act (“Tax Act”) was signed into law. The Tax Act reduced federal corporate income tax rates effective January 1, 2018 and changed numerous other provisions. Because Kimball International has a June 30 fiscal year-end, the lower corporate federal income tax rate was phased in, resulting in a U.S. federal statutory tax rate of 28.1% for our fiscal year ended June 30, 2018. The statutory federal tax rate will be 21% in subsequent fiscal years. Fiscal year 2018 included approximately $3.3 million in reduced income tax expense to reflect federal taxes on current year taxable income at the lower blended effective tax rate, partially offset by a discrete tax impact of $1.8 million in additional expense as a result of applying the new lower federal income tax rates to our net tax assets. The changes included in the Tax Act are broad and complex and future impacts may be dependent on interpretations of the Tax Act, legislative action to address questions that arise because of the Tax Act, or changes in accounting standards for income taxes or related interpretations in response to the Tax Act. While the Tax Act reduced our current rate, future changes to the federal tax rate could have an adverse impact. In addition, states or foreign jurisdictions may amend their tax laws and policies in response to the Tax Act, which could have a material impact on our future results and our effective tax rate.
Fluctuations in our effective tax rate could have a significant impact on our financial position, results of operations, or cash flows. We are subject to income taxes as well as non-income based taxes, mainly in the United States. Judgment is required in determining the worldwide provision for income taxes, other tax liabilities, interest, and penalties. Future events could change management’s assessment. We operate within multiple taxing jurisdictions and are subject to tax audits in these jurisdictions. These audits can involve complex issues, which may require an extended period of time to resolve. We have also made assumptions about the realization of deferred tax assets. Changes in these assumptions could result in a valuation allowance for these assets. Final determination of tax audits or tax disputes may be different from what is currently reflected by our income tax provisions and accruals.
Our failure to retain our existing management team, maintain our engineering, technical, and manufacturing process expertise, or continue to attract qualified personnel could adversely affect our business. We depend significantly on our executive officers and other key personnel. Our success is also dependent on keeping pace with technological advancements and adapting services to provide manufacturing capabilities which meet customers’ changing needs. To do that, we must retain our qualified engineering and technical personnel and successfully anticipate and respond to technological changes in a cost effective and timely manner. Our culture and guiding principles focus on continuous training, motivation, and development of employees, and we strive to attract, motivate, and retain qualified personnel. Failure to retain our executive officers and retain and attract other key personnel could adversely affect our business. Mr. Schneider, our Chief Executive Officer, plans to retire effective October 31, 2018. The Board of Directors has created a Continuity Committee to facilitate our succession planning process relative to Mr. Schneider’s retirement; however, the change in executive leadership could impact the execution of our business strategy. If we encounter difficulties in the transition, that could affect our relationship with our customers and could adversely impact our financial results.
Our sales to the U.S. government are subject to compliance with regulatory and contractual requirements and noncompliance could expose us to liability or impede current or future business. The U.S. government, as well as state and local governments, can typically terminate or modify their contracts with us either at their discretion or if we default by failing to perform under the terms of the applicable contract, which could expose us to liability and impede our ability to compete in the future for contracts and orders. The failure to comply with regulatory and contractual requirements could subject us to investigations, fines, or other penalties, and violations of certain regulatory and contractual requirements could also result in us being suspended or debarred from future government contracting.
9
In March 2016, in connection with a renewal of one of our contracts with the GSA, we became aware of noncompliance and inaccuracies in our GSA subcontractor reporting. Accordingly, we retained outside legal counsel to assist in conducting an internal review of our reporting practices, and we self-reported the matter and the results of the internal review to the GSA. We have promptly responded to inquiries from the GSA since our initial reporting, have met with government officials as requested on two occasions, and intend to cooperate fully with any further inquiries or investigations. While we are not able to reasonably estimate the future financial impact, if any, of the possible sanctions at this time, any of them could, if imposed, have a material adverse impact on our business, future financial position, results of operations, or cash flows. The timing of the government’s review and determination of any outcome of these matters is uncertain and, therefore, it is unclear as to when and to what extent, if any, our previously issued financial targets might be impacted. We have incurred, and may incur additional, legal and related costs in connection with our internal review and the government’s response to this matter. During fiscal year 2018, sales related to our GSA contracts were approximately 7.5% of our consolidated sales, with one contract accounting for approximately 5.3% of our consolidated sales and the other contract accounting for approximately 2.2% of our consolidated sales.
We may pursue acquisitions that present risks and may not be successful. Our sales growth plans may occur through both organic growth and acquisitions. Acquisitions involve many risks that could have an adverse effect on our business, financial condition or results of operations, including:
• | difficulties in identifying suitable acquisition candidates and in negotiating and consummating acquisitions on terms attractive to us; |
• | difficulties in the assimilation of the operations of the acquired company; |
• | the diversion of resources, including diverting management’s attention from our current operations; |
• | risks of entering new geographic or product markets in which we have limited or no direct prior experience; |
• | the potential loss of key customers of the acquired company; |
• | the potential loss of key employees of the acquired company; |
• | the potential incurrence of indebtedness to fund the acquisition; |
• | the potential issuance of common stock for some or all of the purchase price, which could dilute ownership interests of our current shareowners; |
• | the acquired business not achieving anticipated revenues, earnings, cash flow, or market share; |
• | excess capacity; |
• | failure to achieve the expected synergies resulting from the acquisition; |
• | inaccurate assessment of undisclosed, contingent, or other liabilities or problems and unanticipated costs associated with the acquisition; |
• | incorrect estimates made in accounting for acquisitions, incurrence of non-recurring charges, and write-off of significant amounts of goodwill that could adversely affect our financial results; and |
• | dilution of earnings. |
We may not be successful in launching start-up operations. We are committed to growing our business, and therefore from time to time, we may determine that it would be in our best interests to start up a new operation. Start-up operations involve a number of risks and uncertainties, such as funding the capital expenditures related to the start-up operation, developing a management team for the new operation, diversion of management focus away from current operations, and creation of excess capacity. Any of these risks could have a material adverse effect on our financial position, results of operations, or cash flows.
Our business depends on information technology systems and digital capabilities which are implemented in a manner intended to minimize the risk of a cybersecurity breach or other such threat, including the misappropriation of assets or other sensitive information, or data corruption which could cause operational disruption. An ongoing commitment of significant resources is required to maintain and enhance existing information systems and implement the new and emerging technology necessary to meet customer expectations and compete in our markets. The techniques used to obtain unauthorized access change frequently and are not often recognized until after they have been launched. We recognize that any breach could disrupt our operations, damage our reputation, erode our share value, drive remediation expenses, or increase costs related to the mitigation of, response to, or litigation arising from any such issue. We cannot guarantee that our cybersecurity measures will completely prevent others from obtaining unauthorized access to our enterprise network, system and data.
Many states and the U.S. federal government are increasingly enacting laws and regulations to protect consumers against identity theft and to also protect their privacy. As our business expands globally, we are subject to data privacy and other similar laws in various foreign jurisdictions. If we are the target of a cybersecurity attack resulting in unauthorized disclosure of sensitive or confidential data, we may be required to execute costly notification procedures. Compliance with these laws will likely increase the costs of doing business. If we fail to implement appropriate safeguards or to detect and provide prompt notice of unauthorized access as required by some of these laws, we could be subject to potential claims for damages and other remedies, which could harm our business.
10
If the distribution or certain internal transactions undertaken relating to the spin-off do not qualify as tax-free transactions, the Company, our shareowners as of the Distribution Date, and Kimball Electronics could be subject to substantial tax liabilities. On October 10, 2014 we received a favorable written tax ruling from the Internal Revenue Service (“IRS”) that our stock unification in connection with the spin-off will not cause us to recognize income or gain as a result of the unification. In addition, we have also received an opinion of Squire Patton Boggs (US) LLP to the effect that the distribution satisfies the requirements to qualify as a tax-free transaction (except for cash received in lieu of fractional shares) for U.S. federal income tax purposes to the Company, our shareowners and Kimball Electronics under Section 355 of the Internal Revenue Code of 1986, as amended (the “Code”).
The tax ruling and the tax opinion rely on the accuracy of certain factual representations and assumptions provided by the Company and Kimball Electronics in connection with obtaining the tax ruling and tax opinion, including with respect to post-spin-off operations and conduct of the parties. If these factual representations and assumptions are inaccurate or incomplete in any material respect, we will not be able to rely on the tax ruling and/or the tax opinion.
Furthermore, the tax opinion will not be binding on the IRS or the courts. Accordingly, the IRS or the courts may reach conclusions with respect to the spin-off that are different from the conclusions reached in the tax opinion. If, notwithstanding our receipt of the tax opinion, the spin-off is determined to be taxable, then (i) we would be subject to tax as if we sold the Kimball Electronics common stock in a taxable sale for its fair market value; and (ii) each shareowner who received Kimball Electronics common stock would be treated as receiving a distribution of property in an amount equal to the fair market value of the Kimball Electronics common stock that would generally result in varied tax liabilities for each shareowner depending on the facts and circumstances.
We entered into a Tax Matters Agreement with Kimball Electronics that governs the respective rights, responsibilities and obligations of us and Kimball Electronics after the spin-off with respect to tax liabilities and benefits, tax attributes, tax contests and other tax sharing regarding U.S. federal, state, local and foreign income taxes, other tax matters and related tax returns. The Tax Matters Agreement also provides special rules for allocating tax liabilities in the event that the spin-off or certain internal transactions undertaken in anticipation of the spin-off do not qualify as tax-free transactions. Though valid as between us and Kimball Electronics, the Tax Matters Agreement will not be binding on the IRS.
Pursuant to the Tax Matters Agreement, (i) we have agreed (a) not to enter into any transaction that could cause any portion of the spin-off to be taxable to Kimball Electronics, including under Section 355(e) of the Code; and (b) to indemnify Kimball Electronics for any tax liabilities resulting from such transactions entered into by us; and (ii) Kimball Electronics has agreed to indemnify us for any tax liabilities resulting from such transactions entered into by Kimball Electronics. In addition, under U.S. Treasury regulations, each member of our consolidated group at the time of the spin-off (including Kimball Electronics) would be jointly and severally liable for the resulting U.S. federal income tax liability if all or a portion of the spin-off does not or certain internal transactions undertaken in anticipation of the spin-off do not qualify as tax-free transactions. These obligations may discourage, delay or prevent a change of control of our Company.
If Kimball Electronics were to default in its obligation to us to pay taxes under the Tax Matters Agreement, we could be legally liable under applicable tax law for such liabilities and required to make additional tax payments. Accordingly, under certain circumstances, we may be obligated to pay amounts in excess of our agreed-upon share of tax liabilities. To the extent we are responsible for any liability under the Tax Matters Agreement, there could be a material adverse impact on our business, financial condition, results of operations and cash flows.
We may be exposed to the credit risk of our customers who are adversely affected by weakness in market conditions. Weakness in market conditions may drive an elevated risk of potential bankruptcy of our customers resulting in a greater risk of uncollectible outstanding accounts receivable. The realization of these risks could have a negative impact on our profitability.
Reduction of purchases by or the loss of a significant number of customers could reduce revenues and profitability. Significant declines in the level of purchases by customers or the loss of a significant number of customers could have a material adverse effect on our business. A reduction of, or uncertainty surrounding, government spending could also have an adverse impact on our sales levels. We can provide no assurance that we will be able to fully replace any lost sales, which could have an adverse effect on our financial position, results of operations, or cash flows.
We operate in a highly competitive environment and may not be able to compete successfully. The office and hospitality furniture industries are competitive due to numerous global manufacturers competing in the marketplace. In times of reduced demand for office furniture, large competitors may have greater efficiencies of scale or may apply more pressure to their aligned distribution to sell their products exclusively which could lead to reduced opportunities for our products. While we work toward reducing costs to respond to pricing pressures, if we cannot achieve the proportionate reductions in costs, profit margins may suffer.
11
Our operating results could be adversely affected by increases in the cost of fuel and other energy sources. The cost of energy is a critical component of freight expense and the cost of operating manufacturing facilities. Increases in the cost of energy could reduce our profitability.
We are subject to manufacturing inefficiencies due to the transfer of production among our facilities and other factors. At times we may experience labor or other manufacturing inefficiencies due to factors such as new product introductions, transfers of production among our manufacturing facilities, a sudden decline in sales, a new operating system, or turnover in personnel. Manufacturing inefficiencies could have an adverse impact on our financial position, results of operations, or cash flows.
A change in our sales mix among our diversified product offerings could have a negative impact on our gross profit margin. Changes in product sales mix could negatively impact our gross margin as margins of different products vary. We strive to improve the margins of all products, but certain products have lower margins in order to price the product competitively. An increase in the proportion of sales of products with lower margins could have an adverse impact on our financial position, results of operations, or cash flows.
Our international operations involve financial and operational risks. We have a manufacturing operation outside the United States in Mexico, and administrative offices in China and Vietnam which coordinate with suppliers in those countries. These international operations are subject to a number of risks, including the following:
• | economic and political instability; |
• | warfare, riots, terrorism, and other forms of violence or geopolitical disruption; |
• | compliance with laws, such as the Foreign Corrupt Practices Act, applicable to U.S. companies doing business outside the United States; |
• | changes in foreign regulatory requirements and laws; |
• | tariffs and other trade barriers; |
• | potentially adverse tax consequences including the manner in which multinational companies are taxed in the U.S.; and |
• | foreign labor practices. |
These risks could have an adverse effect on our financial position, results of operations, or cash flows. In addition, fluctuations in exchange rates could impact our operating results. Our risk management strategy can include the use of derivative financial instruments to hedge certain foreign currency exposures. Any hedging techniques we implement contain risks and may not be entirely effective. Exchange rate fluctuations could also make our products more expensive than competitor's products not subject to these fluctuations, which could adversely affect our revenues and profitability in international markets.
If efforts to introduce new products or start-up new programs are not successful, this could limit sales growth or cause sales to decline. We regularly introduce new products to keep pace with workplace trends and evolving regulatory and industry requirements, including environmental, health, and safety standards such as sustainability and ergonomic considerations, and similar standards for the workplace and for product performance. Shifts in workforce demographics, working styles, and technology may impact the quantity and types of furniture products purchased by our customers as commercial office spaces occupy smaller footprints and collaborative, open-plan workstations gain popularity. The introduction of new products or start-up of new programs require the coordination of the design, manufacturing, and marketing of such products. The design and engineering required for certain new products or programs can take an extended period of time, and further time may be required to achieve customer acceptance. Accordingly, the launch of any particular product or program may be delayed or may be less successful than we originally anticipated. Difficulties or delays in introducing new products or programs, or lack of customer acceptance of new products or programs could limit sales growth or cause sales to decline.
If customers do not perceive our products and services to be innovative and of high quality, our brand and name recognition and reputation could suffer. We believe that establishing and maintaining good brand and name recognition and a good reputation is critical to our business. Promotion and enhancement of our name and brands will depend on the effectiveness of marketing and advertising efforts and on successfully providing design driven, innovative, and high quality products and superior services. If customers do not perceive our products and services to be design driven, innovative, and of high quality, our reputation, brand and name recognition could suffer, which could have a material adverse effect on our business.
A loss of independent sales representatives, dealers, or other sales channels could lead to a decline in sales. Our office furniture is marketed to end users through both independent and employee sales representatives, office furniture dealers, wholesalers, brokers, designers, purchasing companies, and catalog houses. Our hospitality furniture is marketed to end users using independent sales representatives. A significant loss within any of these sales channels could result in a sales decline and thus have an adverse impact on our financial position, results of operations, or cash flows.
12
Failure to effectively manage working capital may adversely affect our cash flow from operations. We closely monitor inventory and receivable efficiencies and continuously strive to improve these measures of working capital, but customer financial difficulties, cancellation or delay of customer orders, transfers of production among our manufacturing facilities, or manufacturing delays could adversely affect our cash flow from operations.
We may not be able to achieve maximum utilization of our manufacturing capacity. Fluctuations and deferrals of customer orders may have a material adverse effect on our ability to utilize our fixed capacity and thus negatively impact our operating margins.
We could incur losses due to asset impairment. As business conditions change, we must continually evaluate and work toward the optimum asset base. It is possible that certain assets such as, but not limited to, facilities, equipment, goodwill, or other intangible assets, could be impaired at some point in the future depending on changing business conditions. Goodwill and certain intangible assets are tested for impairment annually or when triggering events occur. Such resulting impairment could have an adverse impact on our financial position and results of operations.
A failure to comply with the financial covenants under our $30 million credit facility could adversely impact us. Our credit facility requires us to comply with certain financial covenants. We believe the most significant covenants under this credit facility are the adjusted leverage ratio and the fixed charge coverage ratio. More detail on these financial covenants is discussed in Item 7 - Management's Discussion and Analysis of Financial Condition and Results of Operations of Part II of this Annual Report on Form 10-K. As of June 30, 2018, we had no borrowings under this credit facility and we had $1.4 million in letters of credit outstanding which reduced our borrowing capacity on the credit facility. At June 30, 2018, our cash and cash equivalents totaled $87.3 million. In the future, a default on the financial covenants under our credit facility could cause an increase in the borrowing rates or could make it more difficult for us to secure future financing which could adversely affect the financial condition of the Company.
Failure to protect our intellectual property could undermine our competitive position. We attempt to protect our intellectual property rights, both in the United States and in foreign countries, through a combination of patent, trademark, copyright, and trade secret laws, as well as licensing agreements and third-party non-disclosure and assignment agreements. Because of the differences in foreign laws concerning proprietary rights, our intellectual property rights do not generally receive the same degree of protection in foreign countries as they do in the United States, and therefore in some parts of the world, we have limited protections, if any, for our intellectual property. Competing effectively depends, to a significant extent, on maintaining the proprietary nature of our intellectual property. The degree of protection offered by our various patents and trademarks may not be broad enough to provide significant proprietary protection or competitive advantages to the Company, and patents or trademarks may not be issued on pending or contemplated applications. In addition, not all of our products are covered by patents. It is also possible that our patents and trademarks may be challenged, invalidated, canceled, narrowed, or circumvented.
We may be sued by third parties for alleged infringement of their intellectual property rights and incur substantial litigation or other costs. We could be notified of a claim regarding intellectual property rights which could lead us to spend time and money to defend or address the claim. Even if the claim is without merit, it could result in substantial costs and diversion of resources.
Our insurance may not adequately protect us from liabilities related to product defects. We maintain product liability and other insurance coverage that we believe to be generally in accordance with industry practices, but our insurance coverage does not extend to field visits to repair, retrofit or replace defective products, or to product recalls. As a result, our insurance coverage may not be adequate to protect us fully against substantial claims and costs that may arise from liabilities related to product defects, particularly if we have a large number of defective products that we must repair, retrofit, replace, or recall.
Increases in the cost of providing employee healthcare benefits could reduce our profitability. There may continue to be upward pressure on the cost of providing healthcare benefits to our employees. We are self-insured for healthcare benefits so we incur the cost of claims, including catastrophic claims that may occasionally occur, with employees bearing only a limited portion of healthcare costs through employee healthcare premium withholdings. There can be no assurance that we will succeed in limiting cost increases, and continued upward pressure could reduce our profitability.
We are subject to extensive environmental regulation and significant potential environmental liabilities. Our past and present operation and ownership of manufacturing plants and real property are subject to extensive federal, state, local, and foreign environmental laws and regulations, including those relating to discharges in air, water, and land, the handling and disposal of solid and hazardous waste, and the remediation of contamination associated with releases of hazardous substances. In addition, the increased prevalence of global climate issues may result in new regulations that may negatively impact us. We cannot predict what environmental legislation or regulations will be enacted in the future, how existing or future laws or regulations will be administered or interpreted or what environmental conditions may be found to exist with respect to our
13
facilities and real property. Compliance with more stringent laws or regulations, or stricter interpretation of existing laws, may require additional expenditures, some of which could be material. In addition, any investigations or remedial efforts relating to environmental matters could involve material costs or otherwise result in material liabilities.
Turnover in personnel could cause manufacturing inefficiencies. The demand for manufacturing labor in certain geographic areas makes retaining experienced production employees difficult. Turnover could result in lost time due to inefficiencies and additional training that could impact our operating results.
Natural disasters or other catastrophic events may impact our production schedules and, in turn, negatively impact profitability. Natural disasters or other catastrophic events, including severe weather, terrorist attacks, power interruptions, and fires, could disrupt operations and likewise our ability to produce or deliver products. Our manufacturing operations require significant amounts of energy, including natural gas and oil, and governmental regulations may control the allocation of such fuels. Employees are an integral part of our business and events such as a pandemic could reduce the availability of employees reporting for work. In the event we experience a temporary or permanent interruption in our ability to produce or deliver product, revenues could be reduced, and our business could be materially adversely affected. In addition, catastrophic events, or the threat thereof, can adversely affect U.S. and world economies, and could result in delayed or lost sales of our products. In addition, any continuing disruption in our computer system could adversely affect the ability to receive and process customer orders, manufacture products, and ship products on a timely basis, and could adversely affect relations with our customers, potentially resulting in a reduction in orders from customers or loss of customers. We maintain insurance to help protect us from costs relating to some of these matters, but such insurance may not be sufficient or paid in a timely manner to us in the event of such an interruption.
The value of our common stock may experience substantial fluctuations for reasons over which we may have little control. The value of our common stock could fluctuate substantially based on a variety of factors, including, among others:
• | actual or anticipated fluctuations in operating results; |
• | announcements concerning our Company, competitors, or industry; |
• | overall volatility of the stock market; |
• | changes in the financial estimates of securities analysts or investors regarding our Company, the industry, or competitors; |
• | general market or economic conditions; and |
• | proxy contests or other shareowner activism. |
We also provide financial targets for our expected operating results for future periods. While the information is provided based on current and projected data about the markets we deliver to and our operational capacity and capabilities, the financial targets are subject to risks and uncertainties. If our future results do not match our financial targets for a particular period, or if the financial targets are reduced in future periods, the value of our common stock could decline.
Furthermore, stock prices for many companies fluctuate widely for reasons that may be unrelated to their operating results. These fluctuations, coupled with changes in results of operations and general economic, political, and market conditions, may adversely affect the value of our common stock.
Item 1B - Unresolved Staff Comments
None.
14
Item 2 - Properties
The location, number, and use of our major facilities, including our executive and administrative offices, as of June 30, 2018, are as follows:
Number of Facilities | Use | |
North America | ||
United States: | ||
Indiana | 15 | Manufacturing, Warehouse, Office |
Kentucky | 2 | Manufacturing, Office |
California | 1 | Warehouse, Office |
Virginia | 1 | Manufacturing, Warehouse, Office |
Mexico | 1 | Manufacturing, Office |
Asia | ||
China | 1 | Office |
Vietnam | 1 | Office |
Total Facilities | 22 | |
The listed facilities occupy approximately 3,227,000 square feet in aggregate, of which approximately 3,050,000 square feet are owned, and 177,000 square feet are leased.
During fiscal year 2017, a facility in Indiana which housed an education center for dealer and employee training, a research and development center, and a product showroom was sold. We leased a portion of the facility back to facilitate the transition of those functions to other existing Indiana locations. The lease expired in fiscal year 2018.
During the second quarter of fiscal year 2018, we acquired certain assets of D’style, headquartered in Chula Vista, California, and all of the capital stock of Diseños de Estilo S.A. de C.V., a Mexican corporation located in Tijuana, Mexico, which resulted in our acquisition of 27,000 square feet and 33,000 square feet of leased space, respectively.
Generally, properties are utilized at normal capacity levels on a multiple shift basis. At times, certain facilities utilize a reduced second or third shift. Due to sales fluctuations, not all facilities were utilized at normal capacity during fiscal year 2018. We continually assess our capacity needs and evaluate our operations to optimize our service levels by geographic region.
Significant loss of income resulting from a facility catastrophe would be partially offset by business interruption insurance coverage.
Operating leases for all facilities and related land, including twelve leased office furniture showroom facilities which are not included in the table above, total 265,000 square feet and expire from fiscal year 2019 to 2027 with many of the leases subject to renewal options. The leased showroom facilities are in six states and the District of Columbia. See Note 5 - Commitments and Contingent Liabilities of Notes to Consolidated Financial Statements for additional information concerning leases.
We own approximately 331 acres of land which includes land where various facilities reside, including approximately 115 acres of land in the Kimball Industrial Park, Jasper, Indiana.
Item 3 - Legal Proceedings
We and our subsidiaries are not parties to any pending legal proceedings, other than ordinary routine litigation incidental to the business. The outcome of current routine pending litigation, individually and in the aggregate, is not expected to have a material adverse impact.
Item 4 - Mine Safety Disclosures
Not applicable.
15
Executive Officers of the Registrant
Our executive officers as of August 28, 2018 are as follows:
(Age as of August 28, 2018)
Name | Age | Office and Area of Responsibility | Executive Officer Since Calendar Year | |||
Robert F. Schneider | 57 | Chairman of the Board, Chief Executive Officer, Kimball International | 1992 | |||
Donald W. Van Winkle | 57 | President, Chief Operating Officer, Kimball International | 2010 | |||
Michelle R. Schroeder | 53 | Vice President, Chief Financial Officer, Kimball International | 2003 | |||
Michael S. Wagner | 46 | Vice President, Kimball International; President, Kimball | 2014 | |||
R. Gregory Kincer | 60 | Vice President, Corporate Development, Kimball International | 2014 | |||
Julia E. Heitz Cassidy | 53 | Vice President, Chief Ethics & Compliance Officer, General Counsel and Secretary, Kimball International | 2014 | |||
Lonnie P. Nicholson | 54 | Vice President, Chief Administrative Officer, Kimball International | 2014 | |||
Kourtney L. Smith | 48 | Vice President, Kimball International; President, National Office Furniture | 2015 | |||
Kathy S. Sigler | 55 | Vice President, Kimball International; President, Kimball Hospitality | 2018 | |||
Executive officers are elected annually by the Board of Directors.
Mr. Schneider was appointed Chairman of the Board, Chief Executive Officer in November 2014 and was appointed to our Board of Directors in February 2014. He led the Kimball Hospitality subsidiary in 2013 and 2014, and was Executive Vice President, Chief Financial Officer (“CFO”) from July 1997 to November 2014. He has been with the Company for 30 years in various financial and executive positions. As leader of Kimball Hospitality, he oversaw the business as it returned to profitability in fiscal year 2014. He was also responsible for strategic planning, SEC reporting, finance, capital structure, insurance, tax, internal audit, and treasury services as CFO of the Company. Mr. Schneider plans to retire effective October 31, 2018. The Board of Directors created a Continuity Committee to facilitate the succession planning process.
Mr. Van Winkle was appointed President, Chief Operating Officer in November 2014. He previously served as Executive Vice President, President — Furniture Group from March 2014 to November 2014. He also served as Vice President, President — Office Furniture Group from February 2010 until November 2013 when he was appointed Executive Vice President, President — Office Furniture Group. He had previously served as Vice President, General Manager of National from October 2003 until February 2010, and prior to that served as Vice President, Chief Finance and Administrative Officer for the Furniture Brands Group as well as other key finance roles within our Furniture business since joining the Company in January 1991.
Ms. Schroeder was appointed Vice President, Chief Financial Officer in November 2014. She previously served as Vice President and Chief Accounting Officer, a position she assumed in May 2009. She was appointed to Vice President in December 2004, served as Corporate Controller from August 2002 until May 2009, and prior to that served as Assistant Corporate Controller and Director of Financial Analysis. As CFO, Ms. Schroeder has responsibility for the accounting, internal audit, investor relations, tax and treasury functions, as well as setting financial strategy and policies for the Company.
Mr. Wagner was appointed President, Kimball in November 2014 and was also appointed as a Vice President of Kimball International, Inc. in February 2015. Prior to that, he served as Vice President, General Manager of Kimball. Since joining the Company in October 2013, Mr. Wagner has led the extensive sales growth and aggressive cost reductions at Kimball. Prior to joining the Company, he most recently served as Senior Vice President of Sales and Marketing with OFS Brands, Inc. (an office furniture manufacturing company) from 2004 until October 2013. His career spans over 20 years of experience in the office furniture industry with leadership positions in sales, sales management, marketing, and strategic planning.
Mr. Kincer was appointed Vice President, Corporate Development in November 2014. Prior to that, he served as Vice President, Business Development, Treasurer since 2006 with responsibility for global treasury operations managing Company-wide liquidity, commercial banking relationships, corporate debt facilities, foreign exchange risk, and insurance programs as well as the evaluation of acquisition opportunities. He also served in various finance and leadership roles of progressing responsibility since joining the Company in 1994.
16
Ms. Heitz Cassidy was appointed Vice President, General Counsel and Secretary in November 2014 and to the additional role of Chief Compliance Officer in July 2016, which was adjusted to Chief Ethics and Compliance Officer in October 2016, where she has the responsibility to provide and oversee the provision of legal advice and guidance as needed by the Company, oversee compliance with laws, assist in instilling and maintaining an ethical corporate culture, and implement and maintain our compliance policies and program. She provides strategic-thinking leadership, advice and counsel to our executive management, and as Secretary, assists the Board of Directors. She previously served as Deputy General Counsel since August 2009, with responsibility for handling all day-to-day legal activities of the Company and was appointed to Vice President in October 2013. She joined the Company in 1996 as an associate corporate counsel and has held positions of increasing responsibility within the legal department during her career.
Mr. Nicholson was appointed Vice President, Chief Administrative Officer in February 2015 with responsibility for the human resources and information technology functions. He also served as Vice President, Chief Information Officer from January 2014 until March 2015. Throughout 2013 he served as Director, Business Analytics and then Vice President, Business Analytics, with oversight of strategic application of data analysis, social media and mobile computing in support of the growth of our information management into more predictive analysis in order to build greater responsiveness to customer needs and improvement of operational decision making. He also served as Director of Organizational Development from November 2011 until January 2013, and Director of Employee Engagement from November 2008 until November 2011 following other roles of advancing responsibility in the areas of application development, systems analysis, process re-engineering, lean/continuous improvement and enterprise resource planning since joining the Company in 1986.
Ms. Smith was appointed President, National Office Furniture in January 2018 and has served as Vice President of Kimball International, Inc. since October 2015. Prior to January 2018, she held the position of President, Kimball Hospitality from August 2015 until January 2018, where she was responsible for strategic growth and direction. Previously, she served as Vice President, Marketing for National Office Furniture, a position she assumed in 2010 where she led product development, marketing, sustainability, vertical markets, and increasing brand awareness in the architect and design community. Prior to that, she held various other roles of increasing responsibility in marketing, product development, sales and service. She has over 25 years of experience in the office and hospitality industries.
Ms. Sigler was appointed President, Kimball Hospitality and also appointed as a Vice President of Kimball International, Inc. in January 2018. She is responsible for the strategic growth and direction of Kimball Hospitality. Prior to that, she served as Vice President, Operations, for the Kimball brand from February 2015 until January 2018, where she was responsible for the strategic and day-to-day execution of all direct manufacturing and manufacturing support (engineering, global supply chain, quality and continuous improvement) functions. From December 2012 until February 2015, she served as Director of Operations of a Kimball brand manufacturing facility. From August 2004 to December 2012, she held operational leadership roles of increasing responsibility within the Kimball brand. Before her time with the Kimball brand, Ms. Sigler held numerous roles in Kimball Hospitality from 1992 to 2004, including customer service, master scheduling, sales operations management, demand management, and program management.
17
PART II
Item 5 - Market for Registrant’s Common Equity, Related Shareowner Matters and Issuer Purchases of Equity Securities
Market Prices
Our Class B common stock trades on the Global Select Market of Nasdaq under the symbol: KBAL. High and low sales prices by quarter for the last two fiscal years as quoted by the Nasdaq system were as follows:
2018 | 2017 | ||||||||||||||
High | Low | High | Low | ||||||||||||
First Quarter | $ | 20.24 | $ | 15.60 | $ | 13.46 | $ | 10.99 | |||||||
Second Quarter | $ | 20.96 | $ | 15.40 | $ | 18.00 | $ | 11.97 | |||||||
Third Quarter | $ | 20.17 | $ | 15.70 | $ | 17.98 | $ | 15.66 | |||||||
Fourth Quarter | $ | 17.70 | $ | 15.88 | $ | 18.94 | $ | 15.84 | |||||||
There is no established public trading market for our Class A common stock. However, Class A shares are convertible on a one-for-one basis into Class B shares.
Dividends
Dividends declared totaled $10.5 million and $9.0 million for fiscal years 2018 and 2017, respectively. Included in these figures are dividends computed and accrued on unvested restricted share units. Dividends on these restricted share units accumulate and, when the restricted share units vest, are paid in shares of our common stock, with the number of shares determined based on the closing price of our common stock on the vesting date. Dividends per share declared by quarter for fiscal year 2018 compared to fiscal year 2017 were as follows:
2018 | 2017 | ||||||
First Quarter | $ | 0.07 | $ | 0.06 | |||
Second Quarter | 0.07 | 0.06 | |||||
Third Quarter | 0.07 | 0.06 | |||||
Fourth Quarter | 0.07 | 0.06 | |||||
Total Dividends | $ | 0.28 | $ | 0.24 | |||
Shareowners
On August 27, 2018, our Class A common stock was owned by 108 shareowners of record, and our Class B common stock was owned by 1,291 shareowners of record, of which 50 also owned Class A common stock.
Securities Authorized for Issuance Under Equity Compensation Plans
The information required by this item concerning securities authorized for issuance under equity compensation plans is incorporated by reference to Item 12 - Security Ownership of Certain Beneficial Owners and Management and Related Shareowner Matters of Part III of this Annual Report on Form 10-K.
Issuer Purchases of Equity Securities
A share repurchase program authorized by the Board of Directors was announced on October 16, 2007. The program allowed for the repurchase of up to two million shares of common stock. During fiscal year 2017, we repurchased all remaining shares originally authorized.
On August 11, 2015 an additional two million shares of common stock were authorized by the Board of Directors for repurchase and will remain in effect until all shares authorized have been repurchased. The Board of Directors can discontinue this repurchase program at any time. At June 30, 2018, 1.2 million shares remained available under the repurchase program.
18
During each of fiscal years 2018 and 2017, we repurchased 0.5 million shares of our common stock. The following table presents a summary of our share repurchases during the fourth quarter of fiscal year 2018:
Period | Total Number of Shares Purchased | Average Price Paid per Share | Total Number of Shares Purchased as Part of Publicly Announced Plans or Programs | Maximum Number of Shares that May Yet Be Purchased Under the Plans or Programs | ||||||||
Month #1 (April 1 - April 30, 2018) | 16,530 | $ | 16.52 | 16,530 | 1,236,816 | |||||||
Month #2 (May 1 - May 31, 2018) | 3,900 | $ | 16.39 | 3,900 | 1,232,916 | |||||||
Month #3 (June 1 - June 30, 2018) | 11,210 | $ | 16.01 | 11,210 | 1,221,706 | |||||||
Total | 31,640 | $ | 16.32 | 31,640 | ||||||||
Performance Graphs
The following performance graphs are not deemed to be “soliciting material” or to be “filed” with the SEC or subject to Regulation 14A or 14C under the Exchange Act or to the liabilities of Section 18 of the Exchange Act and will not be deemed to be incorporated by reference into any filing under the Securities Act or the Exchange Act, except to the extent we specifically incorporate them by reference into such a filing.
The first graph below compares the cumulative total return to shareowners of our common stock from June 30, 2013 through June 30, 2018, the last business day in the respective fiscal years, to the cumulative total return of the Nasdaq Stock Market (U.S. and Foreign) and a peer group index for the same period of time.
The spin-off of Kimball Electronics is reflected as an increase in the total cumulative return to shareowners as a result of each shareowner receiving a distribution of three shares of Kimball Electronics for every four shares of the Company. The increase in the total cumulative return was calculated based on the value of Kimball Electronics stock, using a 30-day volume weighted average price calculation to eliminate the impact of stock price volatility immediately after the October 31, 2014 spin-off date.
Due to the diversity of our operations prior to the spin-off date, we are not aware of any public companies that are directly comparable. Therefore, the peer group index is comprised of publicly traded companies in both the furniture industry and in our former EMS segment, as follows:
Furniture peers: HNI Corporation, Knoll, Inc., Steelcase Inc., Herman Miller, Inc.
EMS peers (applicable through the October 31, 2014 spin-off): Benchmark Electronics, Inc., Jabil, Inc., Plexus Corp.
In order to reflect the segment allocation of Kimball International prior to the October 31, 2014 spin-off date, a market capitalization-weighted index was first computed for each peer group, then a composite peer group index was calculated based on each segment’s proportion of net sales to total consolidated sales for fiscal year 2014 and for fiscal year 2015 through the October 31, 2014 spin-off date. After the spin-off date, only the Furniture peer companies were used in the capitalization-weighted peer group index. The public companies included in the peer groups have a larger revenue base than our furniture business and our former EMS business.
19
The graph assumes $100 is invested in our common stock and each of the two indexes at the closing market quotations on June 30, 2013 and that dividends and the Kimball Electronics spin-off stock distribution are reinvested in Kimball International. The performances shown on the graph are not necessarily indicative of future price performance.
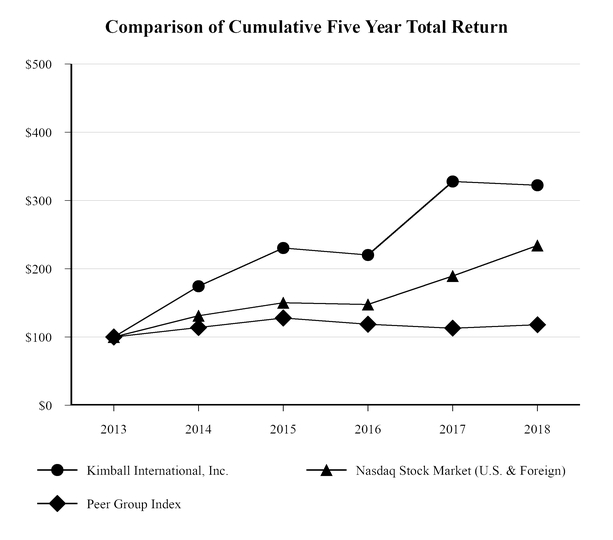
2013 | 2014 | 2015 | 2016 | 2017 | 2018 | |||||||||||||
Kimball International, Inc. | $ | 100.00 | $ | 174.54 | $ | 230.35 | $ | 220.16 | $ | 327.85 | $ | 322.46 | ||||||
Nasdaq Stock Market (U.S. & Foreign) | $ | 100.00 | $ | 131.17 | $ | 150.10 | $ | 147.58 | $ | 189.34 | $ | 234.02 | ||||||
Peer Group Index | $ | 100.00 | $ | 113.84 | $ | 127.88 | $ | 118.66 | $ | 113.09 | $ | 118.06 | ||||||
20
The spin-off of Kimball Electronics, which represented more than half of our Company in sales and the majority of earnings, makes comparable long-term stock price performance very difficult. Publicly available stock price analyses, such as five-year stock price trends, are not representative of our performance as stock prices in the pre-spin period are not comparable to stock prices in the post-spin period. To aid in trending our performance, below is a cumulative total return performance graph from the spin-off date forward.
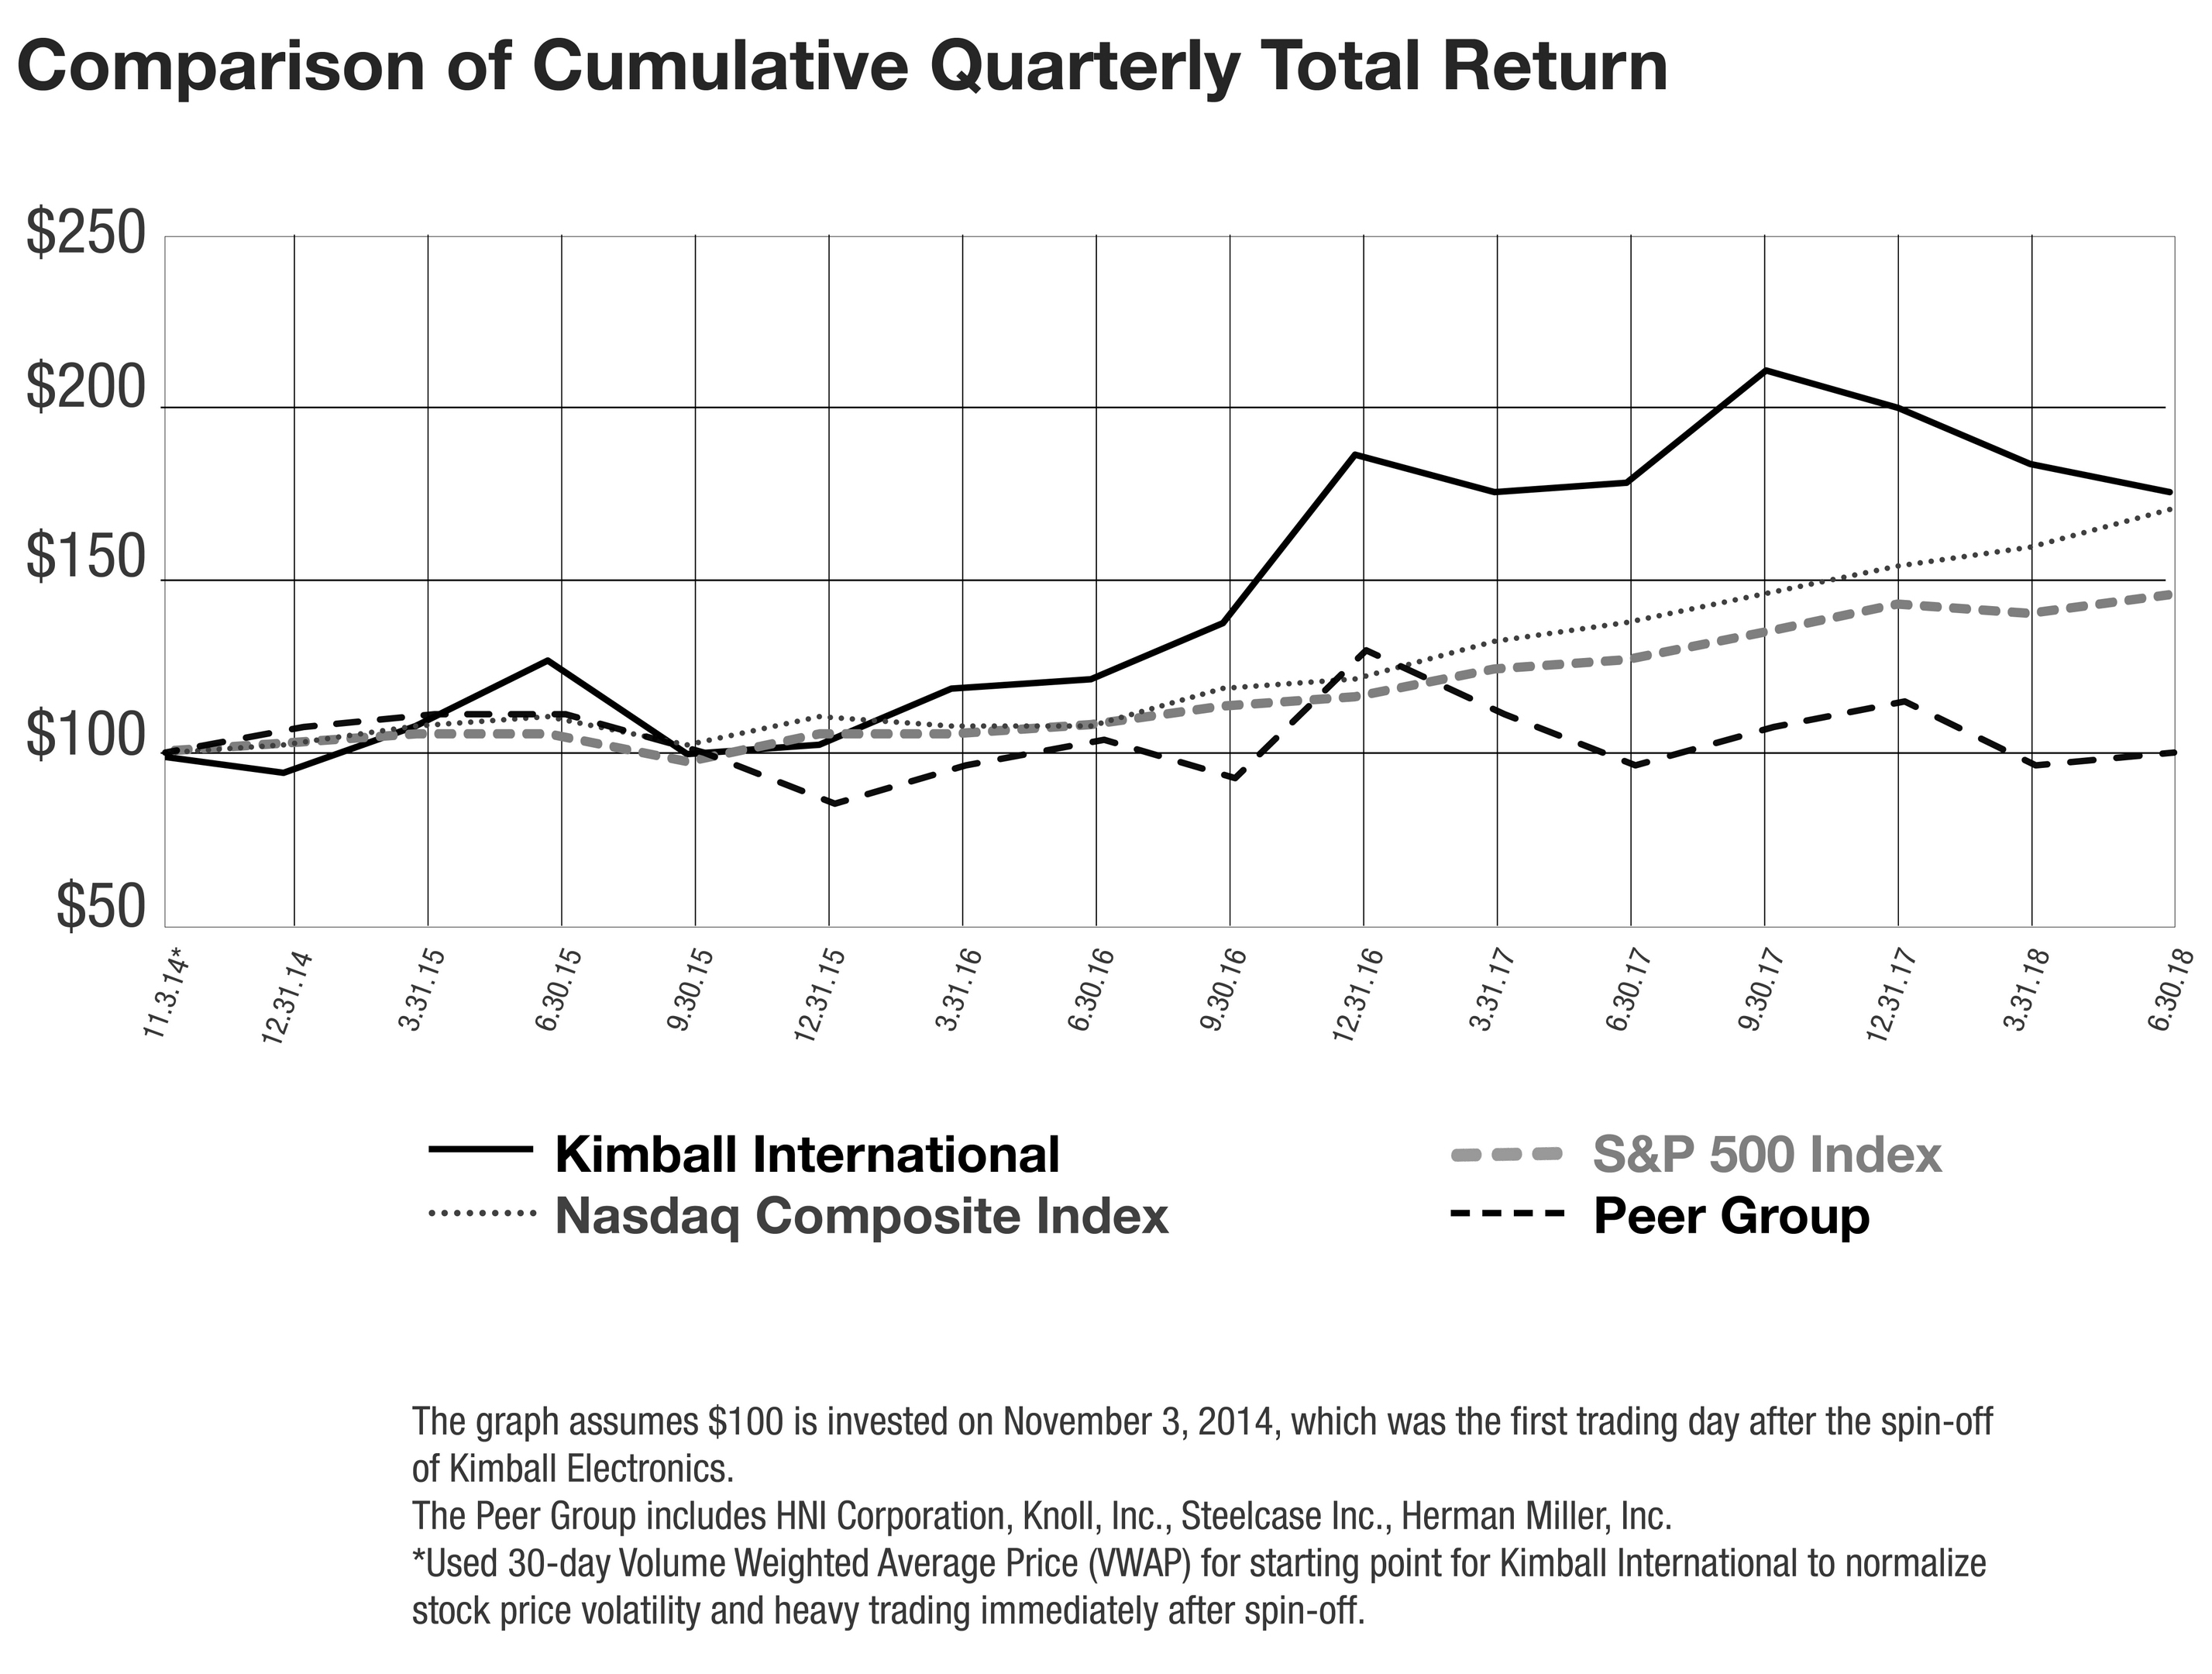
21
Item 6 - Selected Financial Data
This information should be read in conjunction with Item 7 - Management's Discussion and Analysis of Financial Condition and Results of Operations and Item 8 - Financial Statements and Supplementary Data.
Year Ended June 30 | |||||||||||||||||||
(Amounts in Thousands, Except for Per Share Data) | 2018 | 2017 | 2016 | 2015 | 2014 | ||||||||||||||
Net Sales | $ | 685,600 | $ | 669,934 | $ | 635,102 | $ | 600,868 | $ | 543,817 | |||||||||
Income from Continuing Operations | $ | 34,439 | $ | 37,506 | $ | 21,156 | $ | 11,143 | $ | 3,419 | |||||||||
Earnings Per Share from Continuing Operations: | |||||||||||||||||||
Basic: | $ | 0.92 | $ | 1.00 | $ | 0.56 | |||||||||||||
Class A | $ | 0.25 | $ | 0.07 | |||||||||||||||
Class B | $ | 0.29 | $ | 0.09 | |||||||||||||||
Diluted: | $ | 0.92 | $ | 0.99 | $ | 0.56 | |||||||||||||
Class A | $ | 0.25 | $ | 0.07 | |||||||||||||||
Class B | $ | 0.29 | $ | 0.09 | |||||||||||||||
Total Assets | $ | 330,168 | $ | 313,747 | $ | 273,570 | $ | 265,279 | $ | 722,146 | |||||||||
Long-Term Debt, Less Current Maturities | $ | 161 | $ | 184 | $ | 212 | $ | 241 | $ | 268 | |||||||||
Cash Dividends Per Share: | $ | 0.28 | $ | 0.24 | $ | 0.22 | |||||||||||||
Class A | $ | 0.195 | $ | 0.18 | |||||||||||||||
Class B | $ | 0.20 | $ | 0.20 | |||||||||||||||
On October 31, 2014, we completed the spin-off of our EMS segment. The EMS segment was reclassified to discontinued operations in the Consolidated Statements of Income for all periods presented. Discontinued operations did not have an impact on the financial results of fiscal years 2018, 2017 and 2016. The preceding table excludes all income statement activity of the discontinued operations. The balance sheet data in the preceding table includes the EMS segment for fiscal years prior to 2015.
Fiscal year 2017 income from continuing operations included $1.1 million ($0.03 per diluted share) of after-tax restructuring gains driven by the sale of the Idaho facility.
Fiscal year 2016 income from continuing operations included $4.5 million ($0.12 per diluted share) of after-tax restructuring expenses.
Fiscal year 2015 income from continuing operations included $3.2 million ($0.08 per diluted share) of after-tax restructuring expenses and $3.2 million ($0.08 per diluted share) of after-tax expense related to the spin-off.
Fiscal year 2014 income from continuing operations included an after-tax gain of $1.1 million ($0.03 per diluted share) for the sale of an idle Furniture segment manufacturing facility and land located in Jasper, Indiana, after-tax impairment of $0.7 million ($0.02 per diluted share) for an aircraft which was subsequently sold, and $1.4 million ($0.04 per diluted share) of after-tax expense related to the spin-off.
Item 7 - Management’s Discussion and Analysis of Financial Condition and Results of Operations
Business Overview
Kimball International, Inc. (the “Company,” “Kimball International,” “we,” “us,” or “our”) creates design driven, innovative furnishings sold through our family of brands: Kimball, National, and Kimball Hospitality. Our diverse portfolio offers solutions for the workplace, learning, healing, and hospitality environments. Our values and integrity are demonstrated daily by living our Guiding Principles and creating a culture of caring, that establishes us as an employer of choice. “We Build Success” by establishing long-term relationships with customers, employees, suppliers, shareowners and the communities in which we operate.
We closely monitor key indicators for the markets in which we compete. As reported by the Business and Institutional Furniture Manufacturer Association (“BIFMA”), the forecast by IHS as of April 2018 for the U.S. commercial furniture market, which they define as including office, education, and healthcare furniture products, projects a year-over-year increase of 1.9% for calendar year 2018 and 3.6% for calendar year 2019. The forecast for two of the leading indicators for the hospitality furniture market (May 2018 PwC Hospitality Directions U.S. report) includes a projected increase in RevPAR (Revenue Per Available
22
Room) of 3.0% for calendar year 2018 and 2.8% for calendar year 2019, while the occupancy levels for calendar year 2018 and 2019 continue to hover at peak levels.
Management currently considers the following events, trends, and uncertainties to be most important to understanding our financial condition and operating performance:
• | On November 6, 2017, we successfully completed the acquisition of certain assets of D’style, Inc. (“D’style”) and all of the capital stock of Diseños de Estilo S.A. de C.V., which have administrative and sales offices and warehousing in Chula Vista, California and a manufacturing location in Tijuana, Mexico. The acquisition expands our hospitality offerings beyond guest rooms to public spaces and provides new mixed material manufacturing capabilities. The cash paid for the acquisition totaled $18.2 million, inclusive of a $0.4 million post-closing working capital adjustment. An earn-out of up to $2.2 million may be paid, which is contingent based upon fiscal year 2018 and 2019 D’style operating income compared to a predetermined target for each fiscal year. As of June 30, 2018, the fair value of the earn-out was $1.1 million. See Note 2 - Acquisition of Notes to Consolidated Financial Statements for additional information. |
• | On December 22, 2017, the Tax Cuts and Jobs Act (“Tax Act”) was signed into law. The Tax Act reduced federal corporate income tax rates effective January 1, 2018 and changed numerous other provisions. Because Kimball International has a June 30 fiscal year-end, the lower corporate income tax rate was phased in, resulting in a U.S. statutory federal tax rate of 28.1% for our fiscal year ending June 30, 2018. The statutory federal tax rate will be 21% in subsequent fiscal years. Our fiscal year 2018 included approximately $3.3 million in reduced income tax expense reflecting federal taxes on current year taxable income at the lower blended effective tax rate, partially offset by a fiscal year 2018 discrete tax impact of $1.8 million in additional expense as a result of applying the new lower federal income tax rates to our net tax assets. The changes included in the Tax Act are broad and complex. The Securities and Exchange Commission has issued rules that would allow for a measurement period of up to one year after the enactment date of the Tax Act to finalize the recording of the related tax impacts. We have finalized and recorded the related tax impacts as of June 30, 2018. We expect the lower statutory tax rate to generate significantly lower tax expense in future periods, which will be partially offset by the loss of the deductibility of certain expenses. |
• | The impact of higher transportation and commodity prices is expected to intensify as pricing pressure from our vendors increases. We utilize both steel and aluminum in our products, most of which is sourced domestically. The U.S. recently imposed tariffs of 25% on steel and 10% on aluminum imported from several countries which could adversely impact our input costs. The government has also recently proposed to expand its list of products subject to tariffs to include furniture products, parts, and components, and if approved, the landed cost of our products could increase materially, which would reduce our net income if we are unable to mitigate the additional cost. We are monitoring this situation, but at this time we are uncertain of the potential impact that these tariffs may have on our results of operations. We strive to offset increases in the cost of these materials through supplier negotiations, global sourcing initiatives, product re-engineering and parts standardization, and price increases on our products. We are also exposed to fluctuation in transportation costs which vary based upon freight carrier capacity and fuel prices. Transportation costs are managed by optimizing logistics and supply chain planning, and increasing prices on our products is sometimes necessary. Our National brand recently implemented a price increase that was effective on April 6, 2018, while our Kimball brand announced a price increase effective on July 2, 2018. |
• | On May 7, 2018, Robert F. Schneider informed the Board of Directors of Kimball International of his decision to retire as our Chief Executive Officer and Chairman of the Board. Mr. Schneider plans to retire effective October 31, 2018. The Board of Directors created a Continuity Committee to facilitate the appointment of a new CEO. |
• | During the latter portion of our fiscal year 2017, we sold a facility in Indiana which housed the education center for dealer and employee training, a research and development center, and a product showroom for proceeds of $3.8 million. We leased a portion of the facility through December 2017 to facilitate the short-term transition of those functions to other existing Indiana locations. The sale of the facility did not qualify for sale-leaseback accounting during fiscal year 2017, and thus the $1.7 million pre-tax gain on the sale was not recognized in selling and administrative expenses until fiscal year 2018. |
• | The U.S. government, as well as state and local governments, can typically terminate or modify their contracts with us either at their discretion or if we default by failing to perform under the terms of the applicable contract, which could expose us to liability and impede our ability to compete in the future for contracts and orders. The failure to comply with regulatory and contractual requirements could subject us to investigations, fines, or other penalties, and violations of certain regulatory and contractual requirements could also result in us being suspended or debarred from future government contracting. In March 2016, in connection with a renewal of one of our two contracts with the General Services Administration (“GSA”), we became aware of noncompliance and inaccuracies in our GSA subcontractor reporting. Accordingly, we retained outside legal counsel to assist in conducting an internal review of our reporting practices, and we self-reported the matter and the results of the internal review to the GSA. We have promptly responded to |
23
inquiries from the GSA since our initial reporting, have met with government officials as requested on two occasions, and intend to cooperate fully with any further inquiries or investigations. We cannot reasonably predict the outcome of a government investigation at this time. During fiscal year 2018, sales related to our GSA contracts were approximately 7.5% of our consolidated sales, with one contract accounting for approximately 5.3% of our consolidated sales and the other contract accounting for approximately 2.2% of our consolidated sales.
• | Due to the contract and project nature of furniture markets, fluctuation in the demand for our products and variation in the gross margin on those projects is inherent to our business which in turn impacts our operating results. Effective management of our manufacturing capacity is and will continue to be critical to our success. See below for further details regarding current sales and open order trends. |
• | We expect to continue to invest in capital expenditures prudently, including potential acquisitions, that would enhance our capabilities and diversification while providing an opportunity for growth and improved profitability. |
• | We have a strong focus on cost control and closely monitor market changes and our liquidity in order to proactively adjust our operating costs, discretionary capital spending, and dividend levels as needed. Managing working capital in conjunction with fluctuating demand levels is likewise key. In addition, a long-standing component of our Annual Cash Incentive plan is that it is linked to our Company-wide and business unit performance which is designed to adjust compensation expense as profits change. |
• | We continue to maintain a strong balance sheet. Our short-term liquidity available, represented as cash, cash equivalents, and short-term investments plus the unused amount of our credit facility, was $115.9 million at June 30, 2018. |
24
Fiscal Year 2018 Results of Operations
At or for the Year Ended | ||||||||||
June 30 | ||||||||||
(Amounts in Millions) | 2018 | 2017 | % Change | |||||||
Net Sales | $ | 685.6 | $ | 669.9 | 2 | % | ||||
Gross Profit | 221.4 | 223.3 | (1 | %) | ||||||
Selling and Administrative Expenses | 170.4 | 168.5 | 1 | % | ||||||
Restructuring Gain | — | (1.8 | ) | |||||||
Operating Income | 51.1 | 56.7 | (10 | %) | ||||||
Operating Income % | 7.4 | % | 8.5 | % | ||||||
Adjusted Operating Income * | $ | 51.1 | $ | 54.8 | (7 | %) | ||||
Adjusted Operating Income % * | 7.4 | % | 8.2 | % | ||||||
Net Income | $ | 34.4 | $ | 37.5 | (8 | %) | ||||
Adjusted Net Income * | 34.4 | 36.4 | (5 | %) | ||||||
Diluted Earnings Per Share | $ | 0.92 | $ | 0.99 | ||||||
Adjusted Diluted Earnings Per Share * | $ | 0.92 | $ | 0.96 | ||||||
Open Orders | $ | 148.9 | $ | 131.6 | 13 | % | ||||
* Items indicated represent Non-GAAP (Generally Accepted Accounting Principles) measurements for fiscal year 2017. See the “Non-GAAP Financial Measures and Other Key Performance Indicators” section below.
Net Sales by End Market Vertical | ||||||||||
Year Ended | ||||||||||
June 30 | ||||||||||
(Amounts in Millions) | 2018 | 2017 | % Change | |||||||
Commercial | $ | 201.7 | $ | 198.5 | 2 | % | ||||
Education | 82.8 | 78.0 | 6 | % | ||||||
Finance | 66.6 | 68.1 | (2 | %) | ||||||
Government | 81.3 | 75.5 | 8 | % | ||||||
Healthcare | 86.6 | 96.0 | (10 | %) | ||||||
Hospitality | 166.6 | 153.8 | 8 | % | ||||||
Total Net Sales | $ | 685.6 | $ | 669.9 | 2 | % | ||||
Fiscal year 2018 consolidated net sales were $685.6 million compared to fiscal year 2017 net sales of $669.9 million, a 2% increase, as $13.0 million of net sales resulting from the D’style acquisition and price increases net of higher discounting more than offset decreased organic sales volume.
During fiscal year 2018 we redefined our vertical market reporting to better reflect the end markets that we serve. The largest shifts among vertical markets were sales to certain government-affiliated medical facilities, which were previously classified in the government and commercial vertical markets and are now classified in the healthcare vertical market. Prior period information was estimated to reflect the new vertical market definitions on a comparable basis.
Key explanatory comments for our sales by vertical market follow:
• | For fiscal year 2018 compared to fiscal year 2017, increased hospitality vertical market sales were driven by the acquisition of the D’style business and increases in organic non-custom business, which more than offset a sales decline in our custom business. |
• | Government vertical market sales for fiscal year 2018 increased as state and local government sales increased while sales to the federal government decreased. |
25
• | Our sales to the education vertical market increased due to our greater focus on this market, despite educational funding being diverted to safety and security products which negatively impacted the timing and size of furniture orders received. |
• | Although sales in the healthcare vertical market declined in fiscal year 2018 compared to fiscal year 2017, we have experienced a rebound in quoting activity which led to increased shipments and orders in the fourth quarter of our fiscal year 2018. |
• | Each of our vertical market sales levels can fluctuate depending on the mix of projects in a given period. |
Open orders at June 30, 2018 increased 13% when compared to the open order level as of June 30, 2017 primarily due to higher hospitality furniture backlog driven by both the D’style acquisition and growth in organic hospitality orders. Excluding an approximate $2.0 million positive impact from a price increase for one of our brands which took effect on July 2, 2018 and accelerated orders into our fiscal year 2018, office furniture backlog as of June 30, 2018 was flat. Open orders at a point in time may not be indicative of future sales trends.
In fiscal year 2018 we recorded net income of $34.4 million, or $0.92 per diluted share. In fiscal year 2017 we recorded net income of $37.5 million, or $0.99 per diluted share, inclusive of $1.1 million, or $0.03 per diluted share, of after-tax restructuring gain from the sale of the Idaho facility. Excluding the non-recurring gain, our adjusted net income for fiscal year 2017 was $36.4 million, or $0.96 per diluted share. See the “Non-GAAP Financial Measures and Other Key Performance Indicators” section below.
Gross profit as a percent of net sales decreased 100 basis points in fiscal year 2018 compared to fiscal year 2017, as increased product pricing and lower employee benefit expenses such as healthcare were more than offset by a shift in sales mix to lower margin products, freight cost increases, higher discounting, and an increase in our LIFO inventory reserve. See Note 3 - Inventories of Notes to Consolidated Financial Statements for more information on LIFO inventory.
As a percent of net sales, selling and administrative expenses in fiscal year 2018 compared to fiscal year 2017 decreased 20 basis points due to the increased sales volumes. In absolute dollars selling and administrative spending increased 1% as the additional selling and administrative expenses of the D’style acquisition, higher salary expense, and higher marketing expenditures to grow the business were partially offset by lower incentive compensation costs. During fiscal year 2018 we recognized a $1.7 million pre-tax gain on the sale of an administrative building, and in fiscal year 2017 we recognized $1.2 million of gains on the sale of land.
Fiscal year 2017 included a pre-tax restructuring gain of $1.8 million which included a gain on the sale of our Post Falls, Idaho facility and land of $2.1 million partially offset by restructuring expense of $0.3 million. See Note 17 - Restructuring Expense of Notes to Consolidated Financial Statements for further information on restructuring.
Other Income (Expense) consisted of the following:
Other Income (Expense) | Year Ended | ||||||
June 30 | |||||||
(Amounts in Thousands) | 2018 | 2017 | |||||
Interest Income | $ | 1,057 | $ | 536 | |||
Interest Expense | (221 | ) | (37 | ) | |||
Foreign Currency (Loss) Gain | (93 | ) | 18 | ||||
Gain on Supplemental Employee Retirement Plan Investments | 980 | 1,215 | |||||
Other | (461 | ) | (377 | ) | |||
Other Income (Expense), net | $ | 1,262 | $ | 1,355 | |||
Our fiscal year 2018 results of operations included the impact of the enactment of the Tax Act, which was signed into law on December 22, 2017. The Tax Act reduced federal corporate income tax rates effective January 1, 2018 and changed numerous other provisions. Because Kimball International has a June 30 fiscal year-end, the lower corporate income tax rate was phased in, resulting in a U.S. statutory federal tax rate of 28.1% for our fiscal year ending June 30, 2018. The statutory federal tax rate will be 21% for subsequent fiscal years. Our fiscal year 2018 included approximately $3.3 million in reduced income tax expense to reflect federal taxes on current year taxable income at the lower blended effective tax rate, partially offset by a discrete tax impact of $1.8 million in additional expense as a result of applying the new lower federal income tax rates to our net tax assets.
26
Our fiscal year 2018 effective tax rate was 34.2%, as the benefits of the Tax Act were partially offset by the negative tax impact of applying the lower federal income tax rates to our net deferred tax assets. Our fiscal year 2018 effective tax rate also included a $0.6 million benefit resulting from a domestic manufacturing deduction. Our fiscal year 2017 effective tax rate was 35.4% and included the benefit of $1.5 million resulting from a domestic manufacturing deduction. The Tax Act repealed the domestic manufacturing deduction; thus future fiscal years will not have this benefit.
The changes included in the Tax Act are broad and complex. The transition impacts of the Tax Act may differ from the above estimate, due to, among other things, changes in interpretations of the Tax Act, any legislative action to address questions that arise because of the Tax Act, and any changes in accounting standards for income taxes or related interpretations in response to the Tax Act. The Securities and Exchange Commission has issued rules that would allow for a measurement period of up to one year after the enactment date of the Tax Act to finalize the recording of the related tax impacts. Based on current interpretations, we have finalized our transition and recorded all resulting adjustments as of June 30, 2018.
Comparing the balance sheet as of June 30, 2018 to June 30, 2017, goodwill increased $8.8 million and intangible assets increased $9.7 million relating to the acquisition of D’style. Our prepaid expenses and other current assets line increased by $10.5 million primarily due to an overpayment of estimated income taxes for the fiscal year and also due to a shift in the Supplemental Employee Retirement Plan (“SERP”) balance from long term to short term in conjunction with the pending retirement of our Chief Executive Officer. Our deferred tax assets balance declined by $9.6 million as we accelerated the timing of certain incentive compensation payments and capital expenditures in order for them to be deductible in fiscal year 2018 before our statutory tax rate further decreases in fiscal year 2019.
Fiscal Year 2017 Results of Operations
At or for the Year Ended | ||||||||||
June 30 | ||||||||||
(Amounts in Millions) | 2017 | 2016 | % Change | |||||||
Net Sales | $ | 669.9 | $ | 635.1 | 5 | % | ||||
Gross Profit | 223.3 | 203.8 | 10 | % | ||||||
Selling and Administrative Expenses | 168.5 | 163.0 | 3 | % | ||||||
Restructuring (Gain) Expense | (1.8 | ) | 7.3 | |||||||
Operating Income | 56.7 | 33.5 | 69 | % | ||||||
Operating Income % | 8.5 | % | 5.3 | % | ||||||
Adjusted Operating Income * | $ | 54.8 | $ | 40.8 | 34 | % | ||||
Adjusted Operating Income % * | 8.2 | % | 6.4 | % | ||||||
Net Income | $ | 37.5 | $ | 21.2 | 77 | % | ||||
Adjusted Net Income * | 36.4 | 25.7 | 42 | % | ||||||
Diluted Earnings Per Share | $ | 0.99 | $ | 0.56 | ||||||
Adjusted Diluted Earnings Per Share * | $ | 0.96 | $ | 0.68 | ||||||
Open Orders | $ | 131.6 | $ | 129.9 | 1 | % | ||||
* Items indicated represent Non-GAAP measurements. See the “Non-GAAP Financial Measures and Other Key Performance Indicators” section below.
27
Net Sales by End Market Vertical | ||||||||||
Year Ended | ||||||||||
June 30 | ||||||||||
(Amounts in Millions) | 2017 | 2016 | % Change | |||||||
Commercial | $ | 198.5 | $ | 194.0 | 2 | % | ||||
Education | 78.0 | 69.5 | 12 | % | ||||||
Finance | 68.1 | 60.5 | 13 | % | ||||||
Government | 75.5 | 66.6 | 13 | % | ||||||
Healthcare | 96.0 | 96.5 | (1 | %) | ||||||
Hospitality | 153.8 | 148.0 | 4 | % | ||||||
Total Net Sales | $ | 669.9 | $ | 635.1 | 5 | % | ||||
Fiscal year 2017 consolidated net sales were $669.9 million compared to fiscal year 2016 net sales of $635.1 million, a 5% increase. Increased volume across five of our verticals was the primary driver while the positive impact of price increases contributed to a lesser extent.
During fiscal year 2018 we redefined our vertical market reporting to better reflect the end markets that we serve. The largest shifts among vertical markets were sales to certain government-affiliated medical facilities, which were previously classified in the government and commercial vertical markets and are now classified in the healthcare vertical market. The net sales by vertical market was estimated for fiscal years 2017 and 2016 to reflect the new vertical market definitions on a comparable basis.
Key explanatory comments for our sales by vertical market follow:
• | Our education vertical market sales grew as we continued our focus on education products and distribution. |
• | Our finance vertical market sales increase was driven by focus on strategic accounts and assisting financial institutions with refreshing their image and adding collaborative spaces. |
• | Our sales in the government vertical market increased as we experienced improved order activity on awarded blanket purchase agreements and had success with larger projects relative to fiscal year 2016. |
• | The hospitality vertical market sales increase was primarily driven by increased non-custom business. |
• | Each of our vertical market sales levels can fluctuate depending on the mix of projects in a given period. |
Open orders at June 30, 2017 increased 1% when compared to the open order level as of June 30, 2016 as demand for office furniture increased and hospitality furniture open orders declined slightly.
In fiscal year 2017 we recorded net income of $37.5 million, or $0.99 per diluted share, inclusive of a $1.1 million after-tax restructuring gain, or $0.03 per diluted share, from the sale of the Idaho facility. In fiscal year 2016 we recorded net income of $21.2 million, or $0.56 per diluted share, inclusive of $4.5 million, or $0.12 per diluted share, of after-tax restructuring expense. Excluding these non-recurring gains or expenses, our adjusted net income for fiscal year 2017 improved to $36.4 million, or $0.96 per diluted share, compared to adjusted net income for fiscal year 2016 of $25.7 million, or $0.68 per diluted share. See the “Non-GAAP Financial Measures and Other Key Performance Indicators” section below.
Gross profit as a percent of net sales increased 120 basis points in fiscal year 2017 compared to fiscal year 2016. The improvement was driven by the favorable impact of price increases, the benefit of leverage gained on higher sales volumes, and the benefits from our restructuring plan involving the transfer of metal fabrication production from Idaho into facilities in Indiana. Higher employee benefit costs in fiscal year 2017, retirement expense in particular, partially offset the aforementioned improvements.
As a percent of net sales, selling and administrative expenses in fiscal year 2017 compared to fiscal year 2016 decreased 50 basis points due to increased sales volumes. In absolute dollars selling and administrative spending increased 3% primarily due to higher incentive compensation costs as a result of higher earnings levels and higher salary expense. We also had an unfavorable variance within selling and administrative expenses of $1.2 million for fiscal year 2017 compared to fiscal year 2016 related to the normal revaluation to fair value of our SERP liability. The impact from the change in the SERP liability that was recognized in selling and administrative expenses was offset with the change in fair value of the SERP investments which was recorded in Other Income (Expense), and thus there was no effect on net income. During fiscal year 2017 we also recognized $1.2 million of gains on the sale of land.
28
Fiscal year 2017 includes a pre-tax restructuring gain of $1.8 million which included a gain on the sale of our Post Falls, Idaho facility and land of $2.1 million partially offset by restructuring expense of $0.3 million. We recognized pre-tax restructuring expense of $7.3 million in fiscal year 2016. The improvement of customer delivery, supply chain dynamics, and reduction of transportation costs were expected to generate annual pre-tax savings of approximately $5 million per year, and we achieved savings of approximately $4.7 million in fiscal year 2017 as savings began to ramp up during our first quarter. See Note 17 - Restructuring Expense of Notes to Consolidated Financial Statements for further information on restructuring.
Other Income (Expense) consisted of the following:
Other Income (Expense) | Year Ended | ||||||
June 30 | |||||||
(Amounts in Thousands) | 2017 | 2016 | |||||
Interest Income | $ | 536 | $ | 275 | |||
Interest Expense | (37 | ) | (22 | ) | |||
Foreign Currency Gain (Loss) | 18 | (17 | ) | ||||
Gain (Loss) on SERP Investments | 1,215 | (13 | ) | ||||
Other | (377 | ) | (330 | ) | |||
Other Income (Expense), net | $ | 1,355 | $ | (107 | ) | ||
Our fiscal year 2017 effective tax rate was 35.4% as higher taxable income generated a $1.2 million higher domestic manufacturing deduction than fiscal year 2016. Our fiscal year 2016 effective tax rate was 36.6% and did not include any material unusual items.
Liquidity and Capital Resources
Our cash position, which is comprised of cash, cash equivalents, and short-term investments, decreased to $87.3 million at June 30, 2018 from $98.6 million at June 30, 2017, primarily due to an $18.2 million cash outflow for the D’style acquisition, capital expenditures of $22.3 million in fiscal year 2018, and the return of capital to shareowners in the form of stock repurchases and dividends totaling $19.0 million in fiscal year 2018, which more than offset $46.9 million of cash flows from operations during fiscal year 2018.
Working capital at June 30, 2018 was $85.1 million compared to working capital of $82.5 million at June 30, 2017. The current ratio was 1.7 at both June 30, 2018 and June 30, 2017.
Our short-term liquidity available, represented as cash, cash equivalents, and short-term investments plus the unused amount of our credit facility, totaled $115.9 million at June 30, 2018. At June 30, 2018, we had $1.4 million in letters of credit outstanding, which reduced our borrowing capacity on the credit facility. We had no credit facility borrowings outstanding as of June 30, 2018 or June 30, 2017.
During fiscal year 2017 we sold a facility in Indiana which housed an education center for dealer and employee training, a research and development center, and a product showroom for proceeds of $3.8 million. We were leasing a portion of the facility back to facilitate the short-term transition of those functions to other existing Indiana locations. The sale of the facility did not qualify for sale-leaseback accounting thus the book value of the building remained on the property and equipment line of our Consolidated Balance Sheet as of June 30, 2017 and the related sale-leaseback financing obligation was a current liability on our Consolidated Balance Sheet as of June 30, 2017. During fiscal year 2018, the lease terminated and the sales transaction was recognized, resulting in a $1.7 million pre-tax gain which was recorded in selling and administrative expense.
Cash Flows
The following table reflects the major categories of cash flows for fiscal years 2018, 2017, and 2016.
Year Ended | ||||||||||||
June 30 | ||||||||||||
(Amounts in thousands) | 2018 | 2017 | 2016 | |||||||||
Net cash provided by operating activities | $ | 46,866 | $ | 64,844 | $ | 49,352 | ||||||
Net cash used for investing activities | $ | (35,216 | ) | $ | (36,176 | ) | $ | (16,883 | ) | |||
Net cash used for financing activities | $ | (21,869 | ) | $ | (13,362 | ) | $ | (19,554 | ) | |||
29
Cash Flows from Operating Activities
For fiscal years 2018 and 2017, net cash provided by operating activities was $46.9 million and $64.8 million, respectively, fueled by net income of $34.4 million and $37.5 million, respectively. In fiscal year 2018, changes in working capital balances used $15.2 million and a reduction in deferred income tax and other deferred charges increased cash flow by $9.1 million. Changes in working capital balances provided $10.1 million of cash in fiscal year 2017. Cash generated from operating activities in fiscal year 2016 totaled $49.4 million, which was impacted by net income of $21.2 million, and changes in working capital provided $4.6 million of cash.
The $15.2 million of cash used as a result of changes in working capital balances in fiscal year 2018 was partially driven by an increase of $6.7 million in prepaid expenses and other current assets primarily due to an overpayment of estimated income taxes for fiscal year 2018. Statutory federal tax rates declined in the latter half of our fiscal year as the Tax Act was enacted, and we accelerated certain deductions into the current fiscal year to take advantage of higher tax rates in fiscal year 2018 versus fiscal year 2019. Also contributing was an increase of $5.7 million in our accounts receivable balance primarily driven by increased sales toward the end of fiscal year 2018 compared to fiscal year 2017.
The $10.1 million of cash provided by changes in working capital balances in fiscal year 2017 was primarily driven by a combined $5.7 million increase in accrued annual cash incentive compensation and accrued retirement plan contributions.
The $4.6 million of cash provided by changes in working capital balances in fiscal year 2016 was primarily due to the $4.9 million source of cash driven by a decrease in our accounts receivable balance as the collection process was improved at a select location.
Our measure of accounts receivable performance, also referred to as Days Sales Outstanding (“DSO”), for both fiscal years ended June 30, 2018 and June 30, 2017 was 27.0 days. We define DSO as the average of monthly trade accounts and notes receivable divided by an average day’s net sales. Our Production Days Supply on Hand (“PDSOH”) of inventory measure for both fiscal years ended June 30, 2018 and June 30, 2017 was 47.0 days. We define PDSOH as the average of the monthly gross inventory divided by an average day’s cost of sales.
Cash Flows from Investing Activities
During fiscal year 2018, we invested $42.5 million in available-for-sale securities, and $42.8 million matured. During fiscal year 2017, we invested $42.1 million in available-for-sale securities, and $5.9 million matured. Our short-term investments included municipal bonds, certificates of deposit purchased in the secondary market, and U.S. Treasury and federal agency securities. During fiscal year 2018, we had a cash outflow of $18.2 million upon the D’style acquisition. During fiscal years 2018 and 2017, we received proceeds from the sale of assets net of selling expenses of $5.8 million and $13.2 million, respectively, the majority of which related to the sale of our fleet of over-the-road tractors and trailers in fiscal year 2018 and the sale of our Idaho facility in fiscal year 2017, respectively. During fiscal years 2018, 2017, and 2016 we reinvested $22.3 million, $12.7 million, and $16.2 million, respectively, into capital investments for the future. The capital investments in the current year were primarily for facility improvements such as renovations to our corporate headquarters and showrooms, and various manufacturing equipment upgrades to increase automation in production facilities. The capital investments during fiscal year 2017 were primarily for facility improvements such as renovations to showrooms and the corporate headquarters, various manufacturing equipment, and replacements of tractors and trailers in our fleet. The fiscal year 2016 capital investments were primarily for manufacturing equipment such as an automated finish technology upgrade and equipment related to the transition of the metal fabrication capabilities and assembly operations to certain Indiana facilities and various facility and showroom improvements.
Cash Flows from Financing Activities
We paid $10.1 million of dividends in fiscal year 2018 compared to paying $8.8 million of dividends in fiscal year 2017 and $8.1 million of dividends in fiscal year 2016. Consistent with our historical dividend policy, our Board of Directors evaluates the appropriate dividend payment on a quarterly basis. We repurchased shares pursuant to a previously announced stock repurchase program which drove cash outflow of $8.9 million in fiscal year 2018, $6.7 million in fiscal year 2017, and $9.7 million in fiscal year 2016.
Credit Facility
We maintain a $30.0 million credit facility with a maturity date of October 2019 that allows for both issuances of letters of credit and cash borrowings. This facility provides an option to increase the amount available for borrowing to $55.0 million at our request, subject to the consent of the participating banks. At June 30, 2018, we had $1.4 million in letters of credit outstanding, which reduced our borrowing capacity on the credit facility. At both June 30, 2018 and June 30, 2017, we had no borrowings outstanding.
30
The credit facility requires us to comply with certain debt covenants, the most significant of which are the adjusted leverage ratio and the fixed charge coverage ratio. The adjusted leverage ratio is defined as (a) consolidated total indebtedness minus unencumbered U.S. cash on hand in the U.S. in excess of $15,000,000 to (b) consolidated EBITDA, determined as of the end of each of our fiscal quarters for the then most recently ended four fiscal quarters, and may not be greater than 3.0 to 1.0. The fixed charge coverage ratio is defined as (a) the sum of (i) consolidated EBITDA, minus (ii) 50% of depreciation expense, minus (iii) taxes paid, minus (iv) dividends and distributions paid, to (b) the sum of (i) scheduled principal payments on indebtedness due and/or paid, plus (ii) interest expense, calculated on a consolidated basis in accordance with U.S. GAAP, determined as of the end of each of our fiscal quarters for the trailing four fiscal quarters then ending, and may not be less than 1.10 to 1.00. We were in compliance with all debt covenants of the credit facility during fiscal year 2018.
The table below compares the adjusted leverage ratio and fixed charge coverage ratio with the limits specified in the credit agreement.
At or For the Period Ended | Limit As Specified in | ||||||||
Covenant | June 30, 2018 | Credit Agreement | Excess | ||||||
Adjusted Leverage Ratio | (0.55 | ) | 3.00 | 3.55 | |||||
Fixed Charge Coverage Ratio | 135.72 | 1.10 | 134.62 | ||||||
Future Liquidity
We believe our principal sources of liquidity from available funds on hand and short-term investments, cash generated from operations, and the availability of borrowing under our credit facility will be sufficient to fund future dividends and meet our working capital and other operating needs for at least the next 12 months. During fiscal year 2019, we anticipate cash outflow of approximately $11.3 million for accrued cash incentive compensation related to our fiscal year 2018 performance. We will continue to evaluate market conditions in determining future share repurchases. At June 30, 2018, 1.2 million shares remained available under the repurchase program. During fiscal year 2019 we expect to continue investments in capital expenditures, particularly for projects such as our headquarters renovation, showroom renovations, machinery and equipment upgrades and automation, and potential acquisitions, that would enhance our capabilities and diversification while providing an opportunity for growth and improved profitability.
Our ability to generate cash from operations to meet our liquidity obligations could be adversely affected in the future by factors such as general economic and market conditions, lack of availability of raw material components in the supply chain, a decline in demand for our services, the impact of changes in tariffs, loss of key contract customers, including government subcontract customers, or the outcome of a governmental review of our GSA subcontractor reporting practices, and other unforeseen circumstances. In particular, should demand for our products decrease significantly over the next 12 months, the available cash provided by operations could be adversely impacted.
31
Non-GAAP Financial Measures and Other Key Performance Indicators
This Management’s Discussion and Analysis (“MD&A”) contains non-GAAP financial measures. A non-GAAP financial measure is a numerical measure of a company’s financial performance that excludes or includes amounts so as to be different than the most directly comparable measure calculated and presented in accordance with GAAP in the United States in the statements of income, statements of comprehensive income, balance sheets, or statements of cash flows of the company. The non-GAAP financial measures used within this MD&A include (1) adjusted operating income defined as operating income excluding restructuring; (2) adjusted net income defined as net income excluding restructuring; and (3) adjusted diluted earnings per share defined as diluted earnings per share excluding restructuring. Reconciliations of the reported GAAP numbers to these non-GAAP financial measures are included in the table below. Management believes it is useful for investors to understand how its core operations performed without gains or expenses incurred in executing its restructuring plan. Excluding these amounts allows investors to meaningfully trend, analyze, and benchmark the performance of our core operations. Many of our internal performance measures that management uses to make certain operating decisions exclude these gains/expenses to enable meaningful trending of core operating metrics. These non-GAAP financial measures should not be viewed as an alternative to the GAAP measures and are presented as supplemental information.
Reconciliation of Non-GAAP Financial Measures and Other Key Performance Indicators | |||||||||||
(Amounts in Thousands, Except for Per Share Data) | |||||||||||
Year Ended | |||||||||||
June 30 | |||||||||||
2018 | 2017 | 2016 | |||||||||
Operating Income | $ | 51,063 | $ | 56,663 | $ | 33,497 | |||||
Pre-tax Restructuring (Gain) Expense | — | (1,832 | ) | 7,328 | |||||||
Adjusted Operating Income | $ | 51,063 | $ | 54,831 | $ | 40,825 | |||||
Net Sales | $ | 685,600 | $ | 669,934 | $ | 635,102 | |||||
Adjusted Operating Income % | 7.4 | % | 8.2 | % | 6.4 | % | |||||
Net Income | $ | 34,439 | $ | 37,506 | $ | 21,156 | |||||
Pre-tax Restructuring (Gain) Expense | — | (1,832 | ) | 7,328 | |||||||
Tax on Restructuring (Gain) Expense | — | 713 | (2,825 | ) | |||||||
After-tax Restructuring (Gain) Expense | — | (1,119 | ) | 4,503 | |||||||
Adjusted Net Income | $ | 34,439 | $ | 36,387 | $ | 25,659 | |||||
Diluted Earnings Per Share | $ | 0.92 | $ | 0.99 | $ | 0.56 | |||||
Impact of Restructuring (Gain) Expense | — | (0.03 | ) | 0.12 | |||||||
Adjusted Diluted Earnings Per Share | $ | 0.92 | $ | 0.96 | $ | 0.68 | |||||
The open orders metric is a key performance indicator representing firm orders placed by our customers which have not yet been fulfilled and are expected to be recognized as revenue during future quarters. The timing of shipments can vary, but generally open orders are expected to ship within a twelve-month period. Adjusted operating income percentage is also a key performance indicator, which is defined as adjusted operating income as a percentage of net sales.
Fair Value
During fiscal year 2018, no financial instruments were affected by a lack of market liquidity. Financial assets classified as level 1 assets were valued using readily available market pricing. For commercial paper and available-for-sale securities classified as level 2 assets, the fair values are determined based on market data which use evaluated pricing models and incorporate available trade, bid, and other market information. We evaluated the inputs used to value the instruments and validated the accuracy of the instrument fair values based on historical evidence. The investment in stock warrants and non-marketable equity securities of a privately-held company are classified as level 3 financial assets. The stock warrants are accounted for as a derivative instrument valued on a recurring basis considering the pricing of recent purchases or sales, if any, of the investment as well as positive and negative qualitative evidence, while the non-marketable equity securities are accounted for as a cost-method investment which carries the securities at cost, except in the event of impairment. Our foreign currency derivatives, which were classified as level 2 liabilities, were valued using observable market inputs such as forward interest rate yield
32
curves, current spot rates, and time value calculations. To verify the reasonableness of the determined fair values, these derivative fair values were compared to fair values calculated by the counterparty banks. Our own credit risk and counterparty credit risk had an immaterial impact on the valuation of the foreign currency derivatives. The contingent earn-out liability incurred in the acquisition of D’style is classified as a level 3 financial liability and is valued based on a valuation model that measures the present value of the probable cash payments based upon the forecasted operating performance of the D’style acquisition and a discount rate that captures the risk associated with the liability.
See Note 10 - Fair Value of Notes to Consolidated Financial Statements for more information.
Contractual Obligations
The following table summarizes our contractual obligations as of June 30, 2018.
Payments Due During Fiscal Years Ending June 30 | ||||||||||||||||||||||
(Amounts in Millions) | Total | 2019 | 2020-2021 | 2022-2023 | Thereafter | |||||||||||||||||
Recorded Contractual Obligations: (a) | ||||||||||||||||||||||
Long-Term Debt Obligations (b) | $ | 0.2 | $ | — | $ | 0.1 | $ | 0.1 | $ | — | ||||||||||||
Other Long-Term Liabilities Reflected on the Balance Sheet (c) (d) (e) | 19.4 | 5.6 | 3.8 | 2.7 | 7.3 | |||||||||||||||||
Unrecorded Contractual Obligations: | ||||||||||||||||||||||
Operating Leases (e) | 22.5 | 4.0 | 6.9 | 5.7 | 5.9 | |||||||||||||||||
Purchase Obligations (f) | 56.0 | 40.2 | 8.3 | 7.5 | — | |||||||||||||||||
Other (b) | 0.1 | — | 0.1 | — | — | |||||||||||||||||
Total | $ | 98.2 | $ | 49.8 | $ | 19.2 | $ | 16.0 | $ | 13.2 | ||||||||||||
(a) | As of June 30, 2018, we had no Capital Lease Obligations. |
(b) | Refer to Note 6 - Long-Term Debt and Credit Facilities of Notes to Consolidated Financial Statements for more information regarding Long-Term Debt Obligations. Accrued interest is also included on the Long-Term Debt Obligations line. The fiscal year 2019 amount includes less than $0.1 million of long-term debt obligations due in fiscal year 2019 which were recorded as a current liability. The estimated interest not yet accrued related to debt is included in the Other line item within the Unrecorded Contractual Obligations. |
(c) | The timing of payments of certain items included on the “Other Long-Term Liabilities Reflected on the Balance Sheet” line above is estimated based on the following assumptions: |
• | The timing of long-term SERP payments is estimated based on an assumed retirement age of 62 with payout based on the prior distribution elections of participants. The fiscal year 2019 amount includes $3.9 million for SERP payments recorded as current liabilities. |
• | The timing of severance plan payments is estimated based on the average remaining service life of employees. The fiscal year 2019 amount includes $0.5 million for severance payments recorded as a current liability. |
• | The timing of warranty payments is estimated based on historical data. The fiscal year 2019 amount includes $0.7 million for short-term warranty payments recorded as a current liability. |
• | The timing of earn-out liability is contingent based upon fiscal year 2018 and 2019 D’style operating income compared to a predetermined target for each fiscal year. The fiscal year 2019 amount includes $0.5 million for earn-out payments recorded as a current liability. |
(d) | Excludes $1.7 million of long-term unrecognized tax benefits and associated accrued interest and penalties along with deferred tax liabilities and miscellaneous other long-term tax liabilities which are not tied to a contractual obligation and for which we cannot make a reasonably reliable estimate of the period of future payments. |
(e) | Refer to Note 5 - Commitments and Contingent Liabilities of Notes to Consolidated Financial Statements for more information regarding Operating Leases and certain Other Long-Term Liabilities. |
(f) | Purchase Obligations are defined as agreements to purchase goods or services that are enforceable and legally binding and that specify all significant terms. The amounts listed above for purchase obligations include contractual commitments for items such as raw materials, supplies, capital expenditures, services, and software acquisitions/license commitments. Cancellable purchase obligations that we intend to fulfill are also included in the purchase obligations amount listed above through fiscal year 2023. |
33
Off-Balance Sheet Arrangements
Our off-balance sheet arrangements are limited to standby letters of credit, a performance bond, and operating leases entered into in the normal course of business. These arrangements do not have a material current effect and are not reasonably likely to have a material future effect on our financial condition, results of operations, liquidity, capital expenditures, or capital resources. See Note 5 - Commitments and Contingent Liabilities of Notes to Consolidated Financial Statements for more information on the standby letters of credit and the performance bond. We do not have material exposures to trading activities of non-exchange traded contracts.
Critical Accounting Policies
Our consolidated financial statements have been prepared in accordance with U.S. GAAP. These principles require the use of estimates and assumptions that affect amounts reported and disclosed in the consolidated financial statements and related notes. Actual results could differ from these estimates and assumptions. Management uses its best judgment in the assumptions used to value these estimates, which are based on current facts and circumstances, prior experience, and other assumptions that are believed to be reasonable. Management believes the following critical accounting policies reflect the more significant judgments and estimates used in preparation of our consolidated financial statements and are the policies that are most critical in the portrayal of our financial position and results of operations. Management has discussed these critical accounting policies and estimates with the Audit Committee of our Board of Directors and with our independent registered public accounting firm.
Revenue recognition - We recognize revenue when persuasive evidence of an arrangement exists, delivery has occurred, the sales price is fixed or determinable, and collectability is reasonably assured. Delivery is not considered to have occurred until the title and the risk of loss passes to the customer according to the terms of the contract. Title and risk of loss are transferred upon shipment to or receipt at our customers’ locations, or in limited circumstances, as determined by other specific sales terms of the transaction. Shipping and handling fees billed to customers are recorded as sales while the related shipping and handling costs are included in cost of goods sold. We recognize sales net of applicable sales tax. Based on estimated product returns and price concessions, a reserve for returns and allowances is recorded at the time of the sale, resulting in a reduction of revenue.
Self-insurance reserves - We are self-insured up to certain limits for auto and general liability, workers’ compensation, and certain employee health benefits such as medical, short-term disability, and dental with the related liabilities included in the accompanying financial statements. Our policy is to estimate reserves based upon a number of factors including known claims, estimated incurred but not reported claims, and other analyses, which are based on historical information along with certain assumptions about future events. Changes in assumptions for such matters as a result of increased medical costs and changes in actual experience could cause these estimates to change and reserve levels to be adjusted accordingly. At June 30, 2018 and June 30, 2017, our accrued liabilities for self-insurance exposure were $4.1 million and $4.3 million, respectively.
Taxes - Deferred income taxes are recognized for the estimated future tax consequences attributable to temporary differences between the financial statement carrying amounts of existing assets and liabilities and their respective tax bases. The deferred taxes are measured using enacted tax rates expected to apply to taxable income in the years in which the temporary differences are expected to reverse. We evaluate the recoverability of our deferred tax assets each quarter by assessing the likelihood of future taxable income and available tax planning strategies that could be implemented to realize our deferred tax assets. If recovery is not likely, we provide a valuation allowance based on our best estimate of future taxable income in the various taxing jurisdictions and the amount of deferred taxes ultimately realizable. Future events could change management’s assessment.
We operate within multiple taxing jurisdictions and are subject to tax audits in these jurisdictions. These audits can involve complex issues, which may require an extended period of time to resolve. However, we believe we have made adequate provision for income and other taxes for all years that are subject to audit. As tax positions are effectively settled, the tax provision will be adjusted accordingly. The liability for uncertain income tax and other tax positions, including accrued interest and penalties on those positions, was $1.9 million at June 30, 2018 and $2.8 million at June 30, 2017.
Goodwill - Goodwill represents the difference between the purchase price and the related underlying tangible and intangible net asset fair values resulting from business acquisitions. Annually, or if conditions indicate an earlier review is necessary, we may assess qualitative factors to determine if it is more likely than not that the fair value is less than its carrying amount. We also have the option to bypass the qualitative assessment and proceed directly to performing the quantitative goodwill impairment test. We compare the carrying value of the reporting unit to the reporting unit’s fair value to identify impairment. If the fair value of the reporting unit is less than the carrying value, goodwill is written down to its fair value. Goodwill is assigned to and the fair value is tested at the reporting unit level. The fair value is established primarily using a discounted cash flow analysis and secondarily a market approach utilizing current industry information. The calculation of the fair value of the reporting unit considers current market conditions existing at the assessment date. During fiscal year 2018 no goodwill impairment was recognized. At June 30, 2018, goodwill totaled $8.8 million.
34
New Accounting Standards
See Note 1 - Summary of Significant Accounting Policies of Notes to Consolidated Financial Statements for information regarding New Accounting Standards.
Item 7A - Quantitative and Qualitative Disclosures About Market Risk
Interest Rate Risk: We hold an investment portfolio of available-for-sale securities, comprised of municipal bonds, certificates of deposit purchased in the secondary market, U.S. Treasury and federal agency securities. As of June 30, 2018, the fair value of the investment portfolio was $34.6 million. Our investment policy dictates that municipal bonds, U.S. Treasury and federal agency securities must be investment grade quality, and all certificates of deposit are Federal Deposit Insurance Corporation insured. These securities are fixed income instruments and will decline in value if market interest rates increase. A hypothetical 100 basis point increase in an annual period in market interest rates from levels at June 30, 2018 would cause the fair value of these investments to decline by an immaterial amount. Further information on investments is provided in Note 12 - Investments of Notes to Consolidated Financial Statements.
We also hold a total investment of $2.0 million in a privately-held company, consisting of $0.5 million in non-marketable equity securities and $1.5 million in stock warrants. The fair value of the investment may fluctuate due to events and changes in circumstances, but we have incurred no impairment during fiscal year 2018 or 2017.
Commodity Risk: We are exposed to market risk with respect to commodity price fluctuations for components used in the manufacture of our products, primarily related to wood and wood-related components, steel, aluminum, and plastics. These components are impacted by global pricing pressures and general economic conditions. The U.S. recently imposed tariffs of 25% on steel and 10% on aluminum imported from several countries, which could adversely impact our input costs. The government has also recently proposed to expand its list of products subject to tariffs to include furniture products, parts, and components, and if approved, the landed cost of our products could increase materially, which would reduce our net income if we are unable to mitigate the additional cost. We are monitoring this situation, but at this time we are uncertain of the potential impact that these tariffs may have on our results of operations. We strive to offset increases in the cost of these materials through supplier negotiations, global sourcing initiatives, product re-engineering and parts standardization, and price increases on our products. We are also exposed to fluctuation in transportation costs which vary based upon freight carrier capacity and fuel prices. Transportation costs are managed by optimizing logistics and supply chain planning, and increasing prices on our products.
Foreign Exchange Rate Risk: We have minimal foreign currency risk and held an immaterial amount of derivative instruments as of June 30, 2018, and none as of June 30, 2017. Further information on derivative financial instruments is provided in Note 11 - Derivative Instruments of Notes to Consolidated Financial Statements.
35
Item 8 - Financial Statements and Supplementary Data
INDEX TO CONSOLIDATED FINANCIAL STATEMENTS | |
Page No. | |
36
MANAGEMENT’S REPORT ON INTERNAL CONTROL OVER FINANCIAL REPORTING
The management of Kimball International, Inc. is responsible for establishing and maintaining adequate internal control over financial reporting and for the preparation and integrity of the accompanying financial statements and other related information in this report. The consolidated financial statements of the Company and its subsidiaries, including the footnotes, were prepared in accordance with accounting principles generally accepted in the United States of America and include judgments and estimates, which in the opinion of management are applied appropriately. We maintain a system of internal and disclosure controls intended to provide reasonable assurance that assets are safeguarded from loss or material misuse, transactions are authorized and recorded properly, and that the accounting records may be relied upon for the preparation of the financial statements. This system is tested and evaluated regularly for adherence and effectiveness by employees who work within the internal control processes, by our staff of internal auditors, as well as by the independent registered public accounting firm in connection with their annual audit.
Management’s assessment of the effectiveness of internal control over financial reporting excluded D’style, an acquisition completed in November 2017 which consisted of certain assets of D’style, Inc. and all of the capital stock of Diseños de Estilo, S.A. de C.V. This acquisition represented 7% and 2% of consolidated total assets and consolidated net sales, respectively, of the Company as of and for the year ended June 30, 2018. Under guidelines established by the Securities and Exchange Commission, companies are permitted to exclude acquisitions from their first assessment of internal control over financial reporting within one year of the date of the acquisition.
The Audit Committee of the Board of Directors, which is comprised of directors who are not employees of the Company, meets regularly with management, our internal auditors, and the independent registered public accounting firm to review our financial policies and procedures, our internal control structure, the objectivity of our financial reporting, and the independence of the independent registered public accounting firm. The internal auditors and the independent registered public accounting firm have free and direct access to the Audit Committee, and they meet periodically, without management present, to discuss appropriate matters.
Because of inherent limitations, a system of internal control over financial reporting may not prevent or detect misstatements and even when determined to be effective, can only provide reasonable assurance with respect to financial statement preparation and presentation.
These consolidated financial statements are subject to an evaluation of internal control over financial reporting conducted under the supervision and with the participation of management, including the Chief Executive Officer and Chief Financial Officer. Based on that evaluation, conducted under the criteria established in Internal Control — Integrated Framework (2013) issued by the Committee of Sponsoring Organizations of the Treadway Commission, management concluded that our internal control over financial reporting was effective as of June 30, 2018.
Deloitte & Touche LLP, our independent registered public accounting firm, has issued an audit report on our internal control over financial reporting which is included herein.
/s/ ROBERT F. SCHNEIDER | |
Robert F. Schneider | |
Chairman of the Board, | |
Chief Executive Officer | |
August 28, 2018 | |
/s/ MICHELLE R. SCHROEDER | |
Michelle R. Schroeder | |
Vice President, | |
Chief Financial Officer | |
August 28, 2018 | |
37
REPORT OF INDEPENDENT REGISTERED PUBLIC ACCOUNTING FIRM
To the Board of Directors and Shareowners of Kimball International, Inc.
Jasper, Indiana
Opinions on the Financial Statements and Internal Control over Financial Reporting
We have audited the accompanying consolidated balance sheets of Kimball International, Inc. and subsidiaries (the “Company”) as of June 30, 2018 and 2017, the related consolidated statements of income, comprehensive income, cash flows, and shareowners’ equity, for each of the three years in the period ended June 30, 2018, and the related notes and the schedule listed in the Index at Item 15 (collectively referred to as the “financial statements”). We also have audited the Company’s internal control over financial reporting as of June 30, 2018, based on criteria established in Internal Control — Integrated Framework (2013) issued by the Committee of Sponsoring Organizations of the Treadway Commission (COSO).
In our opinion, the financial statements referred to above present fairly, in all material respects, the financial position of the Company as of June 30, 2018 and 2017, and the results of its operations and its cash flows for each of the three years in the period ended June 30, 2018, in conformity with accounting principles generally accepted in the United States of America. Also, in our opinion, the Company maintained, in all material respects, effective internal control over financial reporting as of June 30, 2018, based on criteria established in Internal Control — Integrated Framework (2013) issued by COSO.
As described in Management’s Report on Internal Control over Financial Reporting, management excluded from its assessment the internal control over financial reporting at D’style (consisting of certain assets of D’style, Inc. and all of the capital stock of Diseños de Estilo, S.A. de C.V.), which was acquired in November 2017 and whose financial statements constitute 7% of total assets and 2% of net sales of the consolidated financial statement amounts as of and for the year ended June 30, 2018. Accordingly, our audit did not include the internal control over financial reporting at D’style.
Basis for Opinions
The Company’s management is responsible for these financial statements, for maintaining effective internal control over financial reporting, and for its assessment of the effectiveness of internal control over financial reporting, included in the accompanying Management’s Report on Internal Control over Financial Reporting. Our responsibility is to express an opinion on these financial statements and an opinion on the Company’s internal control over financial reporting based on our audits. We are a public accounting firm registered with the Public Company Accounting Oversight Board (United States) (PCAOB) and are required to be independent with respect to the Company in accordance with the U.S. federal securities laws and the applicable rules and regulations of the Securities and Exchange Commission and the PCAOB.
We conducted our audits in accordance with the standards of the PCAOB. Those standards require that we plan and perform the audits to obtain reasonable assurance about whether the financial statements are free of material misstatement, whether due to error or fraud, and whether effective internal control over financial reporting was maintained in all material respects.
Our audits of the financial statements included performing procedures to assess the risks of material misstatement of the financial statements, whether due to error or fraud, and performing procedures to respond to those risks. Such procedures included examining, on a test basis, evidence regarding the amounts and disclosures in the financial statements. Our audits also included evaluating the accounting principles used and significant estimates made by management, as well as evaluating the overall presentation of the financial statements. Our audit of internal control over financial reporting included obtaining an understanding of internal control over financial reporting, assessing the risk that a material weakness exists, and testing and evaluating the design and operating effectiveness of internal control based on the assessed risk. Our audits also included performing such other procedures as we considered necessary in the circumstances. We believe that our audits provide a reasonable basis for our opinions.
Definition and Limitations of Internal Control over Financial Reporting
A company’s internal control over financial reporting is a process designed to provide reasonable assurance regarding the reliability of financial reporting and the preparation of financial statements for external purposes in accordance with generally accepted accounting principles. A company’s internal control over financial reporting includes those policies and procedures that (1) pertain to the maintenance of records that, in reasonable detail, accurately and fairly reflect the transactions and dispositions of the assets of the company; (2) provide reasonable assurance that transactions are recorded as necessary to permit preparation of financial statements in accordance with generally accepted accounting principles, and that receipts and
38
expenditures of the company are being made only in accordance with authorizations of management and directors of the company; and (3) provide reasonable assurance regarding prevention or timely detection of unauthorized acquisition, use, or disposition of the company’s assets that could have a material effect on the financial statements.
Because of its inherent limitations, internal control over financial reporting may not prevent or detect misstatements. Also, projections of any evaluation of effectiveness to future periods are subject to the risk that controls may become inadequate because of changes in conditions, or that the degree of compliance with the policies or procedures may deteriorate.
/s/ Deloitte & Touche LLP | |
DELOITTE & TOUCHE LLP | |
Indianapolis, Indiana | |
August 28, 2018 | |
We have served as the Company's auditor since 2002.
39
KIMBALL INTERNATIONAL, INC.
CONSOLIDATED BALANCE SHEETS
(Amounts in Thousands, Except for Share and Per Share Data)
June 30, 2018 | June 30, 2017 | ||||||
ASSETS | |||||||
Current Assets: | |||||||
Cash and cash equivalents | $ | 52,663 | $ | 62,882 | |||
Short-term investments | 34,607 | 35,683 | |||||
Receivables, net of allowances of $1,317 and $1,626, respectively | 60,984 | 53,909 | |||||
Inventories | 39,509 | 38,062 | |||||
Prepaid expenses and other current assets | 18,523 | 8,050 | |||||
Assets held for sale | 281 | 4,223 | |||||
Total current assets | 206,567 | 202,809 | |||||
Property and Equipment, net of accumulated depreciation of $180,059 and $182,803, respectively | 84,487 | 80,069 | |||||
Goodwill | 8,824 | — | |||||
Other Intangible Assets, net of accumulated amortization of $36,757 and $35,148, respectively | 12,607 | 2,932 | |||||
Deferred Tax Assets | 4,916 | 14,487 | |||||
Other Assets | 12,767 | 13,450 | |||||
Total Assets | $ | 330,168 | $ | 313,747 | |||
LIABILITIES AND SHAREOWNERS’ EQUITY | |||||||
Current Liabilities: | |||||||
Current maturities of long-term debt | $ | 23 | $ | 27 | |||
Accounts payable | 48,214 | 44,730 | |||||
Customer deposits | 21,253 | 20,516 | |||||
Sale-leaseback financing obligation | — | 3,752 | |||||
Dividends payable | 2,662 | 2,296 | |||||
Accrued expenses | 49,294 | 49,018 | |||||
Total current liabilities | 121,446 | 120,339 | |||||
Other Liabilities: | |||||||
Long-term debt, less current maturities | 161 | 184 | |||||
Other | 15,537 | 17,020 | |||||
Total other liabilities | 15,698 | 17,204 | |||||
Shareowners’ Equity: | |||||||
Common stock-par value $0.05 per share: | |||||||
Class A - Shares authorized: 50,000,000 Shares issued: 264,000 and 280,000, respectively | 13 | 14 | |||||
Class B - Shares authorized: 100,000,000 Shares issued: 42,761,000 and 42,744,000, respectively | 2,138 | 2,137 | |||||
Additional paid-in capital | 1,881 | 2,971 | |||||
Retained earnings | 249,945 | 230,763 | |||||
Accumulated other comprehensive income | 1,816 | 1,115 | |||||
Less: Treasury stock, at cost, 5,901,000 shares and 5,726,000 shares, respectively | (62,769 | ) | (60,796 | ) | |||
Total Shareowners’ Equity | 193,024 | 176,204 | |||||
Total Liabilities and Shareowners’ Equity | $ | 330,168 | $ | 313,747 | |||
40
KIMBALL INTERNATIONAL, INC.
CONSOLIDATED STATEMENTS OF INCOME
(Amounts in Thousands, Except for Per Share Data)
Year Ended June 30 | |||||||||||
2018 | 2017 | 2016 | |||||||||
Net Sales | $ | 685,600 | $ | 669,934 | $ | 635,102 | |||||
Cost of Sales | 464,154 | 446,629 | 431,298 | ||||||||
Gross Profit | 221,446 | 223,305 | 203,804 | ||||||||
Selling and Administrative Expenses | 170,383 | 168,474 | 162,979 | ||||||||
Restructuring (Gain) Expense | — | (1,832 | ) | 7,328 | |||||||
Operating Income | 51,063 | 56,663 | 33,497 | ||||||||
Other Income (Expense): | |||||||||||
Interest income | 1,057 | 536 | 275 | ||||||||
Interest expense | (221 | ) | (37 | ) | (22 | ) | |||||
Non-operating income | 953 | 1,276 | 79 | ||||||||
Non-operating expense | (527 | ) | (420 | ) | (439 | ) | |||||
Other income (expense), net | 1,262 | 1,355 | (107 | ) | |||||||
Income Before Taxes on Income | 52,325 | 58,018 | 33,390 | ||||||||
Provision for Income Taxes | 17,886 | 20,512 | 12,234 | ||||||||
Net Income | $ | 34,439 | $ | 37,506 | $ | 21,156 | |||||
Earnings Per Share of Common Stock: | |||||||||||
Basic Earnings Per Share | $ | 0.92 | $ | 1.00 | $ | 0.56 | |||||
Diluted Earnings Per Share | $ | 0.92 | $ | 0.99 | $ | 0.56 | |||||
Class A and B Common Stock: | |||||||||||
Average Number of Shares Outstanding - Basic | 37,314 | 37,334 | 37,462 | ||||||||
Average Number of Shares Outstanding - Diluted | 37,494 | 37,833 | 37,852 | ||||||||
41
KIMBALL INTERNATIONAL, INC.
CONSOLIDATED STATEMENTS OF COMPREHENSIVE INCOME
(Amounts in Thousands)
Year Ended June 30, 2018 | Year Ended June 30, 2017 | Year Ended June 30, 2016 | |||||||||||||||||||||||||||||||||
Pre-tax | Tax | Net of Tax | Pre-tax | Tax | Net of Tax | Pre-tax | Tax | Net of Tax | |||||||||||||||||||||||||||
Net income | $ | 34,439 | $ | 37,506 | $ | 21,156 | |||||||||||||||||||||||||||||
Other comprehensive income (loss): | |||||||||||||||||||||||||||||||||||
Available-for-sale securities | $ | (11 | ) | $ | 3 | $ | (8 | ) | $ | (34 | ) | $ | 13 | $ | (21 | ) | $ | — | $ | — | $ | — | |||||||||||||
Postemployment severance actuarial change | 895 | (296 | ) | 599 | 186 | (72 | ) | 114 | 576 | (225 | ) | 351 | |||||||||||||||||||||||
Derivative gain (loss) | (10 | ) | 3 | (7 | ) | — | — | — | — | — | — | ||||||||||||||||||||||||
Reclassification to (earnings) loss: | |||||||||||||||||||||||||||||||||||
Available-for-sale securities | 4 | (1 | ) | 3 | — | — | — | — | — | — | |||||||||||||||||||||||||
Amortization of actuarial change | (260 | ) | 84 | (176 | ) | (473 | ) | 184 | (289 | ) | (441 | ) | 172 | (269 | ) | ||||||||||||||||||||
Other comprehensive income (loss) | $ | 618 | $ | (207 | ) | $ | 411 | $ | (321 | ) | $ | 125 | $ | (196 | ) | $ | 135 | $ | (53 | ) | $ | 82 | |||||||||||||
Total comprehensive income | $ | 34,850 | $ | 37,310 | $ | 21,238 | |||||||||||||||||||||||||||||
42
KIMBALL INTERNATIONAL, INC.
CONSOLIDATED STATEMENTS OF CASH FLOWS
(Amounts in Thousands)
Year Ended June 30 | |||||||||||
2018 | 2017 | 2016 | |||||||||
Cash Flows From Operating Activities: | |||||||||||
Net income | $ | 34,439 | $ | 37,506 | $ | 21,156 | |||||
Adjustments to reconcile net income to net cash provided by operating activities: | |||||||||||
Depreciation and amortization | 15,470 | 15,553 | 14,996 | ||||||||
(Gain) Loss on sales of assets | (2,050 | ) | (3,148 | ) | 181 | ||||||
Restructuring and asset impairment charges | — | 241 | 153 | ||||||||
Deferred income tax and other deferred charges | 9,082 | (1,580 | ) | 2,523 | |||||||
Stock-based compensation | 4,179 | 6,303 | 5,558 | ||||||||
Other, net | 984 | (125 | ) | 201 | |||||||
Change in operating assets and liabilities: | |||||||||||
Receivables | (5,682 | ) | (3,550 | ) | 4,874 | ||||||
Inventories | 8 | 2,876 | (3,304 | ) | |||||||
Prepaid expenses and other current assets | (6,741 | ) | 2,694 | 459 | |||||||
Accounts payable | 3,062 | 1,998 | 2,874 | ||||||||
Customer deposits | (2,347 | ) | 1,891 | 7 | |||||||
Accrued expenses | (3,538 | ) | 4,185 | (326 | ) | ||||||
Net cash provided by operating activities | 46,866 | 64,844 | 49,352 | ||||||||
Cash Flows From Investing Activities: | |||||||||||
Capital expenditures | (21,575 | ) | (11,751 | ) | (15,028 | ) | |||||
Proceeds from sales of assets | 5,817 | 13,200 | 290 | ||||||||
Cash paid for acquisition | (18,201 | ) | — | — | |||||||
Purchases of capitalized software | (724 | ) | (982 | ) | (1,138 | ) | |||||
Purchases of available-for-sale securities | (42,497 | ) | (42,059 | ) | — | ||||||
Maturities of available-for-sale securities | 42,839 | 5,941 | — | ||||||||
Other, net | (875 | ) | (525 | ) | (1,007 | ) | |||||
Net cash used for investing activities | (35,216 | ) | (36,176 | ) | (16,883 | ) | |||||
Cash Flows From Financing Activities: | |||||||||||
Net change in capital leases and long-term debt | (27 | ) | (30 | ) | (27 | ) | |||||
Proceeds from sale-leaseback financing obligation | — | 3,752 | — | ||||||||
Dividends paid to Shareowners | (10,084 | ) | (8,783 | ) | (8,078 | ) | |||||
Repurchases of Common Stock | (8,936 | ) | (6,665 | ) | (9,665 | ) | |||||
Repurchase of employee shares for tax withholding | (2,822 | ) | (1,636 | ) | (1,784 | ) | |||||
Net cash used for financing activities | (21,869 | ) | (13,362 | ) | (19,554 | ) | |||||
Net (Decrease) Increase in Cash and Cash Equivalents | (10,219 | ) | 15,306 | 12,915 | |||||||
Cash and Cash Equivalents at Beginning of Year | 62,882 | 47,576 | 34,661 | ||||||||
Cash and Cash Equivalents at End of Year | $ | 52,663 | $ | 62,882 | $ | 47,576 | |||||
43
KIMBALL INTERNATIONAL, INC.
CONSOLIDATED STATEMENTS OF SHAREOWNERS’ EQUITY
(Amounts in Thousands, Except for Share and Per Share Data)
Common Stock | Additional Paid-In Capital | Retained Earnings | Accumulated Other Comprehensive Income (Loss) | Treasury Stock | Total Shareowners’ Equity | ||||||||||||||||||||||
Class A | Class B | ||||||||||||||||||||||||||
Amounts at June 30, 2015 | $ | 19 | $ | 2,132 | $ | 3,445 | $ | 194,372 | $ | 1,229 | $ | (59,692 | ) | $ | 141,505 | ||||||||||||
Adjustment of Kimball Electronics, Inc. distribution | (4 | ) | (4 | ) | |||||||||||||||||||||||
Net income | 21,156 | 21,156 | |||||||||||||||||||||||||
Other comprehensive income | 82 | 82 | |||||||||||||||||||||||||
Issuance of non-restricted stock (44,000 shares) | (1,058 | ) | 950 | (108 | ) | ||||||||||||||||||||||
Conversion of Class A to Class B common stock (94,000 shares) | (5 | ) | 5 | — | |||||||||||||||||||||||
Compensation expense related to stock incentive plans | 5,558 | 5,558 | |||||||||||||||||||||||||
Performance share issuance (235,000 shares) | (3,445 | ) | (2,132 | ) | 4,424 | (1,153 | ) | ||||||||||||||||||||
Restricted share units issuance (56,000 shares) | (1,583 | ) | 1,389 | (194 | ) | ||||||||||||||||||||||
Repurchase of Common Stock (736,000 shares) | (8,686 | ) | (8,686 | ) | |||||||||||||||||||||||
Dividends declared ($0.22 per share) | (8,288 | ) | (8,288 | ) | |||||||||||||||||||||||
Amounts at June 30, 2016 | $ | 14 | $ | 2,137 | $ | 2,917 | $ | 205,104 | $ | 1,311 | $ | (61,615 | ) | $ | 149,868 | ||||||||||||
Net income | 37,506 | 37,506 | |||||||||||||||||||||||||
Other comprehensive income | (196 | ) | (196 | ) | |||||||||||||||||||||||
Issuance of non-restricted stock (49,000 shares) | (1,205 | ) | 1,204 | (1 | ) | ||||||||||||||||||||||
Conversion of Class A to Class B common stock (11,000 shares) | — | — | — | ||||||||||||||||||||||||
Compensation expense related to stock incentive plans | 6,303 | 6,303 | |||||||||||||||||||||||||
Performance share issuance (192,000 shares) | (3,096 | ) | (2,823 | ) | 4,751 | (1,168 | ) | ||||||||||||||||||||
Restricted share units issuance (61,000 shares) | (1,948 | ) | 1,529 | (419 | ) | ||||||||||||||||||||||
Repurchase of Common Stock (516,000 shares) | (6,665 | ) | (6,665 | ) | |||||||||||||||||||||||
Dividends declared ($0.24 per share) | (9,024 | ) | (9,024 | ) | |||||||||||||||||||||||
Amounts at June 30, 2017 | $ | 14 | $ | 2,137 | $ | 2,971 | $ | 230,763 | $ | 1,115 | $ | (60,796 | ) | $ | 176,204 | ||||||||||||
Net income | 34,439 | 34,439 | |||||||||||||||||||||||||
Other comprehensive income | 411 | 411 | |||||||||||||||||||||||||
Issuance of non-restricted stock (39,000 shares) | (624 | ) | 624 | — | |||||||||||||||||||||||
Conversion of Class A to Class B common stock (16,000 shares) | (1 | ) | 1 | — | |||||||||||||||||||||||
Compensation expense related to stock incentive plans | 4,179 | 4,179 | |||||||||||||||||||||||||
Performance share issuance (226,000 shares) | (2,261 | ) | (4,463 | ) | 4,622 | (2,102 | ) | ||||||||||||||||||||
Restricted share units issuance (58,000 shares) | (1,101 | ) | 760 | (341 | ) | ||||||||||||||||||||||
Relative total shareholder return performance units issuance (38,000 shares) | (1,283 | ) | 957 | (326 | ) | ||||||||||||||||||||||
Reclassification of change in enacted income tax rate to retained earnings | (290 | ) | 290 | — | |||||||||||||||||||||||
Repurchase of Common Stock (536,000 shares) | (8,936 | ) | (8,936 | ) | |||||||||||||||||||||||
Dividends declared ($0.28 per share) | (10,504 | ) | (10,504 | ) | |||||||||||||||||||||||
Amounts at June 30, 2018 | $ | 13 | $ | 2,138 | $ | 1,881 | $ | 249,945 | $ | 1,816 | $ | (62,769 | ) | $ | 193,024 | ||||||||||||
44
KIMBALL INTERNATIONAL, INC.
NOTES TO CONSOLIDATED FINANCIAL STATEMENTS
Note 1 Summary of Significant Accounting Policies
Principles of Consolidation: The consolidated financial statements include the accounts of all subsidiaries. All intercompany balances and transactions have been eliminated in the consolidation.
Operating Segments: We sell a portfolio of furniture products and services under three brands: Kimball, National, and Kimball Hospitality. We consider each of the three brands to be operating segments which aggregate into one reportable segment. The brands operate within six market verticals, selling to similar types of customers. Our products and services are similar in nature and utilize similar production and distribution processes. Our three brands share similar long-term economic characteristics.
Use of Estimates: The preparation of financial statements in conformity with accounting principles generally accepted in the United States of America (“U.S. GAAP”) requires management to make estimates and assumptions that affect the reported amounts included in the consolidated financial statements and related note disclosures. While efforts are made to assure estimates used are reasonably accurate based on management’s knowledge of current events, actual results could differ from those estimates.
Revenue Recognition: We recognize revenue when persuasive evidence of an arrangement exists, delivery has occurred, the sales price is fixed or determinable, and collectability is reasonably assured. Delivery is not considered to have occurred until the title and the risk of loss passes to the customer according to the terms of the contract. Title and risk of loss are transferred upon shipment to or receipt at our customers’ locations, or in limited circumstances, as determined by other specific sales terms of the transaction. Shipping and handling fees billed to customers are recorded as sales while the related shipping and handling costs are included in cost of goods sold. We recognize sales net of applicable sales tax. Based on estimated product returns and price concessions, a reserve for returns and allowances is recorded at the time of the sale, resulting in a reduction of revenue.
Cash and Cash Equivalents: Cash equivalents consist primarily of highly liquid investments with original maturities of three months or less at the time of acquisition. Cash and cash equivalents consist of bank accounts, money market funds, and commercial paper. Bank accounts are stated at cost, which approximates fair value, and money market funds and commercial paper are stated at fair value.
Short-Term Investments: Short-term investments consist primarily of municipal bonds, certificates of deposit purchased in the secondary market, and U.S. Treasury and federal agency securities. Municipal bonds include general obligation bonds and revenue bonds, some of which are pre-refunded. U.S. Treasury securities represent Treasury Bills and Notes of the U.S. government. Federal agency securities represent debt securities of a U.S. government sponsored agency, some of which are callable. Our investment policy dictates that municipal bonds, U.S. Treasury and federal agency securities must be investment grade quality. Our secondary market certificates of deposit are classified as investment securities, being purchased in the secondary market through a broker and available to be sold in the secondary market. All certificates of deposit are FDIC insured. All investments have maturities exceeding three months and are classified as available-for-sale securities which are recorded at fair value. Unrealized losses on available-for-sale securities are recognized in earnings when there is intent to sell or it is likely to be required to sell before recovery of the loss, or when the available-for-sale securities have incurred a credit loss. Otherwise, unrealized gains and losses are recorded net of the tax-related effect as a component of Shareowners’ Equity.
Notes Receivable and Trade Accounts Receivable: Our notes receivable and trade accounts receivable are recorded per the terms of the agreement or sale, and accrued interest is recognized when earned. We determine on a case-by-case basis the cessation of accruing interest, the resumption of accruing interest, the method of recording payments received on nonaccrual receivables, and the delinquency status for our limited number of notes receivable.
Our policy for estimating the allowance for credit losses on trade accounts receivable and notes receivable includes analysis of such items as aging, credit worthiness, payment history, and historical bad debt experience. Management uses these specific analyses in conjunction with an evaluation of the general economic and market conditions to determine the final allowance for credit losses on the trade accounts receivable and notes receivable. Trade accounts receivable and notes receivable are written off after exhaustive collection efforts occur and the receivable is deemed uncollectible. Our limited amount of notes receivable allows management to monitor the risks, credit quality indicators, collectability, and probability of impairment on an individual basis. Adjustments to the allowance for credit losses are recorded in selling and administrative expenses. Customary terms require payment within 30 days, with terms beyond 30 days being considered extended.
Inventories: Inventories are stated at the lower of cost or market value. Cost includes material, labor, and applicable manufacturing overhead. Costs associated with underutilization of capacity are expensed as incurred. The last-in, first-out (“LIFO”) method was used for approximately 92% and 94% of consolidated inventories at June 30, 2018 and June 30, 2017,
45
respectively. The remaining inventories were valued using the first-in, first-out (“FIFO”) method and average cost method. Inventories are adjusted for excess and obsolete inventory. Evaluation of excess inventory includes such factors as anticipated usage, inventory turnover, inventory levels, and product demand levels. Factors considered when evaluating obsolescence include the age of on-hand inventory and reduction in value due to damage, use as showroom samples, design changes, or cessation of product lines.
Property, Equipment, and Depreciation: Property and equipment are stated at cost less accumulated depreciation. Depreciation is provided over the estimated useful life of the assets using the straight-line method for financial reporting purposes. Leasehold improvements are amortized on a straight-line basis over the shorter of the useful life of the improvement or the term of the lease. Major maintenance activities and improvements are capitalized; other maintenance, repairs, and minor renewals are expensed. Depreciation and expenses for maintenance, repairs and minor renewals are included in both the Cost of Sales line and the Selling and Administrative Expense line of the Consolidated Statements of Income.
Impairment of Long-Lived Assets: We perform reviews for impairment of long-lived assets whenever events or changes in circumstances indicate that the carrying value of an asset may not be recoverable. Impairment is recognized when estimated future cash flows expected to result from the use of the asset and its eventual disposition are less than its carrying amount. When an impairment is identified, the carrying amount of the asset is reduced to its estimated fair value. Assets to be disposed of are recorded at the lower of net book value or fair market value less cost to sell at the date management commits to a plan of disposal.
Goodwill and Other Intangible Assets: Goodwill represents the difference between the purchase price and the related underlying tangible and intangible net asset fair values resulting from business acquisitions. Annually, or if conditions indicate an earlier review is necessary, we may assess qualitative factors to determine if it is more likely than not that the fair value is less than its carrying amount. We also have the option to bypass the qualitative assessment and proceed directly to performing the quantitative goodwill impairment test. We compare the carrying value of the reporting unit to the reporting unit’s fair value to identify impairment. If the fair value of the reporting unit is less than the carrying value, goodwill is written down to its fair value. Goodwill is assigned to and the fair value is tested at the reporting unit level. The fair value is established primarily using a discounted cash flow analysis and secondarily a market approach utilizing current industry information. The calculation of the fair value of the reporting unit considers current market conditions existing at the assessment date. During fiscal year 2018 no goodwill impairment was recognized.
During fiscal year 2018, we recorded $8.8 million and $10.7 million, respectively, in goodwill and other intangible assets from the acquisition of D’style, Inc. See Note 2 - Acquisition to Consolidated Financial Statements for more information on this acquisition.
Other Intangible Assets reported on the Consolidated Balance Sheets consist of capitalized software, product rights, customer relationships, trade names, and non-compete agreements. Intangible assets are reviewed for impairment when events or circumstances indicate that the carrying value may not be recoverable over the remaining lives of the assets. A summary of intangible assets subject to amortization is as follows:
June 30, 2018 | June 30, 2017 | ||||||||||||||||||||||
(Amounts in Thousands) | Cost | Accumulated Amortization | Net Value | Cost | Accumulated Amortization | Net Value | |||||||||||||||||
Capitalized Software | $ | 38,482 | $ | 35,922 | $ | 2,560 | $ | 37,918 | $ | 34,986 | $ | 2,932 | |||||||||||
Product Rights | 162 | 162 | — | 162 | 162 | — | |||||||||||||||||
Customer Relationships | 7,050 | 422 | 6,628 | — | — | — | |||||||||||||||||
Trade Names | 3,570 | 238 | 3,332 | — | — | — | |||||||||||||||||
Non-Compete Agreements | 100 | 13 | 87 | — | — | — | |||||||||||||||||
Other Intangible Assets | $ | 49,364 | $ | 36,757 | $ | 12,607 | $ | 38,080 | $ | 35,148 | $ | 2,932 | |||||||||||
During fiscal years 2018, 2017, and 2016, amortization expense of other intangible assets was, in thousands, $1,769, $1,071, and $786, respectively. Amortization expense in future periods is expected to be, in thousands, $1,909, $1,955, $1,572, $1,252, and $1,029 in the five years ending June 30, 2023, and $4,890 thereafter. The estimated useful life of internal-use software ranges from 2 to 10 years. The amortization period for customer relationship intangible assets is 20 years. The estimated useful life of trade names is 10 years. The estimated useful life of non-compete agreements is 5 years.
Internal-use software is stated at cost less accumulated amortization and is amortized using the straight-line method. During the software application development stage, capitalized costs include external consulting costs, cost of software licenses, and internal payroll and payroll-related costs for employees who are directly associated with a software project. Upgrades and
46
enhancements are capitalized if they result in added functionality which enable the software to perform tasks it was previously incapable of performing. Software maintenance, training, data conversion, and business process reengineering costs are expensed in the period in which they are incurred.
Trade names, non-compete agreements, and product rights to produce and sell certain products are amortized on a straight-line basis over their estimated useful lives. Capitalized customer relationships are amortized on estimated attrition rate of customers. We have no intangible assets with indefinite useful lives which are not subject to amortization.
Research and Development: The costs of research and development are expensed as incurred. Research and development costs were approximately, in millions, $7, $7, and $6 in fiscal years 2018, 2017, and 2016, respectively.
Advertising: Advertising costs are expensed as incurred. Advertising costs, included in selling and administrative expenses were, in millions, $5.8, $4.3, and $4.0, in fiscal years 2018, 2017, and 2016, respectively.
Insurance and Self-insurance: We are self-insured for certain employee health benefits including medical, short-term disability, and dental. Our self-insured reserves are estimated based upon a number of factors including known claims, estimated incurred but not reported claims, and other analyses, which are based on historical information along with certain assumptions about future events. We carry medical coverage for our eligible workforce not covered by self-insured plans. Insurance benefits are not provided to retired employees.
We also participate, along with other companies, in a group captive insurance company (“Captive”). The Captive insures losses related to workman's compensation, motor vehicle liability, product liability, and general liability. The Captive reinsures catastrophic losses for all participants, including Kimball International, in excess of predetermined amounts. We pay premiums to the Captive which accumulate as a prepaid deposit estimated for losses related to the above coverage. We also maintain a reserve for outstanding unpaid workers’ compensation claims, including an estimate of incurred but not reported claims.
Additionally, we purchase insurance coverage for property insurance, director and officer liability insurance, umbrella coverage, and other risks.
Income Taxes: Deferred income taxes are recognized for the estimated future tax consequences attributable to temporary differences between the financial statement carrying amounts of existing assets and liabilities and their respective tax bases. The deferred taxes are measured using enacted tax rates expected to apply to taxable income in the years in which the temporary differences are expected to reverse. We evaluate the recoverability of deferred tax assets each quarter by assessing the likelihood of future taxable income and available tax planning strategies that could be implemented to realize our deferred tax assets. If recovery is not likely, we provide a valuation allowance based on our best estimate of future taxable income in the various taxing jurisdictions and the amount of deferred taxes ultimately realizable. Future events could change management’s assessment. We classify all deferred tax assets and liabilities as noncurrent in our consolidated balance sheets.
We operate within multiple taxing jurisdictions and are subject to tax audits in these jurisdictions. These audits can involve complex uncertain tax positions, which may require an extended period of time to resolve. A tax benefit from an uncertain tax position may be recognized only if it is more likely than not that the tax position will be sustained on examination by taxing authorities, based on the technical merits of the position. We maintain a liability for uncertain income tax and other tax positions, including accrued interest and penalties on those positions. As tax positions are effectively settled, the tax liability is adjusted accordingly. We recognize interest and penalties related to unrecognized tax benefits in the Provision for Income Taxes line of the Consolidated Statements of Income.
Concentrations of Credit Risk: Certain business and credit risks are inherent in our business. Additionally, we currently have notes receivable from independent dealership financing and other miscellaneous notes receivable which are included on the Receivables and Other Assets lines of the Consolidated Balance Sheets. At June 30, 2018 and 2017, $0.8 million and $0.6 million, respectively, were outstanding under the notes receivable. The credit risk associated with receivables is disclosed in Note 19 - Credit Quality and Allowance for Credit Losses of Notes Receivable of Notes to Consolidated Financial Statements.
Off-Balance Sheet Risk: Our off-balance sheet arrangements are limited to standby letters of credit, a performance bond, and operating leases entered into in the normal course of business as described in Note 5 - Commitments and Contingent Liabilities of Notes to Consolidated Financial Statements.
Non-operating Income and Expense: Non-operating income and expense include the impact of such items as fair value adjustments on Supplemental Employee Retirement Plan (“SERP”) investments, foreign currency rate movements, bank charges, investment gain or loss, non-production rent income, and other miscellaneous non-operating income and expense items that are not directly related to operations. The gain or loss on SERP investments is offset by a change in the SERP liability that is recognized in selling and administrative expenses.
47
Foreign Currency Translation: Our foreign operations use the U.S. Dollar as their functional currency. Foreign currency assets and liabilities are remeasured into functional currencies at end-of-period exchange rates, except for nonmonetary assets and equity, which are remeasured at historical exchange rates. Revenue and expenses are remeasured at the weighted average exchange rate during the fiscal year, except for expenses related to nonmonetary assets, which are remeasured at historical exchange rates. Gains and losses from foreign currency remeasurement are reported in the Non-operating income or expense line item on the Consolidated Statements of Income.
Derivative Instruments and Hedging Activities: Derivative financial instruments are recognized on the balance sheet as assets and liabilities and are measured at fair value. Changes in the fair value of derivatives are recorded each period in earnings or accumulated other comprehensive income, depending on whether a derivative is designated and effective as part of a hedge transaction, and if it is, the type of hedge transaction. Hedge accounting is utilized when a derivative is expected to be highly effective upon execution and continues to be highly effective over the duration of the hedge transaction. Hedge accounting permits gains and losses on derivative instruments to be deferred in accumulated other comprehensive income and subsequently included in earnings in the periods in which earnings are affected by the hedged item, or when the derivative is determined to be ineffective. We use derivatives primarily for forward purchases of foreign currency to manage exposure to the variability of cash flows, primarily related to the foreign exchange rate risks inherent in forecasted transactions denominated in foreign currency.
We hold a total investment of $2.0 million in a privately-held company, including $1.5 million in stock warrants purchased during fiscal year 2017. The investment in stock warrants is accounted for as a derivative instrument and is included in the Other Assets line of the Consolidated Balance Sheets. See Note 11 - Derivative Instruments of Notes to Consolidated Financial Statements for more information on derivative instruments and hedging activities.
Stock-Based Compensation: As described in Note 8 - Stock Compensation Plans of Notes to Consolidated Financial Statements, we maintain a stock-based compensation plan which allows for the issuance of stock unit awards, restricted stock awards, stock options, stock appreciation rights, and other stock-based awards. each of which may include performance-based conditions, to certain employees, non-employee directors, consultants, and advisors. We recognize the cost resulting from share-based payment transactions using a fair-value-based method. The estimated fair value of outstanding performance shares and restricted share units is based on the stock price at the date of the grant. For performance shares, the price is reduced by the present value of dividends normally paid over the vesting period which are not payable on outstanding performance share awards. The estimated fair value of outstanding relative total shareholder return performance units (“RTSR”) is based on the grant date fair value of RTSR awards using a Monte Carlo simulation which includes estimating the movement of stock prices and the effects of volatility, interest rates, and dividends. Stock-based compensation expense is recognized for the portion of the awards that are ultimately expected to vest. Forfeitures are accounted for as they occur.
Recently Adopted Accounting Pronouncements:
In February 2018, the Financial Accounting Standards Board (“FASB”) issued guidance that allows the reclassification of the income tax effects resulting from the Tax Cuts and Jobs Act (“Tax Act”) from accumulated other comprehensive income to retained earnings. Under the Tax Act, deferred taxes were adjusted to reflect the reduction of the federal income tax rate to the newly enacted federal income tax rate which left the tax effects on items within accumulated other comprehensive income stranded at historical tax rates. This guidance requires qualitative disclosure of the accounting policy for releasing income tax effects from accumulated other comprehensive income and if the reclassification election is made, the impacts of the change on the consolidated financial statements. The guidance is effective for our first quarter of fiscal year 2020 with early adoption permitted and is to be applied either in the period of adoption or retrospectively to each period in which the effect of the Tax Act changes are recognized. We early adopted the guidance in our fourth quarter of fiscal year 2018 and reclassified the entire tax effect out of accumulated other comprehensive income and into retained earnings in the amount of $0.3 million. Our policy for releasing disproportionate income tax effects from accumulated other comprehensive income utilizes the aggregate approach.
In August 2017, the FASB issued guidance on accounting for derivatives and hedging activities. The objective of this guidance is to better align a company’s risk management activities and financial reporting for hedging relationships, simplify the hedge accounting requirements, and improve the disclosures of hedging arrangements. The guidance is effective for our first quarter of fiscal year 2020 with early adoption permitted. We early adopted the guidance in our fourth quarter of fiscal year 2018 and the guidance did not have a material effect on our consolidated financial statements.
In January 2017, the FASB issued guidance on simplifying the test for goodwill impairment by eliminating the requirement to estimate the implied fair value of a reporting unit from the goodwill impairment test. Under the guidance, an entity should perform its annual, or interim, goodwill impairment test by comparing the fair value of a reporting unit with its carrying amount and should recognize an impairment charge for the amount by which the carrying amount exceeds the reporting unit’s fair value. However, the loss recognized should not exceed the total amount of goodwill allocated to that reporting unit. An
48
entity still has the option to perform the qualitative assessment for a reporting unit to determine if the quantitative impairment test is necessary. The guidance is effective prospectively for our first quarter of fiscal year 2021 financial statements with early adoption permitted. In conjunction with our acquisition of D’style, Inc. we early adopted the guidance in our second quarter of fiscal year 2018, and the guidance did not have a material effect on our consolidated financial statements.
In January 2017, the FASB issued guidance which revises the definition of a business with the objective of adding guidance to assist entities with evaluating whether transactions should be accounted for as acquisitions or disposals of assets or businesses. The guidance is effective for our first quarter of fiscal year 2019 with early adoption permitted and the amendments can be applied to transactions occurring before the guidance was issued as long as the applicable financial statements have not been issued. In conjunction with our acquisition of D’style, Inc., we early adopted the guidance in our second quarter of fiscal year 2018 and the guidance did not have a material effect on our consolidated financial statements.
In August 2016, the FASB issued guidance that clarifies and provides specific guidance on eight cash flow classification issues that are not addressed by current GAAP. The new guidance is intended to reduce diversity in practice in how certain transactions are classified in the statement of cash flows, including how to classify contingent consideration payments made after a business combination, which will impact the presentation of future earn-out payments for our acquisition of D’style, Inc. The guidance is effective for our first quarter of fiscal year 2019 with early adoption permitted. We early adopted the guidance in our second quarter of fiscal year 2018 and the guidance did not have a material effect on our consolidated financial statements.
In July 2015, the FASB issued guidance on simplifying the measurement of inventory which applies to inventory that is measured using first-in, first-out (“FIFO”) or average cost. Inventory within the scope of this update is required to be measured at the lower of cost or net realizable value, which is the estimated selling price in the ordinary course of business less reasonably predictable costs of completion, disposal, and transportation. The guidance does not impact inventory measured on a last-in, first-out (“LIFO”) basis. The guidance was adopted prospectively in our first quarter of fiscal year 2018 and did not have a material effect on our consolidated financial statements.
Recently Issued Accounting Pronouncements Not Yet Adopted:
In June 2018, the FASB issued guidance to improve the accounting for and to reduce the cost and complexity of share-based payments to nonemployees for goods and services. The guidance is effective for our first quarter of fiscal year 2020 with early adoption permitted but may not be adopted earlier than the adoption of the new revenue standard. We expect to adopt the standard at the beginning of our fiscal year 2019, and it will be applied to awards that have not been settled by the date of adoption. We do not expect the adoption to have a material effect on our consolidated financial statements.
In May 2017, the FASB issued guidance that clarifies when changes to the terms or conditions of a share-based payment award must be accounted for as modifications. The guidance is effective for our first quarter of fiscal year 2019 with early adoption permitted and will be applied prospectively to awards modified on or after the adoption date. We do not expect the adoption to have a material effect on our consolidated financial statements.
In March 2017, the FASB issued guidance that will shorten the amortization period for certain callable debt securities held at a premium to the earliest call date. This guidance does not require an accounting change for securities held at a discount. This guidance is to be applied on a modified retrospective basis, with a cumulative-effect adjustment directly to retained earnings as of the beginning of the period of adoption. The guidance is effective for our first quarter of fiscal year 2020 with early adoption permitted. We have not yet determined the effect of this guidance on our consolidated financial statements.
In March 2017, the FASB issued guidance that requires employers that present a measure of operating income in their statement of income to include only the service cost component of net periodic benefit cost in operating expenses, which will impact the presentation of our postemployment benefit plan. Employers are required to present all other components of net benefit cost separate from the service costs and disclose the line item in which the components of net benefit cost other than the service cost are included. Retrospective application of the change in the statement of income presentation is required. The guidance is effective for our first quarter of fiscal year 2019 with early adoption permitted. We do not expect the adoption to have a material effect on our consolidated financial statements.
In February 2017, the FASB issued guidance that clarifies the scope of guidance on nonfinancial asset derecognition as well as the accounting for partial sales of nonfinancial assets. This new guidance is meant to clarify the scope of the original guidance that was issued in connection with the guidance relating to the recognition of revenue from contracts with customers, as defined below, which addresses recognizing gains and losses from the transfer of nonfinancial assets in contracts with noncustomers. The guidance is effective for our first quarter of fiscal year 2019 with early adoption permitted, and we are required to adopt concurrent with the adoption of the guidance on recognition of revenue from contracts with customers. We are reviewing the impact of this rule but have not yet determined the effect of this guidance on our consolidated financial statements.
In November 2016, the FASB issued guidance which requires an entity to include in their cash and cash equivalent balances in the statement of cash flows those amounts that are deemed to be restricted cash and restricted cash equivalents. The guidance is
49
effective for our first quarter of fiscal year 2019 with early adoption permitted and is required to be applied using a retrospective transition method to each prior reporting period. We do not expect the adoption to have a material effect on our consolidated financial statements.
In June 2016, the FASB issued guidance on the measurement of credit losses on financial instruments. Under the guidance, an entity recognizes as an allowance its estimate of expected credit losses, which the FASB believes will result in more timely recognition of such losses. The guidance is also intended to reduce the complexity by decreasing the number of credit impairment models that entities use to account for debt instruments. The guidance is effective for our first quarter of fiscal year 2021 with early adoption in our fiscal year 2020 permitted. We have not yet determined the effect of this guidance on our consolidated financial statements.
In February 2016, the FASB issued guidance that revises the accounting for leases. The guidance is intended to improve financial reporting of leasing transactions by requiring lessees to record right-of-use assets and corresponding lease liabilities on the balance sheet. Leases will continue to be classified as either operating or finance leases, with the classification affecting the pattern of expense recognition in the statement of income. The guidance will also require additional disclosures to help investors and other financial statement users better understand the amount, timing, and uncertainty of cash flows arising from leases. In January 2018, the FASB issued additional guidance for land easements which permits entities to forgo the evaluation of existing land easement arrangements to determine if they contain a lease. New land easement arrangements, or modifications to existing arrangements, after the adoption of the lease standard will be evaluated to determine if they meet the definition of a lease. In July 2018, the FASB amended the new standard to clarify certain aspects of the guidance, and they also issued another new standard in July 2018 that allows the option to apply the transition provisions at the adoption date instead of at the earliest comparative period in the consolidated financial statements. The guidance is effective for our first quarter of fiscal year 2020 with early adoption permitted and is required to be applied either using a modified retrospective approach to each prior reporting period or initial application as of the beginning of the period of adoption. We are currently evaluating the impact of this guidance but have not yet determined the effect on our consolidated financial statements.
In January 2016, the FASB issued guidance which is intended to improve the recognition and measurement of financial instruments. The guidance revises an entity’s accounting related to the classification and measurement of investments in equity securities and the presentation of certain fair value changes for financial liabilities measured at fair value. The guidance also amends certain disclosure requirements associated with the fair value of financial instruments. The guidance is effective prospectively for our first quarter of fiscal year 2019 financial statements with early adoption allowed on certain provisions. We do not expect the adoption to have a material effect on our consolidated financial statements.
In May 2014, the FASB issued guidance on the recognition of revenue from contracts with customers. The core principle of the guidance is that a company should recognize revenue to depict the transfer of promised goods or services to customers in an amount that reflects the consideration which the company expects to receive in exchange for those goods or services. To achieve this core principle, the guidance provides a five-step analysis of transactions to determine when and how revenue is recognized. The guidance addresses several areas including transfer of control, contracts with multiple performance obligations, and costs to obtain and fulfill contracts. The guidance also requires additional disclosure about the nature, amount, timing and uncertainty of revenue and cash flows arising from customer contracts, including significant judgments and changes in judgments and assets recognized from costs incurred to obtain or fulfill a contract. In July 2015, the FASB decided to defer the effective date for this new revenue standard by one year, which will make the guidance effective for our first quarter of fiscal year 2019 financial statements using either of two acceptable adoption methods: (i) retrospective adoption to each prior reporting period presented with the option to elect certain practical expedients; or (ii) adoption with the cumulative effect of initially applying the guidance recognized at the date of initial application and providing certain additional disclosures. In March 2016, the FASB issued additional guidance which further clarifies assessing whether an entity is a principal or an agent in a revenue transaction, and impacts whether an entity reports revenue on a gross or net basis; in April 2016, the FASB issued additional guidance that addresses identifying performance obligations and implementing licensing guidance; and in May 2016, the FASB issued additional guidance that clarifies collectability, noncash consideration, and other transition issues. The amendments have the same effective date and transition requirements as the new revenue standard.
We have completed a preliminary review of the impact of the new revenue standard and expect the primary change to be the reclassification of certain items on the statement of income. For contracts involving products that are sold directly to end customers, currently any fees paid to dealer agents for facilitating the sale and performing certain services are netted against revenue. Under the new standard, fees paid to dealer agents will be recognized as either cost of sales or selling expense. In addition, any commissions or fees paid to third-party purchasing organizations will be recognized as a selling expense rather than being netted against revenue. Although the result of these changes will be increases in net sales, cost of sales, and selling expenses, these changes will have no impact to operating income dollars but will reduce operating income as a percent of net sales. The new standard will also require several less significant changes including classifying the reserve for returns and allowance as a liability rather than a contra-receivable, recognizing a recovery asset for potential product returns, and capitalizing costs to obtain and fulfill sales contracts. The new standard will also require significantly more disclosure than is required under current rules. We continue to evaluate the impact that will result from adoption of the new standard, and we are
50
finalizing changes to our business processes, systems, and internal controls to support recognition and disclosure under the new standard. We expect to adopt the standard at the beginning of our fiscal year 2019 using the full retrospective approach which, upon adoption, will adjust fiscal years 2017 and 2018 to provide comparable financial reporting for these periods.
Note 2 Acquisition
During the second quarter of fiscal year 2018, we acquired certain assets of D’style, Inc. (“D’style”), headquartered in Chula Vista, California. This acquisition expanded our reach into hospitality public space areas and added an attractive product portfolio of solutions for the residential market through the acquired Allan Copley Designs brand. These offerings enable us to take advantage of the trend where hospitality, residential and commercial designs are merging. As part of this acquisition, we also acquired all of the capital stock of Diseños de Estilo S.A. de C.V. headquartered in Tijuana, Mexico, another member of the D’style group which manufactures exclusively for D’style, strengthening our North American manufacturing footprint and serving as a distribution channel to the Mexico and Latin America hospitality markets. The cash paid for the acquisition totaled $18.2 million. An earn-out of up to $2.2 million may be paid, which is contingent based upon fiscal year 2018 and 2019 D’style, Inc. operating income compared to a predetermined target for each fiscal year. As of June 30, 2018, the fair value of the earn-out was $1.1 million.
A summary of the preliminary purchase price allocation is as follows:
Purchase Price Allocation | ||||
(Amounts in Thousands) | ||||
Assets: | ||||
Receivables | $ | 1,467 | ||
Inventories | 1,455 | |||
Prepaid expenses and other current assets | 1,120 | |||
Net property and equipment | 184 | |||
Goodwill | 8,824 | |||
Other intangible assets | 10,720 | |||
Deferred tax assets | 302 | |||
$ | 24,072 | |||
Liabilities: | ||||
Accounts payable | $ | 774 | ||
Customer deposits | 3,084 | |||
Accrued expenses | 333 | |||
$ | 4,191 | |||
$ | 19,881 | |||
Consideration | ||||
(Amounts in Thousands) | ||||
Cash | $ | 18,201 | ||
Contingent earn-out — fair value at acquisition date | 1,680 | |||
Fair value of total consideration | $ | 19,881 | ||
As of the acquisition date the fair value of the earn-out was $1.7 million. At June 30, 2018, the fair value of the contingent earn-out liability was adjusted to $1.1 million, resulting in a $0.6 million pre-tax gain, recognized as a $0.8 million pre-tax gain included in Selling and Administrative Expenses, offset in part by $0.2 million of Interest Expense attributable to an adjustment of the contingent earn-out liability that will be based upon fiscal year 2018 and 2019 D’style, Inc. operating income compared to a predetermined target for each fiscal year.
The operating results of this acquisition are included in our consolidated financial statements beginning on November 6, 2017. For the year ended June 30, 2018, net sales and net income related to D’style were $13.0 million and $0.8 million, respectively. Direct costs of the acquisition for the year ended June 30, 2018, of approximately $0.8 million, were expensed as incurred and were included on the Selling and Administrative Expenses line of our Consolidated Statements of Income.
51
Goodwill is primarily attributable to the anticipated revenue and supply chain synergies expected from the operations of the combined company. An immaterial amount of goodwill is not deductible for tax purposes, while the tax deductible portion is deductible over 15 years. See Note 1 - Summary of Significant Accounting Policies of Notes to Consolidated Financial Statements for more information on goodwill and other intangible assets. The following summarizes our goodwill activity for fiscal year 2018:
Goodwill | ||||
(Amounts in Thousands) | ||||
Goodwill - June 30, 2017 | $ | — | ||
Goodwill - at acquisition date | 8,559 | |||
Working capital adjustments | 265 | |||
Goodwill - June 30, 2018 | $ | 8,824 | ||
The purchase price allocation is provisional pending final valuations and purchase accounting adjustments, which were not final as of June 30, 2018. We utilized management estimates and consultation with an independent third-party valuation firm to assist in the valuation process.
Note 3 Inventories
Inventories are stated at the lower of cost or market value. Inventories are valued using the last-in, first-out (“LIFO”) method for approximately 92% and 94% of consolidated inventories at June 30, 2018 and June 30, 2017, respectively. The remaining inventories are valued using the first-in, first-out (“FIFO”) method and average cost method.
Had the FIFO method been used for all inventories, income would have been $1.1 million higher in fiscal year 2018, $0.4 million higher in fiscal year 2017, and $1.0 million lower in fiscal year 2016. Certain inventory quantity reductions caused liquidations of LIFO inventory values, which increased income by an immaterial amount in 2018, 2017 and 2016.
Inventory components at June 30, 2018 were as follows:
(Amounts in Thousands) | 2018 | 2017 | |||||
Finished products | $ | 23,756 | $ | 24,537 | |||
Work-in-process | 1,378 | 1,346 | |||||
Raw materials | 29,158 | 25,368 | |||||
Total FIFO inventory | $ | 54,292 | $ | 51,251 | |||
LIFO reserve, net | (14,783 | ) | (13,189 | ) | |||
Total inventory | $ | 39,509 | $ | 38,062 | |||
Note 4 Property and Equipment
Major classes of property and equipment at June 30 consist of the following:
(Amounts in Thousands) | 2018 | 2017 | |||||
Land | $ | 2,219 | $ | 2,431 | |||
Buildings and improvements | 105,372 | 109,374 | |||||
Machinery and equipment | 152,653 | 147,407 | |||||
Construction-in-progress | 4,302 | 3,660 | |||||
Total | $ | 264,546 | $ | 262,872 | |||
Less: Accumulated depreciation | (180,059 | ) | (182,803 | ) | |||
Property and equipment, net | $ | 84,487 | $ | 80,069 | |||
52
The useful lives used in computing depreciation are based on estimated service lives for classes of property, as follows:
Years | |
Buildings and improvements | 5 to 40 |
Machinery and equipment | 2 to 20 |
Leasehold improvements | Lesser of Useful Life or Term of Lease |
Depreciation and amortization of property and equipment, including asset write-downs associated with restructuring plans, totaled, in millions, $13.7 for fiscal year 2018, $14.7 for fiscal year 2017, and $14.3 for fiscal year 2016.
At June 30, 2018, excess land located in Jasper, Indiana totaling $0.3 million was classified as held for sale. At June 30, 2017, our fleet of over-the-road tractors and trailers and a small parcel of land located in Jasper, Indiana totaling $4.2 million were classified as held for sale. During fiscal year 2018, we sold all of our over-the-road tractors and trailers and the small parcel of land and recognized a pre-tax gain of $0.4 million as the $4.8 million selling price exceeded the book value net of selling costs.
At June 30, 2016, assets totaling $9.2 million were classified as held for sale for a facility and land located in Post Falls, Idaho. During fiscal year 2017, we sold our Post Falls, Idaho facility and land and recognized a pre-tax gain of $2.1 million as the $12.0 million selling price exceeded the book value of the facility and land net of selling costs. The gain was recorded on the Restructuring (Gain) Expense line of the Consolidated Statements of Income. We also sold excess land for proceeds of $1.4 million and recognized pre-tax gains of $1.2 million which is recorded on the Selling and Administrative Expenses line of the Consolidated Statements of Income. In addition, during fiscal year 2017 we recognized impairment of $0.2 million as the carrying value of our fleet of over-the-road tractors and trailers exceeded the market value less selling costs.
During fiscal year 2017, we also sold a facility in Indiana which housed an education center for dealer and employee training, a research and development center, and a product showroom for proceeds of $3.8 million. In order to allow for transition of those functions to our primary campus also located in Jasper, Indiana, we leased back a portion of the facility until December 31, 2017 at a favorable rate. The below-market terms of the leaseback are considered a form of continuing involvement that precludes sale treatment therefore we deferred the recognition of the sale until fiscal year 2018 when we recorded the pre-tax gain of $1.7 million on the sale.
Note 5 Commitments and Contingent Liabilities
Leases:
Operating leases for certain offices, showrooms, manufacturing facilities, land, and equipment, which expire from fiscal year 2019 to 2027, contain provisions under which minimum annual lease payments are, in millions, $4.0, $3.6, $3.3, $3.1, and $2.6 for the five years ending June 30, 2023, respectively, and aggregate $5.9 million from fiscal year 2024 to the expiration of the leases in fiscal year 2027. We are obligated under certain real estate leases to maintain the properties and pay real estate taxes. Certain leases include renewal options and escalation clauses. Total rental expense amounted to, in millions, $5.8, $6.0, and $6.7 in fiscal years 2018, 2017, and 2016, respectively, including certain leases requiring contingent lease payments based primarily on warehouse space utilized, which amounted to expense of, in millions, $1.2, $1.5, and $2.4 in fiscal years 2018, 2017, and 2016, respectively.
As of June 30, 2017, capitalized leases were not material and matured during fiscal year 2018.
During the latter portion of our fiscal year 2017, we sold a facility in Indiana which housed the education center for dealer and employee training, a research and development center, and a product showroom for proceeds of $3.8 million. We were leasing a portion of the facility back to facilitate the short-term transition of those functions to other existing Indiana locations. The sale of the facility did not qualify for sale-leaseback accounting during fiscal year 2017, and thus the $1.7 million pre-tax gain on the sale was not recognized in selling and administrative expenses until fiscal year 2018.
Guarantees:
Standby letters of credit were issued to lessors and insurance institutions and can only be drawn upon in the event of our failure to pay our obligations to a beneficiary. We had a maximum financial exposure from unused standby letters of credit totaling $1.4 million as of June 30, 2018 and $1.2 million as of June 30, 2017.
We are periodically required to provide performance bonds in order to conduct business with certain customers. The bonds are required to provide assurances to customers that the products and services they have purchased will be installed and/or provided properly and without damage to their facilities. We are ultimately liable for claims that may occur against the
53
performance bonds. We had a maximum financial exposure from performance bonds totaling $0.5 million as of June 30, 2018 and $0.4 million as of June 30, 2017.
We are not aware of circumstances that would require us to perform under these arrangements and believe that the resolution of any claims that might arise in the future, either individually or in the aggregate, would not materially affect our consolidated financial statements. Accordingly, no liability has been recorded as of June 30, 2018 and 2017 with respect to the standby letters of credit or performance bonds. We also enter into commercial letters of credit to facilitate payments to vendors and from customers.
Product Warranties:
We estimate product warranty liability at the time of sale based on historical repair or replacement cost trends in conjunction with the length of the warranty offered. Management refines the warranty liability periodically based on changes in historical cost trends and in certain cases where specific warranty issues become known.
Changes in the product warranty accrual during fiscal years 2018, 2017, and 2016 were as follows:
(Amounts in Thousands) | 2018 | 2017 | 2016 | ||||||||
Product Warranty Liability at the beginning of the year | $ | 1,992 | $ | 2,351 | $ | 2,264 | |||||
Additions to warranty accrual (including changes in estimates) | 1,307 | 562 | 1,165 | ||||||||
Settlements made (in cash or in kind) | (1,005 | ) | (921 | ) | (1,078 | ) | |||||
Product Warranty Liability at the end of the year | $ | 2,294 | $ | 1,992 | $ | 2,351 | |||||
Other Contingency:
The U.S. government, as well as state and local governments, can typically terminate or modify their contracts with us either at their discretion or if we default by failing to perform under the terms of the applicable contract, which could expose us to liability. The failure to comply with regulatory and contractual requirements could subject us to investigations, fines, or other penalties, and violations of certain regulatory and contractual requirements could also result in us being suspended or debarred from future government contracting.
In March 2016, in connection with a renewal of one of our contracts, we became aware of noncompliance and inaccuracies in our General Services Administration (“GSA”) subcontractor reporting. Accordingly, we retained outside legal counsel to assist in conducting an internal review of our reporting practices, and we self-reported the matter and the results of the internal review to the GSA. We have promptly responded to inquiries from the GSA since our initial reporting, have met with government officials as requested on two occasions, and intend to cooperate fully with any further inquiries or investigations. While we are not able to reasonably estimate the future financial impact, if any, of the possible sanctions at this time, any of them could, if imposed, have a material adverse impact on our business, future financial position, results of operations, or cash flows. The timing of the government’s review and determination of any outcome of these matters is uncertain and, therefore, it is unclear as to when and to what extent, if any, our previously issued earnings guidance might be impacted. We have incurred, and may incur additional, legal and related costs in connection with our internal review and the government’s response to this matter. During fiscal year 2018, sales related to our GSA contracts were approximately 7.5% of our consolidated sales, with one contract accounting for approximately 5.3% of our consolidated sales and the other contract accounting for approximately 2.2% of our consolidated sales.
Note 6 Long-Term Debt and Credit Facilities
Long-term debt, less current maturities as of June 30, 2018 and 2017, was, in thousands, $161 and $184, respectively, and current maturities of long-term debt were, in thousands, $23 and $27, respectively. Long-term debt consists of a long-term note payable, which has an interest rate of 9.25% and matures in 2025. As of June 30, 2017, long-term debt also included capitalized leases, which matured during fiscal year 2018. Aggregate maturities of long-term debt for the next five years are, in thousands, $23, $25, $27, $30, and $33, respectively, and aggregate $46 thereafter.
We maintain a $30 million credit facility with a maturity date of October 31, 2019 that allows for both issuances of letters of credit and cash borrowings. This facility provides an option to increase the amount available for borrowing to $55 million at our request, subject to the consent of the participating banks. At June 30, 2018 and 2017, we had no borrowings outstanding under the credit facility. At June 30, 2018, we had $1.4 million in letters of credit outstanding, which reduced our borrowing capacity on the credit facility to $28.6 million.
54
The revolving loans under the Credit Agreement may consist of, at our election, advances in U.S. dollars or advances in any other currency that is agreed to by the lenders. The proceeds of the revolving loans are to be used for general corporate purposes, including acquisitions. A portion of the credit facility, not to exceed $10 million of the principal amount, will be available for the issuance of letters of credit. The commitment fee is payable on the unused portion of the credit facility which was immaterial to our operating results for fiscal years 2018 and 2017. The commitment fee on the unused portion of principal amount of the credit facility is payable at a rate that ranges from 20.0 to 25.0 basis points per annum as determined by our ratio of consolidated total indebtedness to adjusted consolidated EBITDA.
The interest rate is dependent on the type of borrowings and will be one of the following two options:
• | The adjusted London Interbank Offered Rate (“Adjusted LIBO Rate” as defined in the Credit Agreement) in effect two business days prior to the advance (adjusted upwards to reflect bank reserve costs) for such interest period, plus the Eurocurrency Loans margin which can range from 125.0 to 175.0 basis points based on our ratio of consolidated total indebtedness to adjusted consolidated EBITDA; or |
• | The Alternate Base Rate, which is defined as the highest of the fluctuating rate per annum equal to the higher of |
a. | JP Morgan’s prime rate; |
b. | 1% per annum above the Adjusted LIBO rate; or |
c. | 0.5% per annum above the Federal funds rate; |
plus the ABR Loans spread which can range from 25.0 to 75.0 basis points based on our ratio of consolidated total indebtedness to adjusted consolidated EBITDA.
Our financial covenants under the Credit Agreement require:
• | An adjusted leverage ratio of (a) consolidated total indebtedness minus unencumbered U.S. cash on hand in the U.S. in excess of $15,000,000 to (b) consolidated EBITDA, determined as of the end of each of its fiscal quarters for the then most recently ended four fiscal quarters, to not be greater than 3.0 to 1.0, and |
• | A fixed charge coverage ratio of (a) the sum of (i) consolidated EBITDA, minus (ii) 50% of depreciation expense, minus (iii) taxes paid, minus (iv) dividends and distributions paid, to (b) the sum of (i) scheduled principal payments on indebtedness due and/or paid, plus (ii) interest expense, calculated on a consolidated basis in accordance with GAAP, determined as of the end of each of its fiscal quarters for the trailing four fiscal quarters then ending, to not be less than 1.10 to 1.00. |
Interest expense incurred on borrowings were, in thousands, $70, $37, and $22, in fiscal years 2018, 2017, and 2016, respectively.
Note 7 Employee Benefit Plans
Retirement Plans:
We have a trusteed defined contribution retirement plan in effect for substantially all domestic employees meeting the eligibility requirements. Employer contributions to the trusteed plan have a five-year vesting schedule and are held for the sole benefit of participants. We also maintain a supplemental employee retirement plan (“SERP”) for executive employees which enables them to defer cash compensation on a pre-tax basis in excess of IRS limitations. The SERP is structured as a rabbi trust, and therefore assets in the SERP portfolio are subject to creditor claims in the event of bankruptcy.
The discretionary employer contribution for domestic employees is determined annually by the Compensation and Governance Committee of the Board of Directors. Total expense related to employer contributions to the domestic retirement plans was, in millions, $5.9, $6.4, and $4.3 for fiscal years 2018, 2017, and 2016, respectively.
Employees of certain foreign subsidiaries are covered by local pension or retirement plans. The expense related to employer contributions to these foreign plans for fiscal years 2018, 2017, and 2016 was not material.
Severance Plans:
Our domestic employees participate in severance plans which provide severance benefits to eligible employees meeting the plans’ qualifications, primarily for involuntary termination without cause.
55
There are no statutory requirements for us to contribute to the plans, nor do employees contribute to the plans. The plans hold no assets. Benefits are paid using available cash on hand when eligible employees meet plan qualifications for payment. Benefits are based upon an employee’s years of service and accumulate up to certain limits specified in the plans and include both salary and an allowance for medical benefits. The components and changes in the Benefit Obligation, Accumulated Other Comprehensive Income (Loss), and Net Periodic Benefit Cost are as follows:
June 30 | |||||||
(Amounts in Thousands) | 2018 | 2017 | |||||
Changes and Components of Benefit Obligation: | |||||||
Benefit obligation at beginning of year | $ | 3,083 | $ | 2,815 | |||
Service cost | 521 | 482 | |||||
Interest cost | 85 | 65 | |||||
Actuarial (gain) loss for the period | (895 | ) | (186 | ) | |||
Benefits paid | (75 | ) | (93 | ) | |||
Benefit obligation at end of year | $ | 2,719 | $ | 3,083 | |||
Balance in current liabilities | $ | 494 | $ | 561 | |||
Balance in noncurrent liabilities | 2,225 | 2,522 | |||||
Total benefit obligation recognized in the Consolidated Balance Sheets | $ | 2,719 | $ | 3,083 | |||
June 30 | |||||||
(Amounts in Thousands) | 2018 | 2017 | |||||
Changes and Components in Accumulated Other Comprehensive Income (Loss) (before tax): | |||||||
Accumulated Other Comprehensive Income (Loss) at beginning of year | $ | 1,859 | $ | 2,146 | |||
Net change in unrecognized actuarial gain (loss) | 635 | (287 | ) | ||||
Accumulated Other Comprehensive Income (Loss) at end of year | $ | 2,494 | $ | 1,859 | |||
(Amounts in Thousands) | Year Ended June 30 | ||||||||||
Components of Net Periodic Benefit Cost (before tax): | 2018 | 2017 | 2016 | ||||||||
Service cost | $ | 521 | $ | 482 | $ | 490 | |||||
Interest cost | 85 | 65 | 74 | ||||||||
Amortization of actuarial (gain) loss | (260 | ) | (473 | ) | (441 | ) | |||||
Net periodic benefit cost — Total cost | $ | 346 | $ | 74 | $ | 123 | |||||
The benefit cost in the above table includes only normal recurring levels of severance activity, as estimated using an actuarial method. Unusual or non-recurring severance actions are not estimable using actuarial methods and are expensed in accordance with other applicable U.S. GAAP.
The actuarial gain is amortized on a straight-line basis over the average remaining service period of employees expected to receive benefits under the plan. The estimated actuarial net gain for the severance plans that will be amortized from accumulated other comprehensive income into earnings over the next fiscal year is, pre-tax in thousands, $381.
Assumptions used to determine fiscal year end benefit obligations are as follows:
2018 | 2017 | ||
Discount Rate | 3.4% | 2.8% | |
Rate of Compensation Increase | 3.0% | 3.0% | |
56
Weighted average assumptions used to determine fiscal year net periodic benefit costs are as follows:
2018 | 2017 | 2016 | |||
Discount Rate | 3.0% | 2.4% | 2.7% | ||
Rate of Compensation Increase | 3.0% | 3.0% | 3.0% | ||
Note 8 Stock Compensation Plans
On October 31, 2017, the shareowners approved the 2017 Stock Incentive Plan (“the 2017 Plan”) which allows for the issuance of stock awards, restricted stock awards, stock options, stock appreciation rights, and other stock-based awards, each of which may include performance-based conditions, to certain employees, non-employee directors, consultants, and advisors. The 2017 Plan authorizes the issuance of 1,000,000 shares of our Class B Common Stock, plus approximately 1.2 million unused shares from the former Amended and Restated 2003 Stock Option and Incentive Plan (“the 2003 Plan”).
Stock-based compensation expense was $4.2 million, $6.3 million, and $5.6 million in fiscal years 2018, 2017 and 2016, respectively. The total income tax benefit for stock compensation arrangements was $2.1 million, $2.9 million, and $2.2 million in fiscal years 2018, 2017 and 2016, respectively. Included in the income tax benefit for fiscal years 2018 and 2017, respectively, was a $0.7 million and $0.5 million reduction in taxes for excess tax benefits from the vesting of stock awards. We generally use treasury shares for issuance of shares.
Performance Shares:
We award performance shares to officers and other key employees. Under these awards, a number of shares will be issued to each participant based upon the attainment of the applicable performance conditions as applied to a total potential share award made and approved by the Compensation and Governance Committee. Currently outstanding are long-term performance share awards with a contractual life of five years. We also award annual performance share awards with a contractual life of one year. The performance conditions for both types of performance share awards are based on annual performance measurement periods. Annual performance shares vest at the end of the fiscal year. Long-term performance shares vest when issued as Common Stock shortly after the end of the fiscal year in which each performance measurement period is complete. Therefore, the long-term performance share awards include shares applicable to performance measurement periods in future fiscal years that will be measured at fair value when the performance targets are established in future fiscal years. The long-term performance share award is being phased out and has only one year remaining. If a participant is not employed on the date long-term performance shares are issued or the date annual performance shares are vested, the performance share award is forfeited, except in the case of death, retirement, total permanent disability, or certain other circumstances described in our employment policy. To the extent performance conditions are not fully attained, performance shares are forfeited.
A summary of performance share activity during fiscal year 2018 is presented below:
Number of Shares (1) | Weighted Average Grant Date Fair Value | |||
Performance Shares outstanding at July 1, 2017 | 466,778 | $11.23 | ||
Granted | 121,602 | $16.62 | ||
Vested | (401,833 | ) | $11.86 | |
Forfeited | (82,324 | ) | $16.61 | |
Performance Shares outstanding at June 30, 2018 | 104,223 | $16.52 | ||
(1) The shares granted include the maximum number of shares that may vest under performance share awards; however, the actual number of shares which vest is determined based on the satisfaction of performance conditions, and therefore may be significantly lower. The shares vested include the earned number of shares to be issued based on performance conditions, while shares forfeited include shares that will not be issued as a result of not fully attaining the maximum performance conditions.
As of June 30, 2018, there was approximately $0.6 million of unrecognized compensation cost related to performance shares, based on the latest estimated attainment of performance conditions. That cost is expected to be recognized over annual performance periods ending July 2018 through July 2019, with a weighted average vesting period of less than one year. The fair value of performance shares is based on the stock price at the date of grant, reduced by the present value of dividends normally paid over the vesting period which are not payable on outstanding performance share awards. The weighted average grant date fair value was $16.62, $11.26, and $12.12 for performance share awards granted in fiscal years 2018, 2017, and
57
2016, respectively. During fiscal years 2018, 2017, and 2016, respectively, 401,833; 294,086; and 352,924 performance shares vested at a fair value of $4.8 million, $3.6 million, and $3.6 million. Annual performance shares that were granted in July 2016 and also in July 2017 vested during fiscal year 2018, as a result of annual performance shares now vesting on June 30 rather than in July. The fair value is equal to the closing price, less the present value of annual dividends, of shares of our Common Stock on the date of the grant.
The performance shares vested represent the total number of shares vested prior to the reduction of shares withheld to satisfy tax withholding obligations. The number of shares presented in the above table, the amounts of unrecognized compensation, and the weighted average period include long-term performance shares awarded that are applicable to the fiscal year 2019 performance measurement period and will be measured at fair value when the performance targets are established.
Relative Total Shareholder Return Performance Units:
We award relative total shareholder return performance units (“RTSR”) to key officers. Under these awards, a participant will earn from 0% to 200% of the target award depending upon how the compound annual growth rate of Kimball International common stock ranks within the peer group at the end of the performance period. RTSRs are vested at the end of the performance period and are issued as common shares shortly after the performance measurement period is complete. The contractual life of the RTSRs is generally three years. If a participant is not employed on the date shares are vested, the RTSR award is forfeited, except in the case of death, retirement, total permanent disability, or certain other circumstances described in our employment policy. To the extent performance conditions are not fully attained, RTSRs are forfeited.
A summary of RTSR activity during fiscal year 2018 is presented below:
Number of Shares (1) | Weighted Average Grant Date Fair Value | |||
RTSRs outstanding at July 1, 2017 | 150,492 | $14.49 | ||
Granted | 52,334 | $20.65 | ||
Vested | (37,535 | ) | $16.25 | |
Forfeited | (34,651 | ) | $15.10 | |
RTSRs outstanding at June 30, 2018 | 130,640 | $18.94 | ||
(1) The shares granted include the maximum number of shares that may vest under RTSR awards; however, the actual number of shares which vest is determined based on the satisfaction of performance conditions, and therefore may be significantly lower. The shares vested include the earned number of shares to be issued based on performance conditions, while shares forfeited include shares that will not be issued as a result of not fully attaining the maximum performance conditions.
As of June 30, 2018, there was approximately $1.0 million of unrecognized compensation cost related to RTSRs. That cost is expected to be recognized over the vesting periods ending June 2019 through June 2020, with a weighted average vesting period of approximately one year, five months. The grant date fair value of RTSR awards was calculated using a Monte Carlo simulation. This valuation technique includes estimating the movement of stock prices and the effects of volatility, interest rates, and dividends. The weighted average grant date fair value was $20.65, $13.92, and $15.10 for RTSR awards granted in fiscal years 2018, 2017, and 2016, respectively. During fiscal years 2018 and 2017, 37,535 and 57,375, RTSRs vested at a fair value of $0.6 million and $1.0 million, respectively. The RTSR awards vested represent the total number of shares vested prior to the reduction of shares withheld to satisfy tax withholding obligations. During fiscal year 2016, no RTSRs vested.
On May 7, 2018, Robert F. Schneider informed the Board of Directors of Kimball International of his decision to retire as our Chief Executive Officer (“CEO”) and Chairman of the Board. With the announcement of his plan to retire, the Company and Mr. Schneider entered into an Amendment to Executive’s Terms of Employment (“Amendment”) which modified the terms of his RTSR awards so that a prorated portion of awards vest based on the portion of the applicable performance period that Mr. Schneider works prior to his retirement. The Amendment was determined to be a Type III “Improbable to Probable” modification, as the awards were no longer probable of vesting prior to the Amendment. Because the outstanding RTSR awards were improbable of vesting prior to the modification, the original grant date fair value is no longer used to measure compensation cost for the awards, and the cumulative expense recorded to date was reversed resulting in income of $0.3 million. The fair value of his 83,292 maximum number of RTSR shares that can be earned was re-measured on May 7, 2018, at an aggregate fair value of $1.7 million assuming full vesting of the maximum number of shares (or $1.1 million assuming Mr. Schneider retires on October 31, 2018 and receives a prorated maximum number of shares). We estimated that the vesting conditions of the modified award would be met on his expected retirement date of October 31, 2018, and we are therefore
58
recognizing his share-based compensation expense for the pro rata number of shares over a requisite service period beginning on May 7, 2018 and ending on October 31, 2018.
Restricted Share Units:
Restricted Share Units (“RSUs”) were granted to officers and key employees. Upon vesting, the outstanding number of RSUs and the value of dividends accumulated over the vesting period are converted to shares of common stock. The contractual life of the RSUs is generally three years, however certain awards have shorter or longer contractual lives in order to transition from other types of compensation or to be used as a long-term retention tool. If the employment of a holder of an RSU terminates before the RSU has vested for any reason other than death, retirement, total permanent disability, or certain other circumstances described in our employment policy, the RSU and accumulated dividends will be forfeited.
A summary of RSU activity during fiscal year 2018 is presented below:
Number of Shares | Weighted Average Grant Date Fair Value | |||
RSUs outstanding at July 1, 2017 | 196,616 | $12.00 | ||
Granted | 106,778 | $17.14 | ||
Vested | (79,315 | ) | $12.61 | |
Forfeited | (22,253 | ) | $13.04 | |
RSUs outstanding at June 30, 2018 | 201,826 | $15.10 | ||
As of June 30, 2018, there was approximately $2.0 million of unrecognized compensation cost related to nonvested RSU compensation arrangements. That cost is expected to be recognized over vesting periods ending October 2018 through June 2021, with a weighted average vesting period of one year, five months. The fair value of RSU awards is based on the stock price at the date of award. The weighted average grant date fair value was $17.14, $11.85, and $12.19 for RSU awards granted in fiscal years 2018, 2017, and 2016, respectively. During fiscal years 2018, 2017, 2016, respectively, 79,315, 86,116, and 79,461 RSUs vested at a fair value of $1.0 million, $0.8 million, and $0.7 million. The fair value is equal to the closing price of shares of our Common Stock on the date of the grant. The RSU awards vested represent the total number of shares vested prior to the reduction of shares withheld to satisfy tax withholding obligations.
Mr. Schneider’s Amendment, in conjunction with his expected retirement, modified the terms of his existing RSU awards so that a prorated portion of awards vest based on the portion of the applicable period that Mr. Schneider works prior to his retirement. The Amendment was determined to be a Type III “Improbable to Probable” modification, as the awards were no longer probable of vesting prior to the Amendment. Because the outstanding RSU awards were improbable of vesting prior to the modification, the original grant date fair value is no longer used to measure compensation cost for the awards, and the cumulative expense recorded to date was reversed resulting in income of $0.1 million. The fair value of his 38,921 RSU awards was re-measured on May 7, 2018, at an aggregate fair value of $0.7 million assuming full vesting (or $0.4 million assuming Mr. Schneider retires on October 31, 2018 and receives a prorated number of shares). We estimated that the vesting conditions of the modified award would be met on his expected retirement date of October 31, 2018, and we are therefore recognizing his share-based compensation expense for the pro rata number of shares over a requisite service period beginning on May 7, 2018 and ending on October 31, 2018.
Unrestricted Share Grants:
Unrestricted shares may be granted to employees and non-employee members of the Board of Directors as consideration for service to Kimball International. Unrestricted share grants do not have vesting periods, holding periods, restrictions on sale, or other restrictions. The fair value of unrestricted shares is based on the stock price at the date of the award. During fiscal years 2018, 2017, and 2016, respectively, we granted a total of 38,696, 48,812, and 47,471 unrestricted shares of common stock at an average grant date fair value of $18.31, $14.12, and $11.21 for a total fair value, in thousands, of $709, $689, and $532. These shares are the total number of shares granted, prior to the reduction of shares withheld to satisfy tax withholding obligations. Unrestricted shares were awarded to key employees and non-employee members of the Board of Directors as compensation for director’s fees and as a result of directors’ elections to receive unrestricted shares in lieu of cash payment. Director’s fees are expensed over the period that directors earn the compensation.
59
Note 9 Income Taxes
On December 22, 2017, the Tax Cuts and Jobs Act (“Tax Act”) was signed into law. The Tax Act reduced federal corporate income tax rates effective January 1, 2018 and changed numerous other provisions. Because Kimball International has a June 30 fiscal year-end, a lower corporate federal income tax rate was being phased in, resulting in a U.S. federal statutory tax rate of 28.1% for our fiscal year ending June 30, 2018. The statutory federal tax rate will be 21% in subsequent fiscal years. Fiscal year 2018 included approximately $3.3 million in reduced income tax expense to reflect federal taxes on current year taxable income at the lower blended effective tax rate, partially offset by a discrete tax impact of $1.8 million in additional expense as a result of applying the new lower federal income tax rates to our net tax assets.
The changes included in the Tax Act are broad and complex, due to, among other things, changes in interpretations of the Tax Act, any legislative action to address questions that arise because of the Tax Act, any changes in accounting standards for income taxes or related interpretations in response to the Tax Act. The Securities and Exchange Commission has issued rules that allow for a measurement period of up to one year after the enactment date of the Tax Act to finalize the recording of the related tax impacts. We have finalized recording of the tax impacts of June 30, 2018.
Deferred income taxes reflect the net tax effect of temporary differences between the carrying amounts of assets and liabilities for financial reporting purposes and the amounts used for income tax purposes. Income tax benefits associated with net operating losses of, in thousands, $2,179 expire from fiscal year 2019 to 2036. Income tax benefits associated with tax credit carryforwards of, in thousands, $2,168, expire from fiscal year 2023 to 2027. Valuation allowances were provided as of June 30, 2018 for deferred tax assets relating to state net operating losses of, in thousands, $534, and for foreign tax credits of, in thousands, $326, that we currently believe are more likely than not to remain unrealized in the future. In all periods presented, the change in the valuation allowance is reported as a component of income tax expense.
The components of the deferred tax assets and liabilities as of June 30, 2018 and 2017, were as follows:
(Amounts in Thousands) | 2018 | 2017 | |||||
Deferred Tax Assets: | |||||||
Receivables | $ | 708 | $ | 1,152 | |||
Inventory | 428 | 819 | |||||
Employee benefits | 161 | 563 | |||||
Deferred compensation | 4,061 | 13,254 | |||||
Other current liabilities | 70 | 446 | |||||
Warranty reserve | 591 | 775 | |||||
Tax credit carryforwards | 2,168 | 1,982 | |||||
Sale-leaseback | — | 1,507 | |||||
Restructuring | — | 31 | |||||
Goodwill | 98 | — | |||||
Net operating loss carryforward | 2,179 | 2,256 | |||||
Miscellaneous | 2,135 | 2,251 | |||||
Valuation Allowance | (860 | ) | (643 | ) | |||
Total asset | $ | 11,739 | $ | 24,393 | |||
Deferred Tax Liabilities: | |||||||
Property and equipment | $ | 6,062 | $ | 9,203 | |||
Miscellaneous | 761 | 703 | |||||
Total liability | $ | 6,823 | $ | 9,906 | |||
Net Deferred Tax Assets | $ | 4,916 | $ | 14,487 | |||
60
The provision for income taxes is composed of the following items:
Year Ended June 30 | |||||||||||
(Amounts in Thousands) | 2018 | 2017 | 2016 | ||||||||
Currently Payable: | |||||||||||
Federal | $ | 6,592 | $ | 19,780 | $ | 7,548 | |||||
State | 1,636 | 2,318 | 1,184 | ||||||||
Total current | $ | 8,228 | $ | 22,098 | $ | 8,732 | |||||
Deferred Taxes: | |||||||||||
Federal | $ | 8,236 | $ | (1,761 | ) | $ | 3,081 | ||||
State | 1,422 | 175 | 421 | ||||||||
Total deferred | $ | 9,658 | $ | (1,586 | ) | $ | 3,502 | ||||
Total provision for income taxes | $ | 17,886 | $ | 20,512 | $ | 12,234 | |||||
A reconciliation of the statutory U.S. income tax rate to Kimball International’s effective income tax rate follows:
Year Ended June 30 | ||||||||||||||||||||
2018 | 2017 | 2016 | ||||||||||||||||||
(Amounts in Thousands) | Amount | % | Amount | % | Amount | % | ||||||||||||||
Tax provision computed at U.S. federal statutory rate | $ | 14,703 | 28.1 | % | $ | 20,306 | 35.0 | % | $ | 11,686 | 35.0 | % | ||||||||
State income taxes, net of federal income tax benefit | 2,198 | 4.2 | 1,620 | 2.8 | 1,043 | 3.1 | ||||||||||||||
Domestic manufacturing deduction | (617 | ) | (1.2 | ) | (1,495 | ) | (2.6 | ) | (286 | ) | (0.9 | ) | ||||||||
Research credit | (180 | ) | (0.3 | ) | (218 | ) | (0.4 | ) | (346 | ) | (1.0 | ) | ||||||||
Remeasurement of tax assets and liabilities related to the Tax Act | 1,839 | 3.5 | — | — | — | — | ||||||||||||||
Other - net | (57 | ) | (0.1 | ) | 299 | 0.6 | 137 | 0.4 | ||||||||||||
Total provision for income taxes | $ | 17,886 | 34.2 | % | $ | 20,512 | 35.4 | % | $ | 12,234 | 36.6 | % | ||||||||
Net cash payments for income taxes were, in thousands, $13,937, $20,881, and $7,963 in fiscal years 2018, 2017, and 2016, respectively.
Changes in the unrecognized tax benefit, excluding accrued interest and penalties, during fiscal years 2018, 2017, and 2016 were as follows:
(Amounts in Thousands) | 2018 | 2017 | 2016 | ||||||||
Beginning balance - July 1 | $ | 1,888 | $ | 2,077 | $ | 1,920 | |||||
Tax positions related to prior fiscal years: | |||||||||||
Additions | 222 | 213 | 301 | ||||||||
Reductions | (1,030 | ) | (581 | ) | (43 | ) | |||||
Tax positions related to current fiscal year: | |||||||||||
Additions | — | 391 | — | ||||||||
Reductions | — | — | — | ||||||||
Settlements | — | — | — | ||||||||
Lapses in statute of limitations | (91 | ) | (212 | ) | (101 | ) | |||||
Ending balance - June 30 | $ | 989 | $ | 1,888 | $ | 2,077 | |||||
Portion that, if recognized, would reduce tax expense and effective tax rate | $ | 832 | $ | 1,377 | $ | 1,407 | |||||
61
We recognize interest and penalties related to unrecognized tax benefits in the Provision for Income Taxes line of the Consolidated Statements of Income. Amounts accrued for interest and penalties were as follows:
As of June 30 | |||||||||||
(Amounts in Thousands) | 2018 | 2017 | 2016 | ||||||||
Accrued Interest and Penalties: | |||||||||||
Interest | $ | 70 | $ | 84 | $ | 102 | |||||
Penalties | $ | 98 | $ | 102 | $ | 108 | |||||
Interest and penalties income (expense) recognized for fiscal years 2018, 2017, and 2016 were, in thousands, $11, $23, and $(1), respectively.
Kimball International, or one of its wholly-owned subsidiaries, files U.S. federal income tax returns and income tax returns in various state and local jurisdictions. We are no longer subject to any significant U.S. federal tax examinations by tax authorities for years before fiscal year 2015, and to various state and local income tax examinations by tax authorities for years before 2014. We do not expect the change in the amount of unrecognized tax benefits in the next 12 months to have a significant impact on our results of operations or financial position.
We had no net tax impact related to the one-time transition tax on the deemed repatriation of undistributed foreign earnings as required by the Tax Act because we utilized available foreign tax credits to offset the transition tax.
We consider the earnings of certain non-U.S. subsidiaries to be indefinitely invested outside the United States on the basis of estimates that future domestic cash generation will be sufficient to meet future domestic cash needs. We have not recorded a deferred tax liability of approximately, in thousands, $191 related to the U.S. federal and state income taxes and foreign withholding taxes on approximately, in thousands, $589 of undistributed earnings of foreign subsidiaries indefinitely invested outside the United States. Should we decide to repatriate the foreign earnings, we would need to adjust our income tax provision in the period we determined that the earnings will no longer be indefinitely invested outside the United States.
Note 10 Fair Value
We categorize assets and liabilities measured at fair value into three levels based upon the assumptions (inputs) used to price the assets or liabilities. Level 1 provides the most reliable measure of fair value, whereas level 3 generally requires significant management judgment. The three levels are defined as follows:
• | Level 1: Unadjusted quoted prices in active markets for identical assets and liabilities. |
• | Level 2: Observable inputs other than those included in level 1. For example, quoted prices for similar assets or liabilities in active markets or quoted prices for identical assets or liabilities in inactive markets. |
• | Level 3: Unobservable inputs reflecting management’s own assumptions about the inputs used in pricing the asset or liability. |
Our policy is to recognize transfers between these levels as of the end of each quarterly reporting period. There were no transfers between these levels during fiscal years 2018 and 2017.
We hold a total investment of $2.0 million in a privately-held company, consisting of $0.5 million in non-marketable equity securities and $1.5 million in stock warrants. The investment in non-marketable equity securities is classified as a level 3 financial asset and is accounted for using the cost method, as explained in the Financial Instruments Not Carried At Fair Value section below. The investment in stock warrants is also classified as a level 3 financial asset and is accounted for as a derivative instrument valued on a recurring basis, as explained in the Financial Instruments Recognized at Fair Value section below. See Note 12 - Investments of Notes to Consolidated Financial Statements for further information regarding the investment in non-marketable equity securities, and Note 11 - Derivative Instruments of Notes to Consolidated Financial Statements for further information regarding the investment in stock warrants. No other purchases or sales of level 3 assets occurred during the fiscal years ended June 30, 2018 and 2017.
In connection with the acquisition of D’style, we valued long-lived and intangible assets at their estimated fair values at the acquisition date. The fair value estimates for intangible assets were based upon assumptions related to the future cash flows and discount rates utilizing currently available information, and in some cases, valuation results from independent valuation specialists (Level 3 determination of fair value). Subsequent to the acquisition, we determine the fair value of our long-lived and intangible assets on a non-recurring basis in connection with our periodic evaluations of such assets for potential impairment and record impairment charges when such fair value estimates are lower than the carrying values of the assets. As part of the acquisition, contingent earn-out payments up to $2.2 million may be paid based upon fiscal year 2018 and 2019
62
D’style, Inc. operating income compared to a predetermined target for each fiscal year. As of the November 6, 2017 acquisition date, the fair value of the earn-out liability was $1.7 million. The liability is carried at fair value and is classified in Level 3 of the fair value hierarchy. During fiscal year ended June 30, 2018, the fair value of the contingent earn-out liability was adjusted to $1.1 million, resulting in a $0.6 million pre-tax gain, recognized as $0.8 million pre-tax gain included in Selling and Administrative Expenses, offset in part by $0.2 million of Interest Expense attributable to an adjustment of the contingent earn-out liability that will be based upon fiscal year 2018 and 2019 D’style, Inc. operating income compared to a predetermined target for each fiscal year.
Financial Instruments Recognized at Fair Value:
The following methods and assumptions were used to measure fair value:
Financial Instrument | Level | Valuation Technique/Inputs Used | ||
Cash Equivalents: Money market funds | 1 | Market - Quoted market prices. | ||
Cash Equivalents: Commercial Paper | 2 | Market - Based on market data which use evaluated pricing models and incorporate available trade, bid, and other market information. | ||
Available-for-sale securities: Secondary market certificates of deposit | 2 | Market - Based on market data which use evaluated pricing models and incorporate available trade, bid, and other market information. | ||
Available-for-sale securities: Municipal bonds | 2 | Market - Based on market data which use evaluated pricing models and incorporate available trade, bid, and other market information. | ||
Available-for-sale securities: U.S. Treasury and federal agencies | 2 | Market - Based on market data which use evaluated pricing models and incorporate available trade, bid, and other market information. | ||
Derivative Assets: Stock warrants | 3 | Market - The privately-held company is currently in an early stage of start-up. The pricing of recent purchases or sales of the investment are considered, if any, as well as positive and negative qualitative evidence, in the assessment of fair value. | ||
Trading securities: Mutual funds held in nonqualified SERP | 1 | Market - Quoted market prices | ||
Derivative Liability: Foreign exchange contracts | 2 | Market - Based on observable market inputs using standard calculations, such as time value, forward interest rate yield curves, and current spot rates adjusted for Kimball International's non-performance risk. | ||
Contingent earn-out liability | 3 | Income - Based on a valuation model that measures the present value of the probable cash payments based upon the forecasted operating performance of the acquisition and a discount rate that captures the risk associated with the liability. | ||
63
Recurring Fair Value Measurements:
As of June 30, 2018 and June 30, 2017, the fair values of financial assets and liabilities that are measured at fair value on a recurring basis using the market or income approach are categorized as follows:
(Amounts in Thousands) | June 30, 2018 | ||||||||||||||
Level 1 | Level 2 | Level 3 | Total | ||||||||||||
Assets | |||||||||||||||
Cash equivalents: Money market funds | $ | 24,407 | $ | — | $ | — | $ | 24,407 | |||||||
Cash equivalents: Commercial paper | — | 25,918 | — | 25,918 | |||||||||||
Available-for-sale securities: Secondary market certificates of deposit | — | 11,850 | — | 11,850 | |||||||||||
Available-for-sale securities: Municipal bonds | — | 16,508 | — | 16,508 | |||||||||||
Available-for-sale securities: U.S. Treasury and federal agencies | — | 6,249 | — | 6,249 | |||||||||||
Derivatives: Stock warrants | — | — | 1,500 | 1,500 | |||||||||||
Trading Securities: Mutual funds in nonqualified SERP | 12,114 | — | — | 12,114 | |||||||||||
Total assets at fair value | $ | 36,521 | $ | 60,525 | $ | 1,500 | $ | 98,546 | |||||||
Liabilities | |||||||||||||||
Derivatives: Foreign exchange contracts | $ | — | $ | 10 | $ | — | $ | 10 | |||||||
Contingent earn-out liability | — | — | 1,056 | 1,056 | |||||||||||
Total liabilities at fair value | $ | — | $ | 10 | $ | 1,056 | $ | 1,066 | |||||||
(Amounts in Thousands) | June 30, 2017 | ||||||||||||||
Level 1 | Level 2 | Level 3 | Total | ||||||||||||
Assets | |||||||||||||||
Cash equivalents: Money market funds | $ | 30,383 | $ | — | $ | — | $ | 30,383 | |||||||
Cash equivalents: Commercial paper | — | 29,102 | — | 29,102 | |||||||||||
Available-for-sale securities: Secondary market certificates of deposit | — | 10,336 | — | 10,336 | |||||||||||
Available-for-sale securities: Municipal bonds | — | 22,154 | — | 22,154 | |||||||||||
Available-for-sale securities: U.S. Treasury and federal agencies | — | 3,193 | — | 3,193 | |||||||||||
Derivatives: Stock warrants | — | — | 1,500 | 1,500 | |||||||||||
Trading Securities: Mutual funds in nonqualified SERP | 11,194 | — | — | 11,194 | |||||||||||
Total assets at fair value | $ | 41,577 | $ | 64,785 | $ | 1,500 | $ | 107,862 | |||||||
The nonqualified supplemental employee retirement plan (“SERP”) assets consist primarily of equity funds, balanced funds, a bond fund, and a money market fund. The SERP investment assets are offset by a SERP liability which represents our obligation to distribute SERP funds to participants. See Note 12 - Investments of Notes to Consolidated Financial Statements for further information regarding the SERP.
Non-Recurring Fair Value Measurements:
Certain assets are measured at fair value on a non-recurring basis. These assets are not measured at fair value on an ongoing basis but are subject to fair value adjustments when events or circumstances indicate a significant adverse effect on the fair value of the asset. Assets that are written down to fair value when impaired are not subsequently adjusted to fair value unless further impairment occurs.
Non-recurring fair value adjustment | Level | Valuation Technique/Inputs Used | ||
Impairment of assets held for sale (transportation equipment) | 3 | Market - Quoted market prices for similar assets sold, adjusted for features specific to the asset | ||
64
During the fourth quarter of fiscal year 2017, we classified our fleet of over-the-road tractors and trailers as held for sale and recognized impairment of $0.2 million as the book value exceeded the $4.2 million fair market value less selling costs.
Financial Instruments Not Carried At Fair Value:
Financial instruments that are not reflected in the Consolidated Balance Sheets at fair value that have carrying amounts which approximate fair value include the following:
Financial Instrument | Level | Valuation Technique/Inputs Used | ||
Notes receivable | 2 | Market - Price approximated based on the assumed collection of receivables in the normal course of business, taking into account the customer’s non-performance risk | ||
Non-marketable equity securities (cost-method investments, which carry shares at cost except in the event of impairment) | 3 | Cost Method, with impairment recognized using a market-based valuation technique - See the explanation below the table regarding the method used to periodically estimate the fair value of cost-method investments. | ||
Long-term debt (carried at amortized cost) | 3 | Income - Price estimated using a discounted cash flow analysis based on quoted long-term debt market rates, taking into account Kimball International’s non-performance risk | ||
The investment in non-marketable equity securities is accounted for using the cost method because we do not have the ability to exercise significant influence over the operating and financial policies of the investee. On a periodic basis, but no less frequently than quarterly, these investments are assessed for impairment when there are events or changes in circumstances that may have a significant adverse effect on the fair value of the investment. If a significant adverse effect on the fair value of the investment were to occur and was deemed to be other-than-temporary, the fair value of the investment would be estimated, and the amount by which the carrying value of the cost-method investment exceeds its fair value would be recorded as an impairment loss.
The carrying value of our cash deposit accounts, trade accounts receivable, trade accounts payable, and dividends payable approximates fair value due to the relatively short maturity and immaterial non-performance risk.
Note 11 Derivative Instruments
Foreign Exchange Contracts:
We operate internationally and are therefore exposed to foreign currency exchange rate fluctuations in the normal course of our business.
As of June 30, 2018, we had outstanding foreign exchange contracts to hedge currencies against the U.S. dollar in the aggregate notional amount of $0.7 million. The notional amount is an indicator of the volume of derivative activities but is not an indicator of the potential gain or loss on the derivatives.
Based on fair values as of June 30, 2018, we estimate that approximately $10 thousand of pre-tax derivative loss deferred in Accumulated Other Comprehensive Income (Loss) will be reclassified into earnings, along with the earnings effects of related forecasted transactions, within the fiscal year ending June 30, 2019. Losses on foreign exchange contracts are generally offset by gains in operating costs in the income statement when the underlying hedged transaction is recognized in earnings. Because gains or losses on foreign exchange contracts fluctuate partially based on currency spot rates, the future effect on earnings of the cash flow hedges alone is not determinable, but in conjunction with the underlying hedged transactions, the result is expected to be a decline in currency risk. The maximum length of time we had hedged our exposure to the variability in future cash flows was 4 months as of June 30, 2018.
Stock Warrants:
We hold a total investment of $2.0 million in a privately-held company, including $1.5 million in stock warrants purchased during fiscal year 2017. The investment in stock warrants is accounted for as a derivative instrument and is included in the Other Assets line of the Consolidated Balance Sheets. The stock warrants are convertible into equity shares of the privately-held company upon achieving certain milestones. The value of the stock warrants will fluctuate primarily in relation to the value of the privately-held company's underlying securities, either providing an appreciation in value or potentially expiring with no value. During the year ended June 30, 2018, the change in fair value of the stock warrants was not significant. See Note 10 - Fair Value of Notes to Consolidated Financial Statements for more information on the valuation of these securities.
65
Information on the location and amounts of derivative fair values in the Consolidated Balance Sheets are presented below.
Fair Values of Derivative Instruments on the Consolidated Balance Sheets | ||||||||||||||||||||
Asset Derivatives | Liability Derivatives | |||||||||||||||||||
Fair Value As of | Fair Value As of | |||||||||||||||||||
(Amounts in Thousands) | Balance Sheet Location | June 30 2018 | June 30 2017 | Balance Sheet Location | June 30 2018 | June 30 2017 | ||||||||||||||
Derivatives designated as hedging instruments: | ||||||||||||||||||||
Foreign exchange contracts | Prepaid expenses and other current assets | $ | — | $ | — | Accrued expenses | $ | 10 | $ | — | ||||||||||
Derivatives not designated as hedging instruments: | ||||||||||||||||||||
Stock warrants | Other Assets | $ | 1,500 | $ | 1,500 | |||||||||||||||
Total derivatives | $ | 1,500 | $ | 1,500 | $ | 10 | $ | — | ||||||||||||
Note 12 Investments
Investment Portfolio:
Our investment portfolio consists of municipal bonds, certificates of deposit purchased in the secondary market, and U.S. Treasury and federal agency securities. Municipal bonds include general obligation bonds and revenue bonds, some of which are pre-refunded. U.S. Treasury securities represent Treasury Bills and Notes of the U.S. government. Federal agency securities represent debt securities of a U.S. government sponsored agency, and certain of these securities are callable. Our investment policy dictates that municipal bonds, U.S. Treasury and federal agency securities must be investment grade quality. Our secondary market certificates of deposit are classified as investment securities, being purchased in the secondary market through a broker and available to be sold in the secondary market. All certificates of deposit are FDIC insured.
Our investment portfolio is available for use in current operations, therefore investments are recorded within Current Assets in the Consolidated Balance Sheets. The contractual maturities of our investment portfolio were as follows (maturity dates for municipal bonds are based on pre-refunded dates and maturity dates for government agency securities are based on the first available call date, if applicable):
June 30, 2018 | |||||||||||
(Amounts in Thousands) | Certificates of Deposit | Municipal Bonds | U.S. Treasury and Federal Agencies | ||||||||
Within one year | $ | 9,292 | $ | 14,502 | $ | 2,196 | |||||
After one year through two years | 2,558 | 2,006 | 4,053 | ||||||||
Total Fair Value | $ | 11,850 | $ | 16,508 | $ | 6,249 | |||||
All investments are classified as available-for-sale securities which are recorded at fair value. See Note 10 - Fair Value of Notes to Consolidated Financial Statements for more information on the fair value of available-for-sale securities. The amortized cost basis reflects the original purchase price, with discounts and premiums amortized over the life of the available-for-sale securities. Unrealized losses on available-for-sale securities are recognized in earnings when there is intent to sell or it is likely to be required to sell before recovery of the loss, or when the available-for-sale securities have incurred a credit loss. Otherwise, unrealized gains and losses are recorded net of the tax-related effect as a component of Shareowners’ Equity.
66
June 30, 2018 | |||||||||||
(Amounts in Thousands) | Certificates of Deposit | Municipal Bonds | U.S. Treasury and Federal Agencies | ||||||||
Amortized cost basis | $ | 11,850 | $ | 16,532 | $ | 6,266 | |||||
Unrealized holding gains | — | — | — | ||||||||
Unrealized holding losses | — | (24 | ) | (17 | ) | ||||||
Fair Value | $ | 11,850 | $ | 16,508 | $ | 6,249 | |||||
June 30, 2017 | |||||||||||
(Amounts in Thousands) | Certificates of Deposit | Municipal Bonds | U.S. Treasury and Federal Agencies | ||||||||
Amortized cost basis | $ | 10,334 | $ | 22,183 | $ | 3,200 | |||||
Unrealized holding gains | 2 | — | — | ||||||||
Unrealized holding losses | — | (29 | ) | (7 | ) | ||||||
Fair Value | $ | 10,336 | $ | 22,154 | $ | 3,193 | |||||
An immaterial amount of investments were in a continuous unrealized loss position for greater than 12 months as of June 30, 2018. There was an immaterial amount of realized losses as a result of sales during fiscal year 2018, and there were no realized gains or losses during fiscal year 2017.
Supplemental Employee Retirement Plan Investments:
We maintain a self-directed supplemental employee retirement plan (“SERP”) in which executive employees are eligible to participate. The SERP utilizes a rabbi trust, and therefore assets in the SERP portfolio are subject to creditor claims in the event of bankruptcy. We recognize SERP investment assets on the Consolidated Balance Sheets at current fair value. A SERP liability of the same amount is recorded on the Consolidated Balance Sheets representing an obligation to distribute SERP funds to participants. The SERP investment assets are classified as trading, and accordingly, realized and unrealized gains and losses are recognized in income in the Other Income (Expense) category. Adjustments made to revalue the SERP liability are also recognized in income as selling and administrative expenses and offset valuation adjustments on SERP investment assets. Net unrealized holding gains (losses) for securities held at June 30, 2018, 2017, and 2016 were, in thousands, $585, $223, and $(484), respectively. SERP asset and liability balances were as follows:
June 30 | |||||||
(Amounts in Thousands) | 2018 | 2017 | |||||
SERP investments - current asset | $ | 3,868 | $ | 1,259 | |||
SERP investments - other long-term asset | 8,246 | 9,935 | |||||
Total SERP investments | $ | 12,114 | $ | 11,194 | |||
SERP obligation - current liability | $ | 3,868 | $ | 1,259 | |||
SERP obligation - other long-term liability | 8,246 | 9,935 | |||||
Total SERP obligation | $ | 12,114 | $ | 11,194 | |||
Non-marketable equity securities:
We hold a total investment of $2.0 million in a privately-held company, including $0.5 million in non-marketable equity securities purchased during fiscal year 2016. The investment in non-marketable equity securities is included in the Other Assets line of the Consolidated Balance Sheets. See Note 10 - Fair Value of Notes to Consolidated Financial Statements for more information on the valuation of these securities. We do not hold a majority voting interest and are not the variable interest primary beneficiary of the privately-held company, thus consolidation is not required.
67
Note 13 Accrued Expenses
Accrued expenses consisted of:
June 30 | |||||||
(Amounts in Thousands) | 2018 | 2017 | |||||
Compensation | $ | 22,045 | $ | 22,815 | |||
Selling | 7,134 | 6,704 | |||||
Employer retirement contribution | 5,605 | 6,196 | |||||
Taxes | 3,598 | 2,568 | |||||
Insurance | 4,210 | 4,382 | |||||
Restructuring | — | 80 | |||||
Rent | 2,997 | 2,944 | |||||
Other expenses | 3,705 | 3,329 | |||||
Total accrued expenses | $ | 49,294 | $ | 49,018 | |||
Note 14 Geographic Information
The following geographic area data includes net sales based on the location where title transfers.
Year Ended June 30 | |||||||||||
(Amounts in Thousands) | 2018 | 2017 | 2016 | ||||||||
Net Sales: | |||||||||||
United States | $ | 672,918 | $ | 658,474 | $ | 622,096 | |||||
Foreign | 12,682 | 11,460 | 13,006 | ||||||||
Total Net Sales | $ | 685,600 | $ | 669,934 | $ | 635,102 | |||||
Substantially all long-lived assets were located in the United States for each of the three fiscal years ended June 30, 2018. Long-lived assets include property and equipment and other long-term assets such as software.
Note 15 Earnings Per Share
Basic earnings per share are based on the weighted average number of shares outstanding during the period. Diluted earnings per share are based on the weighted average number of shares outstanding plus the assumed issuance of common shares for all potentially dilutive securities.
Year Ended June 30 | |||||||||||
(Amounts in Thousands, Except for Per Share Data) | 2018 | 2017 | 2016 | ||||||||
Net Income | $ | 34,439 | $ | 37,506 | $ | 21,156 | |||||
Average Shares Outstanding for Basic EPS Calculation | 37,314 | 37,334 | 37,462 | ||||||||
Dilutive Effect of Average Outstanding Compensation Awards | 180 | 499 | 390 | ||||||||
Average Shares Outstanding for Diluted EPS Calculation | 37,494 | 37,833 | 37,852 | ||||||||
Basic Earnings Per Share | $ | 0.92 | $ | 1.00 | $ | 0.56 | |||||
Diluted Earnings Per Share | $ | 0.92 | $ | 0.99 | $ | 0.56 | |||||
68
Note 16 Accumulated Other Comprehensive Income
During fiscal year 2018 and 2017, the changes in the balances of each component of Accumulated Other Comprehensive Income, net of tax, were as follows:
(Amounts in Thousands) | Unrealized Investment Gain (Loss) | Postemployment Benefits Net Actuarial Gain (Loss) | Derivative Gain (Loss) | Accumulated Other Comprehensive Income | |||||||||||
Balance at June 30, 2016 | $ | — | $ | 1,311 | $ | — | $ | 1,311 | |||||||
Other comprehensive income (loss) before reclassifications | (21 | ) | 114 | — | 93 | ||||||||||
Reclassification to (earnings) loss | — | (289 | ) | — | (289 | ) | |||||||||
Net current-period other comprehensive income (loss) | (21 | ) | (175 | ) | — | (196 | ) | ||||||||
Balance at June 30, 2017 | $ | (21 | ) | $ | 1,136 | $ | — | $ | 1,115 | ||||||
Other comprehensive income (loss) before reclassifications | (8 | ) | 599 | (7 | ) | 584 | |||||||||
Reclassification to (earnings) loss | 3 | (176 | ) | — | (173 | ) | |||||||||
Net current-period other comprehensive income (loss) | (5 | ) | 423 | (7 | ) | 411 | |||||||||
Reclassification of change in enacted income tax rate to retained earnings | $ | (5 | ) | $ | 295 | $ | — | $ | 290 | ||||||
Balance at June 30, 2018 | $ | (31 | ) | $ | 1,854 | $ | (7 | ) | $ | 1,816 | |||||
The following reclassifications were made from Accumulated Other Comprehensive Income to the Consolidated Statements of Income:
Reclassifications from Accumulated Other Comprehensive Income | Fiscal Year Ended | Affected Line Item in the Consolidated Statements of Income | ||||||||
June 30, | ||||||||||
(Amounts in Thousands) | 2018 | 2017 | ||||||||
Realized Investment Gain (Loss) on available-for-sale securities (1) | $ | (4 | ) | $ | — | Non-operating income (expense), net | ||||
1 | — | Benefit (Provision) for Income Taxes | ||||||||
$ | (3 | ) | $ | — | Net Income | |||||
Postemployment Benefits Amortization of Actuarial Gain (2) | $ | 168 | $ | 301 | Cost of Sales | |||||
92 | 172 | Selling and Administrative Expenses | ||||||||
(84 | ) | (184 | ) | Benefit (Provision) for Income Taxes | ||||||
$ | 176 | $ | 289 | Net Income | ||||||
Total Reclassifications for the Period | $ | 173 | $ | 289 | Net Income | |||||
Amounts in parentheses indicate reductions to income.
(1) See Note 12 - Investments of Notes to Consolidated Financial Statements for further information on available-for-sale securities.
(2) See Note 7 - Employee Benefit Plans of Notes to Consolidated Financial Statements for further information on postemployment benefit plans.
69
Note 17 Restructuring
During fiscal year 2018, we recognized no restructuring expense as the restructuring plan was complete. We recognized a pre-tax restructuring gain of $1.8 million in fiscal year 2017 which included a gain on the sale of the Post Falls facility. In fiscal year 2016, we recognized pre-tax restructuring expense $7.3 million. As of June 30, 2018, we had no remaining restructuring liability as the June 30, 2017 balance of less than $0.1 million was paid during fiscal year 2018.
Capacity Utilization Restructuring Plan:
In November 2014, we announced a capacity utilization restructuring plan which included the consolidation of our metal fabrication production from an operation located in Post Falls, Idaho, into existing production facilities in Indiana, and the reduction of our Company plane fleet from two jets to one.
The transfer of work from our Idaho facility involved the start-up of metal fabrication capabilities in an existing Company-owned facility, along with the transfer of certain assembly operations into two additional existing Company-owned facilities, all located in southern Indiana. All production was transferred out of the Idaho facility as of March 2016, after which work continued during fiscal year 2017 in the Indiana facilities to train employees, ramp up production and eliminate the inefficiencies associated with the start-up of production in these facilities. The improvement of customer delivery, supply chain dynamics, and reduction of transportation costs generated pre-tax annual savings of approximately $5 million beginning in our fiscal year 2017. In addition, during fiscal year 2017, we sold our Post Falls, Idaho facility and land which was classified as held for sale. Therefore, fiscal year 2017 restructuring includes a pre-tax gain of $2.1 million as the $12.0 million selling price net of selling costs exceeded the book value of the facility and land.
The restructuring plan is complete with pre-tax restructuring totaling $10.8 million. Excluding the pre-tax gain from the sale of the Idaho facility of $2.1 million, the restructuring expense consisted of $4.9 million of transition, training, and other employee costs, $6.9 million of plant closure and other exit costs, and $1.1 million of non-cash asset impairment. Approximately 91% of the total restructuring expense was cash expense.
We utilized available market prices and management estimates to determine the fair value of impaired fixed assets. Restructuring is included in the Restructuring (Gain) Expense line item on our Consolidated Statements of Income.
Note 18 Variable Interest Entities
Our involvement with variable interest entities (“VIEs”) is limited to situations in which we are not the primary beneficiary as we lack the power to direct the activities that most significantly impact the VIE’s economic performance. Thus, consolidation is not required. Our involvement with VIEs consists of an investment in a privately-held company consisting of non-marketable equity securities and stock warrants, and notes receivable related to independent dealership financing.
The non-marketable equity securities and stock warrants were valued at $0.5 million and $1.5 million, respectively, at both June 30, 2018 and June 30, 2017 and were included in the Other Assets line of the Consolidated Balance Sheets. For more information related to our investment in the privately-held company, see Note 10 - Fair Value of Notes to Consolidated Financial Statements.
The carrying value of the notes receivable for independent dealership financing were $0.6 million, net of a $0.1 million allowance, and $0.4 million as of June 30, 2018 and June 30, 2017, respectively, and were included on the Receivables and Other Assets lines of our Consolidated Balance Sheets.
We have no obligation to provide additional funding to the VIEs, and thus our exposure and risk of loss related to the VIEs is limited to the carrying value of the investment and notes receivable. Financial support provided by Kimball International to the VIEs was limited to the items discussed above during the fiscal year ended June 30, 2018.
70
Note 19 Credit Quality and Allowance for Credit Losses of Notes Receivable
We monitor credit quality and associated risks of notes receivable on an individual basis based on criteria such as financial stability of the party and collection experience in conjunction with general economic and market conditions. As of June 30, 2018 and 2017, we had no material past due outstanding notes receivable.
As of June 30, 2018 | As of June 30, 2017 | ||||||||||||||||||||||
(Amounts in Thousands) | Unpaid Balance | Related Allowance | Receivable Net of Allowance | Unpaid Balance | Related Allowance | Receivable Net of Allowance | |||||||||||||||||
Independent Dealership Financing | $ | 666 | $ | 50 | $ | 616 | $ | 433 | $ | — | $ | 433 | |||||||||||
Other Notes Receivable | 183 | 183 | — | 138 | 126 | 12 | |||||||||||||||||
Total | $ | 849 | $ | 233 | $ | 616 | $ | 571 | $ | 126 | $ | 445 | |||||||||||
Note 20 Quarterly Financial Information (Unaudited)
Three Months Ended | |||||||||||||||
(Amounts in Thousands, Except for Per Share Data) | September 30 | December 31 | March 31 | June 30 | |||||||||||
Fiscal Year 2018: | |||||||||||||||
Net Sales | $ | 169,517 | $ | 173,674 | $ | 157,897 | $ | 184,512 | |||||||
Gross Profit | 59,589 | 53,936 | 47,755 | 60,166 | |||||||||||
Net Income | 10,957 | 7,378 | 5,850 | 10,254 | |||||||||||
Basic Earnings Per Share | $ | 0.29 | $ | 0.20 | $ | 0.16 | $ | 0.28 | |||||||
Diluted Earnings Per Share | $ | 0.29 | $ | 0.20 | $ | 0.16 | $ | 0.28 | |||||||
Fiscal Year 2017: | |||||||||||||||
Net Sales | $ | 174,996 | $ | 169,887 | $ | 153,068 | $ | 171,983 | |||||||
Gross Profit | 58,687 | 55,758 | 51,052 | 57,808 | |||||||||||
Restructuring (Gain) Expense | (1,832 | ) | — | — | — | ||||||||||
Net Income | 10,998 | 8,717 | 7,231 | 10,560 | |||||||||||
Basic Earnings Per Share | $ | 0.29 | $ | 0.23 | $ | 0.19 | $ | 0.28 | |||||||
Diluted Earnings Per Share | $ | 0.29 | $ | 0.23 | $ | 0.19 | $ | 0.28 | |||||||
Item 9 - Changes in and Disagreements With Accountants on Accounting and Financial Disclosure
None.
Item 9A - Controls and Procedures
(a) Evaluation of disclosure controls and procedures.
We maintain controls and procedures designed to ensure that information required to be disclosed in the reports that we file or submit under the Securities Exchange Act of 1934 is recorded, processed, summarized, and reported within the time periods specified in the rules and forms of the Securities and Exchange Commission and that such information is accumulated and communicated to our management, including our Chief Executive Officer and Chief Financial Officer, as appropriate, to allow timely decisions regarding required disclosure. Based upon their evaluation of those controls and procedures performed as of June 30, 2018, our Chief Executive Officer and Chief Financial Officer concluded that our disclosure controls and procedures were effective.
(b) Management’s report on internal control over financial reporting.
Pursuant to Section 404 of the Sarbanes-Oxley Act of 2002 and the rules and regulations adopted pursuant thereto, we included a report of management’s assessment of the effectiveness of our internal control over financial reporting as part of this report. The effectiveness of our internal control over financial reporting as of June 30, 2018 has been audited by our independent registered public accounting firm. Management’s report and the independent registered public accounting firm’s attestation report are included in our Consolidated Financial Statements under the captions
71
entitled “Management's Report on Internal Control Over Financial Reporting” and “Report of Independent Registered Public Accounting Firm” and are incorporated herein by reference.
(c) Changes in internal control over financial reporting.
There have been no changes in our internal control over financial reporting that occurred during the quarter ended June 30, 2018 that have materially affected, or that are reasonably likely to materially affect, our internal control over financial reporting.
Item 9B - Other Information
None.
PART III
Item 10 - Directors, Executive Officers and Corporate Governance
Directors
The information required by this item with respect to Directors is incorporated by reference to the material contained in our Proxy Statement for our annual meeting of shareowners to be held October 30, 2018 under the captions “Proposal No. 1 - Election of Directors” and “Information Concerning the Board of Directors and Committees.”
Committees
The information required by this item with respect to the Audit Committee and its financial experts and with respect to the Compensation and Governance Committee’s responsibility for establishing procedures by which shareowners may recommend nominees to the Board of Directors is incorporated by reference to the material contained in our Proxy Statement for our annual meeting of shareowners to be held October 30, 2018 under the caption “Information Concerning the Board of Directors and Committees.”
Executive Officers of the Registrant
The information required by this item with respect to Executive Officers of the Registrant is included at the end of Part I of this Annual Report on Form 10-K and is incorporated herein by reference.
Compliance with Section 16(a) of the Exchange Act
The information required by this item with respect to compliance with Section 16(a) of the Securities Exchange Act of 1934 is incorporated by reference to the material contained in our Proxy Statement for our annual meeting of shareowners to be held October 30, 2018 under the caption “Section 16(a) Beneficial Ownership Reporting Compliance.”
Code of Ethics
We have a code of ethics that applies to all of our employees, including our Chief Executive Officer, our Chief Financial Officer, and our Corporate Controller (functioning as Principal Accounting Officer). The code of ethics is posted on our website at https://www.kimballinternational.com/corporate-governance. It is our intention to disclose any amendments to the code of ethics on this website. In addition, any waivers of the code of ethics for our directors or executive officers will be disclosed in a Current Report on Form 8-K.
Item 11 - Executive Compensation
The information required by this item is incorporated by reference to the material contained in our Proxy Statement for our annual meeting of shareowners to be held October 30, 2018 under the captions “Information Concerning the Board of Directors and Committees,” “Compensation Discussion and Analysis,” “Compensation Committee Report,” “Compensation Related Risk Assessment,” and “Executive Officer and Director Compensation.”
72
Item 12 - Security Ownership of Certain Beneficial Owners and Management and Related Shareowner Matters
Security Ownership
The information required by this item is incorporated by reference to the material contained in our Proxy Statement for our annual meeting of shareowners to be held October 30, 2018 under the caption “Share Ownership Information.”
Securities Authorized for Issuance Under Equity Compensation Plans
The information required by this item is incorporated by reference to the material contained in our Proxy Statement for our annual meeting of shareowners to be held October 30, 2018 under the caption “Executive Officer and Director Compensation — Securities Authorized for Issuance Under Equity Compensation Plans.”
Item 13 - Certain Relationships and Related Transactions, and Director Independence
Relationships and Related Transactions
The information required by this item is incorporated by reference to the material contained in our Proxy Statement for our annual meeting of shareowners to be held October 30, 2018 under the caption “Review and Approval of Transactions with Related Persons.”
Director Independence
The information required by this item is incorporated by reference to the material contained in our Proxy Statement for our annual meeting of shareowners to be held October 30, 2018 under the caption “Information Concerning the Board of Directors and Committees.”
Item 14 - Principal Accounting Fees and Services
The information required by this item is incorporated by reference to the material contained in our Proxy Statement for our annual meeting of shareowners to be held October 30, 2018 under the caption “Proposal No. 3 - Ratification of the Appointment of our Independent Registered Public Accounting Firm” and “Appendix A - Approval Process for Services Performed by the Independent Registered Public Accounting Firm.”
73
PART IV
Item 15 - Exhibits, Financial Statement Schedules
(a) | The following documents are filed as part of this report: |
(1) Financial Statements:
The following consolidated financial statements of the Company are found in Item 8 and incorporated herein. | |||
(2) Financial Statement Schedules:
Schedules other than those listed above are omitted because they are either not required or not applicable, or the required information is presented in the Consolidated Financial Statements. | |||
(3) Exhibits
Exhibit | Description | |
2(a)** | ||
3(a) | ||
3(b) | ||
10(a)* | ||
10(b)* | ||
10(c)* | ||
10(d)* | ||
10(e)* | ||
10(f)* | ||
10(g)* | ||
74
Exhibit | Description | |
10(h)* | ||
10(i)* | ||
10(j)* | ||
10(k)* | ||
10(l)* | ||
10(m)* | ||
10(n)* | ||
10(o)* | ||
10(p)* | ||
10(q)* | ||
10(r)* | ||
10(s)* | ||
10(t)* | ||
10(u) | ||
10(v) | ||
10(w) | ||
10(x) | ||
11 | ||
21 | ||
23 | ||
24 | ||
31.1 | ||
31.2 | ||
32.1 | ||
32.2 | ||
101.INS | XBRL Instance Document | |
101.SCH | XBRL Taxonomy Extension Schema Document | |
101.CAL | XBRL Taxonomy Extension Calculation Linkbase Document | |
101.DEF | XBRL Taxonomy Extension Definition Linkbase Document | |
101.LAB | XBRL Taxonomy Extension Label Linkbase Document | |
101.PRE | XBRL Taxonomy Extension Presentation Linkbase Document | |
* Constitutes management contract or compensatory arrangement
** The Company agrees to furnish supplementally to the Securities and Exchange Commission a copy of any omitted schedule upon request.
Item 16 - Form 10-K Summary
None.
75
SIGNATURES
Pursuant to the requirements of Section 13 or 15(d) of the Securities Exchange Act of 1934, the Registrant has duly caused this report to be signed on its behalf by the undersigned, thereunto duly authorized.
KIMBALL INTERNATIONAL, INC. | ||
By: | /s/ MICHELLE R. SCHROEDER | |
Michelle R. Schroeder | ||
Vice President, | ||
Chief Financial Officer | ||
August 28, 2018 | ||
Pursuant to the requirements of the Securities Exchange Act of 1934, this report has been signed below by the following persons on behalf of the Registrant and in the capacities and on the dates indicated:
/s/ ROBERT F. SCHNEIDER | ||
Robert F. Schneider | ||
Chairman of the Board, Director | ||
Chief Executive Officer | ||
August 28, 2018 | ||
/s/ MICHELLE R. SCHROEDER | ||
Michelle R. Schroeder | ||
Vice President, | ||
Chief Financial Officer | ||
August 28, 2018 | ||
/s/ DARREN S. GRESS | ||
Darren S. Gress | ||
Corporate Controller | ||
(functioning as Principal Accounting Officer) | ||
August 28, 2018 | ||
76
Signature | Signature | |
/s/ THOMAS J. TISCHHAUSER * | /s/ GEOFFREY L. STRINGER * | |
Thomas J. Tischhauser | Geoffrey L. Stringer | |
Director | Director | |
/s/ KIMBERLY K. RYAN * | /s/ TIMOTHY J. JAHNKE * | |
Kimberly K. Ryan | Timothy J. Jahnke | |
Director | Director | |
/s/ PATRICK E. CONNOLLY * | /s/ DR. SUSAN B. FRAMPTON * | |
Patrick E. Connolly | Dr. Susan B. Frampton | |
Director | Director | |
/s/ KRISTINE L. JUSTER * | ||
Kristine L. Juster | ||
Director | ||
* | The undersigned does hereby sign this document on my behalf pursuant to powers of attorney duly executed and filed with the Securities and Exchange Commission, all in the capacities as indicated: |
Date | ||
August 28, 2018 | /s/ ROBERT F. SCHNEIDER | |
Robert F. Schneider | ||
Chairman of the Board, Director, Chief Executive Officer | ||
Individually and as Attorney-In-Fact | ||
77
KIMBALL INTERNATIONAL, INC.
Schedule II. - Valuation and Qualifying Accounts
Description | Balance at Beginning of Year | Additions (Reductions) to Expense | Adjustments to Other Accounts | Write-offs and Recoveries | Balance at End of Year | |||||||||||||||
(Amounts in Thousands) | ||||||||||||||||||||
Year Ended June 30, 2018 | ||||||||||||||||||||
Valuation Allowances: | ||||||||||||||||||||
Short-Term Receivables | $ | 1,626 | $ | (25 | ) | $ | 204 | $ | (488 | ) | $ | 1,317 | ||||||||
Long-Term Notes Receivable | $ | 109 | $ | (3 | ) | $ | 33 | $ | — | $ | 139 | |||||||||
Deferred Tax Asset | $ | 643 | $ | — | $ | 326 | $ | (109 | ) | $ | 860 | |||||||||
Year Ended June 30, 2017 | ||||||||||||||||||||
Valuation Allowances: | ||||||||||||||||||||
Short-Term Receivables | $ | 2,145 | $ | (206 | ) | $ | 101 | $ | (414 | ) | $ | 1,626 | ||||||||
Long-Term Notes Receivable | $ | 118 | $ | (9 | ) | $ | — | $ | — | $ | 109 | |||||||||
Deferred Tax Asset | $ | 687 | $ | — | $ | — | $ | (44 | ) | $ | 643 | |||||||||
Year Ended June 30, 2016 | ||||||||||||||||||||
Valuation Allowances: | ||||||||||||||||||||
Short-Term Receivables | $ | 1,522 | $ | 374 | $ | 310 | $ | (61 | ) | $ | 2,145 | |||||||||
Long-Term Notes Receivable | $ | 618 | $ | (11 | ) | $ | (489 | ) | $ | — | $ | 118 | ||||||||
Deferred Tax Asset | $ | 687 | $ | — | $ | — | $ | — | $ | 687 | ||||||||||
A valuation allowance totaling $489 thousand transferred from long-term to short-term during the year ended June 30, 2016 and was a reduction to expense during the year ended June 30, 2017 as the entire receivable was collected.
78