Attached files
| file | filename |
|---|---|
| EX-32.2 - EX-32.2 - OneSpan Inc. | ospn-20191231ex322624384.htm |
| EX-32.1 - EX-32.1 - OneSpan Inc. | ospn-20191231ex3214ccc82.htm |
| EX-31.2 - EX-31.2 - OneSpan Inc. | ospn-20191231ex312afbc64.htm |
| EX-31.1 - EX-31.1 - OneSpan Inc. | ospn-20191231ex31130a414.htm |
| EX-23 - EX-23 - OneSpan Inc. | ospn-20191231xex23.htm |
| EX-21 - EX-21 - OneSpan Inc. | ospn-20191231ex21f0d9394.htm |
| EX-14.2 - EX-14.2 - OneSpan Inc. | ospn-20191231ex142a9172d.htm |
| EX-14.1 - EX-14.1 - OneSpan Inc. | ospn-20191231ex141685626.htm |
| EX-4.11 - EX-4.11 - OneSpan Inc. | ospn-20191231ex4117b52b2.htm |
| EX-4.10 - EX-4.10 - OneSpan Inc. | ospn-20191231ex4100243d7.htm |
| EX-4.9 - EX-4.9 - OneSpan Inc. | ospn-20191231ex49e41554c.htm |
| EX-4.8 - EX-4.8 - OneSpan Inc. | ospn-20191231ex48d36574c.htm |
UNITED STATES
SECURITIES AND EXCHANGE COMMISSION
Washington, D.C. 20549
FORM 10-K
FOR ANNUAL AND TRANSITION REPORTS PURSUANT TO
SECTIONS 13 OR 15(d) OF THE SECURITIES EXCHANGE ACT OF 1934
(Mark One)
[x] ANNUAL REPORT PURSUANT TO SECTION 13 OR 15(D) OF THE SECURITIES EXCHANGE ACT OF 1934 FOR THE FISCAL YEAR ENDED DECEMBER 31, 2019
or
[ ] TRANSITION REPORT PURSUANT TO SECTION 13 OR 15(d) OF THE SECURITIES EXCHANGE ACT OF 1934 FOR THE TRANSITION PERIOD FROM TO
Commission file number 000‑24389
OneSpan Inc.
(Exact Name of Registrant as Specified in Its Charter)
|
DELAWARE |
36‑4169320 |
|
(State or Other Jurisdiction of |
(IRS Employer |
121 West Wacker Drive, Suite 2050
Chicago, Illinois 60601
(Address of Principal Executive Offices)(Zip Code)
Registrant’s telephone number, including area code:
312-766-4001
Securities registered pursuant to Section 12(b) of the Act:
|
Title of each class |
|
Name of exchange on which registered |
|
Common Stock, par value $.001 per share |
|
NASDAQ Capital Market |
Securities registered pursuant to Section 12(g) of the Act:
None
Indicate by check mark if the registrant is a well-known seasoned issuer, as defined by Rule 405 of the Securities Act. Yes No X
Indicate by check mark if the registrant is not required to file reports pursuant to Section 13 or 15(d) of the act. Yes No X
Indicate by check mark whether the registrant: (1) has filed all reports required to be filed by Section 13 or 15(d) of the Securities Exchange Act of 1934 during the preceding 12 months (or for such shorter period that the registrant was required to file such reports), and (2) has been subject to such filing requirements for the past 90 days. Yes X No
Indicate by check mark whether the registrant has submitted electronically every Interactive Data File required to be submitted pursuant to Rule 405 of Regulation S-T (§232.405 of this chapter) during the preceding 12 months (or for such shorter period that the registrant was required to submit such files). Yes X No
Indicate by check mark if disclosure of delinquent filers pursuant to Item 405 of Regulation S-K is not contained herein, and will not be contained, to the best of registrant’s knowledge, in definitive proxy or information statements incorporated by reference in Part III of this Form 10‑K or any amendment to this Form 10‑K. [ ]
Indicate by check mark whether the registrant is a large accelerated filer, an accelerated filer, a non-accelerated filer, a smaller reporting company, or an emerging growth company. See definition of “large accelerated filer,” “accelerated filer”, “smaller reporting company”, and “emerging growth company” in Rule 12b‑2 of the Exchange Act.
|
|
|
|
|
|
|
Large accelerated filer ☐ |
Accelerated filer ☑ |
Non-accelerated filer ☐ |
Smaller reporting company ☐ |
Emerging growth company ☐ |
If an emerging growth company, indicate by check mark if the registrant has elected not to use the extended transition period for complying with any new or revised financial accounting standards pursuant to Section 13(a) of the Exchange Act. [ ]
Indicate by check mark whether the registrant is a shell company (as defined in Rule 12b‑2 of the Exchange Act). Yes No X
As of June 30, 2019, the aggregate market value of voting and non-voting common equity (based upon the last sale price of the common stock as reported on the NASDAQ Capital Market on June 30, 2019) held by non-affiliates of the registrant was $460,536,053 at $14.17 per share.
As of March 1, 2020, there were 40,271,211 shares of common stock outstanding.
DOCUMENTS INCORPORATED BY REFERENCE
Certain sections of the registrant’s Notice of Annual Meeting of Stockholders and Proxy Statement for its 2018 Annual Meeting of Stockholders are incorporated by reference into Part III of this report.
Cautionary Statement for Purposes of the Safe Harbor Provisions of the Private Securities Litigation Reform Act of 1995
This Annual Report on Form 10-K contains forward-looking statements within the meaning of applicable U.S. Securities laws, including statements regarding the potential benefits, performance, and functionality of our products and solutions, including future offerings; our expectations, beliefs, plans, operations and strategies relating to our business and the future of our business; our acquisitions to date and our strategy related to future acquisitions; and our expectations regarding our financial performance in the future. Forward-looking statements may be identified by words such as "seek", "believe", "plan", "estimate", "anticipate", expect", "intend", and statements that an event or result "may", "will", "should", "could", or "might" occur or be achieved and any other similar expressions. These forward-looking statements involve risks and uncertainties, as well as assumptions which, if they do not fully materialize or prove incorrect, could cause our results to differ materially from those expressed or implied by such forward-looking statements. Factors that could materially affect our business and financial results include, but are not limited to: market acceptance of our products and solutions and competitors’ offerings; the potential effects of technological changes; our ability to effectively identify, purchase and integrate acquisitions; the execution of our transformative strategy on a global scale; the increasing frequency and sophistication of hacking attacks; claims that we have infringed the intellectual property rights of others; changes in customer requirements; price competitive bidding; changing laws, government regulations or policies; pressures on price levels; impairment of goodwill or amortizable intangible assets causing a significant charge to earnings; exposure to increased economic and operational uncertainties from operating a global business as well as those factors set forth in this Form 10-K (and other forms) filed with the Securities and Exchange Commission. Our SEC filings and other important information can be found on the Investor Relations section of our website at investors.onespan.com. We do not have any intent, and disclaim any obligation, to update the forward-looking information to reflect events that occur, circumstances that exist, or changes in our expectations after the date of this Form 10-K.
Unless otherwise noted, references in this Annual Report on Form 10‑K to “OneSpan”, “Company”, “we”, “our”, and “us” refer to OneSpan Inc. and its subsidiaries.
OneSpan Inc., formerly known as VASCO Data Security International, Inc., was incorporated in the State of Delaware in 1997. Our principal executive office is located at 121 West Wacker Drive, Suite 2050, Chicago, Illinois 60601; the telephone number at that address is 312 766 4001. Unless otherwise noted, references in this Annual Report on Form 10-K to “Onespan”, “Company”, “we”, “our”, and “us” refer to OneSpan Inc. and its subsidiaries. Our website address is www.onespan.com.
Additional information about the Company, including the Company’s annual report on Form 10-K, quarterly reports on Form 10-Q, current reports on Form 8-K, and amendments to those reports filed with the Securities and Exchange Commission (the “SEC”) are available on our website at investors.onespan.com.
Overview
We design, develop and market digital solutions for identity, security, and business productivity that protect and facilitate electronic transactions via mobile and connected devices. We are a global leader in providing anti-fraud and digital transaction management solutions to financial institutions and other businesses. We do this by delivering trust in people’s identities, their devices, and the transactions that they conduct online. We make digital banking accessible, secure, easy, and valuable. Our solutions secure access to online accounts, data, assets, and applications for global enterprises; provide tools for application developers to easily integrate security functions into their web-based and mobile applications; and facilitate end-to-end financial agreement automation including digital identity verification, customer due diligence, electronic signature, and document management. Our trusted identity platform technologies including Intelligent Adaptive Authentication, Risk Analytics and Secure Agreement Automation, along with various multi-factor authentication, mobile app security and transaction signing technologies, enhance the ability of companies to prevent hacking attacks against online and mobile transactionswhile providing an exceptional experience for remote customers.
We offer cloud based and on-premises solutions using both open standards and proprietary technologies. Some of our proprietary technologies are patented. Our products and services are used for authentication, fraud mitigation, e-signing transactions and documents, and identity management in Business-to-Business (“B2B”), Business-to-Employee (“B2E”) and Business-to-Consumer (“B2C”) environments. Our target market is business processes using an electronic interface, particularly the internet, where there is risk of account takeover or new account fraud. Our products can enhance customer experience, increase security associated with accessing business processes, reduce losses from unauthorized access, and reduce the cost of the process by automating activities previously performed manually.
Online and mobile application owners and publishers benefit from our expertise in multi-factor authentication, document signing, transaction signing, application security, remote customer onboarding, and in mitigating hacking attacks. Our convenient and proven security solutions enable low friction and trusted interactions between businesses, employees, and consumers across a variety of online and mobile platforms.
Our primary growth strategy is to make digital banking more accessible, secure, easy and valuable. Our key growth objectives include:
|
· |
Expanding our portfolio of solutions that enable institutions to mitigate fraud, comply with regulations, easily on-board customers, and adaptively authenticate transactions; |
|
· |
Automating and securing digital customer journeys with Secure Agreement Automation to remotely verify identities, mitigate application fraud, and secure account openings and transactions; |
|
· |
Increasing sales to existing customers and acquiring new customers; |
|
· |
Driving increased demand for our products in new applications, new markets, and new territories; |
1
|
· |
Expanding our channel partner ecosystem; and |
|
· |
Strategically acquiring companies that expand our technology portfolio or customer base and increase our recurring revenue. |
Industry Background
Rapid global growth in cloud and mobile banking transactions is driving increased demand for multi-channel security solutions and enhanced user experiences across the financial services industry. Similarly, increasing remote corporate access of important resources by employees, business partners and customers is introducing new security risks for participants. Large and powerful criminal hacking organizations are launching more sophisticated hacking attacks with greater frequency. The criminal activities of private and state-sponsored hacking organizations have driven an increased need for security solutions and expansion of regulations requiring improved security measures to protect against hacking attacks and breaches. Several governments worldwide have issued specific recommendations advocating multi-factor authentication and other security measures to improve cloud-based and mobile banking security. We believe these global trends will continue and that the market for authentication, anti-fraud, and e-signature solutions will continue to grow driven by growth in digital banking transactions, digital commerce, remote corporate access, growing awareness of the impact of cyber-crime, and new government regulations.
Our Background
Our predecessor company, VASCO Corp., entered the data security business in 1991 through the acquisition of a controlling interest in ThumbScan, Inc., which we renamed as VASCO Data Security, Inc.
In 1996, we expanded our computer security business by acquiring Lintel Security NV/SA, a Belgian corporation, which included assets associated with the development of security tokens and security technologies for personal computers and computer networks. Also in 1996, we acquired Digipass NV/SA, a Belgian corporation, which was also a developer of security tokens and security technologies. In 1997, the acquired entity was renamed VASCO Data Security NV/SA.
In 1997, VASCO Data Security International, Inc. was incorporated and in 1998, we completed a registered exchange offer with the holders of the outstanding securities of VASCO Corp., becoming a publicly traded company.
In 2006, we opened our international headquarters in Zurich, Switzerland.
In 2013, we acquired Cronto Limited (“Cronto”), a provider of secure visual transaction authentication solutions for online banking.
In 2014, we acquired Risk IDS, a provider of risk analysis solutions to the banking community.
In 2015, we acquired Silanis Technology Inc., a leading provider of electronic signature (e-signature) and digital transaction solutions used to electronically sign, send, and manage documents. The solution is sold under the OneSpan Sign (formerly eSignLive) name and is trusted by many of the largest banks, insurers, and government agencies.
In May 2018, we acquired Dealflo Limited, a leading provider of identity verification and end-to-end financial automation solutions.
Also in May 2018, VASCO Data Security international, Inc. changed its name to OneSpan Inc. The Company’s name change reflects a shift in our strategy and solution offerings.
Including our predecessor companies, we have engaged in sixteen acquisitions and two dispositions.
2
Our Products and Services
Trusted Identity Platform
The Trusted Identity (TID) platform is a cloud-based platform that brings together OneSpan’s broad portfolio of security technologies, including Intelligent Adaptive Authentication, Risk Analytics, Secure Agreement Automation, Mobile Security Suite, multi-factor authentication, biometrics, and orchestration to power solutions that secure users, devices, and transactions across the digital journey. The innovative approach of this platform delivers on simplicity with orchestration technology that integrates applications and services requirements via a single interface while constantly protecting sensitive data through an encrypted client/server secure channel.
Intelligent Adaptive Authentication
Intelligent Adaptive Authentication is a cloud-based solution that enables banks and other financial institutions to secure users, devices, and transactions while providing an enhanced customer experience. It is powered by the TID platform and leverages advanced risk analytics, mobile security, multi-factor authentication, biometrics, and other technologies that enable the real-time analysis and scoring of vast and disparate data across channels. This risk score drives a precise level of authentication security for each unique transaction which ensures a positive customer experience while safe guarding transactions and sensitive customer data. This helps institutions reduce fraud and drive growth through higher customer loyalty and increased use of bank services.
Risk Analytics
Risk Analytics is a comprehensive anti-fraud solution designed to help banks and other financial institutions improve the speed and accuracy of detecting known and emerging fraud across online and mobile channels. A component of the TID platform, which includes machine learning technology, the solution analyzes vast amounts of user, device, and transaction data in real time to provide a comprehensive risk assessment. It enables institutions to take a proactive approach to fraud prevention while removing major points of friction for end users. Cross-channel, prebuilt rules complement this scoring process and allow fraud experts to make decisions on alerts or link to automated business processes such as step-up authentication. The solution can be implemented in combination with Mobile Security Suite to provide integrated trust with minimal impact on the end user experience. It can be deployed in the cloud or on-premises.
Secure Agreement Automation
Secure Agreement Automation is a cloud-based solution that combines digital identity verification, e-signature, and workflow automation capabilities to help digitize the mobile and online application process. By leveraging multiple third-party identity verification services, organizations can drive higher customer adoption and conversion rates via a single vendor, single SLA, and single API integration through OneSpan. Solution capabilities include: Identity document (e.g., driver’s license, passport, etc.) capture and real-time authenticity verification, as well as facial comparison (“selfie”) and liveness detection to establish that the individual presenting the identity document is the same person whose picture appears on the authenticated identity document. Combined with e-signature capabilities, organizations can quickly present and execute legally enforceable agreements while improving the digital customer experience.
Secure Agreement Automation enables banks and financial institutions to verify the identity of remote applicants during the new digital account opening, lending, and financing application processes. The multi-layered identity verification approach enables automated failover to alternative identity verification providers in the event of a verification failure or provider unavailability which reduces applicant abandonment rates. Additionally, the solution provides organizations the ability to ensure the best identity verification processes for their business needs and digital channels to help maximize pass rates, minimize application fraud, and increase operational efficiencies.
Mobile Security Suite and Mobile Authenticator Studio
Mobile Security Suite is a comprehensive software development kit that allows application developers to natively integrate security features including geolocation, device identification, jailbreak and root detection, fingerprint
3
and face recognition, one-time password delivery via push notification, and electronic signing, among others. Through a comprehensive library of APIs, application developers can extend and strengthen application security, deliver enhanced convenience to their application users, and streamline application deployment and lifecycle management processes. Mobile Security Suite also includes a Runtime Application Self-Protection module, which can detect and mitigate malicious app activity and potential loss to hacking activities.
Mobile Authenticator Studio is a user-friendly and secure mobile authenticator that operates as a discrete mobile application. It includes many of the features of the Mobile Security Suite and can easily be tailored to meet the needs of countless authentication processes. It can be customized and deployed rapidly without extensive technical support ensuring strong security with compelling value.
OneSpan Sign
OneSpan Sign supports a broad range of e-signature requirements from simple to complex, and from the occasional agreement to processing tens of thousands of transactions. OneSpan Sign provides multiple deployment options including public cloud, private cloud, or on-premises without compromising security or functionality. The solution is also available in a Federal Risk and Authorization Management Program (FedRAMP) SaaS-level compliant cloud, allowing U.S. government agencies to implement e-signatures in the cloud and meet GSA security requirements.
Customers can configure OneSpan Sign to reinforce their brand for a seamless signing experience. Each step of the e-signature workflow can be customized, from authentication to distribution and storage. OneSpan Sign also provides comprehensive and secure electronic evidence for strong legal protection by capturing both document and process-level evidence. This reduces the time and cost of gathering evidence and demonstrating legal and regulatory compliance. Electronic signature capabilities can be a critical component of the account opening and onboarding processes, providing a secure and user-friendly way to execute legally binding agreements.
Hardware Authenticators
We offer a wide variety of hardware authenticators, each of which has its own distinct characteristics to meet the needs of our customers. All models of the Digipass family of authenticators are designed to work together so customers can switch devices without changes to their existing infrastructure. Our models range from one-button devices and smart card readers to devices that include more advanced technologies, such as public key infrastructure (“PKI”) and visual cryptography.
Digipass hardware technology is designed to support authentication and digital signatures for applications running on traditional PCs, tablets, and mobile phones.
Authentication Server
Authentication Server incorporates a range of strong authentication utilities and solutions designed to allow organizations to securely authenticate users and transactions. Our solution, once integrated, becomes largely transparent to users, minimizing rollout and support issues. Authentication Server encompasses multiple authentication technologies (e.g., passwords, dynamic password technologies, certificates, and biometrics) and allows the use of any combination of those technologies simultaneously.
Authentication Server enables customers to administer a high level of access control. The solution requires only a few days to implement in most systems and supports our line of hardware and software authenticators. Once linked to an application, Authentication Server automatically handles login requests from any authorized user.
Intellectual Property and Proprietary Rights and Licenses
We rely on a combination of patent, copyright, trademark, design, and trade secret laws, as well as employee and third-party non-disclosure agreements to protect our proprietary rights. In particular, we hold several patents in the U.S. and in other countries, which cover multiple aspects of our technology. These patents expire between now and more
4
than 10 years from now. In addition to the issued patents, we also have several patent applications pending in the U.S., Europe, and other countries. The majority of our issued and pending patents cover our Digipass product line. We believe these patents to be valuable property rights and we rely on the strength of our patents and on trade secret law to protect our proprietary technology. We furthermore have registrations for most of our trademarks in most of the markets where we sell the corresponding products and services and registrations of the designs of many of our hardware products primarily in the EU and China. To the extent that we believe our intellectual property rights are being infringed upon, we intend to assert vigorously our intellectual property rights, including but not limited to, pursuing all available legal remedies.
Research and Development
Our research and development efforts historically have been, and will continue to be, concentrated on solution enhancement, new technology development, and related new software introductions. We employ a team of full-time engineers and, from time to time, also engage independent engineering firms to conduct non-strategic product development efforts on our behalf. For fiscal years ended December 31, 2019, 2018, and 2017, we incurred expenses of $42.5 million, $32.2 million, and $23.1 million, respectively, for research and development.
Production
Our Digipass security hardware products are manufactured by third party manufacturers pursuant to purchase orders that we issue. Our hardware Digipass products are made primarily from commercially available electronic components purchased globally. Our software solutions are produced in-house or developed by third parties and sold under license.
Hardware Digipass products utilize commercially available programmable microprocessors purchased from several suppliers. The microprocessors are the most important components of our security authenticators that are not commodity items readily available on the open market. Some microprocessors are single sourced. Orders of microprocessors generally require a lead-time of 12-16 weeks. We attempt to maintain a sufficient inventory of all parts to handle short-term increases in orders.
Large orders that would significantly deplete our inventory are typically required to be placed with more than twelve weeks of lead-time, allowing us to make appropriate arrangements with our suppliers. We purchase microprocessors and arrange for shipment to third parties for assembly and testing in accordance with our design specifications. The majority of our Digipass products are manufactured by four independent factories in Southern China. Purchases are made on a volume purchase order basis. We supply product test equipment at the point of assembly. We maintain a local team in China to conduct quality control and quality assurance procedures. Periodic visits are conducted by our personnel for quality management, assembly process review, and supplier relations.
Competition
The market for digital solutions for identity, security, and business productivity solutions is very competitive and, like most technology-driven markets, is subject to rapid change and constantly evolving solutions and services. Our anti-fraud products are designed to allow authorized users access to a computing environment or application, in some cases using patented technology, as a replacement for or supplement to a static password. Although certain of our security technologies are patented, there are other organizations that offer anti-fraud solutions that compete with us for market share. Our main competitors in our anti-fraud markets are Gemalto, a subsidiary of Thales Group, and RSA Security, a subsidiary of Dell Technologies. There are many other companies, such as Transmit Security, Symantec, and Early Warning that offer competing services. In addition to these companies, we face competition from many small authentication solution providers, many of whom offer new technologies and niche solutions such as biometric or behavioral analysis. We believe that competition in this market is likely to intensify as a result of increasing demand for security products. Our primary competitors for electronic signature solutions include DocuSign and Adobe Systems. Both companies are significantly larger than us. In addition to these companies, there are dozens of smaller and regional providers of electronic signing solutions.
5
We believe that the principal competitive factors affecting the market for digital solutions for identity, security, and business productivity, as well as electronic signatures include the strength and effectiveness of the solution, technical features, ease of use, quality and reliability, customer service and support, brand recognition, customer base, distribution channels, and the total cost of ownership of the solution. Although we believe that our products currently compete favorably with respect to such factors, there can be no assurance that we can maintain our competitive position against current and potential competitors.
Some of our present and potential competitors have significantly greater financial, technical, marketing, purchasing, and other resources. As a result, they may be able to respond more quickly to new or emerging technologies and changes in customer requirements, or to devote greater resources to the development, promotion and sale of products, or to deliver competitive products at a lower end-user price. Current and potential competitors have established or may establish cooperative relationships among themselves or with third parties to increase the ability of their products to address the needs of our prospective customers. It is possible that new competitors or alliances may emerge and rapidly acquire significant market share. Accordingly, we have forged, and will continue to forge, our own partnerships to offer a broader range of products and capabilities to the market.
Sales and Marketing
Our solutions are sold worldwide through our direct sales force as well as through distributors, resellers, systems integrators, and original equipment manufacturers. Our sales staff coordinates sales activity through both our sales channels and those of our partners making direct sales calls either alone or with the sales personnel of our partners. Our sales staff also provides product education seminars to sales and technical personnel of resellers and distributors with whom we have working relationships and to potential end-users of our products.
We offer customers a choice of on-site implementation using our on-premises model or a cloud implementation for solutions using our services platform.
Part of our expanded selling effort includes approaching our partners to find additional applications for our security products. In addition, our marketing plan calls for the identification of new business opportunities that may require enhanced security or areas where we do not currently market our products.
Customers and Markets
We generally focus our sales and marketing efforts in three primary areas. The first is financial institutions where the majority of our revenue is derived. This segment includes traditional banks, credit unions, and online-only banks. This is our primary market. We believe there are substantial opportunities for future growth in the financial vertical as our solution portfolio expands and we deliver additional capabilities targeted specifically at identifying and mitigating online and mobile banking fraud. We also sell to the enterprise market segment which consists primarily of businesses seeking secure internal and remote network access. We sell to these businesses mostly through distribution and resellers. Our strategy is to leverage products developed for the banking market in the enterprise market as the hacking attacks in both markets have many similarities. We also target the government market segment in select regions around the globe. Our customer base includes a number of government organizations.
Our top 10 customers contributed 29%, 24%, and 27%, in 2019, 2018, and 2017, respectively, of total worldwide revenue.
A significant portion of our sales is denominated in foreign currencies and changes in exchange rates impact results of operations. To mitigate exposure to risks associated with fluctuations in currency exchange rates, we attempt to denominate an amount of billings in a currency such that it would provide a hedge against operating expenses being incurred in that currency. For additional information regarding how currency fluctuations can affect our business, please refer to “Management’s Discussion and Analysis of Financial Condition and Results of Operations” and “Quantitative and Qualitative Disclosures about Market Risk.”
6
We also experience seasonality or variation across the year in our markets. These trends can include lower sales during the summer months, particularly in EMEA, or higher sales during the second half of the fiscal year compared to the first half of the fiscal year.
Financial Information Relating to Foreign and Domestic Operations
For financial information regarding OneSpan, see our Consolidated Financial Statements and the related Notes, which are included in this Annual Report on Form 10-K. We have a single operating segment for all our products and operations. See Note 14 in the Notes to Consolidated Financial Statements for a breakdown of revenue and long-lived assets between the U.S. and other regions.
Employees
As of December 31, 2019, we had 744 total employees, including 365 located in the Americas, 346 located in EMEA (Europe, the Middle East and Africa), and 33 located in Asia Pacific. Of the total employees, 321 were involved in sales, marketing, operations, and customer support, 309 in research and development and 114 in general and administration.
RISK FACTORS
You should carefully consider the following risk factors, which we consider the most significant, as well as other information contained in this Annual Report on Form 10-K. In addition, there are a number of less significant and other general risk factors that could affect our future results. If any of the events described in the risk factors were to occur, our business, financial condition or operating results could be materially and adversely affected. We have grouped our Risk Factors under captions that we believe describe various categories of potential risk. For the reader’s convenience, we have not duplicated risk factors that could be considered to be included in more than one category.
Risks Related to Our Business
A significant portion of our sales are to a limited number of customers. The loss of substantial sales to any one of them could have an adverse effect on revenues and profits.
We derive a substantial portion of our revenue from a limited number of customers, many of which are financial institutions. The loss of substantial sales to any one of them could adversely affect our operations and results. In fiscal 2019, 2018, and 2017, our top 10 largest customers contributed 29%, 24%, and 27%, respectively, of total worldwide revenue.
The return of a worldwide recession and/or regional economic downturns may further impact our business.
Our business is subject to economic conditions that may fluctuate in the major markets in which we operate. Factors that could cause economic conditions to fluctuate include, without limitation, recession, inflation, deflation, interest rates, unemployment, consumer debt levels, general retail or commercial markets and consumer or business purchasing power or preferences.
If global economic and financial market conditions remain uncertain and/or weak for an extended period of time, any of the following factors, among others, could have a material adverse effect on our financial condition and results of operations:
|
· |
slower consumer or business spending may result in reduced demand for our products and services, reduced orders from customers for our products, order cancellations, lower revenues, increased inventories, and lower gross margins; |
7
|
· |
continued volatility in the global markets and fluctuations in exchange rates for foreign currencies and contracts or purchase orders in foreign currencies could negatively impact our reported financial results and condition; |
|
· |
continued volatility in the prices for commodities and raw materials we use in our products could have a material adverse effect on our costs, gross margins, and ultimately our profitability; |
|
· |
restructurings, reorganizations, consolidations and other corporate events could affect our customers’ budgets and buying cycles, particularly in the banking industry; |
|
· |
if our customers experience declining revenues, or experience difficulty obtaining financing in the capital and credit markets to purchase our products and services, this could result in reduced orders, order cancellations, inability of customers to timely meet their payment obligations to us, extended payment terms, higher accounts receivable, reduced cash flows, greater expense associated with collection efforts and increased bad debt expense; |
|
· |
in the event of a contraction of our sales, dated inventory may result in a need for increased obsolescence reserves; |
|
· |
a severe financial difficulty experienced by our customers may cause them to become insolvent or cease business operations, which could reduce sales, cash collections and revenue streams. |
|
· |
any difficulty or inability on the part of manufacturers of our products or other participants in our supply chain in obtaining sufficient financing to purchase raw materials or to finance general working capital needs may result in delays or non-delivery of shipments of our products. |
We are unable to predict potential future economic conditions, disruptions in the sovereign debt markets or other financial markets, regional recessions, or the effect of any such disruption or disruptions on our business and results of operations, but the consequences may be materially adverse. We believe that our business in the Banking market in Europe would be impacted most directly by any such disruption and that the consequences may be materially adverse, as approximately 58% of our consolidated revenues originated in the EMEA region in 2019.
Disruptions in markets or the European Union may affect our liquidity and capital resources.
We believe our financial resources are adequate to meet our operating needs. However, disruptions in the sovereign debt markets or other financial markets, the Euro Monetary Union or the European Union, could materially adversely affect our liquidity and capital resources and expose us to additional currency fluctuation risk. Sufficiently adverse effects could cause us to modify our business plans.
Furthermore, in an adverse economic environment there is a risk that customers may delay their orders until the economic conditions improve further. If a significant number of orders are delayed for an indefinite period of time, our revenue and cash receipts may not be sufficient to meet the operating needs of the business. If this is the case, we may need to significantly reduce our workforce, sell certain of our assets, enter into strategic relationships or business combinations, discontinue some or all of our operations, or take other similar restructuring actions. While we expect that these actions would result in a reduction of recurring costs, they also may result in a reduction of recurring revenue and cash receipts. It is also likely that we would incur substantial non-recurring costs to implement one or more of these restructuring actions.
We could incur substantial accounting related costs if we are unable to maintain an effective system of internal control over financial reporting.
In response to the material weakness in our internal control over financial reporting disclosed as of December 31, 2018, we expended significant resources to improve our internal control over financial reporting and the
8
effectiveness of our disclosure controls and procedures. We expended significant resources, including accounting related costs and significant management oversight as we corrected the deficiencies. Management has determined that full remediation of the prior deficiencies in internal control over financial reporting that led to this material weakness has occurred, disclosed in Item 9A, and the subsequent investment in the control environment will continue.
We cannot provide absolute assurance that additional material weaknesses, or significant deficiencies, in our internal controls will not be identified in the future. Failure to maintain effective controls or implement new or improved controls could result in significant deficiencies or material weaknesses, affect management evaluations and auditor attestations regarding the effectiveness of our internal controls, failure to meet periodic reporting obligations, and material misstatements in our financial statements. Material misstatement of our financial statements may result in a restatement, loss of investor and customer confidence, a decline in the market price of the Company’s common stock, and potential sanctions or investigations by NASDAQ, the Securities and Exchange Commission or other regulatory authorities. Failure to remedy any material weakness in the Company’s internal control over financial reporting, or to implement or maintain other effective control systems required of public companies, could also restrict the Company’s future access to the capital markets.
We have a long operating history, but only modest accumulated profit.
Although we have reported net income (loss) of $8.8 million, $3.8 million, and $(22.4) million for the years ended December 31, 2019, 2018, and 2017, respectively, our retained earnings were $181.2 million at December 31, 2019. Over our 25 year operating history, we have operated at a loss for many of those years. Depending on the economic environment’s changing rules and regulations, and our investment strategies, it may be difficult for us to sustain profitability on a GAAP basis. We may choose to invest for long term value which could decrease or eliminate short term profit.
We derive revenue from a limited number of products.
Approximately half of our revenue is derived from the sale of authentication related hardware products and related services. We anticipate a substantial portion of future revenue, will be derived from authentication, products and related services. If the sale of these products and services is impeded for any reason and we have not diversified our offerings into more software, our business and results of operations would be negatively impacted. Further, we expect our hardware product sales to decline over the long term in our traditional markets. If the rate of decline is more than expected and the aforementioned diversification is not enough to offset the decline, our results could be uneven and overall could be negative.
The sales cycle for our products and technology is long, and we may incur substantial expenses for sales that do not occur when anticipated.
The sales cycle for our products, which is the period of time between the identification of a potential customer and completion of the sale, is typically lengthy and subject to a number of significant risks over which we have little control. If revenue falls significantly below anticipated levels, our business would be seriously harmed.
A typical sales cycle in the financial services market is often six months or more. Larger banking transactions may take up to 18 months or more. Purchasing decisions for our products and services may be subject to delays due to many factors that are not within our control, such as:
|
· |
Time required for a prospective customer to recognize the need for our products; |
|
· |
Significant expense of many security products and systems; |
|
· |
Customer budgeting process; and |
|
· |
Customer evaluation, testing and approval process. |
9
As our operating expenses are based on anticipated revenue levels, a small fluctuation in the timing of sales can cause our operating results to vary significantly between periods.
We have a great dependence on a limited number of suppliers and the loss of their manufacturing capability could materially impact our operations.
In the event that the supply of components or finished products is interrupted or relations with any of our principal vendors is terminated, there could be increased costs and considerable delay in finding suitable replacement sources to manufacture our hardware products. Our hardware Digipass authentication devices are assembled at facilities located in mainland China. The importation of these products from China exposes us to the possibility of product supply disruption and increased costs in the event of changes in the policies of the Chinese government, political unrest or unstable economic conditions in China or developments in the United States or European Union that are adverse to trade, including enactment of protectionist legislation. In 2019, a portion of our hardware products became subject to tariffs. If such tariffs increase in amount or scope, our financial results could be negatively affected.
We order some hardware components, such as processors, in advance of expected use and often produce finished goods prior to the receipt of executed customer orders. If orders are not received, we could suffer losses related to inventory that cannot be sold at full value.
In an attempt to minimize the risk of not having an adequate supply of component parts to meet demand and to take advantage of volume purchasing benefits, especially in situations where we have been notified that key processors will no longer be manufactured, we sometimes purchase multiple years’ supply of parts based on internal forecasts of demand. In addition, to meet customers’ demands for accelerated delivery of product, we sometimes produce finished product for existing customers before we receive the executed order from the customer. Should our forecasts of future demand be inaccurate or if we produce product that is never ordered, we could incur substantial losses related to the realization of our inventory.
Our success depends on establishing and maintaining strategic relationships with other companies to distribute our technology and products and, in some cases, for us to incorporate their technology into our products and our products and services.
Part of our business strategy is to enter into strategic alliances and other cooperative arrangements with other companies in our industry. We currently are involved in cooperative efforts with respect to the incorporation of our products into products of others and vice versa, research and development efforts, marketing efforts and reseller arrangements. These relationships are generally non-exclusive, and some of our strategic partners also have cooperative relationships with certain of our competitors. If we are unable to enter cooperative arrangements in the future or if we lose any of our current strategic or cooperative relationships, our business could be harmed. We do not control the time and resources devoted to such activities by parties with whom we have relationships. In addition, we may not have the resources available to satisfy expectations, which may adversely affect these relationships. These relationships may not continue, may not be commercially successful, or may require our expenditure of significant financial, personnel and administrative resources from time to time. Further, certain of our products and services compete with the products and services of our strategic partners.
We may not be able to maintain effective product distribution channels, which could result in decreased revenue.
We rely on both our direct sales force and an indirect channel distribution strategy for the sale and marketing of our products. We may be unable to attract distributors, resellers and integrators, as planned, that can market our products effectively and provide timely and cost-effective customer support and service. There is also a risk that some or all of our distributors, resellers or integrators may be acquired, may change their business models or may go out of business, any of which could have an adverse effect on our business. Further, our distributors, integrators and resellers may sell competing products. The loss of important sales personnel, distributors, integrators or resellers could adversely affect us.
10
We depend on our key personnel for the success of our business and the loss of one or more of our key personnel could have an adverse effect on our ability to manage our business or could be negatively perceived in the capital markets.
Our success and our ability to manage our business depend, in large part, upon the efforts and continued service of our senior management team. The loss of one or more of our key personnel could have a material adverse effect on our business and operations. It could be difficult for us to find replacements for our key personnel, as competition for such personnel is often intense. Further, such a loss could be negatively perceived in the capital markets, which could reduce the market value of our securities.
If we fail to continue to attract and retain qualified personnel, our business may be harmed.
Our future success depends upon our ability to attract and retain highly qualified technical, sales and managerial personnel. Competition for such personnel is often intense and there can be no assurance that we can attract other highly qualified personnel in the future. If we cannot retain or are unable to hire such key personnel, our business, financial condition and results of operations could be significantly adversely affected.
Changes in our effective tax rate may have an adverse effect on our results of operations.
Our future effective tax rates may be adversely affected by a number of factors including the distribution of income among the various countries in which we operate, changes in the valuation of our deferred tax assets, increases in expenses not deductible for tax purposes, including the impairment of goodwill in connection with acquisitions, changes in share-based compensation expense, and changes in tax laws or the interpretation of such tax laws and changes in generally accepted accounting principles. Any significant increase in our future effective tax rates could adversely impact net income for future periods; and a reduction in our U.S. tax rate could negatively impact our deferred tax assets which could also adversely impact our net income.
Our worldwide income tax provisions and other tax accruals may be insufficient if any taxing authorities assume taxing positions that are contrary to our positions.
Significant judgment is required in determining our provision for income taxes and other taxes such as sales and VAT taxes. There are many transactions for which the ultimate tax outcome is uncertain. Some of these uncertainties arise as a consequence of intercompany agreements to purchase intellectual properties, allocate revenue and costs, and other factors, each of which could ultimately result in changes once the arrangements are reviewed by taxing authorities. Although we believe that our approach to determining the amount of such arrangements is reasonable, we cannot be certain that the final tax authority review of these matters will not differ materially from what is reflected in our historical income tax provisions and other tax accruals. Such differences could have a material effect on our income tax provisions or benefits, or other tax accruals, in the period in which such determination is made, and consequently, on our results of operations for such period.
Changes in global tax laws or in their interpretation or enforcement, could have a material adverse effect on our effective tax rate, results of operations, cash flows and financial condition.
We could be materially adversely affected by future changes in tax law or policy (or in their interpretation or enforcement) in the jurisdictions where we operate. These changes could be exacerbated by economic, budget or other challenges facing these jurisdictions. For example, foreign jurisdictions could impose tax rate changes along with additional corporate tax provisions that would disallow or tax perceived “base erosion” or profit shifting amongst jurisdictions. In addition, aspects of U.S. tax reform may lead foreign jurisdictions to respond by enacting additional tax legislation that results in an adverse effect on our effective tax rate, results of operations, cash flows and financial condition.
11
We may acquire or invest in companies, which may disrupt our business and divert management's attention and cause harm to our financial condition or results. We may be unable to integrate acquired businesses and technologies successfully or achieve the expected benefits of such acquisitions.
We may evaluate and consider potential strategic transactions, including acquisitions of, or investments in, complementary businesses, technologies, services, products and other assets in the future. We also may enter into relationships with other businesses to expand our products and platform, which could involve preferred or exclusive licenses, additional channels of distribution, discount pricing or investments in other companies.
Our failure to successfully structure or manage any acquisitions could seriously harm our financial condition or operating results. The expected benefits of any acquisition may not be realized. In connection with our recent acquisitions and any future purchases, we could face additional financial and operational risks, including:
|
· |
Difficulty in assimilating the operations, technology and personnel of acquired companies; |
|
· |
Disruption in our business because of the allocation of resources to consummate these transactions and the diversion of management’s attention from our existing business; |
|
· |
Difficulty in retaining key technical and managerial personnel from acquired companies; |
|
· |
Dilution of our stockholders, if we issue equity to fund these transactions; |
|
· |
Reduced liquidity, increased debt and higher amortization expenses; |
|
· |
Assumption of operating losses, increased expenses and liabilities; |
|
· |
Our relationships with existing employees, customers and business partners may be weakened or terminated as a result of these transactions; |
|
· |
Discovery of unanticipated issues and liabilities; |
|
· |
Failure to meet expected returns; and |
|
· |
Difficulty in maintaining financial reporting and internal control processes needed to be compliant with requirements applicable to companies subject to SEC reporting. |
Reported revenue may fluctuate widely due to the interpretation or application of accounting rules.
Our sales arrangements often include multiple elements, including hardware, services, software, maintenance and support. In addition, we have sold software related arrangements in multiple forms, including perpetual licenses, term-based licenses and SaaS subscriptions, each of which may be treated differently under accounting rules. The accounting rules for such arrangements are complex and subject to change from time to time. The nature of the arrangement can create variations in the timing of revenue recognition.
Provisions in various agreements potentially expose us to substantial liability for intellectual property infringement and other losses.
Our agreements with customers, solution partners and channel partners generally include provisions under which we agree to indemnify them for losses suffered or incurred as a result of claims of intellectual property infringement and, in some cases, for damages caused by us to property or persons or for other damages. In addition, we make certain representations and warranties and incur obligations under our contracts in the ordinary course of business, including for items related to data security and potential data privacy breaches. Not all of our potential losses under our contracts are covered by insurance policies, which could increase the impact of any such loss should it occur. Large
12
indemnity payments or damages resulting from our contractual obligations could harm our business, operating results and financial condition.
The evolution of our business requires more complex development and go-to-market strategies, which involve significant risk.
Our increasing focus on developing and marketing a platform of solutions for identity management, authentication, risk analysis, fraud detection, digital business processes and related areas requires different development and go-to-market strategies than our historic hardware authentication business. We are developing, buying and licensing technology weighted toward software solutions and investment in research, development, product management, sales training and senior management. This transformation strategy is currently in progress and brings with it significant risks related to our choice of solutions and our ability to execute the strategy successfully. This strategy requires a greater focus on marketing and selling product suites and software solutions rather than selling hardware products for authentication and transaction signing. Consequently, we are developing, and must continue to develop, new strategies for marketing and selling our offerings. In addition, marketing and selling new solutions to enterprises requires significant investment of time and resources in order to train our employees and educate our customers on the benefits of our new product offerings. These investments can be costly and the additional effort required to educate both customers and our own sales force can distract from efforts to sell existing products and services.
Complications with the design or implementation of our new enterprise resource planning system could adversely impact our business and operations, or not allow us to experience the anticipated benefits from our investments in new technology.
We rely extensively on information systems and technology to manage our business and summarize operating results and are in the process of a multi-year implementation of a new global enterprise resource planning (“ERP”) system and connected auxiliary applications. This ERP system has replaced our existing operating and financial systems and is designed to accurately maintain the Company’s financial records, enhance operational functionality, and provide timely information to the Company’s management team related to the operation of the business. The ERP system implementation process has required, and will continue to require, the investment of significant personnel and financial resources. We may not be able to successfully implement the ERP system without experiencing delays, increased costs and other difficulties. If we have not successfully designed, and are unable to implement the new ERP system as planned, our financial positions, results of operations, and cash flows could be negatively impacted. Additionally, if we do not effectively implement the ERP system as planned or the ERP system does not operate as intended, the effectiveness of our internal control over financial reporting could be adversely affected or our ability to assess those controls adequately could be delayed.
Risks Related to the Market
We face significant competition and if we lose or fail to gain market share our financial results will suffer.
The market for security products and services is highly competitive. Our competitors include organizations that provide security products based upon approaches similar to and different from those that we employ. Many of our competitors have significantly greater financial, marketing, technical and other competitive resources than we do. As a result, our competitors may be able to adapt more quickly to new or emerging technologies and changes in customer requirements, or to devote greater resources to the promotion and sale of their products.
A decrease of average selling prices for our products and services could adversely affect our business.
The average selling prices for our solution offerings may decline as a result of competitive pricing pressures or a change in our mix of products, software and services. In addition, competition continues to increase in the market segments in which we participate and we expect competition to further increase in the future, thereby leading to increased pricing pressures. Furthermore, we anticipate that the average selling prices and gross profits for our products will decrease over product life cycles. To maintain or realize our revenue and gross margins, we must continue to develop, or purchase and introduce new products and services that incorporate new technologies or increased
13
functionality. If we experience such pricing pressures or fail to deliver new products and services relevant to our markets, our revenue and gross margins could decline, which could harm our business, financial condition and results of operations.
We may need additional capital in the future and our failure to obtain capital would interfere with our growth strategy.
Our ability to obtain financing will depend on a number of factors, including market conditions, our operating performance and investor or creditor interest. These factors may make the timing, amount, terms and conditions of any financing unattractive. They may also result in our incurring additional indebtedness or accepting stockholder dilution. If adequate funds are not available or are not available on acceptable terms, we may have to forego strategic acquisitions or investments, defer our product development activities, or delay the introduction of new products.
We experience variations in quarterly operating results and sales are subject to seasonality, both of which may result in a volatile stock price.
In the future, as in the past, our quarterly operating results may vary significantly, resulting in a volatile stock price. Factors affecting our operating results include:
|
· |
The level of competition; |
|
· |
The size, timing, cancellation or rescheduling of significant orders; |
|
· |
New product announcements or introductions by competitors; |
|
· |
Technological changes in the market for security products including the adoption of new technologies and standards; |
|
· |
Changes in pricing by competitors; |
|
· |
Our ability to develop, introduce and market new products and product enhancements on a timely basis, if at all; |
|
· |
Component costs and availability; |
|
· |
Achievement of significant market share in particular markets followed by declines as buying cycles may be multiple years apart; |
|
· |
The variability of revenue realized from individual customers as their buying patterns can vary significantly from period to period and is affected by the individual solutions purchased and the structure of the contract; |
|
· |
Our success in expanding our sales and marketing programs; |
|
· |
Market acceptance of new products and product enhancements; |
|
· |
Changes in foreign currency exchange rates; and |
|
· |
General economic conditions in the countries in which we operate. |
We also experience seasonality or variation across the year in our markets. These trends can include the summer months, particularly in Europe, or the second half of the fiscal year is generally higher than the first half in terms of sales.
14
Our stock price may be volatile for reasons other than variations in our quarterly operating results.
The market price of our common stock may fluctuate significantly in response to factors, some of which are beyond our control, including the following:
|
· |
Actual or anticipated fluctuations in our quarterly or annual operating results; |
|
· |
Differences between actual operating results and results estimated by analysts that follow our stock and provide estimates of our results to the market; |
|
· |
Differences between guidance relative to financial results, if given, and actual results; |
|
· |
Changes in market valuations of other technology companies, and cybersecurity companies in particular; |
|
· |
Investor acceptance of our strategies and the perception of our success in executing those strategies; |
|
· |
Announcements by us or our competitors of significant technical innovations, contracts, acquisitions, strategic partnerships, joint ventures or capital commitments; |
|
· |
Additions or departures of key personnel; |
|
· |
Future sales of common stock; |
|
· |
The inclusion or exclusion of our stock in ETF’s, indices and other benchmarks, and changes made to methodologies connected therewith; |
|
· |
Trading volume fluctuations; and |
|
· |
Reactions by investors to uncertainties in the world economy and financial markets. |
A small group of persons control a substantial amount of our common stock and could delay or prevent a change of control.
Our Board of Directors, our officers and their immediate families and related entities beneficially own approximately 19%, with Mr. T. Kendall Hunt beneficially owning approximately 17%, of the outstanding shares of our common stock. As a director and our largest stockholder, Mr. Hunt may exercise substantial control over our future direction and operations and such concentration of control may have the effect of discouraging, delaying or preventing a change in control and may also have an adverse effect on the market price of our common stock.
Additionally, Blackrock, Inc. holds approximately 12% of ownership, Legion Partners Asset Management holds approximately 5% of ownership, and The Vanguard Group holds approximately 5% of ownership.
Certain provisions of our charter and of Delaware law make a takeover of our Company more difficult.
Our corporate charter and Delaware law contain provisions, such as a class of authorized but unissued preferred stock which may be issued by our board without stockholder approval that might enable our management to resist a takeover of our Company. Delaware law also limits business combinations with interested stockholders. These provisions might discourage, delay or prevent a change in control or a change in our management. These provisions could also discourage proxy contests and make it more difficult for stockholders to elect directors and take other corporate actions. The existence of these provisions could limit the price that investors might be willing to pay in the future for shares of our common stock.
15
Future issuances of blank check preferred stock may reduce voting power of common stock and may have anti-takeover effects that could prevent a change in control.
Our corporate charter authorizes the issuance of up to 500,000 shares of preferred stock with such designations, rights, powers and preferences as may be determined from time to time by our Board of Directors, including such dividend, liquidation, conversion, voting or other rights, powers and preferences as may be determined from time to time by the Board of Directors without further stockholder approval. The issuance of preferred stock could adversely affect the voting power or other rights of the holders of common stock. In addition, the authorized shares of preferred stock and common stock could be utilized, under certain circumstances, as a method of discouraging, delaying or preventing a change in control.
Risks Related to Technology and Intellectual Property
Technological changes occur rapidly in our industry and our development of new products is critical to maintain our revenue.
The introduction by our competitors of products embodying new technologies and the emergence of new industry standards could render our existing products obsolete and unmarketable. Our future revenue growth and operating profit will depend in part upon our ability to enhance our current products and develop innovative new solutions to distinguish us from the competition and to meet customers’ changing needs. Security-related product developments and technology innovations by others may adversely affect our competitive position and we may not successfully anticipate or adapt to changing technology, industry standards or customer requirements on a timely basis.
Our business could be negatively impacted by cyber security incidents and other disruptions.
Our use of technology is increasing and is critical in at least three primary areas of our business:
|
1. |
Software and information systems that we use to help us run our business more efficiently and cost effectively, which are increasingly cloud-based tools; |
|
2. |
The products we have traditionally sold and continue to sell to our customers contain technology that incorporates the use of secret numbers and encryption technology; and |
|
3. |
Solutions delivered on a software-as-a-service basis, from both public and private cloud models, which may process and store confidential, personal, health and financial information and which may rely on third parties for some or all of the solution. |
A cyber incident in any of these areas of our business could disrupt our ability to take orders or deliver products or services to our customers, cause us to suffer significant monetary and other losses and significant reputational harm, or substantially impair our ability to grow the business. We expect that there will continue to be hacking attempts intended to capture business information or exploit computing power to impede the performance of our products, to access our customers’ information, or harm our reputation as a company. The processes used by hackers to access or sabotage technology products, services and networks are evolving in sophistication and increasing in frequency. We could experience a security incident due to various causes including intentional or unintentional conduct of our employees, vendors, technology partners and others that have access to or store our information.
In July 2011, we discovered a cyber-incident related to DigiNotar B.V. shortly after we purchased the company. The hacking incident at DigiNotar B.V. led to the termination of DigiNotar B.V’s registration as a certification service provider and DigiNotar B.V.’s bankruptcy. Since that time, we have experienced several security incidents, although none have been material. Even though we have established teams, processes and strategies to protect our corporate and solution assets, we may incur losses from such events as a result of unanticipated costs associated with data security incidents.
16
In addition, because we are in the cyber security industry, we could be targeted by hackers more than other companies and if a material cyber security breach occurred related to corporate or customer information, the reputational harm and potential lost future business could be greater than other companies not in our industry. We have taken various measures to strengthen the security of our products and our systems, to establish information security governance procedures and to train our employees. However, we are the subject of a large volume of hacking attempts and our defenses might not always be effective. If a hacking attempt were to be successful and lead to a material data breach, then it could harm our business, financial condition and results of operations, both in the current period and for a significant future period of time.
We rely upon Amazon Web Services to operate portions of our platform and any disruption of or interference with our use of Amazon Web Services or other vendors’ material would adversely affect our business, results of operations and financial condition
We outsource portions of our cloud infrastructure to Amazon Web Services, or AWS. Customers of our products need to be able to access our platform at any time, without interruption or degradation of performance. AWS runs its own platform that we access, and we are, therefore, vulnerable to service interruptions at AWS. We have experienced and expect that in the future we may experience interruptions, delays and outages in service and availability from time to time due to a variety of factors, including infrastructure changes, human or software errors, website hosting disruptions and capacity constraints. Capacity constraints could be due to a number of potential causes including technical failures, natural disasters, fraud or security attacks. In addition, if our security, or that of AWS, is compromised, our products or platform are unavailable or our users are unable to use our products within a reasonable amount of time or at all, then our business, results of operations and financial condition could be adversely affected. In some instances, we may not be able to identify the cause or causes of these performance problems within a period of time acceptable to our customers. It may become increasingly difficult to maintain and improve our platform performance, especially during peak usage times, as our products become more complex and the usage of our products increases. To the extent that we do not effectively address capacity constraints, either through AWS or alternative providers of cloud infrastructure, our business, results of operations and financial condition may be adversely affected. In addition, any changes in service levels from AWS may adversely affect our ability to meet our customers' requirements.
Any of the above circumstances or events may harm our reputation, possibly move customers to stop using our products, impair our ability to increase revenue from existing customers, impair our ability to grow our customer base, subject us to financial penalties and liabilities under our service level agreements and otherwise harm our business, results of operations and financial condition. These risks are also present with our other cloud service infrastructure vendors beside AWS. In addition, we also utilize strategic vendors to resell or incorporate third party technology and if these material vendors experienced a data breach, outage in service or other failure, we could be prevented from meeting our customers’ requirements.
Some of our products contain third-party, open-source software and failure to comply with the terms of the underlying open-source software licenses could restrict our ability to sell our products or otherwise result in claims against us.
Our products are distributed with software programs licensed to us by third-party authors under open-source licenses, which may include the GNU General Public License, the GNU Lesser Public License, the BSD License and the Apache License. Third-party, open-source programs are typically licensed to us for no fee and the underlying license agreements could require us to make available to users the source code for such programs, as well as the source code for any modifications or derivative works we create based on these third-party, open-source software programs.
We do not provide end users a copy of the source code to our proprietary software because we believe that the manner in which our proprietary software is aligned or communicates with the relevant open-source programs does not create a modification, derivative work or extended version of, or a work based on, that open-source program requiring the distribution of our proprietary source code.
17
Our ability to commercialize our products by incorporating third-party, open-source software may be restricted because, among other reasons:
|
· |
the terms of open-source license agreements are unclear and subject to varying interpretations, which could result in unforeseen obligations regarding our proprietary products or claims of infringement; |
|
· |
it may be difficult to determine the developers of open-source software and whether such licensed software infringes another party’s intellectual property rights; |
|
· |
competitors may have equal access to these open source products, which may help them develop competitive products; and |
|
· |
open-source software potentially increases customer support costs because licensees can modify the software and potentially introduce errors, which could also increase the risk of vulnerabilities available to hackers. |
We must continue to attract and retain highly skilled technical personnel for our research and development efforts.
The market for highly skilled technical talent is highly competitive. If we fail to attract, train, assimilate and retain qualified technical personnel for our research and development and product management efforts, we will experience delays or failures in introductions of new or modified products, and services, failures in adequate analysis of technology or acquisitions in the market, loss of clients and market share and a reduction in revenue.
We cannot be certain that our research and development activities will be successful.
While management is committed to enhancing our current product offerings and introducing new products, we cannot be certain our research and development activities will be successful. Furthermore, we may not have sufficient financial resources to identify and develop new technologies and bring new products to market in a timely and cost effective manner, and we cannot ensure that any such products will be commercially successful.
Failure to effectively manage our product and service lifecycles could harm our business.
As part of the natural lifecycle of our products and services, we periodically inform customers that products or services will be reaching their end of life or end of availability and will no longer be supported or receive updates and security patches. Failure to effectively manage our product and service lifecycles could lead to customer dissatisfaction and contractual liabilities, which could adversely affect our business and operating results.
SaaS offerings, which involve various risks, constitute an important part of our business.
As we continue to acquire, develop and offer SaaS versions of products, we will need to continue to evolve our processes to meet a number of regulatory, intellectual property, contractual and service compliance challenges. These challenges include compliance with licenses for open source and third party software embedded in our SaaS offerings, maintaining compliance with export control and privacy regulations, including HIPAA and GDPR, protecting our services from external threats, maintaining continuous service levels and data security expected by our customers, preventing inappropriate use of our services and adapting our go-to-market efforts. In addition to using our internal resources, we also utilize third party resources to deliver SaaS offerings, such as third party data hosting vendors. The failure of a third party provider to prevent service disruptions, data losses or security breaches may require us to issue credits or refunds or indemnify or otherwise be liable to customers or third parties for damages that may occur. Additionally, if these third-party providers fail to deliver on their obligations, our reputation could be damaged, our customers could lose confidence in us and our ability to maintain and expand our SaaS offerings. Finally, our SaaS offerings need to be designed to operate at significant transaction volumes. When combined with third party software
18
and hosting infrastructure, our SaaS offerings may not perform as designed which could lead to service disruptions and associated damages.
We depend significantly upon our proprietary technology and intellectual property and the loss of or successful challenge to our proprietary rights could require us to divert management attention and could reduce revenue and increase our operating costs.
From time to time, we receive claims that we have infringed the intellectual property rights of others, including claims regarding patents, copyrights, and trademarks. Because of constant technological change in the segments in which we compete, the extensive patent coverage of existing technologies, and the rapid rate of issuance of new patents, it is possible that the number of these claims may grow. In addition, former employers of our former, current, or future employees may assert claims that such employees have improperly disclosed to us the confidential or proprietary information of these former employers. Any such claim, with or without merit, could result in costly litigation and distract management from day-to-day operations. If we are not successful in defending such claims, we could be required to stop selling, delay shipments, redesign our products, pay monetary amounts as damages, enter into royalty or licensing arrangements, or satisfy indemnification obligations with our customers. Royalty or licensing arrangements we may seek in such circumstances may not be available to us on commercially reasonable terms or at all. We have made and expect to continue making significant expenditures to establish our intellectual property rights and to investigate, defend and settle claims related to the use of technology and intellectual property rights as part of our strategy to manage this risk. In addition, we license and use software from third parties in our business. These third party software licenses may not continue to be available to us on acceptable terms or at all, and may expose us to additional liability. This liability, or our inability to use any of this third party software or technology, could result in shipment delays or other disruptions in our business that could materially and adversely affect our operating results.
We rely principally on trade secrets to protect much of our intellectual property in cases where we do not believe patent protection is appropriate or obtainable. However, trade secrets are difficult to protect. Although our employees are subject to confidentiality obligations, this protection may be inadequate to deter or prevent misappropriation of our confidential information. We may be unable to detect unauthorized use of our intellectual property or otherwise take appropriate steps to enforce our rights. Failure to obtain or maintain trade secret protection could adversely affect our competitive business position. If we are unable to prevent third parties from infringing or misappropriating our copyrights, trademarks or other proprietary information, our competitive position could be adversely affected. In the course of conducting our business, we may inadvertently infringe the intellectual property rights of others, resulting in claims against us or our customers. Our contracts generally indemnify our customers for third-party claims for intellectual property infringement by the services and products we provide. In the past, we have resolved several claims of patent infringement brought against us and a claim brought against a customer related to our technology. None of these claims were material to our financial results but this may not always be the case. The expense of defending these claims may adversely affect our financial results and may not be covered by any insurance policies we maintain. In addition, any such disputes and litigation could divert management attention and harm our reputation in the market.
Our patents may not provide us with competitive advantages.
We hold numerous patents in the United States and in other countries, which cover multiple aspects of our technology. A substantial part of our patents cover the Digipass product line. Our patents expire between now and more than 10 years from now. There can be no assurance that we will continue to develop proprietary products or technologies that are patentable, that any issued patent will provide us with any competitive advantages or will not be challenged by third parties, or that patents of others will not hinder our competitive advantage. Although certain of our technologies are patented, there are other organizations that offer products with comparable functionality that employ different technological solutions and compete with us for market share.
We are subject to warranty and product liability risks.
A malfunction of or design defect in our products which results in a breach of a legal obligation or physical harm or damage from our products could result in tort or warranty claims against us. We seek to reduce the risk of these
19
losses by using qualified engineers in the design, manufacturing and testing of our hardware products, proper development and testing of our software solutions, attempting to negotiate warranty disclaimers and liability limitation clauses in our sales agreements, and maintaining customary insurance coverage. However, these measures may ultimately prove ineffective in limiting our liability for damages.
In addition to any monetary liability for the failure of our products, an actual or perceived breach of network or security at one of our customers or publicly known defect or perceived defect in our products could adversely affect the market’s perception of us and our products, and could have an adverse effect on our reputation and the demand for our products. Similarly, an actual or perceived breach of security within our own systems could damage our reputation and have an adverse effect on the demand for our products.
There is significant government regulation of technology imports and exports and to the extent we cannot meet the requirements of the regulations we may be prohibited from exporting some of our products, which could negatively impact our revenue.
Our international sales and operations are subject to risks such as the imposition of government controls, new or changed export license requirements, restrictions on the export of critical technology, trade restrictions and changes in tariffs. If we are unable to obtain regulatory approvals on a timely basis our business may be impacted. Certain of our products are subject to export controls under U.S. law. The list of products and countries for which export approval is required, and the regulatory policies with respect thereto, may be revised from time to time and our inability to obtain required approvals under these regulations could materially and adversely affect our ability to make international sales. Violations of export control and international trade laws could result in penalties, fines, adverse reputational consequences, and other materially adverse consequences. In the past, we voluntarily disclosed a trade control matter to the U.S. government. Although this matter was closed during 2018 with no fines, penalties, or finding of wrongdoing, we cannot guarantee that such issues will not arise in the future. In addition, we cannot predict the future government regulation of aspects of our business and such regulation could be detrimental to our results.
We employ cryptographic technology in our authentication products that uses complex mathematical formulations.
A portion of our products are based on cryptographic technology. With cryptographic technology, a user is given a key that is required to encrypt and decode messages. The security afforded by this technology depends on the integrity of a user’s key and in part on the application of algorithms, which are advanced mathematical factoring equations. These codes may eventually be broken or become subject to government regulation regarding their use, which would render our technology and products less effective. The occurrence of any one of the following could result in a decline in demand for our technology and products:
|
· |
Any significant advance in techniques for attacking cryptographic systems, including the development of an easy factoring method or faster, more powerful computers; |
|
· |
Publicity of the successful decoding of cryptographic messages or the misappropriation of keys; and |
|
· |
Increased government regulation limiting the use, scope or strength of cryptography. |
Risks Related to International Operations
We face a number of risks associated with our international operations, any or all of which could result in a disruption in our business and a decrease in our revenue.
In 2019, approximately 76% of our revenue and approximately 72% of our operating expenses were generated/incurred outside of the U.S. In 2018, approximately 74% of our revenue and approximately 79% of our operating expenses were generated/incurred outside of the U.S. In 2017, approximately 72% of our revenue and approximately 76% of our operating expenses were generated/incurred outside of the U.S. A severe economic decline in any of our major foreign markets could adversely affect our results of operations and financial condition.
20
In addition to exposures to changes in the economic conditions of our major foreign markets, we are subject to a number of risks any or all of which could result in a disruption in our business and a decrease in our revenue. These include:
|
· |
Inconsistent regulations and unexpected changes in regulatory requirements; |
|
· |
Export controls relating to our technology; |
|
· |
Difficulties and costs of staffing and managing international operations, including maintaining internal controls and closing or restructuring such operations; |
|
· |
Potentially adverse tax consequences; |
|
· |
Wage and price controls or protection; |
|
· |
Uncertain protection for intellectual property rights, contractual rights and collecting accounts receivable; |
|
· |
Imposition of trade barriers; |
|
· |
Differing technology standards; |
|
· |
Uncertain demand for our solutions in individual countries, even if there were past sales; |
|
· |
Linguistic and cultural differences; |
|
· |
A widely distributed workforce; |
|
· |
Difficulty in providing support and training to customers in certain international locations; |
|
· |
Economic and political instability; and |
|
· |
Social unrest, health crises, and cultural barriers or changes. |
We are subject to foreign currency exchange rate fluctuations and risks, and improper management of that risk could adversely affect our business, results of operations, and financial conditions.
Because a significant number of our principal customers are located outside the United States, we expect that international sales will continue to generate a significant portion of our total revenue. We are subject to foreign exchange fluctuations and risks because the majority of our product costs are denominated in U.S. Dollars, whereas a significant portion of the sales and expenses of our foreign operating subsidiaries are denominated in various foreign currencies. A decrease in the value of any of these foreign currencies relative to the U.S. Dollar could adversely affect our revenue and profitability in U.S. Dollars of our products sold in these markets. We do not currently hold forward exchange contracts to exchange foreign currencies for U.S. Dollars to offset currency rate fluctuations.
Changes in the European regulatory environment regarding privacy and data protection regulations could have a material adverse impact on our results of operations.
In Europe, we are subject to the 1995 European Union (“EU”) Directive on Data Protection (“1995 Data Protection Directive”), which requires EU member states to impose minimum restrictions on the collection and use of personal data that, in some respects, are more stringent, and impose more significant burdens on subject businesses, than current privacy standards in the United States. We may also face audits or investigations by one or more foreign government agencies relating to our compliance with these regulations that could result in the imposition of penalties or fines. The EU member state regulations establish several obligations that organizations must follow with respect to use
21
of personal data, including a prohibition on the transfer of personal information from the EU to other countries whose laws do not protect personal data to an adequate level of privacy or security. In addition, certain member states have adopted more stringent data protection standards. The Company addressed these requirements by certification to the U.S.-EU Safe Harbor Frameworks prior to such Frameworks being invalidated in October 2015 by the European Court of Justice. The General Data Protection Regulation (“GDPR”) replaced the 1995 Data Protection Directive effective May 25, 2018, creating significant impacts on how businesses can collect and process the personal data of EU individuals. We have expended significant resources to comply, but those methods may be subject to scrutiny by data protection authorities in EU member states. The costs of compliance with, and other burdens imposed by, such laws, regulations and policies that are applicable to us may limit our use of personal data and solutions and could have a material adverse impact on our results of operations.
We must comply with governmental regulations setting environmental standards.
Governmental regulations setting environmental standards influence the design, components or operation of our products. New regulations and changes to current regulations are always possible and, in some jurisdictions, regulations may be introduced with little or no time to bring related products into compliance with these regulations. Our failure to comply with these regulations may prevent us from selling our products in a certain country. In addition, these regulations may increase our cost of supplying the products by forcing us to redesign existing products or to use more expensive designs or components. In these cases, we may experience unexpected disruptions in our ability to supply customers with products, or we may incur unexpected costs or operational complexities to bring products into compliance. This could have an adverse effect on our revenues, gross profit margins and results of operations and increase the volatility of our financial results.
We are subject to the Restriction on the Use of Hazardous Substances Directive 2002/95/EC (also known as the “RoHS Directive”) and the Waste Electrical and Electronic Equipment Directive (also known as the “WEEE Directive”). These directives restrict the distribution of products containing certain substances, including lead, within applicable geographies and require a manufacturer or importer to recycle products containing those substances.
These directives affect the worldwide electronics and electronics components industries as a whole. If we or our customers fail to comply with such laws and regulations, we could incur liabilities and fines and our operations could be suspended.
The vote by the United Kingdom (UK) to leave the European Union (EU) could adversely affect our financial results.
In June 2016, UK voters approved a referendum to withdraw the UK's membership from the EU, which is commonly referred to as "Brexit". We have operations in the UK and the EU, and as a result, we face risks associated with the potential uncertainty and disruptions that may follow Brexit, including with respect to volatility in exchange rates and interest rates and potential material changes to the regulatory regime applicable to our operations in the UK. Brexit could adversely affect European or worldwide political, regulatory, economic or market conditions and could contribute to instability in global political institutions, regulatory agencies and financial markets. Any of these effects of Brexit, and others we cannot anticipate or that may evolve over time, could adversely affect our business, financial condition, and operating results.
We or our suppliers may be impacted by new regulations related to climate change.
In addition to the European environmental regulations noted above, we or our suppliers may become subject to new laws enacted with regards to climate change. In the event that new laws are enacted or current laws are modified in countries in which we or our suppliers operate, our flow of product may be impacted and/or the costs of handling the potential waste associated with our products may increase dramatically, either of which could result in a significant negative impact on our ability to operate or operate profitably.
22
The effects of regulations relating to conflict minerals may adversely affect our business.
The Dodd-Frank Wall Street Reform and Consumer Protection Act contains provisions to improve transparency and accountability concerning the supply of certain minerals and derivatives (collectively “Conflict Minerals”) which may originate from the conflict zones of the Democratic Republic of Congo (DRC) and adjoining countries (collectively, “Covered Countries”). As a result, in August 2012 the SEC established annual disclosure and reporting requirements for companies using Conflict Minerals in their products, including products manufactured by third parties. Like many electronic devices, our hardware products contain Conflict Minerals and are subject to the disclosure and reporting requirements. Compliance with these rules also requires due diligence including country of origin inquiries to determine the sources of Conflict Minerals used in our products.
As required, we filed our annual reports related to products manufactured. We reported that we determined we had no reason to believe Conflict Minerals used in our products may have originated in Covered Countries.
We may incur continued costs associated with complying with these disclosure requirements. These requirements may affect pricing, sourcing and availability of Conflict Minerals used to produce our devices. We may be unable to verify the origin of all Conflict Minerals in our products. We may encounter challenges with customers and stakeholders if we are unable to certify that our products are conflict free.
U.S. investors may have difficulties in making claims for any breach of their rights as holders of shares because some of our assets and key employees are not located in the United States.
Several of our key employees are full-time or part-time residents of foreign countries, and a substantial portion of our assets and those of some of our key employees are located in foreign countries. As a result, it may not be possible for investors to effect service of process on those persons located in foreign countries, or to enforce judgments against some of our key employees based upon the securities or other laws of jurisdictions in those foreign countries.
Our business in countries with a history of corruption and transactions with foreign governments increase the risks associated with our international activities.
We are subject to the U.S. Foreign Corrupt Practices Act (FCPA), and other laws that prohibit improper payments or offers of payments to foreign governments and their officials and political parties by U.S. and other business entities for the purpose of obtaining or retaining business. We have operations, deal with and make sales to governmental or quasi-governmental customers in countries known to experience corruption, particularly certain countries in the Middle East, Africa, East Asia and South and Central America, and further expansion of our international selling efforts may involve additional regions. Our activities in these countries create the risk of unauthorized payments or offers of payments by one of our employees, consultants, sales agents or channel partners that could be in violation of various laws, including the FCPA and the U.K. Bribery Act, even though these parties are not always subject to our control. Violations of the FCPA may result in severe criminal or civil sanctions, including suspension or debarment from U.S. government contracting, and we may be subject to other liabilities, which could negatively affect our business, operating results and financial condition. Violations of the U.K. Bribery Act may result in severe criminal or civil sanctions and we may be subject to other liabilities that could negatively affect our business operating results and financial condition.
Item 1B - Unresolved Staff Comments
None.
Our corporate headquarters is located in Chicago, Illinois. Our international headquarters is in Zurich, Switzerland. Our European operational headquarters is in Brussels, Belgium, along with our logistics facility. We conduct sales and marketing, research and development and customer support activities from various locations. Our
23
primary global research and development center is in Montreal, Canada. We have additional research and development facilities in the Netherlands, Cambridge, United Kingdom, Bordeaux, France and Vienna, Austria.
We have sales personnel in our offices near Boston, Massachusetts, Sydney, Australia, Singapore, Tokyo, Japan, Sao Paulo, Brazil, Dubai, Zurich, Switzerland, Chicago, Illinois, London, United Kingdom, and in several field offices around the world.
All of our properties are leased.
We are a party to or have intellectual property subject to litigation and other proceedings that arise in the ordinary course of our business. These types of matters could result in fines, penalties, compensatory or treble damages or non-monetary sanctions or relief. We believe the probability is remote that the outcome of each of these matters, including the legal proceedings described below, will have a material adverse effect on the corporation as a whole, notwithstanding that the unfavorable resolution of any matter may have a material effect on our financial results in any particular interim reporting period. Among the factors that we consider in this assessment are the nature of existing legal proceedings and claims, the asserted or possible damages or loss contingency (if estimable), the progress of the case, existing law and precedent, the opinions or views of legal counsel and other advisers, our experience in similar cases and the experience of other companies, the facts available to us at the time of assessment and how we intend to respond to the proceeding or claim. Our assessment of these factors may change over time as individual proceedings or claims progress.
Although we cannot predict the outcome of legal or other proceedings with certainty, where there is at least a reasonable possibility that a loss may have been incurred, U.S. GAAP requires us to disclose an estimate of the reasonably possible loss or range of loss or make a statement that such an estimate cannot be made. We follow a process in which we seek to estimate the reasonably possible loss or range of loss, and only if we are unable to make such an estimate do we conclude and disclose that an estimate cannot be made. Accordingly, unless otherwise indicated below in our discussion of legal proceedings, a reasonably possible loss or range of loss associated with any individual legal proceeding cannot be estimated.
We include various types of indemnification clauses in our agreements. These indemnifications may include, but are not limited to, infringement claims related to our intellectual property, direct damages and consequential damages. The type and amount of such indemnifications vary substantially based on our assessment of risk and reward associated with each agreement. We believe the estimated fair value of these indemnification clauses is minimal, and we cannot determine the maximum amount of potential future payments, if any, related to such indemnification provisions. We have no liabilities recorded for these clauses as of December 31, 2019.
On March 14, 2017, a complaint was filed in the United States District Court for the District of Massachusetts, captioned StrikeForce Technologies, Inc. v. Vasco Data Security International, Inc., et al., claiming the Company infringed on certain patent rights of the plaintiff. On May 8, 2017, the Company answered the complaint denying the allegations of patent infringement. The parties then engaged in motion practice and discovery in the case. The plaintiff has also brought suit against various other companies in the cybersecurity industry. In one such suit in the federal district court for the Central District of California, on December 1, 2017, the court granted defendant’s motion to dismiss, finding that the StrikeForce asserted claims are invalid. StrikeForce appealed such decision. In light of such ruling, on December 20, 2017, the court in the Company’s case granted a stay of the proceedings pending the appeal in the related case. On April 16, 2019, the Court dismissed the claims of StrikeForce against us with prejudice. We consider this case to be closed.
From time to time, we have been involved in the litigation incidental to the conduct of our business. Excluding matters disclosed above, we are not a party to any lawsuit or proceeding that, in management’s opinion, is likely to have a material adverse effect on its business, financial condition or results of operations.
24
Item 4 - Mine Safety Disclosures
Not applicable.
Item 5 - Market for Registrant’s Common Equity, Related Stockholder Matters and Issuer Purchases of Equity Securities
Our common stock, par value $0.001 per share, trades on the NASDAQ Capital Market under the symbol OSPN. Prior to June 1, 2018, our common stock traded on the NASDAQ Capital Market under the symbol VDSI.
The following table sets forth the range of high and low daily closing prices of our common stock on the NASDAQ Capital Market for the past two years.
|
|
|
|
|
|
|
|
|
2019 |
|
High |
|
Low |
||
|
Fourth quarter |
|
$ |
19.74 |
|
$ |
14.13 |
|
Third quarter |
|
|
16.68 |
|
|
12.95 |
|
Second quarter |
|
|
19.41 |
|
|
13.40 |
|
First quarter |
|
|
21.55 |
|
|
12.40 |
|
|
|
|
|
|
|
|
|
2018 |
|
High |
|
Low |
||
|
Fourth quarter |
|
$ |
19.08 |
|
$ |
12.21 |
|
Third quarter |
|
|
20.85 |
|
|
16.30 |
|
Second quarter |
|
|
23.15 |
|
|
12.60 |
|
First quarter |
|
|
14.95 |
|
|
12.05 |
On March 1, 2020, there were 64 registered holders and approximately 10,878 street name holders of the Company’s common stock.
We have not paid any dividends on our common stock since incorporation. The declaration and payment of dividends will be at the sole discretion of the Board of Directors and subject to certain limitations under the General Corporation Law of the State of Delaware. The timing, amount and form of dividends, if any, will depend, among other things, on the Company’s results of operations, financial condition, cash requirements, plans for expansion and other factors deemed relevant by the Board of Directors. The Company intends to retain any future earnings for use in its business and therefore does not anticipate paying any cash dividends in the foreseeable future.
Recent Sales of Unregistered Securities
None
25
Issuer Purchases of Equity Securities
The following table provides information about purchases by the Company of its shares of common stock during the three month period ended December 31, 2019:
|
|
|
|
|
|
|
|
Total Number |
|
|
|
|
|
|
|
|
|
|
of Shares |
|
Maximum |
|
|
|
|
|
|
|
|
Purchased as |
|
Number of Shares |
|
|
|
Total |
|
|
|
Part of Publicly |
|
that May Yet Be |
|
|
|
|
Number of |
|
Average |
|
Announced |
|
Purchased Under |
|
|
|
|
Shares Purchased |
|
Price Paid |
|
Plans or |
|
the Plans or |
|
|
Period |
|
(1) |
|
per Share |
|
Programs (2) |
|
Programs (2) |
|
|
October 1, 2019 through October 31, 2019 |
|
1,513 |
|
$ |
17.81 |
|
— |
|
— |
|
November 1, 2019 through November 30, 2019 |
|
— |
|
|
— |
|
— |
|
— |
|
December 1, 2019 through December 31, 2019 |
|
1,731 |
|
$ |
19.20 |
|
— |
|
— |
|
(1) |
All transactions represent surrender of vested shares in satisfaction of tax withholdings by grantees under the Company’s Equity Incentive Plans. |
|
(2) |
The Company has no publicly announced plans or programs to repurchase its shares. |
Stock Performance Graph
The Stock Performance Graph below compares the cumulative total return through December 31, 2019, assuming reinvestment of dividends, by an investor who invested $100.00 on December 31, 2013, in each of (i) our common stock, (ii) the Russell 2000 index, (iii) the Standard Industrial Code Index 3577 – Computer Peripheral Equipment, NEC and (iv) a comparable industry (the peer group) index selected by the Company. The peer group for this purpose consists of: American Software, Inc., Appian Corporation, Barracuda Networks, Inc., BlackLine, Inc., Callidus Software, Inc., Carbonite, Inc., CPI Card Group, Inc., FireEye, Inc., Gigamon, Inc., Imperva, Inc., Mobilelron, Inc., ProofPoint, Inc., PROS Holdings, Inc., Q2 Holdings, Inc., QAD, Inc., Qualys, Inc., Rapid7, Inc., SecureWorks Corp., Varonis Systems, Inc. The stock price performance shown on the graph below is not necessarily indicative of future price performance.
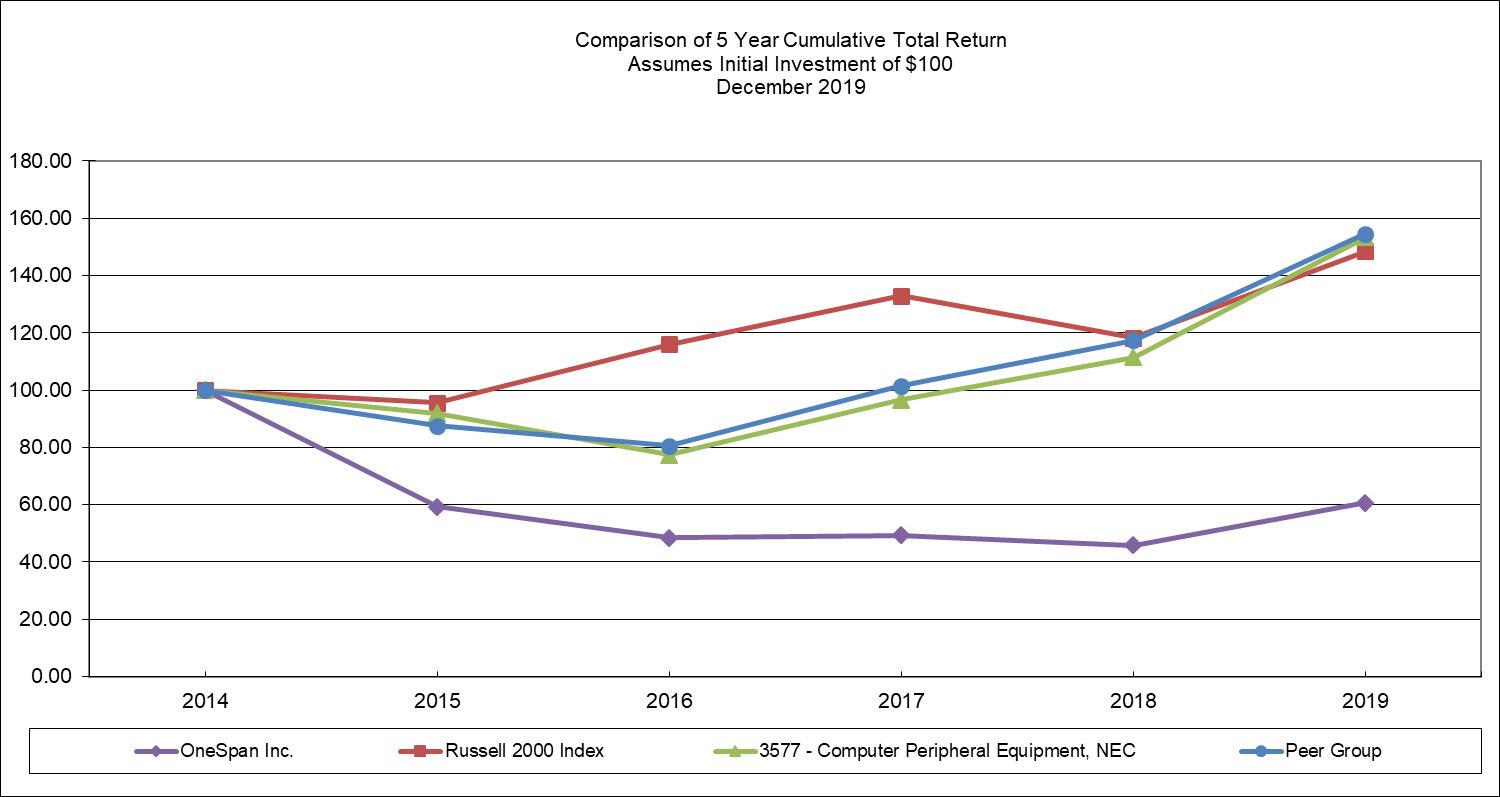
26
Item 6 - Selected Financial Data (in thousands, except per share data)
|
|
|
|
|
|
|
|
|
|
|
|
|
|
|
|
|
|
|
|
Year Ended December 31, |
|||||||||||||
|
|
|
2019 |
|
2018 |
|
2017* |
|
2016* |
|
2015* |
|||||
|
Statements of Operations Data: |
|
|
|
|
|
|
|
|
|
|
|
|
|
|
|
|
Revenue |
|
$ |
254,570 |
|
$ |
212,280 |
|
$ |
193,291 |
|
$ |
192,304 |
|
$ |
241,443 |
|
Operating income |
|
|
15,275 |
|
|
24 |
|
|
6,192 |
|
|
9,599 |
|
|
50,453 |
|
Net income (loss) |
|
|
8,789 |
|
|
3,846 |
|
|
(22,399) |
|
|
10,514 |
|
|
42,151 |
|
Diluted net income (loss) per common share |
|
|
0.22 |
|
|
0.10 |
|
|
(0.56) |
|
|
0.27 |
|
|
1.06 |
|
|
|
|
|
|
|
|
|
|
|
|
|
|
|
|
|
|
Balance Sheet Data: |
|
|
|
|
|
|
|
|
|
|
|
|
|
|
|
|
Cash and equivalents |
|
$ |
84,282 |
|
$ |
76,708 |
|
$ |
78,661 |
|
$ |
49,345 |
|
$ |
78,522 |
|
Working capital |
|
|
137,506 |
|
|
119,599 |
|
|
161,784 |
|
|
139,199 |
|
|
127,675 |
|
Total assets |
|
|
384,570 |
|
|
352,826 |
|
|
337,622 |
|
|
327,270 |
|
|
311,827 |
|
Long term obligations |
|
|
46,436 |
|
|
28,028 |
|
|
33,539 |
|
|
6,148 |
|
|
11,197 |
|
Total stockholders equity |
|
|
264,021 |
|
|
252,441 |
|
|
237,930 |
|
|
253,162 |
|
|
245,156 |
|
Cash dividends declared per common share |
|
|
— |
|
|
— |
|
|
— |
|
|
— |
|
|
— |
*Prior period amounts are presented under ASC 605 and ASC 985-605.
Item 7 - Management’s Discussion and Analysis of Financial Condition and Results of Operations (in thousands, except head count, ratios, time periods and percentages)
The following discussion and analysis of our financial condition and results of operations should be read in conjunction with our financial statements and related notes appearing elsewhere in this Annual Report on Form 10-K. In addition to historical financial information, the following discussion may contain predictions, estimates and other forward-looking statements that involve a number of risks and uncertainties, including those discussed under Item 1A and elsewhere in this Form 10-K. These risks could cause our actual results to differ materially from any future performance suggested below. Please see “Cautionary Statement for Purposes of the Safe Harbor Provisions of the Private Securities Litigation Reform Act of 1995” at the beginning of this Form 10-K.
The Company has excluded discussion of the comparison of the years ended December 31, 2018 and 2017 from this Form 10-K., which can be found in the annual report on Form 10-K for the period ended December 31, 2018, filed on March 15, 2019.
Overview
We design, develop and market digital solutions for identity, security, and business productivity that protect and facilitate electronic transactions via mobile and connected devices. We are a global leader in providing anti-fraud and digital transaction management solutions to financial institutions and other businesses. Our solutions secure access to online accounts, data, assets, and applications for global enterprises; provide tools for application developers to easily integrate security functions into their web-based and mobile applications; and facilitate end-to-end financial agreement automation including digital identity verification, customer due diligence, electronic signature, secure storage, and document management. Our Trusted Identity platform technologies including Intelligent Adaptive Authentication, Risk Analytics and Secure Agreement Automation, along with our various multi-factor authentication, mobile app security and transaction signing technologies, enhance the ability of companies to prevent hacking attacks against online and mobile transactions and to safely transact business with remote customers.
We offer cloud based and on-premises solutions using both open standards and proprietary technologies. Some of our proprietary technologies are patented. Our products and services are used for authentication, fraud mitigation, e-signing transactions and documents, and identity management in Business-to-Business (“B2B”), Business-to-Employee (“B2E”) and Business-to-Consumer (“B2C”) environments. Our target market is business processes using an electronic
27
interface, particularly the internet, where there is risk of account takeover or new account fraud. Our products can increase security associated with accessing business processes, reduce losses from unauthorized access, and reduce the cost of the process by automating activities previously performed manually.
Online and mobile application owners and publishers benefit from our expertise in multi-factor authentication, document signing, transaction signing, application security, and in mitigating hacking attacks. Our convenient and proven security solutions enable low friction and trusted interactions between businesses, employees, and consumers across a variety of online and mobile platforms.
Our primary growth strategy is to make digital banking more accessible, secure, easy and valuable. Our key growth objectives include:
|
· |
Expanding our portfolio of services that enable institutions to mitigate fraud, comply with regulations, easily on-board customers, and adaptively authenticate transactions; |
|
· |
Automating and securing digital customer journeys with Secure Agreement Automation to remotely verify identities, mitigate application fraud and secure account opening and transactions; |
|
· |
Increasing sales to existing customers and acquiring new customers; |
|
· |
Driving increased demand for our products in new applications, new markets, and new territories; |
|
· |
Expanding our channel partner ecosystem; and |
|
· |
Strategically acquiring companies that expand our technology portfolio or customer base and increase our recurring revenue. |
Our Business Model
We offer our products through a product sales and licensing model or through our services platform, which includes our cloud-based service offering.
Our solutions are sold worldwide through our direct sales force, as well as through distributors, resellers, systems integrators, and original equipment manufacturers. Our sales force is able to offer customers a choice of an on-site implementation using our traditional on-premises model or a cloud implementation for some solutions using our services platform.
Economic Conditions
Our revenue may vary significantly with changes in the economic conditions in the countries in which we currently sell products. With our current concentration of revenue in Europe and specifically in the banking and finance vertical market, significant changes in the economic outlook for the European Banking market may have a significant effect on our revenue.
Cybersecurity Risks
Our use of technology is increasing and is critical in three primary areas of our business:
|
1. |
Software and information systems that we use to help us run our business more efficiently and cost effectively; |
|
2. |
The products we have traditionally sold and continue to sell to our customers for integration into their software applications contain technology that incorporates the use of secret numbers and encryption technology; and |
28
|
3. |
New products and services that we introduced to the market are focused on processing information through our servers or in the cloud. |
We believe that the risks and consequences of potential incidents in each of the above areas are different.
In the case of the information systems we use to help us run our business, we believe that an incident could disrupt our ability to take orders or deliver product to our customers, but such a delay in these activities would not have a material impact on our overall results. To minimize this risk, we actively use various forms of security and monitor the use of our systems regularly to detect potential incidents as soon as possible.
In the case of products that we have traditionally sold, we believe that the risk of a potential cyber incident is minimal. We offer our customers the ability to either create the secret numbers themselves or have us create the numbers on their behalf. When asked to create the numbers, we do so in a secure environment with limited physical access and store the numbers on a system that is not connected to any other network, including other OneSpan networks, and similarly, is not connected to the internet.
In the case of our cloud-based solutions, which involve the processing of customer information, we believe a cyber-incident could have a material impact on our business. While our revenue from cloud-based solutions comprises a minority of our revenue today, we believe that these solutions will provide substantial future growth. A cyber incident involving these solutions in the future could substantially impair our ability to grow the business and we could suffer significant monetary and other losses and significant reputational harm.
To minimize the risk, we review our product security and procedures on a regular basis. Our reviews include the processes and software code we are currently using as well as the hosting platforms and procedures that we employ. We mitigate the risk of cyber incidents through a series of reviews, tests, tools and training. Certain insurance coverages may apply to certain cyber incidents. Overall, we expect the cost of securing our networks will increase in future periods, whether through increased staff, systems or insurance coverage.
While we did not experience any cyber incident in 2019, 2018, or 2017 that had a significant impact on our business, it is possible that we could experience an incident in 2020 or future years, which could result in unanticipated costs.
Currency Fluctuations
In 2019, approximately 76% of our revenue and approximately 72% of our operating expenses were generated/incurred outside of the U.S. In 2018, approximately 74% of our revenue and approximately 79% of our operating expenses were generated/incurred outside of the U.S. In 2017, approximately 72% of our revenue and approximately 76% of our operating expenses were generated/incurred outside of the U.S. While the majority of our revenue is generated outside of the U.S., the majority of our revenue is billed in U.S. Dollars.
In 2019, approximately 62% of our revenue was denominated in U.S. Dollars, 29% was denominated in Euros and 9% was denominated in other currencies. In 2018, approximately 61% of our revenue was denominated in U.S. Dollars, 34% was denominated in Euros and 5% was denominated in other currencies. In 2017, approximately 66% of our revenue was denominated in U.S. Dollars, 29% was denominated in Euros, and 5% was denominated in other currencies.
In general, to minimize the net impact of currency fluctuations on operating income, we attempt to denominate an amount of billings in a currency such that it would provide a hedge against the operating expenses being incurred in that currency. We expect that changes in currency rates may also impact our future results if we are unable to match amounts of revenue with our operating expenses in the same currency. If the amount of our revenue in Europe denominated in Euros continues as it is now or declines, we may not be able to balance fully the exposures of currency exchange rates on revenue and operating expenses.
29
The financial position and the results of operations of our foreign subsidiaries, with the exception of our subsidiaries in Switzerland, Singapore and Canada, are measured using the local currency as the functional currency. Accordingly, assets and liabilities are translated into U.S. Dollars using current exchange rates as of the balance sheet date. Revenues and expenses are translated at average exchange rates prevailing during the year. Translation adjustments arising from differences in exchange rates generated a comprehensive gain of $1.5 million in 2019, comprehensive loss of $5.5 million in 2018 and comprehensive income of $4.0 million in 2017. These amounts are included as a separate component of stockholders’ equity. The functional currency of our subsidiaries in Singapore, Switzerland, and Canada are measured in U.S. Dollars.
Gains and losses resulting from foreign currency transactions are included in the consolidated statements of operations as other non-operating income/expense. We reported foreign exchange transaction losses of $1.5 million, $0.2 million, and $0.5 million in 2019, 2018, and 2017, respectively.
Components of Operating Results
Revenue
We generate revenue from the sale of our hardware products, software licenses, subscriptions, and services. We believe comparison of revenues between periods is heavily influenced by the timing of orders and shipments reflecting the transactional nature of our business.
|
· |
Product and license revenue. Product and license revenue includes hardware products and software licenses. |
|
· |
Service and other revenue. Service and other revenue includes software as a service (“SaaS”) solutions, maintenance and support, and professional services. |
Cost of Goods Sold
Our total cost of goods sold consists of cost of product and license revenue and cost of service and other revenue. We expect our cost of goods sold to increase in absolute dollars as our business grows, although it may fluctuate as a percentage of total revenue from period to period.
|
· |
Cost of product and license revenue. Cost of product and license revenue primarily consists of direct product costs. |
|
· |
Cost of service and other revenue. Cost of service and other revenue primarily consists of costs related to SaaS solutions, including personnel and equipment costs, and personnel costs of employees providing professional services and maintenance and support. |
Gross Profit
Gross profit as a percentage of total revenue, or gross margin, has been and will continue to be affected by a variety of factors, including our average selling price, manufacturing costs, the mix of products sold, and the mix of revenue among products, subscriptions and services. We expect our gross margins to fluctuate over time depending on these factors.
Operating Expenses
Our operating expenses are generally based on anticipated revenue levels and fixed over short periods of time. As a result, small variations in revenue may cause significant variations in the period-to-period comparisons of operating income or operating income as a percentage of revenue.
30
Generally, the most significant factor driving our operating expenses is headcount. Direct compensation and benefit plan expenses generally represent between 55% and 65% of our operating expenses. In addition, a number of other expense categories are directly related to headcount. We attempt to manage our headcount within the context of the economic environments in which we operate and the investments we believe we need to make for our infrastructure to support future growth and for our products to remain competitive.
Historically, operating expenses have been impacted by changes in foreign exchange rates. We estimate the change in currency rates in 2019 compared to 2018 resulted in a decrease in operating expenses of approximately $3.1 million in 2019.
The comparison of operating expenses can also be impacted significantly by costs related to our stock-based and long-term incentive plans. For full-year 2019, 2018, and 2017, operating expenses included $5.3 million, $6.1 million, and $5.4 million, respectively, related to stock-based and long-term incentive plans. Long-term incentive plan compensation expense includes both cash and stock-based incentives.
|
· |
Sales and marketing. Sales and marketing expenses consist primarily of personnel costs, commissions and bonuses, trade shows, marketing programs and other marketing activities, travel, outside consulting costs, and long-term incentive compensation. We expect sales and marketing expenses to increase in absolute dollars as we continue to invest in sales resources in key focus areas, although our sales and marketing expenses may fluctuate as a percentage of total revenue. |
|
· |
Research and development. Research and development expenses consist primarily of personnel costs and long-term incentive compensation. We expect research and development expenses to increase in absolute dollars as we continue to invest in our future solutions, although our research and development expenses may fluctuate as a percentage of total revenue. |
|
· |
General and administrative. General and administrative expenses consist primarily of personnel costs, legal and other professional fees, and long-term incentive compensation. We expect general and administrative expenses to increase in absolute dollars although our general and administrative expenses may fluctuate as a percentage of total revenue. |
|
· |
Amortization/impairment of intangible assets. Acquired intangible assets are amortized over their respective amortization periods. |
Interest Income, Net
Interest income consists of income earned on our cash equivalents and short term investments. Our cash equivalents and short term investments are invested in short-term instruments at current market rates.
Other Income, Net
Other income, net primarily includes exchange gains (losses) on transactions that are denominated in currencies other than our subsidiaries’ functional currencies, subsidies received from foreign governments in support of our research and development in those countries and other miscellaneous non-operational expenses.
Income Taxes
Our effective tax rate reflects our global structure related to the ownership of our intellectual property (“IP”). All our IP in our traditional authentication business is owned by two subsidiaries, one in the U.S. and one in Switzerland. These two subsidiaries have entered into agreements with most of the other OneSpan entities under which those other entities provide services to our U.S. and Swiss subsidiaries on either a percentage of revenue or on a cost plus basis or both. Under this structure, the earnings of our service provider subsidiaries are relatively constant. These service provider companies tend to be in jurisdictions with higher effective tax rates. Fluctuations in earnings tend to flow to the U.S. company and Swiss company. In 2019, earnings flowing to the U.S. company are expected to be taxed at a rate of 21% to 25%, while earnings flowing to the Swiss company are expected to be taxed at a rate ranging from 10% to 21%. Our Canadian subsidiary currently sells and services global customers directly, as does a UK subsidiary.
31
As the majority of our revenues are generated outside of the U.S., our consolidated effective tax rate is strongly influenced by the effective tax rate of our foreign operations. Changes in the effective rate related to foreign operations reflect changes in the geographic mix of earnings and the tax rates in each of the countries in which it is earned. The statutory tax rate for the primary foreign tax jurisdictions ranges from 10% to 36%.
The geographic mix of earnings of our foreign subsidiaries primarily depends on the level of pretax income of our service provider subsidiaries and the benefit realized in Switzerland through the sales of product. The level of pretax income in our service provider subsidiaries is expected to vary based on:
|
1. |
the staff, programs and services offered on a yearly basis by the various subsidiaries as determined by management, or |
|
2. |
the changes in exchange rates related to the currencies in the service provider subsidiaries, or |
|
3. |
the amount of revenues that the service provider subsidiaries generate. |
For items 1 and 2 above, there is a direct impact in the opposite direction on earnings of the U.S. and Swiss entities. Any change from item 3 is generally expected to result in a larger change in income in the U.S. and Swiss entities in the direction of the change (increased revenues expected to result in increased margins/pretax profits and conversely decreased revenues expected to result in decreased margins/pretax profits).
In addition to the provision of services, the intercompany agreements transfer the majority of the business risk to our U.S. and Swiss subsidiaries. As a result, the contracting subsidiaries’ pretax income is reasonably assured while the pretax income of the U.S. and Swiss subsidiaries varies directly with our overall success in the market.
In 2015, we acquired OneSpan Canada Inc., a foreign company with substantial IP and net operating loss and other tax carryforwards. The tax benefit of the carryforwards has been fully reserved as realization has not been deemed more likely than not.
In May 2018, we acquired Dealflo, a foreign company with substantial IP and net operating losses. The tax benefit of the loss carryforwards will be reserved to the extent they exceed deferred tax liabilities as the realization has not been deemed more likely than not.
Results of Operations
The following tables summarize our consolidated results of operations for the periods presented.
Comparison of the Years Ended December 31, 2019 and 2018
|
|
|
Years ended December 31, |
|
|
Change |
||||||
|
|
|
2019 |
|
2018 |
|
|
$ |
|
% |
||
|
|
|
(in thousands) |
|||||||||
|
Revenue |
|
|
|
|
|
|
|
|
|
|
|
|
Product and license |
$ |
184,173 |
|
|
$ |
152,977 |
|
$ |
31,196 |
|
20% |
|
Services and other |
|
70,397 |
|
|
|
59,303 |
|
|
11,094 |
|
19% |
|
Total revenue |
$ |
254,570 |
|
|
$ |
212,280 |
|
$ |
42,290 |
|
20% |
|
|
|
|
|
|
|
|
|
|
|
|
|
|
Revenue by geographic region |
|
|
|
|
|
|
|
|
|
|
|
|
EMEA |
$ |
147,027 |
|
|
$ |
103,293 |
|
$ |
43,734 |
|
42% |
|
Americas |
|
61,577 |
|
|
|
54,979 |
|
|
6,598 |
|
12% |
|
APAC |
|
45,966 |
|
|
|
54,008 |
|
|
(8,042) |
|
-15% |
|
Total revenue |
$ |
254,570 |
|
|
$ |
212,280 |
|
$ |
42,290 |
|
20% |
32
Total revenue increased $42.3 million or 20%, during the year ended December 31, 2019 compared to the year ended December 31, 2018. Product and license revenue increased by $31.2 million, or 20% during the year ended December 31, 2019. The increase in product and license revenue was due to an increase in both hardware and software licenses revenue. Services and other revenue increased by $11.1 million, or 19% during the year ended December 31, 2019. The increase was due to an increase in SaaS and maintenance revenue.
Revenue generated in EMEA increased $43.7 million, or 42% during the year ended December 31, 2019. The increase in revenue was driven by an increase in hardware, software and maintenance revenue.
Revenue generated in the Americas increased $6.6 million, or 12% during the year ended December 31, 2019. The increase in revenue was driven by higher subscription and maintenance revenue.
Revenue generated in the Asia Pacific region decreased $8.0 million, or 15% during the year ended December 31, 2019. The decrease in revenue was primarily due to a decrease in software license revenue.
Cost of Goods Sold and Gross Margin
|
|
|
Twelve months ended December 31, |
|
|
||||
|
|
|
2019 |
2018 |
|
$ |
|
% Change |
|
|
|
|
(in thousands) |
||||||
|
Cost of goods sold |
|
|
|
|
|
|
|
|
|
Product and license |
|
$ 63,393 |
|
$ 50,706 |
|
$ 12,687 |
|
25% |
|
Services and other |
|
18,569 |
|
14,107 |
|
4,462 |
|
32% |
|
Total cost of goods sold |
|
$ 81,962 |
|
$ 64,813 |
|
$ 17,149 |
|
26% |
|
|
|
|
|
|
|
|
|
|
|
Gross profit |
|
$ 172,608 |
|
$ 147,467 |
|
25,141 |
|
17% |
|
|
|
|
|
|
|
|
|
|
|
Gross margin |
|
|
|
|
|
|
|
|
|
Product and license |
|
66% |
|
67% |
|
|
|
|
|
Services and other |
|
74% |
|
76% |
|
|
|
|
|
Total gross margin |
|
68% |
|
69% |
|
|
|
|
The cost of product and license revenue increased $12.7 million, or 25% during the year ended December 31, 2019 compared to the year ended December 31, 2018. The increase in cost of product and license revenue was primarily driven by higher token volume due to increased hardware sales.
The cost of services and other revenue increased $4.5 million, or 32%, during the year ended December 31, 2019 compared to the year ended December 31, 2018. The increase in cost of services and other revenue was primarily due to increased services and other revenues and increased SaaS hosting fees.
Gross profit increased $25.1 million, or 17%, during the year ended December 31, 2019 compared to the year ended December 31, 2018. Gross margin was 68% for the year ended December 31, 2019 and 69% for the year ended December 31, 2018.
The majority of our inventory purchases are denominated in U.S. Dollars. Our sales are denominated in various currencies including the Euro. As the U.S. Dollar strengthened against the Euro for the year ended December 31, 2019 compared to the same period of 2018, revenue from sales made in Euros decreased, as measured in US Dollars, without a corresponding change in the cost of goods sold. The impact of changes in currency rates are estimated to have decreased revenue by approximately $7.5 million for the year ended December 31, 2019. Had currency rates in 2019 been equal to rates in 2018, the gross profit margin would have been approximately 3 percentage points higher for the year ended December 31, 2019.
33
Operating Expenses
|
|
Twelve months ended December 31, |
|
Change |
||||||
|
|
2019 |
|
2018 |
|
$ |
|
% |
||
|
|
(in thousands) |
|
|
|
|
||||
|
Operating costs |
|
|
|
|
|
|
|
|
|
|
Sales and marketing |
$ |
61,503 |
|
$ |
63,805 |
|
$ (2,302) |
|
-4% |
|
Research and development |
|
42,463 |
|
|
32,197 |
|
10,266 |
|
32% |
|
General and administrative |
|
43,897 |
|
|
41,589 |
|
2,308 |
|
6% |
|
Amortization / impairment of intangible assets |
|
9,470 |
|
|
9,852 |
|
(382) |
|
-4% |
|
Total operating costs |
$ |
157,333 |
|
$ |
147,443 |
|
$ 9,890 |
|
7% |
Sales and Marketing Expenses
Sales and marketing expenses decreased $2.3 million, or 4% during the year ended December 31, 2019 compared to the year ended December 31, 2018, primarily due to decreased outside marketing spend.
Average full-time sales and marketing employee headcount for year ended December 31, 2019 was 319, compared to 330 for year ended December 31, 2018. Average headcount in 2019 was 3% lower than in 2018.
Research and Development Expenses
Research and development expenses increased $10.3 million, or 32% during the year ended December 31, 2019 compared to the year ended December 31, 2018. The increase in expense was largely driven by an increase in headcount related to the Dealflo acquisition.
Average full-time research and development employee headcount for year ended December 31, 2019 was 302, compared to 250 for year ended December 31, 2018. Average headcount in 2019 was 21% higher than in 2018.
General and Administrative Expenses
General and administrative expenses increased $2.3 million, or 6% during the year ended December 31, 2019 compared to the year ended December 31, 2018. The increase in general and administrative expenses for the year ended December 31, 2019 was driven by higher professional services fees and the prior year reversal of the $0.9 million accrual resulting from a favorable outcome in our matter with the Office of Foreign Assets Control (“OFAC”).
Average full-time general and administrative employee headcount for year ended December 31, 2019 was 113, compared to 105 for the year ended December 31, 2018. Average headcount in 2019 was 8% higher than in 2018.
Amortization / Impairment of Intangible Assets
Amortization / impairment of intangible assets for the year ended December 31, 2019 was $9.5 million, compared to $9.9 million for the year ended December 31, 2018, a decrease of $0.4 million or 4%. The decrease in expense was driven expense recognized during 2018 for assets that were considered impaired as a result of the rebranding.
Interest Income, net
|
|
|
Twelve months ended December 31, |
|
|
||
|
|
|
2019 |
2018 |
|
% Change |
|
|
|
|
(in thousands) |
|
|
||
|
Interest income, net |
|
$ 747 |
|
$ 1,265 |
|
-41% |
34
Interest income, net was $0.7 million for the year ended December 31, 2019, compared to $1.3 million for the year ended December 31, 2018. The decrease in interest income for 2019 compared to 2018 reflects a decrease in the average invested balance during the period.
Other Income, Net
|
|
|
Twelve months ended December 31, |
|
|
||
|
|
|
2019 |
|
2018 |
|
% Change |
|
|
|
(in thousands) |
|
|
||
|
Other income (expense), net |
|
$ (527) |
|
$ 2,264 |
|
-123% |
Other income (expense) , net primarily includes exchange gains (losses) on transactions that are denominated in currencies other than our subsidiaries’ functional currencies, and subsidies received from foreign governments in support of our research and development in those countries.
Other income (expense), net for the year ended December 31, 2019 was $(0.5) million, compared to $2.3 million for the year ended December 31, 2018. The fluctuation is driven by foreign exchange expense incurred during the year ended December 31, 2019 and lower government subsidies.
Provision (Benefit) for income taxes
|
|
|
Twelve months ended December 31, |
|
|
||
|
|
|
2019 |
|
2018 |
|
% Change |
|
|
|
(in thousands) |
|
|
||
|
Provision (benefit) for income taxes |
|
$ 6,706 |
|
$ (293) |
|
-2389% |
Income tax expense for 2019 was $6.7 million compared to an income tax benefit of $0.3 million in 2018. For the year ended December 31, 2019 there was a 43% tax expense, compared to an 8% tax benefit in 2018. Taxes increased in 2019 primarily due to the increase in pre-tax income, as well as an accrual related to uncertain tax positions. Taxes in 2018 included a benefit for an adjustment related to the 2017 deemed repatriation tax as part of Tax Reform.
Our future effective tax rate could be adversely affected by losses generated in jurisdictions where we cannot recognize a tax benefit, earnings being lower than anticipated in countries that have lower statutory rates and higher than anticipated in countries that have higher statutory rates, changes in the valuation of our deferred tax assets or liabilities, or changes in tax laws, regulations, or accounting principles, as well as certain discrete items.
Loss Carryforwards Available
At December 31, 2019, we have gross deferred tax assets of $24.9 million resulting from foreign and state NOL carryforwards of $16.6 million and other foreign deductible carryforwards of $8.3 million. At December 31, 2019, we have a valuation allowance of $17.3 million against deferred tax assets related to certain carryforwards. See Note 10 – Income taxes for more information regarding carryforwards and valuation allowances.
Liquidity and Capital Resources
As of December 31, 2019, we had net cash balances (total cash and cash equivalents) of $84.3 million and short-term investments of $25.5 million. Short term investments consist of U.S. treasury bills and notes, corporate notes, and high quality commercial paper with maturities at acquisition of more than three months and less than twelve months. During the year ended December 31, 2018, we entered into a new lease agreement that required a letter of credit in the amount of $0.8 million to secure the obligation. The restricted cash related to this letter of credit is recorded in other non-current assets on the Consolidated Balance Sheet as of December 31, 2019 and December 31, 2018. We had no outstanding debt at December 31, 2019 or December 31, 2018.
35
Our working capital at December 31, 2019 was $137.5 million, an increase of $17.9 million or 15% from $119.6 million at December 31, 2018. The increase in the combined balance of our cash and short-term investments is primarily driven by higher net income.
As of December 31, 2019, we held $64.1 million of cash and cash equivalents in subsidiaries outside of the United States. Of that amount, $63.5 million is not subject to repatriation restrictions, but may be subject to taxes upon repatriation.
We believe that our financial resources are adequate to meet our operating needs over the next twelve months.
Our cash flows are as follows:
|
|
|
Twelve months ended December 31, |
||||
|
|
|
2019 |
2018 |
|
2017 |
|
|
|
|
(in thousands) |
||||
|
Cash provided by (used in): |
|
|
|
|
|
|
|
Operating activities |
|
$ 18,244 |
|
$ 1,226 |
|
17,627 |
|
Investing activities |
|
(9,893) |
|
194 |
|
12,798 |
|
Financing activities |
|
(569) |
|
(970) |
|
(640) |
|
Effect of foreign exchange rate changes on cash and cash equivalents |
|
(208) |
|
(1,556) |
|
(469) |
Operating Activities
Cash generated by operating activities is primarily comprised of net income, as adjusted for non-cash items, and changes in operating assets and liabilities. Non-cash adjustments consist primarily of amortization and impairment of intangible assets, depreciation of property and equipment, and stock-based compensation. We expect cash inflows from operating activities to be affected by increases or decreases in sales and timing of collections. Our primary uses of cash from operating activities have been for personnel costs. We expect cash outflows from operating activities to be affected by increases in personnel cost as we grow our business.
For the year ended December 31, 2019, $18.2 million of cash was provided by operating activities. Cash of $1.2 million and $17.6 million was provided by operating activities for the years ended December 31, 2018 and 2017, respectively.
Investing Activities
The changes in cash flows from investing activities primarily relate to timing of purchases, maturities and sales of investments, purchases of property and equipment, and activity in connection with acquisitions. We expect to continue to purchase property and equipment to support the continued growth of our business as well to continue to invest in our infrastructure and activity in connection with acquisitions.
For the year ended December 31, 2019 cash of $9.9 million was used in investing activities. For the years ended December 31, 2018 and December 31, 2017, cash of $0.2 million and $12.8 million, respectively, was provided by investing activities.
Financing Activities
The changes in cash flows from financing activities primarily relate to tax payments for restricted stock issuances.
Cash of $0.6 million, $1.0 million and $0.6 million was used in financing activities during the years ended December 31, 2019, 2018 and 2017, respectively.
36
Off-Balance Sheet Arrangements
The Company has no off-balance sheet arrangements.
Contractual Obligations and Commitments
The following summarizes our contractual obligations and commitments as of December 31, 2019:
|
|
|
Payments due by period |
|||||||||||||
|
|
|
|
|
|
|
|
|
2-3 |
|
4-5 |
|
More than |
|||
|
|
|
Total |
|
1 year |
|
years |
|
years |
|
5 years |
|||||
|
Operating lease obligations |
|
$ |
16,547 |
|
$ |
3,245 |
|
$ |
5,206 |
|
$ |
3,092 |
|
$ |
5,004 |
|
Purchase obligations |
|
|
28,547 |
|
|
21,915 |
|
|
6,620 |
|
|
12 |
|
|
— |
|
Taxes payable |
|
|
10,710 |
|
|
3,752 |
|
|
2,106 |
|
|
4,606 |
|
|
246 |
|
|
|
$ |
55,804 |
|
$ |
28,912 |
|
$ |
13,932 |
|
$ |
7,710 |
|
$ |
5,250 |
The operating lease obligations above do not include common area maintenance (“CAM”) charges or real estate taxes under our operating leases, for which the Company is also obligated. These charges are generally not fixed and can fluctuate from year to year.
Taxes payable primarily represents deemed repatriation tax from 2017. For further information, refer to Note 10 – Income Taxes.
The Company had $2.9 million, $0.4 million and $0.1 million of unrecognized tax benefits as of December 31, 2019, December 31, 2018 and December 31, 2017, respectively, which have been set aside in a reserve in accordance with Financial Accounting Standards Board (“FASB”) Accounting Standards Codification (“ASC”) 740 Income Taxes. We have included $2.7 million in the table above. The remaining amounts are not included in the above table as the timing of payment of such obligations, if any, is not determinable.
Critical Accounting Policies and Estimates
Management’s Discussion and Analysis of Financial Condition and Results of Operations discusses our consolidated financial statements, which have been prepared in accordance with accounting principles generally accepted in the U.S. The preparation of these financial statements requires management to make estimates and assumptions that affect the reported amounts of assets and liabilities and the disclosure of contingent assets and liabilities at the date of the consolidated financial statements and the reported amounts of revenue and expenses during the reporting period.
On an on-going basis, management evaluates its estimates and judgments, including those related to bad debts, net realizable value of inventory and intangible assets. Management bases its estimates and judgments on historical experience and on various other factors that are believed to be reasonable under the circumstances, the results of which form the basis for making judgments about the carrying values of assets and liabilities that are not readily apparent from other sources. Actual results may differ from these estimates under different assumptions or conditions. Management believes the following critical accounting policies affect significant judgments and estimates used in the preparation of its consolidated financial statements.
37
Revenue Recognition
Under ASC 605 – For the Year ended December 31, 2017
Prior to January 1, 2018 we recognized revenue in accordance with ASC 985-605, Software – Revenue Recognition, ASC 985-605-25, Revenue Recognition – Multiple Element Arrangements and Staff Accounting Bulletin 104.
Product and License Revenue includes hardware products and software licenses. Services and Other includes software as a service (“SaaS”), maintenance and support, and professional services.
Revenue is recognized when there is persuasive evidence that an arrangement exists, delivery has occurred, the fee is fixed or determinable and collection of the revenue is probable.
In multiple-element arrangements, some of our products are accounted for under the software provisions of ASC 985-605 and others under the provisions that relate to the sale of non-software products.
In our typical multiple-element arrangement, the primary deliverables include:
|
1. a client component (i.e., an item that is used by the person being authenticated in the form of either a new standalone hardware device or software that is downloaded onto a device the customer already owns); |
|
2. host system software that is installed on the customer’s systems (i.e., software on the host system that verifies the identity of the person being authenticated) or licenses for additional users on the host system software if the host system software had been installed previously; and |
|
3. post contract support (PCS) in the form of maintenance on the host system software or support. |
Our multiple-element arrangements may also include other items that are usually delivered prior to the recognition of any revenue are incidental to the overall transaction such as initialization of the hardware device, customization of the hardware device itself or the packaging in which it is delivered, deployment services where we deliver the device to our customer’s end-use customer or employee and, in some limited cases, professional services to assist with the initial implementation of a new customer.
In multiple-element arrangements that include a hardware client device, we allocate the selling price among all elements, delivered and undelivered, based on estimated selling price of all of the elements. In multiple-element arrangements that include a software client device, we continue to account for each element under the current standards of ASC 985-605 related to software. When software for the client device and host software are delivered elements, we use the Residual Method for determining the amount of revenue to recognize for token and software licenses if we have vendor-specific objective evidence (“VSOE”) for all of the undelivered elements. Any discount provided to the customer is applied fully to the delivered elements in such an arrangement. VSOE for undelivered elements is established using the “bell curve method.” Under this method, we conclude VSOE exists when a substantial majority of PCS renewals are within a narrow range of pricing. The estimated selling price of PCS items is based on an established percentage of the user license fee attributable to the specific software. In sales arrangements where VSOE of fair value has not been established, revenue for all elements is deferred and amortized over the life of the arrangement.
38
For transactions other than multiple-element arrangements, we recognize revenue as follows:
|
1. Product and License Revenue: Revenue from the sale of computer security hardware or the license of software is recorded upon shipment, or upon delivery based on the underlying contract terms. No significant obligations or contingencies exist with regard to delivery, customer acceptance or rights of return at the time revenue is recognized. |
|
2. SaaS: We generate SaaS revenues from our cloud services offerings. SaaS revenues include fees from customers for access to the OneSpan Sign (formerly eSignLive) suite of solutions. Our standard customer arrangements generally do not provide the customer with the right to take possession of the software supporting the cloud-based application service at any time. As such, these arrangements are considered service contracts and revenue is recognized ratably over the service period of the contract. |
|
3. Maintenance and Support Agreements: Maintenance and support agreements generally call for us to provide software updates and technical support, respectively, to customers. Revenue on maintenance and technical support is deferred and recognized ratably over the term of the applicable maintenance and support agreement. |
|
4. Professional Services: We provide professional services to our customers. Revenue from such services is recognized during the period in which the services are performed. |
We recognize revenue from sales to distributors and resellers on the same basis as sales made directly to customers. We recognize revenue when there is persuasive evidence that an arrangement exists, delivery has occurred, the fee is fixed or determinable and collection of the revenue is probable.
For large-volume transactions, we may negotiate a specific price that is based on the number of users of the software license or quantities of hardware supplied. The per unit prices for large-volume transactions are generally lower than transactions for smaller quantities and the price differences are commonly referred to as volume-purchase discounts.
All revenue is reported on a net basis, excluding any sales taxes or value added taxes.
Under ASC 606 – For the years ended December 31, 2019 and 2018
On January 1, 2018, we adopted FASB Accounting Standards Codification (ASC) Topic 606, “Revenue from Contracts with Customers”, or “Topic 606” using the modified retrospective method applied to those contracts which were not completed as of January 1, 2018. Results for reporting periods beginning after January 1, 2018 are presented under Topic 606, while prior period amounts are not adjusted and continue to be reported in accordance with our historic accounting under FASB ASC Topic 605 “Revenue Recognition ” and FASB ASC Topic 985-605 “ Software-Revenue Recognition ” (“Topic 605”). We recorded a net increase to opening Accumulated Income of $11.9 million, net of tax, as of January 1, 2018 due to the cumulative impact of adopting Topic 606, with the impact primarily related to the accounting impacts of our customer contracts that include a term license to our software, as well as the impact of accounting for costs incurred to obtain our contracts. The net impact to revenue as a result of applying Topic 606 was an increase of $3.4 million for the year ended December 31, 2018. See Note 4 - Revenue for further details. We determine revenue recognition through the following steps:
39
|
|
· |
|
Identification of the contract, or contracts, with a customer; |
|
|
· |
|
Identification of the performance obligations in the contract; |
|
· |
Determination of the transaction price; |
||
|
|
· |
|
Allocation of the transaction price to the performance obligations in the contract; and |
|
|
· |
|
Recognition of revenue when, or as, we satisfy a performance obligation. |
Revenues are recognized when control of the promised goods or services is transferred to our customers, in an amount that reflects the consideration we expect to be entitled to in exchange for those products or services, which excludes any sales incentives and amounts collected on behalf of third parties. Taxes assessed by a governmental authority that are both imposed on and concurrent with a specific revenue-producing transaction, that are collected by the Company from a customer, are excluded from revenue. Shipping and handling costs associated with outbound freight after control over a product has transferred to a customer are accounted for as a fulfillment cost and are included in cost of goods sold.
Nature of Goods and Services
We derive our revenues primarily from Product and License Revenue, which includes hardware products and software licenses, and Services and Other, which is inclusive of software-as-a-service (which we refer to as “subscription”, or “SaaS”), maintenance and support, and professional services.
Product Revenue: Revenue from the sale of security hardware is recorded upon shipment, which is the point at which control of the goods are transferred and the completion of the performance obligations, unless there are specific terms that would suggest control is transferred at a later date (e.g. delivery). No significant obligations or contingencies typically exist with regard to delivery, customer acceptance or rights of return at the time revenue is recognized. Customer payments normally correspond with delivery.
License Revenue: Revenue from the sale of software licensing is recorded upon the latter of when the customer receives the ability to access the software or when they are legally allowed to use the software. No significant obligations or contingencies exist with regard to delivery, customer acceptance or rights of return at the time revenue is recognized. Contracts with customers for distinct licenses of intellectual property include perpetual licenses, which grant the customer unlimited access to the software, and term licenses which limit the customer’s access to the software to a specific time period. We offer term licenses ranging from one to five years in length. Customer payments normally correspond with delivery for perpetual licenses. For term licenses, payments are either on installment or in advance. In limited circumstances, we integrate third party software solutions into our software products. We have determined that, consistent with our conclusion under prior revenue recognition rules, generally we act as the principal with respect to the satisfaction of the related performance obligation and record the corresponding revenue on a gross basis from these transactions. For transactions in which we do not act as the principal, we would recognize revenue on a net basis. The fees paid to the third parties are recognized as a component of cost of goods sold when the revenue is recognized.
Subscription Revenue: We generate subscription revenues from our cloud services offerings. Subscription revenues mostly include fees from customers for access to the OneSpan Sign, TID, and Dealflo solutions. Our standard customer arrangements do not provide the customer with the right to take possession of the software supporting the cloud-based application service at any time. As such, these arrangements are considered service contracts and revenue is recognized ratably over the service period of the contract. Customer payments are normally in advance for annual service.
Maintenance, Support and Other: Maintenance and support agreements generally call for us to provide software updates and technical support, respectively, to customers. Revenue on maintenance and technical support is deferred and recognized ratably over the term of the maintenance and support agreement. Customer payments are normally in advance for annual service.
Professional Services: We provide professional services to our customers. Revenue from such services is recognized during the period in which the services are performed. Payments vary, but normally occur on a time and materials basis.
40
Significant Judgments
We enter into contracts to deliver a combination of hardware devices, software licenses, subscriptions, maintenance and support and, in some situations, professional services. The Company evaluates the nature of the goods or services promised in these arrangements to identify the distinct performance obligations. Determining whether products and services are considered distinct performance obligations that should be accounted for separately versus together may require significant judgment. When a hardware client device and licenses to host software are sold in a contract, they are treated as a single performance obligation because the software license is deemed to be a component of the hardware that is integral to the functionality of the hardware that is used by our customers for identity authentication. When a software client device is sold in a contract host software, the licenses are considered a single performance obligation to deliver the authentication solution to the customer. In either of these types of arrangements, maintenance and support and professional services are typically distinct separate performance obligations from the hardware or software solutions. Our contracts to deliver subscription services typically do not include multiple performance obligations; however, in certain limited cases customers may purchase professional services that are distinct performance obligations.
For contracts that contain multiple performance obligations, the transaction price is allocated to the separate performance obligations based on their estimated relative standalone selling price. Judgment is required to determine the stand-alone selling price (“SSP”) of each distinct performance obligation. We determine SSP for maintenance and support and professional services based on observable inputs; specifically, the range of prices charged to customers to renew annual maintenance and support contracts and the range of hourly rates we charge our customers in standalone professional services contracts. In instances where SSP is not directly observable, and when we sell at a highly variable price range, such as for transactions involving software licenses or subscriptions, we determine the SSP for those performance obligations using the residual method.
Allowance for Doubtful Accounts
We maintain allowances for doubtful accounts for estimated losses resulting from the inability of our customers to make payments for goods and services. The allowance is based on a specific review of all significant past-due accounts. If the financial condition of our customers deteriorates, resulting in an impairment of their ability to make payments, additional allowances may be required.
Inventories
We write down inventory where it appears that the carrying cost of the inventory may not be recovered through subsequent sale of the inventory. We analyze the quantity of inventory on hand, the quantity sold in the past year, the anticipated sales volume in the form of sales to new customers as well as sales to previous customers, the expected sales price and the cost of making the sale when evaluating the valuation of our inventory. If the sales volume or sales price of a specific model declines significantly, additional write-downs may be required.
Impairment of Long-Lived and Intangible Assets
Definite-lived intangible assets include proprietary technology, customer relationships, and other intangible assets. Intangible assets other than patents with definite lives are amortized over the useful life, generally three to seven years for proprietary technology and five to twelve years for customer relationships. Patents are amortized over the life of the patent, generally 20 years in the U.S. Intangible assets arising from business combinations, such as acquired technology, customer relationships, and other intangible assets, are originally recorded at fair value. As a result of the Company rebranding, the value of certain intangible assets were written down during the second quarter of 2018, and impairment charges of $0.5 million were recorded for the year ended December 31, 2018.
Long-lived assets, including property, plant and equipment, definite-lived intangible assets being amortized and capitalized software costs, are reviewed for impairment whenever events or changes in circumstances indicate that the carrying amount of the long-lived asset group may not be recoverable. An impairment loss shall be recognized if the
41
carrying amount of a long-lived asset group exceeds the sum of the undiscounted cash flows expected to result from the use and eventual disposition of the asset. If it is determined that an impairment loss has occurred, the loss is measured as the amount by which the carrying amount of the long-lived asset group exceeds its fair value. Long-lived assets held for sale are reported at the lower of carrying value or fair value less cost to sell.
Goodwill
Goodwill represents the excess of purchase price over the fair value of net identifiable assets acquired in a business combination. We assess the impairment of goodwill each November or whenever events or changes in circumstances indicate that the carrying value may not be recoverable. The Company’s impairment assessment begins with a qualitative assessment to determine whether it is more likely than not that the fair value of a reporting unit is less than its carrying value. The qualitative assessment includes comparing the overall financial performance of the reporting units against the planned results used in the last quantitative goodwill impairment test. Additionally, each reporting unit’s fair value is assessed in light of certain events and circumstances, including macroeconomic conditions, industry and market considerations, cost factors, and other relevant entity- and reporting unit specific events. The selection and assessment of qualitative factors used to determine whether it is more likely than not that the fair value of a reporting unit exceeds the carrying value involves significant judgments and estimates. If it is determined under the qualitative assessment that it is more likely than not that the fair value of a reporting unit is less than its carrying value, then a two-step quantitative impairment test is performed. Under the first step, the estimated fair value of the reporting unit is compared with its carrying value (including goodwill). If the fair value of the reporting unit exceeds its carrying value, step two does not need to be performed. If the estimated fair value of the reporting unit is less than its carrying value, an indication of goodwill impairment exists for the reporting unit and the enterprise must perform step two of the impairment test (measurement). Under step two, an impairment loss is recognized for any excess of the carrying amount of the reporting unit’s goodwill over the implied fair value of that goodwill. The implied fair value of goodwill is determined by allocating the fair value of the reporting unit in a manner similar to a purchase price allocation in acquisition accounting. The residual amount after this allocation is the implied fair value of the reporting unit goodwill. Fair value of the reporting unit under the two-step assessment is determined using a combination of both income and market-based variation approaches. The inputs and assumptions to valuation methods used to estimate the fair value of reporting units involves significant judgments.
We operate in one reporting unit and had no goodwill impairment recorded for the years ended December 31, 2019, 2018, and 2017.
Income Taxes
As a global company, we calculate and provide for income taxes in each tax jurisdiction in which we operate. The provision for income taxes includes the amounts payable or refundable for the current year, the effect of deferred taxes and impacts from uncertain tax positions. Our provision for income taxes is significantly affected by shifts in the geographic mix of our pre-tax earnings across tax jurisdictions, changes in tax laws and regulations, and tax planning opportunities available in each tax jurisdiction.
Deferred tax assets and liabilities are recognized for the expected future tax consequences of temporary differences between the financial statement and tax bases of our assets and liabilities and for operating losses and tax credit carryforwards. Deferred tax assets and liabilities are measured using enacted tax rates that will apply to taxable income in the years in which those differences are expected to be recovered or settled. Valuation allowances are established for deferred tax assets when it is more likely than not that a tax benefit will not be realized. We recognize the effect of a change in tax rates on deferred tax assets and liabilities and in income in the period that includes the enactment date.
We recognize tax benefits for tax positions that are more likely than not to be sustained upon examination by tax authorities. The amount recognized is measured as the largest amount of benefit that is greater than 50 percent likely to be realized upon ultimate settlement. Unrecognized tax benefits are tax benefits claimed in our income tax returns that do not meet these recognition and measurement standards. Assumptions, judgments, and the use of estimates are
42
required in determining whether the “more likely than not” standard has been meet when developing the provision for income taxes.
We monitor for changes in tax laws and reflect the impacts of tax law changes in the period of enactment.
Recently Issued Accounting Pronouncements
In February 2016, the FASB issued ASU 2016-02, Leases. Since that date, the FASB has issued additional ASU’s clarifying certain aspects of ASU 2016-02. The new guidance supersedes the lease guidance under FASB Accounting Standards Codification (“ASC”) Topic 840, Leases, resulting in the creation of FASB ASC Topic 842, Leases. The guidance requires a lessee to recognize on the Balance Sheet a liability to make lease payments and a right-of-use asset representing its right to use the underlying asset for the lease term for both finance and operating leases. Subsequent guidance issued after February 2016 did not change the core principle of ASU 2016-02. The Company adopted ASC Topic 842 effective January 1, 2019, using the modified retrospective method, which did not require the Company to adjust comparative periods. See the Accounting for Leases section of this note for additional information.
In June 2016, the FASB issued ASU 2016-13, Financial Instruments - Credit Losses (Topic 326): Measurement of Credit Losses on Financial Instruments (“ASU 2016-13”). The new guidance provides financial statement users with improved information about the expected credit losses on trade receivables and other financial instruments held by a reporting entity at each reporting date. The amendments in this update replace the incurred loss methodology with a methodology that reflects expected credit losses and requires consideration of a broader range of reasonable and supportable information to calculate credit loss estimates. ASU 2016-13 is effective for fiscal years beginning after December 15, 2019, including interim periods within those fiscal years. The Company expects to adopt the standard on a modified retrospective basis and is still evaluating the impact of adopting ASU 2016-13 on its consolidated financial statements.
In January 2017, the FASB issued ASU 2017-04, Intangibles-Goodwill and Other (Topic 350) – Simplifying the Test for Goodwill Impairment. This standard eliminates the requirement to calculate the implied fair value of goodwill to measure a goodwill impairment charge (i.e. Step 2 of the current guidance), instead measuring the impairment charge as the excess of the reporting unit's carrying amount over its fair value (i.e. Step 1 of the current guidance). The guidance is effective for us beginning in the first quarter of 2020, and should be applied prospectively. Early adoption is permitted for impairment testing dates after January 1, 2017. We are currently evaluating the effect, if any, that the ASU will have on our consolidated financial statements and related disclosures.
Effective January 1, 2018, we adopted ASU 2016-01, Financial Instruments – Overall, which revises the classification and measurement of investments in equity securities. ASU 2016-01 requires that equity investments, except those accounted for under the equity method of accounting, be measured at fair value and changes in fair value are recognized in net income. ASU 2016-01 also provides a new measurement alternative for equity investments that do not have a readily determinable fair value (cost method investments). These investments are measured at cost, less any impairment, adjusted for observable price changes. Effective January 1, 2018, we elected to record our equity investment that does not have a readily determinable fair value using the alternative measurement method. Accordingly upon adoption, we recorded a cumulative effect adjustment to increase opening accumulated income at January 1, 2018 by $0.5 million, net of tax, as required for our equity investments with no readily determinable fair value to reflect the investment at approximate fair value.
In June 2018, the FASB issued ASU 2018-07, Compensation – Stock Compensation (Topic 718): Improvements to Nonemployee share-based payment accounting, which is intended to reduce the cost and complexity of accounting for, and improve financial reporting for share-based payments to nonemployees for goods and services. The ASU is effective for annual periods, including interim periods within those annual periods, beginning after December 15, 2018. The guidance should be applied prospectively and early adoption is permitted. We adopted this standard on January 1, 2019 on a prospective basis. The adoption of this standard did not have a material impact on our consolidated financial statements.
43
In August 2018, the FASB issued ASU No. 2018-13, Disclosure Framework - Changes to the Disclosure Requirements for Fair Value Measurement (“ASU 2018-13”) which amends ASC 820, Fair Value Measurement. ASU 2018-13 modifies the disclosure requirements for fair value measurements by removing, modifying, or adding certain disclosures. The ASU is effective for annual periods, including interim periods within those annual periods, beginning after December 15, 2019, with early adoption permitted for removed or modified disclosures, and delayed adoption of the additional disclosures until their effective date. We are currently evaluating the effect that the ASU will have on our consolidated financial statements and related disclosures.
In August 2018, the FASB issued ASU 2018-14, Compensation—Retirement Benefits—Defined Benefit Plans—General (Topic 715-20): Disclosure Framework—Changes to the Disclosure Requirements for Defined Benefit Plans (ASU 2018-14), which modifies the disclosure requirements for defined benefit pension plans and other postretirement plans. ASU 2018-14 is effective for fiscal years ending after December 15, 2020, and earlier adoption is permitted. We are currently evaluating the effect that the ASU will have on our consolidated financial statements and related disclosures.
In August 2018, the FASB issued ASU 2018-15, Customer's Accounting for Fees Paid in a Cloud Computing Arrangement , which helps entities evaluate the accounting for fees paid by a customer in a cloud computing arrangement (CCA) by providing guidance for determining when an arrangement includes a software license and when an arrangement is solely a hosted CCA service. Under ASU 2018-15, customers will apply the same criteria for capitalizing implementation costs as they would for an arrangement that has a software license. The new guidance also prescribes the balance sheet, income statement, and cash flow classification of the capitalized implementation costs and related amortization expense, and requires additional quantitative and qualitative disclosures. The new standard is effective for us on January 1, 2020. Early adoption is permitted, including adoption in any interim period for which financial statements have not been issued. Entities can choose to adopt the new guidance prospectively to eligible costs incurred on or after the date this guidance is first applied or retrospectively. We expect to implement the guidance prospectively to all implementation costs incurred after the date of adoption. We are currently evaluating the effect that the ASU will have on our consolidated financial statements and related disclosures.
In December 2019, the FASB issued ASU 2019-12, Simplifying the Accounting for Income Taxes, to simplify the accounting for income taxes. The ASU’s amendments are based on changes that were suggested by stakeholders as part of the FASB’s effort to reduce the complexity of accounting standards while maintaining or enhancing the helpfulness of information provided to financial statement users. The new standard is effective for us on January 1, 2021. We are currently evaluating the effect that the ASU will have on our consolidated financial statements and related disclosures.
From time to time, new accounting pronouncements are issued by the FASB or other standard setting bodies that are adopted by us as of the specified effective date. Unless otherwise discussed, our management believes that the issued standards that are not yet effective will not have a material impact on our consolidated financial statements upon adoption.
Item 7A - Quantitative and Qualitative Disclosures about Market Risk (In thousands)
Foreign Currency Exchange Risk – In 2019, approximately 76% of our business was conducted outside the United States, primarily in Europe, Latin America and Asia/Pacific. A significant portion of our business operations is transacted in foreign currencies. As a result, we have exposure to foreign exchange fluctuations. We are affected by both foreign currency translation and transaction adjustments. Translation adjustments result from the conversion of the foreign subsidiaries’ balance sheets and income statements to U.S. Dollars at year-end exchange rates and weighted average exchange rates, respectively. Translation adjustments resulting from this process are recorded directly into stockholders’ equity. Transaction adjustments result from currency exchange movements when one of our companies transacts business in a currency that differs from its local currency. These adjustments are recorded as gains or losses in our statements of operations. Our business transactions are spread across numerous countries and currencies. This geographic diversity reduces the risk to our operating results. As noted in Management’s Discussion and Analysis above,
44
we attempt to minimize the net impact of currency on operating earnings by denominating an amount of billings in a currency such that it would provide a hedge against the operating expenses being incurred in that currency.
Interest Rate Risk – We have minimal interest rate risk. We had no debt outstanding at December 31, 2019. Our cash, cash equivalents, and short term investments are invested in short-term instruments at current market rates. If rates were to increase or decrease by one percentage point, the Company’s interest income would increase or decrease approximately $0.3 million annually.
Impairment Risk – At December 31, 2019, we had goodwill of $94.6 million and other intangible assets of $36.2 million, primarily from acquisitions including Dealflo in 2018, eSignLive in 2015, Risk IDS in 2014, Cronto in 2013, and other prior acquisitions. We assess the recoverability of goodwill at least annually, and the recoverability of other intangible assets whenever events or circumstances change indicating the carrying value may not be recoverable. As a result of the Company rebranding, the value of certain intangible assets was written down during the second quarter of 2018, and impairment charges of $0.5 million were recorded for the year ended December 31, 2018. For the year ended December 31, 2019 and 2017, we did not incur any impairments.
Item 8 - Financial Statements and Supplementary Data
The information in response to this item is included in our consolidated financial statements, together with the report thereon of KPMG LLP, appearing on pages F‑1 through F‑42 of this Form 10‑K, and in Item 7 under the heading Management’s Discussion and Analysis of Financial Condition and Results of Operations.
Item 9 - Changes in and Disagreements with Accountants on Accounting and Financial Disclosure
None.
Item 9A - Controls and Procedures
Evaluation of Disclosure Controls and Procedures
Our management, with the participation of our Chief Executive Officer and Chief Financial Officer, who, respectively, are our principal executive officer and principal financial officer, conducted an evaluation of the effectiveness of the design and operation of our disclosure controls and procedures (as defined in Rules 13a-15(e) and 15d-15(e) under the Securities Exchange Act of 1934, as amended (the "Exchange Act")) as of December 31, 2019. Disclosure controls and procedures include, without limitation, controls and procedures designed to ensure (i) information required to be disclosed by us in our reports that we file or submit under the Exchange Act is recorded, processed, summarized and reported within the time periods specified in the Securities and Exchange Commission’s rules and forms, and (ii) information required to be disclosed by us in our reports that we file or submit under the Exchange Act is accumulated and communicated to our management, including our principal executive and principal financial officers, or persons performing similar functions, as appropriate to allow timely decisions regarding required disclosure. Based upon that evaluation, our management have concluded that the Company's disclosure controls and procedures are effective as of December 31, 2019, to give reasonable assurance that the information required by us in reports filed under the Exchange Act, is recorded, processed, summarized and reported within the time period specified in the rules and forms of the SEC, and is accumulated and communicated to management, including our principal executive officer and principal financial officer, as appropriate, to allow timely decisions regarding required disclosure.
Management’s Annual Report on Internal Control over Financial Reporting
The management of OneSpan Inc. is responsible for establishing and maintaining adequate internal control over financial reporting. Internal control over financial reporting is defined in Rule 13a-15(f) and 15d-15(f) promulgated under the Exchange Act as a process designed by, or under the supervision of, the Company’s principal executive and principal financial officers and effected by the Company’s board of directors, management and other personnel, to provide reasonable assurance regarding the reliability of financial reporting and the preparation of financial statements for external purposes in accordance with generally accepted accounting principles and includes those policies and
45
procedures that: (1) Pertain to the maintenance of records that in reasonable detail accurately and fairly reflect the transactions and dispositions of the assets of the Company; (2) Provide reasonable assurance that transactions are recorded as necessary to permit preparation of financial statements in accordance with generally accepted accounting principles, and that receipts and expenditures of the Company are being made only in accordance with authorizations of management and directors of the Company; and (3) Provide reasonable assurance regarding prevention or timely detection of unauthorized acquisition, use or disposition of the Company’s assets that could have a material effect on the financial statements.
Our management, led by our Chief Executive Officer and Chief Financial Officer, assessed the effectiveness of our internal control over financial reporting as of December 31, 2019, using the criteria set forth by the Committee of Sponsoring Organizations of the Treadway Commission (COSO) in Internal Control—Integrated Framework (2013).
Management’s evaluation of our internal control over financial reporting determined that the Company’s internal control over financial reporting was effective based on those criteria as of December 31, 2019.
KPMG LLP, an independent registered public accounting firm, has audited the consolidated financial statements as of and for the year ended December 31, 2019 included in this Annual Report on Form 10-K, and has issued its report on the effectiveness of the Company’s internal control over financial reporting as of December 31, 2019, included on page 48 of this annual report.
Changes in Internal Control over Financial Reporting
Management has evaluated, with the participation of our Chief Executive Officer and Chief Financial Officer, whether any changes in our internal control over financial reporting that occurred during our last fiscal quarter affected, or are reasonably likely to materially affect, our internal control over financial reporting.
During the three months ended December 31, 2019, the Company finalized its remediation plan related to the material weakness that was disclosed in Part II Item 9A Controls and Procedures in our Annual Report on Form 10-K for the fiscal year ended December 31, 2018. The deficiencies that constituted a material weakness in our internal control over financial reporting as of December 31, 2018, were as follows:
|
· We did not maintain a sufficient complement of trained, knowledgeable resources (i) to support the adoption of the new revenue accounting standard (ASC Topic 606) and (ii) to execute their responsibilities with respect to internal control over financial reporting over several financial statement accounts and disclosures. |
|
· We did not conduct an effective continuous risk assessment process that was responsive to the adoption of ASC Topic 606 and other changes in the Company’s operating environment. |
|
· As a consequence, the Company did not design, implement and operate effective process-level control activities over the majority of the asset, liability, equity, revenue and operating expense accounts reported in the consolidated financial statements as well as operating cash flows and financial statement disclosures around revenue. |
The Company has finalized its remediation plan during the three months ended December 31, 2019, which consisted of the following measures, and we are satisfied that the material weakness in internal control over financial reporting identified as of December 31, 2018, has been remediated:
|
· Hired additional accounting personnel with the requisite technical knowledge with respect to revenue recognition and internal control over financial reporting and have used third party resources to ensure we have a sufficient complement of resources; |
|
· Conducted an expanded training program for our new and existing personnel on internal control over financial reporting, accounting for revenue recognition, and other relevant accounting topics; |
|
· Concluded the implementation of a new global enterprise resource planning (“ERP”) system. This ERP system replaced our previous operating and financial systems and is designed to accurately maintain the Company’s financial records, enhance operational functionality, and provide timely information to the Company’s management team related to the operation of the business; |
46
|
· Designed, implemented and operated effective process-level controls throughout each of the processes in which there were ineffectively designed and implemented controls as of December 31, 2018; and |
|
· Designed and implemented an effective continuous risk assessment processes to monitor changes that could significantly impact our internal control over financial reporting. |
Except for the changes in connection with our finalization of the remediation plan discussed above, there have been no other changes in our internal control over financial reporting (as defined in Rules 13a-15(f) or 15d-15(f) of the Exchange Act) that occurred during the fourth quarter of 2019 that have materially affected, or are reasonably likely to materially affect, the Company’s internal control over financial reporting.
Limitations on the Effectiveness of Controls
Internal control over financial reporting has inherent limitations. Internal control over financial reporting is a process that involves human diligence and compliance and is subject to lapses in judgment and breakdowns resulting from human failures. Internal control over financial reporting also can be circumvented by collusion or improper management override. Because of such limitations, there is a risk that material misstatements will not be prevented or detected on a timely basis by internal control over financial reporting. However, these inherent limitations are known features of the financial reporting process. Therefore, it is possible to design into the process safeguards to reduce, though not eliminate, this risk. Also, projections of any evaluation of effectiveness to future periods are subject to the risk that controls may become inadequate because of changes in conditions, or that the degree of compliance with the policies and procedures may deteriorate.
47
Report of Independent Registered Public Accounting Firm
To the Stockholders and Board of Directors
OneSpan Inc.:
Opinion on Internal Control Over Financial Reporting
We have audited OneSpan Inc. and subsidiaries’ (the Company) internal control over financial reporting as of December 31, 2019, based on criteria established in Internal Control – Integrated Framework (2013) issued by the Committee of Sponsoring Organizations of the Treadway Commission. In our opinion, the Company maintained, in all material respects, effective internal control over financial reporting as of December 31, 2019, based on criteria established in Internal Control – Integrated Framework (2013) issued by the Committee of Sponsoring Organizations of the Treadway Commission.
We also have audited, in accordance with the standards of the Public Company Accounting Oversight Board (United States) (PCAOB), the consolidated balance sheets of the Company as of December 31, 2019 and 2018, the related consolidated statements of operations, comprehensive income (loss), stockholders’ equity, and cash flows for each of the years in the three-year period ended December 31, 2019, and the related notes and financial statement schedule II – Valuation and Qualifying Accounts (collectively, the consolidated financial statements), and our report dated March 16, 2020 expressed an unqualified opinion on those consolidated financial statements.
Basis for Opinion
The Company’s management is responsible for maintaining effective internal control over financial reporting and for its assessment of the effectiveness of internal control over financial reporting, included in the accompanying Management’s Annual Report on Internal Control over Financial Reporting in Item 9A - Controls and Procedures. Our responsibility is to express an opinion on the Company’s internal control over financial reporting based on our audit. We are a public accounting firm registered with the PCAOB and are required to be independent with respect to the Company in accordance with the U.S. federal securities laws and the applicable rules and regulations of the Securities and Exchange Commission and the PCAOB.
We conducted our audit in accordance with the standards of the PCAOB. Those standards require that we plan and perform the audit to obtain reasonable assurance about whether effective internal control over financial reporting was maintained in all material respects. Our audit of internal control over financial reporting included obtaining an understanding of internal control over financial reporting, assessing the risk that a material weakness exists, and testing and evaluating the design and operating effectiveness of internal control based on the assessed risk. Our audit also included performing such other procedures as we considered necessary in the circumstances. We believe that our audit provides a reasonable basis for our opinion.
Definition and Limitations of Internal Control Over Financial Reporting
A company’s internal control over financial reporting is a process designed to provide reasonable assurance regarding the reliability of financial reporting and the preparation of financial statements for external purposes in accordance with generally accepted accounting principles. A company’s internal control over financial reporting includes those policies and procedures that (1) pertain to the maintenance of records that, in reasonable detail, accurately and fairly reflect the transactions and dispositions of the assets of the company; (2) provide reasonable assurance that transactions are recorded as necessary to permit preparation of financial statements in accordance with generally accepted accounting principles, and that receipts and expenditures of the company are being made only in accordance with authorizations of management and directors of the company; and (3) provide reasonable assurance regarding prevention or timely detection of unauthorized acquisition, use, or disposition of the company’s assets that could have a material effect on the financial statements.
Because of its inherent limitations, internal control over financial reporting may not prevent or detect misstatements. Also, projections of any evaluation of effectiveness to future periods are subject to the risk that controls may become
48
inadequate because of changes in conditions, or that the degree of compliance with the policies or procedures may deteriorate.
/s/ KPMG LLP
Chicago, Illinois
March 16, 2020
49
Item 10 - Directors, Executive Officers and Corporate Governance
All information in response to this Item is incorporated by reference to the “Directors and Executive Officers” and “Section 16(a) Beneficial Ownership Compliance” sections of OneSpan’s Proxy Statement for the 2019 Annual Meeting of Stockholders.
Item 11 - Executive Compensation
The information in response to this Item is incorporated by reference to the “Executive Compensation” section of OneSpan’s Proxy Statement for the 2019 Annual Meeting of Stockholders.
Item 12 - Security Ownership of Certain Beneficial Owners and Management and Related Stockholder Matters
The information in response to this Item is incorporated by reference to the “Security Ownership of Certain Beneficial Owners, Directors and Management” section of OneSpan’s Proxy Statement for the 2019 Annual Meeting of Stockholders.
Item 13 - Certain Relationships and Related Transactions, and Director Independence
The information in response to this Item is incorporated by reference to the “Directors and Executive Officers” and “Transactions with Related Persons” sections of OneSpan’s Proxy Statement for the 2019 Annual Meeting of Stockholders.
Item 14 - Principal Accounting Fees and Services
The information in response to this Item is incorporated by reference to the “Report of the Audit Committee” section of OneSpan’s Proxy Statement for the 2019 Annual Meeting of Stockholders.
Item 15 - Exhibits and Financial Statement Schedules
(a) The following documents are filed as part of this Form 10‑K.
(1) The following consolidated financial statements and notes thereto, and the related independent auditors’ report, are included on pages F‑1 through F‑42 of this Form 10‑K:
Report of Independent Registered Public Accounting Firm
Consolidated Balance Sheets as of December 31, 2019 and 2018
Consolidated Statements of Operations for the Years Ended December 31, 2019, 2018 and 2017
Consolidated Statements of Comprehensive Income for the Years Ended December 31, 2019, 2018 and 2017
Consolidated Statements of Stockholders’ Equity for the Years Ended December 31, 2019, 2018 and 2017
Consolidated Statements of Cash Flows for the Years Ended December 31, 2019, 2018 and 2017
50
Notes to Consolidated Financial Statements
(2) The following consolidated financial statement schedule of the company is included on page F‑43 of this Form 10‑K:
Schedule II – Valuation and Qualifying Accounts
All other financial statement schedules are omitted because such schedules are not required or the information required has been presented in the aforementioned consolidated financial statements.
(3) The following exhibits are filed with this Form 10‑K or incorporated by reference as set forth at the end of the list of exhibits:
|
Exhibit |
|
Description |
|
2.1 |
||
|
2.2 |
|
|
|
2.3 |
||
|
2.4 |
||
|
3.1 |
|
|
|
3.2 |
|
|
|
4.1 |
||
|
|
|
|
|
4.2* |
|
|
|
|
|
|
|
4.3* |
|
|
|
|
|
|
|
4.4* |
|
|
|
|
|
|
|
4.5* |
|
|
|
|
|
|
51
|
Exhibit |
|
Description |
|
4.6* |
|
|
|
|
|
|
|
4.7* |
||
|
4.8* |
||
|
4.9* |
||
|
4.10* |
||
|
4.11* |
|
|
|
|
|
|
|
10.1* |
|
|
|
|
|
|
|
10.2* |
|
|
|
|
|
|
|
10.3* |
|
|
|
|
|
|
|
10.4* |
||
|
10.5* |
||
|
14.1 |
|
Amended Corporate Governance Guidelines of the Board of Directors of One Span Inc. and Subsidiaries. |
|
|
|
|
|
14.2 |
||
|
21 |
|
|
|
|
|
|
|
23 |
|
|
|
|
|
|
|
31.1 |
|
|
|
31.2 |
|
|
|
32.1 |
|
|
52
|
Exhibit |
|
Description |
|
32.2 |
|
|
|
101.INS |
|
XBRL Instance Document |
|
101.SCH |
|
XBRL Taxonomy Extension Schema Document |
|
101.CAL |
|
XBRL Taxonomy Extension Calculation Linkbase Document |
|
101.LAB |
|
XBRL Taxonomy Extension Label Linkbase Document |
|
101.PRE |
|
XBRL Taxonomy Extension Presentation Linkbase Document |
|
101.DEF |
|
XBRL Taxonomy Extension Definition Linkbase Document |
*Management contract or compensatory plan or arrangement required to be filed as an exhibit to this Annual Report on Form 10‑K.
OneSpan Inc. will furnish any of the above exhibits to stockholders upon written request addressed to the Secretary at the address given on the cover page of this Form 10‑K. The charge for furnishing copies of the exhibits is $0.25 per page, plus postage.
53
OneSpan Inc.
INDEX TO FINANCIAL STATEMENTS AND SCHEDULE
|
|
|
|
Financial Statements |
|
|
F-2 |
|
|
Consolidated Balance Sheets as of December 31, 2019 and 2018 |
F-3 |
|
Consolidated Statements of Operations for the Years Ended December 31, 2019, 2018 and 2017 |
F-4 |
|
F-5 |
|
|
Consolidated Statements of Stockholders’ Equity for the Years Ended December 31, 2019, 2018 and 2017 |
F-6 |
|
Consolidated Statements of Cash Flows for the Years Ended December 31, 2019, 2018 and 2017 |
F-7 |
|
F-9 |
|
|
Financial Statement Schedule |
|
|
The following consolidated financial statement schedule is included herein: |
|
|
F-42 |
All other financial statement schedules are omitted because they are not applicable or the required information is shown in the consolidated financial statements or notes thereto.
F-1
Report of Independent Registered Public Accounting Firm
To the Stockholders and Board of Directors
OneSpan Inc.:
Opinion on the Consolidated Financial Statements
We have audited the accompanying consolidated balance sheets of OneSpan Inc. and subsidiaries (the Company) as of December 31, 2019 and 2018, the related consolidated statements of operations, comprehensive income (loss), stockholders’ equity, and cash flows for each of the years in the three-year period ended December 31, 2019, and the related notes and financial statement schedule II –Valuation and Qualifying Accounts (collectively, the consolidated financial statements). In our opinion, the consolidated financial statements present fairly, in all material respects, the financial position of the Company as of December 31, 2019 and 2018, and the results of its operations and its cash flows for each of the years in the three-year period ended December 31, 2019, in conformity with U.S. generally accepted accounting principles.
We also have audited, in accordance with the standards of the Public Company Accounting Oversight Board (United States) (PCAOB), the Company’s internal control over financial reporting as of December 31, 2019, based on criteria established in Internal Control – Integrated Framework (2013) issued by the Committee of Sponsoring Organizations of the Treadway Commission, and our report dated March 16, 2020 expressed an unqualified opinion on the effectiveness of the Company’s internal control over financial reporting.
Changes in Accounting Principles
As discussed in Notes 1 and 4 to the consolidated financial statements, the Company changed its method of accounting for revenue and certain costs effective January 1, 2018, due to the adoption of Financial Accounting Standards Board (FASB) Accounting Standards Codification (ASC) Topic 606, Revenue from Contracts with Customers, and as discussed in Notes 1 and 9 to the consolidated financial statements, the Company changed its method of accounting for leases effective January 1, 2019, due to the adoption of FASB ASC Topic 842, Leases.
Basis for Opinion
These consolidated financial statements are the responsibility of the Company’s management. Our responsibility is to express an opinion on these consolidated financial statements based on our audits. We are a public accounting firm registered with the PCAOB and are required to be independent with respect to the Company in accordance with the U.S. federal securities laws and the applicable rules and regulations of the Securities and Exchange Commission and the PCAOB.
We conducted our audits in accordance with the standards of the PCAOB. Those standards require that we plan and perform the audit to obtain reasonable assurance about whether the consolidated financial statements are free of material misstatement, whether due to error or fraud. Our audits included performing procedures to assess the risks of material misstatement of the consolidated financial statements, whether due to error or fraud, and performing procedures that respond to those risks. Such procedures included examining, on a test basis, evidence regarding the amounts and disclosures in the consolidated financial statements. Our audits also included evaluating the accounting principles used and significant estimates made by management, as well as evaluating the overall presentation of the consolidated financial statements. We believe that our audits provide a reasonable basis for our opinion.
/s/ KPMG LLP
We have served as the Company’s auditor since 1996.
Chicago, Illinois
March 16, 2020
F-2
OneSpan Inc.
(in thousands, except per share data)
|
|
|
December 31, |
||||
|
|
|
2019 |
|
2018 |
||
|
ASSETS |
|
|
|
|
|
|
|
Current assets |
|
|
|
|
|
|
|
Cash and equivalents |
|
$ |
84,282 |
|
$ |
76,708 |
|
Short term investments |
|
|
25,511 |
|
|
22,789 |
|
Accounts receivable, net of allowances of $2,524 in 2019 and $1,152 in 2018 |
|
|
62,405 |
|
|
59,631 |
|
Inventories, net |
|
|
19,819 |
|
|
14,428 |
|
Prepaid expenses |
|
|
6,198 |
|
|
4,733 |
|
Contract assets |
|
|
7,058 |
|
|
7,962 |
|
Other current assets |
|
|
6,346 |
|
|
5,705 |
|
Total current assets |
|
|
211,619 |
|
|
191,956 |
|
Property and equipment, net |
|
|
11,454 |
|
|
6,250 |
|
Operating lease right-of-use assets |
|
|
10,580 |
|
|
— |
|
Goodwill |
|
|
94,612 |
|
|
91,841 |
|
Intangible assets, net of accumulated amortization |
|
|
36,209 |
|
|
45,462 |
|
Deferred income taxes |
|
|
7,863 |
|
|
5,601 |
|
Contract assets - non-current |
|
|
3,565 |
|
|
3,316 |
|
Other assets |
|
|
8,668 |
|
|
8,400 |
|
Total assets |
|
$ |
384,570 |
|
$ |
352,826 |
|
LIABILITIES AND STOCKHOLDERS' EQUITY |
|
|
|
|
|
|
|
Current liabilities |
|
|
|
|
|
|
|
Accounts payable |
|
$ |
10,835 |
|
$ |
7,202 |
|
Deferred revenue |
|
|
30,338 |
|
|
33,633 |
|
Accrued wages and payroll taxes |
|
|
15,415 |
|
|
13,932 |
|
Short-term income taxes payable |
|
|
7,711 |
|
|
6,905 |
|
Other accrued expenses |
|
|
8,786 |
|
|
9,323 |
|
Deferred compensation |
|
|
1,028 |
|
|
1,362 |
|
Total current liabilities |
|
|
74,113 |
|
|
72,357 |
|
Long-term deferred revenue |
|
|
15,259 |
|
|
10,672 |
|
Long-term lease liability |
|
|
11,299 |
|
|
— |
|
Other long-term liabilities |
|
|
8,297 |
|
|
7,075 |
|
Long-term income taxes payable |
|
|
6,958 |
|
|
7,620 |
|
Deferred income taxes |
|
|
4,623 |
|
|
2,661 |
|
Total liabilities |
|
|
120,549 |
|
|
100,385 |
|
Stockholders' equity |
|
|
|
|
|
|
|
Preferred stock: 500 shares authorized, none issued and outstanding at December 31, 2019 and 2018 |
|
|
— |
|
|
— |
|
Common stock: $.001 par value per share, 75,000 shares authorized; 40,207 and 40,225 issued and outstanding at December 31, 2019 and 2018, respectively |
|
|
40 |
|
|
40 |
|
Additional paid-in capital |
|
|
96,109 |
|
|
93,310 |
|
Accumulated income |
|
|
181,167 |
|
|
172,378 |
|
Accumulated other comprehensive loss |
|
|
(13,295) |
|
|
(13,287) |
|
Total stockholders' equity |
|
|
264,021 |
|
|
252,441 |
|
Total liabilities and stockholders' equity |
|
$ |
384,570 |
|
$ |
352,826 |
See accompanying notes to consolidated financial statements.
F-3
OneSpan Inc.
CONSOLIDATED STATEMENTS OF OPERATIONS
(in thousands, except per share data)
|
|
|
|
For the years ended December 31, |
|||||||
|
|
|
|
2019 |
|
2018 |
|
2017 |
|||
|
Revenue |
|
|
|
|
|
|
|
|
|
|
|
Product and license |
|
|
$ |
184,173 |
|
$ |
152,977 |
|
$ |
147,257 |
|
Services and other |
|
|
|
70,397 |
|
|
59,303 |
|
|
46,034 |
|
Total revenue |
|
|
|
254,570 |
|
|
212,280 |
|
|
193,291 |
|
|
|
|
|
|
|
|
|
|
|
|
|
Cost of goods sold |
|
|
|
|
|
|
|
|
|
|
|
Product and license |
|
|
|
63,393 |
|
|
50,706 |
|
|
48,333 |
|
Services and other |
|
|
|
18,569 |
|
|
14,107 |
|
|
10,444 |
|
Total cost of goods sold |
|
|
|
81,962 |
|
|
64,813 |
|
|
58,777 |
|
|
|
|
|
|
|
|
|
|
|
|
|
Gross profit |
|
|
|
172,608 |
|
|
147,467 |
|
|
134,514 |
|
|
|
|
|
|
|
|
|
|
|
|
|
Operating costs |
|
|
|
|
|
|
|
|
|
|
|
Sales and marketing |
|
|
|
61,503 |
|
|
63,805 |
|
|
58,994 |
|
Research and development |
|
|
|
42,463 |
|
|
32,197 |
|
|
23,119 |
|
General and administrative |
|
|
|
43,897 |
|
|
41,589 |
|
|
37,400 |
|
Amortization / impairment of intangible assets |
|
|
|
9,470 |
|
|
9,852 |
|
|
8,809 |
|
Total operating costs |
|
|
|
157,333 |
|
|
147,443 |
|
|
128,322 |
|
|
|
|
|
|
|
|
|
|
|
|
|
Operating income |
|
|
|
15,275 |
|
|
24 |
|
|
6,192 |
|
|
|
|
|
|
|
|
|
|
|
|
|
Interest income, net |
|
|
|
747 |
|
|
1,265 |
|
|
1,431 |
|
Other income (expense), net |
|
|
|
(527) |
|
|
2,264 |
|
|
758 |
|
|
|
|
|
|
|
|
|
|
|
|
|
Income before income taxes |
|
|
|
15,495 |
|
|
3,553 |
|
|
8,381 |
|
Provision (benefit) for income taxes |
|
|
|
6,706 |
|
|
(293) |
|
|
30,780 |
|
|
|
|
|
|
|
|
|
|
|
|
|
Net income (loss) |
|
|
$ |
8,789 |
|
$ |
3,846 |
|
$ |
(22,399) |
|
|
|
|
|
|
|
|
|
|
|
|
|
Net income (loss) per share |
|
|
|
|
|
|
|
|
|
|
|
Basic |
|
|
$ |
0.22 |
|
$ |
0.10 |
|
$ |
(0.56) |
|
Diluted |
|
|
$ |
0.22 |
|
$ |
0.10 |
|
$ |
(0.56) |
|
|
|
|
|
|
|
|
|
|
|
|
|
Weighted average common shares outstanding |
|
|
|
|
|
|
|
|
|
|
|
Basic |
|
|
|
40,050 |
|
|
39,932 |
|
|
39,802 |
|
Diluted |
|
|
|
40,136 |
|
|
40,046 |
|
|
39,802 |
See accompanying notes to consolidated financial statements.
F-4
CONSOLIDATED STATEMENTS OF COMPREHENSIVE INCOME (LOSS)
(in thousands)
|
|
|
|
For the years ended December 31, |
|||||||
|
|
|
|
2019 |
|
2018 |
|
2017 |
|||
|
Net income (loss) |
|
|
$ |
8,789 |
|
$ |
3,846 |
|
$ |
(22,399) |
|
Other comprehensive income (loss) |
|
|
|
|
|
|
|
|
|
|
|
Cumulative translation adjustment, net of tax |
|
|
|
1,543 |
|
|
(5,516) |
|
|
4,029 |
|
Pension adjustment, net of tax |
|
|
|
(1,551) |
|
|
797 |
|
|
313 |
|
Comprehensive income (loss) |
|
|
$ |
8,781 |
|
$ |
(873) |
|
$ |
(18,057) |
See accompanying notes to consolidated financial statements.
F-5
OneSpan Inc.
CONSOLIDATED STATEMENTS OF STOCKHOLDERS’ EQUITY
(in thousands)
|
|
|
|
|
|
|
|
|
|
|
|
|
|
Accumulated |
|
|
|
|
|
|
|
|
|
|
|
|
Additional |
|
|
|
|
Other |
|
Total |
|||
|
|
|
Common Stock |
|
Paid-In |
|
Accumulated |
|
Comprehensive |
|
Stockholders' |
|||||||
|
Description |
|
Shares |
|
Amount |
|
Capital |
|
Income |
|
Income (Loss) |
|
Equity |
|||||
|
Balance at December 31, 2016 |
|
40,097 |
|
|
40 |
|
|
87,481 |
|
|
178,550 |
|
|
(12,910) |
|
|
253,161 |
|
Net income (loss) |
|
— |
|
|
— |
|
|
— |
|
|
(22,399) |
|
|
— |
|
|
(22,399) |
|
Foreign currency translation adjustment, net of tax |
|
— |
|
|
— |
|
|
— |
|
|
— |
|
|
4,029 |
|
|
4,029 |
|
Restricted stock awards |
|
(11) |
|
|
— |
|
|
3,466 |
|
|
— |
|
|
— |
|
|
3,466 |
|
Tax payments for stock issuances |
|
— |
|
|
— |
|
|
(640) |
|
|
— |
|
|
— |
|
|
(640) |
|
Pension adjustment, net of tax |
|
— |
|
|
— |
|
|
— |
|
|
— |
|
|
313 |
|
|
313 |
|
Balance at December 31, 2017 |
|
40,086 |
|
|
40 |
|
|
90,307 |
|
|
156,151 |
|
|
(8,568) |
|
|
237,930 |
|
Cumulative impact of change in accounting principles, net of tax |
|
— |
|
|
— |
|
|
— |
|
|
12,381 |
|
|
— |
|
|
12,381 |
|
Net income (loss) |
|
— |
|
|
— |
|
|
— |
|
|
3,846 |
|
|
— |
|
|
3,846 |
|
Foreign currency translation adjustment, net of tax |
|
— |
|
|
— |
|
|
— |
|
|
— |
|
|
(5,516) |
|
|
(5,516) |
|
Restricted stock awards |
|
139 |
|
|
— |
|
|
3,973 |
|
|
— |
|
|
— |
|
|
3,973 |
|
Tax payments for stock issuances |
|
— |
|
|
— |
|
|
(970) |
|
|
— |
|
|
— |
|
|
(970) |
|
Pension adjustment, net of tax |
|
— |
|
|
— |
|
|
— |
|
|
— |
|
|
797 |
|
|
797 |
|
Balance at December 31, 2018 |
|
40,225 |
|
$ |
40 |
|
$ |
93,310 |
|
$ |
172,378 |
|
$ |
(13,287) |
|
$ |
252,441 |
|
Net income (loss) |
|
— |
|
|
— |
|
|
— |
|
|
8,789 |
|
|
— |
|
|
8,789 |
|
Foreign currency translation adjustment, net of tax |
|
— |
|
|
— |
|
|
— |
|
|
— |
|
|
1,543 |
|
|
1,543 |
|
Restricted stock awards |
|
— |
|
|
— |
|
|
3,368 |
|
|
— |
|
|
— |
|
|
3,368 |
|
Tax payments for stock issuances |
|
(18) |
|
|
— |
|
|
(569) |
|
|
— |
|
|
— |
|
|
(569) |
|
Pension adjustment, net of tax |
|
— |
|
|
— |
|
|
— |
|
|
— |
|
|
(1,551) |
|
|
(1,551) |
|
Balance at December 31, 2019 |
|
40,207 |
|
$ |
40 |
|
$ |
96,109 |
|
$ |
181,167 |
|
$ |
(13,295) |
|
$ |
264,021 |
See accompanying notes to consolidated financial statements.
F-6
OneSpan Inc.
CONSOLIDATED STATEMENTS OF CASH FLOWS
(in thousands)
|
|
|
Twelve months ended December 31, |
|||||||
|
|
|
2019 |
|
2018 |
|
2017 |
|||
|
Cash flows from operating activities: |
|
|
|
|
|
|
|
|
|
|
Net income (loss) from operations |
|
$ |
8,789 |
|
$ |
3,846 |
|
$ |
(22,399) |
|
Adjustments to reconcile net income (loss) from operations to net cash provided by (used in) operations: |
|
|
|
|
|
|
|
|
|
|
Depreciation, amortization, and impairment of intangible assets |
|
|
11,545 |
|
|
12,138 |
|
|
10,601 |
|
Loss (gain) on disposal of assets |
|
|
69 |
|
|
(49) |
|
|
185 |
|
Deferred tax expense (benefit) |
|
|
(1,624) |
|
|
(7,431) |
|
|
13,053 |
|
Stock-based compensation |
|
|
3,368 |
|
|
3,973 |
|
|
3,466 |
|
Changes in operating assets and liabilities: |
|
|
|
|
|
|
|
|
|
|
Accounts receivable, net |
|
|
(3,414) |
|
|
(11,960) |
|
|
(8,428) |
|
Inventories, net |
|
|
(5,391) |
|
|
(2,388) |
|
|
5,380 |
|
Contract assets |
|
|
655 |
|
|
(3,110) |
|
|
— |
|
Accounts payable |
|
|
3,628 |
|
|
(1,475) |
|
|
(1,013) |
|
Income taxes payable |
|
|
318 |
|
|
(2,541) |
|
|
11,926 |
|
Accrued expenses |
|
|
(1,286) |
|
|
2,211 |
|
|
2,514 |
|
Deferred compensation |
|
|
(334) |
|
|
(291) |
|
|
(77) |
|
Deferred revenue |
|
|
1,465 |
|
|
9,538 |
|
|
3,704 |
|
Other assets and liabilities |
|
|
456 |
|
|
(1,235) |
|
|
(1,285) |
|
Net cash provided by operating activities |
|
|
18,244 |
|
|
1,226 |
|
|
17,627 |
|
|
|
|
|
|
|
|
|
|
|
|
Cash flows from investing activities: |
|
|
|
|
|
|
|
|
|
|
Adjustments to reconcile net income (loss) from operations to net cash provided by (used in) operations: |
|
|
|
|
|
|
|
|
|
|
Purchase of short term investments |
|
|
(33,839) |
|
|
(22,820) |
|
|
(178,658) |
|
Maturities of short term investments |
|
|
31,399 |
|
|
80,000 |
|
|
195,000 |
|
Purchase of Dealflo, net of cash acquired |
|
|
— |
|
|
(53,065) |
|
|
— |
|
Additions to property and equipment |
|
|
(7,453) |
|
|
(3,685) |
|
|
(3,088) |
|
Other |
|
|
— |
|
|
(236) |
|
|
(456) |
|
Net cash provided by (used in) investing activities |
|
|
(9,893) |
|
|
194 |
|
|
12,798 |
|
|
|
|
|
|
|
|
|
|
|
|
Cash flows from financing activities: |
|
|
|
|
|
|
|
|
|
|
Tax payments for restricted stock issuances |
|
|
(569) |
|
|
(970) |
|
|
(640) |
|
Net cash used in financing activities |
|
|
(569) |
|
|
(970) |
|
|
(640) |
|
|
|
|
|
|
|
|
|
|
|
|
Effect of exchange rate changes on cash |
|
|
(208) |
|
|
(1,556) |
|
|
(469) |
|
|
|
|
|
|
|
|
|
|
|
|
Net increase (decrease) in cash |
|
|
7,574 |
|
|
(1,106) |
|
|
29,316 |
|
Cash, cash equivalents, and restricted cash, beginning of period |
|
|
77,555 |
|
|
78,661 |
|
|
49,345 |
|
Cash, cash equivalents, and restricted cash, end of period (1.) |
|
$ |
85,129 |
|
$ |
77,555 |
|
$ |
78,661 |
|
|
|
|
|
|
|
|
|
|
|
|
Supplemental cash flow disclosures: |
|
|
|
|
|
|
|
|
|
|
Cash paid for income taxes |
|
$ |
7,839 |
|
$ |
10,884 |
|
$ |
6,427 |
See accompanying notes to consolidated financial statements.
F-7
|
(1.) |
The following table provides a reconciliation of cash, cash equivalents and restricted cash shown above to amounts reported within the consolidated balance sheets as of December 31, 2019 and 2018 and our previously reported consolidated balance sheet as of December 31, 2017 in our Annual Report on Form 10-K for the year ended December 31, 2018 (in thousands): |
|
|
|
December 31, 2019 |
|
December 31, 2018 |
|
December 31, 2017 |
|||
|
|
|
|
|
|
|
|
|
|
|
|
Cash and cash equivalents |
|
$ |
84,282 |
|
$ |
76,708 |
|
$ |
78,661 |
|
Restricted cash included in other non-current assets |
|
|
847 |
|
|
847 |
|
|
— |
|
Cash, cash equivalents and restricted cash |
|
$ |
85,129 |
|
$ |
77,555 |
|
$ |
78,661 |
F-8
OneSpan Inc.
NOTES TO CONSOLIDATED FINANCIAL STATEMENTS
(amounts in thousands, except per share data)
Unless otherwise noted, references in this Annual Report on Form 10‑K to “OneSpan”, “Company”, “we”, “our” and “us” refer to OneSpan Inc. and its subsidiaries.
Note 1 – Summary of Significant Accounting Policies
Description of the Company
OneSpan Inc. and its wholly owned subsidiaries design, develop, market and support hardware and software security systems that manage and secure access to information assets. OneSpan has operations in Austria, Australia, Belgium, Brazil, Canada, China, France, Japan, The Netherlands, Singapore, Switzerland, the United Arab Emirates, the United Kingdom (U.K)., and the United States (U.S.).
In accordance with ASC 280, Segment Reporting, our operations are reported as a single operating segment. The chief operating decision maker is the Chief Executive Officer who reviews the statement of operations of the Company on a consolidated basis, makes decisions and manages the operations of the Company as a single operating segment.
Principles of Consolidation
The consolidated financial statements include the accounts of OneSpan Inc. and its wholly owned subsidiaries. Intercompany accounts and transactions have been eliminated in consolidation.
Reclassifications
Certain amounts from prior years have been reclassified to conform to current year presentation.
Estimates and Assumptions
The preparation of financial statements in conformity with accounting principles generally accepted in the U.S. requires management to make estimates and assumptions that affect the reported amounts of assets and liabilities and disclosure of contingent assets and liabilities at the date of the financial statements and the reported amounts of revenue and expenses during the reporting period. Actual results could differ from those estimates.
Foreign Currency Translation and Transactions
The financial position and results of operations of the majority of the Company’s foreign subsidiaries are measured using the local currency as the functional currency. Accordingly, assets and liabilities are translated into U.S. Dollars using current exchange rates as of the balance sheet date. Revenues and expenses are translated at average exchange rates prevailing during the year. Translation adjustments arising from differences in exchange rates are charged or credited to other comprehensive income (loss). Gains or (losses) resulting from foreign currency transactions were $1.5 million, $0.2 million, and $0.5 million in 2019, 2018, and 2017, respectively, and are included in other income (expense), net in the consolidated statements of operations.
The financial position and results of our operations in Singapore, Switzerland, and Canada are measured in U.S. Dollars. For these subsidiaries, gains and losses that result from foreign currency transactions are included in the consolidated statements of operations in other income (expense), net.
F-9
ONESPAN INC.
NOTES TO CONSOLIDATED FINANCIAL STATEMENTS – (Continued)
(amounts in thousands, except per share data)
Revenue Recognition
Under ASC 605 – For the Year ended December 31, 2017
Prior to January 1, 2018 we recognized revenue in accordance with ASC 985-605, Software – Revenue Recognition, ASC 985-605-25, Revenue Recognition – Multiple Element Arrangements and Staff Accounting Bulletin 104.
Product and License Revenue includes hardware products and software licenses. Services and Other includes software as a service (“SaaS”), maintenance and support, and professional services.
Revenue is recognized when there is persuasive evidence that an arrangement exists, delivery has occurred, the fee is fixed or determinable and collection of the revenue is probable.
In multiple-element arrangements, some of our products are accounted for under the software provisions of ASC 985-605 and others under the provisions that relate to the sale of non-software products.
In our typical multiple-element arrangement, the primary deliverables include:
|
1. a client component (i.e., an item that is used by the person being authenticated in the form of either a new standalone hardware device or software that is downloaded onto a device the customer already owns); |
|
2. host system software that is installed on the customer’s systems (i.e., software on the host system that verifies the identity of the person being authenticated) or licenses for additional users on the host system software if the host system software had been installed previously; and |
|
3. post contract support (PCS) in the form of maintenance on the host system software or support. |
Our multiple-element arrangements may also include other items that are usually delivered prior to the recognition of any revenue are incidental to the overall transaction such as initialization of the hardware device, customization of the hardware device itself or the packaging in which it is delivered, deployment services where we deliver the device to our customer’s end-use customer or employee and, in some limited cases, professional services to assist with the initial implementation of a new customer.
In multiple-element arrangements that include a hardware client device, we allocate the selling price among all elements, delivered and undelivered, based on estimated selling price of all of the elements. In multiple-element arrangements that include a software client device, we continue to account for each element under the current standards of ASC 985-605 related to software. When software for the client device and host software are delivered elements, we use the Residual Method for determining the amount of revenue to recognize for token and software licenses if we have vendor-specific objective evidence (“VSOE”) for all of the undelivered elements. Any discount provided to the customer is applied fully to the delivered elements in such an arrangement. VSOE for undelivered elements is established using the “bell curve method.” Under this method, we conclude VSOE exists when a substantial majority of PCS renewals are within a narrow range of pricing. The estimated selling price of PCS items is based on an established percentage of the user license fee attributable to the specific software. In sales arrangements where VSOE of fair value has not been established, revenue for all elements is deferred and amortized over the life of the arrangement.
For transactions other than multiple-element arrangements, we recognize revenue as follows:
|
1. Product and License Revenue: Revenue from the sale of computer security hardware or the license of software is recorded upon shipment, or upon delivery based on the underlying contract terms. No significant obligations or contingencies exist with regard to delivery, customer acceptance or rights of return at the time revenue is recognized. |
F-10
ONESPAN INC.
NOTES TO CONSOLIDATED FINANCIAL STATEMENTS – (Continued)
(amounts in thousands, except per share data)
|
2. SaaS: We generate SaaS revenues from our cloud services offerings. SaaS revenues include fees from customers for access to the OneSpan Sign (formerly eSignLive) suite of solutions. Our standard customer arrangements generally do not provide the customer with the right to take possession of the software supporting the cloud-based application service at any time. As such, these arrangements are considered service contracts and revenue is recognized ratably over the service period of the contract. |
|
3. Maintenance and Support Agreements: Maintenance and support agreements generally call for us to provide software updates and technical support, respectively, to customers. Revenue on maintenance and technical support is deferred and recognized ratably over the term of the applicable maintenance and support agreement. |
|
4. Professional Services: We provide professional services to our customers. Revenue from such services is recognized during the period in which the services are performed. |
We recognize revenue from sales to distributors and resellers on the same basis as sales made directly to customers. We recognize revenue when there is persuasive evidence that an arrangement exists, delivery has occurred, the fee is fixed or determinable and collection of the revenue is probable.
For large-volume transactions, we may negotiate a specific price that is based on the number of users of the software license or quantities of hardware supplied. The per unit prices for large-volume transactions are generally lower than transactions for smaller quantities and the price differences are commonly referred to as volume-purchase discounts.
All revenue is reported on a net basis, excluding any sales taxes or value added taxes.
Under ASC 606 – For the Years ended December 31, 2019 and December 31, 2018
On January 1, 2018, we adopted FASB Accounting Standards Codification (ASC) Topic 606, “Revenue from Contracts with Customers”, or “Topic 606” using the modified retrospective method applied to those contracts which were not completed as of January 1, 2018. Results for reporting periods beginning after January 1, 2018 are presented under Topic 606, while prior period amounts are not adjusted and continue to be reported in accordance with our historic accounting under FASB ASC Topic 605 “Revenue Recognition ” and FASB ASC Topic 985-605 “ Software-Revenue Recognition ” (“Topic 605”). We recorded a net increase to opening Accumulated Income of $11.9 million, net of tax, as of January 1, 2018 due to the cumulative impact of adopting Topic 606, with the impact primarily related to the accounting impacts of our customer contracts that include a term license to our software, as well as the impact of accounting for costs incurred to obtain our contracts. We determine revenue recognition through the following steps:
|
|
· |
|
Identification of the contract, or contracts, with a customer; |
|
|
· |
|
Identification of the performance obligations in the contract; |
|
|
· |
|
Determination of the transaction price; |
|
|
· |
|
Allocation of the transaction price to the performance obligations in the contract; and |
|
|
· |
|
Recognition of revenue when, or as, we satisfy a performance obligation. |
Revenues are recognized when control of the promised goods or services is transferred to our customers, in an amount that reflects the consideration we expect to be entitled to in exchange for those products or services, which excludes any sales incentives and amounts collected on behalf of third parties. Taxes assessed by a governmental authority that are both imposed on and concurrent with a specific revenue-producing transaction, that are collected by the Company from a customer, are excluded from revenue. Shipping and handling costs associated with outbound freight after control over a product has transferred to a customer are accounted for as a fulfillment cost and are included in cost of goods sold.
Nature of Goods and Services
F-11
ONESPAN INC.
NOTES TO CONSOLIDATED FINANCIAL STATEMENTS – (Continued)
(amounts in thousands, except per share data)
We derive our revenues primarily from Product and License Revenue, which includes hardware products and software licenses, and Services and Other, which is inclusive of software-as-a-service (which we refer to as “subscription”), maintenance and support, and professional services.
Product Revenue: Revenue from the sale of security hardware is recorded upon shipment, which is the point at which control of the goods are transferred and the completion of the performance obligation, unless there are specific terms that would suggest control is transferred at a later date (e.g. delivery). No significant obligations or contingencies typically exist with regard to delivery, customer acceptance or rights of return at the time revenue is recognized. Customer payments normally correspond with delivery.
License Revenue: Revenue from the sale of software licenses is recorded upon the latter of when the customer receives the ability to access the software or when they are legally allowed to use the software. No significant obligations or contingencies exist with regard to delivery, customer acceptance or rights of return at the time revenue is recognized. Contracts with customers for distinct licenses of intellectual property include perpetual licenses, which grant the customer unlimited access to the software, and term licenses which limit the customer’s access to the software to a specific time period. The typical term license length is 3 years. Customer payments normally correspond with delivery for perpetual licenses. For term licenses, payments are made either on installment or upon initial delivery. In limited circumstances, we integrate third party software solutions into our software products. We have determined that, consistent with our conclusion under prior revenue recognition rules, generally we act as the principal with respect to the satisfaction of the related performance obligation and record the corresponding revenue on a gross basis from these transactions. The fees paid to the third parties are recognized as a component of cost of goods sold when the revenue is recognized.
Subscription Revenue: We generate subscription revenues from our cloud services offerings. Subscription revenues mostly include fees from customers for access to the OneSpan Sign and Dealflo solutions. Our standard customer arrangements do not provide the customer with the right to take possession of the software supporting the cloud-based application service at any time. As such, these arrangements are considered service contracts and revenue is recognized ratably over the service period of the contract or based on customer usage. Customer payments are normally in advance for an annual subscription period.
Maintenance, Support and Other: Maintenance and support agreements generally call for us to provide software updates and technical support, respectively, to customers. The annual fee for maintenance and technical support is recognized ratably over the term of the maintenance and support agreement as this is the period the services are delivered. Customer payments are normally in advance for annual service.
Professional Services: Professional services revenues are primarily comprised of implementing, automating and extending business processes, technology infrastructure, and software applications. Professional services revenues are recognized over time as services are rendered, usually over a period of time that is generally less than a few months. Most projects are performed on a time and materials basis, while a portion of revenues is derived from projects performed on a fixed fee. For time and material contracts, revenues are generally recognized and invoiced by multiplying the number of hours expended in the performance of the contract by the contractual hourly rates. For fixed fee contracts, revenues are generally recognized using an input method based on the ratio of hours expended to total estimated hours to complete the services. Customer payments normally correspond with delivery.
Significant Judgments
We enter into contracts to deliver a combination of hardware devices, software licenses, subscriptions, maintenance and support and, in some situations, professional services. The Company evaluates the nature of the goods or services promised in these arrangements to identify the distinct performance obligations. Determining whether products and services are considered distinct performance obligations that should be accounted for separately versus together may require significant judgment. When a hardware client device and licenses to host software are sold in a contract, they are treated as a single performance obligation because the software license is deemed to be a component of the hardware that is integral to the functionality of the hardware that is used by our customers for identity
F-12
ONESPAN INC.
NOTES TO CONSOLIDATED FINANCIAL STATEMENTS – (Continued)
(amounts in thousands, except per share data)
authentication. When a software client device is sold in a contract with host software, the licenses are considered a single performance obligation to deliver the authentication solution to the customer. In either of these types of arrangements, maintenance and support and professional services are typically distinct separate performance obligations from the hardware and software solutions. Our contracts to deliver subscription services typically do not include multiple performance obligations; however, in certain limited cases, customers may purchase professional services that are distinct performance obligations.
For contracts that contain multiple performance obligations, the transaction price is allocated to the separate performance obligations based on their estimated relative stand-alone selling price (“SSP”). Judgment is required to determine the SSP of each distinct performance obligation. We determine SSP for maintenance and support and professional services based on observable inputs; specifically, the range of prices charged to customers to renew annual maintenance and support contracts and the range of hourly rates we charge our customers in standalone professional services contracts. In instances where SSP is not directly observable, and when we sell at a highly variable price range, such as for transactions involving software licenses or subscriptions, we determine the SSP for those performance obligations using the residual method.
Cash and Cash Equivalents
Cash and cash equivalents are stated at cost plus accrued interest, which approximates fair value. Cash equivalents are high-quality short term money market instruments and commercial paper with maturities at acquisition of three months or less. Cash and cash equivalents are held by a number of U.S. and non-U.S. commercial banks and money market investment funds. During the year ended December 31, 2018, we entered into a new lease agreement that required a letter of credit in the amount of $0.8 million to secure the obligation. The restricted cash related to this letter of credit is recorded in other non-current assets on the Consolidated Balance Sheet as of December 31, 2019 and December 31, 2018.
Short Term Investments
Short term investments consist of U.S. treasury bills and notes, U.S. government agency notes, corporate notes, and high quality commercial paper with maturities at acquisition of more than three months and less than twelve months. Fair value is determined using Level 2 inputs as defined by ASC 820, Fair Value Measurements.
Accounts Receivable and Allowance for Doubtful Accounts
The credit worthiness of customers (including distributors and resellers) is reviewed prior to shipment. A reasonable assurance of collection is a requirement for revenue recognition. Credit limit adjustments for existing customers may result from the periodic review of outstanding accounts receivable. The Company records trade accounts receivable at invoice values, which are generally equal to fair value.
We maintain allowances for estimated losses resulting from the inability of our customers to make payments for goods and services. We analyze accounts receivable balances, customer credit-worthiness, current economic trends and changes in our customer payment timing when evaluating the adequacy of the allowance for doubtful accounts. The allowance is based on a specific review of all significant past-due accounts. If the financial condition of our customers deteriorates, resulting in an impairment of their ability to make payments, additional allowances may be required.
Inventories
Inventories, consisting principally of hardware and component parts, are stated at the lower of cost or net realizable value. Cost is determined using the first-in-first-out (FIFO) method. We write down inventory when it appears that the carrying cost of the inventory may not be recovered through subsequent sale of the inventory. We analyze the quantity of inventory on hand, the quantity sold in the past year, the anticipated sales volume in the form of sales to new customers as well as sales to previous customers, the expected sales price and the cost of making the sale when
F-13
ONESPAN INC.
NOTES TO CONSOLIDATED FINANCIAL STATEMENTS – (Continued)
(amounts in thousands, except per share data)
evaluating the valuation of our inventory. If the sales volume or sales price of a specific model declines significantly, additional write downs may be required.
Property and Equipment
Property and equipment is stated at cost. Depreciation is computed using the straight-line method over the estimated useful lives of the related assets ranging from three to ten years. Leasehold improvements are depreciated over the lesser of the remaining lease term or 10 years. Additions and improvements are capitalized, while expenditures for maintenance and repairs are charged to operations as incurred. Gains or losses resulting from sales or retirements are recorded as incurred, at which time related costs and accumulated depreciation are removed from the accounts.
Equity Method Investment
We apply the equity method of accounting to our investment in Promon AS (Promon), because we exercise significant influence, but not controlling interest, in the investee. Promon is a technology company headquartered in Norway that specializes in mobile app security, whose solutions focus largely on Runtime Application Self-Protection (RASP). We exercise significant influence over Promon as a result of our 17% ownership interest in Promon, our representation on Promon’s Board of Directors, and the significance to Promon of our business activities with them. We integrate Promon’s RASP technology into our software solution, which are licensed to our customers. Under the equity method of accounting, the Company’s proportionate share of the net earnings (losses) of Promon is reported in other income (expense), net in our consolidated Statements of Operations. The impact of the proportionate share of net earnings (losses) were immaterial for the years ended December 31, 2019, 2018 and 2017 as were the relative size of Promon’s assets and operations in relation to the Company’s. The carrying value of our equity method investment is reported in other noncurrent assets in the consolidated Balance Sheets and is reported originally at cost and adjusted each period for the Company’s share of the investee’s earnings (losses) and dividends paid, if any. The Company also assesses the investment for impairment whenever events or changes in circumstances indicate that the carrying value of the investment may not be recoverable. The Company did not record any impairment charges during the years ended December 31, 2019, 2018 or 2017. The Company recorded $3.5 million in costs of sales in 2019 for license fees owed to Promon for use of their software and technology. The Company owed Promon $2.2 million as of December 31, 2019, which is included in accounts payable and accrued liabilities.
Cost of Goods Sold
Included in product and license cost of goods sold are direct product costs. Cost of goods sold related to service revenues are primarily costs related to subscription solutions, including personnel and equipment costs, and personnel costs of employees providing professional services and maintenance support.
Research and Development Costs
Costs for research and development, principally the design and development of hardware, and the design and development of software prior to the determination of technological feasibility, are expensed as incurred on a project-by-project basis.
Software Development Costs
Software development costs are accounted for in accordance with ASC 985-20, Costs of Software to be Sold, Leased, or Marketed. Research costs and software development costs, prior to the establishment of technological feasibility, determined based upon the creation of a working model, are expensed as incurred. Our software capitalization policy defines technological feasibility as a functioning beta test prototype with confirmed manufacturability (a working model), within a reasonably predictable range of costs. Additional criteria include receptive customers, or potential customers, as evidenced by interest expressed in a beta test prototype, at some suggested selling price. Our policy is to amortize capitalized costs by the greater of (a) the ratio that current gross
F-14
ONESPAN INC.
NOTES TO CONSOLIDATED FINANCIAL STATEMENTS – (Continued)
(amounts in thousands, except per share data)
revenue for a product bears to the total of current and anticipated future gross revenue for that product or (b) the straight-line method over the remaining estimated economic life of the product, generally two to five years, including the period being reported on.
Other Income (Expense), Net
Other income (expense), net primarily includes exchange gains (losses) on transactions that are denominated in currencies other than our subsidiaries’ functional currencies, subsidies received from foreign governments in support of our research and development in those countries and other miscellaneous non-operational expenses. During 2018, the Company recognized a $1.2 million government subsidy from a foreign government in support of our advancement authentication technology, which is included in other income (expense), net on the statement of operations for the year ended December 31, 2018.
Income Taxes
As a global company, we calculate and provide for income taxes in each tax jurisdiction in which we operate. The provision for income taxes includes the amounts payable or refundable for the current year, the effect of deferred taxes and impacts from uncertain tax positions. Our provision for income taxes is significantly affected by shifts in the geographic mix of our pre-tax earnings across tax jurisdictions, changes in tax laws and regulations, and tax planning opportunities available in each tax jurisdiction.
Deferred tax assets and liabilities are recognized for the expected future tax consequences of temporary differences between the financial statement and tax bases of our assets and liabilities and for operating losses and tax credit carryforwards. Deferred tax assets and liabilities are measured using enacted tax rates that will apply to taxable income in the years in which those differences are expected to be recovered or settled. Valuation allowances are established for deferred tax assets when it is more likely than not that a tax benefit will not be realized. We recognize the effect of a change in tax rates on deferred tax assets and liabilities and in income in the period that includes the enactment date.
We recognize tax benefits for tax positions that are more likely than not to be sustained upon examination by tax authorities. The amount recognized is measured as the largest amount of benefit that is greater than 50 percent likely to be realized upon ultimate settlement. Unrecognized tax benefits are tax benefits claimed in our income tax returns that do not meet these recognition and measurement standards. Assumptions, judgments, and the use of estimates are required in determining whether the “more likely than not” standard has been meet when developing the provision for income taxes.
We monitor for changes in tax laws and reflect the impacts of tax law changes in the period of enactment.
Fair Value of Financial Instruments
At December 31, 2019 and 2018, our financial instruments were cash and equivalents, short term investments, accounts receivable, accounts payable and accrued liabilities. The estimated fair value of our financial instruments has been determined by using available market information and appropriate valuation methodologies, as defined in ASC 820, Fair Value Measurements. The fair values of the financial instruments were not materially different from their carrying amounts at December 31, 2019 and 2018. See Note 8 - Fair Value Measurements for additional detail.
Accounting for Leases
All of our leases are operating leases.
F-15
ONESPAN INC.
NOTES TO CONSOLIDATED FINANCIAL STATEMENTS – (Continued)
(amounts in thousands, except per share data)
Under ASC 840 – For the Years ended December 31, 2018 and December 31, 2017;
Rent expense on facility leases is charged evenly over the life of the lease, regardless of the timing of actual payments. We relocated one of our principal executive offices from Oakbrook Terrace, Illinois to Chicago, Illinois during 2018 and recognized $0.3 million of lease exit costs in general and administrative expense on the statement of operations for the year ended December 31, 2018.
Under ASC 842 – For the Year ended December 31, 2019:
The Company adopted ASC Topic 842, Leases as of January 1, 2019, using the modified retrospective approach. Prior period amounts were not adjusted. In addition, the Company elected the following practical expedients:
|
· |
The package of practical expedients permitted under the transition guidance within the new standard. The practical expedient package applies to leases commenced prior to adoption of the new standard and permits companies not to reassess whether existing or expired contracts contain a lease, the lease classification, and any initial direct costs for existing leases. |
|
· |
The short-term lease practical expedient, which allowed the Company to exclude short-term leases from recognition in the consolidated balance sheets; |
|
· |
We have lease agreements that contain lease and non-lease components. For automobile leases, we account for lease and non-lease components together. For office leases, we account for these components separately using a relative standalone selling basis; and |
|
· |
We apply the portfolio approach to automobile leases with similar characteristics that commence in the same period. |
The adoption of this accounting standard resulted in the recording of Operating lease right-of-use (“ROU”) assets and Operating lease liabilities of $9.2 million and $11.0 million, respectively, as of January 1, 2019. The difference between the asset and liability is a result of lease incentives, such as tenant improvement allowances, and deferred rent on the balance sheet at transition. The adoption of ASC Topic 842 had no impact on Retained earnings. See Note 9 – Leases for additional information.
Impairment of Long-Lived and Intangible Assets
Definite-lived intangible assets include proprietary technology, customer relationships, and other intangible assets. Intangible assets other than patents with definite lives are amortized over the useful life, generally three to seven years for proprietary technology and five to twelve years for customer relationships. Patents are amortized over the life of the patent, generally 20 years in the U.S. Intangible assets arising from business combinations, such as acquired technology, customer relationships, and other intangible assets, are originally recorded at fair value.
Long-lived assets, including property, plant and equipment, operating lease right-of-use assets, definite-lived intangible assets being amortized and capitalized software costs, are reviewed for impairment whenever events or changes in circumstances indicate that the carrying amount of the long-lived asset group may not be recoverable. An impairment loss shall be recognized if the carrying amount of a long-lived asset group exceeds the sum of the undiscounted cash flows expected to result from the use and eventual disposition of the asset. If it is determined that an impairment loss has occurred, the loss is measured as the amount by which the carrying amount of the long-lived asset group exceeds its fair value. Long-lived assets held for sale are reported at the lower of carrying value or fair value less cost to sell.
F-16
ONESPAN INC.
NOTES TO CONSOLIDATED FINANCIAL STATEMENTS – (Continued)
(amounts in thousands, except per share data)
Goodwill
Goodwill represents the excess of purchase price over the fair value of net identifiable assets acquired in a business combination. We assess the impairment of goodwill and intangible assets each November 30 or whenever events or changes in circumstances indicate that the carrying value may not be recoverable. The Company’s impairment assessment begins with a qualitative assessment to determine whether it is more likely than not that the fair value of a reporting unit is less than its carrying value. The qualitative assessment includes comparing the overall financial performance of the reporting unit against the planned results used in the last quantitative goodwill impairment test. Additionally, the reporting unit’s fair value is assessed in light of certain events and circumstances, including macroeconomic conditions, industry and market considerations, cost factors, and other relevant entity- and reporting unit specific events. The selection and assessment of qualitative factors used to determine whether it is more likely than not that the fair value of the reporting unit is less than the carrying value may involve significant judgments and estimates. If it is determined under the qualitative assessment that it is more likely than not that the fair value of the reporting unit is less than its carrying value, then a two-step quantitative impairment test is performed. Under the first step, the estimated fair value of the reporting unit is compared with its carrying value (including goodwill). If the fair value of the reporting unit exceeds its carrying value, step two does not need to be performed. If the estimated fair value of the reporting unit is less than its carrying value, an indication of goodwill impairment exists for the reporting unit and the enterprise must perform step two of the impairment test (measurement). Under step two, an impairment loss is recognized for any excess of the carrying amount of the reporting unit’s goodwill over the implied fair value of that goodwill. The implied fair value of goodwill is determined by allocating the fair value of the reporting unit in a manner similar to a purchase price allocation in acquisition accounting. The residual amount after this allocation is the implied fair value of the reporting unit goodwill. Fair value of the reporting unit under the two-step assessment is determined using a combination of both income and market-based variation approaches. The inputs and assumptions to valuation methods used to estimate the fair value of the reporting unit involves significant judgments.
We operate in one reporting unit and had no goodwill impairment recorded for the years ended December 31, 2019, 2018, and 2017.
Stock-Based Compensation
We have stock-based employee compensation plans, described in Note 11 – Long-Term Compensation Plan and Stock Compensation. ASC 718, Stock Compensation requires us to estimate the fair value of restricted stock granted to employees, directors and others to record compensation expense equal to the estimated fair value. Compensation expense is recorded on a straight-line basis over the vesting period for time-based awards and performance awards with cliff vesting provisions and on a graded basis for performance awards with graded vesting provisions. Forfeitures are recorded as incurred.
Retirement Benefits
We record annual expenses relating to defined benefit pension plans based on calculations which include various actuarial assumptions, including discount rates, assumed asset rates of return, compensation increases, and turnover rates. We review our actuarial assumptions on an annual basis and make modifications to the assumptions based on current rates and trends. The effects of gains, losses, and prior service costs and credits are amortized over the average service life. The funded status, or projected benefit obligation less plan assets, for each plan, is reflected in our consolidated financial statements using a December 31 measurement date.
Recently Issued Accounting Pronouncements
In February 2016, the FASB issued ASU 2016-02, Leases. Since that date, the FASB has issued additional ASU’s clarifying certain aspects of ASU 2016-02. The new guidance supersedes the lease guidance under FASB Accounting Standards Codification (“ASC”) Topic 840, Leases, resulting in the creation of FASB ASC Topic 842, Leases. The guidance requires a lessee to recognize on the Balance Sheet a liability to make lease payments and a right-of-use asset representing its right to use the underlying asset for the lease term for both finance and operating leases.
F-17
ONESPAN INC.
NOTES TO CONSOLIDATED FINANCIAL STATEMENTS – (Continued)
(amounts in thousands, except per share data)
Subsequent guidance issued after February 2016 did not change the core principle of ASU 2016-02. The Company adopted ASC Topic 842 effective January 1, 2019, using the modified retrospective method, which did not require the Company to adjust comparative periods. See the Accounting for Leases section of this note for additional information.
In June 2016, the FASB issued ASU 2016-13, Financial Instruments - Credit Losses (Topic 326): Measurement of Credit Losses on Financial Instruments (“ASU 2016-13”). The new guidance provides financial statement users with improved information about the expected credit losses on trade receivables and other financial instruments held by a reporting entity at each reporting date. The amendments in this update replace the incurred loss methodology with a methodology that reflects expected credit losses and requires consideration of a broader range of reasonable and supportable information to calculate credit loss estimates. ASU 2016-13 is effective for fiscal years beginning after December 15, 2019, including interim periods within those fiscal years. The Company expects to adopt the standard on a modified retrospective basis and is still evaluating the impact of adopting ASU 2016-13 on its consolidated financial statements.
In January 2017, the FASB issued ASU 2017-04, Intangibles-Goodwill and Other (Topic 350) – Simplifying the Test for Goodwill Impairment. This standard eliminates the requirement to calculate the implied fair value of goodwill to measure a goodwill impairment charge (i.e. Step 2 of the current guidance), instead measuring the impairment charge as the excess of the reporting unit's carrying amount over its fair value (i.e. Step 1 of the current guidance). The guidance is effective for us beginning in the first quarter of 2020, and should be applied prospectively. Early adoption is permitted for impairment testing dates after January 1, 2017. We are currently evaluating the effect, if any, that the ASU will have on our consolidated financial statements and related disclosures.
Effective January 1, 2018, we adopted ASU 2016-01, Financial Instruments – Overall, which revises the classification and measurement of investments in equity securities. ASU 2016-01 requires that equity investments, except those accounted for under the equity method of accounting, be measured at fair value and changes in fair value are recognized in net income. ASU 2016-01 also provides a new measurement alternative for equity investments that do not have a readily determinable fair value (cost method investments). These investments are measured at cost, less any impairment, adjusted for observable price changes. Effective January 1, 2018, we elected to record our equity investment that does not have a readily determinable fair value using the alternative measurement method. Accordingly upon adoption, we recorded a cumulative effect adjustment to increase opening accumulated income at January 1, 2018 by $0.5 million, net of tax, as required for our equity investments with no readily determinable fair value to reflect the investment at approximate fair value.
In June 2018, the FASB issued ASU 2018-07, Compensation – Stock Compensation (Topic 718): Improvements to Nonemployee share-based payment accounting, which is intended to reduce the cost and complexity of accounting for, and improve financial reporting for share-based payments to nonemployees for goods and services. The ASU is effective for annual periods, including interim periods within those annual periods, beginning after December 15, 2018. The guidance should be applied prospectively and early adoption is permitted. We adopted this standard on January 1, 2019 on a prospective basis. The adoption of this standard did not have a material impact on our consolidated financial statements.
In August 2018, the FASB issued ASU No. 2018-13, Disclosure Framework - Changes to the Disclosure Requirements for Fair Value Measurement (“ASU 2018-13”) which amends ASC 820, Fair Value Measurement. ASU 2018-13 modifies the disclosure requirements for fair value measurements by removing, modifying, or adding certain disclosures. The ASU is effective for annual periods, including interim periods within those annual periods, beginning after December 15, 2019, with early adoption permitted for removed or modified disclosures, and delayed adoption of the additional disclosures until their effective date. We are currently evaluating the effect that the ASU will have on our consolidated financial statements and related disclosures.
In August 2018, the FASB issued ASU 2018-14, Compensation—Retirement Benefits—Defined Benefit Plans—General (Topic 715-20): Disclosure Framework—Changes to the Disclosure Requirements for Defined Benefit Plans (ASU 2018-14), which modifies the disclosure requirements for defined benefit pension plans and other postretirement plans. ASU 2018-14 is effective for fiscal years ending after December 15, 2020, and earlier adoption is permitted. We
F-18
ONESPAN INC.
NOTES TO CONSOLIDATED FINANCIAL STATEMENTS – (Continued)
(amounts in thousands, except per share data)
are currently evaluating the effect that the ASU will have on our consolidated financial statements and related disclosures.
In August 2018, the FASB issued ASU 2018-15, Customer's Accounting for Fees Paid in a Cloud Computing Arrangement , which helps entities evaluate the accounting for fees paid by a customer in a cloud computing arrangement (CCA) by providing guidance for determining when an arrangement includes a software license and when an arrangement is solely a hosted CCA service. Under ASU 2018-15, customers will apply the same criteria for capitalizing implementation costs as they would for an arrangement that has a software license. The new guidance also prescribes the balance sheet, income statement, and cash flow classification of the capitalized implementation costs and related amortization expense, and requires additional quantitative and qualitative disclosures. The new standard is effective for us on January 1, 2020. Early adoption is permitted, including adoption in any interim period for which financial statements have not been issued. Entities can choose to adopt the new guidance prospectively to eligible costs incurred on or after the date this guidance is first applied or retrospectively. We expect to implement the guidance prospectively to all implementation costs incurred after the date of adoption. We are currently evaluating the effect that the ASU will have on our consolidated financial statements and related disclosures.
In December 2019, the FASB issued ASU 2019-12, Simplifying the Accounting for Income Taxes, to simplify the accounting for income taxes. The ASU’s amendments are based on changes that were suggested by stakeholders as part of the FASB’s effort to reduce the complexity of accounting standards while maintaining or enhancing the helpfulness of information provided to financial statement users. The new standard is effective for us on January 1, 2021. We are currently evaluating the effect that the ASU will have on our consolidated financial statements and related disclosures.
From time to time, new accounting pronouncements are issued by the FASB or other standard setting bodies that are adopted by us as of the specified effective date. Unless otherwise discussed, our management believes that the issued standards that are not yet effective will not have a material impact on our consolidated financial statements upon adoption.
Note 2 – Inventories, net
Inventories, net, consisting principally of hardware and component parts, are stated at the lower of cost or net realizable value. Cost is determined using the FIFO method.
Inventories, net are comprised of the following:
|
|
|
December 31, |
||||
|
|
|
2019 |
|
2018 |
||
|
|
|
(in thousands) |
||||
|
Component parts |
|
$ |
7,429 |
|
$ |
5,445 |
|
Work-in-process and finished goods |
12,390 |
8,983 |
||||
|
Total |
|
$ |
19,819 |
|
$ |
14,428 |
Note 3 – Business Acquisitions
On May 30, 2018, OneSpan acquired the remaining interest in Dealflo Limited and its subsidiaries (“Dealflo”), increasing our ownership percentage to 100% from 1%. Dealflo, formerly a privately-held company based in the United Kingdom, provides identity verification and end-to-end financial agreement solutions. Upon acquisition, Dealflo became a wholly-owned subsidiary of OneSpan.
Dealflo’s total purchase price consideration was $53.9 million, net of $5.7 million of cash acquired. The total purchase price consideration includes $53.1 million of cash paid to acquire the remaining 99% interest in Dealflo, as well as $0.8 million of fair value of our previous 1% ownership interest. As described in Note 1 – Summary of
F-19
ONESPAN INC.
NOTES TO CONSOLIDATED FINANCIAL STATEMENTS – (Continued)
(amounts in thousands, except per share data)
Significant Accounting Policies, upon the adoption of ASU 2016-01 on January 1, 2018 the book value of this ownership interest was increased by $0.5 million to record the equity investment at $0.8 million within our consolidated financial statements.
This acquisition is accounted for as a business combination using the acquisition method of accounting, which requires the net assets acquired and liabilities assumed to be recognized at their fair values on the acquisition date.
During the year ended December 31, 2019, we recorded certain measurement period adjustments to amounts previously reported, comprised primarily of a $1.8 million increase to the deferred tax liability and a $0.6 million increase to other current assets. The effect of the measurement period adjustments recorded before the measurement period ended during the year ended December 31, 2019 have been determined as if such adjustments had been accounted for at the acquisition date. The net effect of the measurement period adjustments increased goodwill by $1.1 million. The measurement period adjustments did not result in material income statement effects for the year ended December 31, 2019. The measurement period closed on May 30, 2019.
The following table summarizes our final allocation of the purchase price consideration based on the estimated fair values of the assets acquired and liabilities assumed at the date of acquisition (net of cash acquired):
|
|
|
|
|
Total |
|
|
|
|
|
(in thousands) |
|
|
Acquired tangible assets |
|
$ |
2,700 |
|
|
Acquired identifiable intangible assets |
|
|
17,900 |
|
|
Liabilities assumed |
|
|
(6,041) |
|
|
Goodwill |
|
|
39,295 |
|
|
Total purchase price consideration |
|
$ |
53,854 |
The excess of purchase consideration over net assets assumed was recorded as goodwill, which represents the strategic value assigned to Dealflo, including expected benefits from synergies resulting from the acquisition, as well as the knowledge and experience of the workforce in place. In accordance with applicable accounting standards, goodwill is not amortized and will be tested for impairment at least annually, or more frequently, if certain indicators are present. Goodwill and intangible assets related to this acquisition are not deductible for foreign tax purposes.
Based on the final results of the acquisition valuation, $17.9 million of the purchase price consideration has been allocated to identifiable intangible assets. The following table summarizes the major classes of intangible assets, as well as the estimated weighted-average amortization periods:
|
|
|
Estimated Fair Value |
|
Weighted Average Amortization Period |
|
Identifiable Intangible Assets |
|
(in thousands) |
|
(Years) |
|
Customer relationships |
$ |
11,800 |
|
7 |
|
Technology |
|
5,900 |
|
4 |
|
Trademarks |
|
200 |
|
3 |
|
|
$ |
17,900 |
|
|
The results of operations of Dealflo subsequent to the acquisition date have been included in the consolidated statement of operations of the years ended December 31, 2019 and December 31, 2018. The acquisition related costs directly attributable to the business combination of $1.1 million, including professional fees, and other direct expenses, were expensed as incurred and included in general and administrative expense in the consolidated statement of operations for the year ended December 31, 2018.
F-20
ONESPAN INC.
NOTES TO CONSOLIDATED FINANCIAL STATEMENTS – (Continued)
(amounts in thousands, except per share data)
Unaudited Pro Forma Financial Information
The following presents the unaudited pro forma combined results of operations of the Company with Dealflo for the years ended December 31, 2018 and 2017, assuming Dealflo was acquired at the beginning of 2017, and after giving effect to certain pro forma adjustments. Pro forma adjustments for the year ended December 31, 2018 reflect estimated amortization expense for intangible assets purchased of $1.3 million, the elimination of $0.2 million of revenue related to intercompany transactions, and the elimination of $1.1 million of non-recurring acquisition-related costs. Pro forma adjustments for the year ended December 31, 2017 reflect estimated amortization expense for intangible assets purchased of $3.2 million, the addition of $1.1 million of non-recurring acquisition-related costs, the elimination of $0.5 million of revenue related to intercompany transactions, and a $0.6 million reduction of revenue to reflect the estimated fair value adjustment of acquired deferred revenue.
These unaudited pro forma results are not necessarily indicative of the actual consolidated results of operations had the acquisition actually occurred on January 1, 2017 or of future results of operations of the consolidated entities (in thousands except per share data):
|
|
|
|
||||
|
|
|
2018 |
|
2017 |
||
|
|
|
(in thousands) |
||||
|
Revenue |
|
$ |
219,847 |
|
$ |
198,717 |
|
Net loss |
|
|
(6,164) |
|
|
(32,990) |
|
Basic net loss per share |
|
|
(0.15) |
|
|
(0.83) |
|
Diluted net loss per share |
|
|
(0.15) |
|
|
(0.83) |
|
Shares used in computing basic and diluted net loss per share |
|
|
39,932 |
|
|
39,802 |
Note 4 – Revenue
We recognize revenue in accordance with ASC 606 “Revenue from Contracts with Customers” (“Topic 606”), as described in Note 1 – Summary of Significant Accounting Policies. As described in Note 1, the Company adopted Topic 606 on January 1, 2018, using the modified retrospective method. The cumulative effect of initially applying Topic 606 was an adjustment to the opening balance of Accumulated Income of $11.9 million, net of tax, as of January 1, 2018.
Significant Impacts of Adoption
Term Licenses
For revenues generated from arrangements that included term licenses to our software, the Company previously
recognized revenue ratably over the term of the contract when vendor-specific objective evidence (“ VSOE”) did not exist for all undelivered elements. Under Topic 606, these licenses are considered licenses of functional intellectual property, which requires recognition at the point in time all of the revenue recognition criteria per Topic 606 are met, which for the Company is generally when the customer is provided access to the software and the license term has commenced. No significant obligations or contingencies exist with regard to delivery, customer acceptance or rights of returns at the time revenue is recognized. We have established a stand-alone selling price (SSP) for all other performance obligations in the contract. Accordingly, the Company now recognizes revenue from these licenses, based on the residual approach due to highly variable pricing, at the beginning of the license period and recognizes the transaction price allocated to the other performance obligations in the contract (typically maintenance and support) over the period in which those performance obligations are satisfied. This is consistent with the method of recognizing revenue for perpetual licenses of intellectual property. Fees paid to third party software providers in term license arrangements are recognized when the term license revenues are recognized. For large-volume transactions, we may negotiate a specific price that is based on the number of users of the software license or quantities of hardware supplied. The per unit prices for large-volume transactions are generally lower than transactions for smaller quantities and the price differences are commonly referred to as volume-purchase discounts.
F-21
ONESPAN INC.
NOTES TO CONSOLIDATED FINANCIAL STATEMENTS – (Continued)
(amounts in thousands, except per share data)
Sales Commissions
The Company incurs incremental costs related to commissions, which can be directly tied to obtaining a contract. For commissions earned by sales personnel, the Company previously expensed these amounts when they were earned by the employees. As a result of adopting Topic 606, the Company now capitalizes commissions associated with new customers and amortizes the costs over a period in which the Company is expected to benefit, which can be up to seven years. The amortization is reflected in Sales and Marketing in the statement of operations. For certain contracts, any commission that is subject to a service period, such as continued employment, is expensed as incurred within Sales and Marketing in the statement of operations.
Disaggregation of Revenues
The following tables present our revenues disaggregated by major products and services, geographical region and timing of revenue recognition.
Revenue by major products and services (in thousands)
|
|
|
|
Twelve months ended December 31, |
||||||
|
|
|
2019 |
|
2018 |
|
|
2017* |
||
|
Hardware products |
|
$ |
127,005 |
|
$ |
105,560 |
|
$ |
105,867 |
|
Software licenses |
|
|
57,168 |
|
|
47,417 |
|
|
41,390 |
|
Subscription |
|
|
22,250 |
|
|
15,426 |
|
|
10,296 |
|
Professional services |
|
|
5,759 |
|
|
5,743 |
|
|
4,891 |
|
Maintenance, support and other |
|
|
42,388 |
|
|
38,134 |
|
|
30,847 |
|
Total Revenue |
|
$ |
254,570 |
|
$ |
212,280 |
|
$ |
193,291 |
Revenue by location of customer for the years ended December 31, 2019, 2018, and 2017 (in thousands)
|
|
|
|
|
|
|
|
|
|
|
|
|
|
|
|
|
|
EMEA |
|
Americas |
|
APAC |
|
Total |
|
||||
|
Total Revenue: |
|
|
|
|
|
|
|
|
|
|
|
|
|
|
2019 |
|
$ |
147,027 |
|
$ |
61,577 |
|
$ |
45,966 |
|
$ |
254,570 |
|
|
2018 |
|
$ |
103,293 |
|
$ |
54,979 |
|
$ |
54,008 |
|
$ |
212,280 |
|
|
2017* |
|
$ |
92,859 |
|
$ |
52,981 |
|
$ |
47,451 |
|
$ |
193,291 |
|
|
|
|
|
|
|
|
|
|
|
|
|
|
|
|
|
|
|
|
|
|
|
|
|
|
|
|
|
|
|
|
Percent of Total: |
|
|
|
|
|
|
|
|
|
|
|
|
|
|
2019 |
|
|
58 |
% |
|
24 |
% |
|
18 |
% |
|
100 |
% |
|
2018 |
|
|
49 |
% |
|
26 |
% |
|
25 |
% |
|
100 |
% |
|
2017* |
|
|
48 |
% |
|
27 |
% |
|
25 |
% |
|
100 |
% |
*Amounts for the year ended December 31, 2017 are presented under ASC 605 and ASC 985-605.
Timing of revenue recognition (in thousands)
|
|
|
Year ended December 31, |
||||
|
|
|
2019 |
|
2018 |
||
|
Products and Licenses transferred at a point in time |
|
$ |
184,173 |
|
$ |
152,977 |
|
Services transferred over time |
|
|
70,397 |
|
|
59,303 |
|
Total Revenue |
|
$ |
254,570 |
|
$ |
212,280 |
F-22
ONESPAN INC.
NOTES TO CONSOLIDATED FINANCIAL STATEMENTS – (Continued)
(amounts in thousands, except per share data)
Contract balances
The following table provides information about receivables, contract assets and contract liabilities from contracts with customers.
|
|
|
|
December 31, |
|||
|
|
|
2019 |
|
2018 |
||
|
Receivables, inclusive of trade and unbilled |
|
$ |
62,405 |
|
$ |
59,631 |
|
Contract Assets (current and non-current) |
|
$ |
10,623 |
|
$ |
11,278 |
|
Contract Liabilities (Deferred Revenue current and non-current) |
|
$ |
45,597 |
|
$ |
44,305 |
Contract assets relate primarily to multi-year term license arrangements and the remaining contractual billings. These contract assets are transferred to receivables when the right to billing occurs, which is normally over 3-5 years. The contract liabilities primarily relate to the advance consideration received from customers for subscription and maintenance services. Revenue is recognized for these services over time.
As a practical expedient, we do not adjust the promised amount of consideration for the effects of a significant financing component when we expect, at contract inception, that the period between our transfer of a promised product or service to a customer and when the customer pays for that product or service will be one year or less. We do not typically include extended payment terms in our contracts with customers.
Revenue recognized during the twelve months ended December 31, 2019 included $34.7 million that was included on the December 31, 2018 balance sheet in contract liabilities. Deferred revenue increased in the same period due to timing of annual renewals.
Transaction price allocated to the remaining performance obligations
The following table includes estimated revenue expected to be recognized in the future related to performance obligations that are unsatisfied (or partially unsatisfied) at the end of the reporting period.
|
in thousands |
|
2020 |
|
2021 |
|
2022 |
|
Beyond 2022 |
|
Total |
|||||
|
Future revenue related to current unsatisfied performance obligations |
|
$ |
11,295 |
|
$ |
7,682 |
|
$ |
5,951 |
|
$ |
10,986 |
|
$ |
35,914 |
The Company applies practical expedients and does not disclose information about remaining performance obligations (a) that have original expected durations of one year or less, or (b) where revenue is recognized as invoiced.
Costs of obtaining a contract
The Company incurs incremental costs related to commissions, which can be directly tied to obtaining a contract. Under Topic 606, the Company capitalizes commissions associated with certain new contracts and amortizes the costs over a period of benefit based on the transfer of goods or services that we have determined to be up to seven years. We determined the period of benefit by taking into consideration our customer contracts, our technology and other factors, including customer attrition. Commissions are earned upon invoicing to the customer. For contracts with multiple year payment terms, as the commissions that are payable after year 1 are payable based on continued employment, they are expensed when incurred. Commissions and amortization expense are included in Sales and Marketing expenses on the consolidated statements of operations.
F-23
ONESPAN INC.
NOTES TO CONSOLIDATED FINANCIAL STATEMENTS – (Continued)
(amounts in thousands, except per share data)
Applying the practical expedient, the Company recognizes the incremental costs of obtaining contracts as an expense when incurred if the amortization period for the assets that the Company otherwise would have recognized is one year or less.
The following tables provide information related to the capitalized costs and amortization recognized in the period:
|
|
|
|
|
|
|
|
|
|
in thousands |
|
|
|
December 31, 2019 |
|
|
December 31, 2018 |
|
Capitalized costs to obtain contracts, current |
$ |
676 |
$ |
413 | |||
|
Capitalized costs to obtain contracts, non-current |
|
|
$ |
3,222 |
|
$ |
2,150 |
|
|
|
|
|
Year ended December 31, |
|
|||
|
in thousands |
|
|
|
2019 |
|
|
2018 |
|
|
Amortization of capitalized costs to obtain contracts |
|
|
$ |
495 |
|
$ |
283 |
|
|
Impairments of capitalized costs to obtain contracts |
|
|
$ |
- |
|
$ |
- |
|
Topic 606 Adoption impacts on Financial Statements
The following tables summarize the impacts of adopting Topic 606 on the Company’s consolidated financial statements as of December 31, 2018 and for the year ended December 31, 2018.
Balance Sheet (in thousands)
|
|
December 31, 2018 |
|||||||
|
|
As Reported |
|
Adjustments |
|
Balances without the adoption of Topic 606 |
|||
|
ASSETS |
|
|
|
|
|
|
|
|
|
Current assets |
|
|
|
|
|
|
|
|
|
Accounts receivable, net of allowance |
$ |
59,631 |
|
$ |
(331) |
|
$ |
59,300 |
|
Contract asset |
|
7,962 |
|
|
(7,962) |
|
|
— |
|
Other current assets |
|
5,705 |
|
|
(703) |
|
|
5,002 |
|
Total current assets |
|
191,956 |
|
|
(8,996) |
|
|
182,960 |
|
Deferred income taxes |
|
5,601 |
|
|
587 |
|
|
6,188 |
|
Contract asset - non-current |
|
3,316 |
|
|
(3,316) |
|
|
— |
|
Other assets |
|
8,400 |
|
|
(289) |
|
|
8,111 |
|
Total assets |
$ |
352,826 |
|
$ |
(12,014) |
|
$ |
340,812 |
|
LIABILITIES AND STOCKHOLDERS' EQUITY |
|
|
|
|
|
|
|
|
|
Current liabilities |
|
|
|
|
|
|
|
|
|
Deferred revenue |
$ |
33,633 |
|
$ |
3,019 |
|
$ |
36,652 |
|
Short-term income taxes payable |
|
6,905 |
|
|
(1,209) |
|
|
5,696 |
|
Other accrued expenses |
|
9,323 |
|
|
(116) |
|
|
9,207 |
|
Total current liabilities |
|
72,357 |
|
|
1,694 |
|
|
74,051 |
|
Deferred revenue - non-current |
|
10,672 |
|
|
3,391 |
|
|
14,063 |
|
Deferred income taxes |
|
2,661 |
|
|
(424) |
|
|
2,237 |
|
Total liabilities |
|
100,385 |
|
|
4,661 |
|
|
105,046 |
|
Stockholders' equity |
|
|
|
|
|
|
|
|
|
Accumulated income |
|
172,378 |
|
|
(16,675) |
|
|
155,703 |
|
Total stockholders' equity |
|
252,441 |
|
|
(16,675) |
|
|
235,766 |
|
Total liabilities and stockholders' equity |
$ |
352,826 |
|
$ |
(12,014) |
|
$ |
340,812 |
F-24
ONESPAN INC.
NOTES TO CONSOLIDATED FINANCIAL STATEMENTS – (Continued)
(amounts in thousands, except per share data)
Statement of Operations (in thousands)
|
|
|
Year ended December 31, 2018 |
|||||||
|
|
|
As Reported |
|
Adjustments |
|
Balances without the adoption of Topic 606 |
|||
|
Revenue |
|
|
|
|
|
|
|
|
|
|
Product and license |
|
$ |
152,977 |
|
$ |
2,365 |
|
$ |
155,342 |
|
Services and other |
|
|
59,303 |
|
|
(5,772) |
|
|
53,531 |
|
Total revenue |
|
|
212,280 |
|
|
(3,407) |
|
|
208,873 |
|
|
|
|
|
|
|
|
|
|
|
|
Cost of goods sold |
|
|
|
|
|
|
|
|
|
|
Product and license |
|
|
50,706 |
|
|
605 |
|
|
51,311 |
|
Services and other |
|
|
14,107 |
|
|
— |
|
|
14,107 |
|
Total Cost of goods sold |
|
|
64,813 |
|
|
605 |
|
|
65,418 |
|
|
|
|
|
|
|
|
|
|
|
|
Gross profit |
|
|
147,467 |
|
|
(4,012) |
|
|
143,455 |
|
|
|
|
|
|
|
|
|
|
|
|
Operating Costs |
|
|
|
|
|
|
|
|
|
|
Sales and marketing |
|
|
63,805 |
|
|
1,108 |
|
|
64,913 |
|
Total operating costs |
|
|
147,443 |
|
|
1,108 |
|
|
148,551 |
|
|
|
|
|
|
|
|
|
|
|
|
Operating income (loss) |
|
|
24 |
|
|
(5,120) |
|
|
(5,096) |
|
|
|
|
|
|
|
|
|
|
|
|
Income (loss) before taxes |
|
|
3,553 |
|
|
(5,120) |
|
|
(1,567) |
|
|
|
|
|
|
|
|
|
|
|
|
Provision (benefit) for income taxes |
|
|
(293) |
|
|
(365) |
|
|
(658) |
|
|
|
|
|
|
|
|
|
|
|
|
Net income (loss) |
|
$ |
3,846 |
|
$ |
(4,755) |
|
$ |
(909) |
|
|
|
|
|
|
|
|
|
|
|
|
Basic EPS |
|
$ |
0.10 |
|
|
|
|
$ |
(0.02) |
|
Diluted EPS |
|
$ |
0.10 |
|
|
|
|
$ |
(0.02) |
The adoption of Topic 606 did not impact total operating, investing or financing cash flows in the statement of cash flows.
Note 5 – Goodwill
Goodwill activity for the two years ended December 31, 2019 consisted of the following:
|
in thousands |
|
|
|
|
Net balance at December 31, 2017 |
|
$ |
56,332 |
|
Additions |
|
|
38,167 |
|
Net foreign currency translation |
|
|
(2,658) |
|
Net balance at December 31, 2018 |
|
$ |
91,841 |
|
Adjustment to provisional estimate of acquisition date fair values |
|
|
1,128 |
|
Net foreign currency translation |
|
|
1,643 |
|
Net balance at December 31, 2019 |
|
$ |
94,612 |
|
|
|
|
|
F-25
ONESPAN INC.
NOTES TO CONSOLIDATED FINANCIAL STATEMENTS – (Continued)
(amounts in thousands, except per share data)
Certain portions of goodwill are denominated in local currencies and are subject to currency fluctuations. No impairment of goodwill was recorded during the years ended December 31, 2019, 2018, or 2017.
Note 6 – Intangible Assets
Intangible asset activity for the two years ended December 31, 2019 is detailed in the following table;
|
|
|
|
|
|
|
|
|
|
|
|||
|
in thousands |
|
Acquired Technology |
|
Customer Relationships |
|
Other |
|
Total Intangible Assets |
||||
|
Net balance at December 31, 2017 |
|
$ |
6,946 |
|
$ |
22,544 |
|
$ |
8,398 |
|
$ |
37,888 |
|
Additions-Acquisition |
|
|
5,900 |
|
|
11,800 |
|
|
200 |
|
|
17,900 |
|
Additions-Other |
|
|
109 |
|
|
— |
|
|
150 |
|
|
259 |
|
Impairment |
|
|
— |
|
|
— |
|
|
(478) |
|
|
(478) |
|
Net foreign currency translation |
|
|
(239) |
|
|
(486) |
|
|
(8) |
|
|
(733) |
|
Amortization expense |
|
|
(3,921) |
|
|
(3,450) |
|
|
(2,003) |
|
|
(9,374) |
|
Net balance at December 31, 2018 |
|
|
8,795 |
|
|
30,408 |
|
|
6,259 |
|
|
45,462 |
|
Net foreign currency translation |
|
|
120 |
|
|
118 |
|
|
(21) |
|
|
217 |
|
Amortization expense |
|
|
(3,461) |
|
|
(3,642) |
|
|
(2,367) |
|
|
(9,470) |
|
Net balance at December 31, 2019 |
|
$ |
5,454 |
|
$ |
26,884 |
|
$ |
3,871 |
|
$ |
36,209 |
|
|
|
|
|
|
|
|
|
|
|
|
|
|
|
December 31, 2019 balance at cost |
|
$ |
42,647 |
|
$ |
39,505 |
|
$ |
13,710 |
|
$ |
95,862 |
|
Accumulated amortization |
|
|
(37,193) |
|
|
(12,621) |
|
|
(9,839) |
|
|
(59,653) |
|
Net balance at December 31, 2019 |
|
$ |
5,454 |
|
$ |
26,884 |
|
$ |
3,871 |
|
$ |
36,209 |
Certain intangible assets are denominated in local currencies and are subject to currency fluctuations. Additions - Acquisitions refers to intangible assets acquired in the acquisition of Dealflo described in Note 3 – Business Acquisitions and include capitalized technology, trademarks, and customer relationships.
As a result of the Company rebranding, the values of certain intangible assets were written down during the second quarter of 2018, and impairment charges of $0.5 million were recorded for the twelve months ended December 31, 2018.
Expected amortization of the intangible assets for the years ended:
|
December 31, 2020 |
|
$ |
9,460 |
|
December 31, 2021 |
|
|
5,794 |
|
December 31, 2022 |
|
|
4,663 |
|
December 31, 2023 |
|
|
4,054 |
|
December 31, 2024 |
|
|
4,014 |
|
Thereafter |
|
|
7,603 |
|
Subject to amortization |
|
|
35,588 |
|
Trademarks |
|
|
621 |
|
Total intangible assets |
|
$ |
36,209 |
Note 7 – Property and Equipment
The major classes of property and equipment are as follows:
|
in thousands |
|
December 31, 2019 |
|
December 31, 2018 |
||
|
Office equipment and software |
|
|
14,595 |
|
|
11,059 |
|
Leasehold improvements |
|
|
9,417 |
|
|
4,784 |
|
Furniture and fixtures |
|
|
3,717 |
|
|
2,829 |
F-26
ONESPAN INC.
NOTES TO CONSOLIDATED FINANCIAL STATEMENTS – (Continued)
(amounts in thousands, except per share data)
|
Total |
|
|
27,729 |
|
|
18,672 |
|
Accumulated depreciation |
|
|
(16,275) |
|
|
(12,422) |
|
Property and equipment, net |
|
$ |
11,454 |
|
$ |
6,250 |
Depreciation expense was $2.1 million, $2.3 million, and $1.8 million for the years ended December 31, 2019, 2018, and 2017, respectively.
Note 8 – Fair Value Measurements
The fair values of cash equivalents, receivables, net, and accounts payable approximate their carrying amounts due to their short duration.
The fair value hierarchy is based on inputs to valuation techniques that are used to measure fair value that are either observable or unobservable. Observable inputs reflect assumptions market participants would use in pricing an asset or liability based on market data obtained from independent sources while unobservable inputs reflect a reporting entity’s pricing base upon its own market assumptions.
The fair value hierarchy consists of the following three levels:
|
· |
Level 1 – Inputs are quoted prices in active markets for identical assets or liabilities. |
|
· |
Level 2 – Inputs are quoted prices for similar assets or liabilities in an active market, quoted prices for identical or similar assets or liabilities in markets that are not active, inputs other than quoted prices that are observable and market-corroborated inputs which are derived primarily from or corroborated by observable market data. |
|
· |
Level 3 – Inputs are derived from valuation techniques in which one or more significant inputs or value drivers are unobservable. |
The following tables summarize assets that are measured at fair value on a recurring basis as of December 31, 2019 and December 31, 2018:
|
|
|
|
|
|
Fair Value Measurement at Reporting Date Using |
||||
|
in thousands |
|
|
December 31, 2019 |
|
Quoted Prices in Active Markets for Identical Assets (Level 1) |
|
Significant Other Observable Inputs (Level 2) |
|
Significant Unobservable Inputs (Level 3) |
|
Assets: |
|
|
|
|
|
|
|
|
|
|
U.S. Treasury Notes |
|
|
9,225 |
|
- |
|
9,225 |
|
- |
|
Corporate Notes / Bonds |
|
|
8,169 |
|
- |
|
8,169 |
|
- |
|
Commercial Paper |
|
|
3,482 |
|
- |
|
3,482 |
|
- |
|
U.S. Treasury Bills |
|
|
2,385 |
|
- |
|
2,385 |
|
- |
|
U.S. Government Agencies |
|
|
2,249 |
|
- |
|
2,249 |
|
- |
|
|
|
|
|
|
Fair Value Measurement at Reporting Date Using |
||||
|
in thousands |
|
|
December 31, 2018 |
|
Quoted Prices in Active Markets for Identical Assets (Level 1) |
|
Significant Other Observable Inputs (Level 2) |
|
Significant Unobservable Inputs (Level 3) |
|
Assets: |
|
|
|
|
|
|
|
|
|
|
U.S. Treasury Notes |
|
|
8,920 |
|
- |
|
8,920 |
|
- |
|
Corporate Notes / Bonds |
|
|
7,934 |
|
- |
|
7,934 |
|
- |
|
Commercial Paper |
|
|
2,952 |
|
- |
|
2,952 |
|
- |
|
U.S. Treasury Bills |
|
|
2,983 |
|
- |
|
2,983 |
|
- |
F-27
ONESPAN INC.
NOTES TO CONSOLIDATED FINANCIAL STATEMENTS – (Continued)
(amounts in thousands, except per share data)
Note 9 – Leases
As mentioned in Note 1 – Summary of Significant Accounting Policies, the Company adopted ASC Topic 842, Leases on January 1, 2019, using the modified retrospective approach. The adoption of this accounting standard resulted in the recording of operating lease right-of-use (“ROU”) assets of $9.2 million in Operating lease right-of use assets, and operating lease liabilities of $2.5 million and $8.5 million in Other accrued expenses and Long-term lease liabilities, respectively, as of January 1, 2019, to capture the cumulative effect of the standard. The difference between the asset and liability is a result of lease incentives, such as tenant improvement allowances, and deferred rent on the balance sheet at transition.
The Company leases certain real estate and automobiles. Leases with an initial term of 12 months or less (“short-term leases”) are not recorded on the consolidated balance sheet; the Company recognizes lease expense for these leases on a straight-line basis over the lease term. The Company determines if an arrangement is a lease at inception. All of our leases are operating leases.
Operating lease right-of-use (“ROU”) assets and operating lease liabilities are recognized based on the present value of lease payments over the lease term at commencement date. Because most of the Company’s leases do not provide an implicit rate of return, the Company uses its imputed collateralized rate based on the information available at the commencement date in determining the present value of lease payments. Operating lease ROU assets are comprised of the lease liability plus prepaid rents and are reduced by lease incentives or deferred rents. The Company has lease agreements with non-lease components which are not bifurcated.
Some of our leases include one or more options to renew, with renewal terms that can extend the lease from one to five years. The exercise of a lease renewal option typically occurs at the discretion of both parties. Certain leases also include options to purchase the leased property at fair value. For purposes of calculating operating lease liabilities, lease terms are deemed not to include options to extend the lease termination until it is reasonably certain that the Company will exercise that option. Certain of the Company’s lease agreements include payments adjusted periodically for inflation based on the consumer price index. The Company’s lease agreements do not contain any material residual value guarantees or material restrictive covenants.
Operating lease cost details for the year ended December 31, 2019 are as follows:
|
|
|
Year ended December 31, |
|
|
|
|
2019 |
|
|
|
|
(in thousands) |
|
|
Building rent |
|
$ |
3,397 |
|
Automobile rentals |
|
|
1,531 |
|
Total net operating lease costs |
|
$ |
4,928 |
Short term lease costs and variable lease costs recognized during the year ended December 31, 2019 are
immaterial.
Supplemental consolidated balance sheet information related to our operating leases is as follows:
|
|
|
December 31, 2019 |
|
|
in thousands |
|
|
|
|
Leases |
|
|
|
|
Assets |
|
|
10,580 |
|
Operating lease assets |
|
$ |
10,580 |
|
|
|
|
|
|
Liabilities |
|
|
|
|
Current |
|
|
|
F-28
ONESPAN INC.
NOTES TO CONSOLIDATED FINANCIAL STATEMENTS – (Continued)
(amounts in thousands, except per share data)
|
Operating lease liabilities |
|
$ |
2,636 |
|
|
|
|
|
|
Noncurrent |
|
|
|
|
Operating lease liabilities |
|
|
11,299 |
|
Total lease liabilities |
|
$ |
13,935 |
The weighted average remaining lease term for our operating leases is 6.7 years. The weighted-average discount rate for our operating leases is 5%.
Supplemental consolidated cash flow information related to leases is as follows:
|
|
|
Year ended |
|
|
|
|
December 31, 2019 |
|
|
|
|
|
(in $ thousands) |
|
Supplemental cash flow and other information related to leases was as follows: |
|
|
|
|
|
|
|
|
|
Operating cash payments from operating leases |
|
$ |
3,731 |
|
|
|
|
|
|
ROU assets obtained in exchange for new operating lease liabilities |
|
$ |
4,924 |
Maturities of our operating leases are as follows:
|
|
|
As of December 31, 2019 |
|
|
|
|
|
(in $ thousands) |
|
2020 |
|
$ |
3,245 |
|
2021 |
|
|
2,784 |
|
2022 |
|
|
2,422 |
|
2023 |
|
|
1,909 |
|
2024 |
|
|
1,183 |
|
Later years |
|
|
5,004 |
|
Less imputed interest |
|
|
(2,612) |
|
Total lease liabilities |
|
$ |
13,935 |
Disclosures related to periods prior to adoption of ASU 2016-02
Operating lease rent expense was $4.9 million for the year ended December 31, 2018 and $3.8 million for the year ended December 31, 2017. Future minimum lease are as follows:
|
|
|
As of December 31, 2018 |
|
|
|
|
|
(in $ thousands) |
|
2019 |
|
$ |
3,817 |
|
2020 |
|
|
3,081 |
|
2021 |
|
|
2,671 |
|
2022 |
|
|
2,244 |
|
2023 |
|
|
1,941 |
|
Later years |
|
|
8,870 |
|
Minimum lease commitments |
|
$ |
22,624 |
During the year ended December 31, 2018, we entered into a new lease agreement of which a portion commenced during the three months ended September 30, 2019, and remainder will commence during the three months ended March 31, 2020. We estimated as of January 1, 2019 and December 31, 2019 that the undiscounted future minimum obligations related to the portion of the lease not yet commenced to be approximately $7.4 million and $2.0
F-29
ONESPAN INC.
NOTES TO CONSOLIDATED FINANCIAL STATEMENTS – (Continued)
(amounts in thousands, except per share data)
million, respectively. The $7.4 million obligation is disclosed as part of our future minimum lease obligations table above.
Note 10 – Income Taxes
Tax Reform enacted on December 22, 2017 introduced significant changes to U.S. income tax law. Effective in 2018, Tax Reform reduces the U.S. statutory tax rate from 35% to 21% and created new taxes on certain foreign-sourced earnings which are referred to as the global intangible low-taxed income tax (“GILTI”). In addition, in 2017 we were subject to a one-time transition tax on accumulated foreign subsidiary earnings not previously subject to U.S. income tax.
Due to the timing of the enactment and the complexity involved in applying the provisions of Tax Reform, we made reasonable estimates of the effects and recorded provisional amounts in our financial statements as of December 31, 2017. As we collected and prepared necessary data, and interpreted the additional guidance issued by the U.S. Treasury Department, the IRS, and other standard-setting bodies, we made adjustments, over the course of the year, to the provisional amounts, including refinements to deferred taxes. The accounting for the tax effects of Tax Reform was completed as of December 31, 2018.
Tax reform required us to pay U.S. income taxes on accumulated foreign subsidiary earnings not previously subject to U.S. income tax at a rate of 15.5% to the extent of foreign cash and certain other net current assets and 8% on the remaining earnings. We recorded a provisional amount for our one-time transitional tax liability and income tax expense of $18.2 million as of December 31, 2017. During 2018 we recorded a measurement period adjustment of $2.5 million, as a reduction to the provisional estimates recorded at the end of 2017 due to the release of regulations on the one-time transition tax which reduced long term taxes payable. After the utilization of existing tax credits, we expect to pay U.S. federal taxes of approximately $10.1 million over eight years related to the repatriation tax.
Due to the change in the statutory tax rate from Tax Reform, we remeasured our deferred taxes as of December 31, 2017 to reflect the reduced rate that will apply in future periods when these deferred taxes are settled or realized. We recognized a deferred tax expense of $2.3 million to reflect the reduced U.S. tax rate and other effects of Tax Reform as of December 31, 2017. During 2018, we recorded an adjustment of $0.5 million as a reduction of the provisional estimate which reduced current taxes payable.
As a result of Tax Reform, earnings of all foreign subsidiaries have been designated as available for distribution. Previously, earnings of certain foreign subsidiaries were deemed permanently reinvested. During the fourth quarter of 2017, we provisionally provided deferred income tax expense of $7.3 million for foreign taxes on distributions from foreign subsidiaries previously designated as permanently reinvested. No adjustment was made during 2018.
The GILTI provisions require the Company to include in its U.S. income tax return foreign subsidiary earnings in excess of an allowable return on the foreign subsidiary’s tangible assets. The Company could be subjected to incremental U.S. tax on GILTI income beginning in 2018. FASB Topic 740 allows the company to treat GILTI as either a deferred tax asset or liability or to account for the impacts in the period in which it is incurred. The Company has elected to account for GILTI tax in the period in which it is incurred.
Income before income taxes was generated in the following jurisdictions:
|
|
|
For the year ended December 31, |
|||||||
|
|
|
2019 |
|
2018 |
|
2017 |
|||
|
|
|
|
|
|
|
|
|
|
|
|
U.S. |
|
$ |
3,223 |
|
$ |
(4,347) |
|
$ |
(1,877) |
|
Non-U.S. |
|
|
12,272 |
|
|
7,900 |
|
|
10,258 |
|
Total |
|
$ |
15,495 |
|
$ |
3,553 |
|
$ |
8,381 |
F-30
ONESPAN INC.
NOTES TO CONSOLIDATED FINANCIAL STATEMENTS – (Continued)
(amounts in thousands, except per share data)
For the years ended December 31, 2019, 2018, and 2017, domestic income excludes intercompany dividend income of $6.3 million, $133.3 million, and $0, respectively. The provision (benefit) for income taxes consists of the following:
|
|
|
For the year ended December 31, |
|||||||
|
|
|
2019 |
|
2018 |
|
2017 |
|||
|
Current: |
|
|
|
|
|
|
|
|
|
|
Federal |
|
$ |
433 |
|
$ |
(3,792) |
|
$ |
14,299 |
|
State |
|
|
107 |
|
|
97 |
|
|
141 |
|
Foreign |
|
|
7,790 |
|
|
10,833 |
|
|
3,287 |
|
Total current |
|
|
8,330 |
|
|
7,138 |
|
|
17,727 |
|
|
|
|
|
|
|
|
|
|
|
|
Deferred: |
|
|
|
|
|
|
|
|
|
|
Federal |
|
|
(970) |
|
|
(333) |
|
|
6,043 |
|
State |
|
|
24 |
|
|
15 |
|
|
(200) |
|
Foreign |
|
|
(678) |
|
|
(7,113) |
|
|
7,210 |
|
Total deferred |
|
|
(1,624) |
|
|
(7,431) |
|
|
13,053 |
|
Total |
|
$ |
6,706 |
|
$ |
(293) |
|
$ |
30,780 |
Our U.S. federal statutory rate for 2019 and 2018 was 21%. For 2017, our U.S. statutory rate was 35%. The differences between the income tax provisions computed using the statutory federal income tax rate and the provisions for income taxes reported in the consolidated statements of operations are as follows:
|
|
|
For the year ended December 31, |
|||||||
|
|
|
2019 |
|
2018 |
|
2017 |
|||
|
|
|
|
|
|
|
|
|
|
|
|
Expected tax at statutory rate |
|
$ |
3,255 |
|
$ |
747 |
|
$ |
2,933 |
|
Foreign taxes at other rates |
|
|
(982) |
|
|
(1,308) |
|
|
(3,139) |
|
US tax on foreign earnings, net of foreign tax credits |
|
|
— |
|
|
— |
|
|
(226) |
|
Valuation allowances on NOL carryforwards |
|
|
2,042 |
|
|
2,894 |
|
|
3,997 |
|
US tax reform - deemed repatriation |
|
|
— |
|
|
(2,534) |
|
|
18,472 |
|
US tax reform - changes in indefinite reinvestment assertion |
|
|
— |
|
|
— |
|
|
7,281 |
|
US tax reform - deferred tax expense from tax rate change |
|
|
— |
|
|
(462) |
|
|
2,339 |
|
State income taxes, net of federal benefit |
|
|
108 |
|
|
(79) |
|
|
(59) |
|
Uncertain tax positions |
|
|
1,845 |
|
|
— |
|
|
— |
|
Disallowed expenses and other |
|
|
438 |
|
|
449 |
|
|
(818) |
|
Total |
|
$ |
6,706 |
|
$ |
(293) |
|
$ |
30,780 |
F-31
ONESPAN INC.
NOTES TO CONSOLIDATED FINANCIAL STATEMENTS – (Continued)
(amounts in thousands, except per share data)
Significant components of our deferred tax assets and liabilities are as follows:
|
|
|
As of December 31, |
||||
|
|
|
2019 |
|
2018 |
||
|
Deferred tax assets: |
|
|
|
|
|
|
|
Stock and long-term compensation plans |
|
$ |
2,405 |
|
$ |
2,284 |
|
Foreign NOL & other carryforwards |
|
|
24,240 |
|
|
23,785 |
|
US state NOL carryforwards |
|
|
670 |
|
|
842 |
|
Deferred revenue |
|
|
684 |
|
|
627 |
|
Pension liability |
|
|
1,509 |
|
|
1,078 |
|
Lease liability |
|
|
2,807 |
|
|
— |
|
Amortization and depreciation |
|
|
586 |
|
|
770 |
|
Accrued expenses and other |
|
|
562 |
|
|
1,138 |
|
Total gross deferred tax assets |
|
|
33,463 |
|
|
30,524 |
|
Less: Valuation allowance |
|
|
(17,255) |
|
|
(15,170) |
|
Net deferred income tax assets |
|
$ |
16,208 |
|
$ |
15,354 |
|
|
|
|
|
|
|
|
|
Deferred tax liabilities: |
|
|
|
|
|
|
|
Accruals |
|
$ |
740 |
|
$ |
549 |
|
Foreign tax on unremitted foreign earnings |
|
|
2,058 |
|
|
1,650 |
|
Right of use asset |
|
|
2,124 |
|
|
— |
|
Intangible assets |
|
|
8,046 |
|
|
10,215 |
|
Deferred tax liabilities |
|
$ |
12,968 |
|
$ |
12,414 |
|
|
|
|
|
|
|
|
|
Net deferred tax assets (liabilities) |
|
$ |
3,240 |
|
$ |
2,940 |
Deferred tax assets and liabilities are netted by tax jurisdiction.
At December 31, 2019, we had foreign and state net operating loss (NOL) carryforwards and other foreign deductible carryforwards as shown in the following table:
|
|
|
Carryforward |
|
Expiration |
|
|
NOL Carryforward |
|
|
|
|
|
|
Canada |
|
$ |
50,191 |
|
2025-2039 |
|
United Kingdom |
|
|
4,592 |
|
None |
|
Other foreign |
|
|
7,039 |
|
None |
|
Canada province |
|
|
50,499 |
|
2025-2039 |
|
U.S. states |
|
|
8,961 |
|
2020-2030 |
|
|
|
|
121,282 |
|
|
|
Other Carryforwards |
|
|
|
|
|
|
Canada |
|
|
17,332 |
|
None |
|
Canada province |
|
|
31,463 |
|
None |
|
Canada (credit) |
|
|
1,962 |
|
2036 |
|
|
|
|
50,757 |
|
|
|
|
|
|
|
|
|
|
|
|
$ |
172,039 |
|
|
The net change in the valuation allowance for the years ended December 31, 2019 and December 31, 2018 were increases of $2.1 million and $2.4 million respectively. Valuation allowances are reviewed on a regular basis and adjustments made as appropriate. The increase in the valuation allowance in 2019 reflects NOLs and credits for which the realization is not more likely than not. The change in the valuation allowance also reflects other factors including, but not limited to, changes in our assessment of our ability to use existing NOLs and other deduction carryforwards, changes
F-32
ONESPAN INC.
NOTES TO CONSOLIDATED FINANCIAL STATEMENTS – (Continued)
(amounts in thousands, except per share data)
in currency rates, and adjustments to reflect differences between the actual returns filed and the estimates we made at financial reporting dates. For all other deferred tax assets, the Company believes it is more likely than not that the results of future operations will generate sufficient taxable income to realize the deferred tax assets.
Our policy is to record interest and penalties on income taxes as income tax expense. We provided $0.2 million in 2019 and less than $0.1 million during each of the years ended December 31, 2018, and 2017.
ASC 740, Income Taxes sets a “more likely than not” criterion for recognizing the tax benefit of uncertain tax positions. As of December 31, 2019, 2018, and 2017, we had reserves of $2.9 million, $0.4 million, and $0.1 million, respectively.
|
|
|
As of year ended December 31, |
|||||||
|
|
|
2019 |
|
2018 |
|
2017 |
|||
|
Reserve at beginning of year |
|
$ |
427 |
|
$ |
107 |
|
$ |
662 |
|
Increases related to prior year tax positions |
|
|
2,500 |
|
|
427 |
|
|
7 |
|
Lapse of statute of limitations |
|
|
(4) |
|
|
(107) |
|
|
(562) |
|
Total |
|
$ |
2,923 |
|
$ |
427 |
|
$ |
107 |
We file income tax returns in the U.S. federal jurisdiction and in many state and foreign jurisdictions. We are subject to examination of our income tax returns by the IRS and other tax authorities. During the second quarter of 2018, the Belgian tax authorities commenced an audit covering income tax returns filed for the years 2015-2018. During the fourth quarter of 2019, the scope of the audit expanded to also include income tax returns filed for the years 2013 and 2014. While we believe the positions we took were supportable under Belgian tax law, in lieu of extending the audit process or pursuing litigation, we negotiated a settlement with the Belgian tax authorities during the fourth quarter of 2019, and booked an accrual adjustment related to the settlement. The settlement agreement was signed and payment was made in January 2020.
We believe that an adequate provision has been made for any adjustments that may result from tax examinations. However, the outcome of tax audits cannot be predicted with certainty. If any issues addressed in our tax audits are resolved in a manner not consistent with management's expectations, we could be required to adjust our provision for income taxes in the period such resolution occurs. Included in the balance of unrecognized tax benefits as of December 31, 2019 is $2.1 million, of tax benefits that, if recognized, would affect the effective tax rate.
We estimate that our unrecognized tax benefits as of December 31, 2019 will decrease by approximately $2.7 million in the next 12 months.
Our primary tax jurisdictions and the earliest tax year subject to audit are presented in the following table.
|
Australia |
|
2011 |
|
Austria |
|
2013 |
|
Belgium |
|
2013 |
|
Canada |
|
2015 |
|
Netherlands |
|
2014 |
|
Singapore |
|
2014 |
|
Switzerland |
|
2017 |
|
United Kingdom |
|
2018 |
|
United States |
2016 |
F-33
ONESPAN INC.
NOTES TO CONSOLIDATED FINANCIAL STATEMENTS – (Continued)
(amounts in thousands, except per share data)
Note 11 – Stock Compensation Plans (sharecounts in thousands)
The Company has a share-based compensation plan, the OneSpan Inc. 2019 Omnibus Incentive Plan (“2019 Plan”), which was approved by its Shareholders in June 2019 under which the Board of Directors may grant share-based awards including restricted stock units (RSUs) and performance restricted stock units (PSUs). Awards were previously granted under the OneSpan Inc. 2009 Equity Incentive Plan (“2009 Plan”), and included Restricted Stock Awards (RSAs) and performance restricted stock units (PSUs). The 2009 Plan terminated on December 31, 2018, and no additional securities remained for issuance.
The 2019 Plan may provide performance incentives to employees and non-employee directors, consultants and other key persons of the Company. The plan is administered by the Compensation Committee as appointed by the Board of Directors and is intended to be a non-qualified plan.
As of December 31, 2019, the remaining number of shares allowed to be issued under the 2019 Plan was 4.6 million shares of the company’s common stock, representing 11% of the issued and outstanding shares of the company as of such date.
The following table details long-term compensation plan and stock-based compensation expense for the years ended December 31, 2019, 2018, and 2017.
|
|
|
For the year ended December 31, |
|||||||
|
|
|
2019 |
|
2018 |
|
2017 |
|||
|
in thousands |
|
|
|
|
|
|
|
|
|
|
Restricted stock |
|
$ |
3,368 |
|
$ |
3,973 |
|
$ |
3,466 |
|
Long-term compensation plan |
|
|
1,955 |
|
|
2,118 |
|
|
1,906 |
|
Total compensation |
|
$ |
5,323 |
|
$ |
6,091 |
|
$ |
5,372 |
Time-Based Restricted Stock Awards
Time-based restricted stock awards granted to non-employee directors vest on the first anniversary date of the grant. Awards granted to certain executive officers vest in equal semi-annual installments over four years. Awards granted to certain other employees vest ratably over a four-year period with the first one-fourth of the grant vesting one year after the date of the grant. Shares are subject to forfeiture if the service period requirement is not met. Compensation expense was $0.5 million, $2.0 million, and $2.1 million for 2019, 2018, and 2017, respectively. Tax benefit related to the compensation expense was $0.2 million, $0.5 million, and $0.6 million for 2019, 2018, and 2017, respectively. The following table summarizes the time-based restricted stock activity for the year ended December 31, 2019.
|
|
|
|
|
Weighted- |
|
|
Weighted- |
|
|
|
|
|
average |
|
|
average |
|
|
|
|
|
remaining |
|
|
grant date |
|
(in thousands) |
|
Shares |
|
term (years) |
|
|
fair value |
|
Outstanding at January 1, 2019 |
|
241 |
|
2.17 |
|
$ |
15.08 |
|
Shares vested |
|
(116) |
|
|
|
|
15.20 |
|
Shares forfeited |
|
(4) |
|
|
|
|
17.75 |
|
Outstanding at December 31, 2019 |
|
121 |
|
1.71 |
|
$ |
14.88 |
The unamortized future compensation expense for time-based restricted stock awards was $1.2 million at December 31, 2019.
F-34
ONESPAN INC.
NOTES TO CONSOLIDATED FINANCIAL STATEMENTS – (Continued)
(amounts in thousands, except per share data)
Time-Based Restricted Stock Units settled in stock
Upon approval of the 2019 Plan, the Company began granting certain eligible employees RSUs that settle in Company stock. RSUs granted to non-employee directors vest on the first anniversary date of the grant. Awards granted to certain executive officers vest in equal semi-annual installments over four years. Awards granted to certain other employees vest ratably over a four-year period with the first one-fourth of the grant vesting one year after the date of the grant. Shares are subject to forfeiture if the service period is not met. Compensation expense was $1.0 million for 2019, and the related tax benefit was $0.3 million. The following table summarizes the time-based restricted stock activity for the year ended December 31, 2019:
|
|
|
|
|
Weighted- |
|
|
Weighted- |
|
|
|
|
|
average |
|
|
average |
|
|
|
|
|
remaining |
|
|
grant date |
|
(in thousands) |
|
Shares |
|
term (years) |
|
|
fair value |
|
Nonvested, January 1, 2019 |
|
— |
|
— |
|
$ |
- |
|
Shares vested |
|
(21) |
|
|
|
|
13.69 |
|
Shares awarded |
|
211 |
|
|
|
|
13.77 |
|
Shares forfeited |
|
— |
|
|
|
|
- |
|
Nonvested, December 31, 2019 |
|
190 |
|
2.54 |
|
$ |
13.78 |
|
|
|
|
|
|
|
|
|
The unamortized future compensation expense for time-based restricted stock units was $2.1 million at December 31, 2019.
Performance-Based Restricted Stock Units settled in stock
Performance-based restricted stock units granted to executive officers and certain other employees were subject to achievement of three year performance criteria established by the Board of Directors. Under certain grants, earned shares related to three-year targets cliff vest upon fulfillment of the performance criteria and completion of the three-year period. Shares are subject to forfeiture if the performance criteria and service period are not met.
Compensation expense in 2019, 2018, and 2017 was $1.8 million, $2.0 million, and $1.3 million. Tax benefit related to the compensation expense was $0.2 million, $0.5 million, and $0.5 million for 2019, 2018, and 2017, respectively.
The following table summarizes activity related to unvested performance restricted stock shares during 2019:
|
|
|
|
|
Weighted- |
|
|
Weighted- |
|
|
|
Total |
|
average |
|
|
average |
|
|
|
Unvested |
|
remaining |
|
|
grant date |
|
(in thousands) |
|
Shares |
|
term (years) |
|
|
fair value |
|
Unearned, January 1, 2019 |
|
330 |
|
1.45 |
|
$ |
15.07 |
|
Shares vested |
|
(9) |
|
|
|
|
27.13 |
|
Shares awarded |
|
226 |
|
|
|
|
14.12 |
|
Shares forfeited |
|
(55) |
|
|
|
|
14.65 |
|
Unearned, December 31, 2019 |
|
492 |
|
1.25 |
|
$ |
14.46 |
Unamortized future compensation expense for performance-based restricted stock was $3.1 million at December 31, 2019.
F-35
ONESPAN INC.
NOTES TO CONSOLIDATED FINANCIAL STATEMENTS – (Continued)
(amounts in thousands, except per share data)
Note 12 – Earnings per Common Share (sharecounts in thousands)
Basic earnings per share is based on the weighted average number of shares outstanding and excludes the dilutive effect of unvested common stock equivalents. Diluted earnings per share is based on the weighted average number of shares outstanding and includes the dilutive effect of unvested common stock equivalents to the extent they are not anti-dilutive. Because the Company was in a net loss position for the year ended December 31, 2017, diluted net loss per share for this period excludes the effects of common stock equivalents, which are anti-dilutive.
A reconciliation of the shares included in the basic and fully diluted earnings per share calculations is as follows:
|
|
|
|
For the year ended December 31, |
|||||||
|
in thousands, except per share data |
|
|
2019 |
|
2018 |
|
2017 |
|||
|
Net income (loss) |
|
|
$ |
8,789 |
|
$ |
3,846 |
|
$ |
(22,399) |
|
Weighted average common shares outstanding: |
|
|
|
|
|
|
|
|
|
|
|
Basic |
|
|
|
40,050 |
|
|
39,932 |
|
|
39,802 |
|
Incremental shares with dilutive effect: |
|
|
|
|
|
|
|
|
|
|
|
Restricted stock awards |
|
|
|
86 |
|
|
114 |
|
|
— |
|
Diluted |
|
|
|
40,136 |
|
|
40,046 |
|
|
39,802 |
|
|
|
|
|
|
|
|
|
|
|
|
|
Net income (loss) per share: |
|
|
|
|
|
|
|
|
|
|
|
Basic |
|
|
$ |
0.22 |
|
$ |
0.10 |
|
$ |
(0.56) |
|
Diluted |
|
|
$ |
0.22 |
|
$ |
0.10 |
|
$ |
(0.56) |
Note 13 – Employee Benefit Plans
U.S. Plan
We maintain a defined contribution pension plan for U.S. employees established pursuant to Section 401(k) of the Internal Revenue Code. The plan allows voluntary employee contributions and discretionary employer contributions. For the years ended December 31, 2019, 2018, and 2017, we expensed contributions of $0.3 million, $0.3 million, and $0.2 million, respectively.
Non-U.S. Plans
We are subject to national mandatory pension systems and other compulsory plans, or make contributions to social pension funds based on local regulations. When our obligation is limited to the payment of the contribution into these plans or funds, the recognition of such liabilities is not required.
In addition, we have, in some countries, defined benefit plans consisting of final retirement salary and committed pension payments.
In Switzerland, the pension plan is a cash balance plan where contributions are expressed as a percentage of the pensionable salary. Contributions to Swiss plans are paid by the employees and the employer. The pension plan guarantees the amount accrued on the members’ savings accounts, as well as a minimum interest on those savings accounts. The plan assets are held in guaranteed investment contracts.
We also maintain a pension plan for our Belgian employees, in compliance with Belgian law. Contributions to Belgium plans are paid by the employees and the employer. Certain features of the plans require them to be categorized as defined benefit plans under ASC 715 due to Belgian social legislation, which prescribed a minimum annual return of
F-36
ONESPAN INC.
NOTES TO CONSOLIDATED FINANCIAL STATEMENTS – (Continued)
(amounts in thousands, except per share data)
1.6% on employer contributions and 1.6% for employee contributions. The plan assets are held in guaranteed investment contracts.
The Company also includes a liability related to obligations to provide retirement benefits to employees who retire from the Company’s French subsidiary, as required by law. Per French regulations, each employee is entitled to a lump sum payment upon retirement based on years of service and salary at retirement. Benefit rights vest upon the statutory retirement age of 62. The obligation recorded represents the present value of amounts the Company expects to pay.
Components of net periodic pension cost included in earnings:
|
|
|
Year ended December 31, |
|||||||
|
|
|
2019 |
|
2018 |
|
2017 |
|||
|
|
|
|
|
|
|
|
|
|
|
|
Service cost (gross) |
|
$ |
1,164 |
|
$ |
1,281 |
|
$ |
1,397 |
|
Interest cost |
|
|
234 |
|
|
199 |
|
|
188 |
|
Expected return on plan assets |
|
|
(242) |
|
|
(327) |
|
|
(199) |
|
Amortization of unrecognized actuarial gain |
|
|
(22) |
|
|
18 |
|
|
45 |
|
Net periodic pension cost |
|
$ |
1,134 |
|
$ |
1,171 |
|
$ |
1,431 |
The net unfunded status of the Non-U.S. pension plans is as follows:
|
|
|
As of December 31, |
||||
|
|
|
2019 |
|
2018 |
||
|
Fair value of plan assets |
|
$ |
14,159 |
|
$ |
12,823 |
|
Projected benefit obligation |
|
|
(21,759) |
|
|
(18,173) |
|
Net unfunded benefit obligation |
|
$ |
(7,600) |
|
$ |
(5,350) |
Net unfunded benefit obligation is recorded as other long-term liabilities in our consolidated Balance Sheets.
The change in the fair value of plan assets is as follows:
|
|
|
Year ended December 31, |
||||
|
|
|
2019 |
|
2018 |
||
|
|
|
|
|
|
|
|
|
Fair value of plan assets at January 1 |
|
$ |
12,823 |
|
$ |
12,390 |
|
Employee contributions |
|
|
485 |
|
|
506 |
|
Actual return on plan assets |
|
|
908 |
|
|
904 |
|
Benefits (paid), net of transfers |
|
|
(977) |
|
|
(1,601) |
|
Employer contributions |
|
|
977 |
|
|
971 |
|
Foreign exchange adjustment |
|
|
(57) |
|
|
(347) |
|
Fair value of plan assets at December 31 |
|
$ |
14,159 |
|
$ |
12,823 |
F-37
ONESPAN INC.
NOTES TO CONSOLIDATED FINANCIAL STATEMENTS – (Continued)
(amounts in thousands, except per share data)
The change in benefit obligations is as follows:
|
|
|
Year ended December 31, |
||||
|
|
|
2019 |
|
2018 |
||
|
|
|
|
|
|
|
|
|
Benefit obligations at January 1 |
|
$ |
18,173 |
|
$ |
18,308 |
|
Gross service cost |
|
|
1,164 |
|
|
1,281 |
|
Interest cost |
|
|
234 |
|
|
199 |
|
Employee contributions |
|
|
485 |
|
|
506 |
|
Actuarial (gains)/losses |
|
|
2,763 |
|
|
(672) |
|
Plan amendment |
|
|
— |
|
|
560 |
|
Benefits (paid), net of transfers |
|
|
(977) |
|
|
(1,601) |
|
Foreign exchange adjustment |
|
|
(83) |
|
|
(408) |
|
Benefit obligations at December 31 |
|
$ |
21,759 |
|
$ |
18,173 |
Our investment policy meets our responsibility under local social legislation and aligns plan assets with liabilities, while minimizing risk. For the years ended December 31, 2019 and 2018, plan assets are invested in guaranteed investment contracts. Fair value of guaranteed investment contracts is surrender value. Fair value for the year ended December 31, 2019 was determined using Level 3 inputs as defined by ASC 820, Fair Value Measurements. Changes in our plan assets are attributable to benefit payments and contributions as we have not actively traded our assets during the years ended December 31, 2019 and December 31, 2018.
Other
The accumulated benefit obligation for the plans were $20.3 million and $16.5 million as of December 31, 2019 and 2018, respectively.
The Company expects to pay $1.0 million of contributions over the next twelve months.
The amounts reclassified out of other comprehensive income during the twelve months ended December 31, 2019, 2018, and 2017 were not material.
Actuarial Assumptions
Certain actuarial assumptions such as the discount rate and the long-term rate of return on plan assets have a significant effect on the amounts reported for net periodic cost and the benefit obligation. The assumed discount rates reflect the prevailing market rates of a universe of high-quality, non-callable, corporate bonds currently available that, if the obligation were settled at the measurement date, would provide the necessary future cash flows to pay the benefit obligation when due. In determining the long-term return on plan assets, the Company considers long-term rates of return of comparable low risk investments, such as Euro AA bonds.
The following weighted-average assumptions between all plans were utilized in the pension calculations:
|
|
|
|
|
|
|
|
|
|
|
|
|
As of December 31, |
||||||
|
|
|
2019 |
|
2018 |
||||
|
|
|
(%) |
||||||
|
Discount rates |
|
0.15 |
- |
0.70 |
|
0.90 |
- |
1.80 |
|
Inflation |
|
1.00 |
- |
2.00 |
|
1.00 |
- |
2.00 |
|
Expected return on plan assets |
|
1.25 |
- |
2.00 |
|
1.30 |
- |
2.00 |
|
Rate of salary increases |
|
2.00 |
- |
2.80 |
|
2.00 |
- |
2.80 |
F-38
ONESPAN INC.
NOTES TO CONSOLIDATED FINANCIAL STATEMENTS – (Continued)
(amounts in thousands, except per share data)
Projected future pension benefits as of December 31, 2019:
|
|
|
|
|
|
2020 |
|
$ |
452 |
|
2021 |
|
|
549 |
|
2022 |
|
|
769 |
|
2023 |
|
|
667 |
|
2024 |
|
|
568 |
|
Beyond |
|
|
4,460 |
Note 14 – Geographic, Customer and Supplier Information
We classify our sales by our customers’ locations in three geographic regions: 1) EMEA, which includes Europe, the Middle East, and Africa; 2) the Americas, which includes sales in North, Central, Latin and South America and Canada; and 3) Asia Pacific, which includes Australia and India.
|
|
|
Europe, |
|
|
|
|
|
|
|
|
|
|
|
|
|
Middle East, |
|
|
|
|
|
|
|
|
|
|
|
|
|
Africa (EMEA) |
|
Americas |
|
Asia Pacific |
|
Total |
||||
|
2019 |
|
|
|
|
|
|
|
|
|
|
|
|
|
Revenue |
|
$ |
147,027 |
|
$ |
61,577 |
|
$ |
45,966 |
|
$ |
254,570 |
|
Gross profit |
|
|
99,689 |
|
|
41,752 |
|
|
31,167 |
|
|
172,608 |
|
Long-lived assets |
|
|
8,085 |
|
|
13,240 |
|
|
709 |
|
|
22,034 |
|
|
|
|
|
|
|
|
|
|
|
|
|
|
|
2018 |
|
|
|
|
|
|
|
|
|
|
|
|
|
Revenue |
|
$ |
103,293 |
|
$ |
54,979 |
|
$ |
54,008 |
|
$ |
212,280 |
|
Gross profit |
|
|
71,840 |
|
|
38,204 |
|
|
37,423 |
|
|
147,467 |
|
Long-lived assets |
|
|
7,665 |
|
|
4,247 |
|
|
155 |
|
|
12,067 |
|
|
|
|
|
|
|
|
|
|
|
|
|
|
|
2017 |
|
|
|
|
|
|
|
|
|
|
|
|
|
Revenue |
|
$ |
92,859 |
|
$ |
52,981 |
|
$ |
47,451 |
|
$ |
193,291 |
|
Gross profit |
|
|
61,506 |
|
|
41,491 |
|
|
31,517 |
|
|
134,514 |
|
Long-lived assets |
|
|
8,437 |
|
|
897 |
|
|
68 |
|
|
9,401 |
For the years 2019, 2018, and 2017, our top 10 customers contributed 29%, 24% and 27%, respectively, of total worldwide revenue. The majority of our hardware products are assembled by four independent factories in Southern China.
Note 15 – Commitments and Contingencies
The company leases office space and automobiles under operating lease agreements. See Note 9 – Leases for future minimum rental payments required under non-cancelable leases.
At December 31, 2019, we have purchase obligations of $28.5 million, including $14.0 million of inventory purchase obligations which are expected to be consummated in the next 12 months, $12.8 million of committed hosting arrangements which will be used in the next one to four years, and $1.7 million for other software agreements related to the administration of our business which range from one to five years.
We are a party to or have intellectual property subject to litigation and other proceedings that arise in the ordinary course of our business. These types of matters could result in fines, penalties, compensatory or treble damages or non-monetary sanctions or relief. We believe the probability is remote that the outcome of each of these matters, including the legal proceedings described below, will have a material adverse effect on the corporation as a whole, notwithstanding that the unfavorable resolution of any matter may have a material effect on our financial results in any
F-39
ONESPAN INC.
NOTES TO CONSOLIDATED FINANCIAL STATEMENTS – (Continued)
(amounts in thousands, except per share data)
particular interim reporting period. Among the factors that we consider in this assessment are the nature of existing legal proceedings and claims, the asserted or possible damages or loss contingency (if estimable), the progress of the case, existing law and precedent, the opinions or views of legal counsel and other advisers, our experience in similar cases and the experience of other companies, the facts available to us at the time of assessment and how we intend to respond to the proceeding or claim. Our assessment of these factors may change over time as individual proceedings or claims progress.
Although we cannot predict the outcome of legal or other proceedings with certainty, where there is at least a reasonable possibility that a loss may have been incurred, U.S. GAAP requires us to disclose an estimate of the reasonably possible loss or range of loss or make a statement that such an estimate cannot be made. We follow a process in which we seek to estimate the reasonably possible loss or range of loss, and only if we are unable to make such an estimate do we conclude and disclose that an estimate cannot be made. Accordingly, unless otherwise indicated below in our discussion of legal proceedings, a reasonably possible loss or range of loss associated with any individual legal proceeding cannot be estimated.
We include various types of indemnification clauses in our agreements. These indemnifications may include, but are not limited to, infringement claims related to our intellectual property, direct damages and consequential damages. The type and amount of such indemnifications vary substantially based on our assessment of risk and reward associated with each agreement. We believe the estimated fair value of these indemnification clauses is minimal, and we cannot determine the maximum amount of potential future payments, if any, related to such indemnification provisions. We have no liabilities recorded for these clauses as of December 31, 2019.
On March 14, 2017, a complaint was filed in the United States District Court for the District of Massachusetts, captioned StrikeForce Technologies, Inc. v. Vasco Data Security International, Inc., et al., claiming the Company infringed on certain patent rights of the plaintiff. On May 8, 2017, the Company answered the complaint denying the allegations of patent infringement. The parties then engaged in motion practice and discovery in the case. The plaintiff has also brought suit against various other companies in the cybersecurity industry. In one such suit in the federal district court for the Central District of California, on December 1, 2017, the court granted defendant’s motion to dismiss, finding that the StrikeForce asserted claims are invalid. StrikeForce appealed such decision. In light of such ruling, on December 20, 2017, the court in the Company’s case granted a stay of the proceedings pending the appeal in the related case. On April 16, 2019, the Court dismissed the claims of StrikeForce against us with prejudice. We consider this case to be closed.
From time to time, we have been involved in the litigation incidental to the conduct of our business. Excluding matters disclosed above, we are not a party to any lawsuit or proceeding that, in management’s opinion, is likely to have a material adverse effect on its business, financial condition or results of operations.
F-40
ONESPAN INC.
NOTES TO CONSOLIDATED FINANCIAL STATEMENTS – (Continued)
(amounts in thousands, except per share data)
Note 16 – Quarterly Results of Operations (unaudited)
The quarterly results of operations are as follows:
|
|
|
First |
|
Second |
|
Third |
|
Fourth |
||||
|
|
|
Quarter |
|
Quarter |
|
Quarter |
|
Quarter |
||||
|
2019 |
|
|
|
|
|
|
|
|
|
|
|
|
|
Total revenues |
|
$ |
47,608 |
|
$ |
56,234 |
|
$ |
79,725 |
|
$ |
71,003 |
|
Gross profit |
|
|
31,569 |
|
|
38,354 |
|
|
53,056 |
|
|
49,629 |
|
Operating costs |
|
|
37,096 |
|
|
40,565 |
|
|
35,937 |
|
|
43,735 |
|
Operating income (loss) |
|
|
(5,527) |
|
|
(2,211) |
|
|
17,119 |
|
|
5,894 |
|
Provision (benefit) for income taxes |
|
|
(272) |
|
|
770 |
|
|
3,864 |
|
|
2,343 |
|
Net income (loss) |
|
|
(5,671) |
|
|
(2,461) |
|
|
11,872 |
|
|
5,050 |
|
Net income/(loss) per share: |
|
|
|
|
|
|
|
|
|
|
|
|
|
Basic |
|
$ |
(0.14) |
|
$ |
(0.06) |
|
$ |
0.30 |
|
$ |
0.13 |
|
Diluted |
|
$ |
(0.14) |
|
$ |
(0.06) |
|
$ |
0.30 |
|
$ |
0.13 |
|
|
|
|
|
|
|
|
|
|
|
|
|
|
|
2018 |
|
|
|
|
|
|
|
|
|
|
|
|
|
Total revenues |
|
$ |
45,432 |
|
$ |
49,554 |
|
$ |
52,495 |
|
$ |
64,799 |
|
Gross profit |
|
|
34,697 |
|
|
35,981 |
|
|
34,543 |
|
|
42,246 |
|
Operating costs |
|
|
33,049 |
|
|
38,592 |
|
|
37,657 |
|
|
38,145 |
|
Operating income |
|
|
1,648 |
|
|
(2,611) |
|
|
(3,114) |
|
|
4,101 |
|
Provision (benefit) for income taxes |
|
|
629 |
|
|
(872) |
|
|
(1,702) |
|
|
650 |
|
Net income (loss) |
|
|
1,792 |
|
|
(1,002) |
|
|
(908) |
|
|
3,964 |
|
Net income/(loss) per share: |
|
|
|
|
|
|
|
|
|
|
|
|
|
Basic |
|
$ |
0.04 |
|
$ |
(0.03) |
|
$ |
(0.02) |
|
$ |
0.10 |
|
Diluted |
|
$ |
0.04 |
|
$ |
(0.03) |
|
$ |
(0.02) |
|
$ |
0.10 |
Note 17 – Related Party
In August 2017, Able N.V. (“Able”), a wholly-owned subsidiary, was sold to an employee of Able for a de minimis amount. The operating results of Able through the date of sale are included in the consolidated financial statements as of December 31, 2017, and for the year ended December 31, 2017, and is not significant to our consolidated results. In addition, our 2017 results include a loss on sale of approximately $0.2 million, recorded in general and administrative expense.
Concurrent with the sale, we provided Able an unsecured line of credit of 1.5 million Euro ($1.8 million at an exchange rate of $1.18 dollars per Euro). Interest accrued at the rate of 2% per annuum. Beginning in August 2017, Able could take advances against the line of credit for a period of eighteen months followed by twelve quarterly repayments. The credit line expired during the year ended December 31, 2019, and no advancements were made. In addition we entered into a transition services agreement with Able whereby we agreed to provide certain administrative services for a period of three months and Able agreed to provide office space and consulting services for an agreed upon periodic fee as long as the services are provided.
F-41
ONESPAN INC.
VALUATION AND QUALIFYING ACCOUNTS
Allowance for doubtful accounts for trade receivables.
|
|
|
|
|
|
|
|
|
|
|
|
|
|
|
|
|
|
|
|
|
|
|
|
|
|
|
|
|
|
|
|
|
|
|
|
|
|
|
|
|
|
|
|
|
|
|
|
Provision |
|
|
|
Foreign |
|
|
|
|
|
|
Beginning |
|
for Bad |
|
|
|
Currency |
|
Ending |
||
|
For the year ended December 31, |
|
Balance |
|
Debts |
|
Chargeoffs |
|
Translation |
|
Balance |
||
|
2019 |
|
$ |
1,152 |
|
2,215 |
|
(843) |
|
— |
|
$ |
2,524 |
|
2018 |
|
$ |
520 |
|
871 |
|
(239) |
|
— |
|
$ |
1,152 |
|
2017 |
|
$ |
535 |
|
120 |
|
(137) |
|
2 |
|
$ |
520 |
See accompanying independent auditors’ report.
F-42
SIGNATURES
Pursuant to the requirements of Section 13 or 15(d) of the Securities Exchange Act of 1934, the Registrant has duly caused this Report to be signed on its behalf by the undersigned, thereunto duly authorized, on March 16, 2020.
|
|
OneSpan Inc. |
|
|
|
|
|
/s/ Scott Clements |
|
|
Scott Clements |
|
|
President and Chief Executive Officer |
Pursuant to the requirements of the Securities Exchange Act of 1934, this Report has been signed by the following persons on behalf of the Registrant in the capacities indicated on March 16, 2020.
POWER OF ATTORNEY
Each of the undersigned, in his capacity as an officer or director, or both, as the case may be, of OneSpan Inc. does hereby appoint Scott Clements, and each of them severally, his true and lawful attorneys or attorney to execute in his name, place and stead, in his capacity as director or officer, or both, as the case may be, this Annual Report on Form 10‑K for the fiscal year ended December 31, 2019 and any and all amendments thereto and to file the same with all exhibits thereto and other documents in connection therewith with the Securities and Exchange Commission. Each of said attorneys shall have power to act hereunder with or without the other attorney and shall have full power and authority to do and perform in the name and on behalf of each of said directors or officers, or both, as the case may be, every act whatsoever requisite or necessary to be done in the premises, as fully and to all intents and purposes as to which each of said officers or directors, or both, as the case may be, might or could do in person, hereby ratifying and confirming all that said attorneys or attorney may lawfully do or cause to be done by virtue hereof.
|
SIGNATURE |
|
TITLE |
|
|
|
|
|
/s/ Scott Clements Scott Clements |
|
President, Chief Executive Officer, and Director |
|
|
|
|
|
/s/ Mark S. Hoyt Mark S. Hoyt |
|
Chief Financial Officer |
|
|
|
|
|
/s/ John N. Fox, Jr. John N. Fox, Jr. |
|
Chairman |
|
|
|
|
|
/s/ Marc Boroditsky Marc Boroditsky |
|
Director |
|
|
|
|
|
/s/ Michael P. Cullinane Michael P. Cullinane |
|
Director |
|
|
|
|
|
/s/ Jean K. Holley Jean K. Holley |
|
Director |
|
|
|
|
|
/s/ T. Kendall Hunt T. Kendall Hunt |
|
Director |
|
|
|
|
|
/s/ Matthew Moog Matthew Moog |
|
Director |
|
|
|
|
|
/s/ Marc Zenner Marc Zenner |
|
Director |
|
|
|
|