Attached files
| file | filename |
|---|---|
| EXCEL - IDEA: XBRL DOCUMENT - OneSpan Inc. | Financial_Report.xls |
| EX-21 - SUBSIDIARIES OF REGISTRANT - OneSpan Inc. | d274865dex21.htm |
| EX-31.2 - CERTIFICATION OF PRINCIPAL FINANCIAL OFFICER PURSUANT TO SECTION 302 - OneSpan Inc. | d274865dex312.htm |
| EX-32.2 - CERTIFICATION OF PRINCIPAL FINANCIAL OFFICER PURSUANT TO SECTION 906 - OneSpan Inc. | d274865dex322.htm |
| EX-4.13 - FORM OF AWARD AGREEMENT FOR PERFORMANCE SHARES - OneSpan Inc. | d274865dex413.htm |
| EX-32.1 - CERTIFICATION OF PRINCIPAL EXECUTIVE OFFICER PURSUANT TO SECTION 906 - OneSpan Inc. | d274865dex321.htm |
| EX-31.1 - CERTIFICATION OF PRINCIPAL EXECUTIVE OFFICER PURSUANT TO SECTION 302 - OneSpan Inc. | d274865dex311.htm |
| EX-23 - CONSENT OF KPMG LLP - OneSpan Inc. | d274865dex23.htm |
Table of Contents
UNITED STATES
SECURITIES AND EXCHANGE COMMISSION
Washington, D.C. 20549
FORM 10-K
FOR ANNUAL AND TRANSITION REPORTS PURSUANT TO
SECTIONS 13 OR 15(d) OF THE SECURITIES EXCHANGE ACT OF 1934
(Mark One)
| [x] | ANNUAL REPORT PURSUANT TO SECTION 13 OR 15(D) OF THE SECURITIES EXCHANGE ACT OF 1934 |
| FOR THE FISCAL YEAR ENDED DECEMBER 31, 2011 |
or
| [ ] | TRANSITION REPORT PURSUANT TO SECTION 13 OR 15(d) OF THE SECURITIES EXCHANGE ACT OF 1934 |
| FOR THE TRANSITION PERIOD FROM TO |
Commission file number 000-24389
VASCO Data Security International, Inc.
(Exact Name of Registrant as Specified in Its Charter)
| DELAWARE | 36-4169320 | |
| (State or Other Jurisdiction of Incorporation or Organization) |
(IRS Employer Identification No.) |
1901 South Meyers Road, Suite 210
Oakbrook Terrace, Illinois 60181
(Address of Principal Executive Offices)(Zip Code)
Registrant’s telephone number, including area code:
(630) 932-8844
Securities registered pursuant to Section 12(b) of the Act:
| Title of each class |
Name of exchange on which registered | |
| Common Stock, par value $.001 per share | NASDAQ Capital Market |
Securities registered pursuant to Section 12(g) of the Act:
None
Indicate by check mark if the registrant is a well-known seasoned issuer, as defined by Rule 405 of the Securities Act. Yes No X
Indicate by check mark if the registrant is not required to file reports pursuant to Section 13 or 15(d) of the act. Yes No X
Indicate by check mark whether the registrant: (1) has filed all reports required to be filed by Section 13 or 15(d) of the Securities Exchange Act of 1934 during the preceding 12 months (or for such shorter period that the registrant was required to file such reports), and (2) has been subject to such filing requirements for the past 90 days. Yes X No
Indicate by check mark whether the registrant has submitted electronically and posted on its corporate Web site, if any, every Interactive Data File required to be submitted and posted pursuant to Rule 405 of Regulation S-T (§232.405 of this chapter) during the preceding 12 months (or for such shorter period that the registrant was required to submit and post such files). Yes X No
Indicate by check mark if disclosure of delinquent filers pursuant to Item 405 of Regulation S-K is not contained herein, and will not be contained, to the best of registrant’s knowledge, in definitive proxy or information statements incorporated by reference in Part III of this Form 10-K or any amendment to this Form 10-K. [X]
Indicate by check mark whether the registrant is a large accelerated filer, an accelerated filer, a non-accelerated filer or a smaller reporting company. See definition of “large accelerated filer,” “accelerated filer” and “smaller reporting company” in Rule 12b-2 of the Exchange Act.
Large accelerated filer Accelerated filer X Non-accelerated filer Smaller reporting company
(do not check if smaller reporting company)
Indicate by check mark whether the registrant is a shell company (as defined in Rule 12b-2 of the Exchange Act). Yes No X
As of June 30, 2011, the aggregate market value of voting and non-voting common equity (based upon the last sale price of the common stock as reported on the NASDAQ Capital Market on June 30, 2011) held by non-affiliates of the registrant was $354,738,311 at $12.45 per share.
As of February 28, 2012, there were 38,254,166 shares of common stock outstanding.
DOCUMENTS INCORPORATED BY REFERENCE
Certain sections of the registrant’s Notice of Annual Meeting of Stockholders and Proxy Statement for its 2012 Annual Meeting of Stockholders are incorporated by reference into Part III of this report.
Table of Contents
This report contains trademarks of VASCO Data Security International, Inc. and its subsidiaries, which include VASCO, the VASCO “V” design, Digipass as a Service (DPS), DIGIPASS, VACMAN, aXsGUARD and IDENTIKEY.
Table of Contents
Cautionary Statement for Purposes of the Safe Harbor Provisions of the Private Securities Litigation Reform Act of 1995
This Annual Report on Form 10-K, including Management’s Discussion and Analysis of Financial Condition and Results of Operations and Quantitative and Qualitative Disclosures About Market Risk contains forward-looking statements within the meaning of Section 21E of the Securities Exchange Act of 1934, as amended and Section 27A of the Securities Act of 1933, as amended concerning, among other things, our expectations regarding the DigiNotar B.V. bankruptcy process, the impairment of our investment in DigiNotar B.V., the timeframe in which the impairment costs will be incurred, our ability to recover amounts held in escrow, our ability to offset amounts that may be owed to DigiNotar B.V. by other VASCO affiliates against amounts owed to VASCO affiliates by DigiNotar B.V., and our ability to effectively integrate certain intellectual property assets acquired from DigiNotar into our operations, as well as the prospects of, and developments and business strategies for, VASCO and our operations, including the development and marketing of certain new products and services and the anticipated future growth in certain markets in which we currently market and sell our products and services or anticipate selling and marketing our products or services in the future. These forward-looking statements (1) are identified by use of terms and phrases such as “expect”, “believe”, “will”, “anticipate”, “emerging”, “intend”, “plan”, “could”, “may”, “estimate”, “should”, “objective”, “goal”, “possible”, “potential” and similar words and expressions, but such words and phrases are not the exclusive means of identifying them, and (2) are subject to risks and uncertainties and represent our present expectations or beliefs concerning future events. VASCO cautions that the forward-looking statements are qualified by important factors that could cause actual results to differ materially from those in the forward-looking statements. Factors that could cause actual results to differ materially from those contemplated above include, among others, unanticipated costs associated with DigiNotar B.V.’s bankruptcy or potential claims that may arise in connection with the hacking incidents at DigiNotar B.V. Additional risks, uncertainties and other factors have been described in greater detail in this Annual Report on Form 10-K and include, but are not limited to, (a) risks of general market conditions, including currency fluctuations and the uncertainties resulting from turmoil in world economic and financial markets, (b) risks inherent to the computer and network security industry, including rapidly changing technology, evolving industry standards, increasingly sophisticated hacking attempts, increasing numbers of patent infringement claims, changes in customer requirements, price competitive bidding, and changing government regulations, and (c) risks specific to VASCO, including, demand for our products and services, competition from more established firms and others, pressures on price levels and our historical dependence on relatively few products, certain suppliers and certain key customers. Thus, the results that we actually achieve may differ materially from any anticipated results included in, or implied by these statements. Except for our ongoing obligations to disclose material information as required by the U.S. federal securities laws, we do not have any obligations or intention to release publicly any revisions to any forward-looking statements to reflect events or circumstances in the future or to reflect the occurrence of unanticipated events.
1
Table of Contents
VASCO Data Security International, Inc. was incorporated in the State of Delaware in 1997 and is the successor to VASCO Corp., a Delaware corporation. Our principal executive offices are located at 1901 South Meyers Road, Suite 210, Oakbrook Terrace, Illinois 60181; the telephone number at that address is 630 932 8844. Our international headquarters in Europe is located at World-Wide Business Center, Balz-Zimmermannstrasse 7, CH-8152, Glattbrugg, Switzerland; the phone number at this location is 41 (0)43 555 3500. Our principal operations offices in Europe are located at Koningin Astridlaan 164, B-1780 Wemmel, Belgium and the telephone number at that address is 32 (0)2 609 9700. Unless otherwise noted, references in this Annual Report on Form 10-K to “VASCO”, “company”, “we”, “our”, and “us” refer to VASCO Data Security International, Inc. and its subsidiaries.
Additional information on the company, our products and services and our results, including the company’s annual report on Form 10-K, quarterly reports on our Form 10-Q, current reports on Form 8-K, and amendments to those reports filed with the Securities and Exchange Commission (the “SEC”) are available, free of charge, on our website at http://www.vasco.com. You may also read and copy any materials we file with the SEC at the SEC’s Public Reference Room at 100 F Street, NE, Washington, DC 20549. You may obtain information on the operation of the Public Reference Room by calling the SEC at 1-800-SEC-0330. Our reports are filed electronically with the SEC and are also available on the SEC’s website (http://www.sec.gov).
General
We, through our operating subsidiaries, design, develop, market and support hardware and software security systems that manage and secure access to information assets. Those security systems include both open standards-based and patented “Strong User Authentication” and “PKI” (Public Key Infrastructure) products and services for employee and consumer security, e-business and e-commerce.
We operate in one business segment, authentication products and services, but have two target markets, the banking and financial services market (which we refer to as the “Banking market” or “Banking”) and the enterprise and application security market (which we refer to as the “Enterprise and Application Security Market” or “Enterprise and Application Security”) . Our target markets are the applications and their several hundred million users that utilize fixed passwords as security. Our event and time-based system generates “one-time” passwords that change with every use and electronic and digital signatures that protect transactions. As a result, when compared to fixed passwords, our security system substantially reduces the risks of unauthorized access to the application and of the hijacking of financial or other data transfers over the Internet.
Products:
Our products enable secure financial transactions to be made over private enterprise networks and public networks, such as the Internet. VASCO customers have historically installed and managed VASCO’s products on their own computers.
VASCO’s hardware and software products address three main security areas:
| 1. | User authentication: log-on access process of verifying that the user is in fact who he claims to be, |
| 2. | Electronic signatures: securing a transaction/message between two known parties, and |
| 3. | Digital signatures/PKI: securing a transaction/message between two parties who do not necessarily know each other, whereby a third party guarantees the identity/signature of all parties involved. |
2
Table of Contents
The backbone of our product range is VACMAN. VACMAN is either integrated into or interfaced with the host system’s application. VACMAN supports multiple authentication technologies, including passwords, dynamic password technology, electronic signatures, digital signatures, certificates and biometrics, on one unique platform.
Our client side strong user authentication is delivered via our hardware and software DIGIPASS security products, (collectively “DIGIPASSES”) most of which incorporate an electronic signature capability, which further protects the integrity of electronic transactions and data transmissions. Some of our DIGIPASSES are compliant with the Europay MasterCard Visa (EMV) standard and with MasterCard’s and VISA’s Chip Authentication Program (CAP). Some of our DIGIPASSES are OATH (Initiative for Open Authentication) compliant.
Our strategy is to be the full option, all-terrain authentication company. Our end-to-end authentication combines all aspects of VASCO’s longstanding full option, all-terrain business model. Based on one unique core authentication engine, VACMAN, VASCO offers a wide portfolio of over 50 software and hardware client authentication products and services, for banking and non-banking markets and secures a network from the server to the end-user.
We offer our products in one of two models, a sales/license model or a services model:
| 1. | Our sales/license model, which is our traditional approach to the market, allows a customer to license our host system software for installation on their on- premise systems in their applications. Similarly, our customers would purchase or license hardware or software devices (which we refer to as “client devices”) that would be distributed to the users of their systems or applications. Our sales /license model is ideally suited to applications that have either a high transaction value or a high frequency of use. Under our traditional approach, the client devices can generally only be used with one host system application. |
| 2. | Our services model is DIGIPASS as a Service, which we also refer to as DPS, and was announced in October 2010. DPS allows our customer to use host system software installed on our servers and access it over the Internet, sometimes referred to as “in the cloud”. We then provide our customers with various options on how to procure, deploy and use client devices. With our services model, the client devices can be used with multiple applications. We believe that DPS is ideally suited to online applications where the application owner’s primary focus is on the functionality of the application rather than security or on other online applications that have limited transaction value or low frequency of use. |
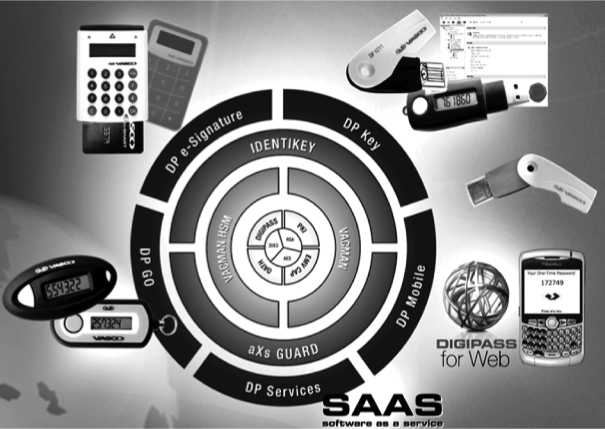
VASCO’s product and service lines include:
•
 VACMAN: Core authentication platform, combining all technologies on one unique platform;
•
 IDENTIKEY: VASCO’s authentication server, combining the VACMAN core authentication platform with full server functionality;
•
 aXs GUARD: Leading authentication appliance, combining IDENTIKEY with a wide variety of Internet communication solutions;
3
Table of Contents
•
 DIGIPASS: A suite of over 50 multi-application client e-signature software products, based on the world’s most widely spread electronic client platforms;
•
 DIGIPASS as a Service (DPS): Offers on-demand identity and transaction security as a service. VASCO’s authentication services product offering is designed to provide enterprise employees, businesses and consumers
secure access to multiple online and in-the-cloud applications, combined with safe online transactions.
DIGIPASS as a Service (DPS): Offers on-demand identity and transaction security as a service. VASCO’s authentication services product offering is designed to provide enterprise employees, businesses and consumers
secure access to multiple online and in-the-cloud applications, combined with safe online transactions.
Our security solutions are sold worldwide through our direct sales force, as well as through distributors, resellers and systems integrators. We currently have over 10,000 customers, including more than 1,600 financial institutions, in more than 100 countries. Representative customers of our products include HSBC, Rabobank Nederland, BNP-Paribas Fortis, Citibank, KBC and Blizzard Entertainment.
Our Background
Our predecessor company, VASCO Corp., entered the data security business in 1991 through the acquisition of a controlling interest in ThumbScan, Inc., which we renamed VASCO Corp. in 1993. In 1996, we began an expansion of our computer security business by acquiring Lintel Security NV/SA, a Belgian corporation, which included assets associated with the development of security tokens and security technologies for personal computers and computer networks. In addition, in 1996, we acquired Digipass NV/SA, a Belgian corporation, which was also a developer of security tokens and security technologies and whose name we changed to VASCO Data Security NV/SA in 1997.
On March 11, 1998, we completed a registered exchange offer with the holders of the outstanding securities of VASCO Corp. In December 2006, we opened our international headquarters in Zurich, Switzerland. In 2007, we established wholly-owned sales subsidiaries in Brazil and Japan. In 2008 and 2009, we established wholly-owned sales subsidiaries in Mumbai, India and Bahrain, respectively. In 2011, we completed the establishment of our wholly-owned sales subsidiary in China and received our trade license for a new subsidiary in Dubai, United Arab Emirates.
In January 2011, we acquired an internet trusted certificate authority/provider, in a two step process. In the first step, we acquired all of the intellectual property of DigiNotar Holding B.V. and its subsidiaries. In the second step we acquired 100% of the stock of DigiNotar B.V. and DigiNotar Notariaat B.V. (collectively, “DigiNotar”). The acquisition expanded the technological breadth of our product line by expanding our abilities to offer PKI technology throughout the product line.
In April 2011, we acquired Alfa & Ariss BV (“Alfa & Ariss”). Alfa & Ariss is an authority in the field of developing open identity and access management solutions. Alfa & Ariss brought additional important know-how and engineering capabilities in the fields of linking applications in-the-cloud. We believe that the acquisition of Alfa & Ariss will support the long-term growth strategy of our services and enterprise and application security businesses.
Since the 1998 exchange offer, including the acquisitions of DigiNotar and Alfa & Ariss in 2011, we have engaged in eight acquisitions and one disposition.
In July 2011, DigiNotar B.V. detected an intrusion into its certificate authority infrastructure, which resulted in the fraudulent issuance of public key certificate requests for a number of domains. On September 14, 2011, the Dutch Independent Post and Telecommunications Authority (OPTA) Commission terminated the registration of DigiNotar B.V. as a certification service provider that issues qualified certificates. As a result of the termination of its registration as a certification service provider, DigiNotar B.V. filed for bankruptcy on September 19, 2011 and the Haarlem District Court, The Netherlands declared DigiNotar B.V. bankrupt on September 20, 2011.
4
Table of Contents
Following the bankruptcy of DigiNotar B.V., we do not plan to continue the certificate authority business, which was DigiNotar B.V.’s core product. We do expect, however, that we will be able to use the intellectual property acquired from DigiNotar to create our own PKI-secured applications, such as document signing, registration and storage solutions, which we expect will strengthen our core authentication product line and expand opportunities for us on our DPS platform.
Industry Background
We believe that the growth in the number of people using the Internet and the growth in the number of applications that are available to Internet users are key drivers in the growth of the industry. As the number of people using the Internet has grown, the number of criminal activities associated with identity theft and other forms of cyber attacks has also grown. The growth in electronic banking and electronic commerce, and the increasing use and reliance upon proprietary or confidential information by businesses, government and educational institutions that is remotely accessible by many users, has made information security a paramount concern. We believe that enterprises are seeking solutions that will continue to allow them to expand access to data and financial assets while maintaining network security.
Internet and Enterprise Security. With the advent of personal computers and distributed information systems in the form of wide area networks, intranets, local area networks and the Internet, as well as other direct electronic links, many organizations have implemented applications to enable their work force and third parties, including vendors, suppliers and customers, to access and exchange data and perform electronic transactions. As a result of the increased number of users having direct and remote access to such enterprise applications, data and financial assets have become increasingly vulnerable to unauthorized access and misuse.
Cloud Computing. As noted above, cloud computing has grown in popularity over the past 10 years. Organizations are able to outsource many of their applications and access them over the Internet (sometimes referred to as the “cloud”). Many such applications are not adequately secured and commonly use a traditional user name and password as security. As a result of the increased number of users having direct and remote access to such enterprise applications, data and financial assets in the cloud are similarly increasingly vulnerable to unauthorized access and misuse.
Individual (i.e., consumer) User Security. In addition to the need for enterprise-wide security, the proliferation of personal computers, personal digital assistants and mobile telephones in both home and office settings, combined with widespread access to the Internet, have created significant opportunities for electronic commerce by individual users, such as electronic bill payment, home banking and home shopping.
Fueled by well-publicized incidents, including misappropriation of credit card information and denial of service attacks, there is a growing perception among many consumers that there is a risk involved in transmitting information via the Internet. These incidents and this perception may hamper the development of consumer-based electronic commerce. Accordingly, we believe that electronic commerce will benefit from the implementation of improved security measures that accurately identify users and reliably encrypt data transmissions over the Internet. To minimize losses due to misappropriation of credit card information, many banks in European countries have issued smart cards (credit cards with a micro-chip) that are compliant with the EMV standard.
Several governments worldwide have recognized the risk associated with using fixed passwords for Internet applications and have issued specific rules requiring two-factor authentication for online banking security. We expect that trend to continue and that governments in many countries will prepare similar guidance and/or rules in order to protect their citizens’ online assets.
5
Table of Contents
Components of Security. Data and financial asset security, and secured access to and participation in on-line commerce, generally consist of the following components:
| • | Encryption: Maintains data privacy by converting information into an unreadable pattern and allowing only authorized parties to decrypt the data. Encryption can also maintain data integrity by creating digital signatures for transmitted data, enabling the recipient to check whether the data has been changed since or during transmission. |
| • | Identification and Authentication: Serves as the foundation for other security mechanisms by verifying that a user is who he or she claims to be. Identification and authentication mechanisms are often employed with encryption tools to authenticate users, to determine the proper encryption key for encrypting/decrypting data, or to enable users to digitally “sign” or verify the integrity of transmitted data. |
| • | Access Control: Software that provides authentication, authorization and accounting functions, controlling a user’s access to only that data or the financial assets which he or she is authorized to access, and that keeps track of a user’s activities after access has been granted. |
| • | Administration and Management Tools: Software that sets, implements, and monitors security policies, the access to which is typically regulated by access control systems. These tools are extremely important to the overall effectiveness of a security system. |
The most effective security policies employ most, if not all, of the above components. Many companies, however, only implement a patchwork of these components, which could result in their security systems being compromised.
Our Solution
We have found that, to date, most approaches to network security, including Internet security related to access to both internal applications and applications in the cloud, have been limited in scope and have failed to address all of the critical aspects of data security. We believe that an effective enterprise-wide solution must address and assimilate issues relating to the following:
| • | Speed and ease of implementation, use and administration; |
| • | Reliability; |
| • | Interoperability within diverse enterprise environments, existing customer applications and the security infrastructure; |
| • | Interoperability within diverse applications in cloud processing environments; |
| • | Scalability; and |
| • | Overall cost of ownership. |
Accordingly, we have adopted the following approach to data security:
| • | In designing our products and services, we have sought to incorporate industry-accepted, open and non-proprietary protocols. This permits interoperability between our products and the multiple platforms, products and applications widely in use. |
| • | We have designed our products and services to minimize their integration effort with, and disruption of, existing legacy applications and the security infrastructure. We provide customers with easier implementations and a more rapid means of implementing security across the enterprise, including the Internet. With security being a critical enabling technology for on-line business initiatives, speed and ease of security implementation has become crucial to an organization’s success. |
6
Table of Contents
| • | We design our products and services to have a more attractive total cost of ownership than competing products and services. We have found that product improvements and tools that lower a customer’s total cost of ownership create differentiating sales and marketing tools and also help in the development of a highly loyal customer base that is open to new solutions that we offer. |
| • | We are providing a choice to our customers with our DPS platform. By using our authentication platform, customers can deploy two-factor authentication more quickly, incur less upfront costs and be able to use strong authentication when logging onto a larger number of Internet sites and applications. We expect those applications to include business-to-business applications (“B2B”), business to employee applications (“B2E”) (e.g., employees of companies logging into third party applications operated in the cloud), and business to consumer (“B2C”) applications. We believe that DPS has the potential for significant future growth as it will make two-factor authentication more affordable and readily available to consumers and application markets. |
As a result of this approach, we believe that we are a leading provider of strong software and hardware authentication security that can be combined with electronic and digital signature (“e-signature”) solutions for all types of on-line, risk-based transactions.
Our Strategy
We believe that we have one of the most complete lines of security products and services for strong user authentication and electronic signatures digital signatures available in the market today. We also believe that we can demonstrate to an increasing number of distributors, resellers and systems integrators that they can more effectively differentiate themselves in their marketplaces and increase the value of their products by incorporating our security products into their own products. On a broad basis, our strategy is to:
| • | Continue our “full-option,” end-to-end authentication strategy by offering the financial services sector the full array of authentication products and services; |
| • | Expand our penetration in other traditional markets (“all-terrain” strategy) by selling the products offered in the financial services sector to other markets including, but not limited to, business enterprises and other vertical markets that center around core applications that are similar to the way that the financial services market operates (e.g., e-commerce applications and e-government applications); |
| • | Expand our penetration into new markets such as B2B, B2E and B2C by providing strong authentication through our services platform, DPS, and; |
| • | Expand our footprint in the market by creating hundreds of millions of dormant DIGIPASS client devices that can be activated by our or our customers’ end users electronically without the need to buy host system software or buy and deploy hardware DIGIPASS client devices. |
We plan to bring dormant DIGIPASSES to end users in the following ways:
| • | DIGIPASS Embedded Security Solutions, which we also refer to as “DESS”: a software DIGIPASS is natively embedded on a manufacturer’s hardware. Examples are our partnering relationships with Intel Corporation and Option N.V, |
| • | DIGIPASS Plus: a DIGIPASS client device that is purchased by our customer that has more than one identity on the device. The first identity is used for our customer’s proprietary application and the second identity can be activated by our customer’s end user to secure access to third party applications through our DPS platform. |
| • | National ID cards: many countries are expected to roll out national ID cards that can be used as an authentication and PKI platform. |
7
Table of Contents
| • | Mobile platform solutions: we expect that mobile software platform providers will embed DIGIPASSES in their applications. An example is our activities with Option N.V. through which we co-developed Cloudkey®, a DIGIPASS with 3G connectivity, that provides simple and secure access to cloud applications and data. |
| • | DIGIPASS client devices sold in retail shops. |
| • | DIGIPASS client devices sold or downloaded from our web shop. |
In the coming year, we expect to have over 100 million of dormant DIGIPASSES in the market and expect this number to grow significantly in the next two years.
Our strategy with the dormant DIGIPASSES represents both a top-down and a bottom-up approach to get DIGIPASSES to consumers, in many cases at no additional cost to the consumer. In the top-down approach, the consumer obtains the dormant DIGIPASS from a bank or other customer of VASCO. In the bottom-up approach, the DIGIPASS is embedded in the software of a device that the consumer is purchasing primarily for another purpose (for example, a personal computer). Once the dormant DIGIPASS is in the hands of the consumer, the consumer can decide if he or she wants to activate and use the DIGIPASS to secure other applications. We expect that as consumers’ awareness of identity theft grows, they will be willing to pay VASCO a fee for the monthly use of the DIGIPASS to secure their applications.
Additionally, we intend to continue to enhance and broaden our line of security products to meet the changing needs of our existing and potential customers by:
| • | Building on our core software and hardware security expertise by continuing to expand our technology and services for use on different platforms, such as mobile phones and personal digital assistants; |
| • | Embedding our core software into different platforms, such as chip sets used for PCs, mobile phones and personal digital assistants; |
| • | Expanding our authentication services product offering; |
| • | Acquiring complementary technologies or businesses; and |
| • | Developing products for applications in new vertical markets. |
Our Products
VACMAN Product Line
The VACMAN product line incorporates a range of strong authentication utilities and solutions designed to allow organizations to add DIGIPASS strong authentication into their existing networks and applications.
In order to provide the greatest flexibility, without compromising on functionality or security, VACMAN solutions are designed to integrate with most popular hardware and software. Once integrated, the VACMAN components become largely transparent to the users, minimizing rollout and support issues.
VACMAN is the backbone of VASCO’s product strategy towards the banking and e-commerce markets. VACMAN encompasses all four authentication technologies (passwords, dynamic password technologies, certificates and biometrics) and allows our customers to use any combination of those technologies simultaneously. VACMAN is natively embedded in or compatible with the solutions of over 100 VASCO solution partners.
Designed by specialists in “system entry” security, VACMAN makes it easy to administer a high level of access control and allows our customers to match the level of authentication security used with their perceived risk for each user of their application. Our customer simply adds a field to his or her existing user database,
8
Table of Contents
describing the authentication technology used and, if applicable, the unique DIGIPASS assigned to the end user of their application. VACMAN takes it from there, automatically authenticating the logon request using the security sequence the user specifies, whether it’s a one-time password using either response-only or a challenge/response authentication scheme or an electronic signature.
VACMAN allows the user the freedom to provide secure remote access to virtually any type of application. VACMAN is a library requiring only a few days to implement in most systems and supports all DIGIPASS functionality. Once linked to an application, VACMAN automatically handles login requests from any users authorized to have a DIGIPASS.
IDENTIKEY Server
IDENTIKEY Server is an off-the-shelf centralized authentication server that supports the deployment, use and administration of DIGIPASS strong user authentication. IDENTIKEY is based on VASCO’s core VACMAN technology.
IDENTIKEY is available in four packaged versions for the use of the Enterprise and Application Security market and can be easily upgraded.
| • | The Standard Edition includes Remote Authentication Dial In User Service (“RADIUS”) functionality for a single licensed server. It targets small and medium-sized business (“SMB”s) wanting to secure their remote access infrastructure at the lowest total cost of ownership. |
| • | The Gold Edition offers web filters to secure Outlook Web Access (“OWA”) and Citrix Web Interface (CWI”), additional to the RADIUS support. This version includes licenses for a primary and a back-up server. It is an ideal solution for SMBs that want to offer more functionality and assure availability for their employees. |
| • | The Platinum Edition addresses the security needs of companies that want to protect the external access to the corporate network as well as Windows desktop and network logon. |
| • | The Enterprise Edition is the most comprehensive solution, offering: |
| • | RADIUS for remote access to the corporate network, |
| • | Web filter support for access to in-house applications (OWA, CWI), |
| • | Simple Object Access Protocol (“SOAP”) for protection of Internet based business applications (e.g. portals, extranet, e-commerce websites, partner services, etc.), and |
| • | Licenses for up to seven servers. |
The Enterprise Edition is the perfect solution for SMBs that want to secure more than remote access by using the same DIGIPASS device to secure additional applications at little to no extra cost. It also addresses the need of large enterprises to set up a pool of replication servers to share the authentication load and assure high-availability, especially when securing an increased number of customers and partners who use web-hosted applications.
aXs GUARD Product Line
We offer two types of aXs GUARD appliances: aXs GUARD Identifier and aXs GUARD Gatekeeper.
aXs GUARD Identifier
aXs GUARD Identifier is a standalone authentication solution that offers strong two-factor authentication for remote access to a corporate network or to web-based in-house business applications. It comes in a standard 19 inch rack with a mountable “slim fit” design. The appliance verifies DIGIPASS/IDENTIKEY authentication requests from RADIUS clients and web filters and can easily be integrated with any authentication server. It features a web based administration interface as well as an auditing and reporting console.
9
Table of Contents
aXs GUARD Gatekeeper
aXs GUARD Gatekeeper consists of a range of dedicated appliances that brings strong user authentication and secure Internet communications to the enterprise through a choice of multiple software modules. aXs GUARD Gatekeeper integrates DIGIPASS to provide secure two factor user authentication. It is a standalone modular communications solution providing intrusion, website and virus protection; remote connection through VPNs and a reporting and monitoring console, among other things.
DIGIPASS Product Line
Our DIGIPASS product line, which exists as a family of software and hardware client authentication products and services, provides a flexible and affordable means of authenticating users to any network, including the Internet.
Security can be broken into three factors:
| • | What the user has (the DIGIPASS itself, in either hardware or software version); |
| • | What the user knows (the PIN code to activate the DIGIPASS); and |
| • | Who the user is (biometrics). |
The DIGIPASS family is currently based on the first two factors. Using the DIGIPASS system, in order to enter a remote system or to digitally sign data, the user needs a:
| • | Client authentication device, hardware DIGIPASS or DIGIPASS software downloaded onto an existing device. Without physical possession of the client authentication device the user will not be able to log on to the system; and |
| • | PIN code for the DIGIPASS; if the user does not know the appropriate code, he or she will not be able to use the applications stored inside. |
Both factors help ensure that a natural person is authenticating (or signing), instead of a computer or another device. These factors also enable very high portability for security anytime and anywhere.
DIGIPASSES calculate dynamic signatures and passwords, also known as one-time passwords, to authenticate users on a computer network and for a variety of other applications. There are over 50 models of the DIGIPASS, each of which has its own distinct characteristics depending on the platform that it uses and the functions it performs. However, the DIGIPASS family is designed to work together and customers can switch their users’ devices without requiring any changes to the customers’ existing infrastructure. In addition, these devices can be used to calculate digital signatures, also known as electronic signatures or message authentication codes, to protect electronic transactions and the integrity of the contents of such transactions.
DIGIPASS technology is designed to operate on non-VASCO platforms such as a desktop PC or laptop. DIGIPASS technology is also available for personal digital assistants (PDA), mobile phones and smart cards. For users of mobile phones, the virtual DIGIPASS generates one-time passwords that are sent to the mobile telephone user by SMS (Short Messaging System).
Other technologies such as paper based authentication (TAN lists) and PKI-enabled products are successfully created in the DIGIPASS family, always based on the same back-end VACMAN core technology.
DIGIPASS technology also combines the benefits of traditional password authenticators (authentication and digital signatures) with smart card readers. Together, they bring portability to smart cards and allow secure time-based algorithms.
10
Table of Contents
The DIGIPASS technology is also available in a web browser based version. DIGIPASS for Web is the ideal product to replace a password-based security or paper-based authentication system with a security system using strong authentication, to achieve a higher security level. DIGIPASS for Web supports user authentication, transaction signing and document signing. No software installation is required on the end-user’s PC.
DIGIPASS as a Service (DPS)
In October of 2010, we launched our DPS security platform to the market. Our initial DPS offering was directed at providing strong authentication for B2B and B2E applications. B2B applications are applications between two organizations that have an on-going relationship of some type. An example could be a manufacturer that has a web site through which a customer regularly purchases its products. VASCO’s DPS platform could be used to strongly authenticate the purchaser to prevent fraudulent activities. B2E applications are applications which have been outsourced by an organization. These could be sales reporting and forecasting applications, payroll and 401-(k) plan administration applications, human resource applications, etc. that are operated in the cloud. VASCO’s DPS platform could be used to strongly authenticate the employee accessing these applications or sites.
We are planning to launch a DPS offering that will be directed at B2C in 2012. These applications are consumer-facing applications. End users will be able to get secure access to, among other things, their private email accounts, their personal photos, their frequent flyer information and their social networking pages, as well as buy goods, order tickets, and play their favorite e-games securely on the Internet. Our goal is to have the user securely access multiple consumer applications with only one DIGIPASS. We believe that with this approach, we bring best-of-breed authentication into the reach of almost every online application.
In 2012, we will focus on activating the millions of end users that have already a dormant DIGIPASS in their possession. We believe that this bottom up approach, as described above, will be very successful. We plan to put the initiative for better security in the hands of the consumers and the citizens and expect that they will drive demand for our strong authentication products and services.
The combination of our core business line and DIGIPASS as a Service brings virtually every online application into VASCO’s reach. While revenues generated from DPS to date have been minimal, we believe DPS has the potential for significant future growth as it will make two-factor authentication more affordable and readily available to users and applications markets. We believe that this combination provides VASCO with a unique position in the market, giving us the opportunity to aim at every web application owner and offer their end users convenience and security.
11
Table of Contents
DIGIPASS at Work
Our core authentication product, VACMAN, supports all existing authentication technologies, products and services on one unique platform. This allows us to go to market with a very flexible, “full option” authentication offering. Our customers can choose which type of client authentication product they offer to their different end user segments.
Currently, our products are used in a wide variety of applications, the largest of which is banking. Banking applications include:
| • | Corporate banking through direct dial-up, as well as over the Internet, and |
| • | Retail banking to secure transactions made through the use of a dial-up connection with a personal computer, the traditional phone system, the Internet, wireless phones and other communication devices such as personal digital assistants. |
Another significant application for our products is to secure access to corporate networks for home-based, traveling and other remote users. Hardware and software DIGIPASSES are increasingly being used in a variety of e-commerce applications where the user is part of a pre-defined user group. Finally, VASCO’s product lines are breaking through in a number of new, end-user-facing verticals, such as e-gaming. We intend to expand the use of the DIGIPASS to other groups of users and applications, including electronic commerce transactions directed at the general public.
12
Table of Contents
Intellectual Property and Proprietary Rights and Licenses
We rely on a combination of patent, copyright, trademark and trade secret laws, as well as employee and third-party non-disclosure agreements to protect our proprietary rights. In particular, we hold several patents in the U.S. and in other countries, which cover multiple aspects of our technology. These patents expire between 2014 and 2027. We do not believe that we have any patents that will expire in 2012 that will affect business, profitability or increase competition. In addition to the issued patents, we also have several patents pending in the U.S., Europe and other countries. The majority of our issued and pending patents cover our DIGIPASS family. We believe these patents to be valuable property rights and we rely on the strength of our patents and on trade secret law to protect our intellectual property rights. To the extent that we believe our patents are being infringed upon, we intend to assert vigorously our patent protection rights, including but not limited to, pursuing all available legal remedies.
Research and Development
Our research and development efforts historically have been, and will continue to be, concentrated on product enhancement, new technology development and related new product introductions. We employ a team of full-time engineers and, from time to time, also engage independent engineering firms to conduct non-strategic research and development efforts on our behalf. We recorded $18.6, $13.6, and $11.6 million for fiscal years ended December 31, 2011, 2010, and 2009, respectively, on company-sponsored research and development.
Production
Our security hardware DIGIPASSES are manufactured by third party manufacturers pursuant to purchase orders that we issue. Our hardware DIGIPASSES are made primarily from commercially available electronic components that are purchased globally. Our software products, including software versions of our DIGIPASSES are produced in-house.
Hardware DIGIPASSES utilize commercially available programmable microprocessors, or chips. We use a limited number of microprocessors, made by Samsung, for the various hardware products we produce. The Samsung microprocessors are purchased from Samsung Semiconductor in Germany. The microprocessors are the only components of our security authenticators that are not commodity items readily available on the open market.
Orders of microprocessors generally require a lead-time of 12-16 weeks. We attempt to maintain a sufficient inventory of all parts to handle short-term increases in orders. Large orders that would significantly deplete our inventory are typically required to be placed with more than 12 weeks of lead-time, allowing us to make appropriate arrangements with our suppliers.
We purchase the microprocessors and arrange for shipment to third parties for assembly and testing in accordance with our design specifications. Our DIGIPASS products are assembled by one of three independent companies with headquarters in Hong Kong and production facilities in China. Purchases from these companies are made on a volume purchase order basis. These companies commit to very high production standards, and as a result, they also have major production contracts with Japanese hi-tech companies. Equipment designed to test product at the point of assembly is supplied by us and periodic visits are made by our personnel for purposes of quality assurance, assembly process review and supplier relations.
Competition
The market for computer and network security solutions is very competitive and, like most technology-driven markets, is subject to rapid change and constantly evolving products and services. Our main competitor is RSA Security, a subsidiary of EMC Corporation. Additional direct competitors include Gemalto and Kobil Systems. There are many other companies, such as SafeNet, Symantec and Entrust that offer authentication
13
Table of Contents
hardware, software and services that range from simple locking mechanisms to sophisticated encryption technologies. We believe that competition in this market is likely to intensify as a result of increasing demand for security products. Visibility of global competitors and their planned actions has diminished over the last several years due to the fact that some of our competitors have been acquired by larger corporations (e.g., EMC’s acquisition of RSA in 2006) or private equity firms (e.g., SafeNet, which was acquired by Vector Capital in 2007, and Entrust, which was acquired by Thoma Bravo, LLC in 2009).
We believe that the principal competitive factors affecting the market for computer and network security products include the strength and effectiveness of the solution, technical features, ease of use, quality/reliability, customer service and support, name recognition, customer base, distribution channels and the total cost of ownership of the authentication solution. Although we believe that our products currently compete favorably with respect to such factors, other than name recognition in certain markets, there can be no assurance that we can maintain our competitive position against current and potential competitors, especially those with significantly greater financial, marketing, service, support, technical and other competitive resources.
Some of our present and potential competitors have significantly greater financial, technical, marketing, purchasing and other resources than we do, and as a result, may be able to respond more quickly to new or emerging technologies and changes in customer requirements, or to devote greater resources to the development, promotion and sale of products, or to deliver competitive products at a lower end-user price. Current and potential competitors have established or may establish cooperative relationships among themselves or with third parties to increase the ability of their products to address the needs of our prospective customers. It is possible that new competitors or alliances may emerge and rapidly acquire significant market share. Accordingly, we have forged, and will continue to forge, our own partnerships to offer a broader range of products and capabilities to the market.
Our products are designed to allow authorized users access to a computing environment, in some cases using patented technology as a replacement for the static password. Although certain of our security token technologies are patented, there are other organizations that offer token-type password generators incorporating challenge-response or response-only approaches that employ different technological solutions and compete with us for market share.
Sales and Marketing
Our security solutions are sold through our direct sales force, as well as through approximately 77 distributors, their reseller networks and systems integrators. A sales staff of 75 coordinates our sales activity through both our sales channels and our strategic partners’ sales channels and makes direct sales calls either alone or with sales personnel of vendors of computer systems. Our sales staff also provides product education seminars to sales and technical personnel of vendors and distributors with whom we have working relationships and to potential end-users of our products.
VASCO secures and trains its channel. Over 1,000 staff members of our channel partners have become VASCO certified engineers.
Part of our expanded selling effort includes approaching our existing strategic partners to find additional applications for our security products. In addition, our marketing plan calls for the identification of new business opportunities that may require enhanced security over the transmission of electronic data or transactions where we do not currently market our products. Our efforts also include the preparation and dissemination of white papers prepared by our support engineers that explain how we believe our security products can add value or otherwise be beneficial.
14
Table of Contents
Customers and Markets
Customers for our products include some of the world’s most recognized names: HSBC, Rabobank Nederland, BNP-Paribas Fortis, and Blizzard Entertainment. In 2011 and 2010, we announced numerous new customers around the world including, but not limited to VTB 24 (Russia), SEB (Sweden), STB (Tunisia), BetClic (Malta), OHFA (U.S.A.), Crédit Agricole (Belgium), Virginia Heritage Bank (U.S.), PartyGaming (Gibraltar), Konami Digital Entertainment Co. Ltd. (Japan), Caixa Geral de Depositos (France), Indiana University (U.S.), University of Colorado (U.S.), Volunteer Corporate Credit Union (U.S.), and Adapti (Belgium).
Our top 10 customers contributed 47%, 37%, and 34%, in 2011, 2010, and 2009, respectively, of total worldwide revenue. In 2011 and 2010, HSBC contributed approximately 17% and 11% of our worldwide revenue, respectively. In 2009, no single customer accounted for more than 10% of our revenue.
A significant portion of our sales is denominated in foreign currencies and changes in exchange rates could impact results of operations. To minimize exposure to risks associated with fluctuations in currency exchange rates, we attempt to denominate an amount of billings in a currency such that it would provide a hedge against operating expenses being incurred in that currency. For additional information regarding how currency fluctuations can affect our business, please refer to “Management’s Discussion and Analysis of Financial Condition and Results of Operations” and “Quantitative and Qualitative Disclosures about Market Risk.”
We also experience seasonality in our business. Historically, these seasonal trends are most notable in the summer months, particularly in Europe, when many businesses defer purchase decisions; however, given the relatively small size of our business, the timing of any one or more large orders may temper or offset this seasonality.
We organize our sales group and report our results in two vertical markets:
| • | Banking and Financial Institutions: Our traditional stronghold where we believe that there are substantial opportunities for future growth. |
| • | Enterprise and Application Security: Our second market that has grown into a robust source of revenue and includes: |
| - | Various corporations for network and remote access: We have enjoyed growing success in this market and have developed new products that we believe will allow us to compete more effectively for both SME (small and medium enterprises) as well as large corporations. |
| - | Other application-specific markets: Our products are being used in more than 50 different applications and we believe that we will be able to identify and leverage our knowledge with those applications to increase our penetration in the more promising markets. |
| - | E-commerce: Both business-to-business and business-to-consumer e-commerce are becoming ever more important for us. |
| - | E-government: Our revenue in this market is still small, but we are ready to take advantage of the market’s evolution. |
Our channel partners are critical to our success in the Enterprise and Application Security markets. We serve this market exclusively via our two-tier indirect sales channel. We train employees of our resellers and distributors on-site and in our offices. In addition, we have developed online video training software that allows us to train people worldwide, resulting in cost and time benefits.
We invest in and support our channel with marketing and public relations actions. Distributors and resellers get the tools they need to be successful, such as campaigns, case studies, marketing funds and more. We expect our Enterprise and Application Security market to become even more successful in the future.
15
Table of Contents
Backlog
Our backlog at December 31, 2011 was approximately $33 million compared to $56 million at December 31, 2010. We anticipate that substantially all of the backlog at the end of 2011 will be shipped in 2012. We do not believe that the specific amount of backlog at any point in time is indicative of the trends in our markets or the expected results of our business. Given the relatively small size of our business and the large size of potential orders, the backlog number can change significantly with the receipt of a new order or modification of an existing order, for example, shipment timing.
Financial Information Relating to Foreign and Domestic Operations
For financial information regarding VASCO, see our Consolidated Financial Statements and the related Notes, which are included in this Annual Report on Form 10-K. We have a single reportable segment for all our products and operations. See Note 12 in the Notes to Consolidated Financial Statements for a breakdown of revenue and long-lived assets between U.S. and foreign operations.
Employees
As of December 31, 2011, we had 358 total employees, which included 339 full-time employees. Of the total employees, 34 were located in the U.S., 274 in EMEA (Europe, the Middle East and Africa), 14 in the Asia Pacific Rim countries and 36 in other countries, including Australia, Latin America, India and Central Asia. Of the total employees, 167 were involved in sales, marketing and customer support, 136 in research and development and 55 in general and administration.
RISK FACTORS
You should carefully consider the following risk factors, which we consider the most significant, as well as other information contained in this Annual Report on Form 10-K. In addition, there are a number of less significant and other general risk factors that could affect our future results. If any of the events described in the risk factors were to occur, our business, financial condition or operating results could be materially and adversely affected. We have grouped our Risk Factors under captions that we believe describe various categories of potential risk. For the reader’s convenience, we have not duplicated risk factors that could be considered to be included in more than one category.
Risks Related to Our Business
The worldwide recession and European sovereign debt crisis may further impact our business.
Our business is subject to economic conditions that may fluctuate in the major markets in which we operate. Factors that could cause economic conditions to fluctuate include, without limitation, recession, inflation, higher interest borrowing rates, higher levels of unemployment, higher consumer debt levels, general weakness in retail or commercial markets and changes in consumer or business purchasing power or preferences.
The current turmoil in the sovereign debt markets as a result of the European debt crisis has resulted in general market uncertainty and in worsening economic conditions, particularly in Europe. If global economic and financial market conditions remain uncertain and/or weak for an extended period of time, any of the following factors, among others, could have a material adverse effect on our financial condition and results of operations:
| • | slower consumer or business spending may result in reduced demand for our products, reduced orders from customers for our products, order cancellations, lower revenues, increased inventories, and lower gross margins; |
16
Table of Contents
| • | continued volatility in the global markets and fluctuations in exchange rates for foreign currencies and contracts or purchase orders in foreign currencies could negatively impact our reported financial results and condition; |
| • | continued volatility in the prices for commodities and raw materials we use in our products could have a material adverse effect on our costs, gross margins, and ultimately our profitability; |
| • | if our customers experience declining revenues, or experience difficulty obtaining financing in the capital and credit markets to purchase our products, this could result in reduced orders for our products, order cancellations, inability of customers to timely meet their payment obligations to us, extended payment terms, higher accounts receivable, reduced cash flows, greater expense associated with collection efforts and increased bad debt expense; |
| • | in the event of a contraction of our sales, dated inventory may result in a need for increased obsolescence reserves; |
| • | a severe financial difficulty experienced by our customers may cause them to become insolvent or cease business operations, which could reduce the availability of our products to consumers; and |
| • | any difficulty or inability on the part of manufacturers of our products or other participants in our supply chain in obtaining sufficient financing to purchase raw materials or to finance general working capital needs may result in delays or non-delivery of shipments of our products. |
While we believe that many of the effects of the recession and credit crisis have abated, we are unable to predict potential future economic conditions, disruptions in the sovereign debt markets or other financial markets, the Euro Monetary Union or the European Union, or the effect of any such disruption or disruptions on our business and results of operations, but the consequences may be materially adverse. We believe that our business in the Banking market in Europe would be impacted most directly by any such disruption and that the consequences may be materially adverse, as approximately 66% of our consolidated revenues originated in the EMEA region in 2011.
The current worldwide economic conditions may affect our liquidity and capital resources.
While we believe that our financial resources and current borrowing arrangements are adequate to meet our operating needs, we anticipate that the difficult current economic conditions that exist on a worldwide basis today may require us to modify our business plans. Disruptions in the sovereign debt markets or other financial markets, the Euro Monetary Union or the European Union, could materially adversely affect our liquidity and capital resources and expose us to additional currency fluctuation risk.
Furthermore, in the current economic environment there is a risk that customers may delay their orders until the economic conditions and risks of sovereign debt default stabilize or improve further. If a significant number of orders are delayed for an indefinite period of time, our revenue and cash receipts may not be sufficient to meet the operating needs of the business. If this is the case, we may need to significantly reduce our workforce, sell certain of our assets, enter into strategic relationships or business combinations, discontinue some or all of our operations, or take other similar restructuring actions. While we expect that these actions would result in a reduction of recurring costs, they also may result in a reduction of recurring revenue and cash receipts. It is also likely that we would incur substantial non-recurring costs to implement one or more of these restructuring actions.
We have a long operating history, but only a small accumulated profit.
Although we have reported net income of $18.1 million, $10.8 million, and $11.9 million for the years ended December 31, 2011, 2010, and 2009, respectively, our retained earnings were only $65.7 million at December 31, 2011. Over our 20 year operating history, we have operated at a loss for many of those years. In the current uncertain economic environment, it may be difficult for us to sustain our recent levels of profitability.
17
Table of Contents
We derive revenue from a limited number of products and do not have a broadly-diversified product base.
Substantially all of our revenue is derived from the sale of authentication products. We also anticipate that a substantial portion of our future revenue, if any, will also be derived from these products and related services. If the sale of these products and services is impeded for any reason and we have not diversified our product offerings, our business and results of operations would be negatively impacted.
The sales cycle for our products and technology is long, and we may incur substantial expenses for sales that do not occur when anticipated.
The sales cycle for our products, which is the period of time between the identification of a potential customer and completion of the sale, is typically lengthy and subject to a number of significant risks over which we have little control. If revenue falls significantly below anticipated levels, our business would be seriously harmed.
A typical sales cycle in the Banking market is often six months or more. Larger Banking transactions may take up to 18 months or more. Purchasing decisions for our products and systems may be subject to delays due to many factors that are not within our control, such as:
| • | The time required for a prospective customer to recognize the need for our products; |
| • | The significant expense of many data security products and network systems; |
| • | Customers’ internal budgeting processes; and |
| • | Internal procedures customers may require for the approval of large purchases. |
As our operating expenses are based on anticipated revenue levels, a small fluctuation in the timing of sales can cause our operating results to vary significantly between periods.
We have a great dependence on a limited number of suppliers and the loss of their manufacturing capability could materially impact our operations.
In the event that the supply of components or finished products is interrupted or relations with any of our principal vendors is terminated, there could be a considerable delay in finding suitable replacement sources to manufacture our products at the same cost or at all. The majority of our products are manufactured by four independent vendors, a processor manufacturer headquartered in Europe and the three manufacturers of finished goods in Hong Kong. Our hardware DIGIPASSES are assembled at facilities in mainland China. The importation of these products from China exposes us to the possibility of product supply disruption and increased costs in the event of changes in the policies of the Chinese government, political unrest or unstable economic conditions in China or developments in the United States that are adverse to trade, including enactment of protectionist legislation.
We have a significant dependence on major customers and losing any of these customers could result in a significant loss in revenue.
If we don’t find other customers who generate significant future revenue, the unforeseen loss of one or more of our major customers, or the inability to maintain reasonable profit margins on sales to any of these customers, would have a material adverse effect on our results of operations and financial condition.
Our customers have the ability to reschedule their deliveries.
Prior to 2009, a major portion of our business was scheduled by our customers under purchase orders which called for multiple shipments over the course of 12 months. Typically, these were firm orders with specific requests for shipments on specified dates. Historically, a customer may have requested that a shipment be accelerated and delivered earlier than scheduled or, conversely, delayed and delivered later than originally scheduled, or in rare cases, cancelled. In 2009 and in 2010, we experienced instances in which customers delayed
18
Table of Contents
delivery shipments or placed smaller orders covering shorter periods of time. In 2011, our customers returned to order patterns more similar to their earlier historical patterns. However, in the future, they may delay shipments or order small quantities covering shorter periods of time. Our results may differ substantially from period to period based on orders delivered in that period.
Our success depends on establishing and maintaining strategic relationships with other companies to develop, market and distribute our technology and products and, in some cases, to incorporate our technology into their products.
Part of our business strategy is to enter into strategic alliances and other cooperative arrangements with other companies in our industry. We currently are involved in cooperative efforts with respect to the incorporation of our products into products of others, research and development efforts, marketing efforts and reseller arrangements. None of these relationships are exclusive, and some of our strategic partners also have cooperative relationships with certain of our competitors. If we are unable to enter cooperative arrangements in the future or if we lose any of our current strategic or cooperative relationships, our business could be harmed. We do not control the time and resources devoted to such activities by parties with whom we have relationships. In addition, we may not have the resources available to satisfy our commitments, which may adversely affect these relationships. These relationships may not continue, may not be commercially successful, or may require our expenditure of significant financial, personnel and administrative resources from time to time. Further, certain of our products and services compete with the products and services of our strategic partners.
We may not be able to maintain effective product distribution channels, which could result in decreased revenue.
We rely on both our direct sales force and an indirect channel distribution strategy for the sale and marketing of our products. We may be unable to attract distributors, resellers and integrators, as planned, that can market our products effectively and provide timely and cost-effective customer support and service. There is also a risk that some or all of our distributors, resellers or integrators may be acquired, may change their business models or may go out of business, any of which could have an adverse effect on our business. Further, our distributors, integrators and resellers may carry competing lines of products. The loss of important sales personnel, distributors, integrators or resellers could adversely affect us.
We depend on our key personnel for the success of our business and the loss of one or more of our key personnel could have an adverse effect on our ability to manage our business or could be negatively perceived in the capital markets.
Our success and our ability to manage our business depend, in large part, upon the efforts and continued service of our senior management team. The loss of one or more of our key personnel could have a material adverse effect on our business and operations. It could be difficult for us to find replacements for our key personnel, as competition for such personnel is intense. Further, such a loss could be negatively perceived in the capital markets, which could reduce the market value of our securities.
If we fail to continue to attract and retain qualified personnel, our business may be harmed.
Our future success depends upon our ability to continue to attract and retain highly qualified scientific, technical, sales and managerial personnel. Competition for such personnel is intense and there can be no assurance that we can attract other highly qualified personnel in the future. If we cannot retain or are unable to hire such key personnel, our business, financial condition and results of operations could be significantly adversely affected.
Changes in our effective tax rate may have an adverse effect on our results of operations.
Our future effective tax rates may be adversely affected by a number of factors including the distribution of income among the various countries in which we operate, changes in the valuation of our deferred tax assets, increases in expenses not deductible for tax purposes, including the impairment of goodwill in
19
Table of Contents
connection with acquisitions, changes in share-based compensation expense, and changes in tax laws or the interpretation of such tax laws and changes in generally accepted accounting principles. Any significant increase in our future effective tax rates could adversely impact net income for future periods.
Our worldwide income tax provisions and other tax accruals may be insufficient if any taxing authorities assume taxing positions that are contrary to our positions.
Significant judgment is required in determining our provision for income taxes and other taxes such as sales and VAT taxes. There are many transactions for which the ultimate tax outcome is uncertain. Some of these uncertainties arise as a consequence of intercompany agreements to purchase intellectual properties, allocate revenue and allocate costs, each of which could ultimately result in changes once the arrangements are reviewed by taxing authorities. Although we believe that our approach to determining the amount of such arrangements is reasonable, we can not be certain that the final tax authority review of these matters will not differ materially from what is reflected in our historical income tax provisions and other tax accruals. Such differences could have a material effect on our income tax provisions or benefits, or other tax accruals, in the period in which such determination is made, and consequently, on our results of operations for such period.
Any acquisitions we make could disrupt our business and harm our financial condition.
We may make investments in complementary companies, products or technologies. Should we do so, our failure to successfully manage future acquisitions could seriously harm our operating results. In the event of any future purchases, we will face additional financial and operational risks, including:
| • | Difficulty in assimilating the operations, technology and personnel of acquired companies; |
| • | Disruption in our business because of the allocation of resources to consummate these transactions and the diversion of management’s attention from our existing business; |
| • | Difficulty in retaining key technical and managerial personnel from acquired companies; |
| • | Dilution of our stockholders, if we issue equity to fund these transactions; |
| • | Assumption of operating losses, increased expenses and liabilities; and |
| • | Our relationships with existing employees, customers and business partners may be weakened or terminated as a result of these transactions. |
Reported revenue may fluctuate widely due to the interpretation or application of accounting rules.
Our sales arrangements often include multiple elements, including hardware, software and maintenance. The accounting rules for such arrangements are complex and subject to change from time to time. Small changes in circumstances could cause wide deviations in the timing of reported revenue.
Indemnity provisions in various agreements potentially expose us to substantial liability for intellectual property infringement and other losses.
Our agreements with customers, solution partners and channel partners include indemnification provisions under which we agree to indemnify them for losses suffered or incurred as a result of claims of intellectual property infringement and, in some cases, for damages caused by us to property or persons. Large indemnity payments could harm our business, operating results and financial condition.
Risks Related to the Market
We face significant competition and if we lose or fail to gain market share our financial results will suffer.
The market for computer and network security products and services is highly competitive. Our competitors include organizations that provide computer and network security products based upon approaches similar to and different from those that we employ. Many of our competitors have significantly greater financial,
20
Table of Contents
marketing, technical and other competitive resources than we do. As a result, our competitors may be able to adapt more quickly to new or emerging technologies and changes in customer requirements, or to devote greater resources to the promotion and sale of their products.
A decrease of average selling prices for our products and services could adversely affect our business.
The average selling prices for our solution offerings may decline as a result of competitive pricing pressures or a change in our mix of products, software and services. In addition, competition continues to increase in the market segments in which we participate and we expect competition to further increase in the future, thereby leading to increased pricing pressures. Furthermore, we anticipate that the average selling prices and gross profits for our products will decrease over product life cycles. To sell our products and services at higher prices, we must continue to develop and introduce new products and services that incorporate new technologies or increased functionality. If we experience pricing pressures or fail to develop new products, our revenue and gross margins could decline, which could harm our business, financial condition and results of operations.
We may need additional capital in the future and our failure to obtain capital would interfere with our growth strategy.
Our ability to obtain financing will depend on a number of factors, including market conditions, our operating performance and investor interest. These factors may make the timing, amount, terms and conditions of any financing unattractive. They may also result in our incurring additional indebtedness or accepting stockholder dilution. If adequate funds are not available or are not available on acceptable terms, we may have to forego strategic acquisitions or investments, defer our product development activities, or delay the introduction of new products.
We experience variations in quarterly operating results and sales are subject to seasonality, both of which may result in a volatile stock price.
In the future, as in the past, our quarterly operating results may vary significantly, resulting in a volatile stock price. Factors affecting our operating results include:
| • | The level of competition; |
| • | The size, timing, cancellation or rescheduling of significant orders; |
| • | New product announcements or introductions by competitors; |
| • | Technological changes in the market for data security products including the adoption of new technologies and standards; |
| • | Changes in pricing by competitors; |
| • | Our ability to develop, introduce and market new products and product enhancements on a timely basis, if at all; |
| • | Component costs and availability; |
| • | Our success in expanding our sales and marketing programs; |
| • | Market acceptance of new products and product enhancements; |
| • | Changes in foreign currency exchange rates; and |
| • | General economic conditions in the countries in which we operate. |
We also experience seasonality in all markets. These seasonal trends are most notable in the summer months, particularly in Europe, when many businesses defer purchase decisions.
21
Table of Contents
Our stock price may be volatile for reasons other than variations in our quarterly operating results.
The market price of our common stock may fluctuate significantly in response to factors, some of which are beyond our control, including the following:
| • | Actual or anticipated fluctuations in our quarterly or annual operating results; |
| • | Differences between actual operating results and results estimated by analysts that follow our stock and provide estimates of our results to the market; |
| • | Differences between guidance relative to financial results, if given, and actual results; |
| • | Changes in market valuations of other technology companies; |
| • | Announcements by us or our competitors of significant technical innovations, contracts, acquisitions, strategic partnerships, joint ventures or capital commitments; |
| • | Additions or departures of key personnel; |
| • | Future sales of common stock; |
| • | Trading volume fluctuations; and |
| • | Reactions by investors to uncertainties in the world economy and financial markets. |
A small group of persons control a substantial amount of our common stock and could delay or prevent a change of control.
Our Board of Directors, our officers and their immediate families and related entities beneficially own approximately 25%, with Mr. T. Kendall Hunt beneficially owning approximately 24%, of the outstanding shares of our common stock. As the Chairman of the Board of Directors, Chief Executive Officer and our largest stockholder, Mr. Hunt may exercise substantial control over our future direction and operation and such concentration of control may have the effect of discouraging, delaying or preventing a change in control and may also have an adverse effect on the market price of our common stock.
Certain provisions of our charter and of Delaware law make a takeover of our company more difficult.
Our corporate charter and Delaware law contain provisions, such as a class of authorized but unissued preferred stock which may be issued by our board without stockholder approval that might enable our management to resist a takeover of our company. Delaware law also limits business combinations with interested stockholders. These provisions might discourage, delay or prevent a change in control or a change in our management. These provisions could also discourage proxy contests, and make it more difficult for you and other stockholders to elect directors and take other corporate actions. The existence of these provisions could limit the price that investors might be willing to pay in the future for shares of our common stock.
Future issuances of blank check preferred stock may reduce voting power of common stock and may have anti-takeover effects that could prevent a change in control.
Our corporate charter authorizes the issuance of up to 500,000 shares of preferred stock with such designations, rights, powers and preferences as may be determined from time to time by our Board of Directors, including such dividend, liquidation, conversion, voting or other rights, powers and preferences as may be determined from time to time by the Board of Directors without further stockholder approval. The issuance of preferred stock could adversely affect the voting power or other rights of the holders of common stock. In addition, the authorized shares of preferred stock and common stock could be utilized, under certain circumstances, as a method of discouraging, delaying or preventing a change in control.
22
Table of Contents
Risks Related to Technology and Intellectual Property
Technological changes occur rapidly in our industry and our development of new products is critical to maintain our revenue.
The introduction by our competitors of products embodying new technologies and the emergence of new industry standards could render our existing products obsolete and unmarketable. Our future revenue growth and operating profit will depend in part upon our ability to enhance our current products and develop innovative products to distinguish ourselves from the competition and to meet customers’ changing needs in the data security industry. We cannot assure you that security-related product developments and technology innovations by others will not adversely affect our competitive position or that we will be able to successfully anticipate or adapt to changing technology, industry standards or customer requirements on a timely basis.
Our business could be negatively impacted by cybersecurity incidents and other disruptions.
Our use of technology is increasing and is critical in three primary areas of our business:
| 1. | Software and information systems that we use to help us run our business more efficiently and cost effectively; |
| 2. | The products we have traditionally sold and continue to sell to our customers for integration into their software applications contain technology that incorporates the use of secret numbers and encryption technology; and |
| 3. | New products and services that we are introducing to the market, such as DPS, are focused on processing information through our servers (or in the cloud from our customers’ perspective). |
A cyber incident in any of these areas of our business could disrupt our ability to take orders or deliver product to our customers, cause us to suffer significant monetary and other losses and significant reputational harm, or substantially impair our ability to grow the business. We expect that there are likely to be hacking attempts intended to impede the performance of our products, disrupt our services and harm our reputation as a company, as the processes used by computer hackers to access or sabotage technology products, services and networks are rapidly evolving in sophistication.
In July 2011, we experienced a cyber incident related to DigiNotar B.V. Please see Part I. Item 1 – Business – General, Part II. Item 7 – Management’s Discussion and Analysis of Financial Condition and Results of Operations, and Note 3 to our consolidated financial statements for a description of the hacking incident at DigiNotar B.V., the termination of DigiNotar B.V’s registration as a certification service provider and DigiNotar B.V.’s bankruptcy. Please see Part I. Item 3 – Legal Proceedings for a description of legal proceedings related to the cybersecurity incident at DigiNotar B.V. Our losses from discontinued operations resulting from these events may increase as a result of unanticipated costs associated with DigiNotar B.V.’s bankruptcy, potential claims that may arise in connection with the hacking incidents, further impairment of our investment in DigiNotar, the time frame in which the impairment costs will be incurred, our inability to recover amounts held in escrow relating to our acquisition of DigiNotar, our inability to offset amounts that may be owed to DigiNotar B.V. by other VASCO affiliates against amounts owed to VASCO affiliates by DigiNotar B.V., and our inability to effectively integrate certain intellectual property acquired from DigiNotar into our operations.
Our products contain third-party, open-source software and failure to comply with the terms of the underlying open-source software licenses could restrict our ability to sell our products or otherwise result in claims of infringement.
Our products are distributed with software programs licensed to us by third-party authors under “open-source” licenses, which may include the GNU General Public License, the GNU Lesser Public License, the BSD License and the Apache License. These open-source software programs include, without limitation, Linux, Apache, Openssl, IPTables, Tcpdump, Postfix, Cyrus, Perl, Squid and Snort. These third-party, open-source programs are typically licensed to us for no fee and the underlying license agreements generally require us to
23
Table of Contents
make available to users the source code for such programs, as well as the source code for any modifications or derivative works we create based on these third-party, open-source software programs.
We do not believe that we have created any modifications or derivative works to, an extended version of, or works based on, any open-source software programs referenced above. We include instructions to users on how to obtain copies of the relevant open-source code and licenses.
We do not provide end users a copy of the source code to our proprietary software because we believe that the manner in which our proprietary software is aligned or communicates with the relevant open-source programs does not create a modification, derivative work or extended version of, or a work based on, that open-source program requiring the distribution of our proprietary source code.
Our ability to commercialize our products by incorporating third-party, open-source software may be restricted because, among other reasons:
| • | the terms of open-source license agreements are unclear and subject to varying interpretations, which could result in unforeseen obligations regarding our proprietary products or claims of infringement; |
| • | it may be difficult to determine the developers of open-source software and whether such licensed software infringes another party’s intellectual property rights; |
| • | competitors will have greater access to information by obtaining these open source products, which may help them develop competitive products; and |
| • | open-source software potentially increases customer support costs because licensees can modify the software and potentially introduce errors. |
We must continue to attract and retain highly skilled technical personnel for our research and development department.
The market for highly skilled technicians in Europe, Asia, Australia and the United States is highly competitive. If we fail to attract, train, assimilate and retain qualified technical personnel for our research and development department, we will experience delays in introductions of new or modified products, loss of clients and market share and a reduction in revenue.
We cannot be certain that our research and development activities will be successful.
While management is committed to enhancing our current product offerings and introducing new products, we cannot be certain that our research and development activities will be successful. Furthermore, we may not have sufficient financial resources to identify and develop new technologies and bring new products to market in a timely and cost effective manner, and we cannot ensure that any such products will be commercially successful if and when they are introduced.
We depend significantly upon our proprietary technology and intellectual property and the failure to protect our proprietary rights could require us to redesign our products or require us to enter into royalty or licensing agreements, any of which could reduce revenue and increase our operating costs.
We currently rely on a combination of patent, copyright and trademark laws, trade secrets, confidentiality agreements and contractual provisions to protect our proprietary rights. We seek to protect our software, documentation and other written materials under trade secret and copyright laws, which afford only limited protection, and generally enter into confidentiality and nondisclosure agreements with our employees and with key vendors and suppliers.
There has been substantial litigation in the technology industry regarding intellectual property rights, and we may have to litigate to protect our proprietary technology.
24
Table of Contents
We expect that companies in the computer and information security market will increasingly be subject to infringement claims as the number of products and competitors increases. Any such claims or litigation may be time-consuming and costly, cause product shipment delays, require us to redesign our products or require us to enter into royalty or licensing agreements, harm our reputation, cause our customers to use our competitors’ products or divert the efforts and attention of our management and technical personnel from normal business operations, any of which could reduce revenue and increase our operating costs.
Our patents may not provide us with competitive advantages.
We hold several patents in the United States and in other countries, which cover multiple aspects of our technology. The majority of our patents cover the DIGIPASS product line. These patents expire between 2014 and 2027. In addition to the issued patents, we also have several patents pending in the United States, Europe and other countries. There can be no assurance that we will continue to develop proprietary products or technologies that are patentable, that any issued patent will provide us with any competitive advantages or will not be challenged by third parties, or that patents of others will not hinder our competitive advantage. Although certain of our security token technologies are patented, there are other organizations that offer token-type password generators incorporating challenge-response or response-only approaches that employ different technological solutions and compete with us for market share.
We are subject to warranty and product liability risks.
A malfunction of or design defect in our products which results in a breach of a customer’s data security could result in tort or warranty claims against us. We seek to reduce the risk of these losses by attempting to negotiate warranty disclaimers and liability limitation clauses in our sales agreements. However, these measures may ultimately prove ineffective in limiting our liability for damages. We do not presently maintain product liability insurance for these types of claims.
In addition to any monetary liability for the failure of our products, an actual or perceived breach of network or data security at one of our customers could adversely affect the market’s perception of us and our products, and could have an adverse effect on our reputation and the demand for our products. Similarly, an actual or perceived breach of network or data security within our own systems could damage our reputation and have an adverse effect on the demand for our products.
There is significant government regulation of technology exports and to the extent we cannot meet the requirements of the regulations we may be prohibited from exporting some of our products, which could negatively impact our revenue.
Our international sales and operations are subject to risks such as the imposition of government controls, new or changed export license requirements, restrictions on the export of critical technology, trade restrictions and changes in tariffs. If we become unable to obtain foreign regulatory approvals on a timely basis our business in those countries would no longer exist and our revenue would decrease dramatically. Certain of our products are subject to export controls under U.S. law. The list of products and countries for which export approval is required, and the regulatory policies with respect thereto may be revised from time to time and our inability to obtain required approvals under these regulations could materially and adversely affect our ability to make international sales.
25
Table of Contents
We employ cryptographic technology in our authentication products that uses complex mathematical formulations to establish network security systems.
Many of our products are based on cryptographic technology. With cryptographic technology, a user is given a key that is required to encrypt and decode messages. The security afforded by this technology depends on the integrity of a user’s key and in part on the application of algorithms, which are advanced mathematical factoring equations. These codes may eventually be broken or become subject to government regulation regarding their use, which would render our technology and products less effective. The occurrence of any one of the following could result in a decline in demand for our technology and products:
| • | Any significant advance in techniques for attacking cryptographic systems, including the development of an easy factoring method or faster, more powerful computers; |
| • | Publicity of the successful decoding of cryptographic messages or the misappropriation of keys; and |
| • | Increased government regulation limiting the use, scope or strength of cryptography. |
Risks Related to International Operations
We face a number of risks associated with our international operations, any or all of which could result in a disruption in our business and a decrease in our revenue.
In 2011, approximately 90% of our revenue and approximately 79% of our operating expenses were generated/incurred outside of the U.S. In 2010, approximately 91% of our revenue and approximately 82% of our operating expenses were generated/incurred outside of the U.S. A severe economic decline in any of our major foreign markets could adversely affect our results of operations and financial condition.
In addition to exposures to changes in the economic conditions of our major foreign markets, we are subject to a number of risks any or all of which could result in a disruption in our business and a decrease in our revenue. These include:
| • | Inconsistent regulations and unexpected changes in regulatory requirements; |
| • | Export controls relating to our technology; |
| • | Difficulties and costs of staffing and managing international operations; |
| • | Potentially adverse tax consequences; |
| • | Wage and price controls; |
| • | Uncertain protection for intellectual property rights; |
| • | Imposition of trade barriers; |
| • | Differing technology standards; |
| • | Uncertain demand for electronic commerce; |
| • | Linguistic and cultural differences; |
| • | Political instability; and |
| • | Social unrest. |
26
Table of Contents
We are subject to foreign exchange risks, and improper management of that risk could result in large cash losses.
Because a significant number of our principal customers are located outside the United States, we expect that international sales will continue to generate a significant portion of our total revenue. We are subject to foreign exchange risks because the majority of our costs are denominated in U.S. Dollars, whereas a significant portion of the sales and expenses of our foreign operating subsidiaries are denominated in various foreign currencies. A decrease in the value of any of these foreign currencies relative to the U.S. Dollar could affect the profitability in U.S. Dollars of our products sold in these markets. We do not currently hold forward exchange contracts to exchange foreign currencies for U.S. Dollars to offset currency rate fluctuations.
We must comply with European governmental regulations setting environmental standards.
Our activities in Europe require that we comply with European Union Directives with respect to product quality assurance standards and environmental standards. Directive 2002/95/ec of the European Parliament on the Restriction of the Use of Certain Hazardous Substances in Electrical and Electronic Equipment, known as the RoHS Directive, became effective on July 1, 2006. The RoHS Directive restricts the use of certain hazardous substances, including mercury, lead, cadmium, hexavalent chromium and certain flame retardants, from being used in the construction of component parts of electrical and electronic equipment. If we fail to maintain compliance, we may be restricted from selling our products in the European Union and this could adversely affect our results of operations.
European Directive 2002/96/EC on waste, electrical and electronic equipment, known as the WEEE Directive, makes manufacturers of electrical and electronic equipment financially responsible for specified collection, recycling, treatment and disposal of past and future covered products. The WEEE Directive became effective on August 13, 2005. We may incur financial responsibility for the collection, recycling, treatment or disposal of products covered under the WEEE Directive. The WEEE Directive is also currently being reviewed and recast by the European Union. This process of review and redrafting is likely to be finalized in calendar year 2012. It is expected that the recast law will widen the scope of the WEEE Directive, which may cause us to incur further financial responsibility. Because the EU member states have not fully implemented the WEEE Directive, the nature and extent of the costs to comply and fees or penalties associated with noncompliance are unknown at this time. Costs to comply with the WEEE Directive and similar future legislation, if applicable, may also include legal and regulatory costs and insurance costs. We may also be required to take additional reserves for costs associated with compliance with these regulations.
We or our suppliers may be impacted by new regulations related to climate change.
In addition to the European environmental regulations noted above, we or our suppliers may become subject to new laws enacted with regards to climate change. In the event that new laws are enacted or current laws are modified in countries in which we or our suppliers operate, our flow of product may be impacted and/or the costs of handling the potential waste associated with our products may increase dramatically, either of which could result in a significant negative impact on our ability to operate or operate profitably.
U.S. investors may have difficulties in making claims for any breach of their rights as holders of shares because some of our assets and executives are not located in the United States.
Several of our executives and key employees are residents of foreign countries, and a substantial portion of our assets and those of some of our executives and key employees are located in foreign countries. As a result, it may not be possible for investors to effect service of process on those persons located in foreign countries, or to enforce judgments against some of our executives and key employees based upon the securities or other laws of jurisdictions in those foreign countries.
27
Table of Contents
Our business in countries with a history of corruption and transactions with foreign governments increase the risks associated with our international activities.
As we operate and sell internationally, we are subject to the U.S. Foreign Corrupt Practices Act (FCPA), and other laws that prohibit improper payments or offers of payments to foreign governments and their officials and political parties by U.S. and other business entities for the purpose of obtaining or retaining business. We have operations, deal with and make sales to governmental or quasi-governmental customers in countries known to experience corruption, particularly certain countries in the Middle East, Africa, East Asia and South America, and further expansion of our international selling efforts may involve additional regions. Our activities in these countries create the risk of unauthorized payments or offers of payments by one of our employees, consultants, sales agents or channel partners that could be in violation of various laws, including the FCPA and the U.K. Bribery Act, even though these parties are not always subject to our control. Violations of the FCPA may result in severe criminal or civil sanctions, including suspension or debarment from U.S. government contracting, and we may be subject to other liabilities, which could negatively affect our business, operating results and financial condition. Violations of the U.K. Bribery Act may result in severe criminal or civil sanctions and we may be subject to other liabilities which could negatively affect our business operating results and financial condition.
Item 1B - Unresolved Staff Comments
None.
Our corporate headquarters is located in Oakbrook Terrace, Illinois, and our U.S. sales offices are located in Marlborough, Massachusetts and San Mateo, California.
Our international headquarters is in Zurich, Switzerland. Our European operational headquarters is located in a suburb of Brussels, Belgium. We conduct sales and marketing, research and development and customer support activities from our operational headquarters. Also in Belgium are our logistics facility in Mollem, and an operations facility in Mechelen. In the Netherlands, we have two research and development facilities, one of which also houses a sales office. Additionally, we have research and development facilities in Bordeaux, France and Vienna, Austria.
We occupy two locations in Australia. In Brisbane, we have an administrative and research and development facility. Our Australian sales office is located in Sydney.
In the Asia/Pacific region we currently have sales offices in Singapore and Tokyo, Japan as well as a liaison office in Shanghai, China.
We have sales offices in Mumbai, India, Sao Paulo, Brazil, Dubai, and the U.K. and conduct sales activities through liaison offices and agents in Germany, Turkey, Russia, China, Mexico and Colombia.
All of our properties are leased and we believe that these facilities are adequate for our present growth plans.
On September 19, 2011, one of our wholly-owned subsidiaries, DigiNotar B.V., a company organized and existing in The Netherlands, filed a bankruptcy petition under Article 4 of the Dutch Bankruptcy Act in the Haarlem District Court, The Netherlands. On September 20, 2011, the court declared DigiNotar B.V. bankrupt and appointed a bankruptcy trustee and a bankruptcy judge to manage all affairs of DigiNotar B.V. through the bankruptcy process. The trustee took over management of DigiNotar B.V.’s business activities and is responsible for the administration and liquidation of DigiNotar B.V.
28
Table of Contents
On September 26, 2011, we received a Civil Investigative Demand from the Federal Trade Commission (FTC) in connection with its non-public investigation of the hacking incidents at DigiNotar B.V. The FTC has not alleged any wrongdoing on our part.
We are from time to time involved in litigation incidental to the conduct of our business. Excluding matters related to DigiNotar B.V. discussed above, we are not currently a party to any lawsuit or proceeding which, in the opinion of management, is likely to have a material adverse effect on our business, financial condition or results of operations.
Item 4 - Mine Safety Disclosures
Not applicable.
29
Table of Contents
PART II
Item 5 - Market for Registrant’s Common Equity, Related Stockholder Matters and Issuer Purchases of Equity Securities
Our common stock, par value $0.001 per share, trades on the NASDAQ Capital Market under the symbol VDSI.
The following table sets forth the range of high and low prices of our common stock on the NASDAQ Capital Market for the past two years.
| 2011 |
High | Low | ||||||
| Fourth quarter |
$ | 8.95 | $ | 4.72 | ||||
| Third quarter |
13.82 | 4.94 | ||||||
| Second quarter |
14.12 | 10.12 | ||||||
| First quarter |
14.01 | 7.33 | ||||||
| 2010 |
||||||||
| Fourth quarter |
$ | 9.00 | $ | 6.12 | ||||
| Third quarter |
6.83 | 5.76 | ||||||
| Second quarter |
8.36 | 5.82 | ||||||
| First quarter |
8.98 | 6.20 | ||||||
On March 5, 2012, there were 72 registered holders and approximately 10,900 street name holders of the company’s common stock.
We have not paid any dividends on our common stock since incorporation. The declaration and payment of dividends will be at the sole discretion of the Board of Directors and subject to certain limitations under the General Corporation Law of the State of Delaware. The timing, amount and form of dividends, if any, will depend, among other things, on the company’s results of operations, financial condition, cash requirements, plans for expansion and other factors deemed relevant by the Board of Directors. The company intends to retain any future earnings for use in its business and therefore does not anticipate paying any cash dividends in the foreseeable future.
Recent Sales of Unregistered Securities
None
Issuer Purchases of Equity Securities
None
30
Table of Contents
Stock Performance Graph
The Stock Performance Graph below compares the cumulative total return through December 31, 2011, assuming reinvestment of dividends, by an investor who invested $100.00 on December 31, 2006, in each of (i) our common stock, (ii) the Russell 2000 index, (iii) the Standard Industrial Code Index 3577 – Computer Peripheral Equipment, NEC and (iv) a comparable industry (the peer group) index selected by the company. The peer group for this purpose consists of: Aruba Networks Inc., AuthenTec, Inc., Blue Coat Systems, Inc., CommVault Systems, Inc., F5 Networks, Inc., Fortinet, Inc., Guidance Software, Inc., OPTNET Technologies, Inc. Sourcefire, Inc. and Websense, Inc. The stock price performance shown on the graph below is not necessarily indicative of future price performance.
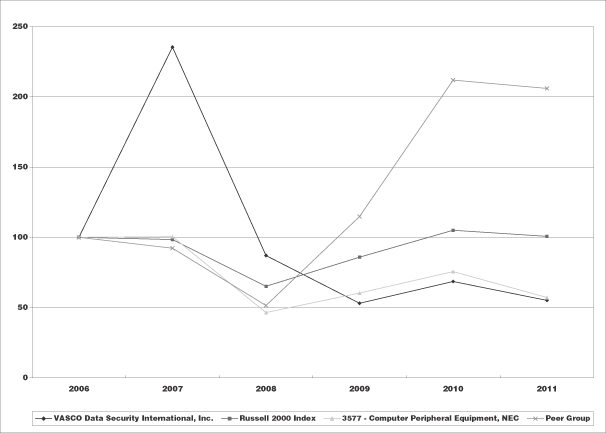
| Dec-06 | Dec-07 | Dec-08 | Dec-09 | Dec-10 | Dec-11 | |||||||||||||||||||
| VASCO Data Security International, Inc. |
100.00 | 235.61 | 87.16 | 52.98 | 68.59 | 55.00 | ||||||||||||||||||
| Russell 2000 Index |
100.00 | 98.45 | 65.18 | 85.90 | 105.16 | 100.75 | ||||||||||||||||||
| 3577—Computer Peripheral Equipment, NEC |
100.00 | 100.56 | 46.48 | 60.45 | 75.74 | 57.14 | ||||||||||||||||||
| Peer Group |
100.00 | 92.27 | 51.42 | 114.97 | 212.02 | 206.10 | ||||||||||||||||||
31
Table of Contents
Item 6 - Selected Financial Data (in thousands, except per share data)
| Year ended December 31, | ||||||||||||||||||||
| 2011 | 2010 | 2009 | 2008 | 2007 | ||||||||||||||||
| Statements of Operations Data: |
||||||||||||||||||||
| Revenue |
$ | 168,082 | $ | 107,963 | $ | 101,695 | $ | 132,977 | $ | 119,980 | ||||||||||
| Operating income from continuing operations |
24,765 | 12,390 | 12,643 | 28,137 | 30,893 | |||||||||||||||
| Net income from continuing operations |
24,251 | 10,806 | 11,862 | 24,291 | 20,963 | |||||||||||||||
| Net (loss) from discontinued operations |
(6,118 | ) | 0 | 0 | 0 | 0 | ||||||||||||||
| Net income available to common stockholders |
18,133 | 10,806 | 11,862 | 24,291 | 20,963 | |||||||||||||||
| Diluted income from continuing operations per common share |
0.63 | 0.28 | 0.31 | 0.64 | 0.55 | |||||||||||||||
| Diluted (loss) from discontinued operations per common share |
(0.16 | ) | 0.00 | 0.00 | 0.00 | 0.00 | ||||||||||||||
| Diluted income per common share |
0.47 | 0.28 | 0.31 | 0.64 | 0.55 | |||||||||||||||
| Balance Sheet Data: |
||||||||||||||||||||
| Cash and equivalents |
$ | 84,497 | $ | 85,533 | $ | 67,601 | $ | 57,714 | $ | 38,833 | ||||||||||
| Working capital |
108,590 | 96,889 | 87,632 | 75,930 | 52,438 | |||||||||||||||
| Total assets |
168,923 | 142,941 | 132,724 | 127,950 | 100,676 | |||||||||||||||
| Long term obligations |
1,956 | 683 | 1,095 | 2,694 | 2,658 | |||||||||||||||
| Total stockholders’ equity |
135,799 | 116,493 | 108,376 | 95,284 | 71,539 | |||||||||||||||
| Cash dividends declared per common share |
0 | 0 | 0 | 0 | 0 | |||||||||||||||
32
Table of Contents
Item 7 - Management’s Discussion and Analysis of Financial Condition and Results of Operations
(in thousands, except head count, ratios, time periods and percents)
Unless otherwise noted, references in this Annual Report on Form 10-K to “VASCO”, “company”, “we”, “our”, and “us” refer to VASCO Data Security International, Inc. and its subsidiaries.
Cautionary Note Regarding Forward-Looking Statements
This Annual Report on Form 10-K, including Management’s Discussion and Analysis of Financial Condition and Results of Operations and Quantitative and Qualitative Disclosures About Market Risk contains forward-looking statements within the meaning of Section 21E of the Securities Exchange Act of 1934, as amended and Section 27A of the Securities Act of 1933, as amended concerning, among other things, our expectations regarding the DigiNotar B.V. bankruptcy process, the impairment of our investment in DigiNotar, the timeframe in which the impairment costs will be incurred, our ability to recover amounts held in escrow, our ability to offset amounts that may be owed to DigiNotar B.V. by other VASCO affiliates against amounts owed to VASCO affiliates by DigiNotar B.V., and our ability to effectively integrate certain intellectual property assets acquired from DigiNotar into our operations, as well as the prospects of, and developments and business strategies for, VASCO and our operations, including the development and marketing of certain new products and services and the anticipated future growth in certain markets in which we currently market and sell our products and services or anticipate selling and marketing our products or services in the future. These forward-looking statements (1) are identified by use of terms and phrases such as “expect”, “believe”, “will”, “anticipate”, “emerging”, “intend”, “plan”, “could”, “may”, “estimate”, “should”, “objective”, “goal”, “possible”, “potential” and similar words and expressions, but such words and phrases are not the exclusive means of identifying them, and (2) are subject to risks and uncertainties and represent our present expectations or beliefs concerning future events. VASCO cautions that the forward-looking statements are qualified by important factors that could cause actual results to differ materially from those in the forward-looking statements. Factors that could cause actual results to differ materially from those contemplated above include, among others, unanticipated costs associated with DigiNotar B.V.’s bankruptcy or potential claims that may arise in connection with the hacking incidents at DigiNotar B.V. Additional risks, uncertainties and other factors have been described in greater detail in this Annual Report on Form 10-K and include, but are not limited to, (a) risks of general market conditions, including currency fluctuations and the uncertainties resulting from turmoil in world economic and financial markets, (b) risks inherent to the computer and network security industry, including rapidly changing technology, evolving industry standards, increasingly sophisticated hacking attempts, increasing numbers of patent infringement claims, changes in customer requirements, price competitive bidding, and changing government regulations, and (c) risks specific to VASCO, including, demand for our products and services, competition from more established firms and others, pressures on price levels and our historical dependence on relatively few products, certain suppliers and certain key customers. Thus, the results that we actually achieve may differ materially from any anticipated results included in, or implied by these statements. Except for our ongoing obligations to disclose material information as required by the U.S. federal securities laws, we do not have any obligations or intention to release publicly any revisions to any forward-looking statements to reflect events or circumstances in the future or to reflect the occurrence of unanticipated events.
General
The following discussion is based upon our consolidated results of operations for the years ended December 31, 2011, 2010 and 2009 (percentages in the discussion, except for returns on average net cash balances, are rounded to the closest full percentage point) and should be read in conjunction with our consolidated financial statements included elsewhere in this Annual Report on Form 10-K.
We design, develop, market and support open standards-based hardware and software security systems that manage and secure access to information assets. We also design, develop, market and support patented strong user authentication products and services for e-business and e-commerce. Our products enable secure financial transactions to be made over private enterprise networks and public networks, such as the Internet. Our
33
Table of Contents
strong user authentication is delivered via our hardware and software DIGIPASS security products (collectively “DIGIPASSES”), many of which incorporate an electronic and digital signature capability, which further protects the integrity of electronic transactions and data transmissions. Some of our DIGIPASSES are compliant with the Europay MasterCard Visa (“EMV”) standard and are compatible with MasterCard’s and VISA’s Chip Authentication Program (“CAP”). Some of our DIGIPASSES comply with the Initiative for Open Authentication (“OATH”). As evidenced by our current customer base, most of our products are purchased by companies and, depending on the business application, are distributed to either their employees or their customers. Those customers may be other businesses or, as an example in the case of Internet banking, our customer banks’ corporate and retail customers. In future years, we expect that our customers will increasingly use our cloud-based service offering, DIGIPASS as a Service (“DPS”) as described below.
We offer our products either through a product sales and licensing model or through our DPS product offering, which was first made available in the fourth quarter of 2010. DPS is our cloud-based authentication platform. By using our authentication platform, customers can deploy two-factor authentication more quickly, incur less upfront costs and be able to use strong authentication when logging onto a larger number of Internet sites and applications. We expect those applications to include B2B applications, B2E applications (e.g., employees of companies logging into third party applications operated in the cloud), and B2C applications. While there were minimal revenues generated from this product in 2011, and we expect that the contribution of DPS will still be limited in 2012, we believe that DPS has the potential for significant future growth as it will make two-factor authentication more affordable and readily available to users and application markets.
Our target market is any business process that uses some form of electronic interface, particularly the Internet, where the owner of that process is at risk if unauthorized users can gain access to its process and either obtain proprietary information or execute transactions that are not authorized. Our products can not only increase the security associated with accessing the business process, thereby reducing the losses from unauthorized access, but also, in many cases, can reduce the cost of the process itself by automating activities that were previously performed manually.
In January 2011, we acquired an internet trusted certificate authority/provider, in a two step process. In the first step, we acquired all of the intellectual property of DigiNotar Holding B.V. and its subsidiaries. In the second step we acquired 100% of the stock of DigiNotar B.V. and DigiNotar Notariaat B.V. (collectively, “DigiNotar”). In July 2011, DigiNotar B.V. detected an intrusion into its Certificate Authority (CA) infrastructure, which resulted in the fraudulent issuance of public key certificate requests for a number of domains. On September 14, 2011, the Dutch Independent Post and Telecommunications Authority (OPTA) Commission terminated the registration of DigiNotar B.V. as a certification service provider that issues qualified certificates. As a result of the termination of its registration as a certification service provider, DigiNotar B.V. filed for bankruptcy and the Haarlem District Court, The Netherlands declared DigiNotar B.V. bankrupt on September 20, 2011.
Following the bankruptcy of DigiNotar B.V., we do not plan to continue the certificate authority business, which was DigiNotar B.V.’s core product. We do expect, however, that we will be able to use the intellectual property acquired from DigiNotar to create our own PKI-secured applications, such as document signing, registration and storage solutions, which we expect will strengthen our core authentication product line and expand opportunities for us on our DPS platform.
In April 2011, we acquired Alfa & Ariss, an authority in the field of developing open identity and access management solutions. Alfa & Ariss brought additional important know-how and engineering capabilities in the fields of linking applications in the cloud. We believe that the acquisition of Alfa & Ariss will support the long-term growth strategy of our services and enterprise and application security businesses.
Industry Growth: We do not believe that there are any accurate measurements of the total industry’s size or the industry’s growth rate. We believe, however, that the industry will grow at a significant rate as the use
34
Table of Contents
of the internet increases and the awareness of the risks of using the internet become more prevalent among applications owners and consumers. We expect that growth will be driven by new government regulations, growing awareness of the impact of identity theft, and the growth in commerce that is transacted electronically. The issues driving the growth are global issues and the rate of adoption in each country is a function of that country’s culture, the competitive position of businesses operating in that country, the country’s overall economic conditions and the degree to which businesses and consumers within the country use technology.
Economic Conditions: Our revenue may vary significantly with changes in the economic conditions in the countries in which we currently sell products. With our current concentration of revenue in Europe and specifically in the banking/finance vertical market, significant changes in the economic outlook for the European Banking market may have a significant effect on our revenue.
We believe that as a result of the difficult global economy in 2009 and the first half of 2010, many of our customers delayed the rollout of existing applications and deferred purchase decisions related to the implementation of our product in new applications. In 2010, we responded to the difficult economic conditions by focusing our sales efforts on markets that we believed to have the most near-term opportunity and by implementing cost containment initiatives, including a hiring freeze. With the apparent abatement of the difficult economic conditions in the fourth quarter of 2010 in many of the countries in which we operate, we began to hire staff to support new product development and sales initiatives as well as hiring staff to mitigate risk and strengthen our position in existing markets. In 2011, it appeared that many customers in the Banking market returned to the buying patterns that were in use prior to the economic downturn in 2009, which included large orders for our products that would be delivered to our customers over several quarters. For the full year 2011 as compared to 2010, our revenues in the Banking market increased 72%, with all geographic regions participating strongly in the increase.
We acknowledge that there is significant economic uncertainty regarding the sovereign debt of various European countries. If the sovereign debt issue escalates to the point that a country defaults on its debt or the European Union, or Euro Monetary Union, either disbands or is re-formulated, we expect that the resulting economic difficulties would have a major negative impact on the global economy, not just the economies of Western Europe, and our business.
We do not believe that the uncertainty surrounding the sovereign debt issue had a significant negative impact on our business in 2011.
In 2011, revenue from our Europe, Middle East and Africa (“EMEA”) region, which accounted for 66% of our consolidated revenues in 2011, increased 53% over 2010. Revenues from the Banking market in EMEA, which we believe would be impacted most directly by the sovereign debt issue, increased by 67% in 2011 over 2010. We believe that the growth has been driven by the banks focusing on the need to grow their retail banking business and secure their customers’ internet banking transactions. Notwithstanding the fact that the specific amount of revenue from any one country may vary significantly year to year depending on specific orders we receive from our customers in each country in each period, our revenues from customers located in the countries that are most often noted as having the most significant sovereign debt issues (i.e., Portugal, Italy, Ireland, Greece and Spain) were less than 10% of our total revenues in 2011.
Cybersecurity: Our use of technology is increasing and is critical in three primary areas of our business:
| 1. | Software and information systems that we use to help us run our business more efficiently and cost effectively; |
| 2. | The products we have traditionally sold and continue to sell to our customers for integration into their software applications contain technology that incorporates the use of secret numbers and encryption technology; and |
35
Table of Contents
| 3. | New products and services that we are introducing to the market, such as DIGIPASS as a Service, are focused on processing information through our servers (or in the cloud from our customers’ perspective). |
We believe that the risks and consequences of potential incidents in each of the above areas are different.
In the case of the information systems we use to help us run our business, we believe that an incident could disrupt our ability to take orders or deliver product to our customers, but such a delay in these activities would not have a material impact on our overall results. To minimize this risk, we actively use various forms of security and monitor the use of our systems regularly to detect potential incidents as soon as possible.
In the case of products that we have traditionally sold, we believe that the risk of a potential cyber incident is minimal. We offer our customers the ability to either create the secret numbers themselves or have us create the numbers on their behalf. When asked to create the numbers, we do so in a secure environment with limited physical access and store the numbers on a system that is not connected to any other network, including other VASCO networks, and similarly, is not connected to the Internet. Were such a cyber incident to occur, our business could be subject to significant disruption and we could suffer significant monetary and other losses and significant reputational harm.
In the case of our new products and services, which involve the active daily processing of the secret numbers on our servers or servers managed by others in a hosted environment, we believe a cyber incident could have a material impact on our future business. We also believe that these products may be more susceptible to cyber attacks than our traditional products since it involves the active processing of transactions using the secret numbers. While we do not have a significant amount of revenue from these products today, we believe that these products have the potential to provide substantial future growth. A cyber incident involving these products in the future could substantially impair our ability to grow the business and we could suffer significant monetary and other losses and significant reputational harm.
In July 2011, we experienced a cyber incident related to DigiNotar B.V. We expect that there are likely to be other hacking attempts intended to impede the performance of our products, disrupt our services and harm our reputation as a company, as the processes used by computer hackers to access or sabotage technology products, services and networks are rapidly evolving. As discussed above, our business could be subject to significant disruption, and we could suffer monetary and other losses and reputational harm, in the event of such incidents.
Our losses from discontinued operations resulting from the these events may be exceeded as a result of unanticipated costs associated with DigiNotar B.V.’s bankruptcy, potential claims that may arise in connection with the hacking incidents, further impairment of our investment in DigiNotar, the timeframe in which the impairment costs will be incurred, our inability to recover amounts held in escrow relating to our acquisition of DigiNotar, our inability to offset amounts that may be owed to DigiNotar B.V. by other VASCO affiliates against amounts owed to VASCO affiliates by DigiNotar B.V., and our inability to effectively integrate certain intellectual property assets previously acquired from DigiNotar into our operations.
See Note 3 to the financial statements for additional information associated with a cybersecurity incident involving DigiNotar B.V. that we experienced in July 2011. See also Part I, Item 3—Legal Proceedings for a description of legal proceedings related to the cybersecurity incident in 2011.
Income Taxes: Our effective tax rate reflects our global structure related to the ownership of our intellectual property (“IP”). All our IP is owned by two subsidiaries, one in the U.S. and one in Switzerland. Our two subsidiaries have entered into agreements with most of the other VASCO entities under which those other entities provide services to our U.S. and Swiss subsidiaries on either a percentage of revenue or on a cost plus
36
Table of Contents
basis or both. Under this structure, the earnings of our service provider subsidiaries are relatively constant. These service provider companies tend to be in jurisdictions with higher effective tax rates. Fluctuations in earnings tend to flow to the US and Swiss companies, which for 2011, had lower effective tax rates.
At the beginning of 2011, we had a U.S. net operating loss (“NOL”) carryforward that was fully reserved as we had not been able to establish that it was more likely than not that we would be able to use the U.S. NOL. As a result of the U.S. NOL and related reserve, the effective tax rate on U.S. earnings had approximated zero, excluding the impact of the alternative minimum tax (“AMT”). The AMT rate had generally computed to be about 2% of pretax income in the U.S.
In 2011, with the strong performance in the territories in which the U.S. subsidiary owns the IP, we used a significant portion of the U.S. NOL that had been reserved and we determined that it was more likely than not that we would use the remaining unused portion of U.S. NOL in future years. As a result, the effective tax rate for 2011 reflected both a benefit of using the U.S. NOL against income in 2011 and a benefit from eliminating the reserve against the U.S. NOL that remained unused at December 31, 2011. See the effective tax rate reconciliation in Note 7 to the financial statements for the benefits related to the use of NOL carryforwards or the changes in the reserves related to NOL carryforwards in 2011. In future years, we expect that earnings in the territories in which the U.S. subsidiary owns the IP will be taxed at a rate that approximates the U.S. statutory rate.
With the majority of our revenues being generated outside of the U.S., our consolidated effective tax rate is strongly influenced by the effective tax rate of our foreign operations. Changes in the effective rate related to foreign operations reflect changes in the geographic mix of where the earnings are realized and the tax rates in each of the countries in which it is earned. The statutory tax rate for the primary foreign tax jurisdictions ranges from 8% to 34%. For 2012, we expect that total earnings in foreign countries where the IP is owned by our subsidiary in Switzerland will be taxed at a rate that is 10 to 15 percentage points lower than the U.S. statutory rate. For years after 2012, we expect that the rate differential for foreign countries, when compared to the U.S. statutory rate, will increase as the buy-in payments related to the original purchase of the IP are completed (i.e., taxable income in the foreign countries will decrease in the higher tax rate jurisdictions and increase in the lower tax rate jurisdictions as the Swiss and U.S. subsidiaries no longer make payments to the higher rate foreign countries related to the original purchase of the IP).
The geographic mix of earnings of our foreign subsidiaries will primarily depend on the level of our service provider subsidiaries’ pretax income, which is recorded as an expense by the U.S. and Swiss subsidiaries and the benefit that is realized in Switzerland through the sales of product. The level of pretax income in our service provider subsidiaries is expected to vary based on:
| 1. | the staff, programs and services offered on a yearly basis by the various subsidiaries as determined by management, or |
| 2. | the amount of the payments made by the U.S. and Swiss entities related to the purchase of the service providers’ original IP (which payments are scheduled to cease at the end of 2012), or |
| 3. | the changes in exchange rates related to the currencies in the service provider subsidiaries, or |
| 4. | the amount of revenues that the service provider subsidiaries generate. |
For items 1, 2 and 3 above, there is a direct impact in the opposite direction on earnings of the U.S. and Swiss entities. Any change from item 4 is generally expected to result in a larger change in income in the U.S. and Swiss entities in the direction of the change (increased revenues expected to result in increased margins/pretax profits and conversely decreased revenues expected to result in decreased margins/pretax profits).
In addition to the provision of services, the intercompany agreements transfer the majority of the business risk to our U.S. and Swiss subsidiaries. As a result, the contracting subsidiaries’ pretax income is reasonably assured while the pretax income of the U.S. and Swiss subsidiaries varies directly with our overall success in the market.
37
Table of Contents
For 2012, we expect that our effective tax rate will increase substantially as the effective rate on our income in territories in which the IP is owned by the U.S. subsidiary increases to a rate that approximates the U.S. statutory rate with no further benefit for the U.S. NOL. The actual tax rate for 2012, however, will be determined based on the geographic location of earnings in 2012.
Currency Fluctuations. In 2011, approximately 90% of our revenue and approximately 78% of our operating expenses were generated/incurred outside of the U.S. In 2010, approximately 91% of our revenue and approximately 82% of our operating expenses were generated/incurred outside of the U.S. As a result, changes in currency exchange rates, especially the Euro to U.S. Dollar, can have a significant impact on revenue and expenses. To minimize the net impact of currency on operating earnings, we attempt to denominate an amount of billings in a currency such that it would provide a hedge against the operating expenses being incurred in that currency. If our revenue in Europe continues as it is now or grows, however, we do not expect that we will be able to balance fully the exposures of currency exchange rates on revenue and operating expenses. In periods in which the U.S. Dollar is weakening, we expect that our operating income will increase as a result of the change in currency exchange rates. Conversely, in periods in which the U.S. Dollar is strengthening, we expect that our operating income will decrease as a result of the change in currency exchange rates.
In 2011 compared to 2010, the U.S. Dollar, on average, weakened approximately 5% against the Euro and weakened approximately 13% against the Australian Dollar. In 2010 compared to 2009, on average, the U.S. Dollar strengthened approximately 5% against the Euro and weakened approximately 16% against the Australian Dollar. We estimate that the net impact of the change in currency rates in 2011 compared to 2010 resulted in an increase in revenue of approximately $5,406 and an increase in operating expenses of $3,475. We also estimate that the change in currency rates in 2010 compared to 2009 resulted in a decrease in revenue of approximately $1,679 and a decrease in operating expenses of $1,792.
The financial position and the results of operations of most of our foreign subsidiaries, with the exception of our subsidiaries in Switzerland and Singapore, are measured using the local currency as the functional currency. Accordingly, assets and liabilities are translated into U.S. Dollars using current exchange rates as of the balance sheet date. Revenues and expenses are translated at average exchange rates prevailing during the year. Translation adjustments arising from differences in exchange rates generated other comprehensive loss of $2,120 in 2011and $3,747 in 2010 and other comprehensive income of $559 in 2009. These amounts are included as a separate component of stockholders’ equity. The functional currency for both our subsidiaries in Switzerland and Singapore is the U.S. Dollar.
Gains and losses resulting from foreign currency transactions are included in the consolidated statements of operations as other non-operating income/expense. In 2011, we reported $760 of foreign exchange transaction losses compared to foreign exchange losses of $225 in 2010 and foreign exchange gains of $835 in 2009.
38
Table of Contents
Revenue
Revenue by Geographic Regions: We classify our sales by customers’ location in four geographic regions: 1) EMEA, which includes Europe, the Middle East and Africa; 2) the United States, which for our purposes includes sales in Canada; 3) Asia Pacific Rim; and 4) Other Countries, including Australia, Latin America and India. The breakdown of revenue in each of our major geographic areas was as follows:
| Year |
Europe, Middle East, Africa (EMEA) |
United States |
Asia Pacific |
Other Countries |
Total | |||||||||||||||
| Total Revenue: |
||||||||||||||||||||
| 2011 |
$ | 111,575 | $ | 16,025 | $ | 14,738 | $ | 25,744 | $ | 168,082 | ||||||||||
| 2010 |
72,694 | 9,912 | 10,860 | 14,497 | 107,963 | |||||||||||||||
| 2009 |
72,833 | 7,376 | 9,492 | 11,994 | 101,695 | |||||||||||||||
| Percent of Total: |
||||||||||||||||||||
| 2011 |
66 | % | 10 | % | 9 | % | 15 | % | 100 | % | ||||||||||
| 2010 |
67 | % | 9 | % | 10 | % | 14 | % | 100 | % | ||||||||||
| 2009 |
72 | % | 7 | % | 9 | % | 12 | % | 100 | % | ||||||||||
2011 Compared to 2010
Total revenue in 2011 increased $60,119 or 56% from 2010. The increase in total revenue was primarily attributable to an increase in products sold to the Banking market, both hardware and non-hardware, an increase in non-hardware products sold to the Enterprise and Application Security market and the weakening of the U.S. Dollar as compared to the Euro, as noted above, partially offset by a decrease in hardware products sold to the Enterprise and Application Security market. Please see the discussion below under “Revenue by Target Market” for additional information regarding the changes in revenue from the Banking market and the Enterprise and Application Security market.
Revenue generated in EMEA for the full-year 2011 was $38,881 or 53% higher in 2011 than in 2010. The increase reflected an increase of approximately 67% in revenue from the Banking market and an increase of 13% in revenue from the Enterprise and Application Security markets. We estimate that the change in currency rates increased revenues in EMEA by $4,776 compared to 2010. Had currency exchange rates in 2011 remained unchanged from 2010, revenues in EMEA would have been approximately 47% higher than in full-year 2010.
Revenue generated in United States for the full-year 2011 was $6,113 or 62% higher in 2011 than in 2010. Revenue was approximately 155% higher in the Banking market and 1% lower in the Enterprise and Application Security markets than in full-year 2010. The U.S. market continues to defer the adoption of two factor authentication for retail internet banking applications. The results in the U.S. also reflect strong competition from our competitors, especially in the Enterprise and Application Security market.
Revenue generated in Asia Pacific for the full-year 2011 was $3,878 or 36% higher in 2011 than in 2010. Revenue was approximately 29% higher in the Banking market and 78% higher in the Enterprise and Application Security markets than in full-year 2010. We believe the region offers substantial opportunities for future growth as our sales offices in Japan and Beijing mature and the two-factor authentication market expands.
Revenue generated in other countries for the full-year 2011 was $11,247 or 78% higher in 2011 than in 2010. Revenue in other countries was approximately 97% higher in the Banking market and 27% lower in the Enterprise and Application Security markets. As noted above, the average exchange rate for the U.S. Dollar was approximately 13% weaker than the Australian Dollar in 2011 compared to 2010 and we estimate that the change in currency rates increased revenues in other countries by $555 compared to 2010. We expect that revenue from other countries will be more volatile than our other regions given the earlier stage of development of the authentication market in those countries. VASCO, however, plans to continue to invest in new markets based on our estimates of the market’s demand for strong user authentication.
39
Table of Contents
Given the relatively small size of the revenue in regions other than EMEA, the results may vary substantially year-to-year on both an absolute and on a percentage basis depending upon the timing of the receipt and delivery of a large new order or the completion of a large rollout. We believe that the variability in results will lessen as we develop a larger base of Banking customers and further develop our distribution channel and direct touch sales model for the Enterprise and Application Security market.
2010 Compared to 2009
Total revenue in 2010 increased $6,268 or 6% from 2009. The increase in total revenue was primarily attributable to an increase in products sold to the Banking market, both hardware and non-hardware, a decline in hardware products sold to the Enterprise and Application Security market and the strengthening of the U.S. Dollar as compared to the Euro, as noted above, partially offset by an increase in non-hardware products sold to the Enterprise and Application Security market.
Revenue generated in EMEA for the full-year 2010 was $139 or less than 1% lower in 2010 than in 2009. The decrease was primarily attributable to a decline of approximately 1% in the Banking market, partially offset by a 2% increase in revenue from the Enterprise and Application Security markets. We estimate that the change in currency rates reduced revenues in EMEA by $2,282 compared to 2009. Had currency exchange rates in 2010 remained unchanged from 2009, revenues in EMEA would have been approximately 3% higher than in full-year 2009.
Revenue generated in United States for the full-year 2010 was $2,536 or 34% higher in 2010 than in 2009. Revenue was approximately 42% higher in the Banking market and 30% higher in the Enterprise and Application Security markets than in full-year 2009.
Revenue generated in Asia Pacific for the full-year 2010 was $1,368 or 14% higher in 2010 than in 2009. Revenue was approximately 25% higher in the Banking market and 26% lower in the Enterprise and Application Security markets than in full-year 2009.
Revenue generated in other countries for the full-year 2010 was $2,503 or 21% higher in 2010 than in 2009. Revenue in other countries was approximately 23% higher in the Banking market and 12% higher in the Enterprise and Application Security markets. The average exchange rate for the U.S. Dollar was approximately 16% weaker than the Australian Dollar in 2010 compared to 2009 and we estimate that the change in currency rates increased revenues in other countries by $591 in 2010 compared to 2009.
40
Table of Contents
Revenue by Target Market: Revenue is generated currently from two primary markets, (1) Banking and (2) Enterprise and Application Security, through the use of both direct and indirect sales channels. The Enterprise and Application Security market includes products used by employees of corporations to secure their internal networks (the enterprise security market) and business-to-business, business-to-consumer, e-commerce, e-government, e-gaming and other vertical applications (the application security market) that are not related to banking or finance. In addition, revenues from services-related activities, such as maintenance and support are included in the Enterprise and Application Security markets. Management currently views the Enterprise and Application Security market as one market because the same products are sold using the same methods to both groups (i.e., a direct touch model and channel distribution model). Sales to the Enterprise and Application Security market are generally for smaller quantities and higher prices than sales made to the Banking market. The breakdown of revenue between the two primary markets is as follows:
| Year |
Banking | Enterprise & Application Security |
Total | |||||||||
| Total Revenue: |
||||||||||||
| 2011 |
$ | 136,975 | $ | 31,107 | $ | 168,082 | ||||||
| 2010 |
79,757 | 28,206 | 107,963 | |||||||||
| 2009 |
74,891 | 26,804 | 101,695 | |||||||||
| Percent of Total: |
||||||||||||
| 2011 |
81 | % | 19 | % | 100 | % | ||||||
| 2010 |
74 | % | 26 | % | 100 | % | ||||||
| 2009 |
74 | % | 26 | % | 100 | % | ||||||
2011 Compared to 2010
Revenue for the full year 2011 from the Banking market increased $57,218 or 72% from 2010 and revenue from the Enterprise and Application Security market increased $2,901 or 10% in the same period.
The increase in the Banking market reflects an increase in products sold, both hardware and non-hardware, and an increase resulting from the weakening of the U.S. Dollar as compared to the Euro, as previously noted. In 2011, banks returned to a buying pattern that was more consistent with the way that they had placed orders prior to the crisis in 2008, which included larger orders for significant rollouts to their retail customers. Revenues in 2011 reflected large transactions from both new banking customers as well as existing banking customers.
Given the sustainable, repeatable nature of our revenue model, we expect that customers that have purchased our products in prior years will replace those products in future years for several reasons, including but not limited to;
| • | upgrading to products that provide a higher level of security (e.g., our products with electronic or digital signing capability) to counteract the increasing sophistication of parties attempting to steal their customers’ identities or conduct man-in-the-middle attacks, |
| • | establishing a competitive advantage in their market place by providing technology that differs from their competitors, |
| • | expanding the use of our products to provide security over new applications that may be offered by the bank, and |
| • | replacing existing products that may have been lost or are reaching the end of their useful lives. |
While we believe that the revenues in 2011 reflected a certain amount of catch-up related to replacement cycles that we otherwise would have expected to take place in 2009 and 2010, we also believe the total revenue for the full year 2011 reflects a more normal level of revenue associated with the long-term growth
41
Table of Contents
that we expect from the banking industry as banks continue to increase the use of internet banking applications. The compounded annual growth rate in revenue from our Banking market has been approximately 8% and 16% for the three and five year periods ended December 31, 2011, respectively. While revenues from the Banking market will continue to fluctuate quarterly and annually based on the specific rollouts being done by our customers in those specific periods, we expect that revenues from the Banking market should grow at an annual rate of 10% or more on a long-term, normalized basis.
The increase in the Enterprise and Application Security market was primarily attributable to an increase in non-hardware revenue and the weakening of the U.S. Dollar as compared to the Euro partially offset by a decline in the number of products shipped.
As a result of our continued investment in new technologies and products, our products can compete effectively for large transactions in the Enterprise and Application Security market. To market those new products, we have also invested in a new sales approach by introducing a direct touch sales model that allows a dedicated internal sales group to work either directly with customers or with our existing channel partners to more effectively present our product. The direct touch sales method is comparable to our direct sales approach in the Banking market. We believe that the new sales approach contributed to the strength of the business in the second half of 2011 compared to both the first half of 2011 and the second half of 2010. Revenues from the Enterprise and Application Security market in the second half of 2011 were 50% higher than in the first half of 2011 and 35% higher than the second half of 2010. We expect that we will continue to see the benefits of the investments we made in 2010 and 2011 in the form of increased revenues from the Enterprise and Application Security market in future years.
2010 Compared to 2009
Revenue for the full year 2010 from the Banking market increased $4,866 or 6% from 2009 and revenue from the Enterprise and Application Security market increased $1,402 or 5% in the same period.
The increase in the Banking market reflected an increase in products sold, both hardware and non-hardware, partially offset by the strengthening of the U.S. Dollar as compared to the Euro, as previously noted. In the fourth quarter of 2009 banks began issuing requests for information and proposals for new projects and placed larger orders for delivery in the quarter, in part we believe to spend remaining budgets for 2009 and in part reflecting a return to a more normal level of business. Throughout 2010, we had seen a sustained increase in the volume of requests for information and proposals. Those requests for information and proposals also reflected an increase in quantities, which we believe indicated that the banks were returning to the business practices they followed prior to the onset of the financial crisis. In the second half of 2010, we also saw a significant increase in orders from banks, some of which was reflected in the growth of our revenue in the third and fourth quarters of 2010, but also in our backlog of orders for delivery in 2011 and beyond.
The increase in the Enterprise and Application Security market was primarily attributable to an increase in non-hardware revenue partially offset by a decline in the number of products shipped and the strengthening of the U.S. Dollar as compared to the Euro. We believe that the decline in products shipped reflected the fact that we had strong growth from 2009 from new application markets, such as gaming, that was not fully sustained or replaced by sales into other application markets in 2010.
42
Table of Contents
Gross Profit and Operating Expenses
The following table sets forth, for the periods indicated, certain consolidated financial data as a percentage of revenue from continuing operations for the years ended December 31, 2011, 2010 and 2009.
| Percentage of Revenue Year Ended December 31, |
||||||||||||
| 2011 | 2010 | 2009 | ||||||||||
| Revenue |
100.0 | % | 100.0 | % | 100.0 | % | ||||||
| Cost of goods sold |
35.7 | 29.6 | 30.0 | |||||||||
|
|
|
|
|
|
|
|||||||
| Gross profit |
64.3 | 70.4 | 70.0 | |||||||||
| Operating costs |
||||||||||||
| Sales and marketing |
24.0 | 28.7 | 29.8 | |||||||||
| Research and development |
11.1 | 12.6 | 11.4 | |||||||||
| General and administrative |
13.3 | 17.2 | 15.9 | |||||||||
| Amortization of purchased intangible assets |
1.2 | 0.4 | 0.4 | |||||||||
|
|
|
|
|
|
|
|||||||
| Total operating costs |
49.6 | 58.9 | 57.5 | |||||||||
|
|
|
|
|
|
|
|||||||
| Operating income |
14.7 | 11.5 | 12.5 | |||||||||
| Interest income, net |
0.3 | 0.3 | 0.5 | |||||||||
| Other income (expense), net |
0.3 | 0.6 | 2.1 | |||||||||
|
|
|
|
|
|
|
|||||||
| Income before income taxes |
15.3 | 12.4 | 15.1 | |||||||||
| Provision for income taxes |
0.9 | 2.4 | 3.4 | |||||||||
|
|
|
|
|
|
|
|||||||
| Net Income |
14.4 | 10.0 | 11.7 | |||||||||
|
|
|
|
|
|
|
|||||||
Gross Profit
2011 Compared to 2010
Consolidated gross profit for 2011 was $108,112, an increase of $32,146, or 42%, from the $75,966 reported for 2010. Gross profit as a percentage of revenue (“gross profit margin”) was 64% in 2011 compared to 70% in 2010. The decline in the gross profit margin was primarily attributable to the following factors:
| • | an unfavorable change in the mix of our revenues between the Banking and Enterprise and Application Security markets, |
| • | a decline in the gross profit margin of hardware products sold within both the Banking and Enterprise and Application Security markets, |
| • | a decline in non-hardware revenues as a percentage of total revenue, and |
| • | a write down of selected inventory items to their expected net realizable value, partially offset by |
| • | a benefit from the weakening of the U.S. Dollar compared to other currencies. |
Our gross profit margin was negatively impacted by the higher growth rate in revenues coming from our Banking market as compared to the growth rate of revenues coming from our Enterprise and Application Security market. As noted above, revenues from the Banking market increased to 81% of total revenue in 2011 from 74% of total revenue in 2010. In contrast, revenues from the Enterprise and Application Security markets declined to 19% of total revenue in 2011 from 26% of total revenue in 2010. The gross profit margin from our Enterprise and Application Security Business is approximately 20 to 25 percentage points higher than in the Banking market primarily because sales in the Enterprise and Application Security market are generally for lower quantities and higher prices than in the Banking market. We plan to continue to invest in both the Banking market and the Enterprise and Application Security market and the overall mix between the two markets will vary in the future based on the growth rates in each of the markets.
43
Table of Contents
We experienced a decline in the gross profit margin coming from hardware-related revenues generated in both the Banking and the Enterprise and Application Security markets. The decline in the gross profit margin for hardware-related revenues was primarily attributable to:
| • | an increase in the size of our largest transactions in 2011 compared to 2010. We had transactions in both the Banking and Enterprise and Application Security markets in 2011 that were substantially larger than transactions in 2010. Our normal pricing models provide our customers with lower prices per unit if they commit to purchase higher quantities. |
| • | an increase in the percentage of our revenues coming from our card readers. Card readers represented 19% of our total revenue in 2011 as compared to 13% of our total revenue in 2010. Card readers, generally have a gross profit margin that is approximately 25 to 35 percentage points lower than other hardware-related margins, due to competitive pricing pressures. There are a number of competitors in the EMV market that produce card reader products with fewer features at a lower cost than our products. |
| • | an increase in costs associated with shipping our products as a result of the need for an increased number of expedited shipments, especially in the first half of the year, to ensure that we met our delivery commitments to customers. |
Non-hardware revenue as a percentage of total revenue was approximately 21% in 2011 compared to 25% in 2010. While the amount of non-hardware revenue increased by approximately 30% in 2011 compared to 2010, it was a lower percentage of total revenue as the growth rate in non-hardware revenues was less than the growth rate in hardware revenues. Non-hardware revenue can have a gross profit margin that is approximately 20 to 30 percentage points higher than hardware-related revenue, depending on the model and quantity of the hardware units sold.
In the fourth quarter of 2011, we wrote down the value of selected inventory items to their expected net realizable value. The total amount of the write down was approximately $1,375. The amount of the write down was based on our evaluation of specific inventory items on hand at the end of 2011 in relation to our estimates of future demand for that inventory. Going forward, we believe that similar adjustments may be needed reflecting the risk associated with making estimates of future demand and buying inventory to meet that demand on a recurring basis.
Changes in currency exchange rates had a positive impact on our gross profit margins in 2011. The majority of our inventory purchases are denominated in U.S. Dollars. As previously noted, our sales are denominated in various currencies, including the Euro and Australian Dollar. As the U.S. Dollar weakened in 2011 when compared to the Euro and the Australian Dollar in 2010, revenue as measured in U.S. Dollars increased from sales made in Euros and Australian Dollars, without a corresponding increase in cost of goods sold. The impact from changes in currency rates, as noted above, is estimated to have increased revenue by approximately $5,406 for the full year 2011. Had the currency rates in 2011 been equal to the rates in 2010, the gross profit margin would have been approximately 1.2 percentage points lower for the year ended December 31, 2011.
2010 Compared to 2009
Consolidated gross profit for 2010 was $75,966, an increase of $4,806, or 7%, from the $71,160 reported for 2009. Our gross profit margin was 70% in both 2010 and 2009. While the gross profit margin was relatively constant for full year 2010 compared to full year 2009, we did experience pricing pressures across our product line that reduced our gross profit margin that were offset by changes in the mix of products sold. In 2010, card readers, as a percentage of total revenue declined from approximately 18% in 2009 to 13% in 2010 and non-hardware revenue, as a percentage of total revenue, increased from approximately 23% in 2009 to 25% of revenue in 2010.
44
Table of Contents
Card readers generally have a gross profit margin that is approximately 25 to 35 percentage points lower than other hardware-related margins due to competitive pricing pressures. There are a number of competitors in the EMV market that produce card reader products with fewer features at a lower price than our products. Non-hardware revenue can have a gross profit margin that is approximately 20 to 30 percentage points higher than hardware-related revenue, depending on the model and quantity of the hardware units sold.
Other factors that typically influence our gross profit margins include the mix of business between the Banking and Enterprise and Application Security markets and the impact of the change in exchange rates. Neither factor had a material impact on the comparison of gross profit margins in 2010 compared to 2009.
Revenue from our Enterprise and Application Security markets was 26% of total revenue in both 2010 and in 2009. The gross profit margin from our Enterprise and Application Security Business is approximately 20 to 25 percentage points higher than in the Banking market because sales in the Enterprise and Application Security market are generally for lower quantities and higher prices than in the Banking market.
Changes in currency exchange rates can impact our gross profit margins as well. The majority of our inventory purchases are denominated in U.S. Dollars. As previously noted, our sales are denominated in various currencies, including the Euro and Australian Dollar. As the U.S. Dollar strengthened in 2010 when compared to the Euro in 2009 and weakened in 2010 when compared to the Australian Dollar in 2009, revenue as measured in U.S. Dollars decreased from sales made in Euros and increased from sales made in Australian Dollars, without a corresponding decrease in cost of goods sold. The impact from changes in currency rates, as noted above, is estimated to have decreased revenue by approximately $1,679 for the full year 2010. Had the currency rates in 2010 been equal to the rates in 2009, the gross profit margin would have been approximately 0.5 percentage points higher for the year ended December 31, 2010.
Operating Expenses
Our operating expenses are generally based on anticipated revenue levels and the majority of such expenses are fixed over short periods of time. As a result, small variations in the amount of revenue recognized in any given period could cause significant variations in the period-to-period comparisons of either the absolute amounts of operating income or operating income as a percentage of revenue.
The most significant factor driving our operating expenses is our headcount. Direct compensation and benefit plan expenses generally represent between 55% and 65% of our operating expenses. In addition, a number of other expense categories are directly related to headcount. We attempt to manage our headcount within the context of the economic environments in which we operate and the investments that we believe we need to make to help ensure that our infrastructure is able to support future growth and ensure that our products are competitive. The headcount from continuing operations for 2008 through 2011 is recapped in the following table:
| Headcount at December 31, |
% Increase (Decrease) in Headcount |
Average Headcount for Full Year* |
% Increase (Decrease) in Average Headcount |
|||||||||||||
| 2008 |
310 | 271 | ||||||||||||||
| 2009 |
294 | (5 | )% | 301 | 11 | % | ||||||||||
| 2010 |
342 | 16 | % | 319 | 6 | % | ||||||||||
| 2011 |
358 | 5 | % | 355 | 11 | % | ||||||||||
| * | Average is based on the headcount at the end of five consecutive quarters. |
With the economic crisis that began in 2008, we implemented a cost containment initiative that resulted in a decrease of staff in 2009. In the fourth quarter of 2009, with the increase in requests for information and proposals, we began to invest in our business by looking to add staff in critical areas in 2010. In 2011, other than
45
Table of Contents
our acquisitions of DigiNotar and Alfa & Ariss early in 2011, our primary focus was on realizing a benefit from the staff additions made in 2010. Our headcount at December 31, 2011 was 358, including 10 persons from the acquisition of Alfa & Ariss, but excluding DigiNotar, which was discontinued in 2011 as noted above. For 2012, we expect to hire between 25 and 35 persons, with hiring focused primarily on sales and product development staff.
In addition to headcount, the comparison of operating expenses in both 2011 to 2010 and 2010 to 2009 were impacted by adjustments to our stock-based incentive plan compensation expenses. Stock-based incentive plan compensation expenses generally relate to stock-based, long-term performance incentives. For the full year of 2011, operating expenses included $6,117 of expense related to stock-based incentive plans compared to expense of $1,021 in 2010 and a benefit of $309 in 2009. In 2011, 2010 and 2009 we recorded adjustments to the accrual each year for such plans based on management’s determination of whether it was probable that the performance criterion for each plan outstanding at the end of each period would be met. With our strong performance in 2011, we achieved the performance targets that had been set in the 2009 plan awards and that management had determined in the fourth quarter of 2010, and maintained such determination through the end of the third quarter 2011, that it was improbable that we would meet the targets. As a result of achieving the targets, expense increased by $2,493 in the fourth quarter of 2011. In 2010, we reversed $721 of accruals that had been established in the prior year for the 2009 awards based on management’s assessment that it was improbable that the 2009 plan award targets would be met. In 2009 we recorded a benefit of $2,002 related to the reversal of accruals that had been established in prior years for long-term performance incentives where the performance targets were not met.
Sales and Marketing Expenses
2011 Compared to 2010
Consolidated sales and marketing expenses for the year ended December 31, 2011 were $40,294, an increase of $9,267, or 30%, from $31,027 reported for 2010. This increase in sales and marketing expenses, including the impact of changes in currency exchange rates, is primarily related to:
| • | higher compensation expenses of approximately $5,750 related to both an increase in the average headcount and an increase in base, bonus and commission related compensation amounts, and |
| • | an increase in stock-based compensation expenses of approximately $1,969, including the impact of the adjustments previously noted. |
We estimate that the weakening of the U.S. Dollar in relation to other currencies, primarily the Euro and Australian Dollar, increased sales and marketing expenses by approximately $1,752 in 2011 compared to 2010.
Our average full year headcount increased approximately 6% in 2011 compared to 2010. The average full-time sales, marketing and operations employee headcount was 172 in 2011 compared to 162 in 2010. At year-end 2011, 2010 and 2009, the company employed 167, 170 and 156 sales, marketing and operations employees, respectively.
2010 Compared to 2009
Consolidated sales and marketing expenses for the year ended December 31, 2010 were $31,027, an increase of $728, or 2%, from $30,299 reported for 2009. This increase in sales and marketing expenses, including the impact of changes in currency exchange rates, is primarily related to:
| • | higher compensation expenses of approximately $1,007, and |
| • | an increase in stock-based compensation expenses of approximately $399, including the impact of the adjustments previously noted. |
46
Table of Contents
We estimate that the strengthening of the U.S. Dollar to other currencies, primarily the Euro and Australian Dollar, reduced sales and marketing expenses by approximately $1,072 in 2010 compared to 2009.
While our average full year headcount was flat in 2010 compared to 2009, our compensation expenses increased as a result of the timing of when staff were added or terminated over the two year period. The average full-time sales, marketing and operations employee headcount was 162 in 2010 compared to 161 in 2009.
Research and Development Expenses
2011 Compared to 2010
Consolidated research and development costs for the year ended December 31, 2011 were $18,636, an increase of $5,068, or 37%, from the $13,568 reported for 2010. The increase in research and development, including the impact of changes in currency exchange rates, was primarily attributable to:
| • | higher compensation expenses of approximately $2,264 related to both an increase in the average headcount and an increase in base and bonus related compensation amounts, |
| • | an increase in stock-based compensation expenses of approximately $869, including the impact of the adjustments previously noted, |
| • | operating expenses associated with Alfa & Ariss, which was acquired April 1, 2011, of approximately $662, and |
| • | an increase in the cost of third party consulting expenses of approximately $444. |
We estimate that the weakening of the U.S. Dollar to other currencies, primarily the Euro and Australian Dollar, increased research and development expenses by approximately $1,128 in 2011 compared to 2010.
The average research and development headcount, including the staff of Alfa & Ariss, increased approximately 22% to 128 in 2011 from 105 in 2010. Excluding the Alfa & Ariss staff, the average full time research and development headcount was 122 in 2011, an increase of 16% over 2010. At year-end 2011, 2010 and 2009, the company employed 136, 115 and 92 research and development employees, respectively.
2010 Compared to 2009
Consolidated research and development costs for the year ended December 31, 2010 were $13,568, an increase of $1,986, or less than 17%, from the $11,582 reported for 2009. The change in research and development, including the impact of changes in currency exchange rates, was primarily attributable to:
| • | higher compensation expenses of approximately $816 related to both an increase in the average headcount and an increase in base and bonus related compensation amounts, and |
| • | an increase in stock-based compensation expenses of approximately $228, including the impact of the adjustments previously noted. |
The average full-time sales, research and development headcount increased 13% to 105 in 2010 from 93 in 2009.
We estimate that the strengthening of the U.S. Dollar to other currencies, primarily the Euro and Australian Dollar, reduced research and development expenses by approximately $291 in 2010 compared to 2009.
47
Table of Contents
General and Administrative Expenses
2011 Compared to 2010
Consolidated general and administrative expenses for the year ended December 31, 2011 were $22,450, an increase of $3,912 or 21%, from the $18,538 reported for 2010. The increase in general and administrative expense, including the impact of changes in currency exchange rates, was primarily attributable to:
| • | higher compensation expenses of approximately $1,213 related to both an increase in the average headcount and an increase in base and bonus related compensation amounts, and |
| • | an increase in stock-based compensation expenses of approximately $2,235, including the impact of the adjustments previously noted. |
We estimate that the weakening of the U.S. Dollar to other currencies, primarily the Euro and Australian Dollar, increased general and administrative expenses by approximately $594 in 2011 compared to 2010.
The average full-time general and administrative employee headcount increased 6% to 56 in 2011 from 53 in 2010. At year-end 2011, 2010 and 2009, the company employed 55, 57 and 46 general and administrative employees, respectively.
2010 Compared to 2009
Consolidated general and administrative expenses for the year ended December 31, 2010 were $18,538, an increase of $2,355 or 15%, from the $16,183 reported for 2009. The increase in general and administrative expenses, including the impact of changes in currency exchange rates, was primarily attributable to:
| • | an increase in stock-based compensation expenses of approximately $703, including the impact of the adjustments previously noted, and |
| • | an increase in professional fees of approximately $1,512 primarily associated with increased legal fees related to various discrete projects in various countries around the world. While we do not consider any of the individual projects either material or likely to be of a recurring nature, we do expect that we will continue to incur significant legal expenses on an ongoing basis in support of our global operations. |
We estimate that the strengthening of the U.S. Dollar to other currencies, primarily the Euro and Australian Dollar, reduced general and administrative expenses by approximately $430 in 2010 compared to 2009.
The average full-time general and administrative employee headcount increased 13% to 53 in 2010 from 47 in 2009. The increase in average headcount did not result in a significant increase in compensation related expenses as the cost of the increased headcount was offset, in part by lower incentive related costs.
Amortization Expense
2011 Compared to 2010
Amortization expense for 2011 was $1,967, an increase of $1,524 or 344% from $443 reported for 2010. The increase was primarily due to the asset acquisition of the intellectual property of DigiNotar, which is not impacted by the bankruptcy of DigiNotar B.V., and the stock acquisition of Alfa & Ariss.
2010 Compared to 2009
Amortization expense for 2010 was $443, a decrease of $10 or 2% from $453 reported for 2009. The decrease was primarily due to the strengthening of the U.S. Dollar versus the Euro.
48
Table of Contents
Interest Income, Net
2011 Compared to 2010
Consolidated net interest income was $543 in 2011 compared to $324 in 2010. The increase in net interest income reflected an increase in both the average net cash balances and the average return on those balances. Average net cash balances were $82,375 in 2011, an increase of $4,112 or 5% from $78,263 in 2010. Our return on average net cash balances was 0.7% in 2011 compared to 0.4% in 2010. We expect that the lower rates of return will continue in 2012.
2010 Compared to 2009
Consolidated net interest income was $324 in 2010 compared to $572 in 2009. The decrease in net interest income primarily reflected a decrease in the rate of return on higher average net cash balances. Average net cash balances were $78,263 in 2010, an increase of $13,971 or 22% from $64,292 in 2009. Our return on average net cash balances was 0.4% in 2010 compared to 0.9% in 2009. The reduction in the rate of return reflected the impact of various stimulus packages offered by governments to banks in the regions in which we operate. The stimulus packages effectively reduced the cost of funds to each bank, thereby reducing the interest rate the banks were willing to pay on deposits.
Other Income (Expense), net
2011 Compared to 2010
Other income (expense), net in 2011 primarily included exchange gains (losses) on transactions that are denominated in currencies other than a subsidiary’s functional currency and subsidies received from foreign governments related to increasing trade in other countries or increasing spending on research and development. Other income was $500 in 2011 compared to $698 in 2010. The decrease in other income primarily reflects an increase in exchange losses of $535 partially offset by an increase in other income of $337. Exchange losses were $760 in 2011 compared to exchange losses of $225 in 2010.
2010 Compared to 2009
Other income was $698 in 2010 compared to expense of $2,107 in 2009 and reflects a decrease in exchange gains of $1,060 and a decrease in other income of $349. We realized exchange losses of $225 in 2010 compared to exchange gains of $835 in 2009. In 2010, our other income from government subsidies declined as government incentives put in place to stimulate the economies in some of the countries in which we operate lapsed.
Income Taxes
2011 Compared to 2010
Income tax expense for 2011 was $1,557, compared to $2,606 in 2010. The effective tax rate in 2011 was 6%, a decrease of 13 percentage points from 19% in 2010. The reduction in the rate in 2011 is primarily attributable to the benefit of the use of net operating loss carryforwards in the U.S. and the reversal of a reserve related to the use of remaining U.S. net operating loss carryforwards in future years. See the discussion regarding income taxes in the general commentary section of Management’s Discussion and Analysis above and in Note 7 to the consolidated financial statements for additional information.
49
Table of Contents
2010 Compared to 2009
Income tax expense for 2010 was $2,606, compared to $3,460 in 2009. The effective tax rate in 2010 was 19%, a decrease of 4 percentage points from 23% in 2009. The reduction in the rate in 2010 is primarily due to the change in the distribution of pretax income in the countries in which we operate and the fact that our income in foreign countries was taxed at a lower effective rate in 2010 than in 2009.
Loss Carryforwards Available
At December 31, 2011, we had U.S. NOL carryforwards of $9,907, foreign NOL carryforwards of $5,535, and $2,770 of other deductible foreign carryforwards. Of the U.S. NOL carryforwards, $7,334 represents U.S. tax deductions for employee stock option gains, the tax benefit of which, will be credited to additional paid in capital when the NOL carryforwards are utilized. U.S. NOL carryforwards expire in varying amounts beginning in 2022 and continuing through 2029. Foreign NOL carryforwards do not expire. Other deductible foreign carryforwards expire from 2016 through 2018.
Such tax loss carryforwards may provide an offset to future tax liabilities. We had a valuation reserve of $2,088 against the foreign net operating loss and other deductible carryforwards at December 31, 2011. A reduction in the valuation reserve may be possible if it is more likely than not that we will realize the benefit of the deferred tax asset. The reduction in the reserve would reduce income tax expense in the period it is reduced. See Note 7 to the consolidated financial statements for more information on tax loss carryforwards.
Loss from Discontinued Operations
We reported an after-tax loss from discontinued operations of $6,118 for the year ended December 31, 2011. The loss reflected a loss on the disposal of DigiNotar B.V. of $3,962 and a loss from DigiNotar’s operations of $2,156. As described in Note 3 of the financial statements, the loss on disposal of DigiNotar B.V. included the following losses on an after-tax basis:
| Gain (Loss) | ||||
| Writeoff of goodwill |
$ | (2,643 | ) | |
| Writeoff of intangible assets |
(2,122 | ) | ||
| Writeoff of intercompany receivable |
(952 | ) | ||
| Professional fees |
(599 | ) | ||
| Reversal of DigiNotar’s net liabilities |
1,317 | |||
| A decrease in contingent consideration |
1,037 | |||
|
|
|
|||
| Total loss on disposal of DigiNotar |
$ | (3,962 | ) | |
|
|
|
|||
The decrease in contingent consideration reflects the amount that is expected to be recovered from the escrow agent that is holding funds associated with the original purchase transaction due to the fact that DigiNotar B.V. will not be able to achieve the earnings target established in the original purchase agreements.
We did not write off any of the intellectual property that we purchased prior to the purchase of the stock of DigiNotar. We believe that we will be able to strengthen our authentication product lines using the PKI technology we acquired from DigiNotar.
Note 3 of the consolidated financial statements contains additional information about the discontinued operations. See Part I, Item 1A – Risk Factors and Part I, Item 3 - Legal Proceedings for additional information related to DigiNotar B.V.
Liquidity and Capital Resources
At December 31, 2011, we had net cash balances (total cash, cash equivalents and restricted cash less bank borrowings), totaling $84,497. We had no outstanding debt or restricted cash at December 31, 2011.
50
Table of Contents
At December 31, 2011, we held $68,935 of cash in banks outside of the United States. Of that amount, $67,941 is not subject to significant repatriation restrictions, but may be subject to taxes upon repatriation. We have not provided for taxes on our unremitted foreign earnings as we consider them to be permanently invested.
Cash provided by operating activities was $17,918 during the year ended December 31, 2011. During 2011, we used $9,784 for investing activities, primarily for the acquisition of the intellectual property of DigiNotar, the acquisition of the stock of Alfa & Ariss and additions to property and equipment, and provided $153 from financing activities, primarily consisting of proceeds from the exercise of stock options. Capital expenditures were $1,132 for the year ended December 31, 2011.
Cash provided by operating activities was $21,083 during the year ended December 31, 2010. During 2010, we used $1,772 for investing activities, primarily for additions to property and equipment, and provided $3 in financing activities from the exercise of stock options. Capital expenditures were $1,417 for the year ended December 31, 2010.
The net effect of 2011 activity resulted in a decrease in net cash of $1,036 and a net cash balance of $84,497 at December 31, 2011, compared to $85,533 at the end of 2010. Our working capital at December 31, 2011 was $108,590, an increase of $11,701 or 12% from $96,889 at December 31, 2010. The change is primarily attributable to the generation of positive cash flow from operations in 2011. Our current ratio was 4.5 to 1.0 at December 31, 2011. We believe that our current cash balances and the anticipated cash generated from operations, including deposits received on orders of DIGIPASSES to be delivered in 2012, will be sufficient to meet our anticipated cash needs for the next 12 months.
The net effect of 2010 activity resulted in an increase in net cash of $17,932 and a net cash balance of $85,533 at December 31, 2010, compared to $67,601 at the end of 2009. Our working capital at December 31, 2010 was $96,889, an increase of $9,257 or 11% from $87,632 at December 31, 2009. The change is primarily attributable to the generation of positive cash flow from operations in 2010. Our current ratio was 4.8 to 1.0 at December 31, 2010.
We believe that our financial resources are adequate to meet our operating needs over the next twelve months.
While we believe that our financial resources are adequate to meet our operating needs over the next twelve months, we anticipate that the difficult current economic conditions that exist on a worldwide basis today may require us to modify our business plans. In the current economic environment there is a risk that customers may delay their orders until the economic conditions stabilize or improve further. If a significant number of orders are delayed for an indefinite period of time, our revenue and cash receipts may not be sufficient to meet the operating needs of the business. If this is the case, we may need to significantly reduce our workforce, sell certain of our assets, enter into strategic relationships or business combinations, discontinue some or all of our operations, or take other similar restructuring actions. While we expect that these actions would result in a reduction of recurring costs, they also may result in a reduction of recurring revenue and cash receipts. It is also likely that we would incur substantial non-recurring costs to implement one or more of these restructuring actions. See our “Risks Related to Our Business” in Part I, Item 1A, Risk Factors.
Off-Balance Sheet Arrangements
The company has no off-balance sheet arrangements.
51
Table of Contents
Contractual Obligations
The company has the following contractual obligations:
| Payments due by period | ||||||||||||||||||||
| Total | Less than 1 year |
1-3 years |
3-5 years |
More than 5 years |
||||||||||||||||
| Operating lease obligations |
$ | 12,860 | $ | 3,190 | $ | 5,004 | $ | 3,429 | $ | 1,237 | ||||||||||
| Purchase obligations |
$ | 17,572 | 17,572 | 0 | 0 | 0 | ||||||||||||||
| Warranty reserve |
$ | 36 | 36 | 0 | 0 | 0 | ||||||||||||||
|
|
|
|
|
|
|
|
|
|
|
|||||||||||
| $ | 30,468 | $ | 20,798 | $ | 5,004 | $ | 3,429 | $ | 1,237 | |||||||||||
|
|
|
|
|
|
|
|
|
|
|
|||||||||||
The company had $470 of unrecognized tax benefits as of both December 31, 2011 and 2010, respectively, which have been set aside in a reserve in accordance with ASC 740-10. These amounts are not included in the above table as the timing of payment of such obligations, if any, is not determinable.
Critical Accounting Policies and Estimates
Management’s Discussion and Analysis of Financial Condition and Results of Operations discusses our consolidated financial statements, which have been prepared in accordance with accounting principles generally accepted in the U.S. The preparation of these financial statements requires management to make estimates and assumptions that affect the reported amounts of assets and liabilities and the disclosure of contingent assets and liabilities at the date of the consolidated financial statements and the reported amounts of revenue and expenses during the reporting period.
On an on-going basis, management evaluates its estimates and judgments, including those related to bad debts, net realizable value of inventory and intangible assets. Management bases its estimates and judgments on historical experience and on various other factors that are believed to be reasonable under the circumstances, the results of which form the basis for making judgments about the carrying values of assets and liabilities that are not readily apparent from other sources. Actual results may differ from these estimates under different assumptions or conditions. Management believes the following critical accounting policies, among others, affect its more significant judgments and estimates used in the preparation of its consolidated financial statements.
Revenue Recognition
We recognize revenue in accordance with Financial Accounting Standards Board (“FASB”) Accounting Standards Codification (“ASC”) 985-605, Software – Revenue Recognition, ASC 985-605-25, Revenue Recognition – Multiple Element Arrangements and Staff Accounting Bulletin 104. Revenue is recognized when there is persuasive evidence that an arrangement exists, delivery has occurred, the fee is fixed or determinable and collection of the revenue is probable.
Effective January 1, 2011, we adopted Accounting Standards Update (ASU) 2009-13, Multiple-Deliverable Revenue Arrangements- a consensus of the FASB Emerging Issues Task Force, which amended ASC 985-605-25, and ASU 2009-14, Certain Revenue Arrangements That Include Software Elements, which amended ASC 985-605. In multiple-element arrangements, the adoption of these two ASUs will result in some of our products continuing to be accounted for under the software provisions of ASC 985-605 and others to be accounted for under the provisions that relate to the sale of non-software products.
In our typical multiple-element arrangement, the primary deliverables include:
| 1. | a client component (i.e., an item that is used by the person being authenticated in the form of either a new standalone hardware device or software that is downloaded onto a device the customer already owns), |
52
Table of Contents
| 2. | host system software that is installed on the customer’s systems (i.e., software on the host system that verifies the identity of the person being authenticated) or licenses for additional users on the host system software if the host system software had been installed previously, and |
| 3. | post contract support (PCS) in the form of maintenance on the host system software or support. |
Our multiple-element arrangements may also include other items that are usually delivered prior to the recognition of any revenue and incidental to the overall transaction such as initialization of the hardware device, customization of the hardware device itself or the packaging in which it is delivered, deployment services where we deliver the device to our customer’s end-use customer or employee and, in some limited cases, professional services to assist with the initial implementation of a new customer.
Effective January 1, 2011 with the adoption of ASU 2009-13 and 14 there was no change in the units of accounting, but there was a change in the method we use to allocate the revenue among the elements included in the arrangement.
In multiple-element arrangements that include a hardware client device, we allocate the selling price among all elements, delivered and undelivered, based on our internal price lists and the percentage of the selling price of that element, per the price list, to the total of the estimated selling price of all of the elements per the price list. Our internal price lists for both delivered and undelivered elements were determined to be reasonable estimates of the selling price of each element based on a comparison of actual sales made to the price list for each item delivered and to vendor specific objective evidence (VSOE) for undelivered items.
Undelivered elements primarily are PCS. The method by which we determine VSOE has validated that the price lists are reasonable estimates of the selling price for PCS. The estimated selling price of PCS items is based on an established percentage of the user license fee attributable to the specific software and is applied consistently to all PCS arrangements. The percentage we use to establish VSOE, which is also generally consistent with the percentage used in the price list, is developed using the “bell curve method”. This method relies on historical data to show that at least 80% of all our renewals are within 15% of the median renewal percentage rate.
In multiple-element arrangements that include a software client device, we continue to account for each element under the current standards of ASC 985-605 related to software. When software client device and host software are delivered elements, we use the Residual Method (ASC 605-25) for determining the amount of revenue to recognize for token and software licenses if we have VSOE for all of the undelivered elements. Any discount provided to the customer is applied fully to the delivered elements in such an arrangement. VSOE of fair value of PCS agreements is based on customer renewal transactions on a worldwide basis. In sales arrangements where VSOE of fair value has not been established, revenue for all elements is deferred and amortized over the life of the arrangement.
We do not expect a significant change in the pattern or timing of revenue recognition. The adoption of ASU 2009-13 and 14 did not have a significant impact on the recognition of revenue for the three and twelve months ended December 31, 2011 and is not expected to have a material impact on the recognition of future revenues.
For transactions other than multiple-element arrangements, we recognize revenue as follows:
| 1. | Hardware Revenue and License Fees: Revenue from the sale of computer security hardware or the license of software is recorded upon shipment or, if an acceptance period is allowed, at the latter of shipment or customer acceptance. No significant obligations or contingencies exist with regard to delivery, customer acceptance or rights of return at the time revenue is recognized. |
| 2. | Maintenance and Support Agreements: Maintenance and support agreements generally call for us to provide software updates and technical support, respectively, to customers. Revenue on maintenance and technical support is deferred and recognized ratably over the term of the applicable maintenance and support agreement. |
53
Table of Contents
| 3. | Services: Subscription revenue is recognized ratably over the period in which the service is provided. |
| 4. | Consulting and Education Services: We provide consulting and education services to our customers. Revenue from such services is recognized during the period in which the services are performed. |
We recognize revenue from sales to distributors and resellers on the same basis as sales made directly to customers. We recognize revenue when there is persuasive evidence that an arrangement exists, delivery has occurred, the fee is fixed or determinable and collection of the revenue is probable.
For large-volume transactions, we may negotiate a specific price that is based on the number of users of the software license or quantities of hardware supplied. The per unit prices for large-volume transactions are generally lower than transactions for smaller quantities and the price differences are commonly referred to as volume-purchase discounts.
All revenue is reported on a net basis, excluding any sales taxes or value added taxes.
Allowance for Doubtful Accounts
We maintain allowances for doubtful accounts for estimated losses resulting from the inability of our customers to make payments for goods and services. We analyze accounts receivable, customer credit-worthiness, current economic trends and changes in our customer payment terms when evaluating the adequacy of the allowance for doubtful accounts. The allowance is based on a specific review of all significant past-due accounts. If the financial condition of our customers deteriorates, resulting in an impairment of their ability to make payments, additional allowances may be required.
Net Realizable Value of Inventory
We write down inventory where it appears that the carrying cost of the inventory may not be recovered through subsequent sale of the inventory. We analyze the quantity of inventory on hand, the quantity sold in the past year, the anticipated sales volume in the form of sales to new customers as well as sales to previous customers, the expected sales price and the cost of making the sale when evaluating the valuation of our inventory. If the sales volume or sales price of a specific model declines significantly, additional write-downs may be required.
Valuation of Goodwill and Other Intangible Assets and Software Development Costs
Impairment of Long-Lived and Intangible Assets:
Definite-lived intangible assets include proprietary technology and other intangible assets. Intangible assets other than patents with definite lives are amortized over the useful life, generally three to seven years for proprietary technology. Patents are amortized over the life of the patent, generally 20 years in the U.S.
Long-lived assets, including property, plant and equipment, definite-lived intangible assets being amortized and capitalized software costs, are reviewed for impairment in accordance with ASC 360-10, Property, Plant and Equipment, whenever events or changes in circumstances indicate that the carrying amount of the long-lived asset may not be recoverable. An impairment loss shall be recognized if the carrying amount of a long-lived asset exceeds the sum of the undiscounted cash flows expected to result from the use and eventual disposition of the asset. If it is determined that an impairment loss has occurred, the loss is measured as the amount by which the carrying amount of the long-lived asset exceeds its fair value. Long-lived assets held for sale are reported at the lower of carrying value or fair value less cost to sell.
54
Table of Contents
Goodwill and other Intangible Assets:
We account for goodwill and indefinite-lived intangible assets in accordance with ASC 350-20, Intangibles-Goodwill and Other. We assess the impairment of goodwill and intangible assets with indefinite lives each year as of the end of November or whenever events or changes in circumstances indicate that the carrying value may not be recoverable. Factors considered important which could trigger an impairment review include significant underperformance relative to expected historical or projected future operating results, significant changes in the manner of our use of the acquired assets or the strategy for our overall business, and significant negative industry or economic trends. Once identified, the amount of the impairment is computed by comparing the carrying value of the assets to the fair value, which is based on the discounted estimated future cash flows.
As further described in Note 3 to the consolidated financial statements, the bankruptcy of DigiNotar B.V. triggered an impairment review. As a result of the impairment review, we concluded that goodwill and other intangibles of DigiNotar were impaired and recorded non-cash impairment charges of $2,873 for goodwill and $2,307 for other intangibles. We have not recognized any impairment for the years ended December 31 2010 or 2009 as the fair value of our reporting unit substantially exceeded the carrying amount.
Income Taxes:
At December 31, 2011, we had U.S. NOL carryforwards of $9,907, foreign NOL carryforwards of $5,535, and $2,770 of other deductible foreign carryforwards. ASC 740-10 requires that valuation allowances be established for deferred tax assets if it is more likely than not that the assets will not be realized. We have provided valuation allowances against a substantial portion of the foreign NOLs and carryforwards. (See Note 7 to the consolidated financial statements for more information regarding the NOL and valuation allowance.)
Also in accordance with ASC 740-10, we have established a reserve related to tax benefits of uncertain tax positions. We have identified one exposure concerning cost allocations used in the implementation of our worldwide strategy related to the ownership of our intellectual property for which we had a reserve of $470 at both December 31, 2011 and 2010, each of which is an offset to our U.S. deferred tax asset at the end of each respective period.
Recently Issued Accounting Pronouncements
From time to time, new accounting pronouncements are issued by the FASB or other standard setting bodies that are adopted by us as of the specified effective date. Unless otherwise discussed, our management believes that the impact of recently issued standards that are not yet effective will not have a material impact on our consolidated financial statements upon adoption.
55
Table of Contents
Item 7A - Quantitative and Qualitative Disclosures about Market Risk (In thousands)
Foreign Currency Exchange Risk – In 2011, approximately 90% of our business was conducted outside the United States, primarily in Europe, Latin America and Asia/Pacific. A significant portion of our business operations is transacted in foreign currencies. As a result, we have exposure to foreign exchange fluctuations. We are affected by both foreign currency translation and transaction adjustments. Translation adjustments result from the conversion of the foreign subsidiaries’ balance sheets and income statements to U.S. Dollars at year-end exchange rates and weighted average exchange rates, respectively. Translation adjustments resulting from this process are recorded directly into stockholders’ equity. Transaction adjustments result from currency exchange movements when one of our companies transacts business in a currency that differs from its local currency. These adjustments are recorded as gains or losses in our statements of operations. Our business transactions are spread across numerous countries and currencies. This geographic diversity reduces the risk to our operating results. As noted in Management’s Discussion and Analysis above, we attempt to minimize the net impact of currency on operating earnings by denominating an amount of billings in a currency such that it would provide a hedge against the operating expenses being incurred in that currency.
Interest Rate Risk – We have minimal interest rate risk. We had no debt outstanding at December 31, 2011. Our cash is invested in short-term instruments at current market rates. If rates were to increase or decrease by one percentage point, the company’s interest income would increase or decrease approximately $845 annually.
Impairment Risk – At December 31, 2011, we had goodwill of $12,910 and other intangible assets of $8,091, primarily related to the acquisition of the intellectual property of DigiNotar and the acquisition of the stock of Alfa & Ariss in 2011 and the acquisition of the stock of Logico Smart Card Solutions GmbH and its subsidiary, Logico Vertriebs GmbH, and Able N.V. in 2006. We will assess the net realizable value of goodwill at least annually, and we will also assess the net realizable value of other intangible assets whenever events or circumstances change indicating that the carrying value may not be recoverable. As noted above in the discussion of Loss from Discontinued Operations in Management’s Discussion and Analysis, we experienced an impairment in 2011 in the value of the certain intangible assets related to DigiNotar due to termination of DigiNotar B.V.’s registration as a certificate service provider and the bankruptcy filing of DigiNotar B.V. See Note 3 to the consolidated financial statements for additional information on the impairment. We may incur additional impairment charges in future periods.
Item 8 - Financial Statements and Supplementary Data
The information in response to this item is included in our consolidated financial statements, together with the report thereon of KPMG LLP, appearing on pages F-1 through F-27 of this Form 10-K, and in Item 7 under the heading Management’s Discussion and Analysis of Financial Condition and Results of Operations.
Item 9 - Changes in and Disagreements with Accountants on Accounting and Financial Disclosure
None.
Item 9A - Controls and Procedures
Evaluation of Disclosure Controls and Procedures
Our management, with the participation of our Chief Executive Officer and Chief Financial Officer, who, respectively, are our principal executive officer and principal financial officer, conducted an evaluation of the effectiveness of our disclosure controls and procedures (as defined in Rule 13a-15(e) and Rule 15d-15(e) under the Securities Exchange Act of 1934, as amended (the “Exchange Act”)) as of the end of the fiscal quarter ended December 31, 2011. Based on that evaluation, our Chief Executive Officer and Chief Financial Officer concluded that as of the end of the end of the fiscal quarter ended December 31, 2011, our disclosure controls
56
Table of Contents
and procedures were effective to provide assurance that (i) the information required to be disclosed by us in our reports that we file or submit under the Exchange Act is recorded, processed, summarized and reported within the time periods specified in the SEC’s rules and forms, and (ii) information required to be disclosed by us in our reports that we file or submit under the Exchange Act is accumulated and communicated to our management, including our principal executive and principal financial officers, or persons performing similar functions, as appropriate to allow timely decisions regarding required disclosure.
Changes in Internal Controls
There were no changes in the company’s internal control over financial reporting (as defined in Rule 13a-15(f) and 15d-15(f) under the Exchange Act) during the fiscal quarter ended December 31, 2011, that have materially affected, or are reasonably likely to materially affect, the company’s internal control over financial reporting.
Management’s Annual Report on Internal Control over Financial Reporting
The management of VASCO Data Security International, Inc. is responsible for establishing and maintaining adequate internal control over financial reporting. Our internal control system was designed to provide reasonable assurance to the company’s management and board of directors regarding the preparation and fair presentation of published financial statements. Internal control over financial reporting is defined in Rule 13a-15(f) or 15d-15(f) promulgated under the Exchange Act as a process designed by, or under the supervision of, the company’s principal executive and principal financial officers and effected by the company’s board of directors, management and other personnel, to provide reasonable assurance regarding the reliability of financial reporting and the preparation of financial statements for external purposes in accordance with generally accepted accounting principles and includes those policies and procedures that:
| • | Pertain to the maintenance of records that in reasonable detail accurately and fairly reflect the transactions and dispositions of the assets of the company; |
| • | Provide reasonable assurance that transactions are recorded as necessary to permit preparation of financial statements in accordance with generally accepted accounting principles, and that receipts and expenditures of the company are being made only in accordance with authorizations of management and directors of the company; and |
| • | Provide reasonable assurance regarding prevention or timely detection of unauthorized acquisition, use or disposition of the company’s assets that could have a material effect on the financial statements. |
Our management, including our Chief Executive Officer and Chief Financial Officer, do not expect that our disclosure controls and procedures or internal control over financial reporting will prevent all error and all fraud. While our disclosure controls and procedures and internal control over financial reporting are designed to provide reasonable assurance that their objectives are met, they cannot provide absolute assurance. The design of a control system must reflect the fact that there are resource constraints, and the benefits of controls must be considered relative to their costs. Because of the inherent limitations in all control systems, no evaluation of controls can provide absolute assurance that all control issues within a company are detected. The inherent limitations include the realities that judgments in decision-making can be faulty, and that breakdowns can occur because of simple errors or mistakes. Controls can also be circumvented by the individual acts of some persons, by collusion of two or more people or by management override of the controls. Because of the inherent limitations in a cost-effective control system, misstatements due to error or fraud may occur and may not be detected.
Notwithstanding the limitations noted above, our principal executive officer and principal financial officer have both concluded that our disclosure controls and procedures and internal control over financial reporting were effective at a reasonable level of assurance as of December 31, 2011.
57
Table of Contents
Our management assessed the effectiveness of its internal control over financial reporting as of December 31, 2011. In making this assessment, it used the criteria based on the framework set forth by the Committee of Sponsoring Organizations of the Treadway Commission on Internal Controls – Integrated Framework (COSO). Based on our assessments we believe that, as of December 31, 2011, our internal control over financial reporting is effective based on those criteria.
Our independent registered public accounting firm, KPMG LLP, has issued an audit report on the effectiveness of our internal control over financial reporting. This report appears below.
58
Table of Contents
Report of Independent Registered Public Accounting Firm
The Board of Directors and Stockholders
VASCO Data Security International, Inc.:
We have audited VASCO Data Security International, Inc.’s internal control over financial reporting as of December 31, 2011, based on criteria established in Internal Control—Integrated Framework issued by the Committee of Sponsoring Organizations of the Treadway Commission (COSO). VASCO Data Security International, Inc.’s management is responsible for maintaining effective internal control over financial reporting and for its assessment of the effectiveness of internal control over financial reporting, included in the accompanying Management’s Annual Report on Internal Control over Financial Reporting. Our responsibility is to express an opinion on the Company’s internal control over financial reporting based on our audit.
We conducted our audit in accordance with the standards of the Public Company Accounting Oversight Board (United States). Those standards require that we plan and perform the audit to obtain reasonable assurance about whether effective internal control over financial reporting was maintained in all material respects. Our audit included obtaining an understanding of internal control over financial reporting, assessing the risk that a material weakness exists, and testing and evaluating the design and operating effectiveness of internal control based on the assessed risk. Our audit also included performing such other procedures as we considered necessary in the circumstances. We believe that our audit provides a reasonable basis for our opinion.
A company’s internal control over financial reporting is a process designed to provide reasonable assurance regarding the reliability of financial reporting and the preparation of financial statements for external purposes in accordance with generally accepted accounting principles. A company’s internal control over financial reporting includes those policies and procedures that (1) pertain to the maintenance of records that, in reasonable detail, accurately and fairly reflect the transactions and dispositions of the assets of the company; (2) provide reasonable assurance that transactions are recorded as necessary to permit preparation of financial statements in accordance with generally accepted accounting principles, and that receipts and expenditures of the company are being made only in accordance with authorizations of management and directors of the company; and (3) provide reasonable assurance regarding prevention or timely detection of unauthorized acquisition, use, or disposition of the company’s assets that could have a material effect on the financial statements.
Because of its inherent limitations, internal control over financial reporting may not prevent or detect misstatements. Also, projections of any evaluation of effectiveness to future periods are subject to the risk that controls may become inadequate because of changes in conditions, or that the degree of compliance with the policies or procedures may deteriorate.
In our opinion, VASCO Data Security International, Inc. maintained, in all material respects, effective internal control over financial reporting as of December 31, 2011, based on criteria established in Internal Control—Integrated Framework issued by the Committee of Sponsoring Organizations of the Treadway Commission.
We also have audited, in accordance with the standards of the Public Company Accounting Oversight Board (United States), the consolidated balance sheets of VASCO Data Security International, Inc. and subsidiaries as of December 31, 2011 and 2010, and the related consolidated statements of operations, comprehensive income, stockholders’ equity, and cash flows for each of the years in the three-year period ended December 31, 2011, and our report dated March 9, 2012 expressed an unqualified opinion on those consolidated financial statements.
/s/ KPMG LLP
Chicago, Illinois
March 9, 2012
59
Table of Contents
None.
60
Table of Contents
PART III
Item 10 - Directors, Executive Officers and Corporate Governance
All information in response to this Item is incorporated by reference to the “Directors and Executive Officers” and “Section 16(a) Beneficial Ownership Compliance” sections of VASCO’s Proxy Statement for the 2012 Annual Meeting of Stockholders.
Item 11 - Executive Compensation
The information in response to this Item is incorporated by reference to the “Executive Compensation” section of VASCO’s Proxy Statement for the 2012 Annual Meeting of Stockholders.
Item 12 - Security Ownership of Certain Beneficial Owners and Management and Related Stockholder Matters
The information in response to this Item is incorporated by reference to the “Security Ownership of Certain Beneficial Owners, Directors and Management” section of VASCO’s Proxy Statement for the 2012 Annual Meeting of Stockholders.
Item 13 - Certain Relationships and Related Transactions, and Director Independence
The information in response to this Item is incorporated by reference to the “Directors and Executive Officers” and “Transactions with Related Persons” sections of VASCO’s Proxy Statement for the 2012 Annual Meeting of Stockholders.
Item 14 - Principal Accounting Fees and Services
The information in response to this Item is incorporated by reference to the “Report of the Audit Committee” section of VASCO’s Proxy Statement for the 2012 Annual Meeting of Stockholders.
61
Table of Contents
PART IV
Item 15 - Exhibits and Financial Statement Schedules
(a) The following documents are filed as part of this Form 10-K.
(1) The following consolidated financial statements and notes thereto, and the related independent auditors’ report, are included on pages F-1 through F-26 of this Form 10-K:
Report of Independent Registered Public Accounting Firm
Consolidated Balance Sheets as of December 31, 2011 and 2010
Consolidated Statements of Operations for the Years Ended December 31, 2011, 2010 and 2009
Consolidated Statements of Comprehensive Income for the Years Ended December 31, 2011, 2010 and 2009
Consolidated Statements of Stockholders’ Equity for the Years Ended December 31, 2011, 2010 and 2009
Consolidated Statements of Cash Flows for the Years Ended December 31, 2011, 2010 and 2009
Notes to Consolidated Financial Statements
(2) The following consolidated financial statement schedule of the company is included on page F-27 of this Form 10-K:
Schedule II – Valuation and Qualifying Accounts
All other financial statement schedules are omitted because such schedules are not required or the information required has been presented in the aforementioned consolidated financial statements.
(3) The following exhibits are filed with this Form 10-K or incorporated by reference as set forth at the end of the list of exhibits:
| Exhibit |
Description | |
| 2.1 | IP Purchase Agreement between VASCO Data Security International GmbH and DigiNotar Technologie B.V., DigiNotar Notariaat B.V., DigiNotar B.V., and DigiNotar Holding B.V. dated January 10, 2011. (Incorporated by reference - Form 8K filed January 14, 2011.) | |
| 2.2 | Share Sale and Purchase Agreement between VASCO Data Security International GmbH and DigiNotar Holding B.V., DigiNotar B.V., and DigiNotar Notariaat B.V. dated January 10, 2011. (Incorporated by reference - Form 8K filed January 14, 2011.) | |
| 2.3 | Agreement between VASCO Data Security International GmbH and D.B.A. ten Burg Holding B.V. and Bosco Holding B.V. dated January 10, 2011. (Incorporated by reference - Form 8K filed January 14, 2011.) | |
| 3.1 | Certificate of Incorporation of Registrant, as amended. (Incorporated by reference to the Registrant’s Registration Statement on Form S-4, as amended (Registration No. 333-35563), originally filed on September 12, 1997.) | |
| 3.2 | Bylaws of Registrant, as amended and restated December 12, 2007. (Incorporated by reference -Form 8-K filed on December 18, 2007.) | |
| 4.1 | Specimen of Registrant’s Common Stock Certificate. (Incorporated by reference to the Registrant’s Registration Statement on Form S-4, as amended (Registration No. 333-35563), originally filed on September 12, 1997.) | |
62
Table of Contents
| Exhibit |
Description | |
| 4.2* | Form of Award Agreement for Stock Option Grant under the VASCO Data Security International, Inc. 1997 Stock Compensation Plan, as Amended and Restated. (Incorporated by reference -Form 10-K filed March 14, 2008.) | |
| 4.3* | Form of Award Agreement for Restricted Shares under the VASCO Data Security International, Inc. 1997 Stock Compensation Plan, as Amended and Restated (time-based vesting) with respect to awards granted on January 9, 2008. (Incorporated by reference - Form 8-K/A filed January 16, 2008.) | |
| 4.4* | Form of Award Agreement for Restricted Shares under the VASCO Data Security International, Inc. 1997 Stock Compensation Plan as Amended and Restated (performance-based vesting) with respect to awards granted on January 9, 2008. (Incorporated by reference - Form 8-K/A filed January 16, 2008.) | |
| 4.5* | Form of Award Agreement for Deferred Stock under the VASCO Data Security International, Inc. 1997 Stock Compensation Plan, as Amended and Restated (performance-based vesting). (Incorporated by reference - Form 10-K filed March 14, 2008.) | |
| 4.6* | Form of Award Agreement for Restricted Shares under the VASCO Data Security International, Inc. 1997 Stock Compensation Plan, as Amended and Restated (time-based vesting) with respect to awards granted on or after January 8, 2009. (Incorporated by reference - Form 8K filed January 14, 2009.) | |
| 4.7* | Form of Award Agreement for Restricted Shares under the VASCO Data Security International, Inc. 1997 Stock Compensation Plan as Amended and Restated (performance-based vesting) with respect to awards granted on or after January 8, 2009. (Incorporated by reference - Form 8-K filed January 14, 2009.) | |
| 4.8* | Form of Option Agreement under the VASCO Data Security International, Inc. 1997 Stock Compensation Plan as Amended and Restated with respect to awards granted prior to January 9, 2008. (Incorporated by reference to the Registrant’s Registration Statement on Form S-4, as amended (Registration No. 333-35563), originally filed with the Securities and Exchange Commission on September 12, 1997.) | |
| 4.9* | Form of Award Agreement for Deferred Stock under the VASCO Data Security International, Inc. 2009 Equity Incentive Plan. (Incorporated by reference - Form 10-K filed March 16, 2010.) | |
| 4.10* | Form of Award Agreement for Restricted Shares under the VASCO Data Security International, Inc. 2009 Equity Incentive Plan. (Incorporated by reference - Form 10-K filed March 16, 2010.) | |
| 4.11* | Form of Award Agreement for Performance Shares under the VASCO Data Security International, Inc. 2009 Equity Incentive Plan with respect to awards granted in 2010. (Incorporated by reference - Form 10-K filed March 16, 2010.) | |
| 4.12* | Form of Award Agreement for Performance Shares under the VASCO Data Security International, Inc. 2009 Equity Incentive Plan with respect to awards granted in 2011. (Incorporated by reference - Form 10-K filed March 11, 2011.) | |
| 4.13* | Form of Award Agreement for Performance Shares under the VASCO Data Security International, Inc. 2009 Equity Incentive Plan with respect to awards granted in 2012. | |
| 10.1* | 1997 VASCO Data Security International, Inc. Stock Compensation Plan, as Amended and Restated. (Incorporated by reference to the Registrant’s Definitive Proxy Statement pursuant to Schedule 14A, filed with the SEC on April 30, 1999.) | |
| 10.2* | Employment agreement with T. Kendall Hunt. (Incorporated by reference to the Registrant’s Annual Report on Form 10-K, originally filed with the Securities and Exchange Commission on March 31, 2003.) | |
63
Table of Contents
| Exhibit |
Description | |
| 10.3* | Employment agreement with Clifford Bown. (Incorporated by reference to the Registrant’s Annual Report on Form 10-K, originally filed with the Securities and Exchange Commission on March 31, 2003.) | |
| 10.4 | Share Sale and Purchase Agreement by and among VASCO Data Security International, Inc., A.O.S. Holding B.V., Filipan Beheer B.V., Mr. Mladen Filipan and Pijnenburg Beheer N.V., dated February 4, 2005 (Incorporated by reference - Form 8-K filed February 8, 2005.) | |
| 10.5* | Employment Agreement by and between VASCO Data Security International, Inc. and Jan Valcke effective as of January 1, 2005. (Incorporated by reference - Form 8-K filed July 1, 2005.) | |
| 10.6* | Letter agreement dated February 26, 2007, supplementing the Employment Agreement dated January 1, 2003, between the company and Clifford K. Bown. (Incorporated by reference - Form 8K filed March 2, 2007.) | |
| 10.7* | Letter agreement dated January 8, 2009, supplementing the Employment Agreement dated January 1, 2003, between the company and Clifford K. Bown. (Incorporated by reference - Form 8K filed January 14, 2009.) | |
| 10.8* | Employment Agreement Amendment, dated December 31, 2008 by and between VASCO Data Security International, Inc. and T. Kendall Hunt (Incorporated by reference - Form 8-K filed January 14, 2009.) | |
| 10.9* | Employment Agreement Amendment, dated December 31, 2008 by and between VASCO Data Security International, Inc. and Clifford K. Bown (Incorporated by reference - Form 8-K filed January 14, 2009.) | |
| 10.10* | Amendment to the VASCO Data Security International, Inc. 1997 Stock Compensation Plan, dated December 19, 2008. (Incorporated by reference - Form 8-K filed January 14, 2009.) | |
| 10.11* | VASCO Data Security International, Inc. 2009 Equity Incentive Plan, effective December 19, 2008. (Incorporated by reference to the Registrant’s Definitive Proxy Statement pursuant to Schedule 14A, filed with the SEC on April 30, 2009.) | |
| 10.12* | VASCO Data Security International, Inc. Executive Incentive Compensation Plan, effective December 19, 2008. (Incorporated by reference to the Registrant’s Definitive Proxy Statement pursuant to Schedule 14A, filed with the SEC on April 30, 2009.) | |
| 10.13* | Amended and Restated Employment Agreement effective as of January 1, 2011 between VASCO Data Security International, Inc. and T. Kendall Hunt. (Incorporated by reference - Form 8-K filed April 27, 2010.) | |
| 10.14* | Letter Agreement dated February 15, 2011, by and between VASCO Data Security International, Inc. and T. Kendall Hunt. (Incorporated by reference - Form 8-K filed February 15, 2011.) | |
| 14.1 | VASCO Data Security International, Inc. and Subsidiaries Code of Conduct and Ethics. (Incorporated by reference - Form 8-K filed March 12, 2008.) | |
| 14.2 | Amended VASCO Data Security International, Inc. and Subsidiaries Code of Conduct and Ethics. (Incorporated by reference - Form 8-K filed April 27, 2010.) | |
| 21 | Subsidiaries of Registrant. | |
| 23 | Consent of KPMG LLP. | |
| 31.1 | Rule 13a-14(a)/15d-14(a) Certification of Principal Executive Officer pursuant to Section 302 of the Sarbanes-Oxley Act of 2002, dated March 9, 2012. | |
64
Table of Contents
| Exhibit |
Description | |
| 31.2 | Rule 13a-14(a)/15d-14(a) Certification of Principal Financial Officer pursuant to Section 302 of the Sarbanes-Oxley Act of 2002, dated March 9, 2012. | |
| 32.1 | Section 1350 Certification of Principal Executive Officer pursuant to Section 906 of the Sarbanes-Oxley Act of 2002, dated March 9, 2012. | |
| 32.2 | Section 1350 Certification of Principal Financial Officer pursuant to Section 906 of the Sarbanes-Oxley Act of 2002, dated March 9, 2012. | |
| 101.INS | XBRL Instance Document | |
| 101.SCH | XBRL Taxonomy Extension Schema Document | |
| 101.CAL | XBRL Taxonomy Extension Calculation Linkbase Document | |
| 101.LAB | XBRL Taxonomy Extension Label Linkbase Document | |
| 101.PRE | XBRL Taxonomy Extension Presentation Linkbase Document | |
| 101.DEF | XBRL Taxonomy Extension Definition Linkbase Document | |
| * | Management contract or compensatory plan or arrangement required to be filed as an exhibit to this Annual Report on Form 10-K. |
(b) VASCO Data Security International, Inc. will furnish any of the above exhibits to its stockholders upon written request addressed to the Secretary at the address given on the cover page of this Form 10-K. The charge for furnishing copies of the exhibits is $0.25 per page, plus postage.
65
Table of Contents
VASCO Data Security International, Inc.
INDEX TO FINANCIAL STATEMENTS AND SCHEDULE
| Financial Statements |
||||
| F-2 | ||||
| Consolidated Balance Sheets as of December 31, 2011 and 2010 |
F-3 | |||
| Consolidated Statements of Operations for the Years Ended December 31, 2011, 2010 and 2009 |
F-4 | |||
| Consolidated Statements of Comprehensive Income for the Years Ended December 31, 2011, 2010 and 2009 |
F-5 | |||
| Consolidated Statements of Stockholders’ Equity for the Years Ended December 31, 2011, 2010 and 2009 |
F-6 | |||
| Consolidated Statements of Cash Flows for the Years Ended December 31, 2011, 2010 and 2009 |
F-7 | |||
| F-8 | ||||
| Financial Statement Schedule |
||||
| The following financial statement schedule is included herein: |
||||
| F-27 | ||||
All other financial statement schedules are omitted because they are not applicable or the required information is shown in the consolidated financial statements or notes thereto.
F-1
Table of Contents
Report of Independent Registered Public Accounting Firm
The Board of Directors and Stockholders
VASCO Data Security International, Inc.:
We have audited the accompanying consolidated balance sheets of VASCO Data Security International, Inc. and subsidiaries (the Company) as of December 31, 2011 and 2010, and the related consolidated statements of operations, comprehensive income, stockholders’ equity, and cash flows for each of the years in the three-year period ended December 31, 2011. In connection with our audits of the consolidated financial statements, we also have audited the accompanying consolidated financial statement Schedule II – Valuation and Qualifying Accounts. These consolidated financial statements and the consolidated financial statement schedule are the responsibility of the Company’s management. Our responsibility is to express an opinion on these consolidated financial statements and the consolidated financial statement schedule based on our audits.
We conducted our audits in accordance with the standards of the Public Company Accounting Oversight Board (United States). Those standards require that we plan and perform the audit to obtain reasonable assurance about whether the financial statements are free of material misstatement. An audit includes examining, on a test basis, evidence supporting the amounts and disclosures in the financial statements. An audit also includes assessing the accounting principles used and significant estimates made by management, as well as evaluating the overall financial statement presentation. We believe that our audits provide a reasonable basis for our opinion.
In our opinion, the consolidated financial statements referred to above present fairly, in all material respects, the financial position of the Company as of December 31, 2011 and 2010, and the results of their operations and their cash flows for each of the years in the three-year period ended December 31, 2011, in conformity with U.S. generally accepted accounting principles. Also in our opinion, the related consolidated financial statement schedule, when considered in relation to the basic consolidated financial statements taken as a whole, presents fairly, in all material respects, the information set forth therein.
We also have audited, in accordance with the standards of the Public Company Accounting Oversight Board (United States), the Company’s internal control over financial reporting as of December 31, 2011, based on criteria established in Internal Control—Integrated Framework issued by the Committee of Sponsoring Organizations of the Treadway Commission (COSO), and our report dated March 9, 2012 expressed an unqualified opinion on the effectiveness of the Company’s internal control over financial reporting.
/s/ KPMG LLP
Chicago, Illinois
March 9, 2012
F-2
Table of Contents
VASCO Data Security International, Inc.
CONSOLIDATED BALANCE SHEETS
(in thousands, except per share data)
| December 31, | ||||||||
| 2011 | 2010 | |||||||
| ASSETS |
||||||||
| Current assets |
||||||||
| Cash and equivalents |
$ | 84,497 | $ | 85,533 | ||||
| Accounts receivable, net of allowance for doubtful accounts of $1,585 in 2011 and $1,274 in 2010 |
31,618 | 21,702 | ||||||
| Inventories |
16,033 | 10,710 | ||||||
| Prepaid expenses |
1,657 | 1,859 | ||||||
| Foreign sales tax receivable |
683 | 2,282 | ||||||
| Deferred income taxes |
2,382 | 369 | ||||||
| Other current assets |
343 | 199 | ||||||
| Assets of discontinued operations |
2,545 | 0 | ||||||
|
|
|
|
|
|||||
| Total current assets |
139,758 | 122,654 | ||||||
| Property and equipment: |
||||||||
| Furniture and fixtures |
4,924 | 4,657 | ||||||
| Office equipment |
7,390 | 7,511 | ||||||
|
|
|
|
|
|||||
| 12,314 | 12,168 | |||||||
| Accumulated depreciation |
(7,909 | ) | (7,397 | ) | ||||
|
|
|
|
|
|||||
| Property and equipment, net |
4,405 | 4,771 | ||||||
| Goodwill, net of accumulated amortization |
12,910 | 12,772 | ||||||
| Intangible assets, net of accumulated amortization |
8,091 | 1,603 | ||||||
| Other assets, net of accumulated amortization |
3,759 | 1,141 | ||||||
|
|
|
|
|
|||||
| Total assets |
$ | 168,923 | $ | 142,941 | ||||
|
|
|
|
|
|||||
| LIABILITIES AND STOCKHOLDERS’ EQUITY |
||||||||
| Current liabilities |
||||||||
| Accounts payable |
$ | 7,328 | $ | 8,857 | ||||
| Deferred revenue |
8,649 | 6,464 | ||||||
| Accrued wages and payroll taxes |
6,564 | 4,971 | ||||||
| Income taxes payable |
1,965 | 2,109 | ||||||
| Other accrued expenses |
3,162 | 3,364 | ||||||
| Deferred compensation |
1,908 | 0 | ||||||
| Liabilities of discontinued operations |
1,592 | 0 | ||||||
|
|
|
|
|
|||||
| Total current liabilities |
31,168 | 25,765 | ||||||
| Deferred compensation |
1,526 | 456 | ||||||
| Other long-term liabilities |
106 | 47 | ||||||
| Deferred income taxes |
324 | 180 | ||||||
|
|
|
|
|
|||||
| Total liabilities |
33,124 | 26,448 | ||||||
|
|
|
|
|
|||||
| Stockholders’ equity |
||||||||
| Common stock: $.001 par value per share, 75,000 shares authorized; 38,193 and 37,640 shares issued and outstanding at December 31, 2011 and 2010, respectively |
38 | 38 | ||||||
| Preferred stock: 500 shares authorized, none issued and outstanding at December 31, 2011 or 2010 |
0 | 0 | ||||||
| Additional paid-in capital |
71,720 | 68,428 | ||||||
| Accumulated income |
65,658 | 47,524 | ||||||
| Accumulated other comprehensive income |
(1,617 | ) | 503 | |||||
|
|
|
|
|
|||||
| Total stockholders’ equity |
135,799 | 116,493 | ||||||
|
|
|
|
|
|||||
| Total liabilities and stockholders’ equity |
$ | 168,923 | $ | 142,941 | ||||
|
|
|
|
|
|||||
See accompanying notes to consolidated financial statements.
F-3
Table of Contents
VASCO Data Security International, Inc.
CONSOLIDATED STATEMENTS OF OPERATIONS
(in thousands, except per share data)
| For the years ended December 31, | ||||||||||||
| 2011 | 2010 | 2009 | ||||||||||
| Revenue |
$ | 168,082 | $ | 107,963 | $ | 101,695 | ||||||
| Cost of goods sold |
59,970 | 31,997 | 30,535 | |||||||||
|
|
|
|
|
|
|
|||||||
| Gross profit |
108,112 | 75,966 | 71,160 | |||||||||
|
|
|
|
|
|
|
|||||||
| Operating costs: |
||||||||||||
| Sales and marketing |
40,294 | 31,027 | 30,299 | |||||||||
| Research and development |
18,636 | 13,568 | 11,582 | |||||||||
| General and administrative |
22,450 | 18,538 | 16,183 | |||||||||
| Amortization of purchased intangible assets |
1,967 | 443 | 453 | |||||||||
|
|
|
|
|
|
|
|||||||
| Total operating costs |
83,347 | 63,576 | 58,517 | |||||||||
|
|
|
|
|
|
|
|||||||
| Operating income |
24,765 | 12,390 | 12,643 | |||||||||
| Interest income, net |
543 | 324 | 572 | |||||||||
| Other income, net |
500 | 698 | 2,107 | |||||||||
|
|
|
|
|
|
|
|||||||
| Income from continuing operations before income taxes |
25,808 | 13,412 | 15,322 | |||||||||
| Provision for income taxes |
1,557 | 2,606 | 3,460 | |||||||||
|
|
|
|
|
|
|
|||||||
| Net income-continuing operations |
24,251 | 10,806 | 11,862 | |||||||||
| Net income (loss) from discontinued operations |
(6,118 | ) | 0 | 0 | ||||||||
|
|
|
|
|
|
|
|||||||
| Net income |
$ | 18,133 | $ | 10,806 | $ | 11,862 | ||||||
|
|
|
|
|
|
|
|||||||
| Basic income (loss) per share: |
||||||||||||
| Continuing operations |
$ | 0.65 | $ | 0.29 | $ | 0.32 | ||||||
| Discontinued operations |
(0.16 | ) | 0.00 | 0.00 | ||||||||
|
|
|
|
|
|
|
|||||||
| Total net income per share |
$ | 0.48 | $ | 0.29 | $ | 0.32 | ||||||
|
|
|
|
|
|
|
|||||||
| Diluted income (loss) per share: |
||||||||||||
| Continuing operations |
$ | 0.63 | $ | 0.28 | $ | 0.31 | ||||||
| Discontinued operations |
(0.16 | ) | 0.00 | 0.00 | ||||||||
|
|
|
|
|
|
|
|||||||
| Total net income per share |
$ | 0.47 | $ | 0.28 | $ | 0.31 | ||||||
|
|
|
|
|
|
|
|||||||
| Weighted average common shares outstanding: |
||||||||||||
| Basic |
37,555 | 37,413 | 37,319 | |||||||||
|
|
|
|
|
|
|
|||||||
| Diluted |
38,568 | 38,241 | 38,084 | |||||||||
|
|
|
|
|
|
|
|||||||
See accompanying notes to consolidated financial statements.
F-4
Table of Contents
VASCO Data Security International, Inc.
CONSOLIDATED STATEMENTS OF COMPREHENSIVE INCOME
(in thousands)
| For the years ended December 31, | ||||||||||||
| 2011 | 2010 | 2009 | ||||||||||
| Net income |
$ | 18,133 | $ | 10,806 | $ | 11,862 | ||||||
| Other comprehensive income (loss) - Currency translation adjustment |
(2,120 | ) | (3,747 | ) | 559 | |||||||
|
|
|
|
|
|
|
|||||||
| Comprehensive income |
$ | 16,013 | $ | 7,059 | $ | 12,421 | ||||||
|
|
|
|
|
|
|
|||||||
See accompanying notes to consolidated financial statements.
F-5
Table of Contents
VASCO Data Security International, Inc.
CONSOLIDATED STATEMENTS OF STOCKHOLDERS’ EQUITY
(in thousands)
| Description |
Common Stock | Additional Paid-In Capital |
Accumulated Income |
Accumulated Other Comprehensive Income (Loss) |
Total Stockholders’ Equity |
|||||||||||||||||||
| Shares | Amount | |||||||||||||||||||||||
| Balance at January 1, 2009 |
37,340 | $ | 37 | $ | 66,700 | $ | 24,856 | $ | 3,691 | $ | 95,284 | |||||||||||||
| Net income |
0 | 0 | 0 | 11,862 | 0 | 11,862 | ||||||||||||||||||
| Foreign currency translation adjustment |
0 | 0 | 0 | 0 | 559 | 559 | ||||||||||||||||||
| Exercise of stock options |
38 | 0 | 119 | 0 | 0 | 119 | ||||||||||||||||||
| Restricted stock awards |
109 | 0 | 542 | 0 | 0 | 542 | ||||||||||||||||||
| Stock option compensation |
0 | 0 | 10 | 0 | 0 | 10 | ||||||||||||||||||
|
|
|
|
|
|
|
|
|
|
|
|
|
|||||||||||||
| Balance at December 31, 2009 |
37,487 | 37 | 67,371 | 36,718 | 4,250 | 108,376 | ||||||||||||||||||
| Net income |
0 | 0 | 0 | 10,806 | 0 | 10,806 | ||||||||||||||||||
| Foreign currency translation adjustment |
0 | 0 | 0 | 0 | (3,747 | ) | (3,747 | ) | ||||||||||||||||
| Exercise of stock options |
1 | 0 | 3 | 0 | 0 | 3 | ||||||||||||||||||
| Restricted stock awards |
152 | 1 | 1,054 | 0 | 0 | 1,055 | ||||||||||||||||||
|
|
|
|
|
|
|
|
|
|
|
|
|
|||||||||||||
| Balance at December 31, 2010 |
37,640 | 38 | 68,428 | 47,524 | 503 | 116,493 | ||||||||||||||||||
| Net income |
0 | 0 | 0 | 18,133 | 0 | 18,133 | ||||||||||||||||||
| Foreign currency translation adjustment |
0 | 0 | 0 | 0 | (2,120 | ) | (2,120 | ) | ||||||||||||||||
| Exercise of stock options |
160 | 0 | 152 | 0 | 0 | 152 | ||||||||||||||||||
| Restricted stock awards |
393 | 0 | 3,140 | 0 | 0 | 3,140 | ||||||||||||||||||
|
|
|
|
|
|
|
|
|
|
|
|
|
|||||||||||||
| Balance at December 31, 2011 |
38,193 | $ | 38 | $ | 71,720 | $ | 65,658 | ($ | 1,617 | ) | $ | 135,799 | ||||||||||||
|
|
|
|
|
|
|
|
|
|
|
|
|
|||||||||||||
See accompanying notes to consolidated financial statements.
F-6
Table of Contents
VASCO Data Security International, Inc.
CONSOLIDATED STATEMENTS OF CASH FLOWS
(in thousands)
| For the years ended December 31, | ||||||||||||
| 2011 | 2010 | 2009 | ||||||||||
| Cash flows from operating activities: |
||||||||||||
| Net income from continuing operations |
$ | 24,251 | $ | 10,806 | $ | 11,862 | ||||||
| Adjustments to reconcile net income from continuing operations to net cash provided by continuing operations: |
||||||||||||
| Depreciation and amortization |
3,809 | 2,458 | 3,343 | |||||||||
| Deferred tax expense (benefit) |
(4,332 | ) | 118 | (38 | ) | |||||||
| Stock-based compensation |
6,117 | 1,021 | (309 | ) | ||||||||
| Changes in assets and liabilities: |
||||||||||||
| Accounts receivable, net |
(10,315 | ) | 6,700 | (4,951 | ) | |||||||
| Inventories |
(5,323 | ) | (1,695 | ) | 4,363 | |||||||
| Foreign sales tax receivable |
1,600 | (1,155 | ) | 6,375 | ||||||||
| Other current assets |
186 | (229 | ) | 5 | ||||||||
| Accounts payable |
(1,569 | ) | 4,465 | (5,864 | ) | |||||||
| Income taxes payable |
(113 | ) | (744 | ) | (91 | ) | ||||||
| Accrued expenses |
1,438 | 41 | (951 | ) | ||||||||
| Deferred compensation |
0 | 0 | (1,434 | ) | ||||||||
| Deferred revenue |
2,169 | (703 | ) | 518 | ||||||||
|
|
|
|
|
|
|
|||||||
| Net cash provided by operating activities of continuing operations |
17,918 | 21,083 | 12,828 | |||||||||
|
|
|
|
|
|
|
|||||||
| Cash flows from investing activities of continuing operations: |
||||||||||||
| Purchase of Alfa & Ariss |
(1,301 | ) | 0 | 0 | ||||||||
| Additions to property and equipment |
(1,132 | ) | (1,417 | ) | (2,169 | ) | ||||||
| Additions to intangible assets |
(7,287 | ) | (289 | ) | (317 | ) | ||||||
| Other assets |
(64 | ) | (66 | ) | (242 | ) | ||||||
|
|
|
|
|
|
|
|||||||
| Net cash used in investing activities of continuing operations |
(9,784 | ) | (1,772 | ) | (2,728 | ) | ||||||
|
|
|
|
|
|
|
|||||||
| Cash flows from financing activities of continuing operations: |
||||||||||||
| Proceeds from exercise of stock options |
153 | 3 | 119 | |||||||||
|
|
|
|
|
|
|
|||||||
| Net cash provided by financing activities of continuing operations |
153 | 3 | 119 | |||||||||
|
|
|
|
|
|
|
|||||||
| Cash flows used in discontinued operations: |
||||||||||||
| Net cash used in operating activities of discontinued operations |
(1,310 | ) | 0 | 0 | ||||||||
| Net cash used in investing activities of discontinued operations |
(5,761 | ) | 0 | 0 | ||||||||
|
|
|
|
|
|
|
|||||||
| Net cash used in discontinued operations |
(7,071 | ) | 0 | 0 | ||||||||
|
|
|
|
|
|
|
|||||||
| Effect of exchange rate changes on cash |
(2,252 | ) | (1,382 | ) | (332 | ) | ||||||
|
|
|
|
|
|
|
|||||||
| Net increase (decrease) in cash |
(1,036 | ) | 17,932 | 9,887 | ||||||||
| Cash and equivalents, beginning of year |
85,533 | 67,601 | 57,714 | |||||||||
|
|
|
|
|
|
|
|||||||
| Cash and equivalents, end of year |
$ | 84,497 | $ | 85,533 | $ | 67,601 | ||||||
|
|
|
|
|
|
|
|||||||
| Supplemental cash flow disclosures: |
||||||||||||
| Cash paid for income taxes |
$ | 5,914 | $ | 3,372 | $ | 3,775 | ||||||
| Cash paid for interest |
0 | 0 | 0 | |||||||||
See accompanying notes to consolidated financial statements.
F-7
Table of Contents
VASCO DATA SECURITY INTERNATIONAL, INC.
NOTES TO CONSOLIDATED FINANCIAL STATEMENTS
(amounts in thousands, except per share data)
Unless otherwise noted, references in this Annual Report on Form 10-K to “VASCO”, “company”, “we”, “our” and “us” refer to VASCO Data Security International, Inc. and its subsidiaries.
Note 1 – Summary of Significant Accounting Policies
Nature of Operations
VASCO Data Security International, Inc. and its wholly owned subsidiaries design, develop, market and support hardware and software security systems that manage and secure access to information assets. VASCO has operations in Austria, Australia, Belgium, Brazil, China, France, India, Japan, The Netherlands, Singapore, Switzerland, the United Arab Emirates, the United Kingdom (U.K)., and the United States (U.S.).
Principles of Consolidation
The consolidated financial statements include the accounts of VASCO Data Security International, Inc. and its wholly owned subsidiaries. Intercompany accounts and transactions have been eliminated in consolidation.
As further described in Note 3, during January 2011 we acquired 100% of the stock of DigiNotar B.V. Effective September 20, 2011, DigiNotar B.V. was declared bankrupt in The Netherlands transferring effective control over DigiNotar B.V. to the bankruptcy trustee. Accordingly, as of September 20, 2011, the assets, liabilities and operating activities related to DigiNotar B.V. are reflected in discontinued operations.
Estimates and Assumptions
The preparation of financial statements in conformity with accounting principles generally accepted in the U.S. requires management to make estimates and assumptions that affect the reported amounts of assets and liabilities and disclosure of contingent assets and liabilities at the date of the financial statements and the reported amounts of revenue and expenses during the reporting period. Actual results could differ from those estimates.
Foreign Currency Translation and Transactions
The financial position and results of the operations of the majority of the company’s foreign subsidiaries are measured using the local currency as the functional currency. Accordingly, assets and liabilities are translated into U.S. Dollars using current exchange rates as of the balance sheet date. Revenues and expenses are translated at average exchange rates prevailing during the year. Translation adjustments arising from differences in exchange rates are charged or credited to other comprehensive income. Gains and (losses) resulting from foreign currency transactions were $(760), $(225), and $835 in 2011, 2010, and 2009, respectively, and are included in other income (expense) in the consolidated statements of operations.
The financial position and results of our operations in Singapore and Switzerland are measured in U.S. Dollars. For these subsidiaries, gains and losses that result from foreign currency transactions are included in the consolidated statements of operations in other income (expense).
Revenue Recognition
We recognize revenue in accordance with Financial Accounting Standards Board (FASB) Accounting Standards Codification (ASC) 985-605, Software – Revenue Recognition, ASC 985-605-25, Revenue Recognition – Multiple Element Arrangements and Staff Accounting Bulletin 104. Revenue is recognized when there is persuasive evidence that an arrangement exists, delivery has occurred, the fee is fixed or determinable and collection of the revenue is probable.
F-8
Table of Contents
VASCO DATA SECURITY INTERNATIONAL, INC.
NOTES TO CONSOLIDATED FINANCIAL STATEMENTS - (Continued)
(amounts in thousands, except per share data)
Effective January 1, 2011, we adopted Accounting Standards Update (ASU) 2009-13, Multiple-Deliverable Revenue Arrangements- a consensus of the FASB Emerging Issues Task Force, which amended ASC 985-605-25, and ASU 2009-14, Certain Revenue Arrangements That Include Software Elements, which amended ASC 985-605. In multiple-element arrangements, the adoption of these two ASUs will result in some of our products continuing to be accounted for under the software provisions of ASC 985-605 and others to be accounted for under the provisions that relate to the sale of non-software products.
In our typical multiple-element arrangement, the primary deliverables include:
| 1. | a client component (i.e., an item that is used by the person being authenticated in the form of either a new standalone hardware device or software that is downloaded onto a device the customer already owns), |
| 2. | host system software that is installed on the customer’s systems (i.e., software on the host system that verifies the identity of the person being authenticated) or licenses for additional users on the host system software if the host system software had been installed previously, and |
| 3. | post contract support (“PCS”) in the form of maintenance on the host system software or support. |
Our multiple-element arrangements may also include other items that are usually delivered prior to the recognition of any revenue and incidental to the overall transaction such as initialization of the hardware device, customization of the hardware device itself or the packaging in which it is delivered, deployment services where we deliver the device to our customer’s end-use customer or employee and, in some limited cases, professional services to assist with the initial implementation of a new customer.
Effective January 1, 2011 with the adoption of ASU 2009-13 and 14 there was no change in the units of accounting, but there was a change in the method we use to allocate the revenue among the elements included in the arrangement.
In multiple-element arrangements that include a hardware client device, we allocate the selling price among all elements, delivered and undelivered, based on our internal price lists and the percentage of the selling price of that element, per the price list, to the total of the estimated selling price of all of the elements per the price list. Our internal price lists for both delivered and undelivered elements were determined to be reasonable estimates of the selling price of each element based on a comparison of actual sales made to the price list for each item delivered and to vendor specific objective evidence (VSOE) for undelivered items.
Undelivered elements primarily are PCS. The method by which we determine VSOE has validated that the price lists are reasonable estimates of the selling price for PCS. The estimated selling price of PCS items is based on an established percentage of the user license fee attributable to the specific software and is applied consistently to all PCS arrangements. The percentage we use to establish VSOE, which is also generally consistent with the percentage used in the price list, is developed using the “bell curve method”. This method relies on historical data to show that at least 80% of all our renewals are within 15% of the median renewal percentage rate.
In multiple-element arrangements that include a software client device, we continue to account for each element under the current standards of ASC 985-605 related to software. When software client devices and host software are delivered elements, we use the Residual Method (ASC 605-25) for determining the amount of revenue to recognize for token and software licenses if we have VSOE for all of the undelivered elements. Any discount provided to the customer is applied fully to the delivered elements in such an arrangement. VSOE of
F-9
Table of Contents
VASCO DATA SECURITY INTERNATIONAL, INC.
NOTES TO CONSOLIDATED FINANCIAL STATEMENTS - (Continued)
(amounts in thousands, except per share data)
fair value of PCS agreements is based on customer renewal transactions on a worldwide basis. In sales arrangements where VSOE of fair value has not been established, revenue for all elements is deferred and amortized over the life of the arrangement.
We do not expect a significant change in the pattern or timing of revenue recognition. The adoption of ASU 2009-13 and 14 did not have a significant impact on the recognition of revenue for the year ended December 31, 2011 and is not expected to have a material impact on the recognition of future revenues.
For transactions other than multiple-element arrangements, we recognize revenue as follows:
| 1. | Hardware Revenue and License Fees: Revenue from the sale of computer security hardware or the license of software is recorded upon shipment or, if an acceptance period is allowed, at the latter of shipment or customer acceptance. No significant obligations or contingencies exist with regard to delivery, customer acceptance or rights of return at the time revenue is recognized. |
| 2. | Maintenance and Support Agreements: Maintenance and support agreements generally call for us to provide software updates and technical support, respectively, to customers. Revenue on maintenance and technical support is deferred and recognized ratably over the term of the maintenance and support agreement. |
| 3. | Services: Subscription revenue is recognized ratably over the period in which the service is provided. |
| 4. | Consulting and Education Services: We provide consulting and education services to our customers. Revenue from such services is recognized during the period in which the services are performed. |
We recognize revenue from sales to distributors and resellers on the same basis as sales made directly to customers. We recognize revenue when there is persuasive evidence that an arrangement exists, delivery has occurred, the fee is fixed or determinable and collection of the revenue is probable.
For large-volume transactions, we may negotiate a specific price that is based on the number of users of the software license or quantities of hardware supplied. The per unit prices for large-volume transactions are generally lower than transactions for smaller quantities and the price differences are commonly referred to as volume-purchase discounts.
All revenue is reported on a net basis, excluding any sales or value added taxes.
Cash and Cash Equivalents
Cash and cash equivalents are stated at cost plus accrued interest, which approximates fair value. Cash equivalents are high-quality short term money market instruments with original maturities of three months or less. Cash and cash equivalents are held by a number of U.S. and non-U.S. commercial banks and money market investment funds. Cash and equivalents at December 31, 2011 include $84,432 in money market investment funds or demand bank deposits for which fair value is equal to cost. These investments are valued using level one inputs, as defined in ASC 820, Fair Value Measurements and Disclosures. Cash and cash equivalents also include $65 in bank certificates of deposit for which fair value was $65 at December 31, 2011. Bank certificates of deposit are valued using level two inputs, as defined by ASC 820.
At December 31, 2010, cash and equivalents included approximately $14,048 of unrestricted cash held on our behalf by our attorneys in a bank in The Netherlands pending the acquisition of DigiNotar in January 2011. (See Note 3.)
F-10
Table of Contents
VASCO DATA SECURITY INTERNATIONAL, INC.
NOTES TO CONSOLIDATED FINANCIAL STATEMENTS - (Continued)
(amounts in thousands, except per share data)
Accounts Receivable and Allowance for Doubtful Accounts
The credit worthiness of customers is reviewed prior to shipment. A reasonable assurance of collection is a requirement for revenue recognition. Verification of credit and/or the establishment of credit limits are part of the customer contract administration process. Credit limit adjustments for existing customers may result from the periodic review of outstanding accounts receivable. The company records trade accounts receivable at invoice values, which are generally equal to fair value.
We maintain allowances for doubtful accounts for estimated losses resulting from the inability of our customers to make payments for goods and services. We analyze accounts receivable balances, customer credit-worthiness, current economic trends and changes in our customer payment timing when evaluating the adequacy of the allowance for doubtful accounts. The allowance is based on a specific review of all significant past-due accounts. If the financial condition of our customers deteriorates, resulting in an impairment of their ability to make payments, additional allowances may be required.
Inventories
Inventories, consisting principally of hardware and component parts, are stated at the lower of cost or market. Cost is determined using the first-in-first-out (FIFO) method. We write down inventory where it appears that the carrying cost of the inventory may not be recovered through subsequent sale of the inventory. We analyze the quantity of inventory on hand, the quantity sold in the past year, the anticipated sales volume in the form of sales to new customers as well as sales to previous customers, the expected sales price and the cost of making the sale when evaluating the valuation of our inventory. If the sales volume or sales price of a specific model declines significantly, additional write downs may be required.
Property and Equipment
Property and equipment are stated at cost. Depreciation is computed using the straight-line method over the estimated useful lives of the related assets ranging from three to seven years. Additions and improvements are capitalized, while expenditures for maintenance and repairs are charged to operations as incurred. Gains or losses resulting from sales or retirements are recorded as incurred, at which time related costs and accumulated depreciation are removed from the accounts.
Research and Development Costs
Costs for research and development, principally the design and development of hardware, and the design and development of software prior to the determination of technological feasibility, are expensed as incurred on a project-by-project basis.
Software Development Costs
We capitalize software development costs in accordance with ASC 985-20, Costs of Software to be Sold, Leased, or Marketed. Research costs and software development costs, prior to the establishment of technological feasibility, determined based upon the creation of a working model, are expensed as incurred. Our software capitalization policy currently defines technological feasibility as a functioning beta test prototype with confirmed manufacturability (a working model), within a reasonably predictable range of costs. Additional criteria include receptive customers, or potential customers, as evidenced by interest expressed in a beta test prototype, at some suggested selling price. Our policy is to amortize capitalized costs by the greater of (a) the
F-11
Table of Contents
VASCO DATA SECURITY INTERNATIONAL, INC.
NOTES TO CONSOLIDATED FINANCIAL STATEMENTS - (Continued)
(amounts in thousands, except per share data)
ratio that current gross revenue for a product bear to the total of current and anticipated future gross revenue for that product or (b) the straight-line method over the remaining estimated economic life of the product, generally two to five years, including the period being reported on. No software development costs were capitalized in any of the years ending December 31, 2011, 2010, or 2009.
Income Taxes
We account for income taxes under the asset and liability method. Deferred tax assets and liabilities are recognized for the future tax consequences attributable to differences between the financial statement carrying amounts of existing assets and liabilities and their respective tax bases and operating loss and tax credit carryforwards. We measure deferred tax assets and liabilities using enacted tax rates expected to apply to taxable income in the years in which those temporary differences are expected to be recovered or settled. We recognize the effect of a change in tax rates on deferred tax assets and liabilities and in income in the period that includes the enactment date.
We monitor our potential income tax exposures as required by ASC 740-10, Income Taxes.
We have significant net operating loss carryforwards in the U.S. and certain foreign jurisdictions available to reduce the liability on future taxable income. A valuation allowance has been provided to offset some of these future benefits because we have not determined that their realization is more likely than not.
Fair Value of Financial Instruments
At December 31, 2011, and 2010, our financial instruments were cash equivalents, accounts receivable, accounts payable and accrued liabilities. The estimated fair value of our financial instruments has been determined by using available market information and appropriate valuation methodologies, as described in Cash and Equivalents above. The fair values of the financial instruments were not materially different from their carrying amounts at December 31, 2011 and 2010.
Accounting for Leases
All of our leases are operating leases. Rent expense on facility leases is charged evenly over the life of the lease, regardless of the timing of actual payments.
Goodwill and Other Intangibles
We account for goodwill and indefinite-lived intangible assets in accordance with ASC 350-20. Indefinite-lived intangible assets include customer lists, proprietary technology and other intangible assets. Intangible assets other than patents with definite lives are amortized over the useful life, generally three to seven years for proprietary technology. Patents are amortized over the life of the patent, generally 20 years in the U.S.
We assess the impairment of goodwill and intangible assets with indefinite lives each year-end or whenever events or changes in circumstances indicate that the carrying value may not be recoverable. Factors considered important which could trigger an impairment review include significant underperformance relative to expected historical or projected future operating results, significant changes in the manner of our use of the acquired assets or the strategy for our overall business, and significant negative industry or economic trends. Once identified, the amount of the impairment is computed by comparing the carrying value of the assets to the fair value. Fair value
F-12
Table of Contents
VASCO DATA SECURITY INTERNATIONAL, INC.
NOTES TO CONSOLIDATED FINANCIAL STATEMENTS - (Continued)
(amounts in thousands, except per share data)
for goodwill and intangible assets is determined using our stock price which is a level 1 valuation, as defined by ASC 820-10, Fair Value Measurements and Disclosures. We did not recognize any impairment for the years ended December 31, 2010 or 2009 as the fair value of our reporting unit substantially exceeded our carrying amount.
As further described in Note 3, during 2011, the DigiNotar Events triggered an impairment review. As a result of the impairment review, we concluded that goodwill and other intangibles of DigiNotar B.V. were impaired and recorded non-cash impairment charges of $2,873 for goodwill and $2,307 for other intangibles.
Stock-Based Compensation
We have stock-based employee compensation plans, which are described more fully in Note 9. ASC 718-10, Stock Compensation requires us to estimate the fair value of restricted stock granted to employees, directors and others and to record compensation expense equal to the estimated fair value. Compensation expense is recorded on a straight-line basis over the vesting period.
Warranty
Warranties are provided on the sale of certain of our products and an accrual for estimated future claims is recorded at the time revenue is recognized. We estimate the cost based on past claims experience, sales history and other considerations. We regularly assess the adequacy of our estimates and adjust the amounts as necessary. Our standard practice is to provide a warranty on our hardware products for either a one or two year period after the date of purchase. Customers may purchase extended warranties covering periods from one to four years after the standard warranty period. We defer the revenue associated with the extended warranty and recognize it into income on a straight-line basis over the extended warranty period. We have historically experienced minimal actual claims over the warranty period.
Note 2 – Inventories
Inventories, consisting principally of hardware and component parts, are stated at the lower of cost or market. Cost is determined using the first-in-first-out (FIFO) method.
Inventory is comprised of the following:
| December 31, | ||||||||
| 2011 | 2010 | |||||||
| Component parts |
$ | 6,447 | $ | 4,716 | ||||
| Work-in-process and finished goods |
9,586 | 5,994 | ||||||
|
|
|
|
|
|||||
| Total |
$ | 16,033 | $ | 10,710 | ||||
|
|
|
|
|
|||||
Note 3 – DigiNotar
On January 10, 2011, we purchased all of the intellectual property of DigiNotar Holding B.V. and its subsidiaries and acquired 100% of the stock of DigiNotar B.V. and DigiNotar Notariaat B.V., each a private company organized and existing in The Netherlands (collectively, “DigiNotar”), for aggregate consideration of €10,000 ($13,253 at an exchange rate of 1.32 US Dollars per Euro) comprised of assumed debt of €64 and cash. Both transactions were effective January 1, 2011. We funded the transactions from our existing cash balances.
F-13
Table of Contents
VASCO DATA SECURITY INTERNATIONAL, INC.
NOTES TO CONSOLIDATED FINANCIAL STATEMENTS - (Continued)
(amounts in thousands, except per share data)
The consideration was allocated to assets acquired and liabilities assumed based on their respective fair values as of the acquisition date as follows:
| Current assets |
$ | 2,039 | ||
| Property and equipment |
589 | |||
| Goodwill |
2,632 | |||
| Intangible assets |
10,139 | |||
| Deferred income tax liabilities - current |
(414 | ) | ||
| Other current liabilities |
(1,217 | ) | ||
| Deferred income tax liabilities - non-current |
(515 | ) | ||
|
|
|
|||
| $ | 13,253 | |||
|
|
|
Acquired identifiable intangible assets are amortized over their respective useful lives ranging from two to seven years.
Purchase consideration includes contingent consideration held in escrow payable upon the achievement of certain one year operating targets. The contingent consideration was recorded as a current asset at its estimated fair value of $861. As a result of events described below, the contingent consideration was re-measured as of September 30, 2011 resulting in an increase of $1,085 recorded in our statement of operations as discontinued operations.
In July 2011, DigiNotar B.V. detected an intrusion into its Certificate Authority (CA) infrastructure, which resulted in the fraudulent issuance of public key certificate requests for a number of domains. On September 14, 2011, the Dutch Independent Post and Telecommunications Authority (OPTA) Commission terminated DigiNotar B.V.’s registration as a certification service provider that issues qualified certificates. As a result of the termination of its registration as a certification service provider, DigiNotar B.V. filed for bankruptcy on September 19, 2011 and the Haarlem District Court, The Netherlands declared DigiNotar B.V. bankrupt on September 20, 2011. The court appointed a bankruptcy trustee to manage all the affairs of DigiNotar B.V. as it proceeds through the bankruptcy process. The trustee took over the management of business activities of DigiNotar B.V. and responsibility for the administration and liquidation of DigiNotar B.V. The foregoing events described in this paragraph are referred to as the “DigiNotar Events”.
As a result of the DigiNotar Events, the loss on operating activities, the loss on the disposal and the related assets and liabilities related to DigiNotar B.V. are reflected as discontinued operations. The income (loss) from discontinued operations, net of tax, for the year ended December 31, 2011 was as follows:
| Year ended December 31, 2011 |
||||
| Loss from operations |
$ | (1,595 | ) | |
| Loss on disposal |
(4,523 | ) | ||
|
|
|
|||
| Loss from discontinued operations |
$ | (6,118 | ) | |
|
|
|
|||
DigiNotar revenues of $1,764 for the year ended December 31, 2011 are included in the loss from operations shown above.
F-14
Table of Contents
VASCO DATA SECURITY INTERNATIONAL, INC.
NOTES TO CONSOLIDATED FINANCIAL STATEMENTS - (Continued)
(amounts in thousands, except per share data)
The loss on disposal includes the following:
| Amount | Tax | Net | ||||||||||
| Impairment of goodwill |
$ | 2,873 | $ | (251 | ) | $ | 2,622 | |||||
| Impairment of intangibles |
2,307 | (201 | ) | 2,106 | ||||||||
| Other assets and liabilities |
(1,459 | ) | 204 | (1,255 | ) | |||||||
| Provision for doubtful account |
952 | 0 | 952 | |||||||||
| Professional fees |
1,253 | (110 | ) | 1,143 | ||||||||
| Contingent consideration |
(1,085 | ) | 40 | (1,045 | ) | |||||||
|
|
|
|
|
|
|
|||||||
| Total loss on disposal |
$ | 4,841 | $ | (318 | ) | $ | 4,523 | |||||
|
|
|
|
|
|
|
|||||||
At December 31, 2011, remaining assets and liabilities related to DigiNotar have been classified as assets of discontinued operations and liabilities of discontinued operations, respectively, in the consolidated balance sheets and consist of the following:
| Contingent consideration due from escrow |
$ | 1,813 | ||
| Due from DigiNotar net of allowance for doubtful account of $952 |
414 | |||
| Income taxes receivable |
318 | |||
|
|
|
|||
| Assets of discontinued operations |
$ | 2,545 | ||
|
|
|
|||
| Due to DigiNotar |
$ | 1,275 | ||
| Accrued professional fees |
317 | |||
|
|
|
|||
| Liabilities of discontinued operations |
$ | 1,592 | ||
|
|
|
Note 4 – Acquisition of Alfa & Ariss
On April 1, 2011, we acquired all of the stock of Alfa & Ariss B.V. (“Alfa & Ariss”), an open identity and access management specialist of Enschede, The Netherlands, in exchange for cash consideration of €1,000 ($1,410 at the exchange rate of 1.41 US Dollars per Euro). The purchase price was subject to verification of certain balances resulting in an additional payment of €36 in May 2011 (approximately $51 at an exchange rate of 1.41 US Dollars per Euro). The acquisition was funded by our existing cash balances.
Consideration was allocated to assets acquired and liabilities assumed based on their respective fair values as of the acquisition date as follows:
| Prepaid compensation - current |
$ | 141 | ||
| Other current assets |
343 | |||
| Prepaid compensation - non-current |
423 | |||
| Property and equipment |
64 | |||
| Goodwill |
468 | |||
| Intangible assets |
606 | |||
| Deferred income tax liabilities - current |
(68 | ) | ||
| Other current liabilities |
(292 | ) | ||
| Deferred income tax liabilities - non-current |
(224 | ) | ||
|
|
|
|||
| $ | 1,461 | |||
|
|
|
F-15
Table of Contents
VASCO DATA SECURITY INTERNATIONAL, INC.
NOTES TO CONSOLIDATED FINANCIAL STATEMENTS - (Continued)
(amounts in thousands, except per share data)
Consideration includes contingent consideration of €400 ($564 at the exchange rate of 1.41 US Dollars per Euro) held in escrow payable ratably over four years on the anniversary date of the transaction subject to continued employment of a former officer and shareholder of Alfa & Ariss. The amount has been recorded as a prepaid expense and will be amortized ratably over the four year period.
Acquired identifiable intangible assets totaling $606 are being amortized over their respective useful lives ranging from two to five years.
The acquisition is not material to our consolidated balance sheet and results of operations. The consolidated financial statements include the operating results of Alfa & Ariss from the acquisition date.
Note 5 – Goodwill
Goodwill activity for the two years ended December 31, 2011 consisted of the following:
| Net balance at December 31, 2009 |
$ | 13,813 | ||
| Additions |
0 | |||
| Net foreign currency translation |
(1,041 | ) | ||
|
|
|
|||
| Net balance at December 31, 2010 |
12,772 | |||
| Additions-DigiNotar |
2,632 | |||
| Additions-Alfa & Ariss |
468 | |||
| Impairment-Diginotar |
(2,873 | ) | ||
| Net foreign currency translation |
(89 | ) | ||
|
|
|
|||
| Net balance at December 31, 2011 |
$ | 12,910 | ||
|
|
|
|||
| December 31, 2011 balance at cost |
$ | 13,893 | ||
| Accumulated amortization |
(983 | ) | ||
|
|
|
|||
| Net balance at December 31, 2011 |
$ | 12,910 | ||
|
|
|
As further described in Notes 1, 3, and 4, additions to goodwill result from the acquisitions of DigiNotar and Alfa & Ariss and the impairment results from the DigiNotar Events. Certain portions of goodwill are denominated in local currencies and are subject to currency fluctuation.
F-16
Table of Contents
VASCO DATA SECURITY INTERNATIONAL, INC.
NOTES TO CONSOLIDATED FINANCIAL STATEMENTS - (Continued)
(amounts in thousands, except per share data)
Note 6 – Intangible Assets
Intangible asset activity for the two years ended December 31, 2011 and the composition of the balance as of December 31, 2011 is detailed in the following table. As further described in Notes 1, 3, and 4, Additions – DigiNotar and Additions – Alfa & Ariss result from the acquisitions of DigiNotar and Alfa & Ariss and Impairment-DigiNotar results from the DigiNotar Events. Certain goodwill and other intangibles are denominated in local currencies and are subject to currency fluctuations.
| Capitalized Technology |
Patents & Trademarks |
Other | Total Intangible Assets |
|||||||||||||
| Net balance at December 31, 2009 |
$ | 1,034 | $ | 763 | $ | 0 | $ | 1,797 | ||||||||
| Additions |
0 | 326 | 0 | 326 | ||||||||||||
| Net translation loss |
(77 | ) | 0 | 0 | (77 | ) | ||||||||||
| Amortization expense |
(413 | ) | (30 | ) | 0 | (443 | ) | |||||||||
|
|
|
|
|
|
|
|
|
|||||||||
| Net balance at December 31, 2010 |
544 | 1,059 | 0 | 1,603 | ||||||||||||
| Additions-DigiNotar |
7,554 | 318 | 2,267 | 10,139 | ||||||||||||
| Impairment-Diginotar |
0 | (301 | ) | (2,006 | ) | (2,307 | ) | |||||||||
| Additions-Alfa & Ariss |
522 | 28 | 56 | 606 | ||||||||||||
| Additions-Other |
0 | 325 | 0 | 325 | ||||||||||||
| Net foreign currency translation |
(26 | ) | 27 | 153 | 154 | |||||||||||
| Amortization expense |
(1,901 | ) | (95 | ) | (433 | ) | (2,429 | ) | ||||||||
|
|
|
|
|
|
|
|
|
|||||||||
| Net balance at December 31, 2011 |
$ | 6,693 | $ | 1,361 | $ | 37 | $ | 8,091 | ||||||||
|
|
|
|
|
|
|
|
|
|||||||||
| December 31, 2011 balance at cost |
$ | 18,923 | $ | 1,506 | $ | 52 | $ | 20,481 | ||||||||
| Accumulated amortization |
(12,230 | ) | (145 | ) | (15 | ) | (12,390 | ) | ||||||||
|
|
|
|
|
|
|
|
|
|||||||||
| Net balance at December 31, 2011 |
$ | 6,693 | $ | 1,361 | $ | 37 | $ | 8,091 | ||||||||
|
|
|
|
|
|
|
|
|
|||||||||
Expected amortization of the intangible assets for the years ended:
| December 31, 2012 |
$ | 1,908 | ||
| December 31, 2013 |
1,698 | |||
| December 31, 2014 |
1,668 | |||
| December 31, 2015 |
1,664 | |||
| December 31, 2016 |
78 | |||
| Thereafter |
429 | |||
|
|
|
|||
| Subject to amortization |
7,445 | |||
| Trademarks |
646 | |||
|
|
|
|||
| Total intangible assets |
$ | 8,091 | ||
|
|
|
Note 7 – Income Taxes
Income from continuing operations before income taxes was generated in the following jurisdictions:
| For the years ended December 31, | ||||||||||||
| 2011 | 2010 | 2009 | ||||||||||
| Domestic |
$ | 6,220 | $ | 806 | $ | (576 | ) | |||||
| Foreign |
19,588 | 12,606 | 15,898 | |||||||||
|
|
|
|
|
|
|
|||||||
| Total |
$ | 25,808 | $ | 13,412 | $ | 15,322 | ||||||
|
|
|
|
|
|
|
|||||||
F-17
Table of Contents
VASCO DATA SECURITY INTERNATIONAL, INC.
NOTES TO CONSOLIDATED FINANCIAL STATEMENTS - (Continued)
(amounts in thousands, except per share data)
The provision for income taxes consists of the following:
| For the years ended December 31, | ||||||||||||
| 2011 | 2010 | 2009 | ||||||||||
| Current: |
||||||||||||
| Federal |
$ | 244 | $ | 32 | $ | (148 | ) | |||||
| State |
443 | 0 | 0 | |||||||||
| Foreign |
4,933 | 2,461 | 3,646 | |||||||||
|
|
|
|
|
|
|
|||||||
| Total current |
5,620 | 2,493 | 3,498 | |||||||||
|
|
|
|
|
|
|
|||||||
| Deferred: |
||||||||||||
| Federal |
(4,543 | ) | 0 | 0 | ||||||||
| State |
(285 | ) | 0 | 0 | ||||||||
| Foreign |
765 | 113 | (38 | ) | ||||||||
|
|
|
|
|
|
|
|||||||
| Total deferred |
(4,063 | ) | 113 | (38 | ) | |||||||
|
|
|
|
|
|
|
|||||||
| Total |
$ | 1,557 | $ | 2,606 | $ | 3,460 | ||||||
|
|
|
|
|
|
|
|||||||
The differences between the income tax provisions computed using the statutory federal income tax rate of 34% and the provisions for income taxes reported in the consolidated statements of operations are as follows:
| For the years ended December 31, | ||||||||||||
| 2011 | 2010 | 2009 | ||||||||||
| Expected tax at statutory rate |
$ | 8,775 | $ | 4,560 | $ | 5,202 | ||||||
| Foreign taxes at other rates |
(1,758 | ) | (1,642 | ) | (1,822 | ) | ||||||
| Change in valuation allowance due to: |
||||||||||||
| NOL valuation reserve adjustments |
(1,639 | ) | (335 | ) | (315 | ) | ||||||
| Utilization of NOL carryforwards |
(4,873 | ) | (725 | ) | (170 | ) | ||||||
| Generation of NOL carryforwards |
134 | 157 | 223 | |||||||||
| Prior year tax adjustments |
171 | 67 | 111 | |||||||||
| Other, net |
747 | 524 | 231 | |||||||||
|
|
|
|
|
|
|
|||||||
| Total |
$ | 1,557 | $ | 2,606 | $ | 3,460 | ||||||
|
|
|
|
|
|
|
|||||||
F-18
Table of Contents
VASCO DATA SECURITY INTERNATIONAL, INC.
NOTES TO CONSOLIDATED FINANCIAL STATEMENTS - (Continued)
(amounts in thousands, except per share data)
Current deferred tax assets and long-term deferred tax liabilities are presented as separate line items in the balance sheet. Long-term deferred tax assets of $2,874 and $708 as of December 31, 2011 and 2010, respectively, are included in other assets, net of accumulated amortization. Current deferred tax liabilities were $269 in 2011 and $299 in 2010 and are included in other accrued liabilities. The deferred income tax balances are comprised of the following:
| As of December 31, | ||||||||
| 2011 | 2010 | |||||||
| Deferred tax assets: |
||||||||
| U.S. net operating loss carryforwards |
$ | 508 | $ | 5,273 | ||||
| Stock and long-term compensation plans |
2,815 | 1,538 | ||||||
| Foreign NOL and other carryforwards |
2,502 | 1,456 | ||||||
| US state income taxes |
286 | 0 | ||||||
| US alternative minimum tax |
416 | 180 | ||||||
| Deferred revenue |
269 | 259 | ||||||
| Accrued expenses and other |
548 | 84 | ||||||
|
|
|
|
|
|||||
| Total gross deferred tax assets |
7,344 | 8,790 | ||||||
| Less: Valuation allowance |
(2,088 | ) | (7,713 | ) | ||||
|
|
|
|
|
|||||
| Net deferred income tax assets |
$ | 5,256 | $ | 1,077 | ||||
|
|
|
|
|
|||||
| Deferred tax liabilities: |
||||||||
| Swiss tax allowances |
$ | 269 | $ | 202 | ||||
| Intangible assets |
324 | 180 | ||||||
| Potential tax on intercompany dividends |
0 | 97 | ||||||
|
|
|
|
|
|||||
| Deferred tax liabilities |
$ | 593 | $ | 479 | ||||
|
|
|
|
|
|||||
At December 31, 2011, we had $9,907 of U.S. net operating loss (NOL) carryforwards, of which, $7,334 represents U.S. tax deductions for employee stock option gains, the tax benefit of which, will be credited to additional paid in capital when the NOL carryforwards are utilized. The U.S. loss carryforwards expire in varying amounts beginning in 2022 and continuing through 2029. If certain substantial changes in the company’s ownership were deemed to have occurred, there would be an annual limitation on the amount of the U.S. NOL carryforwards that could be utilized.
At December 31, 2010, we had a valuation allowance for all our U.S. deferred tax assets totaling $7,252. In 2011, the tax benefit of utilized U.S. NOL carryforwards was $4,816. We determined that it was more likely than not that the remaining U.S. deferred tax assets would be realized and reversed the entire valuation allowance for U.S. deferred tax assets.
At December 31, 2011, we had foreign NOL carryforwards of $5,535 and other foreign deductible carryforwards of $2,770. The foreign NOL carryforwards have no expiration dates and the other deductible carryforwards expire from 2016 to 2018. At December 31, 2011, we had a valuation allowance of $2,088 for certain foreign deferred tax assets.
The net change in the valuation allowance for the years ended December 31, 2011, 2010 and 2009 were decreases of $5,625, $550, and $151, respectively. This valuation allowance will be reviewed on a regular basis and adjustments made as appropriate. In addition to the utilization of NOLs in the U.S. and in foreign countries as noted above, the change in the valuation allowance also reflects other factors including, but not limited to, changes in our assessment of our ability to use existing NOLs, changes in currency rates and adjustments to reflect differences between the actual returns filed and the estimates we made at financial reporting dates. For
F-19
Table of Contents
VASCO DATA SECURITY INTERNATIONAL, INC.
NOTES TO CONSOLIDATED FINANCIAL STATEMENTS - (Continued)
(amounts in thousands, except per share data)
2011, we have reviewed the NOL carryforwards for each of our entities to determine if it is more likely than not that the NOL carryforward would be utilized in future years. Based on our review, we have reduced income tax expense and the valuation allowance in 2011 by $1,639. The company expects to generate adequate taxable income to realize deferred tax assets in foreign jurisdictions where no valuation reserve exists.
The company has not provided deferred U.S. taxes on its unremitted foreign earnings because it considers them to be permanently invested. The unremitted foreign earnings are estimated to be $95,000. It is not practicable to estimate the tax impact related to the repatriation of permanently invested earnings.
We had no accrued interest or penalties for income tax liabilities at December 31, 2011. Our policy is to record interest expense and penalties on income taxes as income tax expense.
ASC 740-10, Accounting for Uncertainty in Income Taxes sets a “more likely than not” criterion for recognizing the tax benefit of uncertain tax positions. We have identified one such exposure concerning cost allocations related to the implementation of our worldwide strategy related to the ownership of our intellectual property for which we had a reserve of $470 at December 31, 2011 and 2010, which is an offset to our U.S. deferred tax asset.
Our primary tax jurisdictions and the earliest year for which tax returns are subject to audit are presented in the following table. VASCO Data Security is abbreviated as “VDS”.
| Australia |
VDS Pty. Ltd. | 2005 | ||||
| Austria |
VDS Austria | 2006 | ||||
| Belgium |
VDS NV | 2008 | ||||
| Belgium |
VDS Europe NV | 2007 | ||||
| Belgium |
Lintel | 2008 | ||||
| Belgium |
Able NV | 2006 | ||||
| Netherlands |
VDS BV | 2003 | ||||
| Singapore |
VDS Asia Pacific | 2006 | ||||
| Switzerland |
VDS International GmbH | 2010 | ||||
| United States |
VDS International, Inc. | 2005 |
Note 8 – Deferred Warranty Revenue and Warranty Reserve
Our standard practice is to provide a warranty on our DIGIPASS hardware for one to two years after the date of purchase. Customers may purchase extended warranties covering periods from one to four years after the standard warranty period. We defer the revenue associated with the extended warranty and recognize it into income on a straight-line basis over the extended warranty period. The estimated cost of providing warranty services during the extended warranty period is less than the revenue related to such warranty service.
Deferred warranty revenue at December 31, 2011, which will be recognized as revenue, is as follows:
| Year |
Amount | |||
| 2012 |
$ | 36 | ||
| 2013 |
34 | |||
| 2014 |
21 | |||
| 2015 |
19 | |||
| 2016 |
3 | |||
|
|
|
|||
| Total |
$ | 113 | ||
|
|
|
|||
F-20
Table of Contents
VASCO DATA SECURITY INTERNATIONAL, INC.
NOTES TO CONSOLIDATED FINANCIAL STATEMENTS - (Continued)
(amounts in thousands, except per share data)
We maintain a reserve for the potential cost of future warranty claims related to products sold and recognized in revenue. The reserve is included in accrued expenses. Activity in the warranty reserve account during the three years ended December 31, 2011 was as follows:
| 2011 | 2010 | 2009 | ||||||||||
| Balance, beginning of period |
$ | 61 | $ | 150 | $ | 475 | ||||||
| Provision for warranty claims |
59 | 105 | 108 | |||||||||
| Product or cash issued to settle claims |
(84 | ) | (194 | ) | (433 | ) | ||||||
|
|
|
|
|
|
|
|||||||
| Balance, end of period |
$ | 36 | $ | 61 | $ | 150 | ||||||
|
|
|
|
|
|
|
|||||||
Note 9 – Stock Compensation Plans
In June 2009, our stockholders approved the VASCO Data Security International, Inc. 2009 Equity Incentive Plan (the “2009 Equity Plan”). The 2009 Equity Plan permits the issuance of awards in a variety of forms, including (1) shares of our common stock, (2) nonqualified and incentive stock options for the purchase of our common stock, (3) stock appreciation rights, (4) deferred stock, (5) other stock-based awards (including restricted shares, performance shares, performance units and other stock unit awards), and (6) cash incentive awards.
Upon approval of the 2009 Equity Plan, our 1997 Stock Compensation Plan, as amended and restated (the “1997 Compensation Plan”) was suspended. No additional awards will be issued under the 1997 Compensation Plan, however, all outstanding awards under the 1997 Compensation Plan were unaffected by the approval of the 2009 Equity Plan. The 1997 Compensation Plan permitted the award of stock compensation in various forms.
The 2009 Equity Plan and the 1997 Compensation Plan were designed and intended to provide performance incentives to employees and non-employee directors, consultants and other key persons of the company. Both plans are administered by the Compensation Committee as appointed by the Board of Directors and are intended to be non-qualified plans.
As of December 31, 2011, the number of shares allowed to be issued under the 2009 Equity Plan was 7,003 shares of the company’s common stock, representing 18.3% of the issued and outstanding shares of the company as of such date.
The following table summarizes compensation expense recorded under the two plans.
| 2011 | 2010 | 2009 | ||||||||||
| Compensation expense included in income: |
||||||||||||
| Stock options |
$ | 0 | $ | 0 | $ | 11 | ||||||
| Restricted stock |
3,140 | 1,054 | 542 | |||||||||
| Long-term compensation plan |
2,977 | (33 | ) | (862 | ) | |||||||
|
|
|
|
|
|
|
|||||||
| Total expense (benefit) |
$ | 6,117 | $ | 1,021 | ($ | 309 | ) | |||||
|
|
|
|
|
|
|
|||||||
Stock Options
We have not granted stock options since 2005; however, compensation expense is recognized for the unvested options as required by ASC 718-10. This statement requires the company to estimate the fair value of stock options granted and to record compensation expense equal to the estimated fair value. The fair value of stock options at the date of grant is estimated using the Black-Scholes option pricing model, with the expected life adjusted to reflect the effect of post-vesting restrictions. This compensation expense is recorded on a straight-line basis over the vesting period of the options.
F-21
Table of Contents
VASCO DATA SECURITY INTERNATIONAL, INC.
NOTES TO CONSOLIDATED FINANCIAL STATEMENTS - (Continued)
(amounts in thousands, except per share data)
All options granted under the 1997 Compensation Plan were issued with a strike price equal to market value on the date of grant, with terms of six to ten years and vesting periods ranging from one to five years. The company may issue new shares or treasury shares for option exercises. The following table summarizes option activity for the year ended December 31, 2011. All options outstanding at December 31, 2011, 2010, and 2009 were fully vested.
| Shares | Weighted Average Exercise Price |
Weighted Average Remaining Term (Years) |
Aggregate Intrinsic Value |
|||||||||||||
| Outstanding at January 1, 2011 |
1,231 | $ | 2.65 | 1.88 | $ | 6,746 | ||||||||||
| Exercised |
(203 | ) | 2.60 | 1,094 | ||||||||||||
|
|
|
|||||||||||||||
| Outstanding at December 31, 2011 |
1,028 | 2.66 | 1.05 | 3,968 | ||||||||||||
|
|
|
|||||||||||||||
| At December 31, 2011: |
||||||||||||||||
| Fully vested, exercisable options |
1,028 | $ | 2.66 | 1.05 | $ | 3,968 | ||||||||||
The intrinsic value of options exercised and the fair value of shares vested over the last three years were:
| 2011 | 2010 | 2009 | ||||||||||
| Intrinsic value of options exercised |
$ | 1,094 | $ | 2 | $ | 204 | ||||||
| Fair value of shares vested |
0 | 0 | 21 | |||||||||
Time-Based Restricted Stock
Time-based restricted stock awards were granted to executive officers, employees and non-employee directors. Awards to non-employee directors vest on the first anniversary date of the grant. Awards to executive officers and employees vest annually over three or four year periods. Shares are subject to forfeiture if the service period requirement is not met. Compensation expense equal to the market value of the stock on the grant date is recorded on a straight-line basis over the vesting period as required by ASC 718-10. Compensation expense was $1,415, $905, and $961 for 2011, 2010 and 2009. The following table summarizes the time-based restricted stock activity for the year ended December 31, 2011:
| Shares | Weighted average remaining term (years) |
Aggregate intrinsic value |
||||||||||
| Outstanding at January 1, 2011 |
222 | 1.85 | $ | 1,805 | ||||||||
| Shares vested |
(110 | ) | 916 | |||||||||
| Shares awarded |
393 | 3,262 | ||||||||||
|
|
|
|||||||||||
| Outstanding at December 31, 2011 |
505 | 2.48 | 3,295 | |||||||||
|
|
|
|||||||||||
The unamortized future compensation expense for time-based restricted stock awards was $2,776 at December 31, 2011.
Performance-Based Restricted Stock
Performance-based restricted stock awards were granted to executive officers and employees and are earned over a three or four year period. Awards are variable subject to achievement of company performance targets established by the Board of Directors. For awards granted in 2011, performance targets relate to 2011 earnings per share and 2011 revenues. For awards granted in 2010 and 2009, performance targets relate to three year cumulative earnings per share.
F-22
Table of Contents
VASCO DATA SECURITY INTERNATIONAL, INC.
NOTES TO CONSOLIDATED FINANCIAL STATEMENTS - (Continued)
(amounts in thousands, except per share data)
The estimated number of shares to be earned from awards granted in 2011, 2010, and 2009 were 276, 221, and 67, respectively. Compensation expense, equal to the market value of the stock on the grant date, is recorded on a straight-line basis over the vesting period at the performance level deemed probable, as required by ASC 718-10. Compensation expense (benefit) in 2011, 2010, and 2009 was $1,725, $149, and ($419). Unamortized future compensation expense for performance-based restricted stock was $2,328 at December 31, 2011.
The following table summarizes the activity related to performance share units during 2011:
| Shares | Weighted average remaining term (years) |
Aggregate intrinsic value |
||||||||||
| Outstanding at January 1, 2011 |
262 | 2.02 | $ | 2,130 | ||||||||
| Shares awarded |
272 | 2,272 | ||||||||||
|
|
|
|||||||||||
| Outstanding at December 31, 2011 |
534 | 1.91 | 3,482 | |||||||||
|
|
|
|||||||||||
Long-term Incentive Compensation
During 2010 and 2009 we provided long-term incentive awards to key employees, other than named executive officers. Awards are variable subject to achievement of company performance targets established by the Board of Directors. For awards granted in 2010 and 2009, performance targets relate to three year cumulative earnings per share.
Awards are designated in U.S. Dollars however, at the option of the company, may be paid in our common stock. If paid in stock, the corresponding number of unrestricted shares will be issued to recipients based on the stock price on the date the awards are earned. Compensation expense equal to the award level deemed probable is recorded on a straight-line basis over the vesting period as required by ASC 718-10. At December 31, 2011, $1,525 and $1,908 have been accrued for the 2010 and 2009 awards, respectively.
Employees forfeit awards if they terminate employment prior to the completion of the performance period. Expensed amounts are reported as liabilities on the balance sheet. The unamortized future compensation expense for the long-term incentive awards was $938 at December 31, 2011.
F-23
Table of Contents
VASCO DATA SECURITY INTERNATIONAL, INC.
NOTES TO CONSOLIDATED FINANCIAL STATEMENTS - (Continued)
(amounts in thousands, except per share data)
Note 10 – Earnings per Common Share
Basic earnings per share is based on the weighted average number of shares outstanding and excludes the dilutive effect of unexercised common stock equivalents. Diluted earnings per share is based on the weighted average number of shares outstanding and includes the dilutive effect of unexercised common stock equivalents to the extent they are not anti-dilutive. A reconciliation of the shares included in the basic and fully diluted earnings per share calculations is as follows:
| For the years ended December 31, | ||||||||||||
| 2011 | 2010 | 2009 | ||||||||||
| Net income-continuing operations |
$ | 24,251 | $ | 10,806 | $ | 11,862 | ||||||
| Net (loss)-discontinued operations |
(6,118 | ) | 0 | 0 | ||||||||
|
|
|
|
|
|
|
|||||||
| Net income |
$ | 18,133 | $ | 10,806 | $ | 11,862 | ||||||
|
|
|
|
|
|
|
|||||||
| Weighted average common shares outstanding |
||||||||||||
| Basic |
37,555 | 37,413 | 37,319 | |||||||||
| Incremental shares with dilutive effect: |
||||||||||||
| Stock options |
824 | 778 | 762 | |||||||||
| Restricted stock awards |
189 | 50 | 3 | |||||||||
|
|
|
|
|
|
|
|||||||
| Diluted |
38,568 | 38,241 | 38,084 | |||||||||
|
|
|
|
|
|
|
|||||||
| Basic income (loss) per share |
||||||||||||
| Continuing Operations |
$ | 0.65 | $ | 0.29 | $ | 0.32 | ||||||
| Discontinued Operations |
(0.16 | ) | 0.00 | 0.00 | ||||||||
|
|
|
|
|
|
|
|||||||
| Total Net income per share |
$ | 0.48 | $ | 0.29 | $ | 0.32 | ||||||
|
|
|
|
|
|
|
|||||||
| Diluted income (loss) per share |
||||||||||||
| Continuing Operations |
$ | 0.63 | $ | 0.28 | $ | 0.31 | ||||||
| Discontinued Operations |
(0.16 | ) | 0.00 | 0.00 | ||||||||
|
|
|
|
|
|
|
|||||||
| Total Net income per share |
$ | 0.47 | $ | 0.28 | $ | 0.31 | ||||||
|
|
|
|
|
|
|
|||||||
Note 11 – Employee Benefit Plan
We maintain a defined contribution pension plan for our U.S. employees established pursuant to the provisions of Section 401(k) of the Internal Revenue Code, which provides benefits for eligible employees of the company and allow us to match employee contributions. For the years ended December 31, 2011, 2010, and 2009, we contributed $100, $72, and $75, respectively, to this plan as matching contributions.
We also maintain a pension plan for our Belgian employees, in compliance with Belgian law. The plan is a defined contribution plan, but has a minimum return guarantee under Belgian law. Returns guaranteed by the pension plan administrator are essentially equal to the legal requirement. For the years ended December 31, 2011, 2010, and 2009, the company contributed $515, $470, and $487, respectively, to this plan.
F-24
Table of Contents
VASCO DATA SECURITY INTERNATIONAL, INC.
NOTES TO CONSOLIDATED FINANCIAL STATEMENTS - (Continued)
(amounts in thousands, except per share data)
Note 12 – Geographic, Customer and Supplier Information
We classify our sales by our customers’ locations in four geographic regions: 1) EMEA, which includes Europe, the Middle East and Africa; 2) the United States, which for our purposes includes sales in Canada; 3) Asia Pacific Rim; and 4) Other Countries, including Australia, Latin America and India. Information regarding geographic areas for the years ended December 31, 2011, 2010, and 2009 is as follows:
| Europe, Middle East, Africa (EMEA) |
United States | Asia Pacific | Other Countries |
Total | ||||||||||||||||
| 2011 |
||||||||||||||||||||
| Revenue |
$ | 111,575 | $ | 16,025 | $ | 14,738 | $ | 25,744 | $ | 168,082 | ||||||||||
| Gross profit |
69,324 | 11,949 | 7,536 | 19,303 | 108,112 | |||||||||||||||
| Long-lived assets |
25,149 | 967 | 10 | 165 | 26,291 | |||||||||||||||
| 2010 |
||||||||||||||||||||
| Revenue |
$ | 72,694 | $ | 9,912 | $ | 10,860 | $ | 14,497 | $ | 107,963 | ||||||||||
| Gross profit |
50,950 | 7,683 | 6,078 | 11,255 | 75,966 | |||||||||||||||
| Long-lived assets |
18,685 | 730 | 17 | 147 | 19,579 | |||||||||||||||
| 2009 |
||||||||||||||||||||
| Revenue |
$ | 72,833 | $ | 7,376 | $ | 9,492 | $ | 11,994 | $ | 101,695 | ||||||||||
| Gross profit |
57,615 | 4,013 | 3,327 | 6,204 | 71,160 | |||||||||||||||
| Long-lived assets |
20,452 | 561 | 38 | 118 | 21,169 | |||||||||||||||
For the years 2011, 2010, and 2009, our top 10 customers contributed 47%, 37%, and 34%, respectively, of total worldwide revenue. In 2011 and 2010, one customer accounted for approximately 17% and 11%, respectively, of total revenue. In 2009, no one customer exceeded 10% of total revenue.
The majority of our products are manufactured by four independent vendors, one headquartered in Europe and the other three in Hong Kong. Our hardware DIGIPASSES are assembled at facilities in mainland China.
Note 13 – Commitments and Contingencies
The company leases office space and automobiles under operating lease agreements expiring at various times through 2018. Future minimum rental payments required under non-cancelable leases are as follows:
| Year |
Amount | |||
| 2012 |
$ | 3,190 | ||
| 2013 |
2,719 | |||
| 2014 |
2,285 | |||
| 2015 |
2,016 | |||
| 2016 |
1,413 | |||
| Thereafter |
1,237 | |||
|
|
|
|||
| Total |
$ | 12,860 | ||
|
|
|
|||
Rent expense under operating leases aggregated $3,282, $2,540, and $2,544 for the years ended December 31, 2011, 2010 and 2009, respectively. Rent expense is recorded on a straight-line basis over the life of the lease agreement.
F-25
Table of Contents
VASCO DATA SECURITY INTERNATIONAL, INC.
NOTES TO CONSOLIDATED FINANCIAL STATEMENTS - (Continued)
(amounts in thousands, except per share data)
We include various types of indemnification clauses in our agreements. These indemnifications may include, but are not limited to, infringement claims related to our intellectual property, direct damages and consequential damages. The type and amount of such indemnifications vary substantially based on our assessment of risk and reward associated with each agreement. We believe the estimated fair value of these indemnification clauses is minimal and there have been no previous indemnification claims, and we cannot determine the maximum amount of potential future payments, if any, related to such indemnification provisions. We have no liabilities recorded for these clauses as of December 31, 2011.
From time to time, we have been involved in litigation incidental to the conduct of our business. Currently, we are not a party to any lawsuit or proceeding that, in management’s opinion, is likely to have a material adverse effect on its business, financial condition or results of operations.
Note 14 – Quarterly Results of Operations (unaudited)
The quarterly results of operations are as follows:
| First Quarter |
Second Quarter |
Third Quarter |
Fourth Quarter |
|||||||||||||
| 2011 | ||||||||||||||||
| Net sales |
$ | 36,065 | $ | 42,103 | $ | 41,385 | $ | 48,528 | ||||||||
| Gross profit |
22,627 | 25,706 | 27,752 | 32,026 | ||||||||||||
| Operating expenses |
18,439 | 21,648 | 20,316 | 22,944 | ||||||||||||
| Operating income |
4,189 | 4,058 | 7,436 | 9,082 | ||||||||||||
| Income from Continuing Operations |
3,647 | 3,339 | 5,927 | 11,338 | ||||||||||||
| Income from Discont. Operations |
(1,147 | ) | (718 | ) | (3,691 | ) | (561 | ) | ||||||||
| Net income |
2,500 | 2,621 | 2,236 | 10,777 | ||||||||||||
| Basic income/(loss) per share: |
||||||||||||||||
| Continuing Operations |
$ | 0.10 | $ | 0.09 | $ | 0.16 | $ | 0.30 | ||||||||
| Discont. Operations |
(0.03 | ) | (0.02 | ) | (0.10 | ) | (0.01 | ) | ||||||||
| Total Net income per share |
$ | 0.07 | $ | 0.07 | $ | 0.06 | $ | 0.29 | ||||||||
| Diluted income/(loss) per share: |
||||||||||||||||
| Continuing Operations |
$ | 0.09 | $ | 0.09 | $ | 0.15 | $ | 0.29 | ||||||||
| Discont. Operations |
(0.03 | ) | (0.02 | ) | (0.09 | ) | (0.01 | ) | ||||||||
| Total Net income per share |
$ | 0.06 | $ | 0.07 | $ | 0.06 | $ | 0.28 | ||||||||
| 2010 | ||||||||||||||||
| Net sales |
$ | 23,915 | $ | 24,742 | $ | 26,301 | $ | 33,005 | ||||||||
| Gross profit |
16,688 | 17,436 | 18,545 | 23,296 | ||||||||||||
| Operating expenses |
15,964 | 15,860 | 16,043 | 15,710 | ||||||||||||
| Operating income |
724 | 1,576 | 2,502 | 7,586 | ||||||||||||
| Net income |
573 | 1,396 | 2,183 | 6,654 | ||||||||||||
| Net income per share: |
||||||||||||||||
| Basic |
$ | 0.02 | $ | 0.04 | $ | 0.06 | $ | 0.18 | ||||||||
| Fully diluted |
0.01 | 0.04 | 0.06 | 0.17 | ||||||||||||
Due to rounding in earnings per share, the sum of the quarters may not be equal to the full year.
F-26
Table of Contents
VASCO DATA SECURITY INTERNATIONAL, INC.
VALUATION AND QUALIFYING ACCOUNTS
| Additions | Deductions | |||||||||||||||||||
| Beginning balance |
Bad debt expense/ (recovery) |
Foreign currency translation |
Accounts written off |
Ending balance |
||||||||||||||||
| Allowance for doubtful accounts for trade accounts receivable |
||||||||||||||||||||
| Year ended December 31, 2011 |
$ | 1,274 | 333 | (22 | ) | 0 | $ | 1,585 | ||||||||||||
| Year ended December 31, 2010 |
$ | 1,201 | 114 | (36 | ) | (5 | ) | $ | 1,274 | |||||||||||
| Year ended December 31, 2009 |
$ | 708 | 472 | 43 | (22 | ) | $ | 1,201 | ||||||||||||
See accompanying independent auditors’ report
F-27
Table of Contents
SIGNATURES
Pursuant to the requirements of Section 13 or 15(d) of the Securities Exchange Act of 1934, the Registrant has duly caused this Report to be signed on its behalf by the undersigned, thereunto duly authorized, on March 9, 2012.
| VASCO Data Security International, Inc. |
| /s/ T. Kendall Hunt |
| T. Kendall Hunt |
| Chief Executive Officer |
Pursuant to the requirements of the Securities Exchange Act of 1934, this Report has been signed by the following persons on behalf of the Registrant in the capacities indicated on March 9, 2012.
POWER OF ATTORNEY
Each of the undersigned, in his capacity as an officer or director, or both, as the case may be, of VASCO Data Security International, Inc. does hereby appoint T. Kendall Hunt, and each of them severally, his true and lawful attorneys or attorney to execute in his name, place and stead, in his capacity as director or officer, or both, as the case may be, this Annual Report on Form 10-K for the fiscal year ended December 31, 2011 and any and all amendments thereto and to file the same with all exhibits thereto and other documents in connection therewith with the Securities and Exchange Commission. Each of said attorneys shall have power to act hereunder with or without the other attorney and shall have full power and authority to do and perform in the name and on behalf of each of said directors or officers, or both, as the case may be, every act whatsoever requisite or necessary to be done in the premises, as fully and to all intents and purposes as to which each of said officers or directors, or both, as the case may be, might or could do in person, hereby ratifying and confirming all that said attorneys or attorney may lawfully do or cause to be done by virtue hereof.
| SIGNATURE |
TITLE | |||
| /s/ T. Kendall Hunt T. Kendall Hunt |
Chief Executive Officer and Chairman (Principal Executive Officer) | |||
| /s/ Jan Valcke Jan Valcke |
President and Chief Operating Officer (Principal Operating Officer) | |||
| /s/ Clifford K. Bown Clifford K. Bown |
Chief Financial Officer and Secretary (Principal Financial Officer and Principal Accounting Officer) | |||
| /s/ Michael P. Cullinane Michael P. Cullinane |
Director | |||
| /s/ Jean K. Holley Jean K. Holley |
Director | |||
| /s/ John R. Walter John R. Walter |
Director | |||
| /s/ John N. Fox, Jr. John N. Fox, Jr. |
Director | |||