Attached files
| file | filename |
|---|---|
| EX-31.1 - EXHIBIT 31.1 - NN INC | q42019ex311.htm |
| EX-32.2 - EXHIBIT 32.2 - NN INC | q42019ex322.htm |
| EX-32.1 - EXHIBIT 32.1 - NN INC | q42019ex321.htm |
| EX-31.2 - EXHIBIT 31.2 - NN INC | q42019ex312.htm |
| EX-23.1 - EXHIBIT 23.1 - NN INC | q42019ex231.htm |
| EX-21.1 - EXHIBIT 21.1 - NN INC | q42019ex211.htm |
| EX-4.7 - EXHIBIT 4.7 - NN INC | q42019exhibit47.htm |
UNITED STATES
SECURITIES AND EXCHANGE COMMISSION
Washington, D.C. 20549
FORM 10-K
þ | ANNUAL REPORT PURSUANT TO SECTION 13 OR 15(d) OF THE SECURITIES EXCHANGE ACT OF 1934 |
For the fiscal year ended December 31, 2019
OR
☐ | TRANSITION REPORT PURSUANT TO SECTION 13 OR 15(d) OF THE SECURITIES EXCHANGE ACT OF 1934 |
For the transition period from to
Commission file number 000-23486

NN, Inc.
(Exact name of registrant as specified in its charter)
Delaware | 62-1096725 | |
(State or other jurisdiction of incorporation or organization) | (I.R.S. Employer Identification Number) | |
6210 Ardrey Kell Road Charlotte, North Carolina | 28277 | |
(Address of principal executive offices) | (Zip Code) | |
(980) 264-4300
(Registrant’s telephone number, including area code)
Securities registered pursuant to Section 12(b) of the Act:
Title of each class | Trading symbol | Name of each exchange on which registered | ||
Common Stock, par value $0.01 | NNBR | The Nasdaq Stock Market LLC | ||
Securities registered pursuant to Section 12(g) of the Act:
None
(Title of class)
Indicate by check mark if the registrant is a well-known seasoned issuer, as defined in Rule 405 of the Securities Act. Yes ☐ No þ
Indicate by check mark if the registrant is not required to file reports pursuant to Section 13 or Section 15(d) of the Act. Yes ☐ No þ
Indicate by check mark whether the registrant (1) has filed all reports required to be filed by Section 13 or 15(d) of the Securities Exchange Act of 1934 during the preceding 12 months (or for such shorter period that the registrant was required to file such reports), and (2) has been subject to such filing requirements for the past 90 days. Yes þ No ☐
Indicate by check mark whether the registrant has submitted electronically every Interactive Data File required to be submitted pursuant to Rule 405 of Regulation S-T (§ 232.405 of this chapter) during the preceding 12 months (or for such shorter period that the registrant was required to submit such file). Yes þ No ☐
Indicate by check mark if disclosure of delinquent filers pursuant to Item 405 of Regulation S-K (§229.405 of this chapter) is not contained herein, and will not be contained, to the best of registrant’s knowledge, in definitive proxy or information statements incorporated by reference in Part III of this Form 10-K or any amendment to this Form 10-K. ☐
Indicate by check mark whether the registrant is a large accelerated filer, an accelerated filer, a non-accelerated filer, a smaller reporting company, or an emerging growth company. See definitions of “large accelerated filer,” “accelerated filer,” “smaller reporting company,” and “emerging growth company” in Rule 12b-2 of the Exchange Act.
Large accelerated filer | ☐ | Accelerated filer | þ | |||
Non-accelerated filer | ☐ | Smaller reporting company | ☐ | |||
Emerging growth company | ☐ | |||||
If an emerging growth company, indicate by check mark if the registrant has elected not to use the extended transition period for complying with any new or revised financial accounting standards provided pursuant to Section 13(a) of the Exchange Act. ☐
Indicate by check mark whether the registrant is a shell company (as defined in Rule 12b-2 of the Exchange Act). Yes ☐ No þ
The aggregate market value of the voting and non-voting common stock held by non-affiliates of the registrant was approximately $177 million as of June 30, 2019, the last business day of the registrant’s most recently completed second fiscal quarter, computed using the closing price of the registrant’s common stock as quoted on the Nasdaq Stock Market LLC on that date of $9.76. Solely for purposes of making this calculation, shares of the registrant’s common stock held by named executive officers, directors and 5% or greater stockholders of the registrant as of such date have been excluded because such persons may be deemed to be affiliates. This determination of affiliate status is not necessarily a conclusive determination for any other purposes.
As of March 6, 2020, there were 42,773,665 shares of the registrant’s common stock, par value $0.01 per share, outstanding.
DOCUMENTS INCORPORATED BY REFERENCE
Portions of the Proxy Statement with respect to the 2020 Annual Meeting of Stockholders are incorporated by reference in Part III, Items 10 to 14 of this Annual Report on Form 10-K as indicated herein. Such proxy statement will be filed with the Securities and Exchange Commission within 120 days of the registrant’s fiscal year ended December 31, 2019.
NN, Inc.
INDEX
3
PART I
Forward-Looking Statements
This Annual Report on Form 10-K contains forward-looking statements that are made pursuant to the safe harbor provisions of the Private Securities Litigation Reform Act of 1995. These statements may discuss goals, intentions and expectations as to future trends, plans, events, results of operations or financial condition, or state other information relating to NN, Inc., based on current beliefs of management as well as assumptions made by, and information currently available to, management. Forward-looking statements generally will be accompanied by words such as “anticipate,” “believe,” “could,” “estimate,” “expect,” “forecast,” “guidance,” “intend,” “may,” “possible,” “potential,” “predict,” “project” or other similar words, phrases or expressions. Forward-looking statements involve a number of risks and uncertainties that are outside of management’s control and that may cause actual results to be materially different from such forward-looking statements. Such factors include, among others, general economic conditions and economic conditions in the industrial sector, competitive influences, risks that current customers will commence or increase captive production, risks of capacity underutilization, quality issues, availability of raw materials, currency and other risks associated with international trade, our dependence on certain major customers, the impact of acquisitions and divestitures, unanticipated difficulties integrating acquisitions and realizing anticipated cost savings and operating efficiencies, risks associated with joint ventures, new laws and governmental regulations, and other risk factors and cautionary statements listed from time to time in our periodic reports filed with the Securities and Exchange Commission. We disclaim any obligation to update any such factors or to publicly announce the result of any revisions to any of the forward-looking statements included herein or therein to reflect future events or developments.
Except for per share data or as otherwise noted, all U.S dollar amounts presented in tables that follow are in thousands.
Item 1. | Business |
Introduction
NN, Inc. is a global diversified industrial company that combines advanced engineering and production capabilities with in-depth materials science expertise to design and manufacture high-precision solutions, components and assemblies for the medical, aerospace and defense, electrical, automotive and general industrial markets. As used in this Annual Report on Form 10-K (this “Annual Report”), the terms “NN,” the “Company,” “we,” “our,” or “us” refer to NN, Inc. and its subsidiaries. We have 50 facilities in North America, Europe, South America, and Asia.
Our enterprise and management structure is designed to accelerate growth and further balance our portfolio by aligning our strategic assets and businesses. Our businesses are organized into the Life Sciences, Mobile Solutions, and Power Solutions groups and are based principally on the end markets they serve. Life Sciences is focused on growth in the medical end market, primarily in the orthopaedics and medical/surgical end markets. Mobile Solutions is focused on growth in the general industrial and automotive end markets. Power Solutions is focused on growth in the electrical and aerospace and defense end markets.
Business Segments and Products
Life Sciences
Life Sciences is focused on growth in the medical end market, primarily in the orthopaedics and medical/surgical end markets. Within this group we combine advanced engineering and production capabilities to design and manufacture a broad range of high-precision metal and plastic components, assemblies, and finished devices. We manufacture a variety of components, assemblies, and instruments, such as surgical knives, bioresorbable implants, surgical staples, cases and trays, orthopaedic implants and tools, laparoscopic devices, and drug delivery devices for the orthopaedics and medical/surgical end markets.
Mobile Solutions
Mobile Solutions is focused on growth in the general industrial and automotive end markets. We have developed an expertise in manufacturing highly complex, system critical components for fuel systems, engines and transmissions, power steering systems, and electromechanical motors on a high-volume basis. This expertise has been gained through investment in technical capabilities, processes and systems, and skilled program management and product launch capabilities.
Power Solutions
Power Solutions is focused on growth in the electrical and aerospace and defense end markets. Within this group we combine materials science expertise with advanced engineering and production capabilities to design and manufacture a broad range of high-precision metal and plastic components, assemblies, and finished devices used in applications ranging from power control to flight control and for military devices. We manufacture a variety of products including electrical contacts, connectors, contact assemblies, and precision stampings for the electrical end market and high precision products for the aerospace and defense end markets utilizing our extensive process technologies for optical grade plastics, thermally conductive plastics, titanium, Inconel, magnesium, and electroplating.
4
Competitive Strengths
High-precision manufacturing capabilities
We believe our ability to produce high-precision parts at high production volumes is among the best in the market. Our technology platform consists of high precision machining, progressive stamping, injection molding, laser welding, material science, assembly, and design optimization. Unique specialty machine building capabilities, in-house tool design and process know-how create trade secrets that enable consistent production tolerances of less than one micron while producing millions of parts per day. Parts are manufactured to application-specific customer design and co-design standards that are developed for a specific use. The high-precision capabilities are part of our zero-defect design process which seeks to eliminate variability and manufacturing defects throughout the entire product lifecycle. We believe our production capabilities provide a competitive advantage as few other manufacturers are capable of meeting tolerance demands at any volume level requested by our customers. As the need for tight-tolerance precision parts, subassemblies, and devices continues to increase, we believe that our production capabilities will place us at the forefront of the industry. We have differentiated ourselves among our competitors by providing customers engineered solutions and a broad reach and breadth of manufacturing capabilities. We believe it is for these reasons, and because of our proven ability to produce high-quality, precision parts and components on a cost-effective basis, that customers choose us to meet their manufacturing needs.
Differentiated, system-critical products
The tight-tolerance and high-quality nature of our precision products is specifically suited for use in the most demanding applications that require superior reliability. Our products are critical components to the operation and reliability of larger mechanical systems. Precision parts are difficult to manufacture and achieve premium pricing in the marketplace as the high cost of failure motivates our customers to focus on quality. Our products are developed for specific uses within critical systems and are typically designed in conjunction with the system designer. Our parts are often qualified for, or specified in, customer designs, reducing the ability for customers to change suppliers.
Our ability to make products with tight-tolerance and extreme precision requirements enables our customers to satisfy the critical functionality and performance requirements of their products. We are included in customer designs and deployed in critical systems that involve high cost of failure applications and significant regulatory certification processes, including those for the Food and Drug Administration (“FDA”), Underwriters Laboratories (“UL”), and the National Aerospace and Defense Contractors Accreditation Program (“NADCAP”).
Complete product lifecycle focus
Our engineering expertise and deep knowledge of precision manufacturing processes adds proprietary value throughout the complete lifecycle of our products. Our in-house engineering team works closely with our customers to provide parts that meet specific design specifications for a given application. The relationship with the customer begins early in the conceptual design process when we provide feedback on potential cost, manufacturability, and estimated reliability of the parts. Part designs are then prototyped, tested, and qualified in coordination with the customer design process before going to full-scale production. The close working relationship with our customers early in the product lifecycle helps to secure business, increase industry knowledge, and develop significant trade secrets. Performance verification, product troubleshooting, and post-production engineering services further deepen relationships with our customers as well as provide additional industry knowledge that is applicable to future design programs and provide continuous manufacturing process improvement.
Prototype products are developed for testing, and process validation procedures are instituted. In many instances, we will file for regulatory production approval and include the customer’s proprietary processes, further discouraging supplier changes. We will assist the customer with continuous supply chain management and comprehensive customer support for the lifetime of the product and continuously seek to identify new operational efficiencies to reduce the product’s cost and improve its quality. Once our solution is designed into a platform, it is often embedded through the multi-year manufacturing lifecycle and has a competitive advantage in supporting subsequent platforms. As an added benefit, customers generally fund development, prototypes, and manufacturing tooling expenses. This discourages supplier changes and drives recurring revenue for us.
Long-term blue-chip customer base
We maintain relationships with hundreds of customers around the world. Our customers are typically sophisticated, engineering-driven, mechanical systems manufacturers with long histories of product development and reputations for quality. We have no significant retail exposure, which limits volatility and provides enhanced sales visibility. Relationships with our top ten customers, in terms of revenue, average more than ten years. We have significant exposure to emerging markets in Asia, South America, and Europe through these global customers as well as key local manufacturers. The diverse nature, size, and reach of our customer base provides resistance to localized market and geographic fluctuations and help stabilizes overall product demand.
5
Strategic global footprint
Our 50 facilities, on four continents, are strategically located to serve our customer base and provide local service and expertise. Our global footprint provides flexibility to locally supply identical products for global customers, reducing shipping time and expense, allowing us to match costs to revenue and to capitalize on industry localization trends. In total, we operate more than 3.0 million square feet of manufacturing space. North America constitutes the largest portion of our manufacturing operations with facilities in the U.S. and Mexico. The North American facilities are strategically located to serve major customers in the United States and Mexico. Our foreign facilities are located in regional manufacturing hubs in France, Poland, China, and Brazil, and primarily serve global customers in those local markets. The Asian and South American facilities, we believe, have significant growth potential as local customer bases expand and the markets for high-precision products grow in those regions.
Proven and experienced management team
Our management team has significant experience in precision manufacturing and the diversified industrial sector. Warren Veltman was named President and Chief Executive Officer in September 2019 and previously served as Executive Vice President of Mobile Solutions. Mr. Veltman joined us in 2014 as part of the Autocam acquisition, a business at which he had 30 years of experience in financial and operational leadership roles. Thomas DeByle joined NN and was named Senior Vice President and Chief Financial Officer in August 2019. Mr. DeByle has extensive experience in finance leadership roles at global manufacturers and most recently served as Chief Financial Officer, Vice President and Treasurer of Standex International since 2008. Christopher Qualters was named Executive Vice President of Life Sciences in November 2019, having previously served as Executive Vice President of Power Solutions since 2018. Mr. Qualters joined us in 2014 as part of the Autocam acquisition, a business at which he had 10 years of experience in sales and marketing. John Buchan was named Executive Vice President of Mobile Solutions in September 2019 and Executive Vice President of Mobile Solutions and Power Solutions in November 2019. Mr. Buchan joined us in 2014 as part of the Autocam acquisition, a business at which he had 18 years of experience in operations. We believe that our current management team has the necessary talent and experience to lead our previously announced evaluation of strategic alternatives while profitably operating and growing the business.
Research and Development and Product Engineering
Our research and development and product engineering efforts focus on enhancing our existing products and developing patented products, particularly in the medical industry, that can be presented to and sold by our customers. Our Life Sciences business has developed a portfolio of patented and branded medical products that we manufacture for customers and that are sold through their channels. Our engineering teams focus on working closely with our customers to develop engineered solutions to improve our customers’ products.
Customers
Our products are supplied primarily to manufacturers for use in a broad range of industrial applications, including medical; automotive; electrical; agricultural; construction; residential devices and equipment; aerospace and defense; heating, ventilation, and air conditioning; fluid power and diesel engines. Sales to each of our top ten customers are made to multiple customer locations and divisions throughout the world. In 2019, our top ten customers accounted for approximately 52% of our net sales. In 2019, 76% of our products were sold to customers in North America, 11% to customers in Europe, 8% to customers in Asia, and the remaining 5% to customers in South America. During the year ended December 31, 2019, we recognized sales to affiliates of Johnson & Johnson of $93.1 million, or 11.0% of consolidated net sales. Revenues from this customer are in our Life Sciences and Power Solutions groups.
We sell our products to most of our largest customers under either sales contracts or agreed upon commercial terms. In general, we pass through material cost fluctuations when incurred to our customers in the form of changes in selling prices. We ordinarily ship our products directly to customers within 60 days, and in many cases, during the same calendar month of the date on which a sales order is placed.
Sales and Marketing
A primary emphasis of our marketing strategy is to expand key customer relationships by offering high quality, high-precision, application-specific customer solutions with the value of a single supply chain partner for a wide variety of products and components. Due to the technical nature of many of our products, our engineers and manufacturing management personnel also provide technical sales support functions, while internal sales employees handle customer orders and other general sales support activities. Our marketing strategy is to offer custom manufactured, high quality, precision products to markets with high value-added characteristics at competitive price levels. This strategy focuses on relationships with key customers that require the production of technically difficult parts and assemblies, enabling us to take advantage of our strengths in custom product development, equipment and tool design, component assembly, and machining processes.
6
Employees
As of December 31, 2019, we employed a total of 5,418 full and part-time employees and 369 temporary workers. Of our total employment, 20% are management employees and 80% are production employees. The employees of the France, Brazil, and Brainin de Mexico plants are unionized. A small group of employees at our Bridgeport, Connecticut, plant is also unionized. We believe we have a good working relationship with our employees and the unions that represent them.
Competition
Life Sciences
Life Sciences operates in intensely competitive but very fragmented supply chains. Our primary competitors t are AIP Precision Machining; Avalign Technologies, Inc.; Cretex Companies, Inc.; EPTAM Precision Solutions; MTD Micro Molding; Orchid Orthopedic Solutions; Tecomet, Inc.; and Viant Medical, Inc. We compete against other companies depending on the type of product offered or the geographic area served as well as our customers with in-house manufacturing capabilities. Customers will choose manufacturers based on reputation, quality, delivery, responsiveness, breadth of capabilities, including design and engineering support, price, and relationships. We believe that our ability to assist customers through all phases of the product life cycle differentiates us from most of our competitors.
Mobile Solutions
In the market in which Mobile Solutions operates, internal production of components by our customers can impact our business as the customers weigh the risk of outsourcing strategically critical components or producing in-house. Our primary competitors are Anton Häring KG, A. Berger Holding GmbH & Co. KG, Brovedani Group, Burgmaier Technologies GmbH & Co. KG, CIE Automotive, S.A., IMS Companies, and MacLean-Fogg Component Solutions. We believe that we generally win new business on the basis of technical competence and our proven track record of successful product development.
Power Solutions
Power Solutions operates in intensely competitive but very fragmented supply chains. We must compete with numerous companies in each industry market segment. Our primary competitors are Checon Corporation; Deringer-Ney, Inc.; Electrical Contacts, Ltd.; Interplex Industries, Inc.; J&J Machining, LLC; Norstan, Inc.; Owens Industries, Inc.; and Precinmac Precision Machining. We believe that competition within the electrical and aerospace and defense end markets is based principally on quality, price, design capabilities, and speed of responsiveness and delivery. We believe that our competitive strengths are product development, tool design, fabrication, tight tolerance processes, and customer solutions. With these strengths, we have built our reputation in the marketplace as a quality producer of technically difficult products.
Raw Materials
Life Sciences
Due to the technically challenging requirements of our customers products, we purchase our raw materials from a limited number of suppliers. Many of the raw materials that are used in our products are subject to fluctuations in market price, particularly titanium and precious metals such as platinum. Generally, raw material prices are passed through to our customers to offset market fluctuations. Because of the lengthy process required to qualify raw materials with our customers, we cannot change suppliers easily. However, we have not experienced any significant interruptions or delays in obtaining critical raw materials.
Mobile Solutions
Mobile Solutions produces products from a wide variety of metals in various forms from various sources located in the North America, Europe, South America, and Asia. Basic types include hot rolled steel, cold rolled steel (both carbon and alloy), stainless, extruded aluminum, die cast aluminum, gray and ductile iron castings, hot and cold forgings, and mechanical tubing. Some material is purchased directly under contracts, some is consigned by the customer, and some is purchased directly from the steel mills.
Power Solutions
Power Solutions uses a wide variety of metals in various forms, including precious metals like gold, silver, palladium, and platinum, as well as plastics. Through our diverse network of suppliers, we minimize supplier concentration risk and provide a stable supply of raw materials at competitive pricing. This group also procures resins and metal stampings from several domestic and foreign suppliers. Power Solutions bases purchase decisions on quality, service and price. Generally, we do not enter into written supply contracts with our suppliers or commit to maintain minimum monthly purchases of materials. However, we carefully manage raw material price volatility, particularly with respect to precious metals, through the use of consignment agreements. In effect, we contract the precious metals for our own stock and buy the raw materials on the same day customer shipments are priced, thereby eliminating speculation.
7
In each of our segments, we have historically been affected by upward price pressure on steel principally due to general increases in global demand. In general, we pass through material cost fluctuations to our customers in the form of changes in selling price. Most of the raw materials we use are purchased from various suppliers and are typically available from numerous sources, some of which are located in China and Europe. The recent coronavirus outbreak has impacted our suppliers in China and other affected regions. We are monitoring the effect of these impacts on our supply chain in order to maintain regular and timely supply of raw materials to our business segments.
Patents, Trademarks and Licenses
We have several U.S. patents, patent applications and trademarks for various trade names. However, we cannot be certain that we would be able to protect and enforce our intellectual property rights against third parties, and if we cannot do so, we may face increased competition and diminished net sales.
Furthermore, third parties may assert infringement claims against us based on their patents or other intellectual property, and we may have to pay substantial damages and/or redesign our products if we are ultimately found to infringe. Even if such intellectual property claims against us are without merit, investigating and defending these types of lawsuits takes significant time, may be expensive and may divert management attention from other business concerns.
Additionally, we rely on certain data and processes, including trade secrets and know-how, and the success of our business depends, to some extent, on such information remaining confidential. Each officer is subject to a non-competition and confidentiality agreement that seeks to protect this information. Additionally, all employees are subject to company code of ethics policies that prohibit the disclosure of information critical to the operations of our business.
Seasonal Nature of Business
General economic conditions impact our business and financial results, and certain businesses experience seasonal and other trends related to the industries and end markets that they serve. For example, European sales are often weaker in the summer months as customers slow production, medical device sales are often stronger in the third calendar quarter, and sales to original equipment manufacturers are often stronger immediately preceding and following the launch of new products. However, as a whole, we are not materially impacted by seasonality.
Environmental Compliance
Our operations and products are subject to extensive federal, state and local regulatory requirements both domestically and abroad relating to pollution control and protection of the environment. These laws and regulations govern, among other things, discharges to air or water, the generation, storage, handling, and use of automotive hazardous materials and the handling and disposal of hazardous waste generated at our facilities. Under such laws and regulations, we are required to obtain permits from governmental authorities for some of our operations. If we violate or fail to comply with these laws, regulations or permits, we could be fined or otherwise sanctioned by regulators. Under some environmental laws and regulations, we could also be held responsible for all the costs relating to any contamination at our past or present facilities and at third-party waste disposal sites. We maintain a compliance program to assist in preventing and, if necessary, correcting environmental problems.
Based on information compiled to date, management believes that our current operations are in substantial compliance with applicable environmental laws and regulations, the violation of which could have a material adverse effect on our business and financial condition. We cannot assure that currently unknown matters, new laws and regulations, or stricter interpretations of existing laws and regulations will not materially affect our business or operations in the future. More specifically, although we believe that we dispose of waste in material compliance with applicable environmental laws and regulations, we cannot be certain that we will not incur significant liabilities in the future in connection with the clean-up of waste disposal sites.
FDA Compliance
As a manufacturer of medical devices, certain of our subsidiaries and facilities are required to register as such with the FDA. To maintain our registration, we deploy a robust quality management system across all of our Life Sciences manufacturing facilities.
With respect to medical and life sciences products that we are specifically developing to sell to our customers, before these devices can be marketed, we will seek to obtain a marketing clearance from the FDA under Section 510(k) of the United States Federal Food, Drug, and Cosmetic Act. The FDA typically grants a 510(k) clearance if the applicant can establish that the device is substantially equivalent to a predicate device. Clearance under Section 510(k) typically takes about four months from the date of submission.
8
Executive Officers of the Registrant
Our executive officers are:
Name | Age | Position | |||
Warren A. Veltman | 58 | President and Chief Executive Officer | |||
Thomas D. DeByle | 60 | Senior Vice President and Chief Financial Officer | |||
John R. Buchan | 58 | Executive Vice President – Mobile Solutions and Power Solutions | |||
Christopher J. Qualters | 52 | Executive Vice President – Life Sciences | |||
Matthew S. Heiter | 59 | Senior Vice President and General Counsel | |||
D. Gail Nixon | 49 | Senior Vice President and Chief Human Resources Officer | |||
Warren A. Veltman was appointed President and Chief Executive Officer in September 2019 having previously served as Executive Vice President of Mobile Solutions since January 2018. Mr. Veltman joined NN as part of the Autocam acquisition in 2014 as the Senior Vice President and General Manager of our former Autocam Precision Components Group. Prior to the acquisition, Mr. Veltman served as Chief Financial Officer of Autocam Corporation from 1990 and Secretary and Treasurer since 1991. Prior to Mr. Veltman’s service at Autocam, Mr. Veltman was an Audit Manager with Deloitte & Touche LLP.
Thomas D. DeByle joined us as Senior Vice President and Chief Financial Officer in September 2019. Prior to joining NN, Mr. DeByle served as Chief Financial Officer, Vice President, and Treasurer of Standex International from March 2008 to August 2019. Prior to joining Standex International, Mr. DeByle held a variety of leadership positions at Ingersoll Rand, a leading diversified industrial firm, culminating in his appointment as Chief Financial Officer for the Compact Vehicle Technology Sector. Prior to joining Ingersoll Rand, Mr. DeByle held a variety of leadership positions at Actuant Corporation, a publicly held diversified industrial company, Milwaukee-based Johnson Controls, and two regional public accounting firms.
John R. Buchan was appointed Executive Vice President of Mobile Solutions in September 2019 and Executive Vice President of Mobile Solutions and Power Solutions in November 2019 having previously served as Vice President of Operations of Mobile Solutions. Mr. Buchan joined NN as part of the Autocam acquisition in 2014, where he served as the Chief Operations Officer. Prior to joining Autocam in 2002, Mr. Buchan held a variety of technical leadership roles at Benteler Automotive, culminating in his appointment as Executive Vice President of the Exhaust Products Group. Mr. Buchan has spent his entire career in operations roles, beginning with General Motors Central Foundry and Rochester Products Divisions.
Christopher J. Qualters was appointed Executive Vice President of Life Sciences in November 2019, having previously served as Executive Vice President of Power Solutions since January 2018. Prior to his appointment in January 2018, Mr. Qualters served as the Company’s Vice President and Chief Commercial Officer. Mr. Qualters joined NN as part of the Autocam acquisition in 2014, where he served as Vice President of Sales and Marketing. Prior to joining Autocam in 2008, Mr. Qualters held several leadership positions in sales, marketing, and product management at Robert Bosch. From 1990 to 2000, Mr. Qualters held the position of sales engineer at The Torrington Company, where he was responsible for anti-friction bearing solutions for the general industrial and automotive industries.
Matthew S. Heiter joined us as Senior Vice President and General Counsel in July 2015. Prior to joining NN, Mr. Heiter was a shareholder in the law firm of Baker, Donelson, Bearman, Caldwell and Berkowitz, P.C. from May 1996 to December 1999 and from July 2002 to July 2015, where he served as chairman of the firm’s Securities and Corporate Governance Practice Group. From January 2000 to July 2002, Mr. Heiter served as the Executive Vice President, General Counsel, and Secretary of Internet Pictures Corporation, a publicly traded internet technology company.
D. Gail Nixon joined us in 2007 and was appointed Senior Vice President and Chief Human Resources Officer in January 2018. Ms. Nixon previously served as our Vice President of Human Resources as well as Corporate Human Resources Manager. Ms. Nixon is a member of the Society for Human Resource Management and World at Work and has earned her Senior Professional in Human Resources designation. From 2000 to 2007, she held various accounting and human resources positions with a multi-state healthcare organization, ultimately serving as its corporate human resources director.
9
Item 1A. | Risk Factors |
The following are risk factors that affect our business, prospects, financial condition, results of operations, and cash flows, some of which are beyond our control. These risk factors should be considered in connection with evaluating the forward-looking statements contained in this Annual Report on Form 10-K. If any of the events described below were to actually occur, our business, prospects, financial condition, results of operations, or cash flows could be adversely affected, and results could differ materially from expected and historical results.
Risks Related to Our Operations
We depend heavily on a relatively limited number of customers, and the loss of any major customer would have a material adverse effect on our business.
During 2019, sales to various U.S. and foreign divisions of our ten largest customers accounted for approximately 52% of our consolidated net sales. The loss of all or a substantial portion of sales to these customers would cause us to lose a substantial portion of our revenue and would lower our operating profit margin and cash flows from operations.
Work stoppages or similar difficulties and unanticipated business disruptions could significantly disrupt our operations, reduce our revenues and materially affect our earnings.
A work stoppage at one or more of our facilities could have a material adverse effect on our business, prospects, financial condition, results of operations, or cash flows. Also, if one or more of our customers were to experience a work stoppage, that customer would likely halt or limit purchases of our products, which could have a material adverse effect on our business, prospects, financial condition, results of operations, or cash flows.
We have a complex network of suppliers, owned and leased manufacturing locations, co-manufacturing locations, distribution networks, and information systems that support our ability to consistently provide our products to our customers. Factors that are hard to predict or beyond our control, such as weather, raw material shortages, natural disasters, fires or explosions, political unrest, terrorism, generalized labor unrest, or health pandemics, such as the new coronavirus that originated in China, could damage or disrupt our operations or our customers’, suppliers’, co-manufacturers’ or distributors’ operations. These disruptions may require additional resources to restore our supply chain or distribution network. If we cannot respond to disruptions in our operations, whether by finding alternative suppliers or replacing capacity at key manufacturing or distribution locations, or if we are unable to quickly repair damage to our information, production, or supply systems, we may be late in delivering, or be unable to deliver, products to our customers and may also be unable to track orders, inventory, receivables, and payables. If that occurs, our customers’ confidence in us and long-term demand for our products could decline. Any of these events could materially and adversely affect our product sales, financial condition, and operating results.
In addition, our business could be adversely affected by the effects of health epidemics, particularly in regions where we have significant operations or concentrations of customers or suppliers. For example, several of our customers and suppliers are located in cities throughout China, and our plant in France relies on suppliers located in Italy. As a result, we could be adversely affected by health epidemics in China and other affected regions, including the recent outbreak of a novel coronavirus first identified in Wuhan, China, which has subsequently spread around the globe. Consequences of the coronavirus outbreak have included disruptions or restrictions on our ability to travel and temporary closures of our Chinese facilities and the facilities of our customers and suppliers in China and other affected regions. Our operating results could be adversely affected to the extent that the coronavirus outbreak harms the Chinese and global economies in general. Any disruption of our customers or suppliers may also materially adversely affect our business and operating results. In addition, the coronavirus outbreak could evolve into a worldwide health crisis that could adversely affect the economies and financial markets of many countries, resulting in an economic downturn that could affect demand for our products and materially adversely affect our business, operating results, and financial condition.
We operate in and sell products to customers outside the U.S. and are subject to several risks related to doing business internationally.
We obtain a majority of our raw materials from overseas suppliers, actively participate in overseas manufacturing operations and sell to a large number of international customers. During the year ended December 31, 2019, sales to customers located outside of the U.S. accounted for approximately 28% of our consolidated net sales. As a result of doing business internationally, we face risks associated with the following:
• | changes in tariff regulations, which may make our products more costly to export or import; |
• | changes in monetary and fiscal policies, laws and regulations, and other activities of governments, agencies and similar organizations; |
• | recessions or marked declines specific to a particular country or region; |
• | the potential imposition of trade restrictions or prohibitions; |
10
• | the potential imposition of import tariffs or other duties or taxes; |
• | difficulties establishing and maintaining relationships with local original equipment manufacturers, distributors and dealers; |
• | difficulty in staffing and managing geographically diverse operations; and |
• | unstable governments or legal systems in countries in which our suppliers, manufacturing operations, and customers are located. |
These and other risks may also increase the relative price of our products compared to those manufactured in other countries, thereby reducing the demand for our products in the markets in which we operate, which could have a material adverse effect on our business, prospects, financial condition, results of operations, or cash flows.
In addition, we could be adversely affected by violations of the Foreign Corrupt Practices Act (the “FCPA”) and similar worldwide anti-bribery laws, as well as export controls and economic sanction laws. The FCPA and similar anti-bribery laws in other jurisdictions generally prohibit companies and their intermediaries from making improper payments to non-U.S. officials for the purpose of obtaining or retaining business. Our policies mandate compliance with these laws. We operate in many parts of the world that have experienced governmental corruption to some degree and, in certain circumstances, strict compliance with anti-bribery laws may conflict with local customs and practices. We cannot assure you that our internal controls and procedures will always protect us from the improper acts committed by our employees or agents. If we are found to be liable for FCPA, export control or sanction violations, we could suffer from criminal or civil penalties or other sanctions, including loss of export privileges or authorization needed to conduct aspects of our international business, which could have a material adverse effect on our business, prospects, financial condition, results of operations, or cash flows.
In addition, the prices we pay for raw materials used in our products may be impacted by tariffs. The tariffs initiated by the U.S. government in 2018 under Section 232 of the Trade Expansion Act of 1962 resulted in increased metals prices in the United States. Any future tariffs or quotas imposed on steel and aluminum imports may increase the price of metal, which could have a material adverse effect on our business, prospects, financial condition, results of operations, or cash flows.
Failure of our products could result in a product recall.
The majority of our products are components of our customers’ products that are used in critical industrial applications. A failure of our components could lead to a product recall. If a recall were to happen as a result of our components failing, we could bear a substantial part of the cost of correction. In addition to the cost of fixing the parts affected by the component, a recall could result in the loss of a portion of or all of the customer’s business and damage our reputation. A successful product recall claim requiring that we bear a substantial part of the cost of correction or the loss of a key customer could have a material adverse effect on our business, prospects, financial condition, results of operations, or cash flows.
Our markets are highly competitive, and many of our competitors have significant advantages that could adversely affect our business.
We face substantial competition in the sale of components, system subassemblies, and finished devices in the vertical end markets into which we sell our products. Our competitors are continuously exploring and implementing improvements in technology and manufacturing processes in order to improve product quality, and our ability to remain competitive will depend, among other things, on whether we are able to keep pace with such quality improvements in a cost-effective manner. Due to this competitiveness, we may not be able to increase prices for our products to cover cost increases. In many cases we face pressure from our customers to reduce prices, which could adversely affect our business, prospects, financial condition, results of operations, or cash flows. In addition, our customers may choose to purchase products from one of our competitors rather than pay the prices we seek for our products, which could adversely affect our business, prospects, financial condition, results of operations, or cash flows.
Any loss of key personnel and the inability to attract and retain qualified employees could have a material adverse impact on our operations.
We are dependent on the continued services of key executives and personnel. The departure of our key personnel without adequate replacement could severely disrupt our business operations. Additionally, we need qualified managers and skilled employees with technical and manufacturing industry experience to operate our businesses successfully. From time to time, there may be shortages of skilled labor, which may make it more difficult and expensive for us to attract and retain qualified employees. If we are unable to attract and retain qualified individuals or our costs to do so increase significantly, our operations would be materially adversely affected.
Damage to our reputation could harm our businesses, including our competitive position and business prospects.
Our ability to attract and retain customers, supplier, investors, and employees is impacted by our reputation. Harm to our reputation can arise from various sources, including employee misconduct, security breaches, unethical behavior, litigation or
11
regulatory outcomes. The consequences of damage to our reputation include, among other things, increasing the number of litigation claims and the size of damages asserted or subjecting us to enforcement actions, fines, and penalties, all of which would cause us to incur significant defense related costs and expenses.
Our strategic review is subject to various risks and uncertainties, may not result in any completed transaction and could disrupt or negatively adversely affect our business.
In November 2019, we initiated a strategic review to evaluate a broad range of operational, financial and strategic options to reduce leverage and enhance shareholder value, and we retained external advisors to assist in this effort. The strategic options we are evaluating include further cost savings and cash generation initiatives, capital allocation opportunities, and the sale of part or all of NN, among others. There is no finite timetable for completion of the review, and we can provide no assurance that we will pursue or complete any action or transaction in connection with the review. While the review is ongoing, we are exposed to various risks and uncertainties, including, without limitation, the diversion of management’s attention to the review; potential difficulty in retaining and attracting key employees during the review process; foreseen and unforeseen costs and expenses associated with the review and any transaction resulting therefrom; exposure to potential litigation in connection with the review process or any transaction resulting therefrom; speculation regarding any developments related to the review and perceived uncertainties related to our future; and potential negative reactions from the financial markets if we do not complete one or more transactions as a result of the review. Any of these factors could have a material adverse effect on our business, financial condition, results of operations, cash flows and/or the price of our common stock.
Risks Related to Legal and Regulatory Compliance
Environmental, health and safety laws and regulations impose substantial costs and limitations on our operations, environmental compliance may be more costly than we expect, and any adverse regulatory action may materially adversely affect our business.
We are subject to extensive federal, state, local, and foreign environmental, health, and safety laws and regulations concerning matters such as air emissions, wastewater discharges, solid and hazardous waste handling, and disposal and the investigation and remediation of contamination. The risks of substantial costs, liabilities, and limitations on our operations related to compliance with these laws and regulations are an inherent part of our business, and future conditions may develop, arise or be discovered that create substantial environmental compliance or remediation liabilities and costs.
Compliance with environmental, health, and safety legislation and regulatory requirements may prove to be more limiting and costly than we anticipate. To date, we have committed significant expenditures in our efforts to achieve and maintain compliance with these requirements at our facilities, and we expect that we will continue to make significant expenditures related to such compliance in the future. From time to time, we may be subject to legal proceedings brought by private parties or governmental authorities with respect to environmental matters, including matters involving alleged noncompliance with or liability under environmental, health and safety laws, property damage or personal injury. New laws and regulations, including those which may relate to emissions of greenhouse gases, stricter enforcement of existing laws and regulations, the discovery of previously unknown contamination or the imposition of new clean-up requirements could require us to incur costs or become the basis for new or increased liabilities that could have a material adverse effect on our business, prospects, financial condition, results of operations, or cash flows.
Our medical devices are subject to regulation by numerous government agencies, including the FDA and comparable agencies outside the U.S. To varying degrees, each of these agencies requires us to comply with laws and regulations governing the development, testing, manufacturing, labeling, marketing and distribution of our medical devices. We cannot guarantee that we will be able to obtain marketing clearance for our new products or enhancements or modifications to existing products. If such approval is obtained, it may:
• | take a significant amount of time; |
• | require the expenditure of substantial resources; |
• | involve stringent clinical and pre-clinical testing, as well as increased post-market surveillance; |
• | involve modifications, repairs or replacements of our products; and |
• | result in limitations on the proposed uses of our products. |
Both before and after a product is commercially released, we have ongoing responsibilities under FDA regulations. We are also subject to periodic inspections by the FDA to determine compliance with the FDA’s requirements, including primarily the quality system regulations and medical device reporting regulations. The results of these inspections can include inspectional observations on FDA’s Form-483, warning letters, or other forms of enforcement. Since 2009, the FDA has significantly increased its oversight of companies subject to its regulations, including medical device companies, by hiring new investigators and stepping up inspections of manufacturing facilities. The FDA has also significantly increased the number of warning letters
12
issued to companies. If the FDA were to conclude that we are not in compliance with applicable laws or regulations, or that any of our medical devices are ineffective or pose an unreasonable health risk, the FDA could ban such medical devices, detain or seize adulterated or misbranded medical devices, order a recall, repair, replacement or refund of such devices, refuse to grant pending pre-market approval applications or require certificates of foreign governments for exports, and/or require us to notify health professionals and others that the devices present unreasonable risks of substantial harm to the public health. The FDA may also impose operating restrictions on a company-wide basis, enjoin and/or restrain certain conduct resulting in violations of applicable law pertaining to medical devices, and assess civil or criminal penalties against our officers, employees, or us. The FDA may also recommend prosecution to the Department of Justice. Any adverse regulatory action, depending on its magnitude, may restrict us from effectively marketing and selling our products.
Foreign governmental regulations have become increasingly stringent and more common, and we may become subject to more rigorous regulation by foreign governmental authorities in the future. Penalties for a company’s non-compliance with foreign governmental regulation could be severe, including revocation or suspension of a company’s business license and criminal sanctions. Any domestic or foreign governmental law or regulation imposed in the future may have a material adverse effect on us.
Changes in U.S. tax laws could have a material adverse effect on our business, cash flow, results of operations, and financial condition.
Changes in U.S. tax laws, tax rulings, or interpretations of existing laws could materially affect our business, cash flow, results of operations, and financial condition. In particular, on December 22, 2017, the U.S. government enacted comprehensive Federal tax legislation commonly referred to as the Tax Cuts and Jobs Act of 2017 (the “U.S. Tax Cuts and Jobs Act of 2017”). The U.S. Tax Cuts and Jobs Act of 2017 introduces significant changes to U.S. income tax law that have had a meaningful impact on our provision for income taxes. Accounting for the income tax effects of the U.S. Tax Cuts and Jobs Act of 2017 requires significant judgments and estimates in the interpretation and calculations of the provisions of the U.S. Tax Cuts and Jobs Act of 2017.
We have identified material weaknesses in our internal control over financial reporting which could, if not remediated, result in material misstatements in our financial statements.
Our management is responsible for establishing and maintaining adequate internal control over financial reporting as defined in Rule 13a-15(f) under the Exchange Act. As disclosed in Item 9A, management identified certain material weaknesses in our internal control over financial reporting during 2019 that remained unremediated as of December 31, 2019. Although we undertook efforts in the current year to remediate the material weakness previously reported in our annual filings related to the control environment, we were unsuccessful in fully remediating such material weakness. Because of the material weaknesses identified, our management concluded that we did not maintain effective internal control over financial reporting as of December 31, 2019. With the oversight of senior management and the audit committee, we have begun taking steps to remediate the underlying cause of the material weaknesses and improve the design of controls. Until remediated, these material weaknesses could result in future misstatements to our financial statements.
While we expect to take the measures necessary to address the underlying causes of these material weaknesses, we cannot at this time estimate how long it will take, and our efforts may not prove to be successful in remediating these material weaknesses. While we have not incurred and do not expect to incur material expenses specifically related to the remediation of these material weaknesses, actual expenses may exceed our current estimates and overall costs of compiling the system and processing documentation necessary to assess the effectiveness of our internal control over financial reporting may be material.
If we are unable to successfully remediate these material weaknesses in our internal control over financial reporting, or if we identify any additional material weaknesses that may exist, the accuracy and timing of our financial reporting may be adversely affected. Our failure to file periodic and certain current reports with the SEC in a timely manner, among other things, could in the future preclude or delay us from being eligible to use a short form registration statement on Form S-3 to register certain sales of our common stock by us or our stockholders and could even result in the suspension of trading of our common stock on the Nasdaq Stock Market LLC (“Nasdaq”) and/or the revocation of our registration by the SEC. Any of these consequences may have a material adverse effect on our business and results of operations.
Risks Related to Our Capitalization
Our indebtedness could adversely affect our business, prospects, financial condition, results of operations, or cash flows.
As of December 31, 2019, we had approximately $793.2 million of indebtedness outstanding and an additional $63.9 million of unused borrowings under our debt agreements. Our high degree of leverage could have important consequences, including:
• | increasing our vulnerability to adverse economic, industry, or competitive developments; |
13
• | requiring a substantial portion of our cash flows from operations to be dedicated to the payment of principal and interest on our indebtedness, therefore reducing our ability to use our cash flows to fund operations, capital expenditures, and future business opportunities; |
• | exposing us to the risk of increased interest rates, which could cause our debt service obligations to increase significantly; |
• | making it more difficult for us to satisfy our obligations with respect to our indebtedness, and any failure to comply with the obligations of any of our debt instruments, including restrictive covenants and borrowing conditions, could result in an event of default under our debt agreements; |
• | restricting us from making strategic acquisitions or causing us to make non-strategic divestitures; |
• | limiting our ability to obtain additional financing for working capital, capital expenditures, product and service development, debt service requirements, acquisitions, and general corporate or other purposes; and |
• | limiting our flexibility in planning for, or reacting to, changes in our business or market conditions and placing us at a competitive disadvantage compared to our competitors who are less highly leveraged and who, therefore, may be able to take advantage of opportunities that our leverage may prevent us from exploiting. |
If any one of these events were to occur, our business, prospects, financial condition, results of operations, or cash flows could be materially and adversely affected. For more information regarding our indebtedness, please see “Management’s Discussion and Analysis of Financial Condition and Results of Operations — Liquidity and Capital Resources.”
Despite our high indebtedness level, we will still be able to incur substantial additional amounts of debt, which could further exacerbate the risks associated with our substantial indebtedness.
We and our subsidiaries may be able to incur substantial additional indebtedness in the future. Although our debt agreements contain restrictions on the incurrence of additional indebtedness, these restrictions are subject to a number of significant qualifications and exceptions, and under certain circumstances, the amount of indebtedness that could be incurred in compliance with these restrictions could be substantial. If new debt is added to our and our subsidiaries’ debt levels, the related risks that we now face could increase.
Our debt agreements contain restrictions that will limit our flexibility in operating our business.
Our debt agreements contain various incurrence covenants that limit our ability to engage in specified types of transactions. These incurrence covenants will limit our ability to, among other things:
• | incur additional indebtedness or issue certain preferred equity; |
• | pay dividends on, repurchase, or make distributions in respect of our capital stock, prepay, redeem, or repurchase certain debt or make other restricted payments; |
• | make certain investments and acquisitions; |
• | create certain liens; |
• | enter into agreements restricting our subsidiaries’ ability to pay dividends to us; |
• | consolidate, merge, sell, or otherwise dispose of all or substantially all of our assets; |
• | alter our existing businesses; and |
• | enter into certain transactions with our affiliates. |
In addition, the incurrence covenants in our debt agreements require us to meet specified financial ratios and satisfy other financial condition tests. Our ability to meet those financial ratios and tests will depend on our ongoing financial and operating performance, which, in turn, will be subject to economic conditions and to financial, market, and competitive factors, many of which are beyond our control. A breach of any of these covenants could result in a default under one or more of our debt agreements and permit our lenders to cease making loans to us under our credit facility (as defined below) or to accelerate the maturity date of the indebtedness incurred thereunder. Furthermore, if we were unable to repay the amounts due and payable under our secured debt agreements, our secured lenders could proceed against the collateral granted to them to secure our borrowings. Such actions by the lenders could also cause cross defaults under our other debt agreements.
We may not be able to generate sufficient cash to service all of our indebtedness, and we may not be able to refinance our debt obligations as they mature.
Our ability to make scheduled payments on or to refinance our debt obligations depends on our financial condition and operating performance, which is subject to prevailing economic and competitive conditions and to certain financial, business and other factors beyond our control. We may not be able to maintain a level of cash flows from operating activities sufficient to permit us to pay the principal, premium, if any, and interest on our indebtedness.
14
We regularly review our capital structure, various financing alternatives and conditions in the debt and equity markets in order to opportunistically enhance our capital structure. In connection therewith, we may seek to refinance or retire existing indebtedness, incur new or additional indebtedness or issue equity or equity-linked securities, in each case, depending on market and other conditions. As our debt obligations mature or if our cash flows and capital resources are insufficient to fund our debt service obligations, we may be forced to reduce or delay investments and capital expenditures, or to sell assets, seek additional capital, or restructure or refinance our indebtedness. Our ability to restructure or refinance our debt will depend on the condition of the capital markets and our financial condition at such time. Any refinancing of our debt could be at higher interest rates and may require us to comply with more onerous covenants, which could further restrict our business operations. The terms of our existing or future debt instruments may restrict us from adopting some of these alternatives. In addition, any failure to make payments of interest and principal on our outstanding indebtedness on a timely basis would likely result in a reduction of our credit rating, which could harm our ability to incur additional indebtedness. These alternative measures may not be successful and may not permit us to meet our scheduled debt service obligations.
We have international operations that are subject to foreign economic uncertainties and foreign currency fluctuation.
Approximately 28% of our revenues are denominated in foreign currencies, which may result in additional risk of fluctuating currency values and exchange rates and controls on currency exchange. Changes in the value of foreign currencies could increase our U.S. dollar costs for, or reduce our U.S. dollar revenues from, our foreign operations. Any increased costs or reduced revenues as a result of foreign currency fluctuations could affect our profits. In 2019, the U.S. dollar strengthened against foreign currencies which unfavorably affected our revenue by $8.4 million. In contrast, a weakening of the U.S. dollar may beneficially affect our business, prospects, financial condition, results of operations, or cash flows.
The price of our common stock may be volatile.
The market price of our common stock could be subject to significant fluctuations and may decline. Among the factors that could affect our stock price are:
• | macro or micro-economic factors; |
• | our operating and financial performance and prospects; |
• | quarterly variations in the rate of growth of our financial indicators, such as earnings per share, net income and revenues; |
• | changes in revenue or earnings estimates or publication of research reports by analysts; |
• | loss of any member of our senior management team; |
• | speculation in the press or investment community; |
• | strategic actions by us or our competitors, such as acquisitions or restructuring; |
• | sales of our common stock by stockholders; |
• | general market conditions; |
• | domestic and international economic, legal, and regulatory factors unrelated to our performance; |
• | loss of a major customer; and |
• | the declaration and payment of a dividend. |
The stock markets in general have experienced extreme volatility that has often been unrelated to the operating performance of particular companies. These broad market fluctuations may adversely affect the trading price of our common stock. In addition, due to the market capitalization of our stock, our stock tends to be more volatile than large capitalization stocks that comprise the Dow Jones Industrial Average or Standard and Poor’s 500 Index.
Provisions in our charter documents and Delaware law may inhibit a takeover, which could adversely affect the value of our common stock.
Our certificate of incorporation and bylaws, as well as Delaware corporate law, contain provisions that could delay or prevent a change of control or changes in our management that a stockholder might consider favorable and may prevent shareholders from receiving a takeover premium for their shares. These provisions include, for example, a classified board of directors and the authorization of our board of directors to issue up to five million preferred shares without a stockholder vote. In addition, our certificate of incorporation provides that stockholders may not call a special meeting.
We are a Delaware corporation subject to the provisions of Section 203 of the Delaware General Corporation Law, an anti-takeover law. Generally, this statute prohibits a publicly-held Delaware corporation from engaging in a business combination with an interested stockholder for a period of three years after the date of the transaction in which such person became an interested stockholder, unless the business combination is approved in a prescribed manner. A business combination includes a merger, asset sale or other transaction resulting in a financial benefit to the stockholder. We anticipate that the provisions of
15
Section 203 may encourage parties interested in acquiring us to negotiate in advance with our board of directors, because the stockholder approval requirement would be avoided if a majority of the directors then in office approve either the business combination or the transaction that results in the stockholder becoming an interested stockholder.
These provisions apply even if the offer may be considered beneficial by some of our stockholders. If a change of control or change in management is delayed or prevented, the market price of our common stock could decline.
Risks Related to Acquisitions and Divestitures
Acquisitions may constitute an important part of our future growth strategy.
Acquiring businesses that complement or expand our operations has been and may continue to be a key element of our business strategy. We regularly evaluate acquisition transactions, sign non-disclosure agreements, and participate in processes with respect to acquisitions, some of which may be material to us. We cannot assure you that we will be successful in identifying attractive acquisition candidates or completing acquisitions on favorable terms in the future. In addition, we may borrow funds or issue equity to acquire other businesses, increasing our interest expense and debt levels or diluting our existing stockholders’ ownership interest in us. Our inability to acquire businesses, or to operate them profitably once acquired, could have a material adverse effect on our business, financial condition, results of operations, and cash flows. Our borrowing agreements limit our ability to complete acquisitions without prior approval of our lenders. We have had difficulty with purchase accounting and other aspects related to the accounting for our acquisitions which resulted in material weaknesses in our internal control over financial reporting. Although we have remediated these material weaknesses, there can be no assurances we will not face similar issues with respect to any future acquisitions.
We may not realize all of the anticipated benefits from completed acquisitions or any future strategic portfolio acquisition, or those benefits may take longer to realize than expected.
We either may not realize all of the anticipated benefits from completed acquisitions or any future strategic portfolio acquisition, or it may take longer to realize such benefits. Achieving those benefits depends on the timely, efficient, and successful execution of a number of post-acquisition events, including integrating the acquired businesses into our existing businesses. The integration process may disrupt the businesses and, if implemented ineffectively, would preclude the realization of the full anticipated benefits. The difficulties of combining the operations of acquired companies include, among others:
• | the diversion of management’s attention to integration matters; |
• | difficulties in the integration of operations and systems, including, without limitation, the complexities associated with managing the expanded operations of a significantly larger and more complex company, addressing possible differences in corporate cultures and management philosophies and the challenge of integrating complex systems, technology, networks, and other assets of each of the acquired companies; |
• | difficulties in achieving anticipated cost savings, synergies, business opportunities, and growth prospects from combining the acquired businesses with our own; |
• | the inability to implement effective internal controls, procedures, and policies for acquired businesses as required by the Sarbanes-Oxley Act of 2002 within the time periods prescribed thereby; |
• | the exposure to potential unknown liabilities and unforeseen increased expenses or delays associated with acquired businesses; |
• | challenges in keeping existing customers and obtaining new customers; |
• | challenges in attracting and retaining key personnel; and |
• | the disruption of, or the loss of momentum in, ongoing operations or inconsistencies in standards, controls, procedures and policies. |
Many of these factors will be outside of our control and any one of them could result in increased costs, decreases in the amount of expected revenues and diversion of management’s time and energy, which could materially impact our business, prospects, financial condition, results of operations, or cash flows.
Additionally, we incurred a significant amount of debt in connection with our acquisitions in the past few years. Finally, in relation to such acquisitions, we have significantly higher amounts of intangible assets, including goodwill. These intangible assets will be subject to impairment testing, and we could incur a significant impact to our financial statements in the form of an impairment if assumptions and expectations related to our acquisitions are not realized.
We have and will continue to incur expenses related to our acquisitions and the integration of our acquired companies.
We have and will continue to incur expenses related to our acquisitions and the integration of our acquired companies. While we have assumed that a certain level of expenses will be incurred, there are many factors beyond our control that could affect the total amount or the timing of the integration expenses. Moreover, many of the expenses that will be incurred are, by their
16
nature, difficult to estimate accurately. These integration expenses may result in us taking charges against earnings, and the amount of any future charges are uncertain at present.
We may be unable to realize the anticipated cost or capital expenditure savings or may incur additional and/or unexpected costs in order to realize them.
There can be no assurance that we will be able to realize the anticipated cost or capital expenditure savings from our acquisitions in the anticipated amounts or within the anticipated timeframes or at all. With respect to each acquisition, we anticipate implementing a series of cost savings initiatives that we expect to result in recurring, annual run-rate cost savings. These or any other cost or capital expenditure savings that we realize may differ materially from our estimates. We cannot provide assurances that these anticipated savings will be achieved or that our programs and improvements will be completed as anticipated or at all. In addition, any cost savings that we realize may be offset, in whole or in part, by reductions in revenues or through increases in other expenses.
Our projections and assumptions related to cost savings are based on our current estimates, but they involve risks, uncertainties, projections, and other factors that may cause actual results, performance, or achievements to be materially different from any future results, performance, or achievements, express or implied. Neither our independent registered public accounting firm nor any other independent auditors, have examined, compiled or performed any procedures with respect to these projections, nor have they expressed any opinion, or any other form of assurance on such information or their achievability. Assumptions relating to our projections involve subjective decisions and judgments with respect to, among other things, the estimated impact of certain operational adjustments, including Six Sigma/OpEx optimization programs, product grouping and rationalization, facility rationalization and shared services cost savings, and other cost and savings adjustments, as well as future economic, competitive, industry and market conditions and future business decisions, all of which are inherently uncertain and may be beyond the control of our management.
Failure to realize the expected costs savings and operating synergies related to our acquisitions could result in increased costs and have an adverse effect on our business, prospects, financial condition, results of operations, or cash flows.
Our future results could suffer if we cannot effectively manage our expanded operations, which are significantly larger and more complex following our acquisitions.
As a result of our acquisitions over the past few years, the size and scope of our operations were significantly increased. Our future success depends, in part, upon our ability to manage the expanded operations, which will pose challenges for management, including challenges related to the management and monitoring of new operations and associated increased costs and complexity. We may not have the expertise, experience and resources to pursue or successfully operate all of our businesses at once. The administration of our businesses requires implementation and oversight of appropriate operations, management, compliance and financial reporting systems and controls. We may experience difficulties in effectively implementing and overseeing these and other systems. Such implementation and initial oversight will require the focused attention of our management team, including a significant commitment of its time and resources. The need for management to focus on these matters could have a material and adverse impact on our revenues and operating results. There can be no assurance that we will be successful or that we will realize any operating efficiencies, cost savings, revenue enhancements or other benefits currently anticipated from our acquisitions.
The indemnification provisions of acquisition agreements by which we have acquired companies may not fully protect us and may result in unexpected liabilities.
Certain of the acquisition agreements from past acquisitions require the former owners to indemnify us against certain liabilities related to the operation of each of their companies before we acquired it. In most of these agreements, however, the liability of the former owners is limited in amount and duration and certain former owners may not be able to meet their indemnification responsibilities. These indemnification provisions may not fully protect us, and as a result we may face unexpected liabilities that adversely affect our profitability and financial position.
Our participation in joint ventures could expose us to additional risks from time to time.
We currently have a 49% investment in a Chinese joint venture and may participate in additional joint ventures from time to time. Our participation in joint ventures is subject to risks that may not be present with other methods of ownership, including:
• | our joint venture partners could have investment and financing goals that are not consistent with our objectives, including the timing, terms, and strategies for any investments, and what levels of debt to incur or carry; |
• | we could experience an impasse on certain decisions because we do not have sole decision-making authority, which could require us to expend additional resources on resolving such impasses or potential disputes, including litigation or arbitration; |
• | our ability to transfer our interest in a joint venture to a third party may be restricted and the market for our interest may be limited; |
17
• | our joint venture partners might become bankrupt, fail to fund their share of required capital contributions or fail to fulfill their obligations as a joint venture partner, which may require us to infuse our own capital into the venture on behalf of the partner despite other competing uses for such capital; and |
• | our joint venture partners may have competing interests in our markets that could create conflict of interest issues. |
Any divestitures and discontinued operations could negatively impact our business and retained liabilities from businesses that we may sell could adversely affect our financial results.
As part of our portfolio management process, we review our operations for businesses which may no longer be aligned with our strategic initiatives and long-term objectives. Divestitures pose risks and challenges that could negatively impact our business, including required separation or carve-out activities and costs, disputes with buyers, or potential impairment charges. We may also dispose of a business at a price or on terms that are less than we had previously anticipated. After reaching an agreement with a buyer for the disposition of a business, we are also subject to satisfaction of pre-closing conditions, as well as necessary regulatory and governmental approvals on acceptable terms, which may prevent us from completing a transaction. Dispositions may also involve continued financial involvement, as we may be required to retain responsibility for, or agree to indemnify buyers against contingent liabilities related to businesses sold, such as lawsuits, tax liabilities, lease payments, product liability claims, or environmental matters. Under these types of arrangements, performance by the divested businesses or other conditions outside of our control could affect future financial results.
Item 1B. | Unresolved Staff Comments |
None.
Item 2. | Properties |
As of December 31, 2019, we owned or leased 50 facilities in a total of seven countries, which includes a 49% equity interest in a manufacturing joint venture in China. Utilization of these sites may vary with product mix and economic, seasonal, and other business conditions. Our plants generally have sufficient capacity for existing needs and expected near-term growth. These plants are generally well maintained, in good operating condition, and suitable and adequate for their use. The following table lists the locations of our facilities by segment.
Life Sciences Group
Location | General Character | Country | Owned or Leased | |||
Aurora, Illinois | Plant | U.S.A. | Leased | |||
Bridgeport, Connecticut | Plant 1 | U.S.A. | Owned | |||
Bridgeport, Connecticut | Plant 2 | U.S.A. | Owned | |||
Changzhou | Plant | China | Leased | |||
East Providence, Rhode Island | Plant | U.S.A. | Leased | |||
Hatfield, Pennsylvania | Plant | U.S.A. | Leased | |||
Indianapolis, Indiana | Plant | U.S.A. | Leased | |||
Lausanne | Office | Switzerland | Leased | |||
Mansfield, Massachusetts | Plant | U.S.A. | Leased | |||
Mansfield, Massachusetts | Warehouse | U.S.A. | Leased | |||
Pierceton, Indiana | Plant 1 | U.S.A. | Leased | |||
Pierceton, Indiana | Plant 2 | U.S.A. | Leased | |||
Siechnice | Plant | Poland | Owned | |||
Smithfield, Utah | Plant | U.S.A. | Leased | |||
Vandalia, Ohio | Plant | U.S.A. | Leased | |||
Wallingford, Connecticut | Plant | U.S.A. | Leased | |||
Warsaw, Indiana | Plant | U.S.A. | Leased | |||
18
Mobile Solutions Group
Location | General Character | Country | Owned or Leased | |||
Boituva | Plant | Brazil | Leased | |||
Campinas | Office | Brazil | Leased | |||
Dowagiac, Michigan | Plant | U.S.A. | Owned | |||
Juarez | Plant | Mexico | Leased | |||
Kamienna Gora | Plant | Poland | Owned | |||
Kentwood, Michigan | Plant 1 | U.S.A. | Leased | |||
Kentwood, Michigan | Plant 2 | U.S.A. | Leased | |||
Kentwood, Michigan | Plant 3, Warehouse | U.S.A. | Leased | |||
Kentwood, Michigan | Office | U.S.A. | Owned | |||
Marnaz | Plant | France | Owned | |||
Marshall, Michigan | Plant 1 | U.S.A. | Leased | |||
Marshall, Michigan | Plant 2 | U.S.A. | Leased | |||
Sao Joao da Boa Vista | Plant 1 | Brazil | Leased | |||
Sao Joao da Boa Vista | Plant 2 | Brazil | Leased | |||
Wellington, Ohio | Plant 1 | U.S.A. | Leased | |||
Wellington, Ohio | Plant 2 | U.S.A. | Leased | |||
Wuxi | Plant | China | Leased | |||
Power Solutions Group
Location | General Character | Country | Owned or Leased | |||
Algonquin, Illinois | Plant | U.S.A. | Owned | |||
Attleboro, Massachusetts | Plant 1 | U.S.A. | Owned | |||
Attleboro, Massachusetts | Plant 2 | U.S.A. | Leased | |||
Attleboro, Massachusetts | Plant 3 | U.S.A. | Owned | |||
Attleboro, Massachusetts | Office | U.S.A. | Leased | |||
Fairfield, Ohio | Plant | U.S.A. | Owned | |||
Foshan City | Plant | China | Leased | |||
Franklin, Massachusetts | Plant | U.S.A. | Leased | |||
Hingham, Massachusetts | Plant | U.S.A. | Leased | |||
Irvine, California | Plant | U.S.A. | Leased | |||
Lubbock, Texas | Plant | U.S.A. | Owned | |||
Mexico City | Plant | Mexico | Owned | |||
North Attleboro, Massachusetts | Plant | U.S.A. | Owned | |||
Palmer, Massachusetts | Plant | U.S.A. | Leased | |||
Joint Venture
Location | General Character | Country | Owned or Leased | |||
Wuxi | Plant | China | Leased | |||
In addition to these manufacturing plants, we lease an office building in Charlotte, North Carolina, which serves as our corporate headquarters.
Item 3. | Legal Proceedings |
Brazil ICMS Tax Matter
Prior to the acquisition of Autocam in 2014, Autocam’s Brazilian subsidiary (“Autocam Brazil”) received notification from the Brazilian tax authority regarding ICMS (state value added tax or “VAT”) tax credits claimed on intermediary materials (e.g., tooling and perishable items) used in the manufacturing process. The Brazilian tax authority notification disallowed state ICMS tax credits claimed on intermediary materials based on the argument that these items are not intrinsically related to the manufacturing process. Autocam Brazil filed an administrative defense with the Brazilian tax authority arguing, among other
19
matters, that it should qualify for an ICMS tax credit, contending that the intermediary materials are directly related to the manufacturing process.
We believe that we have substantial legal and factual defenses, and we plan to defend our interests in this matter vigorously. The matter encompasses several lawsuits filed with Brazilian courts requesting declaratory actions that no tax is due or seeking a stay of execution on the collection of the tax. In 2018, we obtained a favorable decision in one of the declaratory actions for which the period for appeal has expired. We have filed actions in each court requesting dismissal of the matter based on the earlier court action. Although we anticipate a favorable resolution to all matters, we can provide no assurances that we will be successful in achieving dismissal of all pending cases. While we believe a loss is not probable, we estimate the range of possible losses related to this assessment is from $0 to $6.0 million. No amount was accrued at December 31, 2019, for this matter.
We are entitled to indemnification from the former shareholders of Autocam, subject to the limitations and procedures set forth in the agreement and plan of merger relating to the Autocam acquisition. Management believes the indemnification would include amounts owed for the tax, interest, and penalties related to this matter.
Securities Offering Matter
On November 1, 2019, Erie County Employees’ Retirement System, on behalf of a purported class of plaintiffs, filed a complaint in the Supreme Court of the State of New York, County of New York, against the Company, certain of the Company’s current and former officers and directors, and each of the underwriters involved in the Company’s public offering and sale of 14.4 million shares of its common stock pursuant to a preliminary prospectus supplement, dated September 10, 2018, a final prospectus supplement, dated September 13, 2018, and a base prospectus, dated April 19, 2017, relating to the Company’s effective shelf registration statement on Form S-3 (File No. 333-216737) (the “Offering”), which complaint was amended on January 24, 2020. The complaint alleges violations of Sections 11, 12(a)(2), and 15 of the Securities Act of 1933 in connection with the Offering. The plaintiffs seek to represent a class of stockholders who purchased shares of the Company’s common stock in the Offering. The complaint seeks unspecified monetary damages and other relief. The Company believes the complaint and allegations to be without merit and intends to vigorously defend itself against these actions. The Company is unable at this time to determine whether the outcome of the litigation would have a material impact on the Company’s financial position, results of operations, or cash flows.
All Other Legal Matters
All other legal proceedings are of an ordinary and routine nature and are incidental to our operations. Management believes that such proceedings should not, individually or in the aggregate, have a material adverse effect on our business, financial condition, results of operations, or cash flows. In making that determination, we analyze the facts and circumstances of each case at least quarterly in consultation with our attorneys and determine a range of reasonably possible outcomes. The procedures performed include reviewing attorney and plaintiff correspondence, reviewing any filings made and discussing the facts of the case with local management and legal counsel. We have not recognized any material loss contingencies at December 31, 2019, or at December 31, 2018.
Item 4. | Mine Safety Disclosures |
Not applicable.
Part II
Item 5. | Market for the Registrant’s Common Equity, Related Stockholder Matters and Issuer Purchases of Equity Securities |
Our common stock is traded on Nasdaq under the trading symbol “NNBR.” As of March 6, 2020, there were approximately 6,944 beneficial owners of record of our common stock, and the closing per share stock price as reported by Nasdaq was $6.43. The following graph and table compare the cumulative total shareholder return on our common stock with the cumulative total shareholder return of: (i) the S&P SmallCap 600 Index and (ii) a customized peer group, for the period from December 31, 2014, to December 31, 2019. The customized peer group consists of the following companies, which we believe are in similar lines of business: Altra Industrial Motion Corp., Ametek Inc., CIRCOR International, Inc., Colfax Corporation, Crane, Enerpac Tool Group Corp, Kaman Corporation, Park-Ohio Holdings Corp. and Worthington Industries, Inc. (collectively, the “Peer Group”). The following graph and table assume that a $100 investment was made at the close of trading on December 31, 2014, in our common stock and in the S&P SmallCap Index and the Peer Group. We cannot assure you that the performance of our common stock will continue in the future with the same or similar trend depicted on the graph.
20
Comparison of Five-Year Cumulative Total Return
NN, Inc., Peer Group, and S&P SmallCap 600 Index
(Performance results through 12/31/2019)
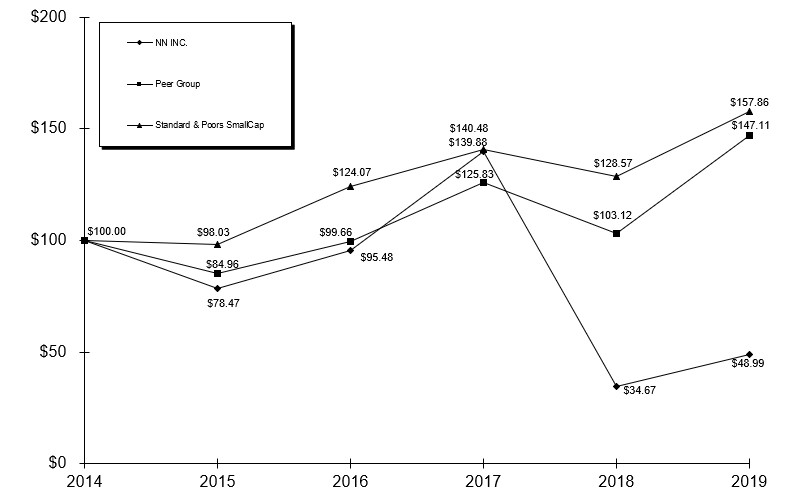
2014 | 2015 | 2016 | 2017 | 2018 | 2019 | |||||||||||||||||||
NN, Inc. | $ | 100.00 | $ | 78.47 | $ | 95.48 | $ | 139.88 | $ | 34.67 | $ | 48.99 | ||||||||||||
Peer Group | $ | 100.00 | $ | 84.96 | $ | 99.66 | $ | 125.83 | $ | 103.12 | $ | 147.11 | ||||||||||||
S&P SmallCap 600 | $ | 100.00 | $ | 98.03 | $ | 124.07 | $ | 140.48 | $ | 128.57 | $ | 157.86 | ||||||||||||
Source: Value Line Publishing LLC
The declaration and payment of dividends are subject to the sole discretion of our Board of Directors and depend upon our profitability, financial condition, capital needs, credit agreement restrictions, future prospects, and other factors deemed relevant by the Board of Directors.
See Part III, Item 12 – “Security Ownership of Certain Beneficial Owners and Management and Related Stockholder Matters” of this Annual Report for information required by Item 201 (d) of Regulation S-K.
Item 6. | Selected Financial Data |
The following selected financial data has been derived from our audited financial statements. The selected financial data should be read in conjunction with “Management’s Discussion and Analysis of Financial Condition and Results of Operations” in Item 7 and the audited Consolidated Financial Statements, including the Notes thereto, in Item 8. Certain amounts in 2018 and 2017 have been revised for the correction of misstatements described in Note 2 in the Notes to Consolidated Financial Statements included in Item 8.
21
Year Ended December 31, | ||||||||||||||||||||
2019 | 2018 | 2017 | 2016 | 2015 | ||||||||||||||||
Statement of Operations Data: | ||||||||||||||||||||
Net sales | $ | 847,451 | $ | 770,657 | $ | 619,793 | $ | 584,954 | $ | 405,443 | ||||||||||
Cost of sales (exclusive of depreciation and amortization) | 641,639 | 589,181 | 460,414 | 428,843 | 320,632 | |||||||||||||||
Goodwill impairment | — | 182,542 | — | — | — | |||||||||||||||
Income (loss) from operations | 9,889 | (179,864 | ) | 31,780 | 34,779 | 58 | ||||||||||||||
Income (loss) from continuing operations | (46,741 | ) | (262,987 | ) | 24,549 | (9,490 | ) | (24,375 | ) | |||||||||||
Income from discontinued operations, net of tax | — | — | 137,688 | 16,153 | 17,889 | |||||||||||||||
Income (loss) from continuing operations per common share, basic | $ | (1.13 | ) | $ | (8.30 | ) | $ | 0.89 | $ | (0.35 | ) | $ | (1.15 | ) | ||||||
Income (loss) from continuing operations per common share, diluted | $ | (1.13 | ) | $ | (8.30 | ) | $ | 0.89 | $ | (0.35 | ) | $ | (1.15 | ) | ||||||
Cash dividends declared per common share | $ | 0.21 | $ | 0.28 | $ | 0.28 | $ | 0.28 | $ | 0.28 | ||||||||||
As of December 31, | ||||||||||||||||||||
2019 | 2018 | 2017 | 2016 (1) | 2015 (1) | ||||||||||||||||
Balance Sheet Data: | ||||||||||||||||||||
Current assets | $ | 302,980 | $ | 296,203 | $ | 475,986 | $ | 282,328 | $ | 283,910 | ||||||||||
Current liabilities | 139,481 | 145,030 | 108,421 | 140,241 | 132,491 | |||||||||||||||
Total assets | 1,541,984 | 1,500,902 | 1,473,709 | 1,358,274 | 1,388,337 | |||||||||||||||
Long-term obligations | 769,477 | 817,549 | 792,499 | 788,953 | 802,011 | |||||||||||||||
Convertible preferred stock | 93,012 | — | — | — | — | |||||||||||||||
Stockholders’ equity | 353,277 | 419,271 | 485,329 | 309,391 | 312,431 | |||||||||||||||
_______________________________
(1) | Current assets of discontinued operations were $106.7 million, and $98.9 million as of December 31, 2016, and 2015, respectively. Current liabilities of discontinued operations were $45.2 million, and $44.6 million as of December 31, 2016, and 2015, respectively. Total assets of discontinued operations were $210.7 million, and $204.4 million as of December 31, 2016, and 2015, respectively. |
During 2019, we adopted new lease accounting guidance that requires operating leases to be included on the balance sheet. As a result of this new guidance, $65.5 million of operating lease right-of-use assets and $67.0 million of non-current operating lease liabilities are included in total assets and long-term obligations, respectively, as of December 31, 2019. Additionally, we issued convertible preferred stock in December 2019 and used the net cash proceeds of $95.7 million to pay down debt and to pay debt amendment costs.
During 2018, we recognized goodwill impairment charges of $182.5 million as described in Note 9 to the consolidated financial statements and issued shares of common stock in a public offering as described in Note 17 to the consolidated financial statements. Additionally, acquisitions made in 2018 and 2017 contributed $153.0 million to the increase in net sales and $10.4 million additional income from operations for the year ended December 31, 2018, compared to the prior year.
During 2017, we completed the sale of our global precision bearing components business (the “PBC Business”) and recorded an after-tax gain on sale of $127.7 million as described Note 3 to the consolidated financial statements. Also during 2017, we acquired DRT Medical, subsequently renamed NN Life Sciences - Vandalia, LLC, which contributed $30.7 million to net sales and $1.5 million to income from operations during the year ended December 31, 2018, and $6.7 million to net sales and $0.5 million to loss from operations during the year ended December 31, 2017, as described in Note 5 to the consolidated financial statements.
During 2016, we recognized an increase in net sales of $174.2 million and increase in income from operations of $38.5 million primarily due to the acquisition of our former Precision Engineered Products Group.
During 2015, we acquired two businesses, including our former Precision Engineered Products group, which contributed $40.7 million to net sales and $5.1 million to loss from operations during the year ended December 31, 2015. Also during 2015, we issued shares of common shares in a public offering with net proceeds used for repayment of principal and interest on existing debt.
22
Item 7. | Management’s Discussion and Analysis of Financial Condition and Results of Operations |
The following discussion should be read in conjunction with, and is qualified in its entirety by, the Consolidated Financial Statements and the Notes thereto and Selected Financial Data included elsewhere in this Annual Report. Historical operating results and percentage relationships among any amounts included in the Consolidated Financial Statements are not necessarily indicative of trends in operating results for any future period. Unless otherwise noted herein, all amounts are in thousands, except per share numbers.
Overview and Management Focus
Our strategy and management focus are based upon the following long-term objectives
• | Organic growth within all our segments; |
• | Improved operating margins |
• | Cost reduction |
• | Efficient capital deployment |
• | Reduced overall debt and debt leverage ratio improvement |
• | Capital management initiatives |
Management generally focuses on these trends and relevant market indicators
• | Global industrial growth and economics; |
• | Residential and non-residential construction rates; |
• | Global automotive production rates; |
• | Surgery rates and U.S. healthcare spending; |
• | Costs subject to the global inflationary environment, including, but not limited to: |
• | Raw materials; |
• | Wages and benefits, including health care costs; |
• | Regulatory compliance; and |
• | Energy; |
• | Trends related to the geographic migration of competitive manufacturing; |
• | Regulatory environment for United States public companies and manufacturing companies; |
• | Currency and exchange rate movements and trends; |
• | Interest rate levels and expectations; and |
• | Changes in tariff regulations. |
Management generally focuses on the following key indicators of operating performance
• | Sales growth; |
• | Cost of sales; |
• | Gross margin; |
• | Selling, general and administrative expense; |
• | Earnings before interest, taxes, depreciation and amortization; |
• | Return on invested capital; |
• | Income from operations and adjusted income from operations; |
• | Net income and adjusted net income; |
• | Leverage ratio |
• | Cash flow from operations and capital spending; |
• | Customer service reliability; |
• | External and internal quality indicators; and |
• | Employee development. |
23
Critical Accounting Policies
Our significant accounting policies, including the assumptions and judgment underlying them, are disclosed in Note 1 of the Notes to Consolidated Financial Statements. These policies have been consistently applied in all material respects and address such matters as revenue recognition, inventory valuation, and asset impairment recognition. Due to the estimation processes involved, management considers the following summarized accounting policies and their application to be critical to understanding our business operations, financial condition and results of operations. We cannot assure you that actual results will not significantly differ from the estimates used in these critical accounting policies.
Business Combinations
We allocate the total purchase price of tangible and intangible assets acquired and liabilities assumed based on their estimated fair values as of the business combination date, with the excess purchase price recorded as goodwill. The purchase price allocation process requires us to use significant estimates and assumptions, including fair value estimates, as of the business combination date. Although we believe the assumptions and estimates we have made are reasonable and appropriate, they are based in part on historical experience and information obtained from management of the acquired company. Our assumptions and estimates are also partially based on valuation models that incorporate projections of expected future cash flows and operating plans and are inherently uncertain. Valuations are performed by management or third-party valuation specialists under management’s supervision. In determining the fair value of assets acquired and liabilities assumed in business combinations, as appropriate, we may use one of the following recognized valuation methods: the income approach (including discounted cash flows, relief from royalty and excess earnings model), the market approach, or the replacement cost approach.
Examples of significant estimates used to value certain intangible assets acquired include but are not limited to:
• | sales volume, pricing, and future cash flows of the business overall; |
• | future expected cash flows from customer relationships, and other identifiable intangible assets, including future price levels, rates of increase in revenue, and appropriate attrition rate; |
• | the acquired company’s brand and competitive position, royalty rate quantum, as well as assumptions about the period of time the acquired brand will continue to benefit the combined company’s product portfolio; and |
• | cost of capital, risk-adjusted discount rates, and income tax rates. |
Different assumptions regarding projected performance and other factors associated with the acquired assets may affect the amount recorded under each type of asset and liability. The valuations of property, plant and equipment, intangible assets, goodwill and deferred income tax liabilities depend heavily on assumptions. Subsequent assessment could result in future impairment charges. We refine these estimates over a measurement period not to exceed one year to reflect new information obtained surrounding facts and circumstances existing at the acquisition date.
Goodwill and Other Indefinite Lived Intangible Assets
Goodwill is tested for impairment on an annual basis in the fourth quarter and between annual tests if a triggering event occurs. The impairment analysis is performed at the reporting unit level. An impairment charge is calculated based on a reporting unit’s carrying amount in excess of its fair value (i.e., step 1 of the two-step impairment test). If the carrying value of the reporting unit including goodwill is less than fair value of the reporting unit, the goodwill is not considered impaired. Reporting units for the purpose of goodwill impairment testing are the same as our operating segments (Life Sciences, Mobile Solutions and Power Solutions). Based on the results of the quantitative measurement performed, which indicated a fair value in excess of carrying amount for each of our designated reporting units, we concluded there was no impairment of goodwill for the year ended December 31, 2019.
The fair value of the Power Solutions reporting unit exceeds the carrying value by approximately 5% as of the date of our annual impairment test. If our assessment of the relevant facts and circumstances changes, or the actual performance falls short of the expected results, impairment charges may be required.
As noted above, it was determined under a quantitative assessment that there was no impairment of goodwill in 2019. However, if we become aware of indicators of impairment in future periods, we may be required to perform an interim assessment for some or all of our reporting units before the next annual assessment. Examples of such indicators may include a decrease in expected net earnings, adverse equity market conditions, a decline in current market multiples, a decline in our common stock price, a significant adverse change in legal factors or business climates, an adverse action or assessment by a regulator, unanticipated competition, strategic decisions made in response to economic or competitive conditions, or a more likely than not expectation that a reporting unit or a significant portion of a reporting unit will be sold or disposed of. In the event of significant adverse changes of the nature described above, we may have to recognize a non-cash impairment of goodwill, which could have a material adverse effect on our consolidated financial condition and results of operations.
24
Based on the closing sales price of a share of our common stock as of December 31, 2019, our market capitalization exceeded the $353.3 million net book value of our stockholders’ equity. Subsequent to December 31, 2019, our market capitalization declined to a level that is less than the net book value of our stockholders’ equity. A prolonged or significant decline in market capitalization could be an indicator of possible goodwill impairment. We will continue to monitor the market capitalization relative to net book value in subsequent periods.
Income Taxes
Income taxes are accounted for under the asset and liability method. Deferred tax assets and liabilities are recognized for the future tax consequences attributable to differences between the financial statement carrying amounts of existing assets and liabilities and their respective tax bases and operating loss and tax credit carryforwards. Deferred tax assets and liabilities are measured using enacted tax rates expected to apply to taxable income in the years in which those temporary differences are expected to be recovered or settled. The effect on deferred tax assets and liabilities of a change in tax rates is recognized in income in the period that includes the enactment date. Valuation allowances are recorded to reduce deferred tax assets when it is more likely than not that a tax benefit will not be realized. Provision has been made for income taxes on unremitted earnings of certain foreign subsidiaries as these earnings are not deemed to be permanently reinvested. We recognize income tax positions that meet the more likely than not threshold and accrue interest and potential penalties related to unrecognized income tax positions which are recorded as a component of the provision (benefit) for income taxes.
The calculation of tax assets, liabilities, and expenses under U.S. GAAP is largely dependent on management judgment of the current and future deductibility and utilization of taxable expenses and benefits using a more likely than not threshold. Specifically, the realization of deferred tax assets and the certainty of tax positions taken are largely dependent upon management weighting the current positive and negative evidence for recording tax benefits and expenses. Additionally, many of our positions are based on future estimates of taxable income and deductibility of tax positions. Particularly, our assertion of permanent reinvestment of foreign undistributed earnings is largely based on management’s future estimates of domestic and foreign cash flows and current strategic foreign investment plans. As of December 31, 2019, the Company is not asserting indefinite reinvestment on unremitted earnings of certain foreign subsidiaries in China and Mexico. We have recorded a U.S. deferred tax liability as applicable for these subsidiaries. All other foreign earnings continue to be considered indefinitely reinvested. We treat global intangible low-taxed income (“GILTI”) as a periodic charge in the year in which it arises and therefore do not record deferred taxes for basis differences associated with GILTI.
In the event that the actual outcome from future tax consequences differs from management estimates and assumptions or management plans and positions are amended, the resulting change to the provision for income taxes could have a material impact on the consolidated results of operations and financial position. (See Note 1 and Note 11 of the Notes to Consolidated Financial Statements).
Impairment of Long-Lived Assets
Long-lived tangible and intangible assets subject to depreciation or amortization are tested for recoverability when changes in circumstances indicate the carrying value of these assets may not be recoverable. A test for recoverability is also performed when management has committed to a plan to dispose of a reporting unit or asset group. Assets to be held and used are tested for recoverability when indications of impairment are evident. Recoverability of a long-lived tangible or intangible asset is evaluated by comparing its carrying value to the future estimated undiscounted cash flows expected to be generated by the asset or asset group. If the asset is not recoverable, then the asset is considered impaired and adjusted to fair value which is then depreciated or amortized over its remaining useful life. Assets to be disposed of are recorded at the lesser of carrying value or fair value less costs of disposal. In assessing potential impairment for long-lived assets, we consider forecasted financial performance based, in large part, on management business plans and projected financial information which are subject to a high degree of management judgment and complexity. Future adverse changes in market conditions or adverse operating results of the underlying assets could result in having to record additional impairment charges not previously recognized.
Results of Operations
Factors That May Influence Results of Operations
The following paragraphs describe factors that have influenced results of operations for the year ended December 31, 2019, that management believes are important to provide an understanding of the business and results of operations or that may influence operations in the future.
Prior Periods’ Financial Statement Revisions
As described in Note 2 to the consolidated financial statements, we have revised previously issued financial statements to correct immaterial misstatements. Accordingly, this Management’s Discussion and Analysis of Financial Condition and Results of Operations reflects the effects of the revisions.
25
Management Structure
Our enterprise and management structure is designed to accelerate growth and further balance our portfolio by aligning our strategic assets and businesses. Our businesses are organized into the Life Sciences, Mobile Solutions, and Power Solutions groups and are based principally on the end markets they serve. Life Sciences is focused on growth in the medical end market, primarily in the orthopaedics and medical/surgical end markets. Mobile Solutions is focused on growth in the general industrial and automotive end markets. Power Solutions is focused on growth in the electrical and aerospace and defense end markets.
During 2019, our former president and chief executive officer and former chief financial officer left the Company, and we appointed a new chief executive officer and new chief financial officer. We also appointed new executive vice presidents over each of our segments.
Capital Structure
On December 11, 2019, we issued to affiliates of existing common stockholders in a private placement 0.1 million shares of contingently redeemable Series B convertible preferred stock (“Preferred Stock”) at a price of $1,000 per share, together with detachable warrants (the “Warrants”) to purchase up to 1.5 million shares of our common stock at an exercise price of $12.00 per share. The Preferred Stock has a liquidation preference of $1,000 per share; is redeemable at our option in cash (or, under certain circumstances, in stock), subject to the applicable redemption premium; is convertible into a variable number of common shares on certain terms and conditions on or after March 31, 2023; and is subject to certain other rights and obligations. In connection with the issuance of Preferred Stock, we entered into a registration rights agreement with the purchasers to provide certain customary demand registration rights exercisable beginning on March 31, 2021, with respect to their shares of common stock, including those underlying the Preferred Stock and Warrants, shares of Preferred Stock, and the Warrants.
Net cash proceeds of $95.7 million from the issuance of the Preferred Stock were used for debt repayment, fees associated with the amendment and extension of our credit facility, and for general corporate purposes. Preferred Stock shares have limited voting rights and earn cumulative dividends at a rate of 10.625% per year, payable quarterly in arrears if declared, and accrue whether or not earned or declared. If a Preferred Stock dividend is declared by the Board of Directors, then it will be paid in cash. Additionally, holders of Preferred Stock participate in any dividends paid on shares of NN’s common stock on an as-converted basis at a fixed conversion rate. If our common stockholders do not approve a proposal at our 2020 annual stockholder meeting to issue common stock in excess of thresholds established by certain Nasdaq stock market rules upon the exercise of Warrants or the conversion or redemption of Preferred Stock, then the annual dividend rate will immediately increase to 11.625% until such time approval is obtained.
Coronavirus Outbreak
In December 2019, a novel strain of coronavirus began to impact the population of China, where several of our manufacturing facilities are located. In late January and early February 2020, in an effort to contain the spread of the virus and maintain the wellbeing of our employees and in accordance with governmental requirements, we closed several production facilities in China. To date, approximately 92% of our Chinese employees at one location and 100% at another have all returned back to work, and limitations on movement in China appear to be softening. However, the virus has now spread globally, and if the outbreak situation should continue to worsen, we could experience further supplier and customer disruption, which could have a material adverse effect on our results of operations and cash flows.
26
Financial Data as a Percentage of Net Sales
The following table presents the percentage of our net sales represented by statement of operations line item.
Year Ended December 31, | ||||||
2019 | 2018 | |||||
Net sales | 100.0 | % | 100.0 | % | ||
Cost of sales (exclusive of depreciation and amortization shown separately below) | 75.7 | % | 76.5 | % | ||
Selling, general and administrative expense | 12.2 | % | 12.1 | % | ||
Acquisition related costs excluded from selling, general and administrative expense | — | % | 0.8 | % | ||
Depreciation and amortization | 10.8 | % | 9.2 | % | ||
Goodwill impairment | — | % | 23.7 | % | ||
Restructuring and integration expense, net | — | % | 0.3 | % | ||
Other operating (income) expense, net | 0.1 | % | 0.8 | % | ||
Income (loss) from operations | 1.2 | % | (23.3 | )% | ||
Interest expense | 6.7 | % | 7.9 | % | ||
Loss on extinguishment of debt and write-off of debt issuance costs | 0.4 | % | 2.5 | % | ||
Other (income) expense, net | 0.1 | % | 0.2 | % | ||
Loss before benefit for income taxes and share of net income from joint venture | (6.1 | )% | (34.0 | )% | ||
Benefit for income taxes | 0.4 | % | 1.7 | % | ||
Share of net income (loss) from joint venture | 0.2 | % | (1.9 | )% | ||
Net income (loss) | (5.5 | )% | (34.1 | )% | ||
Sales Concentration
During 2019, sales to various U.S. and foreign divisions of our ten largest customers accounted for approximately 52% of our consolidated net sales. For the year ended December 31, 2019, we recognized sales from a single customer of $93.1 million, or 11.0% of consolidated net sales. Revenues from this customer are in our Life Sciences and Power Solutions groups. The loss of all or a substantial portion of sales to these customers would cause us to lose a substantial portion of our revenue and have a corresponding negative impact on our income from operations and operating cash flows or cause us to incur additional restructuring and/or impairment costs.
27
Year Ended December 31, 2019, compared to the Year Ended December 31, 2018
Year Ended December 31, | ||||||||||||||||
2019 | 2018 | $ Change | ||||||||||||||
Net sales | $ | 847,451 | $ | 770,657 | $ | 76,794 | ||||||||||
Acquisitions | $ | 75,334 | ||||||||||||||
Organic growth | 9,847 | |||||||||||||||
Foreign exchange effects | (8,387 | ) | ||||||||||||||
Cost of sales (exclusive of depreciation and amortization shown separately below) | 641,639 | 589,181 | 52,458 | |||||||||||||
Selling, general and administrative expense | 103,223 | 93,583 | 9,640 | |||||||||||||
Acquisition related costs excluded from selling, general and administrative expense | — | 5,871 | (5,871 | ) | ||||||||||||
Depreciation and amortization | 91,846 | 71,128 | 20,718 | |||||||||||||
Goodwill impairment | — | 182,542 | (182,542 | ) | ||||||||||||
Restructuring and integration expense, net | (12 | ) | 2,127 | (2,139 | ) | |||||||||||
Other operating (income) expense, net | 866 | 6,089 | (5,223 | ) | ||||||||||||
Income from operations | 9,889 | (179,864 | ) | 189,753 | ||||||||||||
Interest expense | 57,155 | 61,243 | (4,088 | ) | ||||||||||||
Loss on extinguishment of debt and write-off of debt issuance costs | 3,293 | 19,562 | (16,269 | ) | ||||||||||||
Other (income) expense, net | 1,140 | 1,341 | (201 | ) | ||||||||||||
Loss before benefit for income taxes and share of net income from joint venture | (51,699 | ) | (262,010 | ) | 210,311 | |||||||||||
Benefit for income taxes | 3,277 | 13,413 | (10,136 | ) | ||||||||||||
Share of net income (loss) from joint venture | 1,681 | (14,390 | ) | 16,071 | ||||||||||||
Net loss | $ | (46,741 | ) | $ | (262,987 | ) | $ | 216,246 | ||||||||
Net Sales. Net sales increased by $76.8 million, or 10.0%, during the year ended December 31, 2019, compared to the year ended December 31, 2018, primarily due to $75.3 million of additional net sales attributable to businesses acquired in 2018 as well as a net increase due to organic growth of $9.8 million which was led by an increase in core volume in the Life Sciences group. The increase in Life Sciences core volume was partially offset by lower demand within the automotive end market in Mobile Solutions group as well as unfavorable foreign exchange effects of $8.4 million in Europe, South America, and Asia.
Cost of Sales. Cost of sales increased by $52.5 million, or 8.9%, during the year ended December 31, 2019, compared to the year ended December 31, 2018, primarily due to $51.5 million in additional cost of sales attributable to the businesses acquired in 2018 as well as an increase due to organic growth of $6.9 million. Organic growth in cost of sales relative to net sales was impacted by the relative contribution margin impact of higher sales in the Life Sciences group and lower sales in the Mobile Solutions group. The increase in cost of sales was partially offset by favorable foreign exchange effects of $6.0 million.
Selling, General and Administrative Expense. Selling, general and administrative expense increased by $9.6 million during the year ended December 31, 2019, compared to the year ended December 31, 2018, primarily due to businesses acquired in 2018 which collectively contributed an additional $7.4 million to selling, general and administrative expense during the year ended December 31, 2019, as well as an increase in overall headcount and inflation in wages and benefits. The increase was partially offset by lower costs for professional services as a result of cost savings initiatives, including integration of recent acquisitions.
Acquisition Related Costs Excluded from Selling, General and Administrative Expense. Acquisition related costs decreased by $5.9 million during the year ended December 31, 2019, compared to the year ended December 31, 2018, as there was no business acquisition activity during the year ended December 31, 2019. The year ended December 31, 2018, included professional service costs incurred in connection with the 2018 business acquisitions.
Depreciation and Amortization. Depreciation and amortization increased by $20.7 million during the year ended December 31, 2019, compared to the year ended December 31, 2018, consistent with additions to intangible assets and property, plant and equipment, including an additional $11.8 million from businesses acquired in 2018. The increase in depreciation and amortization includes the effects of related fair value adjustments to certain property, plant and equipment and the addition of intangible assets, principally for customer relationships and trade names.
28
Goodwill Impairment. Goodwill impairment decreased by $182.5 million during the year ended December 31, 2019, compared to the year ended December 31, 2018, as there was no goodwill impairment recorded during the year ended December 31, 2019. Goodwill impairment was recorded in the year ended December 31, 2018, as a result of the goodwill impairment charges at Mobile Solutions and Power Solutions.
Restructuring and Integration Expense. Restructuring and integration expense decreased by $2.1 million during the year ended December 31, 2019, compared to the year ended December 31, 2018, primarily due to employee severance costs incurred in connection with implementing our new enterprise and management structure as well as the acquisition of Paragon Medical, Inc. in 2018. Note 15 in the Notes to Consolidated Financial Statements provides more information regarding the effects of restructuring and integration on our operating results.
Other Operating (Income) Expense, Net. Other operating (income) expense, net, decreased by $5.2 million during the year ended December 31, 2019, compared to the year ended December 31, 2018, primarily due to a reduction in asset impairment charges.
Interest Expense. Interest expense decreased by $4.1 million during the year ended December 31, 2019, compared to the year ended December 31, 2018, primarily due to payoff of the $200.0 million Second Lien Facility, which was entered into in May 2018 and repaid in full in September 2018, as well as principal payments on our credit facility, partially offset by higher average interest rates and increased borrowings under the Senior Secured Revolver during 2019.
Year Ended December 31, | ||||||||
2019 | 2018 | |||||||
Interest on debt | $ | 51,967 | $ | 56,977 | ||||
Interest rate swap settlements | 1,411 | — | ||||||
Amortization of debt issuance costs | 4,789 | 4,845 | ||||||
Capitalized interest | (1,847 | ) | (1,203 | ) | ||||
Other | 835 | 624 | ||||||
Total interest expense | $ | 57,155 | $ | 61,243 | ||||
Loss on Extinguishment of Debt and Write-off of Unamortized Debt Issuance Costs. Loss on extinguishment of debt and write-off of unamortized debt issuance costs decreased by $16.3 million during the year ended December 31, 2019, compared to the year ended December 31, 2018, due to a prepayment penalty and costs written off associated with the Second Lien Facility and the amendment to the existing credit facility in May 2018. Costs written off in association with the 2019 amendments to the credit facility were lower than those associated with the Second Lien Facility.
Provision/Benefit for Income Taxes. Our effective tax rate was 6.3% for the year ended December 31, 2019, compared to 5.1% for the year ended December 31, 2018. Note 12 in the Notes to Consolidated Financial Statements describes the components of income taxes for each period presented.
Share of Net Income from Joint Venture. Our share of net income from the joint venture increased by $16.1 million primarily due to a partial impairment of the investment in the joint venture of $16.6 million during the year ended December 31, 2018. Refer to Note 11 to the consolidated financial statements for further discussion of the joint venture.
Results by Segment
LIFE SCIENCES
Year Ended December 31, | ||||||||||||||||
2019 | 2018 | $ Change | ||||||||||||||
Net sales | $ | 359,732 | $ | 248,173 | $ | 111,559 | ||||||||||
Acquisitions | $ | 71,375 | ||||||||||||||
Organic growth | 41,383 | |||||||||||||||
Foreign exchange effects | (1,199 | ) | ||||||||||||||
Income from operations | 28,157 | 19,136 | 9,021 | |||||||||||||
Net sales increased by $111.6 million during the year ended December 31, 2019, compared to the year ended December 31, 2018, primarily due to $71.4 million of net sales attributable to the Paragon Medical and Bridgemedica acquisitions as well as a $41.4 million increase in organic growth as a result of an increase in core volume primarily within the orthopaedic and medical/surgical end markets. These increases were partially offset by unfavorable foreign exchange effects of $1.2 million.
Income from operations increased by $9.0 million compared to prior year primarily due to income related to the Paragon Medical and Bridgemedica acquisitions as well as lower costs resulting from our strategic initiatives for cost savings and the
29
favorable impact of integration activities. The higher income was partially offset by an increase in costs related to organic growth in the Life Sciences group.
MOBILE SOLUTIONS
Year Ended December 31, | |||||||||||||||
2019 | 2018 | $ Change | |||||||||||||
Net sales | $ | 297,749 | $ | 335,037 | $ | (37,288 | ) | ||||||||
Organic growth | (30,305 | ) | |||||||||||||
Foreign exchange effects | (6,983 | ) | |||||||||||||
Goodwill impairment | — | 73,442 | (73,442 | ) | |||||||||||
Income from operations | 9,553 | (55,079 | ) | 64,632 | |||||||||||
Net sales decreased by $37.3 million during the year ended December 31, 2019, compared to the year ended December 31, 2018, primarily due to lower demand within the North American and European automotive markets, unfavorable foreign exchange effects, reduced demand for components associated with programs nearing the end of the product lifecycle, and delays in new product launches, partially offset by higher demand within the South American automotive market.
Income from operations increased by $64.6 million compared to prior year primarily due to the $73.4 million goodwill impairment in the prior year. Absent the effect of the goodwill impairment, income from operations decreased by $8.8 million due to lost variable margin on the above-referenced sales volume decline and costs associated with the launch of new fuel systems business within our European operations. These unfavorable impacts were partially offset by favorable foreign exchange effects and fixed cost reduction initiatives achieved in response to the decline in sales volume.
POWER SOLUTIONS
Year Ended December 31, | ||||||||||||||||
2019 | 2018 | $ Change | ||||||||||||||
Net sales | $ | 192,100 | $ | 189,778 | $ | 2,322 | ||||||||||
Acquisitions | $ | 3,959 | ||||||||||||||
Organic growth | (1,432 | ) | ||||||||||||||
Foreign exchange effects | (205 | ) | ||||||||||||||
Goodwill impairment | — | 109,100 | (109,100 | ) | ||||||||||||
Income from operations | 13,881 | (95,115 | ) | 108,996 | ||||||||||||
Net sales increased by $2.3 million during the year ended December 31, 2019, compared to the year ended December 31, 2018, primarily due to $4.0 million of net sales attributable to the Technical Arts acquisition. The increase in net sales was partially offset by lower demand in the electrical products end market and unfavorable foreign exchange effects.
Income from operations increased by $109.0 million compared to prior year due to the $109.1 million goodwill impairment in the prior year.
Changes in Financial Condition from December 31, 2018, to December 31, 2019
Overview
From December 31, 2018, to December 31, 2019, total assets increased by $41.1 million primarily due to the initial recognition of operating lease assets as of January 1, 2019, pursuant to ASC 842. Cash increased by $13.7 million primarily due to residual proceeds from the issuance of Preferred Stock after paying down debt and the payment of fees associated with the amendment and extension of our credit facility. These increases were partially offset by a decrease in intangible assets due to normal amortization.
From December 31, 2018, to December 31, 2019, total liabilities increased by $14.1 million primarily due to the initial recognition of operating lease liabilities as of January 1, 2019, pursuant to ASC 842 and recognition of the fair value of the interest rate swap. These increases were partially offset by a reduction in outstanding borrowings under our credit facility.
Working capital, which consists principally of cash, accounts receivable, inventories, and other current assets offset by accounts payable, accrued payroll costs, current maturities of long-term debt, current portion of lease liabilities, and other current liabilities, was $163.5 million as of December 31, 2019, compared to $151.2 million as of December 31, 2018. The increase in working capital was due primarily to cash proceeds from the sale of Preferred Stock after the paydown of principal outstanding on the Senior Secured Revolver.
30
Cash Flows
Cash provided by operations was $49.2 million for the twelve months ended December 31, 2019, compared with cash provided by operations of $40.9 million for the twelve months ended December 31, 2018. The difference was primarily due to improved gross margin which was partially offset by cash paid for taxes in 2019 compared to cash received for tax refunds in 2018.
Cash used in investing activities was $39.4 million for the twelve months ended December 31, 2019, compared with cash used by investing activities of $461.3 million for the twelve months ended December 31, 2018. The decrease was primarily due to cash paid for the 2018 business acquisitions partially offset by cash received from the liquidation of a short-term investment and some fixed assets during 2019.
Cash provided by financing activities was $5.3 million for the twelve months ended December 31, 2019, compared with cash provided by financing activities of $215.1 million for the twelve months ended December 31, 2018. The difference was primarily due to net proceeds of $217.3 million from the sale of common stock during the twelve months ended December 31, 2018. We received net proceeds of $95.7 million from the sale of Preferred Stock during the twelve months ended December 31, 2019, which were used to repay the entire balance outstanding on our Senior Secured Revolver.
Liquidity and Capital Resources
Overview
On October 21, 2019, we announced expense reduction and cash savings initiatives to help the Company continue to pay down its debt and support greater growth by reinvesting in its businesses. The expense reduction and cash saving initiatives will include streamlining facilities and reducing overall selling, general and administrative costs; elimination of quarterly dividend payments; and a reduction in capital expenditures from 2019 spending levels as the Company returns to a more normalized level of capital spending after several years of higher investment.
In November 2019, we initiated a strategic review to evaluate a broad range of operational, financial, and strategic options to reduce leverage and enhance shareholder value, and we retained external advisors to assist in this effort. The strategic options we are evaluating include further cost savings and cash generation initiatives, more efficient capital deployment, changes to our debt and equity structure to improve financial flexibility and liquidity, and the sale of part or all of NN, among others.
As discussed in Note 13 and Note 17 in the accompanying Notes to Consolidated Financial Statements in Item 8, on December 11, 2019, we issued preferred stock for net proceeds of $95.7 million and used a portion of the proceeds to repay amounts due at that time on our Senior Secured Revolver. In December 2019 we amended our Credit Agreement which, in turn, extended the due date of our Senior Secured Revolver to July 20, 2022, and reduced the total available borrowing amount to $75.0 million and extended our Incremental Term Loan to October 19, 2022, matching the date of our longer-dated Senior Secured Term Loan. Additionally, as part of this amendment our debt covenants were amended to establish more restrictive leverage ratios that also become more restrictive over time. Our Consolidated Net Leverage Ratio covenant (the “financial leverage ratio covenant”) is required to be complied with on a quarterly basis at the end of each of our quarterly reporting periods. Our financial leverage ratio covenant is based upon our consolidated net indebtedness at each quarter end and our trailing twelve-month Adjusted EBITDA as defined in our Credit Agreement. In order to maintain compliance with the financial leverage ratio covenant, our operational and financial performance must continue to improve in line with our expectations.
The Company relies on cash flow generated from operations and available borrowings under its Senior Secured Revolver to fund our working capital and other operating and investing needs. Our ability to borrow under our Senior Secured Revolver is based on our continued compliance with our financial leverage ratio covenant, as defined, which becomes more restrictive in the second quarter of 2020 and the first quarter of 2021. If our operational and financial performance does not improve in line with our expectations, and as a result we are unable to comply with our financial ratio covenant, then the revolving credit lenders, the Senior Secured Term Loan lenders, and the Incremental Term Loan lenders could take action to cause amounts due under our credit facilities to become due and payable unless we are able to amend such covenants or otherwise refinance our debt. Our ability to amend our covenants or refinance our debt is dependent upon several factors, and therefore there can be no assurance that we would be successful in these efforts. If we would be unable to access future borrowings or be required to pay amounts due under our credit facilities prior to their normal maturity dates, this would have a material impact to the Company’s financial position. We have developed a plan to mitigate the risk of noncompliance with our financial covenants, if necessary, which includes the implementation of a series of specific and identified cost reductions in both our corporate and business groups, including a reduction of our direct and indirect labor costs and benefits. In addition, our plans also include, as deemed necessary, repatriating cash from certain overseas businesses, managing our working capital more efficiently through usage of our customers’ available supply chain finance programs and other means, and the sale or sublease of certain underutilized properties.
31
Hedging
On February 8, 2019, we entered into a $700.0 million fixed-rate interest rate swap agreement that changed the LIBOR-based portion of the interest rate on a portion of our variable rate debt to a fixed rate of 2.4575%. The term of the interest rate swap is from the effective date of February 12, 2019, through the termination date of October 19, 2022, with a declining notional amount over the term of the interest rate swap. Refer to Note 22 in the Notes to Consolidated Financial Statements for further discussion about the interest rate swap.
Our arrangements with customers typically provide that payments are due within 30 to 60 days following the date of shipment. We invoice and receive payment from many of our customers in various other currencies. Additionally, we are party to various third party and intercompany loans, payables, and receivables denominated in currencies other than the U.S. dollar. As a result of these sales, loans, payables, and receivables, we are exposed to foreign exchange transaction and translation risk. Various strategies to manage this risk are available to management, including producing and selling in local currencies and hedging programs. As of December 31, 2019, no currency derivatives were in place. In addition, a strengthening of the U.S. dollar against foreign currencies could impair our ability to compete with international competitors for foreign as well as domestic sales.
Credit Facility
Aggregate principal amounts outstanding under our Senior Secured Term Loan, Incremental Term Loan, and Senior Secured Revolver as of December 31, 2019, were $783.4 million, without regard to unamortized debt issuance costs. As of December 31, 2019, we had unused borrowing capacity of $63.9 million under the Senior Secured Revolver, subject to certain limitations. This amount of borrowing capacity is net of $11.1 million of outstanding letters of credit at December 31, 2019, which are considered as usage of the Senior Secured Revolver.
Collectively, our Senior Secured Term Loan, Incremental Term Loan, and Senior Secured Revolver comprise our credit facility. Total available capacity under the Senior Secured Revolver was $75.0 million as of December 31, 2019. The Senior Secured Revolver matures on July 20, 2022.
The Senior Secured Term Loan requires quarterly principal payments of $1.4 million through October 19, 2022, with the remaining principal amount due on the maturity date. If one-month LIBOR is less than 0.75%, then we pay 6.00% per annum in interest. If one-month LIBOR exceeds 0.75%, then we pay the variable one-month LIBOR plus an applicable margin of 5.25%. Based on the interest rate in effect at December 31, 2019, annual interest payments would be approximately $41.1 million in 2020, approximately $40.2 million in 2021, and approximately $30.6 million in 2022.
The Incremental Term Loan requires quarterly principal payments of $3.0 million through October 19, 2022, with the remaining principal amount due on the maturity date. The Incremental Term Loan bears interest at the variable one-month LIBOR plus an applicable margin of 5.25%. Based on the interest rate in effect at December 31, 2019, annual interest payments would be $19.3 million in 2020, $17.2 million in 2021, and $13.1 million in 2022.
The Senior Secured Revolver bears interest on a variable rate structure with borrowings bearing interest at either one-month LIBOR plus an applicable margin of 4.00% or the prime lending rate plus an applicable margin of 3.00%. We pay a commitment fee of 0.50% for unused capacity under the Senior Secured Revolver.
Covenants
Our credit facility is subject to certain financial covenants based on a consolidated net leverage ratio, becoming more restrictive over time. If our operational or financial performance does not improve in line with our expectations, we may be required to take actions to further reduce expenditures and decrease our net indebtedness to maintain compliance in future periods. We were in compliance with all covenants under our credit facility at December 31, 2019.
32
The table below sets forth our contractual obligations and commercial commitments as of December 31, 2019:
Payments Due by Period | ||||||||||||||||||||
Certain Contractual Obligations | Total | Less than 1 year | 1-3 years | 3-5 years | After 5 years | |||||||||||||||
Long-term debt including current portion | $ | 793,247 | $ | 19,160 | $ | 767,939 | $ | 2,347 | $ | 3,801 | ||||||||||
Expected interest payments (1) | 162,496 | 60,639 | 101,447 | 195 | 215 | |||||||||||||||
Operating leases (2) | 109,212 | 12,229 | 22,174 | 18,535 | 56,274 | |||||||||||||||
Transition tax on deferred foreign income | 1,480 | 208 | 598 | 674 | — | |||||||||||||||
Finance leases | 16,763 | 4,099 | 7,952 | 4,440 | 272 | |||||||||||||||
Total contractual cash obligations | $ | 1,083,198 | $ | 96,335 | $ | 900,110 | $ | 26,191 | $ | 60,562 | ||||||||||
_______________________________
(1) | Expected interest payments consists of fixed-rate debt under the interest rate swap agreement (refer to Note 22 of the Notes to Consolidated Financial Statements) and variable rate debt. Expected interest payments under the variable rate debt are based on one-month LIBOR as of December 31, 2019. |
(2) | During the year ended December 31, 2018, we entered into a build-to-suit lease agreement that will commence upon completion of construction of the leased facility. Base rent payments of approximately $1.8 million per year are not included in the table above and are expected to commence during the third quarter of 2020 and continue over the 15-year lease term. |
We have approximately $2.6 million in unrecognized tax benefits accrued within the liabilities section of our balance sheet. We are unsure when or if at all these amounts might be paid to U.S. and/or foreign taxing authorities. Accordingly, these amounts have been excluded from the table above. (See Note 12 of the Notes to Consolidated Financial Statements).
Functional Currencies
We currently have foreign operations in Brazil, China, France, Mexico, and Poland. The local currency of each foreign facility is also its functional currency.
Seasonality and Fluctuation in Quarterly Results
General economic conditions impact our business and financial results, and certain businesses experience seasonal and other trends related to the industries and end markets that they serve. For example, European sales are often weaker in the summer months as customers slow production, medical device sales are often stronger in the fourth calendar quarter, and sales to original equipment manufacturers are often stronger immediately preceding and following the launch of new products. However, as a whole, we are not materially impacted by seasonality.
Off-Balance Sheet Arrangements
We are not a party to any off-balance sheet arrangements that have, or are reasonably likely to have, a material current or future effect on our financial condition, revenues or expenses, results of operations, liquidity, capital expenditures, or capital resources.
Item 7A. | Quantitative and Qualitative Disclosures About Market Risk |
We are exposed to changes in financial market conditions in the normal course of business due to use of certain financial instruments as well as transacting business in various foreign currencies. To mitigate the exposure to these market risks, we have established policies, procedures, and internal processes governing the management of financial market risks. We are exposed to changes in interest rates primarily as a result of borrowing activities.
Interest Rate Risk
Our policy is to manage interest expense using a mixture of fixed and variable rate debt. To manage this mixture of fixed and variable rate debt effectively and mitigate interest rate risk, we may use interest rate swap agreements. The nature and amount of borrowings may vary as a result of future business requirements, market conditions, and other factors.
In February 2019, we entered into a $700.0 million fixed-rate interest rate swap agreement that changed the LIBOR-based portion of the interest rate on a portion of our variable rate debt to a fixed rate of 2.4575%. The term of the interest rate swap is from the effective date of February 12, 2019, through the termination date of October 19, 2022, with a declining notional amount over the term of the interest rate swap. Refer to Note 22 in the Notes to Consolidated Financial Statements for further discussion about the interest rate swap.
At December 31, 2019, we had $526.3 million and $257.1 million of principal outstanding under the Senior Secured Term Loan and Incremental Term Loan, respectively, without regard to capitalized debt issuance costs. At December 31, 2019,
33
$700.0 million of this outstanding principal was hedged, and a one-percent increase in the interest rate charged on outstanding unhedged variable rate borrowings under the Senior Secured Term Loan and Incremental Term Loan would increase interest expense $0.8 million on an annualized basis.
At December 31, 2019, we had no principal outstanding under the Senior Secured Revolver.
Foreign Currency Risk
Translation of our operating cash flows denominated in foreign currencies is impacted by changes in foreign exchange rates. We participate in various third party and intercompany loans, payables, and receivables denominated in currencies other than the U.S. dollar. To help reduce exposure to foreign currency fluctuation, we have incurred debt in euros in the past. From time to time, we may use foreign currency derivatives to hedge currency exposures when these exposures meet certain discretionary levels. We did not hold a position in any foreign currency derivatives as of December 31, 2019.
34
Item 8. | Financial Statements and Supplementary Data |
Index to Financial Statements
Page | |
35
Report of Independent Registered Public Accounting Firm
To the Board of Directors and Stockholders of NN, Inc.
Opinions on the Financial Statements and Internal Control over Financial Reporting
We have audited the accompanying consolidated balance sheets of NN, Inc. and its subsidiaries (the “Company”) as of December 31, 2019 and 2018, and the related consolidated statements of operations and comprehensive income (loss), of changes in stockholders’ equity and of cash flows for each of the three years in the period ended December 31, 2019, including the related notes (collectively referred to as the “consolidated financial statements”). We also have audited the Company's internal control over financial reporting as of December 31, 2019, based on criteria established in Internal Control - Integrated Framework (2013) issued by the Committee of Sponsoring Organizations of the Treadway Commission (COSO).
In our opinion, the consolidated financial statements referred to above present fairly, in all material respects, the financial position of the Company as of December 31, 2019 and 2018, and the results of its operations and its cash flows for each of the three years in the period ended December 31, 2019 in conformity with accounting principles generally accepted in the United States of America. Also in our opinion, the Company did not maintain, in all material respects, effective internal control over financial reporting as of December 31, 2019, based on criteria established in Internal Control - Integrated Framework (2013) issued by the COSO because the following material weaknesses in internal control over financial reporting existed as of that date. The Company (i) did not maintain an effective control environment due to a lack of a sufficient complement of personnel with an appropriate level of knowledge, experience and training commensurate with the Company’s financial reporting requirements and (ii) did not design and maintain effective monitoring controls over its Paragon Medical business as the Company did not maintain personnel and systems that were sufficient to ensure the adequate monitoring of control activities for certain processes. These material weaknesses contributed to additional material weaknesses, as the Company did not design and maintain effective internal control (iii) over the accounting for transactions within the revenue and receivables business process within the Company’s Paragon Medical business to determine whether the transactions occurred and were complete and accurate and (iv) within the Paragon Medical business over certain information technology general controls that are relevant to the preparation of the Company’s financial statements. The Company also (v) did not maintain effective control activities at one of its smaller foreign subsidiaries in which certain employees intentionally did not operate the controls related to inventory quantities as designed that resulted in the creation of unsupported physical inventory counts and inventory quantity adjustments.
A material weakness is a deficiency, or a combination of deficiencies, in internal control over financial reporting, such that there is a reasonable possibility that a material misstatement of the annual or interim financial statements will not be prevented or detected on a timely basis. The material weaknesses referred to above are described in Management’s Report on Internal Control Over Financial Reporting appearing under Item 9A. We considered these material weaknesses in determining the nature, timing, and extent of audit tests applied in our audit of the 2019 consolidated financial statements, and our opinion regarding the effectiveness of the Company’s internal control over financial reporting does not affect our opinion on those consolidated financial statements.
Change in Accounting Principle
As discussed in Note 1, the Company changed the manner in which it accounts for leases in 2019.
Basis for Opinions
The Company's management is responsible for these consolidated financial statements, for maintaining effective internal control over financial reporting, and for its assessment of the effectiveness of internal control over financial reporting included in management's report referred to above. Our responsibility is to express opinions on the Company’s consolidated financial statements and on the Company's internal control over financial reporting based on our audits. We are a public accounting firm registered with the Public Company Accounting Oversight Board (United States) (PCAOB) and are required to be independent with respect to the Company in accordance with the U.S. federal securities laws and the applicable rules and regulations of the Securities and Exchange Commission and the PCAOB.
We conducted our audits in accordance with the standards of the PCAOB. Those standards require that we plan and perform the audits to obtain reasonable assurance about whether the consolidated financial statements are free of material misstatement,
36
whether due to error or fraud, and whether effective internal control over financial reporting was maintained in all material respects.
Our audits of the consolidated financial statements included performing procedures to assess the risks of material misstatement of the consolidated financial statements, whether due to error or fraud, and performing procedures that respond to those risks. Such procedures included examining, on a test basis, evidence regarding the amounts and disclosures in the consolidated financial statements. Our audits also included evaluating the accounting principles used and significant estimates made by management, as well as evaluating the overall presentation of the consolidated financial statements. Our audit of internal control over financial reporting included obtaining an understanding of internal control over financial reporting, assessing the risk that a material weakness exists, and testing and evaluating the design and operating effectiveness of internal control based on the assessed risk. Our audits also included performing such other procedures as we considered necessary in the circumstances. We believe that our audits provide a reasonable basis for our opinions.
Emphasis of Matter
As disclosed in Note 1 to the consolidated financial statements, the Company is required to comply with a financial ratio covenant pursuant to its Credit Agreement which becomes more restrictive over time and will require the Company to improve financial performance or take other measures to maintain compliance with its debt agreements.
Definition and Limitations of Internal Control over Financial Reporting
A company’s internal control over financial reporting is a process designed to provide reasonable assurance regarding the reliability of financial reporting and the preparation of financial statements for external purposes in accordance with generally accepted accounting principles. A company’s internal control over financial reporting includes those policies and procedures that (i) pertain to the maintenance of records that, in reasonable detail, accurately and fairly reflect the transactions and dispositions of the assets of the company; (ii) provide reasonable assurance that transactions are recorded as necessary to permit preparation of financial statements in accordance with generally accepted accounting principles, and that receipts and expenditures of the company are being made only in accordance with authorizations of management and directors of the company; and (iii) provide reasonable assurance regarding prevention or timely detection of unauthorized acquisition, use, or disposition of the company’s assets that could have a material effect on the financial statements.
Because of its inherent limitations, internal control over financial reporting may not prevent or detect misstatements. Also, projections of any evaluation of effectiveness to future periods are subject to the risk that controls may become inadequate because of changes in conditions, or that the degree of compliance with the policies or procedures may deteriorate.
/s/ PricewaterhouseCoopers LLP
Atlanta, Georgia
March 16, 2020
We have served as the Company’s auditor since 2003.
37
NN, Inc.
Consolidated Statements of Operations and Comprehensive Income (Loss)
For the Years Ended December 31, | ||||||||||||
(in thousands, except per share data) | 2019 | 2018 | 2017 | |||||||||
Net sales | $ | 847,451 | $ | 770,657 | $ | 619,793 | ||||||
Cost of sales (exclusive of depreciation and amortization shown separately below) | 641,639 | 589,181 | 460,414 | |||||||||
Selling, general and administrative expense | 103,223 | 93,583 | 74,112 | |||||||||
Acquisition related costs excluded from selling, general and administrative expense | — | 5,871 | 344 | |||||||||
Depreciation and amortization | 91,846 | 71,128 | 52,406 | |||||||||
Goodwill impairment | — | 182,542 | — | |||||||||
Restructuring and integration expense, net | (12 | ) | 2,127 | 386 | ||||||||
Other operating (income) expense, net | 866 | 6,089 | 351 | |||||||||
Income (loss) from operations | 9,889 | (179,864 | ) | 31,780 | ||||||||
Interest expense | 57,155 | 61,243 | 52,085 | |||||||||
Loss on extinguishment of debt and write-off of debt issuance costs | 3,293 | 19,562 | 42,087 | |||||||||
Derivative (gain) loss on change in interest rate swap fair value | — | — | (101 | ) | ||||||||
Other (income) expense, net | 1,140 | 1,341 | (2,084 | ) | ||||||||
Loss before benefit for income taxes and share of net income from joint venture | (51,699 | ) | (262,010 | ) | (60,207 | ) | ||||||
Benefit for income taxes | 3,277 | 13,413 | 79,545 | |||||||||
Share of net income (loss) from joint venture | 1,681 | (14,390 | ) | 5,211 | ||||||||
Income (loss) from continuing operations | (46,741 | ) | (262,987 | ) | 24,549 | |||||||
Income from discontinued operations, net of tax (Note 2) | — | — | 137,688 | |||||||||
Net income (loss) | $ | (46,741 | ) | $ | (262,987 | ) | $ | 162,237 | ||||
Other comprehensive loss: | ||||||||||||
Reclassification adjustment for discontinued operations | $ | — | $ | — | $ | (9,243 | ) | |||||
Foreign currency translation gain (loss) | (3,845 | ) | (13,609 | ) | 22,134 | |||||||
Interest rate swap: | ||||||||||||
Change in fair value of interest rate swap, net of tax | (10,479 | ) | — | — | ||||||||
Less: reclassification adjustment for (gains) losses included in net income, net of tax | 1,084 | — | — | |||||||||
Other comprehensive income (loss) | $ | (13,240 | ) | $ | (13,609 | ) | $ | 12,891 | ||||
Comprehensive income (loss) | $ | (59,981 | ) | $ | (276,596 | ) | $ | 175,128 | ||||
Basic net income (loss) per common share: | ||||||||||||
Income (loss) from continuing operations per common share | $ | (1.13 | ) | $ | (8.30 | ) | $ | 0.89 | ||||
Income from discontinued operations per common share | — | — | 5.02 | |||||||||
Net income (loss) per common share | $ | (1.13 | ) | $ | (8.30 | ) | $ | 5.91 | ||||
Weighted average common shares outstanding | 42,030 | 31,678 | 27,433 | |||||||||
Diluted net income (loss) per common share: | ||||||||||||
Income (loss) from continuing operations per common share | $ | (1.13 | ) | $ | (8.30 | ) | $ | 0.89 | ||||
Income from discontinued operations per common share | — | — | 4.96 | |||||||||
Net income (loss) per common share | $ | (1.13 | ) | $ | (8.30 | ) | $ | 5.85 | ||||
Weighted average common shares outstanding | 42,030 | 31,678 | 27,755 | |||||||||
See Notes to Consolidated Financial Statements.
38
NN, Inc.
Consolidated Balance Sheets
December 31, | ||||||||
(in thousands, except per share data) | 2019 | 2018 | ||||||
Assets | ||||||||
Current assets: | ||||||||
Cash and cash equivalents | $ | 31,703 | $ | 17,988 | ||||
Accounts receivable, net | 131,558 | 133,421 | ||||||
Inventories | 118,722 | 120,925 | ||||||
Income tax receivable | 5,973 | 2,277 | ||||||
Other current assets | 15,024 | 21,592 | ||||||
Total current assets | 302,980 | 296,203 | ||||||
Property, plant and equipment, net | 374,513 | 361,028 | ||||||
Operating lease right-of-use assets | 65,496 | — | ||||||
Goodwill | 439,095 | 439,452 | ||||||
Intangible assets, net | 329,260 | 376,248 | ||||||
Investment in joint venture | 21,755 | 20,364 | ||||||
Other non-current assets | 8,885 | 7,607 | ||||||
Total assets | $ | 1,541,984 | $ | 1,500,902 | ||||
Liabilities and Stockholders’ Equity | ||||||||
Current liabilities: | ||||||||
Accounts payable | $ | 57,340 | $ | 65,694 | ||||
Accrued salaries, wages and benefits | 30,428 | 24,636 | ||||||
Income tax payable | 1,028 | — | ||||||
Current maturities of long-term debt | 19,160 | 31,280 | ||||||
Current portion of operating lease liabilities | 6,652 | — | ||||||
Other current liabilities | 24,873 | 23,420 | ||||||
Total current liabilities | 139,481 | 145,030 | ||||||
Deferred tax liabilities | 85,799 | 91,838 | ||||||
Non-current income tax payable | 1,272 | 3,875 | ||||||
Long-term debt, net of current portion | 757,440 | 811,471 | ||||||
Operating lease liabilities, net of current portion | 66,980 | — | ||||||
Other non-current liabilities | 44,723 | 29,417 | ||||||
Total liabilities | 1,095,695 | 1,081,631 | ||||||
Commitments and contingencies (Note 16) | ||||||||
Series B convertible preferred stock - $0.01 par value per share, 100 shares authorized, 100 and 0 shares issued and outstanding in 2019 and 2018, respectively | 93,012 | — | ||||||
Stockholders’ equity: | ||||||||
Common stock - $0.01 par value per share, authorized 90,000 shares, 42,313 and 42,104 shares issued and outstanding in 2019 and 2018, respectively | 423 | 421 | ||||||
Additional paid-in capital | 501,615 | 508,655 | ||||||
Warrants | 1,076 | — | ||||||
Accumulated deficit | (105,283 | ) | (58,491 | ) | ||||
Accumulated other comprehensive loss | (44,554 | ) | (31,314 | ) | ||||
Total stockholders’ equity | 353,277 | 419,271 | ||||||
Total liabilities, preferred stock, and stockholders’ equity | $ | 1,541,984 | $ | 1,500,902 | ||||
See Notes to Consolidated Financial Statements.
39
NN, Inc.
Consolidated Statements of Changes in Stockholders’ Equity
Common Stock | Retained earnings (Accumulated deficit) | Accumulated other comprehensive income | |||||||||||||||||||||||||||||
(in thousands) | Number of shares | Par value | Additional paid-in capital | Warrants | Non- controlling interest | Total | |||||||||||||||||||||||||
Balance, December 31, 2016 | 27,249 | $ | 272 | $ | 284,508 | $ | — | $ | 55,175 | $ | (30,596 | ) | $ | 32 | $ | 309,391 | |||||||||||||||
Net income | — | — | — | — | 162,237 | — | — | 162,237 | |||||||||||||||||||||||
Dividends declared or accrued for common stock | — | — | — | — | (7,887 | ) | — | — | (7,887 | ) | |||||||||||||||||||||
Share-based compensation expense | 85 | 1 | 5,495 | — | — | — | — | 5,496 | |||||||||||||||||||||||
Shares issued for option exercises | 263 | 2 | 3,108 | — | — | — | — | 3,110 | |||||||||||||||||||||||
Sale of discontinued operations | — | — | — | — | — | (9,243 | ) | (32 | ) | (9,275 | ) | ||||||||||||||||||||
Restricted shares and performance shares forgiven for taxes and forfeited compensation expense | (25 | ) | — | (617 | ) | — | — | — | — | (617 | ) | ||||||||||||||||||||
Foreign currency translation gain | — | — | — | — | — | 22,134 | — | 22,134 | |||||||||||||||||||||||
Adoption of new accounting standard | — | — | — | — | 740 | — | — | 740 | |||||||||||||||||||||||
Balance, December 31, 2017 | 27,572 | $ | 275 | $ | 292,494 | $ | — | $ | 210,265 | $ | (17,705 | ) | $ | — | $ | 485,329 | |||||||||||||||
Net loss | — | — | — | — | (262,987 | ) | — | — | (262,987 | ) | |||||||||||||||||||||
Dividends declared or accrued for common stock | — | — | (2,968 | ) | — | (5,835 | ) | — | — | (8,803 | ) | ||||||||||||||||||||
Shares issued | 14,375 | 144 | 217,168 | — | — | — | 217,312 | ||||||||||||||||||||||||
Share-based compensation expense | 165 | 2 | 4,382 | — | — | — | — | 4,384 | |||||||||||||||||||||||
Shares issued for option exercises | 27 | — | 274 | — | — | — | — | 274 | |||||||||||||||||||||||
Restricted shares and performance shares forgiven for taxes and forfeited | (35 | ) | — | (805 | ) | — | — | — | — | (805 | ) | ||||||||||||||||||||
Change in estimate of performance share vesting | — | — | (1,890 | ) | — | 50 | — | (1,840 | ) | ||||||||||||||||||||||
Foreign currency translation loss | — | — | — | — | — | (13,609 | ) | — | (13,609 | ) | |||||||||||||||||||||
Adoption of new accounting standard | — | — | — | — | 16 | — | — | 16 | |||||||||||||||||||||||
Balance, December 31, 2018 | 42,104 | $ | 421 | $ | 508,655 | $ | — | $ | (58,491 | ) | $ | (31,314 | ) | $ | — | $ | 419,271 | ||||||||||||||
Net loss | — | — | — | — | (46,741 | ) | — | — | (46,741 | ) | |||||||||||||||||||||
Dividends declared or accrued for common stock | — | — | (8,933 | ) | — | — | — | — | (8,933 | ) | |||||||||||||||||||||
Dividends accrued for preferred stock | — | — | (642 | ) | — | — | — | — | (642 | ) | |||||||||||||||||||||
Share-based compensation expense | 248 | 2 | 3,931 | — | — | — | — | 3,933 | |||||||||||||||||||||||
Shares issued for option exercises | 5 | — | 21 | — | — | — | — | 21 | |||||||||||||||||||||||
Restricted shares forgiven for taxes and forfeited | (44 | ) | — | (365 | ) | — | — | — | — | (365 | ) | ||||||||||||||||||||
Change in estimate of share-based award vesting | — | — | (1,052 | ) | — | — | — | — | (1,052 | ) | |||||||||||||||||||||
Proceeds from issuance of warrants | — | — | — | 1,076 | — | — | — | 1,076 | |||||||||||||||||||||||
Change in fair value of interest rate swap, net of tax of $3,166 | — | — | — | — | — | (10,479 | ) | — | (10,479 | ) | |||||||||||||||||||||
Reclassification of interest rate swap settlement to income, net of tax of $327 | — | — | — | — | — | 1,084 | — | 1,084 | |||||||||||||||||||||||
Foreign currency translation loss | — | — | — | — | — | (3,845 | ) | — | (3,845 | ) | |||||||||||||||||||||
Adoption of new accounting standard (Note 1) | — | — | — | — | (51 | ) | — | — | (51 | ) | |||||||||||||||||||||
Balance, December 31, 2019 | 42,313 | $ | 423 | $ | 501,615 | $ | 1,076 | $ | (105,283 | ) | $ | (44,554 | ) | $ | — | $ | 353,277 | ||||||||||||||
See Notes to Consolidated Financial Statements.
40
NN, Inc.
Consolidated Statements of Cash Flows
Year Ended December 31, | ||||||||||||
(in thousands) | 2019 | 2018 | 2017 | |||||||||
Cash flows from operating activities | ||||||||||||
Net income (loss) | $ | (46,741 | ) | $ | (262,987 | ) | $ | 162,237 | ||||
Adjustments to reconcile net income (loss) to net cash provided by (used in) operating activities: | ||||||||||||
Depreciation and amortization of continuing operations | 91,846 | 71,128 | 52,406 | |||||||||
Depreciation and amortization of discontinued operations | — | — | 7,722 | |||||||||
Amortization of debt issuance costs | 4,789 | 4,845 | 4,296 | |||||||||
Goodwill impairment | — | 182,542 | — | |||||||||
Other impairments | 643 | 21,825 | — | |||||||||
Loss on extinguishment of debt and write-off of debt issuance costs | 3,293 | 19,562 | 42,087 | |||||||||
Total derivative mark-to-market loss (gain), net of cash settlements | — | — | (1,483 | ) | ||||||||
Share of net income from joint venture, net of cash dividends received | (1,681 | ) | 642 | (1,284 | ) | |||||||
Gain on disposal of discontinued operations, net of tax and cost to sell | — | — | (133,665 | ) | ||||||||
Compensation expense from issuance of share-based awards | 2,822 | 2,416 | 4,730 | |||||||||
Deferred income taxes | (3,142 | ) | (22,402 | ) | (23,195 | ) | ||||||
Other | 3,169 | 1,290 | 100 | |||||||||
Changes in operating assets and liabilities, excluding acquisitions: | ||||||||||||
Accounts receivable | 1,265 | (3,543 | ) | (11,374 | ) | |||||||
Inventories | 1,426 | (16,208 | ) | (8,944 | ) | |||||||
Accounts payable | (7,900 | ) | 2,693 | 4,118 | ||||||||
Income taxes receivable and payable, net | (5,292 | ) | 39,615 | (124,389 | ) | |||||||
Other | 4,711 | (479 | ) | (1,595 | ) | |||||||
Net cash provided by (used in) operating activities | 49,208 | 40,939 | (28,233 | ) | ||||||||
Cash flows from investing activities | ||||||||||||
Acquisition of property, plant and equipment, excluding assets acquired in business combinations | (54,003 | ) | (64,036 | ) | (43,722 | ) | ||||||
Proceeds from liquidation of short-term investment | 8,000 | — | (8,000 | ) | ||||||||
Proceeds from sale of business, net of cash sold | — | 838 | 371,436 | |||||||||
Cash paid to acquire businesses, net of cash received | — | (399,009 | ) | (38,434 | ) | |||||||
Proceeds from sale of property, plant, and equipment | 7,287 | 1,434 | 646 | |||||||||
Other | (711 | ) | (517 | ) | 545 | |||||||
Net cash provided by (used in) investing activities | (39,427 | ) | (461,290 | ) | 282,471 | |||||||
Cash flows from financing activities | ||||||||||||
Cash paid for debt issuance or prepayment costs | (11,336 | ) | (20,726 | ) | (40,235 | ) | ||||||
Dividends paid | (8,879 | ) | (8,826 | ) | (7,695 | ) | ||||||
Proceeds from issuance of common stock | — | 217,312 | — | |||||||||
Proceeds from issuance of preferred stock | 95,741 | — | — | |||||||||
Proceeds from long-term debt | 54,209 | 311,841 | 322,000 | |||||||||
Repayment of long-term debt | (108,157 | ) | (290,687 | ) | (314,313 | ) | ||||||
Proceeds from (repayments of) short-term debt, net | (12,564 | ) | 10,305 | (4,211 | ) | |||||||
Other | (3,715 | ) | (4,126 | ) | (1,382 | ) | ||||||
Net cash provided by (used in) financing activities | 5,299 | 215,093 | (45,836 | ) | ||||||||
Effect of exchange rate changes on cash flows | (1,365 | ) | (1,200 | ) | 1,639 | |||||||
Net change in cash and cash equivalents | 13,715 | (206,458 | ) | 210,041 | ||||||||
Cash and cash equivalents at beginning of period (1) | 17,988 | 224,446 | 14,405 | |||||||||
Cash and cash equivalents at end of period | $ | 31,703 | $ | 17,988 | $ | 224,446 | ||||||
Supplemental schedule of non-cash operating, investing and financing activities: | ||||||||||||
Dividends accrued (reversed) for performance share units, net | $ | (11 | ) | $ | (83 | ) | $ | 192 | ||||
Non-cash additions to property, plant and equipment | 23,281 | 26,605 | 1,436 | |||||||||
Restructuring charges in other current and non-current liabilities | (12 | ) | 2,071 | 222 | ||||||||
Supplemental disclosures: | ||||||||||||
Cash paid for interest | $ | 50,514 | $ | 56,223 | $ | 52,083 | ||||||
Cash paid (received) for income taxes | 6,428 | (32,582 | ) | 72,294 | ||||||||
(1) | Cash and cash equivalents as of December 31, 2016, includes $8.1 million of cash and cash equivalents that was included in current assets of discontinued operations. |
See Notes to Consolidated Financial Statements.
41
NN, Inc.
Notes to Consolidated Financial Statements
Note 1. Significant Accounting Policies
Nature of Business
NN, Inc. is a global diversified industrial company that combines advanced engineering and production capabilities with in-depth materials science expertise to design and manufacture high-precision components and assemblies for the medical, aerospace and defense, electrical, automotive, and general industrial markets. As used in this Annual Report on Form 10-K (this “Annual Report”), the terms “NN,” the “Company,” “we,” “our,” or “us” refer to NN, Inc., and its subsidiaries. We have 50 facilities in North America, Europe, South America, and China.
Basis of Presentation
The accompanying consolidated financial statements are prepared in accordance with accounting principles generally accepted in the United States (“U.S. GAAP”). Certain prior period amounts have been reclassified to conform to the current year’s presentation. Except for per share data or as otherwise indicated, all U.S. dollar amounts presented in the tables in these Notes to Consolidated Financial Statements are in thousands.
In November 2019, we initiated a strategic review to evaluate a broad range of operational, financial, and strategic options to reduce leverage and enhance shareholder value, and we retained external advisors to assist in this effort. The strategic options we are evaluating include further cost savings and cash generation initiatives, more efficient capital deployment, changes to our debt and equity structure to improve financial flexibility and liquidity, and the sale of part or all of NN, among others.
As discussed in Note 13 and Note 17, on December 11, 2019, we issued preferred stock for net proceeds of $95.7 million and used a portion of the proceeds to repay amounts due at that time on our Senior Secured Revolver. In December 2019 we amended our Credit Agreement which, in turn, extended the due date of our Senior Secured Revolver to July 20, 2022, and reduced the total available borrowing amount to $75.0 million and extended our Incremental Term Loan to October 19, 2022, matching the date of our longer-dated Senior Secured Term Loan. Additionally, as part of this amendment our debt covenants were amended to establish more restrictive leverage ratios that also become more restrictive over time. Our Consolidated Net Leverage Ratio covenant (the “financial leverage ratio covenant”) is required to be complied with on a quarterly basis at the end of each of our quarterly reporting periods. Our financial leverage ratio covenant is based upon our consolidated net indebtedness at each quarter end and our trailing twelve-month Adjusted EBITDA as defined in our Credit Agreement. In order to maintain compliance with the financial leverage ratio covenant, our operational and financial performance must continue to improve in line with our expectations.
In accordance with Accounting Standards Update (“ASU”) 2014-15, Disclosure of Uncertainties about an Entity’s Ability to Continue as a Going Concern (Subtopic 205-40), the Company has evaluated whether there are conditions and events, considered in the aggregate, that raise substantial doubt about the Company’s ability to continue as a going concern within one year after the date that the Consolidated Financial Statements are issued. The Company relies on cash flow generated from operations and available borrowings under its Senior Secured Revolver to fund our working capital and other operating and investing needs. Our ability to borrow under our Senior Secured Revolver is based on our continued compliance with our financial leverage ratio covenant, as defined, which becomes more restrictive in the second quarter of 2020 and the first quarter of 2021. If our operational and financial performance does not improve in line with our expectations, and as a result we are unable to comply with our financial ratio covenant, then the revolving credit lenders, the Senior Secured Term Loan lenders, and the Incremental Term Loan lenders could take action to cause amounts due under our credit facilities to become due and payable unless we are able to amend such covenants or otherwise refinance our debt. Our ability to amend our covenants or refinance our debt is dependent upon several factors, and therefore there can be no assurance that we would be successful in these efforts. If we would be unable to access future borrowings or be required to pay amounts due under our credit facilities prior to their normal maturity dates, this would have a material impact to the Company’s financial position. We have developed a plan to mitigate the risk of noncompliance with our financial covenants, if necessary, which would include the implementation of a series of specific and identified cost reductions in both our corporate and business groups, including reducing our direct and indirect labor costs and benefits. In addition, our plans also include, as deemed necessary, repatriating cash from certain overseas businesses, managing our working capital more efficiently through usage of our customers’ available supply chain finance programs and other means, and the sale or sublease of certain underutilized properties.
Principles of Consolidation
Our consolidated financial statements include the accounts of NN, Inc., and its wholly owned subsidiaries. We own a 49% interest in a joint venture which we account for using the equity method (see Note 11). All intercompany transactions and balances have been eliminated in consolidation.
42
Use of Estimates in the Preparation of Financial Statements
The preparation of financial statements in accordance with U.S. GAAP requires management to use estimates and assumptions that affect the reported amounts of certain assets and liabilities, disclosure of contingent assets and liabilities, and the reported amounts of revenues and expenses. Actual results may differ from those estimates.
Accounting Standards Recently Adopted
Leases. On January 1, 2019, we adopted ASC 842, Leases, which superseded ASC 840, Leases. We adopted ASC 842 utilizing the modified retrospective transition approach; therefore, historical financial information and disclosures do not reflect the new standard and will continue to be presented under the previous lease accounting guidance. Under the modified retrospective transition method, the cumulative effect of the initial adoption adjustment of less than $0.1 million was recognized to the opening balance of accumulated deficit as of January 1, 2019. As part of the adoption, we elected the package of practical expedients, the short-term lease exemption, and the practical expedient to not separate lease and non-lease components. We recorded lease-related assets and liabilities to our balance sheet for leases with terms greater than twelve months that were classified as operating leases and not previously recorded on our balance sheet. See Note 14 for the required disclosures related to ASC 842.
Derivatives and Hedging. In August 2017, the Financial Accounting Standards Board (“FASB”) issued ASU 2017-12, Derivatives and Hedging (Topic 815): Targeted Improvements to Accounting for Hedging Activities, (“ASU 2017-12”). ASU 2017-12 provides new rules that expand the hedging strategies that qualify for hedge accounting. The new rules also allow additional time to complete hedge effectiveness testing and allow qualitative assessments subsequent to initial quantitative tests if there is a supportable expectation that the hedge will remain highly effective. We adopted the guidance on January 1, 2019. We have applied the new rules to 2019 hedging activities as disclosed in Note 22 to these condensed consolidated financial statements. The new guidance has no effect on our historical financial statements.
Effects of Tax Reform in Other Comprehensive Income. In February 2018, the FASB issued guidance related to the impacts of the U.S. Tax Cuts and Jobs Act of 2017 (“Tax Act”). Under existing U.S. GAAP, the effects of changes in tax rates and laws on deferred tax balances are recorded as a component of income tax expense in the period in which the law was enacted. When deferred tax balances related to items originally recorded in accumulated other comprehensive income (“AOCI”) are adjusted, certain tax effects become stranded in AOCI. The FASB issued ASU 2018-2, Income Statement – Reporting Comprehensive Income (Topic 220): Reclassification of Certain Tax Effects from Accumulated Other Comprehensive Income, that permits reclassification of certain income tax effects of the Tax Act from AOCI to retained earnings. The guidance also requires certain disclosures about stranded tax effects. The new guidance was effective for us on January 1, 2019. We adopted the new guidance at the beginning of the period of adoption. The new guidance had no effect on our financial statements.
Accounting Standards Not Yet Adopted
Fair Value Disclosures. In August 2018, the FASB issued ASU 2018-13, Fair Value Measurement (Topic 820): Disclosure Framework - Changes to the Disclosure Requirements for Fair Value Measurement (“ASU 2018-13”), that modifies fair value disclosure requirements. The new guidance could impact us by streamlining disclosures of Level 3 fair value measurements. The modified disclosures are effective for us beginning in the first quarter of 2020, with early adoption allowed. ASU 2018-13 changes disclosures only and does not impact our financial condition, results of operations, or cash flows. We are in the process of evaluating the effects of this guidance on our fair value disclosures.
Internal-Use Software. In August 2018, the FASB issued ASU 2018-15, Intangibles - Goodwill and Other - Internal-Use Software: Customer’s Accounting for Implementation Costs Incurred in a Cloud Computing Arrangement That Is a Service Contract (a consensus of the FASB Emerging Issues Task Force) (“ASU 2018-15”), that provides guidance on a customer’s accounting for implementation, set-up, and other upfront costs incurred in a cloud computing arrangement that is hosted by the vendor. Under the new guidance, customers will apply the same criteria for capitalizing implementation costs as they would for an arrangement that has a software license. ASU 2018-15 is effective for us on January 1, 2020, using either a prospective or retrospective approach and with early adoption permitted. We are in the process of evaluating the effects of this guidance on our financial statements, but we do not expect the adoption to have a material impact.
Financial Instruments - Credit Losses. In June 2016, the FASB issued ASU 2016-13, Financial Instruments - Credit Losses (Topic 326): Measurement of Credit Losses on Financial Instruments (“ASU 2016-13”), which modifies the measurement of expected credit losses on certain financial instruments and the timing of when such losses are recorded. In November 2019, the SEC issued SAB No. 119, codified in ASC Topic 326, Financial Instruments-Credit Losses, which provides guidance on accounting of credit losses. ASU 2016-13 is effective for us on January 1, 2020, using a modified retrospective approach, with early adoption permitted. We are in the process of evaluating the effects of this guidance on our financial statements, but we do not expect the adoption to have a material impact.
Income Taxes. In December 2019, the FASB issued ASU 2019-12, Income Taxes (Topic 740) - Simplifying the Accounting for Income Taxes, (“ASU 2019-12”) as part of its initiative to reduce complexity in accounting standards. ASU 2019-12 removes
43
certain exceptions and provides simplification to specific tax items to improve consistent application. This standard is effective for fiscal years beginning after December 15, 2020, and interim periods within those fiscal years. Early adoption is permitted, including adoption in any interim period for which financial statements have not yet been issued. Adoption methods vary based on the specific items impacted. We are currently evaluating the impact on our financial statements and related disclosures.
Cash and Cash Equivalents
Cash and cash equivalents include cash and highly liquid investments with original maturities of three months or less.
Fair Value Measurements
Fair value principles prioritize valuation inputs across three broad levels. Level 1 inputs are quoted prices (unadjusted) in active markets for identical assets or liabilities. Level 2 inputs are quoted prices for similar assets and liabilities in active markets or inputs that are observable for the asset or liability, either directly or indirectly through market corroboration, for substantially the full term of the financial instrument. Level 3 inputs are unobservable inputs based on the assumptions used to measure assets and liabilities at fair value. An asset or liability’s classification within the various levels is determined based on the lowest level input that is significant to the fair value measurement.
Accounts Receivable and Allowance for Doubtful Accounts
Trade accounts receivable are recorded at their net realizable value. We maintain allowances for doubtful accounts for estimated losses resulting from the inability of our customers to make required payments. The allowances are based on the number of days an individual receivable is past the invoice due date and on regular credit evaluations of our customers. In evaluating the credit worthiness of our customers, we consider numerous inputs including but not limited to the customers’ financial position, past payment history, relevant industry trends, cash flows, management capability, historical loss experience, and economic conditions and prospects. Allowances are established when customer accounts are at risk of being uncollectible. Accounts receivable are written off at the time a customer receivable is deemed uncollectible.
Inventories
Inventories are stated at the lower of cost or net realizable value. Cost is determined using standard costs, which approximates the average cost method. Our policy is to expense abnormal amounts of idle facility expense, freight, handling cost, and waste included in cost of products sold. In addition, we allocate fixed production overheads based on the normal production capacity of our facilities. Inventory valuations were developed using normalized production capacities for each of our manufacturing locations. The costs from excess capacity or under-utilization of fixed production overheads were expensed in the period incurred and are not included as a component of inventory.
Inventories also include tools, molds, and dies in progress that we are producing and will ultimately sell to our customers. These inventories are also carried at the lower of cost or net realizable value.
Property, Plant and Equipment
Property, plant and equipment are stated at cost less accumulated depreciation. Assets to be disposed of are stated at the lower of depreciated cost or fair market value less estimated selling costs. Expenditures for maintenance and repairs are charged to expense as incurred. Major renewals and betterments are capitalized. When a property item is retired, its cost and related accumulated depreciation are removed from the property accounts and any gain or loss is recorded in the Consolidated Statements of Operations and Comprehensive Income (Loss). We review the carrying values of long-lived assets for impairment whenever events or changes in circumstances indicate the carrying amount of an asset may not be recoverable. Property, plant and equipment also includes tools, molds, and dies used in manufacturing.
Depreciation is calculated based on historical cost using the straight-line method over the estimated useful lives of the depreciable assets. Estimated useful lives for buildings generally range from 15 to 40 years. Estimated useful lives for machinery and equipment generally range from 3 to 12 years.
Goodwill and Other Indefinite Lived Intangible Assets
Goodwill is tested for impairment on an annual basis in the fourth quarter and between annual tests if a triggering event occurs. The impairment analysis is performed at the reporting unit level. An impairment charge is calculated based on a reporting unit’s carrying amount in excess of its fair value (i.e., step 1 of the two-step impairment test). If the carrying value of the reporting unit including goodwill is less than fair value of the reporting unit, the goodwill is not considered impaired.
Impairment of Long-Lived Assets
Long-lived tangible and intangible assets subject to depreciation or amortization are tested for recoverability when changes in circumstances indicate the carrying value of these assets may not be recoverable. A test for recoverability is also performed when management has committed to a plan to dispose of a reporting unit or asset group. Assets to be held and used are tested for recoverability when indications of impairment are evident. Recoverability of a long-lived tangible or intangible asset is
44
evaluated by comparing its carrying value to the future estimated undiscounted cash flows expected to be generated by the asset or asset group. If the asset is not recoverable, then the asset is considered impaired and adjusted to fair value which is then depreciated or amortized over its remaining useful life. Assets to be disposed of are recorded at the lesser of carrying value or fair value less costs of disposal.
Equity Method Investments
The Company’s equity method investment is subject to a review for impairment if, and when, circumstances indicate that a decline in value below its carrying amount may have occurred. Examples of such circumstances include, but are not limited to, a significant deterioration in the earnings performance or business prospects of the investee; a significant adverse change in the regulatory, economic or technological environment of the investee; a significant adverse change in the general market condition of either the geographic area or the industry in which the investee operates; and recurring negative cash flows from operations. If management considers the decline to be other than temporary, the Company would write down the investment to its estimated fair market value.
Income Taxes
Income taxes are accounted for under the asset and liability method. Deferred tax assets and liabilities are recognized for the future tax consequences attributable to differences between the financial statement carrying amounts of existing assets and liabilities and their respective tax bases and operating loss and tax credit carryforwards. Deferred tax assets and liabilities are measured using enacted tax rates expected to apply to taxable income in the years in which those temporary differences are expected to be recovered or settled. The effect on deferred tax assets and liabilities of a change in tax rates is recognized in income in the period that includes the enactment date. Valuation allowances are recorded to reduce deferred tax assets when it is more likely than not that a tax benefit will not be realized. Provision has been made for income taxes on unremitted earnings of certain foreign subsidiaries as these earnings are not deemed to be permanently reinvested. We recognize income tax positions that meet the more likely than not threshold and accrue interest and potential penalties related to unrecognized income tax positions which are recorded as a component of the provision (benefit) for income taxes. We treat global intangible low-taxed income (“GILTI”) as a periodic charge in the year in which it arises and therefore do not record deferred taxes for basis differences associated with GILTI.
Revenue Recognition
We recognize revenues when control of the good or service is transferred to the customer either at a point in time or, in limited circumstances, as our services are rendered over time. Revenue is measured as the amount of consideration we expect to receive in exchange for transferring goods or services.
Share Based Compensation
The cost of stock options, restricted stock, and performance share units are recognized as compensation expense over the vesting periods based on the grant date fair value, net of expected forfeitures. We determine grant date fair value using the Black Scholes financial pricing model for stock options and a Monte Carlo simulation for performance share units that include a market condition for vesting because these awards are not traded in open markets. We determine grant date fair value using the closing price of our common stock on the date of grant for restricted stock and performance share units that include performance conditions for vesting. We recognize excess tax benefits in income tax expense prospectively beginning in 2017. Excess tax benefits are presented in cash flows from operating activities in the statement of cash flows prospectively beginning in 2017. Tax payments in respect of shares withheld for taxes are classified in cash flows from financing activities in the statement of cash flows retrospectively for all periods presented.
Common Stock and Preferred Stock Dividends
Dividends are recorded as a reduction to retained earnings. When we have an accumulated deficit, dividends are recorded as a reduction of additional paid-in capital.
Foreign Currency Translation
Assets and liabilities of our foreign subsidiaries are translated at current exchange rates. Revenue, costs, and expenses are translated at average rates prevailing during each reporting period. Translation adjustments arising from the translation of foreign subsidiary financial statements are reported as a component of other comprehensive income and accumulated other comprehensive income within stockholders’ equity. Transactions denominated in foreign currencies, including intercompany transactions, are initially recorded at the current exchange rate at the date of the transaction. The balances are adjusted to the current exchange rate as of each balance sheet date and as of the date when the transaction is consummated. Transaction gains or losses, excluding intercompany loan transactions, are expensed as incurred in either cost of sales or selling, general and administrative expense in the Consolidated Statements of Operations and Comprehensive Income (Loss) and were immaterial to the years ended December 31, 2019, 2018 and 2017. Transaction gains or losses on intercompany loan transactions are
45
recognized as incurred in the “Other (income) expense, net” line in the Consolidated Statements of Operations and Comprehensive Income (Loss).
Net Income (Loss) Per Common Share
We are required to allocate earnings or losses for a reporting period to common stockholders and participating securities using the two-class method to compute earnings per share. The two-class method is an earnings allocation formula that treats participating securities as having rights to earnings that otherwise would have been available to common stockholders. Participating securities may participate in undistributed earnings with common stock whether or not that participation is conditioned upon the occurrence of a specified event. Under the two-class method, our net income (loss) is reduced (or increased) by the amount that has been or will be distributed to our participating security holders. Preferred shares are participating securities that participate in earnings but do not participate in losses.
Basic net income (loss) per common share is computed by dividing net income (loss) allocable to common shares by the weighted average number of common shares outstanding. Diluted net income (loss) per common share includes the effect of warrants, convertible preferred stock, stock options and the respective tax benefits unless inclusion would not be dilutive.
Business Combinations
We allocate the total purchase price of tangible and intangible assets acquired and liabilities assumed based on their estimated fair values as of the business combination date, with the excess purchase price recorded as goodwill. The purchase price allocation process requires us to use significant estimates and assumptions, including fair value estimates, as of the business combination date. Although we believe the assumptions and estimates we have made are reasonable and appropriate, they are based in part on historical experience and information obtained from management of the acquired company. Our assumptions and estimates are also partially based on valuation models that incorporate projections of expected future cash flows and operating plans and are inherently uncertain. Valuations are performed by management or third-party valuation specialists under management’s supervision. In determining the fair value of assets acquired and liabilities assumed in business combinations, as appropriate, we may use one of the following recognized valuation methods: the income approach (including discounted cash flows, relief from royalty and excess earnings model), the market approach, or the replacement cost approach.
Examples of significant estimates used to value certain intangible assets acquired include but are not limited to:
• | sales volume, pricing, and future cash flows of the business overall; |
• | future expected cash flows from customer relationships, and other identifiable intangible assets, including future price levels, rates of increase in revenue, and appropriate attrition rate; |
• | the acquired company’s brand and competitive position, royalty rate quantum, as well as assumptions about the period of time the acquired brand will continue to benefit the combined company’s product portfolio; and |
• | cost of capital, risk-adjusted discount rates, and income tax rates. |
Different assumptions regarding projected performance and other factors associated with the acquired assets may affect the amount recorded under each type of asset and liability. The valuations of property, plant and equipment, intangible assets, goodwill and deferred income tax liabilities depend heavily on assumptions. Subsequent assessment could result in future impairment charges. We refine these estimates over a measurement period not to exceed one year to reflect new information obtained surrounding facts and circumstances existing at the acquisition date.
Note 2. Prior Periods' Financial Statement Revisions
As a result of misstatements identified by the Company during 2019, we are revising our previously issued financial statements as of and for the years ended December 31, 2018 and 2017, as well as the interim periods in 2018 and the first three quarters of 2019.
During the fourth quarter of 2019, we identified intentional misstatements in the accounting for inventory at one of our smaller foreign subsidiaries. This inappropriate accounting resulted in the understatement of previously reported cost of sales by $0.7 million and $1.3 million in 2018 and 2017, respectively, and the overstatement of previously reported inventories by $1.7 million as of December 31, 2018.
In addition, and as previously reported in our Form 10-Q for the three and nine-months ended September 30, 2019, we identified certain prior period tax misstatements, primarily related to tax accounting associated with the 2018 impairment of our joint venture, as well as other immaterial tax accounting misstatements. These tax misstatements resulted in an understatement of previously reported benefit for income taxes of $2.5 million and $0.5 million in 2018 and 2017, respectively.
We assessed the materiality of these inventory and tax misstatements on prior periods’ financial statements in accordance with Securities and Exchange Commission (the” SEC”) Staff Accounting Bulletin (“SAB”) Topic 1.M, Materiality, codified in
46
Accounting Standards Codification (“ASC”) Topic 250, Accounting Changes and Error Corrections, (“ASC 250”) and concluded that the misstatements were not material to the prior annual or interim periods. However, the Company has determined it to be appropriate to revise its accompanying 2018 and 2017 consolidated financial statements to correct for these misstatements. In connection with such revision, the Company is also correcting for other immaterial misstatements, including the incorrect classification of certain dividend payments in the fourth quarter of 2018 within the Consolidated Statements of Changes in Stockholders’ Equity.
The accompanying notes to the consolidated financial statements reflect the impact of this revision. We have also reflected the impact of the revision in the applicable unaudited quarterly financial results presented in Note 23.
The following tables present the effect of the correction of the misstatements and the resulting revision on the Consolidated Statements of Operations and Comprehensive Income (Loss).
Year Ended December 31, 2017 | ||||||||||||
As Originally Reported | Adjustment | As Revised | ||||||||||
Cost of sales (exclusive of depreciation and amortization) | $ | 459,080 | $ | 1,334 | $ | 460,414 | ||||||
Income (loss) from operations | 33,114 | (1,334 | ) | 31,780 | ||||||||
Loss before (provision) benefit for income taxes and share of net income from joint venture | (58,873 | ) | (1,334 | ) | (60,207 | ) | ||||||
Income tax benefit (expense) | 79,026 | 519 | 79,545 | |||||||||
Income (loss) from continuing operations | 25,364 | (815 | ) | 24,549 | ||||||||
Net income (loss) | 163,052 | (815 | ) | 162,237 | ||||||||
Foreign currency translation gain (loss) | 22,094 | 40 | 22,134 | |||||||||
Comprehensive income (loss) | 175,903 | (775 | ) | 175,128 | ||||||||
Basic net income (loss) per share | $ | 5.94 | $ | (0.03 | ) | $ | 5.91 | |||||
Diluted net income (loss) per share | $ | 5.87 | $ | (0.02 | ) | $ | 5.85 | |||||
Year Ended December 31, 2018 | ||||||||||||
As Originally Reported | Adjustment | As Revised | ||||||||||
Cost of sales (exclusive of depreciation and amortization) | $ | 588,205 | $ | 976 | $ | 589,181 | ||||||
Income (loss) from operations | (178,888 | ) | (976 | ) | (179,864 | ) | ||||||
Loss before (provision) benefit for income taxes and share of net income from joint venture | (261,034 | ) | (976 | ) | (262,010 | ) | ||||||
Income tax benefit (expense) | 10,957 | 2,456 | 13,413 | |||||||||
Income (loss) from continuing operations | (264,467 | ) | 1,480 | (262,987 | ) | |||||||
Net income (loss) | (264,467 | ) | 1,480 | (262,987 | ) | |||||||
Foreign currency translation gain (loss) | (13,880 | ) | 271 | (13,609 | ) | |||||||
Comprehensive income (loss) | (278,347 | ) | 1,751 | (276,596 | ) | |||||||
Basic net income (loss) per share | $ | (8.35 | ) | $ | 0.05 | $ | (8.30 | ) | ||||
Diluted net income (loss) per share | $ | (8.35 | ) | $ | 0.05 | $ | (8.30 | ) | ||||
47
The following table presents the effect of the correction of the misstatements on the Consolidated Balance Sheet as of December 31, 2018.
As of December 31, 2018 | ||||||||||||
As Originally Reported | Adjustment | As Revised | ||||||||||
Inventories | $ | 122,615 | $ | (1,690 | ) | $ | 120,925 | |||||
Income tax receivable | 946 | 1,331 | 2,277 | |||||||||
Other current assets | 21,901 | (309 | ) | 21,592 | ||||||||
Total current assets | 296,871 | (668 | ) | 296,203 | ||||||||
Total assets | 1,501,570 | (668 | ) | 1,500,902 | ||||||||
Deferred tax liabilities | 93,482 | (1,644 | ) | 91,838 | ||||||||
Total liabilities | 1,083,275 | (1,644 | ) | 1,081,631 | ||||||||
Additional paid-in capital | 511,545 | (2,890 | ) | 508,655 | ||||||||
Accumulated deficit | (62,046 | ) | 3,555 | (58,491 | ) | |||||||
Accumulated other comprehensive income (loss) | (31,625 | ) | 311 | (31,314 | ) | |||||||
Total stockholders' equity | 418,295 | 976 | 419,271 | |||||||||
Total liabilities and stockholders' equity | 1,501,570 | (668 | ) | 1,500,902 | ||||||||
The following table presents the effect of the correction of the misstatements on the Consolidated Statements of Stockholders’ Equity.
As Originally Reported | Adjustment | As Revised | ||||||||||
As of and for the year ended December 31, 2017 | ||||||||||||
Net income (loss) | $ | 163,052 | $ | (815 | ) | $ | 162,237 | |||||
Retained earnings | 211,080 | (815 | ) | 210,265 | ||||||||
Foreign currency translation gain (loss) | 22,094 | 40 | 22,134 | |||||||||
Accumulated other comprehensive income (loss) | (17,745 | ) | 40 | (17,705 | ) | |||||||
Total stockholders' equity | 486,104 | (775 | ) | 485,329 | ||||||||
As of and for the year ended December 31, 2018 | ||||||||||||
Additional paid-in capital | $ | 511,545 | $ | (2,890 | ) | $ | 508,655 | |||||
Net income (loss) | $ | (264,467 | ) | $ | 1,480 | $ | (262,987 | ) | ||||
Accumulated deficit | (62,046 | ) | 3,555 | (58,491 | ) | |||||||
Foreign currency translation gain (loss) | (13,880 | ) | 271 | (13,609 | ) | |||||||
Accumulated other comprehensive income (loss) | (31,625 | ) | 311 | (31,314 | ) | |||||||
Total stockholders' equity | 418,295 | 976 | 419,271 | |||||||||
The following table presents the effect of the correction of the misstatements on the Consolidated Statements of Cash Flows.
Year Ended December 31, 2017 | ||||||||||||
As Originally Reported | Adjustment | As Revised | ||||||||||
Net income (loss) | $ | 163,052 | $ | (815 | ) | $ | 162,237 | |||||
Changes in operating assets and liabilities, net of acquisitions: | ||||||||||||
Inventories | (10,278 | ) | 1,334 | (8,944 | ) | |||||||
Other | (1,076 | ) | (519 | ) | (1,595 | ) | ||||||
48
Year Ended December 31, 2018 | ||||||||||||
As Originally Reported | Adjustment | As Revised | ||||||||||
Net income (loss) | $ | (264,467 | ) | $ | 1,480 | $ | (262,987 | ) | ||||
Deferred income taxes | (20,758 | ) | (1,644 | ) | (22,402 | ) | ||||||
Changes in operating assets and liabilities, net of acquisitions: | ||||||||||||
Inventories | (16,872 | ) | 664 | (16,208 | ) | |||||||
Income taxes receivable and payable, net | 40,946 | (1,331 | ) | 39,615 | ||||||||
Other | (1,310 | ) | 831 | (479 | ) | |||||||
Note 3. Discontinued Operations
In August 2017, we sold our global precision bearing components business (the “PBC Business”) and received cash proceeds at closing of $387.6 million and recorded a $0.8 million receivable, which was received in 2018. The PBC Business included all our facilities that were engaged in the production of precision steel balls, steel rollers, and metal retainers and automotive specialty products used primarily in the bearing industry.
We recorded an after-tax gain on sale of $127.7 million, which is included in the “Income from discontinued operations, net of tax” line on the Consolidated Statements of Operations and Comprehensive Income (Loss) for the year ended December 31, 2017. The gain includes the effects of reclassifying $9.3 million in cumulative foreign currency translation gain from accumulated comprehensive income and eliminating the non-controlling interest attributable to the PBC Business as of August 17, 2017.
The operating results of the PBC Business are classified as discontinued operations and presented, net of tax, as one line item on the Consolidated Statements of Operations and Comprehensive Income (Loss). The Consolidated Statements of Cash Flows for the year ended December 31, 2017, include cash flows of the PBC Business in each line item unless otherwise stated. We had no discontinued operations in the years ended December 31, 2019 and 2018.
The following table presents the results of operations of the discontinued operations.
Year Ended December 31, 2017 (1) | ||||
Net sales | $ | 168,287 | ||
Cost of products sold (exclusive of depreciation and amortization shown separately below) | 130,555 | |||
Selling, general and administrative expense | 11,818 | |||
Depreciation and amortization | 7,722 | |||
Restructuring and integration expense | 429 | |||
Income from operations | 17,763 | |||
Interest expense | (181 | ) | ||
Other income (expense), net | (84 | ) | ||
Income from discontinued operations before gain on disposal and provision for income taxes | 17,498 | |||
Provision for income taxes on discontinued operations | (7,461 | ) | ||
Income from discontinued operations before gain on disposal | 10,037 | |||
Gain on disposal of discontinued operations | 213,503 | |||
Provision for income taxes on gain on disposal | (85,852 | ) | ||
Income from discontinued operations, net of tax | $ | 137,688 | ||
_________________________________
(1) | Includes the results of operations of the PBC Business from January 1, 2017 to the sale completion date of August 17, 2017. |
The following table presents the significant noncash items and cash paid for capital expenditures of discontinued operations for each period presented.
Year Ended December 31, 2017 | ||||
Depreciation and amortization | $ | 7,722 | ||
Acquisition of property, plant and equipment | $ | 7,316 | ||
49
Note 4. Acquisitions
Paragon Medical, Inc.
On May 7, 2018, we acquired 100% of the stock of PMG Intermediate Holding Corporation, the parent company of Paragon Medical, Inc. (“Paragon Medical”). For accounting purposes, Paragon Medical meets the definition of a business and has been accounted for as a business combination. Paragon Medical is a medical device manufacturer which focuses on the orthopaedic, case and tray, implant, and instrument markets. We finalized the purchase price allocation and recorded measurement period adjustments to the initial allocation as disclosed in our 2018 Annual Report. Operating results of Paragon Medical are included in the Company’s consolidated financial statements since the date of acquisition and are reported as part of our Life Sciences group.
The unaudited pro forma financial results shown in the table below for the years ended December 31, 2018 and 2017, combine the consolidated results of NN and Paragon Medical giving effect to the Paragon Medical acquisition as if it had been completed on January 1, 2017. The unaudited pro forma financial results do not give effect to any of our other acquisitions that occurred after January 1, 2017, and do not include any anticipated synergies or other assumed benefits of the Paragon Medical acquisition. This unaudited pro forma financial information is presented for informational purposes only and is not indicative of future operations or results had the Paragon Medical acquisition been completed as of January 1, 2017.
The unaudited pro forma financial results include certain adjustments for debt service costs and additional depreciation and amortization expense based upon the fair value step-up and estimated useful lives of Paragon Medical depreciable fixed assets and definite-life amortizable assets acquired. The provision for income taxes has also been adjusted for all periods, based upon the foregoing adjustments to historical results.
Year Ended December 31, | |||||||
2018 | 2017 | ||||||
Pro forma net sales | $ | 825,891 | $ | 760,772 | |||
Pro forma income (loss) from continuing operations | $ | (250,788 | ) | $ | 2,412 | ||
Pro forma net income (loss) | $ | (250,788 | ) | $ | 140,100 | ||
Basic income (loss) from continuing operations per share | $ | (7.92 | ) | $ | 0.09 | ||
Diluted income (loss) from continuing operations per share | $ | (7.92 | ) | $ | 0.09 | ||
Unaudited pro forma results for the year ended December 31, 2017, include $15.0 million of inventory fair value adjustments, financing, integration, and transaction costs, net of tax, directly attributable to the acquisition which will not have an ongoing impact.
Other Acquisitions
We made other acquisitions during the year ended December 31, 2018. Transaction costs were expensed as incurred and are included in the “Acquisition related costs excluded from selling, general and administrative expense” line item in the Consolidated Statements of Operations and Comprehensive Income (Loss).
Bridgemedica, LLC. On February 22, 2018, we completed the acquisition of 100% of the assets of Bridgemedica, LLC (“Bridgemedica”). For accounting purposes, Bridgemedica meets the definition of a business and has been accounted for as a business combination. Bridgemedica is a medical device company that provides concept to supply solutions through design, development engineering, and manufacturing. Operating results of Bridgemedica are reported in our Life Sciences group after the acquisition date. We finalized our valuation related to the assets acquired and liabilities assumed during 2019 with no material changes to the initial allocation.
Southern California Technical Arts, Inc. On August 9, 2018, we completed the acquisition of 100% of the capital stock of Southern California Technical Arts, Inc. (“Technical Arts”). For accounting purposes, Technical Arts meets the definition of a business and has been accounted for as a business combination. Technical Arts is an industrial machining company that manufactures tight tolerance metal components and assemblies. The acquisition of Technical Arts expands our presence in the aerospace and defense end market. Operating results of Technical Arts are reported in our Power Solutions group after the acquisition date. We finalized our valuation related to the assets acquired and liabilities assumed during 2019 with no material changes to the initial allocation.
Note 5. Segment Information
Management has concluded that Life Sciences, Mobile Solutions, and Power Solutions constitute our operating segments. Life Sciences, Mobile Solutions, and Power Solutions are considered operating segments as each engages in business activities for
50
which it earns revenues and incurs expenses, discrete financial information is available for each, and this is the level at which the Chief Operating Decision Maker (“CODM”) reviews discrete financial information for purposes of allocating resources and assessing performance.
Life Sciences
Life Sciences is focused on growth in the medical end market, primarily in the orthopaedics and medical/surgical end markets. Within this group we combine advanced engineering and production capabilities to design and manufacture a broad range of high-precision metal and plastic components, assemblies, and finished devices. We manufacture a variety of components, assemblies, and instruments, such as surgical knives, bioresorbable implants, surgical staples, cases and trays, orthopaedic implants and tools, laparoscopic devices, and drug delivery devices for the orthopaedics and medical/surgical end markets.
Mobile Solutions
Mobile Solutions is focused on growth in the general industrial and automotive end markets. We have developed an expertise in manufacturing highly complex, system critical components for fuel systems, engines and transmissions, power steering systems, and electromechanical motors on a high-volume basis. This expertise has been gained through investment in technical capabilities, processes and systems, and skilled program management and product launch capabilities.
Power Solutions
Power Solutions is focused on growth in the electrical and aerospace and defense end markets. Within this group we combine materials science expertise with advanced engineering and production capabilities to design and manufacture a broad range of high-precision metal and plastic components, assemblies, and finished devices used in applications ranging from power control to flight control and for military devices. We manufacture a variety of products including electrical contacts, connectors, contact assemblies, and precision stampings for the electrical end market and high precision products for the aerospace and defense end markets utilizing our extensive process technologies for optical grade plastics, thermally conductive plastics, titanium, Inconel, magnesium, and electroplating.
Segment Results
The following tables present certain operations information by reportable segment.
Life Sciences | Mobile Solutions | Power Solutions | Corporate and Consolidations | Total | ||||||||||||||||
Year Ended December 31, 2019 | ||||||||||||||||||||
Net sales | $ | 359,732 | $ | 297,749 | $ | 192,100 | $ | (2,130 | ) | (a) | $ | 847,451 | ||||||||
Depreciation and amortization | 46,905 | 27,146 | 15,301 | 2,494 | 91,846 | |||||||||||||||
Income (loss) from operations | 28,157 | 9,553 | 13,881 | (41,702 | ) | $ | 9,889 | |||||||||||||
Interest expense | (57,155 | ) | ||||||||||||||||||
Other | (4,433 | ) | ||||||||||||||||||
Loss before provision for income taxes and share of net income from joint venture | $ | (51,699 | ) | |||||||||||||||||
Share of net income from joint venture | $ | — | $ | 1,681 | $ | — | $ | — | $ | 1,681 | ||||||||||
Expenditures for long-lived assets | 21,445 | 24,969 | 4,457 | 3,132 | 54,003 | |||||||||||||||
Total assets | 811,526 | 373,256 | 310,545 | 46,657 | (b) | 1,541,984 | ||||||||||||||
51
Life Sciences | Mobile Solutions | Power Solutions | Corporate and Consolidations | Total | ||||||||||||||||
Year Ended December 31, 2018 | ||||||||||||||||||||
Net sales | $ | 248,173 | $ | 335,037 | $ | 189,778 | $ | (2,331 | ) | (a) | $ | 770,657 | ||||||||
Depreciation and amortization | 28,091 | 26,217 | 14,753 | 2,067 | 71,128 | |||||||||||||||
Goodwill impairment | — | 73,442 | 109,100 | — | 182,542 | |||||||||||||||
Income (loss) from operations | 19,136 | (55,079 | ) | (95,115 | ) | (48,806 | ) | $ | (179,864 | ) | ||||||||||
Interest expense | (61,243 | ) | ||||||||||||||||||
Other | (20,903 | ) | ||||||||||||||||||
Loss before benefit for income taxes and share of net income from joint venture | $ | (262,010 | ) | |||||||||||||||||
Share of net income from joint venture | $ | — | $ | (14,390 | ) | $ | — | $ | — | $ | (14,390 | ) | ||||||||
Expenditures for long-lived assets | 14,645 | 36,660 | 6,459 | 6,272 | 64,036 | |||||||||||||||
Total assets | 802,770 | 354,542 | 297,947 | 45,643 | (b) | 1,500,902 | ||||||||||||||
Life Sciences | Mobile Solutions | Power Solutions | Corporate and Consolidations | Total | ||||||||||||||||
Year Ended December 31, 2017 | ||||||||||||||||||||
Net sales | $ | 98,329 | $ | 336,852 | $ | 186,602 | $ | (1,990 | ) | (a) | $ | 619,793 | ||||||||
Depreciation and amortization | 12,088 | 24,491 | 14,657 | 1,170 | 52,406 | |||||||||||||||
Income (loss) from operations | 13,271 | 33,071 | 23,440 | (38,002 | ) | $ | 31,780 | |||||||||||||
Interest expense | (52,085 | ) | ||||||||||||||||||
Other | (39,902 | ) | ||||||||||||||||||
Loss before benefit for income taxes and share of net income from joint venture | $ | (60,207 | ) | |||||||||||||||||
Share of net income from joint venture | $ | — | $ | 5,211 | $ | — | $ | — | $ | 5,211 | ||||||||||
Expenditures for long-lived assets | — | 24,056 | 5,443 | 6,907 | 36,406 | |||||||||||||||
Total assets | 353,208 | 427,027 | 385,558 | 307,916 | 1,473,709 | |||||||||||||||
_______________________________
(a) Includes eliminations of intersegment transactions which occur during the ordinary course of business.
(b) Total assets in Mobile Solutions includes $21.8 million and $20.4 million as of December 31, 2019 and 2018, respectively, related to the investment in our 49% owned joint venture (Note 11).
The following table summarizes the net sales and income (loss) from operations from acquisitions in the Life Sciences and Power Solutions groups for the years ended December 31, 2018 and 2017.
Year Ended December 31, | ||||||||
2018 | 2017 | |||||||
Net sales | ||||||||
Paragon Medical | $ | 116,998 | $ | — | ||||
Other | 42,636 | 6,682 | ||||||
Income (loss) from operations | ||||||||
Paragon Medical | $ | 8,086 | $ | — | ||||
Other | 1,816 | (458 | ) | |||||
52
The following table summarizes long-lived tangible assets by geographical region.
Property, Plant, and Equipment, Net As of December 31, | ||||||||
2019 | 2018 | |||||||
United States | $ | 250,163 | $ | 235,975 | ||||
Europe | 54,829 | 50,143 | ||||||
Asia | 43,128 | 42,657 | ||||||
Mexico | 1,388 | 7,647 | ||||||
S. America | 25,005 | 24,606 | ||||||
All foreign countries | $ | 124,350 | $ | 125,053 | ||||
Total | $ | 374,513 | $ | 361,028 | ||||
Note 6. Accounts Receivable
Accounts receivable, net are comprised of the following amounts:
As of December 31, | ||||||||
2019 | 2018 | |||||||
Trade | $ | 132,910 | $ | 135,260 | ||||
Less—allowance for doubtful accounts | 1,352 | 1,839 | ||||||
Accounts receivable, net | $ | 131,558 | $ | 133,421 | ||||
The following table presents changes in allowance for doubtful accounts.
Year Ended December 31, | ||||||||||||
2019 | 2018 | 2017 | ||||||||||
Balance at beginning of year | $ | 1,839 | $ | 1,719 | $ | 1,069 | ||||||
Additions | 449 | 754 | 648 | |||||||||
Write-offs | (924 | ) | (584 | ) | (101 | ) | ||||||
Currency impact | (12 | ) | (50 | ) | 103 | |||||||
Balance at end of year | $ | 1,352 | $ | 1,839 | $ | 1,719 | ||||||
Note 7. Inventories
Inventories are comprised of the following amounts:
As of December 31, | ||||||||
2019 | 2018 | |||||||
Raw materials | $ | 49,135 | $ | 52,930 | ||||
Work in process | 43,456 | 40,888 | ||||||
Finished goods | 26,131 | 27,107 | ||||||
Total inventories | $ | 118,722 | $ | 120,925 | ||||
53
Note 8. Property, Plant and Equipment
Property, plant and equipment are comprised of the following amounts:
As of December 31, | ||||||||
2019 | 2018 | |||||||
Property, plant and equipment | ||||||||
Land and buildings | $ | 80,647 | $ | 69,455 | ||||
Machinery and equipment | 433,016 | 401,729 | ||||||
Construction in progress | 38,829 | 35,122 | ||||||
Total | 552,492 | 506,306 | ||||||
Less: Accumulated depreciation | 177,979 | 145,278 | ||||||
Property, plant and equipment, net | $ | 374,513 | $ | 361,028 | ||||
We monitor property, plant and equipment for any indicators of potential impairment. We recognized an impairment charge of $0.6 million and $5.2 million for the years ended December 31, 2019 and 2018, respectively, related to the early retirement of identified fixed assets. The impairment charge was recorded to the “Other operating (income) expense, net,” line item on the Consolidated Statements of Operations and Comprehensive Income (Loss). The impairment charge was determined by writing the assets down to the estimated salvage value, less disposal costs. We recorded no impairment charge for the year ended December 31, 2017.
For the years ended December 31, 2019, 2018, and 2017, we recorded depreciation expense of $44.8 million, $38.6 million, and $28.9 million, respectively.
Note 9. Goodwill
The following table presents changes in the carrying amount of goodwill for the years ended December 31, 2019, and 2018.
Life Sciences | Mobile Solutions | Power Solutions | Total | |||||||||||||
Balance as of December 31, 2017 | $ | 177,784 | $ | 74,147 | $ | 202,681 | $ | 454,612 | ||||||||
Currency impact and other | (3,118 | ) | (705 | ) | (1,882 | ) | (5,705 | ) | ||||||||
Goodwill acquired in acquisitions | 165,288 | — | 2,657 | 167,945 | ||||||||||||
Impairments | — | (73,442 | ) | (109,100 | ) | (182,542 | ) | |||||||||
Measurement period adjustments | 4,993 | — | 149 | 5,142 | ||||||||||||
Balance as of December 31, 2018 | 344,947 | — | 94,505 | 439,452 | ||||||||||||
Currency impact and other | (631 | ) | — | 274 | (357 | ) | ||||||||||
Balance as of December 31, 2019 | $ | 344,316 | $ | — | $ | 94,779 | $ | 439,095 | ||||||||
The following table presents the gross carrying amount of goodwill and accumulated impairment charges as of December 31, 2019, and 2018.
December 31, 2019 | December 31, 2018 | |||||||||||||||||||||||
Gross Carrying Amount | Accumulated Impairment Charges | Net Book Value | Gross Carrying Amount | Accumulated Impairment Charges | Net Book Value | |||||||||||||||||||
Life Sciences | $ | 344,316 | $ | — | $ | 344,316 | $ | 344,947 | $ | — | $ | 344,947 | ||||||||||||
Mobile Solutions | 77,458 | (77,458 | ) | — | 77,650 | (77,650 | ) | — | ||||||||||||||||
Power Solutions | 215,628 | (120,849 | ) | 94,779 | 215,354 | (120,849 | ) | 94,505 | ||||||||||||||||
Total goodwill | $ | 637,402 | $ | (198,307 | ) | $ | 439,095 | $ | 637,951 | $ | (198,499 | ) | $ | 439,452 | ||||||||||
We review goodwill for impairment on a reporting unit basis annually during the fourth quarter of each year, using a measurement date of October 1st, and whenever events or changes in circumstances indicate the carrying value of goodwill may not be recoverable. Reporting units for the purpose of goodwill impairment testing are the same as our operating segments (Life Sciences, Mobile Solutions and Power Solutions). Based on the results of the quantitative measurement performed, which indicated a fair value in excess of carrying amount for each of our designated reporting units, we concluded there was no impairment of goodwill for the year ended December 31, 2019.
54
The fair value of the Power Solutions reporting unit exceeds the carrying value by approximately 5% as of the date of our annual impairment test. If our assessment of the relevant facts and circumstances changes, or the actual performance falls short of the expected results, impairment charges may be required.
During the fourth quarter of 2018, our market capitalization declined to a level that was less than the net book value of our stockholders’ equity. We performed our annual goodwill impairment analysis as of October 1, 2018, and elected to early adopt ASU 2017-4, Intangibles - Goodwill and Other (Topic 350): Simplifying the Test for Goodwill Impairment. As a result of our analysis, we recorded an impairment loss on goodwill in 2018 of $73.4 million and $109.1 million for Mobile Solutions and Power Solutions, respectively, to the “Goodwill impairment” line on the Consolidated Statements of Operations and Comprehensive Income (Loss). In addition, goodwill in Power Solutions was reduced by $1.6 million related to adjusting deferred tax liabilities for tax deductible goodwill, which is reflected in “Currency impact and other” in the above table. No goodwill impairment loss was recorded at Life Sciences in 2018.
Goodwill acquired in 2018 is related to the acquisitions as described in Note 4 and is derived from the value of the businesses acquired. During 2018, we recorded $161.8 million of goodwill related to the Paragon Medical acquisition, $8.0 million related to the Bridgemedica acquisition, and $2.8 million related to the Technical Arts acquisition. We finalized our valuations related to the 2018 acquisitions in 2019 with no material changes to the initial purchase price allocation.
As noted above, it was determined under a quantitative assessment that there was no impairment of goodwill in 2019. However, if we become aware of indicators of impairment in future periods, we may be required to perform an interim assessment for some or all of our reporting units before the next annual assessment. Examples of such indicators may include a decrease in expected net earnings, adverse equity market conditions, a decline in current market multiples, a decline in our common stock price, a significant adverse change in legal factors or business climates, an adverse action or assessment by a regulator, unanticipated competition, strategic decisions made in response to economic or competitive conditions, or a more likely than not expectation that a reporting unit or a significant portion of a reporting unit will be sold or disposed of. In the event of significant adverse changes of the nature described above, we may have to recognize a non-cash impairment of goodwill, which could have a material adverse effect on our consolidated financial condition and results of operations.
Based on the closing sales price of a share of our common stock as of December 31, 2019, our market capitalization exceeded the $353.3 million net book value of our stockholders’ equity. Subsequent to December 31, 2019, our market capitalization declined to a level that is less than the net book value of our stockholders’ equity. A prolonged or significant decline in market capitalization could be an indicator of possible goodwill impairment. We will continue to monitor the market capitalization relative to net book value in subsequent periods.
Note 10. Intangible Assets, Net
The following table presents changes in the carrying amount of intangible assets, net.
Life Sciences | Mobile Solutions | Power Solutions | Total | |||||||||||||
Balance as of December 31, 2017 | $ | 93,226 | $ | 39,446 | $ | 105,030 | $ | 237,702 | ||||||||
Amortization | (18,074 | ) | (3,540 | ) | (10,939 | ) | (32,553 | ) | ||||||||
Currency impacts and other | — | (14 | ) | — | (14 | ) | ||||||||||
Intangible assets acquired in acquisitions | 169,213 | — | 1,900 | 171,113 | ||||||||||||
Balance as of December 31, 2018 | 244,365 | 35,892 | 95,991 | 376,248 | ||||||||||||
Amortization | (32,525 | ) | (3,479 | ) | (10,994 | ) | (46,998 | ) | ||||||||
Other | 7 | 3 | — | 10 | ||||||||||||
Balance as of December 31, 2019 | $ | 211,847 | $ | 32,416 | $ | 84,997 | $ | 329,260 | ||||||||
The following table shows the cost and accumulated amortization of our intangible assets as of December 31, 2019 and 2018.
December 31, 2019 | December 31, 2018 | |||||||||||||||||||||||||
Estimated Useful Life in Years | Gross Carrying Value as of Acquisition Date | Accumulated Amortization | Net Carrying Value | Gross Carrying Value as of Acquisition Date | Accumulated Amortization | Net Carrying Value | ||||||||||||||||||||
Customer relationships | 12 - 20 | $ | 428,830 | $ | (118,976 | ) | $ | 309,854 | $ | 428,830 | $ | (75,581 | ) | $ | 353,249 | |||||||||||
Trademark and trade name | 8 - 30 | 25,100 | (5,695 | ) | 19,405 | 25,100 | (4,085 | ) | 21,015 | |||||||||||||||||
Other | 2 | 13 | (12 | ) | 1 | 10,641 | (8,657 | ) | 1,984 | |||||||||||||||||
Total identified intangible assets | $ | 453,943 | $ | (124,683 | ) | $ | 329,260 | $ | 464,571 | $ | (88,323 | ) | $ | 376,248 | ||||||||||||
55
Intangible assets that are fully amortized are removed and no longer represented in the gross carrying value or accumulated amortization.
The following table presents estimated future amortization expense for the next five years and thereafter.
Year Ending December 31, | |||
2020 | $ | 45,365 | |
2021 | 41,415 | ||
2022 | 38,464 | ||
2023 | 36,625 | ||
2024 | 33,888 | ||
Thereafter | 133,503 | ||
Total | $ | 329,260 | |
Intangible assets are reviewed for impairment when changes in circumstances indicate the carrying value of those assets may not be recoverable. As of December 31, 2019 and 2018, there were no indications of impairment.
Note 11. Investment in Joint Venture
We own a 49% investment in Wuxi Weifu Autocam Precision Machinery Company, Ltd. (the “JV”), a joint venture located in Wuxi, China. The JV is jointly controlled and managed, and we account for it under the equity method.
The following table presents changes in our investment in the JV.
Balance as of December 31, 2018 | $ | 20,364 | |
Share of earnings | 1,681 | ||
Foreign currency translation loss | (290 | ) | |
Balance as of December 31, 2019 | $ | 21,755 | |
During the fourth quarter of 2018, as a result of changing market conditions, the fair value of the JV was assessed, and we recorded an impairment charge of $16.6 million against our investment in the JV. The fair value assessment was significantly affected by changes in our assessment of future growth rates. It is reasonably possible that material deviation of future performance from the estimates used in the 2018 valuation could result in additional impairment to our investment in the JV in subsequent periods. During the fourth quarter of 2019, we assessed the JV for triggering events that would signify the need to perform an impairment test and concluded there were no triggering events during the period. For the year ended December 31, 2019, no impairment charges were recorded against our investment in the JV.
Note 12. Income Taxes
The following table summarizes the loss from continuing operations before benefit for income taxes and share of net income from joint venture.
Year Ended December 31, | ||||||||||||
2019 | 2018 | 2017 | ||||||||||
Loss before (provision) benefit for income taxes and share of net income from joint venture | ||||||||||||
United States | $ | (69,866 | ) | $ | (263,499 | ) | $ | (71,603 | ) | |||
Foreign | 18,167 | 1,489 | 11,396 | |||||||||
Total | $ | (51,699 | ) | $ | (262,010 | ) | $ | (60,207 | ) | |||
56
The following table summarizes total income tax benefit recognized in each year.
Year Ended December 31, | ||||||||||||
2019 | 2018 | 2017 | ||||||||||
Current taxes: | ||||||||||||
U.S. Federal | $ | (6,805 | ) | $ | 6,819 | $ | (47,916 | ) | ||||
State | 871 | 1,103 | (12,745 | ) | ||||||||
Foreign | 5,770 | 3,086 | 4,310 | |||||||||
Total current tax expense (benefit) | (164 | ) | 11,008 | (56,351 | ) | |||||||
Deferred taxes: | ||||||||||||
U.S. Federal | $ | (4,096 | ) | $ | (17,773 | ) | $ | (25,017 | ) | |||
State | (2,510 | ) | (780 | ) | 3,009 | |||||||
Deferred tax valuation allowance | 4,612 | (3,565 | ) | 710 | ||||||||
Foreign | (1,119 | ) | (2,303 | ) | (1,896 | ) | ||||||
Total deferred tax expense (benefit) | (3,113 | ) | (24,421 | ) | (23,194 | ) | ||||||
Total income tax expense (benefit) | $ | (3,277 | ) | $ | (13,413 | ) | $ | (79,545 | ) | |||
The following table presents a reconciliation of income taxes based on the U.S. federal statutory income tax rate.
Year Ended December 31, | |||||||||
2019 | 2018 | 2017 | |||||||
U.S federal statutory income tax rate | 21.0 | % | 21.0 | % | 35.0 | % | |||
Change in valuation allowance, exclusive of state | 1.2 | % | (0.9 | )% | (1.2 | )% | |||
Foreign tax credits, exclusive of tax reform | — | % | — | % | (13.5 | )% | |||
State taxes, net of federal taxes, exclusive of tax reform | (8.0 | )% | 0.4 | % | 8.9 | % | |||
Non-U.S. earnings taxed at different rates | 1.0 | % | 1.3 | % | 1.6 | % | |||
Non-deductible mergers and acquisitions costs | — | % | (0.2 | )% | — | % | |||
GILTI | (0.8 | )% | (0.5 | )% | — | % | |||
Goodwill impairment | — | % | (14.1 | )% | — | % | |||
Nondeductible asset loss | (1.3 | )% | (0.1 | )% | (0.8 | )% | |||
Research and development tax credit | 3.1 | % | 0.3 | % | 0.3 | % | |||
Change in uncertain tax positions | 2.6 | % | 0.1 | % | 0.5 | % | |||
Impact of tax reform: | |||||||||
Toll charge, net of foreign tax credit | — | % | 0.6 | % | (11.3 | )% | |||
Remeasurement of deferred taxes pursuant to tax reform | — | % | (0.9 | )% | 64.1 | % | |||
Tax reform impact on divestiture of business segment | — | % | — | % | 33.2 | % | |||
Impact of 2019 Treasury regulations | (11.5 | )% | — | % | — | % | |||
Section 199 domestic production deduction | — | % | — | % | 0.7 | % | |||
Divestiture of business segment, exclusive of tax reform | — | % | (0.9 | )% | 13.3 | % | |||
Return to provision | 1.3 | % | (0.8 | )% | — | % | |||
Other adjustments, net | (2.3 | )% | (0.2 | )% | 1.3 | % | |||
Effective tax rate | 6.3 | % | 5.1 | % | 132.1 | % | |||
The 2019 effective tax rate of 6.3% differs from the U.S. federal statutory income tax rate of 21.0% primarily due to the effects of final tax regulations published by the Department of the Treasury and Internal Revenue Service on February 5, 2019, as well as the minimum tax on GILTI. Based upon analysis of the final regulations, we recognized additional tax expense of $5.9 million for the year ended December 31, 2019, which significantly impacted the effective tax rate.
The 2018 effective tax rate of 5.1% differs from the U.S. federal statutory income tax rate of 21.0% primarily due to the impact of goodwill impairment which was nondeductible for tax purposes. In 2018, we recognized an adjustment to the estimated net tax benefit from tax reform, which resulted in additional tax expense of $0.8 million. This adjustment was primarily related to the one-time transition tax on deferred foreign income, the change in valuation of deferred tax assets associated with tax law changes, and the remeasurement of deferred taxes.
57
The 2017 effective tax rate of 132.1% was heavily influenced by the Tax Act which reduced the U.S. federal corporate income tax rate from 35% to 21%, required companies to pay a one-time transition tax on earnings of certain foreign subsidiaries that were previously tax deferred, and created new taxes on certain foreign sourced earnings. As a result of the Tax Act, we recognized a $51.8 million net tax benefit in 2017, which included the estimate of transition tax and the remeasurement of our domestic deferred taxes from 35% to 21%. The 2017 tax rate was also impacted by the divestiture of the PBC Business.
The following table summarizes the principal components of the deferred tax assets and liabilities.
As of December 31, | ||||||||
2019 | 2018 | |||||||
Deferred income tax liabilities: | ||||||||
Tax in excess of book depreciation | $ | 44,834 | $ | 37,425 | ||||
Intangible assets | 73,405 | 80,623 | ||||||
Operating lease liabilities | 17,527 | — | ||||||
Other deferred tax liabilities | 4,857 | 794 | ||||||
Total deferred income tax liabilities | 140,623 | 118,842 | ||||||
Deferred income tax assets: | ||||||||
Interest expense limitation | 14,674 | 9,968 | ||||||
Goodwill | 304 | 1,441 | ||||||
Inventories | 3,466 | 2,745 | ||||||
Interest rate swap | 2,839 | — | ||||||
Pension/Personnel accruals | 495 | 1,317 | ||||||
Operating lease right-of-use assets | 19,313 | — | ||||||
Net operating loss carry forwards | 15,876 | 9,321 | ||||||
U.S. foreign tax credit carryforwards | 3,360 | 5,345 | ||||||
R&D credit carryforwards | 2,654 | 917 | ||||||
Non-U.S. credit carryforwards | 3,313 | 4,130 | ||||||
Accruals and reserves | 2,299 | 1,531 | ||||||
Other deferred tax assets | 5,264 | 4,749 | ||||||
Deferred income tax assets before valuation allowance | 73,857 | 41,464 | ||||||
Valuation allowance on deferred tax assets | (19,033 | ) | (14,460 | ) | ||||
Total deferred income tax assets | 54,824 | 27,004 | ||||||
Net deferred income tax liabilities | $ | 85,799 | $ | 91,838 | ||||
As of December 31, 2019, we had $1.5 million of U.S. federal net operating loss (“NOL”) carryover and $225.4 million of state NOL carryovers. The federal NOL has an indefinite life, but utilization within any tax year is limited to 80% of taxable income. The state NOLs begin to expire in 2030. Management believes that certain of the state NOL carryovers will more likely than not expire prior to utilization. As such, a valuation allowance of $10.8 million has been established to reduce the state attribute balance to the amount expected to be utilized before expiration. We also have $14.1 million of foreign NOL carryovers at December 31, 2019. The foreign NOLs have an indefinite life; however, management believes that benefit for certain of the foreign NOLs may not be realized. Therefore, the Company has established a valuation allowance of $1.0 million to reduce the carrying value of the asset related to foreign NOLs to the amount that has been determined to be more likely than not realized.
We have credit carryforwards for U.S. federal income tax purposes of $5.8 million at December 31, 2019. Of this amount, $3.4 million relates to foreign tax credit carryforwards which will begin to expire in 2026, and $2.4 million relates to research and development tax credit carryforwards. Management believes that the U.S. foreign tax credits will more likely than not expire before utilization and therefore has established a full valuation allowance against the credits. We have $0.2 million of state credit carryforwards for which we believe realization is more likely than not. In addition, we have $3.3 million of tax credits in other foreign jurisdictions at December 31, 2019. The tax credits in these other foreign jurisdictions begin to expire in 2026. We have established a valuation allowance of $3.3 million to offset the full carrying value of the asset related to the foreign jurisdictions’ tax credits.
We have a U.S. federal and state deferred tax asset related to currency losses on intercompany loans. Management believes it is more likely than not that the benefit for the asset will not be realized based on timing of expected repayment of the intercompany loans. We have established a valuation allowance of $0.5 million to eliminate the carrying value of this asset.
58
Management believes all remaining tax assets will more likely than not be realized. However, the amount of the deferred tax considered realizable could be reduced based on changing conditions.
During 2019, the state valuation allowance increased by approximately $5.2 million, primarily due to a valuation allowance recorded to offset the current year generation of separate state loss carryforwards that management does not believe are realizable given anticipated changes in state nexus. In the current year, the U.S. federal valuation allowance decreased by $1.5 million primarily due to previously unanticipated utilization of foreign tax credits upon implementation of the final IRS regulations related to the 2017 transition tax. The foreign valuation allowance increased by $0.9 million in 2019 to offset current year loss generation in jurisdictions where realization of the asset is not more likely than not.
During 2018, the valuation allowance increased by approximately $6.9 million to $14.5 million, as a result of an increase in foreign and state NOLs and U.S. foreign tax credits.
During 2017, the valuation allowance increased by approximately $3.5 million to $7.6 million, as a result of a $2.3 million increase due to the uncertainty of realizing certain state NOL carryforwards, and a $1.2 million increase for foreign NOLs.
As a result of the deemed mandatory repatriation provisions in the Tax Act, we included undistributed earnings in income subject to U.S. tax at reduced tax rates in 2017. Subsequently, we have recognized in income GILTI as part of the changes from the Tax Act. Therefore, we do not have material basis differences related to cumulative unremitted earnings for U.S. income tax purposes. However, we continue to evaluate quarterly the impact that repatriation of foreign earnings would have on withholding and other taxes. As of December 31, 2019, we have recorded a liability of $2.3 million for the anticipated withholding taxes which would be due upon repatriation of the unremitted earnings of those subsidiaries for which management does not intend to permanently reinvest all earnings.
We are subject to U.S. federal income tax as well as tax in several foreign jurisdictions. We are also subject to tax by various state authorities. The tax years subject to examination vary by jurisdiction. We are no longer subject to U.S. federal examination for periods before 2016. We are currently working with tax authorities in France to complete an audit for the 2016 tax year. We regularly assess the outcomes of both ongoing and future examinations for the current or prior years to ensure our provision for income taxes is sufficient. We recognize liabilities based on estimates of whether additional taxes will be due, and we believes our reserves are adequate in relation to any potential assessments. The outcome of any one examination, some of which may conclude during the next twelve months, is not expected to have a material impact on our financial position or results of operations.
Interest and penalties related to federal, state, and foreign income tax matters are recorded as a component of the provision for income taxes in our Consolidated Statements of Operations and Comprehensive Income (Loss). Accrued interest and penalties of $1.5 million, $1.3 million and $1.4 million are included in other non-current liabilities as of December 31, 2019, 2018, and 2017, respectively.
The following table presents a reconciliation of the beginning and ending amounts of unrecognized tax benefits, excluding interest and penalties.
Year Ended December 31, | ||||||||||||
2019 | 2018 | 2017 | ||||||||||
Balance at beginning of year | $ | 4,609 | $ | 5,655 | $ | 4,741 | ||||||
Additions for tax positions of prior years | — | 304 | 1,404 | |||||||||
Settlements for tax positions of prior years | (275 | ) | — | — | ||||||||
Reductions for tax positions of prior years | (1,745 | ) | (1,350 | ) | (490 | ) | ||||||
Balance at end of year | $ | 2,589 | $ | 4,609 | $ | 5,655 | ||||||
In addition to settlements, the reduction to unrecognized tax benefits in 2019 is primarily related to expiring statutes of limitations in certain U.S. state jurisdictions. As of December 31, 2019, the unrecognized tax benefits would, if recognized, impact our effective tax rate by $3.6 million, inclusive of the impact of interest and penalties. Management believes that it is reasonably possible that the amount of unrecognized income benefits, including interest and penalties, may decrease during the next twelve months by approximately $1.4 million, related to the expiration of the statutes of limitations.
We operate under tax holidays in other countries, which are effective through December 31, 2026, and may be extended if certain additional requirements are satisfied. The tax holidays are conditional upon our meeting certain employment and investment thresholds. The impact of these tax holidays decreased foreign taxes by $0.8 million for 2017. The benefit of the tax holidays on net income per share (diluted) was $0.03 for 2017. The tax holidays had no impact on our 2019 and 2018 foreign taxes.
59
Note 13. Debt
Collectively, our credit facility is comprised of a term loan with a face amount of $545.0 million, maturing on October 19, 2022 (the “Senior Secured Term Loan”); a term loan with a face amount of $300.0 million, maturing on October 19, 2022 (the “Incremental Term Loan”); and a revolving line of credit with a face amount of $75.0 million, maturing on July 20, 2022 (the “Senior Secured Revolver”). The credit facility is collateralized by all of our assets.
The following table presents outstanding debt balances as of December 31, 2019 and 2018.
As of December 31, | ||||||||
2019 | 2018 | |||||||
Senior Secured Term Loan | $ | 526,313 | $ | 532,063 | ||||
Incremental Term Loan | 257,111 | 279,000 | ||||||
Senior Secured Revolver | — | 38,720 | ||||||
International lines of credit and other loans | 9,823 | 9,810 | ||||||
Total principal | 793,247 | 859,593 | ||||||
Less-current maturities of long-term debt | 19,160 | 31,280 | ||||||
Principal, net of current portion | 774,087 | 828,313 | ||||||
Less-unamortized debt issuance costs (1) | 16,647 | 16,842 | ||||||
Long-term debt, net of current portion | $ | 757,440 | $ | 811,471 | ||||
_______________________________
(1) In addition to this amount, costs of $3.0 million related to the Senior Secured Revolver are recorded in other non-current assets as of December 31, 2019.
We capitalized interest costs of $1.8 million, $1.2 million, and $1.1 million in the years ended December 31, 2019, 2018, and 2017, respectively, related to construction in progress.
Senior Secured Term Loan
Outstanding borrowings under the Senior Secured Term Loan bear interest at the greater of 0.75% or one-month London Interbank Offered Rate (“LIBOR”) plus an applicable margin. In December 2019, we amended our existing credit facility (the “December 2019 amendment”) to increase the applicable margin from 3.75% to 5.25%. At December 31, 2019, the Senior Secured Term Loan bore interest at 7.05%.
Incremental Term Loan
Outstanding borrowings under the Incremental Term Loan bear interest at one-month LIBOR plus an applicable margin. The December 2019 amendment increased the applicable margin from 3.25% to 5.25% and extended the maturity date of the Incremental Term Loan from April 3, 2021, to October 19, 2022. At December 31, 2019, the Incremental Term Loan bore interest at 7.05%.
Second Lien Credit Agreement
In May 2018, we entered into a $200.0 million Second Lien Credit Agreement to fund the Paragon Medical acquisition. In September 2018, a significant portion of net proceeds from a registered public offering of shares of our common stock was used to voluntarily prepay in full the $200.0 million outstanding principal balance. There were no outstanding borrowings under the Second Lien Credit Agreement at December 31, 2019 and 2018.
Senior Secured Revolver
Outstanding borrowings under the Senior Secured Revolver bear interest on a variable rate structure with borrowings bearing interest at either one-month LIBOR plus an applicable margin of 4.00% or the prime lending rate plus an applicable margin of 3.00%. We pay a commitment fee of 0.50% for unused capacity under the Senior Secured Revolver.
In March 2019, we amended our existing credit facility (the “March 2019 amendment”) to amend the defined terms within the credit facility. In June 2019, we amended our existing credit facility (the “June 2019 amendment”) to reduce the maximum capacity under the Senior Secured Revolver to $110.0 million, reduce the total available capacity to $100.0 million, and modify the consolidated net leverage ratio, as defined in the credit facility agreement, which is utilized for certain financial covenants. The December 2019 amendment extended the maturity date of the Senior Secured Revolver from October 19, 2020, to July 20, 2022, reduced the total available capacity to $75.0 million, and increased the applicable one-month LIBOR margin to a range of 3.00% to 4.00% dependent on the consolidated net leverage ratio.
60
We had no outstanding borrowings under the Senior Secured Revolver at December 31, 2019. Total available capacity under the Senior Secured Revolver was $75.0 million as of December 31, 2019, with $63.9 million available for future borrowings after reductions for outstanding letters of credit and outstanding borrowings as of December 31, 2019. Our credit facility is subject to certain financial covenants based on a consolidated net leverage ratio, becoming more restrictive over time. If our operational or financial performance does not improve in line with our expectations, we may be required to take actions to further reduce expenditures and decrease our net indebtedness to maintain compliance in future periods. We were in compliance with all covenants under our credit facility at December 31, 2019.
Unamortized Debt Issuance Costs
We incurred a total of $10.8 million for debt issuance costs related to the March 2019 amendment, June 2019 amendment, and December 2019 amendment. Costs related to the Senior Secured Term Loan and the Incremental Term Loan are recorded as a direct reduction to the carrying amount of the associated long-term debt. Costs related to the Senior Secured Revolver are recorded in other non-current assets as of December 31, 2019, as no borrowings were outstanding. Additionally, $3.3 million of unamortized debt issuance costs associated with the March 2019 amendment and the December 2019 amendment were written off in 2019.
International Lines of Credit and Other Loans
International lines of credit and other loans consist of loans with financial institutions in France, Brazil, China, and the United States with a weighted average interest rate of 3.43% as of December 31, 2019. These sources are used to fund working capital and equipment purchases for our manufacturing plants and have a weighted average remaining term of 9 years. As of December 31, 2019, the international lines of credit and other loans had $9.8 million outstanding of which $1.4 million is classified as “Current maturities of long-term debt” on the Consolidated Balance Sheets.
Derivative Instruments and Hedging Activities
In February 2019, we entered into a $700.0 million amortizing notional amount fixed-rate interest rate swap agreement to manage the interest rate risk associated with our long-term variable-rate debt until 2022. The fixed-rate interest rate swap agreement calls for us to receive interest monthly at a variable rate equal to one-month LIBOR and to pay interest monthly at a fixed rate of 2.4575%. Refer to Note 22 for further discussion of the interest rate swap agreement.
Future Maturities
The following table lists aggregate maturities of long-term debt for the next five years and thereafter.
Year Ending December 31, | Aggregate Maturities Principal Amounts | |||
2020 | $ | 19,160 | ||
2021 | 18,777 | |||
2022 | 749,162 | |||
2023 | 1,274 | |||
2024 | 1,073 | |||
Thereafter | 3,801 | |||
Total outstanding principal | $ | 793,247 | ||
Note 14. Leases
We adopted ASC 842 on January 1, 2019, and elected the modified retrospective approach in which the new standard is applied to all leases existing at the date of adoption through a cumulative-effect adjustment of less than $0.1 million to accumulated deficit. Consequently, financial information is not updated, and the disclosures required under the new standard are not provided for periods prior to January 1, 2019. As part of the adoption, we elected the package of practical expedients, the short-term lease exemption, and the practical expedient to not separate lease and non-lease components. Accordingly, we accounted for our existing operating leases as operating leases under the new standard, without reassessing (a) whether the contracts contain a lease under ASC 842, (b) whether classification of the operating leases would be different in accordance with ASC 842, or (c) whether any unamortized initial direct costs would have met the definition of initial direct costs in ASC 842 at lease commencement.
We determine whether an arrangement is a lease at inception. Right-of-use (“ROU”) lease assets represent our right to use an underlying asset for the lease term, and lease liabilities represent our obligation to make lease payments arising from the lease. ROU lease assets and liabilities are recognized at the lease commencement date based on the present value of lease payments
61
over the lease term. When the implicit rate is not readily determinable, we use the estimated incremental borrowing rate based on the information available at the lease commencement date in determining the present value of lease payments. The lease terms may include options to extend or terminate the lease when it is reasonably certain that we will exercise that option. Amortization of ROU lease assets is recognized in expense on a straight-line basis over the lease term.
Short-term leases are leases having a term of twelve months or less. We recognize short-term leases on a straight-line basis and do not record a related lease asset or liability for such leases. Finance lease ROU assets consist primarily of equipment used in the manufacturing process with terms greater than twelve months to seven years. Operating lease ROU assets consist of the following:
• | Equipment used in the manufacturing process as well as office equipment with terms three years to seven years; and |
• | Manufacturing plants and office facilities with terms two years to 20 years. |
The following table presents components of lease expense for the year ended December 31, 2019:
Financial Statement Line Item | Year Ended December 31, 2019 | |||||
Lease cost: | ||||||
Finance lease cost | ||||||
Amortization of right-of-use assets | Depreciation and amortization | $ | 1,416 | |||
Interest expense | Interest expense | 284 | ||||
Operating lease cost | Cost of sales and selling, general and administrative expense | 13,684 | ||||
Short-term lease cost (1) | Cost of sales and selling, general and administrative expense | 479 | ||||
Variable lease cost (2) | Cost of sales and selling, general and administrative expense | 36 | ||||
Total lease cost | $ | 15,899 | ||||
_______________________________
(1) Excludes expenses related to leases with a lease term of one month or less.
(2) Represents changes to index-based lease payments.
The following table presents the lease-related assets and liabilities recorded on the balance sheet as of December 31, 2019:
Financial Statement Line Item | December 31, 2019 | |||||
Assets | ||||||
Operating lease assets | Operating lease right-of-use assets | $ | 65,496 | |||
Finance lease assets | Property, plant and equipment, net | 18,415 | ||||
Total lease assets | $ | 83,911 | ||||
Liabilities | ||||||
Current liabilities | ||||||
Operating lease liabilities | Current portion of operating lease liabilities | $ | 6,652 | |||
Finance lease liabilities | Other current liabilities | 3,669 | ||||
Non-current liabilities | ||||||
Operating lease liabilities | Operating lease liabilities, net of current portion | 66,980 | ||||
Finance lease liabilities | Other non-current liabilities | 12,037 | ||||
Total lease liabilities | $ | 89,338 | ||||
62
The following table contains supplemental information related to leases for the year ended December 31, 2019:
Supplemental Cash Flows Information | Year Ended December 31, 2019 | |||
Cash paid for amounts included in the measurement of lease liabilities | ||||
Operating cash flows from finance leases | $ | 273 | ||
Operating cash flows from operating leases | 21,726 | |||
Financing cash flows from finance leases | 3,390 | |||
Right-of-use assets obtained in exchange for new finance lease liabilities | $ | 10,571 | ||
Right-of-use assets obtained in exchange for new operating lease liabilities | $ | 8,508 | ||
As of December 31, 2019, the weighted average remaining lease term and weighted-average discount rate for finance and operating leases was as follows:
Operating Leases | Finance Leases | |||||
Weighted-average remaining lease term (years) | 10.6 | 4.3 | ||||
Weighted-average discount rate | 6.3 | % | 3.0 | % | ||
The maturities of lease liabilities greater than twelve months as of December 31, 2019, is as follows:
Operating Leases | Finance Leases | |||||||
2020 | $ | 12,229 | $ | 4,099 | ||||
2021 | 11,233 | 4,085 | ||||||
2022 | 10,941 | 3,867 | ||||||
2023 | 9,385 | 2,963 | ||||||
2024 | 9,150 | 1,477 | ||||||
Thereafter | 56,274 | 272 | ||||||
Total future minimum lease payments | 109,212 | 16,763 | ||||||
Less: imputed interest | 35,580 | 1,057 | ||||||
Total lease liabilities | $ | 73,632 | $ | 15,706 | ||||
As of December 31, 2019, we have an additional operating lease commitment that would require us to pay a total of approximately $27.5 million base rent payments over the lease term of 15 years. We are expected to commence base rent payments during the third quarter of 2020.
The following table presents the future minimum lease payments under operating leases with initial or non-cancelable lease terms in excess of one year prior to adoption of ASC 842 as reported in the 2018 Annual Report.
Year Ending December 31, | ||||
2019 | $ | 13,337 | ||
2020 | 11,515 | |||
2021 | 10,557 | |||
2022 | 10,293 | |||
2023 | 8,752 | |||
Thereafter | 53,945 | |||
Total minimum payments | $ | 108,399 | ||
During the years ended December 31, 2018 and 2017, we recognized rent expense of $12.4 million and $7.6 million, respectively.
63
Note 15. Restructuring and Integration
The following table presents restructuring and integration charges for the years ended December 31, 2019, 2018, and 2017.
Life Sciences | Mobile Solutions | Corporate and Consolidations | Total | |||||||||||||
Year Ended December 31, 2019 | ||||||||||||||||
Severance and other employee costs | $ | — | $ | — | $ | — | $ | — | ||||||||
Site closure and other associated costs | — | (12 | ) | — | (12 | ) | ||||||||||
Total | $ | — | $ | (12 | ) | $ | — | $ | (12 | ) | ||||||
Year Ended December 31, 2018 | ||||||||||||||||
Severance and other employee costs | $ | 1,336 | $ | — | $ | 728 | $ | 2,064 | ||||||||
Site closure and other associated costs | — | 63 | — | 63 | ||||||||||||
Total | $ | 1,336 | $ | 63 | $ | 728 | $ | 2,127 | ||||||||
Year Ended December 31, 2017 | ||||||||||||||||
Severance and other employee costs | $ | — | $ | 17 | $ | — | $ | 17 | ||||||||
Site closure and other associated costs | — | 369 | — | 369 | ||||||||||||
Total | $ | — | $ | 386 | $ | — | $ | 386 | ||||||||
The following tables presents restructuring and integration reserve activity for the years ended December 31, 2019, 2018, and 2017.
Reserve Balance as of December 31, 2018 | Charges | Non-cash Adjustments | Cash Reductions | Reserve Balance as of December 31, 2019 | ||||||||||||||||
Severance and other employee costs | $ | 1,122 | $ | — | $ | — | $ | (645 | ) | $ | 477 | |||||||||
Site closure and other associated costs | 24 | (12 | ) | — | (12 | ) | — | |||||||||||||
Total | $ | 1,146 | $ | (12 | ) | $ | — | $ | (657 | ) | $ | 477 | ||||||||
Reserve Balance as of December 31, 2017 | Charges | Non-cash Adjustments | Cash Reductions | Reserve Balance as of December 31, 2018 | ||||||||||||||||
Severance and other employee costs | $ | — | $ | 2,064 | $ | — | $ | (942 | ) | $ | 1,122 | |||||||||
Site closure and other associated costs | 1,099 | 63 | (56 | ) | (1,082 | ) | 24 | |||||||||||||
Total | $ | 1,099 | $ | 2,127 | $ | (56 | ) | $ | (2,024 | ) | $ | 1,146 | ||||||||
Reserve Balance as of December 31, 2016 | Charges | Non-cash Adjustments | Cash Reductions | Reserve Balance as of December 31, 2017 | ||||||||||||||||
Severance and other employee costs | $ | 1,000 | $ | 17 | $ | (164 | ) | $ | (853 | ) | $ | — | ||||||||
Site closure and other associated costs | 1,625 | 369 | — | (895 | ) | 1,099 | ||||||||||||||
Total | $ | 2,625 | $ | 386 | $ | (164 | ) | $ | (1,748 | ) | $ | 1,099 | ||||||||
In 2018, we recognized severance and other employee costs of $0.7 million at corporate headquarters related to the restructuring of our former Precision Engineered Products Group to form the Life Sciences and Power Solutions groups, effective January 2, 2018. We also recognized severance and other employee costs of $1.3 million in our Life Sciences group related to the post-acquisition integration of Paragon Medical into our existing business.
In 2017, we recognized restructuring and integration expense of $0.4 million in our Mobile Solutions group due primarily to the closure of a plant in Wheeling, Illinois, which was a part of our integration plan after the acquisition of Autocam Corporation (“Autocam”) in 2014.
The amount accrued as of December 31, 2019, for restructuring and integration costs represents our expected obligation over the next 1.4 years primarily related to severance and other employee costs. We expect to pay $0.3 million within the next twelve months.
64
Note 16. Commitments and Contingencies
Brazil ICMS Tax Matter
Prior to the acquisition of Autocam in 2014, Autocam’s Brazilian subsidiary (“Autocam Brazil”) received notification from the Brazilian tax authority regarding ICMS (state value added tax or “VAT”) tax credits claimed on intermediary materials (e.g., tooling and perishable items) used in the manufacturing process. The Brazilian tax authority notification disallowed state ICMS tax credits claimed on intermediary materials based on the argument that these items are not intrinsically related to the manufacturing process. Autocam Brazil filed an administrative defense with the Brazilian tax authority arguing, among other matters, that it should qualify for an ICMS tax credit, contending that the intermediary materials are directly related to the manufacturing process.
We believe that we have substantial legal and factual defenses, and we plan to defend our interests in this matter vigorously. The matter encompasses several lawsuits filed with Brazilian courts requesting declaratory actions that no tax is due or seeking a stay of execution on the collection of the tax. In 2018, we obtained a favorable decision in one of the declaratory actions for which the period for appeal has expired. We have filed actions in each court requesting dismissal of the matter based on the earlier court action. Although we anticipate a favorable resolution to all matters, we can provide no assurances that we will be successful in achieving dismissal of all pending cases. While we believe a loss is not probable, we estimate the range of possible losses related to this assessment is from $0 to $6.0 million. No amount was accrued at December 31, 2019, for this matter.
We are entitled to indemnification from the former shareholders of Autocam, subject to the limitations and procedures set forth in the agreement and plan of merger relating to the Autocam acquisition. Management believes the indemnification would include amounts owed for the tax, interest, and penalties related to this matter.
Securities Offering Matter
On November 1, 2019, Erie County Employees’ Retirement System, on behalf of a purported class of plaintiffs, filed a complaint in the Supreme Court of the State of New York, County of New York, against the Company, certain of the Company’s current and former officers and directors, and each of the underwriters involved in the Company’s public offering and sale of 14.4 million shares of its common stock pursuant to a preliminary prospectus supplement, dated September 10, 2018, a final prospectus supplement, dated September 13, 2018, and a base prospectus, dated April 19, 2017, relating to the Company’s effective shelf registration statement on Form S-3 (File No. 333-216737) (the “Offering”), which complaint was amended on January 24, 2020. The complaint alleges violations of Sections 11, 12(a)(2), and 15 of the Securities Act of 1933 in connection with the Offering. The plaintiffs seek to represent a class of stockholders who purchased shares of the Company’s common stock in the Offering. The complaint seeks unspecified monetary damages and other relief. The Company believes the complaint and allegations to be without merit and intends to vigorously defend itself against these actions. The Company is unable at this time to determine whether the outcome of the litigation would have a material impact on the Company’s financial position, results of operations, or cash flows.
All Other Legal Matters
All other legal proceedings are of an ordinary and routine nature and are incidental to our operations. Management believes that such proceedings should not, individually or in the aggregate, have a material adverse effect on our business, financial condition, results of operations, or cash flows. In making that determination, we analyze the facts and circumstances of each case at least quarterly in consultation with our attorneys and determine a range of reasonably possible outcomes.
Note 17. Series B Convertible Preferred Stock and Stockholders' Equity
Series B Convertible Preferred Stock
On December 11, 2019, we issued to affiliates of existing common stockholders in a private placement 0.1 million shares of contingently redeemable Series B convertible preferred stock (“Preferred Stock”), par value of $0.01 per share and at a price of $1,000 per share, together with detachable warrants (the “Warrants”) to purchase up to 1.5 million shares of our common stock at an exercise price of $12.00 per share. The Preferred Stock has a liquidation preference of $1,000 per share; is redeemable at our option in cash (or, under certain circumstances, in stock), subject to the applicable redemption premium; is convertible into a variable number of common shares on certain terms and conditions on or after March 31, 2023; and is subject to certain other rights and obligations. In connection with the issuance of Preferred Stock, we entered into a registration rights agreement with the purchasers to provide certain customary demand registration rights exercisable beginning on March 31, 2021, with respect to their shares of common stock, including those underlying the Preferred Stock and Warrants, shares of Preferred Stock, and the Warrants.
Net cash proceeds of $95.7 million from the issuance of the Preferred Stock were used for debt repayment, fees associated with the amendment and extension of our credit facility, and for general corporate purposes. Preferred Stock shares have limited
65
voting rights and earn cumulative dividends at a rate of 10.625% per year, payable quarterly in arrears if declared, and accrue whether or not earned or declared. If a Preferred Stock dividend is declared by the Board of Directors, then it will be paid in cash. Additionally, holders of Preferred Stock participate in any dividends paid on shares of NN’s common stock on an as-converted basis at a fixed conversion rate. If our common stockholders do not approve a proposal at our 2020 annual stockholder meeting to issue common stock in excess of thresholds established by certain Nasdaq stock market rules upon the exercise of Warrants or the conversion or redemption of Preferred Stock, then the annual dividend rate will immediately increase to 11.625% until such time approval is obtained.
Preferred Stock is classified as mezzanine equity, between liabilities and stockholders’ equity because certain features of the Preferred Stock could require redemption of some or all Preferred Stock upon events that are considered not solely within our control, including a leverage ratio threshold and the passage of time. For initial recognition, the Preferred Stock is recognized at a discounted value, net of issuance costs, reflecting allocation to the Warrants on a relative fair value basis and allocation to bifurcated embedded derivatives on a fair value basis. The aggregate discount is amortized as a deemed dividend through December 31, 2023, which is the date the holders have a non-contingent conversion option into a variable number of common shares equal to the liquidation preference plus accrued and unpaid dividends. Deemed dividends adjust retained earnings (or in the absence of retained earnings, additional paid-in capital).
In accordance with ASC 815-15, Derivatives and Hedging - Embedded Derivatives, (“ASC 815-15”) certain features of the Preferred Stock were bifurcated and accounted for separate from the Preferred Stock. The following features are recorded on a combined basis as a single derivative.
• | Leverage ratio put feature. The Preferred Stock includes a redemption option based on a leverage ratio threshold that provides the preferred holder the option to convert the Preferred Stock to a variable number of shares of common stock at a discount to the then fair value of our common stock. The conversion feature is considered a redemption right at a premium which is not clearly and closely related to the debt host. |
• | Contingent dividends. The feature that allows for the dividend rate to increase to 11.625% in 2020 is not considered clearly and closely related to the debt host. |
• | Dividends withholding. The Preferred Stock bears a feature that could require us to make an effective distribution to purchasers which is indexed to the tax rate of the purchasers. This distribution would be partially offset by an adjustment to the redemption price and/or conversion rate. The dividends withholding feature is not clearly and closely related to the debt host. |
As of December 31, 2019, the carrying value of the Preferred Series B shares was $93.0 million which included $0.6 million of accumulated unpaid and deemed dividends. The following table presents the change in the Series B Preferred carrying value during the year ended December 31, 2019.
Year Ended December 31, 2019 | |||
Beginning balance | $ | — | |
Gross proceeds from issuance of shares | 100,000 | ||
Relative fair value of Warrants issued | (1,076 | ) | |
Recognition of bifurcated embedded derivative | (2,295 | ) | |
Allocation of issuance costs to Preferred Stock | (4,259 | ) | |
Accrual of in-kind dividends | 590 | ||
Amortization of discount (deemed dividends) | 52 | ||
Ending balance | $ | 93,012 | |
Common Stock
In September 2018, we issued 14.4 million shares of our common stock in a public offering under our shelf registration statement at a price of $16.00 per share. Net proceeds of $217.3 million were used to repay the Second Lien Facility and a portion of the Senior Secured Revolver.
Warrants
The Warrants are exercisable, in full or in part, at any time prior to December 11, 2026, at an exercise price of $12.00 per share, subject to customary anti-dilution adjustments in the event of future below market issuances, stock splits, stock dividends, combinations or similar events. Unless and until common stockholders approve the issuance of additional common shares upon exercise of the Warrants, the Warrants may not be exercisable. In addition, certain other ownership limitations apply to any holder of a Warrant. The Warrant may be exercised for cash or on a cashless basis, based on an exercise price equal to the
66
closing sale price on the immediately preceding trading day. Warrant holders are entitled to participate in any dividend or other distribution by the Company to holders of shares of its Common Stock, on an as-exercised basis if the Warrant is exercised. The Warrants are classified as equity and recognized in additional paid-in capital based on relative fair value allocation.
The Warrants were valued at issuance using the Black-Scholes method. The valuation at issuance was agreed to by the Preferred Stock holders and the Company, and is specified in the Preferred Stock agreement. Key assumptions relevant to determining the fair value of the Warrants included an expected term of 1.25 years, a risk free interest rate of 1.62%, and expected volatility of 50%.
Note 18. Revenue from Contracts with Customers
Revenue is recognized when control of the good or service is transferred to the customer either at a point in time or, in limited circumstances, as our services are rendered over time. Revenue is measured as the amount of consideration we expect to receive in exchange for transferring goods or services.
The following tables present net sales to external customers by reportable segment.
Year Ended December 31, 2019 | ||||||||||||||||||||
Life Sciences | Mobile Solutions | Power Solutions | Intersegment Sales Eliminations | Total | ||||||||||||||||
United States | $ | 295,690 | $ | 162,445 | $ | 156,945 | $ | (2,130 | ) | $ | 612,950 | |||||||||
China | 7,330 | 38,793 | 6,722 | — | 52,845 | |||||||||||||||
Mexico | 373 | 18,815 | 13,489 | — | 32,677 | |||||||||||||||
Brazil | 3 | 36,058 | 300 | — | 36,361 | |||||||||||||||
Germany | 29,239 | 6,372 | 65 | — | 35,676 | |||||||||||||||
Switzerland | 14,016 | 4,340 | 57 | — | 18,413 | |||||||||||||||
Other | 13,081 | 30,926 | 14,522 | — | 58,529 | |||||||||||||||
Total net sales | $ | 359,732 | $ | 297,749 | $ | 192,100 | $ | (2,130 | ) | $ | 847,451 | |||||||||
Year Ended December 31, 2018 | ||||||||||||||||||||
Life Sciences | Mobile Solutions | Power Solutions | Intersegment Sales Eliminations | Total | ||||||||||||||||
United States | $ | 206,776 | $ | 187,178 | $ | 157,357 | $ | (2,331 | ) | $ | 548,980 | |||||||||
China | 6,130 | 43,610 | 5,537 | — | 55,277 | |||||||||||||||
Mexico | 191 | 27,053 | 12,254 | — | 39,498 | |||||||||||||||
Brazil | 29 | 35,314 | 215 | — | 35,558 | |||||||||||||||
Germany | 19,870 | 5,652 | 26 | — | 25,548 | |||||||||||||||
Switzerland | 6,446 | 5,006 | 54 | — | 11,506 | |||||||||||||||
Other | 8,731 | 31,224 | 14,335 | — | 54,290 | |||||||||||||||
Total net sales | $ | 248,173 | 335,037 | 189,778 | (2,331 | ) | $ | 770,657 | ||||||||||||
Year Ended December 31, 2017 | ||||||||||||||||||||
Life Sciences | Mobile Solutions | Power Solutions | Intersegment Sales Eliminations | Total | ||||||||||||||||
United States | $ | 96,062 | $ | 190,828 | $ | 152,938 | $ | (1,990 | ) | $ | 437,838 | |||||||||
China | 267 | 45,503 | 6,481 | — | 52,251 | |||||||||||||||
Mexico | 78 | 26,639 | 14,220 | — | 40,937 | |||||||||||||||
Brazil | — | 35,425 | 185 | — | 35,610 | |||||||||||||||
Germany | 35 | 5,502 | 11 | — | 5,548 | |||||||||||||||
Switzerland | — | 5,450 | — | — | 5,450 | |||||||||||||||
Other | 1,887 | 27,505 | 12,767 | — | 42,159 | |||||||||||||||
Total net sales | $ | 98,329 | $ | 336,852 | $ | 186,602 | $ | (1,990 | ) | $ | 619,793 | |||||||||
67
Product Sales
We generally transfer control and recognize a sale when we ship the product from our manufacturing facility to our customer, at a point in time, as this is when our customer obtains the ability to direct use of, and obtain substantially all of the remaining benefits from, the goods. We have elected to recognize the cost for freight and shipping when control over products has transferred to the customer as a component of cost of sales.
We use an observable price to determine the stand-alone selling price for separate performance obligations or a cost-plus-margin approach when an observable price is not available. The expected duration of our contracts is one year or less, and we have elected to apply the practical expedient that allows entities to disregard the effects of financing when the contract length is less than one year. The amount of consideration we receive and the revenue we recognize varies with volume rebates and incentives we offer to our customers. We estimate the amount of variable consideration that should be included in the transaction price utilizing the expected value method or the most likely amount method depending on the nature of the variable consideration. Variable consideration is included in the transaction price if, in our judgment, it is probable that a significant future reversal of cumulative revenue under the contract will not occur.
We utilize the portfolio approach practical expedient to evaluate sales-related discounts on a portfolio basis to contracts with similar characteristics. The effect on our financial statements of applying the portfolio approach would not differ materially from applying the new standard to individual contracts.
We give our customers the right to return only defective products in exchange for functioning products or rework of the product. These transactions are evaluated and accounted for under ASC Topic 460, Guarantees, and we estimate the impact to the transaction price based on an analysis of historical experience.
Other Sources of Revenue
We provide pre-production activities related to engineering efforts to develop molds, dies, and machines that are owned by our customers. We may receive advance payments from customers which are deferred until satisfying our performance obligations by compliance with customer-specified milestones, recognizing revenue at a point in time. These contracts generally have an original expected duration of less than one year.
The following table provides information about contract liabilities from contracts with customers.
Deferred Revenue | ||||
Balance at January 1, 2019 | $ | 2,974 | ||
Balance at December 31, 2019 | $ | 4,172 | ||
The timing of revenue recognition, billings, and cash collections results in billed accounts receivable and customer advances and deposits (e.g. contract liability) on the Consolidated Balance Sheets. These contract liabilities are reported on the Consolidated Balance Sheets on a contract-by-contract basis at the end of each reporting period as deferred revenue. Deferred revenue relates to payments received in advance of performance under the contract and recognized as revenue as (or when) we perform under the contract. Changes in the contract liability balances during the year ended December 31, 2019, were not materially impacted by any other factors. Revenue recognized for the year ended December 31, 2019, from amounts included in deferred revenue at the beginning of the period for performance obligations satisfied or partially satisfied during the period was $3.0 million.
Transaction Price Allocated to Future Performance Obligations
We are required to disclose the aggregate amount of transaction price that is allocated to performance obligations that have not yet been satisfied as of December 31, 2019, unless our contracts meet one of the practical expedients. Our contracts met the practical expedient for a performance obligation that is part of a contract that has an original expected duration of one year or less.
Costs to Obtain and Fulfill a Contract
We recognize commissions paid to internal sales personnel that are incremental to obtaining customer contracts as an expense when incurred since the amortization period is less than one year. The judgments made in determining the amount of costs incurred included whether the commissions are in fact incremental and would not have occurred absent the customer contract. Costs to obtain a contract are expensed as selling, general and administrative expense.
Sales, VAT, and other taxes we collect concurrent with revenue-producing activities are excluded from revenue. Incidental items that are immaterial in the context of the contract are recognized as expense.
68
Sales Concentration
For the year ended December 31, 2019, we recognized sales from a single customer of $93.1 million, or 11.0% of consolidated net sales. Revenues from this customer are in our Life Sciences and Power Solutions groups. No customers represented more than 10% of our net sales for the years ended December 31, 2018 and 2017. No customers represented more than 10% of accounts receivable as of December 31, 2019 or 2018.
Note 19. Share-Based Compensation
We recognize compensation expense of all employee and non-employee director share-based compensation awards in the financial statements based upon the grant date fair value of the awards over the requisite service or vesting period, less any expense incurred for estimated forfeitures. As of December 31, 2019, we have 3.6 million maximum shares that can be issued as options, stock appreciation rights, and other share-based awards. Shares of our common stock delivered upon exercise or vesting may consist of newly issued shares of our common stock or shares acquired in the open market.
Share-based compensation expense is recognized in the “Selling, general and administrative expense” line in the Consolidated Statements of Operations and Comprehensive Income (Loss) except for $1.0 million attributable to discontinued operations for the year ended December 31, 2017.
The following table lists the components of share-based compensation expense by type of award.
Year Ended December 31, | ||||||||||||
2019 | 2018 | 2017 | ||||||||||
Stock options | $ | 881 | $ | 678 | $ | 1,078 | ||||||
Restricted stock | 1,897 | 1,630 | 1,968 | |||||||||
Performance share units | 1,155 | 2,076 | 2,450 | |||||||||
Change in estimate of share-based award vesting (1) | (1,111 | ) | (1,968 | ) | — | |||||||
Share-based compensation expense | $ | 2,822 | $ | 2,416 | $ | 5,496 | ||||||
_______________________
(1) Amounts reflect the decrease in share-based compensation expense based on the change in estimate of the probability of vesting of share-based awards.
The total tax benefit for share-based compensation cost was $0.1 million, $0.7 million, and $1.6 million for the years ended December 31, 2019, 2018, and 2017, respectively. Unrecognized compensation cost related to unvested awards was $2.7 million as of December 31, 2019. We expect that cost to be recognized over a weighted-average period of 2.1 years.
Stock Options
Option awards are typically granted to key employees on an annual basis. A single option grant is typically awarded to eligible employees each year by the Compensation Committee of the Board of Directors. The Compensation Committee occasionally awards additional individual grants to eligible employees. All employees are awarded options at an exercise price equal to the closing price of our stock on the date of grant. The term life of options is generally ten years with a vesting period of generally three years.
During the years ended 2019, 2018, and 2017, we granted options to purchase 210,400, 57,800, and 125,700 shares, respectively, to certain key employees. The weighted average grant date fair value of the options granted during 2019, 2018, and 2017 was $2.77, $10.60, and $11.84 per share, respectively. The fair value of our options cannot be determined by market value because they are not traded in an open market. Accordingly, we utilized the Black Scholes financial pricing model to estimate the fair value.
The following table shows the weighted average assumptions relevant to determining the fair value of stock options granted in each year.
2019 | 2018 | 2017 | |||||||
Expected term | 6 years | 6 years | 6 years | ||||||
Average risk-free interest rate | 2.47 | % | 2.66 | % | 2.03 | % | |||
Expected dividend yield | 3.53 | % | 1.15 | % | 1.16 | % | |||
Expected volatility | 49.53 | % | 47.69 | % | 56.56 | % | |||
Expected forfeiture rate | 4.00 | % | 4.00 | % | 3.00 | % | |||
69
The expected term is derived from using the simplified method of determining stock option terms as described under the SAB Topic 14, Share-based payment. The simplified method was used because sufficient historical stock option exercise experience was not available, primarily due to the transformation of the management structure over the past several years.
The average risk-free interest rate is derived from United States Department of Treasury published interest rates of daily yield curves for the same time period as the expected term.
The expected dividend yield is derived by a mathematical formula which uses the expected annual dividends over the expected term divided by the fair market value of our common stock at the grant date.
The expected volatility is derived from our actual common stock historical volatility over the same time period as the expected term. The expected volatility rate is derived by mathematical formula utilizing daily closing price data.
The expected forfeiture rate is determined from examining the historical pre-vesting forfeiture patterns of past option issuances to key employees. While the expected forfeiture rate is not an input of the Black Scholes financial pricing model for determining the fair value of the options, it is an important determinant of stock option compensation expense to be recorded.
The following table summarizes stock option activity for the year ended December 31, 2019.
Number of Options (in thousands) | Weighted- Average Exercise Price (per share) | Weighted- Average Remaining Contractual Term (years) | Aggregate Intrinsic Value | ||||||||||||
Outstanding at January 1, 2019 | 771 | $ | 15.17 | ||||||||||||
Granted | 210 | 7.93 | |||||||||||||
Exercised | (5 | ) | 4.42 | $ | 7 | ||||||||||
Forfeited or expired | (201 | ) | 11.96 | ||||||||||||
Outstanding at December 31, 2019 | 775 | $ | 13.24 | 5.5 | $ | 291 | (1) | ||||||||
Exercisable at December 31, 2019 | 530 | $ | 14.23 | 4.0 | $ | 30 | (1) | ||||||||
_______________________________
(1) | The aggregate intrinsic value is the sum of intrinsic values for each exercisable individual option grant. The intrinsic value is the amount by which the closing market price of our stock at December 31, 2019, was greater than the exercise price of any individual option grant. |
Cash proceeds from the exercise of options in the years ended December 31, 2019, 2018, and 2017 totaled less than $0.1 million, $0.3 million, and $3.1 million, respectively. The tax benefit recognized from stock option exercises was less than $0.1 million, $0.1 million, and $0.2 million in the years ended December 31, 2019, 2018, and 2017, respectively. For the years ended December 31, 2019, 2018, and 2017, proceeds from stock options are presented exclusive of tax benefits in cash flows from financing activities in the Consolidated Statements of Cash Flows. The total intrinsic value of options exercised during the years ended December 31, 2019, 2018, and 2017 was $7 thousand, $0.5 million, and $3.8 million, respectively.
Restricted Stock
During the years ended December 31, 2019, 2018, and 2017, we granted 339,498, 86,516, and 85,393 restricted stock awards to non-executive directors, officers, and certain other key employees. The shares of restricted stock granted during the years ended December 31, 2019, 2018, and 2017, vest pro-rata generally over three years for officers and certain other key employees and over one year for non-executive directors. We determined the fair value of the shares awarded by using the closing price of our common stock as of the date of grant. The weighted average grant date fair value of restricted stock granted in the years ended December 31, 2019, 2018, and 2017, was $7.74, $24.55, and $24.29 per share, respectively. The total grant date fair value of restricted stock that vested in the years ended December 31, 2019, 2018, and 2017, was $2.9 million, $1.8 million, and $2.1 million, respectively.
70
The following table summarizes unvested restricted stock award activity for the year ended December 31, 2019.
Number of Unvested Restricted Shares (in thousands) | Weighted Average Grant Date Fair Value | ||||||
Unvested at January 1, 2019 | 146 | $ | 22.07 | ||||
Granted | 339 | 7.74 | |||||
Vested | (172 | ) | 16.62 | ||||
Forfeited | (91 | ) | 9.98 | ||||
Unvested at December 31, 2019 | 222 | $ | 9.33 | ||||
Performance Share Units
Performance Share Units (“PSUs”) are a form of long-term incentive compensation awarded to executive officers and certain other key employees designed to directly align the interests of employees to the interests of our stockholders, and to create long-term stockholder value. PSUs granted in 2019, 2018 and 2017 were made pursuant to the NN, Inc. 2016 Omnibus Incentive Plan and a Performance Share Unit Agreement (the “2016 Omnibus Agreement”). Some PSUs are based on total shareholder return (“TSR Awards”), and other PSUs are based on return on invested capital (“ROIC Awards”).
The TSR Awards vest, if at all, upon our achieving a specified relative total shareholder return, which will be measured against the total shareholder return of the S&P SmallCap 600 Index during specified performance periods as defined in the 2016 Omnibus Agreement. The ROIC Awards will vest, if at all, upon our achieving a specified average return on invested capital during the performance periods. Each performance period generally begins on January 1 of the year of grant and ends 36 months later on December 31.
We recognize compensation expense over the performance period in which the performance and market conditions are measured. If the PSUs do not vest at the end of the performance periods, then the PSUs will expire automatically. Upon vesting, the PSUs will be settled by the issuance of shares of our common stock, subject to the executive officer’s continued employment. The actual number of shares of common stock to be issued to each award recipient at the end of the performance periods will be interpolated between a threshold and maximum payout amount based on actual performance results. No dividends will be paid on outstanding PSUs during the performance period; however, dividend equivalents will be paid based on the number of shares of common stock that are ultimately earned at the end of the performance periods.
With respect to the TSR Awards, a participant will earn 50% of the target number of PSUs for “Threshold Performance,” 100% of the target number of PSUs for “Target Performance,” and 150% of the target number of PSUs for “Maximum Performance.” With respect to the ROIC Awards, a participant will earn 35% of the target number of PSUs for “Threshold Performance,” 100% of the target number of PSUs for “Target Performance,” and 150% of the target number of PSUs for “Maximum Performance.” For performance levels falling between the values shown below, the percentages will be determined by interpolation.
The following table presents the goals with respect to TSR Awards and ROIC Awards granted in 2019, 2018, and 2017.
TSR Awards: | Threshold Performance (50% of Shares) | Target Performance (100% of Shares) | Maximum Performance (150% of Shares) | |||
2019 grants | 35 | 50 | 75 | |||
2018 grants | 35 | 50 | 75 | |||
2017 grants | 35 | 50 | 75 | |||
ROIC Awards: | Threshold Performance (35% of Shares) | Target Performance (100% of Shares) | Maximum Performance (150% of Shares) | ||||||
2019 grants | 4.7 | % | 5.8 | % | 7.0 | % | |||
2018 grants | 15.5 | % | 18.0 | % | 19.5 | % | |||
2017 grants | 15.0 | % | 17.5 | % | 20.0 | % | |||
We estimate the grant date fair value of TSR Awards using the Monte Carlo simulation model, as the total shareholder return metric is considered a market condition under ASC Topic 718, Compensation – stock compensation. The grant date fair value of ROIC Awards is based on the closing price of a share of our common stock on the date of grant.
71
The following table presents the number of awards granted and the grant date fair value of each award in the periods presented.
TSR Awards | ROIC Awards | |||||||||||||
Award Year | Number of Shares (in thousands) | Grant Date Fair Value (per share) | Number of Shares (in thousands) | Grant Date Fair Value (per share) | ||||||||||
2019 | 136 | $ | 9.28 | 174 | $ | 7.93 | ||||||||
2018 | 55 | $ | 24.65 | 55 | $ | 24.55 | ||||||||
2017 | 46 | $ | 29.84 | 53 | $ | 24.20 | ||||||||
We recognize expense for ROIC Awards based on the probable outcome of the associated performance condition. We generally recognize an expense for ROIC Awards based on the Target Performance threshold of 100% because, at the date of grant, the Target Performance is the probable level of performance achievement. During 2019, none of the ROIC Awards that were granted in 2017 vested because the actual performance achieved was below the “Threshold Performance” level of 15.0%, as defined by the grant agreement. All of the expense related to the 2017 ROIC Awards was reversed during the year ended December 31, 2018, when we recognized a decrease in share-based compensation expense of $0.8 million in the “Selling, general and administrative expense” line in the Consolidated Statements of Operations and Comprehensive Income (Loss). Also during the year ended December 31, 2018, we determined that the probability of performance achievement for ROIC Awards that were granted in 2018 and 2016 diminished to below the “Threshold Performance” level of 15.5%, as defined by the grant agreement, and recognized a decrease in share-based compensation expense of $1.2 million to reflect the change in estimate of the probability of vesting for the 2018 and 2016 ROIC Awards in the “Selling, general and administrative expense” line in the Consolidated Statements of Operations and Comprehensive Income (Loss).
In 2019, we recognized a decrease in share-based compensation expense of $1.1 million in the Selling, general and administrative expense line in the Consolidated Statements of Operations and Comprehensive Income (Loss) to reverse cumulative expense for awards to executives that were forfeited upon termination of employment. Related accrued dividend equivalents of $0.1 million were also reversed in 2019 for awards that are not expected to vest.
The following table summarizes changes in unvested PSUs during the year ended December 31, 2019, and changes during the year then ended.
Nonvested TSR Awards | Nonvested ROIC Awards | |||||||||||||
Number of Shares (in thousands) | Weighted Average Grant Date Fair Value | Number of Shares (in thousands) | Weighted Average Grant Date Fair Value | |||||||||||
Nonvested at January 1, 2019 | 94 | $ | 26.84 | 100 | $ | 24.39 | ||||||||
Granted | 136 | 9.28 | 174 | 7.93 | ||||||||||
Forfeited | (151 | ) | 16.54 | (179 | ) | 14.21 | ||||||||
Expired | (14 | ) | 29.84 | (16 | ) | 24.20 | ||||||||
Nonvested at December 31, 2019 | 65 | $ | 13.27 | 79 | $ | 11.50 | ||||||||
No TSR Awards or ROIC Awards vested in 2019 or 2018 .
72
Note 20. Accumulated Other Comprehensive Income
The components of AOCI are as follows:
Foreign Currency Translation | Interest Rate Swap | Taxes | Accumulated Other Comprehensive Loss | |||||||||||||
Balance at December 31, 2016 | $ | (30,596 | ) | $ | — | $ | — | $ | (30,596 | ) | ||||||
Amounts reclassified from AOCI (1) | (9,243 | ) | — | — | (9,243 | ) | ||||||||||
Current-period other comprehensive income (loss) activity | 22,134 | — | — | 22,134 | ||||||||||||
Balance at December 31, 2017 | (17,705 | ) | — | — | (17,705 | ) | ||||||||||
Current-period other comprehensive income (loss) activity | (13,609 | ) | — | — | (13,609 | ) | ||||||||||
Balance at December 31, 2018 | (31,314 | ) | — | — | (31,314 | ) | ||||||||||
Amounts reclassified from AOCI (2) | — | 1,411 | (327 | ) | 1,084 | |||||||||||
Current-period other comprehensive income (loss) activity | (3,845 | ) | (13,645 | ) | 3,166 | (14,324 | ) | |||||||||
Balance at December 31, 2019 | $ | (35,159 | ) | $ | (12,234 | ) | $ | 2,839 | $ | (44,554 | ) | |||||
_______________________
(1) Amount reflects $9.2 million of foreign currency translation that was reclassified out of AOCI to discontinued operations on the Consolidated Statements of Operations and Comprehensive Income (Loss) in connection with the sale of the PBC Business as discussed in Note 3.
(2) Amount reflects $1.1 million of settlements on the interest rate swap, net of tax, that are reclassified out of AOCI into net income on the Consolidated Statements of Operations and Comprehensive Income (Loss).
Note 21. Net Income (Loss) Per Common Share
In accordance with ASC 260, Earnings Per Share, a company that has participating securities (for example, our Preferred Stock) is required to utilize the two-class method for calculating earnings per share (“EPS”) unless the treasury stock method results in lower EPS. The two-class method is an allocation of earnings between the holders of common stock and a company’s participating securities. Basic EPS is calculated by dividing income or loss attributable to common stockholders by the weighted average number of shares of common stock outstanding. To calculate diluted EPS, basic EPS is further adjusted to include the effect of potentially dilutive stock options, Warrants, and Preferred Stock.
73
The following table summarizes the computation of basic and diluted net income (loss) per common share.
Year Ended December 31, | ||||||||||||
2019 | 2018 | 2017 | ||||||||||
Numerator: | ||||||||||||
Income (loss) from continuing operations | $ | (46,741 | ) | $ | (262,987 | ) | $ | 24,549 | ||||
Income from discontinued operations, net of tax | — | — | 137,688 | |||||||||
Net income (loss) | (46,741 | ) | (262,987 | ) | 162,237 | |||||||
Less: Preferred Stock cumulative dividends and deemed dividends | (642 | ) | — | — | ||||||||
Numerator for basic and diluted net income (loss) per common share (1) | $ | (47,383 | ) | $ | (262,987 | ) | $ | 162,237 | ||||
Denominator: | ||||||||||||
Weighted average common shares outstanding | 42,030 | 31,678 | 27,433 | |||||||||
Effect of dilutive stock options | — | — | 322 | |||||||||
Diluted shares outstanding | 42,030 | 31,678 | 27,755 | |||||||||
Basic income (loss) from continuing operations per common share | $ | (1.13 | ) | $ | (8.30 | ) | $ | 0.89 | ||||
Basic income from discontinued operations per common share | — | — | 5.02 | |||||||||
Basic net income (loss) per common share | $ | (1.13 | ) | $ | (8.30 | ) | $ | 5.91 | ||||
Diluted income (loss) from continuing operations per common share | $ | (1.13 | ) | $ | (8.30 | ) | $ | 0.89 | ||||
Diluted income from discontinued operations per common share | — | — | 4.96 | |||||||||
Diluted net income (loss) per common share | $ | (1.13 | ) | $ | (8.30 | ) | $ | 5.85 | ||||
Cash dividends declared per common share | $ | 0.21 | $ | 0.28 | $ | 0.28 | ||||||
_______________________________
(1) Preferred Stock does not participate in losses.
The following table presents the number of potentially dilutive securities that were excluded from the calculation of diluted income (loss) from continuing operations per common share and diluted net income (loss) per common share because they had an anti-dilutive effect.
Year Ended December 31, | |||||||||
2019 | 2018 | 2017 | |||||||
Options | 577 | 428 | 400 | ||||||
Warrants | 1,500 | — | — | ||||||
Preferred Stock, as-converted | 12,976 | — | — | ||||||
15,053 | 428 | 400 | |||||||
Given the loss from continuing operations in 2019 and 2018, all options and warrants are considered anti-dilutive and were excluded from the calculation of diluted loss from continuing operations per share and diluted net income (loss) per share. Stock options excluded from the calculations of diluted income (loss) from continuing operations per share had a per share exercise price ranging from $8.54 to $25.16 for the year ended December 31, 2019, and $4.42 to $25.16 for each of the years ended December 31, 2018, and 2017. Warrants excluded from the calculation of diluted income (loss) from continuing operations per share for the year ended December 31, 2019, had a per share exercise price of $12.00. Preferred Stock excluded from the calculation of diluted income (loss) from continuing operations per share for the year ended December 31, 2019, was calculated on an as-converted basis. Holders of Preferred Stock will have the right to convert up to 25% of their Preferred Stock into common shares per quarter after December 31, 2023, at a conversion price that equals a 30-day volume weighted average price per common share. Under certain conditions, holders of Preferred Stock may elect to convert their Preferred Stock into common shares at an earlier date after March 31, 2023, at a conversion price that equals 90% of the volume weighted average market price per common share. The potentially dilutive Preferred Stock in the preceding table presents the more dilutive result of these conversion prices as if the Preferred Stock were converted on December 31, 2019.
74
Note 22. Fair Value Measurements
Fair value is an exit price representing the expected amount that an entity would receive to sell an asset or pay to transfer a liability in an orderly transaction with market participants at the measurement date. We followed consistent methods and assumptions to estimate fair values as more fully described in Note 1.
Fair value principles prioritize valuation inputs across three broad levels. Level 1 inputs are quoted prices (unadjusted) in active markets for identical assets or liabilities. Level 2 inputs are quoted prices for similar assets and liabilities in active markets or inputs that are observable for the asset or liability, either directly or indirectly through market corroboration, for substantially the full term of the financial instrument. Level 3 inputs are unobservable inputs based on the assumptions used to measure assets and liabilities at fair value. An asset or liability’s classification within the various levels is determined based on the lowest level input that is significant to the fair value measurement.
Our financial instruments that are subject to fair value disclosure consist of cash and cash equivalents, accounts receivable, accounts payable, derivatives, and long-term debt. As of December 31, 2019, the carrying values of these financial instruments approximated fair value. The fair value of floating-rate debt approximates the carrying amount because the interest rates paid are based on short-term maturities.
Derivative Financial Instruments
As described in Note 17, in connection with the issuance of Preferred Stock in December 2019 and in accordance with ASC 815-15, certain features of the Preferred Stock were bifurcated and accounted for separate from the Preferred Stock. The following features are recorded on a combined basis as a single derivative.
• | Leverage ratio put feature. The Preferred Stock includes a redemption option based on a leverage ratio threshold that provides the preferred holder the option to convert the Preferred Stock to a variable number of shares of common stock at a discount to the then fair value of our common stock. The conversion feature is considered a redemption right at a premium which is not clearly and closely related to the debt host. |
• | Contingent dividends. The feature that allows for the dividend rate to increase to 11.625% in 2020 is not considered clearly and closely related to the debt host. |
• | Dividends withholding. The Preferred Stock bears a feature that could require us to make an effective distribution to purchasers which is indexed to the tax rate of the purchasers. This distribution would be partially offset by an adjustment to the redemption price and/or conversion rate. The dividends withholding feature is not clearly and closely related to the debt host. |
The following table shows the liabilities measured at fair value for the Preferred Stock derivative above as of December 31, 2019.
Fair Value Measurements as of December 31, 2019 | ||||||||||||
Description | Quoted Prices in Active Markets for Identical Assets (Level 1) | Significant Other Observable Inputs (Level 2) | Significant Unobservable Inputs (Level 3) | |||||||||
Derivative liability - other current liabilities | $ | — | $ | — | $ | 60 | ||||||
Derivative liability - other non-current liabilities | — | — | 2,235 | |||||||||
Description | $ | — | $ | — | $ | 2,295 | ||||||
The inputs for determining fair value of the Preferred Stock derivative are classified as Level 3 inputs. Level 3 fair value is based on unobservable inputs based on the best information available. These inputs include probability assessments of how long the Preferred Stock will remain outstanding, whether the leverage ratio threshold will be exceeded, and whether approval is obtained from common stockholders for issuance of common stock upon exercise of the Warrants and conversion or redemption of the Preferred Stock. Inputs also include the percentage of Preferred Stock held by non-U.S. resident holders and the applicable tax withholding rates for those holders.
The following table presents the change in the Preferred Stock derivative during the year ended December 31, 2019.
Year Ended December 31, 2019 | ||||
Beginning balance | $ | — | ||
Issuances | 2,295 | |||
Ending balance | $ | 2,295 | ||
75
Changes in the fair value of the Preferred Stock derivative will be recognized in earnings. There was no change in the fair value from the date of issuance through December 31, 2019.
Cash Flow Hedge
We manage our exposure to fluctuations in interest rates using a mix of fixed and variable rate debt. On February 8, 2019, we entered into a $700.0 million fixed-rate interest rate swap agreement that changed the LIBOR-based portion of the interest rate on a portion of our variable rate debt to a fixed rate of 2.4575% (the “interest rate swap”). The term of the interest rate swap is from the effective date of February 12, 2019, through the termination date of October 19, 2022 (the “interest rate swap term”). The interest rate swap effectively mitigates our exposures to the risks and variability of changes in LIBOR.
The notional amount of the interest rate swap will decrease over the interest rate swap term as follows:
Notional Amount | ||||
February 12, 2019 - December 30, 2020 | $ | 700,000 | ||
December 31, 2020 - December 30, 2021 | 466,667 | |||
December 31, 2021 - October 19, 2022 | 233,333 | |||
The objective of the interest rate swap is to eliminate the variability of cash flows in interest payments on the first $700.0 million of variable rate debt attributable to changes in benchmark one-month LIBOR interest rates. The hedged risk is the interest rate risk exposure to changes in interest payments, attributable to changes in benchmark one-month LIBOR interest rates over the interest rate swap term. If one-month LIBOR is greater than the minimum percentage under the Senior Secured Term Loan, the changes in cash flows of the interest rate swap are expected to exactly offset changes in cash flows of the variable rate debt. The interest rate swap is designated as a cash flow hedge.
As of December 31, 2019, we reported a $9.4 million loss, net of tax, in accumulated other comprehensive income related to the interest rate swap.
The following table shows the liabilities measured at fair value on a recurring basis for the interest rate swap as of December 31, 2019.
Fair Value Measurements as of December 31, 2019 | ||||||||||||
Description | Quoted Prices in Active Markets for Identical Assets (Level 1) | Significant Other Observable Inputs (Level 2) | Significant Unobservable Inputs (Level 3) | |||||||||
Derivative liability - other current liabilities | $ | — | $ | 5,943 | $ | — | ||||||
Derivative liability - other non-current liabilities | — | 6,290 | — | |||||||||
Total | $ | — | $ | 12,233 | $ | — | ||||||
The inputs for determining fair value of the interest rate swap are classified as Level 2 inputs. Level 2 fair value is based on estimates using standard pricing models. These standard pricing models use inputs which are derived from or corroborated by observable market data such as interest rate yield curves, index forward curves, discount curves, and volatility surfaces. Counterparty to this derivative contract is a highly rated financial institution which we believe carries only a minimal risk of nonperformance.
As of December 31, 2018, we had no interest rate swap agreements or other derivative financial instruments outstanding.
Fixed Rate Debt
The fair value of our outstanding fixed-rate debt included in the “International lines of credit and other loans” line item within Note 13 to these Notes to Consolidated Financial Statements was $9.8 million as of December 31, 2019. This fair value represents Level 2 under the three-tier hierarchy described above. The carrying value of this fixed-rate debt was $9.8 million as of December 31, 2019. We had no significant fixed-rate debt outstanding as of December 31, 2018.
76
Note 23. Quarterly Results of Operations (Unaudited)
The following tables present the quarterly results of operations for the years ended December 31, 2019 and 2018.
2019 | First Quarter | Second Quarter | Third Quarter | Fourth Quarter | ||||||||||||
Net sales | $ | 213,256 | $ | 221,666 | $ | 213,897 | $ | 198,632 | ||||||||
Cost of sales (exclusive of depreciation and amortization) | 162,187 | 164,099 | 161,074 | 154,279 | ||||||||||||
Net income (loss) | (19,518 | ) | (7,283 | ) | (5,855 | ) | (14,085 | ) | ||||||||
Comprehensive income (loss) | (22,053 | ) | (15,742 | ) | (17,976 | ) | (4,210 | ) | ||||||||
Basic net income (loss) per common share | $ | (0.47 | ) | $ | (0.17 | ) | $ | (0.14 | ) | $ | (0.35 | ) | ||||
Diluted net income (loss) per common share | $ | (0.47 | ) | $ | (0.17 | ) | $ | (0.14 | ) | $ | (0.35 | ) | ||||
2018 | First Quarter | Second Quarter | Third Quarter | Fourth Quarter | ||||||||||||
Net sales | $ | 168,487 | $ | 197,010 | $ | 205,683 | $ | 199,477 | ||||||||
Cost of sales (exclusive of depreciation and amortization) | 126,160 | 149,588 | 156,510 | 156,923 | ||||||||||||
Net income (loss) | (6,360 | ) | (25,317 | ) | (13,886 | ) | (217,424 | ) | ||||||||
Comprehensive income (loss) | (890 | ) | (40,833 | ) | (18,134 | ) | (216,739 | ) | ||||||||
Basic net income (loss) per common share | $ | (0.23 | ) | $ | (0.91 | ) | $ | (0.48 | ) | $ | (5.18 | ) | ||||
Diluted net income (loss) per common share | $ | (0.23 | ) | $ | (0.91 | ) | $ | (0.48 | ) | $ | (5.18 | ) | ||||
As further described in Note 2, during 2019 we identified misstatements in our previously issued financial statements which we are correcting through the revision of our previously issued financial statements. The effect of the revision on the 2019 and 2018 previously issued unaudited quarterly financial results is presented in the tables below. The revision of our 2019 quarterly financial statements will be effected in connection with the prospective issuance of 2020 quarterly filings on Form 10-Q.
As Originally Reported | Adjustment | As Revised | |||||||||
Third Quarter 2019 | |||||||||||
Net sales | $ | 213,897 | $ | — | $ | 213,897 | |||||
Cost of sales (exclusive of depreciation and amortization) | 160,816 | 258 | 161,074 | ||||||||
Net income (loss) | (5,597 | ) | (258 | ) | (5,855 | ) | |||||
Comprehensive income (loss) | (17,988 | ) | 12 | (17,976 | ) | ||||||
Basic net income (loss) per common share | $ | (0.13 | ) | $ | (0.01 | ) | $ | (0.14 | ) | ||
Diluted net income (loss) per common share | $ | (0.13 | ) | $ | (0.01 | ) | $ | (0.14 | ) | ||
Second Quarter 2019 | |||||||||||
Net sales | $ | 221,666 | $ | — | $ | 221,666 | |||||
Cost of sales (exclusive of depreciation and amortization) | 163,513 | 586 | 164,099 | ||||||||
Net income (loss) | (6,697 | ) | (586 | ) | (7,283 | ) | |||||
Comprehensive income (loss) | (15,093 | ) | (649 | ) | (15,742 | ) | |||||
Basic net income (loss) per common share | $ | (0.16 | ) | $ | (0.01 | ) | $ | (0.17 | ) | ||
Diluted net income (loss) per common share | $ | (0.16 | ) | $ | (0.01 | ) | $ | (0.17 | ) | ||
First Quarter 2019 | |||||||||||
Net sales | $ | 213,256 | $ | — | $ | 213,256 | |||||
Cost of sales (exclusive of depreciation and amortization) | 161,269 | 918 | 162,187 | ||||||||
Net income (loss) | (18,600 | ) | (918 | ) | (19,518 | ) | |||||
Comprehensive income (loss) | (21,194 | ) | (859 | ) | (22,053 | ) | |||||
Basic net income (loss) per common share | $ | (0.44 | ) | $ | (0.03 | ) | $ | (0.47 | ) | ||
Diluted net income (loss) per common share | $ | (0.44 | ) | $ | (0.03 | ) | $ | (0.47 | ) | ||
77
As Originally Reported | Adjustment | As Revised | |||||||||
Fourth Quarter 2018 | |||||||||||
Net sales | $ | 199,477 | $ | — | $ | 199,477 | |||||
Cost of sales (exclusive of depreciation and amortization) | 156,713 | 210 | 156,923 | ||||||||
Net income (loss) | (220,189 | ) | 2,765 | (217,424 | ) | ||||||
Comprehensive income (loss) | (219,560 | ) | 2,821 | (216,739 | ) | ||||||
Basic net income (loss) per common share | $ | (5.25 | ) | $ | 0.07 | $ | (5.18 | ) | |||
Diluted net income (loss) per common share | $ | (5.25 | ) | $ | 0.07 | $ | (5.18 | ) | |||
Third Quarter 2018 | |||||||||||
Net sales | $ | 205,683 | $ | — | $ | 205,683 | |||||
Cost of sales (exclusive of depreciation and amortization) | 156,408 | 102 | 156,510 | ||||||||
Net income (loss) | (13,784 | ) | (102 | ) | (13,886 | ) | |||||
Comprehensive income (loss) | (17,977 | ) | (157 | ) | (18,134 | ) | |||||
Basic net income (loss) per common share | $ | (0.48 | ) | $ | — | $ | (0.48 | ) | |||
Diluted net income (loss) per common share | $ | (0.48 | ) | $ | — | $ | (0.48 | ) | |||
Second Quarter 2018 | |||||||||||
Net sales | $ | 196,349 | $ | 661 | $ | 197,010 | |||||
Cost of sales (exclusive of depreciation and amortization) | 148,640 | 948 | 149,588 | ||||||||
Net income (loss) | (24,511 | ) | (806 | ) | (25,317 | ) | |||||
Comprehensive income (loss) | (40,292 | ) | (541 | ) | (40,833 | ) | |||||
Basic net income (loss) per common share | $ | (0.89 | ) | $ | (0.02 | ) | $ | (0.91 | ) | ||
Diluted net income (loss) per common share | $ | (0.89 | ) | $ | (0.02 | ) | $ | (0.91 | ) | ||
First Quarter 2018 | |||||||||||
Net sales | $ | 169,148 | $ | (661 | ) | $ | 168,487 | ||||
Cost of sales (exclusive of depreciation and amortization) | 126,444 | (284 | ) | 126,160 | |||||||
Net income (loss) | (5,983 | ) | (377 | ) | (6,360 | ) | |||||
Comprehensive income (loss) | (518 | ) | (372 | ) | (890 | ) | |||||
Basic net income (loss) per common share | $ | (0.22 | ) | $ | (0.01 | ) | $ | (0.23 | ) | ||
Diluted net income (loss) per common share | $ | (0.22 | ) | $ | (0.01 | ) | $ | (0.23 | ) | ||
Item 9. | Changes in and Disagreements with Accountants on Accounting and Financial Disclosure |
None.
Item 9A. | Controls and Procedures |
Disclosure Controls and Procedures
Under the supervision and with the participation of management, including our Chief Executive Officer and Chief Financial Officer, we evaluated the effectiveness of disclosure controls and procedures (as defined in Rules 13a-15(e) and 15d-15(e) of the Securities Exchange Act of 1934, as amended (the “Exchange Act”)). Based upon that evaluation, as a result of the material weaknesses in internal control over financial reporting described below, our Chief Executive Officer and Chief Financial Officer concluded that our disclosure controls and procedures were not effective as of December 31, 2019, to ensure that information required to be disclosed in the reports that we file or submit under the Exchange Act is recorded, processed, summarized, and reported within the time periods specified in the SEC’s rules and forms, and that such information is accumulated and communicated to management, including the Chief Executive Officer and Chief Financial Officer, as appropriate, to allow for timely decisions regarding required disclosure.
Management’s Report on Internal Control Over Financial Reporting
The management of NN, Inc. is responsible for establishing and maintaining adequate internal control over financial reporting, as such term is defined in Exchange Act Rule 13a-15(f). Because of its inherent limitations, internal control over financial
78
reporting may not prevent or detect misstatements. Also, projections of any evaluation of effectiveness to future periods are subject to the risk that controls may become inadequate because of changes in conditions, or that the degree of compliance with the policies or procedures may deteriorate.
Management, under the supervision and with the participation of the Chief Executive Officer and Chief Financial Officer, conducted an evaluation of the effectiveness of our internal control over financial reporting as of December 31, 2019, based on the criteria described in Internal Control – Integrated Framework (2013) issued by the Committee of Sponsoring Organizations of the Treadway Commission (“COSO”).
A material weakness is a deficiency, or a combination of deficiencies, in internal control over financial reporting, such that there is a reasonable possibility that a material misstatement of our annual or interim financial statements would not be prevented or detected on a timely basis.
Management has identified the following control deficiencies that constitute material weaknesses in our internal control over financial reporting as of December 31, 2019:
• | We did not maintain an effective control environment due to a lack of a sufficient complement of personnel with an appropriate level of knowledge, experience and training commensurate with our financial reporting requirements. This material weakness resulted in immaterial misstatements to income tax receivable; other current assets; property, plant and equipment, net; goodwill; investment in joint venture; other non-current assets; accounts payable; accrued salaries, wages and benefits; other current liabilities; deferred tax liabilities; other non-current liabilities; additional paid in capital; accumulated deficit; accumulated other comprehensive income (loss); selling, general and administrative expense; depreciation and amortization; other operating expense/income; write-off of unamortized debt issuance costs; provision/benefit for income taxes; comprehensive income/loss; and cash flows in our consolidated financial statements for the interim and annual periods in the years ended December 31, 2019, 2018 and 2017, and prior periods. |
• | We did not design and maintain effective monitoring controls over our Paragon Medical business. Specifically, we did not maintain personnel and systems that were sufficient to ensure the adequate monitoring of control activities for certain processes. This material weakness did not result in a material misstatement to the financial statements. |
These material weaknesses contributed to the material weaknesses described below:
• | We did not design and maintain effective internal controls over the accounting for transactions in the revenue and receivables business process within our Paragon Medical business to determine whether the transactions occurred and were complete and accurate. This material weakness did not result in a material misstatement to the interim or annual consolidated financial statements. |
• | We did not design and maintain effective controls over certain information technology (“IT”) general controls within our Paragon Medical business for information systems that are relevant to the preparation of our financial statements. Specifically, we did not design and maintain: (i) program change management controls to ensure that IT program and data changes affecting financial IT applications and underlying accounting records are identified, tested, authorized, and implemented appropriately; (ii) user access controls to ensure appropriate segregation of duties and that adequately restrict user and privileged access to certain financial applications, programs, and data to appropriate Company personnel; and (iii) computer operations controls to ensure that critical batch jobs are monitored and data backups are authorized and monitored. |
These IT deficiencies did not result in a material misstatement to the financial statements; however, the deficiencies, when aggregated, could impact the effectiveness of IT-dependent controls (such as automated controls that address the risk of material misstatement to one or more assertions, along with the IT controls and underlying data that support the effectiveness of system-generated data and reports) that could result in misstatements potentially impacting all financial statement accounts and disclosures that would not be prevented or detected. Accordingly, management has determined these deficiencies in the aggregate constitute a material weakness.
We did not maintain effective control activities at one of our smaller foreign subsidiaries. Specifically, certain employees at one of our smaller foreign subsidiaries intentionally did not operate the controls related to inventory quantities as designed that resulted in the creation of unsupported physical inventory counts and inventory quantity adjustments. This material weakness resulted in a revision to inventories, cost of sales, and accumulated other comprehensive income/loss within previously issued financial statements for the interim and annual periods in the years ended December 31, 2019, 2018, and 2017.
Additionally, these material weaknesses could result in misstatements of substantially all accounts and disclosures that would result in a material misstatement to the annual or interim consolidated financial statements that would not be prevented or detected.
79
Because of these material weaknesses, management concluded that the Company did not maintain effective internal control over financial reporting as of December 31, 2019.
The effectiveness of the Company’s internal control over financial reporting as of December 31, 2019 has been audited by PricewaterhouseCoopers LLP, an independent registered public accounting firm, as stated in their report, which is included in “Item 8. Financial Statements and Supplementary Data” of this Filing.
Status of Remediation Efforts for Material Weaknesses
In response to the identified material weaknesses, our management, with the oversight of the Audit Committee of our board of directors, has dedicated significant resources and efforts to improve our control environment and has taken immediate action to remediate the material weaknesses identified. While certain remedial actions have been completed, we continue to actively plan for and implement additional control procedures. The remediation efforts outlined below are intended both to address the identified material weaknesses and to enhance our overall financial control environment.
Remediation Plan for Previously Reported Material Weakness - Control Environment
• | As we reported in prior periods, we have hired qualified professionals for critical roles within our finance department. We are also enhancing and installing new processes, controls, and systems to strengthen our internal control over financial reporting. After we integrate these professionals into our control environment and operate any new controls for a sufficient time period, we expect that the remediation of this material weakness will be completed. |
Remediation Plan for New Material Weaknesses
• | We are in the process of reorganizing our finance and IT teams within our Paragon Medical business to ensure management is able to perform ongoing monitoring to ascertain internal controls over financial reporting are designed, implemented, and operating effectively. |
• | We plan to hire personnel within our Paragon Medical business who have technical expertise in internal control over financial reporting. In 2020, we will continue to assess the finance and IT teams within our Paragon Medical business to ensure they have the capacity and capabilities to be successful, including continuing to reinforce our policies and controls and train the finance and IT teams on them. |
• | We plan to provide training to our Mobile Solutions Brazil finance team, specifically relating to inventory count reporting procedures. |
We believe the measures described above will remediate the control deficiencies we have identified and strengthen our internal control over financial reporting. We are committed to continuing to improve our internal control processes and will continue to review, optimize and enhance our financial reporting controls and procedures. As we continue to evaluate and work to improve our internal control over financial reporting, we may determine to take additional measures to address control deficiencies or determine to modify, or in appropriate circumstances not to complete, certain of the remediation measures described above.
Changes in Internal Control Over Financial Reporting
There were no changes in our internal control over financial reporting (as defined in the Exchange Act Rules 13a-15(f) and 15d-15(f)) that occurred during the quarter ended December 31, 2019, that have materially affected, or are reasonably likely to materially affect, our internal control over financial reporting.
Item 9B. | Other Information |
None.
Part III
Item 10. | Directors, Executive Officers and Corporate Governance |
The information required by this Item 10 of Form 10-K concerning our directors is contained in the sections entitled “Information about the Directors and Director Nominees” and “Beneficial Ownership of Common Stock” of our definitive proxy statement to be filed with the Securities and Exchange Commission within 120 days after December 31, 2019, in accordance with General Instruction G to Form 10-K, is hereby incorporated herein by reference.
Our Code of Conduct/Ethics Statement, as amended (the “Code”) is applicable to all officers, directors, and employees. The Code is posted on our website at www.nninc.com. Information contained on our website is not part of this Annual Report. We will satisfy any disclosure requirements under Item 5.05 of Form 8-K regarding an amendment to, or waiver from, any provision of the Code with respect to our principal executive officer, principal financial officer, principal accounting officer,
80
and persons performing similar functions by disclosing the nature of such amendment or waiver on our website or in a Current Report on Form 8-K.
Item 11. | Executive Compensation |
The information required by Item 11 of Form 10-K is contained in the sections entitled “Information about the Directors and the Director Nominees — Compensation of Directors” and “Executive Compensation” of our definitive proxy statement and, in accordance with General Instruction G to Form 10-K, is hereby incorporated herein by reference.
Item 12. | Security Ownership of Certain Beneficial Owners and Management and Related Stockholder Matters |
The information required by Item 12 of Form 10-K is contained in the section entitled “Beneficial Ownership of Common Stock” of our definitive proxy statement and, in accordance with General Instruction G to Form 10-K, is hereby incorporated herein by reference.
Information required by Item 201(d) of Regulation S-K concerning our equity compensation plans is set forth in the table below.
Table of Equity Compensation Plan Information (in thousands, except per share data) | ||||||||||
Plan Category | Number of securities to be issued upon exercise of outstanding options, warrants, and rights (a) | Weighted-average exercise price of outstanding options, warrants, and rights (b) | Number of securities remaining available for future issuance under equity compensation plans (excluding securities reflected in column (a)) (c) | |||||||
Equity compensation plans approved by security holders | 775 | $ | 13.24 | 3,635 | ||||||
Equity compensation plans not approved by security holders | — | — | — | |||||||
Total | 775 | $ | 13.24 | 3,635 | ||||||
Item 13. | Certain Relationships and Related Transactions, and Director Independence |
The information required by this Item 13 of Form 10-K regarding review, approval, or ratification of transactions with related persons is contained in the section entitled “Certain Relationships and Related Transactions” of our definitive proxy statement and, in accordance with General Instruction G to Form 10-K, is hereby incorporated herein by reference.
The information required by this Item 13 of Form 10-K regarding director independence is contained in the section entitled “Information about the Directors and the Director Nominees” of our definitive proxy statement and, in accordance with General Instruction G to Form 10-K, is hereby incorporated herein by reference.
Item 14. | Principal Accounting Fees and Services |
The information required by this Item 14 of Form 10-K concerning our accounting fees and services is contained in the section entitled “Fees Paid to Registered Independent Public Accounting Firm” of our definitive proxy statement and, in accordance with General Instruction G to Form 10-K, is hereby incorporated herein by reference.
81
Part IV
Item 15. | Exhibits, Financial Statement Schedules |
(a) Documents Filed as Part of this Report
1. Financial Statements
The financial statements of NN, Inc. filed as part of this Annual Report on Form 10-K begin on the following pages hereof:
Page | |
2. Financial Statement Schedules
The required information is reflected in the Notes to Consolidated Financial Statements within Item 8.
3. Exhibits
The required information is reflected in the Index to Exhibits (attached hereto).
(b) Exhibits: See Index to Exhibits (attached hereto).
NN, Inc. will provide without charge to any person, upon the written request of such person, a copy of any of the Exhibits to this Form 10-K.
(c) Not Applicable
Item 16. | Form 10-K Summary |
None.
82
INDEX TO EXHIBITS
Incorporation by Reference | ||||||||||
Exhibit Number | Exhibit Description | Form | SEC File No. | Exhibit | Filing Date | |||||
2.1 | 8-K | 000-23486 | 2.1 | July 22, 2014 | ||||||
2.2 | 8-K | 000-23486 | 2.1 | August 18, 2015 | ||||||
2.3 | 8-K | 000-23486 | 2.1 | July 10, 2017 | ||||||
2.4 | 8-K | 000-23486 | 2.1 | April 3, 2018 | ||||||
3.1 | S-3 | 333-89950 | 3.1 | June 6, 2002 | ||||||
3.2 | 8-K | 000-23486 | 3.1 | May 20, 2019 | ||||||
3.3 | 8-K | 000-23486 | 3.2 | May 20, 2019 | ||||||
3.4 | 8-K | 000-23486 | 3.1 | December 18, 2008 | ||||||
3.5 | 8-K | 000-23486 | 3.1 | December 11, 2019 | ||||||
3.6 | 8-K | 000-23486 | 3.1 | November 20, 2015 | ||||||
3.7 | 8-K | 000-23486 | 3.3 | May 20, 2019 | ||||||
4.1 | S-3 | 333-89950 | 4.1 | June 6, 2002 | ||||||
4.2 | 8-K | 000-23486 | 4.1 | September 2, 2014 | ||||||
4.3 | 8-K | 000-23486 | 4.1 | October 20, 2015 | ||||||
4.4 | 8-K | 000-23486 | 10.2 | October 20, 2015 | ||||||
4.5 | 8-K | 000-23486 | 4.3 | October 20, 2015 | ||||||
4.6 | 8-K | 000-23486 | 4.1 | December 11, 2019 | ||||||
4.7# | ||||||||||
10.1* | S-8 | 333-130395 | 4.1 | December 16, 2005 | ||||||
83
10.2* | DEF14A | 000-23486 | Appendix A | April 1, 2016 | ||||||
10.3* | S-3/A | 333-89950 | 10.6 | July 15, 2002 | ||||||
10.4* | 10-K | 000-23486 | 10.16 | March 31, 1999 | ||||||
10.6* | 8-K | 000-23486 | 10.3 | September 18, 2012 | ||||||
10.7* | 8-K | 000-23486 | 10.6 | September 18, 2012 | ||||||
10.8* | 8-K | 000-23486 | 10.1 | May 10, 2013 | ||||||
10.9 | 8-K | 000-23486 | 10.3 | September 2, 2014 | ||||||
10.10 | 8-K | 000-23486 | 10.4 | September 2, 2014 | ||||||
10.11* | 10-K | 000-23486 | 10.27 | March 16, 2015 | ||||||
10.12 | 8-K | 000-23486 | 10.1 | June 10, 2016 | ||||||
10.13 | 8-K | 000-23486 | 10.1 | October 3, 2016 | ||||||
10.14 | 8-K | 000-23486 | 10.1 | November 4, 2016 | ||||||
10.15 | DEF14A | 000-23486 | Appendix A | November 10, 2016 | ||||||
10.16 | 10-K | 000-23486 | 10.18 | March 16, 2017 | ||||||
10.17 | 10-K | 000-23486 | 10.19 | March 16, 2017 | ||||||
10.18 | 10-K | 000-23486 | 10.20 | March 16, 2017 | ||||||
84
10.19 | 10-K | 000-23486 | 10.21 | March 16, 2017 | ||||||
10.20* | 10-Q | 000-23486 | 10.2 | May 4, 2017 | ||||||
10.21 | 8-K | 000-23486 | 10.1 | April 4, 2017 | ||||||
10.22 | 8-K | 000-23486 | 10.1 | August 18, 2017 | ||||||
10.23 | 8-K | 000-23486 | 10.1 | November 24, 2017 | ||||||
10.24* | 8-K | 000-23486 | 10.1 | January 5, 2018 | ||||||
10.25 | 8-K | 000-23486 | 10.2 | April 4, 2017 | ||||||
10.26 | 8-K | 000-23486 | 10.1 | April 3, 2018 | ||||||
10.27 | 8-K | 000-23486 | 10.1 | May 7, 2018 | ||||||
10.28 | 8-K | 000-23486 | 10.1 | December 26, 2018 | ||||||
10.29 | 8-K | 000-23486 | 10.1 | February 26, 2019 | ||||||
10.30 | 8-K | 000-23486 | 10.1 | March 18, 2019 | ||||||
10.31* | DEF14A | 000-23486 | Appendix C | April 8, 2019 | ||||||
85
10.32* | 10-Q | 000-23486 | 10.1 | May 10, 2019 | ||||||
10.33* | 10-Q | 000-23486 | 10.2 | May 10, 2019 | ||||||
10.34 | 8-K | 000-23486 | 10.1 | June 12, 2019 | ||||||
10.35* | 8-K | 000-23486 | 10.1 | July 15, 2019 | ||||||
10.36* | 10-Q | 000-23486 | 10.4 | August 9, 2019 | ||||||
10.37* | 10-Q | 000-23486 | 10.5 | August 9, 2019 | ||||||
10.38* | 10-Q | 000-23486 | 10.6 | August 9, 2019 | ||||||
10.39* | 10-Q | 000-23486 | 10.7 | August 9, 2019 | ||||||
10.40* | 8-K | 000-23486 | 10.1 | August 27, 2019 | ||||||
10.41* | 8-K | 000-23486 | 10.2 | August 27, 2019 | ||||||
10.42* | 8-K | 000-23486 | 10.1 | September 16, 2019 | ||||||
10.43* | 8-K | 000-23486 | 10.1 | September 24, 2019 | ||||||
10.44* | 8-K | 000-23486 | 10.1 | November 25, 2019 | ||||||
10.45 | 8-K | 000-23486 | 10.1 | December 11, 2019 | ||||||
10.46 | 8-K | 000-23486 | 10.2 | December 11, 2019 | ||||||
10.47 | 8-K | 000-23486 | 10.1 | December 19, 2019 | ||||||
10.48 | 8-K | 000-23486 | 10.1 | February 20, 2020 | ||||||
21.1# | ||||||||||
23.1# | ||||||||||
86
31.1# | ||||||||||
31.2# | ||||||||||
32.1## | ||||||||||
32.2## | ||||||||||
101.INS# | XBRL Instance Document | |||||||||
101.SCH# | XBRL Taxonomy Extension Service | |||||||||
101.CAL# | Taxonomy Calculation Linkbase | |||||||||
101LAB# | XBRL Taxonomy Label Linkbase | |||||||||
101.PRE# | XBRL Presentation Linkbase Document | |||||||||
101.DEF# | XBRL Definition Linkbase Document | |||||||||
* | Management contract or compensatory plan or arrangement. |
# | Filed herewith |
## | Furnished herewith |
87
SIGNATURES
Pursuant to the requirements of Section 13 or 15(d) of the Securities Exchange Act of 1934, the registrant has duly caused this report to be signed on its behalf by the undersigned, thereunto duly authorized.
NN, Inc. | ||
By: | /s/ WARREN A. VELTMAN | |
Warren A. Veltman | ||
President, Chief Executive Officer, and Director | ||
Dated: March 16, 2020
Pursuant to the requirements of the Securities Exchange Act of 1934, this report has been signed below by the following persons on behalf of the registrant and in the capacities and on the dates indicated.
Name and Signature | Title | Date | ||
/s/ WARREN A. VELTMAN Warren A. Veltman | President, Chief Executive Officer, and Director (Principal Executive Officer) | March 16, 2020 | ||
/s/ THOMAS D. DEBYLE Thomas D. DeByle | Senior Vice President- Chief Financial Officer (Principal Financial Officer) | March 16, 2020 | ||
/s/ MICHAEL C. FELCHER Michael C. Felcher | Vice President- Chief Accounting Officer (Principal Accounting Officer) | March 16, 2020 | ||
/s/ ROBERT E. BRUNNER Robert E. Brunner | Non-Executive Chairman, Director | March 16, 2020 | ||
/s/ RAYNARD D. BENVENUTI Raynard D. Benvenuti | Director | March 16, 2020 | ||
/s/ CHRISTINA E. CARROLL Christina E. Carroll | Director | March 16, 2020 | ||
/s/ DAVID K. FLOYD David K. Floyd | Director | March 16, 2020 | ||
/s/ JERI J. HARMAN Jeri J. Harman | Director | March 16, 2020 | ||
/s/ DAVID L. PUGH David L. Pugh | Director | March 16, 2020 | ||
/s/ STEVEN T. WARSHAW Steven T. Warshaw | Director | March 16, 2020 | ||
/s/ TOM H. WILSON, JR. Tom H. Wilson, Jr. | Director | March 16, 2020 | ||
88