Attached files
| file | filename |
|---|---|
| EX-99.1 - EX-99.1 - NN INC | d287773dex991.htm |
| EX-32.2 - EX-32.2 - NN INC | d287773dex322.htm |
| EX-32.1 - EX-32.1 - NN INC | d287773dex321.htm |
| EX-31.2 - EX-31.2 - NN INC | d287773dex312.htm |
| EX-31.1 - EX-31.1 - NN INC | d287773dex311.htm |
| EX-23.2 - EX-23.2 - NN INC | d287773dex232.htm |
| EX-23.1 - EX-23.1 - NN INC | d287773dex231.htm |
| EX-21.1 - EX-21.1 - NN INC | d287773dex211.htm |
| EX-12.1 - EX-12.1 - NN INC | d287773dex121.htm |
| EX-10.21 - EX-10.21 - NN INC | d287773dex1021.htm |
| EX-10.20 - EX-10.20 - NN INC | d287773dex1020.htm |
| EX-10.19 - EX-10.19 - NN INC | d287773dex1019.htm |
| EX-10.18 - EX-10.18 - NN INC | d287773dex1018.htm |
Table of Contents
UNITED STATES
SECURITIES AND EXCHANGE COMMISSION
Washington, D.C. 20549
FORM 10-K
(Mark One)
| ☒ | ANNUAL REPORT PURSUANT TO SECTION 13 OR 15(d) OF THE SECURITIES EXCHANGE ACT OF 1934 |
For the fiscal year ended December 31, 2016
OR
| ☐ | TRANSITION REPORT PURSUANT TO SECTION 13 OR 15(d) OF THE SECURITIES EXCHANGE ACT OF 1934 |
For the transition period from to
Commission file number 000-23486

NN, INC.
(Exact name of registrant as specified in its charter)
| Delaware | 62-1096725 | |
| (State or other jurisdiction of incorporation or organization) |
(I.R.S. Employer Identification No.) | |
| 207 Mockingbird Lane Johnson City, Tennessee |
37604 | |
| (Address of principal executive offices) | (Zip Code) | |
Registrant’s telephone number, including area code: (423) 434-8300
Securities registered pursuant to Section 12(b) of the Act:
| Title of each class |
Name of each exchange on which registered | |
| Common Stock, par value $0.01 | The NASDAQ Stock Market LLC |
Securities registered pursuant to Section 12(g) of the Act:
None
(Title of class)
Indicate by check mark if the registrant is a well-known seasoned issuer, as defined in Rule 405 of the Securities
Act.
Yes ☐ No ☒
Indicate by check mark if the registrant is not
required to file reports pursuant to Section 13 or Section 15(d) of the Act.
Yes ☐ No ☒
Indicate by check mark whether the registrant (1) has filed all reports required to be filed by Section 13 or 15(d) of the Securities and Exchange Act of 1934 during the preceding 12 months (or for such shorter period that the registrant was required to file such reports), and (2) has been subject to such filing requirements for the past 90 days. Yes ☒ No ☐
Indicate by check mark whether the registrant has
submitted electronically and posted on its corporate Web site, if any, every Interactive Data file required to be submitted and posted pursuant to Rule 405 of Regulation S-T (Section 232.405 of this chapter) during the preceding 12 months (or for
such shorter period that the registrant was required to submit and post such files).
Yes ☒ No ☐
Indicate by check mark if disclosure of delinquent filers pursuant to Item 405 of Regulation S-K is not contained herein, and will not be contained, to the best of registrant’s knowledge, in definitive proxy or information statements incorporated by reference in Part III of this Form 10-K or any amendment to this Form 10-K. ☐
Indicate by check mark whether the registrant is a large accelerated filer, an accelerated filer, a non-accelerated filer or a smaller reporting company. See definition of “large accelerated filer,” “accelerated filer” and “smaller reporting company” in Rule 12b-2 of the Exchange Act. (Check one):
| Large accelerated filer | ☐ | Accelerated filer | ☒ | |||
| Non-accelerated filer | ☐ (Do not check if a smaller reporting company) | Smaller reporting company | ☐ | |||
Indicate by check mark whether the registrant is a shell company (as defined in Rule 12b-2 of the Act). Yes ☐ No ☒
The aggregate market value of the voting stock held by non-affiliates of the registrant at June 30, 2016, based on the closing price on the NASDAQ Stock Market LLC on that date was approximately $379,000,000
The number of shares of the registrant’s common stock outstanding on March 1, 2017 was 27,292,646.
DOCUMENTS INCORPORATED BY REFERENCE
Portions of the Proxy Statement with respect to the 2017 Annual Meeting of Stockholders are incorporated by reference in Part III, Items 10 to 14 of this Annual Report on Form 10-K as indicated herein.
Table of Contents
PART I
Forward-Looking Statements
This Annual Report on Form 10-K contains forward-looking statements that are made pursuant to the safe harbor provisions of the Private Securities Litigation Reform Act of 1995. These statements may discuss goals, intentions and expectations as to future trends, plans, events, results of operations or financial condition, or state other information relating to us, based on current beliefs of management as well as assumptions made by, and information currently available to, management. Forward-looking statements generally will be accompanied by words such as “anticipate,” “believe,” “could,” “estimate,” “expect,” “forecast,” “guidance,” “intend,” “may,” “possible,” “potential,” “predict,” “project” or other similar words, phrases or expressions. Forward-looking statements involve a number of risks and uncertainties that are outside of our control and that may cause actual results to be materially different from such forward-looking statements. Such factors include, among others, general economic conditions and economic conditions in the industrial sector, competitive influences, risks that current customers will commence or increase captive production, risks of capacity underutilization, quality issues, availability of raw materials, currency and other risks associated with international trade, our dependence on certain major customers, the impact of acquisitions and divestitures, unanticipated difficulties integrating acquisitions, and realizing anticipated cost savings and operating efficiencies, risks associated with joint ventures, new laws and governmental regulations, and other risk factors and cautionary statements listed from time to time in our periodic reports filed with the Securities and Exchange Commission. We disclaim any obligation to update any such factors or to publicly announce the result of any revisions to any of the forward-looking statements included herein or therein to reflect future events or developments.
All dollar amounts presented in tables that follow are in thousands (except for share data) unless otherwise indicated.
| Item 1. | Business Overview |
Introduction
NN, Inc. is a diversified industrial company and a leading global manufacturer of high precision bearing components, industrial plastic products and precision metal components to a variety of markets on a global basis. We have 40 manufacturing plants in North America, Western Europe, Eastern Europe, South America and China. As used in this Annual Report on Form 10-K, the terms “NN,” “the Company,” “we,” “our,” or “us” mean NN, Inc. and its subsidiaries.
Our business is aggregated into three reportable segments, the Precision Bearing Components Group, the Precision Engineered Products Group and the Autocam Precision Components Group. Our business segments and acquisition activity are described further below.
Acquisition Activity
2015
On May 29, 2015, we completed the acquisition of Caprock Manufacturing, Inc. and Caprock Enclosures, LLC (collectively referred to as “Caprock”). Caprock was a privately held plastic components supplier located in Lubbock, Texas. Caprock serves multiple end markets; including aerospace, medical and general industrial. The acquisition provided further balancing of our end markets and represented the first step in our strategic plan related to transforming our plastics business. The results of Caprock have been consolidated with NN since the date of acquisition as part of the Precision Engineered Products Group.
On October 19, 2015, we completed the acquisition (the “PEP Acquisition”) of Precision Engineered Products Holdings, Inc. (“PEP”). As a result of the PEP Acquisition, PEP became a wholly owned subsidiary of NN. PEP is a global manufacturer of highly engineered precision customized solutions serving the medical, electrical, automotive and aerospace end markets. PEP combines materials science expertise with advanced engineering and production capabilities to design and manufacture a broad range of high-precision metal and plastic components, assemblies, and finished devices. Following the PEP Acquisition and the divestiture of Delta Rubber Company (described below), we combined the operations of PEP with our Plastics and Rubber Components Group, and renamed the group as the Precision Engineered Products Group.
On November 30, 2015, we completed the divestiture of Delta Rubber Company, a wholly owned subsidiary (“Delta Rubber”). The sale of Delta Rubber was in furtherance of our strategic plan and provided further balance to our portfolio of businesses.
2014
On January 20, 2014, we acquired V-S Industries (“V-S”), a manufacturer of precision metal components with locations in Wheeling, Illinois and Juarez, Mexico. The acquisition of V-S provided us with a broader product offering, allowing for penetration into adjacent markets. V-S’s products serve a variety of industries including electric motors, HVAC, power tools, automotive and medical. V-S’s operations were integrated with the Autocam Precision Components Group.
2
Table of Contents
On June 20, 2014, we acquired RFK Industries (“RFK” or the “Konjic Plant”), a manufacturer of tapered rollers located in Konjic, Bosnia and Herzegovina. RFK’s products are complementary to our existing roller bearing products and broaden our product offerings and allows penetration into adjacent markets. RFK currently exports all of its products to customers serving the European truck, industrial vehicle and railway markets. RFK’s operations were integrated with our Precision Bearing Components Group.
On July 15, 2014, we acquired Chelsea Grinding Company (“Chelsea”), a manufacturer of cylindrical rollers used primarily in the hydraulic pump industry. Following the acquisition of Chelsea, we relocated Chelsea’s operations to our Erwin, Tennessee plant. Chelsea’s operations were integrated with the Precision Bearing Components Group.
On August 29, 2014, we acquired Autocam Corporation (“Autocam”), a manufacturer of high precision metal components serving primarily the automotive and commercial vehicle HVAC and fluid power industries. Based in Kentwood, Michigan, Autocam manufactures and assembles highly complex, system critical components for fuel systems, engines, transmission, power steering and electric motors. Autocam and its subsidiaries employ over 2,100 employees with 15 manufacturing facilities in the U.S., Europe, South America and Asia. With the acquisition of Autocam, we combined our Whirlaway and V-S businesses under the renamed Autocam Precision Components Group.
Corporate Information
We were founded in October 1980 and are incorporated in Delaware. Our principal executive offices are located at 207 Mockingbird Lane, Johnson City, Tennessee, and our telephone number is (423) 434-8300. Our website address is www.nninc.com. Information contained on our website is not part of this Annual Report on Form 10-K. Our Annual Report on Form 10-K, quarterly reports on Form 10-Q, current reports on Form 8-K and related amendments are available via a link to www.sec.gov on our website under “Investor Relations.” Additionally, all required interactive data files pursuant to Item 405 of Regulation S-T are posted on our website.
Business Segments
Net sales, income from operations and assets for each of our business segments is presented in Management’s Discussion and Analysis of Financial Condition Results of Operations and Note 12 of the Notes to the Consolidated Financial Statements. Additional information regarding our three business segments (Precision Bearing Components Group, Precision Engineered Products Group and Autocam Precision Components Group) is presented below.
Precision Bearing Components Group
Within our Precision Bearing Components Group, we manufacture and supply high precision bearing components, consisting of balls, cylindrical rollers, tapered rollers, spherical rollers and metal retainers, for leading bearing and CV-joint manufacturers on a global basis. We are a leading independent manufacturer of precision steel bearing balls and rollers for the North American, European and Asian markets. We offer one of the industry’s most complete lines of commercially available bearing components. We emphasize application-specific engineered products that take advantage of competencies in product design and tight tolerance manufacturing processes. Our customers use our components in fully assembled ball and roller bearings and CV-joints, which serve a wide variety of end markets, including automotive, agricultural, construction, machinery, heavy truck, and rail.
Precision Engineered Products Group
Following the PEP Acquisition, we combined the operations of PEP with our Plastics and Rubber Components Segment. Within our Precision Engineered Products Group, we combine materials science expertise with advanced engineering and production capabilities to design and manufacture a broad range of high-precision metal and plastic components, assemblies, and finished devices for the medical, electrical, automotive and aerospace end markets.
Autocam Precision Components Group
Within our Autocam Precision Components Group, we manufacture highly engineered, difficult-to-manufacture precision metal components and subassemblies for the automotive, HVAC, fluid power and diesel engine end markets. Our entry into the precision metal components market began in 2006 with the acquisition of Whirlaway Corporation. We dramatically expanded the segment in 2014 with the acquisitions of Autocam and V-S. These acquisitions furthered our strategy to diversify our end markets and build upon our core manufacturing competency of high-precision metal machining.
3
Table of Contents
Products
Precision Bearing Components Group
Precision Steel Balls. At our Precision Bearing Components Group facilities (with the exception of our Veenendaal plant), we manufacture and sell high quality, precision steel balls. Our steel balls are used primarily by manufacturers of anti-friction bearings and constant velocity joints where precise spherical, tolerance and surface finish accuracies are required.
Steel Rollers. We manufacture tapered rollers at our Veenendaal, Erwin, and Konjic plants and cylindrical rollers at our Erwin plant. Rollers are an alternative rolling element used instead of balls in anti-friction bearings that typically have heavier loading or different speed requirements. Our roller products are used primarily for applications similar to those of our precision steel ball product line, plus certain non-bearing applications such as hydraulic pumps and motors. Tapered rollers are a component in tapered roller bearings that are used in a variety of applications including automotive gearbox applications, automotive wheel bearings and a wide variety of industrial applications. Most cylindrical rollers are made to specific customer requirements for diameter and length and are used in a variety of industrial applications.
Metal Retainers. We manufacture and sell precision metal retainers for roller bearings used in a wide variety of industrial applications. Retainers are used to separate and space the rolling elements within a fully assembled bearing. We manufacture metal retainers at our Veenendaal plant.
Precision Engineered Products Group
Precision Solutions. We manufacture a variety of components, assemblies and instruments, such as surgical knives, bioresorbable implants, surgical staples, orthopedic system tools, laparoscopic devices, drug delivery devices and catheter components for the medical end market, electrical contacts, connectors, contact assemblies and precision stampings for the electrical control end market, precision components, assemblies and electrical contacts for the automotive end market, and a variety of engineered materials for the aerospace and defense end market, including optical grade plastics, thermally conductive plastics, and titanium, Inconel, magnesium and gold electroplating. At our Lubbock plant, we manufacture and sell precision plastic retainers for ball and roller bearings used in a wide variety of industrial applications. We also manufacture and sell a wide range of specialized plastic products including automotive under-the-hood components, electronic instrument cases and precision electronic connectors and lenses.
Autocam Precision Components Group
Precision Components. We sell a wide range of highly engineered, extremely close tolerance, precision-machined metal components and subassemblies primarily to the consumer transportation, industrial technology, HVAC, fluid power and diesel engine end markets. We have developed an expertise in manufacturing highly complex, system critical components for fuel systems, engines and transmissions, power steering systems and electromechanical motors. This expertise has been gained through investment in technical capabilities, processes and systems, and skilled program management and product launch capabilities.
Research and Development and Product Engineering
Our research and development and product engineering efforts focus on enhancing our existing products and developing patented products, particularly in the medical industry, that can be presented to and sold by our customers. Our Precision Engineered Products Group has developed a portfolio of patented medical products that we manufacture for customers and that are sold under their brand. Our Autocam Precision Products Group engineering team focuses on lowering the cost of manufacturing existing products and developing engineered solutions to improve our customers’ products. Our Precision Bearing Components Group operates two innovation centers, one in the Netherlands for rollers and one in Italy for balls, which focuses on improving the performance of the rolling element, operating life and friction generation and reducing manufacturing costs.
Customers
Our products are supplied primarily to manufacturers for use in a broad range of industrial applications, including automotive, electrical, agricultural, construction, machinery, heavy truck, rail, medical, aerospace and defense, HVAC, fluid power and diesel engines. Our top ten customers account for approximately 48% of our revenue. Sales to each of these top ten customers are made to multiple customer locations and divisions throughout the world. Only one of these customers, AB SKF (“SKF”), had sales levels that were over 10% of total net sales. Sales to various U.S. and foreign divisions of SKF accounted for approximately 13% of net sales in 2016. In 2016, 63% of our products were sold to customers in North America, 21% to customers in Europe, 12% to customers in Asia and the remaining 4% to customers in South America.
We sell our products to most of our largest customers under either sales contracts or agreed upon commercial terms. In general, we pass through material cost fluctuations when incurred to our customers in the form of changes in selling prices. We ordinarily ship our products directly to customers within 60 days, and in many cases, during the same calendar month of the date on which a sales order is placed. Accordingly, we generally have an insignificant amount of open (backlog) orders from customers at month end.
4
Table of Contents
See Note 12 of the Notes to Consolidated Financial Statements and “Management’s Discussion and Analysis of Financial Condition and Results of Operations — Results of Operations” for additional segment financial information.
Sales and Marketing
A primary emphasis of our marketing strategy is to expand key customer relationships by offering high quality, high-precision, application-specific customer solutions with the value of a single supply chain partner for a wide variety of products and components. Due to the technical nature of many of our products, our engineers and manufacturing management personnel also provide technical sales support functions, while internal sales employees handle customer orders and other general sales support activities. Each of our groups use a distinct direct sales force supported by senior segment management and engineering involvement. Our Precision Bearing Components Group marketing strategy focuses on our ability to provide consistent, high quality products that meet the most precise specifications of leading global brands. Our marketing strategy for the Precision Engineered Products Group and the Autocam Precision Components Group is to offer custom manufactured, high quality, precision products to markets with high value-added characteristics at competitive price levels. This strategy focuses on relationships with key customers that require the production of technically difficult parts and assemblies, enabling us to take advantage of our strengths in custom product development, equipment and tool design, component assembly and machining processes.
The following table presents a breakdown of our net sales for fiscal years 2016, 2015 and 2014:
| 2016 | 2015 | 2014 | ||||||||||
| Precision Bearing Components Group |
$ | 248,534 | $ | 261,837 | $ | 278,026 | ||||||
| Percentage of Total Sales |
30 | % | 39 | % | 57 | % | ||||||
| Precision Engineered Products Group |
258,816 | 77,183 | 33,351 | |||||||||
| Percentage of Total Sales |
31 | % | 12 | % | 7 | % | ||||||
| Autocam Precision Components Group |
326,138 | 328,260 | 177,224 | |||||||||
| Percentage of Total Sales |
39 | % | 49 | % | 36 | % | ||||||
|
|
|
|
|
|
|
|||||||
| Total |
$ | 833,488 | $ | 667,280 | $ | 488,601 | ||||||
|
|
|
|
|
|
|
|||||||
| Percentage of Total Sales |
100 | % | 100 | % | 100 | % | ||||||
During 2015, following the PEP Acquisition and the divestiture of Delta Rubber, we combined the operations of PEP with our Plastics and Rubber Components Group, and renamed the segment as the Precision Engineered Products Group. The Precision Engineered Products Group includes the Plastic and Rubber Components Group as presented in our previous filings. Net sales for the fiscal years 2014 solely relate to our former Plastic and Rubber Components Segment.
Employees
As of December 31, 2016, we employed a total of 4,730 full-time employees and 569 full time equivalent temporary workers. Of our total employment, 17% are management/staff/government/statutory employees and 83% are production employees. The employees at the Pinerolo, Veenendaal, Autocam France and Brainin de Mexico plants are unionized. A small group of employees at Lacey Manufacturing Company are also unionized. We believe we have a good working relationship with our employees and the unions that represent them.
5
Table of Contents
Competition
Precision Bearing Components Group
Our Precision Bearing Components Group operates in intensely competitive markets. Our domestic competitors include Hoover Precision Products, Inc., a wholly owned subsidiary of Tsubaki Nakashima Co., LTD., and Amatsuji Steel Ball Manufacturing Company, Ltd. (Japan), a wholly owned division of NSK LTD. In addition, Jiangsu General Ball and Roller Co., LTD (China) (JGBR) has announced plans to open a manufacturing facility in the United States to begin production in early 2017. Our foreign competitors include Tsubaki Nakashima Co., LTD. (Japan) and JGBR. Additionally, we compete with bearing manufacturers’ in-house (captive) production, which represents the majority of total production.
We believe that competition within the Precision Bearing Components Group is based principally on quality, price and the ability to consistently meet customer delivery requirements. Management believes that our competitive strengths are our precision manufacturing capabilities, our wide product assortment, our reputation for consistent quality and reliability, our global manufacturing footprint and the productivity of our workforce.
Precision Engineered Products Group
Our Precision Engineered Products Group also operates in intensely competitive markets. We must compete with numerous companies in each industry market segment. Many of these companies have substantially greater financial resources than we do and many currently offer competing products nationally and internationally.
Our primary competitors in the plastic bearing retainer market are Nakanishi Manufacturing Corporation and Precimold, Inc. Domestically, National Plastics and Sales, Inc., Nypro, Inc., Thermotec, Inc., GW Plastics, Inc., C&J Industries, Inc., and Nyloncraft, Inc., are amongst the largest players in the precision plastic components markets. Our primary competitors in the medical device market are Tecomet, Inc., Lake Region Medical, Inc., and Vention Medical, Inc. Our primary competitors in the electrical market are Deringer-Ney, Inc., Doduco GmbH and Metalor Technologies International. Our primary competitors in the automotive and aerospace market are Interplex Industries, Inc. and Accu-Mold, LLC.
We believe that competition within the plastic injection molding, plastic bearing retainer, precision plastic components, medical device, electrical, automotive and aerospace markets is based principally on quality, price, design capabilities and speed of responsiveness and delivery. Management believes that our competitive strengths are product development, tool design, fabrication, and tight tolerance molding processes. With these strengths, we have built our reputation in the marketplace as a quality producer of technically difficult products.
Autocam Precision Components Group
In the market in which our Autocam Precision Components Group operates, internal production of components by our customers can impact our business as the customers weigh the risk of outsourcing strategically critical components or producing in-house. Our primary outside competitors are Anton Häring KG, A. Berger Holding Gmbh & Co. KG, C&A Tool Engineering, Inc., American Turned Products, Inc., Camcraft, Inc., and A.B. Heller, Inc. We generally win new business on the basis of technical competence and our proven track record of successful product development.
Raw Materials
Precision Bearing Components Group
The primary raw material used in our core ball and roller business of the Precision Bearing Components Group is 52100 Steel, which is high quality chromium steel. Our other steel requirements include metal strip, stainless steel, and type S2 rock bit steel.
The Precision Bearing Components Group businesses purchase substantially all of their 52100 Steel requirements from suppliers in Europe and Japan, and all of their metal strip requirements from European suppliers and traders. We purchase steel on the basis of composition, quality, availability and price. For precision steel balls, the pricing arrangements with our suppliers are typically subject to adjustment every three to six months in North America and contractually adjusted on an annual basis within the European locations for the base steel price and quarterly for surcharge adjustments. If any of our current suppliers were unable to supply 52100 Steel to us, higher costs and/or production interruptions could occur as a result of obtaining 52100 Steel from alternate sources. Our operating results would be negatively affected in the event that North American or European governments impose any significant quotas, tariffs or other duties or restrictions on the import of such steel, if the U.S. dollar decreases in value relative to foreign currencies or if supplies available to us would significantly decrease.
Precision Engineered Products Group
The Precision Engineered Products Group uses a wide variety of metals in various forms, including precious metals like gold, silver, palladium and platinum. Through our diverse network of suppliers, we minimize supplier concentration risk and provide a stable supply of raw materials at competitive pricing. This group also procures resins and metal stampings from several domestic and foreign suppliers.
6
Table of Contents
For the Precision Engineered Products Group, we base purchase decisions on quality, service and price. Generally, we do not enter into written supply contracts with our suppliers or commit to maintain minimum monthly purchases of materials. However, we carefully manage raw material price volatility, particularly with respect to precious metals, through the use of consignment agreements. In effect, we lease the precious metals for our own stock and buy the raw materials on the same day customer shipments are priced, thereby eliminating speculation. In addition, our products with precious metal content are priced with a margin on the raw material cost to further protect against raw material price volatility and to provide incremental profit.
Autocam Precision Components Group
The Autocam Precision Components Group produces products from a wide variety of metals in various forms from various sources located in the North America, Europe and Japan. Basic types include hot rolled steel, cold rolled steel (both carbon and alloy), stainless, extruded aluminum, die cast aluminum, gray and ductile iron castings, hot and cold forgings and mechanical tubing. Some material is purchased directly under contracts, some is consigned by the customer, and some is purchased directly from the steel mills.
In each of our three segments, we have historically been affected by upward price pressure on steel principally due to general increases in global demand. In general, we pass through material cost fluctuations to our customers in the form of changes in selling price.
Patents, Trademarks and Licenses
Historically, we have not owned any U.S. or foreign patents, trademarks or licenses that are material to our business; however, in our Precision Engineered Products Group, we have six U.S. patents, four patent applications and trademarks for various trade names. Furthermore, we intend to develop patented products that can be presented to and sold by our customers.
Additionally, we rely on certain data and processes, including trade secrets and know-how, and the success of our business depends, to some extent, on such information remaining confidential. Each executive officer is subject to a non-competition and confidentiality agreement that seeks to protect this information. Additionally, all employees are subject to company code of ethics policies that prohibit the disclosure of information critical to the operations of our business.
Seasonal Nature of Business
General economic conditions impact our business and financial results, and certain of our businesses experience seasonal and other trends related to the industries and end markets that they serve. For example, European sales are often weaker in the summer months, medical device sales are often stronger in the fourth calendar quarter and sales to OEMs are often stronger immediately preceding and following the launch of new products. However, as a whole, we are not subject to material seasonality.
Environmental Compliance
Our operations and products are subject to extensive federal, state and local regulatory requirements both domestically and abroad relating to pollution control and protection of the environment. These laws and regulations govern, among other things, discharges to air or water, the generation, storage, handling, and use of automotive hazardous materials and the handling and disposal of hazardous waste generated at our facilities. Under such laws and regulations, we are required to obtain permits from governmental authorities for some of our operations. If we violate or fail to comply with these laws, regulations or permits, we could be fined or otherwise sanctioned by regulators. Under some environmental laws and regulations, we could also be held responsible for all the costs relating to any contamination at our past or present facilities and at third-party waste disposal sites. We maintain a compliance program to assist in preventing and, if necessary, correcting environmental problems. In the Precision Bearing Components Group, the Kysucke plant, the Veenendaal plant, the Pinerolo plant and Kunshan plant are ISO 14000 or 14001 certified and all received the EPD (Environmental Product Declaration), except for the Veenendaal plant’s stamped metal parts business.
Based on information compiled to date, management believes that our current operations are in substantial compliance with applicable environmental laws and regulations, the violation of which could have a material adverse effect on our business and financial condition. We have assessed conditional asset retirement obligations and have found them to be immaterial to the consolidated financial statements. We cannot assure that currently unknown matters, new laws and regulations, or stricter interpretations of existing laws and regulations will not materially affect our business or operations in the future. More specifically, although we believe that we dispose of waste in material compliance with applicable environmental laws and regulations, we cannot be certain that we will not incur significant liabilities in the future in connection with the clean-up of waste disposal sites.
FDA Compliance
As a contract manufacturer of medical devices, certain of our subsidiaries, including PEP, are required to register as such with the U.S. Food and Drug Administration (“FDA”). Each of our facilities that manufacture finished medical devices is registered with the FDA. To maintain our registration, we deploy a robust quality management system across all of our manufacturing facilities.
7
Table of Contents
With respect to medical products that we are specifically developing to sell to our customers, before these devices can be marketed, we will seek to obtain a marketing clearance from the FDA under Section 510(k) of the United States Federal Food, Drug, and Cosmetic Act. The FDA typically grants a 510(k) clearance if the applicant can establish that the device is substantially equivalent to a predicate device. Clearance under Section 510(k) typically takes about three months from the date of submission.
Executive Officers of the Registrant
Our executive officers are:
| Name |
Age |
Position | ||
| Richard D. Holder | 54 | Chief Executive Officer and President | ||
| J. Robert Atkinson | 36 | Vice President, Corporate Treasurer and Manager of Investor Relations | ||
| Thomas C. Burwell, Jr. | 48 | Senior Vice President – Chief Financial Officer | ||
| Matthew S. Heiter | 56 | Senior Vice President and General Counsel | ||
| L. Jeffery Manzagol | 61 | Senior Vice President – General Manager of the Precision Bearing Components Group | ||
| John A. Manzi | 52 | Senior Vice President – General Manager, Precision Engineered Products Group | ||
| Warren Veltman | 55 | Senior Vice President – General Manager Autocam Precision Components Group | ||
| James R. Widders | 60 | Senior Vice President – Integration and Corporate Transformation |
Set forth below is certain additional information with respect to each of our executive officers.
Richard D. Holder joined us as President and Chief Executive Officer in June 2013. Prior to joining us, Mr. Holder served as President of Eaton Electrical Components Group of Eaton Corporation’s Electrical Sector from 2010 to 2013, Executive Vice President of the Eaton Business Systems from 2007 to 2010, Vice President and General Manager of the Power Distribution and Assemblies Division from 2004 to 2006 and Vice President Supply Chain and Operational Excellence from 2001 to 2004. Prior to joining Eaton, Mr. Holder served as Director of Aircraft & Technical Purchasing for US Airways from 1999 to 2001. Prior to this position, Mr. Holder held a variety of leadership positions at Allied Signal Corporation, an aerospace, automotive and engineering company, and Parker Hannifin Corporation, a global motion and control technology manufacturer.
J. Robert Atkinson joined us as Vice President, Corporate Treasurer and Manager of Investor Relations in 2014. Prior to joining us, Mr. Atkinson was with Regions Bank, one of the nation’s largest full-service providers of consumer and commercial banking, wealth management, mortgage, and insurance products and services. He most recently served as vice president and commercial relationship manager in Regions Corporate Bank Group, where he was responsible for marquee corporate relationships, developing treasury management solutions and negotiating terms and conditions for new and renewal credit facilities. Prior to that position, he served as Vice President of business services. Mr. Atkinson also served as a project coordinator for the Electrical Group of Eaton Corporation. Mr. Atkinson is a member of the Association of Financial Professions and earned his certified treasury professional designation.
Thomas C. Burwell, Jr. joined us as Corporate Controller in September 2005. He was promoted to Vice President Chief Accounting Officer and Corporate Controller in 2011, and to Senior Vice President and Chief Financial Officer in November 2016. Prior to joining NN, Mr. Burwell held various positions at Coats, PLC from 1997 to 2005 ultimately becoming the Vice President of Finance for the U.S. Industrial Division. From 1992 to 1997, Mr. Burwell held various positions at the international accounting firm BDO Seidman, LLP. Mr. Burwell is a Certified Public Accountant.
Matthew S. Heiter joined us as Senior Vice President and General Counsel in July 2015. Prior to joining us, Mr. Heiter was a shareholder in the law firm of Baker, Donelson, Bearman, Caldwell and Berkowitz, PC from May 1996 to December 1999 and from July 2002 to July 2015, where he served as chairman of the firm’s Securities and Corporate Governance Practice Group. From January 2000 to July 2002, Mr. Heiter served as the Executive Vice President, General Counsel and Secretary of Internet Pictures Corporation, a publicly traded internet technology company.
L. Jeffery Manzagol joined us as Senior Vice President—General Manager of the Precision Bearing Components Group in October 2014. Manzagol stepped into his role with more than 36 years of metal bearings and high precision manufacturing experience. He most recently served as President of the Bearings Division at Kaydon Corporation. Previously, Manzagol held various leadership positions at SKF Group, including President and General Manager at the Armada, Michigan facility.
John Manzi joined us as Senior Vice President—General Manager of Precision Engineered Products Group in October 2015 in connection with the completion of the PEP Acquisition. Previously, Mr. Manzi served as the President and Chief Executive Officer of PEP. Mr. Manzi was instrumental in leading PEP’s development and, together with PEP’s management team, has successfully enhanced PEP’s end market reach, expanded its product breadth and executed on key strategic acquisitions. Mr. Manzi has 20 years of experience with PEP. Prior to joining PEP’s management team, Mr. Manzi held various positions including President of PEP’s Attleboro operations, Vice President of Operations, and Engineering Manager.
8
Table of Contents
Warren Veltman joined us as Senior Vice President and General Manager of our Autocam Precision Components Group in September 2014. Veltman served as Chief Financial Officer of Autocam Corporation from 1990 and Secretary and Treasurer since 1991. Prior to Mr. Veltman’s service at Autocam, Mr. Veltman was an Audit Manager with Deloitte & Touche LLP.
James R. Widders was appointed us as Senior Vice President of Integration and Corporate Transformation in September 2014. Prior to that appointment, Mr. Widders was Vice President and General Manager of our then-named Metal Bearing Components Group beginning in December 2010. Mr. Widders had 13 years of service at Whirlaway prior to its acquisition by NN. Prior to joining us, he served as Vice President and General Manager at Technifab, Inc. a manufacturer of molded foam components for the Aerospace industry and in various management positions with GE Superabrasives, a division of General Electric.
| Item 1A. | Risk Factors |
The following are risk factors that affect our business, prospects, financial condition, results of operations, and cash flows, some of which are beyond our control. These risk factors should be considered in connection with evaluating the forward-looking statements contained in this Annual Report on Form 10-K. If any of the events described below were to actually occur, our business, prospects, financial condition, results of operations, or cash flows could be adversely affected and results could differ materially from expected and historical results.
Risks Related to Our Operations
A recession impacting our end markets or the geographic regions in which we or our customers operate could have a material adverse effect on our ability to finance our operations and implement our growth strategy.
During the three month period ended December 31, 2008 and the year ended December 31, 2009, we experienced a sudden and significant reduction in customer orders driven by reductions in automotive and industrial end market demand across all our businesses. Additionally, during the latter part of 2011 and all of 2012, we experienced the impacts of a European recession in our European businesses. Prior to this time, we had never been affected by a recession that had impacted both of our key geographic markets of the U.S. and Europe simultaneously. If we are impacted by a global recession in the future, this could have a material adverse effect on our business, prospects, financial condition, results of operations, or cash flows and could lead to additional restructuring and/or impairment charges being incurred and our ability to implement our growth strategy.
The cyclical demand for our products and the seasonality impact on our production could adversely affect our revenues.
The end markets for fully assembled bearings and industrial and automotive components are cyclical and tend to decline in response to overall declines in industrial and automotive production. As a result, the market for the bearing components and precision metal and industrial plastic products we sell is also cyclical and impacted by overall levels of industrial and automotive production. Our sales have been, and can be in the future, negatively affected by adverse conditions in the industrial and/or automotive production sectors of the economy or by adverse global or national economic conditions generally. Similarly, any inflation in oil prices and any resulting increase in gasoline prices could have a negative impact on demand for our products as a result of consumer and corporate spending reductions.
In addition, seasonality may have a negative impact on our production. Due to the typical slower summer manufacturing season in Europe, we expect that revenues in the third fiscal quarter of each year will be lower than in the other quarters of the year.
We depend on a very limited number of sources for our primary raw material and are subject to risks of shortages and price fluctuation.
The steel that we use to manufacture our precision bearing components is of an extremely high quality and is available from only a limited number of producers on a global basis. Due to quality constraints in the U.S. steel industry, we obtain substantially all of the steel used in our U.S. operations of our Precision Bearing Components Group from non-U.S. suppliers. In addition, we obtain most of the steel used in our European operations from a single European source. If we had to obtain steel from sources other than our current suppliers, we could face higher prices and automotive costs, increased duties or taxes and shortages of steel. Problems in obtaining steel, particularly 52100 chrome steel in the quantities that we require, on commercially reasonable terms, could increase our costs and have a material adverse effect on our business, prospects, financial condition, results of operations, or cash flows.
9
Table of Contents
We depend heavily on a relatively limited number of customers, and the loss of any major customer would have a material adverse effect on our business.
Sales to various U.S. and foreign divisions of SKF, one of the largest bearing manufacturers in the world, accounted for approximately 13% of consolidated net sales in 2016. No other customers accounted for more than 10% of sales. During 2016, sales to various U.S. and foreign divisions of our ten largest customers accounted for approximately 48% of our consolidated net sales. The loss of all or a substantial portion of sales to these customers would cause us to lose a substantial portion of our revenue and would lower our operating profit margin and cash flows from operations.
Work stoppages or similar difficulties could significantly disrupt our operations, reduce our revenues and materially affect our earnings.
A work stoppage at one or more of our facilities could have a material adverse effect on our business, prospects, financial condition, results of operations, or cash flows. Also, if one or more of our customers were to experience a work stoppage, that customer would likely halt or limit purchases of our products, which could have a material adverse effect on our business, prospects, financial condition, results of operations, or cash flows.
We operate in and sell products to customers outside the U.S. and are subject to several risks related to doing business internationally.
Because we obtain a majority of our raw materials from overseas suppliers, actively participate in overseas manufacturing operations and sell to a large number of international customers, we face risks associated with the following:
| • | changes in tariff regulations, which may make our products more costly to export or import; |
| • | changes in monetary and fiscal policies, laws and regulations, and other activities of governments, agencies and similar organizations; |
| • | Recessions or marked declines specific to a particular country or region; |
| • | the potential imposition of trade restrictions or prohibitions; |
| • | a U.S. federal tax code that discourages the repatriation of funds to the U.S.; |
| • | the potential imposition of import or other duties or taxes; |
| • | difficulties establishing and maintaining relationships with local original equipment manufacturers, distributors and dealers; |
| • | difficulty in staffing and managing geographically diverse operations; and |
| • | unstable governments or legal systems in countries in which our suppliers, manufacturing operations, and customers are located. |
These and other risks may also increase the relative price of our products compared to those manufactured in other countries, thereby reducing the demand for our products in the markets in which we operate, which could have a material adverse effect on our business, prospects, financial condition, results of operations, or cash flows.
In addition, we could be adversely affected by violations of the Foreign Corrupt Practices Act (the “FCPA”) and similar worldwide anti-bribery laws, as well as export controls and economic sanction laws. The FCPA and similar anti-bribery laws in other jurisdictions generally prohibit companies and their intermediaries from making improper payments to non-U.S. officials for the purpose of obtaining or retaining business. Our policies mandate compliance with these laws. We operate in many parts of the world that have experienced governmental corruption to some degree and, in certain circumstances, strict compliance with anti-bribery laws may conflict with local customs and practices. We cannot assure you that our internal controls and procedures will always protect us from the improper acts committed by our employees or agents. If we are found to be liable for FCPA, export control or sanction violations, we could suffer from criminal or civil penalties or other sanctions, including loss of export privileges or authorization needed to conduct aspects of our international business, which could have a material adverse effect on our business, prospects, financial condition, results of operations, or cash flows.
10
Table of Contents
Failure of our products could result in a product recall.
The majority of our products are components of our customers’ products that are used in the automotive industry and other critical industrial applications. A failure of our components could lead to a product recall. If a recall were to happen as a result of our components failing, we could bear a substantial part of the cost of correction. In addition to the cost of fixing the parts affected by the component, a recall could result in the loss of a portion of or all of the customer’s business. A successful product recall claim requiring that we bear a substantial part of the cost of correction or the loss of a key customer could have a material adverse effect on our business, prospects, financial condition, results of operations, or cash flows.
Our growth strategy depends in part on companies outsourcing critical components, and if outsourcing does not continue, our business could be adversely affected.
Our growth strategy depends in part on major customers continuing to outsource components and expanding the number of components being outsourced. This requires manufacturers to depart significantly from their traditional methods of operations. If major customers do not continue to expand outsourcing efforts or determine to reduce their use of outsourcing, our ability to grow our business could be materially adversely affected.
Our markets are highly competitive, and many of our competitors have significant advantages that could adversely affect our business.
We face substantial competition in the sale of electrical, medical and aerospace and defense products. In addition, the global markets for precision bearing components and precision metal and plastic components are highly competitive, with a majority of production represented by the captive production operations of large manufacturers. Captive manufacturers make components for internal use and for sale to third parties. All of the captive manufacturers, and many of our independent competitors, are significantly larger and have greater resources than we do. Our competitors are continuously exploring and implementing improvements in technology and manufacturing processes in order to improve product quality, and our ability to remain competitive will depend, among other things, on whether we are able to keep pace with such quality improvements in a cost effective manner. Due to this competitiveness, we may not be able to increase prices for our products to cover cost increases. In many cases we face pressure from our customers to reduce prices, which could adversely affect our business, prospects, financial condition, results of operations, or cash flows. In addition, our customers may choose to purchase products from one of our competitors rather than pay the prices we seek for our products, which could adversely affect our business, prospects, financial condition, results of operations, or cash flows.
Our production capacity has been expanded geographically in recent years to operate in the same markets as our customers.
We have expanded our precision bearing components production facilities and capacity over the last several years. Historically, precision bearing component production facilities have not always operated at full capacity. Over the past several years, we have undertaken steps to address a portion of the capacity risk including closing or ceasing operations at certain plants and downsizing employment levels at others. As such, the risk exists that our customers may exit the geographic markets in which our production capacity is located and/or develop vendors in lower cost countries in which we do not have production capacity.
Any loss of key personnel and the inability to attract and retain qualified employees could have a material adverse impact on our operations.
We are dependent on the continued services of key executives and personnel. The departure of our key personnel without adequate replacement could severely disrupt our business operations. Additionally, we need qualified managers and skilled employees with technical and manufacturing industry experience to operate our businesses successfully. From time to time, there may be shortages of skilled labor, which may make it more difficult and expensive for us to attract and retain qualified employees. If we are unable to attract and retain qualified individuals or our costs to do so increase significantly, our operations would be materially adversely affected.
Risks Related to Legal and Regulatory Compliance
Environmental, health and safety laws and regulations impose substantial costs and limitations on our operations, environmental compliance may be more costly than we expect, and any adverse regulatory action may materially adversely affect our business.
We are subject to extensive federal, state, local and foreign environmental, health and safety laws and regulations concerning matters such as air emissions, wastewater discharges, solid and hazardous waste handling and disposal and the investigation and remediation of contamination. The risks of substantial costs, liabilities and limitations on our operations related to compliance with these laws and regulations are an inherent part of our business, and future conditions may develop, arise or be discovered that create substantial environmental compliance or remediation liabilities and costs.
11
Table of Contents
Compliance with environmental, health and safety legislation and regulatory requirements may prove to be more limiting and costly than we anticipate. To date, we have committed significant expenditures in our efforts to achieve and maintain compliance with these requirements at our facilities, and we expect that we will continue to make significant expenditures related to such compliance in the future. From time to time, we may be subject to legal proceedings brought by private parties or governmental authorities with respect to environmental matters, including matters involving alleged noncompliance with or liability under environmental, health and safety laws, property damage or personal injury. New laws and regulations, including those which may relate to emissions of greenhouse gases, stricter enforcement of existing laws and regulations, the discovery of previously unknown contamination or the imposition of new clean-up requirements could require us to incur costs or become the basis for new or increased liabilities that could have a material adverse effect on our business, prospects, financial condition, results of operations, or cash flows.
Our medical devices are subject to regulation by numerous government agencies, including the FDA and comparable agencies outside the U.S. To varying degrees, each of these agencies requires us to comply with laws and regulations governing the development, testing, manufacturing, labeling, marketing and distribution of our medical devices. We cannot guarantee that we will be able to obtain marketing clearance for our new products or enhancements or modifications to existing products. If such approval is obtained, it may:
| • | take a significant amount of time; |
| • | require the expenditure of substantial resources; |
| • | involve stringent clinical and pre-clinical testing, as well as increased post-market surveillance; |
| • | involve modifications, repairs or replacements of our products; and |
| • | result in limitations on the proposed uses of our products. |
Both before and after a product is commercially released, we have ongoing responsibilities under FDA regulations. We are also subject to periodic inspections by the FDA to determine compliance with the FDA’s requirements, including primarily the quality system regulations and medical device reporting regulations. The results of these inspections can include inspectional observations on FDA’s Form-483, warning letters, or other forms of enforcement. Since 2009, the FDA has significantly increased its oversight of companies subject to its regulations, including medical device companies, by hiring new investigators and stepping up inspections of manufacturing facilities. The FDA has also significantly increased the number of warning letters issued to companies. If the FDA were to conclude that we are not in compliance with applicable laws or regulations, or that any of our medical devices are ineffective or pose an unreasonable health risk, the FDA could ban such medical devices, detain or seize adulterated or misbranded medical devices, order a recall, repair, replacement or refund of such devices, refuse to grant pending pre-market approval applications or require certificates of foreign governments for exports, and/or require us to notify health professionals and others that the devices present unreasonable risks of substantial harm to the public health. The FDA may also impose operating restrictions on a company-wide basis, enjoin and/or restrain certain conduct resulting in violations of applicable law pertaining to medical devices, and assess civil or criminal penalties against our officers, employees, or us. The FDA may also recommend prosecution to the Department of Justice. Any adverse regulatory action, depending on its magnitude, may restrict us from effectively marketing and selling our products.
Foreign governmental regulations have become increasingly stringent and more common, and we may become subject to more rigorous regulation by foreign governmental authorities in the future. Penalties for a company’s non-compliance with foreign governmental regulation could be severe, including revocation or suspension of a company’s business license and criminal sanctions. Any domestic or foreign governmental law or regulation imposed in the future may have a material adverse effect on us.
Recent developments relating to the United Kingdom’s referendum vote in favor of leaving the European Union could adversely affect us.
The United Kingdom held a referendum in June 2016 in which a majority voted for the United Kingdom’s withdrawal from the European Union. As a result of this vote, negotiations are expected to commence to determine the terms of the United Kingdom’s withdrawal from (“Brexit”) the European Union as well as its relationship with the European Union going forward, including the terms of trade between the United Kingdom and the European Union. The effects of Brexit have been and are expected to continue to be far-reaching. Brexit, and the perceptions as to its impact, may adversely affect business activity and economic conditions in Europe and globally and could continue to contribute to instability in global financial and foreign exchange markets. The full effects of Brexit are uncertain and will depend on any agreements the United Kingdom may make to retain access to European Union markets. Lastly, as a result of the Brexit, other countries in the European Union may seek to conduct referenda with respect to their continuing membership with the European Union. Given these possibilities and others we may not anticipate, as well as the lack of comparable precedent, the full extent to which our business, prospects, financial condition, results of operations, or cash flows could be adversely affected by Brexit is uncertain.
12
Table of Contents
Changes in legislation, regulation and government policy as a result of the 2016 U.S. presidential and congressional elections may have a material adverse effect on our business in the future.
The recent presidential and congressional elections in the United States could result in significant changes in, and uncertainty with respect to, legislation, regulation and government policy directly affecting our business or indirectly affecting us because of impacts on our customers and suppliers. Legislative and regulatory proposals discussed during and after the election that could have a material direct or indirect impact on us include, but are not limited to, a disallowance of the deduction for net interest expense, a tax on existing unrepatriated foreign earnings, restrictions on imports and exports, modifications to international trade policy, including withdrawal from trade agreements, environmental regulation, changes to immigration policy, changes to health insurance legislation and the imposition of tariffs and other taxes on imports. We are currently unable to predict whether such changes will occur and, if so, the ultimate impact on our business. To the extent that such changes have a negative impact on us, our suppliers or our customers, including as a result of related uncertainty, these changes may materially and adversely impact our business, prospects, financial condition, results of operations, or cash flows.
We have identified material weaknesses in our internal control over financial reporting which could, if not remediated, result in material misstatements in our financial statements.
Our management is responsible for establishing and maintaining adequate internal control over financial reporting as defined in Rule 13a-15(f) under the Exchange Act. As disclosed in Item 9A, management identified certain material weaknesses in our internal control over financial reporting. Because of these material weaknesses, our management concluded that we did not maintain effective internal control over financial reporting as of December 31, 2016. With the oversight of senior management and the audit committee, we have begun taking steps to remediate the underlying cause of these material weaknesses and improve the design of controls.
While we expect to take the measures necessary to address the underlying causes of these material weaknesses, we cannot at this time estimate how long it will take and our efforts may not prove to be successful in remediating these material weaknesses. While we have not incurred and do not expect to incur material expenses specifically related to the remediation of these material weaknesses, actual expenses may exceed our current estimates and overall costs of compiling the system and processing documentation necessary to assess the effectiveness of our internal control over financial reporting may be material.
If we are unable to successfully remediate these material weaknesses in our internal control over financial reporting, or identify any additional material weaknesses that may exist, the accuracy and timing of our financial reporting may be adversely affected, we may be unable to maintain compliance with securities law requirements regarding timely filing of periodic reports in addition to applicable stock exchange listing requirements, and our stock price may decline materially as a result, all of which could have a material adverse effect on our business, prospects, financial condition, results of operations, or cash flows.
Risks Related to Our Capitalization
Our indebtedness could adversely affect our business, prospects, financial condition, results of operations, or cash flows.
As of December 31, 2016, we had approximately $826 million of indebtedness outstanding, and had an additional $104.6 million available for borrowing under our debt agreements. Our high degree of leverage could have important consequences, including:
| • | increasing our vulnerability to adverse economic, industry, or competitive developments; |
| • | requiring a substantial portion of our cash flows from operations to be dedicated to the payment of principal and interest on our indebtedness, therefore reducing our ability to use our cash flows to fund operations, capital expenditures, and future business opportunities; |
| • | exposing us to the risk of increased interest rates, which could cause our debt service obligations to increase significantly; |
| • | making it more difficult for us to satisfy our obligations with respect to our indebtedness, and any failure to comply with the obligations of any of our debt instruments, including restrictive covenants and borrowing conditions, could result in an event of default under our debt agreements; |
| • | restricting us from making strategic acquisitions or causing us to make non-strategic divestitures; |
| • | limiting our ability to obtain additional financing for working capital, capital expenditures, product and service development, debt service requirements, acquisitions, and general corporate or other purposes; and |
| • | limiting our flexibility in planning for, or reacting to, changes in our business or market conditions and placing us at a competitive disadvantage compared to our competitors who are less highly leveraged and who, therefore, may be able to take advantage of opportunities that our leverage may prevent us from exploiting. |
If any one of these events were to occur, our business, prospects, financial condition, results of operations, or cash flows could be materially and adversely affected. For more information regarding our indebtedness, please see “Management’s Discussion and Analysis of Financial Condition and Results of Operations — Liquidity and Capital Resources.”
Despite our high indebtedness level, we will still be able to incur substantial additional amounts of debt, which could further exacerbate the risks associated with our substantial indebtedness.
We and our subsidiaries may be able to incur substantial additional indebtedness in the future. Although our debt agreements contain restrictions on the incurrence of additional indebtedness, these restrictions are subject to a number of significant qualifications and exceptions, and under certain circumstances, the amount of indebtedness that could be incurred in compliance with these restrictions could be substantial. If new debt is added to our and our subsidiaries’ debt levels, the related risks that we now face could increase.
Our debt agreements contain restrictions that will limit our flexibility in operating our business.
Our debt agreements contain various incurrence covenants that limit our ability to engage in specified types of transactions. These incurrence covenants will limit our ability to, among other things:
| • | incur additional indebtedness or issue certain preferred equity; |
| • | pay dividends on, repurchase, or make distributions in respect of our capital stock, prepay, redeem, or repurchase certain debt or make other restricted payments; |
13
Table of Contents
| • | make certain investments and acquisitions; |
| • | create certain liens; |
| • | enter into agreements restricting our subsidiaries’ ability to pay dividends to us; |
| • | consolidate, merge, sell or otherwise dispose of all or substantially all of our assets; |
| • | alter our existing businesses; and |
| • | enter into certain transactions with our affiliates. |
In addition, the incurrence covenants in our debt agreements require us to meet specified financial ratios and satisfy other financial condition tests. Our ability to meet those financial ratios and tests will depend on our ongoing financial and operating performance, which, in turn, will be subject to economic conditions and to financial, market, and competitive factors, many of which are beyond our control. A breach of any of these covenants could result in a default under one or more of our debt agreements, and permit our lenders to cease making loans to us under our credit facilities. Furthermore, if we were unable to repay the amounts due and payable under our secured debt agreements, our secured lenders could proceed against the collateral granted to them to secure our borrowings. Such actions by the lenders could also cause cross defaults under our other debt agreements.
We may not be able to generate sufficient cash to service all of our indebtedness, and we may not be able to refinance our debt obligations as they mature.
Our ability to make scheduled payments on or to refinance our debt obligations depends on our financial condition and operating performance, which is subject to prevailing economic and competitive conditions and to certain financial, business and other factors beyond our control. We may not be able to maintain a level of cash flows from operating activities sufficient to permit us to pay the principal, premium, if any, and interest on our indebtedness.
As our debt obligations mature or if our cash flows and capital resources are insufficient to fund our debt service obligations, we may be forced to reduce or delay investments and capital expenditures, or to sell assets, seek additional capital, or restructure or refinance our indebtedness. Our ability to restructure or refinance our debt will depend on the condition of the capital markets and our financial condition at such time. Any refinancing of our debt could be at higher interest rates and may require us to comply with more onerous covenants, which could further restrict our business operations. The terms of our existing or future debt instruments may restrict us from adopting some of these alternatives. In addition, any failure to make payments of interest and principal on our outstanding indebtedness on a timely basis would likely result in a reduction of our credit rating, which could harm our ability to incur additional indebtedness. These alternative measures may not be successful and may not permit us to meet our scheduled debt service obligations.
We have international operations that are subject to foreign economic uncertainties and foreign currency fluctuation.
Approximately 34% of our revenues are denominated in foreign currencies, which may result in additional risk of fluctuating currency values and exchange rates and controls on currency exchange. Changes in the value of foreign currencies could increase our U.S. dollar costs for, or reduce our U.S. dollar revenues from, our foreign operations. Any increased costs or reduced revenues as a result of foreign currency fluctuations could affect our profits. In 2016, the U.S. dollar continued to strengthen compared to the euro, which adversely affected our revenue by $5.4 million. Further strengthening of the U.S. dollar may adversely affect our business, prospects, financial condition, results of operations, or cash flows.
The price of our common stock may be volatile.
The market price of our common stock could be subject to significant fluctuations and may decline. Among the factors that could affect our stock price are:
| • | macro or micro-economic factors; |
| • | our operating and financial performance and prospects; |
| • | quarterly variations in the rate of growth of our financial indicators, such as earnings per share, net income and revenues; |
| • | changes in revenue or earnings estimates or publication of research reports by analysts; |
14
Table of Contents
| • | loss of any member of our senior management team; |
| • | speculation in the press or investment community; |
| • | strategic actions by us or our competitors, such as acquisitions or restructuring; |
| • | sales of our common stock by stockholders; |
| • | general market conditions; |
| • | domestic and international economic, legal and regulatory factors unrelated to our performance; |
| • | loss of a major customer; and |
| • | the declaration and payment of a dividend. |
The stock markets in general have experienced extreme volatility that has often been unrelated to the operating performance of particular companies. These broad market fluctuations may adversely affect the trading price of our common stock. In addition, due to the market capitalization of our stock, our stock tends to be more volatile than large capitalization stocks that comprise the Dow Jones Industrial Average or Standard and Poor’s 500 Index.
Provisions in our charter documents and Delaware law may inhibit a takeover, which could adversely affect the value of our common stock.
Our certificate of incorporation and bylaws, as well as Delaware corporate law, contain provisions that could delay or prevent a change of control or changes in our management that a stockholder might consider favorable and may prevent shareholders from receiving a takeover premium for their shares. These provisions include, for example, a classified board of directors and the authorization of our board of directors to issue up to five million preferred shares without a stockholder vote. In addition, our certificate of incorporation provides that stockholders may not call a special meeting.
We are a Delaware corporation subject to the provisions of Section 203 of the Delaware General Corporation Law, an anti-takeover law. Generally, this statute prohibits a publicly-held Delaware corporation from engaging in a business combination with an interested stockholder for a period of three years after the date of the transaction in which such person became an interested stockholder, unless the business combination is approved in a prescribed manner. A business combination includes a merger, asset sale or other transaction resulting in a financial benefit to the stockholder. We anticipate that the provisions of Section 203 may encourage parties interested in acquiring us to negotiate in advance with our board of directors, because the stockholder approval requirement would be avoided if a majority of the directors then in office approve either the business combination or the transaction that results in the stockholder becoming an interested stockholder.
These provisions apply even if the offer may be considered beneficial by some of our stockholders. If a change of control or change in management is delayed or prevented, the market price of our common stock could decline.
Risks Related to Acquisitions and Divestitures
Acquisitions may constitute an important part of our future growth strategy.
Acquiring businesses that complement or expand our operations has been and may continue to be a key element of our business strategy. We cannot assure you that we will be successful in identifying attractive acquisition candidates or completing acquisitions on favorable terms in the future. In addition, we may borrow funds to acquire other businesses, increasing our interest expense and debt levels. Our inability to acquire businesses, or to operate them profitably once acquired, could have a material adverse effect on our business, financial position, results of operations and cash flows. Our borrowing agreements limit our ability to complete acquisitions without prior approval of our lenders.
We may not realize all of the anticipated benefits from acquired companies or any future strategic portfolio acquisition, or those benefits may take longer to realize than expected.
We may not realize all of the anticipated benefits from acquired companies or any future strategic portfolio acquisition, or those benefits may take longer to realize than expected. Achieving those benefits depends on the timely, efficient and successful execution of a number of post-acquisition events, including integrating the acquired businesses into our existing businesses. The integration process may disrupt the businesses and, if implemented ineffectively, would preclude realization of the full benefits expected. The difficulties of combining the operations of acquired companies include, among others:
15
Table of Contents
| • | the diversion of management’s attention to integration matters; |
| • | difficulties in the integration of operations and systems, including, without limitation, the complexities associated with managing the expanded operations of a significantly larger and more complex company, addressing possible differences in corporate cultures and management philosophies and the challenge of integrating complex systems, technology, networks and other assets of each of the acquired companies; |
| • | difficulties in achieving anticipated cost savings, synergies, business opportunities and growth prospects from combining the acquired businesses with our own; |
| • | the inability to implement effective internal controls, procedures and policies for acquired businesses as required by the Sarbanes-Oxley Act of 2002 within the time periods prescribed thereby; |
| • | the exposure to potential unknown liabilities and unforeseen increased expenses or delays associated with acquired businesses; |
| • | challenges in keeping existing customers and obtaining new customers; |
| • | challenges in attracting and retaining key personnel; and |
| • | the disruption of, or the loss of momentum in, ongoing operations or inconsistencies in standards, controls, procedures and policies. |
Many of these factors will be outside of our control and any one of them could result in increased costs, decreases in the amount of expected revenues and diversion of management’s time and energy, which could materially impact our business, prospects, financial condition, results of operations, or cash flows.
Additionally, we incurred a significant amount of debt in connection with our acquisitions in the past few years. Finally, in relation to such acquisitions, we have significantly higher amounts of intangible assets, including goodwill. These intangible assets will be subject to impairment testing, and we could incur a significant impact to our financial statements in the form of an impairment if assumptions and expectations related to our acquisitions are not realized.
We have and will continue to incur expenses in relation to our acquisitions and the integration of our acquired companies.
We have and will continue to incur expenses in relation to our acquisitions and the integration of our acquired companies. While we have assumed that a certain level of expenses will be incurred, there are many factors beyond our control that could affect the total amount or the timing of the integration expenses. Moreover, many of the expenses that will be incurred are, by their nature, difficult to estimate accurately. These integration expenses may result in us taking charges against earnings, and the amount of any future charges are uncertain at present.
We may be unable to realize the anticipated cost or capital expenditure savings or may incur additional and/or unexpected costs in order to realize them.
There can be no assurance that we will be able to realize the anticipated cost or capital expenditure savings from our acquisitions in the anticipated amounts or within the anticipated timeframes or at all. We anticipate implementing a series of cost savings initiatives that we expect to result in recurring, annual run-rate cost savings. We expect to incur one-time, non-recurring costs to achieve such synergies, including certain costs during 2015 and 2016. These or any other cost or capital expenditure savings that we realize may differ materially from our estimates. We cannot provide assurances that these anticipated savings will be achieved or that our programs and improvements will be completed as anticipated or at all. In addition, any cost savings that we realize may be offset, in whole or in part, by reductions in revenues or through increases in other expenses.
Our projections and assumptions related to cost savings are based on our current estimates, but they involve risks, uncertainties, projections and other factors that may cause actual results, performance or achievements to be materially different from any future results, performance or achievements, express or implied. Neither our independent auditors nor any other independent auditors, have examined, compiled or performed any procedures with respect to these projections, nor have they expressed any opinion, or any other form of assurance on such information or their achievability. Assumptions relating to our projections involve subjective decisions and judgments with respect to, among other things, the estimated impact of certain operational adjustments, including Six Sigma/OpEx optimization programs, product grouping and rationalization, facility rationalization and shared services cost savings and other cost and savings adjustments, as well as future economic, competitive, industry and market conditions and future business decisions, all of which are inherently uncertain and may be beyond the control of our management.
16
Table of Contents
Failure to realize the expected costs savings and operating synergies related to our acquisitions could result in increased costs and have an adverse effect on our business, prospects, financial condition, results of operations, or cash flows.
Our future results could suffer if we cannot effectively manage our expanded operations, which are significantly larger and more complex following our acquisitions.
As a result of our acquisitions over the past few years, the size and scope of our operations were significantly increased. Our future success depends, in part, upon our ability to manage the expanded operations, which will pose challenges for management, including challenges related to the management and monitoring of new operations and associated increased costs and complexity. We may not have the expertise, experience and resources to pursue or successfully operate all of our businesses at once. The administration of our businesses requires implementation and oversight of appropriate operations, management, compliance and financial reporting systems and controls. We may experience difficulties in effectively implementing and overseeing these and other systems. Such implementation and initial oversight will require the focused attention of our management team, including a significant commitment of its time and resources. The need for management to focus on these matters could have a material and adverse impact on our revenues and operating results. There can be no assurance that we will be successful or that we will realize any operating efficiencies, cost savings, revenue enhancements or other benefits currently anticipated from our acquisitions.
The indemnification provisions of acquisition agreements by which we have acquired companies may not fully protect us and may result in unexpected liabilities.
Certain of the acquisition agreements from past acquisitions require the former owners to indemnify us against certain liabilities related to the operation of each of their companies before we acquired it. In most of these agreements, however, the liability of the former owners is limited in amount and duration and certain former owners may not be able to meet their indemnification responsibilities. These indemnification provisions may not fully protect us, and as a result we may face unexpected liabilities that adversely affect our profitability and financial position.
Our participation in joint ventures could expose us to additional risks from time to time.
We currently have a 49% investment in a Chinese joint venture and may participate in additional joint ventures from time to time. Our participation in joint ventures is subject to risks that may not be present with other methods of ownership, including:
| • | our joint venture partners could have investment and financing goals that are not consistent with our objectives, including the timing, terms and strategies for any investments, and what levels of debt to incur or carry; |
| • | we could experience an impasse on certain decisions because we do not have sole decision-making authority, which could require us to expend additional resources on resolving such impasses or potential disputes, including litigation or arbitration; |
| • | our ability to transfer our interest in a joint venture to a third party may be restricted and the market for our interest may be limited; |
| • | our joint venture partners might become bankrupt, fail to fund their share of required capital contributions or fail to fulfill their obligations as a joint venture partner, which may require us to infuse our own capital into the venture on behalf of the partner despite other competing uses for such capital; and |
| • | our joint venture partners may have competing interests in our markets that could create conflict of interest issues. |
Any divestitures and discontinued operations could negatively impact our business, and retained liabilities from businesses that we may sell could adversely affect our financial results.
As part of our portfolio management process, we review our operations for businesses which may no longer be aligned with our strategic initiatives and long-term objectives. Divestitures pose risks and challenges that could negatively impact our business, including required separation or carve-out activities and costs, disputes with buyers or potential impairment charges. We may also dispose of a business at a price or on terms that are less than we had previously anticipated. After reaching an agreement with a buyer for the disposition of a business, we are also subject to satisfaction of pre-closing conditions, as well as necessary regulatory and governmental approvals on acceptable terms, which may prevent us from completing a transaction. Dispositions may also involve continued financial involvement, as we may be required to retain responsibility for, or agree to indemnify buyers against contingent liabilities related to a businesses sold, such as lawsuits, tax liabilities, lease payments, product liability claims or environmental matters. Under these types of arrangements, performance by the divested businesses or other conditions outside of our control could affect future financial results.
17
Table of Contents
| Item 1B. | Unresolved Staff Comments |
None
| Item 2. | Properties |
The manufacturing plants for each of our segments are listed below. In addition, we lease an office building in Johnson City, Tennessee which serves as our corporate offices.
Precision Bearing Components Group
| Manufacturing Operation |
Country | Owned or Leased | ||
| Erwin Plant | U.S.A. | Owned | ||
| Kunshan Plant | China | Leased | ||
| Kysucke Plant | Slovakia | Owned | ||
| Mountain City Plant | U.S.A. | Owned | ||
| Pinerolo Plant | Italy | Owned | ||
| RFK Valjcici d. d. Konjic Plant | Bosnia | Owned | ||
| Veenendaal Plant | The Netherlands | Owned |
Precision Engineered Products Group
| Manufacturing Operation |
Country | Owned or Leased | ||
| Algonquin Plant | U.S.A. | Owned | ||
| Attleboro Plant 1 | U.S.A. | Owned | ||
| Attleboro Plant 2 | U.S.A. | Owned & Leased | ||
| Attleboro Office | U.S.A. | Leased | ||
| Aurora Plant | U.S.A. | Leased | ||
| Bridgeport Plant | U.S.A. | Owned | ||
| Caprock Manufacturing Plant | U.S.A. | Owned | ||
| East Providence Plant | U.S.A. | Leased | ||
| Fairfield Plant | U.S.A. | Owned | ||
| Foshan City Plant | China | Leased | ||
| Franklin Plant | U.S.A. | Leased | ||
| Hingham Plant | U.S.A. | Leased | ||
| Lubbock Plant | U.S.A. | Owned | ||
| Medsorb Clean Room | Dominican Republic | Leased | ||
| Mexico City Plant | Mexico | Owned | ||
| North Attleboro Plant | U.S.A. | Owned | ||
| Palmer Plant | U.S.A. | Leased | ||
| Wallingford Plant | U.S.A. | Leased | ||
| Warsaw Plant | U.S.A. | Leased |
18
Table of Contents
Autocam Precision Components Group
| Manufacturing Operation |
Country | Owned or Leased | ||
| Autocam Boutuva Plant | Brazil | Leased | ||
| Autocam China Plant | China | Leased | ||
| Autocam Dowagiac Plant | U.S.A. | Owned | ||
| Autocam Kentwood Plant 1 | U.S.A. | Leased | ||
| Autocam Kentwood Plant 2 | U.S.A. | Leased | ||
| Autocam Marshall Plant 1 | U.S.A. | Leased | ||
| Autocam Marshall Plant 2 | U.S.A. | Leased | ||
| Autocam Poland Plant | Poland | Owned | ||
| Autocam Sao Joao da Boa Plant 1 | Brazil | Leased | ||
| Autocam Sao Joao da Boa Plant 2 | Brazil | Leased | ||
| Bouverat Industries Plant | France | Owned | ||
| V-S Products Juarez Plant | Mexico | Leased | ||
| V-S Products Wheeling Plant | U.S.A. | Leased | ||
| Wellington Plant 1 | U.S.A. | Leased | ||
| Wellington Plant 2 | U.S.A. | Leased |
Joint Venture
| Manufacturing Operation |
Country | Owned or Leased | ||
| Wuxi Weifu Autocam Precision Machinery Company, Ltd. Facility Plant | China | N/A |
For more information, please see “Management’s Discussion and Analysis of Financial Condition and Results of Operations — Liquidity and Capital Resources.”
| Item 3. | Legal Proceedings |
All legal proceedings are of an ordinary and routine nature and are incidental to our operations. Management believes that such proceedings should not, individually or in the aggregate, have a material adverse effect on our business, financial condition, results of operations, or cash flows. In making that determination, we analyze the facts and circumstances of each case at least quarterly in consultation with our attorneys and determine a range of reasonably possible outcomes. The procedures performed include reviewing attorney and plaintiff correspondence, reviewing any filings made and discussing the facts of the case with local management and legal counsel. We have not recognized any loss contingencies at December 31, 2016 and 2015.
| Item 4. | Mine Safety Disclosures |
Not applicable
Part II
| Item 5. | Market for the Registrant’s Common Equity, Related Stockholder Matters and Issuer Purchases of Equity Securities |
Our common stock is traded on the NASDAQ Stock Market LLC (“NASDAQ”) under the trading symbol “NNBR.” As of March 1, 2017, there were approximately 6,686 beneficial owners of record of our common stock and the closing per share stock price as reported by NASDAQ was $20.70.
19
Table of Contents
The following table sets forth the high and low closing sales prices of the common stock, as reported by NASDAQ for our two most recent fiscal years.
| Close Price | ||||||||
| High | Low | |||||||
| 2016 |
||||||||
| First Quarter |
$ | 14.90 | $ | 10.58 | ||||
| Second Quarter |
19.16 | 12.77 | ||||||
| Third Quarter |
18.81 | 13.48 | ||||||
| Fourth Quarter |
20.21 | 13.65 | ||||||
| 2015 |
||||||||
| First Quarter |
$ | 28.18 | $ | 19.49 | ||||
| Second Quarter |
29.86 | 22.50 | ||||||
| Third Quarter |
26.97 | 18.29 | ||||||
| Fourth Quarter |
19.54 | 12.92 | ||||||
The following graph and table below compares the cumulative total shareholder return on our common stock with the cumulative total shareholder return of: (i) the Value Line Machinery Index (“Machinery Index”); (ii) the Standard & Poors 500 Stock Index; (iii) the Standard & Poors SmallCap 600; and (iv) a customized peer group, for the period from December 31, 2011 to December 31, 2016. The Machinery Index is an industry index comprised of 80 companies engaged in manufacturing of machinery and machine parts, a list of which may be obtained by writing to NN, Inc., Attention: Secretary, 207 Mockingbird Lane, Johnson City, Tennessee 37604. The customized peer group consists of the following companies, which we believe are in similar lines of business: Actuant Corporation, Altra Industrial Motion Corp., Ametek Inc., CIRCOR International, Inc., Colfax Corporation, Crane, Kaman Corporation, Park-Ohio Holdings Corp. and Worthington Industries, Inc. (collectively, the “Peer Group”). The following graph and table assumes that a $100 investment was made at the close of trading on December 31, 2011 in our common stock and in the Machinery Index, the Standard & Poors 500 Stock Index, the Standard & Poors SmallCap 600 and the Peer Group. We cannot assure you that the performance of our common stock will continue in the future with the same or similar trend depicted on the graph.
In our Annual Report on Form 10-K for the year ended December 31, 2014, we used the Standard & Poors 500 Stock Index as our broad equity market index and the Machinery Index as our line of business index for our performance graph comparison. However, we have determined that the Standard & Poors SmallCap 600 is a more appropriate broad equity market index because it has more companies that have a market capitalization similar to us. Additionally we have determined that the Peer Group is a more appropriate comparative group than the Machinery Index, as the companies comprising the Peer Group include diversified industrial manufacturers like NN. In light of the diversification of our end markets and the broadening of our portfolio of products, services and solutions over the last two years, primarily due to the acquisitions of Autocam and PEP, we believe the Peer Group is comprised of companies that better reflect our current business.
Comparison of Five-Year Cumulative Total Return
NN Inc., S&P 500, S&P 600, Value Line Machinery and Peer Group
(Performance results through 12/31/16)
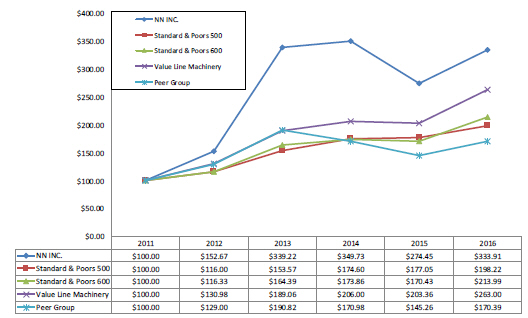
Source: Value Line Publishing LLC
20
Table of Contents
The declaration and payment of dividends are subject to the sole discretion of our Board of Directors and depend upon our profitability, financial condition, capital needs, credit agreement restrictions, future prospects and other factors deemed relevant by the Board of Directors. The following table sets forth the dividends per share paid during the last two fiscal years.
| 2016 |
Dividend | |||
| First Quarter |
$ | 0.07 | ||
| Second Quarter |
$ | 0.07 | ||
| Third Quarter |
$ | 0.07 | ||
| Fourth Quarter |
$ | 0.07 | ||
| 2015 |
Dividend | |||
| First Quarter |
$ | 0.07 | ||
| Second Quarter |
$ | 0.07 | ||
| Third Quarter |
$ | 0.07 | ||
| Fourth Quarter |
$ | 0.07 | ||
See Part III, Item 12 – “Security Ownership of Certain Beneficial Owners and Management and Related Stockholder Matters” of this Annual Report on Form 10-K for information required by Item 201 (d) of Regulation S-K.
| Item 6. | Selected Financial Data |
The following selected financial data has been derived from our audited financial statements. The selected financial data should be read in conjunction with “Management’s Discussion and Analysis of Financial Condition and Results of Operations” and the audited Consolidated Financial Statements, including the Notes thereto.
| Year ended December 31, | ||||||||||||||||||||
| 2016 | 2015 | 2014 | 2013 | 2012 | ||||||||||||||||
| Statement of Income Data: |
||||||||||||||||||||
| Net sales |
$ | 833,488 | $ | 667,280 | $ | 488,601 | $ | 373,206 | $ | 370,084 | ||||||||||
| Cost of products sold (exclusive of depreciation shown separately below) |
621,022 | 525,993 | 384,889 | 295,136 | 294,859 | |||||||||||||||
| Selling, general and administrative |
80,266 | 51,745 | 43,756 | 33,281 | 31,561 | |||||||||||||||
| Acquisition related costs excluded from selling, general and administrative |
— | 11,682 | 9,248 | — | — | |||||||||||||||
| Depreciation and amortization |
62,488 | 44,482 | 22,146 | 16,957 | 17,643 | |||||||||||||||
| (Gain) loss on disposal of assets |
288 | (687 | ) | — | 5 | (17 | ) | |||||||||||||
| Restructuring and integration |
10,024 | 7,268 | 875 | — | 967 | |||||||||||||||
|
|
|
|
|
|
|
|
|
|
|
|||||||||||
| Income from operations |
59,400 | 26,797 | 27,687 | 27,827 | 25,071 | |||||||||||||||
| Interest expense |
63,154 | 29,899 | 10,895 | 2,374 | 3,878 | |||||||||||||||
| Write-off of unamortized debt issuance cost |
3,089 | 18,673 | 1,398 | — | — | |||||||||||||||
| Derivative payments on interest rate swap |
609 | — | — | — | — | |||||||||||||||
| Derivative losses on change in interest rate swap fair value |
2,448 | — | — | — | — | |||||||||||||||
| Other (income) expense, net |
(2,591 | ) | 1,175 | 2,222 | 275 | 852 | ||||||||||||||
|
|
|
|
|
|
|
|
|
|
|
|||||||||||
| Income before provision (benefit) for income taxes |
(7,309 | ) | (22,950 | ) | 13,172 | 25,178 | 20,341 | |||||||||||||
| Provision (benefit) for income taxes |
(9,313 | ) | (10,518 | ) | 5,786 | 8,000 | (3,927 | ) | ||||||||||||
| Share of net income from joint venture |
5,938 | 5,001 | 831 | — | — | |||||||||||||||
|
|
|
|
|
|
|
|
|
|
|
|||||||||||
| Net income (loss) |
$ | 7,942 | $ | (7,431 | ) | $ | 8,217 | $ | 17,178 | $ | 24,268 | |||||||||
|
|
|
|
|
|
|
|
|
|
|
|||||||||||
| Basic income per share: |
||||||||||||||||||||
| Net income (loss) |
$ | 0.29 | $ | (0.35 | ) | $ | 0.46 | $ | 1.00 | $ | 1.43 | |||||||||
|
|
|
|
|
|
|
|
|
|
|
|||||||||||
| Diluted income per share: |
||||||||||||||||||||
| Net income (loss) |
$ | 0.29 | $ | (0.35 | ) | $ | 0.45 | $ | 1.00 | $ | 1.42 | |||||||||
|
|
|
|
|
|
|
|
|
|
|
|||||||||||
| Dividends paid |
$ | 0.28 | $ | 0.28 | $ | 0.28 | $ | 0.18 | $ | — | ||||||||||
|
|
|
|
|
|
|
|
|
|
|
|||||||||||
| Weighted average number of shares outstanding—Basic |
27,016 | 21,181 | 17,887 | 17,176 | 17,009 | |||||||||||||||
|
|
|
|
|
|
|
|
|
|
|
|||||||||||
| Weighted average number of shares outstanding – Diluted |
27,154 | 21,181 | 18,253 | 17,260 | 17,114 | |||||||||||||||
|
|
|
|
|
|
|
|
|
|
|
|||||||||||
21
Table of Contents
| As of December 31, | ||||||||||||||||||||
| 2016 | 2015 | 2014 | 2013 | 2012 | ||||||||||||||||
| Balance Sheet Data: |
||||||||||||||||||||
| Current assets |
$ | 280,555 | $ | 280,181 | $ | 242,799 | $ | 125,674 | $ | 127,296 | ||||||||||
| Current liabilities |
138,616 | 133,351 | 137,598 | 69,384 | 58,758 | |||||||||||||||
| Total assets |
1,360,386 | 1,380,567 | 712,713 | 262,402 | 265,343 | |||||||||||||||
| Long-term debt |
785,713 | 795,400 | 328,026 | 26,000 | 63,715 | |||||||||||||||
| Stockholders’ equity |
315,199 | 313,881 | 173,699 | 152,760 | 128,560 | |||||||||||||||
The year ended December 31, 2016 reflects fully all the acquisition activity from 2015 and 2014. Line items such as Selling, general and administrative costs, Depreciation and amortization, Restructuring and impairment charges, excluding goodwill impairment, and Interest expense all increased because of increased basis in assets and higher debt and employee levels. There were no acquisitions made during 2016.
The year ended December 31, 2015 was significantly impacted by certain costs related to the PEP Acquisition and to a lesser extent the Caprock acquisition completed in 2015, as well as the issuance of shares of our common stock. The total impact of these costs was $43.0 million (before tax) and $29.4 million (after tax). The balance sheet for the year ended December 31, 2015 includes the impact of these costs. With these acquisitions, we acquired current assets and total assets of $71.2 million and $741.6 million, respectively, and assumed current liabilities and total liabilities of $21.7 million and $111.3 million, respectively.
On July 1, 2015 we closed a registered follow-on offering of public common stock. The total number of shares of common stock sold was approximately 7.6 million at a public offering price of $24.00 per share. The net proceeds received from the offering, after deducting underwriter discounts, commissions and offering expenses, were approximately $173.1 million. Of these proceeds, $148.7 million was used for repayment of principal and interest on existing debt.
On October 19, 2015, concurrent with the PEP Acquisition, we: (i) entered into a new senior secured term loan credit facility in the amount of up to $525.0 million (with a $100.0 million accordion feature) and a seven year maturity (as amended, supplemented and/or restated from time to time, the “Term Loan Credit Facility”); (ii) entered into a new senior secured revolving credit facility in the amount of up to $100.0 million with a five year maturity (as amended, supplement and/or restated from time to time, the “Senior Secured Revolving Credit Facility”, and together with the Term Loan Credit Facility, the “Senior Credit Facilities”); and (iii) issued $300.0 million of 10.25% senior notes due 2020 (the “Senior Notes”). Proceeds from the Term Loan Credit Facility and the Senior Notes were used to finance the purchase price of the PEP Acquisition and pay down debt. The Senior Credit Facilities replaced our existing credit facilities. On November 9, 2015, an incremental term loan of $50.0 million was drawn on the Term Loan Credit Facility, and the proceeds were used to repurchase approximately $50.0 million of the Senior Notes. On September 30, 2016, we amended and restated the Senior Credit Facilities, which lowered the interest rate and rate floor on the Company’s Senior Secured Term Loan B (the “Term Loan B”). The new applicable rate for the Term Loan B is London Inter Bank Offering Rate (“LIBOR”), subject to a 0.75% rate floor, plus 4.25%, which in combination is 75 basis points lower (or 0.75%) than the previous rate. Concurrent with the amended and restated Term Loan B, the Senior Secured Revolving Credit Facility was upsized from $100 million to $133 million. Proceeds were drawn under the Senior Secured Revolving Credit Facility to pay down debt under the Term Loan B, reducing the debt under the Term Loan B to $545 million. During October 2016, an incremental amendment was executed increasing the $133 million Senior Secured Revolving Credit Facility to $143 million. See “Management’s Discussion and Analysis of Financial Condition and Results of Operations” and Note 7 of the Notes to Consolidated Financial Statements for more information. Additional details regarding the financing of the PEP Acquisition may be found in our Current Report on Form 8-K filed with the Securities and Exchange Commission on October 20, 2015.
The year ended December 31, 2014 was significantly impacted by certain costs related to the Autocam acquisition and to a lesser extent the three other acquisitions completed in 2014. The total impact of these costs was $14.8 million (before tax) and $13.6 million (after tax). In addition, related to the Autocam acquisition, we discontinued use of certain trade names and incurred a $0.9 million impairment charge. The balance sheet for the year ended December 31, 2014 includes the impact of four acquisitions closed during 2014. With these acquisitions, we acquired current assets and total assets of $92.9 million and $433.9 million, respectively, and assumed current liabilities and total liabilities of $52.9 million and $124.4 million, respectively. See “Management’s Discussion and Analysis of Financial Condition and Results of Operations” for more information.
The year ended December 31, 2012 was impacted by a favorable tax benefit of a net $7.3 million from removing valuation allowances on deferred tax assets in the U.S. Additionally, results for the year ended December 31, 2012 were negatively impacted by impairments of $1.0 million and after tax foreign exchange losses of $1.1 million related to intercompany notes.
22
Table of Contents
| Item 7. | Management’s Discussion and Analysis of Financial Condition and Results of Operations |
The following discussion should be read in conjunction with, and is qualified in its entirety by, the Consolidated Financial Statements and the Notes thereto and Selected Financial Data included elsewhere in this Annual Report on Form 10-K. Historical operating results and percentage relationships among any amounts included in the Consolidated Financial Statements are not necessarily indicative of trends in operating results for any future period. Unless otherwise noted herein, all amounts are in thousands, except per share numbers.
Overview and Management Focus
Our strategy and management focus is based upon the following long-term objectives
| • | Organic and acquisitive growth within all our segments; |
| • | Sales growth in adjacent markets; |
| • | Sales growth through acquisitions; and |
| • | Global expansion of our manufacturing base to better address the global requirements of our customers. |
Management generally focuses on these trends and relevant market indicators
| • | Global industrial growth and economics; |
| • | Global automotive production rates; |
| • | Costs subject to the global inflationary environment, including, but not limited to: |
| • | Raw material; |
| • | Wages and benefits, including health care costs; |
| • | Regulatory compliance; and |
| • | Energy; |
| • | Trends related to the geographic migration of competitive manufacturing; |
| • | Regulatory environment for United States public companies and manufacturing companies; |
| • | Currency and exchange rate movements and trends; and |
| • | Interest rate levels and expectations. |
Management generally focuses on the following key indicators of operating performance
| • | Sales growth; |
| • | Cost of products sold; |
| • | Selling, general and administrative expense; |
| • | Earnings before interest, taxes, depreciation and amortization; |
| • | Income from operations and adjusted income from operations; |
| • | Net income and adjusted net income; |
| • | Cash flow from operations and capital spending; |
| • | Customer service reliability; |
| • | External and internal quality indicators; and |
| • | Employee development. |
23
Table of Contents
Critical Accounting Policies
Our significant accounting policies, including the assumptions and judgment underlying them, are disclosed in Note 1 of the Notes to Consolidated Financial Statements. These policies have been consistently applied in all material respects and address such matters as revenue recognition, inventory valuation and asset impairment recognition. Due to the estimation processes involved, management considers the following summarized accounting policies and their application to be critical to understanding our business operations, financial condition and results of operations. We cannot assure you that actual results will not significantly differ from the estimates used in these critical accounting policies.
Business Combinations. We allocate the total purchase price of the acquired tangible and intangible assets acquired and liabilities assumed based on their estimated fair values as of the business combination date, with the excess purchase price recorded as goodwill. The purchase price allocation process required us to use significant estimates and assumptions, including fair value estimates, as of the business combination date. Although we believe the assumptions and estimates we have made are reasonable and appropriate, they are based in part on historical experience and information obtained from management of the acquired company, in part based on valuation models that incorporate projections of expected future cash flows and operating plans and are inherently uncertain. Valuations are performed by management or third party valuation specialists under management’s supervision. In determining the fair value of assets acquired and liabilities assumed in business combinations, as appropriate, we may use one of the following recognized valuation methods: the income approach (including discounted cash flows from relief from royalty and excess earnings model), the market approach and/or the replacement cost approach.
Examples of significant estimates used to value certain intangible assets acquired include but are not limited to:
| • | sales volume, pricing and future cash flows of the business overall; |
| • | future expected cash flows from customer relationships, and other identifiable intangible assets, including future price levels, rates of increase in revenue and appropriate attrition rate; |
| • | the acquired company’s brand and competitive position, royalty rate quantum, as well as assumptions about the period of time the acquired brand will continue to benefit to the combined company’s product portfolio; and |
| • | cost of capital, risk-adjusted discount rates and income tax rates. |
However, different assumptions regarding projected performance and other factors associated with the acquired assets may affect the amount recorded under each type of assets and liabilities, mainly between property plant and equipment, intangibles assets, goodwill and deferred income tax liabilities and subsequent assessment could result in future impairment charges. The purchase price allocation process also entails us to refine these estimates over a measurement period not to exceed one year to reflect new information obtained surrounding facts and circumstances existing at acquisition date.
Goodwill and Acquired Intangibles. For new acquisitions, we use estimates, assumptions and appraisals to allocate the purchase price to the assets acquired and to determine the amount of goodwill. These estimates are based on market analyses and comparisons to similar assets. Annual procedures are required to be performed to assess whether recorded goodwill is impaired. The annual tests require management to make estimates and assumptions with regard to the future operations of its reporting units, and the expected cash flows that they will generate. These estimates and assumptions could impact the recorded value of assets acquired in a business combination, including goodwill, and whether or not there is any subsequent impairment of the recorded goodwill and the amount of such impairment.
Goodwill is tested for impairment on an annual basis as of October 1 and between annual tests if a triggering event occurs. The impairment procedures are performed at the reporting unit level. In testing goodwill, we have the option to first assess qualitative factors to determine whether it is necessary to perform a two-step test. If an entity believes, as a result of its qualitative assessment, that it is more-likely-than-not that the fair value of a reporting unit is less than its carrying amount including goodwill, the quantitative impairment test is required. Otherwise, no further testing is required. The decision to perform a qualitative assessment or a complete step 1 analysis is an annual decision made by management based on several factors including budget to actual performance, economic, market and industry considerations such as automotive production rates in the geographic markets we serve and cash flow from operations.
Generally accepted accounting principles in the U.S. (“GAAP”) prescribes a quantitative two-step process of testing for goodwill impairments. The first step is to determine if the carrying value of the reporting unit with goodwill is less than the related fair value of the reporting unit. We considered three main approaches to value (cost, market and income) the fair value of the reporting unit and market based multiples of earning and sales methods obtained from a grouping of comparable publicly trading companies. We believe this methodology of valuation is consistent with how market participants would value reporting units. The discount rate and market based multiples used are specifically developed for the units tested regarding the level of risk and end markets served. Even though we do use other observable inputs (Level 2 inputs under the GAAP hierarchy), the calculation of fair value for goodwill would be most consistent with Level 3 under the GAAP hierarchy. We conducted tests for goodwill impairment for the years ended December 31, 2016 and 2015 and concluded no impairment of goodwill had occurred.
24
Table of Contents
As of fourth quarter testing, the PEP Acquisition (the “PEP reporting unit”) had an estimated fair value that exceeded the carrying value including goodwill by 4 percent. As of December 31, 2016, goodwill of $368.3 million is allocated to the PEP reporting unit. Cash flows from the PEP reporting unit are susceptible to changes in demand due to cyclicality and timing of customer project completions primarily in the electrical and medical markets. Weakened demand in these markets could decrease the estimated fair value of the PEP reporting unit. Two of the most critical assumptions used in the calculation of the fair value of the PEP reporting unit are the target market long-term growth rate and the discount rate. Although management believes its estimate of fair value is reasonable, if the PEP reporting unit’s financial performance falls below expectation or there are negative revisions to key assumptions, the Company may be required to recognize an impairment charge.
If the carrying value of the reporting unit, including goodwill, is less than fair value of the reporting unit, the goodwill is not considered impaired. If the carrying value is greater than fair value, then the potential for impairment of goodwill exists. The potential impairment is determined by allocating the fair value of the reporting unit among the assets and liabilities based on a purchase price allocation methodology as if the reporting unit was acquired in a business combination. The fair value of the goodwill is implied from this allocation and compared to the carrying value with an impairment loss recognized if the carrying value is greater than the implied fair value.
Our indefinite lived intangible asset is accounted for similarly to goodwill. This asset is tested for impairment at least annually by comparing the fair value to the carrying value, using the relief from royalty rate method, and if the fair value is less than the carrying value, an impairment charge is recognized for the difference. The indefinite lived intangible asset was impaired during the year ended December 31, 2014, as management is in the process of phasing out the use of the trade name as a result of the Autocam acquisition.
Income taxes. Income taxes are accounted for under the asset and liability method. Deferred tax assets and liabilities are recognized for the future tax consequences attributable to differences between the financial statement carrying amounts of existing assets and liabilities and their respective tax bases and operating loss and tax credit carry forwards. Deferred tax assets and liabilities are measured using enacted tax rates expected to apply to taxable income in the years in which those temporary differences are expected to be recovered or settled. The effect on deferred tax assets and liabilities of a change in tax rates is recognized in income in the period that includes the enactment date.
The calculation of tax assets, liabilities, and expenses under GAAP is largely dependent on management judgment of the current and future deductibility and utilization of taxable expenses and benefits using a more likely than not threshold. Specifically, the realization of deferred tax assets and the certainty of tax positions taken are largely dependent upon management weighting the current positive and negative evidence for recording tax benefits and expenses. Additionally, many of our positions are based on future estimates of taxable income and deductibility of tax positions. Particularly, our assertion of permanent reinvestment of foreign undistributed earnings is largely based on management’s future estimates of domestic and foreign cash flows and current strategic foreign investment plans. In the event that the actual outcome from future tax consequences differs from management estimates and assumptions or management plans and positions are amended, the resulting change to the provision for income taxes could have a material impact on the consolidated results of operations and statement of financial position. (See Notes 1 and 13 of the Notes to Consolidated Financial Statements).
We did not record a U.S. deferred tax liability for the excess of the book basis over the tax basis of our investments in foreign subsidiaries to the extent the foreign earnings meet the indefinite reversal criteria. As of the year ended December 31, 2016, we consider the unremitted foreign earnings of our foreign subsidiaries to be reinvested indefinitely. We base this assertion on two factors. First, our intention to invest in foreign countries that are strategically important to our Precision Bearing Components Group, Autocam Precision Components Group and customers. With the acquisitions completed in 2015 and 2014, we have expanded our domestic and international base of operations adding subsidiaries in Mexico and China, which will require more foreign investment. Second, we have sufficient access to funds in the U.S. through projected free cash flows and the availability of our credit facilities to fund currently anticipated domestic operational and investment needs. As such, we do not expect unrepatriated foreign earnings to become subject to U.S. taxation.
Impairment of Long-Lived Assets. Our long-lived assets include property, plant and equipment. The recoverability of the long-term assets is dependent on the performance of the companies which we have acquired or built, as well as the performance of the markets in which these companies operate. In assessing potential impairment for these assets, we will consider these factors as well as forecasted financial performance based, in large part, on management business plans and projected financial information which are subject to a high degree of management judgment and complexity. Future adverse changes in market conditions or adverse operating results of the underlying assets could result in having to record additional impairment charges not previously recognized.
25
Table of Contents
Results of Operations
During the year ended December 31, 2014, we completed the acquisition of four companies: V-S, RFK, Chelsea and Autocam. The acquisitions of V-S, RFK, Chelsea and Autocam occurred on January 20, 2014, June 20, 2014, July 15, 2014 and August 29, 2014, respectively. As such, only eleven, six, five, and four months of operations were included in the year ended December 31, 2014 with respect to V-S, RFK, Chelsea and Autocam, respectively. During the year ended December 31, 2015, we completed the acquisition of two companies: Caprock and PEP. We acquired Caprock on May 29, 2015 and PEP on October 19, 2015. As such, seven and two months of operations were included in the year ended December 31, 2015 with respect to Caprock and PEP. In an effort to enhance the comparability of the current and prior year periods, we have aggregated into “acquisitions” within each financial line item comparison for the years ended December 31, 2016, 2015 and 2014 that were not included in the comparative prior year period. The remaining changes related to our legacy business.
Devaluation of the Euro against the U.S. Dollar
The euro devalued against the U.S. dollar beginning in the latter part of the third quarter of 2014 and accelerated during the fourth quarter of 2014 and into the first quarter of 2015. During these periods, the euro to U.S. dollar dropped from approximately $1.36 in June 2014 to $1.08 in March 2015, representing an approximate 21% decline in value. The exchange rate ranged between $1.08 and $1.12 for the remainder of the 2015. The exchange rates ranged between $1.05 and $1.09 during 2016, with $1.05 being the exchange rate at December 31, 2016. The devaluation of the euro significantly impacted the translation of our euro denominated sales and costs when comparing year over year activity. The euro translation impact, and the translation impact of other currencies, is highlighted below in the overall results as “foreign exchange effects”. In addition to translation effects, the devaluation of the euro impacted the value of certain intercompany loan receivables denominated in euros.
The following table shows fluctuations in exchange rates in 2016, 2015 and 2014.
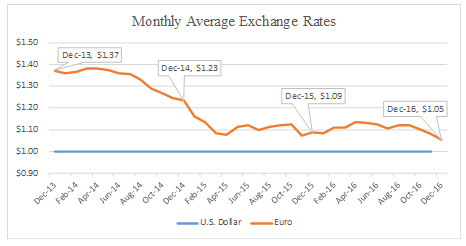
The following table sets forth for the periods indicated selected financial data and the percentage of our net sales represented by each income statement line item presented.
26
Table of Contents
As a Percentage of Net Sales
For the Year Ended December 31,
| 2016 | 2015 | 2014 | ||||||||||
| Net sales |
100.0 | % | 100.0 | % | 100.0 | % | ||||||
| Cost of products sold (exclusive of depreciation and amortization shown separately below) |
74.5 | % | 78.8 | % | 78.8 | % | ||||||
| Selling, general and administrative |
9.6 | % | 7.8 | % | 9.0 | % | ||||||
| Acquisition related costs excluded from selling, general and administrative |
0.0 | % | 1.8 | % | 1.9 | % | ||||||
| Depreciation and amortization |
7.5 | % | 6.7 | % | 4.5 | % | ||||||
| (Gain) loss on disposal of assets |
0.0 | % | -0.1 | % | 0.0 | % | ||||||
| Restructuring and impairment charges |
1.2 | % | 1.1 | % | 0.2 | % | ||||||
|
|
|
|
|
|
|
|||||||
| Income from operations |
7.1 | % | 4.0 | % | 5.7 | % | ||||||
| Interest expense |
7.6 | % | 4.5 | % | 2.2 | % | ||||||
| Write-off of unamortized debt issuance cost |
0.4 | % | 2.8 | % | 0.3 | % | ||||||
| Derivative payments (receipts) on interest rate swap |
0.1 | % | 0.0 | % | 0.0 | % | ||||||
| Derivative (gains) losses on change in interest rate swap fair value |
0.3 | % | 0.0 | % | 0.0 | % | ||||||
| Other expense, net |
-0.3 | % | 0.2 | % | 0.5 | % | ||||||
|
|
|
|
|
|
|
|||||||
| Income before provision (benefit) for income taxes and share of net income from joint venture |
-0.9 | % | -3.4 | % | 2.7 | % | ||||||
| Provision (benefit) for income taxes |
-1.1 | % | -1.6 | % | 1.2 | % | ||||||
| Share of net income (loss) from joint venture, net of tax |
0.7 | % | 0.7 | % | 0.2 | % | ||||||
|
|
|
|
|
|
|
|||||||
| Net income (loss) |
1.0 | % | -1.1 | % | 1.7 | % | ||||||
|
|
|
|
|
|
|
|||||||
Sales Concentration
Sales to various U.S. and foreign divisions of SKF, one of the largest bearing manufacturers in the world, accounted for approximately 13% of consolidated net sales in 2016. During 2016, sales to various U.S. and foreign divisions of our ten largest customers accounted for approximately 48% of our consolidated net sales. None of our other customers individually accounted for more than 10% of our consolidated net sales for 2016. The loss of all or a substantial portion of sales to these customers would cause us to lose a substantial portion of our revenue and have a corresponding negative impact on our operating profit margin due to the operational leverage these customers provide. This could lead to sales volumes not being high enough to cover our current cost structure or to provide adequate operating cash flows or cause us to incur additional restructuring and/or impairment costs. Due to a limit on the amount of excess bearing component production capacity in the markets we serve, we believe it would be difficult for any of our top ten customers to take a significant portion of our business away in the short term.
Year Ended December 31, 2016 Compared to the Year Ended December 31, 2015.
The year ended December 31, 2016 was significantly impacted by certain costs related to past acquisitions and higher debt levels. The net of tax impact of these costs was $31.5 million. The following is a summary of these costs:
| $ | 30,919 | Intangible asset amortization cost related to a acquisition activities and deferred financing costs | ||
| 10,024 | Reorganization and impairment charges | |||
| 4,651 | Acquisition and integration costs | |||
| 3,785 | Write-off of interest rate swap | |||
| 3,089 | Write-off of unamortized debt issuance costs | |||
| (1,219 | ) | Foreign exchange loss on inter-company charges | ||
| (19,773 | ) | Tax effect of identified items | ||
|
|
|
|||
| $ | 31,476 | Total | ||
|
|
|
27
Table of Contents
OVERALL RESULTS
| Consolidated NN, Inc. Year ended December 31, |
||||||||||||||||
| 2016 | 2015 | Change | ||||||||||||||
| Net sales |
$ | 833,488 | $ | 667,280 | $ | 166,208 | ||||||||||
| Acquisitions |
192,182 | |||||||||||||||
| Foreign exchange effects |
(5,377 | ) | ||||||||||||||
| Sale of a plant |
(8,173 | ) | ||||||||||||||
| Volume |
1,214 | |||||||||||||||
| Price/material inflation pass-through/mix |
(13,638 | ) | ||||||||||||||
| Cost of products sold (exclusive of depreciation and amortization shown separately below) |
621,022 | 525,993 | 95,029 | |||||||||||||
| Acquisitions |
119,157 | |||||||||||||||
| Foreign exchange effects |
(4,186 | ) | ||||||||||||||
| Sale of a plant |
(6,375 | ) | ||||||||||||||
| Volume |
(1,255 | ) | ||||||||||||||
| Cost reduction projects |
(12,312 | ) | ||||||||||||||
| Selling, general and administrative |
80,266 | 51,745 | 28,521 | |||||||||||||
| Acquisitions |
15,514 | |||||||||||||||
| Foreign exchange effects |
(352 | ) | ||||||||||||||
| Integration related costs |
2,984 | |||||||||||||||
| Infrastructure and staffing costs |
10,375 | |||||||||||||||
| Acquisition related costs excluded from selling, general and administrative |
— | 11,682 | (11,682 | ) | ||||||||||||
| Depreciation and amortization |
62,488 | 44,482 | 18,006 | |||||||||||||
| Acquisitions |
16,979 | |||||||||||||||
| Foreign exchange effects |
(328) | |||||||||||||||
| Increase in expense |
1,355 | |||||||||||||||
| Restructuring and impairment charges |
10,024 | 7,268 | 2,756 | |||||||||||||
| (Gain)/Loss on disposal of assets |
288 | (687 | ) | 975 | ||||||||||||
|
|
|
|
|
|
|
|||||||||||
| Income from operations |
59,400 | 26,797 | 32,603 | |||||||||||||
| Interest expense |
63,154 | 29,899 | 33,255 | |||||||||||||
| Write-off of unamortized debt issuance cost |
3,089 | 18,673 | (15,584 | ) | ||||||||||||
| Derivative payments (receipts) on interest rate swap |
609 | — | 609 | |||||||||||||
| Derivative (gains) losses on change in interest rate swap fair value |
2,448 | — | 2,448 | |||||||||||||
| Other (income) expense, net |
(2,591 | ) | 1,175 | (3,766 | ) | |||||||||||
|
|
|
|
|
|
|
|||||||||||
| Income (loss) before provision (benefit) for income taxes and share of net income from joint venture |
(7,309 | ) | (22,950 | ) | 15,641 | |||||||||||
| Provision (benefit) expense for income taxes |
(9,313 | ) | (10,518 | ) | 1,205 | |||||||||||
| Share of net income from joint venture |
5,938 | 5,001 | 937 | |||||||||||||
|
|
|
|
|
|
|
|||||||||||
| Net income |
$ | 7,942 | $ | (7,431 | ) | $ | 15,373 | |||||||||
|
|
|
|
|
|
|
|||||||||||
Net Sales. Net sales increased during 2016 compared to 2015 primarily due to sales from PEP business that was acquired in the fourth quarter of 2015. Partially offsetting these increases were both the sale of the Delta Rubber plant in November 2015 and the impact of devaluation of the euro and other currency denominated sales, as discussed above. Additionally, we had lower sales prices and changes in product mix, offset by volumes. The reduction in value relates to global industrial weakness partially offset by growth in the markets we serve.
Cost of Products Sold (exclusive of depreciation and amortization shown separately below). The increase in cost of products sold was primarily due to the addition of production costs from the acquired PEP business, as discussed above. Partially offsetting these increases was the impact of the devaluation of the euro and other currency denominated costs, as discussed above. Additionally, the decrease was incurred due to savings from cost reduction projects partially offset by changes in price, product mix, and material inflation pass-through.
Selling, General and Administrative. Much of the increase during 2016 was due to the selling, general and administrative costs from the acquired PEP business. Additionally, administrative costs were incurred for infrastructure and staffing costs related to our strategic initiatives.
Acquisition related costs excluded from selling, general and administrative. Acquisition related costs are third party legal, accounting, valuation consulting and investment banking advisory fees incurred directly related to the PEP Acquisition and the Caprock acquisition in 2015.
Depreciation and Amortization. The increase in 2016 was primarily due to depreciation and amortization from the acquired PEP business. This additional depreciation and amortization includes the related step-ups of certain property, plant and equipment to fair value and the addition of intangible assets principally for customer relationships and trade names related to the purchase price allocation of the new acquisitions.
28
Table of Contents
Interest expense. Interest expense increased in 2016 from the interest on the debt we undertook to complete the PEP Acquisition and the Caprock acquisition.
Write-off of unamortized debt issuance costs. Write-off of debt issuance costs was incurred due to the refinancing of debt in both 2016 and 2015.
Share of net income from joint venture. Net income from our joint venture primarily increased due to increased sales, which were up $10 million between the years. Their primary customer is Bosch, and Bosch continues to gain market share and we continue to win new business from them.
Provision for Income Taxes. From a dollar standpoint, the provision for both periods was a Benefit of $9.3 million and $10.5 million for the years ended December 31, 2016 and 2015, respectively. However, from a percentage basis, the effective tax rate in 2016 was much greater due to the proportionate share of income was from the foreign entities and the utilization of net operating losses in U.S.
RESULTS BY SEGMENT
PRECISION BEARING COMPONENTS GROUP
| Year ended December 31, | ||||||||||||||||
| 2016 | 2015 | Change | ||||||||||||||
| Net sales |
$ | 248,534 | $ | 261,837 | $ | (13,303 | ) | |||||||||
| Foreign exchange effects |
(2,287) | |||||||||||||||
| Volume |
(5,795) | |||||||||||||||
| Price/material inflation pass-through/mix |
(5,221) | |||||||||||||||
| Income from operations |
$ | 22,985 | $ | 26,310 | $ | (3,325 | ) | |||||||||
|
|
|
|
|
|
|
|||||||||||
Net sales decreased during 2016 compared to 2015 principally due to devaluation of the Euro and other currencies, lower volumes and changes to product mix. The lower volumes were primarily due to global industrial market weakness partially offset by growth in automotive markets.
The decrease in income from operations was consistent with the decrease in net sales, and an increase in restructuring charges related to personnel reductions of $4.4 million.
PRECISION ENGINEERED PRODUCTS GROUP
| Year ended December 31, | ||||||||||||||||
| 2016 | 2015 | Change | ||||||||||||||
| Net sales |
$ | 258,816 | $ | 77,183 | $ | 181,633 | ||||||||||
| Acquisition |
174,176 | |||||||||||||||
| Sale of a plant |
(2,298) | |||||||||||||||
| Price/material inflation pass-through/mix |
9,755 | |||||||||||||||
| Income from operations |
$ | 34,744 | $ | (3,718 | ) | $ | 38,462 | |||||||||
|
|
|
|
|
|
|
|||||||||||
The increase in net sales and income from operations was due primarily to the acquisition of PEP and the sale of Delta Rubber in the fourth quarter of 2015.
29
Table of Contents
AUTOCAM PRECISION COMPONENTS GROUP
| Year ended December 31, | ||||||||||||||||
| 2016 | 2015 | Change | ||||||||||||||
| Net sales |
$ | 326,138 | $ | 328,260 | $ | (2,122 | ) | |||||||||
| Volume |
6,995 | |||||||||||||||
| Foreign exchange effects |
(3,090) | |||||||||||||||
| Price/material inflation pass-through/mix |
(6,027) | |||||||||||||||
| Income from operations |
$ | 29,516 | $ | 31,700 | $ | (2,184 | ) | |||||||||
|
|
|
|
|
|
|
|||||||||||
The decrease in net sales in 2016 was due to the devaluation of the Brazilian real and changes to the product mix, partially offset by the increase in volume. The growth in volume was within CAFE Technologies within automotive.
The decrease in income from operations was consistent with the decrease in net sales and due to restructuring charges in 2016 related to our Wheeling plant closure of $4.3 million.
Year Ended December 31, 2015 Compared to the Year Ended December 31, 2014.
The year ended December 31, 2015 was significantly impacted by certain costs related to the PEP Acquisition and, to a lesser extent, the Caprock acquisition. The net of tax impact of these costs was $43.2 million. The following is a summary of these costs:
| $ | 11,682 | Third party legal, accounting, valuation consulting and investment banking advisory fees, which are reported in acquisition related costs excluded from selling, general and administrative | ||
| 4,300 | Inventory purchase price adjustment related to the PEP Acquisition reported in cost of products sold | |||
| 5,202 | Intangible asset amortization cost related to a backlog purchase price adjustment reported in depreciation and amortization | |||
| 18,673 | Debt issuance costs related to credit facilities refinanced as part of the PEP Acquisition, reported as write-off of debt issuance costs | |||
| 3,368 | Integration costs related to acquisitions reported in cost of products sold | |||
| (15,129 | ) | Tax effect of identified items | ||
|
|
|
|||
| $ | 28,096 | Total | ||
|
|
|
30
Table of Contents
OVERALL RESULTS
| Consolidated NN, Inc. | ||||||||||||||||
| Year ended December 31, | ||||||||||||||||
| 2015 | 2014 | Change | ||||||||||||||
| Net sales |
$ | 667,280 | $ | 488,601 | $ | 178,679 | ||||||||||
| Acquisitions |
212,463 | |||||||||||||||
| Foreign exchange effects |
(39,086 | ) | ||||||||||||||
| Volume |
10,159 | |||||||||||||||
| Price/material infation pass-through/mix |
(4,857 | ) | ||||||||||||||
| Cost of products sold (exclusive of depreciation and amortization shown separately below) |
525,993 | 384,889 | 141,104 | |||||||||||||
| Acquisitions |
163,482 | |||||||||||||||
| Foreign exchange effects |
(33,673 | ) | ||||||||||||||
| Volume |
7,631 | |||||||||||||||
| Price/material infation pass-through/mix |
(3,861 | ) | ||||||||||||||
| Acquisition integration costs and inventory step-up |
7,525 | |||||||||||||||
| Selling, general and administrative |
51,745 | 43,756 | 7,989 | |||||||||||||
| Acquisitions |
12,455 | |||||||||||||||
| Foreign exchange effects |
(2,408 | ) | ||||||||||||||
| Other |
(2,058 | ) | ||||||||||||||
| Acquisition related costs excluded from selling, general and administrative |
11,682 | 9,248 | 2,434 | |||||||||||||
| Depreciation and amortization |
44,482 | 22,146 | 22,336 | |||||||||||||
| Acquisitions |
22,430 | |||||||||||||||
| Foreign exchange effects |
(1,283 | ) | ||||||||||||||
| Increase in expense |
1,189 | |||||||||||||||
| Restructuring and impairment charges |
7,268 | 875 | 6,393 | |||||||||||||
| (Gain)/Loss on disposal of assets |
(687 | ) | — | (687 | ) | |||||||||||
|
|
|
|
|
|
|
|||||||||||
| Income from operations |
26,797 | 27,687 | (890 | ) | ||||||||||||
| Interest expense |
29,899 | 10,895 | 19,004 | |||||||||||||
| Write-off of unamortized debt issuance cost |
18,673 | 1,398 | 17,275 | |||||||||||||
| Other (income) expense, net |
1,175 | 2,222 | (1,047 | ) | ||||||||||||
|
|
|
|
|
|
|
|||||||||||
| Income (loss) before provision (benefit) for income taxes and share of net income from joint venture |
(22,950 | ) | 13,172 | (36,122 | ) | |||||||||||
| Provision (benefit) expense for income taxes |
(10,518 | ) | 5,786 | (16,304 | ) | |||||||||||
| Share of net income from joint venture |
5,001 | 831 | 4,170 | |||||||||||||
|
|
|
|
|
|
|
|||||||||||
| Net income |
$ | (7,431 | ) | $ | 8,217 | $ | (15,648 | ) | ||||||||
|
|
|
|
|
|
|
|||||||||||
Net Sales Net sales increased during 2015 compared to 2014 principally due to sales from the companies acquired in 2014 and 2015. Three of the four companies acquired during 2014 were acquired subsequent to the first half of 2014 and two were acquired during 2015. Additionally, sales growth came from overall volume growth in the markets we serve, from new sales programs with existing customers and sales with new customers in each of these geographic markets. Partially offsetting these increases was the impact of devaluation of the euro on euro denominated sales, as discussed above.
Cost of Products Sold (exclusive of depreciation and amortization shown separately below). Cost of products sold was primarily impacted by the addition of production costs added with the 2015 and 2014 acquisitions, as discussed above. Additionally, the total was impacted by increased production costs at those units that experienced higher sales volumes, as discussed above. Finally, we incurred $7.5 million of costs directly related to acquisitions and integrations and specifically $4.3 million related to a step-up in value of inventory of an acquired company and $3.3 million related to integration costs. Partially offsetting these increases was the impact of devaluation of the euro on euro denominated costs, as discussed above.
Selling, General and Administrative. The majority of the increase during 2015 was due to the selling, general and administrative costs carried over from the companies acquired in 2015 and 2014.
Acquisition related costs excluded from selling, general and administrative. Acquisition related costs are third party legal, accounting, valuation consulting and investment banking advisory fees incurred directly related to the PEP Acquisition and the Caprock acquisition in 2015, and Autocam acquisition and our other acquisitions in 2014.
Depreciation and Amortization. The increase in 2015 was due to depreciation and amortization from the 2015 and 2014 acquisitions. The additional depreciation and amortization includes the related step-ups of certain property, plant and equipment to fair value and the addition of intangible assets principally for customer relationships and trade names related to the purchase price allocation of the new acquisitions. Additionally, 2015 included a $5.2 million charge related to amortizing a large portion of a backlog intangible asset acquired in 2015.
31
Table of Contents
Interest expense. Interest expense increased in 2015 from the interest on the debt we undertook to complete our acquisitions.
Write-off of unamortized debt issuance costs. Write-off of debt issuance costs increased due to the refinancing of acquisitions in both 2015 and 2014.
Provision for Income Taxes. The 2015 effective tax rate of 46% is consistent with the 2014 effective rate of 44%. Both rates are impacted by non-deductible mergers and acquisition cost.
RESULTS BY SEGMENT
PRECISION BEARING COMPONENTS GROUP
| Year ended December 31, | ||||||||||||||||
| 2015 | 2014 | Change | ||||||||||||||
| Net sales |
$ | 261,837 | $ | 278,026 | $ | (16,189 | ) | |||||||||
| Foreign exchange effects |
(33,914 | ) | ||||||||||||||
| Acquisition |
7,753 | |||||||||||||||
| Volume |
11,501 | |||||||||||||||
| Price/material infation pass-through/mix |
(1,529 | ) | ||||||||||||||
| Income from operations |
$ | 26,310 | $ | 31,872 | $ | (5,562 | ) | |||||||||
|
|
|
|
|
|
|
|||||||||||
Net sales decreased from 2014 to 2015 principally due to the impact of devaluation of the euro on euro denominated sales, as discussed above. Partially offsetting the unfavorable foreign exchange effects was greater demand for our products in the North American, Asian and European automotive and general industrial markets. This greater demand was from market share gains with our customers and from winning business with new customers. Additionally, sales increased with the addition of the companies the segment acquired subsequent to the first half of 2014.
Segment income from operations was unfavorably impacted by $3.3 million due to the depreciation in value of Euro denominated income from operations relative to the U.S. Dollar. Additionally, the segment incurred $1.8 million in restructuring costs related to reduce headcount at certain European plants.
PRECISION ENGINEERED PRODUCTS GROUP
| Year ended December 31, | ||||||||||||||||
| 2015 | 2014 | Change | ||||||||||||||
| Net sales |
$ | 77,183 | $ | 33,351 | $ | 43,832 | ||||||||||
| Acquisition |
44,742 | |||||||||||||||
| Price/material infation pass-through/mix |
(910 | ) | ||||||||||||||
| Income from operations |
$ | (3,718 | ) | $ | 1,231 | $ | (4,949 | ) | ||||||||
|
|
|
|
|
|
|
|||||||||||
The Precision Engineered Products Group includes the Plastic and Rubber Components Segment as presented in previous filings. The name of this segment was changed during 2015 after the PEP Acquisition and disposal of Delta Rubber. The increase in sales was primarily due to the acquisition of Caprock during the second quarter of 2015 and the PEP Acquisition in the fourth quarter of 2015. Loss from operations was primarily due to increased depreciation and amortization related to the PEP Acquisition. Specifically included in income from operations was $4.3 million related to a step-up in value of inventory of an acquired company, a charge of $5.2 million related to amortizing a large portion of a backlog intangible asset of an acquired company and $1.6 million of acquisition and integration costs directly attributable to acquisitions within the segment.
32
Table of Contents
AUTOCAM PRECISION COMPONENTS GROUP
| Year ended December 31, | ||||||||||||||||
| 2015 | 2014 | Change | ||||||||||||||
| Net sales |
$ | 328,260 | $ | 177,224 | $ | 151,036 | ||||||||||
| Acquisition |
159,168 | |||||||||||||||
| Volume |
(1,383 | ) | ||||||||||||||
| Foreign exchange effects |
(5,172 | ) | ||||||||||||||
| Price/material inflation pass-through/mix |
(1,577 | ) | ||||||||||||||
| Income from operations |
$ | 31,700 | $ | 15,732 | $ | 15,968 | ||||||||||
|
|
|
|
|
|
|
|||||||||||
The increased sales from 2014 to 2015 were due to sales added with the acquisition during 2014. The increase in income from operations was primarily from the companies acquired in 2014 partially offset by $2.6 million in restructuring costs related to the Wheeling Plant closure.
Changes in Financial Condition from December 31, 2015 to December 31, 2016.
From December 31, 2015 to December 31, 2016, our total assets decreased by $20.2 million and our current assets increased by $0.4 million. The majority of the decrease was due to $26.2 million amortization of intangible assets and a $7.4 reclassification of deferred tax assets to non-current deferred tax assets. Offsetting the decrease is $16.5 million increase in accounts receivable, net, due to increased sales volume. Foreign exchange translation impacted the balance sheet in comparing changes in account balances from December 31, 2015 to December 31, 2016 by decreasing total assets $5.0 million and current assets $3.9 million.
From December 31, 2016 to December 31, 2015, our total liabilities decreased $21.5 million. The majority of the decrease was from the utilization of deferred tax and payment on current tax, amortization of debt issuance costs and payments on long term debt.
Working capital, which consists principally of accounts receivable and inventories offset by accounts payable and current maturities of long-term debt, was $141.9 million at December 31, 2016 and $146.8 for 2015. It remained relative consistent with the increase in accounts receivable and payment of taxes, offset by reductions in accounts payable and reclassification of deferred taxes.
Cash provided by operations was $69.3 million in 2016 compared with cash provided by operations of $33.3 million in 2015. The difference was a full year of results of operations from late 2015 acquisitions, offset by higher interest costs incurred servicing the debt for the acquisitions. Cash flow provided by operations was $33.3 million for 2015 compared with $30.7 million for 2014. The difference was increased results of operations, offset by higher interest costs incurred servicing the debt for the acquisitions
Cash used by investing activities was $41.3 million in 2016 compared with cash used by investing activities of $665.8 million in 2015. The decrease was due to no acquisitions made in 2016 and capital expenditures were within planned amounts. Cash used by investing activities was $665.8 million in 2015 compared with cash used by investing activities of $281.6 million in 2014. The difference was primarily due to the $628.2 million in cash paid to acquire PEP and Caprock, net of cash received.
Cash used in financing activities was $24.3 million for 2016 compared with cash provided by financing activities of $611.9 million in 2015. The difference was primarily related obtaining financing for 2015 acquisitions compared to a year of debt repayments in 2016. Cash provided by financing activities was $611.9 million in 2015, compared with cash used by financing activities of $287.0 million in 2014. The difference was primarily related to using debt to fund the PEP Acquisition and the offering of our common stock.
Liquidity and Capital Resources
Amounts outstanding under our Term Loan Credit Facility, Senior Notes, and Senior Secured Revolving Credit Facility as of December 31, 2016 were $821.5 million (without regard to debt issuance costs). As of December 31, 2016, we could borrow up to $104.6 million under our Senior Secured Revolving Credit Facility subject to certain limitations. The $104.6 million of availability is net of $10.4 million of outstanding letters of credit at December 31, 2016, which are considered as usage of the Senior Secured Revolving Credit Facility.
Our Term Loan B requires us to pay quarterly 0.25% (or $1.4 million) of the initial principal amount through September 30, 2022 with the remaining principal amount due on the maturity date. Additionally, as long as LIBOR stays below 0.75%, we will be paying 5.00% per annum in interest. If the LIBOR exceeds 0.75%, then the rate will be the variable LIBOR rate plus an applicable margin of 4.25%.
33
Table of Contents
Based on the outstanding balance at December 31, 2016, the annual interest payments would have been $27.3 million.
Our Senior Notes require us to pay annual interest of 10.25% payable semi-annually in arrears on May 1 and November 1 of each year. Based on the outstanding balance at December 31, 2016, the annual interest payments would have been $25.6 million.
Our Senior Secured Revolving Credit Facility requires us to pay interest rate of LIBOR plus an applicable margin of 3.50%. Based on the outstanding balance at December 31, 2016, the annual interest payments would have been $1.1 million.
We believe that funds generated from our consolidated operations will provide sufficient cash flow to service these required debt and interest payments under these facilities.
Our arrangements with our domestic customers typically provide that payments are due within 30 to 60 days following the date of our shipment of goods, while arrangements with foreign customers of our domestic business (other than foreign customers that have entered into an inventory management program with us) generally provide that payments are due within 60 to 120 days following the date of shipment to allow for additional transit time and customs clearance. Under the Precision Bearing Components Group’s inventory management program with certain customers, payments typically are due within 30 days after the customer uses the product. Our arrangements with European customers regarding due dates vary from 30 to 90 days following date of sale for European based customers and 60 to 120 days from customers outside of Europe to allow for additional transit time and customs clearance.
Certain of our businesses experience seasonal and other trends related to the industries and end markets that they serve. However, as a whole, we are not subject to material seasonality.
We invoice and receive payment from many of our customers in euros as well as other currencies. Additionally, we are party to various third party and intercompany loans, payables and receivables denominated in currencies other than the U.S. dollar. As a result of these sales, loans, payables and receivables, our foreign exchange transaction and translation risk has increased. Various strategies to manage this risk are available to management including producing and selling in local currencies and hedging programs. As of December 31, 2016, no currency hedges were in place. In addition, a strengthening of the U.S. dollar and/or euro against foreign currencies could impair our ability to compete with international competitors for foreign as well as domestic sales.
For the next twelve months, we expect capital expenditures to remain relatively consistent, the majority of which relate to new or expanded business. We believe that funds generated from operations and borrowings from the credit facilities will be sufficient to finance our capital expenditures and working capital needs through this period. We base this assertion on our current availability for borrowing of up to $104.6 million and our forecasted positive cash flow from operations for the next twelve months.
The table below sets forth our contractual obligations and commercial commitments as of December 31, 2016:
| Payments Due by Period | ||||||||||||||||||||
| Certain Contractual Obligations |
Total | Less than 1 year | 1-3 years | 3-5 years | After 5 years | |||||||||||||||
| Long-term debt including current portion |
$ | 825,090 | $ | 12,751 | $ | 11,936 | $ | 285,591 | $ | 514,812 | ||||||||||
| Expected interest payments |
254,908 | 54,030 | 106,632 | 73,571 | 20,675 | |||||||||||||||
| Operating leases |
31,272 | 7,824 | 12,615 | 7,684 | 3,149 | |||||||||||||||
| Capital leases |
9,024 | 3,955 | 4,201 | 868 | — | |||||||||||||||
|
|
|
|
|
|
|
|
|
|
|
|||||||||||
| Total contractual cash obligations |
$ | 1,120,294 | $ | 78,560 | $ | 135,384 | $ | 367,714 | $ | 538,636 | ||||||||||
|
|
|
|
|
|
|
|
|
|
|
|||||||||||
There are $4.7 million of long-term post-employment benefits, the payment of which depends on various factors including the date of the employee’s termination. Based on the best available information, we believe the vast majority of these payments will be made after 5 years.
We have approximately $5.8 million in unrecognized tax benefits and related penalties and interest accrued within the liabilities section of our balance sheet. We are unsure when or if at all these amounts might be paid to U.S. and/or foreign taxing authorities. Accordingly, these amounts have been excluded from the table above. (See Note 13 of the Notes to the Consolidated Financial Statements).
Functional Currencies
We currently have operations in Slovakia, Italy, Netherlands and France, all of which are euro participating countries. Each of our European facilities sell product to customers in many of the euro participating countries. The euro has been adopted as the functional currency at all of our locations in Europe. The functional currency of both NN Asia and Autocam Asia are the Chinese yuan and Autocam, Poland is the zloty.
34
Table of Contents
Seasonality and Fluctuation in Quarterly Results
General economic conditions impact our business and financial results, and certain of our businesses experience seasonal and other trends related to the industries and end markets that they serve. For example, European sales are often weaker in the summer months, medical device sales are often stronger in the fourth calendar quarter and sales to OEMs are often stronger immediately preceding and following the launch of new products. However, as a whole, we are not subject to material seasonality. For information concerning our quarterly results of operations for the years ended December 31, 2016 and 2015, see Note 17 of the Notes to the Consolidated Financial Statements.
Off-Balance Sheet Arrangements
We are not a party to any off-balance sheet arrangements that have, or are reasonably likely to have, a material current or future effect on our financial condition, revenues or expenses, results of operations, liquidity, capital expenditures or capital resources.
Inflation and Changes in Prices
The cost base of our operations has been materially affected by steel inflation during recent years. Due to the ability to pass on this steel inflation to our customers the overall financial impact has been minimized. The prices for steel, engineered resins and other raw materials which we purchase are subject to material change. Our typical pricing arrangements with steel suppliers are subject to adjustment every three to six months in the U.S. and annually in Europe for base prices but quarterly for scrap surcharge adjustments. In the past, we have been able to minimize the impact on our operations resulting from the steel price fluctuations by adjusting selling prices to our customers periodically in the event of changes in our raw material costs.
| Item 7A. | Quantitative and Qualitative Disclosures About Market Risk |
We are exposed to changes in financial market conditions in the normal course of our business due to our outstanding debt balances as well as from transacting in various foreign currencies. To mitigate our exposure to these market risks, we have established policies, procedures and internal processes governing our management of financial market risks. We are exposed to changes in interest rates primarily as a result of our borrowing activities. At December 31, 2016, we had $571.6 million outstanding under the variable rate credit facilities and $250.0 million outstanding under the fixed rate 10.25% Senior Notes. At December 31, 2016, a one-percent increase in the interest rate charged on our outstanding variable rate borrowings would result in interest expense increasing annually by approximately $5.7 million.
Our policy is to manage interest expense using a mix of fixed and variable rate debt. As such, we entered into a $150.0 million interest rate swap on December 16, 2014 that went into effect on December 29, 2015 and fixed our interest rate at 6.966%. As of December 31, 2016 and as a result of post-amendments to the derivative, our interest rate is now fixed at 6.466% through December 31, 2018. The nature and amount of our borrowings may vary as a result of future business requirements, market conditions and other factors.
Translation of our operating cash flows denominated in foreign currencies is impacted by changes in foreign exchange rates. Our Precision Bearing Components Group invoices and receives payment in currencies other than the U.S. dollar including the euro. Additionally, we participate in various third party and intercompany loans, payables and receivables denominated in currencies other than the U.S. dollar. To help reduce exposure to foreign currency fluctuation, we have incurred debt in euros in the past and have, from time to time, used foreign currency hedges to hedge currency exposures when these exposures meet certain discretionary levels. We did not use any currency hedges in 2016, nor did we hold a position in any foreign currency hedging instruments as of December 31, 2016.
35
Table of Contents
Item 8. Financial Statements and Supplementary Data
| Financial Statements | Page | |||
| 37 | ||||
| 38 | ||||
| 39 | ||||
| 40 | ||||
| Consolidated Statements of Cash Flows for the years ended December 31, 2016, 2015 and 2014 |
41 | |||
| 42 | ||||
36
Table of Contents
Report of Independent Registered Public Accounting Firm
To the Board of Directors and Stockholders of NN, Inc.
In our opinion, based on our audits and the report of other auditors with respect to the consolidated financial statements as of and for the year ended December 31, 2016, the accompanying consolidated balance sheets and the related consolidated statements of operations and comprehensive income (loss), of changes in stockholders’ equity and of cash flows present fairly, in all material respects, the financial position of NN, Inc. and its subsidiaries at December 31, 2016 and December 31, 2015, and the results of their operations and their cash flows for each of the three years in the period ended December 31, 2016 in conformity with accounting principles generally accepted in the United States of America. Also in our opinion, the Company did not maintain, in all material respects, effective internal control over financial reporting as of December 31, 2016, based on criteria established in Internal Control - Integrated Framework (2013) issued by the Committee of Sponsoring Organizations of the Treadway Commission (COSO) because material weaknesses in internal control over financial reporting existed as of that date related to the Company not maintaining an effective control environment due to a lack of a sufficient complement of personnel with an appropriate level of knowledge, experience and training commensurate with the Company’s financial reporting requirements. The material weakness in the control environment contributed to the following material weaknesses: the Company did not design and maintain effective internal control over (i) the accounting for business combinations, including (a) allocating goodwill to its international businesses and (b) deferred income taxes recorded in connection with business combinations, and (ii) the accounting for income taxes. A material weakness is a deficiency, or a combination of deficiencies, in internal control over financial reporting, such that there is a reasonable possibility that a material misstatement of the annual or interim financial statements will not be prevented or detected on a timely basis. The material weaknesses referred to above are described in Management’s Report on Internal Control Over Financial Reporting appearing under item 9A. We considered these material weaknesses in determining the nature, timing, and extent of audit tests applied in our audit of the 2016 consolidated financial statements and our opinion regarding the effectiveness of the Company’s internal control over financial reporting does not affect our opinion on those consolidated financial statements. The Company’s management is responsible for these financial statements, for maintaining effective internal control over financial reporting and for its assessment of the effectiveness of internal control over financial reporting included in management’s report referred to above. Our responsibility is to express opinions on these financial statements and on the Company’s internal control over financial reporting based on our integrated audits. We did not audit the financial statements of Wuxi Weifu Autocam Precision Machinery Co. Ltd, a 49% equity investment of the Company, as of and for the year ended December 31, 2016, which is reflected in the consolidated financial statements of the Company as an investment in joint venture of $40,694,000 as of December 31, 2016 and share of net income from joint venture of $6,427,000 for the year ended December 31, 2016. Those financial statements were audited by other auditors whose report thereon has been furnished to us, and our opinion expressed herein, insofar as it relates to the amounts included for Wuxi Weifu Autocam Precision Machinery Co. Ltd as of and for the year ended December 31, 2016, is based solely on the report of the other auditors. We conducted our audits in accordance with the standards of the Public Company Accounting Oversight Board (United States). Those standards require that we plan and perform the audits to obtain reasonable assurance about whether the financial statements are free of material misstatement and whether effective internal control over financial reporting was maintained in all material respects. Our audits of the financial statements included examining, on a test basis, evidence supporting the amounts and disclosures in the financial statements, assessing the accounting principles used and significant estimates made by management, and evaluating the overall financial statement presentation. Our audit of internal control over financial reporting included obtaining an understanding of internal control over financial reporting, assessing the risk that a material weakness exists, and testing and evaluating the design and operating effectiveness of internal control based on the assessed risk. Our audits also included performing such other procedures as we considered necessary in the circumstances. We believe that our audits and the report of other auditors provide a reasonable basis for our opinions.
As discussed in Note 1 to the consolidated financial statements, the Company changed the manner in which it accounts for inventory and the manner in which it classifies deferred income taxes in 2016.
A company’s internal control over financial reporting is a process designed to provide reasonable assurance regarding the reliability of financial reporting and the preparation of financial statements for external purposes in accordance with generally accepted accounting principles. A company’s internal control over financial reporting includes those policies and procedures that (i) pertain to the maintenance of records that, in reasonable detail, accurately and fairly reflect the transactions and dispositions of the assets of the company; (ii) provide reasonable assurance that transactions are recorded as necessary to permit preparation of financial statements in accordance with generally accepted accounting principles, and that receipts and expenditures of the company are being made only in accordance with authorizations of management and directors of the company; and (iii) provide reasonable assurance regarding prevention or timely detection of unauthorized acquisition, use, or disposition of the company’s assets that could have a material effect on the financial statements.
Because of its inherent limitations, internal control over financial reporting may not prevent or detect misstatements. Also, projections of any evaluation of effectiveness to future periods are subject to the risk that controls may become inadequate because of changes in conditions, or that the degree of compliance with the policies or procedures may deteriorate.
/s/ PricewaterhouseCoopers LLP
Charlotte, North Carolina
March 16, 2017
37
Table of Contents
NN, Inc.
December 31, 2016 and 2015
(In thousands, except per share data)
| (in thousands, except per share data) |
||||||||
| 2016 | 2015 | |||||||
| Assets |
||||||||
| Current assets: |
||||||||
| Cash |
$ | 14,405 | $ | 15,087 | ||||
| Accounts receivable, net |
139,547 | 123,005 | ||||||
| Inventories |
114,851 | 119,836 | ||||||
| Income tax receivable |
— | 3,989 | ||||||
| Current deferred tax assets |
— | 6,696 | ||||||
| Other current assets |
11,752 | 11,568 | ||||||
|
|
|
|
|
|||||
| Total current assets |
280,555 | 280,181 | ||||||
| Property, plant and equipment, net |
322,953 | 318,968 | ||||||
| Goodwill, net |
450,311 | 449,898 | ||||||
| Intangible assets, net |
255,981 | 282,169 | ||||||
| Non-current deferred tax assets |
— | 742 | ||||||
| Investment in joint venture |
40,694 | 38,462 | ||||||
| Other non-current assets |
9,892 | 10,147 | ||||||
|
|
|
|
|
|||||
| Total assets |
$ | 1,360,386 | $ | 1,380,567 | ||||
|
|
|
|
|
|||||
| Liabilities and Stockholders’ Equity |
||||||||
| Current liabilities: |
||||||||
| Accounts payable |
$ | 75,719 | $ | 69,101 | ||||
| Accrued salaries, wages and benefits |
24,996 | 21,125 | ||||||
| Income taxes payable |
2,125 | 5,350 | ||||||
| Current maturities of long-term debt |
12,751 | 11,714 | ||||||
| Current portion of obligation under capital lease |
3,762 | 4,786 | ||||||
| Other current liabilities |
19,263 | 21,275 | ||||||
|
|
|
|
|
|||||
| Total current liabilities |
138,616 | 133,351 | ||||||
| Non-current deferred tax liabilities |
99,591 | 117,459 | ||||||
| Long-term debt, net of current portion |
785,713 | 795,400 | ||||||
| Accrued post-employment benefits |
5,765 | 6,157 | ||||||
| Obligation under capital lease, net of current portion |
5,851 | 9,573 | ||||||
| Other |
9,651 | 4,746 | ||||||
|
|
|
|
|
|||||
| Total liabilities |
1,045,187 | 1,066,686 | ||||||
| Commitments and Contingencies (Note 15) |
||||||||
| Stockholders’ equity: |
||||||||
| Common stock—$0.01 par value, authorized 45,000 shares, issued and outstanding 27,249 in 2016 and 26,849 in 2015 |
272 | 269 | ||||||
| Additional paid-in capital |
284,508 | 277,582 | ||||||
| Retained earnings |
55,509 | 55,151 | ||||||
| Accumulated other comprehensive income |
(25,122 | ) | (19,153 | ) | ||||
| Non-controlling interest |
32 | 32 | ||||||
|
|
|
|
|
|||||
| Total stockholders’ equity |
315,199 | 313,881 | ||||||
|
|
|
|
|
|||||
| Total liabilities and stockholders’ equity |
$ | 1,360,386 | $ | 1,380,567 | ||||
|
|
|
|
|
|||||
See accompanying notes to consolidated financial statements
38
Table of Contents
NN, Inc.
Consolidated Statements of Operations and Comprehensive Income (Loss)
Years ended December 31, 2016, 2015 and 2014
(In thousands, except per share data)
| (in thousands, except per share data) |
2016 | 2015 | 2014 | |||||||||
| Net sales |
$ | 833,488 | $ | 667,280 | $ | 488,601 | ||||||
| Cost of products sold (exclusive of depreciation and amortization shown separately below) |
621,022 | 525,993 | 384,889 | |||||||||
| Selling, general and administrative |
80,266 | 51,745 | 43,756 | |||||||||
| Acquisition related costs excluded from selling, general and administrative |
— | 11,682 | 9,248 | |||||||||
| Depreciation and amortization |
62,488 | 44,482 | 22,146 | |||||||||
| (Gain) loss on disposal of assets |
288 | (687 | ) | — | ||||||||
| Restructuring and integration |
10,024 | 7,268 | 875 | |||||||||
|
|
|
|
|
|
|
|||||||
| Income from operations |
59,400 | 26,797 | 27,687 | |||||||||
| Interest expense |
63,154 | 29,899 | 10,895 | |||||||||
| Write-off of unamortized debt issuance costs |
3,089 | 18,673 | 1,398 | |||||||||
| Derivative payments on interest rate swap |
609 | — | — | |||||||||
| Derivative losses on change in interest rate swap fair value |
2,448 | — | — | |||||||||
| Other (income) expense, net |
(2,591 | ) | 1,175 | 2,222 | ||||||||
|
|
|
|
|
|
|
|||||||
| Income (loss) before provision (benefit) for income taxes and share of net income from joint venture |
(7,309 | ) | (22,950 | ) | 13,172 | |||||||
| Provision (benefit) expense for income taxes |
(9,313 | ) | (10,518 | ) | 5,786 | |||||||
| Share of net income from joint venture |
5,938 | 5,001 | 831 | |||||||||
|
|
|
|
|
|
|
|||||||
| Net income (loss) |
$ | 7,942 | $ | (7,431 | ) | $ | 8,217 | |||||
|
|
|
|
|
|
|
|||||||
| Other comprehensive income (loss): |
||||||||||||
| Change in fair value of interest rate hedge |
3,015 | (2,584 | ) | (431 | ) | |||||||
| Foreign currency translation gain (loss) |
(8,984 | ) | (21,936 | ) | (17,731 | ) | ||||||
|
|
|
|
|
|
|
|||||||
| Other comprehensive income (loss) |
(5,969 | ) | (24,520 | ) | (18,162 | ) | ||||||
|
|
|
|
|
|
|
|||||||
| Comprehensive income (loss) |
$ | 1,973 | $ | (31,951 | ) | $ | (9,945 | ) | ||||
|
|
|
|
|
|
|
|||||||
| Basic income per share: |
||||||||||||
| Net income |
$ | 0.29 | $ | (0.35 | ) | $ | 0.46 | |||||
|
|
|
|
|
|
|
|||||||
| Weighted average shares outstanding |
27,016 | 21,181 | 17,887 | |||||||||
|
|
|
|
|
|
|
|||||||
| Diluted income per share: |
||||||||||||
| Net income |
$ | 0.29 | $ | (0.35 | ) | $ | 0.45 | |||||
|
|
|
|
|
|
|
|||||||
| Weighted average shares outstanding |
27,154 | 21,181 | 18,253 | |||||||||
|
|
|
|
|
|
|
|||||||
| Cash dividends per common share |
$ | 0.28 | $ | 0.28 | $ | 0.28 | ||||||
|
|
|
|
|
|
|
|||||||
See accompanying notes to consolidated financial statements
39
Table of Contents
NN, Inc.
Consolidated Statements of Changes in Stockholders’ Equity
Years ended December 31, 2016, 2015 and 2014
(In thousands)
| Common Stock | Accumulated | |||||||||||||||||||||||||||
| Number | Additional | other | Non- | |||||||||||||||||||||||||
| of | Par | paid in | Retained | comprehensive | controlling | |||||||||||||||||||||||
| (in thousands of dollars and shares) | shares | value | capital | earnings | income | interest | Total | |||||||||||||||||||||
| Balance, December 31, 2013 |
17,630 | $ | 176 | $ | 63,126 | $ | 65,929 | $ | 23,529 | $ | — | $ | 152,760 | |||||||||||||||
| Net income |
— | — | — | 8,217 | — | — | 8,217 | |||||||||||||||||||||
| Dividends declared |
— | — | — | (5,131 | ) | — | — | (5,131 | ) | |||||||||||||||||||
| Stock option expense |
— | — | 1,274 | — | — | — | 1,274 | |||||||||||||||||||||
| Shares issued for option exercises |
152 | 2 | 1,669 | — | — | — | 1,671 | |||||||||||||||||||||
| Shares issued for acquisition |
1,087 | 11 | 31,706 | — | — | — | 31,717 | |||||||||||||||||||||
| Restricted stock compensation expense |
114 | 1 | 1,320 | — | — | — | 1,321 | |||||||||||||||||||||
| Non-controlling interest |
— | — | — | — | — | 32 | 32 | |||||||||||||||||||||
| Foreign currency translation loss |
— | — | — | — | (17,731 | ) | — | (17,731 | ) | |||||||||||||||||||
| Change in fair value of interest rate hedge |
— | — | — | — | (431 | ) | — | (431 | ) | |||||||||||||||||||
|
|
|
|
|
|
|
|
|
|
|
|
|
|
|
|||||||||||||||
| Balance, December 31, 2014 |
18,983 | $ | 190 | $ | 99,095 | $ | 69,015 | $ | 5,367 | $ | 32 | $ | 173,699 | |||||||||||||||
| Net loss |
— | — | — | (7,431 | ) | — | — | (7,431 | ) | |||||||||||||||||||
| Dividends declared |
— | — | — | (6,433 | ) | — | — | (6,433 | ) | |||||||||||||||||||
| Stock option expense |
— | — | 915 | — | — | — | 915 | |||||||||||||||||||||
| Shares issued for option exercises |
179 | 2 | 2,039 | — | — | — | 2,041 | |||||||||||||||||||||
| Shares issued in public offering |
7,590 | 76 | 172,976 | — | — | — | 173,052 | |||||||||||||||||||||
| Restricted stock compensation expense |
115 | 1 | 2,788 | — | — | — | 2,789 | |||||||||||||||||||||
| Restricted shares forgiven for taxes |
(18 | ) | — | (231 | ) | — | — | — | (231 | ) | ||||||||||||||||||
| Foreign currency translation loss |
— | — | — | — | (21,936 | ) | — | (21,936 | ) | |||||||||||||||||||
| Change in fair value of interest rate hedge |
— | — | — | — | (2,584 | ) | — | (2,584 | ) | |||||||||||||||||||
|
|
|
|
|
|
|
|
|
|
|
|
|
|
|
|||||||||||||||
| Balance, December 31, 2015 |
26,849 | $ | 269 | $ | 277,582 | $ | 55,151 | $ | (19,153 | ) | $ | 32 | $ | 313,881 | ||||||||||||||
| Net income |
— | — | — | 7,942 | — | — | 7,942 | |||||||||||||||||||||
| Dividends paid |
— | — | — | (7,584 | ) | — | — | (7,584 | ) | |||||||||||||||||||
| Stock option expense |
— | — | 687 | — | — | — | 687 | |||||||||||||||||||||
| Shares issued for option exercises |
270 | 3 | 2,829 | — | — | — | 2,832 | |||||||||||||||||||||
| Restricted and performance based stock compensation expense |
142 | — | 3,583 | — | — | — | 3,583 | |||||||||||||||||||||
| Restricted shares forgiven for taxes and forfeited |
(12 | ) | — | (173 | ) | — | — | — | (173 | ) | ||||||||||||||||||
| Foreign currency translation loss |
— | — | — | — | (8,984 | ) | — | (8,984 | ) | |||||||||||||||||||
| Change in fair value of interest rate swap |
— | — | — | — | 3,015 | — | 3,015 | |||||||||||||||||||||
|
|
|
|
|
|
|
|
|
|
|
|
|
|
|
|||||||||||||||
| Balance, December 31, 2016 |
27,249 | $ | 272 | $ | 284,508 | $ | 55,509 | $ | (25,122 | ) | $ | 32 | $ | 315,199 | ||||||||||||||
|
|
|
|
|
|
|
|
|
|
|
|
|
|
|
|||||||||||||||
See accompanying notes to consolidated financial statements
40
Table of Contents
NN, Inc.
Consolidated Statements of Cash Flows
Years ended December 31, 2016, 2015 and 2014
(In thousands)
| (in thousands of dollars) |
2016 | 2015 | 2014 | |||||||||
| Cash flows from operating activities: |
||||||||||||
| Net income |
$ | 7,942 | $ | (7,431 | ) | $ | 8,217 | |||||
| Adjustments to reconcile net income to net cash provided by operating activities: |
||||||||||||
| Depreciation and amortization |
62,488 | 44,482 | 22,146 | |||||||||
| Amortization of debt issuance costs |
4,168 | 1,754 | 844 | |||||||||
| Interest rate swap: |
||||||||||||
| Total derivative losses (gains), net |
2,563 | — | — | |||||||||
| Debt issuance costs write-off |
3,089 | 18,673 | 1,398 | |||||||||
| Joint venture net income in excess of cash received |
(2,232 | ) | (3,672 | ) | (831 | ) | ||||||
| (Gain) loss on disposals of property, plant and equipment |
288 | (687 | ) | — | ||||||||
| Allowance for doubtful accounts |
142 | 745 | 208 | |||||||||
| Compensation expense from issuance of restricted stock and incentive stock options |
4,270 | 3,704 | 2,595 | |||||||||
| Deferred income tax benefit |
(10,430 | ) | (16,878 | ) | (1,333 | ) | ||||||
| Restructuring and impairment charges |
||||||||||||
| Changes in operating assets and liabilities: |
||||||||||||
| Accounts receivable |
(18,505 | ) | (1,343 | ) | (3,283 | ) | ||||||
| Inventories |
4,377 | (1,843 | ) | (9,836 | ) | |||||||
| Other current assets |
(269 | ) | (944 | ) | (1,624 | ) | ||||||
| Other non-current assets |
1,833 | (1,501 | ) | (4,828 | ) | |||||||
| Accounts payable |
7,633 | (6,748 | ) | 9,497 | ||||||||
| Other liabilities |
1,946 | 4,999 | 7,538 | |||||||||
|
|
|
|
|
|
|
|||||||
| Net cash provided by operating activities |
69,303 | 33,310 | 30,708 | |||||||||
|
|
|
|
|
|
|
|||||||
| Cash flows from investing activities: |
||||||||||||
| Acquisition of property, plant and equipment |
(43,820 | ) | (38,553 | ) | (27,602 | ) | ||||||
| Proceeds from measurement period adjustments to previous acquisition |
1,635 | — | — | |||||||||
| Proceeds from disposals of property, plant and equipment |
839 | 2,995 | 1,374 | |||||||||
| Cash paid to acquire businesses, net of cash received |
— | (628,281 | ) | (257,664 | ) | |||||||
| Capital contributions to joint venture |
— | (1,999 | ) | — | ||||||||
| Dividend received from joint venture |
— | — | 2,284 | |||||||||
|
|
|
|
|
|
|
|||||||
| Net cash used by investing activities |
(41,346 | ) | (665,838 | ) | (281,608 | ) | ||||||
|
|
|
|
|
|
|
|||||||
| Cash flows from financing activities: |
||||||||||||
| Debt issue costs paid |
(3,952 | ) | (35,189 | ) | (9,380 | ) | ||||||
| Dividends Paid |
(7,584 | ) | (6,433 | ) | (5,131 | ) | ||||||
| Proceeds from long-term debt |
— | 885,000 | 344,750 | |||||||||
| Repayment of long-term debt |
(30,000 | ) | (401,438 | ) | (40,880 | ) | ||||||
| Proceeds from short-term debt, net |
18,544 | (84 | ) | 359 | ||||||||
| Proceeds from shares issued |
2,832 | 173,052 | — | |||||||||
| Proceeds from issuance of stock and exercise of stock options |
— | 2,041 | 1,671 | |||||||||
| Payment for acquisition of non-controlling interest |
— | — | (2,528 | ) | ||||||||
| Principal payments on capital lease |
(4,148 | ) | (5,098 | ) | (1,888 | ) | ||||||
|
|
|
|
|
|
|
|||||||
| Net cash provided by (used in) financing activities |
(24,308 | ) | 611,851 | 286,973 | ||||||||
|
|
|
|
|
|
|
|||||||
| Effect of exchange rate changes on cash flows |
(4,331 | ) | (1,553 | ) | (1,795 | ) | ||||||
| Net change in cash and cash equivalents |
(682 | ) | (22,230 | ) | 34,278 | |||||||
| Cash and cash equivalents at beginning of year |
15,087 | 37,317 | 3,039 | |||||||||
|
|
|
|
|
|
|
|||||||
| Cash and cash equivalents at end of year |
$ | 14,405 | $ | 15,087 | $ | 37,317 | ||||||
|
|
|
|
|
|
|
|||||||
| Supplemental schedule of non-cash operating, investing and financing activities: |
||||||||||||
| Compensation expense for stock awards, ($2,285 in 2016, $2,399 in 2015, and $1,321 in 2014) stock option expense ($825 in 2016, $915 in 2015, and $1,274 in 2014), performance based stock units ($1,159 in 2016, $393 in 2015) included in stockholders’ equity |
$ | 4,270 | $ | 3,704 | $ | 2,595 | ||||||
| Shares issued in acquisition of Autocam |
$ | — | $ | — | $ | 37,717 | ||||||
| Restructuring charges in Other Liabilities |
$ | 283 | $ | 4,362 | $ | 875 | ||||||
| Cash paid for interest and income taxes: |
||||||||||||
| Interest |
$ | 59,158 | $ | 20,146 | $ | 8,307 | ||||||
| Income taxes |
$ | 889 | $ | 6,377 | $ | 5,747 | ||||||
See accompanying notes to consolidated financial statements
41
Table of Contents
NN, Inc.
Notes to Consolidated Financial Statements
December 31, 2016, 2015 and 2014
(In thousands, except per share data)
| 1) | Summary of Significant Accounting Policies and Practices |
| a) | Description of Business |
NN, Inc. is a diversified industrial company and a leading global manufacturer of high precision bearing components, industrial plastic products and precision metal components to a variety of markets on a global basis. We have 40 manufacturing plants in North America, Western Europe, Eastern Europe, South America and Asia. As used in this Annual Report on Form 10-K, the terms “NN,” the “Company,” “we,” “our,” or “us” mean NN, Inc. and its subsidiaries.
Included in the Selling, general and administrative expense line item in the Consolidated Statement of Operations during the years ended December 31, 2015 and 2014 are out of period adjustments in the amounts of approximately $0.2 million, respectively, to correct compensation expense recorded with respect to share based awards previously granted to executives who, either at the time of such grant or during the applicable vesting period, were eligible to retire from the Company, upon which the vesting of all or a portion of these awards would be accelerated.
All dollar amounts presented in tables that follow are in thousands (except for share data) unless otherwise indicated.
| b) | Cash |
We consider all highly liquid investments with an original maturity of three months or less as cash equivalents.
| c) | Inventories |
Inventories are stated at the lower of cost or net realizable value. Cost is determined using the average cost method which approximates the first in first out method. Our policy is to expense abnormal amounts of idle facility expense, freight, handling cost, and waste included in cost of products sold. In addition, we allocate fixed production overheads based on the normal production capacity of our facilities. Inventory valuations were developed using normalized production capacities for each of our manufacturing locations and the costs from excess capacity or under-utilization of fixed production overheads were expensed in the period incurred and are not included as a component of inventory valuation.
Inventories also include tools, molds and dies in progress that we are producing and will ultimately sell to our customers. This activity is principally related to our Autocam Precision Components and Precision Engineered Products Groups. These inventories are carried at the lower of cost or net realizable value.
| d) | Property, Plant and Equipment |
Property, plant and equipment are stated at cost less accumulated depreciation. Assets to be disposed of are stated at lower of depreciated cost or fair market value less estimated selling costs. Expenditures for maintenance and repairs are charged to expense as incurred. Major renewals and betterments are capitalized. When a property item is retired, its cost and related accumulated depreciation are removed from the property accounts and any gain or loss is recorded in the consolidated Statements of Operations and comprehensive income. We review the carrying values of long-lived assets for impairment whenever events or changes in circumstances indicate the carrying amount of an asset may not be recoverable. Property, plant and equipment includes tools, molds and dies principally used in our Autocam Precision Components and Precision Engineered Products Groups that are our property.
Depreciation is provided on the straight-line method over the estimated useful lives of the depreciable assets for financial reporting purposes. For leasehold improvements and buildings under capital lease, we depreciate these over the shorter of useful lives or the lease term. In the event we abandon and cease to use certain property, plant, and equipment, depreciation estimates are revised and, in most cases, depreciation expense will be accelerated to reflect the shortened useful life of the asset.
| e) | Revenue Recognition |
We recognize revenues based on the stated shipping terms with customers when these terms are satisfied and the risks of ownership are transferred to the customers. We have an inventory management program for certain Precision Bearing Components Group customers whereby revenue is recognized when products are used by customers from consigned stock, rather than at the time of shipment. Under both circumstances, revenue is recognized when persuasive evidence of an arrangement exists, delivery has occurred, the sellers’ price is fixed and determinable and collectability is reasonably assured.
42
Table of Contents
| f) | Accounts Receivable |
Accounts receivable are recorded upon recognition of a sale of goods and ownership and risk of loss is assumed by the customer. Substantially all of our accounts receivable are due primarily from the core served markets. In establishing allowances for doubtful accounts, we perform credit evaluations of our customers, considering numerous inputs when available including the customers’ financial position, past payment history, relevant industry trends, cash flows, management capability, historical loss experience and economic conditions and prospects. Accounts receivable are written off or allowances established when considered to be uncollectible or at risk of being uncollectible, respectively.
| g) | Income Taxes |
Income taxes are accounted for under the asset and liability method. Deferred tax assets and liabilities are recognized for the future tax consequences attributable to differences between the financial statement carrying amounts of existing assets and liabilities and their respective tax bases and operating loss and tax credit carry forwards. Deferred tax assets and liabilities are measured using enacted tax rates expected to apply to taxable income in the years in which those temporary differences are expected to be recovered or settled. The effect on deferred tax assets and liabilities of a change in tax rates is recognized in income in the period that includes the enactment date. Valuation allowances are recorded to reduce deferred tax assets when it is more likely than not that a tax benefit will not be realized. Provision has not been made for income taxes on unremitted earnings of foreign subsidiaries as these earnings are deemed to be permanently reinvested. We recognize income tax positions that meet the more likely than not threshold and accrue interest and potential penalties related to unrecognized income tax positions which are recorded as a component of the provision (benefit) for income taxes.
| h) | Net Income Per Common Share |
Basic income per share reflects reported earnings divided by the weighted average number of common shares outstanding. Diluted income per share include the effect of dilutive stock options and the respective tax benefits, unless inclusion would not be dilutive.
| i) | Share Based Compensation |
The cost of stock options, stock awards and performance based stock units are expensed as compensation expense over the vesting periods based on the fair value at the grant date. (See Note 9 of the Notes to the Consolidated Financial Statements) We use the Black Scholes financial pricing model for our stock options, and a Monte Carlo simulation for the performance based stock units to determine the fair value as these awards as they are not traded in open markets.
We account for stock awards by recognizing compensation expense ratably over the vesting period as specified in the award. Compensation expense to be recognized is based on the stock price at date of grant.
| j) | Principles of Consolidation |
Our consolidated financial statements include the accounts of NN, Inc. and its subsidiaries. All of our subsidiaries are 100% owned (except for RFK which we own 99.7% and our Chinese joint venture noted below) and all are included in the consolidated financial statements for the years ended December 31, 2016, 2015 and 2014. All significant intercompany profits, transactions, and balances have been eliminated in consolidation. With the acquisition of Autocam Corporation (“Autocam”) during 2014, we acquired a 49% interest in a Chinese joint venture. This joint venture is not consolidated within the financial statements of NN, Inc. and is accounted for under the equity method (see Note 16 of the Notes to the Consolidated Financial Statements).
| k) | Foreign Currency Translation |
Assets and liabilities of our foreign subsidiaries are translated at current exchange rates, while revenue, costs and expenses are translated at average rates prevailing during each reporting period. Translation adjustments arising from the translation of foreign subsidiary financial statements are reported as a component of other comprehensive income and accumulated other comprehensive income within stockholders’ equity. In addition, transactions denominated in foreign currencies, including intercompany transactions, are initially recorded at the current exchange rate at the date of the transaction. The balances are adjusted to the current exchange rate as of each balance sheet date and as of the date when the transaction is consummated. Transaction gains or losses, excluding intercompany loan transactions, are expensed in either cost of products sold or selling, general and administrative lines in the Consolidated Statements of Operations and Comprehensive Income (Loss) as incurred and were immaterial to the years ended December 31, 2016, 2015 and 2014. Transaction gains or losses on intercompany loan transactions are recognized in the other income, net line in the Consolidated Statements of Operations and Comprehensive Income (Loss) as incurred.
43
Table of Contents
| l) | Goodwill and Other Indefinite Lived Intangible Assets |
We recognize the excess of the purchase price of an acquired entity over the fair value of the net identifiable assets as goodwill. Goodwill is tested for impairment on an annual basis as of October 1 and between annual tests if a triggering event occurs. The impairment procedures are performed at the reporting unit level for the reporting units that have goodwill. In September 2011, the FASB issued a revised accounting standard, intended to reduce the cost and complexity of the annual goodwill impairment test by providing entities an option to perform a “qualitative” assessment to determine whether further impairment testing is necessary. Specifically, an entity has the option to first assess qualitative factors to determine whether it is necessary to perform the current two-step test. If an entity believes, as a result of its qualitative assessment, that it is more-likely-than-not that the fair value of a reporting unit is less than its carrying amount, the quantitative impairment test is required. Otherwise, no further testing is required. For the years ended, December 31, 2016 and 2015, we determined it was more appropriate to perform a full step 1 goodwill test. The decision to perform a qualitative assessment or a complete step 1 analysis is an annual decision made by management. Based on the results of the step 1 analysis fair value of the reporting units exceeded the carrying value of the reporting units at December 31, 2016 and 2015.
If the qualitative assessment indicates it is more likely than not that the fair value is less than the carrying value, GAAP prescribes a two-step process for testing for goodwill impairments. The first step is to determine if the carrying value of the reporting unit with goodwill is less than the related fair value of the reporting unit. We consider three main approaches to value (cost, market and income) the fair value of the reporting unit and market based multiples of earning and sales methods obtained from a grouping of comparable publicly trading companies. We believe this methodology of valuation is consistent with how market participants would value reporting units. The discount rate and market based multiples used are specifically developed for the unit tested regarding the level of risk and end markets served. Even though we do use other observable inputs (Level 2 inputs) the calculation of fair value for goodwill would be most consistent with Level 3 inputs.
If the carrying value of the reporting unit including goodwill is less than fair value of the reporting unit, the goodwill is not considered impaired. If the carrying value is greater than fair value then the potential for impairment of goodwill exists. The potential impairment is determined by allocating the fair value of the reporting unit among the assets and liabilities based on a purchase price allocation methodology as if the reporting unit was acquired in a business combination. The fair value of the goodwill is implied from this allocation and compared to the carrying value with an impairment loss recognized if the carrying value is greater than the implied fair value.
We base our fair value estimates, in large part, on management business plans and projected financial information which are subject to a high degree of management judgment and complexity. Actual results may differ from projections and the differences may be material.
| m) | Impairment of Long-Lived Assets and Long-Lived Assets to Be Disposed Of |
Long-lived tangible and intangible assets subject to amortization are tested for recoverability when changes in circumstances indicate the carrying value of these assets may not be recoverable. A test for recoverability is also performed when management has committed to a plan to dispose of a reporting unit or asset group. Assets to be held and used are tested for recoverability when indications of impairment are evident. Recoverability of a long-lived tangible and intangible asset is evaluated by comparing its carrying value to the future estimated undiscounted cash flows expected to be generated by the asset or asset group. If the asset is not recoverable the asset is considered impaired and adjusted to fair value which is then depreciated/amortized over its remaining useful life. Assets to be disposed of are carried at the lesser of carrying value or fair value less costs of disposal.
| n) | Use of Estimates in the Preparation of Financial Statements |
The preparation of financial statements in conformity with accounting principles generally accepted in the United States requires management to make estimates and assumptions that affect the reported amounts of assets and liabilities and disclosure of contingent assets and liabilities at the date of the financial statements and the reported amounts of revenues and expenses during the reporting period. Actual results could differ from those estimates.
| o) | Fair Value Measurements |
Fair value principles prioritize valuation inputs across three broad levels. Level 1 inputs are quoted prices (unadjusted) in active markets for identical assets or liabilities. Level 2 inputs are quoted prices for similar assets and liabilities in active markets or inputs that are observable for the asset or liability, either directly or indirectly through market corroboration, for substantially the full term of the financial instrument. Level 3 inputs are unobservable inputs based on the assumptions used to measure assets and liabilities at fair value. An asset or liability’s classification within the various levels is determined based on the lowest level input that is significant to the fair value measurement.
44
Table of Contents
| p) | Recently Issued Accounting Standards |
In 2014, the Financial Accounting Standards Board (FASB) and International Accounting Standards Board (IASB) issued the joint revenue recognition standard. Since its release, there have been multiple proposed and finalized amendments made to the revenue recognition standard. The revenue recognition standard is effective for public companies beginning January 1, 2018 with full retrospective or modified retrospective adoption permitted. This standard will change current revenue practices, processes, systems, controls, and disclosures and take time and resources to adopt. Factors that will affect pre and post-implementation include, but are not limited to, identifying all the contracts that exist and whether incidental obligations or marketing incentives included in those contracts are performance obligations. The revenue recognition standard may impact the timing of when revenue received under these performance obligations is recognized. We are in the scoping, performing contract analysis and the development phase of understanding the likely impacts of the standard change that can affect key processes, systems and controls.
On February 25, 2016, the FASB issued ASU 2016-02, Leases (“ASU 2016-02”). ASU 2016-02 creates Topic 842, Leases, in the FASB Accounting Standards Codification (“FASB ASC”) and supersedes FASB ASC 840, Leases. Entities that hold numerous equipment and real estate leases, in particular those with numerous operating leases, will be most affected by the new guidance. The leasing accounting standard is effective for public companies beginning January 1, 2019 with modified retrospective adoption required and early adoption permitted. The amendments in ASU 2016-02 are expected to impact balance sheets at many companies by adding lease-related assets and liabilities. This may affect compliance with contractual agreements and loan covenants. As noted in Item 2. Properties, we list various leased locations. We have also carried out inquiries within segment locations compiling information on operating and capital leases. We are currently evaluating the impacts of the lease accounting standards regarding these and other leases identified on our financial position or results of operations and related disclosures.
On August 27, 2014, the FASB issued ASU 2014-15, Presentation of Financial Statements – Going Concern, (“ASU 2014-15”) which provides guidance on determining when and how to disclose going-concern uncertainties in the financial statements. The new standard requires management to perform interim and annual assessments of an entity’s ability to continue as a going concern within one year of the date the financial statements are issued. An entity must provide certain disclosures if “conditions or events raise substantial doubt about the entity’s ability to continue as a going concern.” ASU 2014-15 applies to all entities and is effective for annual periods ending after December 15, 2016, and interim periods thereafter, with early adoption permitted. We adopted ASU 2014-15 beginning December 31, 2016, which involved adding policies and procedures around our assessments to continue as a going concern. Per our quantitative and qualitative analysis, currently there is no substantial doubt as to our ability to continue as a going concern within the next twelve months.
During March 2016, ASU 2016-09 –Improvements to Employee Share-Based Payment Accounting was issued regarding he guidance of how companies will account for certain aspects of share-based payments to employees. Entities will be required to recognize the income tax effects of awards in the income statement when the awards vest or are settled (i.e., additional paid-in capital or APIC pools will be eliminated). The guidance on employers’ accounting for an employee’s use of shares to satisfy the employer’s statutory income tax withholding obligation and for forfeitures is changing. The guidance is effective for public business entities for fiscal years beginning after 15 December 2016, and interim periods within those fiscal years. For all other entities, it is effective for fiscal years beginning after 15 December 2017, and interim periods within fiscal years beginning after 15 December 2018. Early adoption is permitted in any annual or interim period for which financial statements haven’t been issued or made available for issuance, but all of the guidance must be adopted in the same period. If an entity early adopts the guidance in an interim period, any adjustments must be reflected as of the beginning of the fiscal year that includes that interim period.
The FASB issued ASU 2016-15, Statement of Cash Flows (Topic 230): Classification of Certain Cash Receipts and Cash Payments (“ASU 2016-15”). This ASU provides clarification on how certain cash receipts and cash payments are presented and classified on the statement of cash flows. This ASU is effective for annual and interim periods beginning in 2018 and is required to be adopted using a retrospective approach if practicable, with early adoption permitted. The Company does not expect the adoption of this ASU to have a material impact on its Consolidated Statement of Cash Flows. We are currently evaluating the impact this new guidance is expected to have on our financial position or results of operations and related disclosures.
During January 2017, the FASB issued ASU 2017-04 – Simplifying the Test for Goodwill Impairment that eliminates the requirement to calculate the implied fair value of goodwill (i.e., Step 2 of today’s goodwill impairment test) to measure a goodwill impairment charge. Instead, entities will record an impairment charge based on the excess of a reporting unit’s carrying amount over its fair value (i.e., measure the charge based on today’s Step 1). The standard has tiered effective dates, starting in 2020 for calendar-year public business entities that meet the definition of an SEC filer. Early adoption is permitted for interim and annual goodwill impairment testing dates after 1 January 2017. We are currently evaluating the impact this new guidance is expected to have on our financial position or results of operations and related disclosures.
We adopted ASU No. 2015-11, Inventory (Topic 330)-Simplifying the Measurement of Inventory (“ASU 2015-11”), which simplifies the subsequent measurement of inventories by replacing the lower of cost or market test with a lower of cost and net realizable value test. The subsequent measurement of inventory test, historically three measurements under lower of cost or market, is replaced by lower of cost and net realizable value test. Thus, we will compare the cost of inventory to only one measure, its net realizable value. When evidence exists that the net realizable value of inventory is less than its cost (due to damage, physical deterioration, obsolescence, changes in price levels or other causes), we will recognize the difference as a loss in earnings in the period in which it occurs. In accordance with ASU 2015-11, we are applying the new guidance on a prospective basis.
We adopted ASU No. 2015-17, Income Taxes (Topic 740), Balance Sheet Classification of Deferred Taxes (“ASU 2015-17”). We will classify all deferred tax assets and liabilities as noncurrent on the balance sheet instead of separating deferred taxes into current and noncurrent amounts. In addition, we will no longer allocate valuation allowances between current and noncurrent deferred tax assets because those allowances also will be classified as noncurrent. We have elected to apply ASU 2015-17 on a prospective basis. Therefore, the prior periods were not retroactively adjusted.
45
Table of Contents
| q) | Business Combinations |
We allocate the total purchase price of the acquired tangible and intangible assets acquired and liabilities assumed based on their estimated fair values as of the business combination date, with the excess purchase price recorded as goodwill. The purchase price allocation process required us to use significant estimates and assumptions, including fair value estimates, as of the business combination date. Although we believe the assumptions and estimates we have made are reasonable and appropriate, they are based in part on historical experience and information obtained from management of the acquired company, in part based on valuation models that incorporate projections of expected future cash flows and operating plans and are inherently uncertain. Valuations are performed by management or third party valuation specialists under management’s supervision. In determining the fair value of assets acquired and liabilities assumed in business combinations, as appropriate, we may use one of the following recognized valuation methods: the income approach (including discounted cash flows from relief from royalty and excess earnings model), the market approach and/or the replacement cost approach.
Examples of significant estimates used to value certain intangible assets acquired include but are not limited to:
| • | sales volume, pricing and future cash flows of the business overall; |
| • | future expected cash flows from customer relationships, and other identifiable intangible assets, including future price levels, rates of increase in revenue and appropriate attrition rate; |
| • | the acquired company’s brand and competitive position, royalty rate quantum, as well as assumptions about the period of time the acquired brand will continue to benefit to the combined company’s product portfolio; and |
| • | cost of capital, risk-adjusted discount rates and income tax rates. |
However, different assumptions regarding projected performance and other factors associated with the acquired assets may affect the amount recorded under each type of assets and liabilities, mainly between property plant and equipment, intangibles assets, goodwill and deferred income tax liabilities and subsequent assessment could result in future impairment charges. The purchase price allocation process also entails us to refine these estimates over a measurement period not to exceed one year to reflect new information obtained surrounding facts and circumstances existing at acquisition date.
2) Acquisitions
As reported in our 2015 Annual Report, we completed the acquisition (the “PEP Acquisition”) of Precision Engineered Products Holdings, Inc. (“PEP”) on October 19, 2015. During the nine months ended September 30, 2016, we finalized all issues related to customary working capital adjustments, fixed assets and income taxes. The changes primarily arose from differences noted during acquisition integration and finalizing return to provision adjustments. As a result, we adjusted the preliminary allocation of the purchase price initially recorded at the PEP Acquisition date to reflect these measurement period adjustments.
The following table summarizes the final purchase price allocation for the PEP Acquisition:
| As Reported | Subsequent | Final | ||||||||||
| on | Adjustments | as of | ||||||||||
| December 31, | to fair | September 30, | ||||||||||
| 2015 | value | 2016 | ||||||||||
| Consideration: |
||||||||||||
| Cash paid |
$ | 621,196 | $ | — | $ | 621,196 | ||||||
| Cash adjustment |
— | (1,635 | ) | (1,635 | ) | |||||||
|
|
|
|
|
|
|
|||||||
| Total consideration |
$ | 621,196 | $ | (1,635 | ) | $ | 619,561 | |||||
|
|
|
|
|
|
|
|||||||
| Fair value of assets acquired and liabilities assumed on |
||||||||||||
| Current assets |
$ | 69,331 | $ | 452 | $ | 69,783 | ||||||
| Property, plant and equipment |
56,163 | (962 | ) | 55,201 | ||||||||
| Intangible assets subject to amortization |
240,490 | — | 240,490 | |||||||||
| Other non-current assets |
1,500 | — | 1,500 | |||||||||
| Goodwill |
364,450 | (1,805 | ) | 362,645 | ||||||||
|
|
|
|
|
|
|
|||||||
| Total assets acquired |
731,934 | (2,315 | ) | 729,619 | ||||||||
|
|
|
|
|
|
|
|||||||
| Current liabilities |
21,131 | — | 21,131 | |||||||||
| Non-current deferred tax liabilities |
87,578 | (680 | ) | 86,898 | ||||||||
| Other non-current liabilities |
2,029 | — | 2,029 | |||||||||
|
|
|
|
|
|
|
|||||||
| Total liabilities assumed |
110,738 | (680 | ) | 110,058 | ||||||||
|
|
|
|
|
|
|
|||||||
| Net assets acquired |
$ | 621,196 | $ | (1,635 | ) | $ | 619,561 | |||||
|
|
|
|
|
|
|
|||||||
In accordance with generally accepted accounting principles, we have recognized measurement-period adjustments during the period in which we determine the amount of the adjustment, including the effect on earnings of any amounts we would have recorded in previous periods if the accounting had been completed at the acquisition date.
46
Table of Contents
3) Restructuring, Impairment and Integration Charges, excluding Goodwill Impairments, and Divestitures
Restructuring and integration costs totaling $10.0 million and $7.3 million were recognized in the years ended December 31, 2016 and 2015, comprised of initiatives impacting each of our segments.
Within the Precision Bearing Components Group, restructuring initiatives to optimize operations in the U.S., Italy, the Netherlands, Mexico and at segment headquarters resulted in a charge of $4.4 and $2.0 million for the years ended December 31, 2016 and 2015, respectively. These charges consisted primarily of severance and other employee costs relating to personnel reductions.
Within the Autocam Precision Components Group, certain restructuring programs, including the closure of one facility, the Wheeling Plant, resulted in a charge of $4.3 and $2.6 million for the years ended December 31, 2016 and 2015, respectively. These charges consisted of severance costs of $0.8 million, fixed asset impairment of $0.3 million and site closure costs of $3.2 million for 2016.
Within the Precision Engineered Products (“PEP”) Group, initiatives resulted in integration, site closure and employee costs of $1.3 and $0.9 million for the years ended December 31, 2016 and 2015, respectively.
Within the Corporate and Consolidated Segment, a charge of $1.8 million was incurred for an accounting and reporting system that was ultimately never deployed and abandoned for the year ended December 31, 2015.
The following table summarizes restructuring and integration activity related to actions incurred for the years ended December 31, 2016 and 2015:
| Year Ended | ||||||||
| December 31, | ||||||||
| 2016 | 2015 | |||||||
| Severance and other employee costs |
$ | 5,776 | $ | 2,019 | ||||
| Site closure and other associated costs |
3,970 | 4,399 | ||||||
| Integration and other associated costs |
278 | 850 | ||||||
|
|
|
|
|
|||||
| Total |
$ | 10,024 | $ | 7,268 | ||||
|
|
|
|
|
|||||
| Reserve | Reserve | |||||||||||||||
| Balance at | Paid in | Balance at | ||||||||||||||
| December 31, 2015 | Charges | 2016 | December 31, 2016 | |||||||||||||
| Severance and other employee costs |
$ | 2,517 | $ | 5,776 | $ | (5,274 | ) | $ | 3,019 | |||||||
| Site closure and other associated costs |
1,845 | 3,970 | (4,189 | ) | 1,626 | |||||||||||
| Integration and other associated costs |
— | 278 | (278 | ) | — | |||||||||||
|
|
|
|
|
|
|
|
|
|||||||||
| Total |
$ | 4,362 | $ | 10,024 | $ | (9,741 | ) | $ | 4,645 | |||||||
|
|
|
|
|
|
|
|
|
|||||||||
| Reserve | Paid in | Reserve | ||||||||||||||
| Balance at | Balance at | |||||||||||||||
| December 31, 2014 | Charges | 2015 | December 31, 2015 | |||||||||||||
| Severance and other employee costs |
$ | — | $ | 2,691 | $ | (174 | ) | $ | 2,517 | |||||||
| Site closure and other associated costs |
— | 1,925 | $ | (80 | ) | 1,845 | ||||||||||
| Impairment and write-off charges |
— | 2,652 | $ | — | — | |||||||||||
| Integration and other associated costs |
— | — | — | — | ||||||||||||
|
|
|
|
|
|
|
|
|
|||||||||
| Total |
$ | — | $ | 7,268 | $ | (254 | ) | $ | 4,362 | |||||||
|
|
|
|
|
|
|
|
|
|||||||||
The total restructuring and impairment costs are still being identified at the various segments; therefore, we are not able to estimate the ultimate costs at this time. We will include in future filings updates to these activities along with a reconciliation of beginning and ending liabilities recorded. The amounts recorded for the year ended December 31, 2016 for restructuring charges that have been incurred are primarily expected to be paid out during 2017. Some amounts related to foreign locations extend through 2021.
47
Table of Contents
4) Accounts Receivable and Sales Concentrations
| December 31, | ||||||||
| 2016 | 2015 | |||||||
| Trade |
$ | 140,754 | $ | 124,226 | ||||
| Less—allowance for doubtful accounts |
1,207 | 1,221 | ||||||
|
|
|
|
|
|||||
| Accounts receivable, net |
$ | 139,547 | $ | 123,005 | ||||
|
|
|
|
|
|||||
Activity in the allowance for doubtful accounts is as follows:
| Balance at | ||||||||||||||||||||
| Beginning | Write- | Currency | Balance at | |||||||||||||||||
| Description | of Year | Additions | offs | Impacts | End of Year | |||||||||||||||
| December 31, 2016 |
||||||||||||||||||||
| Allowance for doubtful accounts |
$ | 1,221 | $ | 142 | $ | (75 | ) | $ | (81 | ) | $ | 1,207 | ||||||||
| December 31, 2015 |
||||||||||||||||||||
| Allowance for doubtful accounts |
$ | 520 | $ | 745 | $ | (8 | ) | $ | (36 | ) | $ | 1,221 | ||||||||
| December 31, 2014 |
||||||||||||||||||||
| Allowance for doubtful accounts |
$ | 445 | $ | 208 | $ | (123 | ) | $ | (10 | ) | $ | 520 | ||||||||
For the years ended December 31, 2016, 2015 and 2014, sales to AB SKF (“SKF”) amounted to $104.2 million, $105.7 million, and $128.0 million, respectively, or 13%, 16%, and 26% of consolidated revenues, respectively. None of our other customers accounted for more than 10% of our net sales in 2016, 2015 or 2014. SKF was the only customer with accounts receivable concentration in excess of 10% in 2016 and 2015. The outstanding balance as of December 31, 2016 and 2015 for SKF was $20.5 million and $16.2 million, respectively. All revenues and receivables related to SKF are in the Precision Bearing Components Group and Precision Engineered Products Group.
5) Inventories
| December 31, | December 31, | |||||||
| 2016 | 2015 | |||||||
| Raw materials |
$ | 49,205 | $ | 50,204 | ||||
| Work in process |
31,348 | 30,604 | ||||||
| Finished goods |
34,298 | 39,028 | ||||||
|
|
|
|
|
|||||
| Inventories |
$ | 114,851 | $ | 119,836 | ||||
|
|
|
|
|
|||||
Finished goods inventory on consignment at customers’ sites at December 31, 2016 and 2015 was approximately $5.0 million and $5.1 million, respectively.
The inventory valuations above were developed using normalized production capacities for each of our manufacturing locations. Any costs from abnormal excess capacity or under-utilization of fixed production overheads are expensed in the period incurred and are not included as a component of inventory valuation.
6) Property, Plant and Equipment
| Estimated | December 31, | |||||||||||
| Useful Life | 2016 | 2015 | ||||||||||
| Land and buildings |
15-40 years | 96,173 | 97,322 | |||||||||
| Machinery and equipment |
3-12 years | 464,291 | 432,841 | |||||||||
| Construction in process |
21,045 | 16,049 | ||||||||||
|
|
|
|
|
|||||||||
| 581,509 | 546,212 | |||||||||||
| Less—accumulated depreciation |
258,556 | 227,244 | ||||||||||
|
|
|
|
|
|||||||||
| Property, plant and equipment, net |
$ | 322,953 | $ | 318,968 | ||||||||
|
|
|
|
|
|||||||||
48
Table of Contents
During the year ended December 31, 2015, we acquired $59.1 million in property, plant and equipment with the two acquisitions completed during 2015.
For the years ended December 31, 2016, 2015, and 2014, depreciation expense was $36.0 million, $ 31.5 million and $20.8 million, respectively.
7) Debt
Long-term debt and short-term debt at December 31, 2016 and December 31, 2015 consisted of the following:
| Amended | ||||||||
| December 31, | December 31, | |||||||
| 2016 | 2015 | |||||||
| Borrowings under our $545.0 million Senior Secured Term Loan B bearing interest at the greater of 0.75% or 1 month LIBOR (0.77% at December 31, 2016) plus an applicable margin of 4.25% at September 30, 2016, expiring October 19, 2022, net of debt issuance costs of $19.0 million at December 31, 2016 and $20.6 million at December 31, 2015. |
$ | 524,539 | $ | 552,957 | ||||
| Borrowings under our $143.0 million Senior Secured Revolver bearing interest at LIBOR (0.77% at December 31, 2016) plus an applicable margin of 3.50% at September 30, 2016, expiring October 19, 2020, net of debt issuance costs of $2.7 million at December 31, 2016 and $2.9 million at December 31, 2015. |
25,298 | 3,547 | ||||||
| Borrowings under our $250.0 million Senior Notes bearing interest at 10.25%, maturing on November 1, 2020, net of debt issuance costs of $4.9 million at December 31, 2016 and $5.9 million at December 31, 2015. |
245,077 | 244,088 | ||||||
| French Safeguard Obligations (Autocam) |
358 | 2,000 | ||||||
| Brazilian lines of credit and equipment notes (Autocam) |
573 | 826 | ||||||
| Chinese line of credit (Autocam) |
2,619 | 3,696 | ||||||
|
|
|
|
|
|||||
| Total debt |
798,464 | 807,114 | ||||||
| Less current maturities of long-term debt |
12,751 | 11,714 | ||||||
|
|
|
|
|
|||||
| Long-term debt, excluding current maturities of long-term debt |
$ | 785,713 | $ | 795,400 | ||||
|
|
|
|
|
|||||
On October 19, 2015, we: (i) entered into a new senior secured term loan credit facility in the amount of up to $525.0 million (with a $100.0 million accordion feature) and a seven year maturity (as amended, supplemented and/or restated from time to time, the “Term Loan Credit Facility”); (ii) entered into a new senior secured revolving credit facility in the amount of up to $100.0 million with a five year maturity (as amended, supplement and/or restated from time to time, the “Senior Secured Revolving Credit Facility”, and together with the Term Loan Credit Facility, the “Senior Credit Facilities”); and (iii) issued $300.0 million of 10.25% senior notes due 2020 (the “Senior Notes”). On September 30, 2016, we amended and restated the Senior Credit Facilities, which lowered the interest rate and rate floor on the Company’s Senior Secured Term Loan B (the “Term Loan B”). The new applicable rate for the Term Loan B is London Inter Bank Offering Rate (“LIBOR”), subject to a 0.75% rate floor, plus 4.25%, which in combination is 75 basis points lower (or 0.75%) than the previous rate. There were no changes to the maturities or covenants under the Term Loan B. Concurrent with the amended and restated Term Loan B, the Senior Secured Revolving Credit Facility was upsized from $100 million to $133 million. Proceeds were drawn under the Senior Secured Revolving Credit Facility to pay down debt under the Term Loan B, reducing the debt under the Term Loan B to $545 million. During October 2016, an incremental amendment was executed increasing the $133 million Senior Secured Revolving Credit Facility to $143 million. There were no changes to the Senior Secured Revolving Credit Facility maturities, and the covenant threshold was increased from $30 million to $42.9 million (30% drawn threshold). The outcome of the refinancing and debt transactions was lower principal amounts outstanding on the Term Loan B, increased borrowings under the Senior Secured Revolving Credit Facility, resulting in a lower effective interest rate for the overall debt holdings.
In conjunction with the amended and restated Senior Credit Facilities, we incurred $4.0 million in debt issuance costs. We wrote off a total of $2.6 million in debt issuance costs related to the modification and extinguishment of debt.
49
Table of Contents
As part of the merger with Autocam in 2014, we assumed certain foreign credit facilities. These facilities relate to local borrowings in France, Brazil and China. These facilities are with financial institutions in the countries in which foreign plants operate and are used to fund working capital and equipment purchases in those countries. The following paragraphs describe these foreign credit facilities.
Our French operation (acquired with Autocam) has liabilities with certain creditors subject to Safeguard protection. The liabilities are being paid annually over a 10-year period until 2019 and carry a zero percent interest rate. Amounts due as of December 31, 2016 to those creditors opting to be paid over a 10-year period totaled $0.4 million, of which $0.1 million is included in current maturities of long-term debt and $0.3 million is included in long-term debt, net of current portion, on the Condensed Consolidated Balance Sheet.
The Brazilian equipment notes represent borrowings from certain Brazilian banks to fund equipment purchases for Autocam’s Brazilian plants. These credit facilities have annual interest rates ranging from 2.5% to 9.1%.
The Chinese line of credit is a working capital line of credit with a Chinese bank bearing an annual interest rate ranging from 1.4% to 4.6%.
In accordance with generally accepted accounting principles, we have adopted ASU 2015-03, which provides guidance on simplifying the presentation of debt issuance costs on the balance sheet. To simplify presentation of debt issuance costs, the amendments in ASU 2015-03 require that debt issuance costs related to a recognized debt liability be presented in the balance sheet as a direct deduction from the carrying amount of that debt liability, consistent with debt discounts. The following table displays the debt amounts reported as of December 31, 2015, restated for the adoption of ASU 2015-03. The debt issuance costs were reclassified from other non-current assets and directly applied to the associated liability.
| Reported December 31, 2015 |
ASU 2015-13 Reclass |
Amended December 31, 2015 |
||||||||||
| Borrowings under our $575.0* million Senior Secured Term |
$ | 562,580 | $ | (9,623 | ) | $ | 552,957 | |||||
| Borrowings under our $100.0** million Senior Secured Revolver |
6,462 | (2,915 | ) | 3,547 | ||||||||
| Borrowings under our $250.0 million Senior Notes |
244,509 | (421 | ) | 244,088 | ||||||||
| French Safeguard Obligations (Autocam) |
2,000 | 2,000 | ||||||||||
| Brazilian lines of credit and equipment notes (Autocam) |
826 | 826 | ||||||||||
| Chinese line of credit (Autocam) |
3,696 | 3,696 | ||||||||||
|
|
|
|
|
|||||||||
| Total debt |
820,073 | 807,114 | ||||||||||
| Less current maturities of long-term debt |
11,714 | 11,714 | ||||||||||
|
|
|
|
|
|||||||||
| Long-term debt, excluding current maturities of long-term debt |
$ | 808,359 | $ | 795,400 | ||||||||
|
|
|
|
|
|||||||||
| * | Amended from $575 million down to $545 million on September 30, 2016. |
| ** | Amended from $100 million up to $133 million on September 30, 2016; incremental amendment from $133 million up to $143 million in October 2016. |
The aggregate maturities of long-term debt including current portion for each of the five years subsequent to December 31, 2016 are as follows:
| Year ending December 31, |
||||
| 2017 |
$ | 12,751 | ||
| 2018 |
5,968 | |||
| 2019 |
5,968 | |||
| 2020 |
279,841 | |||
| 2021 |
5,750 | |||
| Thereafter |
514,812 | |||
|
|
|
|||
| Total debt |
$ | 825,090 | ||
| Less debt issuance costs |
(26,626 | ) | ||
|
|
|
|||
| Total debt, net of debt issuance cost |
$ | 798,464 | ||
|
|
|
|||
On June 1, 2004, our wholly owned subsidiary, NN Asia, entered into a twenty-year lease agreement with Kunshan Tian Li Steel Structure Co. LTD for the lease of land and building (approximately 110,000 square feet) in the Kunshan Economic and Technology Development Zone, Jiangsu, The People’s Republic of China. The fair value of the land and building was estimated to be approximately $0.5 million and $1.9 million (at current exchange rates), respectively and undiscounted annual lease payments are approximately $0.3 million (approximately $5.6 million aggregate non-discounted lease payments over the twenty year term). The lease is cancelable after the fifth, ninth, and fourteenth years without payment or penalty by us. In addition, after the end of year five and each succeeding year we can buy the land for a preset price per square meter value and the building for actual cost less depreciation.
50
Table of Contents
On October 1, 2011, our wholly owned subsidiary, NN Asia, entered into a twenty year lease agreement with Kunshan Tian Li Steel Structure Co. LTD for the lease of land and building adjacent to the current leased facility (approximately 75,000 square feet) in the Kunshan Economic and Technology Development Zone, Jiangsu, The People’s Republic of China. This lease was entered into to expand the production capacity of our current leased facility. The fair value of the land and building was estimated to be approximately $0.8 million and $1.1 million (at current exchange rates), respectively and undiscounted annual lease payments are approximately $0.2 million (approximately $3.6 million aggregate non-discounted lease payments over the twenty year term). The lease is cancelable after the fifth, ninth, and fourteenth years without payment or penalty by us. In addition, after the end of year five and each succeeding year we can buy the land for a preset price per square meter value and the building for actual cost less depreciation.
Below are the aggregate minimum future lease payments under both capital leases together with the present value of the net minimum lease payments as of December 31, 2016:
| Year ending December 31, | ||||
| 2017 |
$ | 434 | ||
| 2018 |
434 | |||
| 2019 |
434 | |||
| 2020 |
434 | |||
| 2021 |
434 | |||
| Thereafter |
2,601 | |||
|
|
|
|||
| Total minimum lease payments |
4,771 | |||
| Less interest included in payments above |
(1,462 | ) | ||
|
|
|
|||
| Present value of minimum lease payments |
$ | 3,309 | ||
|
|
|
|||
With the Autocam acquisition, we assumed capital leases on certain buildings and equipment. The cost of the assets subject to capital lease obligations as reflected in Property, Plant and Equipment, net in our Consolidated Balance Sheet was $25.0 million as of December 31, 2014. The accumulated depreciation of such assets as reflected in Property, Plant and Equipment, net in our Consolidated Balance Sheet was $3.6 million and $2.6 million as of December 31, 2016 and 2015, respectively.
Below are the minimum future lease payments under the assumed capital leases together with the present value of the net minimum lease payments as of December 31, 2016:
| Year ending December 31, | ||||
| 2017 |
$ | 3,521 | ||
| 2018 |
2,530 | |||
| 2019 |
803 | |||
| 2020 |
0 | |||
| 2021 |
0 | |||
| Thereafter |
0 | |||
|
|
|
|||
| Total minimum lease payments |
6,854 | |||
| Less interest included in payments above |
(282 | ) | ||
|
|
|
|||
| Present value of minimum lease payments |
$ | 6,572 | ||
|
|
|
|||
| 8) | Employee Benefit Plans |
We have defined contribution 401(k) profit sharing plans covering substantially all U.S. employees. All eligible employees may enroll in the plans on the first day of the month following their employment date. A participant may elect to contribute between 1% and 60% of their compensation to the plans, subject to Internal Revenue Service (“IRS”) dollar limitations. Participants age 50 and older may defer an additional amount up to the applicable IRS Catch Up Provision Limit. We provide a matching contribution, which is determined on an individual, participating company basis. All participant contributions are immediately vested at 100%. Contributions for all U.S. employees were $2.3 million, $0.2 million and $0.8 million in 2016, 2015, and 2014, respectively.
Post-Employment Benefit Liabilities
We provide certain post-employment benefits to employees at our Pinerolo and Veenendaal plants that are either required by law or are local labor practice. There is a plan at each of our Pinerolo and Veenendaal plants, which are described below.
51
Table of Contents
In accordance with Italian law, we have an unfunded severance plan under which all Italian employees are entitled to receive severance indemnities (Trattamento di Fine Rapporto or “TFR”) upon termination of their employment.
Effective January 1, 2007, the amount payable, based on salary paid, is remitted to a pension fund managed by a third party. The severance indemnities paid to the pension fund accrue approximately at the rate of 1/13.5 of the gross salaries paid during the year. The amounts accrued become payable upon termination of the individual employee, for any reason, e.g., retirement, dismissal or reduction in work force. Employees are fully vested in TFR benefits after their first year of service.
We have a plan that covers our Veenendaal plant employees that provides an award for employees who achieve 25 or 40 years of service and an award for employees upon retirement. The plan is unfunded and the benefits are based on years of service and rate of compensation at the time the award is paid.
The amounts shown in the table below represent the actual liabilities at December 31, 2016 and 2015 reported under accrued post-employment benefits in the Consolidated Balance Sheets for both plans combined.
| 2016 | 2015 | |||||||
| Beginning balance |
$ | 5,189 | $ | 6,024 | ||||
| Amounts accrued |
135 | 53 | ||||||
| Payments to employees/government managed plan |
(452 | ) | (266 | ) | ||||
| Foreign currency impacts |
(165 | ) | (622 | ) | ||||
|
|
|
|
|
|||||
| Ending balance |
$ | 4,707 | $ | 5,189 | ||||
|
|
|
|
|
|||||
Defined Benefit Plan
Effective with the Autocam acquisition on August 29, 2014, we sponsor a defined benefit pension plan (the “Pension Plan”) for substantially all employees of the Bouverat, France plant. These benefits are calculated based on each employee’s years of credited service and most recent monthly compensation and service category. Employees become vested in accordance with governmental regulations in place at the time of retirement.
For the purpose of calculating the 2016 actuarial present value of the benefit obligation under the Pension Plan, the discount rates assumed were 1.6%. The compensation growth rate was assumed was 3.0% for 2016. The measurement date was December 31, 2016.
For the purpose of calculating the 2015 actuarial present value of the benefit obligation under the Pension Plan, the discount rates assumed were 2.2%. The compensation growth rate was assumed was 3.0% for 2015. The measurement date was December 31, 2016.
Set forth below is projected benefit obligation information for the Pension Plan and the plan activity for the years ended December 31, 2016 and 2015:
| 2016 | 2015 | |||||||
| Accumulated benefit obligation at measurement date |
$ | 949 | $ | 950 | ||||
| Effect of salary increases |
533 | 494 | ||||||
|
|
|
|
|
|||||
| Projected benefit obligation at measurement date |
$ | 1,482 | $ | 1,444 | ||||
|
|
|
|
|
|||||
| Projected benefit obligation at date of acquisition |
$ | 1,444 | $ | 1,537 | ||||
| Service and interest costs |
113 | 103 | ||||||
| Actuarial gains (losses) |
118 | (15 | ) | |||||
| Benefits paid |
(141 | ) | (22 | ) | ||||
| Effect of foreign currency translation gains and other |
(50 | ) | (159 | ) | ||||
|
|
|
|
|
|||||
| Projected benefit obligation at measurement date |
$ | 1,484 | $ | 1,444 | ||||
|
|
|
|
|
|||||
Set forth below is net periodic benefit cost information for the Pension Plan for the years ended December 31, 2016 and 2015:
| 2016 | 2015 | |||||||
| Service and interest costs |
$ | 113 | $ | 103 | ||||
| Expected return on plan assets |
(10 | ) | (11 | ) | ||||
| Amortization of prior service costs |
27 | 28 | ||||||
|
|
|
|
|
|||||
| Net periodic benefit cost |
$ | 130 | $ | 120 | ||||
|
|
|
|
|
|||||
52
Table of Contents
We expect benefit payments under the Pension Plan to be:
| Year ending December 31, | ||||
| 2017 |
$ | 14 | ||
| 2018 |
7 | |||
| 2019 |
— | |||
| 2020 |
25 | |||
| 2021 |
9 | |||
| 2022-2026 |
213 | |||
|
|
|
|||
| Total benefit payments |
268 | |||
|
|
|
|||
Set forth below is plan asset information for the Pension Plan:
| 2016 | 2015 | |||||||
| Plan assets at fair value at measurement date |
$ | 426 | $ | 515 | ||||
| Projected benefit obligations at measurement date |
(1,482 | ) | (1,444 | ) | ||||
|
|
|
|
|
|||||
| Funded status |
$ | (1,056 | ) | $ | (929 | ) | ||
|
|
|
|
|
|||||
| Plan assets at fair value at date of acquisition |
$ | 515 | $ | 589 | ||||
| Actual return on plan assets |
64 | 9 | ||||||
| Benefits paid |
(141 | ) | (22 | ) | ||||
| Effect of foreign currency translation gains |
(13 | ) | (61 | ) | ||||
|
|
|
|
|
|||||
| Plan assets at fair value at measurement date |
$ | 425 | $ | 515 | ||||
|
|
|
|
|
|||||
The assumed rate of return on assets of the Pension Plan was 2.0% for all periods presented. We have a targeted goal of allocating plan assets one-third to equity and two-thirds to fixed income securities. Actual allocations of Pension Plan assets between equity and fixed income securities were 35% and 65%, respectively, as of December 31, 2016. Our expected funding obligations under the Pension Plan in 2017 is approximately $0.1 million.
Even though we do use other observable inputs (Level 2 inputs under the GAAP hierarchy), the calculation of fair value for pension plan assets and liabilities would be most consistent with Level 3 under the GAAP hierarchy.
| 9) | Stock Based Compensation |
We recognize compensation expense of all employee and non-employee director share-based compensation awards in the financial statements based upon the fair value of the awards over the requisite service or vesting period, less anticipated forfeitures. We account for stock awards by recognizing the fair value of the awarded stock at the grant date as compensation expense over the vesting period, less anticipated forfeitures.
In the years ended December 31, 2016, 2015, and 2014, approximately $4.3 million, $3.7 million, and $2.6 million, respectively of compensation expense was recognized in selling, general and administrative expense for all share-based awards. The compensation expense recognized in the years ended December 31, 2016, 2015 and 2014 related to stock options was $0.8 million, $0.9 million and $1.3 million, respectively. The compensation expense related to stock awards in the years ended December 31, 2016, 2015 and 2014 was $2.3 million, $2.4 million and $1.3 million, respectively. The compensation expense related to performance based awards in the year ended December 31, 2016 and 2015, was $1.2 and $0.4 million, respectively.
As of December 31, 2016, we have approximately 2,300 maximum shares that can be issued as options, stock appreciation rights, and/or other stock based awards.
53
Table of Contents
Stock Option Awards
Option awards are typically granted to non-executive directors and key employees on an annual basis. A single option grant is typically awarded to eligible employees and non-executive directors each year if and when granted by the Compensation Committee of the Board of Directors and occasionally individual grants are awarded to eligible employees. All employee and non-executive directors are awarded options at an exercise price equal to the closing price of our stock on the date of grant. The term life of options is ten years with vesting periods of generally three years for key employees and one year for non-executive directors. The fair value of our options cannot be determined by market value as they are not traded in an open market. Accordingly, the Black Scholes financial pricing model is utilized to determine fair value based on certain assumptions discussed below.
During 2016, 2015 and 2014, we granted options to purchase 167,000, 54,600, and 108,620 shares, respectively, to certain key employees and non-employee directors. The weighted average grant date fair value of the options granted during the years ended December 31, 2016, 2015 and 2014 was $5.02, $12.61 and $9.48, respectively. Upon exercise of stock options, new shares of our stock are issued. The weighted average assumptions relevant to determining the fair value at the dates of grant are below:
| 2016 | 2015 | 2014 | ||||||||||
| Term |
6 years | 6 years | 6 years | |||||||||
| Risk free interest rate |
1.43 | % | 1.43 | % | 1.75 | % | ||||||
| Dividend yield |
2.48 | % | 1.11 | % | 1.43 | % | ||||||
| Expected volatility |
59.23 | % | 59.22 | % | 56.75 | % | ||||||
| Expected forfeiture rate |
3.00 | % | 3.00 | % | 3.00 | % | ||||||
The expected volatility rate is derived from our actual common stock historical volatility over the same time period as the expected term. The volatility rate is derived by mathematical formula utilizing daily closing price data.
The expected dividend yield is derived by a mathematical formula which uses the expected annual dividends over the expected term divided by the fair market value of our common stock at the grant date.
The average risk-free interest rate is derived from United States Department of Treasury published interest rates of daily yield curves for the same time period as the expected term.
The forfeiture rate is determined from examining the historical pre-vesting forfeiture patterns of past option issuances to key employees. While the forfeiture rate is not an input of the Black Scholes model for determining the fair value of the options, it is an important determinant of stock option compensation expense to be recorded.
The term is derived from using the “Simplified Method” of determining stock option terms as described under the Securities and Exchange Commission’s Staff Accounting Bulletin 107.
The following table provides a reconciliation of option activity for the year ended December 31, 2016:
| Options |
Shares (000) | Weighted- Average Exercise Price |
Weighted- Average Remaining Contractual Term (years) |
Aggregate Intrinsic Value |
||||||||||||
| Outstanding at January 1, 2016 |
1,034 | $ | 12.09 | |||||||||||||
| Granted |
167 | $ | 11.31 | |||||||||||||
| Exercised |
(270 | ) | $ | 10.49 | ||||||||||||
| Forfeited or expired |
(34 | ) | $ | 17.52 | ||||||||||||
|
|
|
|
|
|||||||||||||
| Outstanding at December 31, 2016 |
897 | $ | 12.22 | 5.9 | 6,479 | (1) | ||||||||||
|
|
|
|
|
|
|
|
|
|||||||||
| Exercisable at December 31, 2016 |
686 | $ | 11.59 | 4.9 | 5,267 | (1) | ||||||||||
|
|
|
|
|
|
|
|
|
|||||||||
| (1) | The intrinsic value is the amount by which the market price of our stock was greater than the exercise price of any individual option grant at December 31, 2016. |
As of December 31, 2016, there was approximately $0.6 million, $1.0 million and $2.0 million of unrecognized compensation costs for stock options, restricted stock and performance based awards, respectively, to be recognized over approximately two years.
Cash proceeds from the exercise of options in the years ended December 31, 2016, 2015, and 2014 totaled approximately $2.6 million, $2.0 million, and $1.7 million, respectively. For the years ended December 31, 2016, 2015 and 2014, proceeds from stock options were presented exclusive of tax benefits in the Financing Activities section of the Consolidated Statements of Cash Flows. The total intrinsic value of options exercised during the years ended December 31, 2016, 2015 and 2014 was $2.9 million, $2.6 million and $2.0 million, respectively.
54
Table of Contents
Stock Awards
During the year ended December 31, 2016, 2015 and 2014, we issued 152,510, 114,475 and 114,300 shares, respectively, of our common stock as awards to key employees and non-executive directors. The fair value of the 2016 shares issued was determined by using the grant date price of our common stock with a weighted average grant date value of $11.39. The recognized compensation expense for stock awards in the years ended December 31, 2016, 2015, and 2014 was approximately $2.3 million, $2.4 million, and $1.3 million, respectively. The shares issued in 2016, 2015 and 2014 vest over three years.
Performance Based Awards
On March 16, 2016 and April 30, 2015, we awarded performance share units (the “PSUs”) to our executive officers. The PSUs are a form of long-term incentive compensation designed to directly align the interests of employees to the interests of our stockholders, and to create long-term stockholder value. The awards were made pursuant to the NN, Inc. 2011 Stock Incentive Plan and a Performance Share Unit Agreement.
There were two tranches of PSUs awarded, PSUs based on total shareholder return (“TSR Awards”) and PSUs based on return on invested capital (“ROIC Awards”). The TSR Awards vest, if at all, upon our achieving a specified relative total shareholder return, which will be measured against the total shareholder return of the S&P SmallCap 600 Index during the period beginning on March 16, 2016 and ending December 31, 2018 for the 2016 awards and the period beginning February 1, 2015 and ending December 31, 2017 for the 2015 awards (the “Performance Periods”). The ROIC Awards will vest, if at all, upon our achieving a specified average return on invested capital during the Performance Periods. If the PSUs do not vest at the end of the Performance Periods, the PSUs will expire automatically. Upon vesting, the PSUs will be settled by the issuance of shares of our common stock, subject to the executive officer’s continued employment. The actual number of shares of common stock will be issued to each award recipient at the end of the Performance Periods will be interpolated between a threshold and maximum payout amount based on actual performance results. No dividends will be paid on outstanding PSUs during the Performance Period; however, dividend equivalents will be paid based on the number of shares of common stock that are ultimately earned at the end of the Performance Periods.
With respect to the TSR Awards, a participant will earn 50% of the target number of PSUs for “Threshold Performance,” 100% of the target number of PSUs for “Target Performance,” and 150% of the target number of PSUs for “Maximum Performance.” With respect to the ROIC Awards, a participant will earn 35% of the target number of PSUs for “Threshold Performance,” 100% of the target number of PSUs for “Target Performance,” and 150% of the target number of PSUs for “Maximum Performance. For performance levels falling between the values shown below, the percentages will be determined by interpolation. The following table establish the goals with respect to TSR and ROIC:
TSR:
| Threshold Performance (50% of Shares) |
Target Performance (100% of Shares) |
Maximum Performance (150% of Shares) |
||||||
| 35th Percentile |
50th Percentile | 75th Percentile | ||||||
ROIC:
| Threshold Performance (35% of Shares) |
Target Performance (100% of Shares) |
Maximum Performance (150% of Shares) |
||||||||
| 11% | 12.5 | % | 14 | % | ||||||
During 2016 and 2015, we awarded 101,165 and 35,775 TSR Awards and 101,165 and 35,775 ROIC Awards with a grant date fair value of $9.38 and $28.61 for TSR Awards and $11.31 and $25.16 per unit for ROIC Awards, respectively. We estimate the grant date fair value of TSR Awards using the Monte Carlo simulation model, as the total shareholder return metric is considered a market condition under ASC 718. The grant date fair value of ROIC Awards is based on the closing price of a share of our common stock on the date of grant.
The recognized compensation expense for the year ended December 31, 2016 and 2015 was $1.2 million and $0.4 million, respectively, for all PSUs. Unrecognized compensation expense at December 31, 2016 was $2.0 million to be recognized over approximately two years.
During the three months ended June 30, 2016, we recorded an out of period adjustment to correct compensation expense recoded with respect to share-based awards previously granted to executives who, either at the time of such grant or during the applicable vesting period, were eligible to retire from the Company, upon which the vesting of all or a portion of these awards would be accelerated. If the out of period amounts would have been recorded in the appropriate periods, then the Selling, general and administrative expense line item in the Consolidated State of Operations for the years ended December 31, 2015 and 2014 would have been effected by $0.1 million and $32 thousand pre-tax amounts, respectively, increasing expense.
55
Table of Contents
| 10) | Goodwill, Net |
We completed our annual goodwill impairment review during the fourth quarters of 2016 and 2015. For the years ended December 31, 2016, 2015 and 2014, we concluded that there were no indicators of impairment at the reporting units with goodwill.
The changes in the carrying amount of goodwill for the years ended December 31, 2016, 2015 and 2014 are as follows:
| Precision Bearing Components Group |
Autocam Precision Components Group |
Precision Engineered Products Group |
Total | |||||||||||||
| Balance as of December 31, 2014 |
$ | 9,949 | $ | 73,992 | $ | — | $ | 83,941 | ||||||||
| Currency impacts |
(838 | ) | — | — | (838 | ) | ||||||||||
| Goodwill acquired in acquisition |
— | — | 366,795 | 366,795 | ||||||||||||
|
|
|
|
|
|
|
|
|
|||||||||
| Balance as of December 31, 2015 |
$ | 9,111 | $ | 73,992 | $ | 366,795 | $ | 449,898 | ||||||||
| Currency impacts |
(202 | ) | (601 | ) | (2,051 | ) | (2,854 | ) | ||||||||
| Adjustments to goodwill |
— | — | (1,805 | ) | (1,805 | ) | ||||||||||
| Other adjustments (a) |
— | (2,674 | ) | 7,746 | 5,072 | |||||||||||
|
|
|
|
|
|
|
|
|
|||||||||
| Balance as of December 31, 2016 |
$ | 8,909 | $ | 70,717 | $ | 370,685 | $ | 450,311 | ||||||||
|
|
|
|
|
|
|
|
|
|||||||||
| (a) | During the year ended December 31, 2016, the Company identified certain prior period errors primarily relating to the initial recognition of goodwill and deferred taxes in purchase accounting (see Note 13) and the subsequent foreign currency translation of goodwill. The Company has determined that such errors were not material to the previously issued financial statements and therefore has corrected for such errors in 2016 as reflected above. |
The accumulated impairment charges included in the reported goodwill balances at December 31, 2016, 2015 and 2014 were $40.0 million all of which were recorded during the years ended December 31, 2008 and 2007.
The goodwill acquired in the 2015 acquisitions within the Precision Engineered Products Group was primarily related to the PEP Acquisition. (See Note 2 of the Notes to Consolidated Financial Statements). The goodwill balance related to the PEP Acquisition is derived from the value of the Precision Engineered Products Group. This fair value was based in large part on management business plans and projected financial information which are subject to a high degree of management judgment and complexity. Actual results may differ from these projections, and the differences may be material leading to a potential impairment of this goodwill if this reporting unit’s future results are not as forecasted.
| 11) | Intangible Assets, Net |
The change in the carrying amount of intangible assets, net, for the years ended December 31, 2016 and 2015 are as follows:
| Precision Bearing Components Group |
Autocam Precision Components Group |
Precision Engineered Products Group |
Total | |||||||||||||
| Balance as of December 31, 2014 |
$ | 2,328 | $ | 50,499 | $ | — | $ | 52,827 | ||||||||
| Additions |
— | — | 242,980 | 242,980 | ||||||||||||
| Amortization |
(238 | ) | (3,625 | ) | (9,180 | ) | (13,043 | ) | ||||||||
| Currency impacts |
(138 | ) | (457 | ) | — | (595 | ) | |||||||||
|
|
|
|
|
|
|
|
|
|||||||||
| Balance as of December 31, 2015 |
$ | 1,952 | $ | 46,417 | $ | 233,800 | $ | 282,169 | ||||||||
| Amortization |
(207 | ) | (3,533 | ) | (22,465 | ) | (26,205 | ) | ||||||||
| Currency impacts |
(27 | ) | 44 | — | 17 | |||||||||||
|
|
|
|
|
|
|
|
|
|||||||||
| Balance as of December 31, 2016 |
$ | 1,718 | $ | 42,928 | $ | 211,335 | $ | 255,981 | ||||||||
|
|
|
|
|
|
|
|
|
|||||||||
With the PEP Acquisition, the Precision Engineered Products Group acquired a customer relationship intangible asset of $226.5 million, a trade name intangible asset of $6.3 million, a backlog and unfavorable leasehold intangible of $7.7 million. The intangible assets have estimated useful lives of 12 years for customer relationships and 8 years for trade name, and the backlog and unfavorable leases will be amortized over the fourth quarter of 2015 and first quarter of 2016. After the estimated useful lives of the backlog and inventory, the estimated amortization of intangibles will be approximately $19.7 million a year.
With the Caprock acquisition, the Precision Engineered Products Group acquired $2.5 million of intangibles, approximately $0.1 in trade names and $2.4 million in customer relationships. The intangibles have estimated useful lives of one year for trade names and 12 years for customer relationships. The estimated amortization of the intangibles will be approximately $0.2 million per year.
56
Table of Contents
The Autocam Precision Components Group has an intangible asset not subject to amortization of $0.9 million related to the value of the trade names of Whirlaway. This indefinite lived intangible asset was impaired during the year ended December 31, 2014 as management is in the process of phasing out the use of the trade name as a result of the Autocam acquisition. As such, an impairment charge of $0.9 million was included in the restructuring and impairment charges line of the Consolidated Statements of Operations and Comprehensive Income (Loss).
With the Autocam acquisition, the Autocam Precision Components Group acquired a customer contract intangible asset of $46.2 million, a trade name intangible asset of $4.1 million, a developed technology intangible asset of $0.9 million, and net favorable leasehold intangible of $0.4 million. The trade names and customer relationship intangible assets have estimated useful lives of 15 years, and the remaining intangibles have a five year useful life. The estimated amortization for the first five year will be approximately $3.5 million per year.
The Precision Bearing Components Group acquired two customer contract intangible assets related to the acquisition of RKF and Chelsea and a trade name intangible asset related to the acquisition of RFK with an aggregate estimated fair value of $2.7 million. These intangible assets have weighted average useful lives of 10 years and are subject to amortization of approximately $0.3 million per year.
| 12) | Segment Information |
We determined our reportable segments under the provisions of GAAP related to disclosures about segments of an enterprise. Our three reportable segments are based on differences in product lines.
All of the facilities in the Precision Bearing Components Group are engaged in the production of precision steel balls, steel rollers, and metal retainers and automotive specialty products used primarily in the bearing industry. The Precision Engineered Products Group includes the Plastic and Rubber Components Group as presented in previous filings. The name of this segment was changed during 2015 after the PEP Acquisition and disposal of Delta Rubber. With the completion of the PEP Acquisition, we added a global manufacturer of highly engineered precision customized solutions serving the medical, electrical, automotive, aerospace and defense end markets. The Autocam Precision Components Group is engaged in the design and manufacture of close-tolerance, precision-machined metal components. Currently, we manufacture components for use in fuel delivery, electromechanical motor, steering and braking systems for the automotive industry and highly engineered shafts, mechanical components, complex precision assembled and tested parts and fluid system components for the HVAC and fluid power industries. This segment was renamed with the acquisition of Autocam.
57
Table of Contents
| Precision Bearing Components Group |
Precision Engineered Products Group |
Autocam Precision Components Group |
Corporate and Consolidations |
Total | ||||||||||||||||
| December 31, 2016 |
||||||||||||||||||||
| Net sales |
$ | 248,534 | $ | 258,816 | $ | 326,138 | $ | — | $ | 833,488 | ||||||||||
| Depreciation and amortization |
11,676 | 28,020 | 22,189 | 603 | 62,488 | |||||||||||||||
| Income from operations |
22,985 | 34,744 | 29,516 | (27,845 | ) | 59,400 | ||||||||||||||
| Interest expense |
63,154 | 63,154 | ||||||||||||||||||
| Income tax (benefit) expense |
|
(9,313 | ) | (9,313 | ) | |||||||||||||||
| Net income (loss) |
7,942 | 7,942 | ||||||||||||||||||
| Assets |
$ | 220,152 | $ | 715,575 | $ | 416,490 | $ | 8,169 | $ | 1,360,386 | ||||||||||
| Expenditures for long-lived assets |
$ | 11,926 | $ | 5,352 | $ | 23,077 | $ | 3,465 | $ | 43,820 | ||||||||||
| December 31, 2015 |
||||||||||||||||||||
| Net sales |
$ | 261,837 | $ | 77,183 | $ | 328,260 | $ | — | $ | 667,280 | ||||||||||
| Depreciation and amortization |
11,496 | 11,295 | 21,472 | 219 | 44,482 | |||||||||||||||
| Income from operations |
26,310 | (3,718 | ) | 31,700 | (27,495 | ) | 26,797 | |||||||||||||
| Interest expense |
29,899 | 29,899 | ||||||||||||||||||
| Income tax (benefit) expense |
|
(10,518 | ) | (10,518 | ) | |||||||||||||||
| Net income (loss) |
(7,431 | ) | (7,431 | ) | ||||||||||||||||
| Assets |
$ | 215,163 | $ | 743,191 | $ | 417,853 | $ | 17,319 | $ | 1,393,526 | ||||||||||
| Expenditures for long-lived assets |
$ | 15,111 | $ | 728 | $ | 21,341 | $ | 1,373 | $ | 38,553 | ||||||||||
| December 31, 2014 |
||||||||||||||||||||
| Net sales |
$ | 278,026 | $ | 33,351 | $ | 177,224 | $ | — | $ | 488,601 | ||||||||||
| Depreciation and amortization |
12,000 | 1,160 | 9,070 | (84 | ) | 22,146 | ||||||||||||||
| Income from operations |
31,872 | 1,231 | 15,732 | (21,148 | ) | 27,687 | ||||||||||||||
| Interest Expense |
10,895 | 10,895 | ||||||||||||||||||
| Income tax (benefit) expense |
|
5,786 | 5,786 | |||||||||||||||||
| Net income (loss) |
8,217 | 8,217 | ||||||||||||||||||
| Assets |
$ | 214,291 | $ | 17,196 | $ | 444,548 | $ | 36,678 | $ | 712,713 | ||||||||||
| Expenditures for long- lived assets |
$ | 10,941 | $ | 673 | $ | 10,947 | $ | 5,041 | $ | 27,602 | ||||||||||
The vast majority of the acquisition related costs for the PEP Acquisition and Caprock acquisition in 2015, and the Autocam acquisition and the other three acquisitions in 2014 are reported under Corporate and Consolidations. These costs impacted income from operations at Corporate by $10.9 million and $9.8 million for the years ended December 31, 2015 and 2014, respectively. Beginning October 20, 2015 and September 1, 2014, the Precision Engineered Products Group and Autocam Precision Components Group, respectively, include the results of the acquired PEP and Autocam businesses. Since the date of the PEP Acquisition, 2015 sales revenue of $40.7 million and net loss of $(2.6) million (including the $4.3 million for the one-time increase in cost of goods sold for inventory step-up, and $5.2 for the amortization of backlog intangible) has been included in this segment. During 2014 and since the date of the Autocam acquisition, sales revenue of $80.8 million and net income of $3.7 million (including the $1.2 million for the one-time increase in cost of goods sold for inventory step-up) has been included in this segment.
58
Table of Contents
| December 31, 2016 | December 31, 2015 | December 31, 2014 | ||||||||||||||||||||||
| Net Sales | Property, Plant and Equipment, Net |
Net Sales | Property, Plant and Equipment, Net |
Net Sales | Property, Plant and Equipment, Net |
|||||||||||||||||||
| United States |
$ | 456,102 | $ | 176,632 | $ | 326,747 | $ | 183,226 | $ | 204,360 | $ | 129,232 | ||||||||||||
| Europe |
172,895 | 78,664 | 170,921 | 77,147 | 167,665 | 82,783 | ||||||||||||||||||
| Asia |
102,853 | 33,867 | 86,564 | 35,345 | 58,470 | 32,848 | ||||||||||||||||||
| Canada |
10,980 | — | 9,759 | — | 8,657 | — | ||||||||||||||||||
| Mexico |
54,390 | 6,308 | 39,118 | 2,971 | 25,900 | 2,637 | ||||||||||||||||||
| S. America |
36,268 | 27,482 | 34,171 | 20,279 | 23,549 | 30,942 | ||||||||||||||||||
|
|
|
|
|
|
|
|
|
|
|
|
|
|||||||||||||
| All foreign countries |
377,386 | 146,321 | 340,533 | 135,742 | 284,241 | 149,210 | ||||||||||||||||||
|
|
|
|
|
|
|
|
|
|
|
|
|
|||||||||||||
| Total |
$ | 833,488 | $ | 322,953 | $ | 667,280 | $ | 318,968 | $ | 488,601 | $ | 278,442 | ||||||||||||
|
|
|
|
|
|
|
|
|
|
|
|
|
|||||||||||||
Due to the large number of countries in which we sell our products, sales to external customers and long-lived assets utilized by us are reported in the above geographical regions.
| 13) | Income Taxes |
Income (loss) before provision (benefit) for income taxes for the years ended December 31, 2016, 2015 and 2014 was as follows:
| Year ended December 31, | ||||||||||||
| 2016 | 2015 | 2014 | ||||||||||
| Income (loss) before provision (benefit) for income taxes: |
||||||||||||
| United States |
$ | (32,498 | ) | $ | (42,450 | ) | $ | (9,341 | ) | |||
| Foreign |
25,189 | 19,500 | 22,513 | |||||||||
|
|
|
|
|
|
|
|||||||
| Total |
$ | (7,309 | ) | $ | (22,950 | ) | $ | 13,172 | ||||
|
|
|
|
|
|
|
|||||||
The loss of $32.5 million from domestic operations during 2016, was primarily driven from an increase in interest expense due to higher debt levels associated with the 2015 PEP acquisition.
The loss of $42.5 million from domestic operations during 2015, was primarily driven from acquisition related charges (included in selling, general and administrative of $11.7 million, cost of products sold $7.5 million and write-off of debt issuance costs of $18.7 million) of which approximately $3.8 million was non-deductible as these costs were directly facilitative to the acquisitions.
The loss of $9.3 million from domestic operations during 2014, was primarily driven from acquisition related charges of $14.8 million (included in selling, general and administrative, cost of products sold, and interest expense) of which approximately $6.0 million were non-deductible as these costs were directly facilitative to the acquisitions.
59
Table of Contents
Total income tax expense (benefit) for the years ended December 31, 2016, 2015, and 2014 was as follows:
| Year ended December 31, | ||||||||||||
| 2016 | 2015 | 2014 | ||||||||||
| Current: |
||||||||||||
| U.S. Federal |
$ | — | $ | — | $ | — | ||||||
| State |
1,017 | 420 | 37 | |||||||||
| Foreign |
6,968 | 5,940 | 7,082 | |||||||||
|
|
|
|
|
|
|
|||||||
| Total current expense |
$ | 7,985 | $ | 6,360 | $ | 7,119 | ||||||
|
|
|
|
|
|
|
|||||||
| Deferred: |
||||||||||||
| U.S. Federal |
$ | (11,033 | ) | $ | (13,391 | ) | $ | 1,625 | ||||
| State |
(6,440 | ) | (1,869 | ) | (382 | ) | ||||||
| U.S. deferred tax valuation allowance |
1,882 | — | (1,434 | ) | ||||||||
| Foreign |
(1,707 | ) | (1,618 | ) | (1,142 | ) | ||||||
|
|
|
|
|
|
|
|||||||
| Total deferred expense (benefit) |
(17,298 | ) | (16,878 | ) | (1,333 | ) | ||||||
|
|
|
|
|
|
|
|||||||
| Total expense (benefit) (a) |
$ | (9,313 | ) | $ | (10,518 | ) | $ | 5,786 | ||||
|
|
|
|
|
|
|
|||||||
| (a) | During the year ended December 31, 2016, the Company identified certain prior period tax expense (benefit) errors. The Company has determined that such errors were not material to the previously issued financial statements and therefore has corrected for such errors as out of period adjustments in 2016, resulting in $998 of tax benefit being recognized in 2016 that should have been recognized in 2015. |
A reconciliation of income taxes based on the U.S. federal statutory rate of 34% for each of the years ended December 31, 2016, 2015 and 2014 is summarized as follows:
| Year ended December 31, | ||||||||||||
| 2016 | 2015 | 2014 | ||||||||||
| Income taxes at the federal statutory rate |
$ | (2,490 | ) | $ | (7,803 | ) | $ | 4,478 | ||||
| Decrease in U.S. valuation allowance |
1,882 | — | (1,434 | ) | ||||||||
| Foreign tax credit (additions) expiration |
(2,545 | ) | (1,343 | ) | 2,736 | |||||||
| State taxes, net of federal taxes |
(1,558 | ) | (1,592 | ) | (362 | ) | ||||||
| Non-U.S. earnings taxed at different rates |
(2,938 | ) | (2,308 | ) | (1,714 | ) | ||||||
| Non-deductible mergers and acquisition costs |
— | 1,299 | 1,971 | |||||||||
| R&D Tax credit |
(282 | ) | (623 | ) | (529 | ) | ||||||
| Change in uncertain tax positions |
(994 | ) | — | — | ||||||||
| Other permanent differences, net |
(388 | ) | 1,852 | 640 | ||||||||
|
|
|
|
|
|
|
|||||||
| $ | (9,313 | ) | $ | (10,518 | ) | $ | 5,786 | |||||
|
|
|
|
|
|
|
|||||||
The 2016 effective tax rate of 127% reflects the impact of foreign earnings taxed at lower rates. The higher 2016 effective tax rate was driven by a unique mix of lower U.S. losses with higher earnings attributed to foreign subsidiaries. Excluding the effect of foreign earnings, the 2016 effective tax rate would have been 45%.
The 2015 effective tax rate of 46% primarily reflects the impact of foreign earnings being taxed at lower rates.
The 2014 effective tax rate of 44% reflects the impact of two items related to the merger and acquisition activity in 2014, including: (1) $2.0 million for non-deductible third party merger and acquisition costs, as these costs were directly facilitative to the acquisitions; and (2) $1.3 million for the expiration of foreign tax credits that could not be utilized during 2014 because of the merger related acquisition costs as discussed below. In addition, the rate reflects an offset to the items above for the impact of foreign earnings taxed at lower rates of $1.7 million.
60
Table of Contents
The tax effects of the temporary differences as of December 31, 2016, 2015 and 2014 are as follows:
| December 31, | ||||||||||||
| 2016 | 2015 | 2014 | ||||||||||
| Deferred income tax liabilities: |
||||||||||||
| Tax in excess of book depreciation |
$ | 43,336 | $ | 42,345 | $ | 35,411 | ||||||
| Goodwill |
1,580 | 1,554 | 1,949 | |||||||||
| Intangible assets |
86,492 | 91,947 | 15,944 | |||||||||
| Other deferred tax liabilities |
1,771 | 897 | 1,924 | |||||||||
|
|
|
|
|
|
|
|||||||
| Gross deferred income tax liabilities |
133,179 | 136,743 | 55,228 | |||||||||
| Deferred income tax assets: |
||||||||||||
| Goodwill |
1,165 | 1,666 | 2,411 | |||||||||
| Inventories |
960 | 4,490 | 2,035 | |||||||||
| Pension/Personnel accruals |
1,602 | 2,778 | 3,029 | |||||||||
| Net operating loss carry forwards |
10,296 | 8,313 | 1,196 | |||||||||
| Foreign tax credits |
5,759 | 3,242 | 290 | |||||||||
| Guarantee claim deduction |
414 | 1,141 | 1,141 | |||||||||
| Credit carry forwards |
4,581 | 4,958 | 1,853 | |||||||||
| Accruals and reserves |
1,741 | — | — | |||||||||
| Other deferred tax assets |
11,160 | 2,510 | 1,926 | |||||||||
|
|
|
|
|
|
|
|||||||
| Gross deferred income tax assets |
37,678 | 29,098 | 13,881 | |||||||||
| Valuation allowance on deferred tax assets |
(4,090 | ) | (2,376 | ) | — | |||||||
|
|
|
|
|
|
|
|||||||
| Net deferred income tax assets |
33,588 | 26,722 | 13,881 | |||||||||
|
|
|
|
|
|
|
|||||||
| Net deferred income tax assets (liabilities) (b) |
$ | (99,591 | ) | $ | (110,021 | ) | $ | (41,347 | ) | |||
|
|
|
|
|
|
|
|||||||
| (b) | During the year ended December 31, 2016, the Company identified certain prior period errors related to the initial recognition of goodwill and deferred taxes in purchase accounting (see Note 10) as well as prior period errors in the 2015 tax provision as further described above. The Company has determined that such errors were not material to the previously issued financial statements and therefore has corrected for such errors in 2016. The impact of these purchase accounting and tax provision errors resulted in an understatement (overstatement) of net deferred income tax liabilities of $4,469 and $(1,444) as of December 31, 2015 and 2014. |
With the PEP Acquisition during 2015, we assumed $87.6 million in net deferred tax liabilities primarily related to book and tax basis difference in fixed assets and intangibles (excluding goodwill).
With the Autocam acquisition during 2014, we assumed $43.8 million in net deferred tax liabilities primarily related to book and tax basis differences in fixed assets and intangibles (excluding goodwill).
As realization of certain deferred tax assets is not assured, management believes it is more likely than not that those net deferred tax assets will be realized. However, the amount of the deferred tax assets considered realizable could be reduced based on changing conditions. Below is a summary of the activity in the total valuation allowances during the years ended December 31, 2016, 2015 and 2014:
| Balance at Beginning of Year |
Additions | Recoveries | Balance at End of Year |
|||||||||||||
| 2016 |
$ | 2,376 | $ | 1,882 | $ | (168 | ) | $ | 4,090 | |||||||
| 2015 |
$ | — | $ | 2,376 | $ | — | $ | 2,376 | ||||||||
| 2014 |
$ | 1,434 | $ | — | $ | (1,434 | ) | $ | — | |||||||
During 2016, the valuation allowance increased by approximately $1.7 million, consisting of a $1.9 million increase due to the uncertainty of realizing certain state net operating loss carryforwards and a decrease of $0.2 million. The decrease reflects the Company’s expectation that it is more likely than not that it will generate future taxable income to utilize this amount of net deferred tax assets.
During 2015, the valuation allowance increased by approximately $2.4 million, consisting solely of an increase due to the uncertainty of realizing certain local tax credits of a foreign subsidiary.
During 2014, the valuation allowance of $1.4 million on our previously recognized foreign tax credits was reduced by the full $1.4 million for credits which expired as of December 31, 2014. In addition to the foreign tax credits with the full valuation allowance, $1.3 million in foreign tax credits expired unused as of December 31, 2014. These foreign tax credits were not utilized during 2014, as management expected, due to the large amount of non-deductible mergers and acquisition costs incurred related to the four acquisitions completed in 2014. The remaining foreign tax credits, net operating loss and credit carry forwards are expected to be utilized before expiration. We record a valuation allowance when it is “more likely than not” that some portion or all of the deferred income tax assets will not be realized. In reaching this determination, we consider the future reversals of taxable temporary differences, future taxable income, exclusive of taxable temporary differences and carry forwards, taxable income in prior carryback years and tax planning strategies.
61
Table of Contents
Unremitted earnings of subsidiaries outside the U.S. are considered to be reinvested indefinitely at December 31, 2016. It is not practicable to determine the deferred tax liability for temporary differences related to those unremitted earnings. There has been no change in our long term international expansion plans as of December 31, 2016, and our intent and ability is to indefinitely reinvest our foreign earnings. We base this assertion on two factors. The first factor is our intention to invest in foreign countries that are strategically important to our Precision Bearing Components, Precision Engineered Products and Autocam Precision Components Groups. With the acquisitions completed in 2015 and 2014, we have significantly expanded our international base of operations adding subsidiaries in Mexico, Bosnia and Herzegovina, Brazil, Poland, France and China which will require more foreign investment. Second, we have sufficient access to funds in the U.S. through projected free cash flows and the availability of our U.S. credit facilities to fund currently anticipated domestic operational and investment needs.
A reconciliation of the beginning and ending amounts of unrecognized tax benefits, excluding interest and penalties for the years ended December 31, 2016, 2015 and 2014 is as follows:
| 2016 | 2015 | 2014 | ||||||||||
| Beginning balance |
$ | 5,724 | $ | 3,834 | $ | 873 | ||||||
| Additions for tax positions of prior years |
179 | 2,516 | 3,589 | |||||||||
| Reductions for tax positions of prior years |
(1,162 | ) | (626 | ) | (628 | ) | ||||||
|
|
|
|
|
|
|
|||||||
| Ending balance |
$ | 4,741 | $ | 5,724 | $ | 3,834 | ||||||
|
|
|
|
|
|
|
|||||||
As of December 31, 2016, the $4.7 million of unrecognized tax benefits would, if recognized, impact our effective tax rate. The addition for tax positions of prior years was added as part of the purchase price allocation of PEP in 2015 of $2.2 million and Autocam in 2014 of $2.8 million and was included in the fair value of assets acquired and liabilities assumed. (See Note 2 of Notes to Consolidated Financial Statements.)
Interest and penalties related to federal, state, and foreign income tax matters are recorded as a component of the provision for income taxes in our Statements of Operations. During 2016, we released $65 thousand of previously accrued foreign interest and accrued $0.2 million in U.S. interest. During 2015, we accrued $30 thousand in foreign interest and $0.3 million in U.S. interest. During 2014, we accrued $31 thousand in foreign interest and $17 thousand in U.S. interest. As of December 31, 2016, the total amount accrued for interest and penalties was $ 1.1 million.
We or our subsidiaries file income tax returns in the U.S. federal jurisdiction, and in various states and foreign jurisdictions. With few exceptions, we are no longer subject to federal, state and local income tax examinations by tax authorities for years before 2013. We are no longer subject to non-U.S. income tax examinations within various European Union countries for years before 2011. We do not foresee any significant changes to our unrecognized tax benefits within the next twelve months.
In November 2015, the FASB issued ASU 2015-17, intended to improve how deferred taxes are classified on organizations’ balance sheets. The guidance eliminates the requirement for organizations to present deferred tax liabilities and assets as current and noncurrent in a classified balance sheet. Instead, organizations are required to classify all deferred tax assets and liabilities as noncurrent. The new standard is effective for the Company in the first quarter of 2017, and may be applied retrospectively or prospectively. The Company has elected to adopt the standard early, beginning in the first quarter of 2016, and applies prospectively. The adoption of the new accounting rules does not have a material effect on the Company’s financial condition, results of operations or cash flows.
| 14) | Reconciliation of Net Income (Loss) Per Share |
| Year ended December 31, | ||||||||||||
| 2016 | 2015 | 2014 | ||||||||||
| Net income (loss) |
$ | 7,942 | $ | (7,431 | ) | $ | 8,217 | |||||
| Weighted average shares outstanding |
27,016 | 21,181 | 17,887 | |||||||||
| Effect of dilutive stock options |
138 | — | 366 | |||||||||
|
|
|
|
|
|
|
|||||||
| Diluted shares outstanding |
27,154 | 21,181 | 18,253 | |||||||||
|
|
|
|
|
|
|
|||||||
| Basic net income (loss) per share |
$ | 0.29 | $ | (0.35 | ) | $ | 0.46 | |||||
|
|
|
|
|
|
|
|||||||
| Diluted net income (loss) per share |
$ | 0.29 | $ | (0.35 | ) | $ | 0.45 | |||||
|
|
|
|
|
|
|
|||||||
62
Table of Contents
Excluded from the dilutive shares outstanding for the year ended December 31, 2016 were 163,200 of anti-dilutive options, which had per share exercise prices ranging from of $19.63 to $25.16. Given the net loss for the year ended December 31, 2015, all options are considered anti-dilutive. Excluded from the dilutive shares outstanding for the year ended December 31, 2014 were 98,000 of anti-dilutive options, which had per share exercise prices ranging from of $19.63 to $22.49.
| 15) | Commitments and Contingencies |
We have operating lease commitments for machinery, office equipment, vehicles, manufacturing and office space which expire on varying dates. Rent expense for 2016, 2015 and 2014 was $8.6 million, $5.8 million, and $4.5 million, respectively. The following is a schedule by year of future minimum lease payments as of December 31, 2016 under operating leases that have initial or remaining non-cancelable lease terms in excess of one year.
| Year ending December 31, |
||||
| 2017 |
$ | 7,824 | ||
| 2018 |
6,830 | |||
| 2019 |
5,785 | |||
| 2020 |
4,882 | |||
| 2021 |
2,802 | |||
| Thereafter |
3,149 | |||
|
|
|
|||
| Total minimum lease payments |
$ | 31,272 | ||
|
|
|
|||
Brazil ICMS Tax Matter
Prior to our acquisition of Autocam, Autocam’s Brazilian subsidiary received notification from the Brazilian tax authorities regarding ICMS (state value added tax or VAT) tax credits claimed on intermediary materials (tooling and perishable items) used in the manufacturing process. The Brazilian tax authority notification disallowed state ICMS credits claimed on intermediary materials based on the argument that these items are not intrinsically related to the manufacturing process. Autocam Brazil filed an administrative defense with the Brazilian tax authority arguing, among other matters, that it should qualify for an ICMS tax credit, contending that the intermediary materials are directly related to the manufacturing process.
We believe that we have substantial legal and factual defenses and plan to defend our interests vigorously. While we believe a loss is not probable we estimate the range of possible loss related to this assessment is from $0 to $6.0 million. No amount has been accrued at December 31, 2016 for this matter.
We are entitled to indemnification from the former shareholders of Autocam, subject to the limitations and procedures set forth in the agreement and plan of merger. Management believes the indemnification would include amounts owed for the tax, interest and penalties related to the Brazil ICMS matter.
All other legal matters
All other legal proceedings are of an ordinary and routine nature and are incidental to our operations. Management believes that such proceedings should not, individually or in the aggregate, have a material adverse effect on our business, financial condition, results of operations, or cash flows. In making that determination, we analyze the facts and circumstances of each case at least quarterly in consultation with our attorneys and determine a range of reasonably possible outcomes. The procedures performed include reviewing attorney and plaintiff correspondence, reviewing any filings made and discussing the facts of the case with local management and legal counsel. We have not recognized any loss contingencies as December 31, 2016 and 2015.
| 16) | Investment in Non-Consolidated Joint Venture |
As part of the Autocam acquisition, we acquired a 49% investment in a joint venture with an unrelated entity called Wuxi Weifu Autocam Precision Machinery Company, Ltd. (the “JV”), a Chinese company located in the city of Wuxi, China. The JV is jointly controlled and managed and is being accounted for under the equity method.
63
Table of Contents
Below are the components of our JV investment balance and activity for the years ended December 31, 2016, 2015 and 2014:
| Balance as of August 29, 2014 |
$ | 35,595 | ||
| Dividends received |
(2,538 | ) | ||
| Our share of cumulative earnings |
1,646 | |||
| Accretion of basis difference from purchase accounting |
(372 | ) | ||
|
|
|
|||
| Balance as of December 31, 2014 |
$ | 34,331 | ||
| Capital contributions |
1,999 | |||
| Dividends received |
(2,868 | ) | ||
| Our share of cumulative earnings |
5,440 | |||
| Accretion of basis difference from purchase accounting |
(440 | ) | ||
|
|
|
|||
| Balance as of December 31, 2015 |
$ | 38,462 | ||
| Our share of cumulative earnings |
6,427 | |||
| Dividends declared and paid by joint venture |
(3,706 | ) | ||
| Accretion of basis difference from purchase accounting |
(489 | ) | ||
|
|
|
|||
| Balance as of December 31, 2016 |
$ | 40,694 | ||
|
|
|
Set forth below is summarized balance sheet information for the JV:
| December 31, | December 31, | |||||||
| 2016 | 2015 | |||||||
| Current assets |
$ | 31,295 | $ | 24,663 | ||||
| Non-current assets |
22,522 | 22,847 | ||||||
|
|
|
|
|
|||||
| Total assets |
$ | 53,817 | $ | 47,510 | ||||
|
|
|
|
|
|||||
| Current liabilities |
$ | 13,549 | $ | 11,171 | ||||
|
|
|
|
|
|||||
| Total liabilities |
$ | 13,549 | $ | 11,171 | ||||
|
|
|
|
|
|||||
Dividends of $3.7 million were declared for year ended December 31, 2015 and paid by the JV during the year ended December 31, 2016. We had sales to the JV of $0.1 million for the year ended December 31, 2016. Amounts due to us from the JV were $0.1 million as of December 31, 2016. The JV had net sales in 2016 of $65.7 million and net income of $13.1 million.
Dividends of $2.8 million were declared for year ended December 31, 2014 and paid by the JV during the year ended December 31, 2015. Our 49% ownership interest in this amount is net of a 10% withholding tax levied by the Chinese government. We had sales to the JV of $0.1 million for the year ended December 31, 2015. Amounts due to us from the JV were $0.2 million of December 31, 2015. The JV had net sales in 2015 of $55.4 million and net income of $11.1 million.
No dividends were declared by the JV for the four months ended December 31, 2014. We had sales to the JV of $36 thousand during the four months ended December 31, 2014. Amounts due to us from JV were $0.2 million as of December 31, 2014. The JV had net sales in 2014 of $50.5 million and net income of $9.0 million.
64
Table of Contents
| 17) | Quarterly Results of Operations (Unaudited) |
The following summarizes the unaudited quarterly results of operations for the years ended December 31, 2016 and 2015.
| Year ended December 31, 2016 | ||||||||||||||||
| March 31 | June 30 | Sept. 30 | Dec. 31 | |||||||||||||
| Net sales |
$ | 212,226 | $ | 214,272 | $ | 204,961 | $ | 202,029 | ||||||||
| Income from operations |
$ | 11,874 | $ | 16,703 | $ | 18,727 | $ | 12,096 | ||||||||
| Net income (a) |
$ | (1,299 | ) | $ | 2,031 | $ | 4,147 | $ | 3,063 | |||||||
| Comprehensive income (loss)(a) |
$ | 4,418 | $ | (973 | ) | $ | 8,740 | $ | (10,212 | ) | ||||||
| Basic net income per share |
$ | (0.05 | ) | $ | 0.08 | $ | 0.15 | $ | 0.11 | |||||||
| Diluted net income per share |
$ | (0.05 | ) | $ | 0.07 | $ | 0.15 | $ | 0.11 | |||||||
| Weighted average shares outstanding: |
||||||||||||||||
| Basic number of shares |
26,869 | 27,024 | 27,159 | 27,241 | ||||||||||||
| Effect of dilutive stock options |
— | 163 | 163 | 180 | ||||||||||||
|
|
|
|
|
|
|
|
|
|||||||||
| Diluted number of shares |
26,869 | 27,187 | 27,322 | 27,421 | ||||||||||||
|
|
|
|
|
|
|
|
|
|||||||||
| Year ended December 31, 2015 | ||||||||||||||||
| March 31 | June 30 | Sept. 30 | Dec. 31 | |||||||||||||
| Net sales |
$ | 163,746 | $ | 164,856 | $ | 154,824 | $ | 183,854 | ||||||||
| Income from operations |
$ | 13,934 | $ | 13,589 | $ | 10,122 | $ | (10,848 | ) | |||||||
| Net income (a) |
$ | 6,001 | $ | 6,953 | $ | 4,630 | $ | (25,015 | ) | |||||||
| Comprehensive income (loss)(a) |
$ | (11,856 | ) | $ | 10,955 | $ | (2,121 | ) | $ | (28,929 | ) | |||||
| Basic net income per share |
$ | 0.32 | $ | 0.36 | $ | 0.17 | $ | (0.93 | ) | |||||||
| Diluted net income per share |
$ | 0.31 | $ | 0.36 | $ | 0.17 | $ | (0.93 | ) | |||||||
| Weighted average shares outstanding: |
||||||||||||||||
| Basic number of shares |
18,996 | 19,215 | 26,839 | 26,840 | ||||||||||||
| Effect of dilutive stock options |
384 | 367 | 328 | — | ||||||||||||
|
|
|
|
|
|
|
|
|
|||||||||
| Diluted number of shares |
19,380 | 19,582 | 27,167 | 26,840 | ||||||||||||
|
|
|
|
|
|
|
|
|
|||||||||
| (a) | During the fourth quarter ended December 31, 2016, the Company identified certain prior period tax errors. The Company has determined that such errors were not material to the previously issued financial statements and therefore has corrected for such errors as out of period adjustments in 2016, resulting in $998 of tax benefit being recognized in the fourth quarter of 2016 that should have been recognized in the fourth quarter of 2015. During 2016 the Company identified certain prior period comprehensive income errors which primarily related to the accounting for deferred taxes related to unrealized gains (losses) of the fair value of derivatives and the accounting for the foreign currency translation of goodwill (see Note 10). The Company has determined that such errors were not material to the previously issued financial statements and therefore has corrected for such errors as out of period adjustments. The impact of these errors on other comprehensive income resulted in an increase (decrease) to comprehensive income of $582, $(517), $(2,542), $3,104, $91, $166, $345, $(955) for the quarters ended March 31, 2016, June 30, 2016, September 31, 2016, December 31, 2016, March 31, 2015, June 30, 2015, September 30, 2015 and December 31, 2015. |
The year ended December 31, 2016 fully reflects the acquisition activity from 2015 and 2014. Line items such as Selling, general and administrative costs, Depreciation and amortization, Restructuring and impairment charges, excluding goodwill impairment, and Interest expense, all increased as a result of increased bases in assets and higher debt and employee levels. There were no acquisitions made during 2016.
The fourth quarter of 2015 was impacted by merger and acquisition related costs of $18.7 million pre-tax, and $11.6 million after-tax primarily related to the PEP Acquisition. Additionally, the fourth quarter was negatively impacted by $18.7 million in pre-tax costs and $12.0 million in after-tax costs incurred related to writing-off debt issuance costs to our former lenders related to the new debt entered into for the PEP Acquisition.
| 18) | Accumulated Other Comprehensive Income |
The majority of our Accumulated other comprehensive income balance relates to foreign currency translation of our foreign subsidiary balances. During the year ended December 31, 2016, we had other comprehensive loss of $9.0 million due to foreign currency translations and $3.0 million loss due to change in fair value of the interest rate swap. The interest rate swap amounts were reclassified out of accumulated other comprehensive income during the three months ended September 30, 2016. Amounts were reclassified due to the forecasted transactions no longer being probable. During the year ended December 31, 2015, we had other comprehensive loss of $21.9 million due to foreign currency translations and a $2.6 million loss due to change in fair value of interest rate hedge. During the year ended December 31, 2014, we had other comprehensive loss of $17.7 million due to foreign currency translations and a $0.4 million loss due to change in fair value of interest rate hedge.
| 19) | Fair Value Measurements |
We present fair value measurements and disclosures applicable to both our financial and nonfinancial assets and liabilities that are measured and reported on a fair value basis. Fair value is an exit price representing the expected amount we would receive to sell an asset or pay to transfer a liability in an orderly transaction with market participants at the measurement date. We have followed consistent methods and assumptions to estimate the fair values as more fully described in Note 1 of the Notes to Consolidated Financial Statements.
65
Table of Contents
Our financial instruments that are subject to fair value disclosure consist of cash and cash equivalents, accounts receivable, accounts payable, derivatives and long-term debt. At September 30, 2016, the carrying values of all of these financial instruments, except the long-term debt with fixed interest rates, approximated fair value. The fair value of floating-rate debt approximates the carrying amount because the interest rates paid are based on short-term maturities. The fair value of our fixed-rate long-term debt is estimated based on the Bloomberg algorithm, which takes into account similar sized and industry debt (a Level 2 category fair value measurement). As of December 31, 2016, the fair value of our fixed-rate debt was $265.3 million, and $260.4 net of debt issuance costs.
Recurring Fair Value Measurements
The following table summarizes the assets and liabilities measured at fair value on a recurring basis for our interest rate swap derivative financial instrument:
Our policy is to manage interest expense using a mix of fixed and variable rate debt. To manage this mix effectively, we may enter into an interest rate swap in which we agree to exchange the difference between fixed and variable interest amounts calculated by reference to an agreed upon notional principal amount.
Effective December 16, 2014, we entered into a $150 million swap that went into effect on December 29, 2015 (one year delayed start), at which time our rate was locked at 6.966% until December 31, 2018. As of December 31, 2016 and as a result of post-effective amendments to the derivative, our interest rate is now fixed at 6.466% through December 31, 2018. Prior to December 16, 2014, we did not have any existing interest rate hedges. The hedge instrument will be 100% effective and as such the mark to market gains or losses on this hedge will be included in accumulated other comprehensive income (loss), to the extent effective, and reclassified into interest expense over the term of the related debt instruments.
The tables below summarizing the fair value measurement of this swap valued on a recurring basis on a gross basis:
| Fair Value Measurements at December 31, 2016 | ||||||||||||||||
| Description |
December 31, 2016 |
Quoted Prices in Active Markets for Identical Assets (Level 1) |
Significant Other Observable Inputs (Level 2) |
Significant Unobservable Inputs (Level 3) |
||||||||||||
| Derivative asset—current |
$ | 69 | $ | — | $ | 69 | $ | — | ||||||||
| Derivative asset—noncurrent |
6 | — | 6 | — | ||||||||||||
| Derivative liability—current |
(1,903 | ) | — | (1,903 | ) | — | ||||||||||
| Derivative liability—noncurrent |
(1,028 | ) | — | (1,028 | ) | — | ||||||||||
|
|
|
|
|
|
|
|
|
|||||||||
| $ | (2,856 | ) | $ | — | $ | (2,856 | ) | $ | — | |||||||
|
|
|
|
|
|
|
|
|
|||||||||
| Fair Value Measurements at December 31, 2015 | ||||||||||||||||
| Description |
December 31, 2015 |
Quoted Prices in Active Markets for Identical Assets (Level 1) |
Significant Other Observable Inputs (Level 2) |
Significant Unobservable Inputs (Level 3) |
||||||||||||
| Derivative asset—current |
$ | 388 | $ | — | $ | 388 | $ | — | ||||||||
| Derivative asset—noncurrent |
368 | — | 368 | — | ||||||||||||
| Derivative liability—current |
(2,098 | ) | — | (2,098 | ) | — | ||||||||||
| Derivative liability—noncurrent |
(1,673 | ) | — | (1,673 | ) | — | ||||||||||
|
|
|
|
|
|
|
|
|
|||||||||
| $ | (3,015 | ) | $ | — | $ | (3,015 | ) | $ | — | |||||||
|
|
|
|
|
|
|
|
|
|||||||||
Our policy is to manage interest expense using a mix of fixed and variable rate debt. To manage this mix effectively, we may enter into interest rate swaps in which we agree to exchange the difference between fixed and variable interest amounts calculated by reference to an agreed upon notional principal amount.
Our $150 million interest rate swap went into effect on December 29, 2015, at which time our interest rate was effectively 6.966%. The objective of the hedge was to eliminate the variability of cash flows in interest payments on the first $150 million of variable interest rate debt (the Term Loan B). The variable rate benchmark was the three month LIBOR rate for both the Term Loan B and the interest rate swap. The changes in cash flows of the interest rate swap were expected to exactly offset the changes in cash flows of the Term Loan B. The hedged risk was the interest rate risk exposure to changes in the interest payments, attributable to changes in the benchmark three month LIBOR interest rates (subject to a 1.0% LIBOR index floor) from December 29, 2015 through December 31, 2018. As disclosed in Note 7 of the Notes to Consolidated Financial Statements, Long-Term Debt, the LIBOR floor index was lowered
66
Table of Contents
to 0.75% on September 30, 2016, and our intent regarding future interest rate resets changed. Three-month LIBOR was above the floor, and it was more economical to use one month LIBOR. Therefore, our intensions called into question the probability of the amounts deferred in accumulated other comprehensive income (“AOCI”) as the forested transactions would not be probable. As a result, we chose to discontinue hedge accounting, reclassified all amounts in AOCI to earnings, and began to account for the interest rate swap on a mark-to-market basis. The change in reporting will have no impact on our reported cash flows, although future results of operations on a generally accepted accounting principles basis will be affected by the potential volatility of mark-to-market gains and losses which fluctuate with changes in interest rates.
The inputs for determining fair value of the interest rate swap are classified as Level 2 inputs. Level 2 fair value is based on estimates using standard pricing models. These standard pricing models use inputs which are derived from or corroborated by observable market data such as interest rate yield curves, index forward curves, discount curves, and volatility surfaces. Counterparties to these derivative contracts are highly rated financial institutions which we believe carry only a minimal risk of nonperformance.
We have elected to present the derivative contracts on a gross basis in the Consolidated Balance Sheet included within other current assets and other non-current assets and other current liabilities and other non-current liabilities. To the extent we presented the derivative contract on a net basis, we would have a derivative in a net liability position of $2.9 million as of December 31, 2016. We do not have any cash collateral due under such agreements.
As of December 31, 2016, we reported no gains or losses in AOCI related to the interest rate swaps. In connection with lowering the LIBOR index floor from 1.0% to 0.75% within the $150 million interest rate swap, we received a $0.3 million payment that reduced the net liability position on the $150 million interest rate swap. The payment was reported as Derivative payments (receipts) on interest rate swap on the Condensed Consolidated Balance Sheet. Additionally, during 2016 when the interest rate swap was accounted for in accordance with hedge accounting, the periodic settlements and related reclassification of other comprehensive income was $1.4 million of net hedging losses on the interest rate swap in the interest expense line on the Consolidated Statements of Operations. We recognized $0.6 million of interest rate swap settlements for the third quarter of 2016 in Derivative payments (receipts) on interest rate swap line on the Consolidated Statement of Operations. If there are no changes in the interest rates for the next twelve months, we expect $1.8 million in cash payments related to the interest rates swap. See the following “Derivatives’ Hedging Relationships” section of this Note for more information regarding the impact of the interest rate swaps on our Condensed Consolidated Financial Statements.
Derivatives’ Hedging Relationships
| Amount recognized in Other Comprehensive Income (effective portion) |
Location of gain/(loss) reclassified from AOCI into Net Income (effective portion) |
Pre-tax amount of gain/(loss) reclassified from AOCI in Net Income (effective portion) |
||||||||||||||||||
| Derivatives’ Cash Flow Hedging Relationships |
December 31, 2016 |
December 31, 2015 |
December 31, 2016 |
December 31, 2015 |
||||||||||||||||
| Forward starting interest rate swap contract |
$ | — | $ | (3,015 | ) | Interest Expense | $ | (1,393 | ) | $ | — | |||||||||
|
|
|
|
|
|
|
|
|
|||||||||||||
| $ | — | $ | (3,015 | ) | $ | (1,393 | ) | $ | — | |||||||||||
|
|
|
|
|
|
|
|
|
|||||||||||||
As of December 31, 2016, we did not own derivative instruments that were classified as fair value hedges or trading securities. In addition, as of December 31, 2016, we did not own derivative instruments containing credit risk contingencies.
| 20) | Equity Offering |
On July 1, 2015, we closed an underwritten registered public offering of common stock offered pursuant to a shelf registration statement on Form S-3 that was previously filed with, and declared effective by, the Securities Exchange Commission. The total number of shares of common stock sold was 7,590,000 at a public offering price of $24.00 per share. All of the shares in the offering were sold by us. Our net proceeds from the offering, after deducting underwriting discounts and commissions and offering expenses, were approximately $173.1 million. Of these proceeds, $148.7 million was used for repayment of principal and interest on our existing debt.
| Item 9. | Changes in and Disagreements with Accountants on Accounting and Financial Disclosure |
None.
| Item 9A. | Controls and Procedures |
Disclosure Controls and Procedures
Our management, under the supervision and with the participation of the Chief Executive Officer and Chief Financial Officer, conducted an evaluation of the effectiveness of the design and operation of our disclosure controls and procedures as defined under Rule l3a-15(e) promulgated under the Securities Exchange Act of 1934, as amended (the “Exchange Act”). Based upon that evaluation, because of the material weaknesses in internal control over financial reporting described below, our Chief Executive Officer and Chief Financial Officer concluded that our disclosure controls and procedures were not effective as of December 31, 2016 to ensure that information required to be disclosed in the reports that we file under the Exchange Act is recorded, processed, summarized and reported within the time periods specified in the Securities and Exchange Commission’s rules and forms, and that such information is accumulated and communicated to management, including our Chief Executive Officer and Chief Financial Officer, as appropriate, to allow for timely decisions regarding required disclosure.
67
Table of Contents
Management’s Report on Internal Control Over Financial Reporting
The management of NN, Inc. is responsible for establishing and maintaining adequate internal control over financial reporting, as such term is defined in Exchange Act Rule 13a-15(f). Because of its inherent limitations, internal control over financial reporting may not prevent or detect misstatements. Also, projections of any evaluation of effectiveness to future periods are subject to the risk that controls may become inadequate because of changes in conditions, or that the degree of compliance with the policies or procedures may deteriorate.
Management, under the supervision and with the participation of the Chief Executive Officer and Chief Financial Officer, conducted an evaluation of the effectiveness of our internal control over financial reporting as of December 31, 2016, based on the Internal Control-Integrated Framework (2013) issued by the Committee of Sponsoring Organizations of the Treadway Commission (“COSO”).
A material weakness is a deficiency, or a combination of deficiencies, in internal control over financial reporting, such that there is a reasonable possibility that a material misstatement of our annual or interim financial statements would not be prevented or detected on a timely basis.
As of December 31, 2016, management identified the following material weaknesses. We did not maintain an effective control environment due to a lack of a sufficient complement of personnel with an appropriate level of knowledge, experience and training commensurate with our financial reporting requirements. This material weakness in the control environment contributed to the following material weaknesses: we did not design and maintain effective internal control over: (i) the accounting for business combinations, which specifically included not designing and maintaining controls over the (a) accuracy, valuation and presentation and disclosure for allocating goodwill to its international businesses and (b) completeness, accuracy and valuation of deferred income taxes recorded in connection with business combinations; and (ii) the accounting for income taxes, which specifically included not designing and maintaining controls over the completeness, accuracy, valuation and presentation and disclosure of deferred income tax accounts, income tax provision and related disclosures. These material weaknesses resulted in immaterial errors to goodwill, non-current deferred tax liabilities, income taxes and other comprehensive income in our consolidated financial statements for the years ended December 31, 2016, 2015 and 2014. Additionally, these control deficiencies could result in a misstatement of substantially all account balances or disclosures that would result in a material misstatement to the annual or interim consolidated financial statements that would not be prevented or detected. Accordingly, our management has determined that these control deficiencies constitute material weaknesses.
Based on its evaluation, and as a result of the material weaknesses discussed above, management concluded that our internal control over financial reporting was not effective as of December 31, 2016.
The effectiveness of our internal control over financial reporting as of December 31, 2016 has been audited by PricewaterhouseCoopers LLP, an independent registered public accounting firm, as stated in their report which appears herein.
Remediation Plan for Material Weaknesses
In response to the identified material weaknesses, our management, with the oversight of the Audit Committee of our board of directors, has dedicated significant resources and efforts to improve our control environment and has taken immediate action to remediate the material weaknesses identified. While certain remedial actions have been completed, we continue to actively plan for and implement additional control procedures. The remediation efforts, outlined below, are intended both to address the identified material weaknesses and to enhance our overall financial control environment.
| • | Have hired additional personnel, which includes persons with knowledge of and technical expertise in SEC reporting and tax matters, including a Tax Director during the 4th quarter of 2016, and established appropriate roles and responsibilities within our finance and accounting organization to improve our knowledge and expertise over financial reporting. In 2017, we will continue to augment the personnel within our finance and accounting organization; |
| • | Instituted, and will continue to provide, additional training programs for our finance and accounting personnel; and |
| • | Strengthening our business combination and income tax control process with improved accounting policies, documentation standards, technical oversight and training. |
These material weaknesses will not be considered remediated until the applicable remedial controls operate for a sufficient period of time and management has concluded, through testing, that these controls are operating effectively.
We believe the measures described above will remediate the control deficiencies we have identified and strengthen our internal control over financial reporting. We are committed to continuing to improve our internal control processes and will continue to review, optimize and enhance our financial reporting controls and procedures. As we continue to evaluate and work to improve our internal control over financial reporting, we may determine to take additional measures to address control deficiencies or determine to modify, or in appropriate circumstances not to complete, certain of the remediation measures described above.
Changes in Internal Control over Financial Reporting
As discussed in the “Remediation Plan for Material Weaknesses” section above, there were changes in our internal control over financial reporting during the quarter ended December 31, 2016 that have materially affected, or are reasonably likely to materially affect, our internal control over financial reporting.
Risk Factor Insert:
We have identified material weaknesses in our internal control over financial reporting which could, if not remediated, result in material misstatements in our financial statements.
Our management is responsible for establishing and maintaining adequate internal control over financial reporting as defined in Rule 13a-15(f) under the Exchange Act. As disclosed in Item 9A, management identified certain material weaknesses in our internal control over financial reporting. Because of these material weaknesses, our management concluded that we did not maintain effective internal control over financial reporting as of December 31, 2016. With the oversight of the audit committee, we have begun taking steps to remediate the underlying cause of these material weaknesses and improve the design of controls.
While we expect to take the measures necessary to address the underlying causes of these material weaknesses, we cannot at this time estimate how long it will take and our efforts may not prove to be successful in remediating these material weaknesses. While we have not incurred and do not expect to incur material expenses specifically related to the remediation of these material weaknesses, actual expenses may exceed our current estimates and overall costs of compiling the system and processing documentation necessary to assess the effectiveness of our internal control over financial reporting may be material.
If we are unable to successfully remediate these material weaknesses in our internal control over financial reporting, or identify any additional material weaknesses that may exist, the accuracy and timing of our financial reporting may be adversely affected, we may be unable to maintain compliance with securities law requirements regarding timely filing of periodic reports in addition to applicable stock exchange listing requirements, and our stock price may decline materially as a result, all of which could have a material adverse effect on our business, prospects, financial condition, results of operations, or cash flows.
| Item 9B. | Other Information |
None.
Part III
| Item 10. | Directors, Executive Officers and Corporate Governance |
The information required by this Item 10 of Form 10-K concerning our directors is contained in the sections entitled “Information about the Directors” and “Beneficial Ownership of Common Stock” of our definitive proxy statement to be filed with the Securities and Exchange Commission within 120 days after December 31, 2016, in accordance with General Instruction G to Form 10-K, is hereby incorporated herein by reference.
Our Code of Conduct/Ethics Statement, as amended (the “Code”), was most recently approved by our Board on August 11, 2016. The Code is applicable to all officers, directors and employees. The Code is posted on our website at www.nninc.com. Information contained on our website is not part of this Annual Report on Form 10-K. We will satisfy any disclosure requirements under Item 5.05 of Form 8-K regarding an amendment to, or waiver from, any provision of the Code with respect to our principal executive officer, principal financial officer, principal accounting officer and persons performing similar functions by disclosing the nature of such amendment or waiver on our website or in a Current Report on Form 8-K.
| Item 11. | Executive Compensation |
The information required by Item 11 of Form 10-K is contained in the sections entitled “Information about the Directors — Compensation of Directors” and “Executive Compensation” of our definitive proxy statement and, in accordance with General Instruction G to Form 10-K, is hereby incorporated herein by reference.
68
Table of Contents
| Item 12. | Security Ownership of Certain Beneficial Owners and Management and Related Stockholder Matters |
The information required by Item 12 of Form 10-K is contained in the section entitled “Beneficial Ownership of Common Stock” of our definitive proxy statement and, in accordance with General Instruction G to Form 10-K, is hereby incorporated herein by reference.
Information required by Item 201(d) of Regulation S-K concerning our equity compensation plans is set forth in the table below:
Table of Equity Compensation Plan Information
| (in thousands, except per share data) | ||||||||||||
| Plan Category |
Number of securities to be issued upon exercise of outstanding options, warrants and rights (a) |
Weighted –average exercise price of outstanding options, warrants and rights(b) |
Number of securities remaining available for future issuance under equity compensation plans (excluding securities reflected in column (a)) (c) |
|||||||||
| Equity compensation plans approved by security holders |
897 | $ | 12.22 | 2,300 | ||||||||
| Equity compensation plans not approved by security holders |
— | — | — | |||||||||
| Total |
897 | $ | 12.22 | 2,300 | ||||||||
| Item 13. | Certain Relationships and Related Transactions, and Director Independence |
Information regarding review, approval or ratification of transactions with related persons is contained in a section entitled “Certain Relationships and Related Transactions” of our definitive proxy statement and, in accordance with General Instruction G to Form 10-K, is hereby incorporated herein by reference.
Information regarding director independence is contained in a section entitled “Information about the Directors” of our definitive proxy statement and, in accordance with General Instruction G to Form 10-K, is hereby incorporated herein by reference.
| Item 14. | Principal Accountant Fees and Services |
Information required by this item of Form 10-K concerning our accounting fees and services is contained in the section entitled “Fees Paid to Independent Registered Public Accounting Firm” of our definitive proxy statement and, in accordance with General Instruction G to Form 10-K, is hereby incorporated herein by reference.
69
Table of Contents
Part IV
| Item 15. | Exhibits and Financial Statement Schedules |
| (a) | List of Documents Filed as Part of this Report |
1. Financial Statements
The financial statements of NN, Inc. filed as part of this Annual Report on Form 10-K begin on the following pages hereof:
| Page | ||||
| 37 | ||||
| 38 | ||||
| 39 | ||||
| 40 | ||||
| Consolidated Statements of Cash Flows for the years ended December 31, 2015, 2014, and 2013 |
41 | |||
| 42 | ||||
2. Financial Statement Schedules
The required information is reflected in the Notes to Consolidated Financial Statements within Item 8.
3. See Index to Exhibits (attached hereto)
| (b) | Exhibits: See Index to Exhibits (attached hereto). |
NN, Inc. will provide without charge to any person, upon the written request of such person, a copy of any of the Exhibits to this Form 10-K.
| (c) | Not Applicable |
| Item 16. | Summary |
None.
70
Table of Contents
SIGNATURES
Pursuant to the requirements of Section 13 or 15(d) of the Securities Exchange Act of 1934, the registrant has duly caused this report to be signed on its behalf by the undersigned, thereunto duly authorized.
| NN, Inc. | ||
| By: | /S/ RICHARD D. HOLDER | |
| Richard D. Holder | ||
| Chief Executive Officer, President and Director | ||
| Dated: March 16, 2017 | ||
Pursuant to the requirements of the Securities Exchange Act of 1934, this report has been signed below by the following persons on behalf of the Registrant and in the capacities and on the date indicated.
| Name and Signature |
Title |
Date | ||
| /s/ RICHARD D. HOLDER |
Chief Executive Officer, President and Director | March 16, 2017 | ||
| Richard D. Holder | ||||
| /S/ THOMAS C. BURWELL, JR. |
Senior Vice President- Chief Financial Officer | March 16, 2017 | ||
| Thomas C. Burwell, Jr. | ||||
| /S/ G. RONALD MORRIS |
Non-Executive Chairman, Director | March 16, 2017 | ||
| G. Ronald Morris | ||||
| /s/ ROBERT E. BRUNNER |
Director | March 16, 2017 | ||
| Robert E. Brunner | ||||
| /S/ WILLIAM DRIES |
Director | March 16, 2017 | ||
| William Dries | ||||
| /S/ DAVID K. Floyd |
Director | March 16, 2017 | ||
| David K. Floyd | ||||
| /S/ DAVID L. PUGH |
Director | March 16, 2017 | ||
| David L. Pugh | ||||
| /S/ STEVEN T. WARSHAW |
Director | March 16, 2017 | ||
| Steven T. Warshaw | ||||
71
Table of Contents
Index to Exhibits
| Incorporation by Reference | ||||||||||
| Exhibit |
Exhibit Description |
Form |
SEC File No. |
Exhibit |
Filing Date | |||||
| 2.1 |
Agreement and Plan of Merger, dated as of July 18, 2014, by and among NN, Inc., PMC Global Acquisition Corporation, Autocam Corporation, Newport Global Advisors, L.P., and John C. Kennedy | 8-K | 000-23486 | 2.1 | July 22, 2014 | |||||
| 2.2 |
Stock Purchase Agreement, dated as of August 17, 2015, by and among NN, Inc., Precision Engineered Products Holdings, Inc. and PEP Industries, LLC | 8-K | 000-23486 | 2.1 | August 18, 2015 | |||||
| 3.1 |
Restated Certificate of Incorporation of NN, Inc. | S-3 | 333-89950 | 3.1 | June 6, 2002 | |||||
| 3.2 |
Certificate of Designation of Series A Junior Participating Preferred Stock of NN, Inc., as filed with the Secretary of the State of Delaware | 8-K | 000-23486 | 3.1 | December 18, 2008 | |||||
| 3.3 |
Amended and Restated By-Laws of NN, Inc. | 8-K | 000-23486 | 3.1 | November 20, 2015 | |||||
| 4.1 |
The specimen stock certificate representing NN, Inc.’s Common Stock, par value $0.01 per share | S-3 | 333-89950 | 4.1 | June 6, 2002 | |||||
| 4.2 |
Stockholders’ Agreement, effective as of August 29, 2014, by and between NN, Inc. and John C. Kennedy | 8-K | 000-23486 | 4.1 | September 2, 2014 | |||||
| 4.3 |
Indenture, dated as of October 19, 2015, by and among NN, Inc., the subsidiary guarantors party thereto, and U.S. Bank National Association, as trustee | 8-K | 000-23486 | 4.1 | October 20, 2015 | |||||
| 4.4 |
Form of the NN, Inc. 10.25% Senior Notes due 2020 | 8-K | 000-23486 | 4.2 | October 20, 2015 | |||||
| 4.5 |
Supplemental Indenture, dated as of October 19, 2015, by and among NN, Inc., certain direct and indirect subsidiaries of NN, Inc., as additional subsidiary guarantors, and U.S. Bank National Association, as trustee | 8-K | 000-23486 | 4.3 | October 20, 2015 | |||||
| 10.1* |
NN, Inc. 2005 Stock Incentive Plan | S-8 | 333-130395 | 4.3 | December 16, 2005 | |||||
| 10.2* |
NN, Inc. 2011 Amended and Restated Stock Incentive Plan | DEF14A | 000-23486 | Appendix A | April 1, 2016 | |||||
| 10.3* |
Form of Indemnification Agreement | S-3/A | 333-89950 | 10.6 | July 15, 2002 | |||||
| 10.4* |
Elective Deferred Compensation Plan, dated February 26, 1999 | 10-K | 000-23486 | 10.16 | March 31, 1999 | |||||
| 10.5* |
Amended and Restated Executive Employment Agreement, dated September 13, 2012, by and between NN, Inc. and James H. Dorton | 8-K | 000-23486 | 10.2 | September 18, 2012 | |||||
| 10.6* |
Amended and Restated Executive Employment Agreement, dated September 13, 2012, by and between NN, Inc. and Thomas C. Burwell | 8-K | 000-23486 | 10.3 | September 18, 2012 | |||||
72
Table of Contents
| 10.7* |
Amended and Restated Executive Employment Agreement, dated September 13, 2012, by and between the Whirlaway and James R. Widders | 8-K | 000-23486 | 10.6 | September 18, 2012 | |||||
| 10.8* |
Executive Employment Agreement, dated May 8, 2013, between NN, Inc. and Richard D. Holder | 8-K | 000-23486 | 10.1 | May 10, 2013 | |||||
| 10.9 |
Escrow Agreement, effective as of August 29, 2014, by and among NN, Inc., Newport Global Advisors, L.P., John C. Kennedy and Computershare Trust Company, N.A. | 8-K | 000-23486 | 10.3 | September 2, 2014 | |||||
| 10.10 |
Indemnity Agreement, effective as of August 29, 2014, by and among NN, Inc. and each of the shareholders of Autocam Corporation identified therein | 8-K | 000-23486 | 10.4 | September 2, 2014 | |||||
| 10.11* |
Executive Employment Agreement, dated September 9, 2014, between NN, Inc. and Warren A. Veltman | 10-K | 000-23486 | 10.27 | March 16, 2015 | |||||
| 10.12* |
Executive Employment Agreement, dated October 6, 2014, between NN, Inc. and L. Jeffrey Manzagol | 10-K | 000-23486 | 10.28 | March 16, 2015 | |||||
| 10.13* |
Separation Agreement and Release, dated as of April 4, 2016, by and between James H. Dorton and NN, Inc. | 8-K | 000-23486 | 10.1 | April 4, 2016 | |||||
| 10.14 |
Amended and Restated Registration Rights Agreement, dated as of June 10, 2016, by and among NN, Inc., the guarantors party thereto, SunTrust Robinson Humphrey, Inc., on behalf of itself and as representative of the initial purchasers, Spring Capital II Subsidiary, L.P., Summit Partners Credit Fund II, L.P, Summit Partners Credit Fund B-2, L.P., Summit Partners Credit Fund A-2, L.P., Summit Investors Credit II, LLC, Summit Investors Credit II (UK), L.P. and Summit Partners Credit Offshore Intermediate Fund II, L.P. | 8-K | 000-23486 | 10.1 | June 10, 2016 | |||||
| 10.15 |
Amendment and Restatement Agreement, dated as of September 30, 2016, by and among NN, Inc., certain NN, Inc. subsidiaries named therein, SunTrust Bank, KeyBank National Association and Regions Bank | 8-K | 000-23486 | 10.1 | October 3, 2016 | |||||
| 10.16 |
Incremental Amendment to Amended and Restated Credit Agreement, dated as of October 31, 2016, among NN, Inc., the Guarantors, HomeTrust Bank, as 2016 Revolving Credit Increase Lender, KeyBank National Association, as an L/C Issuer, Regions Bank, as Swing Line Lender and an L/C Issuer, and SunTrust Bank, as Administrative Agent and an L/C Issuer | 8-K | 000-23486 | 10.1 | November 4, 2016 | |||||
| 10.17 |
NN, Inc. 2016 Omnibus Incentive Plan | DEF14A | 000-23486 | Appendix A | November 10, 2016 | |||||
| 10.18# |
Form of Incentive Stock Option Agreement under the 2016 Omnibus Incentive Plan | |||||||||
| 10.19# |
Form of Nonqualified Stock Option Agreement under the 2016 Omnibus Incentive Plan | |||||||||
| 10.20# |
Form of Restricted Share Award Agreement under the 2016 Omnibus Incentive Plan | |||||||||
| 10.21# |
Form of Performance Share Unit Award Agreement under the 2016 Omnibus Incentive Plan | |||||||||
73
Table of Contents
| 12.1# |
Calculation of Ratios of Earnings to Fixed Charges | |||||||||
| 21.1# |
List of Subsidiaries of NN, Inc. | |||||||||
| 23.1# |
Consent of PricewaterhouseCoopers LLP, Independent Registered Public Accounting Firm | |||||||||
| 23.2# |
Consent of Deloitte Touche Tohmatsu Certified Public Accountants LLP, Independent Registered Public Accounting Firm | |||||||||
| 31.1# |
Certification of Chief Executive Officer pursuant to Section 302 of Sarbanes-Oxley Act | |||||||||
| 31.2# |
Certification of Chief Financial Officer pursuant to Section 302 of Sarbanes-Oxley Act | |||||||||
| 32.1## |
Certification of Chief Executive Officer pursuant to Section 906 of Sarbanes-Oxley Act | |||||||||
| 32.2## |
Certification of Chief Financial Officer pursuant to Section 906 of Sarbanes-Oxley Act | |||||||||
| 99.1# |
Financial Statements of Wuxi Weifu Autocam Precision Machinery Co., Ltd. | |||||||||
| 101.INS# |
XBRL Instance Document | |||||||||
| 101.SCH# |
XBRL Taxonomy Extension Service | |||||||||
| 101.CAL# |
Taxonomy Calculation Linkbase | |||||||||
| 101LAB# |
XBRL Taxonomy Label Linkbase | |||||||||
| 101.PRE# |
XBRL Presentation Linkbase Document | |||||||||
| 101.DEF# |
XBRL Definition Linkbase Document | |||||||||
| * | Management contract or compensatory plan or arrangement. |
| # | Filed herewith |
| ## | Furnished herewith |
74