Attached files
| file | filename |
|---|---|
| EX-99.1 - EXHIBIT 99.1 - OTELCO INC. | tm2012005d1_ex99-1.htm |
| 8-K - FORM 8-K - OTELCO INC. | tm2012005d1_8k.htm |
Exhibit 99.2

OTELCO INC. OTEL (Nasdaq) www.otelco.com March 2020 1

2 This presentation contains forward - looking statements that are subject to risks and uncertainties . Forward - looking statements give our current expectations relating to our financial condition, results of operations, plans, objectives, future performance and business . These statements may include words such as “anticipate,” “estimate,” “expect,” “project,” “plan,” “intend,” “believe” and other words and terms of similar meaning in connection with any discussion of the timing or nature of future operating or financial performance or other events . These forward - looking statements are based on assumptions that we have made in light of our experience in the industry in which we operate, as well as our perceptions of historical trends, current conditions, expected future developments and other factors we believe are appropriate under the circumstances . Although we believe that these forward - looking statements are based on reasonable assumptions, you should be aware that many factors could affect our actual financial condition or results of operations, or cause our actual results to differ materially from those in the forward - looking statements .
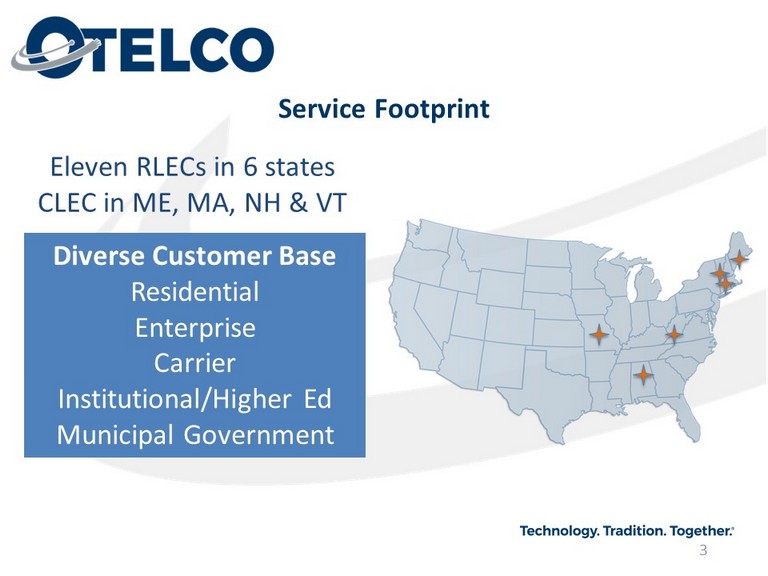
3 Diverse Customer Base Residential Enterprise Carrier Institutional/Higher Ed Municipal Government Eleven RLECs in 6 states CLEC in ME, MA, NH & VT Service Footprint

4 2007 - 2010 • Issued 3 Million IDS units • Acquired 4 ILECs, 2 CLEC properties in MA, ME, NH and WV • Class B conversion to IDS units 2015 - Present • 11 ILEC companies accept A - CAM funding in 6 states • Conversion to consolidated billing and operations systems • Refinanced debt with 5 year CoBank loan 2004 - 2006 • Initial Public Offering of IDS units (OTT:AMEX) • Acquired Mid - Missouri ILEC & ISP • Acquired Mid - Maine ILEC and CLEC 2011 - 2014 • Acquired Shoreham, VT ILEC • IDS units extinguished in conjunction with 2013 Ch. 11 bankruptcy filing: new Class A shares issued ( OTEL:Nasdaq ) • Initiated Cloud Hosting and Managed Services 2019 onward • Expand construction of Fiber to the Premise/Node (FTTP/N) • Continue debt reduction Future Growth Plan… • Future driven by new FTTP/N builds and upgrades to existing infrastructure 2007 - 2010 • Issued 3 Million IDS units • Acquired 4 ILECs, 2 CLEC properties in MA, ME, NH and WV • Class B conversion to IDS units Timeline

5 5 30+ years of experience Appointed President in May 2019 and CEO in January 2020 Joined Otelco in October 2018 as COO Previously Executive Vice President and CFO at Oxford Networks then FirstLight Fiber 40+ years of experience Served as Chief Financial Officer since February 2004 20+ years of experience Joined Otelco in 2017 Previously Vice President of Technology at Great Works Internet 20+ years of experience Previously served as Vice President of Business Development and Director of Sales and Marketing at Great Works Internet 25+ years of experience Served as General Counsel since 2013 Served as Director of Legal and Regulatory Affairs 2009 - 2013 Exceptional management team with deep expertise leading companies in the telecommunications industry and a demonstrated track record of managing growth platforms Richard Clark President and CEO Curtis Garner CFO David Allen VP of Network Operations Trevor Jones VP of Sales, Marketing and Customer Service Trina Bragdon General Counsel, VP of Human Resources and Regulatory Affairs Prior Experience Prior Experience Prior Experience Prior Experience Prior Experience Management Team

6 28,000+ ILEC Customers Both Business and Residential MILLION 2019 revenue $47 million in RLEC $15 million in CLEC $62+ SERVICE FOOTPRINT 11 RLECS across 6 states and CLEC serving 3 states MILLION 2019 EBITDA $23+ EMPLOYEES With 18 office facilities across 6 states 200+ CLEC BUSINESS CUSTOMERS Across critical industries 2,000+ Otelco At - a - Glance

7 2,551 Mile Fiber Network 1,588 Transport, 963 Distribution 56 Cell Towers Served 5,630 Mile Copper Network Network Footprint RLEC (BLUE) CLEC (YELLOW) Missouri New England Alabama West Virginia

8 Summary Core Products RLEC CLEC Otelco offers its SMB and Enterprise customer base a comprehensive portfolio of advanced Voice and Data telecommunications services, as well as a suite of Cloud Hosted and Managed Services . Hosted PBX x x Business Telephony x x High - Speed Data & Internet x x Wide Area Networking (WAN) x x Colocation x Cloud Computing x x Otelco’s Residential segment provides profitable Voice, Internet, Security and video services ¹ to communities in Alabama, Maine, Massachusetts, Missouri , Vermont and West Virginia . High - Speed Internet x x Telephony Services x x Home Automation and Security x Cable and IP TV ¹ x Otelco delivers a full suite of carrier - grade connectivity and colocation products to its Carrier and Wholesale customers, including Internet Service Providers (ISP), Wireless ISP and Managed Services Providers . Access x x Cell Tower Backhaul x x Carrier Internet x Colocation x LAN/WAN x SIP Trunking x TDM Services x x Business Residential Carrier/ Wholesale (1) Video services currently available in Alabama and Vermont Full Product Suite Otelco offers a full suite of advanced telecommunication services to meet the voice, data and connectivity needs of its custo mer s. The Company’s product suite provides comprehensive solutions for the entirety of its business, residential and carrier/wholes ale customers’ communications needs including hosted voice, high - bandwidth connectivity and access services.

9 Otelco Network Summary New England CLEC Missouri RLEC New England RLEC Alabama RLEC Switching Facilities Remote Switches 31 Colos 89 107 75 Video Nodes - - - 46 Wireless Internet Access Points - 156 - - Total Fiber Route Miles 1,259 473 513 1,322 Owned Fiber Route Miles 243 473 513 1,322 Transport Fiber Route Miles 243 457 370 518 Distribution Fiber Route Miles - 16 143 804 IRU Fiber Route Miles 235 - - - Leased Fiber Route Miles 781 - - - Copper Route Miles - 1,010 1,501 3,119 1) Figures as of January 2019 Network Summary

10 0% 5% 10% 15% 20% 25% 30% 35% 40% Local Services Network Access Internet Transport Services Cable Television Managed Services 2019 2015 Diverse and Stable Revenue Mix
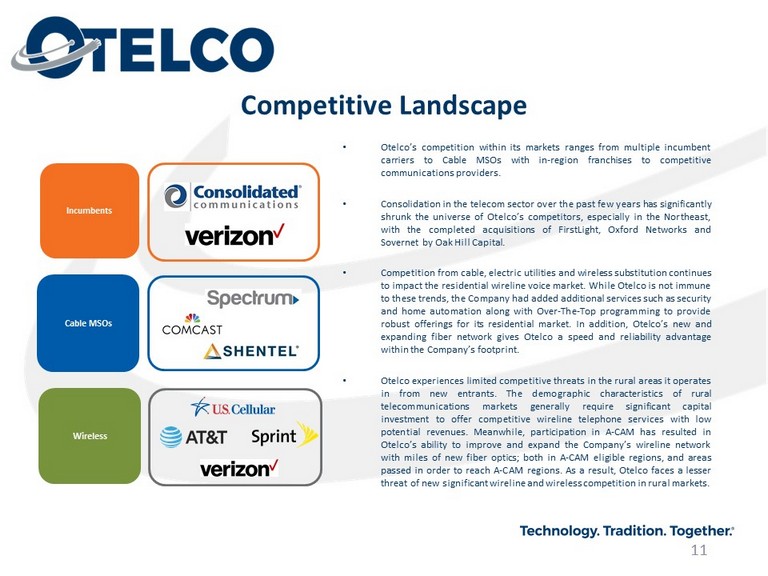
11 Competitive Landscape Incumbents Cable MSOs • Otelco’s competition within its markets ranges from multiple incumbent carriers to Cable MSOs with in - region franchises to competitive communications providers . • Consolidation in the telecom sector over the past few years has significantly shrunk the universe of Otelco’s competitors, especially in the Northeast, with the completed acquisitions of FirstLight , Oxford Networks and Sovernet by Oak Hill Capital . • Competition from cable, electric utilities and wireless substitution continues to impact the residential wireline voice market . While Otelco is not immune to these trends, the Company had added additional services such as security and home automation along with Over - The - Top programming to provide robust offerings for its residential market . In addition, Otelco’s new and expanding fiber network gives Otelco a speed and reliability advantage within the Company’s footprint . • Otelco experiences limited competitive threats in the rural areas it operates in from new entrants . The demographic characteristics of rural telecommunications markets generally require significant capital investment to offer competitive wireline telephone services with low potential revenues . Meanwhile, participation in A - CAM has resulted in Otelco’s ability to improve and expand the Company’s wireline network with miles of new fiber optics ; both in A - CAM eligible regions, and areas passed in order to reach A - CAM regions . As a result, Otelco faces a lesser threat of new significant wireline and wireless competition in rural markets . Wireless

12 Alternative Connect America Model (A - CAM) Election • In March 2016 FCC adopted A - CAM USF plan for Rate - of - Return carriers • A - CAM provides fixed support through 2028 • Promotes broadband build - out in rural America • Replaces legacy High - Cost Loop Support (HCLS) & Interstate Common Line Support (ICLS) mechanisms • Carriers must deliver 25/3 Mbps service to locations in non - competitive, eligible census blocks – A - CAM census blocks represent approximately 23.5% of targeted market – A - CAM census blocks represent approximately 43.6% of copper route miles *Includes Transitional Support Payments **USF in Maine and Vermont, Transitional Support in Alabama ***Connect America Funds and CAF BLS A-CAM FUNDING* $8,971 STATE UNIVERSAL FUNDS** $882 OTHER FEDERAL USF*** $5,878 Total $15,731 2019 Funding (000)

13 Debt Agreement • Debt facility with CoBank through November 2022 • $87.0 million term loan • $20.0 million accordion feature and $5.0 million revolver • Loan balance reduced over $4.4 million in 2019 • Current loan balance $70.2 million at December 31, 2019 • Scheduled principal amortization of $1.1 million per quarter • 2019 interest rate of 4.25% plus Libor • Current interest rate of 4.50% plus Libor • Covenants amended effective December 31, 2019 to allow for increased business investment to expand fiber network
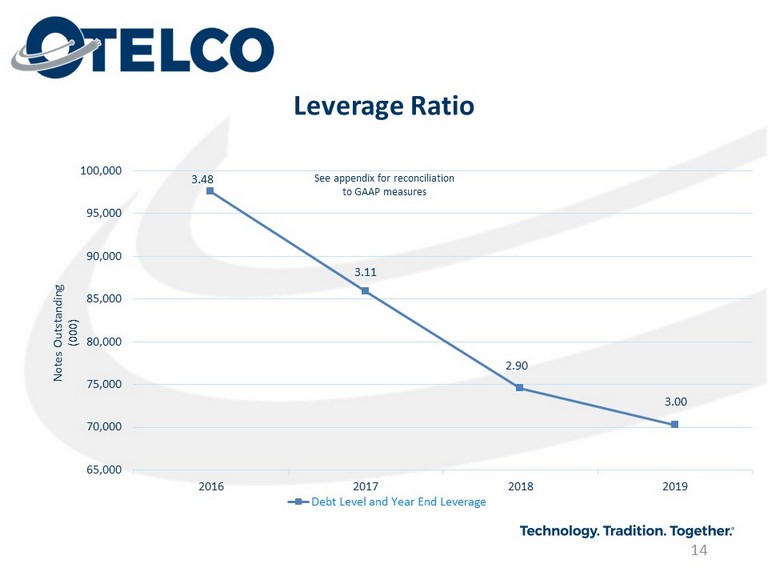
14 3.48 3.11 2.90 3.00 65,000 70,000 75,000 80,000 85,000 90,000 95,000 100,000 2016 2017 2018 2019 Debt Level and Year End Leverage Notes Outstanding (000) Leverage Ratio See appendix for reconciliation to GAAP measures

15 Cable and VDSL Upgrade Fiber Builds Execution on A - CAM Obligations Deploy Capital Effectively Operational Objectives

16 • 38% increase in ILEC customers receiving over 10Mpbs internet via copper and cable network in 2019 • 83% increase in customers receiving over 25Mpbs. Improve Internet Speeds • Customer churn slows through 2019 • Internet product churn has slowed or reversed where fiber construction has begun or been announced • Phone line churn has continued Reduce Churn • Business customers continue to drop phone lines due to competition • Residential customers continue to drop landlines in favor cell phones • Customers are dropping fewer internet connections due to increased speeds. Stabilize Revenue Operational Objectives Cable and VDSL Upgrades • Increase available speed in cable network to 1Gig in 2020 • Implementing VDSL to increase speeds to 50 Mbps for some customers

17 Current Status • 11 eligible RLECs opted for A - CAM funding • Will continue to receive funding through 2028 • Building to current and new customers in all regions • Able to meet some obligations with current DSL network • Secured additional funding through CAF II auction; building to additional locations in Massachusetts Expected Impact • Increase revenue per customer • 12 years of predictable cash flows • Meet 25/3Mbps speed obligations at approximately 5,000 - 6,000 locations by end of 2020, deploying FTTP/N and VDSL • Ultimately pass 13,800 locations in A - CAM census blocks Execute on A - CAM Obligations Operational Objectives

18 Capture New Revenue with Fiber Offerings Market aggressively in new fiber footprints Evolve product lines Price competitively: pricing realignments in 2019 to compete with cable providers Upsell fiber to existing customers Impacts of Fiber Builds 71% increase in fiber internet customers in 2019 57% increase in annualized revenue from fiber customers 1,320 net new fiber customers in 2019 Effectively Manage Expenses Continue to manage operational efficiency New fiber plant requires less maintenance Network optimization Fiber Builds • Over 2,200 new locations passed in 2019 • 2,237 locations scheduled for 2020 • Total of 12,699 locations by end of 2020 • 18.8 % of market Operational Objectives

19 Strategic capex • Investigate and implement lower cost methods to meet A - CAM obligations • Build fiber outside of A - CAM territories to expand fiber network Manage debt • Closely maintain leverage and debt covenants Invest in strategic M&A • Opportunities for partnerships and growth Deploy Capital Effectively • Expand service areas served by fiber to increase service levels and reduce churn • Goal of stabilizing revenues over a multi - year period • Capital expenditures increased from $6.9M (2016) to over $12.4M (2019) Operational Objectives

20 • Mapping Integration Project – Determine market size of Otelco’s network – Establish current customer penetration rates – Estimate costs to build fiber in entire market – Ability to determine competitive landscape by region – Identify areas with highest ROI potential – Expected completion date of July 2020 • VDSL Deployment – Enable VDSL service in all Central Office and Remote locations – Meet 40% A - CAM coverage in 2020 – Provide up to 75 Mbps service to qualifying locations – Expected completion date of July 2020 • Cable Deployment – Free up spectrum currently used by analog channels to enhance speeds for Cable internet customers – Potentially offer up to 1 Gbps service – Allow for deployment of additional HD channels – Expected completion in 2021 2020 Operational Initiatives

21 APPENDIX
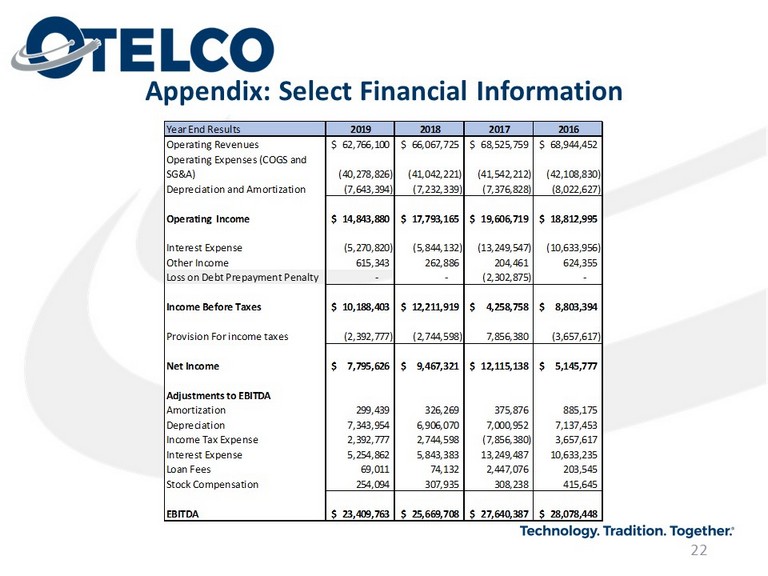
22 Appendix: Select Financial Information Year End Results 2019 2018 2017 2016 Operating Revenues 62,766,100$ 66,067,725$ 68,525,759$ 68,944,452$ Operating Expenses (COGS and SG&A) (40,278,826) (41,042,221) (41,542,212) (42,108,830) Depreciation and Amortization (7,643,394) (7,232,339) (7,376,828) (8,022,627) Operating Income 14,843,880$ 17,793,165$ 19,606,719$ 18,812,995$ Interest Expense (5,270,820) (5,844,132) (13,249,547) (10,633,956) Other Income 615,343 262,886 204,461 624,355 Loss on Debt Prepayment Penalty - - (2,302,875) - Income Before Taxes 10,188,403$ 12,211,919$ 4,258,758$ 8,803,394$ Provision For income taxes (2,392,777) (2,744,598) 7,856,380 (3,657,617) Net Income 7,795,626$ 9,467,321$ 12,115,138$ 5,145,777$ Adjustments to EBITDA Amortization 299,439 326,269 375,876 885,175 Depreciation 7,343,954 6,906,070 7,000,952 7,137,453 Income Tax Expense 2,392,777 2,744,598 (7,856,380) 3,657,617 Interest Expense 5,254,862 5,843,383 13,249,487 10,633,235 Loan Fees 69,011 74,132 2,447,076 203,545 Stock Compensation 254,094 307,935 308,238 415,645 EBITDA 23,409,763$ 25,669,708$ 27,640,387$ 28,078,448$

23 Appendix: Leverage Ratio Year End Results 2019 2018 2017 2016 Net Income 7,795,626$ 9,467,321$ 12,115,138$ 5,145,777$ Adjustments to EBITDA Amortization 299,439 326,269 375,876 885,175 Depreciation 7,343,954 6,906,070 7,000,952 7,137,453 Income Tax Expense 2,392,777 2,744,598 (7,856,380) 3,657,617 Interest Expense 5,254,862 5,843,383 13,249,487 10,633,235 Loan Fees 69,011 74,132 2,447,076 203,545 Stock Compensation 254,094 307,935 308,238 415,645 EBITDA 23,409,763$ 25,669,708$ 27,640,387$ 28,078,448$ Senior Notes Payable 65,862,500$ 70,212,500$ 81,562,500$ 74,875,000$ Current Portion LT Debt 4,350,000 4,350,000 4,350,000 7,125,000 Sub Notes Payable - - - 15,572,726 Sub Notes Outstanding - - - Notes Outstanding 70,212,500$ 74,562,500$ 85,912,500$ 97,572,726$ Leverage 3.00 2.90 3.11 3.48

24 Appendix: Select Financial Information Year End Results 2019 2018 2017 2016 Operating Revenues 62,766,100$ 66,067,725$ 68,525,759$ 68,944,452$ Operating COGS and SG&A (40,278,826)$ (41,042,221)$ (41,542,212)$ (42,108,830)$ % Revenue 64% 62% 61% 61% Consolidated EBITDA 23,409,763$ 25,669,708$ 27,640,387$ 28,078,448$ % Revenue 37% 39% 40% 41%

25 Appendix: Select Financial Information Year End Results 2019 2018 2017 2016 EBITDA 23,409,763$ 25,669,708$ 27,640,387$ 28,078,448$ Capital Expenditures 12,439,624 7,983,158 8,510,625 6,879,677 Free Cash Flow 10,970,139 17,686,550 19,129,762 21,198,771 Debt 70,212,500$ 74,562,500$ 85,912,500$ 97,572,726$ Cash 3,113,092 4,656,624 3,570,367 10,537,577 Net Debt 67,099,408 69,905,876 82,342,133 87,035,149 Debt/EBITDA 3.00 2.90 3.11 3.48 Net Debt/EBITDA 2.87 2.72 2.98 3.10

26 FTTP/FTTN Projects in 2019

27 Total Locations Passed with Fiber Locations Passed = Ready for service installation via drop fiber. State Pre 2017 2017 2018 2019 Total Fiber CustomersPenetration Alabama 3,159 1,230 1,364 2,786 8,539 2,343 27% New England 236 360 330 629 1,555 647 42% Missouri 51 225 92 - 368 198 54% Total 3,446 1,815 1,786 3,415 10,462 3,188 30%
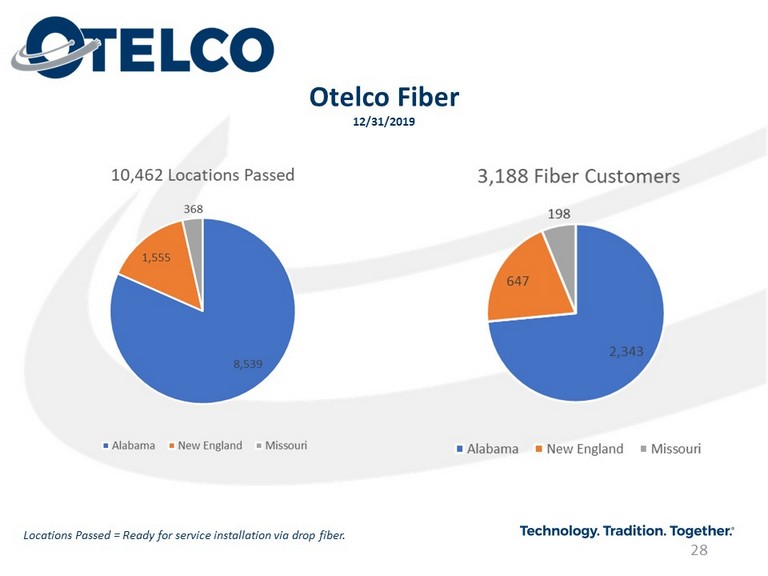
28 Otelco Fiber 12/31/2019 Locations Passed = Ready for service installation via drop fiber.
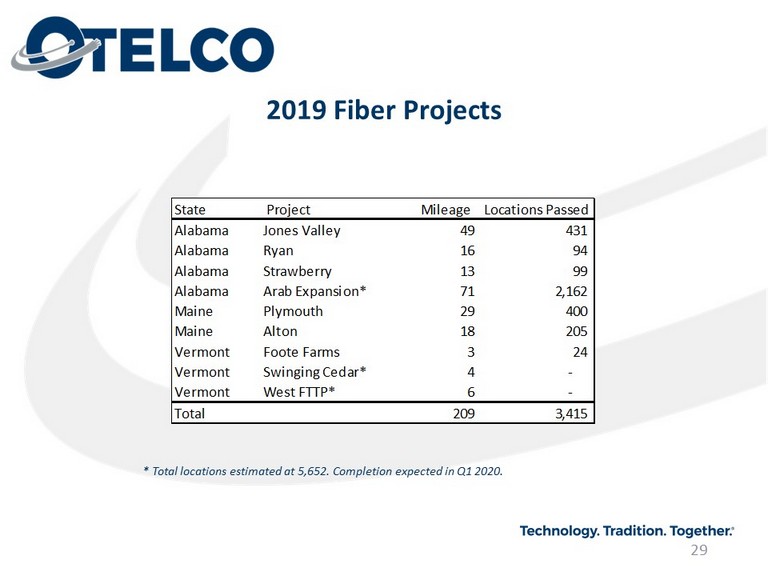
29 2019 Fiber Projects * Total locations estimated at 5,652. Completion expected in Q1 2020. State Project Mileage Locations Passed Alabama Jones Valley 49 431 Alabama Ryan 16 94 Alabama Strawberry 13 99 Alabama Arab Expansion* 71 2,162 Maine Plymouth 29 400 Maine Alton 18 205 Vermont Foote Farms 3 24 Vermont Swinging Cedar* 4 - Vermont West FTTP* 6 - Total 209 3,415

30 2019 Fiber Projects Jones Valley & Ryan Alabama Strawberry

31 2019 Fiber Projects Plymouth Maine Burlington

32 2019 Fiber Projects Singing Cedar Vermont West FTTP/N

Glossary of Terms A - CAM Alternative Connect America Model CAF II Connect America Fund II CAF BLS Connect America Fund Broadband Loop Support CLEC Competitive Local Exchange Carrier FTTN Fiber to the Node (fiber to a remote office, allows for increased speed over existing copper network) FTTP Fiber to the Premise HCLS High Cost Loop Support ICLS Interstate Common Line Support ISP Internet Service Provider MSO Multiple System Operators RLEC Rural Local Exchange Carrier TSF Transitional Support Fund USF Universal Service Fund VDSL Very - high - bit - rate Digital Subscriber Line 33

OTELCO Inc. OTEL (Nasdaq) www.otelco.com 34