Attached files
| file | filename |
|---|---|
| EX-31.2 - EXHIBIT 31.2 - Intrepid Potash, Inc. | ipi12312019exhibit312.htm |
| EX-95.1 - EXHIBIT 95.1 - Intrepid Potash, Inc. | ipi12312019exhibit951.htm |
| EX-32.2 - EXHIBIT 32.2 - Intrepid Potash, Inc. | ipi12312019exhibit322.htm |
| EX-32.1 - EXHIBIT 32.1 - Intrepid Potash, Inc. | ipi12312019exhibit321.htm |
| EX-31.1 - EXHIBIT 31.1 - Intrepid Potash, Inc. | ipi12312019exhibit311.htm |
| EX-23.2 - EXHIBIT 23.2 - Intrepid Potash, Inc. | ipi12312019exhibit232.htm |
| EX-23.1 - EXHIBIT 23.1 - Intrepid Potash, Inc. | ipi12312019exhibit231.htm |
| EX-21.1 - EXHIBIT 21.1 - Intrepid Potash, Inc. | ipi12312019exhibit211.htm |
| EX-4.1 - EXHIBIT 4.1 - Intrepid Potash, Inc. | ipi12312019exhibit41.htm |
UNITED STATES
SECURITIES AND EXCHANGE COMMISSION
Washington, D.C. 20549
FORM 10-K | ||
x | Annual Report Pursuant to Section 13 or 15(d) of the Securities Exchange Act of 1934 |
For the fiscal year ended December 31, 2019 | |
or | |
¨ | Transition Report Pursuant to Section 13 or 15(d) of the Securities Exchange Act of 1934 |
For the transition period from to
Commission File Number: 001-34025

INTREPID POTASH, INC.
(Exact Name of Registrant as Specified in its Charter)
Delaware | 26-1501877 |
(State or other jurisdiction of incorporation or organization) | (I.R.S. Employer Identification No.) |
1001 17th Street, Suite 1050, Denver, Colorado | 80202 |
(Address of principal executive offices) | (Zip Code) |
(303) 296-3006
(Registrant's telephone number, including area code)
Securities registered pursuant to Section 12(b) of the Act:
Title of each class | Trading Symbol | Name of each exchange on which registered |
Common Stock, par value $0.001 per share | IPI | New York Stock Exchange |
Securities registered pursuant to Section 12(g) of the Act: None
Indicate by check mark if the registrant is a well-known seasoned issuer, as defined in Rule 405 of the Securities Act. Yes ¨ No x
Indicate by check mark if the registrant is not required to file reports pursuant to Section 13 or 15(d) of the Act. Yes ¨ No x
Indicate by check mark whether the registrant (1) has filed all reports required to be filed by Section 13 or 15(d) of the Securities Exchange Act of 1934 during the preceding 12 months (or for such shorter period that the registrant was required to file such reports), and (2) has been subject to such filing requirements for the past 90 days. Yes x No ¨
Indicate by check mark whether the registrant has submitted electronically every Interactive Data File required to be submitted pursuant to Rule 405 of Regulation S-T (§ 232.405 of this chapter) during the preceding 12 months (or for such shorter period that the registrant was required to submit and post such files.) Yes x No ¨
Indicate by check mark whether the registrant is a large accelerated filer, an accelerated filer, a non-accelerated filer, smaller reporting company, or an emerging growth company. See the definitions of "large accelerated filer," "accelerated filer," "smaller reporting company," and "emerging growth company" in Rule 12b-2 of the Exchange Act.
Large accelerated filer ¨ | Accelerated filer x | Non-accelerated filer ¨ |
Smaller reporting company ¨ | Emerging growth company ¨ | |
If an emerging growth company, indicate by check mark if the registrant has elected not to use the extended transition period for complying with any new or revised financial accounting standards provided pursuant to Section 13(a) of the Exchange Act. ¨
Indicate by check mark whether the registrant is a shell company (as defined by Rule 12b-2 of the Act). Yes ¨ No x
The aggregate market value of the registrant's common stock held by non-affiliates of the registrant, based upon the closing sale price of the common stock on June 28, 2019, the last trading day of the registrant's most recently completed second fiscal quarter, of $3.36 per share as reported on the New York Stock Exchange was $390 million. Shares of common stock held by each director and executive officer and by each person who owns 10% or more of the registrant's outstanding common stock and is believed by the registrant to be in a control position were excluded. The determination of affiliate status for this purpose is not a conclusive determination of affiliate status for any other purposes.
As of February 26, 2020, the registrant had 131,688,835 shares of common stock, par value $0.001, outstanding.
DOCUMENTS INCORPORATED BY REFERENCE
Certain information required by Items 10, 11, 12, 13 and 14 of Part III is incorporated by reference from portions of the registrant's definitive proxy statement relating to its 2020 annual meeting of stockholders to be filed within 120 days after December 31, 2019.
INTREPID POTASH, INC.
TABLE OF CONTENTS
Page | ||
PART I
Unless the context otherwise requires, the following definitions apply throughout this Annual Report on Form 10-K:
• | "Intrepid," "our," "we," or "us" means Intrepid Potash, Inc. and its consolidated subsidiaries. |
• | "East," "North," and "HB" mean our three operating facilities in Carlsbad, New Mexico. "Moab" means our operating facility in Moab, Utah. "Wendover" means our operating facility in Wendover, Utah. "West" means our previous operating facility in Carlsbad, New Mexico, which was placed in care-and-maintenance mode in mid‑2016. "Intrepid South" refers to certain land, water rights, and other related assets in southeast New Mexico we acquired from Dinwiddie Cattle Company in May 2019. You can find more information about our facilities in Item 2 of this Annual Report on Form 10-K. |
• | "Ton" means a short ton, or a measurement of mass equal to 2,000 pounds. |
To supplement our consolidated financial statements, which are presented in this Annual Report on Form 10-K and which are prepared and presented in accordance with generally accepted accounting principles ("GAAP"), we use "average net realized sales price per ton," which is a non‑GAAP financial measure to monitor and evaluate our performance. You can find more information about average net realized sales price per ton, including a reconciliation of this measure to the most comparable GAAP measure, in Item 7. Management's Discussion and Analysis of Financial Condition and Results of Operations under the heading "Non-GAAP Financial Measure."
CAUTIONARY NOTE REGARDING FORWARD‑LOOKING STATEMENTS
This Annual Report on Form 10-K contains forward‑looking statements within the meaning of the Securities Exchange Act of 1934, as amended (the "Exchange Act"), and the Securities Act of 1933, as amended. These forward‑looking statements are made pursuant to the safe harbor provisions of the Private Securities Litigation Reform Act of 1995. All statements in this Annual Report on Form 10-K other than statements of historical fact are forward‑looking statements. Forward-looking statements include statements about our future results of operations and financial position, our business strategy and plans, and our objectives for future operations, among other things. In some cases, you can identify these statements by forward‑looking words, such as "estimate," "expect," "anticipate," "project," "plan," "intend," "believe," "forecast," "foresee," "likely," "may," "should," "goal," "target," "might," "will," "could," "predict," and "continue." Forward‑looking statements are only predictions based on our current knowledge, expectations, and projections about future events.
These forward-looking statements are subject to a number of risks, uncertainties, and assumptions, which are described in Item 1A. Risk Factors in this Annual Report on Form 10-K.
In addition, new risks emerge from time to time. It is not possible for our management to predict all risks that may cause actual results to differ materially from those contained in any forward-looking statements we may make.
In light of these risks, uncertainties, and assumptions, the future events and trends discussed in this Annual Report on Form 10-K may not occur and actual results could differ materially and adversely from those anticipated or implied in these forward-looking statements. As a result, you should not place undue reliance on these forward-looking statements. We undertake no obligation to publicly update any forward-looking statements, except as required by law.
1
ITEM 1. | BUSINESS |
General
We are a diversified mineral company that delivers potassium, magnesium, sulfur, salt, and water products essential for customer success in agriculture, animal feed and the oil and gas industry. We are the only U.S. producer of muriate of potash (sometimes referred to as potassium chloride or potash), which is applied as an essential nutrient for healthy crop development, utilized in several industrial applications, and used as an ingredient in animal feed. In addition, we produce a specialty fertilizer, Trio®, which delivers three key nutrients, potassium, magnesium, and sulfate, in a single particle. We also provide water, magnesium chloride, brine and various oilfield products and services.
Our extraction and production operations are conducted entirely in the continental United States. We produce potash from three solution mining facilities: our HB solution mine in Carlsbad, New Mexico, our solution mine in Moab, Utah and our brine recovery mine in Wendover, Utah. We also operate our North compaction facility in Carlsbad, New Mexico, which compacts and granulates product from the HB mine. We produce Trio® from our conventional underground East mine in Carlsbad, New Mexico. Until mid-2016, we also produced potash from our East and West mines in Carlsbad, New Mexico. In April 2016, we converted our East facility from a mixed-ore facility that produced both potash and Trio® to a Trio®‑only facility. In addition, in early July 2016, we idled mining operations at our West facility and transitioned the facility into care and maintenance. These changes were designed to increase our production of Trio®, a product that had traditionally shown more resilience to pricing pressure than potash, and to lower costs in a time of declining potash prices.
We have water rights in New Mexico under which we sell water primarily to support oil and gas development in the Permian Basin near our Carlsbad facilities. We continue to work to expand our sales of water. In May 2019, we acquired certain land, water rights, other related assets in Lea County, New Mexico, from Dinwiddie Cattle Company. We refer to these assets and operations as "Intrepid South." The purchase price was $53 million. A reduction of $12 million from the original $65 million purchase price was agreed upon by the parties prior to closing subject to issues identified in the diligence process. Dinwiddie Cattle Company also reserved a 20-year, 10% royalty, proportionally reduced as to our interest, on certain produced water disposal revenue related to Intrepid South and certain other properties located near Intrepid South. We capitalized $3.2 million of acquisition fees related to the purchase of the Intrepid South Assets.
Our principal offices are located at 1001 17th Street, Suite 1050, Denver, Colorado 80202, and our telephone number is (303) 296-3006. Intrepid was incorporated in Delaware in 2007.
Our Products and Services
Our three primary products are potash, Trio®, and water. We also sell salt, magnesium chloride, metal recovery salts, brines, and water that are derived as part of our mining processes. Product sales as a percentage of total sales for the last three years were as follows:
Year Ended December 31, | |||||||||
2019 | 2018 | 2017 | |||||||
Potash | 47 | % | 52 | % | 54 | % | |||
Trio® | 29 | % | 31 | % | 36 | % | |||
Water | 12 | % | 10 | % | 4 | % | |||
Salt | 6 | % | 2 | % | 3 | % | |||
Magnesium Chloride | 2 | % | 3 | % | 3 | % | |||
Brines | 1 | % | 1 | % | — | % | |||
Other | 3 | % | 1 | % | — | % | |||
Total | 100 | % | 100 | % | 100 | % | |||
We have three segments: potash, Trio®, and oilfield solutions. Prior to the adoption of Accounting Standards Codification ("ASC") Topic 606 Revenue from Contract with Customers ("ASC 606"), on January 1, 2018, we accounted for the sale of byproducts as a credit to cost of goods sold.
Potash
We sell potash into three primary markets: the agricultural market as a fertilizer input, the industrial market as a component in drilling and fracturing fluids for oil and gas wells and an input to other industrial processes, and the animal feed market as a nutrient supplement. Potash is sold in different product sizes, such as granular, standard, and fine standard. The agricultural market predominately uses granular-sized potash, while the industrial and animal feed markets mostly use standard-
2
and fine standard-sized product. We have the flexibility to produce all of our product in a granular form, which decreases our dependence on sales of any one particular size of potash and any particular market.
We manage sales and marketing operations centrally. This allows us to evaluate the product needs of our customers and then centrally determine which of our production facilities is best suited, typically based on geographic location, to use to fill customer orders in a manner designed to realize the highest average net realized sales price per ton. Average net realized sales price per ton is a non-GAAP measure that we calculate as sales less byproduct sales and freight costs and then divided by product sales tons. We also monitor product inventory levels and overall production costs centrally.
During 2019, we supplied 0.5% of annual world potassium consumption and 3.9% of annual U.S. potassium consumption.
Substantially all of our potash is sold in the United States, and many of our potash sales are geographically concentrated in the central and western United States. Fertilizer sales are affected by weather and planting conditions in these regions, as well as farmer economics. For more information, please see "Seasonality." A significant portion of our industrial sales are derived from oil and gas customers and vary based on the price of potash, the availability and price of substitute products, and changes in industry preferences.
Trio®
Trio® is our specialty fertilizer that delivers potassium, sulfate, and magnesium in a single particle and has the added benefit of being low in chloride. This unique combination of nutrients makes Trio® an attractive fertilizer across diverse crops and geographies. We produce Trio® in premium, granular, standard, and fine standard sizes for sale both domestically and internationally.
Oilfield Solutions
We have water rights in New Mexico under which we sell water primarily for industrial uses in the oil and gas services industry. We also offer potassium chloride ("KCl") real-time mixing services on location for hydraulic fracturing operations and trucking services. In May 2019 we acquired Intrepid South as part of our strategy to expand our sales of water and other related products and services that support oil and gas development in the Permian Basin in southeast New Mexico. Our other oilfield related products and service offerings include, but are not limited to, caliche, right-of-way agreements, surface damages and easements, and a produced water royalty. We sell water on Intrepid South under a joint marketing agreement with NGL Energy Partners, a land and water rights owner adjacent to our South property. Under this agreement, we are responsible for the marketing, sale, and delivery of water to various customers across our combined acreage. Demand for water and other oilfield related products and services is due to the significant oil and gas activity and development in southeast New Mexico. We continue to work to expand our agreements with operators in the area.
Byproducts
We also sell salt, magnesium chloride, metal recovery salts, brines, and water that are derived as part of our mining processes. Our salt is used in a variety of markets including animal feed, industrial applications, pool salt, and the treatment of roads and walkways for ice melting or to manage road conditions. Magnesium chloride is typically used as a road treatment agent for both deicing and dedusting. Our brines contain salt and potassium and are used primarily by the oil and gas industry to support well workover and completion activities. When the water that we sell was previously used in the production process for potash or Trio®, it is considered a byproduct of the underlying product. We continue to work to expand sales of byproducts, particularly to serve the oil and gas markets near our operating facilities. Sales of byproducts are accounted for within the segment that produced the byproduct. In each of the last three years, the majority of our byproduct sales were accounted for in the potash segment.
Production Facilities
We produce potash from three solar evaporation solution mining facilities: our HB solution mine in Carlsbad, New Mexico, a solution mine in Moab, Utah, and a brine recovery mine in Wendover, Utah. We also operate our North compaction facility in Carlsbad, New Mexico, which compacts and granulates product from the HB mine. Solution mining is a process by which potash is extracted from mineralized beds by injecting a salt-saturated brine into a potash ore body and recovering a brine that contains potash and other minerals. The brine is brought to the surface for mineral recovery through solar evaporation. For solar evaporation, the brine is placed in ponds and solar energy is used to evaporate water thus crystallizing out the potash and minerals contained in the brine. The resulting mineral evaporates are then processed to separate the minerals for sale. Solution mining does not require employees or machines to be underground.
We produce Trio® from our conventional underground East mine in Carlsbad, New Mexico. A conventional underground mine uses a mechanical method of extracting minerals from underground. Underground mining consists of
3
multiple shafts or entry points and a network of tunnels to provide access to minerals and conveyance systems to transport materials to the surface. Underground mining machines are used to remove the ore and a series of pillars are left behind to provide the appropriate level of ground support to ensure safe access and mining.
We have a current estimated annual designed productive capacity of approximately 390,000 tons of potash from our solar evaporation solution mines. We also have an estimated annual designed productive capacity of 400,000 tons of Trio®.
Our annual production rates for potash and Trio® are less than our estimated productive capacity. Actual production is affected by operating rates, the grade of ore mined, recoveries, mining rates, evaporation rates, product pricing, product demand, and the amount of development work that we perform. Therefore, as with other producers in our industry, our production results tend to be lower than reported productive capacity.
We also have pipelines and ponds that we use to deliver water to customers. As mentioned above, we acquired Intrepid South in May 2019 which increased our water rights and water delivery infrastructure.
Industry Overview
Fertilizer serves a fundamental role in global agriculture by providing essential crop nutrients that help sustain both the yield and the quality of crops. The three primary nutrients required for plant growth are nitrogen, phosphate, and potassium. There are no known substitutes for these nutrients. A proper balance of each of the three nutrients is necessary to maximize their effectiveness. Potassium helps regulate plants' physiological functions and improves plant durability, providing crops with protection from drought, disease, parasites, and cold weather. Unlike nitrogen and phosphate, the potassium contained in naturally occurring potash does not require additional chemical conversion to be used as a plant nutrient.
In addition to the primary nutrients, which are required in the greatest quantities in crop nutrition, important secondary nutrients such as sulfur and magnesium are also essential in crop nutrition. Intrepid's Trio® product contains the primary nutrient potassium and two secondary nutrients in its sulfur and magnesium content.
Long-term global fertilizer demand has historically been driven primarily by population growth and global economic conditions with annual demand variations based on planted acreage, agricultural commodity yields and prices, inventories of grains and oilseeds, application rates of fertilizer, weather patterns, and farm sector income. We expect these key variables to continue to have an impact on global fertilizer demand for the foreseeable future. Sustained per capita income growth and agricultural policies in the developing world also affect global demand for fertilizer. Fertilizer demand is affected by other geopolitical factors such as temporary disruptions in fertilizer trade related to government intervention and changes in the buying patterns of key consuming countries. Volatility in agricultural commodity prices also may impact farmer fertilizer buying decisions.
The world potash market has long been characterized by nameplate production capacities that exceed demand. A significant portion of this capacity is controlled by a few companies and this concentration increased in early 2018 with the merger of two Canadian producers. Historically, these larger producers have managed production levels to approximate world demand. Several international brownfield and greenfield expansions have also begun production, with increases in production rates expected over the next few years. Due to the increased production, near-term potash pricing will likely depend on the larger producers' ability to continue to manage this supply and demand balance through decreased utilization rates, a practice we saw in effect in the second half of 2019 as producers removed approximately four million tons of expected production through extended outages at certain facilities. Increases in world fertilizer demand, due mainly to population growth and limitations on arable land, are expected to eventually lessen the burden on producers, although recent increases in productive capacities and the continued progress of key expansion projects across the globe make this unlikely for at least the next few years.
The United States potash market is also impacted by the volume of imports. A change in the volume of imports could result in a material change to potash prices in the United States.
4
Virtually all of the world's potash is currently extracted from 19 commercial deposits. According to the International Fertilizer Industry Association and data published by potash mining companies, six countries accounted for approximately 89% of the world's aggregate potash production during 2018. During this time period, the top nine potash producers supplied approximately 97% of world production. Two major Canadian producers participate in the Canpotex marketing group that supplied approximately 31% of the global potash production in 2018, one producer in Russia supplied approximately 17% of global potash production in 2018 and one producer in Belarus supplied approximately 17% of the global potash production in 2018.
Hydraulically fractured horizontal wells account for the majority of oil and gas wells drilled in the United States today and are responsible for the record amount of fossil fuels produced in the United States in recent years. The use of horizontal drilling in oil and gas production allows a well to remain in contact with the targeted formation, increasing production compared to a vertically drilled well. This process has resulted in longer wells, with some horizontal drilling sections reaching several miles long. The increase in horizontal drilling has also increased the use of fresh water, with a single frac potentially using millions of gallons. In the frac process, water and sand are used to move proppant and other frac additives into the targeted rock formation. Fresh water is important in the fracking process, as impurities in the water can impact the overall effectiveness of the frac. The majority of water used in fracking is transported by pipeline to the frac site, where it is stored in ponds or storage tanks.
The most productive region in the United States for oil production is the Permian Basin, which spans from west Texas to southeastern New Mexico. As of January 2020, the Permian Basin produced approximately 4.8 million barrels of oil per day. For comparison, the next most productive region in the United States produced approximately 1.5 million barrels of oil per day. In addition to producing wells, the Permian Basin also had approximately 3,600 drilled but uncompleted wells as of December 2019.
Competition and Competitive Strategy
We sell into commodity markets and compete based on delivered price, our ability to deliver product in a timely manner, and product quality. We also compete based on the durability, particle size, and potassium oxide content of our potash and Trio® products. For potash, we compete primarily with much larger potash producers, principally Canadian producers and, to a lesser extent, producers located in Russia, Belarus, Chile, Germany, and Israel. For Trio®, we compete with one other producer of langbeinite as well as producers of other specialty nutrients and blended products. For water, we compete primarily with water-specialty companies, farmers, and ranchers operating in or near the Permian Basin in New Mexico. Some of our competitors and potential competitors may have significant advantages over us, including greater name recognition, longer operating histories, pre-existing relationships with current or potential customers, significantly greater financial, marketing and other resources, ownership of more diverse assets and products, geographically and/or access to less expensive mining assets, any of which could allow them to respond more quickly to new or changing opportunities.
Our competitive strategy is focused on the following:
• | Maximize potash gross margin and optimize potash production. All of our potash production comes from solar solution mines, which carry fewer fixed costs than our conventional potash mines. Our per-ton costs are lower for solution mining than conventional mining as solar solution mining requires less labor, energy, and equipment. In addition, we have the advantage of being located close to the markets we serve, and the North American market is significantly larger than our production capacity. As a result, we are able to selectively participate in the markets that we believe will provide the highest average net realized sales price per ton. We also attempt to maximize our gross margin by leveraging our freight advantage to key geographies, our diverse customer and market base, and our flexible marketing approach. Long-term, we have optimization and expansion opportunities at our solution mining facilities, that, over time, could further reduce our per-ton costs and increase our potash production. For example, we have potential expansion opportunities at our HB mine. |
• | Expand Trio® sales and maximize gross margin. We plan to continue to expand our sales and marketing efforts for Trio®. These efforts include continued education in international markets and an increased marketing effort in domestic organic markets. In order to maximize gross margin, we are working to optimize our production process to recover more of the langbeinite we mine and to produce more granular-sized product, which is preferred by most markets. Given the current pricing and demand environment, we intend to continue to operate our Trio® facility at reduced production levels and expect to continue to do so for the foreseeable future. |
• | Expand offerings of oilfield solutions. We intend to continue working to expand sales of water, particularly to service the oil and gas markets near our operating plants in New Mexico. We have a meaningful amount of water |
5
rights under which we sell water primarily for industrial uses such as in the oil and gas services industry. As a result of these efforts, our water sales increased significantly over the past three years. In addition, as described above, in May 2019, we purchased land, water rights, and other assets in the Permian Basin which we operate as Intrepid South. These additional water rights contributed to the growth in water sales in 2019 and we expect to increase the amount of water available for sale on the Intrepid South property over the next few years through additional infrastructure investment and permitting. The Intrepid South property also generates revenue from the sale of caliche, a produced water royalty, and right-of-way and surface use agreements with oil and gas operators.
• | Continue diversification of products and services. We recover magnesium chloride, salt, brines, and water during the production of potash and Trio®. These byproducts offer additional diversity to our portfolio of product and service offerings. As we continue to look for opportunities to diversify our revenue sources, we may enter into new or complementary businesses that expand our product and service offerings. For example, we are adding a brine station on the Intrepid South property and we are in the process of developing a produced water facility with a partner near our Intrepid South property which we expect will begin operating in mid-2020. We may also expand into oil and natural gas exploration and production, or into new products or services in our current industry or other industries. |
Competitive Strengths
• | U.S.-based producer. We are the only producer of potash in the United States. We are located in a market that consumes significantly more potash than we can currently produce on an annual basis. Our geographic location provides us with a transportation advantage over our competitors for shipping our product to our customers. In general, this allows us to obtain a higher average net realized sales price per ton than our competitors, who must ship their products across longer distances to consuming markets, which increases their costs and reduces their gross margin. Our location allows us to target sales to the markets in which we have the greatest transportation advantage, maximizing our average net realized sales price per ton. Our access to strategic rail destination points and our location along major agricultural trucking routes also support this advantage. |
As a U.S. producer, we enjoy a significantly lower total production tax and royalty burden than our principal competitors, which operate primarily in Saskatchewan, Canada. The Saskatchewan tax system for potash producers includes a capital tax and several potash mineral taxes, none of which are imposed on us as a U.S. producer. We currently pay an average royalty rate of approximately 5.0% of our potash and Trio® sales less their related freight costs, which compares favorably to that of our competitors in Canada. The relative tax and royalty advantage for U.S. producers becomes more pronounced when profits per ton increase due primarily to the profit tax component of the Saskatchewan potash mineral tax.
• | Solar evaporation operations. All of our potash production comes from solar solution mines. Solar evaporation is a cost-efficient production method because it significantly reduces labor and energy consumption, which are two of the largest costs of production. Our understanding and application of low-cost solution mining, combined with our reserves being located where a favorable climate for evaporation exists, make solar solution mining difficult for other producers to replicate. We also have significant reserves for future expansion of our solution mining operations. |
• | Participation in specialty markets. Given the greater scarcity of langbeinite relative to potash and its agronomic suitability for certain soils and crops, we believe there is a market for Trio® outside of our core potash markets. We also believe that there is a market for Trio® beyond the United States, and we continue to attempt to capture and grow this market. Through our existing operations and assets, we also have the potential to grow our offerings of salt, water, and brine with low capital investments. |
• | Water rights. We have water rights in New Mexico under which we sell water primarily for industrial uses such as in the oil and gas services industry. We continue to work to expand sales of water, especially to support oil and gas development in the Permian Basin near our Carlsbad facilities. The Intrepid South property increased our total water rights available for sale and our footprint in and around the Delaware Basin. This has expanded our relationships with oil and gas producers, which we may be able to use to expand sales of our industrial potash products, byproducts, and services. |
• | Diversity of potash markets. We sell potash into three different markets—the agricultural, industrial, and feed markets. During 2019, these markets represented approximately 74%, 12%, and 14% of our potash sales, respectively. The agricultural market supplies farmers producing a wide range of crops in different geographies. Because of our geographic proximity to areas that have seen recent increases in oil and gas drilling activity, we |
6
believe that we have an opportunity promote the benefits of potash in drilling activities and to increase our industrial sales volumes.
• | Marketing flexibility. We have the ability to convert all of our standard-sized potash product into granular-sized product as market conditions warrant. We also produce Trio® in premium, granular, standard and fine standard sizes. This provides us with increased marketing flexibility as well as decreased dependence on any one particular market. |
• | Significant reserve life. Our potash and langbeinite reserves each have substantial years of reserve life, with remaining reserve lives for our actively mined areas ranging from 30 years to greater than 100 years, based on proven and probable reserve estimates. In addition to our reserves, we have water rights and access to additional mineralized areas of potash for potential future exploitation. |
• | Existing facilities and infrastructure. Constructing a new potash production facility requires substantial time and extensive capital investment in mining, milling, and infrastructure to extract, process, store, and ship product. Our operations already have significant facilities and infrastructure in place. We also have the ability to expand our business using existing installed infrastructure, in less time and with lower expenditures than would be required to construct entirely new mines. |
Seasonality
The sales pattern for potash sold into the agricultural market is seasonal. Over the last three years, our monthly potash sales volume has been highest in March through May and September through November when purchasers are looking to have product on hand in advance of the spring and fall application seasons in the United States. In turn, our monthly potash sales volume has been the lowest in July and December. The specific timing of when farmers apply potash remains highly weather dependent and varies across the numerous growing regions within the U.S. The timing of potash sales is significantly influenced by the marketing programs of potash producers, as well as storage volumes closer to the farm gate.
The sales pattern for Trio® sold into the domestic agricultural market is also seasonal. Over the last three years, our domestic Trio® sales volume has been highest in March and April, as Trio® products are typically applied to crops in the United States during the spring planting season. Demand for the spring planting season generally runs from December to May, during which we have sold approximately 60% of our domestic Trio® volumes over the past three years. As we expand our Trio® sales efforts outside of the United States, we expect the overall seasonality of our Trio® sales to be impacted by the timing of deliveries to warehouses as we generally ship in larger volumes to minimize per ton transportation costs.
The month-to-month seasonality of our agricultural sales is somewhat moderated due to the variety of crops, industries, distribution strategies and geographies that we serve. Because all of our potash production comes from our solar solution mines, our potash production is also seasonal. Our solar solution mines suspend potash production activities from early spring through late summer, the peak solar evaporation period. Accordingly, we manage our inventories during the low demand periods of the year in order to ensure timely product availability during the peak sales seasons, as well as during the summer evaporation period when we have no potash being produced. The seasonality of fertilizer demand results in our sales volumes and revenue being the highest during the spring and our working capital requirements being the highest just before the start of the spring season. We have observed fertilizer dealers in North America instituting practices that are designed to reduce their risk of changes in the price of fertilizer products through consignment-type programs. These programs tend to make the timing of the spring and fall seasonal demand profile less predictable within the season. Further, through technological advances, the farmers in the United States have gained efficiencies in planting and harvesting their crops, which has compressed the application seasons.
Our quarterly financial results can also vary from one year to the next due to weather‑related shifts in planting schedules and purchasing patterns.
Demand for our oilfield products and services is highly correlated to oil and gas exploration activities and can vary from quarter to quarter.
Major Customers
Within the agricultural market, we supply a diversified customer base of distributors, cooperatives, retailers, and dealers, which in turn supply farmers producing a wide range of crops in different geographies. We sell into the industrial and feed markets through sales to distributors and directly to end users. For water, we have entered into multiple long-term supply agreements with a diverse set of customers aimed at generating a long-term recurring revenue stream from water sales.
In each of 2019, 2018 and 2017, no customer accounted for more than 10% of our total sales.
7
Environmental, Safety, and Health Matters
We are subject to an evolving set of federal, state, and local environmental, safety, and health laws that regulate, among other things; (1) soil, air, and water quality standards for our facilities; (2) disposal, storage, and management of hazardous and solid wastes; (3) post-mining land reclamation and closure; (4) conditions of mining and production operations; (5) employee and contractor safety and occupational health; and (6) product content and labeling. We employ and consult with professionals who assist in monitoring our compliance with these laws and who work with management to ensure that appropriate strategies and processes are in place to promote a culture that prioritizes safety and environmental responsibility.
In 2019, we had approximately $4.0 million of capital investments, and $0.5 million in other expenses, relating to environmental compliance, environmental studies, and remediation efforts. We expect to spend $1.0 million to $3.0 million for environmental related capital projects in both 2020 and 2021. Future capital expenditures are subject to a number of uncertainties, including changes to environmental regulations and interpretations, and enforcement initiatives. If potential negative effects to the environment are discovered, or if the potential negative effects are of a greater magnitude than currently estimated, material expenditures could be required in the future to remediate the identified effects. We expect that continued emphasis on environmental issues will result in increased future investments for environmental controls at our operations. See Item 1A. Risk Factors “Risks Related to Our Business - Environmental laws and regulations could subject us to significant liability and require us to incur additional costs.”
Product Registration Requirements
We are required to register fertilizer products with each U.S. state and foreign country where products are sold. Each brand and grade of commercial fertilizer must be registered with the appropriate state agency before being offered for sale, sold, or distributed in that jurisdiction. In most cases, these product registrations impose specific requirements relating to guaranteed analysis, product labeling, and regular reporting of sales.
Some states require similar registration and reporting for feed grade products. Industrial-grade products typically do not require registration or reporting.
Operating Requirements and Government Regulations
Permits
We are subject to numerous environmental laws and regulations, including laws and regulations regarding land use and reclamation; release of emissions to the atmosphere or water; plant and animal life; and the generation, treatment, storage, disposal, and handling of hazardous substances and wastes. These laws include the Clean Air Act; the Clean Water Act; the Resource Conservation and Recovery Act; the Comprehensive Environmental Response, Compensation, and Liability Act ("CERCLA"); the Toxic Substances Control Act; and various other federal, state, and local laws and regulations. Violations can result in substantial penalties, court orders to install pollution‑control equipment, civil and criminal sanctions, permit revocations, and facility shutdowns. In addition, environmental laws and regulations may impose joint and several liability, without regard to fault, for cleanup costs on potentially responsible parties who have released, disposed of, or arranged for release or disposal of hazardous substances in the environment.
We hold numerous environmental, mining, and other permits or approvals authorizing operations at each of our facilities. Our operations are subject to permits for, among other things, extraction of salt and brine, discharges of process materials and waste to air and surface water, and injection of brine. Some of our proposed activities may require waste storage permits. A decision by a government agency to deny or delay issuing a new or renewed permit or approval, or to revoke or substantially modify an existing permit or approval, could limit or prevent us from mining at these properties. In addition, changes to environmental and mining regulations or permit requirements could limit our ability to continue operations at the affected facility. In many cases, environmental permits and approvals are also required for an expansion of, or changes to, our operations. As a condition to procuring the necessary permits and approvals, we may be required to comply with financial assurance regulatory requirements. The purpose of these requirements is to assure the government that sufficient company funds will be available for the ultimate reclamation, closure, and post-closure care at our facilities. We obtain bonds as financial assurance for these obligations. These bonds require annual payment and renewal.
We believe we are in compliance with existing regulatory programs, permits, and approvals where non-compliance could have a material adverse effect on our operating results or financial condition. In 2016, the New Mexico Office of State Engineer ("OSE") determined that our East tailing impoundment embankments are considered jurisdictional dams. We continue to work with the OSE to determine required dam modifications associated with this determination. We may be required to spend a significant amount of capital to bring the impoundments into compliance with requirements for jurisdictional dams or modify our operations to no longer use impoundments that may qualify as jurisdictional dams.
8
From time to time, we have received notices from governmental agencies that we are not in compliance with certain environmental laws, regulations, permits, or approvals. For example, although designated as zero discharge facilities under the applicable water quality laws and regulations, our East, North, and Moab facilities at times may experience some water and brine discharges during periods of significant rainfall or due to other circumstances. We have implemented several initiatives to address discharge issues, including the reconstruction or modification of certain impoundments, increasing evaporation, and reducing process water usage and discharges and improved management systems. State and federal officials are aware of these issues and have visited the sites to review our corrective efforts and action plans.
Air and Drinking Water
In the ordinary course of our business, from time to time, we receive notices from the New Mexico Environment Department of alleged air or drinking water quality control violations. Upon receipt of these notices, we evaluate the matter and take any required corrective actions. In some cases, we may be required to pay civil penalties for these notices of violation.
Safety and Health Regulation and Programs
Certain of our facilities are subject to the Federal Mine Safety and Health Act of 1977, the Occupational Safety and Health Act, related state statutes and regulations, or a combination of these laws.
The Mine Safety and Health Administration ("MSHA") is the governing agency for our conventional underground mines and related surface facilities in New Mexico. As required by MSHA, these operations are regularly inspected by MSHA personnel. Item 4 and Exhibit 95.1 to this Annual Report on Form 10-K provide information concerning certain mine safety violations.
Our New Mexico facilities participate in MSHA's Region 8 "Partnership Program." There is a formally signed document and plan, pursuant to which each party commits to specific actions and behaviors. Examples of principles include working for an open, cooperative environment; agreeing to citation and conflict processes; and improving training. Our New Mexico facilities are serviced by a trained mine rescue team, which is ready to respond to on-site incidents or assist in local incidents, if needed. The team practices and participates at state and federal events and competitions. In addition, our New Mexico facilities participate in a basin agreement with other natural resource and hazardous waste facilities to provide mine rescue support.
The Occupational Safety and Health Administration ("OSHA") is the governing agency relating to the safety standards at our Utah facilities, as well as our HB mine and plant. Training and other certifications are provided to employees as needed based upon their work duties.
Remediation at Intrepid Facilities
Many of our current facilities have been in operation for a number of years. Operations by us and our predecessors have involved the historical use and handling of potash, salt, related potash and salt byproducts, process tailings, hydrocarbons and other regulated substances. Some of these operations resulted, or may have resulted, in soil, surface water, or groundwater contamination. At some locations, there are areas where process waste, building materials (including asbestos‑containing transite), and ordinary trash may have been disposed or buried, and have since been closed and covered with soil and other materials.
At many of these facilities, spills or other releases of regulated substances may have occurred previously and potentially could occur at any of our facilities in the future, possibly requiring us to undertake or fund cleanup efforts under CERCLA or state laws governing cleanup or disposal of hazardous and solid waste substances.
We work closely with governmental authorities to obtain the appropriate permits to address identified site conditions. For example, buildings located at our facilities in both Utah and New Mexico have a type of siding that contains asbestos. We have adopted programs to encapsulate and stabilize portions of the siding through use of an adhesive spray and to remove the siding, replacing it with an asbestos-free material. Also, we have trained asbestos abatement crews that handle and dispose of the asbestos‑containing siding and related materials. We have a permitted asbestos landfill in Utah and have worked closely with Utah officials to address asbestos‑related issues at our Moab mine.
9
Reclamation Obligations
Mining and processing of potash generates residual materials that must be managed both during the operation of the facility and upon facility reclamation and closure. Potash tailings, consisting primarily of salt and fine sediments that remain after potash is removed from ore during processing, are stored in surface disposal sites. Some of these tailing materials may also include other contaminants, such as lead, that were introduced as reagents during historic processing methods that may require additional management and could cause additional disposal and reclamation requirements to be imposed. For example, at least one of our New Mexico mining facilities may have legacy issues regarding lead in the tailings pile resulting from production methods utilized prior to our acquisition of these assets. During the life of the tailings management areas, we have incurred, and will continue to incur, significant costs to manage potash residual materials in accordance with environmental laws and regulations and with permit requirements. Additional legal and permit requirements will take effect when these facilities are closed.
Our surface permits require us to reclaim property disturbed by operations at our facilities. Our operations in Utah and New Mexico have specific obligations related to reclamation of the land after mining and processing operations are concluded. The discounted present value of our estimated reclamation costs for our facilities as of December 31, 2019, is approximately $22.3 million, which is reflected in our audited financial statements found elsewhere in this Annual Report on Form 10-K. Various permits and authorization documents negotiated with or issued by the appropriate governmental authorities include these estimated reclamation costs on an undiscounted basis.
It is difficult to estimate and predict the potential actual costs and liabilities associated with remediation and reclamation, and there is no guarantee that we will not be identified in the future as potentially responsible for additional remediation and reclamation costs, either as a result of changes in existing laws and regulations or as a result of the identification of additional matters subject to remediation and/or reclamation obligations or liabilities.
Royalties
The potash, langbeinite, water, and byproducts we produce and sell from leased land may be subject to royalty payments. We produce and sell from leased land owned by the U.S. government, the States of New Mexico and Utah, and private landowners. The terms of the royalty payments are determined at the time of the issuance or renewal of the leases. Some royalties are determined as a fixed percentage of revenue and others vary based upon ore grade. Additionally, some of our leases are subject to overriding royalty interest payments paid to various owners. In 2019, we paid $7.9 million in royalties and other taxes. The royalty rates on our state and federal leases in New Mexico are currently set at various rates from 2.0% to 5.0%. The royalty rates on our state and federal leases in Utah are currently set at rates from 3.0% to 5.0%. The royalty rates for the private leaseholds are between 5.0% and 8.0%. For certain water sales we pay an $0.11 per barrel sold royalty to the State of New Mexico.
Employees
As of January 31, 2020, we had 445 employees, the majority of which were full-time employees.
We have a collective bargaining agreement with a labor organization representing our hourly employees in Wendover, Utah, which expires on May 31, 2020. This is the seventh agreement negotiated between us and the United Steel, Paper and Forestry, Rubber, Manufacturing, Energy, Allied Industrial and Service Workers International Union, Local 867. We consider our relationships with our employees to be good.
Available Information
We file or furnish with the U.S. Securities and Exchange Commission (the "SEC") reports, including our Annual Reports on Form 10-K, Quarterly Reports on Form 10-Q, Current Reports on Form 8-K, proxy statements, and any amendments to these reports filed or furnished pursuant to Section 13(a) or Section 15(d) of the Exchange Act. These reports are available free of charge on our website at intrepidpotash.com as soon as reasonably practicable after they are electronically filed with or furnished to the SEC. These reports also can be obtained at sec.gov.
We routinely post important information about us and our business, including information about upcoming investor presentations, on our website under the Investor Relations tab. We encourage investors and other interested parties to enroll on our website to receive automatic email alerts or Really Simple Syndication (RSS) feeds regarding new postings. The information found on, or that can be accessed through, our website is not part of this or any other report we file with, or furnish to, the SEC.
10
Executive Officers
The following section includes biographical information for our executive officers:
Name | Age | Position | ||
Robert P. Jornayvaz III | 61 | Executive Chairman of the Board, President, and Chief Executive Officer | ||
Robert E. Baldridge | 58 | Senior Vice President - New Mexico | ||
Mark A. McDonald | 55 | Vice President of Sales and Marketing | ||
Matthew D. Preston | 35 | Vice President, Finance | ||
Kyle R. Smith | 46 | Vice President, General Counsel and Secretary | ||
E. Brian Stone | 57 | Chief Operating Officer | ||
Erica K. Wyatt | 47 | Chief Human Resources Officer | ||
Robert P. Jornayvaz III has served as our Executive Chairman of the Board since 2010 and as our President and Chief Executive Officer since August 2014. Mr. Jornayvaz served as our Chairman of the Board and Chief Executive Officer from our formation in 2007 until 2010. Mr. Jornayvaz served, directly or indirectly, as a manager of our predecessor, Intrepid Mining LLC, from 2000 until its dissolution at the time of our initial public offering in 2008. Mr. Jornayvaz is the sole owner of Intrepid Production Corporation. Mr. Jornayvaz and Intrepid Production Corporation together beneficially own 14.9% of our common stock.
Robert E. Baldridge has served as our Senior Vice President - New Mexico since December 2019. Mr. Baldridge served as General Manager of our New Mexico operations from July 2010 to December 2019 and Manager of Mines since our formation in 2007. Previously Mr. Baldridge served as Mine Manager of Intrepid Mining from 2003 until its dissolution at the time of our IPO in 2008. Prior to joining Intrepid, Mr. Baldridge held various positions with Mississippi Potash, Inc. from 1988 to 2003. Mr. Baldridge has over 30 years experience in the potash mining industry.
Mark A. McDonald has served as our Vice President of Sales and Marketing since November 2017. Mr. McDonald previously served as our Director of U.S. Agricultural and Feed Sales from March 2017 to November 2017, Director of Industrial, Feed, and Midwest Agricultural Sales from July 2016 to March 2017, and National Accounts Manager from December 2013 to July 2016. Before joining Intrepid, Mr. McDonald worked at Agrium U.S. Inc. and Agrium Inc., a manufacturer, wholesaler, and retail supplier of agricultural products and services, for 17 years in various positions culminating with Director, Eastern Sales Region. Before joining Agrium, Mr. McDonald held positions at Cargill Limited and Monsanto Company.
Matthew D. Preston has served as our Vice President of Finance since November 2019. Mr. Preston also serves as our principal financial officer and principal accounting officer. Mr. Preston served as our Director of Budget and Forecast from April 2016 to November 2019. Previously, Mr. Preston served in successively more senior finance roles since joining Intrepid in 2008, including Senior Manager of Budget and Forecast, Manager of Budget and Forecast, and Financial Analyst.
Kyle R. Smith has served as our Vice President, General Counsel and Secretary since December 2019. Before joining Intrepid, Mr. Smith served as General Counsel for an Alaska Native Claims Settlement Act Regional Corporation. Prior to that, Mr. Smith was in private practice from July 2017 to January 2019, served as Executive Vice President and General Counsel for Echo Energy, a start-up pure-play oil and gas operator from December 2016 to June 2017, and as Assistant General Counsel for Operations for Continental Resources, a large independent upstream producer, from June 2014 to June 2016.
E. Brian Stone has served as our Chief Operating Officer since December 2019. Prior to joining Intrepid, Mr. Stone was the Chief Operating Officer for Hupecol Operating Co. LLC, an international oil and gas company focused on South America and Europe, from 2005 to 2019.
Erica K. Wyatt has served as our Chief Human Resources Officer since December 2018. Ms. Wyatt previously served as Vice President of Human Resources from June 2015 to December 2018, Senior Director of Human Resources from 2013 to June 2015, and Director of Human Resources from 2007 to 2013. Prior to joining Intrepid, Ms. Wyatt held various positions at DISH Network Corporation, a pay-TV provider, from 1999 to 2007, including most recently Director of Human Resources supporting the field services division.
11
ITEM 1A. | RISK FACTORS |
You should carefully consider the following risk factors. Our future performance is subject to a variety of risks and uncertainties that could materially and adversely affect our business, financial condition, and results of operations, and the trading price of our common stock. We may be subject to other risks and uncertainties not presently known to us. See "Cautionary Note Regarding Forward-Looking Statements."
Risks Related to Our Business
Our potash sales are subject to price and demand volatility resulting from periodic imbalances of supply and demand, which could negatively affect our results of operations.
The market for potash is cyclical, and the prices and demand for potash can fluctuate significantly. Periods of high demand, increasing profits, and high-capacity utilization lead to new plant investment and increased production. This growth continues until the market is over-saturated, leading to decreased prices and lower-capacity utilization until the cycle repeats. We are currently experiencing an oversupplied potash market and expect these conditions to continue for several years. Also, individual potash producers have, at times, independently suspended production in response to market outlook. As a result of these factors, the prices and demand for potash can be volatile. This volatility can reduce profit margins and negatively affect our results of operations. We sell most of our potash into the spot market in the U.S. In addition, there is no active hedge market for potash as there is for many other commodities. As a result, we do not have protection from this price and demand volatility.
We are working to expand our sales of Trio®, and our sales and results of operations could be negatively impacted if we are unsuccessful in our plans.
One of our strategies is to continue to expand our sales of Trio® both domestically and internationally. Our expansion efforts may not be successful, which would temper any Trio® sales growth. With respect to international sales, it is difficult to determine if or how international demand and pricing for Trio® may develop. Our international sales often result in lower gross margins than domestic sales due to higher costs. These costs could include higher transportation costs, importation costs, and costs associated with duties, trade requirements, or other import or export control laws and regulations. We also face price pressure and competition in some international markets where substitutes are more prevalent. Any of these items could negatively impact our results of operations. In addition, international sales may occur on an irregular basis, which could cause volatility in our inventories and our results of operations. See also "International sales could present risks to our business."
We may not be successful in our efforts to sustain or expand water sales due to challenges to our water rights, changes in the demand for water in the areas around our facilities, or other events, which could adversely impact our financial condition and results of operations.
We have water rights in New Mexico under which we sell water primarily for industrial uses such as in the oil and gas services industry. We continue to work to expand sales of water, especially to support oil and gas development in the Permian Basin near our New Mexico facilities. In May 2019, we acquired certain land, water rights, and other related assets from Dinwiddie Cattle Company. The land is comprised of fee, federal, and state acreage. If there are changes in state or federal regulations regarding oil and gas production or water usage, this could materially impact our ability to monetize our water rights. Third parties regularly challenge our applications for permits to sell water under our water rights. We may not be successful in these efforts. In many cases, sales of water require governmental permits or approvals. A decision to deny, delay, revoke, or modify a permit or approval could prevent us from selling water, increase the cost to provide water, or result in our having to refund prepayments that we have received for future water sales. If oil or gas prices decline, if oil and gas development in the Permian Basin decreases, or if demand for fresh water in the Permian Basin declines for other reasons, the demand for water under our water rights could be adversely affected. In addition, we could be required to expend capital to meet customer needs. Any of these events could adversely impact our financial condition and results of operations.
Water rights in New Mexico are subject to a stated purpose and place of use, and our water rights were originally issued for uses relating to our mining operations. To sell water under these rights for oil and gas development, we must apply for a permit from the OSE to change the purpose and/or place of use of the underlying water rights. The OSE reviews and makes a determination as to the validity of the right and if it determines the requested change will not negatively impact other valid interests, the OSE can issue a preliminary authorization for the change. The preliminary authorization allows for water sales to begin immediately, subject to repayment if the underlying water rights were ultimately found to be invalid. Third parties may protest the preliminary authorization at minimal cost and frequently do so. Once protested, the OSE is required to hold a hearing to determine if the preliminary authorization was appropriate. A significant portion our water sales are being made under preliminary authorizations issued by the OSE.
In February 2019, certain protestants filed an expedited inter se proceeding in New Mexico District Court as the adjudication court for the Pecos Stream System challenging the validity of our water rights relating to the Pecos River. In
12
August 2019, the parties stipulated to the jurisdiction of the adjudication court. To promote settlement, the adjudication court established a settlement schedule and ordered a trial date in August 2020 if the parties have not reached a settlement by that time. In the adjudication proceeding, the court is expected to make a determination as to the size of our Pecos River water rights. In addition, the Protestants are asking for unspecified monetary and injunctive relief, as well as attorneys' fees and costs, relating to our sale of water under these water rights and breach of contract claims. The OSE has temporarily stayed the hearing process until the adjudication process is complete. We continue to operate under the preliminary authorizations until the adjudication and hearing processes are complete.
We may face political and regulatory issues relating to the potential use of the maximum amount of our rights. However, we believe that our legal position with respect to the validity of our water rights is solid and that we will be able to meet our water commitments.
A decline in oil and gas drilling or a reduction in the use of potash in drilling fluids could increase our operating costs and decrease our revenue.
A portion of our revenue comes from the sale of water and potassium chloride for use in oil and gas development. A decline in oil and gas drilling, especially in the Permian Basin, could reduce our sales of water and potassium chloride. In addition, oil and gas developers are regularly looking for ways to use more produced, or recycled, water instead of fresh water in oil and gas development. Also, there are other products available that have some of the same clay-inhibiting properties as our potassium chloride. These alternative products could temporarily or permanently replace some of our sales of water or potassium chloride. We also have other oilfield product and service offerings, such as trucking services and brine products, the sales of which could be negatively impacted if oil and gas development declined.
We may alter or expand our operations or continue to pursue acquisitions, which could adversely affect our business if we are unable to manage any expansion or acquisition effectively.
We continue to look for opportunities designed to maximize the value of our existing assets, such as through increased production and sales of water, salt, and brine. For example, in 2019 we purchased water and real property assets in southeastern New Mexico, which we refer to as Intrepid South, in an effort to expand our water sales and other revenue from the oil and gas industry. We are also exploring ways to potentially monetize the known but small lithium resource in our Wendover ponds. In addition, we may enter into new or complementary businesses that expand our product offerings beyond our existing assets. For example, we may expand into oil and natural gas exploration and production or into new products or services in our current industry or other industries. We may not be able to successfully implement any alteration or expansion initiatives. Further, we may not be able to fully realize any anticipated benefits of these initiatives. Any expansion initiatives may require significant capital investments and those investments may not produce the expected benefits.
As part of this growth strategy, we may consider the acquisition of other companies or assets that complement or expand our business. We may not be able to successfully identify suitable acquisition opportunities, prevail against competing potential acquirers, negotiate appropriate acquisition terms, obtain necessary financing, complete proposed acquisitions, successfully integrate acquired businesses or assets into our existing operations, or expand into new markets. An acquisition may require us to use a significant portion of available cash or may result in significant dilution to our stockholders. We may be required to assume unanticipated liabilities or contingencies as part of an acquisition, or we may face substantial costs, delays, or other problems as part of the integration process. In addition, acquired businesses or assets may not achieve the desired effects or otherwise perform as we expect. We may not realize the synergies that we expect to achieve. Additionally, while we execute these acquisitions and related integration activities, our attention may be diverted from our ongoing operations, which could have a negative impact on our business.
Any of these items could negatively impact our financial condition and results of operations. See “-Our acquisition of Intrepid South may not achieve the intended results or anticipated cost and operational synergies, which could negatively impact us.”
Our acquisition of Intrepid South may not achieve the intended results or anticipated cost and operational synergies, which could negatively impact us.
In 2019, we purchased water and real property assets from Dinwiddie Cattle Company in southeastern New Mexico in an effort to expand our water sales and other revenue from the oil and gas industry. The success of the acquisition of Intrepid South will depend, in part, on our ability to realize anticipated cost and operational synergies. However, the acquisition may not produce the expected benefits, or we may not realize the synergies that we expect to achieve. Our success in realizing these cost synergies, and the timing of this realization, depends on our ability to expand our water sales and other revenue from the oil and gas industry. Even if we are able to integrate the acquired assets and operations successfully, this integration may not result in the realization of the full benefits of the cost and operational synergies that we currently expect within the anticipated time frame, or at all.
13
Current and future indebtedness could adversely affect our financial condition and impair our ability to operate our business.
As of December 31, 2019, we had outstanding $50 million aggregate principal amount of senior notes. We also have $19.8 million outstanding under a revolving credit facility that allows us to borrow up to $75 million, as of December 31, 2019. We may incur additional indebtedness in the future. The agreements governing the senior notes and credit facility restrict, but do not prohibit, us from incurring additional indebtedness.
Current and future indebtedness could have important consequences, including the following:
• | it could limit our ability to borrow additional money or sell additional shares of common stock to fund our working capital, capital expenditures, and debt service requirements |
• | it could limit our flexibility in planning for, or reacting to, changes in our business |
• | we could be more highly leveraged than some of our competitors, which could place us at a competitive disadvantage |
• | it could make us more vulnerable to a downturn in our business or the economy |
• | it could require us to dedicate a substantial portion of our cash flows from operations to the repayment of our indebtedness, thereby reducing the availability of our cash flows for other purposes |
• | it could adversely affect our business and financial condition if we default on or are unable to service our indebtedness, are unable to refinance such indebtedness on favorable terms or are unable to obtain additional financing, as needed |
Our debt agreements contain financial and other restrictive covenants. For example, the agreements include financial covenants that require us to maintain a minimum fixed charge coverage ratio and a maximum leverage ratio (as these ratios are defined under the agreements). Also, the interest rates under the notes may be adjusted quarterly subject to our financial performance and certain financial covenant levels and we may be subject to higher interest rates. For more information about these financial covenants, see Item 7. "Management's Discussion and Analysis of Financial Condition and Results of Operations - Liquidity and Capital Resources."
These covenants could limit our ability to engage in activities that are in our long-term best interests. Our failure to comply with these covenants would result in an event of default that, if not waived, could result in the acceleration of all outstanding indebtedness. The senior notes and credit facility are variously secured by substantially all of our assets. As such, an event of default could also result in our lenders foreclosing on some or all of our assets.
The credit facility expires in 2024 and the senior notes are due in 2020, 2023, and 2025. In the future, we may be unable to obtain new financing or refinancing on acceptable terms.
Despite our current level of indebtedness, we may incur more debt and undertake additional obligations. Incurring such debt or undertaking such additional obligations could further exacerbate the risks to our financial condition.
Although the agreements governing our indebtedness contain restrictions on our incurrence of additional indebtedness, these restrictions are subject to a number of qualifications and exceptions and the indebtedness incurred in compliance with these restrictions could increase. To the extent new debt is added to our current debt levels, the risks to our financial condition would increase.
While the agreements governing our indebtedness also contains restrictions on our ability to make loans and investments, these restrictions are subject to a number of qualifications and exceptions, and the investments incurred in compliance with these restrictions could be substantial.
The proposed phase out of the London Interbank Offered Rate ("LIBOR") could adversely affect our financial results.
Borrowings under our revolving credit facility bear interest at LIBOR plus an applicable margin. In July 2017, the United Kingdom's Financial Conduct Authority (the authority that regulates LIBOR) announced that it intends to phase out LIBOR by the end of 2021. The Alternative Reference Rates Committee (“ARRC”) has proposed that the Secured Overnight Financing Rate (“SOFR”) is the rate that represents best practice as the alternative to USD-LIBOR for use in derivatives and other financial contracts that are currently indexed to USD-LIBOR. ARRC has proposed a paced market transition plan to SOFR from USD-LIBOR and organizations are currently working on industry wide and company specific transition plans as it relates to derivatives and cash markets exposed to USD-LIBOR. The agreement governing our revolving credit facility is indexed to USD-LIBOR and we are monitoring this activity and evaluating the related risks. In September 2019, the FASB proposed guidance that would help facilitate the market transition from existing reference rates to alternative rates. However, at this time, it is not possible to predict the effect of any such changes, any establishment of alternative reference rates or any other reforms to LIBOR that may be enacted in the United Kingdom or elsewhere. Uncertainty as to the nature of such potential changes, alternative reference rates or other reforms may adversely affect the trading market for LIBOR-based
14
securities, including certain of our debt that is indexed to USD-LIBOR. Furthermore, we may need to renegotiate any debt agreements extending beyond 2021 that utilize LIBOR as a factor in determining the interest rate to replace LIBOR with the new standard that is established. There is currently no definitive information regarding the future utilization of LIBOR or of any particular replacement rate. As such, potential effect of any such event on our business, financial condition and results of operations cannot yet be determined.
Aggressive pricing or operating strategies by our competitors could adversely affect our sales and results of operations.
The potassium-fertilizer industry is concentrated, with a small number of producers accounting for the majority of global production. Many of these producers have significantly larger operations and more resources than we do. These larger producers may have greater leverage in pricing negotiations with customers and transportation providers. They also have a broader product portfolio, which may allow them to offer rebates or bundle products to offer discounts or incentives to gain a competitive advantage. They may also be able to mine their potash or langbeinite at a lower cost due to economies of scale or other competitive advantages. In addition, they may decide to pursue aggressive pricing or operating strategies that disrupt the global and U.S. markets. These disruptions could cause lower prices or demand for our product, which would adversely affect our sales and results of operations.
Changes in the agricultural industry could exacerbate the cyclical nature of the prices and demand for our products or adversely affect the markets for our products.
Farmers attempt to apply the optimum amounts of fertilizer to maximize their economic returns. A farmer's decision about the application rate for each fertilizer, or the decision to forgo the application of a fertilizer, particularly potash and Trio®, varies from year to year depending on a number of factors. These factors include crop types, crop prices, weather patterns, fertilizer and other crop input costs, and the level of crop nutrients remaining in the soil following the previous harvest. Farmers are more likely to increase application rates of fertilizers when crop prices are relatively high, fertilizer and other crop input costs are relatively low, or the level of crop nutrients remaining in the soil is relatively low. Conversely, farmers are likely to reduce application of fertilizers when farm economics are weak or declining or the level of crop nutrients remaining in the soil is relatively high. This variability in application rates can impact the cyclical nature of the prices and demand for our products. In addition, farmers may buy and apply potash or Trio® in excess of current crop needs, which results in a build-up of potassium in the soil that can be used by crops in subsequent crop years. If this occurs, demand for our products could be delayed to future periods.
State and federal governmental policies, including farm and ethanol subsidies and commodity support programs, may also influence the number of acres planted, the mix of crops planted, and the use of fertilizers. In addition, there are various city, county, and state initiatives to regulate the use and application of fertilizers due to various environmental concerns. If U.S. agricultural production or fertilizer use decreased significantly due to one or more of these factors, our results of operations could be adversely affected.
The seasonal demand for our products, and the resulting variations in our cash flows from quarter to quarter, could have an adverse effect on our results of operations and working capital requirements.
The fertilizer business is seasonal. With respect to domestic sales, we typically experience increased sales during the North American spring and fall application seasons. The degree of seasonality can change significantly from one year to the next due to weather-related shifts in planting schedules and purchasing patterns. We and our customers generally build inventories during low-demand periods of the year to ensure timely product availability during high-demand periods, resulting in increased working capital requirements just before the start of these seasons. If we are unable to accurately predict the timing of demand for our products due to variations in seasonality from year to year, our results of operations and working capital could be adversely affected. Similarly, if we do not have adequate storage capacity to manage varying inventory needs, we may need to reduce production or lower the price at which we sell product, either of which would adversely affect our results of operations.
In mid-2016, we transitioned our East mine to Trio®-only, resulting in an increased supply of Trio®. Previously, Trio® was supply-constrained, which meant that we did not see as much seasonality with respect to purchases as we did for potash. As purchasers have gained increased confidence in our ability to supply this product closer to the traditional spring application season in the U.S., these purchasers have moved to more of a just-in-time purchasing model. As a result, we now experience more traditional seasonality with respect to our domestic Trio® sales, which exposes us to inventory and demand risks similar to those with respect to our potash.
We market Trio® in various countries around the world, all of which have different climates and fertilizer-application patterns. As a result, seasonality in our international Trio® sales may develop, which could cause volatility in our results of operations.
15
Our Trio® profitability could be affected by market entrants or the introduction of langbeinite alternatives.
Langbeinite is produced by us and one other company from a single resource located in Carlsbad, New Mexico. Additional competition in the market for langbeinite and comparable products exists and could increase in the future. Other companies could seek to create and market chemically similar alternatives to langbeinite, some of which could be superior to langbeinite, or less costly to produce. In addition, companies sometimes blend several nutrients to obtain a product with similar agronomic benefits as langbeinite. The market for langbeinite and our Trio® sales could be affected by the success of these and other products that are competitive with langbeinite, which could adversely affect the viability of our Trio® business and our results of operations and financial condition. Further, recent increases in the supply of langbeinite by us and the other producer may continue to pressure the sales price of Trio®.
International sales could present risks to our business.
Sales of Trio® into international markets often require more resources and management attention than domestic sales and may subject us to economic, regulatory, and political risks that are different from those in the United States. These risks include accounts receivable collection; the need to adapt marketing and sales efforts for specific countries; new and different sources of competition; disputes and losses associated with overseas shipping; tariffs, export controls, and trade duties; additional time and effort to obtain product certifications; adverse tax consequences; restrictions on the transfer of funds; changes in legal and regulatory requirements or import policies; compliance with potentially unfamiliar local laws and customs; and political and economic instability. International sales may also be subject to fluctuations in currency exchange rates, which could increase the price of our products outside the United States and expose us to foreign currency exchange rate risk. Certain international markets require significant time and effort on the part of management to develop relationships and gain market acceptance for our products. Overall, there are additional logistical requirements associated with international sales, which may increase the time between production and our ability to recognize related revenue. Our failure to manage any of these risks successfully could harm our future international operations and our overall business.
If potash or Trio® prices decline, we could be required to record write-downs of our long-lived assets, which could adversely affect our results of operations and financial condition.
We evaluate our long-lived assets for impairment when events or changes in circumstances indicate that the related carrying amount may not be recoverable. Impairment is considered to exist if an asset's total estimated future cash flows on an undiscounted basis are less than the carrying amount of the related asset. An impairment loss is measured and recorded based on the discounted estimated future cash flows.
Although we believe the carrying values of our long-lived assets were realizable as of the balance sheet dates, future events could cause us to conclude otherwise. These future events could include further significant and sustained declines in potash or Trio® prices or higher production and operating costs. Further, based on our analysis of the profitability of any of our facilities, we may decide to terminate or suspend operations at additional facilities. These events could require a further write-down of the carrying value of our assets, which would adversely affect our results of operations and financial condition.
If we are required to write down the value of our inventories, our financial condition and results of operations would be adversely affected.
We carry our inventories at the lower of cost or net realizable value. In periods when the market prices for our products fall below our cost to produce them and the lower prices are not expected to be temporary, we are required to write down the value of our inventories. Any write-down of our inventory would adversely affect our financial condition and results of operations, possibly materially. For example, due to decreased pricing during the year ended December 31, 2019, we recorded lower of cost or net realizable value ("lower of cost or NRV") inventory adjustments totaling $1.8 million.
The execution of strategic projects could require more time and money than we expect, which could adversely affect our results of operations and financial condition.
From time to time, we invest in strategic projects. The completion of these projects could require significantly more time and money than we expect. In some cases, the construction or commissioning processes could force us to slow or shut down normal operations at the affected facility for a period of time, which would cause lower production volume and higher production costs per ton. In addition, our management team and other employees may be required to spend a significant amount of time addressing strategic projects, which could mean that our normal operations receive less time and attention. As we proceed with one or more of these strategic projects, we may not realize the expected benefits despite substantial investments, they may cost significantly more than we expect, or we may encounter additional risks that we did not initially anticipate.
16
Mining is a complex process that frequently experiences production disruptions, which could adversely affect our results of operations.
The process of mining is complex. Production delays can occur due to equipment failures, unusual or unexpected geological conditions, environmental hazards, acts of nature, and other unexpected events or problems. Furthermore, production is dependent upon the maintenance and geotechnical structural integrity of our tailings and storage ponds. The amounts that we are required to spend on maintenance and repairs may be significant.
Our East mine, surface, and support facilities are over 50 years old. As mining progresses at an underground mine, operations typically move further away from the shafts and, despite modernization through sustaining capital, fixed assets may require increased repair or refurbishment. These conditions increase the exposure to higher operating costs or the increased probability of incidents.
Mining is a hazardous process, and accidents could result in significant costs or production delays.
The process of mining is hazardous and involves various risks and hazards that can result in serious accidents. If accidents or unforeseen events occur, or if our safety procedures are not effective, we could be subject to liabilities arising out of personal injuries or death, our operations could be interrupted, or we could be required to shut down or abandon affected facilities. Accidents could cause us to expend significant amounts to remediate safety issues or repair damaged facilities.
Existing or expanded oil and gas development near our mines could result in methane gas leaking from an oil and gas well into our mines. We test our mines regularly for methane gas. However, unlike coal mines, our mines are not constructed or equipped to deal with methane gas. Any intrusion of methane gas into our mines could cause a fire or an explosion resulting in loss of life or significant property damage or could require the suspension of all mining operations until the completion of extensive modifications and re-equipping of the mine. The costs of modifying our mines and equipment could make it uneconomical to reopen our mines. You can find more information about the co-development of potash and oil and gas resources near our New Mexico facilities under the risk factor below entitled "-Existing and further oil and gas development in the Designated Potash Area could impair our potash reserves, which could adversely affect our financial condition or results of operations."
The grade of ore that we mine could vary from our projections due to the complex geology and mineralogy of reserves, which could adversely affect our production and our results of operations.
Ore bodies have complex geology. Our production is affected by the mineral content and other mineralogy of the ore. Our projections of ore grade may not be accurate. There are numerous uncertainties inherent in estimating ore grade, including many factors beyond our control. As the grade of our remaining ore reserves decreases over time, we need to process more ore to produce the same amount of saleable-grade product, increasing our costs and slowing our production. In addition, there are few opportunities to acquire more reserves in the areas around our current operations. If we are unable to process more ore to maintain current production levels, if the processing of more ore materially increases our costs, or if our ore grade projections are not accurate, our results of operations would be adversely affected.
If the assumptions underlying our reserve estimates are inaccurate or if future events cause us to negatively adjust our previous assumptions, the quantities and value of our reserves, and in turn our financial condition and results of operations, could be adversely affected.
There are numerous uncertainties inherent in estimating our potash and langbeinite reserves. As a result, our reserve estimates necessarily depend upon a number of assumptions, including the following:
• | geologic and mining conditions, which may not be fully identified by available exploration data and may differ from our experiences in areas where we currently mine or operate |
• | future potash and Trio® prices, operating costs, capital expenditures, royalties, severance and excise taxes, and development and reclamation costs |
• | future mining technology improvements |
• | the effects of governmental regulation |
• | variations in mineralogy |
In addition, because reserves are estimates built on various assumptions, they cannot be audited for the purpose of verifying exactness. It is only after extraction that reserve estimates can be compared to actual values to adjust estimates of the remaining reserves. If any of the assumptions that we make in connection with our reserve estimates are incorrect, the amounts of potash and langbeinite that we are able to economically recover from our mines could be significantly lower than our reserve estimates. In addition, we periodically review the assumptions underlying our reserve estimates. If future events cause us to negatively adjust our previous assumptions, our reserve estimates could be adversely affected. In any of these events, our financial condition and results of operations could be adversely affected.
17
Weakening of foreign currencies against the U.S. dollar could lead to lower domestic potash prices, which would adversely affect our results of operations. Currency fluctuations could cause our results of operations to fluctuate.
The U.S. imports the majority of its potash, including from Canada, Russia, and Belarus. If the local currencies for foreign suppliers strengthen in comparison to the U.S. dollar, foreign suppliers realize a smaller margin in their local currencies unless they increase their nominal U.S. dollar prices. Strengthening of these local currencies therefore tends to support higher U.S. potash prices as the foreign suppliers attempt to maintain their margins. However, if these local currencies weaken in comparison to the U.S. dollar, foreign suppliers may lower prices to increase sales volume while again maintaining a margin in their local currency. Currently, the U.S. dollar is still relatively strong in comparison to many foreign currencies, which has led to increased imports into the U.S. These activities could cause our sales prices and results of operations to decrease or fluctuate significantly.
Adverse conditions in the global economy and disruptions in the financial markets could negatively affect our results of operations and financial condition.
Global economic volatility and uncertainty can create uncertainty for farmers and customers in the geographic areas where we sell our products. If farmers reduce, delay, or forgo their potash and Trio® purchases due to this uncertainty, our results of operations would be adversely affected. Moreover, volatility and disruptions in the financial markets could limit our customers' ability to obtain adequate financing or credit to purchase and pay for our products, which would decrease our sales volume and increase our risk of non-payment by customers. Changes in governmental banking, monetary, and fiscal policies to restore liquidity and increase credit availability may not be effective. It is difficult to determine the extent of economic and financial market problems and the many ways in which they could negatively affect our customers and business. In addition, if we are required to raise additional capital or obtain additional credit during an economic downturn, we could be unable to do so on favorable terms or at all.
Changes in laws and regulations affecting our business, or changes in enforcement practices, could have an adverse effect on our financial condition or results of operations.
We are subject to numerous federal and state laws and regulations covering a wide variety of business practices. Changes in these laws or regulations could require us to modify our operations, objectives, or reporting practices in ways that adversely impact our financial condition or results of operations. In addition, new laws and regulations, or new interpretations of or enforcement practices with respect to existing laws and regulations, could similarly impact our business.
For example, we are subject to significant regulation under MSHA and OSHA. High-profile mining accidents could prompt governmental authorities to enact new laws and regulations that apply to our operations or to more strictly enforce existing laws and regulations. See also “Environmental laws and regulations could subject us to significant liability and require us to incur additional costs.”
Our business depends on skilled and experienced workers, and our inability to find and retain quality workers could have an adverse effect on our development and results of operations.
The success of our business depends on our ability to attract and retain skilled managers, engineers, and other workers. At times, we may not be able to find or retain qualified workers. In particular, the labor market around Carlsbad, New Mexico, is competitive and employee turnover is generally high. In that market, we compete for experienced workers with several other employers, including natural resource and hazardous waste facilities, oil and gas producers, and another producer of langbeinite. If we are not able to attract and retain quality workers, the development of our business could suffer, or we could be required to raise wages to keep our employees, hire less qualified workers, or incur higher training costs. These risks may be exacerbated in times when we need to reduce our workforce due to economic conditions. The occurrence of any of these events could have an adverse effect on our results of operations. For example, in mid-2016, we idled our West mine and transitioned our East mine to Trio®-only, resulting in our laying off a significant number of skilled employees in New Mexico. This may make it more difficult for us to re-hire skilled employees in the future.
Changes in the prices of energy and other important materials used in our business, or disruptions to their supply, could adversely impact our sales, results of operations, or financial condition.
Natural gas, electricity, chemicals, diesel, and gasoline are key materials that we purchase and use in the production of our products. The prices of these commodities are volatile.
Our sales and profitability are impacted by the price and availability of these materials. A significant increase in the price of these materials that is not recovered through an increase in the price of our products, or an extended interruption in the supply of these materials to our production facilities, could adversely affect our results of operations or financial condition. In addition, high natural gas or other fuel costs could increase input costs for end-users of our products, which could cause them to spend less on our products.
18
Increased costs could affect our per-ton profitability.
A substantial portion of our operating costs is comprised of fixed costs that do not vary based on production levels. These fixed costs include labor and benefits, base energy usage, property taxes, insurance, maintenance expenditures, and depreciation. Any increase in fixed costs or decrease in production generally increases our per-ton costs and correspondingly decreases our per-ton operating margin. Beginning in December 2016, we curtailed our Trio® production to match expected demand and manage inventory levels. A significant increase in costs at any of our facilities could have an adverse effect on our profitability and cash flows, particularly during periods of lower potash and Trio® prices.
A shortage of railcars or trucks for transporting our products, increased transit times, or interruptions in railcar or truck transportation could result in customer dissatisfaction, loss of sales, higher transportation or equipment costs, or disruptions in production.
We rely heavily upon truck and rail transportation to deliver our products to our customers. In addition, the cost of transportation is an important component of the price of our products. A shortage of trucks or railcars for carrying product or increased transit times due to accidents, highway or railway disruptions, congestion, high or compressed demand, labor disputes, adverse weather, natural disasters, changes to transportation systems, or other events could prevent us from making timely delivery to our customers or lead to higher transportation costs. As a result, we could experience customer dissatisfaction or a loss of sales. Similarly, disruption within the transportation systems could negatively affect our ability to obtain the supplies and equipment necessary to produce our products. We may also have difficulty obtaining access to vessels to deliver our products to overseas customers.
We rely on our management personnel for the development and execution of our business strategy, and the loss of one or more members of our management team could harm our business.
Our management personnel have significant relevant industry and company-specific experience. Our senior management team has developed and implemented first-of-their-kind processes and other innovative ideas that are important to our business. If we are unable to retain these individuals, our operations could be disrupted and we may be unable to achieve our business strategies and grow effectively. We do not currently maintain "key person" life insurance on any of our management personnel.
Existing and further oil and gas development in the Designated Potash Area could impair our potash reserves, which could adversely affect our financial condition or results of operations.
The U.S. Department of the Interior regulates the development of federal mineral resources-both potash and oil and gas-on federal lands in the Designated Potash Area. This 497,000-acre region outside of Carlsbad, New Mexico, includes all of our New Mexico operations and facilities. In 2012, the U.S. Department of the Interior issued an updated order that provides guidance to the U.S. Bureau of Land Management ("BLM") and industry on the co-development of these resources.
It is possible that oil and gas drilling in this area could limit our ability to mine valuable potash and langbeinite reserves or mineralized deposits because of setbacks from oil and gas wells and the establishment of unminable buffer areas around oil or gas wells. It is also possible that the BLM could determine that the size of these unminable buffer areas should be larger than they are currently, which could impact our ability to mine our reserves. We review applications for permits to drill oil and gas wells as they are publicly disclosed by the BLM and the State of New Mexico. When appropriate, we protest applications for drilling permits that we believe should not be drilled consistent with the operative federal and state rules and that could impair our ability to mine our reserves or put at risk the safety of our employees. We may not prevail in these protests or be able to prevent wells from being drilled in the vicinity of our reserves. If, notwithstanding our protests and appeals, a sufficient number of wells are drilled through or near our reserves, our reserves could be significantly impaired, which could adversely affect our financial condition or results of operations.
If we are unable to obtain and maintain the required permits, governmental approvals, and leases necessary for our operations, our business could be adversely affected.
We hold numerous environmental, mining, safety, and other permits and governmental approvals authorizing the operations at each of our facilities. A decision by a governmental agency to deny or delay a new or renewed permit or approval, or to revoke or substantially modify an existing permit or approval, could prevent or limit us from continuing our operations at the affected facility, which could have an adverse effect on our business, financial condition, and results of operations. In addition, we could be required to expend significant amounts to obtain these permits, approvals, and leases, or we could be required to make significant capital investments to modify or suspend our operations at one or more of our facilities.
Any expansion of our existing operations would require us to secure the necessary environmental and other permits and approvals. We may not be able to obtain these permits and approvals in a timely manner or at all. In addition, the federal government must consider and study a project's likely environmental impacts. Based on the federal government's conclusion, it
19
could require an environmental assessment or an environmental impact statement as a condition of approving a project or permit, which could result in significant time delays and costs. Furthermore, many of our operations take place on land that is leased from federal and state governmental authorities. Expansion of our existing operations could require securing additional federal and state leases. We may not be able to obtain or renew these leases on favorable terms or at all. In addition, our existing leases generally require us to commence mining operations within a specified time frame and to continue mining in order to retain the lease. The loss or non-renewal of a lease could adversely affect our ability to mine the associated reserves.
Also, certain of our existing leases require us to make royalty payments based on the revenue generated by the potash, langbeinite, water, or byproducts that we extract from the leased land. The royalty rates are subject to change whenever we renew our leases, which could lead to significant increases in these rates. As of December 31, 2019, approximately 22% of our state, federal and private lease acres at our New Mexico facilities (including leases at the HB and North mines) and 43% of our state and federal lease acres at our Utah operations will be up for renewal within the next five years. Increases in royalty rates would reduce our profit margins and, if the increases were significant, would adversely affect our results of operations. Reporting of royalties is subject to periodic audits by federal and state officials. The Office of Natural Resources Revenue ("ONRR") completed their draft audit report of our New Mexico royalty reporting in September 2019 and we are in the process of responding to their initial report.
We have less product diversification than nearly all of our competitors, which could have an adverse effect on our financial condition and results of operations.
A significant portion of our revenue comes from the sale of potash and langbeinite, whereas nearly all of our competitors are diversified, primarily into nitrogen- or phosphate-based fertilizer businesses or other chemical or industrial businesses. In addition, a majority of our sales are to customers in the U.S., and generally these customers are concentrated in key geographies where we have a freight advantage. As a result, we could be impacted more acutely by factors affecting our industry or the regions in which we operate than we would if our business was more diversified and our sales more global. A decrease in the demand for potash and langbeinite would have an adverse effect on our financial condition and results of operations. Similarly, in periods when production exceeds demand, the price at which we sell our potash and langbeinite and our sales volumes would likely fall, which would adversely affect our results of operations and financial condition more than our diversified competitors.
Heavy precipitation or low evaporation rates at our solar solution mines could impact our potash production at those facilities, which could adversely affect our sales and results of operations.
All of our potash production comes from our solar solution mines. These facilities use solar evaporation ponds to form potash crystals from brines. Weather conditions at these facilities could negatively impact potash production. For example, heavy rainfall in September and October, just after the evaporation season ends, can reduce the amount of potash we produce in that year or the following year by causing the potash crystals to dissolve and consume pond capacity. Similarly, lower‑than‑average temperatures or higher-than-average seasonal rainfall would reduce evaporation rates and therefore impact production. If we experience heavy rainfall or low evaporation rates at any of our solar solution mines, we would have less potash available for sale, and our sales and results of operations would be adversely affected.
Physical effects of climate change, and climate change legislation, could have a negative effect on us and our customers, and, in turn, our results of operations.
The prospective impact of climate change on our operations and our customers’ operations remains uncertain, but the physical effects of climate change could have an adverse effect on us and our customers as experts believe that climate change may be associated with more extreme weather conditions. These effects could include, but may not be limited to, changes in regional weather patterns, including drought and rainfall levels, timing and duration of wintry precipitation and snow events, water availability, sea levels, storm patterns and intensities and temperature levels, including increased volatility in seasonal temperatures via excessively hot or cold temperatures. These extreme weather conditions could vary by geographic location.
Severe climate change could have an adverse effect on our costs, production, or sales, especially with respect to our solar operations, which require hot, arid summer weather conditions. Prolonged periods of precipitation or cooler weather during the evaporation season could reduce evaporation rates, leading to decreases in our production levels. Similarly, drought or decreased mountain snowfall and associated freshwater run-off could change brine levels, impacting our mineral harvesting process at our Wendover facility. The occurrence of these events at our solar operations could lead to decreased production levels, increased operating costs and require us to make significant additional capital expenditures. Furthermore, weather conditions have historically caused volatility in the agricultural industry and, as a result, in our results of operations, by causing crop failures or significantly reduced harvests, which can adversely affect application rates, demand for our products and our customers’ creditworthiness. Weather conditions can also lead to drought or wild fires, which could adversely impact growers’ crop yields and the uptake of our products, which would reduce the need for application of our products for the following
20
planting season, which could result in lower demand for our products and negatively impact the prices of our products. Finally, salt and magnesium chloride sales into the deicing market and our ability to utilize certain water rights for sale into oil and gas markets may be adversely affected by weather conditions in our markets. Any prolonged change in weather patterns in our markets, as a result of climate change or otherwise, could have a material impact on the results of our operations. In addition, in recent years, the United States Congress has considered legislation to reduce emissions of greenhouse gases (“GHGs”). These initiatives could restrict our or our customers’ operations, require us or our customers to make changes in our respective businesses that would increase our operating costs, reduce our efficiency or limit our output, require us to make capital improvements to our facilities, increase our energy, raw material and transportation costs or limit their availability, or otherwise materially adversely affect our financial condition and results of operations. As of the date of this Annual Report on Form 10-K, it appears unlikely that comprehensive climate legislation will be passed by either house of Congress in the near future, although energy legislation and other regulatory initiatives are expected to be proposed that may be relevant to GHG emissions issues. In addition, a number of states are addressing GHG emissions, primarily through the development of emission inventories or regional GHG cap and trade programs. Depending on the particular program, we and our customers could be required to control GHG emissions or to purchase and surrender allowances for GHG emissions resulting from our operations.
Independent of Congress, the environmental protection agency has adopted regulations controlling GHG emissions under its existing authority under the Clean Air Act (the “CAA”). For example, following its findings that emissions of GHGs present an endangerment to human health and the environment because such emissions contributed to warming of the earth’s atmosphere and other climate changes, the EPA has adopted regulations under existing provisions of the CAA that, among other things, establish construction and operating permit reviews for GHG emissions from certain large stationary sources that are already potential major sources for conventional pollutants. In addition, the EPA has adopted rules requiring the monitoring and reporting of GHG emissions from specified production, processing, transmission and storage facilities in the United States on an annual basis.
Further, in December 2015, over 190 countries, including the United States, reached an agreement to reduce global greenhouse gas emissions, also known as the Paris Agreement. The Paris Agreement entered into force in November 2016 after more than 170 nations, including the United States, ratified or otherwise indicated their intent to be bound by the agreement. However, in June 2017, President Trump announced that the United States intended to withdraw from the Paris Agreement and to seek negotiations either to re-enter the Paris Agreement on different terms or enter into a separate agreement. In August 2017, the U.S. Department of State officially informed the United Nations of the United States’ intent to withdraw from the Paris Agreement. The Paris Agreement provides for a four-year exit process beginning when it took effect in November 2016, which would result in an effective exit date of November 2020. The United States’ adherence to the exit process and/or the terms on which the United States may re-enter the Paris Agreement or a separately negotiated agreement are unclear at this time. To the extent that the United States and other countries implement this agreement or impose other climate change regulations on our industry or our customers’ industries, it could have an adverse effect on our business because substantial limitations on GHG emissions could adversely affect demand for our products or the products produced by our customers.
It is also possible that future legislation or regulation addressing climate change, including in response to the Paris Agreement or any new international agreements, could adversely affect our operations, energy, raw material and transportation costs, results of operations, liquidity or capital resources, and these effects could be material or adversely impact us. In addition, to the extent climate change restrictions imposed in countries where our competitors operate, such as Canada, Russia, and Belarus, are less stringent than in the United States, our competitors could gain cost or other competitive advantages over us.
Inflows of water into our langbeinite mine from heavy rainfall or groundwater could result in increased costs and production downtime and could require us to abandon the mine, any of which could adversely affect our results of operations.
Major weather events such as heavy rainfall can result in water inflows into our underground, langbeinite mine. The presence of water-bearing strata in many underground mines carries the risk of water inflows into the mines. If we experience water inflows at our langbeinite mine, our employees could be injured and our equipment and mine shafts could be seriously damaged. We could be forced to shut down the mine temporarily, potentially resulting in significant production delays, and spend substantial funds to repair or replace damaged equipment. Inflows may also destabilize the mine shafts over time, resulting in safety hazards for employees and potentially leading to the permanent abandonment of the mine.
Environmental laws and regulations could subject us to significant liability and require us to incur additional costs.
We are subject to many environmental, safety, and health laws and regulations, including laws and regulations relating to mine safety, mine land reclamation, remediation of hazardous substance releases, and discharges into the soil, air, and water.
21
Our operations, as well as those of our predecessors, have involved the use and handling of regulated substances, hydrocarbons, potash, salt, related potash and salt byproducts, and process tailings. These operations resulted, or may have resulted, in soil, surface water, and groundwater contamination. At some locations, salt-processing waste, building materials (including asbestos-containing material), and ordinary trash may have been disposed of or buried in areas that have since been closed and covered with soil and other materials.
We could incur significant liabilities under environmental remediation laws such as CERCLA with regard to our current or former facilities, adjacent or nearby third-party facilities, or off-site disposal locations. Under CERCLA and similar state laws, in some circumstances liability may be imposed without regard to fault or legality of conduct and one party may be required to bear more than its proportional share of cleanup costs at a site. Liability under these laws involves inherent uncertainties.
We are also subject to federal and state environmental laws that regulate discharges of pollutants and contaminants into the environment, such as the U.S. Clean Water Act and the U.S. Clean Air Act. For example, our water disposal processes rely on dikes and reclamation ponds that could breach or leak, resulting in a possible prohibited release into the environment. Moreover, although the North and East mines in New Mexico and the Moab mine in Utah are designated as zero discharge facilities under the applicable water quality laws and regulations, these mines could experience some water discharges during significant rainfall events.
We expect that we will be required to continue to invest in environmental controls at our facilities and that these expenses could be significant. In addition, violations of environmental, safety, and health laws could subject us to civil and, in some cases, criminal sanctions. We could also be required to invest in additional equipment, facilities, or employees, or could incur significant liabilities, due to any of the following:
• | changes in the interpretation of environmental laws |
• | modifications to current environmental laws |
• | the issuance of more stringent environmental laws |
• | malfunctioning process or pollution control equipment |
The mining and processing of potash and langbeinite also generate residual materials that must be managed both during the operation of the facility and upon facility closure. For example, potash tailings, consisting primarily of salt, iron, and clay, are stored in surface disposal sites and require management. At least one of our New Mexico facilities, the HB mine, may have issues regarding lead in the tailings pile as a result of operations conducted by previous owners. During the life of the tailings management areas, we have incurred and will continue to incur significant costs to manage potash residual materials in accordance with environmental laws and regulations and permit requirements.
As a potash producer, we currently are exempt from certain State of New Mexico mining laws related to reclamation obligations. If this exemption were to be eliminated or restricted, we could be required to incur significant expenses related to reclamation at our New Mexico facilities.
For more information about environmental, safety and health matters affecting our business, see "Business-Environmental, Safety, and Health Matters."
Anti-corruption laws and regulations could subject us to significant liability and require us to incur costs.
As a result of our international sales, we are subject to the U.S. Foreign Corrupt Practices Act (the "FCPA") and other laws that prohibit improper payments or offers of payments to foreign governments and their officials for the purpose of obtaining or retaining business. Our international activities create the risk of unauthorized payments or offers of payments in violation of the FCPA or other anti-corruption laws by one of our employees, consultants, sales agents, or distributors even though these persons are not always subject to our control. Although we have implemented policies and training designed to promote compliance with these laws, these persons may take actions in violation of our policies. Any violations of the FCPA or other anti-corruption laws could result in significant civil or criminal penalties and have an adverse effect on our reputation.
The mining business is capital intensive, and our inability to fund necessary or desirable capital expenditures could have an adverse effect on our growth and profitability.
The mining business is capital intensive. We may find it necessary or desirable to make significant capital expenditures in the future to sustain or expand our existing operations and may not have, or have access to, the financial resources to pursue these expenditures. If costs associated with capital expenditures increase or if our earnings decrease significantly or we do not have access to the capital markets, we could have difficulty funding any necessary or desirable capital expenditures at an acceptable rate or at all. This could limit the expansion of our production or make it difficult for us to sustain our existing operations at optimal levels. Increased costs for capital expenditures could also have an adverse effect on the profitability of our existing operations and returns from our most recent strategic projects.
22
Market upheavals due to global pandemics, military actions, terrorist attacks, or economic repercussions from those events could reduce our sales or increase our costs.
Global pandemics, actual or threatened armed conflicts, terrorist attacks, or military or trade disruptions affecting the areas where we or our competitors do business could disrupt the global market for potassium-based products. As a result, our competitors may increase their sales efforts in our geographic markets and pricing of our products could suffer. If this occurs, we could lose sales to our competitors or be forced to lower our prices. In addition, due to concerns related to terrorism or the potential use of certain fertilizers as explosives, local, state, and federal governments could implement new regulations impacting the production, transportation, sale, or use of potassium-based products. These new regulations could result in lower sales or higher costs.
A significant disruption to our information technology systems could adversely affect our business and operating results.
We rely on a variety of information technology and automated operating systems to manage or support our operations. In particular, we depend on our information technology systems for a variety of functions, including, but not limited to, financial reporting, inventory management, procurement, invoicing and email. We also have access to, and we create and store, sensitive data, including our proprietary business information and that of our customers, and personally identifiable information of our employees. The proper functioning of these systems and the security of this data is critical to the efficient operation and management of our business. In addition, these systems could require modifications or upgrades as of a result of technological changes or growth in our business. These changes could be costly and disruptive to our operations and could impose substantial demands on management time. Our systems, and those of third-party providers, also could be vulnerable to damage or disruption caused by catastrophic events, power outages, natural disasters, computer system or network failures, viruses or malware, physical or electronic break-ins, unauthorized access, and cyber-attacks. Although we take steps to secure our systems and electronic information, these cybersecurity measures may not be adequate. Any security breaches could compromise our networks and the information stored on them could be improperly accessed, disclosed, lost or stolen. Any such access, disclosure or other loss of information could disrupt our operations and the services we provide to customers, damage our reputation or our relationships with our customers or result in legal claims or proceedings, any of which could adversely affect our business, reputation, and operating results.
Our business may be adversely affected by union activities.
Hourly employees at our Wendover facility are represented by a labor union. These employees represent approximately 8% of our workforce. Our current collective bargaining agreement with the union expires on May 31, 2020. Although we believe that our relations with our unionized employees are good, we may not be successful in negotiating a new collective bargaining agreement as a result of general economic, financial, competitive, legislative, political, and other factors beyond our control. Any new agreement could result in a significant increase in our labor costs. In addition, a breakdown in negotiations or failure to timely enter into a new collective bargaining agreement could materially disrupt our Wendover operations.
From time to time, efforts have been made to unionize employees at our other facilities. Additional unionization efforts could disrupt our business, consume management attention, or increase our operating costs. In addition, if these efforts were successful, we could experience increased labor costs, an increased risk of work stoppages, and limits on our flexibility to run our business in the most efficient manner to remain competitive.
Risks Related to our Common Stock
The price of our common stock may be volatile and you could lose all or part of your investment.
The market price of our common stock has historically experienced, and may continue to experience, volatility. For example, during 2019, the market price of our common stock ranged between $2.06 and $4.39. These fluctuations may continue because of numerous factors, including, but not limited to, the following:
• | our operating performance and the performance of our competitors |
• | the public's reaction to our press releases, other public announcements, or filings with the SEC |
• | changes in earnings estimates or recommendations by research analysts who follow us or other companies in our industry |
• | variations in general economic, market, and political conditions |
• | changes in commodity prices or foreign currency exchange rates |
• | substantial sales of common stock by us under our at-the-market offering program or in connection with future acquisitions or capital raising activities |
23
• | actions of our current stockholders, including sales of common stock by our directors and executive officers |
• | the arrival or departure of key personnel |
• | other developments affecting us, our industry, or our competitors |
• | the other risks described in this Annual Report on Form 10-K |
Our financial position, cash flows, results of operations, and stock price could be materially adversely affected if commodity prices decline. In addition, in recent years the stock market has experienced extreme price and volume fluctuations. This volatility has had a significant effect on the market prices of securities issued by many companies for reasons unrelated to their operating performance. Our stock price may experience extreme volatility due to uncertainty regarding, among other things, commodity prices. These market fluctuations, regardless of the cause, may materially and adversely affect our stock price, regardless of our operating results.
Our stock is currently listed on the New York Stock Exchange (“NYSE”). For continued listing, we are required to meet specified listing standards, including a minimum stock price, market capitalization, and stockholders’ equity. If we are unable to meet the NYSE’s listing standards, including the requirement that our common stock continue to trade at over $1.00 per share, the NYSE would delist our common stock. At that point, it is possible that our common stock could be quoted on the over-the-counter bulletin board or the pink sheets. This could have negative consequences, including reduced liquidity for stockholders; reduced trading levels for our common stock; limited availability of market quotations or analyst coverage of our common stock; stricter trading rules for brokers trading our common stock; and reduced access to financing alternatives for us. We also would be subject to greater state securities regulation if our common stock was no longer listed on a national securities exchange. Volatility of our common stock may make it difficult for you to resell shares of our common stock when you want or at attractive prices.
The market price of our common stock may be adversely affected by the future issuance and sale of additional shares of our common stock, including pursuant to our at-the-market offering program, or by our announcement that the issuances and sales may occur.
We cannot predict the size of future issuances or sales of shares of our common stock, including those made pursuant to our at-the-market offering program or in connection with future acquisitions or capital raising activities, or the effect, if any, that the issuances or sales may have on the market price of our common stock. In addition, the sales agent for our at-the-market offering program will not engage in any transactions that stabilize the price of our common stock. The issuance and sale of substantial amounts of shares of our common stock, including issuances and sales pursuant to our at-the-market offering program, or announcement that the issuances and sales may occur, could adversely affect the market price of our common stock.
We do not anticipate paying cash dividends on our common stock.
We currently intend to retain earnings to reinvest for future operations and growth of our business and do not anticipate paying any cash dividends on our common stock. Accordingly, realization of any gain on our common stock will depend on the appreciation of the price of the shares of our common stock, which may never occur. However, our board of directors, in its discretion, may decide to declare a dividend at an appropriate time in the future, subject to the terms of our debt agreements. A decision to pay a dividend would depend upon, among other factors, our results of operations, financial condition, and cash requirements and the terms of our debt agreements at the time a payment is considered.
Provisions in our charter documents and Delaware law may delay or prevent a third party from acquiring us.
We are a Delaware corporation and the anti-takeover provisions of Delaware law impose various barriers to the ability of a third party to acquire control of us, even if a change of control would be beneficial to our existing stockholders. In addition, our current certificate of incorporation and bylaws contain several provisions that may make it more difficult for a third party to acquire control of us without the approval of our board of directors. These provisions may make it more difficult or expensive for a third party to acquire a majority of our outstanding common stock. Among other things, these provisions:
• | allow our board of directors to create and issue preferred stock with rights senior to those of our common stock without prior stockholder approval, except as may be required by NYSE rules |
• | do not permit cumulative voting in the election of directors, which would otherwise allow less than a majority of stockholders to elect director candidates |
• | prohibit stockholders from calling special meetings of stockholders |
• | prohibit stockholders from acting by written consent, thereby requiring all stockholder actions to be taken at a meeting of our stockholders |
• | require vacancies and newly created directorships on the board of directors to be filled only by affirmative vote of a majority of the directors then serving on the board |
24
• | establish advance notice requirements for submitting nominations for election to the board of directors and for proposing matters that can be acted upon by stockholders at a meeting |
• | classify our board of directors so that only some of our directors are elected each year |
These provisions also may delay, prevent, or deter a merger, acquisition, tender offer, proxy contest, or other transaction that might otherwise result in our stockholders receiving a premium over the market price of the common stock they own.
We may issue additional securities, including securities that are senior in right of dividends, liquidation, and voting to our common stock, without your approval, which would dilute your existing ownership interests.
Our board of directors may issue shares of preferred stock or additional shares of common stock without the approval of our stockholders, except as may be required by NYSE rules. Our board of directors may approve the issuance of preferred stock with terms that are senior to our common stock in right of dividends, liquidation, or voting. Our issuance of additional common shares or other equity securities of equal or senior rank will have the following effects:
• | our pre-existing stockholders’ proportionate ownership interest in us will decrease |
• | the relative voting strength of each previously outstanding common share may diminish |
• | the market price of the common stock may decline |
If securities or industry analysts do not publish research or reports about our business, if they adversely change their recommendations regarding our stock, or if our operating results do not meet their expectations, our stock price could decline.
The trading market for our common stock may be influenced by the research and reports that industry or securities analysts publish about us or our business. If one or more of these analysts cease coverage of Intrepid or fail to publish reports on us regularly, we could lose visibility in the financial markets, which in turn could cause our stock price or trading volume to decline. Moreover, if one or more of the analysts who cover Intrepid downgrade our stock or if our operating results do not meet their expectations, our stock price could decline.
ITEM 1B. | UNRESOLVED STAFF COMMENTS |
None.
ITEM 2. | PROPERTIES |
Properties
We produce potash at three solution mining facilities: our HB solution mine in Carlsbad, New Mexico, a solution mine in Moab, Utah, and a brine recovery mine in Wendover, Utah. Additionally, we operate our North compaction facility in Carlsbad, New Mexico, which compacts and granulates product from the HB mine. We produce Trio® from our conventional underground East mine in Carlsbad, New Mexico. We also have the West facility, which is a conventional underground potash mine that is not in operation and is in care-and-maintenance mode.
In May 2019, we acquired certain land, water rights, and other related assets from Dinwiddie Cattle Company. We refer to these assets and operations as "Intrepid South." This property, located in Lea County in southeastern New Mexico, is comprised of 22,154 surface acres, 27,868 acres of BLM grazing leases and 10,097 acres of pending State of New Mexico grazing leases.
25
We control the rights to mine approximately 143,000 acres of land northeast of Carlsbad, New Mexico. We lease approximately 32,000 acres from the State of New Mexico, approximately 106,000 acres from the U.S. federal government through the BLM, and approximately 240 acres from private leaseholders. We own approximately 4,700 surface acres in the vicinity of our mine sites and adjacent to federal and state mining leases.
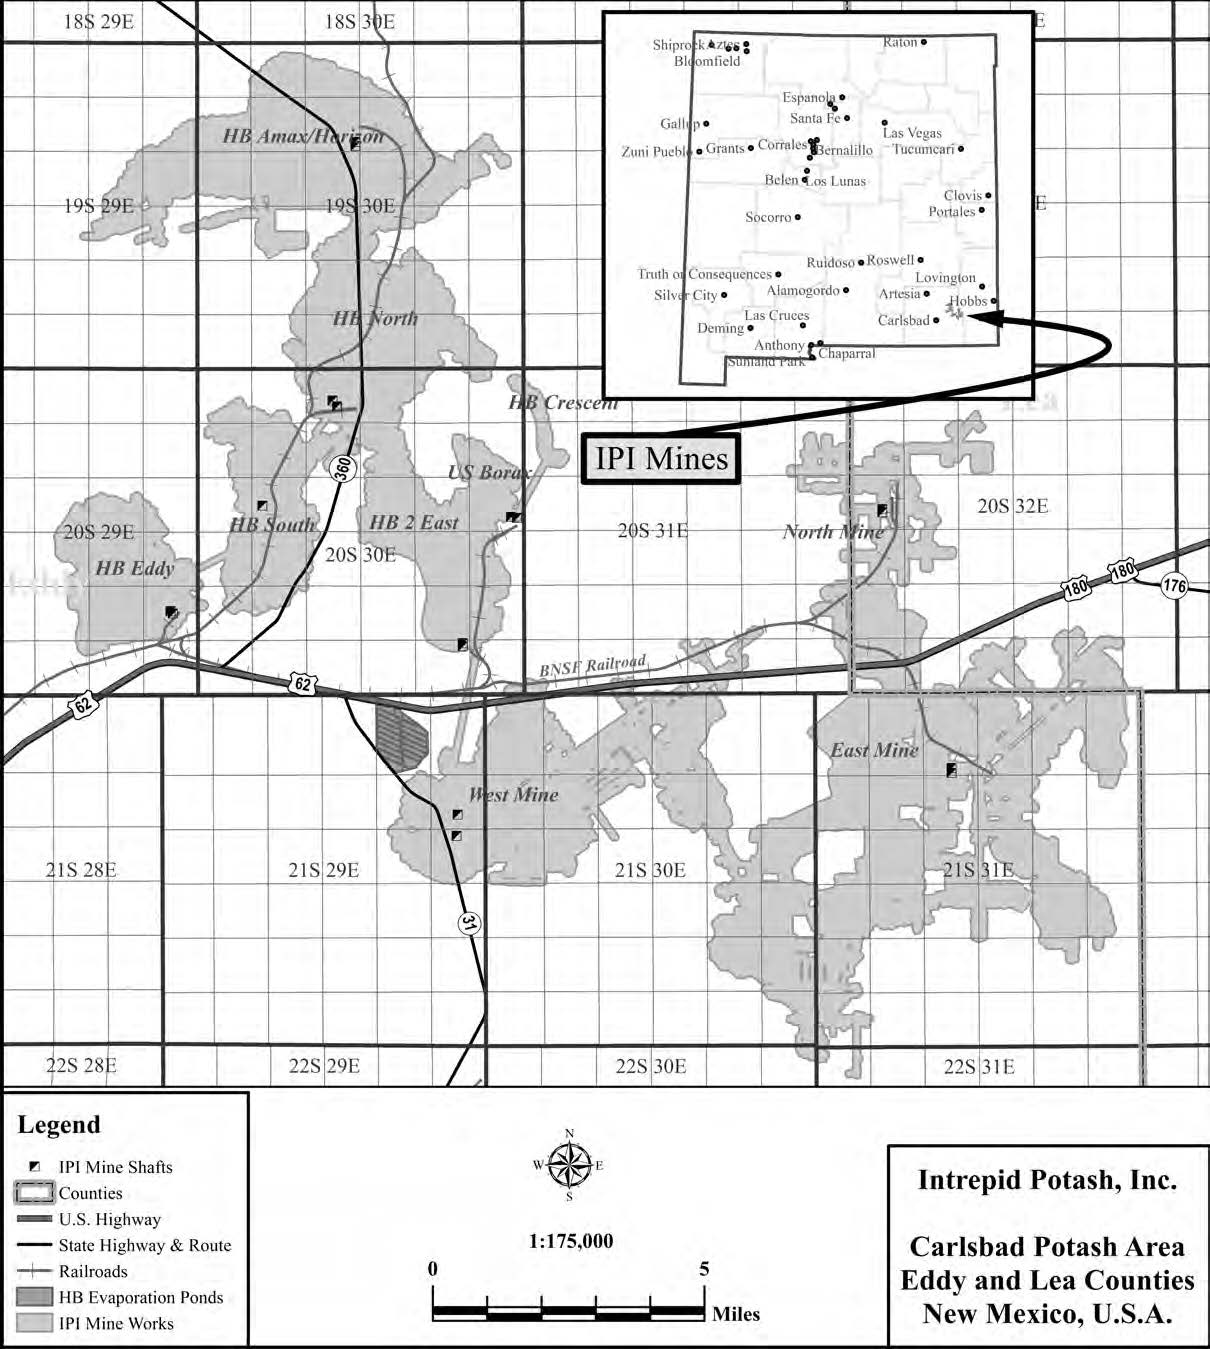
26
We control the rights to mine approximately 14,100 acres of land west of Moab, Utah. We lease approximately 10,100 acres from the State of Utah and approximately 200 acres from the U.S. federal government through the BLM. We own approximately 3,800 surface acres overlying and adjacent to portions of our mining leases with the state of Utah.
.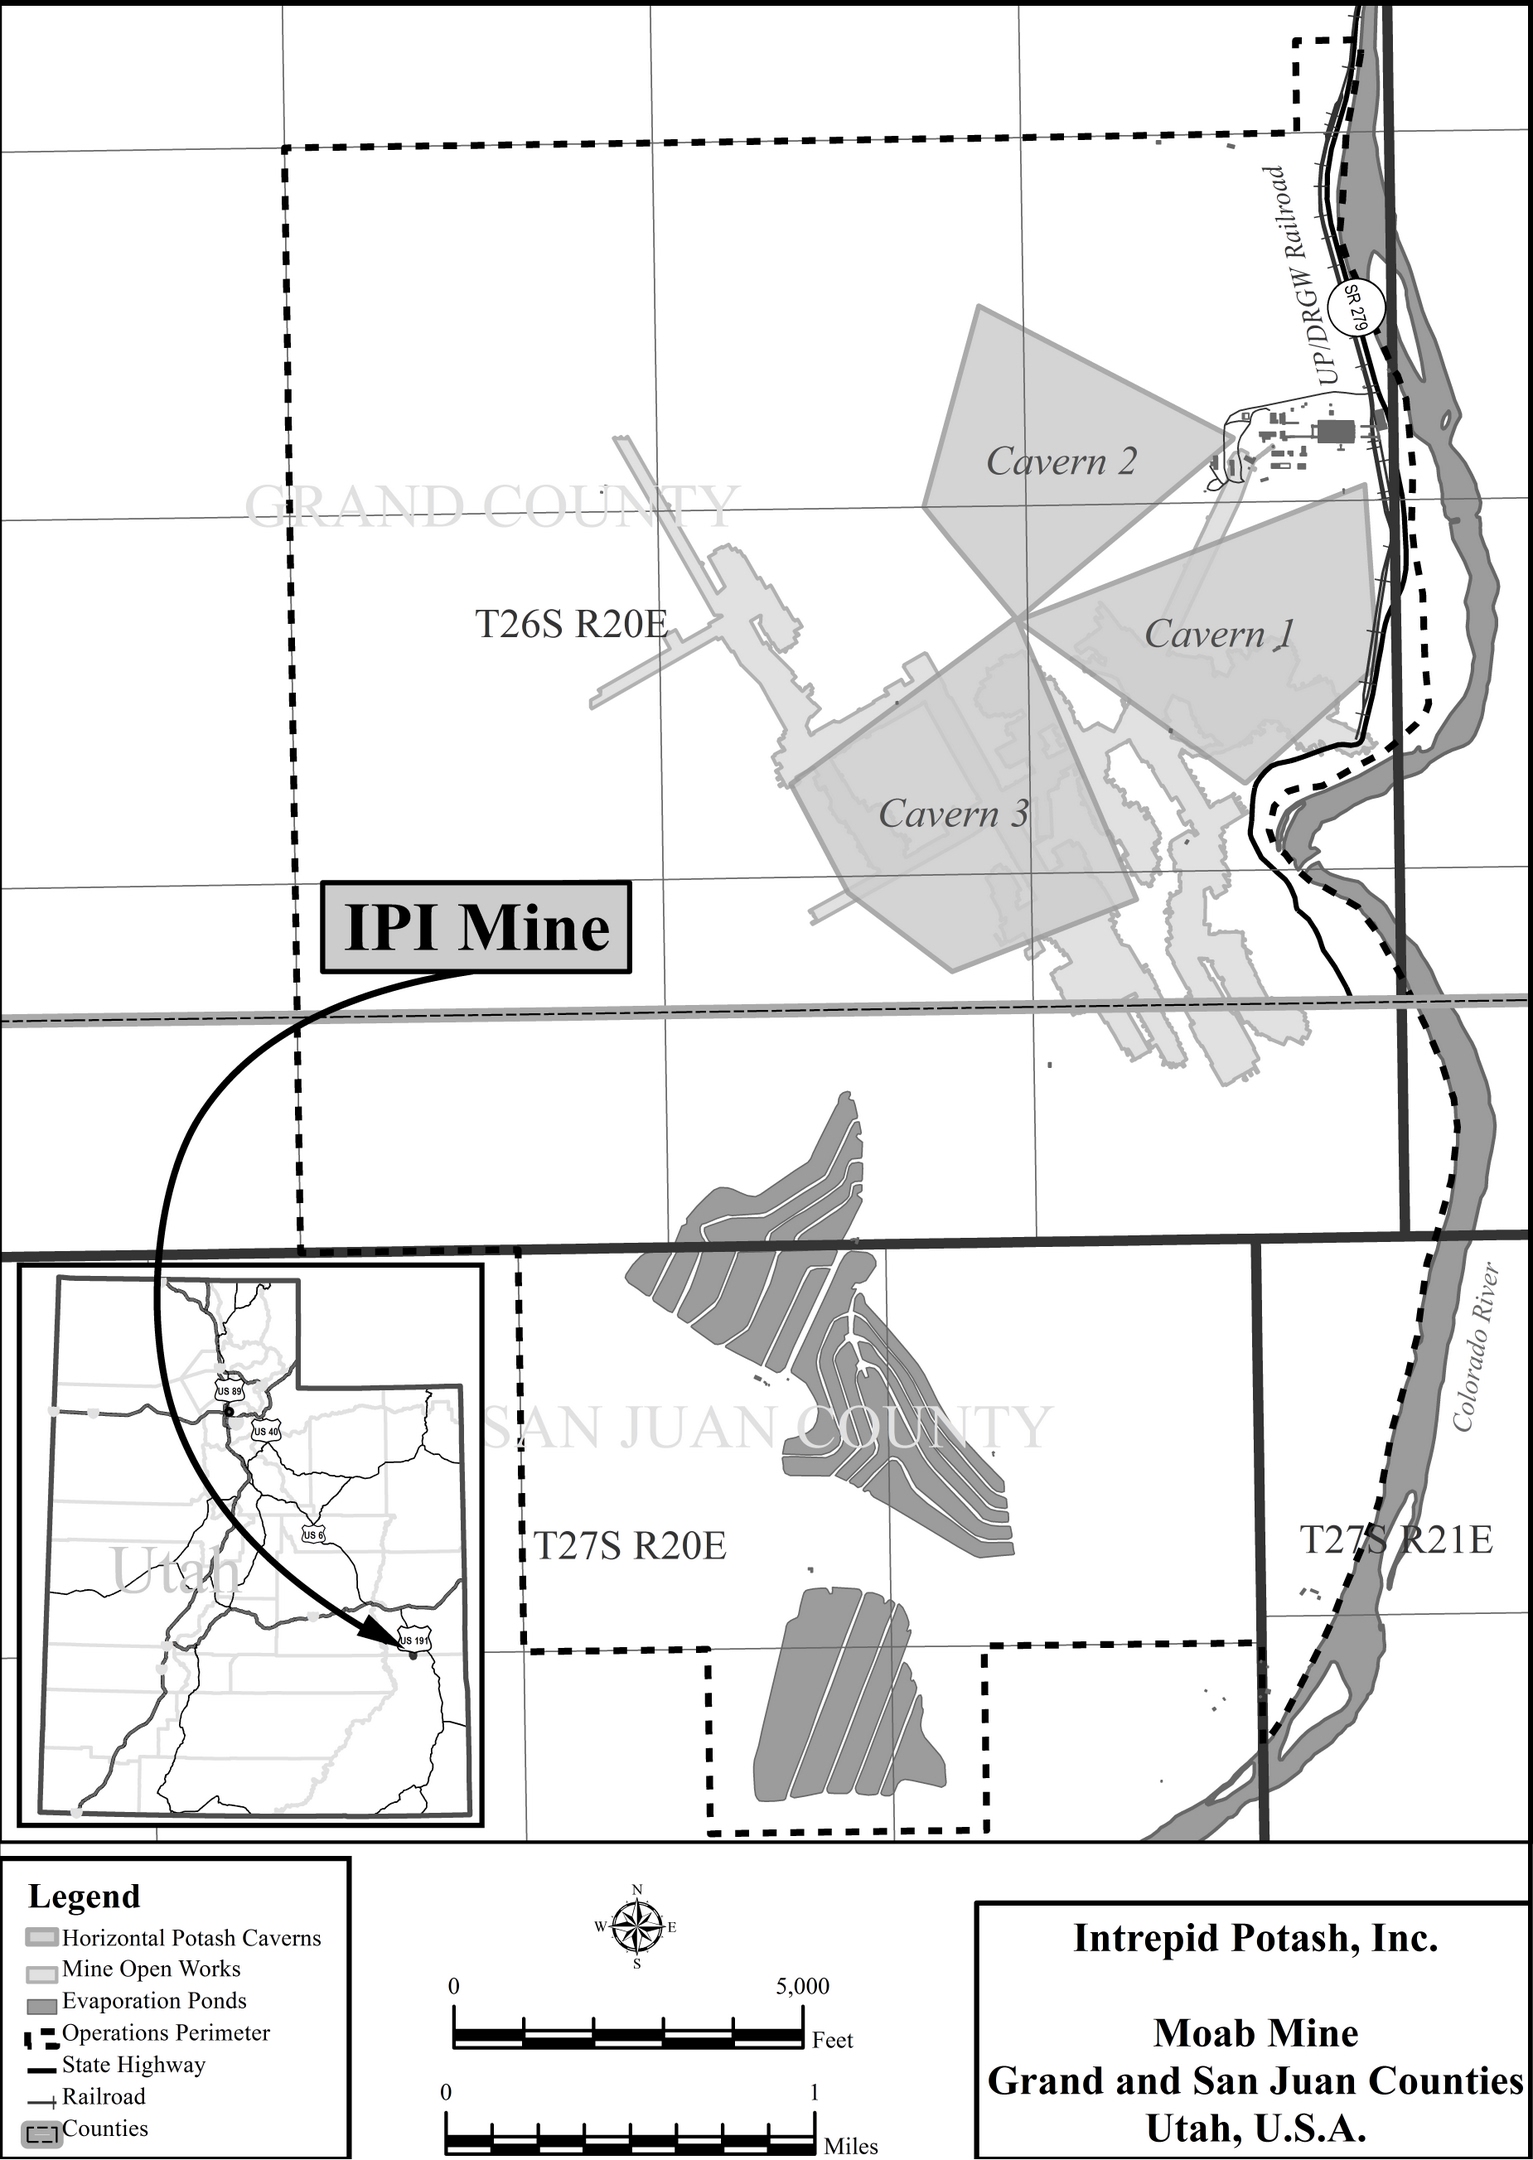
27
We control the rights to mine approximately 90,000 acres of land near Wendover, Utah. We own approximately 57,000 acres, and we lease approximately 8,000 acres from the State of Utah and approximately 25,000 acres from the U.S. federal government through the BLM.
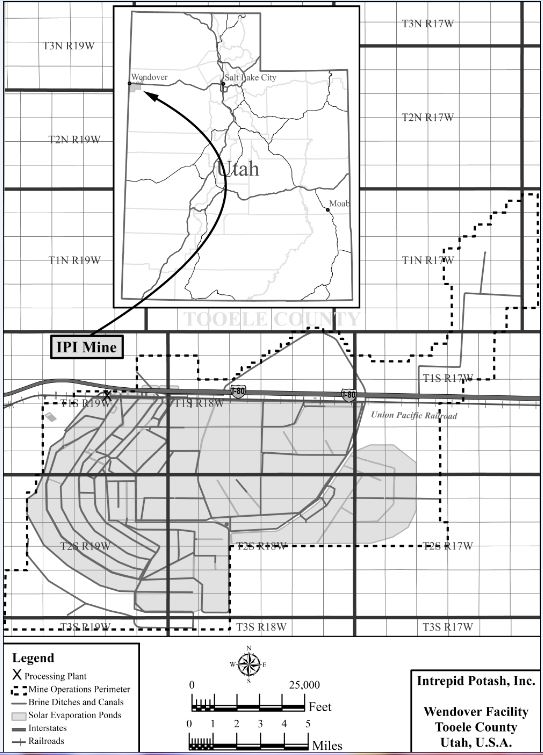
28
We conduct most of our mining operations on properties that we lease from states or the federal government. These leases generally contain stipulations that require us to commence mining operations within a specified term and continue mining to retain the lease.
The stipulations on our leases are subject to periodic readjustment by the applicable state government and the federal government. The lease stipulations could change in the future, which could impact the economics of our operations. Our federal leases are for indefinite terms subject to readjustment of the lease stipulations, including the royalty payable to the federal government, every 20 years. Our leases with the State of New Mexico are issued for terms of 10 years and for as long thereafter as potash is produced in commercial quantities and are subject to readjustment of the lease stipulations, including the royalty payable to the state. Our leases with the State of Utah are for terms of 10 years subject to extension and possible readjustment of the lease by the State of Utah. Our leases for our Moab mine are operated as a unit under a unit agreement with the State of Utah, which extends the terms of all of the leases as long as operations are conducted on any portion of the leases. The term of the state leases for our Moab mine is currently extended until 2024 or so long as potash is being produced. As of December 31, 2019, approximately 22% of our state, federal, and private lease acres at our New Mexico facilities will be up for renewal within the next five years, and 43% of our state and federal lease acres at our Utah operations will be up for renewal within the next five years.
We have water rights at each of our mine properties that we believe are adequate for our needs. All of our mining operations are accessible by paved state or county highways and are accessible by rail. All of our operations obtain electric power from local utilities.
Our mines, plants, and equipment have been in substantially continuous operation since the dates indicated in the chart entitled "Our Proven and Probable Reserves" on the following pages (except for our West facility, which is currently in care-and-maintenance mode), and our mineral development assets, mills, and equipment have been acquired over the interval since these dates.
As noted, we have relatively long-lived proven and probable reserves and consequently expect to conduct limited and focused additional exploration in the coming five years. We plan to drill core holes in areas near our Carlsbad, New Mexico, facility, in order to further define the ore body. Development of the underground mines is expected to be coincident with the continued advancement of ore zones. Development of the solution mine and brine evaporation operations is expected to be enhanced by the drilling of additional wells and flooding of new solution mine caverns. Although not in our current plans, we also have opportunities to rehabilitate the shafts at the currently idled North mine and additional surface infrastructure to accelerate mining of conventional reserves.
Our leased office space in Denver, Colorado, is approximately 19,000 square feet and has a term expiring on April 29, 2022.
We believe that all of our present facilities are adequate for our current needs and that additional space is available for future expansion on acceptable terms.
Proven and Probable Reserves
Our potash (produced from sylvite ore) and langbeinite (marketed as Trio®) reserves each have substantial life, with remaining reserve life ranging from three years to over 100 years, based on proven and probable reserves estimated in accordance with SEC requirements. This lasting reserve base is the result of our past acquisition and development strategy. The estimates of our proven and probable reserves as of December 31, 2019, were prepared by us and were reviewed and independently determined by Agapito Associates, Inc. ("Agapito") based on mine plans and other data furnished by us as described in footnote one below the table. The following table summarizes our proven and probable reserves, stated as product tons and associated percent ore grade, as of December 31, 2019.
29
Our Proven and Probable Reserves 1
(tons in thousands) | Proven 4 | Probable 7 | ||||||||||||||||||||||
Product/Operations | Date Mine Opened 2 | Current Extraction Method | Minimum Remaining Life (years) 3 | Recoverable Ore Tons 5 | Ore Grade 6 (% KCl) | Product Tons as KCl | Recoverable Ore Tons 5 | Ore Grade 6 (% KCl) | Product Tons as KCl | |||||||||||||||
Potash | ||||||||||||||||||||||||
West 2 | 1931 | Underground | 51 | 82,640 | 22.8 | % | 15,410 | 36,060 | 16.0 | % | 6,540 | |||||||||||||
East | 1965 | Underground | 3 | 5,360 | 21.7 | % | 920 | 3,510 | 22.6 | % | 650 | |||||||||||||
HB Mine 2, 9 | 2012 | Solution | 36 | 17,390 | 36.4 | % | 5,900 | 2,190 | 40.2 | % | 790 | |||||||||||||
Moab | 1965 | Solution | 100+ | 29,470 | 44.4 | % | 11,450 | 31,400 | 46.2 | % | 14,760 | |||||||||||||
Wendover 10 | 1932 | Brine Evaporation | 30 | — | — | — | — | 0.7 | % | 3,120 | ||||||||||||||
Total Potash | 32.5 | % | 33,680 | 32.3 | % | 25,860 | ||||||||||||||||||
(tons in thousands) | Proven 4 | Probable 7 | ||||||||||||||||||||||
Product/Operations | Date Mine Opened 2 | Current Extraction Method | Minimum Remaining Life (years) 3 | Recoverable Ore Tons 5 | Ore Grade 6 (% Lang) | Product Tons as Langbeinite | Recoverable Ore Tons 5 | Ore Grade 6 (% Lang) | Product Tons as Langbeinite | |||||||||||||||
Langbeinite | ||||||||||||||||||||||||
East 8,11 | 1965 | Underground | 34 | 31,220 | 43.3 | % | 12,170 | 17,980 | 37.0 | % | 6,490 | |||||||||||||
1 | The determination of estimated reserves has been prepared by us and is based on an independent review and analysis of our mine plans and geologic, financial and other data by Agapito, which is familiar with our mines. The most recent review performed by Agapito for the New Mexico East, West, and HB properties was in 2019. Agapito's analysis for the West, East and HB mines was based on detailed examination of our geologic site data and mine plan, which was updated with information from 2019, and 2018. As a result of the Agapito 2019 review, langbeinite reserves decreased in the East mine and sylvite reserves increased in the West mine compared to previously reported reserves. The change in reserves was primarily due to the reclassification of reserves in the 3rd and 4th ore zones from langbeinite to sylvite. The cutoff grade for langbeinite also increased, thus decreasing reserves. The HB mine reserve estimate decreased due to depletion for 2019 production from the HB mine. The Moab property reserves are based on Agapito's 2018 mine reserve estimate adjusted for depletion for 2019 production. The Wendover property reserves are based on Agapito's 2018 brine aquifer reserve. However, depletion did not change the reserve life of 30 years as discussed in footnote 3 below. Because reserves are estimates, they cannot be audited for the purpose of verifying exactness. Instead, reserve information was reviewed in sufficient detail to determine if, in the aggregate, the data provided by us is reasonable and sufficient to estimate reserves in conformity with practices and standards generally employed by, and within the mining industry, and that are consistent with the requirements of U.S. securities laws. |
2 | These mines, excluding the HB and West mines, have operated in a substantially continuous manner since the dates set forth in this table. The HB mine was originally opened in 1934 and operated continuously as an underground mine until 1996. In July 2016, we transitioned our West facility into care-and-maintenance mode due to the decline in potash prices. |
3 | Minimum remaining lives are calculated by dividing reserves by annual effective capacity. Effective capacity is the estimated amount of production that will likely be achieved based on the amount and quality of ore that we estimate can be mined, milled, and/or processed, assuming an estimated average reserve grade, potential future modifications to the systems, a normal amount of scheduled down time, average or typical mine development efforts and operation of all of our mines and facilities at or near full capacity. Minimum remaining lives at the West, East, HB mine, and Moab mines are based on reserves (product tons) divided by annual effective capacity over the full expected life of the ore body, and corrections for purity: one ton of red muriate of potash equals 0.95 ton of KCl; one ton of Moab white muriate of potash equals 0.97 ton of KCl; one ton of sulfate of potash magnesia equals 0.97 ton of langbeinite. East langbeinite minimum remaining life was based on a langbeinite-only plant and associated plant capacity. Langbeinite-only production commenced in April 2016 at the East facility and the sylvite plant was shut down at that time. The West facility was shut down and placed into care-and-maintenance mode in July 2016 due to low potash prices. If we decided to produce potash from our East and West mine sylvite ore reserves in the future, we expect that we would reopen the West facility and be required to construct a new plant to replace the East sylvite plant closed in 2016 to process the remaining reserves. Calculated mine lives that exceed 100 years are reported at 100+ years to balance the reserve life with the uncertainties |
30
associated with those extended time frames. We currently do not report more than 30 years mining life for Wendover due to the uncertainties associated with natural brine‑containing aquifers.
4 | Generally, "proven reserves" are reserves for which (a) quantity is computed from dimensions revealed in outcrops, trenches, workings, or drill holes; grade and/or quality are computed from the results of detailed sampling, and (b) the sites for inspection, sampling, and measurement are spaced so closely and the geologic character is so well-defined that the size, shape and depth, and mineral content of the reserves are well-established. Proven reserve tonnages are computed from projection of data using the inverse distance squared method taking into account mining dilution, mine extraction efficiency, ore body impurities, metallurgical recovery factors, sales prices, and operating costs from potash ore zone measurements as observed and recorded either in drill holes using cores, or channel samples in mine workings. This classification has the highest degree of geologic assurance. The data points for measurement are adequately spaced and the geologic character so well defined that the thickness, areal extent, size, shape, and depth of the potash ore zone are well-established. The maximum acceptable distance for projection from ore zone data points varies with the geologic nature of the ore zone being studied. |
5 | Recovery is the percentage of valuable material in the ore that is beneficiated prior to further treatment to develop a saleable product. Recoverable ore tons is defined as the hoisted ore for the conventionally mined ore in our East and West mines. This figure was derived from the in-place ore estimate that has been adjusted for factors such as geologic impurities and mine extraction ratios. For the HB mine and the Moab property, recoverable ore tons are defined as the potassium that can be extracted from the underground workings and pumped to the surface. This figure was derived from the in-place ore estimate that has been adjusted for factors such as geologic impurities, potash that dissolves but remains in the cavern (dissolution factor), and an extraction factor that accounts for potash that may not be recovered because solution may be channeled away or stranded due to cavern geometry. We do not calculate recoverable ore tons for the Wendover property as it is a lake brine resource, not an in-place ore deposit. |
6 | Ore grade is expressed as expected mill feed grade to account for minimum mining height for the East and West mines. Potash ore grade is reported in percent KCl and langbeinite ore grade is reported in percent langbeinite. The ore grade for the Moab and HB mines is the in-place KCl grade. |
7 | "Probable reserves" are reserves for which quantity and grade and/or quality are computed from information similar to that used for proven (measured) reserves, but the sites for inspection, sampling and measurement are farther apart or are otherwise less adequately spaced. The degree of assurance of probable (indicated) reserves, although lower than that for proven (measured) reserves, is high enough to assume geological continuity between points of observation. The classification of minerals as probable reserves requires that we believe with reasonable certainty that access to the reserves can be obtained, even though currently-issued permits are not required. Probable reserve tonnages are computed by projection of data using the inverse distance squared method taking into account mining dilution, mine extraction efficiency, ore body impurities, metallurgical recovery factors, sales prices, and operating costs from available ore zone measurements as observed either in drill holes using cores or in mine workings for a distance beyond potash classified as proven reserves. This classification has a moderate degree of geological assurance. |
8 | Our reserves in the 1st, 3rd, 4th, 7th, 8th and 10th ore zones contain either sylvite (KCl) or langbeinite (K2SO4(MgSO4)2) separately. Ore reserves in the East 5th ore zone contain both sylvite and langbeinite which we call mixed ore. We ceased processing sylvite at the East facility in April 2016, and only the langbeinite ore contained in the East 5th ore zone is included in the mine reserve estimate. Additionally, the reserve amounts include the West mine 4th ore zone which contains langbeinite that we anticipate will be processed at the East facility. |
9 | The HB mine reserves were based on solution mining of old workings and recovery of potash from the residual pillars. Reserves are based on thicknesses, grades, and mine maps provided by us. The data presented here includes reserves available via the AMAX/Horizon mine as further described below under Our Development Assets. |
10 | The Wendover facility reserves are the combination of a shallow and a deep aquifer. There were no proven reserves reported for either aquifer because the shallow aquifer represents an unconventional resource and there is uncertainty of the hydrogeology of the deep aquifer. The estimating method for the shallow aquifer was based on brine concentration, brine density, soil porosity within the aquifer, and aquifer thickness from historical reports. The brine concentrations and brine density were confirmed by us recently, but values for the aquifer thickness and the porosity were obtained from literature published by other sources. Probable reserves for the shallow brine at the Wendover facility were calculated from KCl contained in the shallow aquifer based on estimates of porosity and thickness over the reserve area. The distance for projection of probable reserves is a radius of three‑quarters of a mile from points of measurement of brine concentration. Probable reserves for the deep-brine aquifer were estimated based on historical draw-down and KCl brine concentrations. The ore grade (% KCl) for both the shallow and deep aquifer is the percentage by weight of KCl in the brine. |
31
11 | A portion of these reserves are within the West mine boundary. The classification of the reserve as being associated with the East mine is a result of where the ore is intended to be processed. |
Production
Our facilities have a current estimated annual productive capacity of approximately 390,000 tons of potash, and approximately 400,000 tons of langbeinite, based on current design. Our annual production rates are less than our estimated productive capacity. Actual production is affected by operating rates, the grade of ore mined, recoveries, mining rates, evaporation rates, product pricing, and the amount of development work that we perform. Therefore, as with other producers in our industry, our production results tend to be lower than reported productive capacity.
Our production capabilities and capital improvements at our facilities are described in more detail below, along with our historical production of our primary products and byproducts for the years ended December 31, 2019, 2018, and 2017.
Solution Mines
• | Potash ore at HB is mined from idled original mine workings in the Carlsbad, New Mexico, area. |
• | The HB mine has a current estimated productive capacity of 180,000 tons annually. The productive capacity may vary between approximately 160,000 and 200,000 tons of potash, primarily due to evaporation rates. Potash produced from our HB mine is shipped by truck to the North facility for compaction. |
• | Potash ore at Moab is mined from two stacked ore zones: the original mine workings in Potash 5 and the horizontal caverns in Potash 9. |
• | The Moab mine has a current estimated productive capacity of approximately 110,000 tons of potash annually; evaporation rates have historically varied and, consequently, productive capacity may vary between approximately 75,000 and 120,000 tons of potash. |
• | Potash at Wendover is produced primarily from brine containing salt, potash, and magnesium chloride that is collected in ditches from the shallow aquifers of the West Desert. These materials are also collected from a deeper aquifer by means of deep-brine wells. |
• | The Wendover facility has a current estimated productive capacity of approximately 100,000 tons of potash annually; evaporation rates have historically varied resulting in actual annual production between approximately 65,000 and 100,000 tons of potash. |
Conventional Underground Mines
• | Sylvite and langbeinite ore at our Carlsbad locations occurs in a stacked ore body containing at least 10 different mineralized zones, seven of which contain proven and probable reserves. |
• | The East mine has a current estimated productive capacity of approximately 400,000 tons of Trio® annually, based on current design. The East mine was converted to a Trio®-only operation in April 2016 and potash is no longer produced from the East mine. |
• | The West mine was idled in July 2016 and placed in care-and-maintenance mode. When operational, it has an estimated productive capacity of approximately 400,000 tons of red potash annually. |
Compaction Facility
• | The North facility receives compactor feed from the HB mine via truck and converts the compactor feed to finished granular-sized product and standard-sized product. |
Our Development Assets
We have development opportunities in our New Mexico facilities with the acceleration of production from our reserves and mineralized deposits of potash, and the potential construction of additional production facilities in the region. We also own the leases on two idled mines near Carlsbad: the AMAX/Horizon mine and the North mine.
AMAX/Horizon Mine
• | We acquired the potash leases associated with the AMAX/Horizon mine in October 2012. The AMAX/Horizon mine was in continuous operation between 1952 and 1993. This mine, similar to the HB mine, is a viable candidate for solution mining in a manner that is consistent with the HB mine. |
32
• | State and federal permits were obtained in 2015 to utilize these leases for solution mining. The AMAX/Horizon solution mine is expected to utilize the same evaporation ponds and processing mill as the HB mine. We have not yet made a determination to proceed with this potential development project; however, future work may be performed to determine the ability to convert this idled underground mine to a solution mining opportunity. |
• | As noted in footnote 9 to Our Proven and Probable Reserves table, these tons are included in the data presented for the HB Mine. |
North Mine
• | The North mine operated from 1957 to 1982 when it was idled mainly due to low potash prices and mineralogy changes which negatively impacted mineral processing at the facilities. Although the mining and processing equipment has been removed, the mine shafts remain open. The compaction facility at the North mine is where we granulate, store, and ship potash produced from the HB mine. Two abandoned mine shafts, rail access, storage facilities, water rights, utilities and leases covering potash deposits, are already in place. As part of our long-term mine planning efforts, we may choose to evaluate our strategic development options with respect to the shafts at the North mine and their access to mineralized deposits of potash. |
Our Production of Potash and Trio®
One product ton of potash contains approximately 0.60 tons of K2O when produced at our Moab and Wendover facilities and approximately 0.60 or 0.62 tons of K2O when produced at our HB facility. One product ton of langbeinite produced at our East facility contains approximately 0.22 tons of K2O. The following table summarizes production of our primary products at each of our facilities for each of the years ended December 31, 2019, 2018, and 2017:
(tons in thousands) | Year Ended December 31, | ||||||||||||||||||||||||||
2019 | 2018 | 2017 | |||||||||||||||||||||||||
Ore Production | Mill Feed Grade1 | Finished Product | Ore Production | Mill Feed Grade1 | Finished Product | Ore Production | Mill Feed Grade1 | Finished Product | |||||||||||||||||||
Potash | |||||||||||||||||||||||||||
HB | 734 | 16.9 | % | 158 | 679 | 17.4 | % | 150 | 728 | 18.0 | % | 172 | |||||||||||||||
Moab | 509 | 15.6 | % | 94 | 506 | 15.8 | % | 105 | 472 | 16.7 | % | 109 | |||||||||||||||
Wendover | 409 | 15.1 | % | 75 | 404 | 17.3 | % | 89 | 362 | 15.9 | % | 78 | |||||||||||||||
1,652 | 327 | 1,589 | 344 | 1,562 | 359 | ||||||||||||||||||||||
Langbeinite | |||||||||||||||||||||||||||
East 2 | 944 | 9.1 | % | 228 | 935 | 9.1 | % | 217 | 1,177 | 8.0 | % | 243 | |||||||||||||||
Total Primary Products | 555 | 561 | 602 | ||||||||||||||||||||||||
1 Mill feed grade shown is as percent of K2O. Mill freed grade is a measurement of the amount of mineral contained in an ore as a percentage of the total weight of the ore. For potash it is often represented as a percent of potassium oxide (K2O) or percent potassium chloride (KCl).
Water and Byproduct Production
We have water rights in New Mexico under which we sell water primarily to support oil and gas development in the Permian Basin near our Carlsbad facilities. During the extraction of potash and Trio®, we recover marketable salt, magnesium chloride, metal recovery salts, water, and brine containing salt and potassium from our mining processes. Our salt is used in a variety of markets including animal feed, industrial applications, pool salt, and the treatment of roads and walkways for ice melting or to manage road conditions. Magnesium chloride is typically used as a road treatment agent for both deicing and dedusting. At our Moab and Wendover facilities, we also produce metal recovery salt, which is potash mixed with salt, in ratios requested by our customers. Metal recovery salt is a combination of potash and salt that chemically enhances the recovery of aluminum in recycling processing facilities. Our brines are used primarily by the oil and gas industry to support well development and completion activities.
33
ITEM 3. | LEGAL PROCEEDINGS |
In February 2015, Mosaic Potash Carlsbad Inc. (“Mosaic”) filed a complaint and application for preliminary injunction and permanent injunction against Steve Gamble and us in the Fifth Judicial District Court for the County of Eddy in the State of New Mexico. Mr. Gamble is a former employee of Intrepid and Mosaic. In August 2015, the court denied Mosaic’s application for preliminary injunction. In July 2016, Mosaic filed a second complaint against Mr. Gamble and us in U.S. District Court for the District of New Mexico. In January 2018, the two lawsuits were consolidated into one lawsuit pending in the U.S. District Court for the District of New Mexico. Mosaic alleges against us violations of the New Mexico Uniform Trade Secrets Act, tortious interference with contract relating to Mr. Gamble’s separation of employment from Mosaic, violations of the Computer Fraud and Abuse Act, conversion, and civil conspiracy relating to the alleged misappropriation of Mosaic’s confidential information and related actions. Mosaic seeks $23 million to $28 million in compensatory damages, $28 million to $37 million in exemplary damages, and attorneys' fees, punitive damages, injunctive relief, and future royalty damages in unspecified amounts. A settlement conference is scheduled for March 25, 2020 and a trial date has been set for April 27, 2020 through May 8, 2020. The lawsuit has progressed through discovery with many pending motions and additions concerning both the facts and confidentiality procedures concerning trade secrets. We believe that we have defenses against the claims asserted and we are vigorously defending against the lawsuit.
In February 2019, Pecos Valley Artesian Conservancy District, Carlsbad Irrigation District, and Otis Mutual Domestic Water Consumers & Sewage Works Association (together, the "Protestants") filed an expedited inter se proceeding against us, Henry McDonald, Select Energy Services, LLC d/b/a Gregory Rockhouse Ranch, and Vision Resources, Inc. in the Fifth Judicial District Court for the County of Chaves in the State of New Mexico. This court serves as the adjudication court for the Pecos Stream System, which includes the Pecos River. The Protestants challenge the validity of our Pecos River water rights, representing approximately 20,000 acre feet per year. In August 2019, the parties stipulated to the jurisdiction of the adjudication court. To promote settlement, the adjudication court established a settlement schedule and ordered a trial date in August 2020 if the parties have not reached a settlement by that time. We are currently allowed to sell water associated with 5,700 acre feet per year of these water rights under preliminary authorizations issued in 2017 and 2018 by the New Mexico Office of the State Engineer ("OSE"). The preliminary authorizations allowed for water sales to begin immediately, subject to repayment if the underlying water rights are ultimately found to be invalid. Separate from the adjudication proceeding, the Protestants have protested these preliminary authorizations before the OSE. Although the OSE is required to hold a hearing relating to the protests, it has temporarily stayed the hearing process until the agreed-upon adjudication process is complete. In the adjudication proceeding, the court is expected to make a determination as to the size of our Pecos River water rights. In February 2020, the Protestants filed a Writ of Mandamus against the OSE concerning these permits despite the agreed stipulation to jurisdiction of the adjudication court. A hearing regarding this Writ will be heard in early March 2020. In addition, the Protestants are asking for unspecified monetary and injunctive relief, as well as attorneys' fees and costs, relating to our sale of water under these water rights and breach of contract claims. We believe that our legal position with respect to the validity of our water rights is solid, and we are vigorously defending against this matter.
We are subject to other claims and legal actions in the ordinary course of business. While there are uncertainties in predicting the outcome of any claim or legal action, we believe that the ultimate resolution of these other claims or actions is not reasonably likely to have a material adverse effect on our financial condition, results of operations, or cash flows.
ITEM 4. | MINE SAFETY DISCLOSURES |
We are committed to providing a safe and healthy work environment. The objectives of our safety programs are to eliminate workplace accidents and incidents, preserve employee health, and comply with all safety- and health-based regulations. We seek to achieve these objectives by training employees in safe work practices; establishing, following, and improving safety standards; involving employees in safety processes; openly communicating with employees about safety matters; and recording, reporting, and investigating accidents, incidents, and losses to avoid recurrence. As part of our ongoing safety programs, we collaborate with MSHA and the New Mexico Bureau of Mine Safety to identify and implement accident prevention techniques and practices.
Our East, West, and North facilities in New Mexico are subject to regulation by MSHA under the Federal Mine Safety and Health Act of 1977 and the New Mexico Bureau of Mine Safety. MSHA inspects these facilities on a regular basis and issues various citations and orders when it believes a violation has occurred under federal law. Exhibit 95.1 to this Annual Report on Form 10-K provides the information concerning mine safety violations and other regulatory matters required by SEC rules. Our Utah and HB facilities are subject to regulation by OSHA and, therefore, are not required to be included in the information provided in Exhibit 95.1.
34
PART II
ITEM 5. | MARKET FOR REGISTRANT'S COMMON EQUITY, RELATED STOCKHOLDER MATTERS AND ISSUER PURCHASES OF EQUITY SECURITIES |
Market Information
Our common stock is traded on the NYSE under the symbol "IPI". As of February 25, 2020, we had 67 record holders of our common stock based upon information provided by our transfer agent.
Performance Graph—Comparison of Cumulative Return
The graph below compares the cumulative total stockholder return on our common stock with the cumulative total stockholder return on the S&P 500 Index, the Dow Jones U.S. Basic Materials Index, and a peer group for the period beginning on December 31, 2014, through December 31, 2019, assuming an initial investment of $100 and the reinvestment of dividends. The peer group consisted of Potash Corporation of Saskatchewan Inc., The Mosaic Company, Compass Minerals International, Inc., and Agrium Inc. for the period beginning on December 31, 2014, through December 31, 2017, and The Mosaic Company, Compass Minerals International, Inc., and Nutrien Ltd. from January 1, 2018, through December 31, 2019. On January 1, 2018, Potash Corporation of Saskatchewan Inc. and Agrium Inc. merged to form Nutrien Ltd.
IPI | Peer Group | S&P 500 | Dow Jones U.S. Basic Materials | ||||||||||||
December 31, 2014 | $ | 100.00 | $ | 100.00 | $ | 100.00 | $ | 100.00 | |||||||
December 31, 2015 | $ | 21.25 | $ | 70.19 | $ | 99.33 | $ | 87.57 | |||||||
December 31, 2016 | $ | 14.99 | $ | 81.94 | $ | 119.24 | $ | 105.32 | |||||||
December 31, 2017 | $ | 34.29 | $ | 91.30 | $ | 150.73 | $ | 131.75 | |||||||
December 31, 2018 | $ | 18.73 | $ | 83.75 | $ | 147.24 | $ | 110.44 | |||||||
December 31, 2019 | $ | 18.80 | $ | 81.81 | $ | 180.47 | $ | 132.26 | |||||||
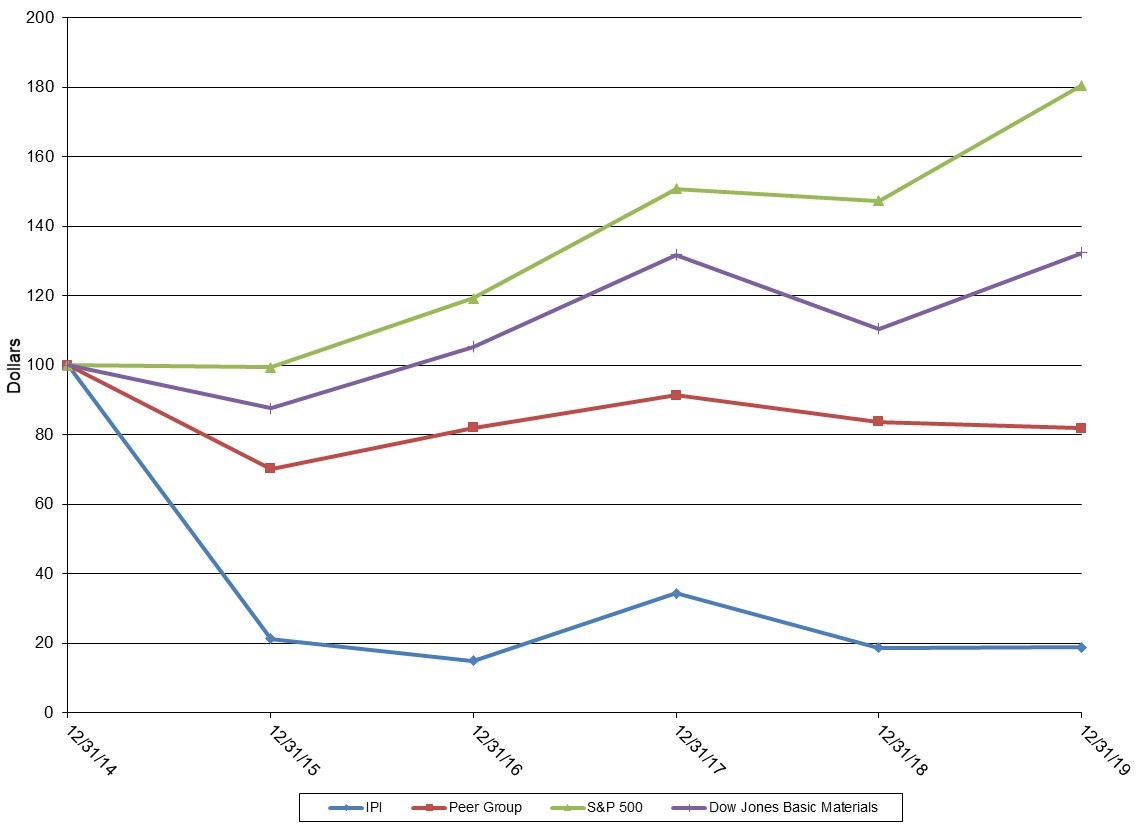
35
Dividends
We currently intend to retain earnings to reinvest for future operations and growth of our business and do not anticipate paying any cash dividends on our common stock. However, our board of directors, in its discretion, may decide to declare a dividend at an appropriate time in the future, subject to the terms of our debt agreements. A decision to pay a dividend would depend upon, among other factors, our results of operations, financial condition, and cash requirements and the terms of our debt agreements at the time a payment is considered.
Purchases of Equity Securities by the Issuer
Issuer Purchases of Equity Securities | ||||||||
Period | (a) Total Number of Shares Purchased1 | (b) Average Price Paid Per Share | (c) Total Number of Shares Purchased as Part of Publicly Announced Plans or Programs | (d) Maximum Number (or Approximate Dollar Value) of Shares that May Yet Be Purchased Under the Plan or Programs | ||||
October 1, 2019, through October 31, 2019 | – | — | – | N/A | ||||
November 1, 2019, through November 30, 2019 | 103,614 | $2.53 | – | N/A | ||||
December 1, 2019, through December 31, 2019 | — | — | – | N/A | ||||
Total | 103,614 | $2.53 | — | N/A | ||||
1 Represents shares of common stock withheld by us as payment of withholding taxes due upon the vesting of restricted stock held by our employees.
36
ITEM 6. | SELECTED FINANCIAL DATA |
The following table sets forth our historical selected financial data for the periods indicated (in thousands, except per share data). The selected financial data should be read together with the other information contained in this document, including "Item 7. Management's Discussion and Analysis of Financial Condition and Results of Operations" and the audited historical financial statements and notes in "Item 8. Financial Statements and Supplemental Data."
Year Ended December 31, | ||||||||||||||||||||
2019 | 2018 | 2017 | 2016 | 2015 | ||||||||||||||||
Sales | $ | 220,075 | $ | 208,270 | $ | 177,915 | $ | 212,097 | $ | 287,183 | ||||||||||
Net income (loss) | $ | 13,631 | $ | 11,783 | $ | (22,567 | ) | $ | (64,183 | ) | $ | (524,776 | ) | |||||||
Basic earnings (loss) per share: | $ | 0.11 | $ | 0.09 | $ | (0.20 | ) | $ | (0.85 | ) | $ | (6.94 | ) | |||||||
Diluted (loss) earnings per share: | $ | 0.10 | $ | 0.09 | $ | (0.20 | ) | $ | (0.85 | ) | $ | (6.94 | ) | |||||||
December 31, | ||||||||||||||||||||
2019 | 2018 | 2017 | 2016 | 2015 | ||||||||||||||||
Total assets | $ | 578,439 | $ | 525,231 | $ | 510,592 | $ | 537,551 | $ | 639,969 | ||||||||||
Long-term debt, net | $ | 29,753 | $ | 49,642 | $ | 49,437 | $ | 133,434 | $ | 149,485 | ||||||||||
December 31, | ||||||||||||||||||||
2019 | 2018 | 2017 | 2016 | 2015 | ||||||||||||||||
Cash, cash equivalents, and investments | $ | 20,603 | $ | 33,222 | $ | 1,068 | $ | 4,464 | $ | 63,629 | ||||||||||
Stockholders' equity | $ | 434,656 | $ | 417,263 | $ | 402,090 | $ | 362,567 | $ | 426,526 | ||||||||||
We adopted Accounting Standards Codification ("ASC") Topic 606 Revenue from Contracts with Customers ("ASC 606") on January 1, 2018. As a result, certain amounts reported for 2017 and 2016 have be recast due to the transition method applied.
37
ITEM 7. | MANAGEMENT'S DISCUSSION AND ANALYSIS OF FINANCIAL CONDITION |
AND RESULTS OF OPERATIONS
This Management Discussion and Analysis should be read in conjunction with the accompanying consolidated financial statements and related notes contained elsewhere in this Annual Report on Form 10-K.
This Management Discussion and Analysis contains forward‑looking statements that involve risks, uncertainties, and assumptions as described under the heading "Cautionary Note Regarding Forward‑Looking Statements," in Part I of this Annual Report on Form 10-K. Our actual results could differ materially from those anticipated by these forward‑looking statements as a result of many factors, including those discussed under "Item 1A. Risk Factors" and elsewhere in this Annual Report on Form 10-K.
Overview
We are a diversified mineral company that delivers potassium, magnesium, sulfur, salt, and water products essential for customer success in agriculture, animal feed and the oil and gas industry. We are the only U.S. producer of muriate of potash (sometimes referred to as potassium chloride or potash), which is applied as an essential nutrient for healthy crop development, utilized in several industrial applications, and used as an ingredient in animal feed. In addition, we produce a specialty fertilizer, Trio®, which delivers three key nutrients, potassium, magnesium, and sulfate, in a single particle. We also provide water, magnesium chloride, brine and various oilfield products and services.
Our extraction and production operations are conducted entirely in the continental United States. We produce potash from three solution mining facilities: our HB solution mine in Carlsbad, New Mexico, our solution mine in Moab, Utah and our brine recovery mine in Wendover, Utah. We also operate our North compaction facility in Carlsbad, New Mexico, which compacts and granulates product from the HB mine. We produce Trio® from our conventional underground East mine in Carlsbad, New Mexico. Until mid-2016, we also produced potash from our East and West mines in Carlsbad, New Mexico. In April 2016, we converted our East facility from a mixed-ore facility that produced both potash and Trio® to a Trio®‑only facility. In addition, in early July 2016, we idled mining operations at our West facility and transitioned the facility into care and maintenance. These changes were designed to increase our production of Trio®, a product that had traditionally shown more resilience to pricing pressure than potash, and to lower costs in a time of declining potash prices.
We have water rights in New Mexico under which we sell water primarily to support oil and gas development in the Permian Basin near our Carlsbad facilities. We continue to work to expand our sales of water. In May 2019, we acquired certain land, water rights, and other related assets from Dinwiddie Cattle Company. We refer to these assets and operations as "Intrepid South." The purchase price was $53 million, and we incurred $3.2 million in acquisition-related fees. We are required to pay Dinwiddie Cattle Company an additional $12 million pending the resolution by Dinwiddie Cattle Company or others by May 1, 2020, of certain issues identified in the diligence process. Dinwiddie Cattle Company also reserved a 20-year, 10% royalty, proportionally reduced as to our interest, on certain produced water disposal revenue relating to Intrepid South and certain other properties located near Intrepid South.
We have three segments: potash, Trio®, and oilfield solutions. We account for the sale of byproducts as revenue in the potash or Trio® segment based on which segment generated the byproduct. For each of the years ended December 31, 2019, 2018, and 2017, a majority of our byproduct sales were accounted for in the potash segment.
Significant Business Trends and Activities
Our financial results have been, or are expected to be, impacted by several significant trends and activities, which are described below. We expect these trends to continue to impact our results of operations, cash flows, and financial position.
• | Potash pricing and demand. Potash remained a significant driver of our profitability, comprising 47% of our total sales in 2019. Our average net realized sales price for potash increased in 2019 to $284 per ton compared to $256 per ton for 2018 due to price increases late in 2018 that we realized in 2019. |
After the spring season, our competitors announced a summer fill program, reducing prices by $45 per ton. Proposed price increases after summer fill did not materialize and we continued to sell at summer pricing levels during the second half of 2019. Despite production curtailments of over four million tons by competitors in the second half of 2019, significant inventories remained available in early 2020. In response to these above average inventories, our competitors announced a winter fill pricing program in January 2020, reducing potash price by an additional $25 per ton. Customers had until January 22 to place orders for delivery through the end of the first quarter. Price levels increased by $20 after the order window. We expect good subscription under the program and expect to achieve higher pricing midway through the second quarter.
Similar to prior years, global effective capacity continues to exceed demand and larger producers have worked to balance stabilize the market through production curtailments. Domestic pricing of our potash is influenced principally
38
by the price established by our competitors. The interaction of global potash supply and demand, ocean, land, and barge freight rates, and currency fluctuations also influence pricing.
• | Trio® pricing and demand. Wet weather in parts of the United States resulted in below-average application during the first half of 2019 leading to a summer-fill program that reduced domestic Trio® pricing by $35 to $50 per ton depending on product grade. This program erased the domestic pricing increases we achieved in 2018. Two subsequent attempts to increase Trio® pricing, after the summer-fill window and again after the October-fill window, failed to gain traction with buyers and we continued to transact near summer-fill pricing levels in the fourth quarter of 2019. |
Shortly after the winter-fill price announcement for potash in January 2020, a competitor announced a new pricing program which reduced delivered pricing for langbeinite to the price offered during the October-fill window. This price was in effect for orders placed in January and delivered by the end of the first quarter of 2020. After the delivery window, our competitor's list price increased by $10 per ton. We matched this pricing, effectively maintaining summer-fill pricing for tons delivered in the first quarter of 2020. We expect to achieve the increased price midway through the second quarter, but this could be affected by, among other things, weather, planting decisions, rail car availability, and the price and availability of other potassium products.
Overall average net realized sales price per ton for Trio® will continue be impacted by the percentage of international sales. Internationally, competition from lower cost alternatives and freight costs continue to negatively impact our average net realized sales price per ton. We continued, and plan to continue, our efforts to implement a price-over-volume strategy by focusing on international markets where we obtain the highest average net realized sales price per ton and thus the highest margin.
We experience seasonality in domestic Trio® demand, with more purchases coming in the first and second quarters in advance of the spring application season in the U.S. In turn, we generally have increased inventory levels in the third and fourth quarters in anticipation of expected demand for the following year. We continue to operate our facilities at production levels that approximate expected demand and allow us to manage inventory levels.
• | Water sales. Water sales increased in 2019 to $25.7 million, compared to $19.8 million in 2018, primarily due to the acquisition of Intrepid South and associated water rights in May 2019. Demand for water has been increasing due to increasing oil and gas activities in the Permian Basin near our facilities in New Mexico. We have put in place a diverse set of arrangements aimed at generating a long-term recurring revenue stream from water sales. We have contracts with various water customers from which we expect revenue of between $32 million to $45 million in 2020. |
Water rights in New Mexico are subject to a stated purpose and place of use, and many of our water rights were originally issued for uses relating to our mining operations. To sell water under these rights for oil and gas development, we must apply for a permit from the New Mexico Office of the State Engineer ("OSE") to change the purpose or place of use of the underlying water rights. The OSE reviews and makes a determination as to the validity of the right and if it determines the requested change will not negatively impact other valid interests, the OSE can issue a preliminary authorization for the change. The preliminary authorization allows for water sales to begin immediately, subject to repayment if the underlying water rights are ultimately found to be invalid. Third parties may protest the preliminary authorization at minimal cost and frequently do so. Once protested, the OSE is required to hold a hearing to determine if the preliminary authorization was appropriate. A significant amount of our water sales are being made under preliminary authorizations issued by the OSE. Third parties have protested these preliminary authorizations. In February 2019, certain protestants filed an expedited inter se proceeding in New Mexico District Court as the adjudication court for the Pecos Stream System challenging the validity of our water rights relating to the Pecos River. In August 2019, the parties stipulated to the jurisdiction of the adjudication court. To promote settlement, the adjudication court established a settlement schedule and ordered a trial date in August 2020 if the parties have not reached a settlement by that time. The OSE has temporarily stayed the hearing process until the adjudication process is complete. We continue to operate under the preliminary authorizations until the adjudication and hearing processes are complete. We may face political and regulatory issues relating to the potential use of the maximum amount of our rights. However, we believe that our legal position with respect to the validity of our water rights is solid and that we will be able to meet our water commitments. You can find more information about the adjudication and hearing processes in Note 15 to our consolidated financial statements.
• | Byproduct sales. Byproduct sales increased to $26.5 million in 2019 compared to $19.3 million in 2018. This increase was primarily due to increased water and brine sales in support of well development and completion activities in the Permian Basin. We also increased sales of salt during 2019, capitalizing on reduced availability in certain parts of the country. Record wet weather in the summer of 2019 in Wendover limited our production of magnesium chloride and is expected to limit product available for sale until the summer of 2020. While the market for magnesium chloride is |
39
somewhat weather dependent, we believe the overall demand for this product remains strong and we expect to return to average production and sales rates in the second half of 2020.
• | Weather impact. Evaporation rates in 2019 were below average across our facilities which will reduce production in the spring of 2020 when compared to the prior year. Above average rainfall at our Wendover facility also decreased our magnesium chloride production in 2019 and we expect to have limited volumes of magnesium chloride available for sale until the evaporation season begins in 2020. |
• | Diversification of products and services. We continued to diversify our products and services in 2019, particularly with the acquisition of Intrepid South in May 2019. In addition to water sales, Intrepid South also generates revenue from right-of-way agreements, surface damages and easements, caliche sales, and a produced water royalty. These sales generated revenue of $3.7 million in 2019 and incur either minimal or no operating expense. We are in the process of adding a brine station at Intrepid South and are currently developing a produced water facility with a partner near Intrepid South. As we continue to diversify our portfolio, we may enter into new or complementary business that expand our product and service offerings beyond our existing assets or products through acquisition of companies or assets or otherwise. Additionally, we may expand into oil and natural gas exploration and production or into new products or services in our current industry or other industries. |
40
Consolidated Results
(in thousands) | Year Ended December 31, | |||||||||||
2019 | 2018 | 2017 | ||||||||||
Sales1 | $ | 220,075 | $ | 208,270 | $ | 177,915 | ||||||
Cost of Goods Sold | $ | 126,110 | $ | 121,955 | $ | 117,962 | ||||||
Gross Margin | $ | 43,478 | $ | 38,271 | $ | 11,888 | ||||||
Net Income (Loss) | $ | 13,631 | $ | 11,783 | $ | (22,567 | ) | |||||
Average Net Realized Sales Price per Ton2 | ||||||||||||
Potash | $ | 284 | $ | 256 | $ | 238 | ||||||
Trio® | $ | 195 | $ | 199 | $ | 191 | ||||||
1Sales include sales of byproducts which were $26.5 million, $19.3 million and $12.7 million for the years ended December 31, 2019, 2018, and 2017, respectively.
2Average net realized sales price per ton is a non-GAAP measure. More information about this non-GAAP measure is below under the heading "Non-GAAP Financial Measure."
Consolidated Results for the Years Ended December 31, 2019, and 2018
Our total sales increased $11.8 million, or 6% in 2019, compared to 2018, as a $7.2 million increase in byproduct sales, a $3.3 million increase in water sales, excluding byproduct water sales, and a $4.8 million increase in sales from other sources, was partly offset by a $3.0 million decrease in potash sales. Our water sales, excluding byproducts, increased 21% primarily due to increased water sales from the additional water rights we acquired with Intrepid South in May 2019 and continued strong demand from oil and gas operators near our properties. Sales from other revenue sources, which include high-speed mixing, right-of-way agreements, surface damages and easements, caliche sales, and a produced water royalty, increased as we completed additional mixing jobs in 2019, and due to the acquisition of Intrepid South in May 2019. Potash sales volumes decreased 12% in 2019, compared to 2018, due to wet weather during the spring application season and reduced sales in the fourth quarter of 2019, as a result of a delayed harvest and an expectation of reduced pricing entering the 2020 spring season. The decrease in potash tons sold was partially offset by an 11% increase in the average net realized sales price per ton in 2019, compared to 2018, as potash prices benefited from price increases late in 2018, that we captured during the first half of 2019.
Our total sales of byproducts derived from potash and Trio® production increased $7.2 million, or 38% in 2019, compared to 2018. The increase in byproducts sales was primarily driven by a $5.9 million increase in salt sales. In 2019, we sold 40% more tons of salt and the delivered price per ton was higher due to increased freight costs included in the delivered price. Like our potash and Trio® sales, our salt sales revenue includes the freight costs to deliver the product to the customer. Freight expense included in the delivered salt price increased in 2019, compared to the same period in 2018, as we expanded the geographic footprint of our salt customers. Our byproduct water sales increased $2.5 million in 2019, compared to 2018, due to the ongoing oil and gas activities in the northern Delaware Basin near our facilities. The increases in salt and by product water sales were partially offset by a $1.9 million decrease in magnesium chloride sales. Wet weather in Wendover reduced our production volumes, which limited the amount of product that was available for us to sell.
Cost of goods sold increased $4.2 million, or 3% in 2019, as compared to 2018, primarily due to third-party costs incurred to move water at Intrepid South, costs associated with our high-speed potassium mixing service, additional depreciation expense for the Intrepid South assets, and below-average evaporation at our potash facilities, which increased our per ton potash production costs.
Our gross margin percentage increased to 20% in 2019, compared to 18% in 2018. The increase was driven an increase in sales of higher-margin products, such as water and byproducts during 2019, compared to 2018.
Net income increased $1.8 million, or 16%, in 2019, compared to 2018, primarily driven by an increase in sales of higher-margin products, as discussed above, partly offset by an increase in selling and administrative expenses, as discussed below.
41
Selling and Administrative Expense
In 2019, selling and administrative expenses increased $3.1 million or 15% from 2018. The increase was due to a $1.6 million increase in legal expenses associated with outstanding litigation and various water protests, a $0.5 million change in bad debt expense, and a $0.4 million increase in labor expense. During 2018, we received payments on an account that had a full bad debt allowance against it. Those payments reduced our bad debt allowance, with a corresponding decrease to bad debt expense. Please see Item 3, "Legal Proceedings," contained in this Annual Report on Form 10-K, for further information on outstanding litigation.
Other Operating Expense
In 2019, we recognized other operating expense of $1.2 million compared to $0.1 million in 2018. In 2019, we recorded a $0.3 million expense related to the disposal of an asset, a $0.3 million expense due to timing of remediation work, and a $0.2 million expense related to a product recall.
Interest Expense
Interest expense decreased $0.8 million in 2019 compared to 2018, primarily due to a decrease in outstanding borrowings on our senior notes.
Consolidated Results for the Years Ended December 31, 2018, and 2017
Our total sales in 2018 increased $30.4 million, or 17%, as compared to 2017 primarily due to an increase in potash tons sold, increases in both potash and Trio® pricing, and an increase in water sales, primarily due to oil and gas drilling activity near our facilities in New Mexico. Byproduct revenue increased $6.6 million as we continue to execute on our strategy to grow sales of our byproducts.
Cost of goods sold increased $4.0 million, or 3% in 2018, as compared to 2017, primarily due to increased sales discussed above.
Our gross margin percentage increased to 18% in 2018 compared to 7% in 2017. The increase was driven the increase in average net realized sales prices for our products, coupled with an increase in sales of higher-margin products, such as fresh water and byproducts. We also recorded fewer lower of cost or NRV inventory adjustments in 2018, as the average net realized sales price per ton for potash and Trio® improved.
Net income increased $34.4 million, or 152%, in 2018 compared to 2017, primarily driven by higher gross margins, as discussed above, and the decrease in interest expense in 2018 compared to 2017, as discussed below.
Selling and Administrative Expense
In 2018, selling and administrative expenses increased $1.5 million or 8% from 2017. The increase was primarily due to an increase in our share-based compensation expense in 2018 compared to 2017. The increase in share-based compensation was due to granting awards earlier in 2018 compared to 2017, coupled with the 2018 grant vesting over a shorter time period as compared to the 2017 grant.
Other Operating Expense
In 2018, we recognized other operating expense of $0.1 million compared to $3.5 million in 2017. In 2017, we recorded a loss on a sale of an asset of $1.7 million, recorded an additional $1.1 million increase in our stores inventory allowance, and recorded a one-time $0.6 million accrual related to land impact issues on or adjacent to our property in New Mexico.
Interest Expense
Interest expense decreased $7.8 million in 2018 compared to 2017. Approximately $4.2 million of the decrease was due to our weighted-average interest rate on our senior notes declining to 4.32% in 2018 from 7.65% in 2017. Additionally, write-offs of deferred financing fees and make-whole payments related to principal prepayments on our senior notes decreased approximately $3.3 million in 2018 compared to 2017.
42
Potash Segment Results
Year Ended December 31, | ||||||||||||
(in thousands) | 2019 | 2018 | 2017 | |||||||||
Sales1 | $ | 124,648 | $ | 124,058 | $ | 107,917 | ||||||
Less: Freight costs | 18,715 | 17,682 | 13,912 | |||||||||
Warehousing and handling costs | 4,745 | 5,046 | 5,556 | |||||||||
Cost of goods sold | 73,401 | 72,322 | 72,229 | |||||||||
Lower of cost or NRV inventory adjustments | — | — | 550 | |||||||||
Gross Margin | $ | 27,787 | $ | 29,008 | $ | 15,670 | ||||||
Depreciation, Depletion, and Amortization Incurred2 | $ | 25,796 | $ | 25,134 | $ | 26,485 | ||||||
Potash Sales Volumes (tons in thousands) | 319 | 364 | 352 | |||||||||
Potash Production Volumes (tons in thousands) | 328 | 344 | 359 | |||||||||
Average Potash Net Realized Sales Price per Ton3 | $ | 284 | $ | 256 | $ | 238 | ||||||
1Potash segment sales include byproduct sales which were $21.2 million, $16.6 million and $12.4 million for the years ended December 31, 2019, 2018, and 2017, respectively.
2Depreciation, depletion, and amortization incurred excludes depreciation, depletion, and amortization amounts absorbed in or (relieved from) inventory.
3Average net realized sales price per ton is a non-GAAP measure. More information about this non-GAAP measure is below under the heading "Non-GAAP Financial Measure."
Potash Segment Results for the Years Ended December 31, 2019, and 2018
Our total potash segment sales in 2019 were similar to the prior year, as an increase of $4.6 million in byproduct sales was mostly offset by a $4.1 million decrease in potash sales accounted for in the potash segment, as detailed below.
Potash sales accounted for in the potash segment decreased 4% during 2019, compared to 2018. The average net sales price per ton increased 11% to $284 per potash ton sold during 2019, compared to the same period in 2018, due to higher pricing in the first half of 2019. This was offset by a 12% decrease in potash tons sold as a delayed harvest and an expectation of flat or declining potash prices entering the 2020 spring season limited purchases in the fourth quarter of 2019. Our second half 2019 potash average net realized sales price per ton was also negatively impacted by a summer fill program announced in June 2019 by our competitors. Under the program, the potash list prices decreased by $45 per ton for orders placed before June 27 and scheduled for shipment during the third quarter and list prices were scheduled to increase $25 per ton after the order window closed. The increased list prices did not materialize and potash remained at the lower summer fill prices levels in the second half of 2019, which contributed to the decrease in potash sales revenue.
Total potash segment byproduct sales increased $4.6 million, or 28%, in 2019, as compared to 2018. The increase was driven by a $5.4 million increase in salt sales, a $0.7 million increase in brine sales and a $0.5 million increase in potash byproduct water sales, partially offset by a $1.9 million decrease in magnesium chloride sales. We saw increased salt sales into deicing markets due to severe weather in the 2019 winter and spring months. We also capitalized on salt supply shortages in certain parts of the United States, which expanded our sales geography compared to the prior year. As a result of this expanded geography, the delivered price per ton for salt increased as we incurred more freight to deliver salt to customers located farther from our facilities. Our byproduct water sales increased in 2019, as compared to the same period in 2018, as a higher proportion of our total water sales was from byproduct water. Wet weather in Wendover reduced our production of magnesium chloride in 2019 and we had less product available for sale.
Potash segment freight expense increased 6% in 2019, mainly driven by an increase in freight expense related to selling more tons of salt and the increased freight expense incurred to ship salt to customers located farther from our facilities as discussed above. Our freight expense is also impacted by the rates charged by carriers, geographic distribution of our products and by the proportion of customers arranging for and paying their own freight costs.
Our potash segment cost of goods sold increased 1% during 2019, as compared to 2018. Potash tons sold decreased 12%, but we experienced below average evaporation across our facilities, which contributed to higher per ton production costs. We also sold a higher percentage of potash tons from our New Mexico facility during 2019 as compared to 2018, which carry a higher average cost than potash tons produced from our Utah facilities because we incur more depreciation expense at our New Mexico facilities.
43
Our potash segment gross margin decreased $1.2 million in 2019, compared to 2018, due to the factors discussed above.
Potash Segment Results for the Years Ended December 31, 2018, and 2017
Potash sales increased in 2018 compared to 2017 due to a 3% increase in potash tons sold and an 8% increase in potash pricing as price increases announced earlier in 2018 were realized during the rest of 2018. Increased demand from the oil and gas industry drove the $4.2 million increase in our byproduct sales.
Our potash segment gross margin increased due to increased sales and pricing partially offset by increased freight costs due to increased sales volumes and an increase in freight rates. Potash freight costs also are impacted by the proportion of customers paying for their own freight, the geographic distribution of our products and the freight rates of our carriers. Potash segment sales include sales of potash and sales of byproducts, such as magnesium chloride, salt, brines, and water used in the potash production process.
Our solar facilities experienced average evaporation rates during the 2017 evaporation season, while the 2016 evaporation season was slightly above average. As a result, our potash production from our solar solution facilities for 2018 decreased slightly compared to 2017.
Potash Segment - Additional Information
The table below shows our potash sales mix for 2019, 2018, and 2017.
Year Ended December 31, | |||||||||
2019 | 2018 | 2017 | |||||||
Agricultural | 74 | % | 74 | % | 77 | % | |||
Industrial | 12 | % | 14 | % | 10 | % | |||
Feed | 14 | % | 12 | % | 13 | % | |||
Historically, sales into the industrial and feed markets have carried a higher average net realized sales price per ton compared to sales into the agricultural market. As a result, we continue to work to increase the percentage of potash sales into the industrial and feed markets.
Trio® Segment Results
Year Ended December 31, | ||||||||||||
(in thousands) | 2019 | 2018 | 2017 | |||||||||
Sales1 | $ | 69,551 | $ | 66,808 | $ | 63,686 | ||||||
Less: Freight costs | 20,514 | 19,370 | 18,104 | |||||||||
Warehousing and handling costs | 3,876 | 4,225 | 4,114 | |||||||||
Cost of goods sold | 42,251 | 45,284 | 45,187 | |||||||||
Lower of cost or NRV inventory adjustments | 1,810 | 1,711 | 5,829 | |||||||||
Gross (Deficit) Margin | $ | 1,100 | $ | (3,782 | ) | $ | (9,548 | ) | ||||
Depreciation, Depletion, and Amortization incurred2 | $ | 6,163 | $ | 6,343 | $ | 6,576 | ||||||
Sales Volumes (tons in thousands) | 225 | 225 | 237 | |||||||||
Production Volumes (tons in thousands) | 228 | 217 | 243 | |||||||||
Average Net Realized Sales Price per Ton3 | $ | 195 | $ | 199 | $ | 191 | ||||||
44
1Trio® segment sales include byproduct sales which were $5.3 million, $2.7 million and $0.3 million for the years ended December 31, 2019, 2018, and 2017, respectively.
2Depreciation, depletion, and amortization incurred excludes depreciation, depletion, and amortization amounts absorbed in or (relieved from) inventory.
3Average net realized sales price per ton is a non-GAAP measure. More information about this non-GAAP measure is below under the heading "Non-GAAP Financial Measure."
Trio® Segment Results for the Years Ended December 31, 2019, and 2018
Trio® segment sales include sales of Trio® and sales of byproducts that are generated or used in the Trio® production process. Trio® segment sales increased 4% in 2019, as compared to 2018. The increase in sales was driven by a $2.6 million increase in Trio® byproduct sales during 2019.
Trio® sales for 2019, increased $0.2 million as compared to 2018, as Trio® tons sold and Trio® average net realized sales price per ton during 2019 were essentially flat compared to 2018. Trio® tons sold domestically decreased 9% in 2019, as compared to 2018. Domestic tons of Trio® sold were negatively impacted by wet spring weather in parts of the U.S. during 2019. Additionally, Trio® domestic sales during the fourth quarter of 2019, as compared to 2018, were also negatively impacted by uncertainty in fertilizer pricing and buyers were reluctant to purchase Trio® believing prices would decline. The decrease in domestic tons of Trio® sold were offset by an increase in international tons sold. As we sold more Trio® tons internationally during 2019 compared to 2018, our Trio® average net realized sales price was negatively impacted due to higher freight costs incurred to ship product internationally.
Trio® byproducts sales increased $2.6 million during 2019, as compared to the same period in 2018 driven by a $2.1 million increase in Trio® byproduct water sales and a $0.5 million increase in Trio® segment salt sales. A higher proportion of our total water sales during 2019, as compared to the same period in 2018, was from Trio® byproduct water. Trio® byproduct salt sales increased due to offering a new road salt product from our Trio® facility in 2019.
Trio® freight costs increased 6% in 2019, compared to 2018, as we sold more tons internationally in 2019. Our freight expense is impacted by the geographic distribution of our Trio® sales and by the proportion of customers arranging for and paying their own freight costs.
Our Trio® cost of goods sold decreased 7%, compared to 2018, due mainly to a slight increase in Trio® tons sold and lower per ton production costs. During 2019, we produced 5% more tons of Trio® which lowered our per ton production costs as discussed below.
Our Trio® production tons increased by 5% in 2019, compared to the same period in 2018, primarily due to increased conversion of work-in-progress inventory into premium Trio®. Most of our production costs are fixed and an increase in production tons lowers our per ton cost of Trio®.
Our Trio® segment generated gross margin of $1.1 million in 2019, compared to a gross deficit of $3.8 million in 2018. The improvement to gross margin in 2019 was due to the factors discussed above.
Trio® Segment Results for the Years Ended December 31, 2018, and 2017
Trio® sales increased $0.8 million, or 1%, in 2018 compared to 2017. The average net realized sales price per ton increased 5% but was almost entirely offset by a similar decrease in Trio® tons sold. Our percentage of domestic tons of Trio® sold to total tons of Trio® sold was higher in 2018 compared to 2017, which had a positive impact on our average net realized sales price per ton. Internationally during 2018, we focused on a price over volume strategy. International sales of Trio® continue to be negatively affected by competition from lower-cost alternatives and higher freight costs to ship to international locations.
Trio® segment gross deficit improved in 2018 compared to 2017, primarily due to a reduction in lower of cost or NRV inventory adjustments and increased sales of byproducts generated from the Trio® production process.
Sales of byproducts increased $2.4 million in 2018 compared to 2017. The increase was driven by an increase in sales of water that was used in the Trio® production process. With the significant oil and gas drilling activities in areas near our facilities in New Mexico, demand for water was strong.
Trio® production decreased 11% in 2018 compared to 2017 as we curtailed production in the second half of 2017 to manage our product inventory levels.
45
Trio® Segment - Additional Information
The table below shows the percentage of total Trio® sales that were sold internationally in the past three years.
United States | Export | |||||
For the year ended December 31, 2019 | 74 | % | 26 | % | ||
For the year ended December 31, 2018 | 81 | % | 19 | % | ||
For the year ended December 31, 2017 | 72 | % | 28 | % | ||
Oilfield Solutions Segment Results
Year Ended December 31, | ||||||||||||
(in thousands) | 2019 | 2018 | 2017 | |||||||||
Sales | $ | 27,894 | $ | 17,404 | $ | 6,312 | ||||||
Less: Warehouse and handling | — | 10 | — | |||||||||
Cost of goods sold | 12,367 | 4,349 | 546 | |||||||||
Gross Margin | $ | 14,591 | $ | 13,045 | $ | 5,766 | ||||||
Depreciation, Depletion, and Amortization incurred | $ | 1,566 | $ | 343 | $ | 19 | ||||||
Oilfield Solutions Segment Results for the Years Ended December 31, 2019, and 2018
Our oilfield solutions segment sales increased 60% in 2019, compared to 2018, as we continued to see strong demand for water and other oilfield related products and services. Segment water sales increased primarily due to the acquisition of Intrepid South in May 2019, which increased our total water rights available for sale. Intrepid South also generated sales from right-of-way agreements, surface damages and easements, caliche sales, and a produced water royalty. These other sales totaled $3.7 million in 2019.
Cost of goods sold increased $8.0 million in 2019, compared to 2018, due to third-party costs to move water on Intrepid South, increased sales of potassium chloride used in our high-speed mixing service, and depreciation and amortization expenses for the Intrepid South assets acquired in May 2019.
Gross margin increased $1.5 million, or 12%, compared to 2018, due to the factors described above.
Oilfield Solutions Segment Results for the Years Ended December 31, 2018, and 2017
Sales increased 176% in 2018, compared to 2017, due to increased water sales into oil and gas markets. During 2018, we also generated sales from high-speed potassium chloride mixing services, trucking services, and other oilfield related products. In 2017, our only source of revenue in the oilfield solutions segment was from sales of water.
Cost of goods sold increased in 2018 compared to 2017 due to the costs relating to our new service offerings in 2018 and costs related to the increased sales of water. We continued to generate strong gross margins in the oilfield solutions segment, mainly due to the high demand for water and the relatively low costs associated with selling water from our existing water rights.
Specific Factors Affecting Our Results
Sales
Our gross sales are derived from the sales of potash, Trio®, water, salt, magnesium chloride, brine water and various other products and services offered to oil and gas producers. Total sales are determined by the quantities of product we sell and the sales prices we realize. For potash, Trio® and salt, we quote prices to customers both on a delivered basis and on the basis of pick-up at our plants and warehouses. Freight costs are incurred on most of our potash, Trio® and salt sales, but some customers arrange and pay for their own freight directly. When we arrange and pay for freight, our quotes and billings are based on expected freight costs to the points of delivery. When we calculate our potash and Trio® average net realized sales price per ton, we deduct any freight costs included in sales before dividing by the number of tons sold. We believe the deduction of freight costs provides a more representative measure of our performance in the market due to variations caused by ongoing changes in the proportion of customers paying for their own freight, the geographic distribution of our products, and freight rates. Freight rates have been increasing, and if we are unable to pass the increased freight costs on to the customer, our average net realized sales price per ton is negatively affected. We manage our sales and marketing operations centrally and we work to achieve the
46
highest average net realized sales price per ton we can by evaluating the product needs of our customers and associated logistics and then determining which of our production facilities can best satisfy these needs.
The volume of product we sell is determined by demand for our products and by our production capabilities. We operate our potash and Trio® facilities at production levels that approximate expected demand and take into account current inventory levels and expect to continue to do so for the foreseeable future.
Our water sales and other products and services offered through our oilfield solutions segment are driven by demand from oil and gas exploration companies drilling in the Permian Basin. As such, demand for our water is generally stronger during a cyclical expansion of oil and gas drilling, which is currently occurring in the Permian Basin. Likewise, a cyclical contraction of oil and gas drilling may decrease demand for our water.
Cost of Goods Sold
Our cost of goods sold reflects the costs to produce our products. Many of our production costs are largely fixed and, consequently, our cost of sales per ton on a facility-by-facility basis tends to move inversely with the number of tons we produce, within the context of normal production levels. Our principal production costs include labor and employee benefits, maintenance materials, contract labor, and materials for operating or maintenance projects, natural gas, electricity, operating supplies, chemicals, depreciation and depletion, royalties, and leasing costs. There are elements of our cost structure associated with contract labor, consumable operating supplies, reagents, and royalties that are variable, which make up a smaller component of our cost base. Our costs often vary from period to period based on the fluctuation of inventory, sales, and production levels at our facilities.
Our production costs per ton are also impacted when our production levels change, due to factors such as changes in the grade of ore delivered to the plant, levels of mine development, plant operating performance, and downtime. We expect that our labor and contract labor costs in Carlsbad, New Mexico, will continue to be influenced most directly by the demand for labor in the local region where we compete for labor with another fertilizer company, companies in the oil and gas industry, and a nuclear waste processing and storage facility.
We pay royalties to federal, state, and private lessors under our mineral leases. These payments typically equal a percentage of sales (less freight) of minerals extracted and sold under the applicable lease. In some cases, federal royalties for potash are paid on a sliding scale that vary with the grade of ore extracted. Our average royalty rate was 5.0%, 4.6%, and 4.6% in 2019, 2018, and 2017, respectively.
We incur costs to transfer water from our water source to our customers' facilities. Our operating costs depend on the distance and amount of water we must transfer. For water sold from certain of our water sources, we pay the State of New Mexico $0.11 per barrel of water sold. Additionally, water rights in New Mexico are subject to a stated purpose and place of use, and many of our water rights were originally issued for uses relating to our mining operations, or in the case of the water rights at Intrepid South, for agricultural uses. To sell water commercially under these rights, we must apply for a permit from the OSE to change the purpose and/or place of use of the underlying water rights. Third parties often protest decisions made by the OSE. As we have worked to sell more water commercially, we have incurred significant legal expenses associated with defending our water rights and obtaining water permits and approvals.
Income Taxes
We are a subchapter C corporation and, therefore are subject to U.S. federal and state income taxes on our taxable income. We recognize deferred tax assets and liabilities for the tax effect of temporary differences between the financial statement and tax basis of recorded assets and liabilities at enacted tax rates in effect when the related taxes are expected to be settled or realized. We also reduce deferred tax assets by a valuation allowance if it is more likely than not that some portion or all of the deferred tax assets will not be realized. Each reporting period we analyze if any additional valuation allowance is necessary using historical and anticipated earnings amounts to determine if it is more likely than not that amounts will not be recovered. We have concluded valuation allowances of $211.6 million and $218.4 million were required as of December 31, 2019 and 2018, respectively.
The amount of valuation allowance decreased in 2019 as compared to 2018 as a result of recalculating our deferred tax assets at a lower effective tax rate due to changes in operations in the various states we conduct business as well as changes to state laws affecting state tax rates and apportionment. Our effective tax rate for the years ended December 31, 2019, 2018, and 2017 was 0.4%, 0.9%, and 11.0%, respectively. Our effective income tax rates are impacted primarily by changes in the underlying tax rates in jurisdictions in which we are subject to income tax, the need for a valuation allowance, and permanent differences between book and tax income for the period, including the benefit associated with the estimated effect of the percentage depletion deduction.
47
The effective tax rate for the years ended December 31, 2019 and 2018, respectively, differs from the U.S. federal statutory rate due to the valuation allowance.
During the year ended December 31, 2017, our effective tax rate was primarily impacted by a $115.5 million decrease to our deferred tax assets resulting from a rate change under the Tax Cuts and Jobs Act, and a net decrease to our valuation allowance of $104.7 million. We also recorded a receivable of $2.6 million related to the monetization of our alternative minimum tax carryforwards based on a carryback, and an election available to taxpayers for 2017.
During the years ended December 31, 2019, and 2018, we recognized income tax expense of $0.1 million. During the year ended December 31, 2017, we recognized an income tax benefit of $2.8 million.
The estimated statutory income tax rates that are applied to our current and deferred income tax calculations are impacted most significantly by the states in which we conduct business. Changing business conditions for normal business transactions and operations as well as changes to state tax rate and apportionment laws potentially alter our apportionment of income among the states for income tax purposes. These changes in apportionment laws result in changes in the calculation of our current and deferred income taxes, including the valuation of our deferred tax assets and liabilities. The effects of any such changes are recorded in the period of the adjustment. These adjustments can increase or decrease the net deferred tax asset on the balance sheet and impact the corresponding deferred tax benefit or deferred tax expense on the income statement.
A valuation allowance is recognized for deferred tax assets if it is more likely than not that a portion or all of the net deferred tax assets will not be realized. In making such a determination, all available positive and negative evidence is considered, including future reversals of existing taxable temporary differences, projected future taxable income, tax-planning strategies, and results of recent operations. As of December 31, 2019, we were in a cumulative three-year loss position. The cumulative three-year loss position is significant negative evidence when evaluating the realizability of our deferred tax assets, and we have concluded it is more likely than not the deferred tax assets will not be realized, and we continue to have a full valuation allowance as of December 31, 2019. However, if positive evidence trends, such as sustained profitability, were to continue then this conclusion could change. If we were to determine that we would be able to realize our deferred tax assets for which a valuation allowance has been recorded, then an adjustment would be made to the deferred tax valuation allowance which would result in a reduction to the provision for income taxes or the recording of an income tax benefit.
Liquidity and Capital Resources
Our operations have primarily been funded from cash on hand, cash generated by operations, and proceeds from debt and equity offerings. During 2019, we generated $49.4 million in cash flows from operating activities and we ended the year with $20.6 million of cash on hand, compared with cash on hand of $33.2 million at December 31, 2018. In December 2018, we repaid $10 million of the outstanding balance of our senior notes, leaving $50 million of senior notes outstanding at the end of the year. As of December 31, 2019, we had $54.2 million available to borrow under our credit facility and $19.8 million in outstanding borrowings and $1 million outstanding in a letter of credit. With the remaining availability under our credit facility and expected cash generated from operations, we believe we have sufficient liquidity to meet our obligations for the next twelve months, including the $20 million principal payment due on our senior notes in April 2020.
We continue to monitor our future sources and uses of cash and anticipate that we will adjust our capital allocation strategies when, and if, determined by our Board of Directors. We may, at any time we deem conditions favorable, attempt to improve our liquidity position by accessing debt or equity markets in accordance with our existing debt agreements. We also may raise capital in the future through the issuance of additional equity or debt securities, subject to prevailing market conditions. However, there is no assurance that we will be able to successfully raise additional capital on acceptable terms or at all.
In May 2019, we acquired certain land, water rights, and other related assets from Dinwiddie Cattle Company. We refer to these assets and operations as "Intrepid South." The purchase price was $53 million, and we incurred $3.2 million in acquisition-related fees. We are required to pay Dinwiddie Cattle Company an additional $12 million pending the resolution by Dinwiddie Cattle Company or others of certain issues identified in the diligence process. Dinwiddie Cattle Company also reserved a 20-year, 10% royalty, proportionally reduced as to our interest, on certain produced water disposal revenue relating to Intrepid South and certain other properties located near Intrepid South. We funded the purchase price from cash on hand and borrowings under our credit facility.
The following summarizes our cash flow activity for the years ended December 31, 2019, 2018, and 2017:
48
Year ended December 31, | ||||||||||||
2019 | 2018 | 2017 | ||||||||||
(In thousands) | ||||||||||||
Cash flows provided by operating activities | $ | 49,381 | $ | 64,237 | $ | 16,693 | ||||||
Cash flows used in investing activities | $ | (80,641 | ) | $ | (16,781 | ) | $ | (7,854 | ) | |||
Cash flows provided by (used in) financing activities | $ | 18,795 | $ | (15,301 | ) | $ | (15,760 | ) | ||||
Our debt agreements contain restrictions on our ability to declare and pay dividends. In general, the terms of our senior notes prohibit us from declaring and paying a dividend unless our leverage ratio is less than 3.5 to 1, our fixed charge coverage ratio after giving effect to the dividend would be greater than 1.3 to 1, and our cash on hand and availability under our credit facility after giving effect to the dividend, would not be less than $15 million. In addition, the terms of our credit facility prohibit us from declaring and paying a dividend unless availability under the credit facility after giving effect to the dividend and during a specified period before the dividend is more than $15 million. More information about how the financial ratios are calculated under our debt agreements is provided below under the heading "Senior Notes."
Operating Activities
Total cash provided by operating activities for the year ended December 31, 2019, was $49.4 million, a decrease of $14.9 million compared with the year ended December 31, 2018. The primary drivers were an increase in inventory and decrease in prepayments from customers, which are recorded as a contract liability.
Investing Activities
Total cash used in investing activities increased $63.9 million in 2019, compared to 2018, primarily related to the $56.2 million Intrepid South asset acquisition in May 2019 and the $3.1 million acquisition of a 50% undivided interest in certain land in Texas.
Financing Activities
Total cash flows used in financing activities increased $34.1 million in 2019, as compared to 2018. In 2019, we received $19.8 million of net proceeds from borrowing under our credit facility. In 2018, we made net repayments of $3.9 million on short-term borrowings under our credit facility and made a $10 million prepayment on our senior notes.
Senior Notes
Senior Notes—As of December 31, 2019, we had outstanding $50 million of senior notes (the "Notes") consisting of the following series:
• | $20 million of Senior Notes, Series A, due April 16, 2020 |
• | $15 million of Senior Notes, Series B, due April 14, 2023 |
• | $15 million of Senior Notes, Series C, due April 16, 2025 |
The agreement governing the Notes contains certain financial covenants including those discussed below:
• | We are required to maintain a minimum fixed charge coverage ratio of 1.30 to 1.0 as of the last day of each quarter, measured based on the previous four quarters. Our fixed charge coverage ratio as of December 31, 2019, was 10.4 to 1.0, therefore we were in compliance with this covenant. |
• | We are allowed a maximum leverage ratio of 3.5 to 1.0 as of the last day of each quarter, measured based on the previous four quarters. Our leverage ratio as of December 31, 2019, was 1.3 to 1.0 therefore we were in compliance with this covenant. |
Fixed charge coverage ratio and leverage ratio are calculated in accordance with the agreement governing the Notes.
For the year ended December 31, 2019, the interest rates on the Notes were 3.73% for the Series A Notes, 4.63% for the Series B Notes and 4.78% for the Series C Notes. These rates represent the lowest interest rates available under the Notes. The interest rates may adjust upward if we do not continue to meet certain financial covenants.
We have granted to the collateral agent for the noteholders a first lien on substantially all of our non-current assets and a second lien on substantially all of our current assets. We are required to offer to prepay the Notes with proceeds of dispositions of certain specified property and with the proceeds of certain equity issuances, as set forth in the agreement. The obligations under the Notes are unconditionally guaranteed by several of our subsidiaries.
We were in compliance with the applicable covenants under the agreement governing the Notes as of December 31, 2019.
49
Credit Facility
We maintain a secured revolving credit facility with Bank of Montreal. In August 2019, we amended and restated the credit facility to change it from an asset-backed facility to a cash-flow facility, to increase the amount available under the facility from $50 million to $75 million plus an additional $75 million accordion feature, and to extend the maturity date to August 1, 2024. The revolving credit facility also provides for a $7.5 million sublimit for the issuance of letters of credit. As of December 31, 2019, borrowings under the credit facility bore interest at LIBOR plus an applicable margin of 1.25% to 2.00% per annum, based on our leverage ratio. We have granted to Bank of Montreal a first lien on substantially all of our current assets and a second lien on substantially all of our non-current assets. The obligations under the credit facility are unconditionally guaranteed by several of our subsidiaries.
We occasionally borrow and repay amounts under the facility for near-term working capital needs or other purposes and may do so in the future. For the years ended December 31, 2019, and 2018, we borrowed $30.3 million and $13.5 million, respectively, and repaid $10.5 million and $17.4 million, respectively, under the facility. As of December 31, 2019, we had $19.8 million borrowings outstanding and $1.0 million in an outstanding letter of credit under the facility. As of December 31, 2018, we had no of borrowings outstanding and $1.0 million in an outstanding letter of credit under the facility. We have $54.2 million available under the facility as of December 31, 2019.
We were in compliance with the applicable covenants under the facility as of December 31, 2019.
Capital Investments
We expect to make capital investments in 2020 of $25 million to $35 million. We anticipate our 2020 operating plans and capital programs will be funded out of operating cash flows and existing cash. We may also use our revolving credit facility, to the extent available, to fund capital investments.
During 2019, we paid cash of $80.7 million to acquire property, plant, equipment, mineral properties and intangible assets. We paid $56.3 million for the Intrepid South asset acquisition, which included water rights and other intangible assets, and $3.1 million to acquire a 50% undivided interest in property in Texas. We also paid cash of $21.3 million for other capital projects, the majority of which were sustaining capital projects.
Contractual Obligations
As of December 31, 2019, we had contractual obligations totaling $148.2 million on an undiscounted basis, as indicated below. Contractual commitments shown are for the full calendar year indicated unless otherwise indicated.
Payments Due By Period | ||||||||||||||||||||||||||||
Total | 2020 | 2021 | 2022 | 2023 | 2024 | More Than 5 Years | ||||||||||||||||||||||
(In thousands) | ||||||||||||||||||||||||||||
Long-term debt | $ | 50,000 | $ | 20,000 | $ | — | $ | — | $ | 15,000 | $ | — | $ | 15,000 | ||||||||||||||
Variable rate interest obligations on long-term debt1 | 6,747 | 1,785 | 1,412 | 1,412 | 1,064 | 717 | 357 | |||||||||||||||||||||
Operating lease obligations2 | 6,629 | 2,432 | 2,116 | 1,459 | 357 | 167 | 98 | |||||||||||||||||||||
Purchase commitments3 | 6,415 | 6,415 | — | — | — | — | — | |||||||||||||||||||||
Asset retirement obligation4 | 65,565 | — | 2,147 | 3,200 | 1,375 | 3,175 | 55,668 | |||||||||||||||||||||
Minimum royalty payments5 | 12,880 | 515 | 515 | 515 | 515 | 515 | 10,305 | |||||||||||||||||||||
Total | $ | 148,236 | $ | 31,147 | $ | 6,190 | $ | 6,586 | $ | 18,311 | $ | 4,574 | $ | 81,428 | ||||||||||||||
1 | See "Senior Notes" section above for more detail on the variable rate interest associated with our long-term debt. Amounts in the table above represent interest calculated at rates in effect as of December 31, 2019. |
2 | Amounts include all operating lease payments, inclusive of sales tax, for leases for office space, railcars, and other equipment. |
3 | Purchase commitments include the approximate amount due to vendors for non-cancelable purchase commitments for materials and services. |
4 | We are obligated to reclaim and remediate lands that our operations have disturbed, but, because of the long-term nature of our reserves and facilities, we estimate that the majority of those expenditures will not be required until after 2024. Although our reclamation obligation activities are not required to begin until after we cease operations, we anticipate certain activities to occur prior to then related to reclamation of facilities that have been replaced with newly constructed assets, as well as certain shaft closure activities for shafts that are no longer in use. Commitments shown are in today's dollars and are undiscounted. |
5 | Estimated annual minimum royalties due under mineral leases, assuming approximately a 25-year life, consistent with estimated useful lives of plant assets. |
50
Off-Balance Sheet Arrangements
As of December 31, 2019, we had no material off-balance sheet arrangements aside from bonding obligations described in the Notes to the Consolidated Financial Statements in "Item 8. Financial Statements and Supplemental Data" of this Annual Report on Form 10-K.
Critical Accounting Policies and Estimates
Our discussion and analysis of our financial condition and results of operations are based upon our consolidated financial statements, which have been prepared in accordance with GAAP. The preparation of the consolidated financial statements in conformity with GAAP requires management to make estimates and assumptions that affect the amounts reported in our financial statements. Actual results could differ from our estimates and assumptions, and these differences could result in material changes to our financial statements. The following discussion presents information about our most critical accounting policies and estimates. Our significant accounting policies are further described in Note 2 to our audited consolidated financial statements included in "Item 8. Financial Statements and Supplemental Data" of this Annual Report on Form 10-K.
Revenue Recognition
We account for revenue in accordance with Accounting Standards Codification ("ASC") Topic 606 Revenue from Contracts with Customers ("ASC 606").
A performance obligation is a promise in a contract to transfer a distinct good or service to the customer and is the unit of account in ASC 606. The contract's transaction price is allocated to the performance obligations and recognized as revenue when the performance obligations are satisfied. Substantially all of our contracts are of a short-term nature and contain a single performance obligation because the sale is for one type of product and shipping and handling charges are accounted for as a fulfillment cost and are not considered to be a separate performance obligation. The performance obligation is satisfied when control of the product is transferred to the customer, which typically occurs when we ship mineral products or deliver water from our facility to the customer. We account for substantially all of our revenue from sales to customers at a single point in time.
Under ASC 606, we recognize revenue when control of the promised goods or services is transferred to customers in an amount that reflects the consideration we expect to be entitled in exchange for those goods or services.
In certain circumstances, we may sell product to customers where the sales price is variable. For such sales, we estimate the sales price we expect to realize based on the facts and circumstances for each sale, including historical experience, and recognize revenue to the extent it is probable that a subsequent change in estimate will not result in a significant revenue reversal compared to the cumulative revenue recognized under the contract.
Property, Plant, and Equipment
Property, plant, and equipment are stated at historical cost. Expenditures for property, plant, and equipment relating to new assets or improvements are capitalized, provided the expenditure extends the useful life of an asset or extends the asset's functionality. Property, plant, and equipment are depreciated under the straight-line method using estimated useful lives. No depreciation is taken on assets classified as construction in progress until the asset is placed into service. Gains or losses are recorded upon retirement, sale or disposal of assets. Maintenance and repair costs are recognized as period costs when incurred. Capitalized interest, to the extent of debt outstanding, is calculated and assigned to assets that are being constructed, drilled, or otherwise are classified as construction in progress.
Mineral Properties and Development Costs
Mineral properties and development costs, which are referred to collectively as mineral properties, include acquisition costs, the cost of drilling wells, and the cost of other development work, all of which are capitalized. Depletion of mineral properties is calculated using the units-of-production method over the estimated life of the relevant ore body. The lives of reserves used for accounting purposes are shorter than current reserve life determinations due to uncertainties inherent in long-term estimates. We have prepared these reserve life estimates and they have been reviewed and independently determined by mine consultants. Tons of potash and langbeinite in the proven and probable reserves are expressed in terms of expected finished tons of product to be realized, net of estimated losses. Market price fluctuations of potash or Trio®, as well as increased production costs or reduced recovery rates, could render proven and probable reserves containing relatively lower grades of mineralization uneconomic to exploit and might result in a reduction of reserves. In addition, the provisions of our mineral leases, including royalties payable, are subject to periodic readjustment by the state and federal government, which could affect the economics of our reserve estimates. Significant changes in the estimated reserves could have a material impact on our results of operations and financial position.
51
Inventory and Long-Term Parts Inventory
Inventory consists of product and byproduct stocks that are ready for sale; mined ore; potash in evaporation ponds, which is considered work-in-process; and parts and supplies inventory. Product and byproduct inventory cost is determined using the lower of weighted average cost or estimated net realizable value and includes direct costs, maintenance, operational overhead, depreciation, depletion, and equipment lease costs applicable to the production process. Direct costs, maintenance, and operational overhead include labor and associated benefits.
We evaluate production levels and costs to determine if any should be deemed abnormal and therefore excluded from inventory costs and expensed directly during the applicable period. The assessment of normal production levels is judgmental and unique to each period. We model normal production levels and evaluate historical ranges of production by operating plant in assessing what is deemed to be normal.
Parts inventory, including critical spares, that is not expected to be used within a period of one year is classified as non-current. Parts and supply inventory cost is determined using the lower of average acquisition cost or estimated replacement cost. Detailed reviews are performed related to the net realizable value of parts inventory, giving consideration to quality, slow-moving items, obsolescence, excessive levels, and other factors. Parts inventories that have not turned over in more than a year, excluding parts classified as critical spares, are reviewed for obsolescence and, if deemed appropriate, are included in the determination of an allowance for obsolescence.
Recoverability of Long-Lived Assets
We evaluate our long-lived assets for impairment when events or changes in circumstances indicate that the related carrying amount may not be recoverable. An impairment is considered to potentially exist if an asset group's total estimated future cash flows on an undiscounted basis are less than the carrying amount of the related asset. An impairment loss is measured and recorded based on the excess of the carrying amount of long-lived assets over its estimated fair value. Changes in significant assumptions underlying future cash flow estimates or fair values of asset groups may have a material effect on our financial position and results of operations. Sales price is a significant element of any cash flow estimate, particularly for higher cost operations. Other assumptions we estimate include, among other things, the economic life of the asset, sales volume, inflation, raw materials costs, cost of capital, tax rates, and capital spending. These assumptions do not change in isolation; therefore, it is not practicable to present the impact of changing a single assumption.
Factors we generally will consider important and which could trigger an impairment review of the carrying value of long-lived assets include the following:
• | significant underperformance relative to expected operating results or operating losses |
• | significant changes in the manner of use of assets or the strategy for our overall business |
• | the denial or delay of necessary permits or approvals that would affect the utilization of our tangible assets |
• | underutilization of our tangible assets |
• | discontinuance of certain products by us or our customers |
• | a decrease in estimated mineral reserves |
• | significant negative industry or economic trends |
Although we believe the carrying values of our long-lived assets were realizable as of the balance sheet dates, future events could cause us to conclude otherwise.
Intangible Assets
Water rights are accounted for as indefinite-lived intangible assets and are not amortized. We test indefinite-lived intangible assets for impairment at least annually on October 1, and more frequently if circumstances require. We use a qualitative assessment to determine whether it is more likely than not that the fair value of the intangible is less than its carrying value. If our qualitative assessment indicates it is more likely than not that the fair value of the intangible asset is less than its carrying value, we estimate the fair value of the intangible asset and record an impairment loss based on the excess of the carrying amount of the intangible asset over its estimated fair value. Fair value is estimated using quoted market prices, if available. If quoted market prices are not available, the estimated fair value is based on various valuation techniques, including the discounted value of estimated future cash flows. Changes in significant assumptions underlying fair value estimates may have a material effect on our financial position and results of operations.
We also have finite-lived intangible assets consisting of contractual agreements. These intangible assets are amortized over the period of estimated benefit using the straight-line method. No significant residual value is estimated for intangible assets. We estimate the useful life of intangible assets considering various factors, including, but not limited to, the expected use of the asset, the expected life of other assets the intangible asset may relate to, any legal, regulatory, contractual provisions, or relevant economic factors that may limit the use of the intangible asset. We evaluate the remaining useful lives of intangible
52
assets each reporting period to determine if a revision to the asset's remaining life is necessary. Changes in significant assumptions underlying useful lives may have a material effect on our financial position and results of operations.
We evaluate our finite-lived intangible assets for impairment when events or changes in circumstances indicate that the related carrying amount may not be recoverable. Such circumstances include, but are not limited to, (1) significant adverse changes in the manner the asset is used, or (2) significant adverse changes in legal factors or economic conditions, including adverse actions by regulatory authorities.
Asset Retirement Obligations
All of our mining properties involve certain reclamation liabilities as required by the states in which they operate or by the BLM. Reclamation costs are initially recorded as a liability associated with the asset to be reclaimed or abandoned, based on applicable inflation assumptions and discount rates. The accretion of this discounted liability is recognized as expense over the life of the related assets, and the liability is periodically adjusted to reflect changes in the estimates of the time or amount of the reclamation and abandonment costs. These asset retirement obligations are reviewed and updated at least annually with any changes in balances recorded as adjustments to the related assets and liabilities. The estimates of amounts to be spent are subject to considerable uncertainty and long timeframes. Changes in these estimates could have a material impact on our results of operations and financial position.
Planned Turnaround Maintenance
Each production operation typically shuts down periodically for planned maintenance activities. Our New Mexico operations perform maintenance activities when not operating in conjunction with their reduced production schedule. Our HB, Moab, and Wendover operations cease harvesting potash from our solar ponds during one or more summer months to maximize the evaporation season. During these summer turnarounds, annual maintenance is performed. The costs of maintenance turnarounds at our facilities are considered part of production costs and are absorbed into inventory in the period incurred.
Income Taxes
We are a subchapter C corporation and therefore are subject to U.S. federal and state income taxes. We recognize income taxes under the asset and liability method. Deferred tax assets and liabilities are recognized for the estimated future tax consequences attributable to differences between the financial statement carrying amounts of assets and liabilities and their respective tax bases. Deferred tax assets and liabilities are measured using the enacted tax rates expected to apply to taxable income in the periods in which the deferred tax liability or asset is expected to be settled or realized. We record a valuation allowance if it is deemed more likely than not that our deferred income tax assets will not be realized in full; such determinations are subject to ongoing assessment.
Stock‑Based Compensation
We account for stock‑based compensation by recording expense using the fair value of the awards at the time of grant. We have recorded compensation expense associated with the issuance of restricted common stock, performance units, and non‑qualified stock options, all of which are subject to service conditions, and in some cases, are subject to performance- or market-based conditions. Expense associated with awards that contain both a service condition and a market condition is recognized using the accelerated recognition method over the requisite service period of the award, which is generally the longest of the explicit service period or the derived service period (expected date the market condition is estimated to be achieved).
Non-GAAP Financial Measure
To supplement our consolidated financial statements, which are prepared and presented in accordance with GAAP, from time to time we use "average net realized sales price per ton," which is a non-GAAP financial measure. This non-GAAP financial measure should not be considered in isolation or as a substitute for, or superior to, the financial information prepared and presented in accordance with GAAP. In addition, because the presentation of this non-GAAP financial measure varies among companies, our presentation of this non-GAAP financial measure may not be comparable to similarly titled measures used by other companies.
We believe average net realized sales price per ton provides useful information to investors for analysis of our business. We use this non-GAAP financial measure as one of our tools in comparing period-over-period performance on a consistent basis and when planning, forecasting, and analyzing future periods. We believe this non-GAAP financial measure is used by professional research analysts and others in the valuation, comparison, and investment recommendations of companies in the potash mining industry. Many investors use the published research reports of these professional research analysts and others in making investment decisions.
53
We calculate average net realized sales price per ton for each of potash and Trio®. Average net realized sales price per ton for potash is calculated as potash segment sales less potash segment byproduct sales and potash freight costs and then dividing that difference by the number of tons of potash sold in the period. Likewise, average net realized sales price per ton for Trio® is calculated as Trio® segment sales less Trio® segment byproduct sales and Trio® freight costs and then dividing that difference by Trio® tons sold. We consider average net realized sales price per ton to be useful, and believe it to be useful for investors, because it shows our potash and Trio® average per-ton pricing without the effect of certain transportation and delivery costs. When we arrange transportation and delivery for a customer, we include in revenue and in freight costs the costs associated with transportation and delivery. However, some of our customers arrange for and pay their own transportation and delivery costs, in which case these costs are not included in our revenue and freight costs. We use average net realized sales price per ton as a key performance indicator to analyze potash and Trio® sales and price trends.
Below is a reconciliation of average net realized sales price per ton for potash and Trio® and to the most directly comparable GAAP measure for the years ended December 31, 2019, 2018, and 2017 (in thousands, except per ton amounts):
Potash Segment | ||||||||||||
2019 | 2018 | 2017 | ||||||||||
Total Segment Sales | $ | 124,648 | $ | 124,058 | $ | 107,917 | ||||||
Less: Segment byproduct sales | 21,245 | 16,586 | 12,377 | |||||||||
Potash freight costs | 12,936 | 14,194 | 11,818 | |||||||||
Subtotal | $ | 90,467 | $ | 93,278 | $ | 83,722 | ||||||
Divided by: | ||||||||||||
Potash tons sold (in thousands) | 319 | 364 | 352 | |||||||||
Average net realized sales price per ton | $ | 284 | $ | 256 | $ | 238 | ||||||
Trio® Segment | ||||||||||||
2019 | 2018 | 2017 | ||||||||||
Total Segment Sales | $ | 69,551 | $ | 66,808 | $ | 63,686 | ||||||
Less: Segment byproduct sales | 5,252 | 2,669 | 348 | |||||||||
Trio® freight costs | 20,514 | 19,367 | 18,104 | |||||||||
Subtotal | $ | 43,785 | $ | 44,772 | $ | 45,234 | ||||||
Divided by: | ||||||||||||
Trio® Tons sold (in thousands) | 225 | 225 | 237 | |||||||||
Average net realized sales price per ton | $ | 195 | $ | 199 | $ | 191 | ||||||
ITEM 7A. | QUANTITATIVE AND QUALITATIVE DISCLOSURES ABOUT MARKET RISK |
Our operations may be impacted by commodity prices, geographic concentration, changes in interest rates, and foreign currency exchange rates.
Commodity Prices
Potash, Trio®, and water are commodities but are not traded on any commodity exchange. As such, direct hedging of future prices cannot be undertaken. For potash and Trio®, we generally do not enter into long-term sales contracts for these products, so prices vary for each particular transaction depending on the market into which we are selling and the individual bids that we receive. For water sales, we have entered into a diverse set of long-term agreements, where the price per barrel of water is fixed. Generally, these agreements allow for the parties to periodically review and adjust the price per barrel of water to the prevailing market price.
Our sales and profitability are determined principally by the price of potash, Trio®, and water. Potash and Trio® sales and profitability are also influenced, to a lesser extent, by the price of natural gas and other commodities used in production. The price of potash and Trio® is influenced by agricultural demand, global and domestic supply, competing specialty fertilizers, and the prices of agricultural commodities. Decreases in agricultural demand, increases in supply, or decreases in agricultural
54
commodity prices could reduce our agricultural potash and Trio® sales. The price of water is influenced by demand from the oil and gas operators in the Permian Basin. Natural gas and oil price declines may result in a reduction in drilling activity, which could reduce our sales of water.
Our costs and capital investments are subject to market movements in other commodities such as natural gas, electricity, steel, and chemicals.
Interest Rate Fluctuations
Balances outstanding under our $75 million revolving credit facility bear interest at a floating rate of 1.25% to 2.00% above LIBOR, based on our leverage ratio. As of December 31, 2019, we had $19.8 million of borrowings outstanding on this facility. We occasionally borrow and repay amounts under the facility for near-term working capital needs.
The $50 million aggregate principal amount of Notes bears interest based on a pricing grid set forth in the agreement governing the Notes. As of December 31, 2019, the Series A Senior Notes bear interest at 3.73%, the Series B Senior Notes bear interest at 4.63%, and the Series C Senior Notes bear interest at 4.78%, which reflect the lowest rates in the pricing grid. These interest rates may adjust quarterly based upon our financial performance and certain financial covenant levels. As of December 31, 2019, these financial covenant tests have been met. The fair value of the senior notes fluctuates based on the assessment of our credit and movements in market interest rates. As of December 31, 2019, the aggregate principal amount of Notes due was $50.0 million and their estimated fair value was $50.0 million.
A 1.0% increase or decrease in underlying interest rates for the Notes would increase or decrease interest expense by approximately $0.5 million annually, assuming aggregate principal amount outstanding remains constant at December 31, 2019 levels.
Geographic Concentration
Our mines, facilities, and many of our customers are concentrated in the western half of United States and are, therefore, affected by weather and other conditions in this region.
Foreign Exchange Rate Fluctuations
We typically do not have balances of accounts receivable denominated in currencies other than U.S. dollars and, as a result, we do not have a direct foreign exchange risk. We do, however, have an indirect foreign exchange risk due to the industry in which we operate.
Specifically, the U.S. imports the majority of its potash, including from Canada, Russia, and Belarus. If the local currencies for foreign suppliers strengthen in comparison to the U.S. dollar, foreign suppliers realize a smaller margin in their local currencies unless they increase their nominal U.S. dollar prices. Strengthening of these local currencies therefore tends to support higher U.S. potash prices as the foreign suppliers attempt to maintain their margins. However, if local currencies weaken in comparison to the U.S. dollar, foreign suppliers may choose to lower prices proportionally to increase sales volume while again maintaining a margin in their local currency.
55
ITEM 8. | FINANCIAL STATEMENTS AND SUPPLEMENTARY DATA |
Report of Independent Registered Public Accounting Firm
To the Stockholders and Board of Directors
Intrepid Potash, Inc.:
Opinions on the Consolidated Financial Statements and Internal Control Over Financial Reporting
We have audited the accompanying consolidated balance sheets of Intrepid Potash, Inc. and subsidiaries (the Company) as of December 31, 2019 and 2018, the related consolidated statements of operations, stockholders' equity, and cash flows for each of the years in the three-year period ended December 31, 2019, and the related notes and financial statement schedule II (collectively, the consolidated financial statements). We also have audited the Company's internal control over financial reporting as of December 31, 2019, based on criteria established in Internal Control - Integrated Framework (2013) issued by the Committee of Sponsoring Organizations of the Treadway Commission.
In our opinion, the consolidated financial statements referred to above present fairly, in all material respects, the financial position of the Company as of December 31, 2019 and 2018, and the results of its operations and its cash flows for each of the years in the three-year period ended December 31, 2019, in conformity with U.S. generally accepted accounting principles. Also in our opinion, the Company maintained, in all material respects, effective internal control over financial reporting as of December 31, 2019 based on criteria established in Internal Control - Integrated Framework (2013) issued by the Committee of Sponsoring Organizations of the Treadway Commission.
Change in Accounting Principle
As discussed in Note 8 to the consolidated financial statements, the Company has changed its method of accounting for leases as of January 1, 2019 due to the adoption of Accounting Standards Update 2016-02, Leases (ASC Topic 842).
Basis for Opinions
The Company’s management is responsible for these consolidated financial statements, for maintaining effective internal control over financial reporting, and for its assessment of the effectiveness of internal control over financial reporting, included in the accompanying Management's Report on Internal Control over Financial Reporting. Our responsibility is to express an opinion on the Company's consolidated financial statements and an opinion on the Company's internal control over financial reporting based on our audits. We are a public accounting firm registered with the Public Company Accounting Oversight Board (United States) (PCAOB) and are required to be independent with respect to the Company in accordance with the U.S. federal securities laws and the applicable rules and regulations of the Securities and Exchange Commission and the PCAOB.
We conducted our audits in accordance with the standards of the PCAOB. Those standards require that we plan and perform the audits to obtain reasonable assurance about whether the consolidated financial statements are free of material misstatement, whether due to error or fraud, and whether effective internal control over financial reporting was maintained in all material respects.
Our audits of the consolidated financial statements included performing procedures to assess the risks of material misstatement of the consolidated financial statements, whether due to error or fraud, and performing procedures that respond to those risks. Such procedures included examining, on a test basis, evidence regarding the amounts and disclosures in the consolidated financial statements. Our audits also included evaluating the accounting principles used and significant estimates made by management, as well as evaluating the overall presentation of the consolidated financial statements. Our audit of internal control over financial reporting included obtaining an understanding of internal control over financial reporting, assessing the risk that a material weakness exists, and testing and evaluating the design and operating effectiveness of internal control based on the assessed risk. Our audits also included performing such other procedures as we considered necessary in the circumstances. We believe that our audits provide a reasonable basis for our opinions.
Definition and Limitations of Internal Control Over Financial Reporting
A company's internal control over financial reporting is a process designed to provide reasonable assurance regarding the reliability of financial reporting and the preparation of financial statements for external purposes in accordance with generally accepted accounting principles. A company's internal control over financial reporting includes those policies and procedures that (1) pertain to the maintenance of records that, in reasonable detail, accurately and fairly reflect the transactions and dispositions of the assets of the company; (2) provide reasonable assurance that transactions are recorded as necessary to permit preparation of financial
56
statements in accordance with generally accepted accounting principles, and that receipts and expenditures of the company are being made only in accordance with authorizations of management and directors of the company; and (3) provide reasonable assurance regarding prevention or timely detection of unauthorized acquisition, use, or disposition of the company’s assets that could have a material effect on the financial statements.
Because of its inherent limitations, internal control over financial reporting may not prevent or detect misstatements. Also, projections of any evaluation of effectiveness to future periods are subject to the risk that controls may become inadequate because of changes in conditions, or that the degree of compliance with the policies or procedures may deteriorate.
/s/ KPMG LLP
We have served as the Company's auditor since 2007.
Denver, Colorado
March 3, 2020
57
INTREPID POTASH, INC.
CONSOLIDATED BALANCE SHEETS
(In thousands, except share and per share amounts)
December 31, | ||||||||
2019 | 2018 | |||||||
ASSETS | ||||||||
Cash and cash equivalents | $ | 20,603 | $ | 33,222 | ||||
Accounts receivable: | ||||||||
Trade, net | 23,749 | 25,161 | ||||||
Other receivables, net | 1,247 | 597 | ||||||
Inventory, net | 94,220 | 82,046 | ||||||
Other current assets | 5,524 | 4,332 | ||||||
Total current assets | 145,343 | 145,358 | ||||||
Property, plant, equipment, and mineral properties, net | 378,509 | 346,209 | ||||||
Water rights | 19,184 | 2,311 | ||||||
Long-term parts inventory, net | 27,569 | 30,031 | ||||||
Other assets, net | 7,834 | 1,322 | ||||||
Total Assets | $ | 578,439 | $ | 525,231 | ||||
LIABILITIES AND STOCKHOLDERS' EQUITY | ||||||||
Accounts payable: | ||||||||
Trade | $ | 9,992 | $ | 9,107 | ||||
Related parties | — | 28 | ||||||
Income taxes payable | 50 | 914 | ||||||
Accrued liabilities | 13,740 | 8,717 | ||||||
Accrued employee compensation and benefits | 4,464 | 4,124 | ||||||
Other current liabilities | 19,382 | 11,891 | ||||||
Advances on credit facility | 19,817 | — | ||||||
Current portion of long-term debt | 20,000 | — | ||||||
Total current liabilities | 87,445 | 34,781 | ||||||
Long-term debt, net | 29,753 | 49,642 | ||||||
Asset retirement obligation | 22,140 | 23,125 | ||||||
Operating lease liabilities | 4,025 | — | ||||||
Other non-current liabilities | 420 | 420 | ||||||
Total Liabilities | 143,783 | 107,968 | ||||||
Commitments and Contingencies | ||||||||
Common stock, $0.001 par value; 400,000,000 shares authorized: | ||||||||
and 129,553,517 and 128,716,595 shares outstanding | ||||||||
at December 31, 2019, and 2018, respectively | 130 | 129 | ||||||
Additional paid-in capital | 652,963 | 649,202 | ||||||
Retained deficit | (218,437 | ) | (232,068 | ) | ||||
Total Stockholders' Equity | 434,656 | 417,263 | ||||||
Total Liabilities and Stockholders' Equity | $ | 578,439 | $ | 525,231 | ||||
See accompanying notes to these consolidated financial statements.
58
INTREPID POTASH, INC.
CONSOLIDATED STATEMENTS OF OPERATIONS
(In thousands, except share and per share amounts)
Year Ended December 31, | ||||||||||||
2019 | 2018 | 2017 | ||||||||||
Sales | $ | 220,075 | $ | 208,270 | $ | 177,915 | ||||||
Less: | ||||||||||||
Freight costs | 40,056 | 37,052 | 32,016 | |||||||||
Warehousing and handling costs | 8,621 | 9,281 | 9,670 | |||||||||
Cost of goods sold | 126,110 | 121,955 | 117,962 | |||||||||
Lower of cost or net realizable value inventory adjustments | 1,810 | 1,711 | 6,379 | |||||||||
Gross Margin | 43,478 | 38,271 | 11,888 | |||||||||
Selling and administrative | 23,556 | 20,438 | 18,915 | |||||||||
Accretion of asset retirement obligation | 1,793 | 1,668 | 1,558 | |||||||||
Restructuring expense | — | — | 266 | |||||||||
Care and maintenance expense | 549 | 530 | 1,687 | |||||||||
Other operating expense (income) | 1,220 | 141 | 3,523 | |||||||||
Operating Income (Loss) | 16,360 | 15,494 | (14,061 | ) | ||||||||
Other Income (Expense) | ||||||||||||
Interest expense, net | (3,031 | ) | (3,855 | ) | (11,692 | ) | ||||||
Other income | 355 | 252 | 403 | |||||||||
Income (Loss) Before Income Taxes | 13,684 | 11,891 | (25,350 | ) | ||||||||
Income Tax (Expense) Benefit | (53 | ) | (108 | ) | 2,783 | |||||||
Net Income (Loss) | $ | 13,631 | $ | 11,783 | $ | (22,567 | ) | |||||
Weighted Average Shares Outstanding: | ||||||||||||
Basic | 129,049,168 | 128,070,702 | 115,708,859 | |||||||||
Diluted | 131,050,920 | 130,985,919 | 115,708,859 | |||||||||
Income (Loss) Per Share: | ||||||||||||
Basic | $ | 0.11 | $ | 0.09 | $ | (0.20 | ) | |||||
Diluted | $ | 0.10 | $ | 0.09 | $ | (0.20 | ) | |||||
See accompanying notes to these consolidated financial statements.
59
INTREPID POTASH, INC.
CONSOLIDATED STATEMENTS OF STOCKHOLDERS' EQUITY
(In thousands, except share amounts)
Common Stock | Additional Paid-in Capital | Retained Deficit | Total Stockholders' Equity | ||||||||||||||||
Shares | Amount | ||||||||||||||||||
Balance, December 31, 2016 | 75,839,998 | $ | 76 | $ | 583,653 | $ | (221,164 | ) | $ | 362,565 | |||||||||
Adjustment to opening balance | — | — | 120 | (120 | ) | — | |||||||||||||
Issuance of common stock | 50,612,027 | 51 | 59,079 | — | 59,130 | ||||||||||||||
Net loss | — | — | — | (22,567 | ) | (22,567 | ) | ||||||||||||
Stock-based compensation | — | — | 3,622 | — | 3,622 | ||||||||||||||
Vesting of restricted shares, net of common stock used to fund employee income tax withholding due upon vesting | 1,077,292 | 1 | (782 | ) | — | (781 | ) | ||||||||||||
Exercise of stock options | 117,213 | — | 121 | — | 121 | ||||||||||||||
Balance, December 31, 2017 | 127,646,530 | 128 | 645,813 | (243,851 | ) | 402,090 | |||||||||||||
Net income | — | — | — | 11,783 | 11,783 | ||||||||||||||
Stock-based compensation | — | — | 4,179 | — | 4,179 | ||||||||||||||
Vesting of restricted shares, net of common stock used to fund employee income tax withholding due upon vesting | 975,061 | 1 | (904 | ) | — | (903 | ) | ||||||||||||
Exercise of stock options | 95,004 | — | 114 | — | 114 | ||||||||||||||
Balance, December 31, 2018 | 128,716,595 | 129 | 649,202 | (232,068 | ) | 417,263 | |||||||||||||
Net income | — | — | — | 13,631 | 13,631 | ||||||||||||||
Stock-based compensation | — | — | 4,281 | — | 4,281 | ||||||||||||||
Vesting of restricted shares, net of common stock used to fund employee income tax withholding due upon vesting | 816,177 | 1 | (541 | ) | — | (540 | ) | ||||||||||||
Exercise of stock options | 20,745 | — | 21 | — | 21 | ||||||||||||||
Balance, December 31, 2019 | 129,553,517 | $ | 130 | $ | 652,963 | $ | (218,437 | ) | $ | 434,656 | |||||||||
See accompanying notes to these consolidated financial statements.
60
INTREPID POTASH, INC.
CONSOLIDATED STATEMENTS OF CASH FLOWS
(In thousands)
Year Ended December 31, | ||||||||||||
2019 | 2018 | 2017 | ||||||||||
Cash Flows from Operating Activities: | ||||||||||||
Adjustments to reconcile net income (loss) to net cash provided by operating activities: | ||||||||||||
Net income (loss) | $ | 13,631 | $ | 11,783 | $ | (22,567 | ) | |||||
Depreciation, depletion, and amortization | 34,121 | 32,215 | 33,209 | |||||||||
Amortization of intangible assets | 214 | — | — | |||||||||
Accretion of asset retirement obligation | 1,793 | 1,668 | 1,558 | |||||||||
Amortization of deferred financing costs | 303 | 732 | 1,778 | |||||||||
Stock-based compensation | 4,281 | 4,179 | 3,622 | |||||||||
Allowance for doubtful accounts | 75 | 100 | 865 | |||||||||
Loss (gain) on disposal of assets | 345 | (87 | ) | 1,830 | ||||||||
Lower of cost or net realizable value inventory adjustments | 1,810 | 1,711 | 6,379 | |||||||||
Other | (34 | ) | (4 | ) | 1,073 | |||||||
Changes in operating assets and liabilities: | ||||||||||||
Trade accounts receivable, net | 1,337 | (7,484 | ) | (6,870 | ) | |||||||
Other receivables, net | (650 | ) | 165 | (270 | ) | |||||||
Refundable income taxes | — | 2,663 | (1,284 | ) | ||||||||
Inventory, net | (11,525 | ) | (67 | ) | (1,263 | ) | ||||||
Other current assets | (1,019 | ) | 1,762 | (3,207 | ) | |||||||
Accounts payable, accrued liabilities, and accrued employee compensation and benefits | 2,280 | 1,740 | 1,738 | |||||||||
Income tax payable | (865 | ) | 914 | — | ||||||||
Operating lease liabilities | (2,090 | ) | — | — | ||||||||
Other liabilities | 5,374 | 12,247 | 102 | |||||||||
Net cash provided by operating activities | 49,381 | 64,237 | 16,693 | |||||||||
Cash Flows from Investing Activities: | ||||||||||||
Additions to property, plant, equipment, mineral properties and other assets | (63,836 | ) | (16,891 | ) | (13,505 | ) | ||||||
Additions to intangible assets | (16,873 | ) | — | — | ||||||||
Proceeds from sale of property, plant, equipment, and mineral properties | 68 | 110 | 5,651 | |||||||||
Net cash used in investing activities | (80,641 | ) | (16,781 | ) | (7,854 | ) | ||||||
Cash Flows from Financing Activities: | ||||||||||||
Issuance of common stock, net of transaction expenses | — | — | 59,130 | |||||||||
Repayment of long-term debt | — | (10,000 | ) | (75,000 | ) | |||||||
Debt prepayment costs | — | (402 | ) | (3,001 | ) | |||||||
Proceeds from short-term borrowings on credit facility | 30,317 | 13,500 | 22,000 | |||||||||
Repayments of short-term borrowings on credit facility | (10,500 | ) | (17,400 | ) | (18,100 | ) | ||||||
Capitalized debt costs | (503 | ) | (210 | ) | (129 | ) | ||||||
Employee tax withholding paid for restricted shares upon vesting | (540 | ) | (903 | ) | (781 | ) | ||||||
Proceeds from exercise of stock options | 21 | 114 | 121 | |||||||||
Net cash provided by (used in) financing activities | 18,795 | (15,301 | ) | (15,760 | ) | |||||||
Net Change in Cash, Cash Equivalents, and Restricted Cash | (12,465 | ) | 32,155 | (6,921 | ) | |||||||
Cash, Cash Equivalents, and Restricted Cash, beginning of period | 33,704 | 1,549 | 8,470 | |||||||||
Cash, Cash Equivalents, and Restricted Cash, end of period | $ | 21,239 | $ | 33,704 | $ | 1,549 | ||||||
Supplemental disclosure of cash flow information | ||||||||||||
Net cash paid (received) during the period for: | ||||||||||||
Interest, net of $0.2 million of capitalized interest in 2019, and $0.1 million in both 2018 and 2017 | $ | 2,733 | $ | 3,470 | $ | 11,639 | ||||||
Income taxes | $ | 942 | $ | (3,469 | ) | $ | (1,499 | ) | ||||
Accrued purchases for property, plant, equipment, and mineral properties | $ | 5,021 | $ | 1,082 | $ | 4,068 | ||||||
See accompanying notes to these consolidated financial statements.
61
INTREPID POTASH, INC.
NOTES TO CONSOLIDATED FINANCIAL STATEMENTS
"Intrepid," "our," "we," or "us" means Intrepid Potash, Inc. and its consolidated subsidiaries.
Note 1 | — COMPANY BACKGROUND |
We are a diversified mineral company that delivers potassium, magnesium, sulfur, salt, and water products essential for customer success in agriculture, animal feed and the oil and gas industry. We are the only U.S. producer of muriate of potash (sometimes referred to as potassium chloride or potash), which is applied as an essential nutrient for healthy crop development, utilized in several industrial applications, and used as an ingredient in animal feed. In addition, we produce a specialty fertilizer, Trio®, which delivers three key nutrients, potassium, magnesium, and sulfate, in a single particle. We also provide water, magnesium chloride, brine and various oilfield products and services.
Our extraction and production operations are conducted entirely in the continental United States. We produce potash from three solution mining facilities: our HB solution mine in Carlsbad, New Mexico, our solution mine in Moab, Utah and our brine recovery mine in Wendover, Utah. We also operate our North compaction facility in Carlsbad, New Mexico, which compacts and granulates product from the HB mine. We produce Trio® from our conventional underground East mine in Carlsbad, New Mexico.
We have water rights in New Mexico under which we sell water primarily to support oil and gas development in the Permian Basin near our Carlsbad facilities. We continue to work to expand our sales of water. In May 2019, we acquired certain land, water rights, other related assets in Lea County, New Mexico, from Dinwiddie Cattle Company. We refer to these assets and operations as "Intrepid South." The purchase price was $53 million. A reduction of $12 million from the original $65 million purchase price was agreed upon by the parties prior to closing subject to issues identified in the diligence process. Dinwiddie Cattle Company also reserved a 20-year, 10% royalty, proportionally reduced as to our interest, on certain produced water disposal revenue related to Intrepid South and certain other properties located near Intrepid South. We capitalized $3.2 million of acquisition fees related to the purchase of the Intrepid South Assets.
We have three segments: potash, Trio®, and oilfield solutions. We account for the sales of byproducts as revenue in the potash or Trio® segment, based on which segment generates the byproduct. For each of the years ended December 31, 2019, 2018, and 2017, a majority of our byproduct sales were accounted for in the potash segment.
We manage sales and marketing operations centrally. This allows us to evaluate the product needs of our customers and then centrally determine which of our production facilities to use to fill customer orders in a manner designed to realize the highest average net realized sales price per ton. Average net realized sales price per ton is a non-GAAP measure that we calculate for each of potash and Trio as segment sales less segment byproduct sales and segment freight costs, divided by the number of tons of product sold in the period. We also monitor product inventory levels and overall production costs centrally.
Note 2 | — SUMMARY OF SIGNIFICANT ACCOUNTING POLICIES |
Basis of Presentation—Our consolidated financial statements include our accounts and those of our wholly-owned subsidiaries. All intercompany balances and transactions have been eliminated in consolidation.
Use of Estimates—The preparation of financial statements requires management to make estimates and assumptions that affect the reported amounts of assets and liabilities, the disclosure of contingent assets and liabilities as of the date of the financial statements, and the reported amounts of revenues and expenses during the reporting period. We base our estimates on historical experience and on various other assumptions that are believed to be reasonable under the circumstances. Accordingly, actual results may differ significantly from these estimates under different assumptions or conditions.
Significant estimates include, but are not limited to, those for proven and probable mineral reserves, the related present value of estimated future net cash flows, useful lives of plant assets, asset retirement obligations, normal inventory production levels, inventory valuations, the valuation of equity awards, revenue from products we sell to customers where the price is variable, the valuation of receivables, estimated future net cash flows used in long-lived assets impairment analysis, the related valuation of our long-lived assets, valuation of our deferred tax assets and estimated blended income tax rates utilized in the current and deferred income tax calculations. There are numerous uncertainties inherent in estimating quantities of proven and probable reserves, projecting future rates of production, and the timing of development expenditures. Future mineral prices may vary significantly from the prices in effect at the time the estimates are made, as may estimates of future operating costs. The estimate of proven and probable mineral reserves, the related present value of estimated future
62
cash flows, and useful lives of plant assets can affect various other items including depletion, the net carrying value of our mineral properties, the useful lives of related property, plant, and equipment, depreciation expense, and estimates associated with recoverability of long-lived assets and asset retirement obligations. Specific to income tax items, we experience fluctuations in the valuation of the deferred tax assets and liabilities due to changing income tax rates and the blend of state tax rates.
Revenue Recognition—We account for revenue in accordance with Accounting Standards Codification ("ASC") Topic 606 Revenue from Contracts with Customers ("ASC 606"). Under ASC 606, we recognize revenue when control of the promised goods or services is transferred to customers in an amount that reflects the consideration we expect to be entitled in exchange for those goods or services.
Performance Obligations: A performance obligation is a promise in a contract to transfer a distinct good or service to the customer and is the unit of account in ASC 606. The contract's transaction price is allocated to the performance obligations and recognized as revenue when the performance obligations are satisfied. Substantially all of our contracts are of a short-term nature and contain a single performance obligation because the sale is for one type of product and shipping and handling charges are accounted for as a fulfillment cost and are not considered to be a separate performance obligation. The performance obligation is satisfied when control of the product is transferred to the customer, which typically occurs when we ship mineral products or deliver water from our facility to the customer. We account for substantially all of our revenue from sales to customers at a single point in time.
Contract Estimates: In certain circumstances, we may sell product to customers where the sales price is variable. For such sales, we estimate the sales price we expect to realize based on the facts and circumstances for each sale, including historical experience, and recognize revenue to the extent it is probable that a subsequent change in estimate will not result in a significant revenue reversal compared to the cumulative revenue recognized under the contract.
Contract Balances: The timing of revenue recognition, billings, and cash collection may result in contract assets or contract liabilities. For certain contracts, the customer has agreed to pay us before we have satisfied our performance obligations. Customer payments received before we have satisfied our performance obligations are accounted for as a contract liability.
Disaggregation of Revenue: We present disaggregation of revenue by products which we believe best depicts how the nature, amount, timing and uncertainty of revenue and cash flows are affected by economic conditions.
Inventory and Long-Term Parts Inventory—Inventory consists of product and byproduct stocks that are ready for sale; mined ore; potash in evaporation ponds, which is considered work-in-process; and parts and supplies inventory. Product and byproduct inventory cost is determined using the lower of weighted average cost or estimated net realizable value and includes direct costs, maintenance, operational overhead, depreciation, depletion, and equipment lease costs applicable to the production process. Direct costs, maintenance, and operational overhead include labor and associated benefits.
We evaluate our production levels and costs to determine if any should be deemed abnormal and therefore excluded from inventory costs and expensed directly during the applicable period. The assessment of normal production levels is judgmental and unique to each period. We model normal production levels and evaluate historical ranges of production by operating plant in assessing what is deemed to be normal.
Parts inventory, including critical spares, that is not expected to be used within a period of one year is classified as non-current. Parts and supply inventory cost is determined using the lower of average acquisition cost or estimated replacement cost. Detailed reviews are performed related to the net realizable value of parts inventory, giving consideration to quality, slow-moving items, obsolescence, excessive levels, and other factors. Parts inventories that have not turned over in more than a year, excluding parts classified as critical spares, are reviewed for obsolescence and, if deemed appropriate, are included in the determination of an allowance for obsolescence.
Property, Plant, Equipment, Mineral Properties, and Development Costs—Property, plant, and equipment are stated at historical cost. Expenditures for property, plant, and equipment relating to new assets or improvements are capitalized, provided the expenditure extends the useful life of an asset or extends the asset's functionality. Property, plant, and equipment are depreciated under the straight-line method using estimated useful lives. The estimated useful lives of property, plant, and equipment are evaluated periodically as changes in estimates occur. No depreciation is taken on assets classified as construction in progress until the asset is placed into service. Gains and losses are recorded upon retirement, sale, or disposal of assets. Maintenance and repair costs are recognized as period costs when incurred. Capitalized interest, to the extent of debt outstanding, is calculated and capitalized on assets that are being constructed, drilled, or built or that are otherwise classified as construction in progress.
63
Mineral properties and development costs, which are referred to collectively as mineral properties, include acquisition costs, the cost of drilling production wells, and the cost of other development work, all of which are capitalized. Depletion of mineral properties is calculated using the units-of-production method over the estimated life of the relevant ore body. The lives of reserves used for accounting purposes are shorter than current reserve life determinations due to uncertainties inherent in long-term estimates. These reserve life estimates have been prepared by us and reviewed and independently determined by mine consultants. Tons of potash and langbeinite in the proven and probable reserves are expressed in terms of expected finished tons of product to be realized, net of estimated losses. Market price fluctuations of potash or Trio®, as well as increased production costs or reduced recovery rates, could render proven and probable reserves containing relatively lower grades of mineralization uneconomic to exploit and might result in a reduction of reserves. In addition, the provisions of our mineral leases, including royalty provisions, are subject to periodic readjustment by the state and federal government, which could affect the economics of our reserve estimates. Significant changes in the estimated reserves could have a material impact on our results of operations and financial position.
Recoverability of Long-Lived Assets—We evaluate our long-lived assets for impairment when events or changes in circumstances indicate that the related carrying amount may not be recoverable. An impairment is potentially considered to exist if an asset group's total estimated net future cash flows on an undiscounted basis are less than the carrying amount of the related asset. An impairment loss is measured and recorded based on the excess of the carrying amount of long-lived assets over its estimated fair value. Changes in significant assumptions underlying future cash flow estimates or fair values of asset groups may have a material effect on our financial position and results of operations. Sales price is a significant element of any cash flow estimate, particularly for higher cost operations. Other assumptions we estimate include, among other things, the economic life of the asset, sales volume, inflation, raw materials costs, cost of capital, tax rates, and capital spending.
Factors we generally will consider important and which could trigger an impairment review of the carrying value of long-lived assets include the following:
• | significant underperformance relative to expected operating results or operating losses |
• | significant changes in the manner of use of assets or the strategy for our overall business |
• | the denial or delay of necessary permits or approvals that would affect the utilization of our tangible assets |
• | underutilization of our tangible assets |
• | discontinuance of certain products by us or our customers |
• | a decrease in estimated mineral reserves |
• | significant negative industry or economic trends |
Intangible Assets—Water rights are accounted for as indefinite-lived intangible assets. We test indefinite-lived intangible assets for impairment at least annually on October 1, and more frequently if circumstances require. We use a qualitative assessment to determine whether it is more likely than not that the fair value of the unamortized intangible is less than its carrying value. If our qualitative assessment indicates it is more likely than not that the fair value of the unamortized assets is less than its carrying value, we estimate the fair value of the unamortized asset and record an impairment loss based on the excess of the carrying amount of the unamortized intangible asset over its estimated fair value. Fair value is estimated using quoted market prices, if available. If quoted market prices are not available, the estimated fair value is based on various valuation techniques, including the discounted value of estimated future cash flows. Changes in significant assumptions underlying fair value estimates may have a material effect on our financial position and results of operations.
We also have finite-lived intangible assets consisting of contractual agreements. These intangible assets are amortized over the period of estimated benefit using the straight-line method. No significant residual value is estimated for our finite-lived intangible assets. We estimate the useful life of intangible assets considering various factors, including but not limited to, the expected use of the asset, the expected life of other assets the intangible asset may relate, any legal, regulatory, contractual provisions, or relevant economic factors that may limit the use of the intangible asset. We evaluate the remaining useful lives of intangible assets each reporting period to determine if a revision to the asset's remaining life is necessary. Changes in significant assumptions underlying useful lives may have a material effect on our financial position and results of operations.
We evaluate our finite-lived intangible assets for impairment when events or changes in circumstances indicate that the related carrying amount may not be recoverable. Such circumstances may include but are not limited to (1) significant adverse changes in the manner the asset is used, or (2) significant adverse changes in legal factors or economic conditions, including adverse actions by regulatory authorities. We did not record any impairments to our intangible assets in 2019 and 2018.
Exploration Costs—Exploration costs include geological and geophysical work performed on areas that do not yet have proven and probable reserves declared. These costs are expensed as incurred.
64
Asset Retirement Obligations—Reclamation costs are initially recorded as a liability associated with the asset to be reclaimed or abandoned, based on applicable inflation assumptions and discount rates. The accretion of this discounted liability is recognized as expense over the life of the related assets, and the liability is periodically adjusted to reflect changes in the estimates of either the timing or amount of the reclamation and abandonment costs.
Planned Turnaround Maintenance—Each production operation typically shuts down periodically for planned maintenance activities. The costs of maintenance turnarounds at our facilities are considered part of production costs and are absorbed into inventory in the period incurred.
Leases—We determine if an arrangement is a lease or contains a lease at inception. Operating and finance lease liabilities are recognized based on the present value of the remaining lease payments, discounted using the discount rate for the lease at the commencement date. If readily determinable, we use the implicit rate in the lease to determine the present value of future lease payments. If the implicit rate is not readily determinable, we use an incremental borrowing rate based on information available at the commencement date to determine the present value of future lease payments. Operating right-of-use ("ROU") assets and finance lease assets are generally recognized based on the amount of the initial measurement of the lease liability. Lease expense is recognized on a straight-line basis over the lease term. We account for lease and non-lease components as a single lease component and we do not apply the requirements of ASC Topic 842 to short-term leases with a term of one year or less at inception.
Income Taxes—We are a subchapter C corporation and, therefore, are subject to U.S. federal and state income taxes. We recognize income taxes under the asset and liability method. Deferred tax assets and liabilities are recognized for the estimated future tax consequences attributable to differences between the financial statement carrying amounts of assets and liabilities and their respective tax bases. Deferred tax assets and liabilities are measured using the enacted tax rates expected to apply to taxable income in the periods in which the deferred tax liability or asset is expected to be settled or realized. We record a valuation allowance if it is deemed more likely than not that our deferred income tax assets will not be realized in full. These determinations are subject to ongoing assessment.
Cash and Cash Equivalents—Cash and cash equivalents consist of cash and liquid investments with an original maturity of three months or less.
Fair Value of Financial Instruments—Our financial instruments include cash and cash equivalents, restricted cash, accounts receivable, refundable income taxes, accounts payable and current accrued liabilities. These instruments are carried at cost, which approximates fair value due to the short-term maturities of the instruments. Allowances for doubtful accounts are recorded against the accounts receivable balance to estimate net realizable value. The fair value of the long-term debt is estimated using discounted cash flow analysis based on current borrowing rates for debt with similar remaining maturities and ratings. Amounts outstanding under our secured credit facility are carried at cost, which approximates fair value, due to the short-term nature of the borrowings.
Earnings per Share—Basic net income or loss per common share of stock is calculated by dividing net income or loss available to common stockholders by the weighted average basic common shares outstanding for the respective period.
Diluted net income per common share of stock is calculated by dividing net income by the weighted average diluted common shares outstanding, which includes the effect of potentially dilutive securities. Potentially dilutive securities for the diluted earnings or loss per share calculation consist of awards of restricted shares, performance units, and non‑qualified stock options. The dilutive effect of stock-based compensation arrangements is computed using the treasury‑stock method. Following the lapse of the vesting period of restricted shares, the shares are considered issued and therefore are included in the number of issued and outstanding shares for purposes of these calculations. When we report a net loss, all potentially dilutive securities are considered anti-dilutive and are excluded from the dilutive loss per share calculation.
Stock‑Based Compensation—We account for stock-based compensation by recording expense using the fair value of the awards at the time of grant. We have recorded compensation expense associated with the issuance of restricted shares, performance units, and non-qualified stock options, all of which are subject to service conditions and in some cases subject to operational performance or market-based conditions. The expense associated with such awards is recognized over the service period associated with each grant. Expense associated with awards with service only conditions is recognized using the straight-line recognition method over the requisite service period of the award, which is generally the vesting period of the award. Expense associated with awards that contain both a service condition and a market condition is recognized using the accelerated recognition method over the requisite service period of the award, which is generally the longest of the explicit service period or the derived service period (expected date the market condition is estimated to be achieved).
Reclassification of Prior Period Presentation—Certain prior period amounts have been reclassified in order to conform to the current period presentation. These reclassifications had no effect on the reported results of operations.
65
Pronouncements Issued But Not Yet Adopted—In June 2016, the FASB issued ASU No. 2016-13, as amended by ASU No. 2019-04 and ASU No. 2019-10, Financial Instruments - (Topic 326): Measurement of Credit Losses on Financial Instruments, which changes the way entities recognize impairment of many financial assets by requiring immediate recognition of estimated credit losses expected to occur over their remaining life. This guidance is effective for us for annual and interim periods in fiscal years beginning after December 15, 2019. Because we have historically experienced minimal bad debt expense related to our trade receivables, the adoption of this new standard will not have a material impact on our condensed consolidated financial statements.
Note 3 | — RECENTLY ADOPTED ACCOUNTING STANDARDS |
In February 2016, the Financial Accounting Standards Board ("FASB") issued ASU No. 2016-02, Leases, ("ASC Topic 842"), which we adopted on January 1, 2019, using a modified retrospective method, applying the new standard to all leases existing at the date of initial application. We used the effective date as our date of initial application. Consequently, financial information will not be updated, and disclosures required under the new standard will not be provided for dates before January 1, 2019.
The new standard requires lessees to recognize lease assets and liabilities on their balance sheet for those leases classified as operating leases under previous GAAP. These assets and liabilities are recorded generally at the present value of the contracted lease payments, using the rate implicit in the lease if known. If the implicit rate is not known, we use our estimated incremental borrowing rate.
We do not account for lease and non-lease components separately and we do not apply the requirements of ASC Topic 842 to short-term leases with a term of one year or less at inception. Lease expense is recognized on a straight-line basis over the lease term.
As a result of adopting the new standard, we recorded operating lease right-of-use ("ROU") assets of $5.9 million and operating lease liabilities of $6.1 million on January 1, 2019.
66
Note 4 | — EARNINGS PER SHARE |
Basic earnings per share is computed by dividing net income or loss by the weighted-average number of shares of common stock outstanding during the period. For purposes of determining diluted earnings per share, basic weighted-average common shares outstanding is adjusted to include potentially dilutive securities, including restricted stock, stock options, and performance units. The treasury-stock method is used to measure the dilutive impact of potentially dilutive shares. Potentially dilutive shares are excluded from the diluted weighted-average shares outstanding computation in periods in which they have an anti-dilutive effect. The following table shows the calculation of basic and diluted earnings (loss) per share (in thousands, except per share amounts):
Year Ended December 31, | ||||||||||||
2019 | 2018 | 2017 | ||||||||||
Net income (loss) | $ | 13,631 | $ | 11,783 | $ | (22,567 | ) | |||||
Basic weighted average common shares outstanding | 129,049 | 128,071 | 115,709 | |||||||||
Add: Dilutive effect restricted common stock | 1,215 | 1,982 | — | |||||||||
Add: Dilutive effect of stock options outstanding | 787 | 933 | — | |||||||||
Diluted weighted average common shares outstanding | 131,051 | 130,986 | 115,709 | |||||||||
Earnings per share: | ||||||||||||
Basic | $ | 0.11 | $ | 0.09 | $ | (0.20 | ) | |||||
Diluted | $ | 0.10 | $ | 0.09 | $ | (0.20 | ) | |||||
The following table shows anti-dilutive shares excluded from the calculation of diluted loss per share (in thousands):
Year Ended December 31, | |||||||||
2019 | 2018 | 2017 | |||||||
Anti-dilutive effect of restricted shares | 495 | — | 3,328 | ||||||
Anti-dilutive effect of stock options outstanding | 1,649 | 1,452 | 1,711 | ||||||
Anti-dilutive effect of performance units | — | — | 63 | ||||||
67
Note 5 | — CASH, CASH EQUIVALENTS AND RESTRICTED CASH |
Total cash, cash equivalents and restricted cash, as shown on the consolidated statements of cash flows are included in the following accounts at December 31, 2019, 2018, and 2017 (in thousands):
Year Ended December 31, | |||||||||||
2019 | 2018 | 2017 | |||||||||
Cash and cash equivalents | 20,603 | $ | 33,222 | $ | 1,068 | ||||||
Restricted cash included in "Other current assets" | 150 | — | — | ||||||||
Restricted cash included in "Other assets, net" | 486 | 482 | 481 | ||||||||
Total cash, cash equivalents, and restricted cash shown in the statement of cash flows | $ | 21,239 | $ | 33,704 | $ | 1,549 | |||||
Restricted cash included in "Other assets, net" on the balance sheet at December 31, 2019, 2018, and 2017 represents amounts whose use is restricted by contractual agreements with the Bureau of Land Management or the State of Utah as security to fund future reclamation obligations at our sites. Restricted cash included in "Other current assets" on the balance sheet at December 31, 2019 represents a cash deposit with a supply vendor.
Note 6 | — INVENTORY AND LONG-TERM PARTS INVENTORY |
The following summarizes our inventory, recorded at the lower of weighted average cost or estimated net realizable value as of December 31, 2019, and 2018, respectively (in thousands):
December 31, | ||||||||
2019 | 2018 | |||||||
Finished goods product inventory | $ | 55,585 | $ | 48,370 | ||||
In-process mineral inventory | 25,591 | 24,325 | ||||||
Total product inventory | 81,176 | 72,695 | ||||||
Current parts inventory, net | 13,044 | 9,351 | ||||||
Total current inventory, net | 94,220 | 82,046 | ||||||
Long-term parts inventory, net | 27,569 | 30,031 | ||||||
Total inventory, net | $ | 121,789 | $ | 112,077 | ||||
Parts inventories are shown net of any required allowances. During the years ended December 31, 2019, 2018, and 2017, we recorded charges of approximately $1.8 million, $1.7 million, and $6.4 million, respectively, as a result of routine assessments of the lower of weighted average cost or estimated net realizable value on our finished goods product inventory.
68
Note 7 | — PROPERTY, PLANT, EQUIPMENT, AND MINERAL PROPERTIES |
"Property, plant, equipment, and mineral properties, net" were comprised of the following (in thousands):
December 31, | ||||||||
2019 | 2018 | |||||||
Land | $ | 27,274 | $ | 519 | ||||
Ponds and land improvements | 65,992 | 58,961 | ||||||
Mineral properties and development costs | 143,988 | 139,418 | ||||||
Buildings and plant | 81,468 | 81,429 | ||||||
Machinery and equipment | 253,536 | 241,977 | ||||||
Vehicles | 6,222 | 5,669 | ||||||
Office equipment and leasehold improvements | 9,136 | 13,779 | ||||||
Operating lease ROU assets | 8,123 | — | ||||||
Construction in progress | 7,124 | 2,822 | ||||||
Total property, plant, equipment, and mineral properties, gross | $ | 602,863 | $ | 544,574 | ||||
Less: accumulated depreciation, depletion, and amortization | (224,354 | ) | (198,365 | ) | ||||
Total property, plant, equipment, and mineral properties, net | $ | 378,509 | $ | 346,209 | ||||
We incurred the following expenses for depreciation, depletion, and amortization of ROU assets, including expenses capitalized into inventory, for the following periods (in thousands):
Year Ended December 31, | ||||||||||||
2019 | 2018 | 2017 | ||||||||||
Depreciation | $ | 27,889 | $ | 27,858 | $ | 28,323 | ||||||
Depletion | 4,173 | 4,357 | 4,886 | |||||||||
Amortization of ROU assets | 2,059 | — | — | |||||||||
Total incurred | $ | 34,121 | $ | 32,215 | $ | 33,209 | ||||||
Note 8 | — LEASES |
We determine if an arrangement is a lease or contains a lease at inception. We have operating leases for mining equipment, trucks, rail cars, and office space. Our operating leases have remaining leases terms ranging from less than one year to five years. Leases recorded on the balance sheet consist of the following (amounts in thousands):
Leases | Classification on the Balance Sheet | Balance, December 31, 2019 | ||||
Assets | ||||||
Operating lease ROU assets, net | Property, plant, equipment, and mineral properties, net | $ | 6,064 | |||
Liabilities | ||||||
Current operating lease liabilities | Other current liabilities | $ | 2,187 | |||
Non-current operating lease liabilities | Operating lease liabilities | $ | 4,025 | |||
Other information related to lease term and discount rate is as follows:
69
December 31, 2019 | |||
Weighted average remaining lease term - operating leases (in years) | 3.1 | ||
Weighted average discount rate - operating leases | 5.62 | % | |
The components of lease expense are as follows (amounts in thousands):
For the Year Ended December 31, 2019 | ||||
Operating lease expense | $ | 2,410 | ||
Short-term lease expense | 107 | |||
Total lease expense | $ | 2,517 | ||
Rental and lease expenses for the years ended December 31, 2018, and 2017 were $3.9 million and $5.7 million, respectively.
Supplemental cash flow information related to leases was as follows (amounts in thousands):
For the Year Ended December 31, 2019 | ||||
Cash paid for amounts included in the measurement of lease liabilities | ||||
Operating cash flows from operating leases | $ | 2,441 | ||
Right-of-Use Assets exchanged for new operating lease liabilities | 8,123 | |||
As of December 31, 2019, maturities of lease liabilities are summarized as follows (amounts in thousands):
Years Ending December 31, | Operating Leases | |||
2020 | $ | 2,432 | ||
2021 | 2,116 | |||
2022 | 1,459 | |||
2023 | 357 | |||
2024 | 167 | |||
Thereafter | 98 | |||
Total future minimum lease payments | $ | 6,629 | ||
Less - amount representing interest | 417 | |||
Present value of future minimum lease payments | $ | 6,212 | ||
Less - current lease obligations | 2,187 | |||
Long-term lease obligations | $ | 4,025 | ||
As of December 31, 2018, and prior to the adoption of ASC Topic 842, the annual future minimum lease payments were as follows (amounts in thousands):
70
Years Ending December 31, | Operating Leases | |||
2019 | $ | 2,266 | ||
2020 | 1,874 | |||
2021 | 1,602 | |||
2022 | 1,083 | |||
2023 | 172 | |||
Thereafter | 1,343 | |||
Total | $ | 8,340 | ||
Note 9 | — INTANGIBLE ASSETS |
We acquired certain water rights, recorded at $16.9 million, and other intangible assets, recorded at $6.4 million, in the Intrepid South asset acquisition that we completed in May 2019. We account for our water rights as indefinite-lived intangible assets.
We account for the other intangible assets acquired in the Intrepid South asset acquisition as finite-lived intangible assets and amortize those intangible assets over the period of estimated benefit, using the straight-line method. The weighted-average amortization period for the other intangible assets acquired in the Intrepid South asset acquisition was 20 years. These intangible assets are included in "Other assets, net" on the consolidated balance sheets.
As of December 31, 2019, and December 31, 2018, we have the following amounts recorded for intangible assets (amounts in thousands):
December 31, 2019 | December 31, 2018 | |||||||||||||||
Finite-lived intangible assets: | Gross Carrying Amount | Accumulated Amortization | Gross Carrying Amount | Accumulated Amortization | ||||||||||||
Produced water disposal royalty agreements | $ | 2,700 | $ | (90 | ) | $ | — | $ | — | |||||||
Surface damage and easement agreements | 3,735 | (124 | ) | — | — | |||||||||||
Total | $ | 6,435 | $ | (214 | ) | $ | — | $ | — | |||||||
Indefinite-lived intangible assets: | ||||||||||||||||
Water rights | $ | 19,184 | $ | 2,311 | ||||||||||||
Total amortization of intangible assets for the year ended December 31, 2019, was $0.2 million. We did not record any amortization of intangible assets for the year ended December 31, 2018. We estimate the annual amortization expense of intangible assets will be $0.3 million for each of the next five years.
Note 10 | — DEBT |
Senior Notes—As of December 31, 2019, we had outstanding $50 million of senior notes (the "Notes") consisting of the following series:
• | $20 million of Senior Notes, Series A, due April 16, 2020 |
• | $15 million of Senior Notes, Series B, due April 14, 2023 |
• | $15 million of Senior Notes, Series C, due April 16, 2025 |
71
The agreement governing the Notes contains certain financial covenants including those discussed below:
• | We are required to maintain a minimum fixed charge coverage ratio of 1.30 to 1.0 as of the last day of each quarter, measured based on the previous four quarters. Our fixed charge coverage ratio as of December 31, 2019, was 10.4 to 1.0, therefore we were in compliance with this covenant. |
• | We are allowed a maximum leverage ratio of 3.5 to 1.0 as of the last day of each quarter, measured based on the previous four quarters. Our leverage ratio as of December 31, 2019, was 1.3 to 1.0 therefore we were in compliance with this covenant. |
Fixed charge coverage ratio and leverage ratio are calculated in accordance with the agreement governing the Notes.
For the year ended December 31, 2019, the interest rates on the Notes were 3.73% for the Series A Notes, 4.63% for the Series B Notes and 4.78% for the Series C Notes. These rates represent the lowest interest rates available under the Notes. The interest rates may adjust upward if we do not continue to meet certain financial covenants.
For the ten months ended October 31, 2017, the interest rates on the Notes were 7.73% for the Series A Notes, 8.63% for the Series B Notes and 8.78% for the Series C Notes. Beginning November 1, 2017, the interest rates on the Notes were reduced to 3.73% for the Series A Notes, 4.63% for the Series B Notes and 4.78% for the Series C Notes.
We have granted to the collateral agent for the noteholders a first lien on substantially all of our non-current assets and a second lien on substantially all of our current assets. We are required to offer to prepay the Notes with proceeds of dispositions of certain specified property and with the proceeds of certain equity issuances, as set forth in the agreement. The obligations under the Notes are unconditionally guaranteed by several of our subsidiaries.
We were in compliance with the applicable covenants under the agreement governing the Notes as of December 31, 2019.
Our outstanding long-term debt, net, was as follows (in thousands):
December 31, 2019 | December 31, 2018 | ||||||
Notes, at carrying value | $ | 50,000 | $ | 50,000 | |||
Less current portion of Notes | (20,000 | ) | — | ||||
Less deferred financing costs | (247 | ) | (358 | ) | |||
Long-term portion of Notes, net | $ | 29,753 | $ | 49,642 | |||
Credit Facility—We maintain a secured revolving credit facility with Bank of Montreal. In August 2019, we amended and restated the credit facility to change it from an asset-backed facility to a cash-flow facility, to increase the amount available under the facility from $50 million to $75 million plus an additional $75 million accordion, and to extend the maturity date to August 1, 2024. The revolving credit facility also provides for a $7.5 million sublimit for the issuance of letters of credit. As of December 31, 2019, borrowings under the credit facility bore interest at LIBOR (London Interbank Offered Rate) plus an applicable margin of 1.25% to 2.00% per annum, based on our leverage ratio. We have granted to Bank of Montreal a first lien on substantially all of our current assets and a second lien on substantially all of our non-current assets. The obligations under the credit facility are unconditionally guaranteed by several of our subsidiaries.
We occasionally borrow and repay amounts under the facility for near-term working capital needs or other purposes and may do so in the future. For the years ended December 31, 2019, and 2018, we borrowed $30.3 million and $13.5 million, respectively, and repaid $10.5 million and $17.4 million, respectively, under the facility. As of December 31, 2019, we had $19.8 million borrowings outstanding and $1.0 million in an outstanding letter of credit under the facility. As of December 31, 2018, we had no borrowings outstanding and $1.0 million in outstanding letters of credit under the facility. We have $54.2 million available under the facility as of December 31, 2019.
We were in compliance with the applicable covenants under the facility as of December 31, 2019.
Interest Expense—Interest expense is recorded net of any capitalized interest associated with investments in capital projects. We incurred gross interest expense of $3.2 million, $4.0 million, and $11.8 million for the years ended December 31, 2019, 2018, and 2017, respectively.
72
Amounts included in interest expense for the years ended December 31, 2019, 2018, and 2017 (in thousands) are as follows:
Year ended December 31, | |||||||||||
2019 | 2018 | 2017 | |||||||||
Interest on notes and credit facility | $ | 2,908 | $ | 2,849 | $ | 7,043 | |||||
Make-whole payments | — | 402 | 3,001 | ||||||||
Amortization of deferred financing costs | 303 | 732 | 1,778 | ||||||||
Gross interest expense | 3,211 | 3,983 | 11,822 | ||||||||
Less capitalized interest | 180 | 128 | 130 | ||||||||
Interest expense, net | $ | 3,031 | $ | 3,855 | $ | 11,692 | |||||
Note 11 | — ASSET RETIREMENT OBLIGATION |
We recognize an estimated liability for future costs associated with the abandonment and reclamation of our mining properties. A liability for the fair value of an asset retirement obligation and a corresponding increase to the carrying value of the related long-lived asset are recorded as the mining operations occur or the assets are acquired.
Our asset retirement obligation is based on the estimated cost to abandon and reclaim the mining operations, the economic life of the properties, and federal and state regulatory requirements. The liability is discounted using credit adjusted risk-free rate estimates at the time the liability is incurred or when there are upward revisions to estimated costs. The credit adjusted risk-free rates used to discount our abandonment liabilities range from 6.9% to 9.7%. Revisions to the liability occur due to construction of new or expanded facilities, changes in estimated abandonment costs or economic lives, changes in the estimated timing of the reclamation activities or if federal or state regulators enact new requirements regarding the abandonment or reclamation of mines.
Following is a table of the changes to our asset retirement obligations for the following periods (in thousands):
Year Ended December 31, | ||||||||||||
2019 | 2018 | 2017 | ||||||||||
Asset retirement obligation, at beginning of period | $ | 23,125 | $ | 21,476 | $ | 19,976 | ||||||
Liabilities settled | (38 | ) | (19 | ) | — | |||||||
Liabilities incurred | 60 | — | 29 | |||||||||
Changes in estimated obligations | (2,690 | ) | — | (87 | ) | |||||||
Accretion of discount | 1,793 | 1,668 | 1,558 | |||||||||
Total asset retirement obligation, at end of period | $ | 22,250 | $ | 23,125 | $ | 21,476 | ||||||
As of December 31, 2019, $0.1 million of the total asset retirement obligation is included in "Other current liabilities" on the Consolidated Balance Sheets. We estimate approximately $9.9 million in payments may occur in the next five years.
Note 12 | — REVENUE |
Revenue Recognition—Under ASC 606, we recognize revenue when control of the promised goods or services is transferred to customers in an amount that reflects the consideration we expect to be entitled in exchange for those goods or services.
Contract Balances—As of December 31, 2019, and 2018, we had $16.6 million and $11.7 million of contract liabilities, respectively, which are included in "Other current liabilities" on the consolidated balance sheets. Our contract liability relates to payments received from customers for water purchases for which we have not yet delivered the water. Our contract liability activity for the years ended December 31, 2019, 2018, and 2017 is shown below (in thousands):
73
Year Ended December 31, | ||||||||
2019 | 2018 | |||||||
Beginning balance | $ | 11,678 | $ | — | ||||
Additions | 11,058 | 17,558 | ||||||
Recognized as revenue during period | (6,124 | ) | (5,880 | ) | ||||
Ending balance | $ | 16,612 | $ | 11,678 | ||||
Disaggregation of Revenue—The table below shows the disaggregation of revenue by product and reconciles disaggregated revenue to segment revenue for the years ended December 31, 2019, 2018, and 2017. We believe the disaggregation of revenue by products best depicts how the nature, amount, timing and uncertainty of revenue and cash flows are affected by economic conditions (in thousands):
Year Ended December 31, 2019 | ||||||||||||||||||||
Product | Potash Segment | Trio® Segment | Oilfield Solutions Segment | Intersegment Eliminations | Total | |||||||||||||||
Potash | $ | 103,403 | $ | — | $ | 2,973 | $ | (1,909 | ) | $ | 104,467 | |||||||||
Trio® | — | 64,299 | — | — | 64,299 | |||||||||||||||
Water | 1,823 | 4,495 | 19,339 | — | 25,657 | |||||||||||||||
Salt | 12,022 | 757 | — | — | 12,779 | |||||||||||||||
Magnesium Chloride | 4,907 | — | — | — | 4,907 | |||||||||||||||
Brines | 2,493 | — | — | — | 2,493 | |||||||||||||||
Other | — | — | 5,582 | (109 | ) | 5,473 | ||||||||||||||
Total Revenue | $ | 124,648 | $ | 69,551 | $ | 27,894 | $ | (2,018 | ) | $ | 220,075 | |||||||||
Year Ended December 31, 2018 | ||||||||||||||||||||
Product | Potash Segment | Trio® Segment | Oilfield Solutions Segment | Intersegment Eliminations | Total | |||||||||||||||
Potash | $ | 107,471 | $ | — | $ | — | $ | — | $ | 107,471 | ||||||||||
Trio® | — | 64,139 | — | — | 64,139 | |||||||||||||||
Water | 1,368 | 2,430 | 15,999 | — | 19,797 | |||||||||||||||
Salt | 6,638 | 239 | — | — | 6,877 | |||||||||||||||
Magnesium Chloride | 6,804 | — | — | — | 6,804 | |||||||||||||||
Brines | 1,777 | — | — | — | 1,777 | |||||||||||||||
Other | — | — | 1,405 | — | 1,405 | |||||||||||||||
Total Revenue | $ | 124,058 | $ | 66,808 | $ | 17,404 | $ | — | $ | 208,270 | ||||||||||
74
Year Ended December 31, 2017 | ||||||||||||||||||||
Product | Potash Segment | Trio® Segment | Oilfield Solutions Segment | Intersegment Eliminations | Total | |||||||||||||||
Potash | $ | 95,540 | $ | — | $ | — | $ | — | $ | 95,540 | ||||||||||
Trio® | — | 63,338 | — | — | 63,338 | |||||||||||||||
Water | 441 | 289 | 6,312 | — | 7,042 | |||||||||||||||
Salt | 6,275 | 59 | — | — | 6,334 | |||||||||||||||
Magnesium Chloride | 5,432 | — | — | — | 5,432 | |||||||||||||||
Brines | 229 | — | — | — | 229 | |||||||||||||||
Total Revenue | $ | 107,917 | $ | 63,686 | $ | 6,312 | $ | — | $ | 177,915 | ||||||||||
Note 13 | — COMPENSATION PLANS |
Cash Bonus Programs—At times, we use cash bonus programs under which employees may receive cash bonuses based on corporate, department, location, or individual performance or other events or accomplishments. We accrue cash bonus expense related to the current year's performance. We did not meet our performance metrics related to the 2019 cash bonus program, and accordingly, we will not be paying cash bonuses for 2019 under the program. We did not meet our performance metrics related to the 2018 cash bonus program, and accordingly, we did not pay cash bonuses for 2018 under the program. We did not implement a cash bonus program for 2017.
Equity Incentive Compensation Plan—Our Board of Directors and stockholders adopted a long-term incentive compensation plan called the Intrepid Potash, Inc. Amended and Restated Equity Incentive Plan (the "Plan"). We have issued restricted shares, common stock, performance units, and non-qualified stock option awards under the Plan. As of December 31, 2019, 1,993,932 restricted shares and options to purchase 3,134,794 shares of common stock were outstanding. As of December 31, 2019, approximately 9.2 million shares of common stock remained available for issuance under the Plan. Total compensation expense related to the Plan was $4.3 million, $4.2 million, and $3.6 million, for the years ended December 31, 2019, 2018, and 2017, respectively. As of December 31, 2019, there was $5.3 million of total remaining unrecognized compensation expense that is expected to be recognized over a weighted-average period of 1.6 years. When restricted shares and performance units vest and when stock options are exercised, new shares are issued and considered outstanding for financial statement purposes.
Restricted Shares
•Restricted Shares with Service Conditions—Under the Plan, the Compensation Committee of the Board of Directors (the "Compensation Committee") has granted restricted shares of common stock to members of the Board of Directors, executive officers, and other key employees. The restricted shares contain service conditions associated with continued employment or service. The restricted shares provide voting and regular dividend rights to the holders of the awards.
In 2019 the Compensation Committee granted 555,180 restricted shares to executives and key employees under the Plan as part of our annual equity award program. The awards vest over two years, subject to continued employment or service.
In 2019, the Compensation Committee granted 128,395 restricted shares to non-employee members of the Board of Directors and one employee member of the Board of Directors under the Plan for their annual service as directors. The restricted shares vest one year after the date of grant, subject to continued service.
We use the closing price of our common stock on the grant date as the grant date fair value for these awards. We record compensation expense monthly using the straight-line recognition method over the vesting period of the award. The weighted-average grant date fair value per share for restricted shares with service conditions issued in 2019, 2018, and 2017 was $3.47, $4.16, and $2.27, respectively.
•Restricted Shares with Service and Market Conditions— Under the Plan in 2019 and 2017, the Compensation Committee granted restricted shares of common stock with service and market conditions to a member of our executive team as part of his annual compensation package. These restricted share grants contain
75
service and market conditions. These grants vest over three years. The market condition for the 2019 award has not been met as of December 31, 2019. The market condition for the 2017 award was met in August 2017. We did not grant any restricted shares of common stock with service and market conditions under the Plan during 2018.
We used a Monte Carlo simulation valuation model to estimate the fair value of these awards on the grant date. We record compensation expense monthly using the accelerated recognition method over the longer of the explicit or derived service period of the award. The weighted-average grant date fair value per share of restricted shares with service and market conditions issued in 2019, and 2017, was $2.89 and $2.10, respectively.
Valuation models require the input of highly subjective assumptions, including the expected volatility of the price of the underlying stock. We used the following assumptions to compute the weighted-average grant date fair market value of restricted stock with service and market conditions granted in 2019 and 2017:
2019 | 2017 | |||||||
Closing stock price on grant date | $ | 3.31 | $ | 2.29 | ||||
Risk free interest rate | 2.2 | % | 1.7 | % | ||||
Dividend yield | — | % | — | % | ||||
Estimated volatility | 84.5 | % | 81.7 | % | ||||
Expected life | 4.81 years | 5.00 years | ||||||
Restricted Shares with Service and Performance Conditions—In 2019 the Compensation Committee granted 218,393 restricted shares of common stock to executive officers, and other key employees. These restricted share grants vest one year after the grant date, subject to continued service and the company meeting certain performance goals. We did not meet the performance goals and 218,393 restricted shares were canceled.
A summary of all activity relating to our restricted shares for the year ended December 31, 2019, is presented below:
Weighted Average Grant-Date Fair Value | |||||||
Shares | |||||||
Restricted shares of common stock, beginning of period | 1,953,305 | $ | 1.87 | ||||
Granted with service only condition | 683,575 | $ | 3.47 | ||||
Granted with service and performance conditions | 218,393 | $ | 3.81 | ||||
Granted with service and market conditions | 545,707 | $ | 2.89 | ||||
Vested, service only condition | (927,344 | ) | $ | 2.01 | |||
Vested, service and market conditions | (71,251 | ) | $ | 2.10 | |||
Forfeited, service only condition | (190,060 | ) | $ | 2.15 | |||
Forfeited, service and performance conditions | (218,393 | ) | $ | 3.81 | |||
Restricted shares of common stock, end of period | 1,993,932 | $ | 2.69 | ||||
Non-qualified Stock Options
• Non-qualified Stock Options with Service-Based Vesting—The Compensation Committee did not grant any non-qualified stock options under the Plan during 2019. In 2018, the Compensation Committee granted 623,274 non-qualified stock options under the Plan to a member of our executive team as part of his annual compensation package. The stock options have a ten-year term from the grant date and vest over three years.
76
In measuring compensation expense for options, we estimated the fair value of the award on the grant date using the Black‑Scholes option valuation model. We record compensation expense monthly using the straight-line recognition method over the vesting period of the award.
Option valuation models require the input of highly subjective assumptions, including the expected volatility of the price of the underlying stock. We used the following assumptions to compute the weighted average fair market value of options with service-based vesting granted in 2018, and 2017:
2018 | 2017 | |||||||
Closing stock price on grant date | $ | 3.90 | $ | 2.29 | ||||
Risk free interest rate | 1.1 | % | 1.6 | % | ||||
Dividend yield | — | % | — | % | ||||
Estimated volatility | 72.8 | % | 71.5 | % | ||||
Expected option life | 6.00 years | 6.00 years | ||||||
Our estimate of volatility was based on the historic volatility of our common stock over a period comparable to the expected life of the option. The estimate of expected option life was determined based on the "simplified method," giving consideration to the overall vesting period and the contractual terms of the award. This method was used because we have very little option exercise history for options issued under the Plan. The risk-free interest rate for the period that matched the option awards' expected life was based on the U.S. Treasury constant maturity yield at the time of grant.
•Non-qualified Stock Options with Service and Market Conditions—The Compensation Committee did not grant any non-qualified stock options with service and market conditions under the Plan during 2019. In 2018, the Compensation Committee granted 934,911 non-qualified stock options with service and market conditions under the Plan to a member of our executive team as part of his annual compensation package. The stock options vest in three equal annual installments, subject to continued employment; provided, however, that no vesting would occur unless and until the volume-weighted average closing market price or our common stock equals or exceeds $5.85 for 20 consecutive trading days on or before the five-year anniversary of the grant date. As of December 31, 2019, the market condition has not been met.
We used a Monte Carlo simulation valuation model to estimate the fair value of these awards on their grant dates. We record compensation expense monthly using the accelerated recognition method over the longer of the explicit or derived service period of the award.
Valuation models require the input of highly subjective assumptions, including the expected volatility of the price of the underlying stock. We used the following assumptions to compute the weighted average fair market value of options with service and market conditions granted in 2018 and 2017:
2018 | 2017 | |||||||
Closing stock price on grant date | $ | 3.90 | $ | 2.29 | ||||
Risk free interest rate | 2.9 | % | 2.2 | % | ||||
Dividend yield | — | % | — | % | ||||
Estimated volatility | 75.0 | % | 81.7 | % | ||||
Expected life | 10.00 years | 10.00 years | ||||||
77
Non-Qualified Stock Option Activity
A summary of all stock option activity for the year ended December 31, 2019, is as follows:
Shares | Weighted Average Exercise Price | Aggregate Intrinsic Value1 | Weighted Average Remaining Contractual Life | ||||||
Outstanding non-qualified stock options, beginning of period | 3,351,684 | $3.91 | |||||||
Granted | — | $— | |||||||
Exercised | (20,745 | ) | $1.03 | ||||||
Forfeited | (69,372 | ) | $1.35 | ||||||
Expired | (126,773 | ) | $22.03 | ||||||
Outstanding non-qualified stock options, end of period | 3,134,794 | $3.25 | $1,857,788 | 7.2 | |||||
Vested or expected to vest, end of period | 3,134,794 | $3.25 | $1,857,788 | 7.2 | |||||
Exercisable non-qualified stock options, end of period | 1,388,702 | $3.10 | $1,408,824 | 6.3 | |||||
1 | The intrinsic value of a stock option is the amount by which the market value exceeds the exercise price as of the end of the period presented. |
We did not grant any stock options during 2019. The weighted-average fair value per share of options to purchase stock granted during 2018, and 2017, was $2.33, and $1.38 per share, respectively. The total intrinsic value of exercised options to purchase stock during 2019 was $41,000 and was $0.3 million in both 2018 and 2017.
Note 14 | — INCOME TAXES |
We account for income taxes in accordance with ASC Topic 740, Income Taxes. This standard requires the recognition of deferred tax assets and liabilities for the tax effect of temporary differences between the financial statement and tax basis of recorded assets and liabilities at enacted tax rates in effect when the related taxes are expected to be settled or realized. We recognize income taxes in each of the tax jurisdictions where we conduct business. The effect on deferred tax assets and liabilities of a change in tax rates is recognized in income in the period that includes the enactment date.
A summary of the provision for income taxes is as follows (in thousands):
Year Ended December 31, | ||||||||||||
2019 | 2018 | 2017 | ||||||||||
Current portion of income tax expense (benefit): | ||||||||||||
Federal | $ | — | $ | 23 | $ | (2,793 | ) | |||||
State | 53 | 85 | 10 | |||||||||
Deferred portion of income tax expense: | ||||||||||||
Federal | — | — | — | |||||||||
State | — | — | — | |||||||||
Total income tax expense (benefit) | $ | 53 | $ | 108 | $ | (2,783 | ) | |||||
78
A reconciliation of the federal statutory income tax rate of 21% for 2019 and 2018, and 35% for 2017 to our effective rate is as follows (in thousands, except percentages):
Year Ended December 31, | ||||||||||||
2019 | 2018 | 2017 | ||||||||||
Federal taxes at statutory rate | $ | 2,874 | $ | 2,497 | $ | (8,873 | ) | |||||
Add: | ||||||||||||
State taxes, net of federal benefit | 1,245 | 1,663 | (1,414 | ) | ||||||||
Change in valuation allowance | (6,754 | ) | (3,330 | ) | (104,710 | ) | ||||||
Change in federal and state tax rates | 2,322 | 634 | 115,545 | |||||||||
Percentage depletion | (600 | ) | (656 | ) | (598 | ) | ||||||
Other | 966 | (700 | ) | (2,733 | ) | |||||||
Net expense (benefit) as calculated | $ | 53 | $ | 108 | $ | (2,783 | ) | |||||
Effective tax rate | 0.4 | % | 0.9 | % | 11.0 | % | ||||||
Our effective tax rate for the years ended December 31, 2019, and 2018, differs from the U.S. federal statutory rate due to the valuation allowance.
During the year ended December 31, 2017, our effective tax rate was impacted by the decrease in our expected future rate at which our deferred tax assets will reverse due to newly enacted federal tax legislation, which reduced the value of our deferred tax assets by $115.5 million. Since we have a full valuation allowance against our deferred tax assets, a corresponding decrease in our valuation allowance was also required. The net decrease in our valuation allowance was $104.7 million for the year ended December 31, 2017. Finally, our effective tax rate was impacted by a benefit of $2.7 million related to our ability to monetize existing alternative minimum tax credits through a carryback as well as an election available to taxpayers in 2017.
As of December 31, 2019, and 2018, we had gross deferred tax assets of $211.6 million and $218.4 million, respectively. During the year ended December 31, 2019, our deferred tax assets decreased primarily due to varying business conditions for normal business transactions and operations as well as changes to state tax rates and apportionment laws. Included in gross deferred tax assets as of December 31, 2019 were approximately $230.0 million of federal net operating loss carryforwards, which expire beginning in 2033, and approximately $296.6 million of state net operating loss carry forwards, the majority of which begin to expire in 2033. Also included are $1.9 million of federal research and development credits which begin to expire in 2031. The federal loss carryforward could be subject to examination by the tax authorities within three years after the carryforward is utilized, while the state net operating loss carryforwards could be subject to examination by the tax authorities generally within three and four years after the carryforward is utilized, depending on jurisdiction.
79
Significant components of our deferred tax assets and liabilities were as follows (in thousands):
December 31, | ||||||||
2019 | 2018 | |||||||
Deferred tax assets (liabilities): | ||||||||
Property, plant, equipment and mineral properties, net | $ | 133,586 | $ | 138,855 | ||||
Federal and state net operating loss carryforwards | 63,194 | 65,779 | ||||||
Asset retirement obligation | 5,763 | 5,950 | ||||||
Deferred revenue | 4,371 | 3,035 | ||||||
Other | 2,839 | 2,888 | ||||||
R&D credits | 1,870 | 1,870 | ||||||
Total deferred tax assets | 211,623 | 218,377 | ||||||
Valuation allowance | (211,623 | ) | (218,377 | ) | ||||
Deferred tax asset, net | $ | — | $ | — | ||||
In assessing the need for a valuation allowance, we consider whether it is more likely than not that some portion or all of the deferred tax assets will not be realized. We evaluate our ability to realize the tax benefits associated with deferred tax assets by analyzing the relative impact of all the available positive and negative evidence regarding our forecasted taxable income using both historical and projected future operating results, the reversal of existing taxable temporary differences, taxable income in prior carryback years, as permitted by regulation, and the availability of tax planning strategies. The ultimate realization of deferred tax assets is dependent upon the generation of certain types of future taxable income during the periods in which those temporary differences become deductible. In making this assessment, we consider the scheduled reversal of deferred tax liabilities, our ability to carry back the deferred tax asset, projected future taxable income, and tax planning strategies.
As of December 31, 2019, and 2018, we have a full valuation allowance against our deferred tax assets because we do not believe it is more likely than not that we will fully realize the benefit of the deferred tax assets. During 2019, our valuation allowance decreased $6.8 million. The decrease was mainly due to current year reversals of our deferred tax assets. Our deferred tax asset, net of the valuation allowance, at both December 31, 2019, and 2018, is zero.
The estimated statutory income tax rates that are applied to our current and deferred income tax calculations are impacted most significantly by the tax jurisdictions in which we conduct business. Changing business conditions for normal business transactions and operations, as well as changes to state tax rates and apportionment laws, potentially alter the apportionment of income among the states for income tax purposes. These changes to apportionment laws result in changes in the calculation of our current and deferred income taxes, including the valuation of our deferred tax assets and liabilities. The effects of any such changes are recorded in the period of the adjustment. Such adjustments can increase or decrease the net deferred tax asset on the balance sheet and impact the corresponding deferred tax benefit or deferred tax expense on the statement of operations.
A decrease of our state tax rate decreases the value of its deferred tax asset, resulting in additional deferred tax expense being recorded in the income statement. Conversely, an increase in our state income tax rate would increase the value of the deferred tax asset, resulting in an increase in our deferred tax benefit. Because of the magnitude of the temporary differences between our book and tax basis in the assets, relatively small changes in the state tax rate may have a pronounced impact on the value of our net deferred tax asset.
Each quarter we evaluate the need for a liability for uncertain tax positions. At December 31, 2019, and 2018, there were no items that required disclosure in accordance with FASB guidance on accounting for uncertainty in income taxes.
We operate, and accordingly file income tax returns, in the U.S. federal jurisdiction and various U.S. state jurisdictions. With few exceptions, we are no longer subject to income tax audits that could result in an assessment for years prior to 2016.
Note 15 | — COMMITMENTS AND CONTINGENCIES |
Reclamation Deposits and Surety Bonds—As of December 31, 2019, and 2018, we had $22.3 million and $19.0 million, respectively, of security placed principally with the State of Utah and the Bureau of Land Management for eventual reclamation of its various facilities. Of this total requirement, as of December 31, 2019, and 2018, $0.5 million consisted of
80
long-term restricted cash deposits reflected in "Other" long-term assets on the balance sheet, and $21.8 million and $18.5 million, respectively, was secured by surety bonds issued by an insurer. The surety bonds are held in place by an annual fee paid to the issuer.
We may be required to post additional security to fund future reclamation obligations as reclamation plans are updated or as governmental entities change requirements.
Legal—In February 2015, Mosaic Potash Carlsbad Inc. (“Mosaic”) filed a complaint and application for preliminary injunction and permanent injunction against Steve Gamble and us in the Fifth Judicial District Court for the County of Eddy in the State of New Mexico. Mr. Gamble is a former employee of Intrepid and Mosaic. In August 2015, the court denied Mosaic’s application for preliminary injunction. In July 2016, Mosaic filed a second complaint against Mr. Gamble and us in U.S. District Court for the District of New Mexico. In January 2018, the two lawsuits were consolidated into one lawsuit pending in the U.S. District Court for the District of New Mexico. Mosaic alleges against us violations of the New Mexico Uniform Trade Secrets Act, tortious interference with contract relating to Mr. Gamble’s separation of employment from Mosaic, violations of the Computer Fraud and Abuse Act, conversion, and civil conspiracy relating to the alleged misappropriation of Mosaic’s confidential information and related actions. Mosaic seeks $23 million to $28 million in compensatory damages, $28 million to $37 million in exemplary damages, and attorneys' fees, punitive damages, injunctive relief, and future royalty damages in unspecified amounts. A settlement conference is scheduled for March 25, 2020 and a trial date has been set for April 27, 2020 through May 8, 2020. The lawsuit has progressed through discovery with many pending motions and additions concerning both the facts and confidentiality procedures concerning trade secrets. We believe that we have defenses against the claims asserted and we are vigorously defending against the lawsuit.
We have recorded no loss contingency in our statements of operations related to this legal matter.
In February 2019, Pecos Valley Artesian Conservancy District, Carlsbad Irrigation District, and Otis Mutual Domestic Water Consumers & Sewage Works Association (together, the "Protestants") filed an expedited inter se proceeding against us, Henry McDonald, Select Energy Services, LLC d/b/a Gregory Rockhouse Ranch, and Vision Resources, Inc. in the Fifth Judicial District Court for the County of Chaves in the State of New Mexico. This court serves as the adjudication court for the Pecos Stream System, which includes the Pecos River. The Protestants challenge the validity of our Pecos River water rights, representing approximately 20,000 acre feet per year. In August 2019, the parties stipulated to the jurisdiction of the adjudication court. To promote settlement, the adjudication court established a settlement schedule and ordered a trial date in August 2020 if the parties have not reached a settlement by that time. We are currently allowed to sell water associated with 5,700 acre feet per year of these water rights under preliminary authorizations issued in 2017 and 2018 by the New Mexico Office of the State Engineer ("OSE"). The preliminary authorizations allowed for water sales to begin immediately, subject to repayment if the underlying water rights are ultimately found to be invalid. Separate from the adjudication proceeding, the Protestants have protested these preliminary authorizations before the OSE. Although the OSE is required to hold a hearing relating to the protests, it has temporarily stayed the hearing process until the adjudication process is complete. In the adjudication proceeding, the court is expected to make a determination as to the size of our Pecos River water rights. In addition, the Protestants are asking for unspecified monetary and injunctive relief, as well as attorneys' fees and costs, relating to our sale of water under these water rights and breach of contract claims. We believe that our legal position with respect to the validity of our water rights is solid, and we are vigorously defending against this matter. We have not recorded a loss contingency in our condensed consolidated statements of operations relating to this matter.
We are subject to other claims and legal actions in the ordinary course of business. Legal costs are expensed as incurred. While there are uncertainties in predicting the outcome of any claim or legal action, we believe that the ultimate resolution of these other claims or actions is not reasonably likely to have a material adverse effect on our financial condition, results of operations, or cash flows.
81
Note 16 | — FAIR VALUE MEASUREMENTS |
We measure our financial assets and liabilities in accordance with Accounting Standards Codification™ ("ASC") Topic 820, Fair Value Measurements and Disclosures. ASC Topic 820 defines fair value as the price that would be received to sell an asset or paid to transfer a liability (an exit price) in an orderly transaction between market participants at the measurement date. The topic establishes market or observable inputs as the preferred sources of values, followed by assumptions based on hypothetical transactions in the absence of market inputs. The topic also establishes a hierarchy for grouping these assets and liabilities based upon the lowest level of input that is significant to the fair value measurement. The definition of each input is described below:
• | Level 1—Quoted prices in active markets for identical assets and liabilities |
• | Level 2—Quoted prices in active markets for similar assets and liabilities, quoted prices for identical or similar instruments in markets that are not active, and model‑derived valuations whose inputs are observable or whose significant value drivers are observable |
• | Level 3—Significant inputs to the valuation model are unobservable |
As of December 31, 2019, and 2018, our cash consisted of bank deposits. Other financial assets and liabilities including, accounts receivable, refundable income taxes, accounts payable, accrued liabilities, and advances on credit facility are carried at cost which approximates fair value because of the short-term nature of these instruments.
As of December 31, 2019, and 2018, the estimated fair value of our outstanding Notes was $50.0 million and $48.1 million, respectively. The fair value of our Notes is estimated using a discounted cash flow analysis based on current borrowing rates for debt with similar remaining maturities and ratings (a Level 2 input) and is designed to approximate the amount at which the instruments could be exchanged in an arm's-length transaction between knowledgeable willing parties.
Note 17 | — EMPLOYEE BENEFITS |
401(k) Plan
We maintain a savings plan qualified under Internal Revenue Code Sections 401(a) and 401(k). The 401(k) Plan is available to eligible employees of our consolidated entities. Employees may contribute amounts as allowed by the U.S. Internal Revenue Service to the 401(k) Plan (subject to certain restrictions) in before-tax contributions. In January 2016, we elected to suspend matching employee contributions to the 401(k) Plan and resumed contributions to the 401(k) Plan in August 2016, matching employee contributions on a dollar-for-dollar basis up to a maximum of 2% of the employee's base compensation. In January 2018, we increased the matching contributions on a dollar-for-dollar basis up to a maximum of 5% of the employee's base compensation. Our contributions to the 401(k) Plan in the following periods were (in thousands):
Contributions | ||||
Year Ended December 31, 2019 | $ | 1,522 | ||
Year Ended December 31, 2018 | $ | 1,410 | ||
Year Ended December 31, 2017 | $ | 685 | ||
Note 18 | — BUSINESS SEGMENTS |
Our operations are organized into three segments: potash, Trio® and oilfield solutions. The reportable segments are determined by management based on several factors including the types of products and services sold, production processes, markets served and the financial information available for our chief operating decision maker. We evaluate performance based on the gross margins of the respective business segments and do not allocate corporate selling and administrative expenses, among others, to the respective segments. Intersegment sales prices are market-based and are eliminated in the "Other" column. Information for each segment is provided in the tables that follow (in thousands).
82
Year Ended December 31, 2019 | Potash | Trio® | Oilfield Solutions | Other | Consolidated | |||||||||||||||
Sales1 | $ | 124,648 | $ | 69,551 | $ | 27,894 | $ | (2,018 | ) | $ | 220,075 | |||||||||
Less: Freight costs | 18,715 | 20,514 | 936 | (109 | ) | 40,056 | ||||||||||||||
Warehousing and handling costs | 4,745 | 3,876 | — | — | 8,621 | |||||||||||||||
Cost of goods sold | 73,401 | 42,251 | 12,367 | (1,909 | ) | 126,110 | ||||||||||||||
Lower of cost or NRV inventory adjustments | — | 1,810 | — | — | 1,810 | |||||||||||||||
Gross Margin | $ | 27,787 | $ | 1,100 | $ | 14,591 | $ | — | $ | 43,478 | ||||||||||
Depreciation, depletion, and amortization2 incurred | $ | 25,796 | $ | 6,163 | $ | 1,566 | $ | 810 | $ | 34,335 | ||||||||||
Year Ended December 31, 2018 | Potash | Trio® | Oilfield Solutions | Other | Consolidated | |||||||||||||||
Sales1 | $ | 124,058 | $ | 66,808 | $ | 17,404 | $ | — | $ | 208,270 | ||||||||||
Less: Freight costs | 17,682 | 19,370 | — | — | 37,052 | |||||||||||||||
Warehousing and handling costs | 5,046 | 4,225 | 10 | — | 9,281 | |||||||||||||||
Cost of goods sold | 72,322 | 45,284 | 4,349 | — | 121,955 | |||||||||||||||
Lower of cost or NRV inventory adjustments | — | 1,711 | — | — | 1,711 | |||||||||||||||
Gross Margin (Deficit) | $ | 29,008 | $ | (3,782 | ) | $ | 13,045 | $ | — | $ | 38,271 | |||||||||
Depreciation, depletion, and amortization incurred2 | $ | 25,134 | $ | 6,343 | $ | 343 | $ | 395 | $ | 32,215 | ||||||||||
Year Ended December 31, 2017 | Potash | Trio® | Oilfield Solutions | Other | Consolidated | |||||||||||||||
Sales1 | $ | 107,917 | $ | 63,686 | $ | 6,312 | $ | — | $ | 177,915 | ||||||||||
Less: Freight costs | 13,912 | 18,104 | — | — | 32,016 | |||||||||||||||
Warehousing and handling costs | 5,556 | 4,114 | — | — | 9,670 | |||||||||||||||
Cost of goods sold | 72,229 | 45,187 | 546 | — | 117,962 | |||||||||||||||
Lower of cost or NRV inventory adjustments | 550 | 5,829 | — | — | 6,379 | |||||||||||||||
Gross (Deficit) Margin | $ | 15,670 | $ | (9,548 | ) | $ | 5,766 | $ | — | $ | 11,888 | |||||||||
Depreciation, depletion, and amortization incurred2 | $ | 26,485 | $ | 6,576 | $ | 19 | $ | 129 | $ | 33,209 | ||||||||||
1 Segment sales include the sales of byproducts generated during the production of potash and Trio®.
2 Depreciation, depletion, and amortization incurred for potash and Trio® excludes depreciation, depletion, and amortization absorbed in or (relieved from) inventory.
Total assets are not presented for each reportable segment as they are not reviewed by, nor otherwise regularly provided to, the chief operating decision maker.
Note 19 | — CONCENTRATION OF CREDIT RISK |
Credit risk represents the loss that would be recognized at the reporting date if counterparties failed completely to perform as contracted. Concentrations of credit risk, whether on- or off-balance sheet, that arise from financial instruments exist for counterparties when they have similar economic characteristics that would cause their ability to meet contractual obligations to be similarly affected by changes in economic or other conditions.
83
Our products are marketed for sale into three primary markets. These markets are the agricultural market as a fertilizer, the industrial market as a component in drilling fluids for oil and gas exploration, and the animal feed market as a nutrient. Credit risks associated with the collection of accounts receivable are primarily related to the impact of external factors on our customers. Our customers are distributors and end-users whose credit worthiness and ability to meet their payment obligations will be affected by factors in their industries and markets. Those factors include soil nutrient levels, crop prices, weather, the type of crops planted, changes in diets, growth in population, the amount of land under cultivation, fuel prices and consumption, oil and gas drilling and completion activity, the demand for biofuels, government policy, and the relative value of currencies. Our industrial sales are significantly influenced by oil and gas drilling activity.
In 2019, 2018, and 2017, no customer accounted for more than 10% of our sales. Because of the size of our company compared to the overall size of the North American market and the regional demands for our products, we believe that a decline in a specific customer's purchases would not have a material adverse long-term effect on our financial results.
In each of the last three years ended December 31, 2019, 2018, and 2017, 94%, 95%, and 88%, respectively, of our total sales were sold to customers located in the United States. All of our long-lived assets are located in the United States.
We maintain cash accounts with several financial institutions. At times, the balances in the accounts may exceed the $250,000 balance insured by the Federal Deposit Insurance Corporation.
Note 20 | — FINANCIAL INFORMATION FOR SUBSIDIARY GUARANTORS |
OF POSSIBLE FUTURE PUBLIC DEBT
Intrepid Potash, Inc., as the parent company, has no independent assets or operations, and operations are conducted solely through its subsidiaries. Cash generated from operations is held at the parent company level as cash on hand and short- and long-term investments. Cash on hand totaled $20.6 million and $33.2 million at December 31, 2019, and 2018, respectively. In the event that one or more of our wholly-owned operating subsidiaries guarantee public debt securities in the future, those guarantees will be full and unconditional and will constitute the joint and several obligations of the subsidiary guarantors. Our other subsidiaries are minor. There are no restrictions on our ability to obtain cash dividends or other distributions of funds from the subsidiary guarantors, except those imposed by applicable law.
Note 21 | — QUARTERLY FINANCIAL DATA (UNAUDITED) (in thousands, except per share amounts) |
Three Months Ended | ||||||||||||||||
December 31, 2019 | September 30, 2019 | June 30, 2019 | March 31, 2019 | |||||||||||||
Sales | $ | 48,849 | $ | 51,160 | $ | 62,512 | $ | 57,554 | ||||||||
Cost of Goods Sold | $ | 26,735 | $ | 31,863 | $ | 35,818 | $ | 31,694 | ||||||||
Lower of cost or NRV inventory adjustments | $ | 348 | $ | 1,462 | $ | — | $ | — | ||||||||
Gross Margin | $ | 10,190 | $ | 6,949 | $ | 13,171 | $ | 13,168 | ||||||||
Net Income (Loss) | $ | 2,082 | $ | (217 | ) | $ | 5,611 | $ | 6,155 | |||||||
Basic and Diluted Earnings Per Share | $ | 0.02 | $ | — | $ | 0.04 | $ | 0.05 | ||||||||
84
Three Months Ended | ||||||||||||||||
December 31, 2018 | September 30, 2018 | June 30, 2018 | March 31, 2018 | |||||||||||||
Sales | $ | 54,364 | $ | 41,410 | $ | 55,176 | $ | 57,320 | ||||||||
Cost of Goods Sold | $ | 26,504 | $ | 23,370 | $ | 35,426 | $ | 36,655 | ||||||||
Lower of cost or NRV inventory adjustments | $ | 930 | $ | — | $ | 76 | $ | 705 | ||||||||
Gross Margin | $ | 14,826 | $ | 8,959 | $ | 7,286 | $ | 7,200 | ||||||||
Net Income (Loss) | $ | 7,634 | $ | 3,350 | $ | (958 | ) | $ | 1,757 | |||||||
Basic and Diluted Earnings (Loss) Per Share | $ | 0.06 | $ | 0.03 | $ | (0.01 | ) | $ | 0.01 | |||||||
Certain prior period amounts have been reclassified in order to conform to the current period presentation. These reclassifications had no effect on the reported gross margin or net income (loss).
85
SCHEDULE II - VALUATION AND QUALIFYING ACCOUNTS
(In thousands) | ||||||||||||||||
Description | Balance at Beginning of Year | Charged to Costs and Expenses | Deductions | Balance at End of Year | ||||||||||||
For the Year Ended December 31, 2017 | ||||||||||||||||
Allowances deducted from assets | ||||||||||||||||
Deferred tax assets - valuation allowance | $ | 326,417 | $ | — | $ | (104,710 | ) | $ | 221,707 | |||||||
Reserve for parts inventory obsolescence | 3,109 | 1,073 | — | 4,182 | ||||||||||||
Allowance for doubtful accounts and other receivables | — | 865 | — | 865 | ||||||||||||
Total allowances deducted from assets | $ | 329,526 | $ | 1,938 | $ | (104,710 | ) | $ | 226,754 | |||||||
For the Year Ended December 31, 2018 | ||||||||||||||||
Allowances deducted from assets | ||||||||||||||||
Deferred tax assets - valuation allowance | $ | 221,707 | $ | — | $ | (3,330 | ) | $ | 218,377 | |||||||
Reserve for parts inventory obsolescence | 4,182 | 15 | (2,454 | ) | 1,743 | |||||||||||
Allowance for doubtful accounts and other receivables | 865 | 100 | (500 | ) | 465 | |||||||||||
Total allowances deducted from assets | $ | 226,754 | $ | 115 | $ | (6,284 | ) | $ | 220,585 | |||||||
For the Year Ended December 31, 2019 | ||||||||||||||||
Allowances deducted from assets | ||||||||||||||||
Deferred tax assets - valuation allowance | $ | 218,377 | $ | — | $ | (6,754 | ) | $ | 211,623 | |||||||
Reserve for parts inventory obsolescence | 1,743 | — | (1,127 | ) | 616 | |||||||||||
Allowance for doubtful accounts and other receivables | 465 | 75 | (60 | ) | 480 | |||||||||||
Total allowances deducted from assets | $ | 220,585 | $ | 75 | $ | (7,941 | ) | $ | 212,719 | |||||||
ITEM 9. | CHANGES IN AND DISAGREEMENTS WITH ACCOUNTANTS ON ACCOUNTING |
AND FINANCIAL DISCLOSURE
None.
ITEM 9A. | CONTROLS AND PROCEDURES |
Evaluation of Disclosure Controls and Procedures
We maintain "disclosure controls and procedures." Our disclosure controls and procedures are designed to ensure that information required to be disclosed by us in reports that we file or submit under the Exchange Act is recorded, processed, summarized, and reported within the time periods specified in SEC rules and forms. Our disclosure controls and procedures are also designed to ensure that this information is accumulated and communicated to our management, including our principal executive officer and principal financial officer, as appropriate, to allow timely decisions regarding required disclosure. Under the supervision and with the participation of our management, including our principal executive officer and principal financial officer, we conducted an evaluation of our disclosure controls and procedures as of December 31, 2019. Based on this evaluation, our principal executive officer and principal financial officer have concluded that our disclosure controls and procedures were effective as of December 31, 2019, at the reasonable assurance level.
Management's Report on Internal Control over Financial Reporting
Our management is responsible for establishing and maintaining adequate "internal control over financial reporting." Our internal control over financial reporting is a process designed to provide reasonable assurance regarding the reliability of financial reporting and the preparation of financial statements for external purposes in accordance with GAAP. Under the
86
supervision and with the participation of our management, including our principal executive officer and principal financial officer, we conducted an evaluation of the effectiveness of our internal control over financial reporting as of December 31, 2019, based on the criteria established in Internal Control—Integrated Framework issued by the Committee of Sponsoring Organizations of the Treadway Commission (COSO) in 2013.
Based on the results of our evaluation, our management concluded that our internal control over financial reporting was effective as of December 31, 2019.
The effectiveness of our internal control over financial reporting as of December 31, 2019, has been audited by KPMG LLP, our independent registered public accounting firm, as stated in their report which appears herein.
Changes in Internal Control over Financial Reporting
There were no changes in our internal control over financial reporting that occurred during the three months ended December 31, 2019, that materially affected, or are reasonably likely to materially affect, our internal control over financial reporting.
Inherent Limitations on Effectiveness of Controls
Our management, including our principal executive officer and principal financial officer, do not expect that our disclosure controls or our internal control over financial reporting will prevent all errors and all fraud. A control system, no matter how well conceived and operated, can provide only reasonable, not absolute, assurance that the objectives of the control system are met. Further, the design of a control system must reflect the fact that there are resource constraints, and the benefits of controls must be considered relative to their costs. Because of the inherent limitations in all control systems, no evaluation of controls can provide absolute assurance that all control issues and instances of fraud, if any, within Intrepid have been detected. These inherent limitations include the realities that judgments in decision-making can be faulty, and that breakdowns can occur because of a simple error or mistake. Additionally, controls can be circumvented by the individual acts of some persons, by collusion of two or more people, or by management override of the controls. The design of any system of controls also is based in part upon certain assumptions about the likelihood of future events, and there can be no assurance that any design will succeed in achieving its stated goals under all potential future conditions. Over time, controls may become inadequate because of changes in conditions, or the degree of compliance with policies or procedures may deteriorate. Because of the inherent limitations in a cost-effective control system, misstatements due to error or fraud may occur and not be detected.
ITEM 9B. | OTHER INFORMATION |
Not applicable.
87
PART III
ITEM 10. | DIRECTORS, EXECUTIVE OFFICERS AND CORPORATE GOVERNANCE |
Biographical information about our executive officers is set forth in "Item 1. Business—Executive Officers." Other information required by this item will be included in the proxy statement for our 2020 annual stockholders' meeting and is incorporated by reference into this Annual Report on Form 10-K.
ITEM 11. | EXECUTIVE COMPENSATION |
Information required by this item will be included in the proxy statement for our 2020 annual stockholders' meeting and is incorporated by reference into this Annual Report on Form 10-K.
ITEM 12. | SECURITY OWNERSHIP OF CERTAIN BENEFICIAL OWNERS AND MANAGEMENT AND RELATED STOCKHOLDER MATTERS |
Information required by this item will be included in the proxy statement for our 2020 annual stockholders' meeting and is incorporated by reference into this Annual Report on Form 10-K.
ITEM 13. | CERTAIN RELATIONSHIPS AND RELATED TRANSACTIONS, |
AND DIRECTOR INDEPENDENCE
Information required by this item will be included in the proxy statement for our 2020 annual stockholders' meeting and is incorporated by reference into this Annual Report on Form 10-K.
ITEM 14. | PRINCIPAL ACCOUNTING FEES AND SERVICES |
Information required by this item will be included in the proxy statement for our 2020 annual stockholders' meeting and is incorporated by reference into this Annual Report on Form 10-K.
88
PART IV
ITEM 15. | EXHIBITS, FINANCIAL STATEMENT SCHEDULES |
(a) Financial Statements, Financial Statement Schedules and Exhibits
The following are filed as a part of this Annual Report on Form 10-K:
(1) Financial Statements
Management's Report on Internal Control over Financial Reporting
Report of Independent Registered Accounting Firm
Consolidated Balance Sheets as of December 31, 2019, and 2018
Consolidated Statements of Operations for the years ended December 31, 2019, 2018, and 2017
Consolidated Statements of Stockholders' Equity for the years ended December 31, 2019, 2018, and 2017
Consolidated Statements of Cash Flows for the years ended December 31, 2019, 2018, and 2017
Notes to Consolidated Financial Statements
(2) Financial Statement Schedules
Schedule | Schedule Description | |
Schedule II | Valuation and Qualifying Accounts | |
Schedule II is filed as part of this Annual Report on Form 10-K and is set forth immediately following the Notes to the Consolidated Financial Statements referred to above. All other financial statement schedules have been omitted because they are not required, are not applicable, or the information is included in the consolidated financial statements or notes thereto.
(3) Exhibits
The following exhibits are filed or incorporated by reference in this report:
Incorporated by Reference from the Below-Listed Form (Each Filed under SEC File Number 001-34025) | |||||
Exhibit Number | Exhibit Description | Form | Filing Date | ||
Restated Certificate of Incorporation of Intrepid Potash, Inc. | 8-K | April 25, 2008 | |||
Certificate of Amendment to Restated Certificate of Incorporation of Intrepid Potash, Inc. | 8-K | May 26, 2016 | |||
Amended and Restated Bylaws of Intrepid Potash, Inc. | 8-K | June 25, 2015 | |||
Description of Registrant's Securities | * | ||||
Form of Indemnification Agreement with each director and officer | 8-K | April 25, 2008 | |||
Director Designation and Voting Agreement, dated as of April 25, 2008, by and among Intrepid Potash, Inc., Harvey Operating and Production Company, Intrepid Production Corporation, and Potash Acquisition, LLC | 8-K | May 1, 2008 | |||
Registration Rights Agreement, dated as of April 25, 2008, by and among Intrepid Potash, Inc., Harvey Operating & Production Company, Intrepid Production Corporation, and Potash Acquisition, LLC | 8-K | May 1, 2008 | |||
Acknowledgment and Relinquishment, dated as of December 19, 2011, by and among Intrepid Potash, Inc., Harvey Operating and Production Company, Intrepid Production Corporation, and Potash Acquisition, LLC | 10-K | February 16, 2012 | |||
Amended and Restated Credit Agreement, dated as of August 1, 2019, by and among Intrepid Potash, Inc., the subsidiaries party thereto, Bank of Montreal, as administrative agent, swing line lender, lead arranger, and book runner, and the lenders party thereto. | 8-K | August 1, 2019 | |||
89
Amended and Restated Note Purchase Agreement, dated as of October 31, 2016, by and among Intrepid Potash, Inc. and each of the purchasers named therein | 8-K | November 1, 2016 | |||
First Amendment to Amended and Restated Note Purchase Agreement, dated as of November 9, 2016, by and among Intrepid Potash, Inc. and each of the purchasers named therein. | 8-K | November 14, 2016 | |||
Fourth Amendment to Amended and Restated Note Purchase Agreement, dated as of June 30, 2017, by and among Intrepid Potash, Inc. and each of the purchasers named therein | 8-K | June 30, 2017 | |||
Amended and Restated Employment Agreement, dated as of May 19, 2010, by and between Intrepid Potash, Inc. and Robert P. Jornayvaz III+ | 8-K | May 19, 2010 | |||
Amendment to Employment Agreement, dated February 23, 2011, by and between Intrepid Potash, Inc. and Robert P. Jornayvaz III+ | 8-K | March 1, 2011 | |||
Second Amendment to Employment Agreement, dated as of February 14, 2013, by and between Intrepid Potash, Inc. and Robert P. Jornayvaz III+ | 8-K | February 19, 2013 | |||
Third Amendment to Employment Agreement, dated as of March 22, 2016, by and between Intrepid Potash, Inc. and Robert P. Jornayvaz III+ | 8-K | March 23, 2016 | |||
Fourth Amendment to Employment Agreement, dated as of March 12, 2019, by and between Intrepid Potash, Inc. and Robert P. Jornayvaz III+ | 8-K | March 15, 2019 | |||
Amended and Restated Employment Agreement, dated as of May 19, 2010, by and between Intrepid Potash, Inc. and Hugh E. Harvey, Jr.+ | 8-K | May 19, 2010 | |||
Intrepid Potash, Inc. Amended and Restated Equity Incentive Plan+ | 8-K | May 24, 2019 | |||
Form of Restricted Stock Agreement under Intrepid Potash, Inc. Amended and Restated Equity Incentive Plan+ | 10-Q/A | August 4, 2016 | |||
Form of Stock Option Agreement under Intrepid Potash, Inc. Amended and Restated Equity Incentive Plan+ | 10-Q/A | August 4, 2016 | |||
Intrepid Potash, Inc. Amended and Restated Short-Term Incentive Plan+ | 8-K | May 26, 2016 | |||
Form of Change-of-Control Severance Agreement with Robert P. Jornayvaz III and Hugh E. Harvey, Jr.+ | 10-Q | November 3, 2011 | |||
Form of Change-in-Control Severance Agreement with Margaret E. McCandless and Mark A. McDonald+ | 10-K | March 12, 2019 | |||
Form of Noncompete Agreement with executives other than Robert P. Jornayvaz III+ | 10-K | February 28, 2017 | |||
Form of Retention Agreement+ | 10-K | March 12, 2019 | |||
Aircraft Dry Lease, dated as of January 9, 2009, by and between Intrepid Potash, Inc. and Intrepid Production Holdings LLC | 8-K | January 12, 2009 | |||
First Amendment to Aircraft Dry Lease, dated as of September 1, 2014, by and between Intrepid Potash, Inc. and Intrepid Production Holdings LLC | 8-K | August 18, 2014 | |||
Aircraft Dry Lease, dated as of September 1, 2014, by and between Intrepid Potash, Inc. and Odyssey Adventures, LLC | 8-K | August 18, 2014 | |||
Purchase and Sale Agreement, dated February 5, 2019, by and between Dinwiddie Cattle Company, LLC, Sherbrooke Partners, LLC and Intrepid Potash - New Mexico, LLC. | 10-Q | May 7, 2019 | |||
Amendment to Purchase and Sale Agreement, dated March 28, 2019, by and between Dinwiddie Cattle Company, LLC, Sherbrooke Partners, LLC, and Intrepid Potash - New Mexico, LLC. | 10-Q | May 7, 2019 | |||
Closing Agreement, dated April 23, 2019, by and among Dinwiddie Cattle Company, LLC, Sherbrooke Partners, LLC, and Intrepid Potash - New Mexico, LLC. | 10-Q | August 6, 2019 | |||
List of Subsidiaries | * | ||||
Consent of KPMG LLP | * | ||||
Consent of Agapito Associates, Inc. | * | ||||
Certification of Principal Executive Officer pursuant to Exchange Act Rules 13a-14(a) and 15d-14(a) | * | ||||
90
Certification of Principal Financial Officer pursuant to Exchange Act Rules 13a-14(a) and 15d-14(a) | * | ||||
Certification of Principal Executive Officer pursuant to 18 U.S.C. Section 1350, as adopted pursuant to Section 906 of the Sarbanes-Oxley Act of 2002 | ** | ||||
Certification of Principal Financial Officer pursuant to 18 U.S.C. Section 1350, as adopted pursuant to Section 906 of the Sarbanes-Oxley Act of 2002 | ** | ||||
Mine Safety Disclosure Exhibit | * | ||||
Transition Services Agreement, dated as of April 25, 2008, by and between Intrepid Potash, Inc., Intrepid Oil & Gas, LLC, and Intrepid Potash-Moab, LLC | 8-K | May 1, 2008 | |||
Extension and Amendment to Transition Services Agreement dated July 14, 2009, to be effective as of April 25, 2009, between Intrepid Potash, Inc. and Intrepid Oil & Gas, LLC | 10-Q | August 7, 2009 | |||
Third Amendment to Transition Services Agreement dated March 26, 2010, between Intrepid Potash, Inc. and Intrepid Oil & Gas, LLC | 10-Q | May 5, 2010 | |||
Fourth Amendment to Transition Services Agreement dated March 25, 2011, between Intrepid Potash, Inc. and Intrepid Oil and Gas, LLC | 10-Q | May 5, 2011 | |||
Sixth Amendment to Transition Services Agreement dated April 3, 2013, between Intrepid Potash, Inc. and Intrepid Oil & Gas, LLC | 10-Q | May 2, 2013 | |||
Seventh Amendment to Transition Services Agreement dated March 24, 2015, between Intrepid Potash, Inc. and Intrepid Oil & Gas, LLC | 10-Q | April 28, 2015 | |||
Eighth Amendment to Transition Services Agreement dated March 22, 2017, between Intrepid Potash, Inc. and Intrepid Oil & Gas, LLC | 10-Q | May 2, 2017 | |||
Ninth Amendment to Transition Services Agreement dated February 20, 2019, between Intrepid Potash, Inc. and Intrepid Oil & Gas, LLC. | 10-K | March 12, 2019 | |||
101.INS | XBRL Instance Document | * | |||
101.SCH | XBRL Taxonomy Extension Schema | * | |||
101.CAL | XBRL Extension Calculation Linkbase | * | |||
101.DEF | XBRL Extension Definition Linkbase | * | |||
101.LAB | XBRL Extension Label Linkbase | * | |||
101.PRE | XBRL Extension Presentation Linkbase | * | |||
* | Filed herewith |
** | Furnished herewith |
+ | Management contract or compensatory plan or arrangement |
ITEM 16. | FORM 10-K SUMMARY |
Not applicable.
91
SIGNATURES
Pursuant to the requirements of Section 13 or 15(d) of the Securities Exchange Act of 1934, the registrant has duly caused this report to be signed on its behalf by the undersigned, thereunto duly authorized.
INTREPID POTASH, INC. (Registrant) | ||
March 3, 2020 | /s/ Robert P. Jornayvaz III | |
Robert P. Jornayvaz III - Executive Chairman of the Board, President, and Chief Executive Officer (Principal Executive Officer and Duly Authorized Officer) | ||
Pursuant to the requirements of the Securities Exchange Act of 1934, this report has been signed below by the following persons on behalf of the registrant and in the capacities and on the dates indicated.
Signature | Title | Date | ||
/s/ Robert P. Jornayvaz III | Executive Chairman of the Board, President, and Chief Executive Officer | March 3, 2020 | ||
Robert P. Jornayvaz III | ||||
/s/ Matthew D. Preston | Vice President of Finance (Principal Financial Officer) | March 3, 2020 | ||
Matthew D. Preston | ||||
/s/ Hugh E. Harvey, Jr. | Executive Vice Chairman of the Board | March 3, 2020 | ||
Hugh E. Harvey, Jr. | ||||
/s/ Terry Considine | Director | March 3, 2020 | ||
Terry Considine | ||||
/s/ Chris A. Elliott | Director | March 3, 2020 | ||
Chris A. Elliott | ||||
/s/ J. Landis Martin | Lead Director | March 3, 2020 | ||
J. Landis Martin | ||||
/s/ Barth E. Whitham | Director | March 3, 2020 | ||
Barth E. Whitham | ||||
92