Attached files
| file | filename |
|---|---|
| EX-99.1 - PRESS RELEASE - LHC Group, Inc | exh_991.htm |
| 8-K - FORM 8-K - LHC Group, Inc | f8k_022720.htm |
EXHIBIT 99.2
Supplemental Financial Information Fourth Quarter and Year Ended December 31, 2019 February 26, 2020
Forward - Looking Statements This presentation contains “forward - looking statements” (as defined in the Securities Litigation Reform Act of 1995 ) regarding, among other things, future events or the future financial performance of the Company . Words such as “anticipate,” “expect,” “project,” “intend,” “believe,” “will,” “estimate,” “may,” “could,” “should,” “outlook,” and “guidance” and words and terms of similar substance used in connection with any discussion of future plans, actions, events or results identify forward - looking statements . Forward - looking statements are based on information currently available to the Company and involve estimates, expectations and projections . Investors are cautioned that all such forward - looking statements are subject to risks and uncertainties that could cause actual events or results to differ materially from the events or results described in the forward - looking statements, including, but not limited to, the risks and uncertainties described in our filings with the Securities and Exchange Commission, including our most recent Annual Report on Form 10 - K and subsequent Quarterly Reports on Form 10 - Q and Current Reports on Form 8 - K . Many of these risks, uncertainties and assumptions are beyond the Company’s ability to control or predict . Because of these risks, uncertainties and assumptions, investors should not place undue reliance on these forward - looking statements . Furthermore, forward - looking statements speak only as of the information currently available to the Company on the date they are made, and the Company does not undertake any obligation to update publicly or revise any forward - looking statements to reflect events or circumstances that may arise after the date of this presentation . The Company does not give any assurance ( 1 ) that the Company will achieve its guidance or expectations, or ( 2 ) concerning any result or the timing thereof . All subsequent written and oral forward - looking statements concerning the Company and attributable to the Company or any person acting on their behalf are expressly qualified in their entirety by the cautionary statements above . ” Non - GAAP Financial Information This presentation includes certain financial measures that were not prepared in accordance with U . S . generally accepted accounting principles (“GAAP”), including EBITDA and Adjusted EBITDA . The company uses these non - GAAP financial measures in operating its business because management believes they are less susceptible to variances in actual operating performance that can result from the excluded items . The company presents these financial measures to investors because they believe they are useful to investors in evaluating the primary factors that drive the company's operating performance . The items excluded from these non - GAAP measures are important in understanding LHC Group’s financial performance, and any non - GAAP measures presented should not be considered in isolation of, or as an alternative to, GAAP financial measures . Since these non - GAAP financial measures are not measures determined in accordance with GAAP, have no standardized meaning prescribed by GAAP and are susceptible to varying calculations, these measures, as presented, may not be comparable to other similarly titled measures of other companies . EBITDA of LHC Group is defined as net income (loss) before income tax benefit (expense), interest expense, and depreciation and amortization expense . Adjusted EBITDA of LHC Group is defined as net income (loss) before income tax expense benefit (expense), depreciation and amortization expense, and transaction costs related to previous transactions . 2 Please visit the Investors section on our website at Investor.LHCgroup.com for additional information on LHC Group and the industry. Nasdaq: LHCG
Table of Contents 3 Company overview ………………………………………………………………………… .................... … 4 - 5 Home health same store total admission growth ……………… .. ……………………… ............. 6 Select key segment statistical and financial data ……………… .. ……………………… .............. 7 Consolidated results ……………………………………………………………… ........................ ……… 8 - 9 Adjustments to net income …………………………………………………………………………… .... 10 - 11 Segment results …………………………………………………………………………………………… ..... 12 - 18 2019 guidance ... ……………………………………………………………… ..... …………… ... …… ... … .. … .. 19 First quarter 2020 guidance …………………………………………………………………………………… 20 Accelerated acquisition and joint venture momentum……………………………………….….21 Quality data………………………………………………………………………………………………….…….….22 Debt and liquidity metrics……………………………………………………………………………………...23 Focus for 2020………………………………………………………………………………………………….….…24 Non - GAAP reconciliations……………………………………………………………………………......25 - 27
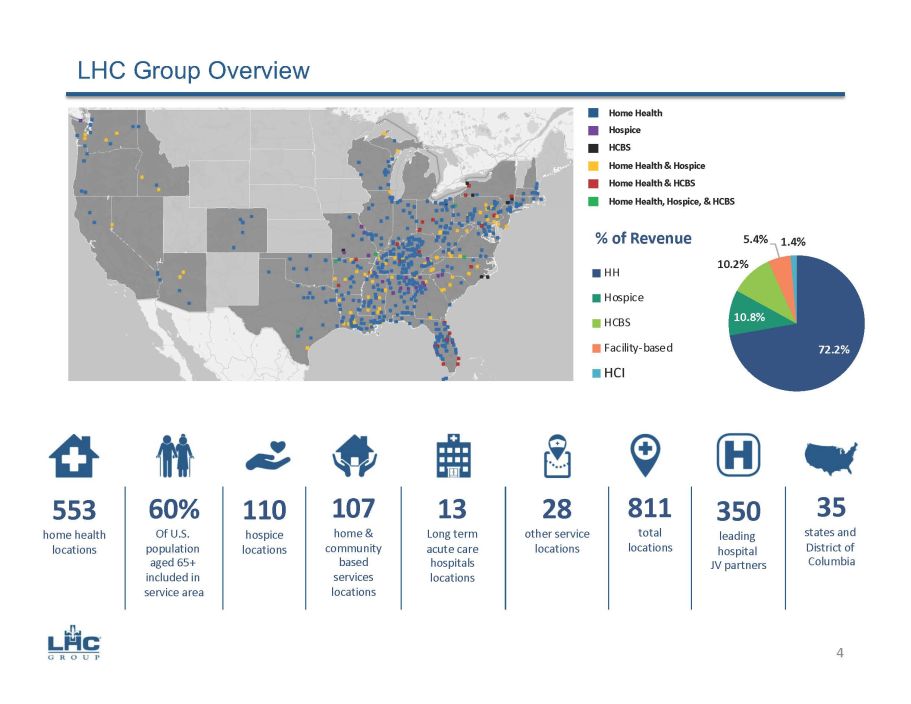
Home Health Hospice HCBS Home Health & Hospice Home Health & HCBS Home Health, Hospice, & HCBS LHC Group Overview 72.2% 10.8% 10.2% 5.4% 1.4% % of Revenue HH Hospice HCBS Facility-based HCI 4 553 home health locations 60% Of U.S. population aged 65+ included in service area 110 hospice locations 107 home & community based services locations 13 Long term acute care hospitals locations 28 other service locations 811 total locations 350 leading hospital JV partners 35 states and District of Columbia
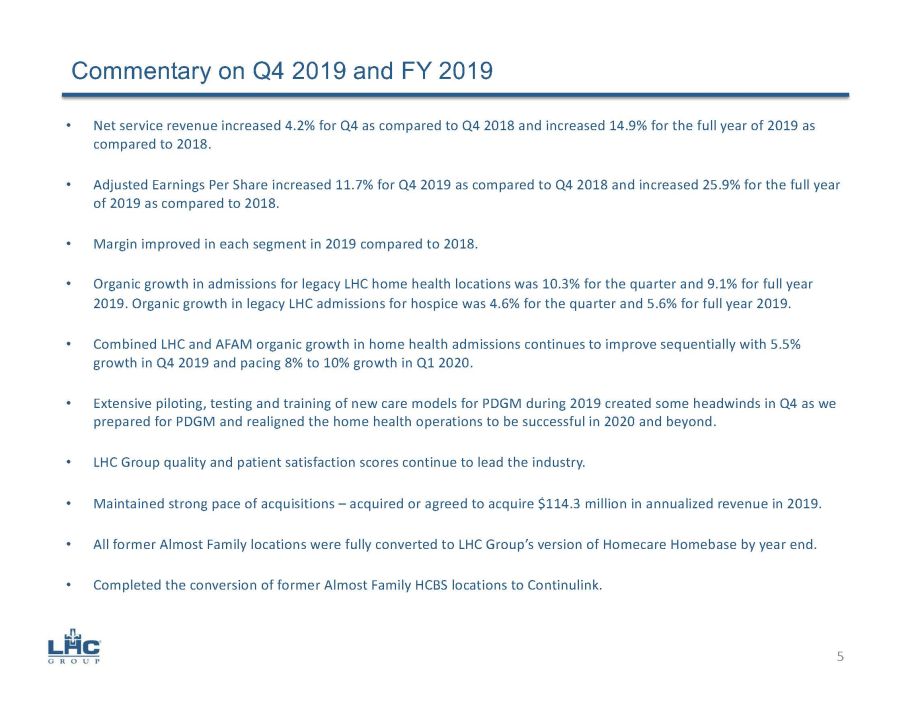
• Net service revenue increased 4.2% for Q4 as compared to Q4 2018 and increased 14.9% for the full year of 2019 as compared to 2018. • Adjusted Earnings Per Share increased 11.7% for Q4 2019 as compared to Q4 2018 and increased 25.9% for the full year of 2019 as compared to 2018. • Margin improved in each segment in 2019 compared to 2018. • Organic growth in admissions for legacy LHC home health locations was 10.3% for the quarter and 9.1% for full year 2019. Organic growth in legacy LHC admissions for hospice was 4.6% for the quarter and 5.6% for full year 2019. • Combined LHC and AFAM organic growth in home health admissions continues to improve sequentially with 5.5% growth in Q4 2019 and pacing 8% to 10% growth in Q1 2020. • Extensive piloting, testing and training of new care models for PDGM during 2019 created some headwinds in Q4 as we prepared for PDGM and realigned the home health operations to be successful in 2020 and beyond. • LHC Group quality and patient satisfaction scores continue to lead the industry. • Maintained strong pace of acquisitions – acquired or agreed to acquire $114.3 million in annualized revenue in 2019. • All former Almost Family locations were fully converted to LHC Group’s version of Homecare Homebase by year end. • Completed the conversion of former Almost Family HCBS locations to Continulink . Commentary on Q4 2019 and FY 2019 5
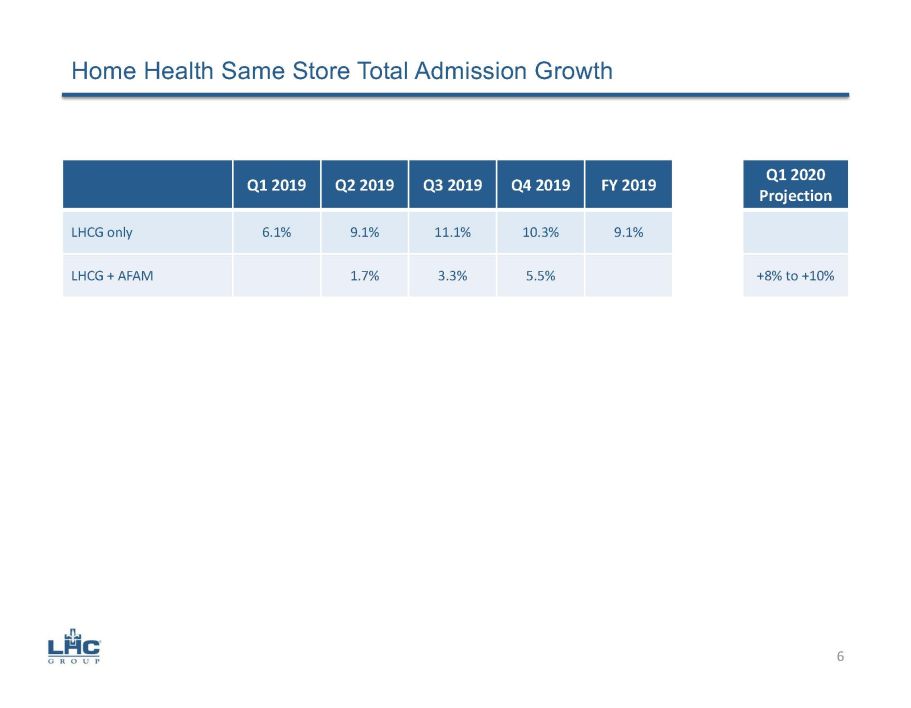
Home Health Same Store Total Admission Growth 6 Q1 2019 Q2 2019 Q3 2019 Q4 2019 FY 2019 Q1 2020 Projection LHCG only 6.1% 9.1% 11.1% 10.3% 9.1% LHCG + AFAM 1.7% 3.3% 5.5% +8% to +10%
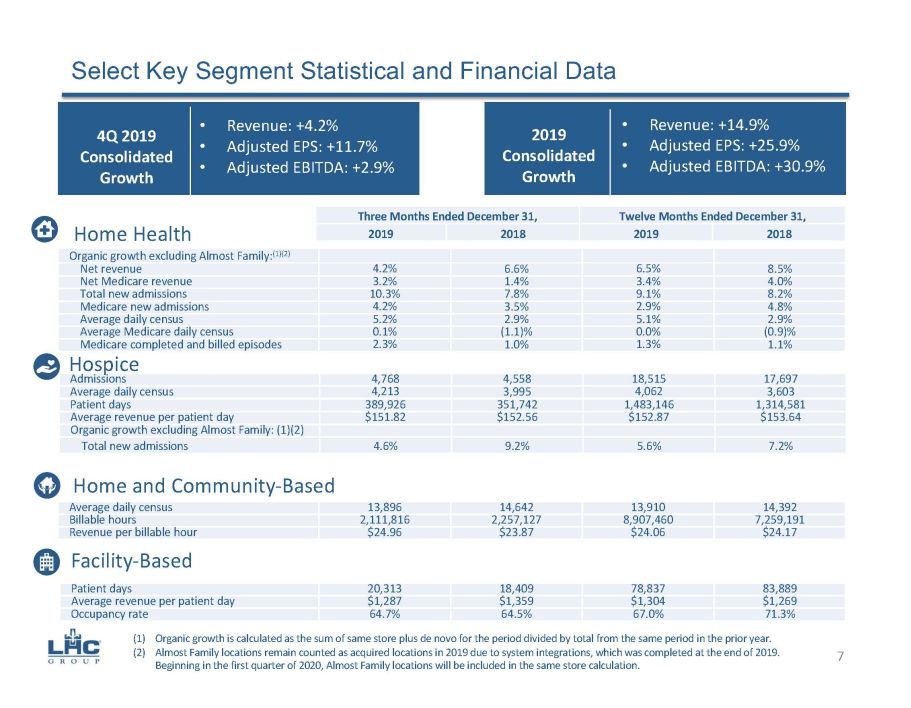
Select Key Segment Statistical and Financial Data Organic growth excluding Almost Family : (1)(2) Net revenue 4.2% 6.6% 6.5% 8.5% Net Medicare revenue 3.2% 1.4% 3.4% 4.0% Total new admissions 10.3% 7.8% 9.1% 8.2% Medicare new admissions 4.2% 3.5% 2.9% 4.8% Average daily census 5.2% 2.9% 5.1% 2.9% Average Medicare daily census 0.1% (1.1)% 0.0% (0.9)% Medicare completed and billed episodes 2.3% 1.0% 1.3% 1.1% Three Months Ended December 31 , Twelve Months Ended December 31, 2019 2018 2019 2018 Home Health Average daily census 13,896 14,642 13,910 14,392 Billable hours 2,111,816 2,257,127 8,907,460 7,259,191 Revenue per billable hour $24.96 $23.87 $24.06 $24.17 Home and Community - Based Admissions 4,768 4,558 18,515 17,697 Average daily census 4,213 3,995 4,062 3,603 Patient days 389,926 351,742 1,483,146 1,314,581 Average revenue per patient day $151.82 $152.56 $152.87 $153.64 Organic growth excluding Almost Family: (1)(2) Total new admissions 4.6% 9.2% 5.6% 7.2% Hospice Patient days 20,313 18,409 78,837 83,889 Average revenue per patient day $1,287 $1,359 $1,304 $1,269 Occupancy rate 64.7% 64.5% 67.0% 71.3% Facility - Based (1) Organic growth is calculated as the sum of same store plus de novo for the period divided by total from the same period in th e p rior year. (2) Almost Family locations remain counted as acquired locations in 2019 due to system integrations, which was completed at the e nd of 2019. Beginning in the first quarter of 2020, Almost Family locations will be included in the same store calculation. 4Q 2019 Consolidated Growth 7 • Revenue: +4.2% • Adjusted EPS: +11.7% • Adjusted EBITDA: +2.9% • Revenue: +70.3% • Adjusted EPS: +46.7% • Adjusted EBITDA: +84.5% 2019 Consolidated Growth • Revenue: +14.9% • Adjusted EPS: +25.9% • Adjusted EBITDA: +30.9%
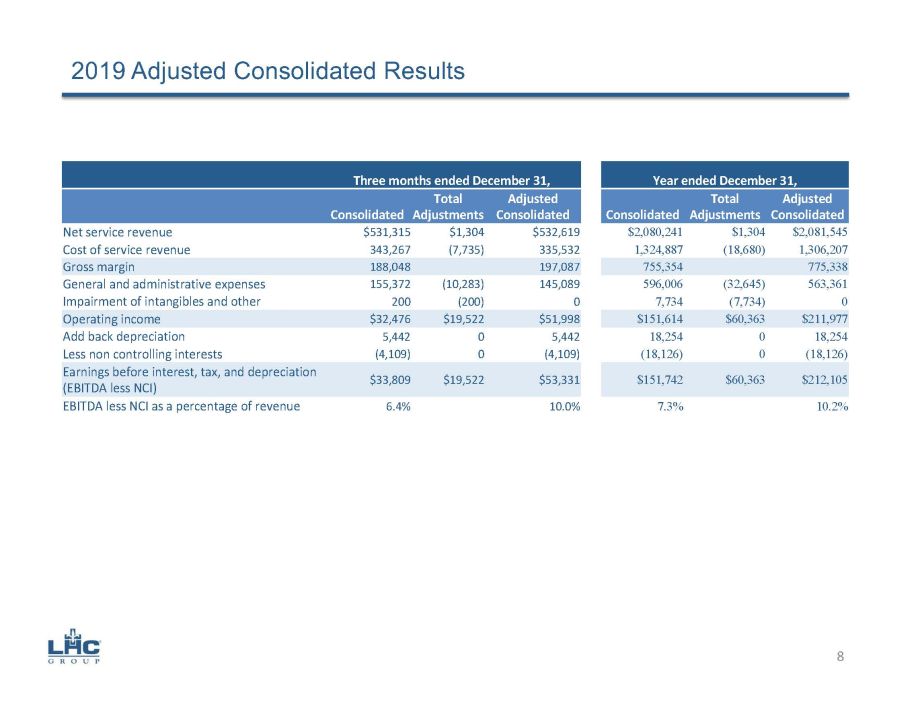
2019 Adjusted Consolidated Results Three months ended December 31, Year ended December 31, Consolidated Total Adjustments Adjusted Consolidated Consolidated Total Adjustments Adjusted Consolidated Net service revenue $531,315 $1,304 $532,619 $2,080,241 $1,304 $2,081,545 Cost of service revenue 343,267 (7,735) 335,532 1,324,887 (18,680) 1,306,207 Gross margin 188,048 197,087 755,354 775,338 General and administrative expenses 155,372 (10,283) 145,089 596,006 (32,645) 563,361 Impairment of intangibles and other 200 (200) 0 7,734 (7,734) 0 Operating income $32,476 $19,522 $51,998 $151,614 $60,363 $211,977 Add back depreciation 5,442 0 5,442 18,254 0 18,254 Less non controlling interests (4,109) 0 (4,109) (18,126) 0 (18,126) Earnings before interest, tax, and depreciation (EBITDA less NCI) $33,809 $19,522 $53,331 $151,742 $60,363 $212,105 EBITDA less NCI as a percentage of revenue 6.4% 10.0% 7.3% 10.2% 8
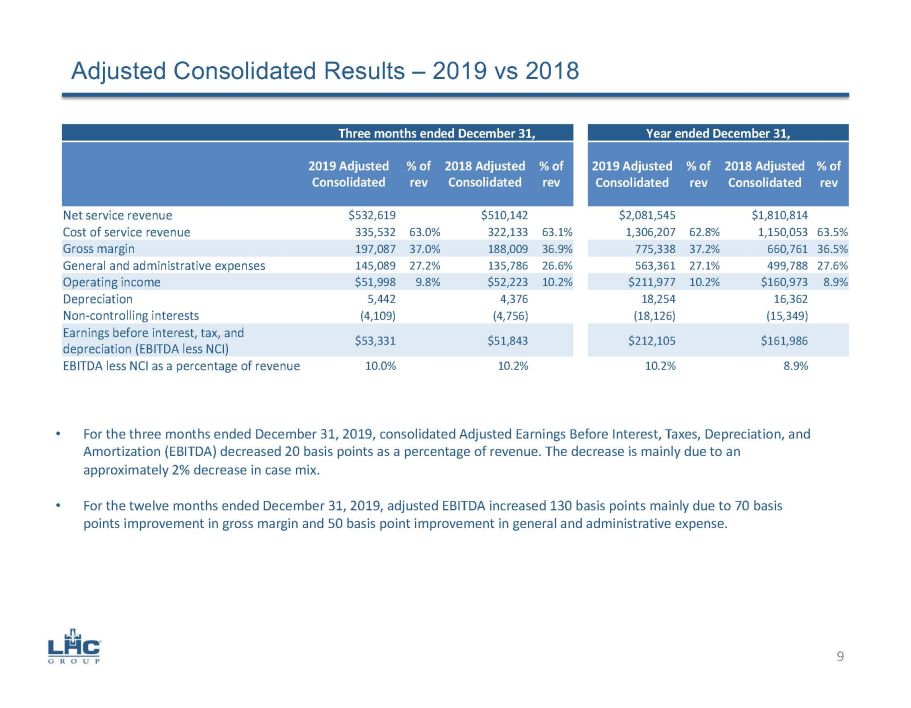
Adjusted Consolidated Results – 2019 vs 2018 Three months ended December 31, Year ended December 31, 2019 Adjusted Consolidated % of rev 2018 Adjusted Consolidated % of rev 2019 Adjusted Consolidated % of rev 2018 Adjusted Consolidated % of rev Net service revenue $532,619 $510,142 $2,081,545 $1,810,814 Cost of service revenue 335,532 63.0% 322,133 63.1% 1,306,207 62.8% 1,150,053 63.5% Gross margin 197,087 37.0% 188,009 36.9% 775,338 37.2% 660,761 36.5% General and administrative expenses 145,089 27.2% 135,786 26.6% 563,361 27.1% 499,788 27.6% Operating income $51,998 9.8% $52,223 10.2% $211,977 10.2% $160,973 8.9% Depreciation 5,442 4,376 18,254 16,362 Non - controlling interests (4,109) (4,756) (18,126) (15,349) Earnings before interest, tax, and depreciation (EBITDA less NCI) $53,331 $51,843 $212,105 $161,986 EBITDA less NCI as a percentage of revenue 10.0% 10.2% 10.2% 8.9% 9 • For the three months ended December 31, 2019, consolidated Adjusted Earnings Before Interest, Taxes, Depreciation, and Amortization (EBITDA) decreased 20 basis points as a percentage of revenue. The decrease is mainly due to an approximately 2% decrease in case mix. • For the twelve months ended December 31, 2019, adjusted EBITDA increased 130 basis points mainly due to 70 basis points improvement in gross margin and 50 basis point improvement in general and administrative expense.
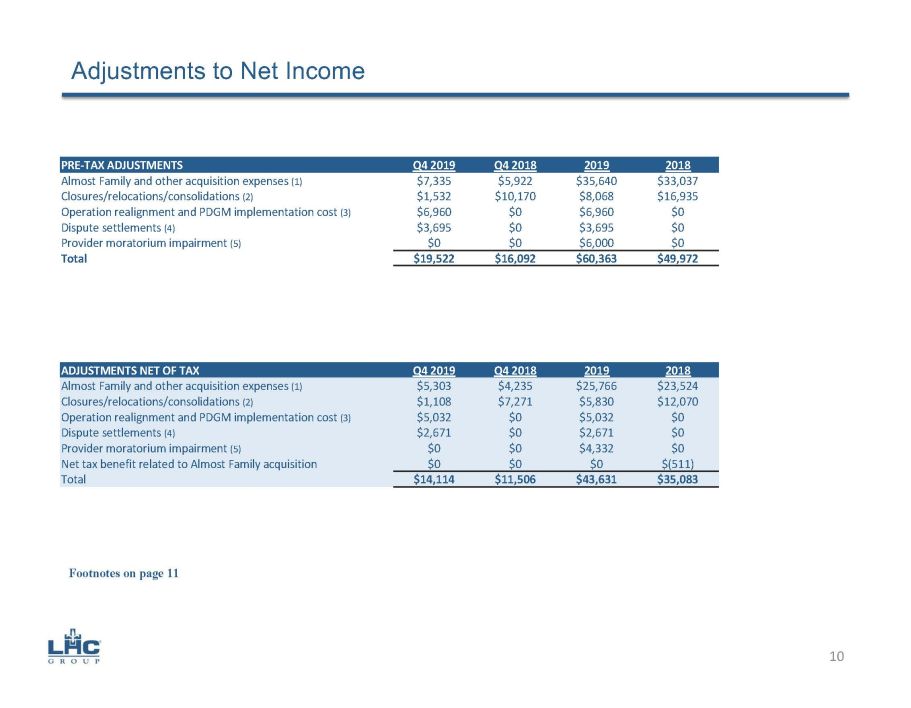
Adjustments to Net Income ADJUSTMENTS NET OF TAX Q4 2019 Q4 2018 2019 2018 Almost Family and other acquisition expenses (1) $5,303 $4,235 $25,766 $23,524 Closures/relocations/consolidations (2) $1,108 $7,271 $5,830 $12,070 Operation realignment and PDGM implementation cost (3) $5,032 $0 $5,032 $0 Dispute settlements (4) $2,671 $0 $2,671 $0 Provider moratorium impairment (5) $0 $0 $4,332 $0 Net tax benefit related to Almost Family acquisition $0 $0 $0 $(511) Total $14,114 $11,506 $43,631 $35,083 10 Footnotes on page 11 PRE - TAX ADJUSTMENTS Q4 2019 Q4 2018 2019 2018 Almost Family and other acquisition expenses (1) $7,335 $5,922 $35,640 $33,037 Closures/relocations/consolidations (2) $1,532 $10,170 $8,068 $16,935 Operation realignment and PDGM implementation cost (3) $6,960 $0 $6,960 $0 Dispute settlements (4) $3,695 $0 $3,695 $0 Provider moratorium impairment (5) $0 $0 $6,000 $0 Total $19,522 $16,092 $60,363 $49,972
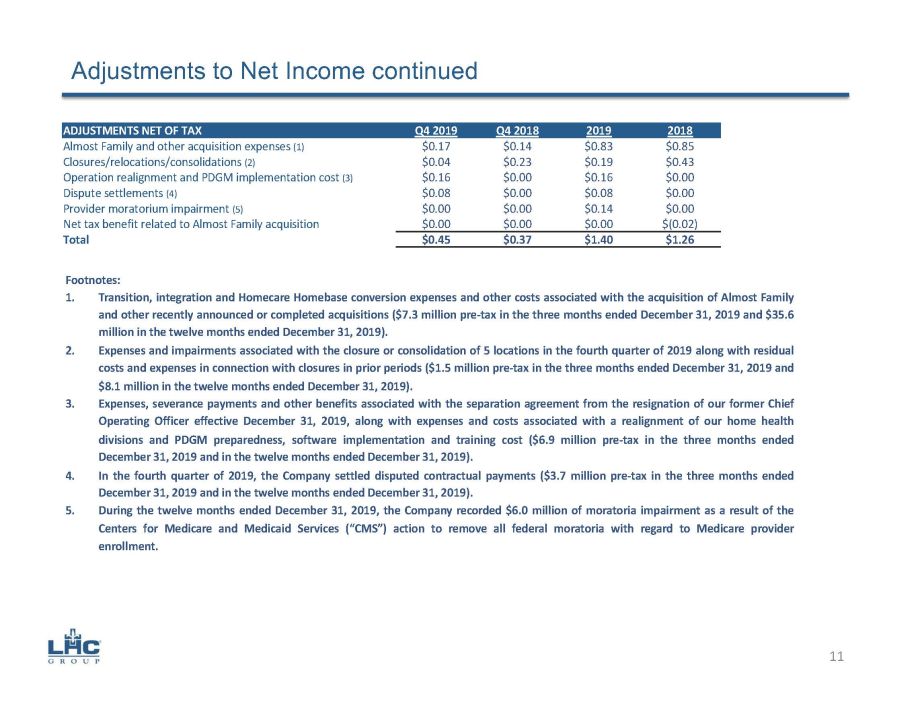
Adjustments to Net Income continued ADJUSTMENTS NET OF TAX Q4 2019 Q4 2018 2019 2018 Almost Family and other acquisition expenses (1) $0.17 $0.14 $0.83 $0.85 Closures/relocations/consolidations (2) $0.04 $0.23 $0.19 $0.43 Operation realignment and PDGM implementation cost (3) $0.16 $0.00 $0.16 $0.00 Dispute settlements (4) $0.08 $0.00 $0.08 $0.00 Provider moratorium impairment (5) $0.00 $0.00 $0.14 $0.00 Net tax benefit related to Almost Family acquisition $0.00 $0.00 $0.00 $(0.02) Total $0.45 $0.37 $1.40 $1.26 11 Footnotes: 1. Transition, integration and Homecare Homebase conversion expenses and other costs associated with the acquisition of Almost Family and other recently announced or completed acquisitions ( $ 7 . 3 million pre - tax in the three months ended December 31 , 2019 and $ 35 . 6 million in the twelve months ended December 31 , 2019 ) . 2. Expenses and impairments associated with the closure or consolidation of 5 locations in the fourth quarter of 2019 along with residual costs and expenses in connection with closures in prior periods ( $ 1 . 5 million pre - tax in the three months ended December 31 , 2019 and $ 8 . 1 million in the twelve months ended December 31 , 2019 ) . 3. Expenses, severance payments and other benefits associated with the separation agreement from the resignation of our former Chief Operating Officer effective December 31 , 2019 , along with expenses and costs associated with a realignment of our home health divisions and PDGM preparedness, software implementation and training cost ( $ 6 . 9 million pre - tax in the three months ended December 31 , 2019 and in the twelve months ended December 31 , 2019 ) . 4. In the fourth quarter of 2019 , the Company settled disputed contractual payments ( $ 3 . 7 million pre - tax in the three months ended December 31 , 2019 and in the twelve months ended December 31 , 2019 ) . 5. During the twelve months ended December 31 , 2019 , the Company recorded $ 6 . 0 million of moratoria impairment as a result of the Centers for Medicare and Medicaid Services (“CMS”) action to remove all federal moratoria with regard to Medicare provider enrollment .
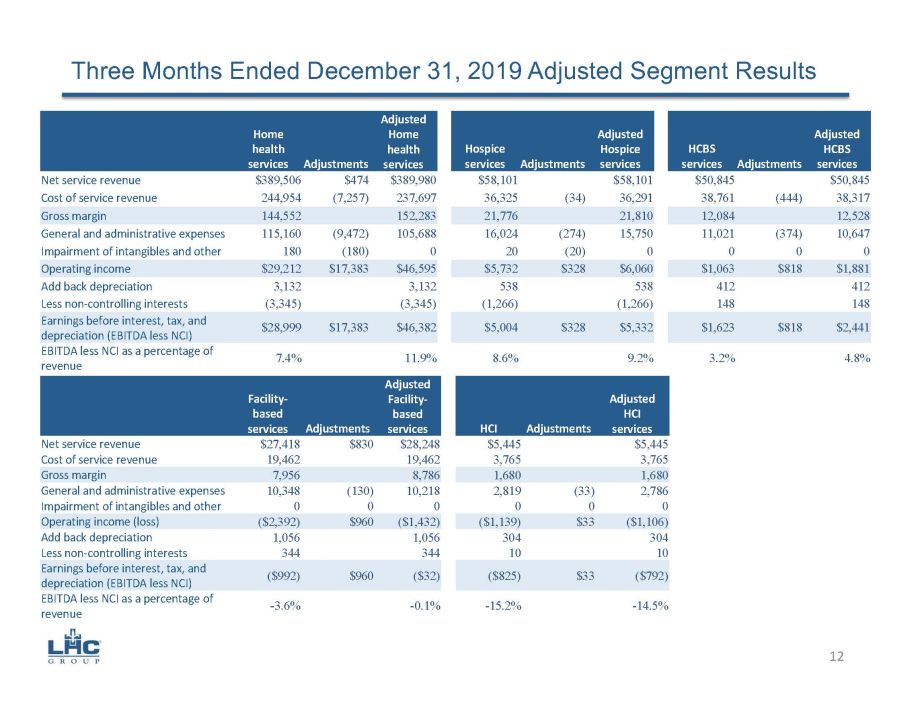
Three Months Ended December 31, 2019 Adjusted Segment Results Home health services Adjustments Adjusted Home health services Hospice services Adjustments Adjusted Hospice services HCBS services Adjustments Adjusted HCBS services Net service revenue $389,506 $474 $389,980 $58,101 $58,101 $50,845 $50,845 Cost of service revenue 244,954 (7,257) 237,697 36,325 (34) 36,291 38,761 (444) 38,317 Gross margin 144,552 152,283 21,776 21,810 12,084 12,528 General and administrative expenses 115,160 (9,472) 105,688 16,024 (274) 15,750 11,021 (374) 10,647 Impairment of intangibles and other 180 (180) 0 20 (20) 0 0 0 0 Operating income $29,212 $17,383 $46,595 $5,732 $328 $6,060 $1,063 $818 $1,881 Add back depreciation 3,132 3,132 538 538 412 412 Less non - controlling interests (3,345) (3,345) (1,266) (1,266) 148 148 Earnings before interest, tax, and depreciation (EBITDA less NCI) $28,999 $17,383 $46,382 $5,004 $328 $5,332 $1,623 $818 $2,441 EBITDA less NCI as a percentage of revenue 7.4% 11.9% 8.6% 9.2% 3.2% 4.8% Facility - based services Adjustments Adjusted Facility - based services HCI Adjustments Adjusted HCI services Net service revenue $27,418 $830 $28,248 $5,445 $5,445 Cost of service revenue 19,462 19,462 3,765 3,765 Gross margin 7,956 8,786 1,680 1,680 General and administrative expenses 10,348 (130) 10,218 2,819 (33) 2,786 Impairment of intangibles and other 0 0 0 0 0 0 Operating income (loss) ($2,392) $960 ($1,432) ($1,139) $33 ($1,106) Add back depreciation 1,056 1,056 304 304 Less non - controlling interests 344 344 10 10 Earnings before interest, tax, and depreciation (EBITDA less NCI) ($992) $960 ($32) ($825) $33 ($792) EBITDA less NCI as a percentage of revenue - 3.6% - 0.1% - 15.2% - 14.5% 12
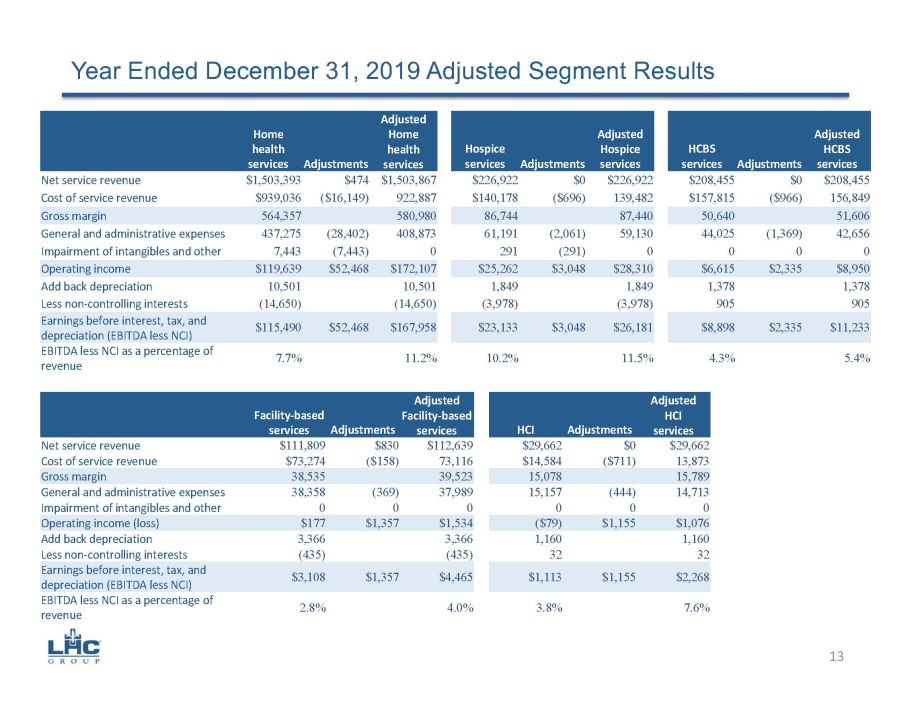
Year Ended December 31, 2019 Adjusted Segment Results Home health services Adjustments Adjusted Home health services Hospice services Adjustments Adjusted Hospice services HCBS services Adjustments Adjusted HCBS services Net service revenue $1,503,393 $474 $1,503,867 $226,922 $0 $226,922 $208,455 $0 $208,455 Cost of service revenue $939,036 ($16,149) 922,887 $140,178 ($696) 139,482 $157,815 ($966) 156,849 Gross margin 564,357 580,980 86,744 87,440 50,640 51,606 General and administrative expenses 437,275 (28,402) 408,873 61,191 (2,061) 59,130 44,025 (1,369) 42,656 Impairment of intangibles and other 7,443 (7,443) 0 291 (291) 0 0 0 0 Operating income $119,639 $52,468 $172,107 $25,262 $3,048 $28,310 $6,615 $2,335 $8,950 Add back depreciation 10,501 10,501 1,849 1,849 1,378 1,378 Less non - controlling interests (14,650) (14,650) (3,978) (3,978) 905 905 Earnings before interest, tax, and depreciation (EBITDA less NCI) $115,490 $52,468 $167,958 $23,133 $3,048 $26,181 $8,898 $2,335 $11,233 EBITDA less NCI as a percentage of revenue 7.7% 11.2% 10.2% 11.5% 4.3% 5.4% Facility - based services Adjustments Adjusted Facility - based services HCI Adjustments Adjusted HCI services Net service revenue $111,809 $830 $112,639 $29,662 $0 $29,662 Cost of service revenue $73,274 ($158) 73,116 $14,584 ($711) 13,873 Gross margin 38,535 39,523 15,078 15,789 General and administrative expenses 38,358 (369) 37,989 15,157 (444) 14,713 Impairment of intangibles and other 0 0 0 0 0 0 Operating income (loss) $177 $1,357 $1,534 ($79) $1,155 $1,076 Add back depreciation 3,366 3,366 1,160 1,160 Less non - controlling interests (435) (435) 32 32 Earnings before interest, tax, and depreciation (EBITDA less NCI) $3,108 $1,357 $4,465 $1,113 $1,155 $2,268 EBITDA less NCI as a percentage of revenue 2.8% 4.0% 3.8% 7.6% 13
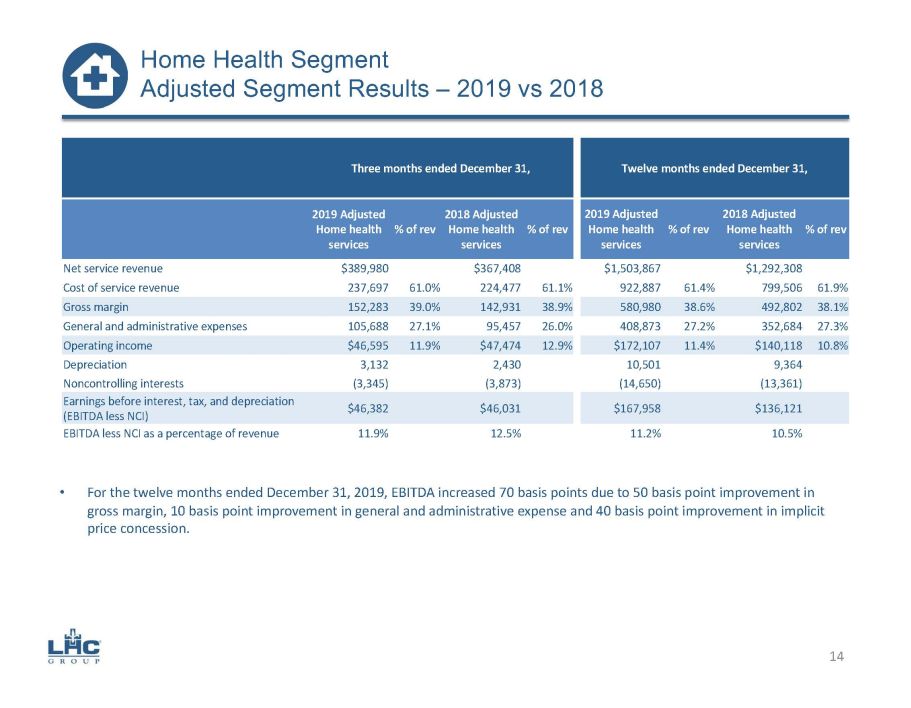
Three months ended December 31, Twelve months ended December 31, 2019 Adjusted Home health services % of rev 2018 Adjusted Home health services % of rev 2019 Adjusted Home health services % of rev 2018 Adjusted Home health services % of rev Net service revenue $389,980 $367,408 $1,503,867 $1,292,308 Cost of service revenue 237,697 61.0% 224,477 61.1% 922,887 61.4% 799,506 61.9% Gross margin 152,283 39.0% 142,931 38.9% 580,980 38.6% 492,802 38.1% General and administrative expenses 105,688 27.1% 95,457 26.0% 408,873 27.2% 352,684 27.3% Operating income $46,595 11.9% $47,474 12.9% $172,107 11.4% $140,118 10.8% Depreciation 3,132 2,430 10,501 9,364 Noncontrolling interests (3,345) (3,873) (14,650) (13,361) Earnings before interest, tax, and depreciation (EBITDA less NCI) $46,382 $46,031 $167,958 $136,121 EBITDA less NCI as a percentage of revenue 11.9% 12.5% 11.2% 10.5% • For the twelve months ended December 31, 2019, EBITDA increased 70 basis points due to 50 basis point improvement in gross margin, 10 basis point improvement in general and administrative expense and 40 basis point improvement in implicit price concession. 14 Home Health Segment Adjusted Segment Results – 2019 vs 2018
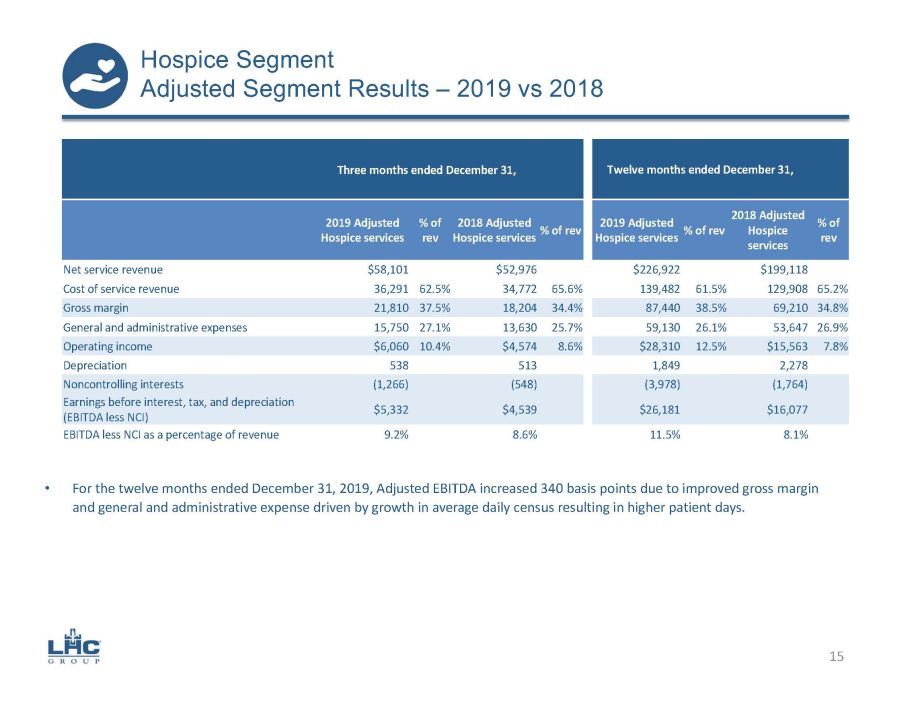
Three months ended December 31, Twelve months ended December 31, 2019 Adjusted Hospice services % of rev 2018 Adjusted Hospice services % of rev 2019 Adjusted Hospice services % of rev 2018 Adjusted Hospice services % of rev Net service revenue $58,101 $52,976 $226,922 $199,118 Cost of service revenue 36,291 62.5% 34,772 65.6% 139,482 61.5% 129,908 65.2% Gross margin 21,810 37.5% 18,204 34.4% 87,440 38.5% 69,210 34.8% General and administrative expenses 15,750 27.1% 13,630 25.7% 59,130 26.1% 53,647 26.9% Operating income $6,060 10.4% $4,574 8.6% $28,310 12.5% $15,563 7.8% Depreciation 538 513 1,849 2,278 Noncontrolling interests (1,266) (548) (3,978) (1,764) Earnings before interest, tax, and depreciation (EBITDA less NCI) $5,332 $4,539 $26,181 $16,077 EBITDA less NCI as a percentage of revenue 9.2% 8.6% 11.5% 8.1% • For the twelve months ended December 31, 2019, Adjusted EBITDA increased 340 basis points due to improved gross margin and general and administrative expense driven by growth in average daily census resulting in higher patient days. 15 Hospice Segment Adjusted Segment Results – 2019 vs 2018
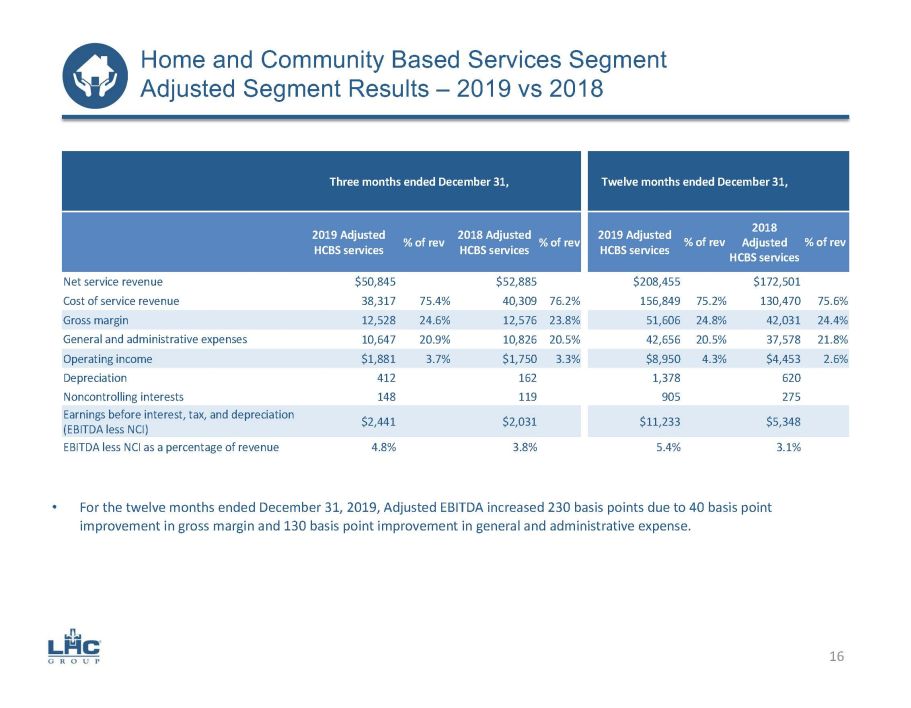
Three months ended December 31, Twelve months ended December 31, 2019 Adjusted HCBS services % of rev 2018 Adjusted HCBS services % of rev 2019 Adjusted HCBS services % of rev 2018 Adjusted HCBS services % of rev Net service revenue $50,845 $52,885 $208,455 $172,501 Cost of service revenue 38,317 75.4% 40,309 76.2% 156,849 75.2% 130,470 75.6% Gross margin 12,528 24.6% 12,576 23.8% 51,606 24.8% 42,031 24.4% General and administrative expenses 10,647 20.9% 10,826 20.5% 42,656 20.5% 37,578 21.8% Operating income $1,881 3.7% $1,750 3.3% $8,950 4.3% $4,453 2.6% Depreciation 412 162 1,378 620 Noncontrolling interests 148 119 905 275 Earnings before interest, tax, and depreciation (EBITDA less NCI) $2,441 $2,031 $11,233 $5,348 EBITDA less NCI as a percentage of revenue 4.8% 3.8% 5.4% 3.1% • For the twelve months ended December 31, 2019, Adjusted EBITDA increased 230 basis points due to 40 basis point improvement in gross margin and 130 basis point improvement in general and administrative expense. 16 Home and Community Based Services Segment Adjusted Segment Results – 2019 vs 2018
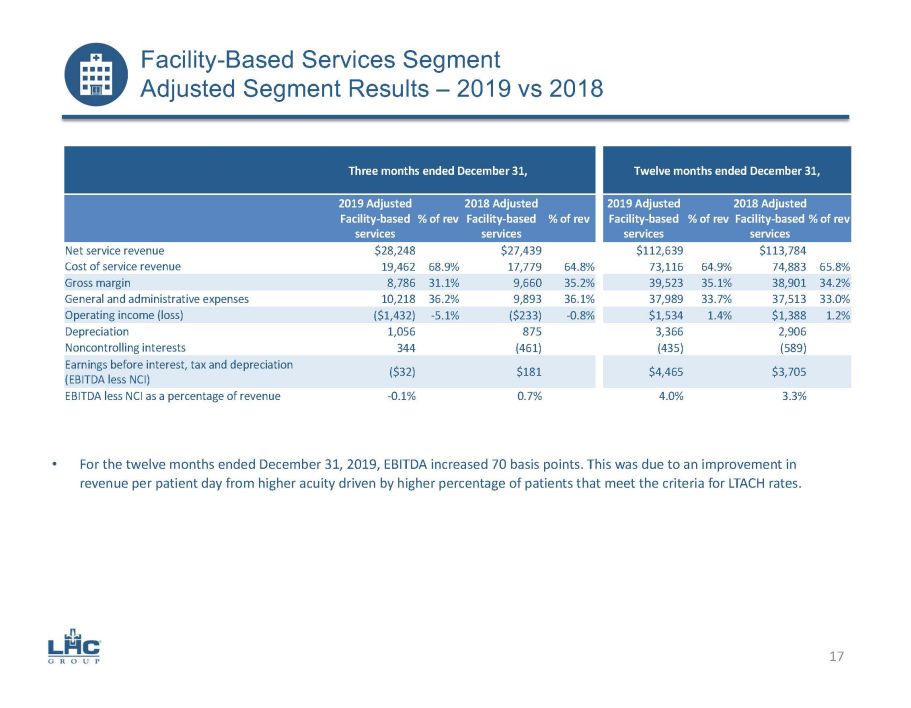
Facility - Based Services Segment Adjusted Segment Results – 2019 vs 2018 Three months ended December 31, Twelve months ended December 31, 2019 Adjusted Facility - based services % of rev 2018 Adjusted Facility - based services % of rev 2019 Adjusted Facility - based services % of rev 2018 Adjusted Facility - based services % of rev Net service revenue $28,248 $27,439 $112,639 $113,784 Cost of service revenue 19,462 68.9% 17,779 64.8% 73,116 64.9% 74,883 65.8% Gross margin 8,786 31.1% 9,660 35.2% 39,523 35.1% 38,901 34.2% General and administrative expenses 10,218 36.2% 9,893 36.1% 37,989 33.7% 37,513 33.0% Operating income (loss) ($1,432) - 5.1% ($233) - 0.8% $1,534 1.4% $1,388 1.2% Depreciation 1,056 875 3,366 2,906 Noncontrolling interests 344 (461) (435) (589) Earnings before interest, tax and depreciation (EBITDA less NCI) ($32) $181 $4,465 $3,705 EBITDA less NCI as a percentage of revenue - 0.1% 0.7% 4.0% 3.3% 17 • For the twelve months ended December 31, 2019, EBITDA increased 70 basis points. This was due to an improvement in revenue per patient day from higher acuity driven by higher percentage of patients that meet the criteria for LTACH rates.
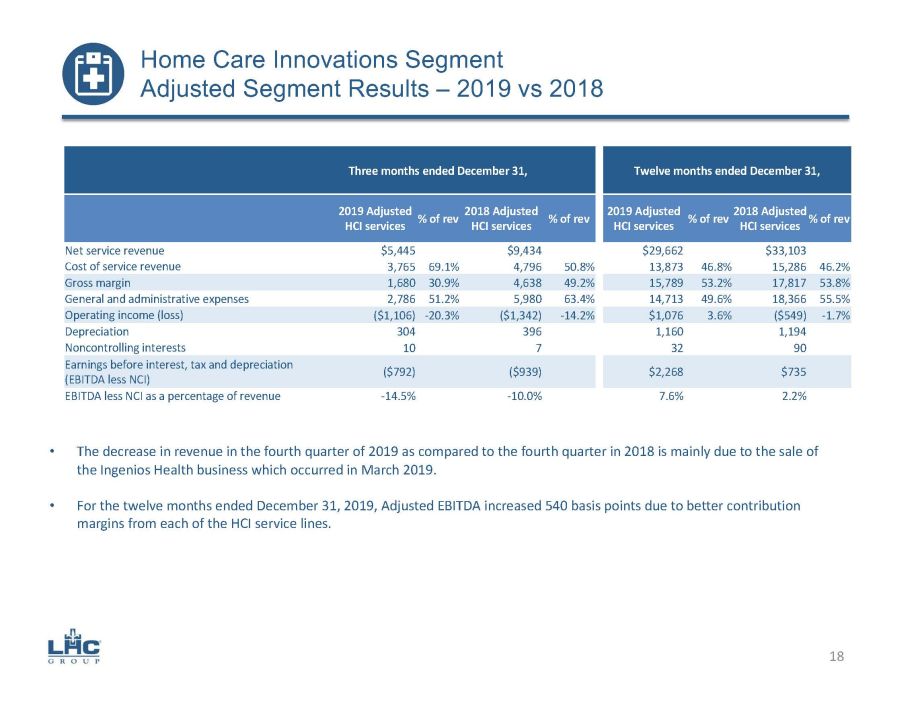
Home Care Innovations Segment Adjusted Segment Results – 2019 vs 2018 Three months ended December 31, Twelve months ended December 31, 2019 Adjusted HCI services % of rev 2018 Adjusted HCI services % of rev 2019 Adjusted HCI services % of rev 2018 Adjusted HCI services % of rev Net service revenue $5,445 $9,434 $29,662 $33,103 Cost of service revenue 3,765 69.1% 4,796 50.8% 13,873 46.8% 15,286 46.2% Gross margin 1,680 30.9% 4,638 49.2% 15,789 53.2% 17,817 53.8% General and administrative expenses 2,786 51.2% 5,980 63.4% 14,713 49.6% 18,366 55.5% Operating income (loss) ($1,106) - 20.3% ($1,342) - 14.2% $1,076 3.6% ($549) - 1.7% Depreciation 304 396 1,160 1,194 Noncontrolling interests 10 7 32 90 Earnings before interest, tax and depreciation (EBITDA less NCI) ($792) ($939) $2,268 $735 EBITDA less NCI as a percentage of revenue - 14.5% - 10.0% 7.6% 2.2% 18 • The decrease in revenue in the fourth quarter of 2019 as compared to the fourth quarter in 2018 is mainly due to the sale of the Ingenios Health business which occurred in March 2019. • For the twelve months ended December 31, 2019, Adjusted EBITDA increased 540 basis points due to better contribution margins from each of the HCI service lines.
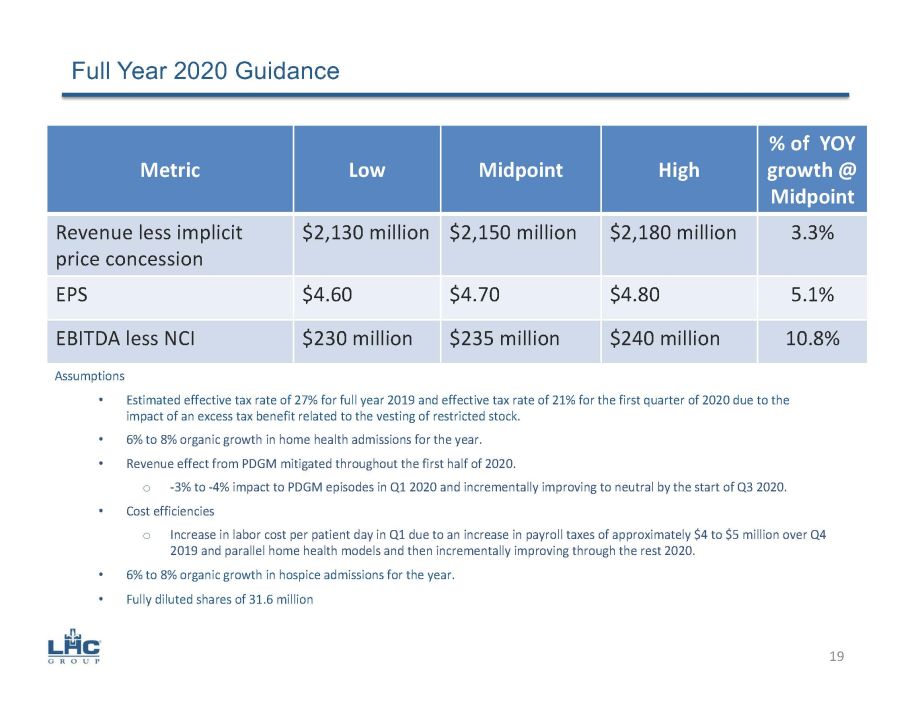
Assumptions • Estimated effective tax rate of 27% for full year 2019 and effective tax rate of 21% for the first quarter of 2020 due to the impact of an excess tax benefit related to the vesting of restricted stock. • 6% to 8% organic growth in home health admissions for the year. • Revenue effect from PDGM mitigated throughout the first half of 2020. o - 3% to - 4% impact to PDGM episodes in Q1 2020 and incrementally improving to neutral by the start of Q3 2020. • Cost efficiencies o Increase in labor cost per patient day in Q1 due to an increase in payroll taxes of approximately $4 to $5 million over Q4 2019 and parallel home health models and then incrementally improving through the rest 2020. • 6% to 8% organic growth in hospice admissions for the year. • Fully diluted shares of 31.6 million Full Year 2020 Guidance 19 Metric Low Midpoint High % of YOY growth @ Midpoint Revenue less implicit price concession $2,130 million $2,150 million $2,180 million 3.3% EPS $4.60 $4.70 $4.80 5.1% EBITDA less NCI $230 million $235 million $240 million 10.8%
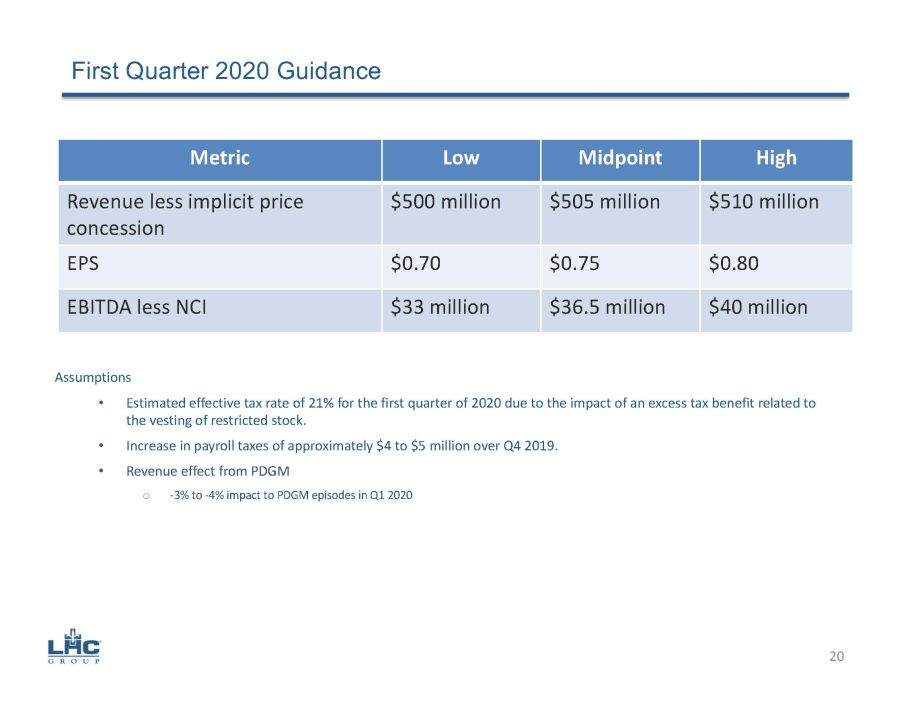
Assumptions • Estimated effective tax rate of 21% for the first quarter of 2020 due to the impact of an excess tax benefit related to the vesting of restricted stock. • Increase in payroll taxes of approximately $4 to $5 million over Q4 2019. • Revenue effect from PDGM o - 3% to - 4% impact to PDGM episodes in Q1 2020 First Quarter 2020 Guidance 20 Metric Low Midpoint High Revenue less implicit price concession $500 million $505 million $510 million EPS $0.70 $0.75 $0.80 EBITDA less NCI $33 million $36.5 million $40 million
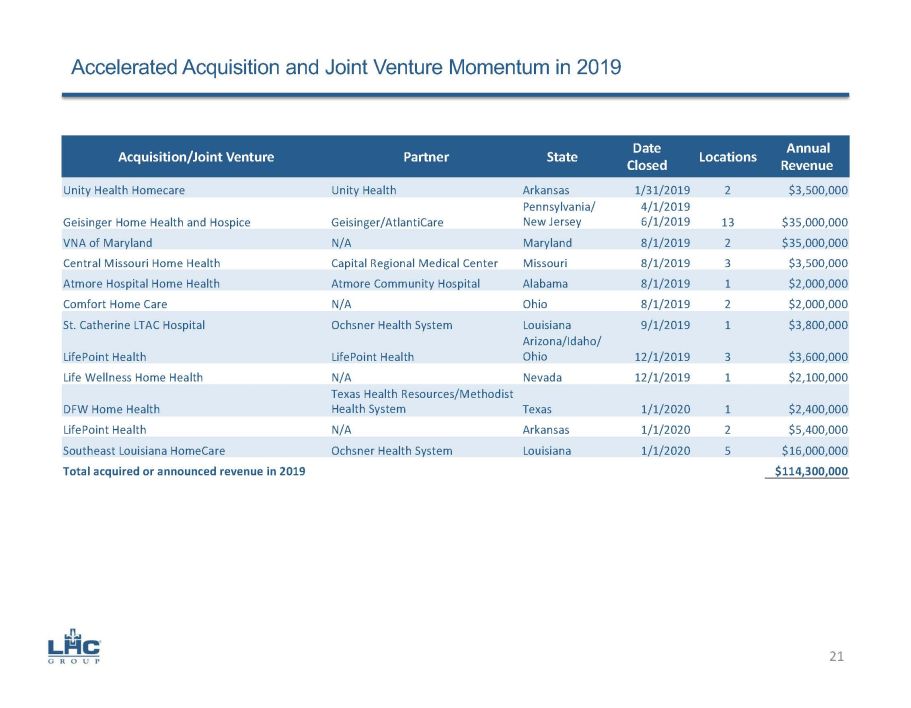
Accelerated Acquisition and Joint Venture Momentum in 2019 Acquisition/Joint Venture Partner State Date Closed Locations Annual Revenue Unity Health Homecare Unity Health Arkansas 1/31/2019 2 $3,500,000 Geisinger Home Health and Hospice Geisinger/AtlantiCare Pennsylvania/ New Jersey 4/1/2019 6/1/2019 13 $35,000,000 VNA of Maryland N/A Maryland 8/1/2019 2 $35,000,000 Central Missouri Home Health Capital Regional Medical Center Missouri 8/1/2019 3 $3,500,000 Atmore Hospital Home Health Atmore Community Hospital Alabama 8/1/2019 1 $2,000,000 Comfort Home Care N/A Ohio 8/1/2019 2 $2,000,000 St. Catherine LTAC Hospital Ochsner Health System Louisiana 9/1/2019 1 $3,800,000 LifePoint Health LifePoint Health Arizona/Idaho/ Ohio 12/1/2019 3 $3,600,000 Life Wellness Home Health N/A Nevada 12/1/2019 1 $2,100,000 DFW Home Health Texas Health Resources/Methodist Health System Texas 1/1/2020 1 $2,400,000 LifePoint Health N/A Arkansas 1/1/2020 2 $5,400,000 Southeast Louisiana HomeCare Ochsner Health System Louisiana 1/1/2020 5 $16,000,000 Total acquired or announced revenue in 2019 $114,300,000 21
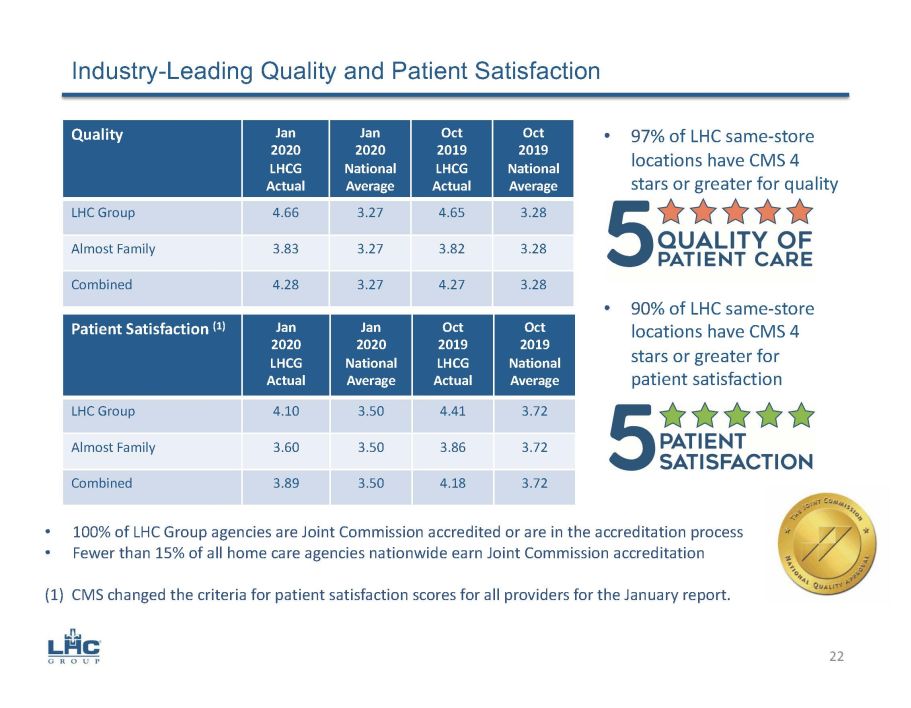
Industry - Leading Quality and Patient Satisfaction • 97 % of LHC same - store locations have CMS 4 stars or greater for quality • 90 % of LHC same - store locations have CMS 4 stars or greater for patient satisfaction 22 Quality Jan 2020 LHCG Actual Jan 2020 National Average Oct 2019 LHCG Actual Oct 2019 National Average LHC Group 4.66 3.27 4.65 3.28 Almost Family 3.83 3.27 3.82 3.28 Combined 4.28 3.27 4.27 3.28 Patient Satisfaction (1) Jan 2020 LHCG Actual Jan 2020 National Average Oct 2019 LHCG Actual Oct 2019 National Average LHC Group 4.10 3.50 4.41 3.72 Almost Family 3.60 3.50 3.86 3.72 Combined 3.89 3.50 4.18 3.72 • 100% of LHC Group agencies are Joint Commission accredited or are in the accreditation process • Fewer than 15% of all home care agencies nationwide earn Joint Commission accreditation (1) CMS changed the criteria for patient satisfaction scores for all providers for the January report.
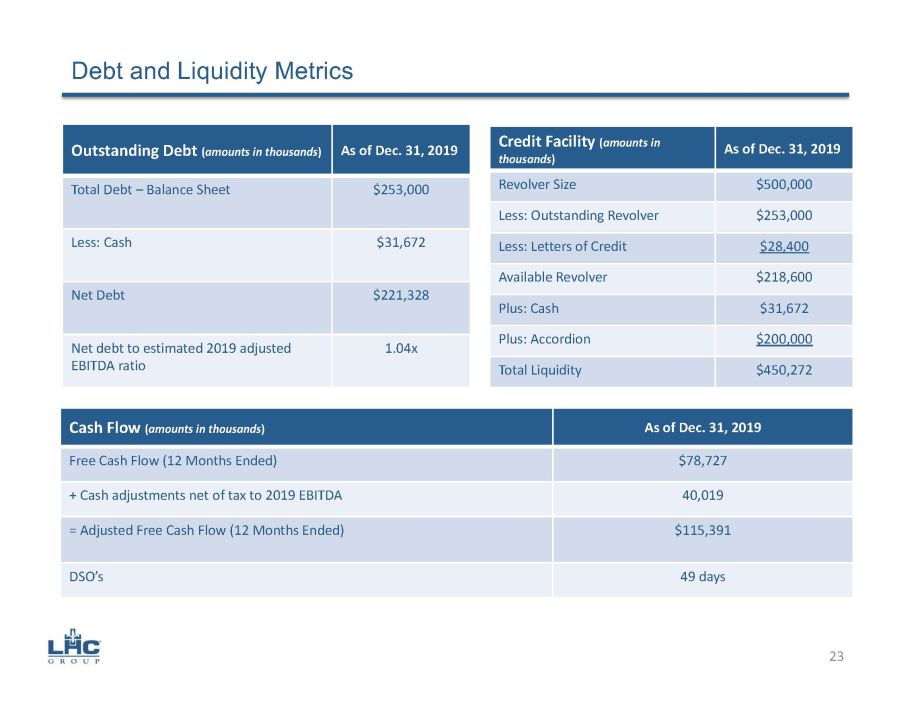
Debt and Liquidity Metrics Outstanding Debt ( amounts in thousands ) As of Dec. 31, 2019 Total Debt – Balance Sheet $253,000 Less: Cash $31,672 Net Debt $221,328 Net debt to estimated 2019 adjusted EBITDA ratio 1.04x Credit Facility ( amounts in thousands ) As of Dec. 31, 2019 Revolver Size $500,000 Less: Outstanding Revolver $253,000 Less: Letters of Credit $28,400 Available Revolver $218,600 Plus: Cash $31,672 Plus: Accordion $200,000 Total Liquidity $450,272 Cash Flow ( amounts in thousands ) As of Dec. 31, 2019 Free Cash Flow (12 Months Ended) $78,727 + Cash adjustments net of tax to 2019 EBITDA 40,019 = Adjusted Free Cash Flow (12 Months Ended) $115,391 DSO’s 49 days 23
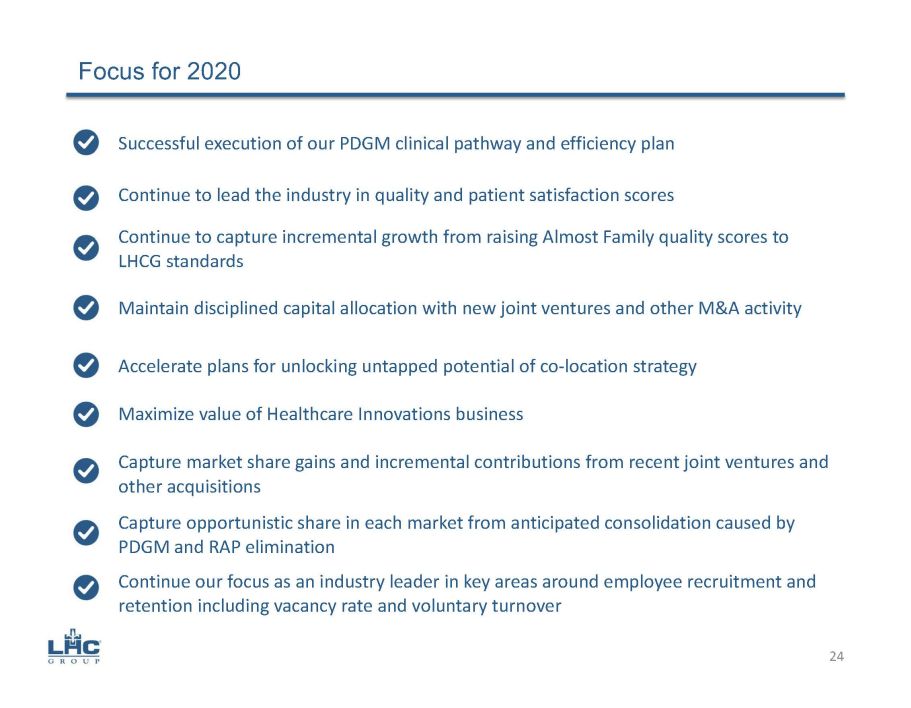
Focus for 2020 Successful execution of our PDGM clinical pathway and efficiency plan Maintain disciplined capital allocation with new joint ventures and other M&A activity Accelerate plans for unlocking untapped potential of co - location strategy Maximize value of Healthcare Innovations business Continue to capture incremental growth from raising Almost Family quality scores to LHCG standards Continue to lead the industry in quality and patient satisfaction scores Capture market share gains and incremental contributions from recent joint ventures and other acquisitions 24 Capture opportunistic share in each market from anticipated consolidation caused by PDGM and RAP elimination Continue our focus as an industry leader in key areas around employee recruitment and retention including vacancy rate and voluntary turnover
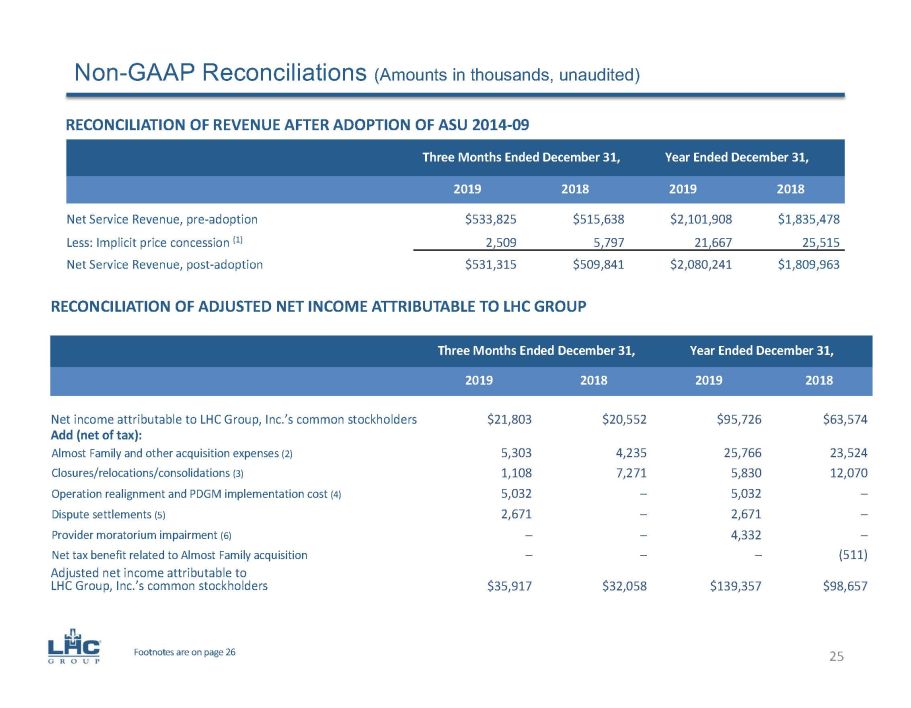
Non - GAAP Reconciliations (Amounts in thousands, unaudited) RECONCILIATION OF REVENUE AFTER ADOPTION OF ASU 2014 - 09 RECONCILIATION OF ADJUSTED NET INCOME ATTRIBUTABLE TO LHC GROUP Three Months Ended December 31, Year Ended December 31, 2019 2018 2019 2018 Net Service Revenue, pre - adoption $533,825 $515,638 $ 2,101,908 $ 1,835,478 Less: Implicit price concession (1) 2,509 5,797 21,667 25,515 Net Service Revenue, post - adoption $531,315 $509,841 $ 2,080,241 $ 1,809,963 Three Months Ended December 31, Year Ended December 31, 2019 2018 2019 2018 Net income attributable to LHC Group, Inc.’s common stockholders $21,803 $20,552 $95,726 $63,574 Add (net of tax): Almost Family and other acquisition expenses (2) 5,303 4,235 25,766 23,524 Closures/relocations/consolidations (3) 1,108 7,271 5,830 12,070 Operation realignment and PDGM implementation cost (4) 5,032 ─ 5,032 ─ Dispute settlements (5) 2,671 ─ 2,671 ─ Provider moratorium impairment (6) ─ ─ 4,332 ─ Net tax benefit related to Almost Family acquisition ─ ─ ─ (511) Adjusted net income attributable to LHC Group, Inc.’s common stockholders $35,917 $32,058 $139,357 $98,657 25 Footnotes are on page 26
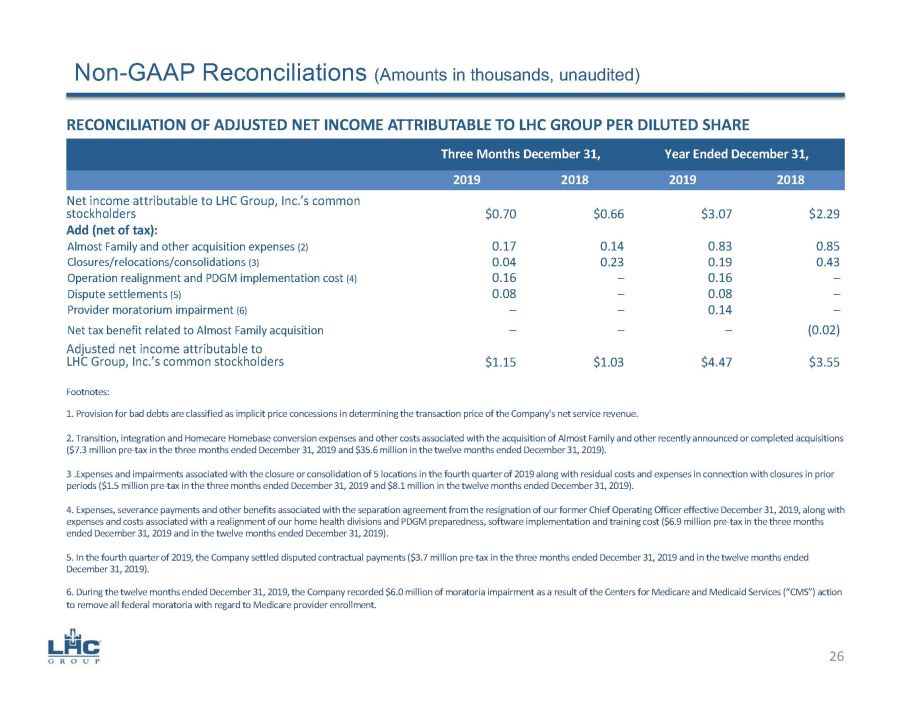
Non - GAAP Reconciliations (Amounts in thousands, unaudited ) RECONCILIATION OF ADJUSTED NET INCOME ATTRIBUTABLE TO LHC GROUP PER DILUTED SHARE Three Months December 31, Year Ended December 31, 2019 2018 2019 2018 Net income attributable to LHC Group, Inc.’s common stockholders $0.70 $0.66 $3.07 $2.29 Add (net of tax): Almost Family and other acquisition expenses (2) 0.17 0.14 0.83 0.85 Closures/relocations/consolidations (3) 0.04 0.23 0.19 0.43 Operation realignment and PDGM implementation cost (4) 0.16 ─ 0.16 ─ Dispute settlements (5) 0.08 ─ 0.08 ─ Provider moratorium impairment (6) ─ ─ 0.14 ─ Net tax benefit related to Almost Family acquisition ─ ─ ─ (0.02) Adjusted net income attributable to LHC Group, Inc.’s common stockholders $1.15 $1.03 $4.47 $3.55 Footnotes : 1. Provision for bad debts are classified as implicit price concessions in determining the transaction price of the Company's ne t service revenue. 2. Transition, integration and Homecare Homebase conversion expenses and other costs associated with the acquisition of Almost Family and other recently announced or complete d acquisitions ($7.3 million pre - tax in the three months ended December 31, 2019 and $35.6 million in the twelve months ended December 31, 2019 ). 3 .Expenses and impairments associated with the closure or consolidation of 5 locations in the fourth quarter of 2019 along w ith residual costs and expenses in connection with closures in prior periods ($1.5 million pre - tax in the three months ended December 31, 2019 and $8.1 million in the twelve months ended December 3 1, 2019). 4. Expenses, severance payments and other benefits associated with the separation agreement from the resignation of our forme r C hief Operating Officer effective December 31, 2019, along with expenses and costs associated with a realignment of our home health divisions and PDGM preparedness, software implementation and training cost ($6.9 million pre - tax in the three months ended December 31, 2019 and in the twelve months ended December 31, 2019). 5. In the fourth quarter of 2019, the Company settled disputed contractual payments ($3.7 million pre - tax in the three months en ded December 31, 2019 and in the twelve months ended December 31, 2019). 6. During the twelve months ended December 31, 2019, the Company recorded $6.0 million of moratoria impairment as a result of th e Centers for Medicare and Medicaid Services (“CMS”) action to remove all federal moratoria with regard to Medicare provider enrollment. 26
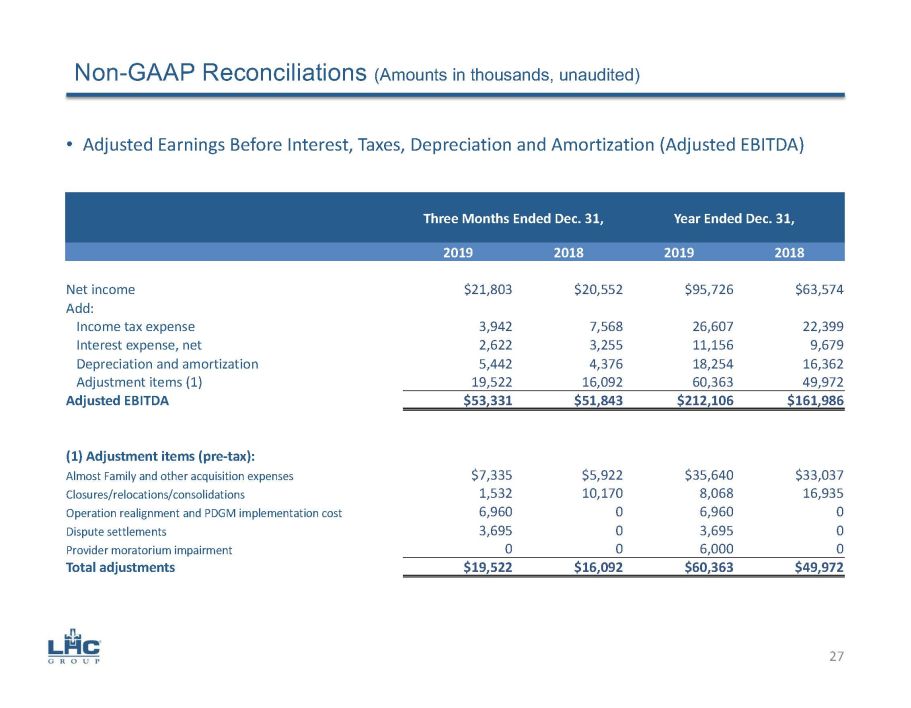
• Adjusted Earnings Before Interest, Taxes, Depreciation and Amortization (Adjusted EBITDA) Three Months Ended Dec. 31, Year Ended Dec. 31, 2019 2018 2019 2018 Net income $21,803 $20,552 $95,726 $63,574 Add: Income tax expense 3,942 7,568 26,607 22,399 Interest expense, net 2,622 3,255 11,156 9,679 Depreciation and amortization 5,442 4,376 18,254 16,362 Adjustment items (1) 19,522 16,092 60,363 49,972 Adjusted EBITDA $53,331 $51,843 $212,106 $161,986 (1) Adjustment items (pre - tax): Almost Family and other acquisition expenses $7,335 $5,922 $35,640 $33,037 Closures/relocations/consolidations 1,532 10,170 8,068 16,935 Operation realignment and PDGM implementation cost 6,960 0 6,960 0 Dispute settlements 3,695 0 3,695 0 Provider moratorium impairment 0 0 6,000 0 Total adjustments $19,522 $16,092 $60,363 $49,972 Non - GAAP Reconciliations (Amounts in thousands, unaudited) 27