Attached files
UNITED STATES
SECURITIES AND EXCHANGE COMMISSION
Washington, D.C. 20549
———————
FORM 10-K
———————
☒ ANNUAL REPORT UNDER
SECTION 13 OR 15(d) OF THE SECURITIES EXCHANGE ACT OF
1934
For The
Year Ended: December 31, 2019
———————

ISSUER DIRECT CORPORATION
(Name of small business issuer in its charter)
———————
|
Delaware
|
|
1-10185
|
|
26-1331503
|
|
(State or Other Jurisdiction of Incorporation)
|
|
(Commission File Number)
|
|
(I.R.S. Employer Identification No.)
|
One Glenwood Avenue, Suite 1001, Raleigh, NC 27603
(Address of Principal Executive Office) (Zip Code)
(919) 481-4000
(Registrant’s telephone number, including area
code)
———————
Securities registered pursuant to Section 12(b) of the
Act:
|
Title of each class
|
|
Name of each exchange on which registered
|
|
Common
Stock, par value $0.001 per share
|
|
NYSE
American.
|
Securities registered pursuant to Section 12(g) of the
Act:
None
(Title of Class)
———————
Indicate
by check mark if the registrant is a well-known seasoned issuer, as
defined in Rule 405 of the Securities Act. Yes ☐ No ☒
Indicate
by check mark if the registrant is not required to file reports
pursuant to Section 13 or Section 15(d) of the Act. Yes
☐ No ☒
Indicate
by check mark whether the registrant (1) has filed all reports
required to be filed by Section 13 or 15(d) of the Securities
Exchange Act of 1934 during the preceding 12 months (or for such
shorter period that the registrant was required to file such
reports), and (2) has been subject to such filing requirements for
the past 90 days. Yes ☒ No ☐
Indicate
by check mark whether the registrant has submitted electronically
every Interactive Data File required to be submitted and posted
pursuant to Rule 405 of Regulation S-T (§ 232.405 of this
chapter) during the preceding 12 months (or for such shorter period
that the registrant was required to submit and post such files).
Yes ☒ No ☐
Indicate
by check mark if disclosure of delinquent filers pursuant to Item
405 of Regulation S-K (§229.405 of this chapter) is not
contained herein, and will not be contained, to the best of
registrant’s knowledge, in definitive proxy or information
statements incorporated by reference in Part III of this Form 10-K
or any amendment to this Form 10-K. ☒
Indicate
by check mark whether the registrant is a large accelerated filer,
an accelerated filer, a non-accelerated filer, smaller reporting
company, or an emerging growth company. See the definition of
“large accelerated filer,” “accelerated
filer,” “smaller reporting company” and
“emerging growth company” in Rule 12b-2 of the Exchange
Act. (Check one):
|
Large
accelerated filer
|
☐
|
Accelerated
filer
|
☐
|
|
Non-accelerated
filer
|
☐ (Do not check if a smaller reporting
company)
|
Smaller
reporting company
|
☒
|
|
|
|
Emerging
growth company
|
☐
|
If an
emerging growth company, indicate by check mark if the registrant
has elected not to use the extended transition period for complying
with new or revised financial accounting standards provided
pursuant to Section 13(a) of the Exchange Act. ☐
Indicate
by check mark whether the registrant is a shell company (as defined
in Rule 12b-2 of the Act). Yes ☐ No
☒
The
aggregate market value of the voting stock held by non-affiliates
of the registrant as of June 30, 2019, the last business day of the
registrant's second fiscal quarter, was approximately $43,260,762
based on the closing price reported on the NYSE American as of such
date.
As of
February 27, 2020, the number of outstanding shares of the
registrant's common stock was 3,786,398.
DOCUMENTS INCORPORATED BY REFERENCE
Portions
of the registrant’s definitive proxy statement relating to
its 2020 annual meeting of stockholders (the “2020 Proxy
Statement”) are incorporated by reference into Part III of
this Annual Report on Form 10-K where indicated. The 2020 Proxy
Statement will be filed with the U.S. Securities and Exchange
Commission within 120 days after the end of the year to which this
report relates.
Table of Contents
|
|
|
|
|
|
Description of Business
|
|
4
|
|
|
|
|
|
|
|
Risk Factors
|
|
11
|
|
|
|
|
|
|
|
Unresolved Staff Comments
|
|
19
|
|
|
|
|
|
|
|
Property
|
|
19
|
|
|
|
|
|
|
|
Legal Proceedings
|
|
19
|
|
|
|
|
|
|
|
Mine Safety Disclosures
|
|
19
|
|
|
|
|
|
|
|
|
|
|
|
|
Market for Common Equity and Related Stockholder
Matters
|
|
20
|
|
|
|
|
|
|
|
Select Financial Data
|
|
22
|
|
|
|
|
|
|
|
Management’s Discussion and Analysis and Results of
Operations
|
|
23
|
|
|
|
|
|
|
|
Quantitative and Qualitative Disclosures About Market
Risk
|
|
30
|
|
|
|
|
|
|
|
Financial Statements and Supplementary Data
|
|
30
|
|
|
|
|
|
|
|
Changes in and Disagreements with Accountants on Accounting and
Financial Disclosure
|
|
30
|
|
|
|
|
|
|
|
Controls and Procedures
|
|
30
|
|
|
|
|
|
|
|
Other Information
|
|
31
|
|
|
|
|
|
|
|
|
|
|
|
|
Directors, Executive Officers, and Corporate
Governance
|
|
32
|
|
|
|
|
|
|
|
Executive Compensation
|
|
32
|
|
|
|
|
|
|
|
Security Ownership of Certain Beneficial Owners and Management and
Related Stockholder Matters
|
|
32
|
|
|
|
|
|
|
|
Certain Relationships and Related Transactions, and Director
Independence
|
|
32
|
|
|
|
|
|
|
|
Principal Accountant Fees and Services
|
|
32
|
|
|
|
|
|
|
|
|
|
|
|
|
Exhibits
|
|
33
|
|
|
|
|
|
|
|
|
Signature
|
|
33
|
|
|
|
|
|
|
EX-21.1
|
Subsidiaries of the Registrant
|
|
|
|
|
|
|
|
|
EX-23.1
|
Consent of Independent Registered Public Accounting
Firm
|
|
|
|
|
|
|
|
|
EX-31.1
|
Chief Financial Officer Certification Pursuant to Section
302
|
|
|
|
|
|
|
|
|
EX-31.2
|
Chief Financial Officer Certification Pursuant to Section
302
|
|
|
|
|
|
|
|
|
EX-32.1
|
Chief Executive Officer Certification Pursuant to Section
906
|
|
|
|
|
|
|
|
|
EX-32.2
|
Chief Financial Officer Certification Pursuant to Section
906
|
|
|
|
|
|
|
|
|
EX-101.INS
|
XBRL INSTANCE DOCUMENT
|
|
|
|
EX-101.SCH
|
XBRL TAXONOMY EXTENSION SCHEMA
|
|
|
|
EX-101.CAL
|
XBRL TAXONOMY EXTENSION CALCULATION LINKBASE
|
|
|
|
EX-101.DEF
|
XBRL TAXONOMY EXTENSION DEFINITION LINKBASE
|
|
|
|
EX-101.LAB
|
XBRL TAXONOMY EXTENSION LABEL LINKBASE
|
|
|
|
EX-101.PRE
|
XBRL TAXONOMY EXTENSION PRESENTATION LINKBASE
|
|
|
CAUTIONARY STATEMENT
All
statements, other than statements of historical fact, included in
this Form 10-K, including without limitation the statements under
“Management’s Discussion and Analysis of Financial
Condition and Results of Operations” and “Description
of Business,” are, or may be deemed to be, forward-looking
statements. Such forward-looking statements involve assumptions,
known and unknown risks, uncertainties and other factors, which may
cause the actual results, performance or achievements of Issuer
Direct Corporation, to be materially different from any future
results, performance or achievements expressed or implied by such
forward-looking statements contained in this Form
10-K.
In our
capacity as Company management, we may from time to time make
written or oral forward-looking statements with respect to our
long-term objectives or expectations which may be included in our
filings with the Securities and Exchange Commission (the
“SEC”), reports to stockholders and information
provided in our web site.
The
words or phrases “will likely,” “are expected
to,” “is anticipated,” “is
predicted,” “forecast,” “estimate,”
“project,” “plans to continue,”
“believes,” or similar expressions identify
“forward-looking statements.” Such forward-looking
statements are subject to certain risks and uncertainties that
could cause actual results to differ materially from historical
earnings and those presently anticipated or projected. We wish to
caution you not to place undue reliance on any such forward-looking
statements, which speak only as of the date made. We are calling to
your attention important factors that could affect our financial
performance and could cause actual results for future periods to
differ materially from any opinions or statements expressed with
respect to future periods in any current statements.
The
following list of important risk factors is not all-inclusive, and
we specifically decline to undertake an obligation to publicly
revise any forward-looking statements that have been made to
reflect events or circumstances after the date of such statements
or to reflect the occurrence of anticipated or unanticipated
events. Among the factors that could have an impact on our ability
to achieve expected operating results and growth plan goals and/or
affect the market price of our stock are:
●
Dependence on key
personnel.
●
Fluctuation in
quarterly operating results related to transaction-based
revenue.
●
Our ability to
successfully integrate and operate acquired or newly formed
entities, ventures and or subsidiaries.
●
Changes in laws and
regulations that affect our operations and demand for our products
and services.
Available Information
Our
Annual Report on Form 10-K, Quarterly Reports on Form 10-Q,
Financial Data in XBRL, Current Reports on Form 8-K, proxy
statements and amendments to those reports filed or furnished
pursuant to Sections 13(a) and 15(d) of the Securities Exchange Act
of 1934, as amended, are available, free of charge, in the investor
relations section of our website at
www.issuerdirect.com.
The SEC
maintains an Internet site that contains reports, proxy and
information statements and other information regarding issuers that
file electronically with the SEC at www.sec.gov. The public may
read and copy any materials we file with the SEC at the SEC’s
Public Reference Room at 100 F Street, NE, Washington, D.C. 20549.
The public may obtain information on the operation of the Public
Reference Room by calling the SEC at 1-800-SEC-0330.
PART I
ITEM 1. DESCRIPTION OF
BUSINESS.
Company Overview
Issuer
Direct Corporation and its subsidiaries are hereinafter
collectively referred to as “Issuer Direct”, the
“Company”, “We” or “Our” unless
otherwise noted). Our corporate offices are located at One Glenwood
Ave., Suite 1001, Raleigh, North Carolina, 27603.
We
announce material financial information to our investors using our
investor relations website, SEC filings, investor events, news and
earnings releases, public conference calls, webcasts and social
media. We use these channels to communicate with our investors and
the public about our company, our products and services and other
related matters. It is possible that information we post on some of
these channels could be deemed to be material information.
Therefore, we encourage investors, the media and others interested
in our company to review the information we post to all of our
channels, including our social media accounts.
Issuer Direct® is a premier provider of
communications and compliance technology solutions that are
designed to help organizations tell their stories globally. Issuer
Direct's principal platform, Platform id.™, empowers users by thoughtfully
integrating the most relevant tools, technologies and products,
thus eliminating the complexity associated with producing and
distributing their business communications and financial
information.
We work with a diverse customer base, which
includes not only corporate issuers and private companies, but also
investment banks, professional firms, such as investor relations
and public relations firms, as well as the accounting and legal
communities. We also sell products and services to others in the
financial services industry, including brokerage firms and mutual
funds. Our customers and their service providers utilize
Platform id.
and related solutions from document
creation all the way to dissemination to regulatory bodies, news
outlets, financial platforms and their shareholders. Private
companies primarily use our news distribution and webcasting
products and services to disseminate their message globally.
Platform id.’s intelligent subscription platform guides
thousands of customers through the process of communicating their
message to a large audience.
We also work with several select stock exchanges
by making available certain parts of our platform
under agreements to integrate our
offerings within their products. We believe such partnerships will
yield increased exposure to a targeted customer base that could
impact our revenue and overall brand in the
market.
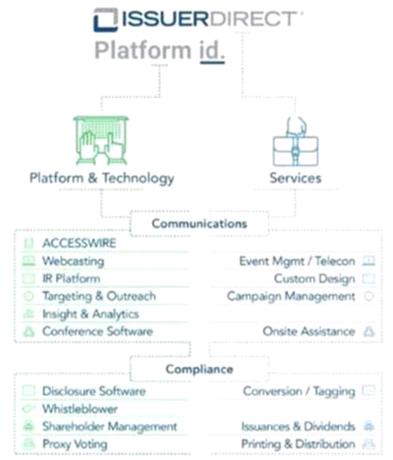
In order to provide a good representation of our
business and reflect our platform first
engagement strategy, we report revenue
in two revenue streams: (i) Platform and Technology and (ii)
Services. Set forth below is an infographic depicting the modules
included in Platform id.
and the services we
provide:
4
Platform and Technology
As our cloud-based subscription business continues
to mature, we expect the Platform and Technology portion of our
business to continue to increase over the next several years, both
in terms of overall revenue and as compared to the Services portion
of our business. Platform and Technology revenue grew to 66% of
total revenue during 2019, compared to 60%, 56% and approximately
44% of our revenue for the years ending December 31, 2018, 2017 and
2016, respectively. In 2019, growth in our Platform &
Technology revenue stream was led by the acquisition of the
VisualWebcaster Platform (“VWP”) in our webcasting
business as well as increased subscriptions of Platform
id.
as a result of our focus on a
platform
first engagement strategy and
converting customers which historically relied on us for services
work to utilizing Platform id. While our ACCESSWIRE® news distribution offering
showed some overall growth in 2019, it had represented a majority
of the year over year growth in our Platform and Technology revenue
for fiscal years 2017 and 2018.
We plan to continue to invest in both our current
Platform id.
offerings as well as additional
offerings that we intend to incorporate into our Platform and
Technology offerings. These new offerings will further help
establish Platform id.
and our strategy of bringing the
issuer and investor closer together. One offering is helping public
issuers better understand the shareholder composition of their
company, which we believe is an area that is underserved by the
market today.
Platform id.
Platform id.
is our cloud-based subscription
platform that efficiently and effectively helps our customers
manage their events when seeking to distribute their messaging to
key constituents, investors, markets and regulatory systems around
the globe. Platform id.
consists of several related but
distinct shareholder communications and compliance modules that
public companies utilize every quarter when they have requirements
to meet reporting obligations as well as fair disclosure to the
markets.
5
Within most of our target markets, customers
require several individual services and/or software providers to
meet their investor relations, communications and compliance needs.
We believe Platform id.
can address all of these needs in a
single, secure, cloud-based platform - one that offers a customer
control, increases efficiencies, demonstrates clear value and, most
importantly, delivers consistent and compliant messaging from one
centralized platform.
Communications Modules
ACCESSWIRE
Our press release offering, which is marketed
under the brand ACCESSWIRE, is a cost-effective, Regulation Fair Disclosure
(“FD”) news dissemination and media outreach service.
The ACCESSWIRE product offering focuses on press release
distribution for both private and public companies globally. We
believe ACCESSWIRE is becoming a competitive alternative to the
traditional newswires because we have been able to integrate
customer editing features and improve the targeting and growing
analytics reporting systems as well as increase its dissemination
distribution footprint. We believe this strategy will enable us to
add new customers for 2020 and beyond. We have also been able to
maintain flexible pricing by offering our customers the option to
pay per release or enter into longer-term, flat-fee subscriptions.
Currently, ACCESSWIRE is available within Platform
id.
as part of a subscription, or as a
stand-alone module.
On July 3, 2018, we completed the acquisition of
Filing Services Canada Inc. (“FSCwire”), which not only
increased our customer base, but more importantly increased the
global footprint, distribution capabilities and editorial team of
our press release business. During the latter part of 2018, we
completed the integration of FSCwire and rebranded it as ACCESSWIRE
Canada, and are now focused on offering those customers the full
suite of products included in Platform id.
ACCESSWIRE
is dependent upon several key partners for news distribution, some
of which are also partners that we rely on for other investor
outreach offerings. During the second quarter of 2019, one of our
key partners made an industry-wide decision to no longer accept
investor commentary content. A significant portion of our
historical ACCESSWIRE revenue was generated from this type of
content, as further discussed in the Results of Operations below.
As part of our efforts to expand our customer base during the
second half of 2018, we began to market ACCESSWIRE more heavily
towards public and private company news issuers, which we believe
will mitigate the impact of the loss of the investment commentary
content long-term. Absent of the investment commentary business,
our ACCESSWIRE news business grew 44% during 2019 compared to the
prior year. Further disruption in any of our partnerships could
have a materially adverse impact on our ACCESSWIRE and overall
business.
Professional Conference Organizer (PCO) Module
At the end of 2018, we released a new module to
Platform id., centered around the professional conference
organizer (“PCO”). This subscription is being
licensed to investor conference organizers, which in the aggregate
we believe hold an estimated 1,000 plus events a year. This
cloud-based product is integrated within Platform id. and enhances our
communications module subscription offerings of newswire,
newsrooms, webcasting and shareholder targeting.
This
cloud-based platform, which is now available as a mobile app,
offers organizers, issuers and investors the ability to register,
request and approve one-on-one meetings, manage schedules, perform
event promotion and sponsorship, print attendee badges and manage
lodging. By combining this module with the other components of
Platform id.
(particularly webcasting and newswire modules), we believe it gives
us a unique offering for PCOs that is not available elsewhere in
the market.
We
believe entering this business expands our current Platform and
Technology revenue base, and as an adjacency, should assist in
making Platform id.
an platform of choice for investment banks, issuers and
investors.
Investor Network
Over the past few years, we have been focused on
refining the model of digital distribution of our customers’
message to the investment community and beyond. This is being
accomplished by integrating our shareholder outreach module,
Investor Network, into and with Platform id.
Most of the customers subscribing to
this module today are historical PrecisionIR (“PIR”)
– Annual Report Service (“ARS”) users, as well as
new customers purchasing the entire Platform id.
subscription. We have migrated some of
the customers from the traditional ARS business into this new
digital subscription business. However, there can be no assurances
these customers will continue using this digital platform in the
long term if market conditions or shareholder interest is not
present.
6
Webcasting
The earnings event industry is a highly
competitive space with the majority of the business being driven
from practitioners in investor relations and communications firms.
We estimate there are over 5,000 companies in North America
conducting earnings events each quarter that include a
teleconference, webcast or both as part of their events.
Platform id. also
incorporates other elements of the
earnings event, including earnings date/call announcement, earnings
press release and SEC Form 8-K filings. There are a handful of our
competitors that can offer this integrated full service solution
today. However, we believe our real-time event setup and integrated
approach offers a more effective way to manage the process as well
as attract an audience of investors.
We have also attempted to differentiate our
offering by investing time and financial resources developing and
integrating systems and processes within Platform
id.
and creating an application
programming interface (“API”). This API allows
customers, such as financial content sites and investment banks, to
query an industry or a single company’s current and past
earnings calls and present those webcasts on their
platforms. Initially, this has
been broadly distributed via our Investor Network platform, with
expectations that customers will license this dataset for their
platforms in the future. We believe this offering will further
increase our brand awareness.
Additionally,
as a commitment to broadening the reach of our webcast platform,
all events are broadcast live within our shareholder outreach
module, which helps drive new audiences and give companies the
ability to view their analytics and engagement of each event. We
believe these analytics, which will be a component of our Insight
and Analytics module, will increase the demand for our webcasting
platform among the corporate issuer community.
On
January 3, 2019, we acquired VWP from Onstream Media Corporation.
VWP is a leading cloud-based webcast, webinar and training platform
that delivers live and on-demand streaming of events to audiences
of all sizes. VWP allows customers to create, produce and deliver
events, which we feel integrates well into Platform id. We believe by acquiring VWP
we have significantly strengthened our webcasting product and
Platform id.
offering as well as acquired over 120 customers, ranging from small
private companies to Fortune 500 companies. The VWP technology
enables us the ability to host thousands of additional webcasts
each year, expanding and diversifying our webcast business from our
historical earnings based events to include corporate meetings,
training sessions and town hall type events. As we expand our
platform, it is vital for us to have solutions that service both
our core public companies but also a growing segment of private
customers.
Investor Relations Content
Our investor relations content network is another
component of Platform id., which is used to create the investor
relations’ tab of a company’s website. This investor
relations content network is a robust series of data feeds
including news feeds, stock feeds, fundamentals, regulatory
filings, corporate governance and many other components which are
aggregated from a majority of the major exchanges and news
distribution outlets around the world. Customers can subscribe to
one or more of these data feeds or as a component of a fully
designed and hosted website for pre-IPO companies, SEC reporting
companies and partners seeking to display our content on their
corporate sites. The clear benefit to our investor relations module
is its integration into Platform id.
As such, companies can produce content
for public distribution and it is automatically linked to their
corporate website, distributed to targeted groups and placed into
our data feed partners.
Compliance Modules
Platform id.’s disclosure reporting module is a document
conversion, editing and filing offering which is designed for
reporting companies and professionals seeking to insource the
document drafting, editing and filing processes to the SEC’s
EDGAR system. This module is available in both a secure public
cloud within our Platform id.
subscription as well as in a private
cloud option for corporations, mutual funds and the legal community
looking to further enhance their internal document process. As this
module has begun to be adopted by our customers, we have seen a
negative impact on our legacy disclosure conversion services
business. However, the margins associated with our Platform and
Technology business compared to our Services business are higher
and align with our long-term strategy, and as such, we believe this
module will have a positive impact on our compliance business going
forward.
Toward the end of 2017, we completed upgrades to
our disclosure reporting product to include tagging functionality
that meets newly mandated SEC requirements. On June 28, 2018, the
SEC voted to adopt rules mandating the use of Inline XBRL (Inline
Extensible Business Reporting Language or “iXBRL”) for
the submission of financial statement information to the SEC. The
new requirements for iXBRL have a three-year phase in which began
for large accelerated filers that use U.S. GAAP on June 15, 2019,
and will begin for all other accelerated filers to begin reporting
for fiscal periods ending on or after June 15, 2020 and for all
other filers to begin reporting for fiscal periods ending on or
after June 15, 2021. These upgrades also include meeting new SEC
mandates for foreign filers that compile financial statements using
International Financial Reporting Standards (“IFRS”) to
be able to utilize our cloud-based platform. Beginning in 2018,
foreign filers with fiscal year’s ending on or after December
15, 2017, are now required to report their financial statements in
XBRL with the SEC. Platform id.
has adopted the new IFRS taxonomy into
and with its new disclosure upgrade for iXBRL to ensure our
customers are able to meet these new mandates.
7
Our whistleblower module is an add-on product
within Platform id.
This system delivers secure
notifications and basic incident workflow management processes that
align with a company’s corporate governance whistleblower
policy. As a supported and subsidized bundle product of the New
York Stock Exchange (“NYSE”) offerings, we are able to
gain relationships with new IPO customers and other larger cap
customers listed on the NYSE.
A valued subscription add-on in our
Platform id.
offering is the ability for our
customers to gain access to real-time information about their
shareholders, stock ledgers and reports and to issue new shares
from our cloud-based stock transfer module. Managing the
capitalization table of a public company or pre-IPO company is a
cornerstone of corporate governance and transparency, and as such
companies and community banks have chosen us to assist with their
stock transfer needs, including bond offerings and dividend
management. This is an industry which has experienced declining
overall revenues as it was affected by the replacement of paper
certificates with digital certificates. However, we have been
focused on selling subscriptions of the stock transfer component of
our platform, allowing customers to gain access to our cloud-based
system in order to move shares or query shareholders, which we
believe has resulted in a more efficient process for both our
customers and us.
Our
proxy module is marketed as a fully integrated, real-time voting
platform for our customers and their shareholders of record. This
module is utilized for every annual meeting or special meeting we
manage for our customers and offers both full-set mailing and
notice of internet availability options.
Services
As we focus on expanding our cloud-based
subscription business, we expect to see decreases in the overall
revenues associated with our Services business, absent additional
acquisitions which may occur in the future. Typically, Services
revenues relate to activities where substantial resources are
required to perform the work for our customers and/or hard goods
are utilized as part of the engagement. To date, most of our
Services have been related to converting and editing SEC documents
and XBRL tagging, which has been our core disclosure business over
the last 13 years, and completing SEDAR (the Canadian equivalent of
EDGAR) filings. Services also include telecommunications services
and print, fulfillment and delivery of stock certificates, proxy
materials or annual reports depending on each customer’s
engagement. Services are not required, but are optional for
customers that utilize our Platform id.
and are invoiced as
used.
Our investor outreach and engagement offering,
formerly known as ARS, was acquired from PIR in 2013. The ARS
business has existed for over 20 years primarily as a physical hard
copy delivery service of annual reports and prospectuses. We
continue to operate a portion of this legacy system for customers
who opt to take advantage of physical delivery of material.
Additionally, we continue to attempt to migrate the install base
over to subscriptions of our digital outreach engagement module
within Platform id.
We believe we will continue to see
further attrition of both customers and revenues in this category
as we focus our efforts on our Platform and Technology
business.
Our overall strategy includes:
Expansion of Current Customers
We
expect to continue to see demand for our products within our
customer base. As we continue to transition from a services
oriented business, our focus is to migrate customer contracts over
to subscription-based contracts for our entire Platform
id. offering. We
believe this will help us move from a transaction based revenue
model to a recurring subscription-based revenue model, which may
give us more consistent, predictable revenue patterns and hopefully
creates longer lasting customer relationships. Additionally, as
part of our customer expansion efforts, we are committed to working
beyond the single point of contact and into the entire C suite
(CEO, CFO, IRO, Corporate Secretary, etc.) of an organization which
we believe will help drive
subscription revenues.
Focus on Organic Growth
Our
primary growth strategy continues to be selling our cloud-based
offerings via Platform
id.
to new customers under a subscription arrangement, whereas in the
past we were inclined to sell a single point solution. Selling a
subscription of Platform id. allows us to provide our
customers with a competitively priced, complete solution for their
communications and compliance needs. Our strategy of selling our
cloud-based offerings via Platform id. to all customers under a
subscription agreement should benefit us by moving away from
selling individual solutions within highly commoditized markets
that are experiencing pricing pressures.
8
New Offerings
During
2020 and going forward, we will continue to innovate, improve and
build new applications into and with our platform, with the
ultimate objective of developing applications in combination, that
are not offered by our competitors. As a company focused on
technology offerings, we understand the importance of advancements
and fully appreciate the risks and consequences of losing our
market position - a very common mistake many technology companies
have made. The pursuit of technological innovation is and has been
a part of our overall strategy as an organization over the last
several years.
Each
year we bring to market certain platform upgrades, add-ons, and new
offerings that we believe will round out our overall platform
solutions. We believe our innovation and technological efficiencies
continue to be a competitive advantage and focus for
us.
Part of
our continued strategy from 2019 is to bring to market our insight
and analytics engine for our Platform id. product offering, which we
began testing with a close group of professionals and customers in
late 2018. The insights and analytics component of Platform
id. will give our
customers the ability to see shareholder and investor engagement
from the source, (i.e. at a conference, road show, earnings event,
corporate website, Investor Network, affiliate networks and
thousands of distribution points from our already robust news
distribution network.), which we believe will enable them to better
assess the effectiveness of investor outreach programs and target
potential investors more effectively. This module’s success
relies on access to raw historical data, from both our customers
and investors in order to tie together patterns and insights. Being
in the conference business, adding improved IR tools and selling
subscriptions are all the right steps in order to gather this data
to run through our engines and analytics systems. We believe we
have gathered enough data for the analysis to be meaningful and
plan to make this module available in 2020.
Acquisition Strategy
We will
continue to evaluate complimentary verticals and systems that we
can integrate well into our current platforms. These opportunities
typically need to be accretive and consistent with what we have
done in the past. We will continue to maintain our product and
technology focus, so it is likely we will look for acquisitions in
areas we currently generate revenues and/or see clear opportunities
to leverage our strengths to disrupt existing markets. In these
potential transactions, we will look for recurring long-term
revenues, customers, and leading technologies that will further
enhance our overall market position.
Sales and Marketing
During
2020, we will continue to strengthen our brands in the market by
working aggressively to expand our new customer footprint and
continue to cross sell to increase average revenue per user. Since
our platform, systems and operations are built to handle growth, we
can leverage them to produce consistently high margins and
increased cash flows without a proportional increase in our capital
or operating expenses.
Our
sales organization is responsible for generating new customer
opportunities and expanding our current customers. We ended 2019
with a multi-tier organization of sales personnel, made up of
Strategic Account Managers and Business Development Managers. We
believe this structured approach is the most efficient and
effective way to reach new customers and also grow our current
install base. The total compensation packages for these teams are
heavily weighted with commission compensation to incent sales. All
members of the team have sales quotas. As of December 31, 2019, we
employed 20 full-time equivalent sales personnel compared to 16 as
of December 31, 2018. During the first quarter of 2020, we have
also created a new inbound digital sales and marketing group to
manage all inbound leads, e-commerce and digital marketing focused
on the portions of our platform we believe can be purchased
online.
Our
marketing organization has been focused on both new customer
acquisition as well as campaigns to educate current customers on
the advantages of our entire Platform id. Additionally, our marketing
team has expanded their focus on investor conferences, strategic
exchange partnerships and private company marketing activities in
order to continue to scale our business long term.
Additionally, our
management team plays a critical role in our sales process,
assisting the organization and customers with new offerings, cross
selling opportunities and channel development; because our overall
organization is small, we benefit from this approach and believe
this is key to our future success.
9
Technology and Security
We will
continue to make investments in our technology as we transition our
business from a historically service-oriented business to a
cloud-based subscription organization. In all of our offerings,
quality, support, and scalability as well as the need to preserve
the confidential content of our customers are of utmost importance
and part of our core values.
Since
2018, we continue to maintain agreements with security consulting
firms to identify, address and create policies and plans which
enable us to mitigate our cybersecurity and information
vulnerabilities on both a short-term and long-term basis. We
believe having a strong cyber and information security policy is
not only necessary to maintain our current business model but also
important to attract new customers. We plan to continue to work
closely with these firms and others to ensure our security policies
meet our customers’ needs and requirements.
Industry Overview
Our
industry benefits from increased regulatory requirements and the
need for platforms and systems to manage these new regulations.
Additionally, the industry, along with cloud-based technologies,
have matured considerably over the past several years, whereby
corporate issuers and communication professionals are seeking
platforms and systems to do some, if not all the work themselves.
We believe we are well positioned in this new environment to
benefit from software licensing and further advancements of
Platform id.
The
business services industry as it relates to compliance and
communications is highly fragmented, with hundreds of independent
service companies that provide a range of financial reporting,
document management services and with a wide range of printing and
technology software providers. The demands for many of our services
historically have been cyclical and reliant on capital market
activity. Over the past few years, we have invested in several new
product offerings beyond our traditional compliance reporting and
transaction services business. We believe these new offerings will
afford us the ability to reduce our revenue seasonality and provide
a new baseline of recurring annualized contracts under our new
subscription-based business.
According to a 2018
Burton-Taylor Media Intelligence report, the global communications
technology market is $4.1+ billion in annual spend. This total
consists of spending on press releases, earnings events, engagement
and targeting and investor relations platforms globally. The key
drivers of growth in our industry relate to changing regulatory
requirements, new innovated platform technologies and typical
industry consolidations. We believe we have a significant
competitive advantage as a result of our technology and workflow
automation solutions.
Competition
Despite
some significant consolidation in recent years, our industry
remains both highly fragmented and extremely competitive. The
success of our products and services are generally based on price,
quality and the ability to service customer demands. Management has
been focused on offsetting these risks relating to competition as
well as the seasonality by introducing our cloud-based subscription
platforms, with higher margins, clear competitive advantages and
scalability to withstand market and pricing pressures.
We also
review our operations on a regular basis to balance growth with
opportunities to maximize efficiencies and support our long-term
strategic goals. We believe by blending our workflow technologies
with our legacy service offerings we are able to offer a
comprehensive set of products and solutions to each of our
customers within one platform that most competitors cannot offer
today.
We
believe we are positioned to be the public company platform of
choice as a cost-effective alternative to both small regional
providers and global providers. We also believe we benefit from our
location in Raleigh, North Carolina, as we do not experience
significant competition for sales, customer service, or production
personnel.
Customers
Our
customers include a wide variety of public and private companies,
mutual funds, law firms, brokerage firms, investment banks,
individuals, and other institutions. For the year ended December
31, 2019, we worked with 2,169 publicly traded customers and 2,691
private customers, compared to 2,103 publicly traded customers and
2,265 private customers for the year ended December 31, 2018. We
did not have any customers during the year ended December 31, 2019
that accounted for more than 10% of our revenue or more than 10% of
our year end accounts receivable balance as of December 31,
2019.
10
Employees
As of
December 31, 2019, we employed seventy-nine employees and engaged
six independent contractors, none of which are represented by a
union. Our employees work in our corporate offices in North
Carolina and in other offices throughout North
America.
Facilities
Our
headquarters are located in Raleigh, North Carolina. In October
2019, we began a new lease for 9,766 square feet of office space,
which expires December 31, 2027. As part of our acquisition of VWP,
we assumed a three-year lease for an office in Ft. Lauderdale,
Florida and a short term lease for an office in New York City, New
York. Additionally, we have an office in Salt Lake City, Utah which
is also on a short term lease.
Insurance
We
maintain both a general business liability policy and an errors and
omissions policy specific to our industry and operations. We
believe that our insurance policies provide adequate coverage for
all reasonable risks associated with operating our business.
Additionally, we maintain a Directors and Officers insurance
policy, which is standard for our industry and size. We also
maintain key person life insurance on our C level executives, and
other key individuals.
Regulations
The
securities and financial services industries generally are subject
to regulation in the United States and elsewhere. Regulatory
policies in the United States and the rest of the world are tasked
with safeguarding the integrity of the securities and financial
markets with protecting the interests of both issuers and
shareholders.
In the
United States, corporate issuers are subject to regulation under
both federal and state laws, which often require public disclosure
and regulatory filings. At the federal level, the SEC regulates the
securities industry, along with the Financial Industry Regulatory
Authority, or FINRA, formally known as NASD, and NYSE market
regulations, various stock exchanges, and other self-regulatory
organizations (“SRO”).
In the
European Union (EU), the securities and reporting authorities tend
to be based on exchanges as well as individual country disclosure
requirements. We currently work with our stock exchange partners to
deliver our solutions. We believe this is the best approach as this
market is highly complex and divided in comparison to our North
American markets.
We
operate our filing agent business and transfer agent business under
the supervision and regulations of the SEC.
Our
transfer agency business, Direct Transfer, LLC, is subject to
certain regulations, which are governed, without limitation by the
SEC, with respect to registration with the SEC, annual reporting,
examination, internal controls, tax reporting and escheatment
services. Our transfer agency is currently approved to handle the
securities of NYSE, NASDAQ and OTC securities.
Our
mission is to assist corporate issuers with these regulations,
communication and compliance of rules imposed by regulatory bodies.
The majority of our business involves the distribution of content,
either electronically or on paper, to governing bodies and
shareholders alike. We are licensed under these regulations to
disseminate, communicate and or solicit on behalf of our customers,
the issuers.
ITEM 1A. RISK FACTORS.
Forward-Looking and Cautionary Statements
Investing in our
common stock involves a high degree of risk. Prospective investors
should carefully consider the following risks and uncertainties and
all other information contained or referred to in this Annual
Report on Form 10-K before investing in our common stock. The risks
and uncertainties described below are not the only ones facing us.
Additional risks and uncertainties that we are unaware of, or that
we currently deem immaterial, also may become important factors
that affect us. If any of the following risks occur, our business,
financial condition or results of operations could be materially
and adversely affected. In that case, the trading price of our
common stock could decline, and you could lose some or all of your
investment.
11
Risks related to our business
Legislative and regulatory changes can influence demand for our
solutions and could adversely affect our business.
The
market for our solutions depends in part on the requirements of the
SEC and other regulatory bodies. Any legislation or rulemaking
substantially affecting the content or method of delivery of
documents to be filed with these regulatory bodies could have an
adverse effect on our business. In addition, evolving market
practices in light of regulatory developments could adversely
affect the demand for our solutions. Uncertainty caused by
political change in the United States and European Union
(particularly Brexit) heightens regulatory uncertainty in these
areas. For example, the White House and Congressional leadership
have publicly announced a goal of repealing or amending parts of
the Dodd Frank Act, as well as certain regulations affecting the
financial services industry. New legislation, or a significant
change in rules, regulations, directives or standards could reduce
demand for our products and services. Regulatory changes could also
increase expenses as we modify our products and services to comply
with new requirements and retain relevancy, impose limitations on
our operations, and increase compliance or litigation expense, each
of which could have a material adverse effect on our business,
financial condition and results of operations.
The environment in which we compete is highly competitive, which
creates adverse pricing pressures and may harm our business and
operating results if we cannot compete effectively.
Competition across
all of our businesses is intense. The speed and accuracy with which
we can meet customers’ needs, the price of our services and
the quality of our products and supporting services are factors in
this competition.
Some
of our competitors have longer operating histories, greater name
recognition, more established customer bases and significantly
greater financial, technical, marketing and other resources than we
do. As a result, they may be able to respond more quickly and
effectively than we can to new or changing market demands and
requirements. We could also be negatively impacted if our
competitors reduce prices, add new features, form strategic
alliances with other companies, or are acquired by other companies
with greater available resources.
These
competitive pressures to any aspect of our business could reduce
our revenue and earnings.
Our revenue growth rate in the recent period relating to our
Platform and Technology business may not be indicative of this
business segment’s future performance.
We
experienced a revenue growth rate of 24% from 2018 to 2019, 21%
from 2017 to 2018 and 49% from 2016 to 2017 with respect to our
Platform and Technology revenue stream. In 2019, much of the growth
came from the acquisition of VWP in January 2019 and FSCwire in
July 2018, while the previous years’ growth was due to the
success of our ACCESSWIRE business. Our historical revenue growth
rate of the Platform and Technology revenue stream is not
indicative of future growth, and we may not achieve similar revenue
growth rates in future periods. You should not rely on our revenue
or revenue growth for any prior quarterly or annual periods as any
indication of our future revenue or revenue growth. If we are
unable to maintain consistent revenue or revenue growth, our stock
price could be volatile, and it may be difficult to achieve and
maintain profitability.
The success of our cloud-based software largely depends on our
ability to provide reliable solutions to our customers. If a
customer were to experience a product defect, a disruption in its
ability to use our solutions or a security flaw, demand for our
solutions could be diminished, we could be subject to substantial
liability and our business could suffer.
Our
Platform and Technology solutions are complex and we often release
new features. As such, our solutions could have errors, defects,
viruses or security flaws that could result in unanticipated
downtime for our customers and harm our reputation and our
business. Internet-based software may contain undetected errors or
security flaws when first introduced or when new versions or
enhancements are released. We might from time to time find such
defects in our solutions, the detection and correction of which
could be time consuming and costly. Since our customers use our
solutions for important aspects of their business, any errors,
defects, disruptions in access, security flaws, viruses, data
corruption or other performance problems with our solutions could
hurt our reputation and may damage our customers’ businesses.
If that occurs, customers could elect not to renew, could delay or
withhold payment to us or may make warranty or other claims against
us, which could result in an increase in our provision for doubtful
accounts, an increase in collection cycles for accounts receivable
or the expense and risk of litigation. We could also lose future
sales. In addition, a security breach of our solutions could result
in our future business prospects being materially adversely
impacted.
12
A substantial portion of our business is derived from our
ACCESSWIRE brand, which is dependent on technology and key
partners.
As
noted, our ACCESSWIRE brand has been vital to the increase in
revenue associated with our Platform and Technology revenue stream.
ACCESSWIRE is dependent upon several key partners for news
distribution, some of which are also partners that we rely on for
other shareholder communications services. During the second quarter of 2019, one of our key
partners made an industry-wide decision to no longer accept
investor commentary content. A significant portion of our
historical ACCESSWIRE revenue was generated from this type of
content, which has significantly affected revenue going
forward. Further disruption in any of these partnership
relationships could have a material adverse impact on our business
and financial results and the inability to procure new key partners
could impact the growth of the ACCESSWIRE brand, particularly with
respect to public company news distribution. Additionally,
ACCESSWIRE is highly dependent on technology and any performance
issues with this technology could have a material impact on our
ability to serve our customers and thus our ability to generate
revenue.
Failure to manage our growth may adversely affect our business or
operations.
Since
2013, we have experienced overall growth in our business, customer
base, employee headcount and operations, and we expect to continue
to grow our business over the next several years. This growth
places a significant strain on our executive management team and
employees and on our operating and financial systems. To manage our
future growth, we must continue to scale our business functions,
improve our financial and management controls and our reporting
systems and procedures and expand and train our work force. In
particular, we grew from twenty-four employees and contractors as
of December 31, 2012 to eighty-five as of December 31, 2019. We
anticipate that additional investments in sales personnel,
infrastructure and research and development spending will be
required to:
●
scale our
operations and increase productivity;
●
address the needs
of our customers;
●
further develop and
enhance our existing solutions and offerings; and
●
develop new
technology.
We
cannot assure you that our controls, systems and procedures will be
adequate to support our future operations or that we will be able
to manage our growth effectively. We also cannot assure you that we
will be able to continue to expand our market presence in the
United States and other current markets or successfully establish
our presence in other markets. Failure to effectively manage growth
could result in difficulty or delays in deploying customers,
declines in quality or customer satisfaction, increases in costs,
difficulties in introducing new features or other operational
difficulties, and any of these difficulties could adversely impact
our business performance and results of operations.
If we are unable to retain our key employees and attract and retain
other qualified personnel, our business could suffer.
Our
ability to grow and our future success will depend to a significant
extent on the continued contributions of our key executives,
managers and employees. In addition, many of our individual
technical and sales personnel have extensive experience in our
business operations and/or have valuable customer relationships
that would be difficult to replace. Their departure, if unexpected
and unplanned, could cause a disruption to our business. Our
competition for these individuals is intense in certain areas of
our business. We may not succeed in identifying and retaining the
appropriate personnel in key positions. Further, competitors and
other entities have in the past recruited and may in the future
attempt to recruit our employees, particularly our sales personnel.
The loss of the services of our key personnel, the inability to
identify, attract and retain qualified personnel in the future or
delays in hiring qualified personnel, particularly technical and
sales personnel, could make it difficult for us to manage our
business and meet key objectives, such as the timely introduction
of new technology-based products and services, which could harm our
business, financial condition and operating results.
13
If we fail to keep our customers’ information confidential or
if we handle their information improperly, our business and
reputation could be significantly and adversely
affected.
If we
fail to keep customers’ proprietary information and
documentation confidential, we may lose existing customers and
potential new customers and may expose them to significant loss of
revenue based on the premature release of confidential information.
While we have security measures in place to protect customer
information and prevent data loss and other security breaches,
these measures may be breached as a result of third-party action,
employee error, malfeasance or otherwise. Because the techniques
used to obtain unauthorized access or sabotage systems change
frequently and generally are not identified until they are launched
against a target, we may be unable to anticipate these techniques
or to implement adequate preventative measures.
In
addition, our service providers (including, without limitation,
hosting facilities, disaster recovery providers and software
providers) may have access to our customers’ data and could
suffer security breaches or data losses that affect our
customers’ information.
If an
actual or perceived security breach or premature release occurs,
our reputation could be damaged and we may lose future sales and
customers. We may also become subject to civil claims, including
indemnity or damage claims in certain customer contracts, or
criminal investigations by appropriate authorities, any of which
could harm our business and operating results. Furthermore, while
our errors and omissions insurance policies include liability
coverage for these matters, if we experienced a widespread security
breach that impacted a significant number of our customers for whom
we have these indemnity obligations, we could be subject to
indemnity claims that exceed such coverage.
We must adapt to rapid changes in technology and customer
requirements to remain competitive.
The
market and demand for our products and services, to a varying
extent, have been characterized by:
●
Technological
change;
●
Frequent product
and service introductions; and
●
Evolving customer
requirements.
We
believe that these trends will continue into the foreseeable
future. Our success will depend, in part, upon our ability
to:
●
Enhance our
existing products and services;
●
Gain market
acceptance.
●
Successfully
develop new products and services that meet increasing customer
requirements; and
To
achieve these goals, we will need to continue to make substantial
investments in sales and marketing. We may not:
●
Have sufficient
resources to make these investments;
●
Be successful in
developing product and service enhancements or new products and
services on a timely basis, if at all; or
●
Be able to market
successfully these enhancements and new products once
developed.
Further, our
products and services may be rendered obsolete or uncompetitive by
new industry standards or changing technology.
14
Our business could be harmed if we do not successfully manage the
integration of any business that we have acquired or may acquire in
the future. These risks include:
●
the difficulty of
integrating the operations and personnel of the acquired businesses
into our ongoing operations;
●
the potential
disruption of our ongoing business and distraction of
management;
●
the difficulty in
incorporating acquired technology and rights into our products and
technology;
●
unanticipated
expenses and delays relating to completing acquired development
projects and technology integration;
●
a potential
increase in our indebtedness and contingent liabilities, which
could restrict our ability to access additional capital when needed
or to pursue other important elements of our business
strategy;
●
the management of
geographically remote units;
●
the establishment
and maintenance of uniform standards, controls, procedures and
policies;
●
the impairment of
relationships with employees and customers as a result of any
integration of new management personnel;
●
risks of entering
markets or types of businesses in which we have either limited or
no direct experience;
●
the potential loss
of key employees or customers of the acquired businesses;
and
●
potential unknown
liabilities, such as liability for hazardous substances, or other
difficulties associated with acquired businesses.
Revenue from Platform id. subscriptions and many of
our service contracts is recognized ratably over the term of the
contract or subscription period. As a result, downturns or upturns
in sales may not be immediately reflected in our operating
results.
We
generally recognize subscription and support revenue from customers
ratably over the terms of their subscription agreements, which are
typically on a quarterly or annual cycle and automatically renew
for additional periods. As a result, a substantial portion of the
revenue we report in each quarter will be derived from the
recognition of deferred revenue relating to subscription agreements
entered into during previous quarters. Consequently, a decline in
new or renewed subscriptions in any one quarter may not be
immediately reflected in our revenue results for that quarter. This
decline, however, will negatively affect our revenue in future
quarters. Accordingly, the effect of significant downturns in sales
and market acceptance of our solutions and potential changes in our
rate of renewals may not be fully reflected in our results of
operations until future periods. Our subscription model also makes
it difficult for us to rapidly increase our subscription revenue
through additional sales in any period, as revenue from new
customers must be recognized over the applicable subscription term.
In addition, we may be unable to adjust our cost structure to
reflect the changes in revenue, which could adversely affect our
operating results.
We cannot accurately predict subscription renewal or upgrade rates
and the impact these rates may have on our future revenue and
operating results.
Our
business depends substantially on customers renewing their
subscriptions with us, specifically Platform id., and expanding their use of
our products. Our customers have no obligation to renew their
subscriptions for our products after the expiration of their
initial subscription period. Given our limited operating history
with respect to our Platform and Technology revenue stream, we may
be unable to accurately predict our revenue retention rate. In
addition, our customers may renew for shorter contract lengths,
lower prices or fewer users. We cannot accurately predict new
subscription or expansion rates and the impact these rates may have
on our future revenue and operating results. Our renewal rates may
decline or fluctuate as a result of a number of factors, including
customer dissatisfaction with our service, customers’ ability
to continue their operations and spending levels and deteriorating
general economic conditions. If our customers do not renew their
subscriptions for our products, purchase fewer solutions at the
time of renewal, or negotiate a lower price upon renewal, our
revenue will decline and our business will suffer. Our future
success also depends in part on our ability to sell additional
solutions and products, more subscriptions or enhanced editions of
our products to our current customers. If our efforts to sell
additional solutions and products to our customers are not
successful, our growth and operations may be impeded. In addition,
any decline in our customer renewals or failure to convince our
customers to broaden their use of our products would harm our
future operating results.
15
Although we have generated positive cash flows for the past 12
years, we have incurred operating losses in the past and may do so
again in the future.
The
Company has incurred operating losses in the past and may do so
again in the future. At December 31, 2019, the Company had
$3,837,000 of retained earnings. Although we have generated
positive cash flows from operations for the past twelve years,
there can be no assurances that we will be able to do so in the
future. As we continue to invest in our cloud-based technologies
and sales and marketing teams, we could experience fluctuations in
our cash flows from operations and retained earnings and there are
no guarantees that our business can continue to generate the
current revenue levels.
We continue to transition our business from a services company to a
software as a service company, which makes it difficult to predict
our future operating results.
In
2015, we began our transition from a services company to a software
as a service company. As a result of this transition, our ability
to forecast our future operating results is limited and subject to
a number of uncertainties, including our ability to plan for and
model future growth. We have encountered and will encounter risks
and uncertainties frequently experienced by growing companies in
rapidly changing industries, such as the risks and uncertainties
described herein. If our assumptions regarding these risks and
uncertainties (which we use to plan our business) are incorrect or
change due to changes in our markets, or if we do not address these
risks successfully, our operating and financial results could
differ materially from our expectations and our business could
suffer.
We are subject to general litigation and regulatory requirements
that may materially adversely affect us.
From
time to time, we may be involved in disputes or regulatory
inquiries that arise in the ordinary course of business. We expect
that the number and significance of these potential disputes may
increase as our business expands and we grow larger. While most of
our agreements with customers limit our liability for damages
arising from our solutions, we cannot assure you that these
contractual provisions will protect us from liability for damages
in the event we are sued. Although we carry general liability
insurance coverage, our insurance may not cover all potential
claims to which we are exposed or may not be adequate to indemnify
us for all liability that may be imposed. Any claims against us,
whether meritorious or not, could be time consuming, result in
costly litigation, require significant amounts of management time,
and result in the diversion of significant operational resources.
Because litigation is inherently unpredictable, we cannot assure
you that the results of any of these actions will not have a
material adverse effect on our business, financial condition,
results of operations and prospects.
New and existing laws make determining our income tax rate complex
and subject to uncertainty.
The
computation of our provision for income tax is complex, as it is
based on the laws of multiple taxing jurisdictions and requires
significant judgment on the application of complicated rules
governing accounting for tax provisions under U.S. generally
accepted accounting principles. Additionally, provisions for income
tax for interim quarters are based on forecasts of our U.S. and
non-U.S. effective tax rates for the year and contain numerous
assumptions. Various items cannot be accurately forecasted and
future events may be treated as discrete to the period in which
they occur. Our provision for income tax can be materially impacted
by things such as changes in our business, internal restructuring
and acquisitions, changes in tax laws and accounting guidance and
other regulatory, legislative developments, tax audit
determinations, changes in uncertain tax positions, tax deductions
attributed to equity compensation and changes in our determination
for a valuation allowance for deferred tax assets. For all of these
reasons, our actual income taxes may be materially different than
our provision for income tax.
We are subject to U.S. and foreign data privacy and protection laws
and regulations as well as contractual privacy obligations, and our
failure to comply could subject us to fines and damages and would
harm our reputation and business.
We
manage private and confidential information and documentation
related to our customers’ finances and transactions, often
prior to public dissemination. The use of insider information is
highly regulated in the United States and abroad, and violations of
securities laws and regulations may result in civil and criminal
penalties. In addition, we are subject to the data privacy and
protection laws and regulations adopted by federal, state and
foreign legislatures and governmental agencies. Data privacy and
protection is highly regulated and may become the subject of
additional regulation in the future. Privacy laws restrict our
storage, use, processing, disclosure, transfer and protection of
non-public personal information by our customers or collected from
visitors of our website. We strive to comply with all applicable
laws, regulations, policies and legal obligations relating to
privacy and data protection. However, it is possible that these
requirements may be interpreted and applied in a manner that is
inconsistent from one jurisdiction to another and may conflict with
other rules or our practices. Any failure, or perceived failure, by
us to comply with federal, state or international laws, including
laws and regulations regulating privacy, payment card information,
personal health information, data or consumer protection, could
result in proceedings or actions against us by governmental
entities or others.
16
The
regulatory framework for privacy and data protection issues
worldwide is evolving, and various government and consumer agencies
and public advocacy groups have called for new regulation and
changes in industry practices, including some directed at providers
of mobile and online resources in particular. Our obligations with
respect to privacy and data protection may become broader or more
stringent. If we are required to change our business activities or
revise or eliminate services, or to implement costly compliance
measures, our business and results of operations could be
harmed.
Our business may be affected by factors outside of our
control.
Our
ability to increase sales and deliver and sell our service
offerings profitably is subject to a number of risks, including
changes to corporate disclosure requirements, regulatory filings
and distribution of proxy materials, competitive risks such as the
entrance of additional competitors into our market, pricing and
competition and risks associated with the marketing of new services
in order to remain competitive.
If potential customers take a long time to evaluate the use of our
products, we could incur additional selling expenses and require
additional working capital.
The
acceptance of our services depends on a number of factors,
including the nature and size of the potential customer base, the
effectiveness of our system, and the extent of the commitment being
made by the potential customer, and is difficult to predict.
Currently, our sales and marketing expenses per customer are fairly
low. If potential customers take longer than we expect to decide
whether to use our services and require that we travel to their
sites, present more marketing material, or spend more time in
completing the sales process, our selling expenses could increase,
and decrease our profitability.
The seasonality of business makes it difficult to predict future
results based on specific quarters.
A
greater portion of our printing, distribution and solicitation of
proxy materials business will be processed during the second
quarter of our fiscal year. Therefore, the seasonality of our
revenue makes it difficult to estimate future operating results
based on the results of any specific quarter and could affect an
investor’s ability to compare our financial condition and
results of operations on a quarter-by-quarter basis. To balance the
seasonal activity of print, distribution and solicitation of proxy
materials, we will attempt to continue to grow other revenues
linked to predictable periodic activity that is cyclical in
nature.
If we are unable to successfully develop and timely introduce new
technology-based products or enhance existing technology-based
products, our business may be adversely affected.
In the
past few years, we have expended significant resources to develop
and introduce new technology-based products and improve and enhance
our existing technology-based products in an attempt to maintain or
increase our sales. The long-term success of new or enhanced
technology-based products may depend on a number of factors
including, but not limited to, the following: anticipating and
effectively addressing customer preferences and demand, the success
of our sales and marketing efforts, timely and successful
development, changes in governmental regulations and the quality of
or defects in our products.
The
development of our technology-based products is complex and costly,
and we typically have multiple technology-based products in
development at the same time. Given the complexity, we occasionally
have experienced, and could experience in the future, delays in
completing the development and introduction of new and enhanced
technology-based products. Problems in the design or quality of our
products or services may also have an adverse effect on our brand,
business, financial condition, and operating results. Unanticipated
problems in developing technology-based products could also divert
substantial development resources, which may impair our ability to
develop new technology-based products and enhancements of such
products, and could substantially increase our costs. If new or
enhanced product and service introductions are delayed or not
successful, we may not be able to achieve an acceptable return, if
any, on our development efforts, and our business may be adversely
affected.
17
Risks Related to Our Common Stock; Liquidity Risks
The price of our common stock may fluctuate significantly, which
could lead to losses for stockholders.
The
stock prices of smaller public companies can experience extreme
price and volume fluctuations. These fluctuations often have been
unrelated or out of proportion to the operating performance of such
companies. We expect our stock price to be similarly volatile.
These broad market fluctuations may continue and could harm our
stock price. Any negative change in the public’s perception
of our prospects or companies in our market could also depress our
stock price, regardless of our actual results. Factors affecting
the trading price of our common stock may include:
●
variations in
operating results;
●
announcements of
strategic alliances or significant agreements by the Company or by
competitors;
●
recruitment or
departure of key personnel;
●
litigation,
legislation, regulation of all or part of our business;
and
●
changes in the
estimates of operating results or changes in recommendations by any
securities analyst that elect to follow our common
stock.
If securities or industry analysts issue an adverse opinion
regarding our stock, our stock price and trading volume could
decline.
The
trading market for our common stock is influenced by the research
and reports that securities or industry analysts may publish about
us, our business, our market or our competitors. If any of the
analysts who may cover us adversely change their recommendation
regarding our common stock, or provide more favorable relative
recommendations about our competitors, the trading price of our
common stock could decline. If any analyst who may cover us were to
cease coverage of our company or fail to regularly publish reports
on us, we could lose visibility in the financial markets, which in
turn could cause the trading price of our common stock or trading
volume to decline.
The market price of our common stock may be adversely affected by
market conditions affecting the stock markets in general, including
price and trading fluctuations on the NYSE American.
Market
conditions may result in volatility in the level of, and
fluctuations in, market prices of stocks generally and, in turn,
our common stock and sales of substantial amounts of our common
stock in the market, in each case being unrelated or
disproportionate to changes in our operating performance. A weak
global economy could also contribute to extreme volatility of the
markets, which may have an effect on the market price of our common
stock.
We do not intend to pay dividends for the foreseeable
future.
We paid
dividends in 2012, part of 2013 and from the fourth quarter of 2015
through the third quarter of 2018. In the fourth quarter of 2018,
we announced that we would no longer be declaring quarterly
dividends for the foreseeable future in order to invest such money
in our business. There can be no assurances that dividends will be
paid in the future in the form of either cash or
stock.
Our Board of Directors has the ability without stockholder approval
to issue shares of preferred stock with terms detrimental to the
holders of our common stock.
We
currently have authorized but unissued “blank check”
preferred stock. Without the vote of our shareholders, the Board of
Directors may issue such preferred stock with both economic and
voting rights and preferences senior to those of the holders of our
common stock. Any such issuances may negatively impact the ultimate
benefits to the holders of our common stock in the event of a
liquidation event and may have the effect of preventing a change of
control and could dilute the voting power of our common stock and
reduce the market price of our common stock.
18
Future sales and issuances of our capital stock or rights to
purchase capital stock could result in additional dilution of the
percentage ownership of our stockholders and could cause our stock
price to decline.
Our
certificate of incorporation authorizes us to issue up to
20,000,000 shares of common stock. Future sales and issuances of
our capital stock or rights to purchase our capital stock could
result in substantial dilution to our existing stockholders. We may
sell common stock, convertible securities and other equity
securities in one or more transactions at prices and in a manner as
we may determine from time to time. If we sell any such securities
in subsequent transactions, investors may be materially diluted,
which could result in downward pressure on the price of our common
stock. New investors in subsequent transactions could gain rights,
preferences and privileges senior to those of holders of our common
stock. In addition, if outstanding stock options are exercised or
when outstanding restricted stock units are settled in shares,
current shareholders will experience dilution.
We will continue to incur significantly increased costs and devote
substantial management time as a result of operating as a public
company.
As a
public company, we incur significant legal, accounting and other
expenses that would not be incurred as a private company. For
example, we are subject to the reporting requirements of the
Securities Exchange Act of 1934, as amended (Exchange Act), and are
required to comply with the applicable requirements of the
Sarbanes-Oxley Act and the Dodd-Frank Act, as well as rules and
regulations subsequently implemented by the SEC and the New York
Stock Exchange, including the establishment and maintenance of
effective disclosure and financial controls and changes in
corporate governance practices. Compliance with these requirements
has increased our legal and financial compliance costs and made
some activities more time consuming and costly. Many of these costs
recur annually. As a result, management’s attention may be
diverted from other business concerns, which could adversely affect
our business and operating results.
A failure to maintain adequate internal controls over our financial
and management systems could cause errors in our financial
reporting, which could cause a loss of investor confidence and
result in a decline in the price of our common stock.
The
Sarbanes-Oxley Act requires, among other things, that we maintain
effective disclosure controls and procedures and internal control
over financial reporting. In order to maintain and, if required,
improve our disclosure controls and procedures and internal control
over financial reporting to meet this standard, significant
resources and management oversight may be required. If we have a
material weaknesses or significant deficiency in our internal
control over financial reporting, we may not detect errors on a
timely basis and our financial statements may be materially
misstated. Effective internal controls are necessary for us to
produce reliable financial reports and are important to prevent
fraud. As a result, our failure to satisfy the requirements of
Section 404 of the Sarbanes-Oxley Act on a timely basis could
result in us being subject to regulatory action and a loss of
investor confidence in the reliability of our financial statements,
both of which in turn could cause the market value of our common
stock to decline and affect our ability to raise
capital.
Because
we are a smaller reporting company, our independent registered
public accounting firm was not required to and did not perform an
audit of our internal control over financial reporting for the
fiscal year ended December 31, 2019.
ITEM 1B. UNRESOLVED STAFF
COMMENTS.
None.
ITEM 2. PROPERTY.
Our
headquarters are located in Raleigh, North Carolina. In October
2019, we began a new lease for 9,766 square feet of office space,
which expires December 31, 2027. As part of our acquisition of VWP,
we assumed a three-year lease for an office in Ft. Lauderdale,
Florida and a short term lease for an office in New York City, New
York. Additionally, we have an office in Salt Lake City, Utah which
is also on a short term lease.
ITEM 3. LEGAL PROCEEDINGS.
From
time to time, we may be involved in litigation that arises through
the normal course of business. As of the date of this filing, we
are neither a party to any litigation nor are we aware of any such
threatened or pending litigation that might result in a material
adverse effect to our business.
ITEM 4. MINE SAFETY
DISCOLSURES.
Not
applicable.
19
PART II
ITEM 5. MARKET FOR COMMON EQUITY AND
RELATED STOCKHOLDER MATTERS.
Market for common stock
Our
common stock is listed on the NYSE American under the symbol
"ISDR". The following table sets forth for the periods indicated
the high and low closing prices of our common stock for the
following periods.
|
|
High
|
Low
|
|
Year ended December 31, 2019
|
|
|
|
Quarter Ended March
31, 2019
|
$13.85
|
$11.35
|
|
Quarter Ended June
30, 2019
|
13.27
|
10.25
|
|
Quarter Ended
September 30, 2019
|
11.39
|
8.90
|
|
Quarter Ended
December 31, 2019
|
$12.75
|
$10.10
|
|
Year ended December 31, 2018
|
|
|
|
Quarter Ended March
31, 2018
|
$18.50
|
$15.75
|
|
Quarter Ended June
30, 2018
|
20.45
|
15.85
|
|
Quarter Ended
September 30, 2018
|
20.65
|
13.75
|
|
Quarter Ended
December 31, 2018
|
$15.60
|
$10.00
|
Holders of Record
As of
December 31, 2019, there were approximately 150 registered holders
of record of our common stock and 3,786,398 shares
outstanding.
Issuer Purchases of Equity Securities
On
August 7, 2019, the Company publicly announced a share repurchase
program under which the Company is authorized to repurchase up to
$1,000,000 of its common shares. As of December 31, 2019, the
Company repurchased a total of 76,170 shares at an aggregate cost
of $769,000 (not including commissions of $4,000) as shown in the
table below ($ in 000’s, except share or per share
amounts):
|
Shares
Repurchased
|
||||
|
Period
|
Total Number of
Shares Repurchased
|
Average Price
Paid Per Share
|
Total Number of
Shares Purchased as Part of Publicly Announced Program
|
Maximum Dollar
Value of Shares that May Yet Be Purchased Under the
Program
|
|
August 7 -31,
2019
|
22,150
|
$9.34
|
22,150
|
$793
|
|
September 1-30,
2019
|
2,830
|
$10.00
|
2,830
|
$765
|
|
October 1-31,
2019
|
39,363
|
$10.44
|
39,363
|
$354
|
|
November 1-30,
2019
|
11,827
|
$10.43
|
11,827
|
$231
|
|
December 1-31,
2019
|
—
|
—
|
—
|
$231
|
|
Total
|
76,170
|
$10.10
|
76,170
|
$231
|
Dividends
We did
not pay any dividends during the year ended December 31, 2019.
During the year ended December 31, 2018, we paid dividends totaling
$460,000 or $0.15 per share. There can be no assurances that
dividends will be paid in the future. The declaration and payment
of dividends in the future will be determined by our Board of
Directors in light of conditions then existing, including our
earnings, financial condition, capital requirements and other
factors.
20
COMPARISON OF CUMULATIVE TOTAL RETURN
Performance Comparison Graph
This
chart compares the five-year cumulative total return on our common
stock with that of the Russell MicroCap index and a custom peer
group, which was selected by the Company. The chart assumes $100
was invested on December 31, 2014, in our common stock, the Russell
MicroCap index and the peer group, and that any dividends were
reinvested. The Peer Group is composed of: Broadridge Financial
Solutions Inc., Cision, Ltd., and Workiva, Inc. The peer group
index utilizes the same method of presentation and assumptions for
the total return calculation as does Issuer Direct Corporation
(ISDR) and the Russell MicroCap index. All companies in the peer
group index are weighted in accordance with their market
capitalizations.
The Company makes no representation to the peer group market caps
being similar to that of Issuer Direct, however these peers do
represent a fair and accurate list of the companies that Issuer
Direct competes with that are in fact public.

|
|
|
|
|
|
|
|
|
|
12/14
|
12/15
|
12/16
|
12/17
|
12/18
|
12/19
|
|
Issuer Direct Corporation
|
100.00
|
64.98
|
103.40
|
214.41
|
133.76
|
137.77
|
|
Russell MicroCap
|
100.00
|
94.84
|
114.16
|
129.19
|
112.29
|
137.48
|
|
Peer Group
|
100.00
|
119.66
|
145.22
|
201.81
|
221.94
|
276.05
|
The stock price performance included in this graph is not
necessarily indicative of future stock price
performance.
21
ITEM 6. SELECT FINANCIAL
DATA.
Our
selected consolidated financial data shown below should be read
together with Item7. “Management’s Discussion and
Analysis of Financial Condition and Results of Operations”
and our consolidated financial statements and respective notes
included in Item 8. “Financial Statements and Supplementary
Data.” The data shown below are not necessarily indicative of
results to be expected for any future period.
Summary of Operations for the periods ended December 31, 2019 and
2018 (in 000’s).
|
|
Year Ended December
31,
|
|
|
|
2019
|
2018
|
|
Statement of Operations
|
|
|
|
Revenue
|
$16,295
|
$14,232
|
|
Cost of
revenues
|
5,080
|
4,103
|
|
Gross
profit
|
11,215
|
10,129
|
|
Operating
costs
|
10,741
|
8,966
|
|
Operating
income
|
474
|
1,163
|
|
Interest income,
net
|
321
|
47
|
|
Income before
taxes
|
795
|
1,210
|
|
Income tax
expense
|
109
|
373
|
|
Net
income
|
$686
|
$837
|
Concentrations:
For the
years ended December 31, 2019 and 2018, we generated revenues from
the following revenue streams as a percentage of total
revenue:
|
|
2019
|
2018
|
|
Revenue Streams
|
|
|
|
Platform and
Technology
|
65.6%
|
60.4%
|
|
Services
|
34.4%
|
39.6%
|
|
Total
|
100.0%
|
100.0%
|
Percentages:
Change
expressed as a percentage increase for the years ended December 31,
2019 and 2018 ($ in 000’s):
|
|
2019
|
2018
|
%
change
|
|
Revenue Streams
|
|
|
|
|
Platform and
Technology
|
$10,696
|
$8,593
|
24.4%
|
|
Services
|
5,599
|
5,639
|
(0.7)%
|
|
Total
|
$16,295
|
$14,232
|
14.5%
|
22
ITEM 7. MANAGEMENT’S DISCUSSION AND
ANALYSIS OF FINANCIAL CONDITION AND RESULTS OF
OPERATIONS.
Except
for the historical information contained herein, the matters
discussed in this Form 10-K include certain forward-looking
statements that involve risks and uncertainties, which are intended
to be covered by safe harbors. Those statements include, but are
not limited to, all statements regarding our and management’s
intent, belief and expectations, such as statements concerning our
future and our operating and growth strategy. We generally use
words such as "believe," "may," "could," "will," "intend,"
"expect," "anticipate," "plan," and similar expressions to identify
forward-looking statements. You should not place undue reliance on
these forward-looking statements. Our actual results could differ
materially from those anticipated in the forward-looking statements
for many reasons including our ability to implement our business
plan, our ability to raise additional funds and manage consumer
acceptance of our products, our ability to broaden our customer
base, our ability to maintain a satisfactory relationship with our
suppliers and other risks described in our reports filed with the
Securities and Exchange Commission, including Item 1A of this
Report on Form 10-K. Although we believe the expectations reflected
in the forward-looking statements are reasonable, they relate only
to events as of the date on which the statements are made, and our
future results, levels of activity, performance or achievements may
not meet these expectations. Investors are cautioned that all
forward-looking statements involve risks and uncertainties
including, without limitation, the factors set forth under the Risk
Factors section of this report. In light of the significant
uncertainties inherent in the forward-looking statements included
herein, the inclusion of such information should not be regarded as
a representation by us or any other person that our objectives and
plans will be achieved. All forward-looking statements made in this
Form 10-K are based on information presently available to our
management. We do not intend to update any of the forward-looking
statements after the date of this document to conform these
statements to actual results or to changes in our expectations,
except as required by law.
Results of Operations
Comparison of results of operations for the years ended December
31, 2019 and 2018 (in 000’s):
|
Revenue Streams
|
2019
|
2018
|
|
Platform
and Technology
|
|
|
|
Revenue
|
$10,696
|
$8,593
|
|
Gross
margin
|
$7,860
|
$6,780
|
|
Gross margin
%
|
73%
|
79%
|
|
|
|
|
|
Services
|
|
|
|
Revenue
|
5,599
|
5,639
|
|
Gross
margin
|
3,355
|
3,349
|
|
Gross margin
%
|
60%
|
59%
|
|
|
|
|
|
Total
|
|
|
|
Revenue
|
$16,295
|
$14,232
|
|
Gross
margin
|
$11,215
|
$10,129
|
|
Gross margin
%
|
69%
|
71%
|
Revenues
Total
revenue increased by $2,063,000, or 14%, to $16,295,000 during the
year ended December 31, 2019, as compared to $14,232,000 in 2018.
Customers obtained from our acquisitions of VWP and FSCwire
contributed $2,175,000 of revenue during the year ended December
31, 2019 compared to 2018. A portion of this revenue is recognized
in the Platform and Technology revenue stream and a portion in the
Services revenue stream.
Platform and
Technology revenue increased $2,103,000, or 24%, to $10,696,000 for
the year ended December 31, 2019, as compared to $8,593,000 during
2018. A majority of the increase is due to the acquisitions of VWP
and FSCwire, which accounted for a combined $1,600,000 of the
increase in Platform and Technology revenue during the year ended
December 31, 2019. Additionally, we generated increased revenue
from additional subscriptions of Platform id., as well as, increased
ACCESSWIRE revenue, despite being negatively impacted by the
industry-wide loss of the investment commentary business. The
investment commentary business accounted for approximately $403,000
of revenue during the year ended December 31, 2019, compared to
approximately $1,577,000 during 2018. We do not expect revenue from
the investment commentary business in the future. Other than the
impact of the investment commentary business and acquisition of
FSCwire, ACCESSWIRE revenue increased 38% during the year ended
December 31, 2019, compared to the same period of the prior year.
These increases were offset by a decline in revenue from our
shareholder outreach offering due to customer attrition as revenue
of this offering is typically tied-in with contracts of our annual
report distribution services. Platform and Technology revenue
increased to 66% of total revenue during the year ended December
31, 2019, as compared to 60% in the prior year.
23
Services revenue
decreased $40,000, or less than 1%, during the year ended December
31, 2019, as compared to 2018. The decrease is partly due to a
decline in revenue from our ARS services due to continued customer
attrition as customers elect to leave the service or transition to
digital fulfillment. We also experienced a decline in revenue from
our transfer agent services due to a decline in corporate
transactions, directives and actions. The timing of these corporate
directives and actions are difficult to predict as they are
controlled by our customers and the conditions of the market, and
therefore fluctuate from year to year. These decreases were offset
by increased revenue associated with the acquisitions of VWP and
FSCwire, which accounted for a combined $575,000 in Services
revenue during the year ended December 31, 2019.
2019 Revenue Backlog
At
December 31, 2019, our deferred revenue balance was $1,812,000, a
majority of which we expect to recognize over the next twelve
months, compared to $1,249,000 at December 31, 2018. Deferred
revenue primarily consists of advance billings for subscriptions of
our cloud-based products and pre-paid packages of our news
distribution product, as well as, advance billings for annual
contracts of legacy ARS services. The increase is primarily due to
an increase in subscriptions of Platform id. During the year ended
December 31, 2019, we entered into new contracts with 150 net, new
or existing customers with annualized contract value of $911,000.
As of December 31, 2019, our total number of subscriptions of
Platform id. was
255, with a total annual contract value of $2,033,000.
Cost of Revenues
Platform and
Technology cost of revenues consists primarily of direct labor
costs, newswire distribution costs, third party licensing and
amortization of capitalized software costs related to platforms
licensed to customers. Services costs of revenue consists primarily
of direct labor costs, warehousing, logistics, print production
materials, postage, and outside services directly related to the
delivery of services to our customers. Cost of revenues increased
by $977,000, or 24%, during the year ended December 31, 2019, as
compared to the same period of 2018. Overall gross margin increased
$1,086,000, or 11%, during the year ended December 31, 2019,
compared to 2018. However, overall gross margin percentage
decreased to 69% during the year ended December 31, 2019, as
compared to 71% during the prior year. The increase in cost of
sales and resulting decrease in gross margin percentage was
primarily due to the addition of VWP, which has a lower gross
margin than our legacy businesses. Additionally, newswire
distribution costs increased as we expanded our distribution during
the year, while newswire revenue did not increase at the same rate
due to the loss of the investment commentary revenue, resulting in
lower gross margins from our newswire business.
Gross
margin percentage from Platform and Technology was 73% for the year
ended December 31, 2019, as compared to 79% for 2018. The decrease
in gross margin percentage is primarily attributable to the
addition of revenue and costs associated with the acquisition of
VWP as well as increased costs associated with our newswire
business.
Gross
margin percentage from our Services revenue was 60% for the year
ended December 31, 2019 compared to 59% for 2018.
General and Administrative Expense
General
and administrative expenses consist primarily of salaries,
stock-based compensation, insurance, fees for professional
services, general corporate expenses (including bad debt expense)
and facility and equipment expenses. General and administrative
expenses were $5,086,000 for the year ended December 31, 2019, an
increase of $1,001,000, or 25%, as compared to the prior year. This
increase is primarily due to additional costs associated with our
acquisition of VWP of approximately $500,000 and an increase in bad
debt expense of $394,000, a majority of which related to additional
reserve for accounts receivable balances related to two significant
investment commentary newswire customers. General and
administrative expenses also increased due to an increase in
corporate headcount as we position the Company for growth. These
increases were offset by a decrease in stock
compensation.
As a
percentage of revenue, General and Administrative expenses were 31%
for the year ended December 31, 2019, as compared to 29% for
2018.
24
Sales and Marketing Expenses
Sales
and marketing expenses consist primarily of salaries, stock based
compensation, sales commissions, advertising expenses, tradeshow
expenses and other marketing expenses. Sales and marketing expenses
were $3,551,000 for the year ended December 31, 2019, an increase
of $549,000, or 18%, as compared to the prior year. This increase
is directly related to our investment in our sales and marketing
initiatives with an increase in headcount and digital
marketing.
As a
percentage of revenue, sales and marketing expenses were 22% for
the year ended December 31, 2019 compared to 21% for
2018.
Product Development
Product
development expenses consist primarily of salaries, stock based
compensation and licenses to develop new products and technology to
complement and/or enhance Platform id. Product development costs
decreased $57,000, or 4%, to $1,219,000 during the year ended
December 31, 2019, as compared to 2018. The decrease is the result
of lower employee-related and consulting expenses.
As a
percentage of revenue, Product Development expenses were 7% for the
year ended December 31, 2019, as compared to 9% for
2018.
Depreciation and Amortization
During
the year ended December 31, 2019, depreciation and amortization
expenses increased by $282,000, or 47%, to $885,000, as compared to
$603,000 during 2018. The increase is primarily due to amortization
of intangible assets acquired in both the VWP and FSCwire
acquisitions.
Interest income, net
Interest income,
net, represents interest income on deposit and money market
accounts, partially offset by the non-cash interest associated with
the present value of the remaining anniversary payments of the
Interwest acquisition.
Income Taxes
We
recorded income tax expense of $109,000 during the year ended
December 31, 2019, compared to $373,000 during the year ended
December 31, 2018. During the year ended December 31, 2019, the
Company’s effective tax rate was favorably impacted by the
research and development tax credit, foreign tax credits as well as
a benefit related to the exercise of stock based
compensation.
The
aforementioned reasons, as well as state taxes, foreign statutory
tax rate differentials are the reasons for the variance between the
Company’s effective tax rate and the statutory rate of
21%
Net Income
Net
income for the year ended December 31, 2019 was $686,000 as
compared to $837,000 in 2018. Although we achieved increases in
revenue and gross margin, these increases were offset by higher
operating expenses due to an increase in bad debt expense
specifically related to two investment commentary customers and
investments made to position ourselves for growth by increasing
headcount, incurring costs related to acquisitions as well as
continuing to invest in our cloud-based products. Depreciation and
amortization expense increased as well, due to amortization
associated with acquired intangible assets. The increase in
operating expense was partially offset by an increase in interest
income on deposit and money market accounts as well as a decrease
in income tax expense due to favorable impacts related to foreign
tax credits and benefits related to exercise of stock based
compensation.
Liquidity and Capital Resources
As of
December 31, 2019, we had $15,766,000 in cash and cash equivalents
and $2,051,000 in net accounts receivable. Current liabilities at
December 31, 2019, totaled $3,840,000 including our accounts
payable, deferred revenue, accrued payroll liabilities, income
taxes payable, remaining payments for Interwest acquisition and
other accrued expenses. At December 31, 2019, our current assets
exceeded our current liabilities by $14,166,000.
25
Effective October
3, 2019, the Company renewed its Line of Credit, which increased
the term to two years, with all other provisions remaining the
same. The amount of funds available for borrowing are $3,000,000
and the interest rate is LIBOR plus 1.75%. As of December 31, 2019,
the interest rate was 3.76% and the Company did not owe any amounts
on the Line of Credit.
Disclosure about Off-Balance Sheet Arrangements
We do
not have any transactions, agreements or other contractual
arrangements that constitute off-balance sheet
arrangements.
Outlook
The following statements and certain statements made elsewhere in
this document are based upon current expectations. These statements
are forward looking and are subject to factors that could cause
actual results to differ materially from those suggested here,
including, without limitation, demand for and acceptance of our
services, new developments, competition and general economic or
market conditions, particularly in the domestic and international
capital markets. Refer also to the Cautionary Statement Concerning
Forward Looking Statements included in this report.
Overall,
the demand for our platforms continues to be stable in the majority
of the segments we serve. In a portion of our business, we expect
demand will continue to shift from traditional printed and
service-based engagements to a cloud-based subscription model, as
well as digital distribution offerings. We believe we are
positioned well in this space to be both competitive and agile to
deliver these solutions to the market. As we have seen over the
last several quarters, the transition to digital platforms has had
a negative effect on our Service revenue and this is a trend we
expect will continue over the next few quarters.
One
of our competitive strengths is that we have embraced cloud
computing early on in our strategy. The transition to a platform
subscription model has been and will continue to be key for our
long-term sustainable growth.
We
will continue to focus on the following key strategic initiatives
during 2020:
●
Expand our Platform
and Technology business development and sales team,
●
Continue to grow
through acquisitions in areas of strategic focus,
●
Expand customer
base,
●
Continue to migrate
acquired businesses to our current platform,
●
Continue to expand
our newswire distribution,
●
Invest in
technology advancements and upgrades,
●
Continue
development of our Insight and Analytics module,
●
Generate profitable
sustainable growth,
●
Generate cash flows
from operations.
We
believe there is significant demand for our products among the
middle, small and micro-cap markets globally, as they seek to find
better platforms and tools to disseminate and communicate their
respective messages. We believe we have the product sets, platforms
and capacity to meet their requirements.
We
have invested and will continue to invest in our product sets,
platforms and intellectual property development via internal
development and acquisitions. These developments are key to our
overall offerings in the market and necessary to keep our
competitive advantages and sustain the next round of growth that
management believes it can achieve. If we are successful in this
development effort, we believe we can achieve increases in revenues
per user as we move through 2020 and beyond.
26
Critical Accounting Policies and Estimates
The
consolidated financial statements include the accounts of the
Company and its wholly owned subsidiaries. Significant intercompany
accounts and transactions are eliminated in
consolidation.
Revenue Recognition
Substantially all
of the Company’s revenue comes from contracts with customers
for subscriptions to its cloud-based products or contracts to
perform compliance or other services. Customers consist primarily
of corporate issuers and professional
firms, such as investor relations and public relations firms. In
the case of our news distribution and webcasting offerings, our
customers also include private companies. The Company
accounts for a contract with a customer when there is an
enforceable contract between the Company and the customer, the
rights of the parties are identified, the contract has economic
substance, and collectability of the contract consideration is
probable. The Company's revenues are measured based on
consideration specified in the contract with each
customer.
The
Company's contracts include either a subscription to our entire
platform or certain modules within our platform, or an agreement to
perform services or any combination thereof, and often contain
multiple subscriptions and services. For these bundled contracts,
the Company accounts for individual subscriptions and services as
separate performance obligations if they are distinct, which is
when a product or service is separately identifiable from other
items in the bundled package, and a customer can benefit from it on
its own or with other resources that are readily available to the
customer. The Company separates revenue from its contracts into two
revenue streams: i) Platform and Technology and ii) Services.
Performance obligations of Platform and Technology contracts
include providing subscriptions to certain modules or the entire
Platform id.
system, distributing press releases on a per release basis or
conducting webcasts on a per event basis. Performance obligations
of Service contracts include obligations to deliver compliance
services and annual report printing and distribution on either a
stand ready obligation or on a per project or event basis. Set up
fees for compliance services are considered a separate performance
obligation and are satisfied upfront. Set up fees for our transfer
agent module and investor relations content management module are
immaterial. The Company’s subscription and service contracts
are generally for one year, with automatic renewal clauses included
in the contract until the contract is cancelled. The contracts do
not contain any rights of returns, guarantees or warranties. Since
contracts are generally for one year, all of the revenue is
expected to be recognized within one year from the contract start
date. As such, the Company has elected the optional exemption that
allows the Company not to disclose the transaction price allocated
to performance obligations that are unsatisfied or partially
satisfied at the end of each reporting period.
The
Company recognizes revenue for subscriptions evenly over the
contract period, upon distribution for per release contracts and
upon event completion for webcasting events. For service contracts
that include stand ready obligations, revenue is recognized evenly
over the contract period. For all other services delivered on a per
project or event basis, the revenue is recognized at the completion
of the event. The Company believes recognizing revenue for
subscriptions and stand ready obligations using a time-based
measure of progress, best reflects the Company’s performance
in satisfying the obligations.
For
bundled contracts, revenue is allocated to each performance
obligation based on its relative standalone selling price.
Standalone selling prices are based on observable prices at which
the Company separately sells the subscription or services. If a
standalone selling price is not directly observable, the Company
uses the residual method to allocate any remaining costs to that
subscription or service. The Company regularly reviews standalone
selling prices and updates these estimates if
necessary.
The
Company invoices its customers based on the billing schedules
designated in its contracts, typically upfront on either a monthly,
quarterly or annual basis or per transaction at the completion of
the performance obligation. Deferred revenue for the periods
presented was primarily related to subscription and service
contracts, which are billed upfront, quarterly or annually, however
the revenue has not yet been recognized. The associated deferred
revenue is generally recognized ratably over the billing period.
Deferred revenue as of December 31, 2019 and 2018 was $1,812,000
and $1,249,000, respectively, and is expected to be recognized
within one year. Revenue recognized for the year ended December 31,
2019 and 2018, that was included in the deferred revenue balance at
the beginning of each reporting period, was approximately
$1,249,000 and $887,000, respectively. Accounts receivable related
to contracts with customers was $2,051,000 and $1,593,000 as of
December 31, 2019 and 2018, respectively. Since substantially all
of the contracts have terms of one year or less, the Company has
elected to use the practical expedient regarding the existence of a
significant financing.
27
Costs
to obtain contracts with customers consist primarily of sales
commissions. As of December 31, 2019 and 2018, the Company has
capitalized $21,000 and $18,000 of costs to obtain contracts that
are expected to be amortized over more than one year. For contract
costs expected to be amortized in less than one year, the Company
has elected to use the practical expedient allowing the recognition
of incremental costs of obtaining a contract as an expense when
incurred. The Company has considered historical renewal rates,
expectations of future renewals and economic factors in making
these determinations.
Accounts Receivable and Allowance for Doubtful
Accounts
The
Company monitors outstanding receivables based on factors
surrounding the credit risk of specific customers, historical
trends, and other information. Credit is granted on an unsecured
basis. The allowance for doubtful accounts is estimated based on an
assessment of the Company’s ability to collect on customer
accounts receivable. There is judgment involved with estimating the
allowance for doubtful accounts and if the financial condition of
the Company’s customers were to deteriorate, resulting in
their inability to make the required payments, the Company may be
required to record additional allowances or charges against
revenues. The Company generally writes-off accounts receivable
against the allowance when it determines a balance is uncollectible
and no longer actively pursues its collection.
Income Taxes
Deferred income tax
assets and liabilities are computed for differences between the
financial statement and tax bases of assets and liabilities that
will result in future taxable or deductible amounts based on
enacted tax laws and rates applicable to the periods in which the
differences are expected to affect taxable income. Valuation
allowances are established, when necessary, to reduce deferred
income tax assets to the amounts expected to be realized. For any
uncertain tax positions, we recognize the impact of a tax position
only if it is more likely than not of being sustained upon
examination, based on the technical merits of the position. Our
policy regarding the classification of interest and penalties is to
classify them as income tax expense in our financial statements, if
applicable.
Capitalized Software
Costs
incurred to develop our cloud-based platform products and
disclosure management system components are capitalized when the
preliminary project phase is complete, management commits to fund
the project and it is probable the project will be completed and
used for its intended purposes. Once the software is substantially
complete and ready for its intended use, the software is amortized
over its estimated useful life. Costs related to design or
maintenance of the software are expensed as incurred. The Company
capitalized $20,000 and $21,000 during the years ended December 31,
2019 and 2018, respectively. The Company recorded amortization
expense of $843,000 and $813,000 during the years ended December
31, 2019 and 2018, respectively, $783,000 and $795,000 of which is
included in Cost of revenues on the Consolidated Statements of
Income. The remaining amount of $60,000 and $18,000 for the years
ended December 31, 2019 and 2018, respectively, is included in
Depreciation and amortization.
Impairment of Long-lived Assets
In
accordance with the authoritative guidance for accounting for
long-lived assets, assets such as property and equipment,
trademarks, and intangible assets subject to amortization, are
reviewed for impairment whenever events or changes in circumstances
indicate that the carrying amount of an asset group may not be
recoverable. Recoverability of asset groups to be held and used is
measured by a comparison of the carrying amount of an asset group
to estimated undiscounted future cash flows expected to be
generated by the asset group. If the carrying amount of an asset
group exceeds its estimated future cash flows, an impairment charge
is recognized by the amount by which the carrying amount of an
asset group exceeds fair value of the asset group.
Lease Accounting
We
determine if an arrangement is a lease at inception. Our operating
lease agreements are primarily for office space and are included
within Other long-term assets and Other long-term liabilities on
the consolidated balance sheets.
Right-of-use
(“ROU”) assets represent our right to use an underlying
asset for the lease term and lease liabilities represent our
obligation to make lease payments arising from the lease. ROU
assets and lease liabilities are recognized at the commencement
date based on the present value of lease payments over the lease
term. Our variable lease payments consist of non-lease services
related to the lease. Variable lease payments are excluded from the
ROU assets and lease liabilities and are recognized in the period
in which the obligation for those payments is incurred. As most of
our leases do not provide an implicit rate, we use our incremental
borrowing rate based on the information available at commencement
date in determining the present value of lease payments. ROU assets
also include any lease payments made and exclude lease incentives.
Rental expense for lease payments related to operating leases is
recognized on a straight-line basis over the lease
term.
28
Fair Value Measurements
ASC
Topic 820 establishes a fair value hierarchy that requires an
entity to maximize the use of observable inputs and minimize the
use of unobservable inputs when measuring fair value. Assets and
liabilities recorded at fair value in the financial statements are
categorized based upon the hierarchy of levels of judgment
associated with the inputs used to measure their fair value.
Hierarchical levels directly related to the amount of subjectivity
associated with the inputs to fair valuation of these assets and
liabilities, are as follows:
●
Level 1–
Quoted prices are available in active markets for identical assets
or liabilities at the reporting date. Generally, this includes debt
and equity securities that are traded in an active market. Our cash
and cash equivalents are quoted at Level 1.
●
Level 2 –
Observable inputs other than Level 1prices such as quote prices for
similar assets or liabilities; quoted prices in markets that are
not active; or other inputs that are observable or can be
corroborated by observable market data for substantially the full
term of the assets or liabilities. Generally, this includes debt
and equity securities that are not traded in an active
market.
●
Level 3 –
Unobservable inputs that are supported by little or no market
activity and that are significant to the fair value of the assets
or liabilities. Level 3 assets and liabilities include financial
instruments whose value is determined using pricing models,
discounted cash flow methodologies, or other valuation techniques,
as well as instruments for which the determination of fair value
requires significant management judgment or
estimation.
As of
December 31, 2019 and 2018, we believe that the fair value of our
financial instruments other than cash and cash equivalents, such
as, accounts receivable, our line of credit, notes payable, and
accounts payable approximate their carrying amounts.
Translation of Foreign Financial Statements
The
financial statements of the foreign subsidiaries of the Company
have been translated into U.S. dollars. All assets and liabilities
have been translated at current rates of exchange in effect at the
end of the period. Income and expense items have been translated at
the average exchange rates for the year or the applicable interim
period. The gains or losses that result from this process are
recorded as a separate component of other accumulated comprehensive
income (loss) until the entity is sold or substantially
liquidated.
Business Combinations, Goodwill and Intangible Assets
We
account for business combinations under FASB ASC No. 805 –
Business Combinations and the related acquired intangible assets
and goodwill under FASB ASC No. 350 – Intangibles –
Goodwill and Other. The authoritative guidance for business
combinations specifies the criteria for recognizing and reporting
intangible assets apart from goodwill. We record the assets
acquired and liabilities assumed in business combinations at their
respective fair values at the date of acquisition, with any excess
purchase price recorded as goodwill. Goodwill is an asset
representing the future economic benefits arising from other assets
acquired in a business combination that are not individually
identified and separately recognized. Intangible assets consist of
client relationships, customer lists, distribution partner
relationships, software, technology and trademarks that are
initially measured at fair value. At the time of the business
combination, trademarks are considered an indefinite-lived asset
and, as such, are not amortized as there is no foreseeable limit to
cash flows generated from them. The goodwill and intangible assets
are assessed annually for impairment, or whenever conditions
indicate the asset may be impaired, and any such impairment will be
recognized in the period identified. The client relationships (7-10
years), customer lists (3 years), distribution partner
relationships (10 years), non-compete agreements (5 years) and
software and technology (3-6 years) are amortized over their
estimated useful lives.
Recently adopted accounting pronouncements
In
February 2016, the FASB established Topic 842, Leases, by issuing
Accounting Standards Update (ASU) No. 2016-02, which requires
lessees to recognize leases on-balance sheet and disclose key
information about leasing arrangements. Topic 842 was subsequently
amended by ASU No. 2018-01, Land Easement Practical Expedient for
Transition to Topic 842; ASU No. 2018-10, Codification Improvements
to Topic 842, Leases; and ASU No. 2018-11, Targeted Improvements.
The new standard establishes a ROU model that requires a lessee to
recognize a ROU asset and lease liability on the balance sheet for
all leases with a term longer than 12 months. Leases will be
classified as finance or operating, with classification affecting
the pattern and classification of expense recognition in the income
statement.
29
The new
standard was effective for the Company on January 1, 2019, which is
also the day we elected to adopt the new standard. A modified
retrospective transition approach is required, applying the new
standard to all leases existing at the date of initial application.
We chose the effective date as our date of initial application.
Consequently, financial information will not be updated and the
disclosures required under the new standard will not be provided
for dates and periods before January 1, 2019. We elected the
package of practical expedients permitted under the transition
guidance within the new standard, which among other things, allowed
us to carry forward the historical lease classification of those
leases in place as of January 1, 2019. See the table below for the
impact of adoption of the lease standard on our balance sheet
accounts as of the day of adoption, January 1, 2019 ($ in
000’s):
|
|
As Previously
Reported
|
New Lease Standard
Adjustment
|
As
Adjusted
|
|
ROU
asset
|
$-
|
$102
|
$102
|
|
Lease
liability
|
-
|
135
|
135
|
|
Deferred
rent
|
33
|
(33)
|
-
|
ITEM 7A. QUANTITATIVE AND QUALITATIVE DISCLOSURES ABOUT
MARKET RISK.
We do
not believe that we face material market risk with respect to our
cash or cash equivalents, which totaled $15,766,000 and $17,222,000
at December 31, 2019 and 2018, respectively. We did not hold any
marketable securities as of December 31, 2019 or 2018.
ITEM 8. FINANCIAL STATEMENTS AND
SUPPLEMENTARY DATA.
The
financial statements required by this Item 8 are set forth in Item
15 of this Annual Report. All information which has been omitted is
either inapplicable or not required.
Our
balance sheets as of December 31, 2019 and 2018, and the related
statements of income, comprehensive income, stockholders’
equity and cash flows for the two years ended December 31, 2019 and
2018, together with the independent registered public
accountants’ reports thereon appear beginning on Page
F-1.
ITEM 9. CHANGES IN AND DISAGREEMENTS WITH ACCOUNTANTS
ON ACCOUNTING AND FINANCIAL DISCLOSURE.
None.
ITEM 9A. CONTROLS AND
PROCEDURES.
Management’s Annual Report Regarding Internal Disclosure
Controls and Procedures
Our
management is responsible for establishing and maintaining adequate
internal control over financial reporting, as defined in Rules
13a-15(f) and 15d-15(f) of the Exchange Act. Internal control over
financial reporting is designed to provide reasonable assurance
regarding the reliability of financial reporting and the
preparation and fair presentation of financial statements for
external purposes, in accordance with generally accepted accounting
principles. The effectiveness of any system of internal control
over financial reporting is subject to inherent limitations and
therefore, may not prevent or detect misstatements. Also,
projections of any evaluation of effectiveness of future periods
are subject to the risk that the controls may become inadequate due
to change in conditions, or that the degree of compliance with the
policies or procedures may deteriorate.
This
annual report does not include an attestation report of the
Company’s registered public accounting firm regarding
internal control over financial reporting. Management’s
report was not subject to attestation by the Company’s
registered public accounting firm pursuant to rules of the
Securities and Exchange Commission that permit the Company to
provide only management’s report in this annual
report.
30
Evaluation of Disclosure Controls and Procedures
Based
on an evaluation under the supervision and with the participation
of our management, our principal executive officer and principal
financial officer have concluded that our disclosure controls and
procedures as defined in Rules 13a-15(e) and 15d-15(e) under the
Securities Exchange Act of 1934, as amended ("Exchange Act") were
effective as of December 31, 2019, to ensure that information
required to be disclosed in reports that are filed or submitted
under the Exchange Act is (i) recorded, processed, summarized and
reported within the time periods specified in the Securities and
Exchange Commission rules and forms and (ii) accumulated and
communicated to our management, including our principal executive
officer and principal financial officer, as appropriate to allow
timely decisions regarding required disclosure.
Inherent Limitations over Internal Controls
Our
internal control over financial reporting is designed to provide
reasonable assurance regarding the reliability of financial
reporting and the preparation of financial statements for external
purposes in accordance with generally accepted accounting
principles. Our internal control over financial reporting includes
those policies and procedures that: (i) pertain to the maintenance
of records that, in reasonable detail, accurately and fairly
reflect the transactions and disposition of our assets; (ii)
provide reasonable assurance that transactions are recorded as
necessary to permit preparation of financial statements in
accordance with generally accepted accounting principles, and that
receipts and expenditures are being made only in accordance with
authorizations of management and directors; and (iii) provide
reasonable assurance regarding prevention or timely detection of
unauthorized acquisition, use, or disposition of assets that could
have a material effect on the financial statements.
Management,
including our Chief Executive Officer and Chief Financial Officer,
do not expect that our internal controls will prevent or detect all
errors and all fraud. A control system, no matter how well designed
and operated, can provide only reasonable, not absolute, assurance
that the objectives of the control system are met. Further, the
design of a control system must reflect the fact that there are
resource constraints, and the benefits of controls must be
considered relative to their costs. Because of the inherent
limitations in all control systems, no evaluation of internal
controls can provide absolute assurance that all control issues and
instances of fraud, if any, have been detected. Also, any
evaluation of the effectiveness of controls in future periods are
subject to the risk that those internal controls may become
inadequate because of changes in business conditions, or that the
degree of compliance with the policies or procedures may
deteriorate.
Report of Management's Annual Report on Internal Control over
Financial Reporting
Our
management is responsible for establishing and maintaining adequate
internal control over financial reporting (as defined in Rule
13a-15(f) under the Securities Exchange Act of 1934, as amended).
Management conducted an evaluation of the effectiveness of our
internal control over financial reporting based on the criteria set
forth by the Committee of Sponsoring Organizations ("COSO") updated
Internal Control—Integrated Framework (2013). Based on this
evaluation, management has concluded that our internal control over
financial reporting was effective as of December 31,
2019.
There
were no changes in our internal controls that could materially
affect the disclosure controls and procedures subsequent to the
date of their evaluation, nor were there any material deficiencies
or material weaknesses in our internal controls. As a result, no
corrective actions were required or undertaken.
ITEM 9B. OTHER INFORMATION.
None.
31
PART III
ITEM 10. DIRECTORS, EXECUTIVE OFFICERS
AND CORPORATE GOVERNANCE.
The
information required by this Item is set forth under the headings
“Directors, Executive Officers and Corporate
Governance” and “Section 16(a) Beneficial Ownership
Reporting Compliance” in the Company’s 2020 Proxy
Statement to be filed with the U.S. Securities and Exchange
Commission ("SEC") within 120 days after December 31, 2019 in
connection with the solicitation of proxies for the Company’s
2020 annual meeting of shareholders and is incorporated herein by
reference.
ITEM 11. EXECUTIVE
COMPENSATION.
The
information required by this Item is set forth under the heading
“Executive Compensation” and under the subheadings
“Board Oversight of Risk Management,”
“Compensation of Directors,” “Director
Compensation-2019” and “Compensation Committee
Interlocks and Insider Participation” under the heading
“Directors, Executive Officers and Corporate
Governance” in the Company’s 2020 Proxy Statement to be
filed with the SEC within 120 days after December 31, 2019 and is
incorporated herein by reference.
ITEM 12. SECURITY OWNERSHIP OF CERTAIN
BENEFICIAL OWNERS AND MANAGEMENT AND RELATED STOCKHOLDER
MATTERS.
The
information required by this Item is set forth under the headings
“Security Ownership of Certain Beneficial Owners and
Management” and “Equity Compensation Plan
Information” in the Company’s 2020 Proxy Statement to
be filed with the SEC within 120 days after December 31, 2019 and
is incorporated herein by reference.
ITEM 13. CERTAIN RELATIONSHIPS AND
RELATED TRANSACTIONS, AND DIRECTOR INDEPENDENCE.
The
information required by this Item is set forth under the heading
“Review, Approval or Ratification of Transactions with
Related Persons” and under the subheading “Board
Committees” under the heading “Directors, Executive
Officers and Corporate Governance” in the Company’s
2020 Proxy Statement to be filed with the SEC within 120 days after
December 31, 2019 and is incorporated herein by
reference.
ITEM 14. PRINCIPAL ACCOUNTING FEES AND
SERVICES.
The
information required by this Item is set forth under the
subheadings “Fees Paid to Auditors” and “Policy
on Audit Committee Pre-Approval of Audit and Non-Audit Services
Performed by the Independent Registered Public Accounting
Firm” under the proposal “Ratification of Appointment
of Independent Registered Public Accounting Firm” in the
Company’s 2020 Proxy Statement to be filed with the SEC
within 120 days after December 31, 2019 and is incorporated herein
by reference.
32
PART IV
ITEM 15. EXHIBITS.
(a)
Financial Statements
The
financial statements listed in the accompanying index (page F-1) to
the financial statements are filed as part of this Annual Report on
Form 10-K.
(b)
Exhibits
|
Exhibit Number
|
|
Exhibit Description
|
|
|
|
|
|
|
Certificate of Incorporation, as amended (incorporated by reference
to Exhibit 3.1 to the Form S-3 filed on May 10, 2017)
|
|
|
|
Amended and Restated Bylaws (incorporated by reference to Exhibit
3.1 to the Form 8-K filed on February 12, 2014)
|
|
|
|
2014 Equity Incentive Plan (incorporated by reference to Annex A to
the Schedule 14A filed on April 2, 2014)
|
|
|
|
Executive Employment Agreement dated April 30, 2015 with Brian R.
Balbirnie (incorporated by reference to Exhibit 10.1 to the Form
8-K filed on May 5, 2014)
|
|
|
|
Executive Employment Agreement dated November 19, 2015 with Steven
Knerr (incorporated by reference to Exhibit 10.1 to the Form 8-K
filed on November 19, 2015)
|
|
|
|
Incentive Stock Option Grant and Agreement dated November 19, 2015
with Steven Knerr (incorporated by reference to Exhibit 10.2 to the
Form 8-K filed on November 19, 2015)
|
|
|
|
Indemnification Agreement dated November 19, 2015 with Steven Knerr
(incorporated by reference to Exhibit 10.3 to the Form 8-K filed on
November 19, 2015)
|
|
|
|
First Amendment to 2014 Equity Incentive Plan (incorporated by
reference to Exhibit 10.1 to the Form 8-K filed on June 13,
2016)
|
|
|
|
First Amendment to Executive Employment Agreement dated May 4, 2017
with Brian R. Balbirnie (incorporated by reference to Exhibit 10.1
to the Form 8-K filed on May 5, 2017)
|
|
|
|
First Amendment to Executive Employment Agreement dated May 4, 2017
with Steven Knerr (incorporated by reference to Exhibit 10.1 to the
Form 8-K filed on May 5, 2017)
|
|
|
|
Stock Purchase Agreement dated October 2, 2017 with Kurtis D.
Hughes (incorporated by reference to Exhibit 10.1 to the Form 8-K
filed on October 3, 2017)
|
|
|
|
Stock Purchase Agreement dated July 3, 2018 with ACCESSWIRE Canada
Ltd. and Fred Gautreau (incorporated by reference to Exhibit 10.1
to the Form 8-K filed on July 5, 2018)
|
|
|
|
Stock Repurchase Agreement dated November 28, 2018 with EQS Group
AG (incorporated by reference to Exhibit 10.1 to the Form 8-K filed
on December 4, 2018)
|
|
|
|
Asset Purchase Agreement dated January 3, 2019 with Onstream Media
Corporation (incorporated by reference to Exhibit 10.1 to the Form
8-K filed on January 3, 2019)
|
|
|
|
Subsidiaries of the Registrant.*
|
|
|
|
Consent of Independent Registered Public Accounting
Firm.*
|
|
|
|
Rule 13a-14(a) Certification of Principal Executive
Officer.*
|
|
|
|
Rule 13a-14(a) Certification of Principal Financial
Officer.*
|
|
|
|
Section 1350 Certification of Principal Executive
Officer.*
|
|
|
|
Section 1350 Certification of Principal Financial
Officer.*
|
———————
* Filed
herewith
(c)
Financial Statement Schedules omitted
None.
33
SIGNATURES
Pursuant to the
requirements of Section 13 or 15(d) of the Securities Exchange Act
of 1934, the Registrant has duly caused this report to be signed on
its behalf by the undersigned, thereunto duly
authorized.
|
|
ISSUER DIRECT CORPORATION
|
|
|
|
|
|
|
|
|
Date:
February 27, 2020
|
By:
|
/s/
Brian R.
Balbirnie
|
|
|
|
|
Brian
R. Balbirnie
|
|
|
|
|
Chief
Executive Officer, Director
|
|
Pursuant to the
requirements of the Securities Exchange Act of 1934, this report
has been signed below by the following persons on behalf of the
Registrant and in the capacities indicated as of the dates set
forth below.
|
Signature
|
|
Date
|
|
Title
|
|
|
|
|
|
|
|
/s/
Brian R. Balbirnie
|
|
February
27, 2020
|
|
Director,
Chief Executive Officer
|
|
Brian
R. Balbirnie
|
|
|
|
(Principal
Executive Officer)
|
|
|
|
|
|
|
|
|
|
|
|
|
|
/s/
Steven Knerr
|
|
February
27, 2020
|
|
Chief
Financial Officer
|
|
Steven
Knerr
|
|
|
|
(Principal
Accounting Officer)
|
|
|
|
|
|
|
|
|
|
|
|
|
|
/s/
William Everett
|
|
February
27, 2020
|
|
Director,
Chairman of the Board and Member of the
|
|
William
Everett
|
|
|
|
Audit
Committee and Strategic Advisory Committee
|
|
|
|
|
|
|
|
|
|
|
|
|
|
/s/ J.
Patrick Galleher
|
|
February
27, 2020
|
|
Director,
Chairman of the Compensation Committee
|
|
J.
Patrick Galleher
|
|
|
|
and
Strategic Advisory Committee
|
|
|
|
|
|
|
|
|
|
|
|
|
|
/s/
Michael Nowlan
|
|
February
27, 2020
|
|
Director,
Chairman of the Audit Committee
|
|
Michael
Nowlan
|
|
|
|
|
|
|
|
|
|
|
|
|
|
|
|
|
|
/s/
Eric Frank
|
|
February
27, 2020
|
|
Director,
Chairman of the Technology Oversight
|
|
Eric
Frank
|
|
|
|
Committee
and Member of the Compensation Committee
|
34
INDEX TO FINANCIAL STATEMENTS
|
|
|
Page
|
|
|
|
|
|
Report of Independent Registered Public Accounting
Firm
|
|
F-2
|
|
Consolidated Balance Sheets as of December 31, 2019 and
2018
|
|
F-3
|
|
Consolidated Statements of Income for the years ended December 31,
2019 and 2018
|
|
F-4
|
|
Consolidated Statements of Comprehensive Income for the years ended
December 31, 2019 and 2018
|
|
F-5
|
|
Consolidated Statements of Stockholders’ Equity for the years
ended December 31, 2019 and 2018
|
|
F-6
|
|
Consolidated Statements of Cash Flows for the years ended December
31, 2019 and 2018
|
|
F-7
|
|
Notes to Consolidated Financial Statements
|
|
F-8
|
F-1
Report of
Independent Registered Public Accounting Firm
To the
Board of Directors and Stockholders
Issuer
Direct Corporation
Raleigh,
North Carolina
Opinion on the
Financial Statements
We have
audited the accompanying consolidated balance sheets of Issuer
Direct Corporation and subsidiaries (the “Company”) as
of December 31, 2019 and 2018, and the related consolidated
statements of income, comprehensive income, stockholders’
equity, and cash flows for each of the years in the two-year period
ended December 31, 2019, and the related notes (collectively
referred to as the “financial statements”). In our
opinion, the financial statements present fairly, in all material
respects, the financial position of the Company as of December 31,
2019 and 2018, and the results of its operations and its cash flows
for each of the years in the two-year period ended December 31,
2019, in conformity with accounting principles generally accepted
in the United States of America.
Basis for
Opinion
These
financial statements are the responsibility of the Company’s
management. Our responsibility is to express an opinion on the
Company’s financial statements based on our audits. We are a
public accounting firm registered with the Public Company
Accounting Oversight Board (United States) (“PCAOB”)
and are required to be independent with respect to the Company in
accordance with the U.S. federal securities laws and the applicable
rules and regulations of the Securities and Exchange Commission and
the PCAOB.
We
conducted our audits in accordance with the standards of the PCAOB.
Those standards require that we plan and perform the audits to
obtain reasonable assurance about whether the financial statements
are free of material misstatement, whether due to error or fraud.
The Company is not required to have, nor were we engaged to
perform, an audit of its internal control over financial reporting.
As part of our audits, we are required to obtain an understanding
of internal control over financial reporting, but not for the
purpose of expressing an opinion on the effectiveness of the
Company’s internal control over financial reporting.
Accordingly, we express no such opinion.
Our
audits included performing procedures to assess the risks of
material misstatement of the financial statements, whether due to
error or fraud, and performing procedures that respond to those
risks. Such procedures included examining, on a test basis,
evidence regarding the amounts and disclosures in the financial
statements. Our audits also included evaluating the accounting
principles used and significant estimates made by management, as
well as evaluating the overall presentation of the financial
statements. We believe that our audits provide a reasonable basis
for our opinion.
/s/
CHERRY BEKAERT LLP
Raleigh,
North Carolina
February
27, 2020
We have
served as the Company’s auditor since 2010.
F-2
ISSUER DIRECT CORPORATION AND SUBSIDIARIES
CONSOLIDATED BALANCE SHEETS
AS OF DECEMBER 31, 2019 AND 2018
(in
thousands, except share and per share amounts)
|
|
December
31,
|
|
|
|
2019
|
2018
|
|
ASSETS
|
|
|
|
Current
assets:
|
|
|
|
Cash and cash
equivalents
|
$15,766
|
$17,222
|
|
Accounts receivable
(net of allowance for doubtful accounts of $700 and $534,
respectively)
|
2,051
|
1,593
|
|
Income tax
receivable
|
48
|
90
|
|
Other current
assets
|
141
|
89
|
|
Total current
assets
|
18,006
|
18,994
|
|
Capitalized
software (net of accumulated amortization of $2,153 and $1,310,
respectively)
|
1,134
|
1,957
|
|
Fixed assets (net
of accumulated depreciation of $181 and $452,
respectively)
|
899
|
132
|
|
Right-of-use asset
– leases (See Note 9)
|
2,127
|
—
|
|
Deferred tax
asset
|
256
|
—
|
|
Other long-term
assets
|
77
|
35
|
|
Goodwill
|
6,376
|
5,032
|
|
Intangible assets
(net of accumulated amortization of $4,937 and $4,219,
respectively)
|
3,515
|
2,802
|
|
Total
assets
|
$32,390
|
$28,952
|
|
|
|
|
|
LIABILITIES
AND STOCKHOLDERS’ EQUITY
|
|
|
|
Current
liabilities:
|
|
|
|
Accounts
payable
|
$266
|
$371
|
|
Accrued
expenses
|
1,151
|
577
|
|
Note payable
– short-term (net of discount of $19 as of December 31, 2019)
(See Note 4)
|
301
|
320
|
|
Income taxes
payable
|
310
|
83
|
|
Deferred
revenue
|
1,812
|
1,249
|
|
Total current
liabilities
|
3,840
|
2,600
|
|
Note payable
– long-term (net of discount of $45 as of December 31, 2018)
(See Note 4)
|
—
|
276
|
|
Deferred income tax
liability
|
141
|
413
|
|
Lease liabilities
– long-term (See Note 9)
|
2,309
|
—
|
|
Total
liabilities
|
6,290
|
3,289
|
|
Commitments and
contingencies (see Note 10)
|
|
|
|
Stockholders'
equity:
|
|
|
|
Preferred stock,
$0.001 par value, 1,000,000 shares authorized, no shares issued and
outstanding as of December 31, 2019 and 2018,
respectively.
|
—
|
—
|
|
Common stock $0.001
par value, 20,000,000 shares authorized, 3,786,398 and 3,829,572
shares issued and outstanding as of December 31, 2019 and 2018,
respectively.
|
4
|
4
|
|
Additional paid-in
capital
|
22,275
|
22,525
|
|
Other accumulated
comprehensive loss
|
(16)
|
(17)
|
|
Retained
earnings
|
3,837
|
3,151
|
|
Total stockholders'
equity
|
26,100
|
25,663
|
|
Total
liabilities and stockholders’ equity
|
$32,390
|
$28,952
|
The
accompanying notes are an integral part of these consolidated
financial statements.
F-3
ISSUER DIRECT CORPORATION AND SUBSIDIARIES
CONSOLIDATED STATEMENTS OF INCOME
(in
thousands, except per share amounts)
|
|
Years Ended
December 31,
|
|
|
|
2019
|
2018
|
|
Revenues
|
$16,295
|
$14,232
|
|
Cost of
revenues
|
5,080
|
4,103
|
|
Gross
profit
|
11,215
|
10,129
|
|
Operating costs and
expenses:
|
|
|
|
General and
administrative
|
5,086
|
4,085
|
|
Sales and
marketing
|
3,551
|
3,002
|
|
Product
development
|
1,219
|
1,276
|
|
Depreciation and
amortization
|
885
|
603
|
|
Total operating
costs and expenses
|
10,741
|
8,966
|
|
Operating
income
|
474
|
1,163
|
|
Interest income,
net
|
321
|
47
|
|
Net income before
income taxes
|
795
|
1,210
|
|
Income tax
expense
|
109
|
373
|
|
Net
income
|
$686
|
$837
|
|
Income per share
– basic
|
$0.18
|
$0.25
|
|
Income per share
– diluted
|
$0.18
|
$0.24
|
|
Weighted average
number of common shares outstanding – basic
|
3,839
|
3,415
|
|
Weighted average
number of common shares outstanding – diluted
|
3,861
|
3,463
|
The
accompanying notes are an integral part of these consolidated
financial statements.
F-4
ISSUER DIRECT CORPORATION
CONSOLIDATED STATEMENTS OF COMPREHENSIVE INCOME
(in
thousands)
|
|
Years Ended
December 31,
|
|
|
|
2019
|
2018
|
|
Net
income
|
$686
|
$837
|
|
Foreign currency
translation adjustment
|
1
|
(51)
|
|
Comprehensive
income
|
$687
|
$786
|
The
accompanying notes are an integral part of these consolidated
financial statements.
F-5
ISSUER DIRECT CORPORATION AND SUBSIDIARIES
CONSOLIDATED STATEMENTS OF STOCKHOLDERS’ EQUITY
YEARS ENDED DECEMBER 31, 2019 AND 2018
(in
thousands, except share and per share amounts)
|
|
Common
Stock
|
Additional
Paid-in
|
Accumulated Other
Comprehensive
|
Retained
|
Total
Stockholders’
|
|
|
|
Shares
|
Amount
|
Capital
|
Loss
|
Earnings
|
Equity
|
|
Balance
at December 31, 2017
|
3,014,494
|
$3
|
$10,400
|
$34
|
$2,774
|
$13,211
|
|
Stock-based
compensation expense
|
—
|
—
|
629
|
—
|
—
|
629
|
|
Exercise of stock
awards, net of tax
|
99,376
|
—
|
747
|
—
|
—
|
747
|
|
Shares issued upon
acquisition of FSCwire (see Note 4)
|
3,402
|
—
|
62
|
—
|
—
|
62
|
|
Secondary stock
offering (see Note 7)
|
927,418
|
1
|
13,322
|
—
|
—
|
13,323
|
|
Stock repurchase
and retirement (see Note 7)
|
(215,118)
|
—
|
(2,635)
|
—
|
—
|
(2,635)
|
|
Dividends
|
—
|
—
|
—
|
—
|
(460)
|
(460)
|
|
Foreign currency
translation
|
—
|
—
|
—
|
(51)
|
—
|
(51)
|
|
Net
income
|
—
|
—
|
—
|
—
|
837
|
837
|
|
Balance
at December 31, 2018
|
3,829,572
|
$4
|
$22,525
|
$(17)
|
$3,151
|
$25,663
|
|
Stock-based
compensation expense
|
—
|
—
|
523
|
—
|
—
|
523
|
|
Exercise of stock
awards, net of tax
|
32,996
|
—
|
—
|
—
|
—
|
—
|
|
Stock repurchase
and retirement (see Note 7)
|
(76,170)
|
—
|
(773)
|
—
|
—
|
(773)
|
|
Foreign currency
translation
|
—
|
—
|
—
|
1
|
—
|
1
|
|
Net
income
|
—
|
—
|
—
|
—
|
686
|
686
|
|
Balance
at December 31, 2019
|
3,786,398
|
$4
|
$22,275
|
$(16)
|
$3,837
|
$26,100
|
The
accompanying notes are an integral part of these consolidated
financial statements.
F-6
ISSUER DIRECT CORPORATION AND SUBSIDIARIES
CONSOLIDATED STATEMENTS OF CASH FLOWS
(in
thousands, except share and per share amounts)
|
|
Years Ended
December 31,
|
|
|
|
2019
|
2018
|
|
Cash
flows from operating activities
|
|
|
|
Net
income
|
$686
|
$837
|
|
Adjustments to
reconcile net income to net cash provided by operating
activities:
|
|
|
|
Bad debt
expense
|
753
|
359
|
|
Depreciation and
amortization
|
1,667
|
1,397
|
|
Deferred income
taxes
|
(528)
|
(336)
|
|
Non-cash interest
expense
|
25
|
25
|
|
Stock-based
compensation expense
|
523
|
629
|
|
Changes in
operating assets and liabilities:
|
|
|
|
Decrease (increase)
in accounts receivable
|
(1,210)
|
(645)
|
|
Decrease (increase)
in deposits and prepaid assets
|
362
|
743
|
|
Increase (decrease)
in accounts payable
|
(117)
|
(322)
|
|
Increase (decrease)
in deferred revenue
|
559
|
296
|
|
Increase (decrease)
in accrued expenses
|
144
|
(114)
|
|
Net cash provided
by operating activities
|
2,864
|
2,869
|
|
|
|
|
|
Cash
flows from investing activities
|
|
|
|
Purchase of
acquired businesses, net of cash received (See Note 4)
|
(2,788)
|
(1,123)
|
|
Purchase of fixed
assets
|
(420)
|
(51)
|
|
Capitalized
software
|
(20)
|
(21)
|
|
Net cash used in
investing activities
|
(3,228)
|
(1,195)
|
|
|
|
|
|
Cash
flows from financing activities
|
|
|
|
Payment for stock
repurchase and retirement (see Note 7)
|
(773)
|
(2,635)
|
|
Payment on notes
payable (See Note 4)
|
(320)
|
(288)
|
|
Proceeds from
secondary stock offering (see Note 7)
|
—
|
13,323
|
|
Proceeds from
exercise of stock options, net of income taxes
|
—
|
747
|
|
Payment of
dividend
|
—
|
(460)
|
|
Net cash provided
by (used in) financing activities
|
(1,093)
|
10,687
|
|
|
|
|
|
Net change in
cash
|
(1,457)
|
12,361
|
|
Cash-
beginning
|
17,222
|
4,917
|
|
Currency
translation adjustment
|
1
|
(56)
|
|
Cash-
ending
|
$15,766
|
$17,222
|
|
|
|
|
|
Supplemental disclosures:
|
|
|
|
Cash paid for
income taxes
|
$340
|
$66
|
|
Non-cash
activities:
|
|
|
|
Right-of-use assets
obtained in exchange for lease liabilities
|
$2,856
|
$—
|
The
accompanying notes are an integral part of these consolidated
financial statements.
F-7
Note
1: Description, Background and Basis of Operations
Nature of Operations
Issuer
Direct Corporation (the “Company” or “Issuer
Direct”) was incorporated in the state of Delaware in October
1988 under the name Docucon Inc. Subsequent to the December 13,
2007 merger with My EDGAR, Inc., the Company changed its name to
Issuer Direct Corporation. Today, Issuer Direct is an industry-leading global
communications and compliance company focusing on the needs of
corporate issuers. Issuer Direct's principal platform,
Platform id.™, empowers users by thoughtfully
integrating the most relevant tools, technologies and products,
thus eliminating the complexity associated with producing and
distributing their business communications and financial
information. The Company operates under several brands in
the market, including Direct Transfer, PrecisionIR (PIR), Investor
Network, Interwest and ACCESSWIRE. The Company leverages its
securities compliance and regulatory expertise to provide a
comprehensive set of services that enhance a customer’s
ability to communicate effectively with its shareholder base while
meeting all reporting regulations required.
Note 2: Summary of Significant Accounting Policies
The
consolidated financial statements include the accounts of the
Company and its wholly-owned subsidiaries. Significant intercompany
accounts and transactions are eliminated in
consolidation.
Cash Equivalents
For
purposes of the Company’s financial statements, the Company
considers all highly liquid investments purchased with an original
maturity date of three months or less to be cash
equivalents.
Accounts Receivable and Allowance for Doubtful
Accounts
The
Company monitors outstanding receivables based on factors
surrounding the credit risk of specific customers, historical
trends, and other information. Credit is granted on an unsecured
basis. The allowance for doubtful accounts is estimated based on an
assessment of the Company’s ability to collect on customer
accounts receivable. There is judgment involved with estimating the
allowance for doubtful accounts and if the financial condition of
the Company’s customers were to deteriorate, resulting in
their inability to make the required payments, the Company may be
required to record additional allowances or charges against
revenues. The Company generally writes-off accounts receivable
against the allowance when it determines a balance is uncollectible
and no longer actively pursues its collection.
The
following is a summary of our allowance for doubtful accounts
during the years ended December 31, 2019 and 2018 (in
000’s):
|
|
Year
Ended
December
31,
2019
|
Year
Ended
December
31,
2018
|
|
Beginning
balance
|
$534
|
$425
|
|
Bad debt
expense
|
753
|
359
|
|
Write-offs
|
(587)
|
(250)
|
|
Ending
balance
|
$700
|
$534
|
Concentration of Credit Risk
Financial
instruments and related items which potentially subject the Company
to concentrations of credit risk consist primarily of cash, cash
equivalents and accounts receivables. The Company places its cash
and temporary cash investments with credit quality institutions. At
times, such investments may be in excess of the FDIC insurance
limit of $250,000. To reduce its risk associated with the failure
of such financial institutions, the Company evaluates at least
annually the rating of the financial institution in which it holds
deposits. As of December 31, 2019, the total amount exceeding such
limit was $14,794,000. The Company also had cash-on-hand of
$305,000 in Europe and $189,000 in Canada as of December 31,
2019.
We
believe we did not have any financial instruments that could have
potentially subjected us to significant concentrations of credit
risk for any relevant period.
F-8
Revenue Recognition
Substantially all
of the Company’s revenue comes from contracts with customers
for subscriptions to its cloud-based products or contracts to
perform compliance or other services. Customers consist primarily
of corporate issuers and professional
firms, such as investor relations and public relations firms. In
the case of our news distribution and webcasting offerings, our
customers also include private companies. The Company
accounts for a contract with a customer when there is an
enforceable contract between the Company and the customer, the
rights of the parties are identified, the contract has economic
substance, and collectability of the contract consideration is
probable. The Company's revenues are measured based on
consideration specified in the contract with each
customer.
The
Company's contracts include either a subscription to our entire
platform or certain modules within our platform, or an agreement to
perform services or any combination thereof, and often contain
multiple subscriptions and services. For these bundled contracts,
the Company accounts for individual subscriptions and services as
separate performance obligations if they are distinct, which is
when a product or service is separately identifiable from other
items in the bundled package, and a customer can benefit from it on
its own or with other resources that are readily available to the
customer. The Company separates revenue from its contracts into two
revenue streams: i) Platform and Technology and ii) Services.
Performance obligations of Platform and Technology contracts
include providing subscriptions to certain modules or the entire
Platform id.
system, distributing press releases on a per release basis or
conducting webcasts on a per event basis. Performance obligations
of Service contracts include obligations to deliver compliance
services and annual report printing and distribution on either a
stand ready obligation or on a per project or event basis. Set up
fees for compliance services are considered a separate performance
obligation and are satisfied upfront. Set up fees for our transfer
agent module and investor relations content management module are
immaterial. The Company’s subscription and service contracts
are generally for one year, with automatic renewal clauses included
in the contract until the contract is cancelled. The contracts do
not contain any rights of returns, guarantees or warranties. Since
contracts are generally for one year, all of the revenue is
expected to be recognized within one year from the contract start
date. As such, the Company has elected the optional exemption that
allows the Company not to disclose the transaction price allocated
to performance obligations that are unsatisfied or partially
satisfied at the end of each reporting period.
The
Company recognizes revenue for subscriptions evenly over the
contract period, upon distribution for per release contracts and
upon event completion for webcasting events. For service contracts
that include stand ready obligations, revenue is recognized evenly
over the contract period. For all other services delivered on a per
project or event basis, the revenue is recognized at the completion
of the event. The Company believes recognizing revenue for
subscriptions and stand ready obligations using a time-based
measure of progress, best reflects the Company’s performance
in satisfying the obligations.
For
bundled contracts, revenue is allocated to each performance
obligation based on its relative standalone selling price.
Standalone selling prices are based on observable prices at which
the Company separately sells the subscription or services. If a
standalone selling price is not directly observable, the Company
uses the residual method to allocate any remaining costs to that
subscription or service. The Company regularly reviews standalone
selling prices and updates these estimates if
necessary.
The
Company invoices its customers based on the billing schedules
designated in its contracts, typically upfront on either a monthly,
quarterly or annual basis or per transaction at the completion of
the performance obligation. Deferred revenue for the periods
presented was primarily related to subscription and service
contracts, which are billed upfront, quarterly or annually, however
the revenue has not yet been recognized. The associated deferred
revenue is generally recognized ratably over the billing period.
Deferred revenue as of December 31, 2019 and 2018 was $1,812,000
and $1,249,000, respectively, and is expected to be recognized
within one year. Revenue recognized for the year ended December 31,
2019 and 2018, that was included in the deferred revenue balance at
the beginning of each reporting period, was approximately
$1,249,000 and $887,000, respectively. Accounts receivable related
to contracts with customers was $2,051,000 and $1,593,000 as of
December 31, 2019 and 2018, respectively. Since substantially all
of the contracts have terms of one year or less, the Company has
elected to use the practical expedient regarding the existence of a
significant financing.
Costs
to obtain contracts with customers consist primarily of sales
commissions. As of December 31, 2019 and 2018, the Company has
capitalized $21,000 and $18,000 of costs to obtain contracts that
are expected to be amortized over more than one year. For contract
costs expected to be amortized in less than one year, the Company
has elected to use the practical expedient allowing the recognition
of incremental costs of obtaining a contract as an expense when
incurred. The Company has considered historical renewal rates,
expectations of future renewals and economic factors in making
these determinations.
F-9
Fixed Assets
Fixed
assets are recorded at cost and depreciated over the estimated
useful lives of the assets using principally the straight-line
method. When items are retired or otherwise disposed of, income is
charged or credited for the difference between net book value and
proceeds realized thereon. Ordinary maintenance and repairs are
charged to expense as incurred, and replacements and betterments
are capitalized. The range of estimated useful lives used to
calculate depreciation for principal items of property and
equipment are as follow:
|
Asset
Category
|
Depreciation /
Amortization Period
|
|
Computer
equipment
|
3
years
|
|
Furniture
& equipment
|
3 to 7
years
|
|
Leasehold
improvements
|
8 years
or lesser of the lease term
|
Earnings per Share
Earnings per share
accounting guidance requires that basic net income per common share
be computed by dividing net income for the period by the weighted
average number of common shares outstanding during the period.
Diluted net income per share is computed by dividing the net income
for the period by the weighted average number of common and
dilutive common equivalent shares outstanding during the period.
Shares issuable upon the exercise of stock options totaling 93,000
and 32,000 were excluded in the computation of diluted earnings per
common share during the years ended December 31, 2019 and 2018,
respectively, because their impact was anti-dilutive.
Use of Estimates
The
preparation of financial statements in conformity with US GAAP
requires management to make estimates and assumptions that affect
the reported amounts of assets and liabilities and disclosure of
contingent assets and liabilities at the date of the financial
statements and the reported amounts of revenues and expenses during
the reporting period. Significant estimates include the allowance
for doubtful accounts and the valuation of goodwill, intangible
assets, deferred tax assets, and stock-based compensation. Actual
results could differ from those estimates.
Income Taxes
Deferred income tax
assets and liabilities are computed for differences between the
financial statement and tax bases of assets and liabilities that
will result in future taxable or deductible amounts based on
enacted tax laws and rates applicable to the periods in which the
differences are expected to affect taxable income. Valuation
allowances are established, when necessary, to reduce deferred
income tax assets to the amounts expected to be realized. For any
uncertain tax positions, we recognize the impact of a tax position
only if it is more likely than not of being sustained upon
examination, based on the technical merits of the position. Our
policy regarding the classification of interest and penalties is to
classify them as income tax expense in our financial statements, if
applicable.
Capitalized Software
Costs
incurred to develop our cloud-based platform products and
disclosure management system components are capitalized when the
preliminary project phase is complete, management commits to fund
the project and it is probable the project will be completed and
used for its intended purposes. Once the software is substantially
complete and ready for its intended use, the software is amortized
over its estimated useful life. Costs related to design or
maintenance of the software are expensed as incurred. The Company
capitalized $20,000 and $21,000 during the years ended December 31,
2019 and 2018, respectively. The Company recorded amortization
expense of $843,000 and $813,000 during the years ended December
31, 2019 and 2018, respectively, $783,000 and $795,000 of which is
included in Cost of revenues on the Consolidated Statements of
Income. The remaining amount of $60,000 and $18,000 for the years
ended December 31, 2019 and 2018, respectively, is included in
Depreciation and amortization.
The
Company reviews capitalized software for impairment whenever events
or changes in circumstances indicate the carrying amount of an
asset may not be recoverable. One part of the Company’s suite
of products was directed toward private companies seeking to raise
capital under Regulation A+ and Regulation D. Market acceptance
under these regulations is behind what was initially anticipated,
resulting in lower than expected revenue from this product. As a
result, the Company wrote-off the remaining carrying value of this
product in the amount of $44,000 as of December 31, 2019. This
amount is included in Depreciation and amortization expense on the
Consolidated Statements of Income for the year ended December 31,
2019.
F-10
Impairment of Long-lived Assets
In
accordance with the authoritative guidance for accounting for
long-lived assets, assets such as property and equipment,
trademarks, and intangible assets subject to amortization, are
reviewed for impairment whenever events or changes in circumstances
indicate that the carrying amount of an asset group may not be
recoverable. Recoverability of asset groups to be held and used is
measured by a comparison of the carrying amount of an asset group
to estimated undiscounted future cash flows expected to be
generated by the asset group. If the carrying amount of an asset
group exceeds its estimated future cash flows, an impairment charge
is recognized by the amount by which the carrying amount of an
asset group exceeds fair value of the asset group.
Lease Accounting
We
determine if an arrangement is a lease at inception. Our operating
lease agreements are primarily for office space and are included
within Other long-term assets and Other long-term liabilities on
the consolidated balance sheets.
Right-of-use
(“ROU”) assets represent our right to use an underlying
asset for the lease term and lease liabilities represent our
obligation to make lease payments arising from the lease. ROU
assets and lease liabilities are recognized at the commencement
date based on the present value of lease payments over the lease
term. Our variable lease payments consist of non-lease services
related to the lease. Variable lease payments are excluded from the
ROU assets and lease liabilities and are recognized in the period
in which the obligation for those payments is incurred. As most of
our leases do not provide an implicit rate, we use our incremental
borrowing rate based on the information available at commencement
date in determining the present value of lease payments. ROU assets
also include any lease payments made and exclude lease incentives.
Rental expense for lease payments related to operating leases is
recognized on a straight-line basis over the lease
term.
Fair Value Measurements
ASC
Topic 820 establishes a fair value hierarchy that requires an
entity to maximize the use of observable inputs and minimize the
use of unobservable inputs when measuring fair value. Assets and
liabilities recorded at fair value in the financial statements are
categorized based upon the hierarchy of levels of judgment
associated with the inputs used to measure their fair value.
Hierarchical levels directly related to the amount of subjectivity
associated with the inputs to fair valuation of these assets and
liabilities, are as follows:
●
Level 1–
Quoted prices are available in active markets for identical assets
or liabilities at the reporting date. Generally, this includes debt
and equity securities that are traded in an active market. Our cash
and cash equivalents are quoted at Level 1.
●
Level 2 –
Observable inputs other than Level 1prices such as quote prices for
similar assets or liabilities; quoted prices in markets that are
not active; or other inputs that are observable or can be
corroborated by observable market data for substantially the full
term of the assets or liabilities. Generally, this includes debt
and equity securities that are not traded in an active
market.
●
Level 3 –
Unobservable inputs that are supported by little or no market
activity and that are significant to the fair value of the assets
or liabilities. Level 3 assets and liabilities include financial
instruments whose value is determined using pricing models,
discounted cash flow methodologies, or other valuation techniques,
as well as instruments for which the determination of fair value
requires significant management judgment or
estimation.
As of
December 31, 2019 and 2018, we believe that the fair value of our
financial instruments other than cash and cash equivalents, such
as, accounts receivable, our line of credit, notes payable, and
accounts payable approximate their carrying amounts.
F-11
Stock-based Compensation
The
authoritative guidance for stock compensation requires that
companies estimate the fair value of share-based payment awards on
the date of the grant using an option-pricing model. The cost is to
be recognized over the period during which an employee is required
to provide service in exchange for the award.
Translation of Foreign Financial Statements
The
financial statements of the foreign subsidiaries of the Company
have been translated into U.S. dollars. All assets and liabilities
have been translated at current rates of exchange in effect at the
end of the period. Income and expense items have been translated at
the average exchange rates for the year or the applicable interim
period. The gains or losses that result from this process are
recorded as a separate component of other accumulated comprehensive
income (loss) until the entity is sold or substantially
liquidated.
Comprehensive Income
Comprehensive
income consists of net income and other comprehensive income
related to changes in the cumulative foreign currency translation
adjustment.
Business Combinations, Goodwill and Intangible Assets
We
account for business combinations under FASB ASC No. 805 –
Business Combinations and the related acquired intangible assets
and goodwill under FASB ASC No. 350 – Intangibles –
Goodwill and Other. The authoritative guidance for business
combinations specifies the criteria for recognizing and reporting
intangible assets apart from goodwill. We record the assets
acquired and liabilities assumed in business combinations at their
respective fair values at the date of acquisition, with any excess
purchase price recorded as goodwill. Goodwill is an asset
representing the future economic benefits arising from other assets
acquired in a business combination that are not individually
identified and separately recognized. Intangible assets consist of
client relationships, customer lists, distribution partner
relationships, software, technology and trademarks that are
initially measured at fair value. At the time of the business
combination, trademarks are considered an indefinite-lived asset
and, as such, are not amortized as there is no foreseeable limit to
cash flows generated from them. The goodwill and intangible assets
are assessed annually for impairment, or whenever conditions
indicate the asset may be impaired, and any such impairment will be
recognized in the period identified. The client relationships (7-10
years), customer lists (3 years), distribution partner
relationships (10 years), non-compete agreements (5 years) and
software and technology (3-6 years) are amortized over their
estimated useful lives.
Advertising
The
Company expenses advertising as incurred, except for
direct-response advertising, which is capitalized and amortized
over its expected period of future benefits. Advertising expense
totaled $163,000 and $115,000, during the years ended December 31,
2019 and 2018, respectively.
Recently adopted accounting pronouncements
In
February 2016, the FASB established Topic 842, Leases, by issuing
Accounting Standards Update (ASU) No. 2016-02, which requires
lessees to recognize leases on-balance sheet and disclose key
information about leasing arrangements. Topic 842 was subsequently
amended by ASU No. 2018-01, Land Easement Practical Expedient for
Transition to Topic 842; ASU No. 2018-10, Codification Improvements
to Topic 842, Leases; and ASU No. 2018-11, Targeted Improvements.
The new standard establishes a ROU model that requires a lessee to
recognize a ROU asset and lease liability on the balance sheet for
all leases with a term longer than 12 months. Leases will be
classified as finance or operating, with classification affecting
the pattern and classification of expense recognition in the income
statement.
F-12
The new
standard was effective for the Company on January 1, 2019, which is
also the day we elected to adopt the new standard. A modified
retrospective transition approach is required, applying the new
standard to all leases existing at the date of initial application.
We chose the effective date as our date of initial application.
Consequently, financial information will not be updated and the
disclosures required under the new standard will not be provided
for dates and periods before January 1, 2019. We elected the
package of practical expedients permitted under the transition
guidance within the new standard, which among other things, allowed
us to carry forward the historical lease classification of those
leases in place as of January 1, 2019. See the table below for the
impact of adoption of the lease standard on our balance sheet
accounts as of the day of adoption, January 1, 2019 ($ in
000’s):
|
|
As Previously
Reported
|
New Lease Standard
Adjustment
|
As
Adjusted
|
|
ROU
asset
|
$-
|
$102
|
$102
|
|
Lease
liability
|
-
|
135
|
135
|
|
Deferred
rent
|
33
|
(33)
|
-
|
Note 3: Fixed Assets
|
in $000’s
|
December
31,
|
|
|
|
2019
|
2018
|
|
Computers
equipment
|
$108
|
$134
|
|
Furniture &
equipment
|
267
|
320
|
|
Leasehold
improvements
|
705
|
130
|
|
Total fixed assets,
gross
|
1,080
|
584
|
|
Less: Accumulated
depreciation
|
(181)
|
(452)
|
|
Total fixed assets,
net
|
$899
|
$132
|
Included in
leasehold improvements is $488,000 of tenant improvements allowance
associated with the new lease signed in March 2019 related to the
Company’s new corporate headquarters. Depreciation expense on
fixed assets for the years ended December 31, 2019 and 2018 totaled
$106,000 and $64,000, respectively. During the year ended December
31, 2019, the Company disposed of fixed assets totaling $377,000.
No disposals were made during the year ended December 31,
2018.
Note 4: Recent Acquisitions
Acquisition of the Visual Webcaster Platform
(“VWP”)
On
January 3, 2019 (the “Closing Date”), the Company
entered into an Asset Purchase Agreement (the “VWP
Agreement”) with Onstream Media Corporation, a Florida
corporation (the “Seller”), whereby the Company
purchased certain assets related primarily to customer accounts,
intellectual property, lease deposits and assumed certain existing
contractual obligations related primarily to data processing and
storage, bandwidth and facility leases relating to the
Seller’s VisualWebcaster Platform ("VWP”) for a
purchase price of $2,788,000 paid as of the Closing Date. The
accounts receivable and the accounts payable related to VWP and
existing as of the Closing Date were not included as part of the
VWP Agreement.
The
acquisition was accounted for under the acquisition method of
accounting for business combinations, which requires, among other
things, that the assets acquired and liabilities assumed be
recognized at their fair values as of the acquisition date.
Acquisition-related costs, which totaled approximately $155,000,
are not included as a component of the acquisition accounting, but
are recognized as expenses in the periods in which the costs are
incurred. Any changes within the measurement period resulting from
facts and circumstances that existed as of the acquisition date may
result in retrospective adjustments to the provisional amounts
recorded at the acquisition date. The Company employed a third
party valuation firm to assist in determining the preliminary
purchase price allocation of assets and liabilities acquired from
Seller. The valuation resulted in the tangible and intangible
assets and liabilities disclosed below. The income approach was
used to determine the value of the customer relationships and
non-compete agreement. The income approach determines the fair
value for the asset based on the present value of cash flows
projected to be generated by the asset. Projected cash flows are
discounted at a rate of return that reflects the relative risk of
achieving the cash flow and the time value of money. Projected cash
flows considered multiple factors, including current revenue from
existing customers; analysis of expected revenue and attrition
trends; reasonable contract renewal assumptions from the
perspective of a marketplace participant; probability of executives
competing, expected profit margins giving consideration to
marketplace synergies; and required returns to contributory assets.
The relief from royalty method was used to value the technology.
The relief from royalty method determines the fair value by
calculating what a typical license fee would be in order to obtain
the same or similar license of the technology from market
participants. Projected cash flows consider revenue assumptions
allocated to the technology.
F-13
The
transaction consisted of a single cash payment to the Seller in the
amount of $2,788,000. In connection with the acquisition, the
Company assumed two short-term leases associated with an office and
co-location for certain computer equipment in New York City, New
York as well as entered into a three-year office lease in Florida.
In addition to the intangible assets listed below, the purchase
price included lease deposits of $13,000 and a right of use asset
and corresponding lease liability for the office lease in Florida
in the amount of $125,000.
The
following table summarizes the preliminary estimates of the
identified intangible assets as a result of the acquisition. The
preliminary estimates of the fair value of identified intangible
assets as a result of the acquisition were subject to revisions,
which resulted in adjustments to the values as presented below. The
changes are due to continued refinement of management’s
appraisals and estimates. In conjunction with the change in the
preliminary estimate, the estimated lives of the identified
intangible assets were reviewed, however, no changes were
made.
The
identified intangible assets are as a result of the acquisition are
as follows (in 000’s):
|
|
As Previously
Reported 9/30/19
|
As Restated
12/31/19
|
Adjustment
|
|
Customer
relationships
|
$1,190
|
$865
|
$(325)
|
|
Technology
|
497
|
497
|
—
|
|
Non-compete
agreement
|
69
|
69
|
—
|
|
Goodwill
|
1,019
|
1,344
|
325
|
|
|
$2,775
|
$2,775
|
$—
|
The
following represents our unaudited condensed pro-forma financial
results as if the VWP acquisition had occurred as of January 1,
2018. Unaudited condensed pro-forma results are based upon
accounting estimates and judgments that we believe are reasonable.
The condensed pro-forma results are not necessarily indicative of
the actual results of our operations had the acquisitions occurred
at the beginning of the period presented, nor does it purport to
represent the results of operations for future
periods.
|
$ in 000’s
|
Year Ended
December 31, 2018
|
|
Revenues
|
$16,836
|
|
Net
Income
|
$1,146
|
|
Basic earnings per
share
|
$0.34
|
|
Diluted earnings
per share
|
$0.33
|
Acquisition of Filing Services Canada Inc.
(“FSCwire”)
On July
3, 2018, the Company entered into a Stock Purchase Agreement (the
“FSCwire Agreement”) with the sole shareholder of
FSCwire, a company incorporated under the Business Corporations Act
(Alberta), whereby the Company purchased all of the outstanding
equity securities. Under the terms of the FSCwire Agreement, the
Company paid $1,140,000 at closing ($180,000 of which was paid into
an escrow account to cover standard representations and warranties
included within the Purchase agreement) and issued 3,402 shares of
restricted common stock of the Company.
The
acquisition was accounted for under the acquisition method of
accounting for business combinations, which requires, among other
things, that the assets acquired and liabilities assumed be
recognized at their fair values as of the acquisition date.
Acquisition-related costs, which totaled approximately $52,000, are
not included as a component of the acquisition accounting, but are
recognized as expenses in the periods in which the costs are
incurred. Any changes within the measurement period resulting from
facts and circumstances that existed as of the acquisition date may
result in retrospective adjustments to the provisional amounts
recorded at the acquisition date. During the year ended December
31, 2018, the Company employed a third party valuation firm to
assist in determining the purchase price allocation of assets and
liabilities acquired from FSCwire. The valuation resulted in the
tangible and intangible assets and liabilities disclosed below. The
income approach was used to determine the value of FSCwire’s
customer relationships and the relief from royalty method was used
to value the distribution partner relationships.
F-14
The
transaction resulted in recording intangible assets and goodwill at
a fair value of $1,426,000 as follows (in
000’s):
|
Initial cash
payment
|
$1,140
|
|
Fair value of
restricted common stock issued
|
62
|
|
Total
Consideration
|
1,202
|
|
Plus: excess of
liabilities assumed over assets acquired
|
224
|
|
Total fair value of
FSCwire intangible assets and goodwill
|
$1,426
|
The
tangible assets and liabilities acquired were as follows (in
000’s):
|
Cash
|
$17
|
|
Accounts
receivable, net
|
42
|
|
Total
assets
|
59
|
|
|
|
|
Accounts payable
and accrued expenses
|
35
|
|
Deferred
revenue
|
78
|
|
Deferred tax
liability
|
170
|
|
Total
liabilities
|
283
|
|
Excess of
liabilities assumed over assets acquired
|
$(224)
|
The
identified intangible assets as a result of the acquisition are as
follows (in 000’s):
|
Customer
relationships
|
$311
|
|
Distribution
partner relationships
|
153
|
|
Goodwill
|
962
|
|
|
$1,426
|
The
Company has elected not to provide unaudited pro forma financial
information for the FSCwire acquisition, because the acquisition
was not considered a significant acquisition in accordance with
Rule 3-05 of the SEC's Regulation S-X.
Note 5: Goodwill and Other Intangible
Assets
The
components of intangible assets are as follows (in
000’s):
|
|
December 31,
2019
|
||
|
|
Gross
Carrying
Amount
|
Accumulated
Amortization
|
Net
Carrying
Amount
|
|
Customer
lists
|
$1,770
|
$(1,770)
|
$—
|
|
Customer
relationships
|
4,600
|
(2,100)
|
2,500
|
|
Proprietary
software
|
1,279
|
(865)
|
414
|
|
Distribution
partner relationships
|
153
|
(23)
|
130
|
|
Non-compete
agreement
|
69
|
(14)
|
55
|
|
Trademarks –
definite-lived
|
173
|
(165)
|
8
|
|
Trademarks –
indefinite-lived
|
408
|
—
|
408
|
|
Total intangible
assets
|
$8,452
|
$(4,937)
|
$3,515
|
|
|
December 31,
2018
|
||
|
|
Gross
Carrying
Amount
|
Accumulated
Amortization
|
Net
Carrying
Amount
|
|
Customer
lists
|
$1,770
|
$(1,770)
|
$—
|
|
Customer
relationships
|
3,735
|
(1,534)
|
2,201
|
|
Proprietary
software
|
782
|
(753)
|
29
|
|
Distribution
partner relationships
|
153
|
(8)
|
145
|
|
Trademarks –
definite-lived
|
173
|
(154)
|
19
|
|
Trademarks –
indefinite-lived
|
408
|
—
|
408
|
|
Total intangible
assets
|
$7,021
|
$(4,219)
|
$2,802
|
F-15
The
Company performed its annual assessment for impairment of goodwill
and intangible assets and determined there was no impairment as of
and for the years ended December 31, 2019 and 2018.
The
amortization of intangible assets is a charge to operating expenses
and totaled $718,000 and $520,000 in the years ended 2019 and 2018,
respectively.
The
future amortization of the identifiable intangible assets is as
follows (in 000’s):
|
Years
Ending December 31:
|
|
|
2020
|
$609
|
|
2021
|
459
|
|
2022
|
431
|
|
2023
|
431
|
|
2024
|
431
|
|
Thereafter
|
746
|
|
Total
|
$3,107
|
Our
goodwill balance of $6,376,000 at December 31, 2019, was related to
our acquisition of Basset Press in July 2007, PIR in 2013,
ACCESSWIRE in 2014, Interwest in 2017, FSCwire in 2018 and VWP in
2019. The increase in the amount of goodwill of $1,344,000 as
compared to the balance of $5,032,000 as of December 31, 2018, was
due to the acquisition of VWP as described in Note 4. We conducted
our annual impairment analyses as of October 1, of 2019 and 2018
and determined that no goodwill was impaired.
Note 6: Line of Credit
Effective October
3, 2019, the Company renewed its Line of Credit, which increased
the term to two years, with all other provisions remaining the
same. The amount of funds available for borrowing are $3,000,000
and the interest rate is LIBOR plus 1.75%. As of December 31, 2019,
the interest rate was 3.76% and the Company did not owe any amounts
on the Line of Credit.
Note 7: Equity
Dividends
We did
not pay any dividends during the year ended December 31, 2019.
During the year ended December 31, 2018, we paid dividends totaling
$460,000 or $0.15 per share.
Preferred stock and common stock
There
were no issuances of preferred stock during the years ended
December 31, 2019 and 2018. During the years ended December 31,
2019 and 2018, the Company had the following issuances of common
stock in addition to stock issued pursuant to vesting of restricted
stock units and exercise of options to purchase common
stock:
●
The Company issued
2,500 shares of common stock to consultants in exchange for
services during the years ended December 31, 2018, and recognized
expense of $38,000, for the value of those shares.
●
On July 3, 2018,
the Company issued 3,402 shares as part of the acquisition of
FSCwire (see Note 4).
Secondary public offering
On
August 17, 2018, the Company completed a secondary public offering
of 806,451 shares of its common stock at a price to the public of
$15.50 per share. In addition, the Company granted the underwriter
a 30-day option to purchase an additional 120,967 shares of its
common stock to cover over-allotments, which were sold on August
24, 2018. The aggregate gross proceeds of the offering were
$14,375,000. Closing costs of $1,052,000, which consisted of
underwriting commissions, legal and accounting fees and other
offering expenses, were netted against the proceeds, which resulted
in net proceeds to the Company of $13,323,000. The net proceeds of
the offering are included in Additional paid-in capital on the
Balance Sheet as of December 31, 2018.
F-16
Stock repurchase and retirement
On
August 7, 2019, the Company publicly announced a share repurchase
program under which the Company is authorized to repurchase up to
$1,000,000 of its common shares. As of December 31, 2019, the
Company repurchased a total of 76,170 shares at an aggregate cost
of $769,000 (not including commissions of $4,000) as shown in the
table below ($ in 000’s, except share or per share
amounts):
|
Shares
Repurchased
|
||||
|
Period
|
Total Number of
Shares Repurchased
|
Average Price Paid
Per Share
|
Total Number of
Shares Purchased as Part of Publicly Announced
Program
|
Maximum Dollar
Value of Shares that May Yet Be Purchased Under the
Program
|
|
August 7 -31,
2019
|
22,150
|
$9.34
|
22,150
|
$793
|
|
September 1-30,
2019
|
2,830
|
$10.00
|
2,830
|
$765
|
|
October 1-31,
2019
|
39,363
|
$10.44
|
39,363
|
$354
|
|
November 1-30,
2019
|
11,827
|
$10.43
|
11,827
|
$231
|
|
December 1-31,
2019
|
—
|
—
|
—
|
$231
|
|
Total
|
76,170
|
$10.10
|
76,170
|
$231
|
On
November 28, 2018, the Company entered into a Stock Repurchase
Agreement with EQS Group AG (the “Stockholder”) whereby
the Company agreed to purchase 215,118 shares (the
“Repurchased Shares”) of the Company’s common
stock, par value $0.001, from the Stockholder for a per share
purchase price of $12.25, or an aggregate purchase price of
$2,635,000. On December 5, 2018, the transaction closed and the
Company acquired the Repurchased Shares and subsequently retired
all of the Repurchased Shares.
Note 8: Stock Options and Restricted Stock Units
On May
23, 2014, the shareholders of the Company approved the 2014 Equity
Incentive Plan (the “2014 Plan”). Under the terms of
the 2014 Plan, the Company is authorized to issue incentive awards
for common stock up to 200,000 shares to employees and other
personnel. On June 10, 2016, the shareholders of the Company
approved an additional 200,000 awards to be issued under the 2014
Plan, bringing the total number of shares to be awarded to 400,000.
The awards may be in the form of incentive stock options,
nonqualified stock options, restricted stock, restricted stock
units and performance awards. The 2014 Plan is effective through
March 31, 2024. As of December 31, 2019, there are 23,500 shares
which remain to be granted under the 2014 Plan.
On
August 9, 2010, the shareholders of the Company approved the 2010
Equity Incentive Plan (the “2010 Plan”). Under the
terms of the 2010 Plan, 150,000 shares of the Company’s
common stock were authorized for the issuance of stock options and
restricted stock. The 2010 Plan also provides for an automatic
annual increase in the number of authorized shares of common stock
issuable beginning in 2011 equal to the lesser of (a) 2% of shares
outstanding on the last day of the immediately preceding year, (b)
50,000 shares, or (c) such lesser number of shares as the
Company’s board of directors shall determine, provided,
however, in no event shall the maximum number of shares that may be
issued under the Plan pursuant to stock awards be greater than 15%
of the aggregate shares outstanding on the last day of the
immediately preceding year. With the automatic increases, there
were 220,416 authorized shares of common stock on January 1, 2012.
On January 20, 2012, the Company’s Board of Directors
approved an increase in the number of shares authorized under the
2010 Plan from 220,416 to 420,416. This increase was ratified by
the shareholders of the Company on June 29, 2012. On December 31,
2018, there were no shares remaining for awards to be issued under
the 2010 Plan.
F-17
The
following is a summary of stock options issued during the year
ended December 31, 2019 and 2018:
|
|
Number of
Options
Outstanding
|
Range
of
Exercise
Price
|
Weighted
Average
Exercise
Price
|
Aggregate
Intrinsic
Value
|
|
Balance at December
31, 2017
|
137,288
|
$0.01 - 13.49
|
$10.20
|
$1,119,562
|
|
Options
granted
|
32,000
|
17.40
|
17.40
|
—
|
|
Options
exercised
|
(61,875)
|
7.76 - 13.49
|
11.46
|
346,284
|
|
Options
forfeited/cancelled
|
(8,850)
|
0.01 – 9.26
|
2.76
|
134,099
|
|
Balance at December
31, 2018
|
98,563
|
$6.80 - 17.40
|
$12.56
|
$127,306
|
|
Options
granted
|
31,500
|
10.75 –
13.21
|
12.90
|
—
|
|
Options
exercised
|
—
|
—
|
—
|
—
|
|
Options
forfeited/cancelled
|
(2,500)
|
13.21
|
13.21
|
—
|
|
Balance at December
31, 2019
|
127,563
|
$6.80 - 17.40
|
$12.63
|
$142,818
|
|
|
|
|
|
|
The
aggregate intrinsic value in the table above represents the total
pretax intrinsic value (i.e. the aggregate difference between the
closing price of our common stock on December 31, 2019 and 2018 of
$11.69 and $11.35, respectively, and the exercise price for
in-the-money options) that would have been received by the holders
if all instruments had been exercised on December 31, 2019 and
2018. As of December 31, 2019, there was $95,000 of unrecognized
compensation cost related to our unvested stock options, which will
be recognized through 2021.
The
following table summarizes information about stock options
outstanding and exercisable at December 31, 2019:
|
|
Options
Outstanding
|
Options
Exercisable
|
||
|
Exercise
Price
|
Number
|
Weighted
Average
Exercise
Price
|
Weighted
Average
Remaining
Contractual
Life
(in
Years)
|
Number
|
|
$0.01 - $7.00
|
10,000
|
$6.80
|
5.88
|
10,000
|
|
$7.01 - $8.00
|
20,313
|
7.76
|
3.74
|
20,313
|
|
$8.01 - $12.00
|
8,250
|
9.98
|
7.18
|
4,250
|
|
$12.01 - $15.00
|
57,000
|
13.09
|
8.37
|
32,000
|
|
$15.01 - $17.40
|
32,000
|
17.40
|
8.42
|
32,000
|
|
Total
|
127,563
|
$12.63
|
7.37
|
98,563
|
Of the
127,563 stock options outstanding, 69,000 are non-qualified stock
options. All options have been registered with the
SEC.
The
fair value of common stock options issued during the year ended
December 31, 2019 and 2018 were estimated on the date of grant
using the Black-Scholes option pricing model with the following
assumptions used:
|
|
Year
ended
December
31,
2019
|
Year
ended
December
31,
2018
|
|
Expected dividend
yield
|
1.56%
|
1.15%
|
|
Expected stock
price volatility
|
50%
|
50%
|
|
Weighted-average
risk-free interest rate
|
2.45%
|
2.75%
|
|
Weighted-average
expected life of options (in years)
|
5.75
|
5.50
|
F-18
The
following is a summary of restricted stock units issued during the
year ended December 31, 2019 and 2018:
|
|
Number of Options
Outstanding
|
Weighted
Average
Fair
Value
|
Aggregate Intrinsic
Value
|
|
Balance at December
31, 2017
|
65,165
|
$6.66
|
$1,131,703
|
|
Units
granted
|
9,000
|
17.43
|
156,850
|
|
Units
vested/issued
|
(34,996)
|
7.28
|
850,984
|
|
Units
forfeited
|
(2,500)
|
5.80
|
43,329
|
|
Balance at December
31, 2018
|
36,669
|
$8.76
|
$257,987
|
|
Units
granted
|
46,000
|
11.57
|
532,220
|
|
Units
vested/issued
|
(33,003)
|
8.62
|
400,700
|
|
Units
forfeited
|
(1,667)
|
8.85
|
14,753
|
|
Balance at December
31, 2019
|
47,999
|
$11.55
|
$554,388
|
As of
December 31, 2019, there was $262,000 of unrecognized compensation
cost related to our unvested restricted stock units, which will be
recognized through 2021. All restricted stock units have been
registered with the SEC.
During
the year ended December 31, 2019 and 2018, we recorded compensation
expense of $523,000 and $629,000, respectively, related to stock
options and restricted stock units.
Note 9: Leases
As
described further in "Note 2. Summary of Significant Accounting
Policies", we adopted Topic 842 as of January 1, 2019. Prior period
amounts have not been adjusted and continue to be reported in
accordance with our historic accounting under Topic
840.
Generally, our
leasing activity consists of office leases. As of January 1, 2019,
we had three existing leases for office space. In October 2015, we
signed a three-year lease extension for our former 16,059
square-foot corporate headquarters in Morrisville, NC. This lease
expired on October 31, 2019 and as of January 1, 2019, we had
remaining minimum lease payments of $135,000. A ROU asset and
corresponding lease liability was recorded for this amount on
January 1, 2019.
In
March 2019, we signed a new lease to move our corporate
headquarters to Raleigh, North Carolina. As we continue our
transition from a services-based company to a cloud-based platform
company, the new lease affords us the ability to separate our
warehouse from our corporate office. The new lease, which has a
lease commencement date of October 2, 2019, is for 9,766 square
feet and expires December 31, 2027. Minimum lease payments are
$2,997,000, not including a tenant improvement allowance of
$488,000, which is included in fixed assets as of December 31,
2019. We recognized a ROU asset and corresponding lease liability
of $2,596,000, which represents the present value of minimum lease
payments discounted at 3.77%, the Company’s incremental
borrowing rate at lease inception.
Additionally, we
have an office in Salt Lake City, Utah, which is on a short-term
lease that is less than twelve months. As a result, we have elected
the short-term lease recognition exemption for our Utah office
lease, which means, for those leases that qualify, we will not
recognize ROU assets or lease liabilities.
In
connection with the Company’s acquisition of VWP (See Note
4), the Company assumed two short term leases in New York City, NY
and entered into a three-year office lease in Florida. We have
elected the short term lease exemption for the two New York leases.
For the Florida lease, which was signed on January 4, 2019, we
recognized a ROU asset and corresponding lease liability of
$125,000, which represents the present value of minimum lease
payments discounted at 4.25%, the Company’s incremental
borrowing rate at lease inception.
F-19
Lease
liabilities totaled $2,693,000 as of December 31, 2019. The current
portion of this liability of $384,000 is included in accrued
expenses on the Consolidated balance sheets and the long-term
portion of $2,309,000 is included in Lease liabilities on the
Consolidated Balance Sheets. Rent expense consists of both
operating lease expense from amortization of our ROU assets as well
as variable lease expense which consists of non-lease components of
office leases (i.e. common area maintenance) or rent expense
associated with short term leases. The components of lease expense
were as follows (in 000’s):
|
|
Year
ended
December
31,
2019
|
Year
ended
December
31,
2018
|
|
Lease expense
|
|
|
|
Operating lease
expense
|
$241
|
$118
|
|
Variable lease
expense
|
133
|
137
|
|
Rent
expense
|
$374
|
$255
|
The
weighted-average remaining non-cancelable lease term for our
operating leases was 5.0 years as of December 31, 2019. As of
December 31, 2019, the weighted-average discount rate used to
determine the lease liability was 3.8%. The future minimum lease
payments to be made under noncancelable operating leases at
December 31, 2019, are as follows (in 000’s):
|
Year
Ended December 31:
|
|
|
2020
|
$383
|
|
2021
|
394
|
|
2022
|
359
|
|
2023
|
369
|
|
2024
|
379
|
|
Thereafter
|
1,201
|
|
Total lease
payments
|
$3,085
|
|
Present value
adjustment
|
(392)
|
|
Lease
liability
|
2,693
|
We have
performed an evaluation of our other contracts with customers and
suppliers in accordance with Topic 842 and have determined that,
except for the leases described above, none of our contracts
contain a lease.
Note 10: Commitments and Contingencies
From
time to time, the Company may be involved in litigation that arises
through the normal course of business. The Company is neither a
party to any litigation nor are we aware of any such threatened or
pending litigation that might result in a material adverse effect
to our business.
Note 11: Revenues
We
consider ourselves to be in a single reportable segment under the
authoritative guidance for segment reporting, specifically a
shareholder communications and compliance company for publicly
traded and private companies. Revenue is attributed to a particular
geographic region based on where subscriptions are sold or the
services are performed. The following tables present revenue
disaggregated by revenue stream and geography in
(000’s):
F-20
For the
years ended December 31, 2019 and 2018, we generated revenues from
the following revenue streams as a percentage of total revenue (in
000’s):
|
|
Year
Ended
December 31,
2019
|
Year
Ended
December 31,
2018
|
||
|
|
Amount
|
Percentage
|
Amount
|
Percentage
|
|
Revenue Streams
|
|
|
|
|
|
Platform and
Technology
|
$10,696
|
65.6%
|
$8,593
|
60.4%
|
|
Services
|
5,599
|
34.4%
|
5,639
|
39.6%
|
|
Total
|
$16,295
|
100.0%
|
$14,232
|
100.0%
|
|
|
Year
Ended
December
31
|
|
|
|
2019
|
2018
|
|
Geographic region
|
|
|
|
North
America
|
$15,796
|
$13,488
|
|
Europe
|
499
|
744
|
|
Total
revenues
|
$16,295
|
$14,232
|
We did
not have any customers during the years ended December 31, 2019 or
2018 that accounted for more than 10% of our revenue. There were no
customers representing more than 10% of our total accounts
receivable as of December 31, 2019. We had one customer that
comprised approximately 12% of our total accounts receivable
balance at December 31, 2018.
Note 12: Income Taxes
The
provision for income taxes consisted of the following components
for the years ended December 31 (in 000’s):
|
|
2019
|
2018
|
|
Current:
|
|
|
|
Federal
|
$522
|
$499
|
|
State
|
94
|
145
|
|
Foreign
|
21
|
73
|
|
Total
Current
|
637
|
717
|
|
Deferred:
|
|
|
|
Federal
|
(434)
|
(259)
|
|
State
|
(55)
|
(59)
|
|
Foreign
|
(39)
|
(26)
|
|
Total
Deferred
|
(528)
|
(344)
|
|
Total expense for
income taxes
|
$109
|
$373
|
Reconciliation
between the statutory rate and the effective tax rate is as follows
at December 31 (in 000's, except percentages):
|
|
2019
|
2018
|
||
|
|
Amount
|
Percentage
|
Amount
|
Percentage
|
|
Federal statutory
tax rate
|
$165
|
21.0%
|
$254
|
21.0%
|
|
State tax
rate
|
12
|
1.5%
|
55
|
4.6%
|
|
Permanent
difference – stock-based compensation
|
(13)
|
(1.6)%
|
(2)
|
(0.1)%
|
|
Permanent
difference – other
|
8
|
0.9%
|
4
|
0.1%
|
|
Provision to
return
|
(37)
|
(4.5)%
|
96
|
7.9%
|
|
Tax on foreign
earnings – tax reform
|
24
|
2.9%
|
41
|
3.5%
|
|
Foreign rate
differential
|
(11)
|
(1.3)%
|
2
|
0.1%
|
|
Research and
development credit
|
(39)
|
(4.7)%
|
(77)
|
(6.3)%
|
|
Total
|
$109
|
14.2%
|
$373
|
30.8%
|
F-21
The
effective income tax rate for 2019 was favorably impacted by the
research and development tax credit, foreign tax credits as well as
a benefit related to the exercise of stock based
compensation.
Components of net
deferred income tax assets, including a valuation allowance, are as
follows at December 31 (in 000's):
|
|
2019
|
2018
|
Change
|
|
Assets:
|
|
|
|
|
Net operating
loss
|
$—
|
$25
|
$(25)
|
|
Deferred
revenue
|
379
|
256
|
123
|
|
Allowance for
doubtful accounts
|
149
|
109
|
40
|
|
Stock
options
|
156
|
116
|
40
|
|
Basis difference in
intangible assets
|
—
|
16
|
(16)
|
|
Transaction
costs
|
49
|
—
|
49
|
|
Other
|
39
|
—
|
39
|
|
Foreign tax credits
carryforward
|
—
|
1,181
|
(1,181)
|
|
Total deferred tax
asset
|
772
|
1,703
|
(931)
|
|
Less: Valuation
allowance
|
—
|
(1,181)
|
1,181
|
|
Total net deferred
tax asset
|
772
|
522
|
250
|
|
|
|
|
|
|
Liabilities
|
|
|
|
|
Prepaid
expenses
|
(23)
|
(11)
|
(12)
|
|
Basis difference in
fixed assets
|
(14)
|
—
|
(14)
|
|
Capitalized
software
|
(94)
|
(285)
|
191
|
|
Purchase of
intangibles
|
(522)
|
(630)
|
108
|
|
Other
|
(4)
|
(9)
|
5
|
|
Total deferred tax
liability
|
(657)
|
(935)
|
278
|
|
|
|
|
|
|
Total net deferred
tax asset / (liability)
|
$115
|
$(413)
|
$528
|
A
valuation allowance of $0 and $1,181,000 was recorded against its
deferred tax asset balance as of December 31, 2019, and December
31, 2018, respectively. During the current year, the Company
determined that its foreign tax credit carryforward had expired and
therefore, released both the credit and associated valuation
allowance, with no impact to the tax rate or tax
expense.
As of
each reporting date, the Company’s management considers new
evidence, both positive and negative, that could impact
management’s view with regard to future realization of
deferred tax assets. In assessing the recovery of the deferred tax
assets, management considers whether it is more likely than not
that some portion or all of the deferred tax assets will not be
realized. The ultimate realization of deferred tax assets is
dependent upon the generation of future taxable income in the
periods in which those temporary differences become deductible.
Management considers the scheduled reversals of future deferred tax
assets, projected future taxable income, and tax planning
strategies in making this assessment. It has been determined that
it is more likely than not that the Company's deferred tax assets
are able to be realized based on future positive earnings and
reversal of existing temporary differences.
The
Company had no unrecognized tax benefits as of December 31, 2019 or
December 31, 2018. Interest and, if applicable, penalties are
recognized related to unrecognized tax benefits in income tax
expense. There are no accruals for interest and penalties at
December 31, 2019.
Undistributed
earnings of the Company are insignificant as of December 31, 2019.
With the enactment of the Tax Cuts and Jobs Act of 2017, the
Company does not consider any of its foreign earnings as
indefinitely reinvested.
The
Company is subject to income taxation by both federal and state
taxing authorities. Income tax returns for the years ended December
31, 2018, 2017 and 2016 are open to audit by federal and state
taxing authorities.
F-22
Note 13: Employee Benefit Plans
The
Company sponsors a defined contribution 401(k) Profit Sharing Plan
and allows all employees in the United States to participate.
Matching and profit sharing contributions to the plan are at the
discretion of management, but are limited to the amount deductible
for federal income tax purposes. The Company made contributions to
the plan of $27,000 and $25,000 during the years ended December 31,
2019 and 2018, respectively.
The
Company also sponsors a defined contribution plan which covers
substantially all employees in the United Kingdom. Employer
contributions to the plan are at the discretion of management. The
Company's contribution expense for discretionary contributions were
$2,000 and $4,000 for the year ended December 31, 2019 and 2018,
respectively.
F-23