Attached files
| file | filename |
|---|---|
| 8-K - FORM 8-K - ASSOCIATED BANC-CORP | form8-kcoverpage1q20in.htm |
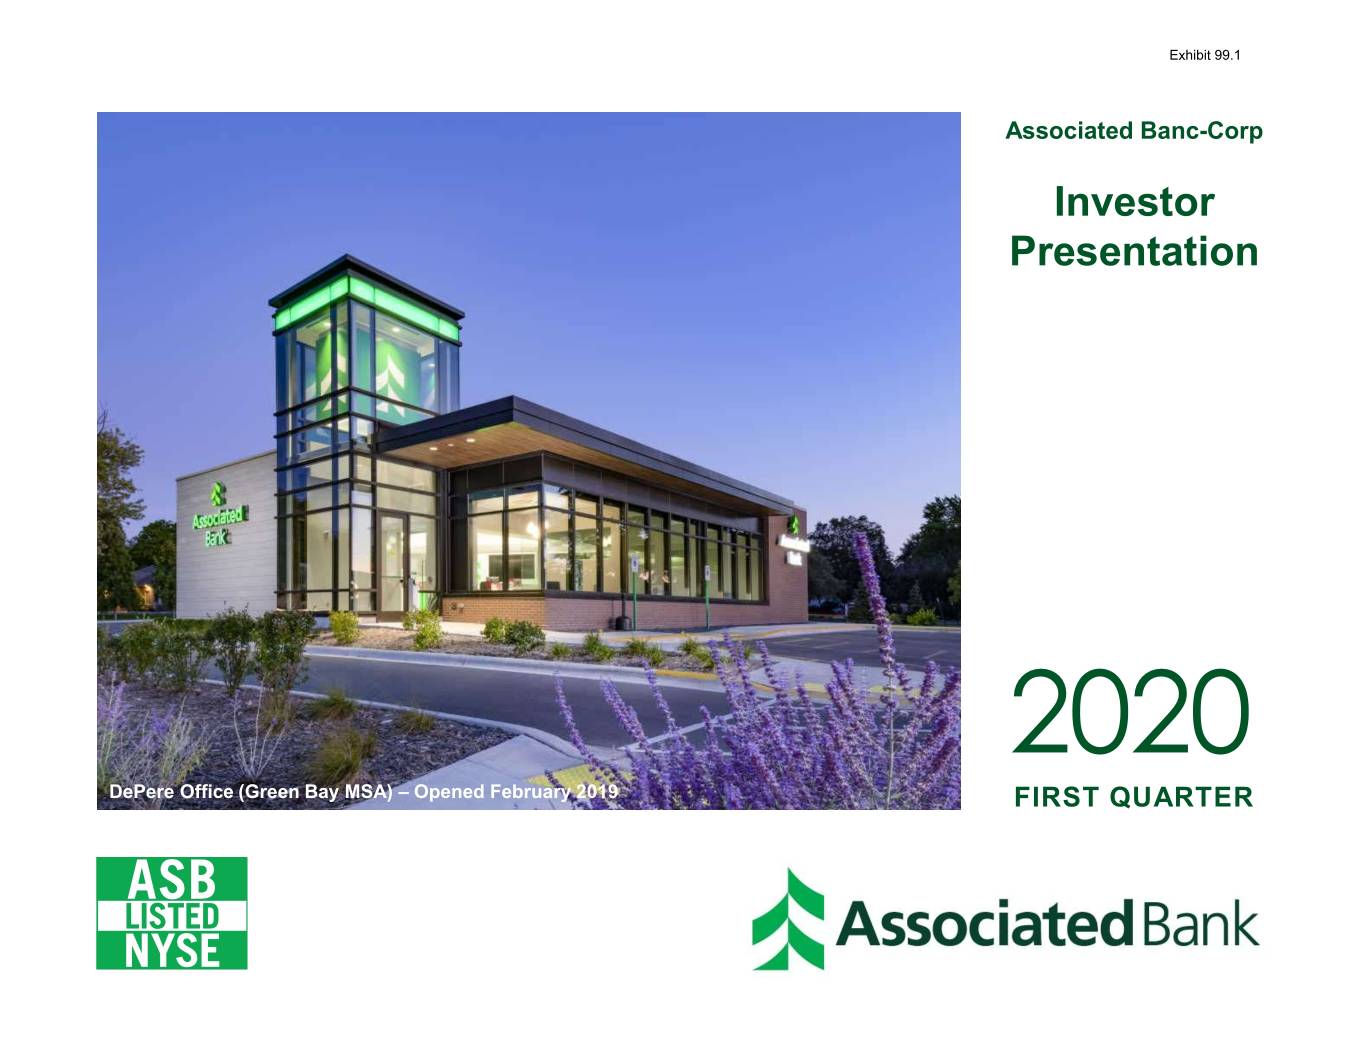
Exhibit 99.1 Associated Banc-Corp Investor Presentation 2020 DePere Office (Green Bay MSA) – Opened February 2019 FIRST QUARTER

FORWARD-LOOKING STATEMENTS Important note regarding forward-looking statements: Statements made in this presentation which are not purely historical are forward-looking statements, as defined in the Private Securities Litigation Reform Act of 1995. This includes any statements regarding management’s plans, objectives, or goals for future operations, products or services, and forecasts of its revenues, earnings, or other measures of performance. Such forward-looking statements may be identified by the use of words such as “believe,” “expect,” “anticipate,” “plan,” “estimate,” “should,” “will,” “intend,” "target," “outlook” or similar expressions. Forward-looking statements are based on current management expectations and, by their nature, are subject to risks and uncertainties. Actual results may differ materially from those contained in the forward-looking statements. These forward-looking statements include: management plans relating to the proposed acquisition of First Staunton Bancshares, Inc. (“proposed transaction”); the expected timing of the completion of the proposed transaction; the ability to complete the proposed transaction; the ability to obtain any required regulatory approvals; any statements of the plans and objectives of management for future operations, products or services; any statements of expectation or belief; projections related to certain financial results or other benefits of the proposed transaction; and any statements of assumptions underlying any of the foregoing. Factors which may cause actual results to differ materially from those contained in such forward-looking statements include those identified in the Company’s most recent Form 10-K and subsequent SEC filings, and such factors are incorporated herein by reference. Additional factors which may cause actual results of the proposed transaction to differ materially from those contained in forward-looking statements are the possibility that expected benefits of the proposed transaction may not materialize in the timeframe expected or at all, or may be more costly to achieve; the proposed transaction may not be timely completed, if at all; that required regulatory approvals are not obtained or other customary closing conditions are not satisfied in a timely manner or at all; reputational risks and the reaction of shareholders, customers, employees or other constituents to the proposed transaction; and diversion of management time on acquisition-related matters. Trademarks: All trademarks, service marks, and trade names referenced in this material are official trademarks and the property of their respective owners. Presentation: Within the charts and tables presented, certain segments, columns and rows may not sum to totals shown due to rounding. 1
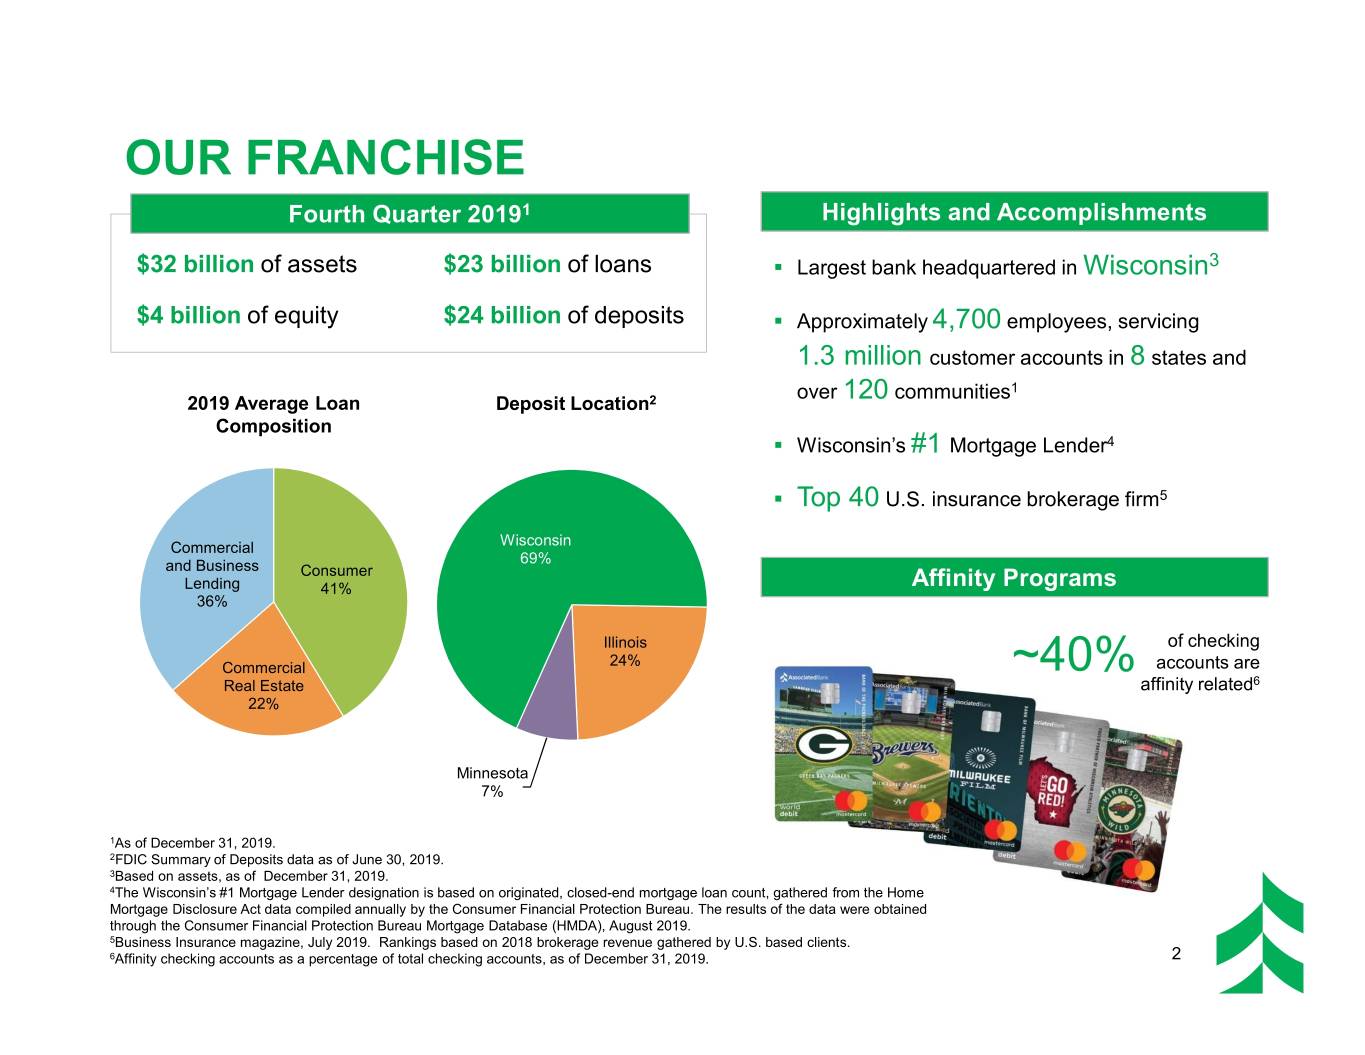
OUR FRANCHISE Fourth Quarter 20191 Highlights and Accomplishments $32 billion of assets $23 billion of loans . Largest bank headquartered in Wisconsin3 $4 billion of equity $24 billion of deposits . Approximately 4,700 employees, servicing 1.3 million customer accounts in 8 states and over 120 communities1 2019 Average Loan Deposit Location2 Composition . Wisconsin’s #1 Mortgage Lender4 . Top 40 U.S. insurance brokerage firm5 Commercial Wisconsin 69% and Business Consumer Lending 41% Affinity Programs 36% Illinois of checking Commercial 24% ~40% accounts are Real Estate affinity related6 22% Minnesota 7% 1As of December 31, 2019. 2FDIC Summary of Deposits data as of June 30, 2019. 3Based on assets, as of December 31, 2019. 4The Wisconsin’s #1 Mortgage Lender designation is based on originated, closed-end mortgage loan count, gathered from the Home Mortgage Disclosure Act data compiled annually by the Consumer Financial Protection Bureau. The results of the data were obtained through the Consumer Financial Protection Bureau Mortgage Database (HMDA), August 2019. 5Business Insurance magazine, July 2019. Rankings based on 2018 brokerage revenue gathered by U.S. based clients. 6Affinity checking accounts as a percentage of total checking accounts, as of December 31, 2019. 2
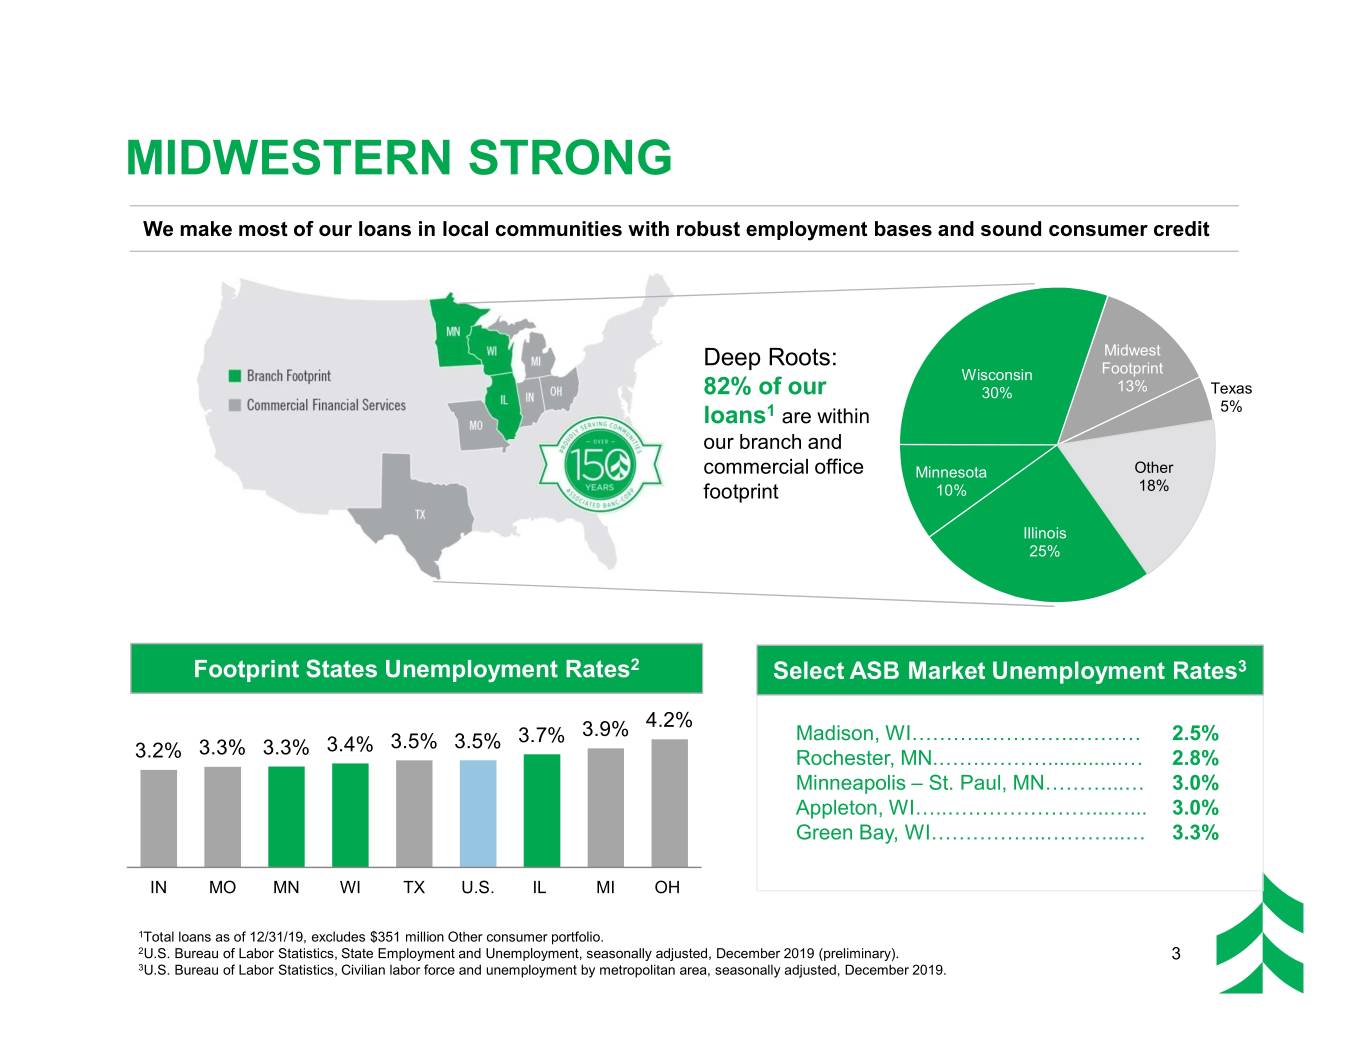
MIDWESTERN STRONG We make most of our loans in local communities with robust employment bases and sound consumer credit Deep Roots: Midwest Wisconsin Footprint 82% of our 30% 13% Texas loans1 are within 5% our branch and commercial office Minnesota Other footprint 10% 18% Illinois 25% Footprint States Unemployment Rates2 Select ASB Market Unemployment Rates3 4.2% 3.7% 3.9% Madison, WI………..…………..……… 2.5% 3.3% 3.3% 3.4% 3.5% 3.5% 3.2% Rochester, MN.…….……….............… 2.8% Minneapolis – St. Paul, MN………...… 3.0% Appleton, WI…..…………………...…... 3.0% Green Bay, WI……………..………...… 3.3% IN MO MN WI TX U.S. IL MI OH 1Total loans as of 12/31/19, excludes $351 million Other consumer portfolio. 2U.S. Bureau of Labor Statistics, State Employment and Unemployment, seasonally adjusted, December 2019 (preliminary). 3 3U.S. Bureau of Labor Statistics, Civilian labor force and unemployment by metropolitan area, seasonally adjusted, December 2019.
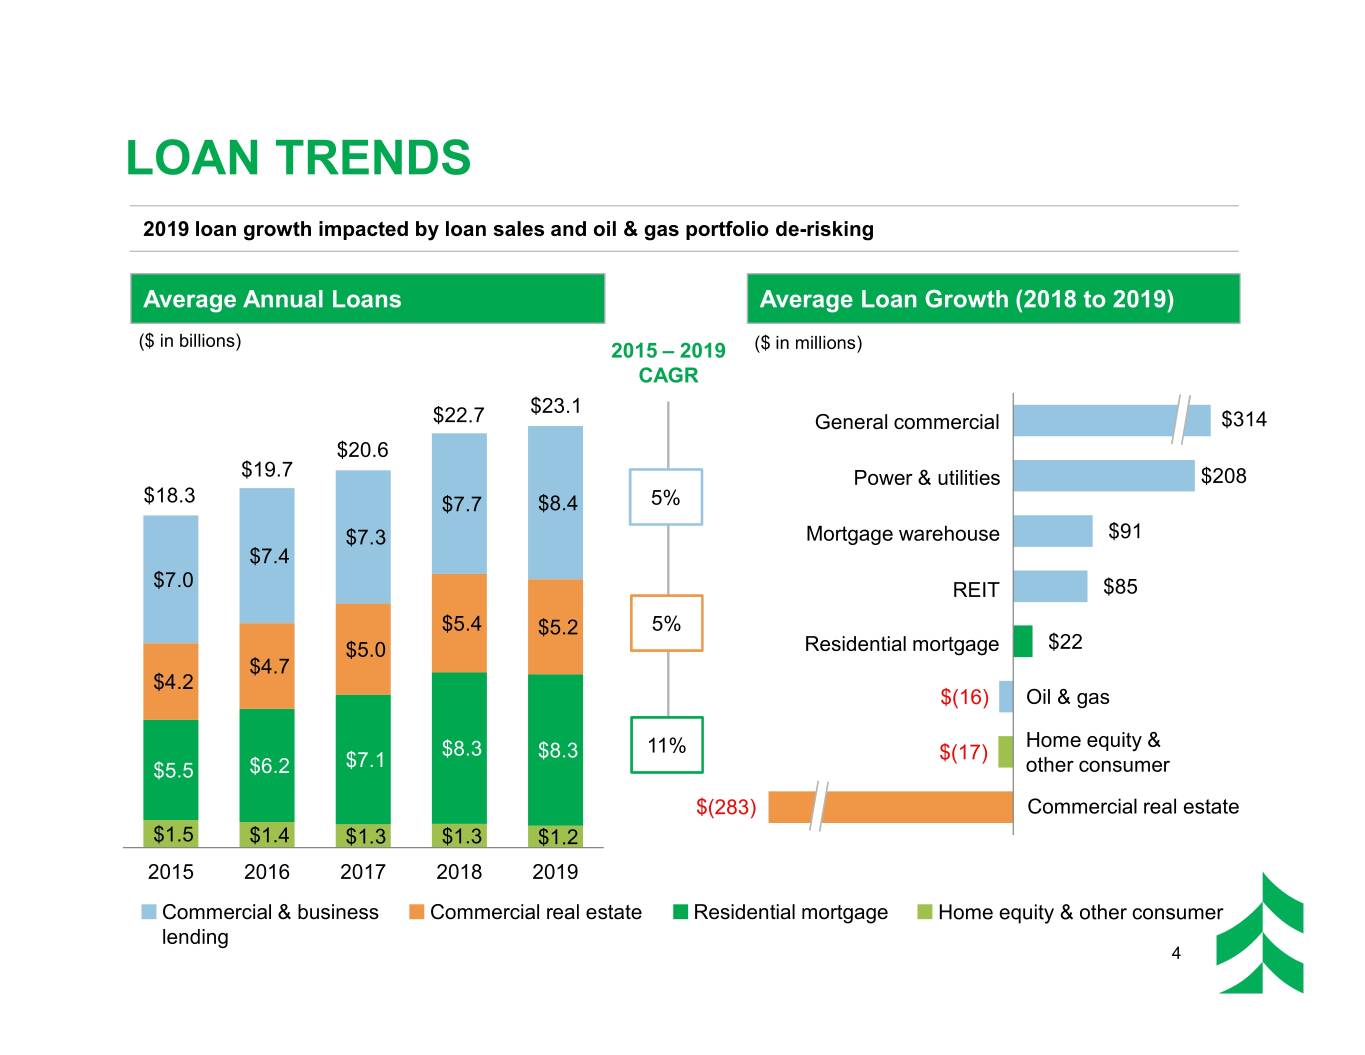
LOAN TRENDS 2019 loan growth impacted by loan sales and oil & gas portfolio de-risking Average Annual Loans Average Loan Growth (2018 to 2019) ($ in billions) 2015 – 2019 ($ in millions) CAGR $23.1 $22.7 General commercial $314 $20.6 $19.7 Power & utilities $208 $18.3 $7.7 $8.4 5% $7.3 Mortgage warehouse $91 $7.4 $7.0 REIT $85 $5.4 $5.2 5% $5.0 Residential mortgage $22 $4.7 $4.2 $(16) Oil & gas $8.3 11% Home equity & $7.1 $8.3 $(17) $5.5 $6.2 other consumer $(283) Commercial real estate $1.5 $1.4 $1.3 $1.3 $1.2 2015 2016 2017 2018 2019 Commercial & business Commercial real estate Residential mortgage Home equity & other consumer lending 4

COMMERCIAL LOAN MANAGEMENT1 We de-risked our oil & gas portfolio while growing power & utilities; commercial real estate rebounded Oil & Gas Loans Power & Utilities Loans Commercial Real Estate ($ in billions) ($ in billions) ($ in billions) $1.5 $0.8 $1.4 $1.4 $1.3 $1.3 $7.0 $7.1 $7.2 $0.7 $0.7 $0.7 $1.2 $6.9 $6.7 $6.7 $0.6 $0.5 $5.3 $5.1 $5.1 $5.2 $5.2 $5.2 3Q18 4Q18 1Q19 2Q19 3Q19 4Q19 3Q18 4Q18 1Q19 2Q19 3Q19 4Q19 3Q18 4Q18 1Q19 2Q19 3Q19 4Q19 CRE unfunded commitments CRE total outstanding balance 1All values as of period end. 5

DEPOSIT PORTFOLIO TRENDS The Huntington branch acquisition and balance sheet repositioning drove increase in low-cost deposit mix Average Annual Deposits Year End Low-cost Deposit Mix ($ in billions) 2015 – 2019 56% 50% 51% CAGR 46% 49% $24.7 $24.1 23% 25% 24% 23% $21.9 26% $21.0 $5.2 4% $19.9 $5.2 21% 19% 20% 14% 17% $5.0 $5.1 6% 7% 7% 8% 12% $4.5 $4.8 $5.1 14% 2015 2016 2017 2018 2019 $4.0 $3.0 $3.4 Year End Network Transaction Deposit Mix $1.9 $2.4 16% $1.3 $1.4 $1.5 18% 15% $7.3 $7.0 $6.4 $6.0 $6.3 11% 9% $1.6 $2.0 6% $1.6 $2.8 $3.1 $3.5 $3.0 $3.1 $2.1 $1.9 2015 2016 2017 2018 2019 2015 2016 2017 2018 2019 Noninterest-bearing demand Savings Time deposits Interest-bearing demand Money market Network transaction deposits 6

INVESTMENT SECURITIES PORTFOLIO TRENDS Investment portfolio balances expected to level off in 1Q20 and remain at ~17% of assets through 2020 Portfolio1 and Yield Trends (Quarterly) Investments / Total Assets2 ($ in billions) 3.73% 3.74% 3.77% 3.78% 3.79% 22% 21% 20% 20% 2.29% 2.34% 2.36% 2.33% 2.32% 17% $6.8 $6.8 $6.5 $6.0 4Q 2015 4Q 2016 4Q 2017 4Q 2018 4Q 2019 $1.7 $1.8 $5.6 $1.9 $1.9 Portfolio Fair Value Composition2 $1.9 Agency Agency CMBS MBS $5.1 $5.0 32% $4.5 7% $4.0 $3.6 ABS Municipals 5% 37% Agency CMOs Other 4Q 2018 1Q 2019 2Q 2019 3Q 2019 4Q 2019 20% <1% Tax-exempt securities Taxable securities 1Average balances. 7 2Period-end balances.

NET INTEREST INCOME AND YIELDS — QUARTERLY TRENDS Lower deposit costs have helped stabilize net interest margin Net Interest Income and Net Interest Margin Average Yields ($ in millions) 5.51% 3.02% 5.19% 5.19% 2.90% 2.88% 4.92% 2.83% 2.81% 4.55% 4.78% 4.86% 4.79% 4.49% $224 3.52% 3.54% 3.47% 4.13% $216 $214 3.29% $206 3.27% $200 2.86% 2.70% 2.78% 2.82% 2.83% 1.54% 1.39% 1.51% 1.44% 1.23% 1.30% 1.35% 1.14% 1.23% 0.98% 4Q 2018 1Q 2019 2Q 2019 3Q 2019 4Q 2019 4Q 2018 1Q 2019 2Q 2019 3Q 2019 4Q 2019 Net interest income Commercial real estate loans Investments and other Net interest margin Commercial and business Total interest-bearing lending loans liabilities Total residential mortgage Total interest- loans bearing deposits 8
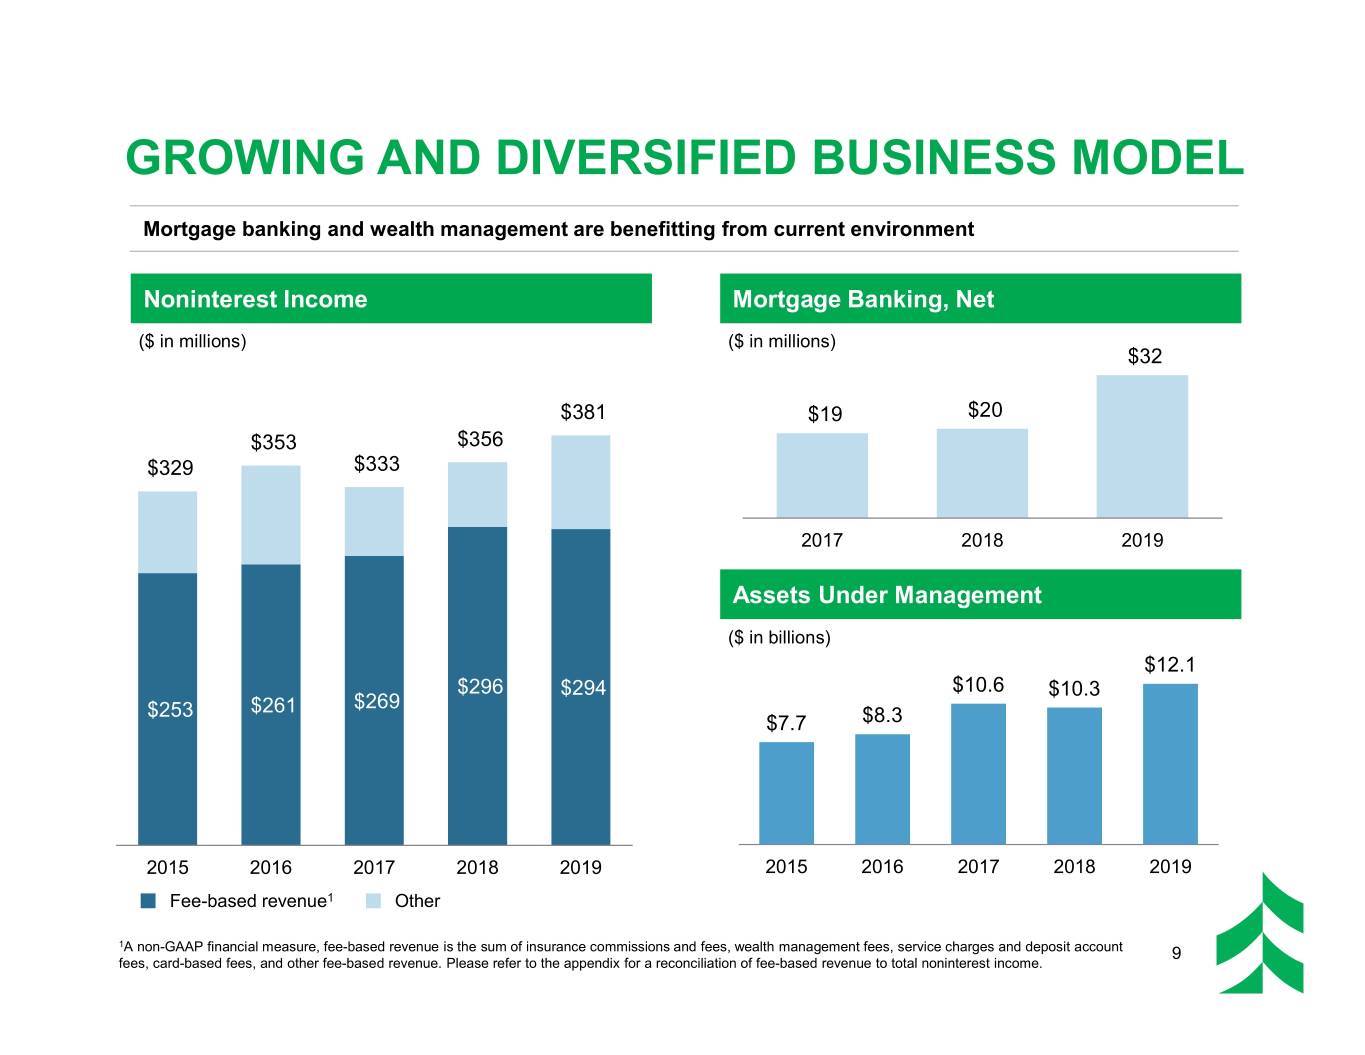
GROWING AND DIVERSIFIED BUSINESS MODEL Mortgage banking and wealth management are benefitting from current environment Noninterest Income Mortgage Banking, Net ($ in millions) ($ in millions) $32 $381 $19 $20 $353 $356 $329 $333 2017 2018 2019 Assets Under Management ($ in billions) $12.1 $296 $294 $10.6 $10.3 $253 $261 $269 $7.7 $8.3 2015 2016 2017 2018 2019 2015 2016 2017 2018 2019 Fee-based revenue1 Other 1 A non-GAAP financial measure, fee-based revenue is the sum of insurance commissions and fees, wealth management fees, service charges and deposit account 9 fees, card-based fees, and other fee-based revenue. Please refer to the appendix for a reconciliation of fee-based revenue to total noninterest income.

NONINTEREST EXPENSE – ANNUAL TRENDS We continue to control our overall costs while increasing technology spending Noninterest Expense Technology and Equipment Expense ($ in millions) ($ in millions) $106 $822 $96 $794 $84 $29 $7 $698 $703 $709 2017 2018 2019 $2 $5 Noninterest Expense / Average Assets $2 $5 $2 2.49% 2.41% 2.40% $481 $482 $414 $420 $427 2.40% 2.40% 2.37% 2015 2016 2017 2018 2019 2017 2018 2019 Adjusted personnel expense1 Other Adjusted noninterest Noninterest expense / Severance Acquisition related costs expense2 / average assets average assets 1A non-GAAP financial measure, adjusted personnel expense excludes restructuring related costs. Please refer to the appendix for a reconciliation of personnel expense to adjusted personnel expense. 2A non-GAAP financial measure, adjusted noninterest expense excludes acquisition and restructuring related costs. Please refer to the appendix for a reconciliation 10 of noninterest expense to adjusted noninterest expense.
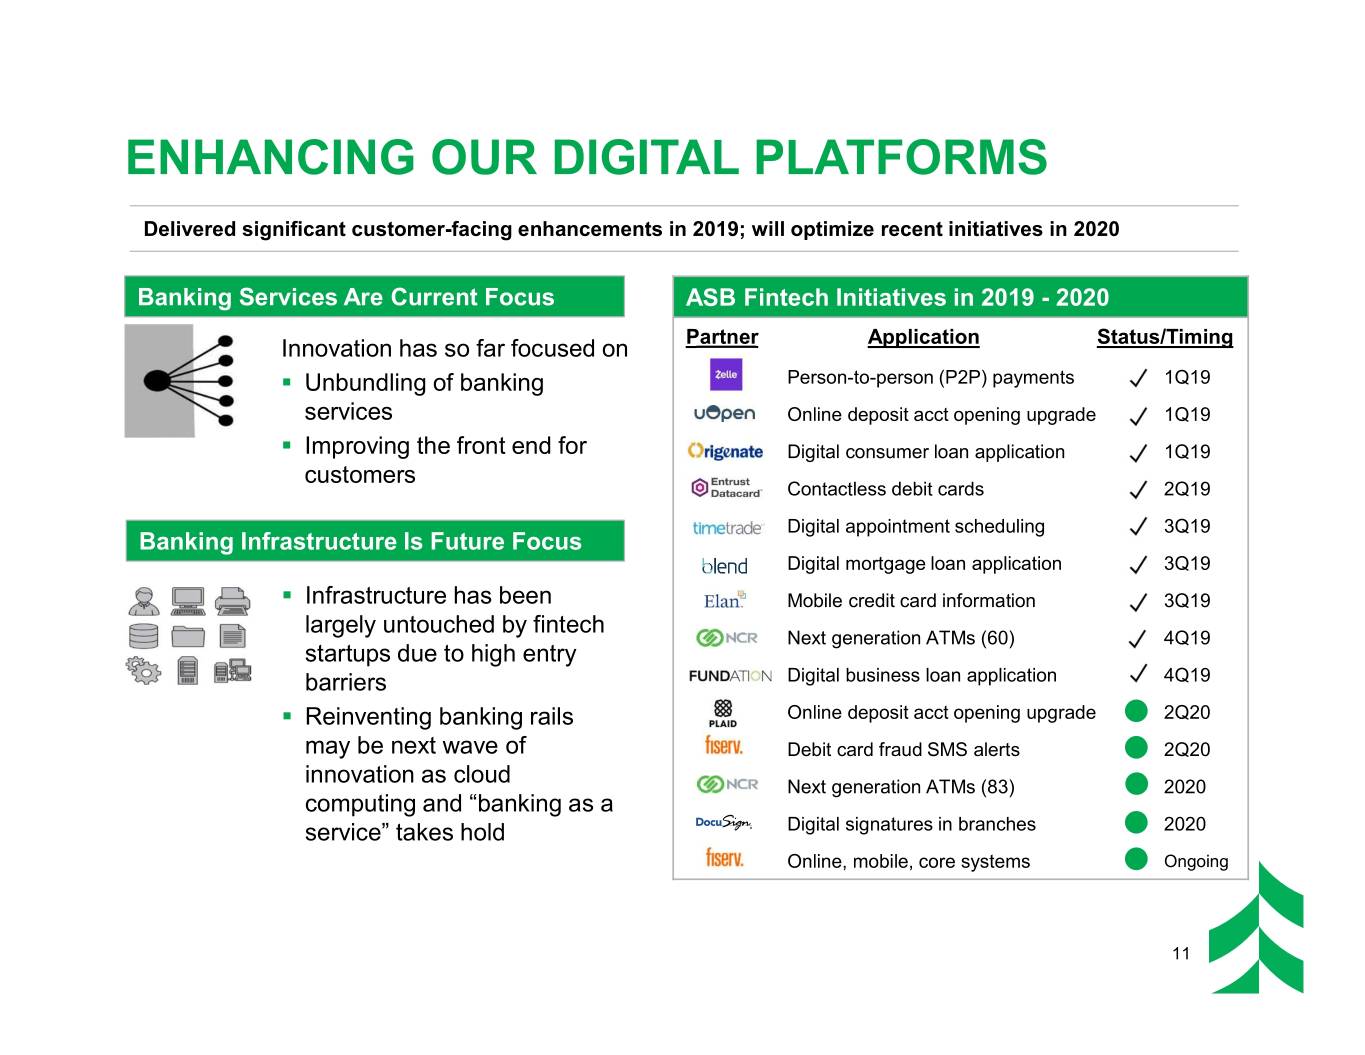
ENHANCING OUR DIGITAL PLATFORMS Delivered significant customer-facing enhancements in 2019; will optimize recent initiatives in 2020 Banking Services Are Current Focus ASB Fintech Initiatives in 2019 - 2020 Innovation has so far focused on Partner Application Status/Timing . Unbundling of banking Person-to-person (P2P) payments 1Q19 services Online deposit acct opening upgrade 1Q19 . Improving the front end for Digital consumer loan application 1Q19 customers Contactless debit cards 2Q19 Digital appointment scheduling 3Q19 Banking Infrastructure Is Future Focus Digital mortgage loan application 3Q19 . Infrastructure has been Mobile credit card information 3Q19 largely untouched by fintech Next generation ATMs (60) 4Q19 startups due to high entry barriers Digital business loan application 4Q19 . Reinventing banking rails Online deposit acct opening upgrade 2Q20 may be next wave of Debit card fraud SMS alerts 2Q20 innovation as cloud Next generation ATMs (83) 2020 computing and “banking as a service” takes hold Digital signatures in branches 2020 Online, mobile, core systems Ongoing 11

CAPITAL PRIORITIES Committed to a consistent capital management philosophy2 with rigorous capital discipline Annual $22.7 $23.1 Average Loans $20.6 Funding $19.7 ($ in billions) 1. Organic Highest Priority $18.3 Growth 2015 2016 2017 2018 2019 14% Annual $0.69 CAGR $0.62 Commitment Dividends $0.50 Paying a $0.41 $0.45 2. Competitive 30%-40% dividend payout Dividend ratio 2015 2016 2017 2018 2019 Opportunistic, . Bank Mutual (45% cost savings) Investing 3. in-market, efficiency . Huntington WI Branch Acq. (45% expected cost savings) Externally driven acquisitions . First Staunton Bancshares1 (35% expected cost savings) Share $259 Disciplined Repurchases $240 $177 Repurchasing maintenance of ($ in millions) 4. 2 $93 Shares TCE ratio $20 $37 >7% 2014 2015 2016 2017 2018 2019 1Expected to close in February 2020. 2The ratio tangible common equity to tangible assets excludes goodwill and other intangible assets, net. The TCE ratio is a non-GAAP financial measure and has been included as it is considered to be a critical metric used to analyze and evaluate financial condition and capital strength. Please refer to the appendix 12 for a reconciliation of non-GAAP financial measures to GAAP financial measures.

CURRENT EXPECTED CREDIT LOSSES (CECL) Our current capital levels and expected earnings should allow us to readily absorb the anticipated CECL impact CECL Adoption in 1Q 2020 Expected CECL Impact in 1Q 2020 . Life-of-loan CECL reserves will be driven by our . $93 million to $106 million increase to ACL1 from portfolio characteristics, risk-grading, economic year-end 2019 levels outlook, and methodology . Net, after-tax, reduction in Tangible Common . Key Reserve Level Increase Factors Equity ratio of 21 bps – 24 bps ‒ Longer tenor of consumer loans drives higher CECL reserve levels By Portfolio2 By Factor3 ‒ Economic uncertainty factor drives increased CRE and commercial & business lending reserve levels Economic ‒ Unfunded commitment reserve uncertainty CRE 57% 24% Consumer 56% Unfunded Loan Portfolio Remaining Maturity reserve 18% Commercial and Business Lending ~4 years CRE ~6 years Accruing TDRs Acqusition Total Consumer ~24 years Commercial and and Other portfolios business lending 15% 10% 20% 1Allowance for Credit Losses. 2By lending portfolio, excluding acquired portfolios. 3Includes acquired portfolios. 13

CREDIT QUALITY – QUARTERLY TRENDS Continued benign credit environment with stable provision outlook for 2020 Potential Problem Loans1 Nonaccrual Loans1 ($ in millions) ($ in millions) $351 $302 $275 $250 $209 $178 $177 $157 $128 $118 2015 2016 2017 2018 2019 2015 2016 2017 2018 2019 Provision for Credit Losses Allowance for Loan Losses to Loans1 ($ in millions) $70 1.47% 1.39% 1.28% $38 1.04% $26 0.88% $16 $0 2015 2016 2017 2018 2019 2015 2016 2017 2018 2019 14 1At period end.

2020 OUTLOOK This outlook reflects our expectation for a stable economy. We may adjust our outlook if, and when, we have more clarity on economic factors. ▪ Annual average loan growth of ▪ Noninterest expense of 2% to 4% $790 million to $795 million, including all First Staunton costs ▪ Maintain loan to deposit ratio Balance Sheet under 100% Expense ▪ Effective tax rate of 19% to 21% Management Management ▪ Full-year 2020 NIM expected to be 2.80% to 2.85% ▪ Noninterest income of ▪ Initial CECL impact expected to $375 million to $385 million be a $70 million to $80 million after-tax charge and a Capital & corresponding 21 bps to 24 bps Fee 1 Credit decrease in the TCE ratio Businesses Management ▪ Continue to follow stated corporate priorities for capital deployment 1The ratio tangible common equity to tangible assets excludes goodwill and other intangible assets, net. The TCE ratio is a non-GAAP financial measure and has been included as it is considered to be a critical metric used to analyze and evaluate financial condition and capital strength. Please refer to the appendix for a reconciliation of non-GAAP financial measures to GAAP financial measures. 15

LINE OF BUSINESS PROFILES

BALANCED BUSINESS SEGMENTS1 Corporate and Community, Consumer, Commercial Specialty and Business . Corporate Banking . Consumer and Business Banking . Commercial Real Estate . Community Markets . Wealth Management and Institutional Services Average Loans and Net Interest Income and Return on Average Deposits Noninterest Income Allocated Capital ($ in billions) ($ in millions) $744 $24.7 21.7% $20.6 $428 14.3% Corporate and Community, Corporate and Community, Corporate and Community, Commercial Consumer, and Commercial Consumer, and Commercial Consumer, and Specialty Business Specialty Business Specialty Business 1For the year ended December 31, 2019. 17

CORPORATE BANKING CORPORATE AND COMMERCIAL SPECIALTY SEGMENT Business Units 2019 Overview Commercial . $14.1 billion in average loans Specialized Corporate Deposits Capital and deposits Lending Lending and Treasury Markets Verticals . 9 offices across 5 states Management . ~270 colleagues Creative, relationship-oriented teams build loyal, Commercial and Business Lending1 long-lasting client relationships Loan Composition by Industry . Corporate Lending serves large and complex customers, Power & including Specialized Industries Utilities 19% . Commercial Deposits and Treasury Management and Capital Markets provide solutions focused on customer Real Estate needs and supported by high-touch, in-market service Manufacturing & 14% Wholesale Trade 21% 2019 Highlights Oil & Gas 7% . Corporate banking average loans grew by 8% and average deposits grew by 4% Finance & Other Insurance . Continued to augment the Treasury Management product 11% 12% offering and focus on developing and enhancing profitable relationships across the group Health Care and Rental and leasing Soc. Assist. services 4% 3% Retail Trade 4% Construction Prof, Scientific, 3% and Tech Svs 3% 18 1Total commercial and business lending loans outstanding as of December 31, 2019.
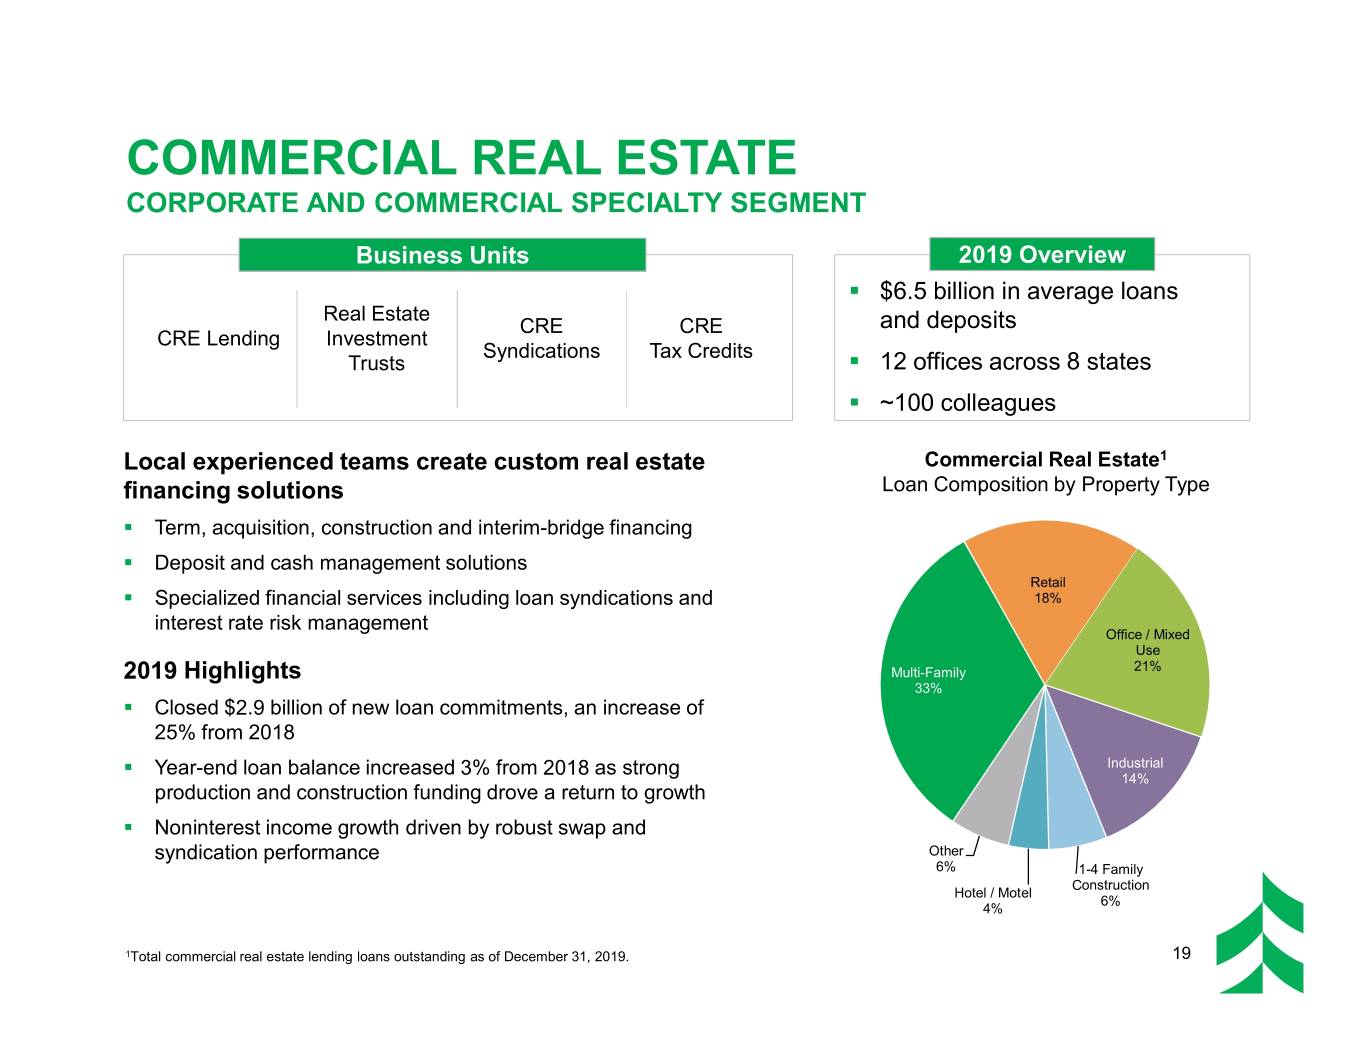
COMMERCIAL REAL ESTATE CORPORATE AND COMMERCIAL SPECIALTY SEGMENT Business Units 2019 Overview . $6.5 billion in average loans Real Estate CRE CRE and deposits CRE Lending Investment Syndications Tax Credits Trusts . 12 offices across 8 states . ~100 colleagues Local experienced teams create custom real estate Commercial Real Estate1 financing solutions Loan Composition by Property Type . Term, acquisition, construction and interim-bridge financing . Deposit and cash management solutions Retail . Specialized financial services including loan syndications and 18% interest rate risk management Office / Mixed Use 2019 Highlights Multi-Family 21% 33% . Closed $2.9 billion of new loan commitments, an increase of 25% from 2018 . Year-end loan balance increased 3% from 2018 as strong Industrial 14% production and construction funding drove a return to growth . Noninterest income growth driven by robust swap and syndication performance Other 6% 1-4 Family Construction Hotel / Motel 6% 4% 1Total commercial real estate lending loans outstanding as of December 31, 2019. 19

CONSUMER AND BUSINESS BANKING COMMUNITY, CONSUMER, AND BUSINESS SEGMENT Business Units Serving Metro Markets 2019 Overview . $17.5 billion in average loans Retail Residential Business and deposits Banking Lending Banking . 175 branches1 . ~1,900 colleagues Full-range services for individuals and small businesses Mobile Deposits . Retail Banking provides best-in-class customer experience across % of total consumer deposits2 branches and digital channels 24% . Residential Lending offers residential mortgages through direct and 23% third party channels and home equity lines through direct channels 19% . Business Banking provides solutions to businesses with $10 million or less in annual revenue 16% 13% 2019 Highlights . Introduced online and mobile mortgage application; 80% of mortgage applicants are now experiencing a quality digital process using Blend 6% ® . Upgraded person-to-person payments to Zelle Instant Payments Launched mobile deposit technology platform and realized a 250% increase in transaction volume over our previous solution 4Q14 4Q15 4Q16 4Q17 4Q18 4Q19 1Includes one branch that offers wealth management services only. 2Based on period end deposits. 20

COMMUNITY MARKETS COMMUNITY, CONSUMER, AND BUSINESS SEGMENT Business Units Serving Midsize Markets 2019 Overview . $4.5 billion in average loans Commercial & Branch Residential Private and deposits Business Banking Lending Banking Banking . 73 branches . ~440 colleagues Localized approach ensures the customer experience is at the forefront of decisions and actions Eau Claire . Virtual community banks with our full suite of financial and risk Northern Wisconsin management solutions in midsize markets Central Wisconsin . Community market presidents are positioned as active community partners and financial leaders . Strategy is intended to build on our strong deposit market share in select midsize markets Rochester . Reduced residential loan officers while maintaining geographical Rockford coverage in all markets La Crosse 2019 Highlights Peoria . Strong mortgage banking income (+57% y/y) drove overall fee Southern Illinois revenue increase of 7% . Average deposits grew 9% 21

WEALTH MGMT AND INSTITUTIONAL SERVICES COMMUNITY, CONSUMER, AND BUSINESS SEGMENT Business Units 2019 Overview Private Banking Personal Trust Asset Management . $2.7 billion in average loans and deposits Retirement Plan Associated Benefits Associated . $12.1 billion AUM Services and Risk Consulting Investment Services . ~780 colleagues Market-based teams are comprised of Fee Revenues1 Assets Under specialists Management2 . Wealth Management Services offers a suite of services tailored to the unique needs $12.1 of high-net-worth and ultra-high-net-worth $10.6 $10.3 clients Insurance $89 $8.3 . Institutional Services works with $7.7 businesses and other entities to provide strategic, customized employee benefits, Wealth management retirement plan services, business insurance $84 and HR solutions Other 2019 Highlights $6 . Average deposit growth of 9% 2015 2016 2017 2018 2019 . Wealth management fees up $1 million from 2018 1Figures in millions, for the year ended December 31, 2019. 2Balances in billions, for the years ended December 31. 22

APPENDIX

FNB STAUNTON TRANSACTION SUMMARY Seller: First Staunton Bancshares Transaction Value: . ~$76 million for franchise Staunton . ~1.30x 1Q 2019 reported tangible book value Alton . ~4% deposit premium Bethalto Consideration: 100% cash Assets Purchased: Edwardsville . Nine branches . ~$350 million of loans Deposits Assumed: . ~$440 million . ~30,000 customer accounts St. Louis Closing and Conversion: . Closing and conversion anticipated in February 2020 Associated Bank Belleville FNB in Staunton Source: S&P Global Market Intelligence 24

ACQUISITIONS Huntington completed… …and Staunton up next Was an in-market, cost takeout Is an in-market, cost takeout driven driven depository acquisition depository acquisition Delivering on Filled in network gaps and boosted Fills in network gaps and boosts our Our Strategy our network in key locations network in key locations Further improved branch density Further improves branch density and scale across Wisconsin and scale in St. Louis market Expanded into 13 new communities Expanding into 7 new communities Enhancing Added over 60,000 deposit accounts Expected to add over 30,000 deposit and 33,000 households accounts and 16,000 loans ASB Franchise Value Acquired ~$730 million of granular ~$440 million of granular branch branch deposits with <1% cost of funds deposits with <1% cost of funds Accretive to efficiency metrics and Accretive to efficiency metrics and EPS outlook EPS outlook Financially Expected 45% cost savings run rate Approximately 35% cost savings Attractive expected on conversion Minimal TBV dilution (~1.5%); Minimal TBV dilution (<1%); $34 million net premium less than 3.5 year TBV earnback expected 25

COMMUNITY, DIVERSITY & SUSTAINABILITY We remain committed to initiatives to improve our communities, promote diversity and enhance sustainability Over $900 million1 in credit $3.6 million1 in grants to support commitments to support wind, CRA programing at various nonprofit hydroelectric and solar projects organizations since 2012 Provided Diversity & Inclusion 67,000 volunteer hours logged, training for all colleagues and with a value of $1.7 million2 specialized unconscious bias and management training to more than 240 leaders1 in 2018 LED lighting yielded nearly $797 million1 in loans helping $700,000 in annual savings2 low- to moderate-income (LMI) and versus 2015 baseline minority families attain home ownership 43% of employees2 participate in 2020 Women on Boards 6 Colleague Resource Groups 2014-2019 | Winning “W” Company acting to address the unique needs of Associated’s diverse workforce 1As of or for the year ended December 31, 2018. 2As of or for the year ended December 31, 2019. 26

LOAN STRATIFICATION OUTSTANDINGS AS OF DECEMBER 31, 2019 C&BL by Geography Total Loans1 CRE by Geography $8.3 billion $5.2 billion Minnesota 6% Illinois Illinois Illinois Minnesota 15% 25% 16% 11% Texas3 Minnesota Wisconsin 9% 10% Other 25% Wisconsin Wisconsin Midwest2 Other 30% 27% 24% Midwest2 Other 11% Midwest2 14% Other 34% Other Other 17% 17% Texas Texas 6% 5% C&BL by Industry Oil and Gas Lending4 CRE by Property Type $8.3 billion $484 million $5.2 billion East Texas Power & Utilities South Texas Retail North 18% 19% & Eagle Louisiana Ford Real Estate Arkansas 13% 14% 14% Office / Mixed Manufacturing & Permian Use Wholesale Trade Multi-Family 26% Rockies 21% 21% Oil & Gas 33% 7% 14% Finance & Insurance 12% Industrial Marcellus 14% Bakken Utica 4% Appalachia 11% Other 1-4 Family Gulf Shallow Mid- 6% Construction 4% 6% 1Excludes $351 million Other consumer portfolio. Other Continent Hotel / Motel 2 (Onshore (primarily 4% Other Midwest includes Missouri, Indiana, Ohio, Michigan and Iowa. 27 3Principally reflects the oil and gas portfolio. Lower 48) OK & KS) 4Chart based on commitments of $741 million. 8% 7%

RECONCILIATION AND DEFINITIONS OF NON-GAAP ITEMS ($ IN MILLIONS) Adjusted Noninterest Expense Reconcilation1 2019 2018 2017 Noninterest expense $794 $822 $709 Acquisition related costs 7 29 - Severance 522 Adjusted noninterest expense $782 $791 $708 Fee-based Revenue1 2019 2018 2017 2016 2015 Insurance commissions and fees $89 $90 $81 $81 $75 Wealth management fees 83 83 70 63 64 Service charges and deposit account fees 63 66 64 67 65 Card-based fees 40 40 35 34 29 Other fee-based revenue 19 18 18 17 19 Fee-basedrevenue $294 $296 $269 $261 $253 Other 8660649276 Total noninterest income $381 $356 $333 $353 $329 Adjusted Personnel Expense Reconciliation1 2019 2018 2017 2016 2015 Personnel expense $487 $483 $429 $425 $416 Severance 52252 Adjusted personnel expense $482 $481 $427 $420 $414 1This is a non-GAAP financial measure. Management believes these measures are meaningful because they reflect adjustments commonly made by management, investors, regulators, and analysts to evaluate the adequacy of earnings per common share, provide greater understanding of ongoing operations and enhance comparability of results with prior periods. 28
