Attached files
| file | filename |
|---|---|
| EX-99.1 - EXHIBIT 99.1 - COLUMBUS MCKINNON CORP | exhibit99102042020.htm |
| 8-K - 8-K - COLUMBUS MCKINNON CORP | a8k02042020.htm |

February 4, Q3 FISCAL YEAR 2020 2020 FINANCIAL RESULTS CONFERENCE CALL Richard H. Fleming Chairman & Interim Chief Executive Officer Gregory P. Rustowicz Vice President – Finance & Chief Financial Officer PARTNERS IN MOTION CONTROL

SAFE HARBOR STATEMENT These slides, and the accompanying oral discussion, contain “forward-looking statements” within the meaning of the Private Securities Litigation Reform Act of 1995. Such statements include, but are not limited to, statements concerning future sales and earnings, involve known and unknown risks, uncertainties and other factors that could cause the actual results of the Company to differ materially from the results expressed or implied by such statements, including the effectiveness of the Company’s 80/20 Process to simplify operations, the ability of the Company’s operational excellence initiatives to drive profitability, the success of the Company’s efforts to ramp its growth engine, global economic and business conditions, conditions affecting the industries served by the Company and its subsidiaries, conditions affecting the Company's customers and suppliers, competitor responses to the Company's products and services, the overall market acceptance of such products and services, the ability to expand into new markets and geographic regions, and other factors disclosed in the Company's periodic reports filed with the Securities and Exchange Commission. The Company assumes no obligation to update the forward- looking information contained in this presentation. Non-GAAP Financial Measures This presentation will discuss some non-GAAP (“adjusted”) financial measures which we believe are useful in evaluating our performance. You should not consider the presentation of this additional information in isolation or as a substitute for results compared in accordance with GAAP. The non-GAAP (“adjusted”) measures are notated and we have provided reconciliations of comparable GAAP to non-GAAP measures in tables found in the Supplemental Information portion of this presentation. Adoption of ASU No. 2017-07 and impact to historical information In accordance with the ASU, historical cost of good sold and RSG&A have been adjusted for the adoption and implementation on a retrospective basis of ASU No. 2017-07 “Improving the Presentation of Net Periodic Pension Cost and Net Periodic Postretirement Benefit Cost. All relevant financial data impacted by the changes has been adjusted. © 2020 Columbus McKinnon Corporation 2
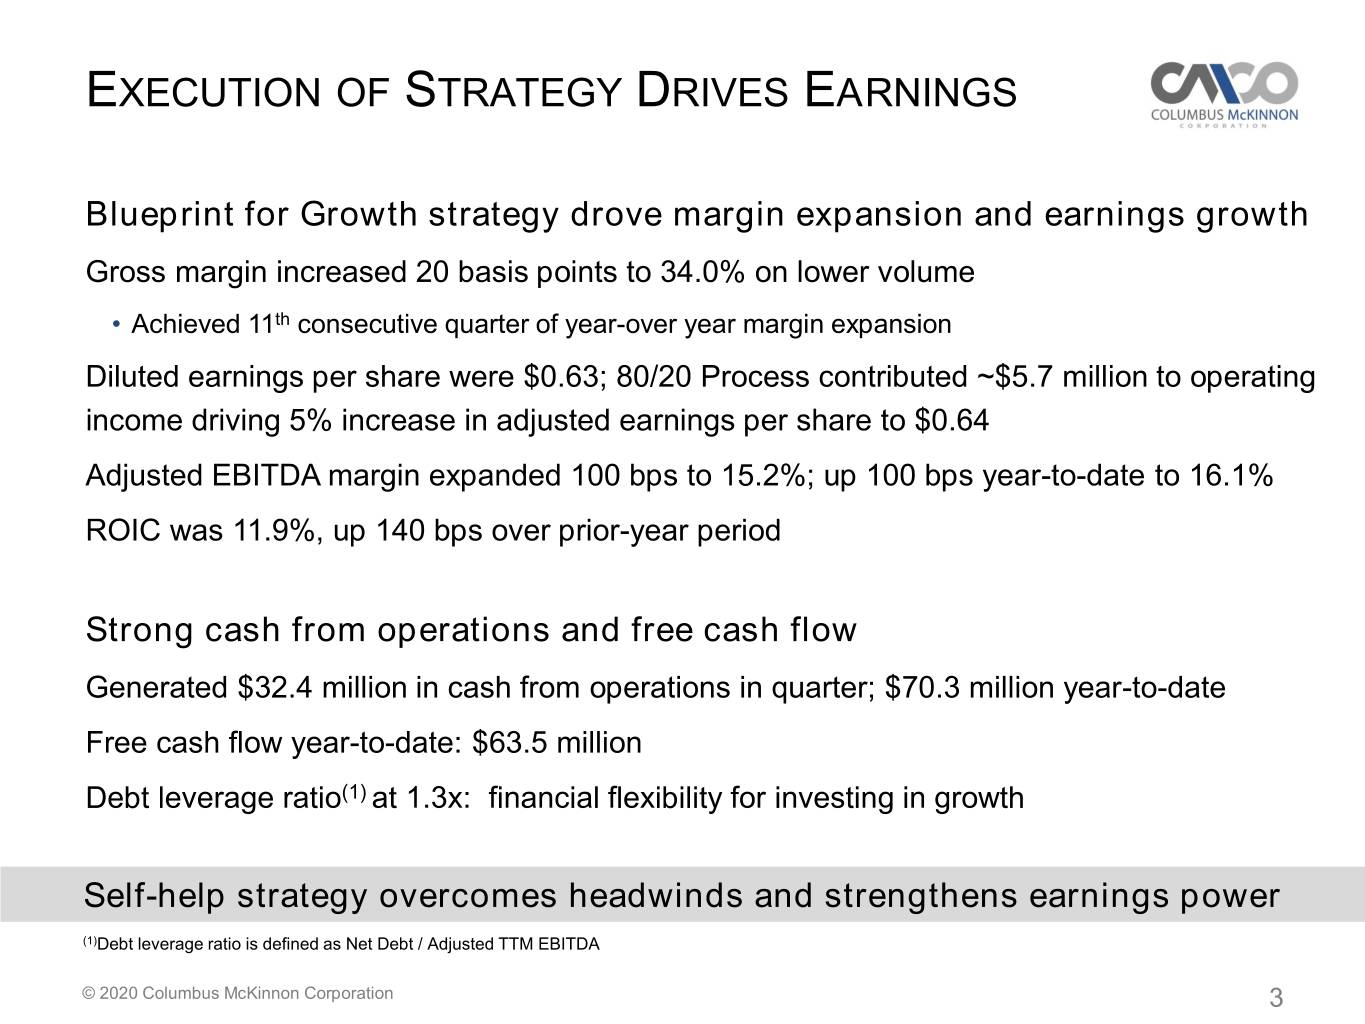
EXECUTION OF STRATEGY DRIVES EARNINGS Blueprint for Growth strategy drove margin expansion and earnings growth Gross margin increased 20 basis points to 34.0% on lower volume • Achieved 11th consecutive quarter of year-over year margin expansion Diluted earnings per share were $0.63; 80/20 Process contributed ~$5.7 million to operating income driving 5% increase in adjusted earnings per share to $0.64 Adjusted EBITDA margin expanded 100 bps to 15.2%; up 100 bps year-to-date to 16.1% ROIC was 11.9%, up 140 bps over prior-year period Strong cash from operations and free cash flow Generated $32.4 million in cash from operations in quarter; $70.3 million year-to-date Free cash flow year-to-date: $63.5 million Debt leverage ratio(1) at 1.3x: financial flexibility for investing in growth Self-help strategy overcomes headwinds and strengthens earnings power (1)Debt leverage ratio is defined as Net Debt / Adjusted TTM EBITDA © 2020 Columbus McKinnon Corporation 3
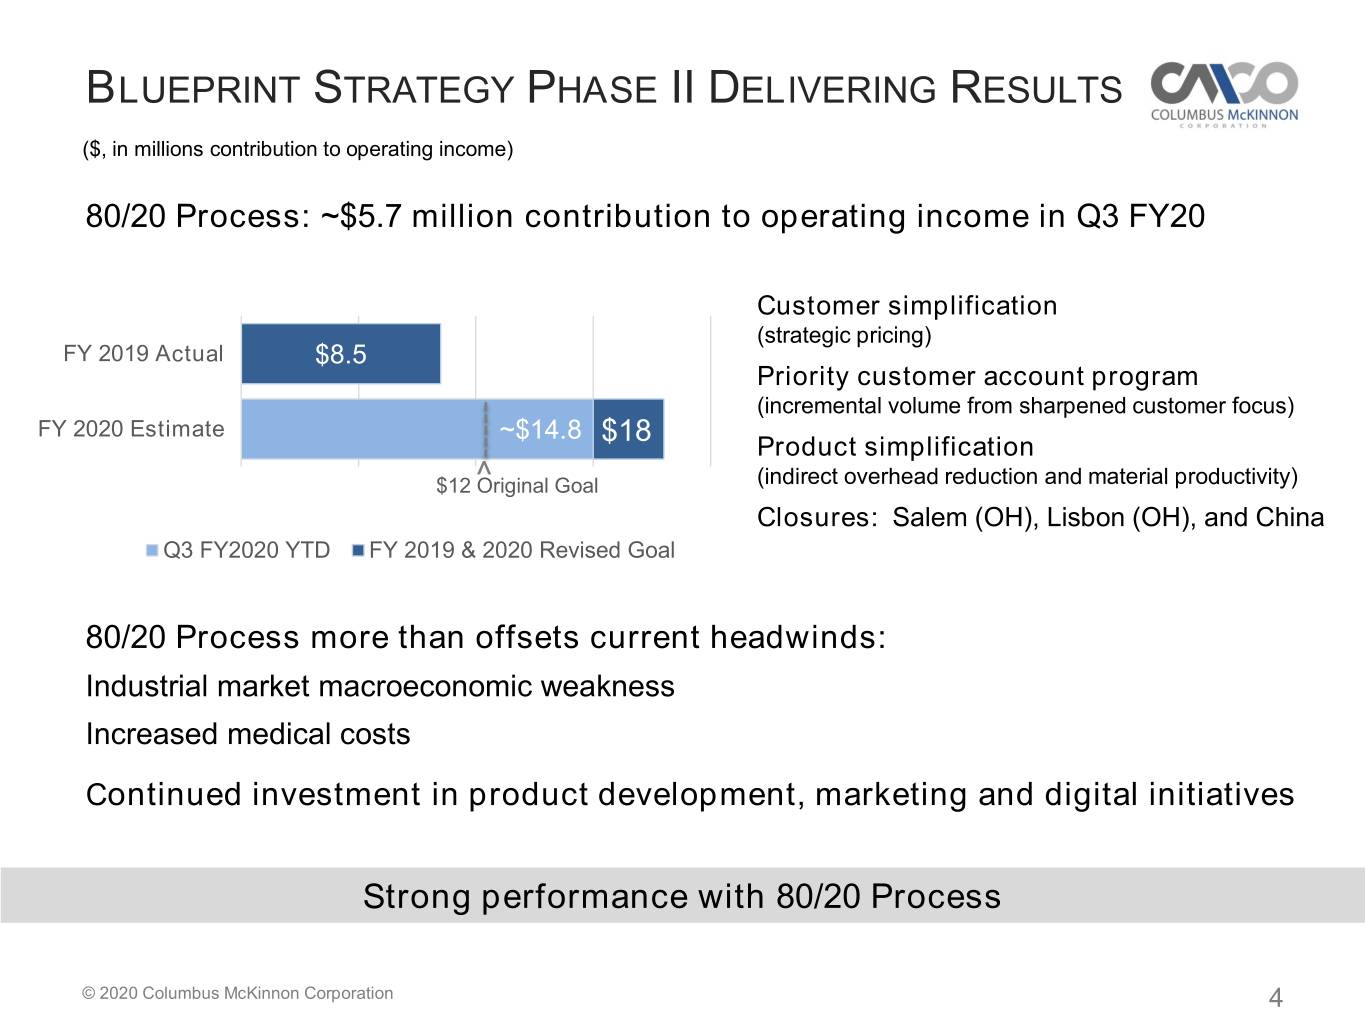
BLUEPRINT STRATEGY PHASE II DELIVERING RESULTS ($, in millions contribution to operating income) 80/20 Process: ~$5.7 million contribution to operating income in Q3 FY20 Customer simplification (strategic pricing) FY 2019 Actual $8.5 Priority customer account program (incremental volume from sharpened customer focus) FY 2020 Estimate ~$14.8 $18 Product simplification $12 ^Original Goal (indirect overhead reduction and material productivity) Closures: Salem (OH), Lisbon (OH), and China Q3 FY2020 YTD FY 2019 & 2020 Revised Goal 80/20 Process more than offsets current headwinds: Industrial market macroeconomic weakness Increased medical costs Continued investment in product development, marketing and digital initiatives Strong performance with 80/20 Process © 2020 Columbus McKinnon Corporation 4

RAMPING THE GROWTH ENGINE Created Automation Division Center of Excellence Integrating Lifting Specialist with Smart Movement Intelli-Crane™ Systems improve safety & productivity Utility lever hoist detects accidental release of loads Innovation expands addressable markets © 2020 Columbus McKinnon Corporation 5
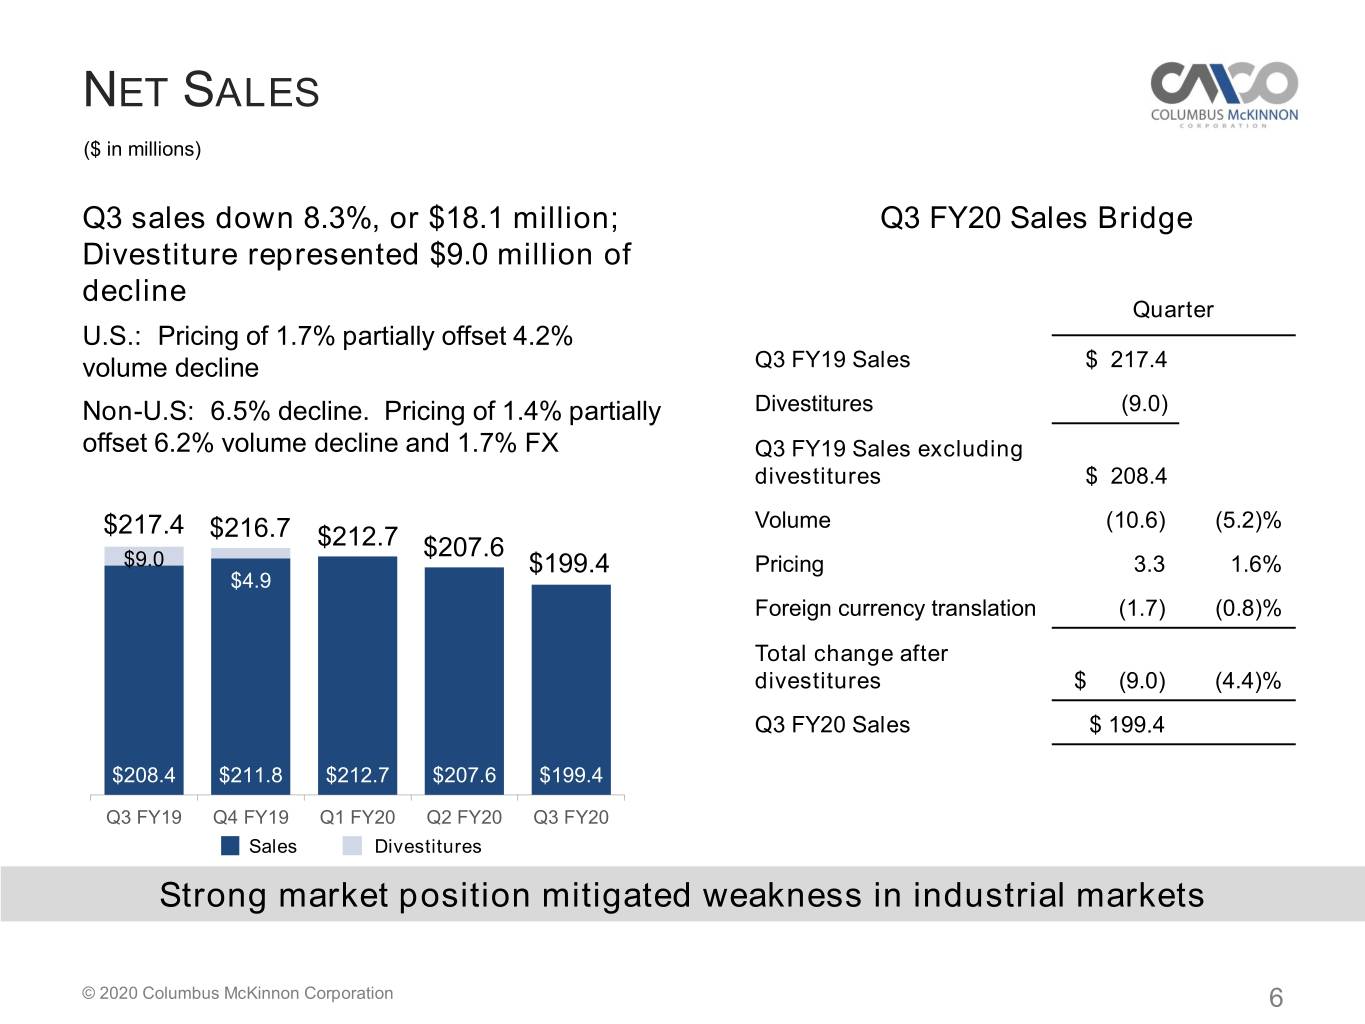
NET SALES ($ in millions) Q3 sales down 8.3%, or $18.1 million; Q3 FY20 Sales Bridge Divestiture represented $9.0 million of decline Quarter U.S.: Pricing of 1.7% partially offset 4.2% volume decline Q3 FY19 Sales $ 217.4 Non-U.S: 6.5% decline. Pricing of 1.4% partially Divestitures (9.0) offset 6.2% volume decline and 1.7% FX Q3 FY19 Sales excluding divestitures $ 208.4 $217.4 $216.7 Volume (10.6) (5.2)% $212.7 $207.6 $9.0 $199.4 Pricing 3.3 1.6% $4.9 Foreign currency translation (1.7) (0.8)% Total change after divestitures $ (9.0) (4.4)% Q3 FY20 Sales $ 199.4 $208.4 $211.8 $212.7 $207.6 $199.4 Q3 FY19 Q4 FY19 Q1 FY20 Q2 FY20 Q3 FY20 Sales Divestitures Strong market position mitigated weakness in industrial markets © 2020 Columbus McKinnon Corporation 6

GROSS PROFIT & GROSS MARGIN ($ in millions) Quarter Gross Profit Bridge 11th consecutive Quarter quarter of year/year Q3 FY2019 Gross Profit $ 73.4 gross margin expansion Divestitures (2.0) Q3 FY2019 Gross Profit adjusted for divestitures $ 71.4 Pricing, net of material cost inflation 2.8 Tariffs 0.1 $73.4 $76.0 $75.6 $73.5 $67.9 Insurance settlement 0.1 Product liability (0.1) Business realignment costs (0.1) Factory closures (0.5) Foreign currency translation (0.6) Productivity, net of other cost changes (2.2) Sales volume and mix (3.0) 33.8% 35.1% 35.5% 35.4% 34.0% Total Change adjusted for divestitures $ (3.5) Q3 FY19 Q4 FY19 Q1 FY20 Q2 FY20 Q3 FY20 Q3 FY2020 Gross Profit $ 67.9 80/20 Process drove gross margin expansion © 2020 Columbus McKinnon Corporation 7
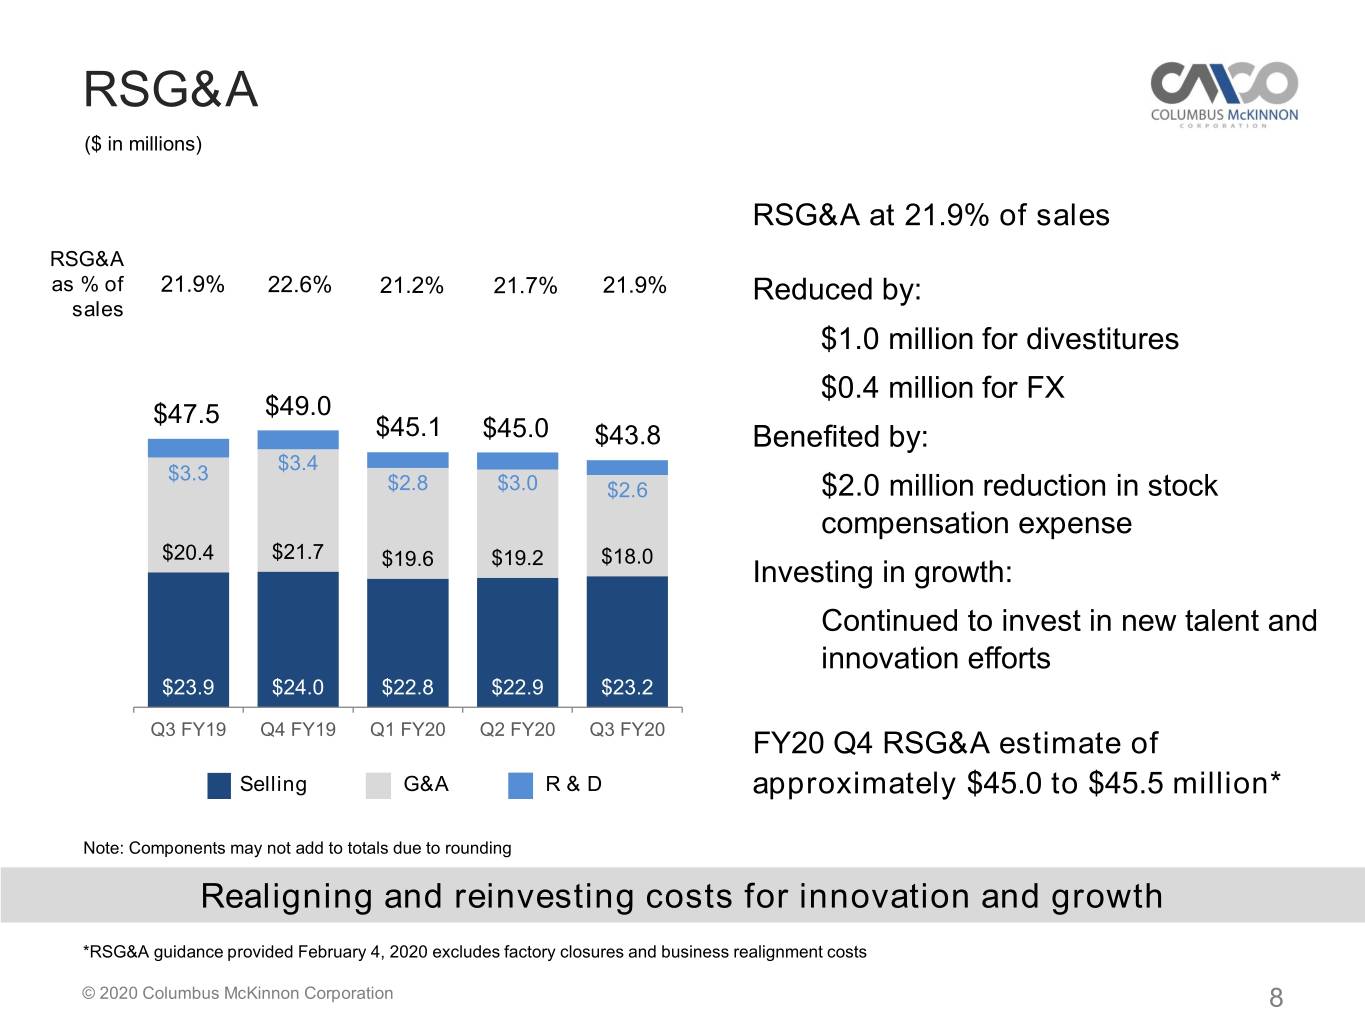
RSG&A ($ in millions) RSG&A at 21.9% of sales RSG&A as % of 21.9% 22.6% 21.2% 21.7% 21.9% Reduced by: sales $1.0 million for divestitures $0.4 million for FX $47.5 $49.0 $45.1 $45.0 $43.8 Benefited by: $3.3 $3.4 $2.8 $3.0 $2.6 $2.0 million reduction in stock compensation expense $20.4 $21.7 $18.0 $19.6 $19.2 Investing in growth: Continued to invest in new talent and innovation efforts $23.9 $24.0 $22.8 $22.9 $23.2 Q3 FY19 Q4 FY19 Q1 FY20 Q2 FY20 Q3 FY20 FY20 Q4 RSG&A estimate of Selling G&A R & D approximately $45.0 to $45.5 million* Note: Components may not add to totals due to rounding Realigning and reinvesting costs for innovation and growth *RSG&A guidance provided February 4, 2020 excludes factory closures and business realignment costs © 2020 Columbus McKinnon Corporation 8
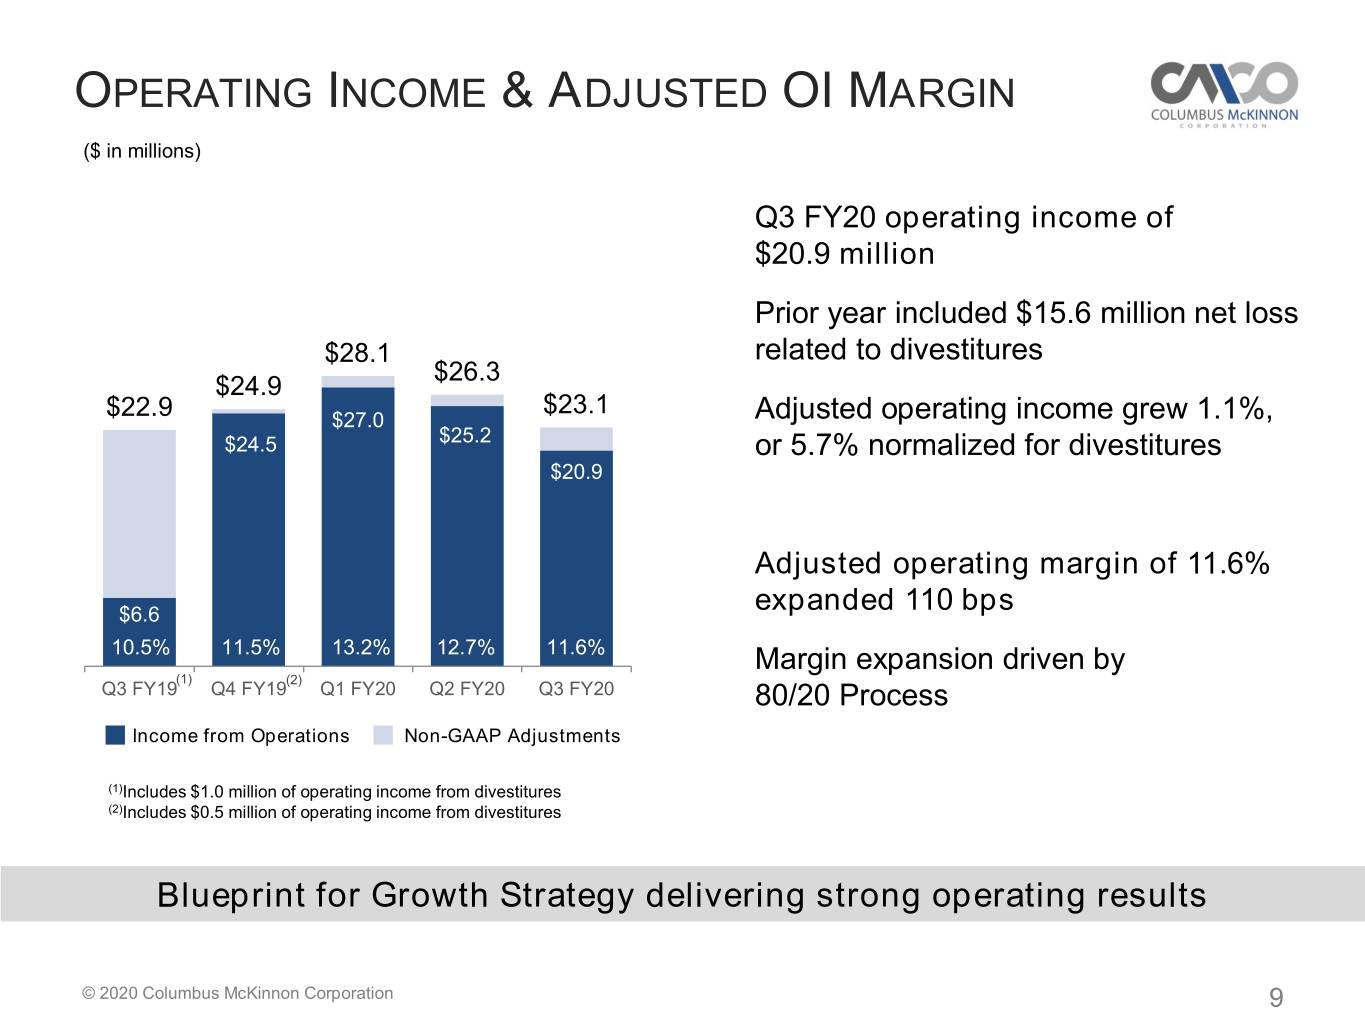
OPERATING INCOME & ADJUSTED OI MARGIN ($ in millions) Q3 FY20 operating income of $20.9 million Prior year included $15.6 million net loss $28.1 related to divestitures $26.3 $24.9 $23.1 $22.9 $27.0 Adjusted operating income grew 1.1%, $24.5 $25.2 or 5.7% normalized for divestitures $20.9 Adjusted operating margin of 11.6% $6.6 expanded 110 bps 10.5% 11.5% 13.2% 12.7% 11.6% Margin expansion driven by (1) (2) Q3 FY19 Q4 FY19 Q1 FY20 Q2 FY20 Q3 FY20 80/20 Process Income from Operations Non-GAAP Adjustments (1)Includes $1.0 million of operating income from divestitures (2)Includes $0.5 million of operating income from divestitures Blueprint for Growth Strategy delivering strong operating results © 2020 Columbus McKinnon Corporation 9

QUARTERLY EARNINGS PER SHARE GAAP Diluted EPS Net income: $0.83 $0.78 $15.3 million $0.69 $0.63 $0.63 per diluted share ($0.03) Adjusted net income: Q3 FY19 Q4 FY19 Q1 FY20 Q2 FY20 Q3 FY20 $15.4 million, 6.2% increase Y/Y Adjusted EPS $0.64 per diluted share, up 4.9% Y/Y $0.81 $0.61 $0.69 $0.74 $0.64 FY20 expected tax rate: 21% to 22% Q3 FY19 Q4 FY19 Q1 FY20 Q2 FY20 Q3 FY20 Solid Adjusted EPS growth driven by operating margin expansion Tax rate guidance provided February 4, 2020 © 2020 Columbus McKinnon Corporation 10

ADJUSTED EBITDA & ROIC Adjusted EBITDA Margin Strong adjusted EBITDA margin 15.2% in Q3 FY20, expanded 100 bps Y/Y 15.1% 15.2% 13.7% YTD EBITDA margin of 16.1% On track to achieve 19% goal in FY 2022 FY18 FY19 Q3 FY20 Return on Invested Capital Adjusted ROIC net of cash increased (1) (ROIC) 11.9% in Q3 FY20, expanded 140 bps Y/Y 11.2% 11.9% 8.7% FY18 FY19 Q3 FY20 TTM Improving performance during weak industrial environment (1)ROIC is defined as adjusted income from operations, net of taxes, for the trailing 12 months divided by the average of debt plus equity less cash (average capital) for the trailing 13 months. A 22% tax rate was used for fiscal years 2018, 2019 & 2020. © 2020 Columbus McKinnon Corporation 11

CASH FLOW ($ in millions) Free Cash Flow(1) Three Months Ended YTD 12/31/19 12/31/18 12/31/19 $90 - $95 $80 - $85 Net cash $75 - $80 provided by $32.4 $26.2 $70.3 $67.2 operating $55.1 activities $46.1 CapEx (1.9) (2.4) (6.8) Free cash flow $30.5 $23.8 $63.5 (FCF) Note: Components may not add to totals due to rounding FY17 FY18 FY19 FY20E FY21E FY22E Year-to-date FCF up 36% year-over-year FY21E to FY22E Assumptions: Raised FCF expectation for FY20 to Annual CapEx of ~$20 million $75 million to $80 million Annual pension contribution of ~$12 million FY20 expected CapEx: approximately $10 million to $12 million Outstanding free cash flow generation Capital expenditure guidance provided February 4, 2020 (1)Free cash flow is defined as cash provided by operating activities minus capital expenditures © 2020 Columbus McKinnon Corporation 12

STRONG BALANCE SHEET ($ in millions) CAPITALIZATION Debt leverage ratio(1) of 1.3x Dec. 31, March 31, Paid down $20 million of debt in 2019 2019 Q3 FY20 Cash and cash equivalents $ 84.0 $ 71.1 YTD paid $50 million of debt Total debt 251.9 300.3 Net debt to net total capital 25.7% Total net debt 167.9 229.2 Expect debt leverage ratio of 1.1x to Shareholders’ equity 484.4 431.2 1.2x at fiscal year end Total capitalization $ 736.3 $ 731.5 Strong financial flexibility enables Debt/total capitalization 34.2% 41.1% Phase III of Blueprint for Growth Net debt/net total 25.7% 34.7% strategy capitalization Plan to pay down $65 million of debt in FY2020 (1)Debt leverage ratio is defined as Net Debt / Adjusted TTM EBITDA © 2020 Columbus McKinnon Corporation 13

CAPITAL DEPLOYMENT PRIORITIES Organic Growth New product development Investing in growth initiatives and CapEx De-lever the balance sheet Achieved net leverage target In-organic Growth M&A Fund M&A Decreasing Priority Decreasing Return of Capital Regular dividend Adhere to dividend policy Share repurchase Consider opportunistically Capital deployment priorities remain unchanged © 2020 Columbus McKinnon Corporation 14

OUTLOOK Q4 FY20 outlook: Slowing macroeconomic and other headwinds expected to continue in Q4 FY20 Expect Q4 FY20 sales to be down 5% to 7% from Q4 FY19, which was ~$210 million* Team working to offset headwinds, both top and bottom lines Blueprint for Growth progress: Completed closure of China facility ($1 million annualized savings) and on track with Lisbon, OH in Q1 FY21 ($5 million annualized savings) 80/20 Process on track to achieve $18 million in contributions to operating income for FY20 Further business realignment efforts underway Self-funding realignment, restructurings and innovation to Ramp the Growth Engine Tracking toward 19% EBITDA margin in FY2022 Active search for CEO in process: Focused on maintaining Phase II momentum and advancing Phase III Blueprint for Growth strategy driving earnings in tougher macro environment *Q4 FY19 revenue was ~$210 million when excluding divestitures and FX at current rates © 2020 Columbus McKinnon Corporation 15

Supplemental Information © 2020 Columbus McKinnon Corporation 16

BLUEPRINT FOR GROWTH STRATEGY Growth Phase III Oriented Evolve business model Industrial • Portfolio optimization Technology • Mergers & acquisitions Phase II Simplify the business Drive profitable growth • 80/20 Process • Operational Excellence • Ramp the Growth Engine Phase I Get control Achieve results Cyclical • New organization Industrial • Operating system Today Future Further pivot to growth oriented Industrial Technology company © 2020 Columbus McKinnon Corporation 17
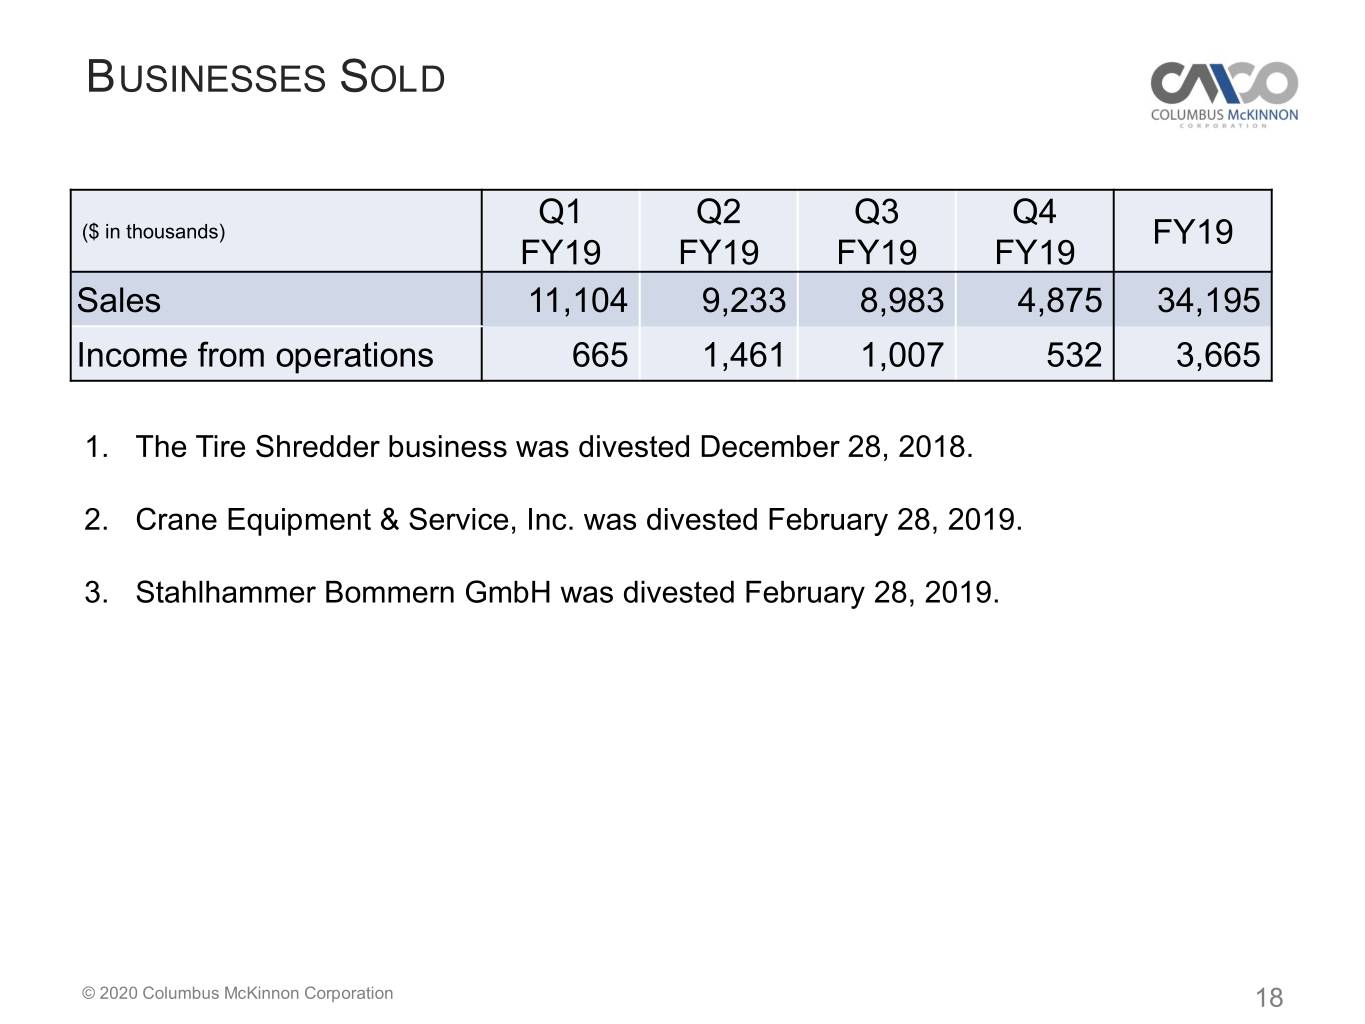
BUSINESSES SOLD Q1 Q2 Q3 Q4 ($ in thousands) FY19 FY19 FY19 FY19 FY19 Sales 11,104 9,233 8,983 4,875 34,195 Income from operations 665 1,461 1,007 532 3,665 1. The Tire Shredder business was divested December 28, 2018. 2. Crane Equipment & Service, Inc. was divested February 28, 2019. 3. Stahlhammer Bommern GmbH was divested February 28, 2019. © 2020 Columbus McKinnon Corporation 18
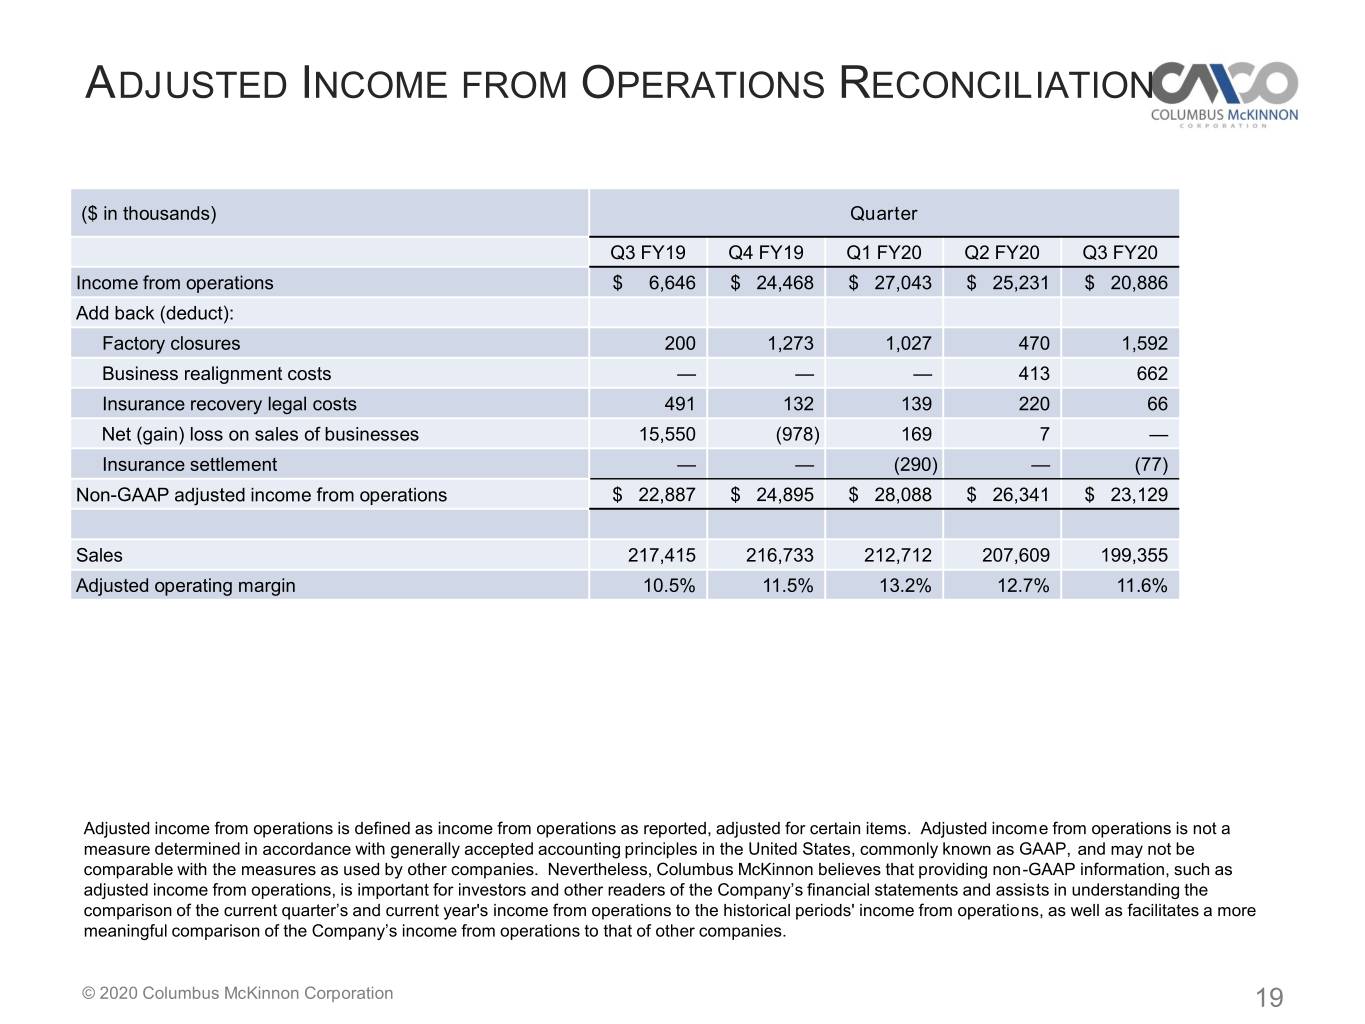
ADJUSTED INCOME FROM OPERATIONS RECONCILIATION ($ in thousands) Quarter Q3 FY19 Q4 FY19 Q1 FY20 Q2 FY20 Q3 FY20 Income from operations $ 6,646 $ 24,468 $ 27,043 $ 25,231 $ 20,886 Add back (deduct): Factory closures 200 1,273 1,027 470 1,592 Business realignment costs — — — 413 662 Insurance recovery legal costs 491 132 139 220 66 Net (gain) loss on sales of businesses 15,550 (978) 169 7 — Insurance settlement — — (290) — (77) Non-GAAP adjusted income from operations $ 22,887 $ 24,895 $ 28,088 $ 26,341 $ 23,129 Sales 217,415 216,733 212,712 207,609 199,355 Adjusted operating margin 10.5% 11.5% 13.2% 12.7% 11.6% Adjusted income from operations is defined as income from operations as reported, adjusted for certain items. Adjusted income from operations is not a measure determined in accordance with generally accepted accounting principles in the United States, commonly known as GAAP, and may not be comparable with the measures as used by other companies. Nevertheless, Columbus McKinnon believes that providing non-GAAP information, such as adjusted income from operations, is important for investors and other readers of the Company’s financial statements and assists in understanding the comparison of the current quarter’s and current year's income from operations to the historical periods' income from operations, as well as facilitates a more meaningful comparison of the Company’s income from operations to that of other companies. © 2020 Columbus McKinnon Corporation 19

ADJUSTED NET INCOME RECONCILIATION ($ in thousands, except per share data) Quarter Q3 FY19 Q4 FY19 Q1 FY20 Q2 FY20 Q3 FY20 Net income (loss) $ (782) $ 19,741 $ 18,579 $ 16,599 $ 15,250 Add back (deduct): Factory closures 200 1,273 1,027 470 1,592 Business realignment costs — — — 413 662 Insurance recovery legal costs 491 132 139 220 66 Net (gain) loss on sales of businesses 15,550 (978) 169 7 — Insurance settlement — — (290) — (77) Normalize tax rate (1) (974) (3,766) (291) 114 (2,106) Non-GAAP adjusted net income $ 14,485 $ 16,402 $ 19,333 $ 17,823 $ 15,387 Average diluted shares outstanding 23,681 23,714 23,777 23,926 24,031 Diluted income per share – GAAP $(0.03) $0.83 $0.78 $0.69 $0.63 Diluted income per share - Non-GAAP $0.61 $0.69 $0.81 $0.74 $0.64 (1) Applies normalized tax rate of 22% to GAAP pre-tax income and non-GAAP adjustments above, which are each pre-tax. Adjusted net income and diluted EPS are defined as net income and diluted EPS as reported, adjusted for certain items and at a normalized tax rate. Adjusted net income and diluted EPS are not measures determined in accordance with generally accepted accounting principles in the United States, commonly known as GAAP, and may not be comparable to the measures as used by other companies. Nevertheless, Columbus McKinnon believes that providing non-GAAP information, such as adjusted net income and diluted EPS, is important for investors and other readers of the Company’s financial statements and assists in understanding the comparison of the current quarter’s and current year's net income and diluted EPS to the historical periods' net income and diluted EPS, as well as facilitates a more meaningful comparison of the Company’s net income and diluted EPS to that of other companies. © 2020 Columbus McKinnon Corporation 20

ADJUSTED EBITDA RECONCILIATION ($ in thousands) Quarter Q3 FY19 Q4 FY19 Q1 FY20 Q2 FY20 Q3 FY20 Net income (loss) $ (782) $ 19,741 $ 18,579 $ 16,599 $ 15,250 Add back (deduct): Income tax expense 3,111 860 5,162 5,141 2,234 Interest and debt expense 4,330 3,959 3,852 3,759 3,423 Investment (income) loss 82 (430) (302) (229) (408) Foreign currency exchange (gain) loss (25) 637 (410) (296) (188) Other (income) expense, net (70) (299) 162 257 199 Depreciation and amortization expense 7,901 7,912 7,403 7,344 7,244 Factory closures 200 1,273 1,027 470 1,592 Business realignment costs — — — 413 662 Insurance recovery legal costs 491 132 139 220 66 Net (gain) loss on sales of businesses 15,550 (978) 169 7 — Insurance settlement — — (290) — (77) Non-GAAP adjusted EBITDA $ 30,788 $ 32,807 $ 35,491 $ 33,685 $ 30,373 Sales $ 217,415 $ 216,733 $ 212,712 $ 207,609 $ 199,355 Adjusted EBITDA margin 14.2% 15.1% 16.7% 16.2% 15.2% Adjusted EBITDA is defined as net income before interest expense, income taxes, depreciation, amortization, and other adjustments. Adjusted EBITDA is not a measure determined in accordance with generally accepted accounting principles in the United States, commonly known as GAAP, and may not be comparable with the measures as used by other companies. Nevertheless, Columbus McKinnon believes that providing non-GAAP information, such as adjusted EBITDA, is important for investors and other readers of the Company’s financial statements and assists in understanding the comparison of the current quarter’s and current year's net income and diluted EPS to the historical periods' net income and diluted EPS, as well as facilitates a more meaningful comparison of the Company’s net income and diluted EPS to that of other companies. © 2020 Columbus McKinnon Corporation 21

INDUSTRIAL CAPACITY UTILIZATION U.S. Capacity Utilization Eurozone Capacity Utilization Source: The Federal Reserve Board Source: European Commission 82% 85% 75.2% (Manufacturing) & 81% 77.0% (Total) December 2019(1) 84% 80% 79% 83% 78% 82% 77% 81.3% December 2019 76% 81% 75% 80% 74% 73% 79% Manufacturing Total (1)December2019 numbers are preliminary © 2020 Columbus McKinnon Corporation 22

CONFERENCE CALL PLAYBACK INFO Replay Number: 412-317-6671 passcode: 13697631 Telephone replay available through February 11, 2020 Webcast / PowerPoint / Replay available at www.cmworks.com/investors Transcript, when available, at www.cmworks.com/investors © 2020 Columbus McKinnon Corporation 23

February 4, Q3 FISCAL YEAR 2020 2020 FINANCIAL RESULTS CONFERENCE CALL PARTNERS IN MOTION CONTROL
