Attached files
| file | filename |
|---|---|
| EX-32.1 - EXHIBIT 32.1 - COLUMBUS MCKINNON CORP | ex32_1.htm |
| EX-21.1 - EXHIBIT 21.1 - COLUMBUS MCKINNON CORP | ex21_1.htm |
| EX-31.1 - EXHIBIT 31.1 - COLUMBUS MCKINNON CORP | ex31_1.htm |
| EX-23.1 - EXHIBIT 23.1 - COLUMBUS MCKINNON CORP | ex23_1.htm |
| EX-31.2 - EXHIBIT 31.2 - COLUMBUS MCKINNON CORP | ex31_2.htm |
UNITED STATES SECURITIES AND EXCHANGE COMMISSION
Washington, D.C. 20549
FORM 10-K
|
|
x
|
ANNUAL REPORT PURSUANT TO SECTION 13 OR 15(d) OF THE SECURITIES EXCHANGE ACT OF 1934 (FEE REQUIRED)
|
For the fiscal year ended March 31, 2011
Commission file number 0-27618
COLUMBUS McKINNON CORPORATION
(Exact name of Registrant as specified in its charter)
|
New York
|
16-0547600
|
|
(State of Incorporation)
|
(I.R.S. Employer Identification Number)
|
140 John James Audubon Parkway
Amherst, New York 14228-1197
(Address of principal executive offices, including zip code)
(716) 689-5400
(Registrant’s telephone number, including area code)
Securities pursuant to section 12(b) of the Act:
NONE
Securities registered pursuant to Section 12(g) of the Act:
Common Stock, $0.01 Par Value (and rights attached thereto)
Indicate by check mark if the registrant is a well-known seasoned issuer, as defined in Rule 405 of the Securities Act. Yes o No x
Indicate by check mark if the registrant is not required to file reports pursuant to Section 13 or Section 15(d) of the Exchange Act. Yes o No x
Indicate by checkmark whether the registrant (1) has filed all reports required to be filed by Section 13 or 15(d) of the Securities Exchange Act of 1934 during the preceding 12 months (or for such shorter period that the Registrant was required to file such reports), and (2) has been subject to such filing requirements for the past 90 days. Yes x No o
Indicate by check mark whether the registrant has submitted electronically and posted on its corporate Web site, if any, every Interactive Data File required to be submitted and posted pursuant to Rule 405 of Regulation S-T during the preceding 12 months (or for such shorter period that the registrant was required to submit and post such files). Yes x No o
Indicate by check mark if disclosure of delinquent filers pursuant to Item 405 of Regulation S-K (§229.405 of this chapter) is not contained herein, and will not be contained, to the best of Registrant’s knowledge, in definitive proxy or information statements incorporated by reference in Part III of this Form 10-K or any amendment to this Form 10-K x.
Indicate by checkmark whether the registrant is a large accelerated filer, an accelerated filer, a non-accelerated filer, or a smaller reporting company. See definition of “accelerated filer,” “large accelerated filer” and “smaller reporting company” in Rule 12b-2 of the Act.
|
Large accelerated filer o
|
Accelerated filer x
|
|
Non-accelerated filer o
|
Smaller reporting company o
|
Indicate by check mark whether the registrant is a shell company (as defined in Rule 12b-2 of the Act). Yes o No x
The aggregate market value of the voting stock held by non-affiliates of the Registrant as of September 30, 2010 (the second fiscal quarter in which this Form 10-K relates) was approximately $318 million, based upon the closing price of the Company’s common shares as quoted on the Nasdaq Stock Market on such date. The number of shares of the Registrant’s common stock outstanding as of April 30, 2011 was 19,251,428 shares.
DOCUMENTS INCORPORATED BY REFERENCE
Portions of the Registrant’s proxy statement for its 2010 Annual Meeting of Shareholders to be filed with the Securities and Exchange Commission pursuant to Regulation 14A not later than 120 days after the end of the Registrant’s fiscal year ended March 31, 2011 are incorporated by reference into Part III of this report.
COLUMBUS McKINNON CORPORATION
2011 Annual Report on Form 10-K
This annual report contains “forward-looking statements” within the meaning of the Private Securities Litigation Reform Act of 1995. Such statements involve known and unknown risks, uncertainties and other factors that could cause our actual results to differ materially from the results expressed or implied by such statements, including general economic and business conditions, conditions affecting the industries served by us and our subsidiaries, conditions affecting our customers and suppliers, competitor responses to our products and services, the overall market acceptance of such products and services, the integration of acquisitions and other factors set forth herein under “Risk Factors.” We use words like “will,” “may,” “should,” “plan,” “believe,” “expect,” “anticipate,” “intend,” “future” and other similar expressions to identify forward looking statements. These forward looking statements speak only as of their respective dates and we do not undertake and specifically decline any obligation to publicly release the results of any revisions to these forward-looking statements that may be made to reflect any future events or circumstances after the date of such statements or to reflect the occurrence of anticipated or unanticipated changes. Our actual operating results could differ materially from those predicted in these forward-looking statements, and any other events anticipated in the forward-looking statements may not actually occur.
1
PART I
|
Item 1.
|
Business
|
General
We are a leading global designer, manufacturer and marketer of hoists, rigging tools, cranes, actuators, and other material handling products serving a wide variety of commercial and industrial end-user markets. Our products are used to efficiently and ergonomically move, lift, position or secure objects and loads. We are the U.S. market leader in hoists, our principal line of products, as well as certain chain, forged attachment, and actuator products which we believe provides us with a strategic advantage in selling our other products. We have achieved this leadership position through strategic acquisitions, our extensive, diverse and well-established distribution channels and our commitment to product innovation and quality. We have one of the most comprehensive product offerings in the industry and we believe we have more overhead hoists in use in North America than all of our competitors combined. Additionally, we believe we are the market leader of manual hoist and actuator products in Europe, which provides us further opportunity to sell our other products through our existing distribution channels in that region. Our products are sold globally and our brand names, including CM, Coffing, Chester, Duff-Norton, Pfaff, Shaw-Box and Yale, are among the most recognized and well-respected in the marketplace.
Our business is cyclical in nature and sensitive to changes in general economic conditions, including changes in the manufacturing industry capacity utilization, industrial production and the general economic activity indicators, like GDP. Both U.S. and Eurozone capacity utilization are leading market indicators for the Company. US industrial capacity utilization increased to 74.9% in April 2011, trending up from 70.9% in April 2010. Eurozone capacity utilization has also been trending higher for the last seven quarters, reaching 77.6% in March 2011 compared with the trough of 69.6% in June 2009.
In response to the negative economic climate we experienced in Fiscal 2010 and consistent with our manufacturing strategy, we rationalized our North American hoist and rigging operations to improve efficiency, control costs and facilitate future growth. This included ceasing welded chain production in our Mexico facility and closure of one of our forge and one of our hoist facilities in the U.S. This entire facility consolidation initiative resulted in a reduction of 500,000 square feet of manufacturing space. We estimate that we will generate annual cost savings of approximately $15,000,000 as a result of the rationalization. We have realized approximately half of those savings during fiscal 2011.
Our Position in the Industry
The broad, global material handling industry includes the following sectors:
|
•
|
overhead material handling and lifting devices;
|
|
•
|
continuous materials movement;
|
|
•
|
wheeled handling devices;
|
|
•
|
pallets, containers and packaging;
|
|
•
|
storage equipment and shop furniture;
|
|
•
|
automation systems and robots; and
|
|
•
|
services and unbundled software.
|
2
The breadth of our products and services enables us to participate in most of these sectors. This diversification, together with our extensive and varied distribution channels, minimizes our dependence on any particular product, market or customer. We believe that none of our competitors offers the variety of products or services in the markets we serve.
We believe that the demand for our products and services will be aided by several macro-economic growth drivers. These drivers include:
Productivity Enhancement - We believe employers respond to competitive pressures by seeking to maximize productivity and efficiency, among other actions. Our hoists and other lifting and positioning products allow loads to be lifted and placed quickly, precisely, with little effort and fewer people, thereby increasing productivity and reducing cycle time. Further, emphasis on “Lean” techniques by many companies increases demand for our lifting and positioning products for use in single-piece flow workstation applications.
Safety Regulations - Driven by workplace safety regulations such as the Occupational Safety and Health Act and the Americans with Disabilities Act in the U.S. and other safety regulations around the world, and by the general competitive need to reduce costs such as health insurance premiums and workers’ compensation expenses, employers seek safer ways to lift and position loads. Our lifting and positioning products enable these tasks to be performed with reduced risk of personal injury.
Consolidation of Suppliers - In an effort to reduce costs and increase productivity, our channel partners and end-user customers are increasingly consolidating their suppliers. We believe that our broad product offering combined with our well established brand names will enable us to benefit from this consolidation and enhance our market share.
Our Competitive Strengths
Leading North American Market Positions - We are a leading manufacturer and marketer of hoists, alloy and high strength carbon steel chain and attachments, and actuators in North America. We have developed our leading market positions over our 136-year history by emphasizing technological innovation, manufacturing excellence and superior service. Approximately 61% of our U.S. net sales for the year ended March 31, 2011 were from product categories in which we believe we hold the number one market share. We believe that the strength of our established products and brands and our leading market positions provide us with significant competitive advantages, including preferred supplier status with a majority of our largest channel partners and end user customers. Our large installed base of products also provides us with a significant competitive advantage in selling our products to existing customers as well as providing repair and replacement parts.
The following table summarizes the product categories where we believe we are the U.S. market leader:
|
Product Category
|
U.S. Market Share
|
U.S. Market Position
|
Percentage of U.S. Net Sales
|
|||||||||
|
Powered Hoists (1)
|
45 | % | #1 | 22 | % | |||||||
|
Manual Hoists & Trolleys (1)
|
55 | % | #1 | 12 | % | |||||||
|
Forged Attachments (1)
|
30 | % | #1 | 6 | % | |||||||
|
Lifting and Sling Chains (1)
|
46 | % | #1 | 4 | % | |||||||
|
Hoist Parts (2)
|
50 | % | #1 | 10 | % | |||||||
|
Mechanical Actuators (3)
|
43 | % | #1 | 5 | % | |||||||
|
Tire Shredders (4)
|
80 | % | #1 | 1 | % | |||||||
|
Jib Cranes (5)
|
25 | % | #1 | 1 | % | |||||||
|
|
61 | % | ||||||||||
|
|
(1)
|
Market share and market position data are internal estimates derived from survey information collected and provided by our trade associations in 2010.
|
3
|
|
(2)
|
Market share and market position data are internal estimates based on our market shares of Powered Hoists and Manual Hoists & Trolleys, which we believe are good proxies for our Hoist Parts market share because we believe most end-users purchase Hoist Parts from the original equipment supplier.
|
|
|
(3)
|
Market share and market position data are internal estimates derived by comparison of our net sales to net sales of one of our competitors and to estimates of total market sales from a trade association in 2010.
|
|
|
(4)
|
Market share and market position data are internal estimates derived by comparing the number of our tire shredders in use and their capacity to estimates of the total number of tires shredded published by a trade association in 2010.
|
|
|
(5)
|
Market share and market position are internal estimates derived from both the number of bids we win as a percentage of the total projects for which we submit bids and from estimates of our competitors’ net sales based on their relative position in distributor catalogues in 2010.
|
Comprehensive Product Lines and Strong Brand Name Recognition - We believe we offer the most comprehensive product lines in the markets we serve. Most of our products work in conjunction with each other to create a lifting system. We offer engineering and design services to help channel partners and end users solve material handling problems. We are the only major supplier of material handling equipment offering full lines of hoists, rigging and lifting tools as well as actuators. Most of our products are maintenance, repair and operating tools which work in conjunction with each other to create a complete lifting system. We complement our product offerings with engineering and design services to assist our channel partners and end-users in finding the optimal solution for their material handling needs. Our capability as a full-line supplier has allowed us to (i) provide our customers with “one-stop shopping” for material handling equipment, which meets some customers’ desires to reduce the number of their supply relationships in order to lower their costs, (ii) leverage our engineering, product development and marketing costs over a larger sales base and (iii) achieve purchasing efficiencies on common materials used across our product lines. No single SKU comprises more than 1% of our sales, a testament to our broad and diversified product offering.
In addition, our brand names, including Budgit, Chester, CM, Coffing, Duff-Norton, Little Mule, Pfaff, Shaw-Box and Yale, are among the most recognized and respected in the industry. The CM and Yale names have been synonymous with powered hoists and manual hoists and were first developed and marketed under these brand names in the early 1900s. We believe that our strong brand name recognition has created customer loyalty and helps us maintain existing business, as well as capture additional business. We are at the forefront of innovation in our industry and continually introduce new products to meet our changing customer needs. Products introduced during the three fiscal years ended March 31, 2011 account for approximately 17% of our net sales; our goal is to increase this to 20%.
Distribution Channel Diversity and Strength - Our products are sold to over 15,000 general and specialty distributors, end users and OEMs globally. We enjoy long-standing relationships with, and are a preferred provider to, the majority of our largest distributors and industrial buying groups. There has been consolidation among distributors of material handling equipment and we have benefited from this consolidation by maintaining and enhancing our relationships with our leading distributors, as well as forming new relationships. We believe our extensive distribution channels provide a significant competitive advantage and allow us to effectively market new product line extensions and promote cross-selling. Our largest distributor represents only approximately 4% of our total net sales and our top 10 customers present less than 15% of our total net sales.
Expanding Non-U.S. Markets - We have significantly grown our non-U.S. sales since becoming a public company in 1996. Our non-U.S. sales have grown from $34,300,000 (representing 16% of total sales) in fiscal 1996 to $241,970,000 (representing 46% of our total sales) during the year ended March 31, 2011. This growth has occurred primarily in Europe, Latin America and Asia-Pacific. The Pfaff acquisition in October 2008 has enhanced our non-U.S. revenue growth, particularly in Europe. Additionally, we have recently opened four sales offices in Shanghai, Guangzhou, Wunan, and Shenyang, China to sell into this growing industrial market, with more planned in the coming year. Our non-U.S. business has provided us, and we believe will continue to provide us, with significant growth opportunities and new markets for our products.
4
"Non-U.S. sales" as expressed throughout Items 1 and 7 of this Form 10-K, are defined as sales to customers located outside of the United States.
Efficient Operations with Low-Cost Structure - We are extremely focused on optimizing our cost structure and have taken a number of steps towards reducing our costs, including: consolidating facilities, promoting a “Lean” culture, manufacturing in low cost jurisdictions, coordinating purchasing activities across the organization and selectively outsourcing non-critical functions. The actions we have taken to date have eliminated fixed costs from our operations and will provide us with significant operating leverage as the economic conditions in our markets continue to improve. Our operating leverage goal is for each incremental sales dollar to generate 20%-30% of additional operating income, in addition to the fixed cost savings realized from our facility consolidation activities.
|
—
|
Rationalization and Consolidation - We have a history of consolidating manufacturing facilities and optimizing warehouse utilization, resulting in lower annual operating costs and improving our fixed-variable cost relationship. During our fiscal year ended March 31, 2010, we initiated further consolidation of our North American hoist and rigging operations in accordance with our strategy. We completed the closure of one of our manufacturing facilities in Cedar Rapids, Iowa and significantly downsized manufacturing at a second facility in Mexico in the third quarter of the fiscal year ended March 31, 2010. Additionally, we completed the closure of a third facility in Muskegon, Michigan in the first quarter of the fiscal year ended March 31, 2011. These projects have resulted in an aggregate reduction of approximately 500,000 square feet of manufacturing space and are expected to generate annual savings estimated at approximately $15,000,000.
|
|
—
|
Lean Culture - We have been applying “Lean” techniques since 2001 and our efforts have resulted in a meaningful reduction in inventory levels, a significant decline in required manufacturing floor space, a decrease in product lead time and an improvement in productivity and on-time deliveries. We have witnessed the benefits of “Lean” principles in our manufacturing operations and are now working to develop a “Lean” culture throughout our organization—improving our processes and reducing waste in all forms in all of our business activities.
|
|
—
|
Expansion Outside the U.S. - Our continued expansion of our manufacturing facilities in China and Hungary provides us with a cost efficient platform to manufacture and distribute certain of our products and components. We now operate 12 major manufacturing facilities in six countries, with 39 stand-alone sales and service offices in 17 countries and 10 warehouse facilities in five countries.
|
|
—
|
Consolidated Purchasing Activities - We continue to leverage our company-wide purchasing power through our Purchasing Council to reduce our costs and manage fluctuations in commodity pricing, including steel.
|
|
—
|
Selective Integration and Outsourcing - We manufacture many of the critical parts and components used in the manufacture of our hoists and lifting systems, resulting in reduced costs. We also evaluate outsourcing opportunities for non-critical operations and components.
|
Strong After-Market Sales and Support - We believe that we retain customers and attract new customers due to our ongoing commitment to customer service and ultimate satisfaction. We have a large installed base of hoists and rigging tools that drives our after-market sales for replacement units and components and repair parts. We maintain strong relationships with our distribution channel partners and provide prompt service to end-users of our products through our authorized network of 14 chain repair stations and approximately 340 hoist service and repair stations. We also work closely with end users to design the appropriate lifting systems using our products to help them solve their material handling problems.
5
We also provide a wide variety of training and certification programs to the users of our products. These training and certification programs include crane inspection and operation training and certification, hoist inspection and repair training and certification, various rigging training courses, load securement training, and CM entertainment technology equipment training and certification classes.
Consistent Free Cash Flow Generation and Significant Debt Reduction—We have consistently generated positive free cash flow (which we define as net cash provided by operating activities less capital expenditures) through periods of economic uncertainty by continually controlling our costs, improving our working capital management and reducing the capital intensity of our manufacturing operations. In the past five years, despite the economic downturn, we have reduced total net debt by $36,400,000, from $110,700,000 to $74,300,000 at March 31, 2011, and we continue to improve our cash balance. We manage our capital structure conservatively while maintaining flexibility to pursue attractive strategic growth opportunities.
Experienced Management Team with Equity Ownership - Our senior management team provides significant depth and continuity of experience in the material handling industry, supplemented by expertise in growing businesses, aggressive cost management, balance sheet management, efficient manufacturing techniques and acquiring and integrating businesses and global operations. This diverse experience has been critical to our success to date and will be instrumental to our long-term growth. Our management promotes the ownership of company stock by the executive officers and directors to align the interests of our leadership team with those of our stakeholders.
Our Strategy
Invest in New Products and Targeted Markets. We intend to leverage our competitive advantages to increase our market shares across all of our product lines and geographies by:
|
—
|
Introducing New Products—We continue to expand our business by developing new material handling products and services and expanding the breadth of our product lines to address the material handling needs of our customers. We design our powered hoist lines to many international standards including the FEM (European and Asian), ANSI (U.S.) and other standard setting bodies to ensure maximum utility for these products across geographies. We employ the StageGate process to enhance discipline and focus in our new product development program. New product sales (as defined by new items introduced within the last three years) amounted to $90,000,000 in the fiscal year ended March 31, 2011 (17.2% of total sales), $74,500,000 in the fiscal year ended March 31, 2010 (15.6% of total sales) and $74,800,000 in the fiscal year ended March 31, 2009 (12.3% of total sales). Our goal is for 20% of our sales each year to come from new product sales.
|
|
—
|
Leveraging Our Distribution Channel Relationships and Vertical Market Knowledge—Our large, diversified, global customer base, our extensive distribution channels and our close relationships with end-users and channel partners provide us with insights into customer preferences and product requirements that allow us to anticipate and address the future needs of the marketplace. We are also investing in key vertical markets that will help us increase our revenues.
|
|
—
|
Broadening Our Product Offering—Developing and offering a broad range of products to our channel partners is an important element of our strategy. Industrial channel partners offer a broad array of industrial components that are used by many end-user markets. We continue to review and add new material handling components to broaden our product offering, but also remove some products that we find duplicative or not marketable.
|
Continue to Grow in Non-U.S. Markets - Our non-U.S. sales of $241,970,000 comprised 46% of our net sales for the year ended March 31, 2011, as compared with $207,921,000, or 44% in fiscal 2010 and $34,300,000, or 16% of our net sales, in fiscal 1996, the year we became a public company. Although we have made significant progress, our goal is to continue to increase our presence outside the U.S to capitalize on the higher growth opportunities and continue to diversify our business profile. We presently sell to distributors in over 50 countries and have our primary non-U.S. manufacturing facilities in China, Germany, United Kingdom, Hungary, Mexico and France. In addition to new product introductions, we continue to expand our sales and service presence in the major and developing market areas of Asia-Pacific, Europe, and Latin America and have sales offices and warehouse facilities in Canada, various countries in Western and Eastern Europe, China, Thailand, Brazil, Uruguay, Panama and Mexico. We intend to increase our sales in Asia-Pacific by manufacturing a broader array of high quality, low-cost products and components in China. We have developed and are continuing to expand upon new hoist and other products in compliance with global standards and international designs to enhance our global distribution.
6
Focus on Operational Excellence - Our objective is to provide the highest quality products and services at prices consistent with the value created for our customers. We continually evaluate our costs and challenge the global supply and manufacturing chain to reduce costs. Our view is that a market-focused sales and marketing effort along with low operating costs will prove to be successful for both our customers and for the Company. We continually seek ways to reduce our operating costs and increase our manufacturing productivity, while maintaining quality. Ongoing programs include our efforts to further develop our “Lean” culture throughout the organization, the completion of our facility rationalization programs in the U.S., the consolidation of our facilities within China, our continued search for new ways to leverage our purchasing power through our Purchasing Council and the continued focus on enhancing the efficiency of our global supply chain. Our operating leverage goal is for each incremental sales dollar to generate 20% to 30% of additional operating income, in addition to the fixed cost savings realized from our facility consolidation activities.
Pursue Strategic Acquisitions and Alliances; Evaluate Existing Business Portfolio - We intend to pursue synergistic acquisitions to complement our organic growth. Priorities for such acquisitions include: 1) increasing international geographic penetration, particularly in the Asia-Pacific region and other emerging markets, and 2) further broadening our offering with complementary products frequently used in conjunction with hoists. Additionally, we continually challenge the long-term fit of our businesses for potential divestiture and redeployment of capital.
Our Business
ASC Topic 280 “Segment Reporting” establishes the standards for reporting information about operating segments in financial statements. As part of the organizational restructuring announced in our December 22, 2008 press release and Form 8-K filing, we reevaluated our reportable segments and determined that we have only one reporting segment for internal and external reporting purposes. We continue to believe that we have only one reportable operating segment.
We design, manufacture and distribute a broad range of material handling products for various applications. Products include a wide variety of electric, lever, hand and air-powered hoists, hoist trolleys, winches, industrial crane systems such as bridge, gantry and jib cranes; alloy and carbon steel chain; closed-die forged attachments, such as hooks, shackles, textile slings, clamps, logging tools and load binders; industrial components, such as mechanical and electromechanical actuators and rotary unions; below-the-hook special purpose lifters; tire shredders; and light-rail systems. These products are typically manufactured for stock or assembled to order from standard components and are sold primarily through a variety of commercial distributors and to a lesser extent, directly to end-users. The diverse end-users of our products are in a variety of industries including: manufacturing, power generation and distribution, utilities, wind power, warehouses, commercial construction, oil exploration and refining, petrochemical, marine, ship building, transportation and heavy duty trucking, agriculture, logging and mining. We also serve a niche market for the entertainment industry including permanent and traveling concerts, live theater and sporting venues.
7
Products
In excess of 80% of our net sales are derived from the sale of products that we sell at a unit price of less than $5,000. Of our fiscal 2011 sales, $282,095,000 or 54% were U.S. and $241,970,000, or 46% were international. The following table sets forth certain sales data for our products, expressed as a percentage of net sales for fiscal 2011 and 2010:
|
Fiscal Years Ended March 31,
|
||||||||
|
2011
|
2010
|
|||||||
|
Hoists
|
55 | % | 53 | % | ||||
|
Rigging tools
|
20 | 21 | ||||||
|
Industrial cranes
|
8 | 9 | ||||||
|
Actuators and rotary unions
|
15 | 14 | ||||||
|
Other
|
2 | 3 | ||||||
| 100 | % | 100 | % | |||||
Hoists - We manufacture a wide variety of electric chain hoists, electric wire rope hoists, hand-operated hoists, winches, lever tools and air-powered hoists. Load capacities for our hoist product lines range from one-eighth of a ton to 100 tons. These products are sold under our Budgit, Chester, CM, Coffing, Little Mule, Pfaff, Shaw-Box, Yale and other recognized brands. Our hoists are sold for use in numerous general industrial applications, as well as for use in the construction, energy, mining, food services, entertainment and other markets. We also supply hoist trolleys, driven manually or by electric motors, for the industrial, consumer and OEM markets.
We also offer several lines of standard and custom-designed, below-the-hook tooling, clamps, and textile strappings. Below-the-hook tooling, textile and chain slings and associated forgings, and clamps are specialized lifting apparatus used in a variety of lifting activities performed in conjunction with hoisting or lifting applications.
Rigging Tools - We manufacture alloy and carbon steel chain for various industrial and consumer applications. U.S. federal regulations require the use of alloy chain, which we first developed, for overhead lifting applications because of its strength and wear characteristics. A line of our alloy chain is sold under the Herc-Alloy brand name for use in overhead lifting, pulling and restraining applications. In addition, we also sell specialized load chain for use in hoists, as well as three grades and multiple sizes of carbon steel welded-link chain for various load securing and other non-overhead lifting applications. We also manufacture kiln chain sold primarily to the cement manufacturing market.
We produce a broad line of alloy and carbon steel closed-die forged attachments, including hooks, shackles, hitch pins and master links. These forged attachments are used in chain, wire rope and textile rigging applications in a variety of industries, including transportation, mining, construction, marine, logging, petrochemical and agriculture.
In addition, we manufacture carbon steel forged and stamped products, such as load binders, logging tools and other securing devices, for sale to the industrial, consumer and logging markets through industrial distributors, hardware distributors, mass merchandiser outlets and OEMs.
Industrial Cranes - We participate in the U.S. crane manufacturing and servicing markets through our offering of overhead bridge, jib and gantry cranes. Our products are sold under the CES, Abell-Howe, Gaffey and Washington Equipment brands. Crane builders represent a specific distribution channel for electric wire rope hoists, chain hoists and other crane components.
8
Actuators and Rotary Unions - Through our Duff-Norton and Pfaff divisions, we design and manufacture industrial components such as mechanical and electromechanical actuators and rotary unions. Actuators are linear motion devices used in a variety of industries, including the transportation, paper, steel, energy, aerospace and many other commercial industries. Rotary unions are devices that transfer a liquid or gas from a fixed pipe or hose to a rotating drum, cylinder or other device. Rotary unions are used in a variety of industries including pulp and paper, printing, textile and fabric manufacturing, rubber and plastic.
Other - This category includes tire shredders and light-rail systems. We have developed and patented a line of heavy equipment that shreds whole tires, for use in recycling the various components of a tire including: rubber and steel. These recycled products also can be used as aggregate, playgrounds, sports surfaces, landscaping and other such applications, as well as scrap steel. Light-rail systems are portable steel overhead beam configurations used at workstations, from which hoists are an integral component.
Sales and Marketing
Our sales and marketing efforts consist of the following programs:
Factory-Direct Field Sales and Customer Service - We sell our products through our sales force of more than 125 sales people and through independent sales agents worldwide. We compensate our sales force through a combination of base salary and a commission plan based on top line sales and a pre-established sales quota.
Product Advertising - We promote our products by advertising in leading trade journals as well as producing and distributing high quality information catalogs. We run targeted advertisements for hoists, chain, forged attachments, actuators, and cranes.
Target Marketing - With increased emphasis beginning in fiscal 2010, we provide marketing literature to target specific end-user market sectors including entertainment, construction, energy, mining, food service and others. This literature displays our broad product offering applicable to those sectors to enhance awareness at the end-user level within those sectors. We also employ vertical market specialists to support our field sales force to assist our customers with solving their material handling application needs.
Trade Show Participation - Trade shows are central to the promotion of our products, and we participate in more than 30 regional, national and international trade shows each year. Shows in which we participate range from global events held in Germany to local “markets” and “open houses” organized by individual hardware and industrial distributors. We also attend specialty shows for the entertainment, rental and safety markets, construction, as well as general purpose industrial and hardware shows. In fiscal 2011, we participated in trade shows in the U.S., Canada, Mexico, Germany, the United Kingdom, France, China, Brazil, Russia, and the United Arab Emirates.
Industry Association Membership and Participation - As a recognized industry leader, we have a long history of work and participation in a variety of industry associations. Our management is directly involved in numerous industry associations including the following: ISA (Industrial Supply Association), AWRF (Associated Wire Rope Fabricators), PTDA (Power Transmission and Distributors Association), SCRA (Specialty Carriers and Riggers Association), WSTDA (Web Sling and Tie Down Association), MHI (Material Handling Institute), HMI (Hoist Manufacturers Institute), CMAA (Crane Manufacturers Association of America), ESTA (Entertainment Services and Technology Association), NACM (National Association of Chain Manufacturers) and ARA (American Rental Association).
Product Standards and Safety Training Classes - We conduct on-site training and certification programs worldwide for distributors and end-users to promote and reinforce the attributes of our products and their safe use and operation in various material handling applications. These training and certification programs include crane inspection and operation training and certification, hoist inspection and repair training and certification, various rigging training courses, load securement training, and entertainment technology equipment training and certification classes.
9
Web Sites - Our main corporate web site www.cmworks.com supports the Company’s broad product offering providing product data, maintenance manuals and related information for 11 brands within our product portfolio. The site also provides detailed search and simultaneous product comparisons, the ability to submit “Requests for Quotations” and allow users to be able chat live with a member of our customer service department. In addition to our main site we maintain an additional 20 sites supporting various product lines, industry segments and geographies. Within these sites we currently sell Towing products, Training, and standard hoist products manufactured by Pfaff. Distributors also have access to a secure, extranet portal website allowing them to enter sales orders, search pricing information, check order status, and product serial number information.
Distribution and Markets
Our distribution channels include a variety of commercial distributors. In addition, we sell overhead bridge, jib and gantry cranes as well as certain Pfaff products directly to end-users. The following describes our global distribution channels:
General Distribution Channels - Our global general distribution channels consist of:
|
—
|
Industrial distributors that serve local or regional industrial markets and sell a variety of products for maintenance repair, operating and production, or MROP, applications through their own direct sales force.
|
|
—
|
Rigging shops that are distributors with expertise in rigging, lifting, positioning and load securing. Most rigging shops assemble and distribute chain, wire rope and synthetic slings and distribute manual hoists and attachments, chain slings and other products.
|
|
—
|
Independent crane builders that design, build, install and service overhead crane and light-rail systems for general industry and also distribute a wide variety of hoists and crane components. We sell electric wire rope hoists and chain hoists as well as crane components, such as end trucks, trolleys, drives and electrification systems to crane builders.
|
Specialty Distribution Channels - Our global specialty distribution channels consist of:
|
—
|
National distributors that market a variety of MROP supplies, including material handling products, either exclusively through large, nationally distributed catalogs, or through a combination of catalog, internet and branch sales and a field sales force. The customer base served by national distributors such as W. W. Grainger, which traditionally included smaller industrial companies and consumers, has grown to include large industrial accounts and integrated suppliers.
|
|
—
|
Material handling specialists and integrators that design and assemble systems incorporating hoists, overhead rail systems, trolleys, scissor lift tables, manipulators, air balancers, jib arms and other material handling products to provide end-users with solutions to their material handling problems.
|
|
—
|
Entertainment equipment distributors that design, supply and install a variety of material handling and rigging equipment for concerts, theaters, ice shows, sporting events, convention centers and night clubs.
|
Pfaff International Direct - Our German-based Pfaff business markets and sells most of its actuators and certain of its hoist products direct to end-users, providing an additional method to market for us in the European region.
10
Crane End-Users - We market and sell overhead bridge, jib and gantry cranes, parts and service to end-users through our wholly owned crane builder, Crane Equipment & Service, Inc. (“CES”). CES which includes Abell-Howe, Gaffey and Washington Equipment brands designs, manufactures, installs and services a variety of cranes with capacities up to 100 tons.
Service-After-Sale Distribution Channel - Service-after-sale distributors include our authorized network of 14 chain repair service stations and approximately 340 hoist service and repair stations throughout North America. This service network is designed for easy parts and service access for our large installed base of hoists and related equipment in that region.
OEM/Government Distribution Channels - This channel consists of:
|
—
|
OEMs that supply various component parts directly to other industrial manufacturers as well as private branding and packaging of our traditional products for material handling, lifting, positioning and special purpose applications.
|
|
—
|
Government agencies, including the U.S. and Canadian Navies and Coast Guards, that purchase primarily load securing chain and forged attachments. We also provide our products to the U.S government for a variety of military applications.
|
Customer Service and Training
We maintain customer service departments staffed by trained personnel for all of our sales divisions, and regularly schedule product and service training schools for all customer service representatives and field sales personnel. Training programs for distribution and service station personnel, as well as for end-users, are scheduled on a regular basis at most of our facilities and in the field. We have approximately 340 service and repair stations worldwide that provide local and regional repair, warranty and general service work for distributors and end-users. End-user trainees attending our various programs include representatives of 3M, Cummins Engine, DuPont, GTE, General Electric, John Deere, Praxair and many other industrial and entertainment organizations.
We also provide, in multiple languages, a variety of collateral material in video, cassette, CD-ROM, slide and print format addressing relevant material handling topics such as the care, use and inspection of chains and hoists, and overhead lifting and positioning safety. In addition, we sponsor advisory boards made up of representatives of our primary distributors and service-after-sale network members who are invited to participate in discussions focused on improving products and service. These boards enable us and our primary distributors to exchange product and market information relevant to industry trends.
Backlog
Our backlog of orders at March 31, 2011 was approximately $89,393,000 compared to approximately $67,819,000 at March 31, 2010. Our orders for standard products are generally shipped within one week. Orders for products that are manufactured to customers’ specifications are generally shipped within four to twelve weeks. Given the short product lead times, we do not believe that the amount of our backlog of orders is a reliable indication of our future sales. Fluctuations in backlog reflect the project oriented nature of certain aspects of our business.
Competition
The material handling industry remains highly fragmented. We face competition from a wide range of regional, national and international manufacturers globally. In addition, we often compete with individual operating units of larger, highly diversified companies.
11
The principal competitive factors affecting our business include customer service and support as well as product availability, performance, functionality, brand reputation, reliability and price. Other important factors include distributor relationships and territory coverage.
Major competitors for hoists are Konecranes, Demag Cranes and Kito (and its U.S. subsidiary Harrington); for chain are Campbell Chain, Peerless Chain Company and American Chain and Cable Company; for forged attachments are The Crosby Group and Brewer Tichner Company; for cranes are Konecranes, Demag Cranes and a variety of independent crane builders; for actuators and rotary unions are Deublin, Joyce-Dayton and Nook Industries; for tire shredders is Granutech; and for light-rail systems is Gorbel.
Employees
At March 31, 2011, we had 2,531 employees; 1,516 in the U.S./Canada, 64 in Latin America, 658 in Europe and 293 in Asia. Approximately 13% of our employees are represented under four separate U.S. or Canadian collective bargaining agreements which terminate at various times between September 2011 and May 2014. The collective bargaining negotiations which will begin in September 2011 will impact approximately 6% of our workforce. We also have various labor agreements with our non-U.S. employees which we negotiate from time to time. We believe that our relationship with our employees is good and that the risk of a disruption in production related to these negotiations is remote.
Raw Materials and Components
Our principal raw materials and components are steel, consisting of structural steel, processed steel bar, forging bar steel, steel rod and wire, steel pipe and tubing and tool steel; electric motors; bearings; gear reducers; castings; and electro-mechanical components. These commodities are all available from multiple sources. We purchase most of these raw materials and components from a limited number of strategic and preferred suppliers under long-term agreements which are negotiated on a company-wide basis through our Purchasing Council to take advantage of volume discounts. We generally seek to pass on materials price increases to our distribution channel partners and end-user customers. We will continue to monitor our costs and reevaluate our pricing policies. Our ability to pass on these increases is determined by market conditions.
Hedging Activities
We use derivative instruments to manage selected foreign currency exposures. The Company does not use derivative instruments for speculative trading purposes.
We use foreign currency forward agreements and a cross-currency swap to offset changes in the value of intercompany loans to certain foreign subsidiaries due to changes in foreign exchange rates. In addition, we use foreign currency forward agreements to i) hedge changes in the value of booked foreign currency liabilities due to changes in foreign exchange rates at the settlement date and ii) to hedge a portion of forecasted inventory purchases denominated in a foreign currency.
Manufacturing
We complement our own manufacturing by outsourcing components and finished goods from an established global network of suppliers. We regularly upgrade our global manufacturing facilities and invest in tooling, equipment and technology. In 2001, we began implementing Lean improvement techniques in our business which has resulted in inventory reductions in required manufacturing floor area, shorter product lead time and increased productivity.
Our manufacturing operations are highly integrated. Although raw materials and some components such as motors, bearings, gear reducers, castings and electro-mechanical components are purchased, our vertical integration enables us to produce many of the components used in the manufacturing of our products. We manufacture hoist lifting chain, steel forged gear blanks, lift wheels, trolley wheels, and hooks and other attachments for incorporation into our hoist products. These products are also sold as spare parts for hoist repair. Additionally, our hoists are used as components in the manufacture of crane systems by us as well as our crane-builder customers.
12
Environmental and Other Governmental Regulation
Like most manufacturing companies, we are subject to various federal, state and local laws relating to the protection of the environment. To address the requirements of such laws, we have adopted a corporate environmental protection policy which provides that all of our owned or leased facilities shall, and all of our employees have the duty to, comply with all applicable environmental regulatory standards, and we have initiated an environmental auditing program for our facilities to ensure compliance with such regulatory standards. We have also established managerial responsibilities and internal communication channels for dealing with environmental compliance issues that may arise in the course of our business. We have made and could be required to continue to make significant expenditures to comply with environmental requirements. Because of the complexity and changing nature of environmental regulatory standards, it is possible that situations will arise from time to time requiring us to incur additional expenditures in order to ensure environmental regulatory compliance. However, we are not aware of any environmental condition or any operation at any of our facilities, either individually or in the aggregate, which would cause expenditures having a material adverse effect on our results of operations, financial condition or cash flows and, accordingly, have not budgeted any material capital expenditures for environmental compliance for fiscal 2012.
In addition, we notified the North Carolina Department of Environment and Natural Resources (the “DENR”) in April 2006 of the presence of certain contaminants in excess of regulatory standards at our Coffing Hoist facility in Wadesboro, North Carolina. We filed an application with the DENR to enter its voluntary cleanup program and were accepted. We investigated under the supervision of a DENR Registered Environmental Consultant (“the REC”) and have commenced voluntary clean-up at the facility. At this time, additional remediation costs are not expected to exceed the accrued balance of $200,000.
In March of 2007, we also discovered the presence of certain contaminants in excess of regulatory standards at our Damascus, Virginia hoist plant and have notified the Virginia Department of Environmental Quality (the “DEQ”). We filed an application with the DEQ to participate in its voluntary remediation program and have been accepted. We are currently investigating under the terms of the DEQ Voluntary Remediation Program and, if appropriate, will remediate site conditions at the facility. At this time, investigative and remediation costs are not expected to be significant.
In June of 2007, we were identified by the New York State Department of Environmental Conservation (“the DEC”), along with other companies, as a potential responsible party (“PRP”) at the Frontier Chemical Royal Avenue Site in Niagara Falls, New York. From 1974 to 1992, the Frontier Royal Avenue Site had been operated as a commercial waste treatment and disposal facility. We sent waste sulfuric acid pickling solution generated at our facility in Tonawanda, New York to the Frontier Royal Avenue Site during the period from approximately 1982 to 1984. We have joined with other PRP members known as the Frontier Chemical Site Joint Defense Alliance Group to conduct investigation and, if appropriate, remediation activities at the site. At this stage, we do not have an estimate of likely remediation costs, if any, but do not believe that such costs would have a material adverse effect on our financial condition or operating results.
For all of the currently known environmental matters, we have accrued a total of $300,000 as of March 31, 2011 which, in our opinion, is sufficient to deal with such matters. Further, we believe that the environmental matters known to, or anticipated by us should not, individually or in the aggregate, have a material adverse effect on our operating results or financial condition. However, there can be no assurance that potential liabilities and expenditures associated with unknown environmental matters, unanticipated events, or future compliance with environmental laws and regulations will not have a material adverse effect on us.
Our operations are also governed by many other laws and regulations, including those relating to workplace safety and worker health, principally OSHA in the U.S. and regulations thereunder. We believe that we are in substantial compliance with these laws and regulations and do not believe that future compliance with such laws and regulations will have a material adverse effect on our operating results, financial condition, or liquidity.
13
Available Information
Our internet address is www.cmworks.com. We make available free of charge through our website our Annual Report on Form 10-K, Quarterly Reports on Form 10-Q, Current Reports on Form 8-K and amendments to those reports filed or furnished pursuant to Section 13(a) or 15(d) of the Securities Exchange Act of 1934, as amended, as soon as reasonably practicable after such documents are electronically filed with, or furnished to, the Securities and Exchange Commission.
14
|
Item 1A.
|
Risk Factors
|
Columbus McKinnon is subject to a number of risk factors that could negatively affect our results from business operations or cause actual results to differ materially from those projected or indicated in any forward looking statement. Such factors include, but are not limited to, the following:
Adverse changes in global economic conditions may negatively affect our industry, business and results of operations.
Financial markets in the United States, Europe and Asia have experienced substantial disruption including, among other things, extreme volatility in security prices, severely diminished liquidity and credit availability, rating downgrades of certain investments and declining valuations of others. Governments have taken unprecedented actions intended to address these market conditions and the extent to which such government actions may prove effective remains unclear. The future economic environment may worsen.
Our industry is affected by changes in economic conditions outside our control, which can result in a general decrease in product demand from our customers. Such economic developments may affect our business in a number of ways. Reduced demand may drive us and our competitors to offer products at promotional prices, which would have a negative impact on our profitability. In addition, the current tightening of credit in financial markets may adversely affect the ability of our customers and suppliers to obtain financing for significant purchases and operations and could result in a decrease in, or cancellation of, orders for our products. If demand for our products slows down or decreases, we will not be able to improve our revenues and we may run the risk of failing to satisfy the financial and other restrictive covenants to which we are subject under our existing indebtedness. Reduced revenues as a result of decreased demand may also reduce our planned growth and otherwise hinder our ability to improve our performance in connection with our long term strategy.
Our business is cyclical and is affected by industrial economic conditions, and, during the global recession in fiscal 2009 and fiscal 2010 we experienced substantially reduced demand for our products.
Many of the end-users of our products are in highly cyclical industries that are sensitive to changes in general economic conditions. Their demand for our products, and thus our results of operations, is directly related to the level of production in their facilities, their construction and capital expenditure budgets, changes in their vertical market sectors and other factors beyond our control. In the fiscal years ended March 31, 2009 and 2010, for example, we experienced significantly reduced demand for our products, generally as a result of the global economic slowdown. These lower levels of demand resulted in a 20% decline in net sales from our 2008 fiscal year to our 2010 fiscal year, from $593,800,000 to $476,100,000, despite our acquisition of Pfaff in the middle of our 2009 fiscal year. This decline in net sales resulted in a 105% decrease in our income from operations during the same period. We have seen improvement in demand for our products in the fiscal year ended March 31, 2011. Our net sales for the year ended March 31, 2011 were $524,065,000, up $47,882,000 or 10.1% from the year ending March 31, 2010. However, there is no certainty that this improvement will continue in the future.
Our business is highly competitive and subject to consolidation of competitors. Increased competition could reduce our sales, earnings, and profitability.
The principal markets that we serve within the material handling industry are fragmented and highly competitive. Competition is based primarily on customer service and support as well as product availability, performance, functionality, brand reputation, reliability and price. Our competition in the markets in which we participate comes from companies of various sizes, some of which have greater financial and other resources than we do. Increased competition could force us to lower our prices or to offer additional services at a higher cost to us, which could reduce our gross margins and net income.
15
The greater financial resources or the lower amount of debt of certain of our competitors may enable them to commit larger amounts of capital in response to changing market conditions. Certain competitors may also have the ability to develop product or service innovations that could put us at a disadvantage. In addition, through consolidation, some of our competitors have achieved substantially more market penetration in certain of the markets in which we operate. If we are unable to compete successfully against other manufacturers of material handling equipment, we could lose customers and our revenues may decline. There can also be no assurance that customers will continue to regard our products favorably, that we will be able to develop new products that appeal to customers, that we will be able to improve or maintain our profit margins on sales to our customers or that we will be able to continue to compete successfully in our core markets.
Our operations outside the U.S. pose certain risks that may adversely impact sales and earnings.
We have operations and assets located outside of the United States, primarily in China, Mexico, Germany, the United Kingdom, France, and Hungary. In addition, we import a portion of our hoist product line from Asia, and sell our products to distributors located in approximately 50 countries. In our fiscal year ended March 31, 2011, approximately 46% of our net sales were derived from non-U.S. markets. These non-U.S. operations are subject to a number of special risks, in addition to the risks of our U.S. business, differing protections of intellectual property, trade barriers, labor unrest, exchange controls, regional economic uncertainty, differing (and possibly more stringent) labor regulation, risk of governmental expropriation, U.S. and foreign customs and tariffs, current and changing regulatory environments, difficulty in obtaining distribution support, difficulty in staffing and managing widespread operations, differences in the availability and terms of financing, political instability and risks of increases in taxes. Also, in some foreign jurisdictions we may be subject to laws limiting the right and ability of entities organized or operating therein to pay dividends or remit earnings to affiliated companies unless specified conditions are met. These factors may adversely affect our future profits.
Part of our strategy is to expand our worldwide market share and reduce costs by strengthening our international distribution capabilities and sourcing basic components in lower cost countries, in particular in China and Hungary. Implementation of this strategy may increase the impact of the risks described above, and we cannot assure you that such risks will not have an adverse effect on our business, results of operations or financial condition.
Our strategy depends on successful integration of acquisitions.
Acquisitions are a key part of our growth strategy. Our historical growth has depended, and our future growth is likely to depend on our ability to successfully implement our acquisition strategy, and the successful integration of acquired businesses into our existing operations. We intend to continue to seek additional acquisition opportunities in accordance with our acquisition strategy, both to expand into new markets and to enhance our position in existing markets throughout the world. If we are unable to successfully integrate acquired businesses into our existing operations or expand into new markets, our sales and earnings growth could be reduced.
Our products involve risks of personal injury and property damage, which exposes us to potential liability.
Our business exposes us to possible claims for personal injury or death and property damage resulting from the products that we sell. We maintain insurance through a combination of self-insurance retentions and excess insurance coverage. We monitor claims and potential claims of which we become aware and establish accrued liability reserves for the self-insurance amounts based on our liability estimates for such claims. We cannot give any assurance that existing or future claims will not exceed our estimates for self-insurance or the amount of our excess insurance coverage. In addition, we cannot give any assurance that insurance will continue to be available to us on economically reasonable terms or that our insurers would not require us to increase our self-insurance amounts. Claims brought against us that are not covered by insurance or that are in excess of insurance coverage could have a material adverse effect on our results, financial condition, or liquidity.
In addition, like many industrial manufacturers, we are also involved in asbestos-related litigation. In continually evaluating costs relating to our estimated asbestos-related liability, we review, among other things, the incidence of past and recent claims, the historical case dismissal rate, the mix of the claimed illnesses and occupations of the plaintiffs, our recent and historical resolution of the cases, the number of cases pending against us, the status and results of broad-based settlement discussions, and the number of years such activity might continue. Based on this review, we estimate our share of liability to defend and resolve probable asbestos related personal injury claims. This estimate is highly uncertain due to the limitations of the available data and the difficulty of forecasting with any certainty the numerous variables that can affect the range of the liability. We continue to study the variables in light of additional information in order to identify trends that may become evident and to assess their impact on the range of liability that is probable and estimable. We believe that the potential additional costs for claims will not have a material after-tax effect on our financial condition or liquidity, although the net after-tax effect of any future liabilities recorded could be material to earnings in a future period. See Note 16 to our March 31, 2011 consolidated financial statements incorporated herein by reference.
16
As indicated above, our self-insurance coverage is effected through our captive insurance subsidiary. The reserves of our captive insurance subsidiary are subject to periodic adjustments based upon actuarial evaluations, which adjustments impact our overall results of operations. These periodic adjustments can be favorable or unfavorable.
We are subject to currency fluctuations from our sales outside the U.S..
Our products are sold in many countries around the world. Thus, a portion of our revenues (approximately $241,970,000 in our fiscal year ended March 31, 2011) are generated in foreign currencies, including principally the euro and the Canadian dollar, and while much of the costs incurred to generate those revenues are incurred in the same currency, a portion is incurred in other currencies. Since our financial statements are denominated in U.S. dollars, changes in currency exchange rates between the U.S. dollar and other currencies have had, and will continue to have, a currency translation impact on our earnings. Currency fluctuations may impact our financial performance in the future.
Our future operating results may be affected by fluctuations in steel or other material prices. We may not be able to pass on increases in raw material costs to our customers.
The principal raw material used in our chain, forging and crane building operations is steel. The steel industry as a whole is highly cyclical, and at times pricing and availability can be volatile due to a number of factors beyond our control, including general economic conditions, labor costs, competition, import duties, tariffs and currency exchange rates. This volatility can significantly affect our raw material costs. In an environment of increasing raw material prices, competitive conditions will determine how much of the steel price increases we can pass on to our customers. During historical rising cost periods, we were generally successful in adding and maintaining a surcharge to the prices of our high steel content products or incorporating them into price increases, with a goal of margin neutrality. In the future, to the extent we are unable to pass on any steel price increases to our customers, our profitability could be adversely affected.
We rely in large part on independent distributors for sales of our products.
For the most part, we depend on independent distributors to sell our products and provide service and aftermarket support to our end-user customers. Distributors play a significant role in determining which of our products are stocked at the branch locations, and hence are most readily accessible to aftermarket buyers, and the price at which these products are sold. Almost all of the distributors with whom we transact business offer competitive products and services to our end-user customers. For the most part, we do not have written agreements with our distributors. The loss of a substantial number of these distributors or an increase in the distributors' sales of our competitors' products to our ultimate customers could materially reduce our sales and profits.
We are subject to various environmental laws which may require us to expend significant capital and incur substantial cost.
Our operations and facilities are subject to various federal, state, local and foreign requirements relating to the protection of the environment, including those governing the discharges of pollutants in the air and water, the generation, management and disposal of hazardous substances and wastes and the cleanup of contaminated sites. We have made, and will continue to make, expenditures to comply with such requirements. Violations of, or liabilities under, environmental laws and regulations, or changes in such laws and regulations (such as the imposition of more stringent standards for discharges into the environment), could result in substantial costs to us, including operating costs and capital expenditures, fines and civil and criminal sanctions, third party claims for property damage or personal injury, clean-up costs or costs relating to the temporary or permanent discontinuance of operations. Certain of our facilities have been in operation for many years, and we have remediated contamination at some of our facilities. Over time, we and other predecessor operators of such facilities have generated, used, handled and disposed of hazardous and other regulated wastes. Additional environmental liabilities could exist, including clean-up obligations at these locations or other sites at which materials from our operations were disposed, which could result in substantial future expenditures that cannot be currently quantified and which could reduce our profits or have an adverse effect on our financial condition, operations, or liquidity.
17
We rely on subcontractors or suppliers to perform their contractual obligations.
Some of our contracts involve subcontracts with other companies upon which we rely to perform a portion of the services we must provide to our customers. There is a risk that we may have disputes with our subcontractors, including disputes regarding the quality and timeliness of work performed by our subcontractor or customer concerns about the subcontractor. Failure by our subcontractors to satisfactorily provide on a timely basis the agreed-upon supplies or perform the agreed upon services may materially and adversely impact our ability to perform our obligations as the prime contractor. A delay in our ability to obtain components and equipment parts from our suppliers may affect our ability to meet our customers' needs and may have an adverse effect upon our profitability.
We are subject to debt covenant restrictions.
Our revolving credit facility contains, and the indenture governing the notes will contain, several financial and other restrictive covenants. A significant decline in our operating income or cash generating ability could cause us to violate our leverage or fixed charge coverage ratios in our bank credit facility. This could result in our being unable to borrow under our bank credit facility or being obliged to refinance and renegotiate the terms of our bank indebtedness.
We depend on our senior management team and the loss of any member could adversely affect our operations.
Our success is dependent on the management and leadership skills of our senior management team. The loss of any of these individuals or an inability to attract, retain and maintain additional personnel could prevent us from implementing our business strategy. We cannot assure you that we will be able to retain our existing senior management personnel or to attract additional qualified personnel when needed.
We have recently hired a new general counsel who joined us in January 2011. We continually evaluate and assess our personnel and may make additional changes to the members or assignments of our senior management team in the future.
We have not entered into employment agreements with any of our senior management personnel with the exception of Dr. Ivo Celi, our Managing Director, EMEA.
18
|
Item 1B.
|
Unresolved Staff Comments
|
None.
|
Item 2.
|
Properties
|
We maintain our corporate headquarters in Amherst, New York and, as of March 31, 2011, conducted our principal manufacturing at the following facilities:
|
Location
|
|
Products/Operations
|
|
Square Footage |
|
Owned or Leased | |
|
|
Major facilities:
|
|
|
|
|
|
|
|
1.
|
Wadesboro, NC
|
|
Hoists
|
|
186,000
|
|
Owned
|
|
2.
|
Lexington, TN
|
|
Chain
|
|
165,000
|
|
Owned
|
|
3.
|
Charlotte, NC
|
|
Actuators and Rotary Unions
|
|
146,000
|
|
Leased
|
|
4.
|
Damascus, VA
|
|
Hoists
|
|
90,000
|
|
Owned
|
|
5.
|
Forging operation:
|
|
|
|
|
|
|
|
|
Chattanooga, TN
|
|
Forged attachments
|
|
81,000
|
|
Owned
|
|
|
Chattanooga, TN
|
|
Forged attachments
|
|
59,000
|
|
Owned
|
|
6.
|
Ohio hoist operation:
|
|
|
|
|
|
|
|
|
Salem, OH
|
|
Hoists
|
|
49,000
|
|
Leased
|
|
|
Lisbon, OH
|
|
Hoists and below-the-hook tooling
|
|
37,000
|
|
Owned
|
|
7.
|
Velbert, Germany
|
|
Hoists
|
|
108,000
|
|
Owned
|
|
8.
|
Kissing, Germany
|
|
Hoists, winches, and actuators
|
|
107,000
|
|
Leased
|
|
9.
|
Santiago, Tianguistenco, Mexico
|
|
Hoists
|
|
91,000
|
|
Owned
|
|
10.
|
Asia operation:
|
|
|
|
|
|
|
|
|
Hangzhou, China
|
|
Hoists and hand pallet trucks
|
|
78,000
|
|
Leased
|
|
|
Hangzhou, China
|
|
Textile strappings
|
|
58,000
|
|
Leased
|
|
|
Hangzhou, China
|
|
Metal fabrication, textiles and textile strappings
|
|
51,000
|
|
Leased
|
|
11.
|
Chester, United Kingdom
|
|
Plate clamps
|
|
48,000
|
|
Leased
|
|
12.
|
Szekesfeher, Hungary
|
|
Textiles and textile strappings
|
|
24,000
|
|
Leased
|
|
|
|
|
|
|
|
|
|
|
|
Non-major facilities:
|
|
|
|
|
|
|
|
|
Eureka, IL
|
|
Cranes
|
|
91,000
|
|
Owned
|
|
|
Cleveland, TX
|
|
Cranes
|
|
39,000
|
|
Owned
|
|
|
Sarasota, FL
|
|
Tire shredders
|
|
25,000
|
|
Owned
|
|
|
Heilbronn, Germany
|
|
Actuators
|
|
23,000
|
|
Leased
|
|
|
Romeny-sur-Marne, France
|
|
Rotary unions
|
|
22,000
|
|
Owned
|
In addition, we have a total of 52 sales offices, distribution centers and warehouses. We believe that our properties have been adequately maintained, are in generally good condition and are suitable for our business as presently conducted. We also believe our existing facilities provide sufficient production capacity for our present needs and for our anticipated needs in the foreseeable future. Upon the expiration of our current leases, we believe that either we will be able to secure renewal terms or enter into leases for alternative locations at market terms.
19
|
Item 3.
|
Legal Proceedings
|
From time to time, we are named a defendant in legal actions arising out of the normal course of business. We are not a party to any pending legal proceeding other than ordinary, routine litigation incidental to our business. We do not believe that any of our pending litigation will have a material impact on our business. We maintain comprehensive general product liability insurance against risks arising out of the use of our products sold to customers through our wholly-owned New York State captive insurance subsidiary of which we are the sole policy holder. The limits of this coverage are currently $3,000,000 per occurrence ($2,000,000 through March 31, 2003) and $6,000,000 aggregate ($5,000,000 through March 31, 2003) per year. We obtain additional insurance coverage from independent insurers to cover potential losses in excess of these limits.
Like many industrial manufacturers, we are also involved in asbestos-related litigation. In continually evaluating costs relating to our estimated asbestos-related liability, we review, among other things, the incidence of past and recent claims, the historical case dismissal rate, the mix of the claimed illnesses and occupations of the plaintiffs, our recent and historical resolution of the cases, the number of cases pending against us, the status and results of broad-based settlement discussions, and the number of years such activity might continue. Based on this review, we do not believe that any of our pending asbestos-related claims will have a material impact on our business. See Note 16 to our March 31, 2011 consolidated financial statements for more information on our asbestos claims.
|
Item 4.
|
Reserved
|
20
PART II
|
Item 5.
|
Market for the Company’s Common Stock and Related Security Holder Matters
|
Our common stock is traded on the Nasdaq Global Select Market under the symbol ‘‘CMCO.” As of April 30, 2011, there were 516 holders of record of our common stock.
We do not currently pay cash dividends. Our current credit agreement allows, but limits our ability to pay dividends. We may reconsider or revise this policy from time to time based upon conditions then existing, including, without limitation, our earnings, financial condition, capital requirements, restrictions under credit agreements or other conditions our Board of Directors may deem relevant.
The following table sets forth, for the fiscal periods indicated, the high and low sale prices per share for our common stock as reported on the Nasdaq Global Select Market.
|
|
Price Range of Common Stock
|
|||||||
|
Year Ended March 31, 2010
|
High
|
Low
|
||||||
|
First Quarter
|
$ | 15.32 | $ | 8.43 | ||||
|
Second Quarter
|
16.28 | 11.36 | ||||||
|
Third Quarter
|
17.79 | 13.61 | ||||||
|
Fourth Quarter
|
17.33 | 12.63 | ||||||
|
|
||||||||
|
Year Ended March 31, 2011
|
||||||||
|
First Quarter
|
$ | 19.26 | $ | 13.92 | ||||
|
Second Quarter
|
16.70 | 12.35 | ||||||
|
Third Quarter
|
21.06 | 15.86 | ||||||
|
Fourth Quarter
|
22.25 | 15.67 | ||||||
On May 20, 2011, the closing price of our common stock on the Nasdaq Global Select Market was $19.98 per share.
21
PERFORMANCE GRAPH
The Performance Graph shown below compares the cumulative total shareholder return on our common stock based on its market price, with the total return of the S&P MidCap 400 Index and the Dow Jones US Diversified Industrials. The comparison of total return assumes that a fixed investment of $100 was invested on March 31, 2006 in our common stock and in each of the foregoing indices and further assumes the reinvestment of dividends. The stock price performance shown on the graph is not necessarily indicative of future price performance.
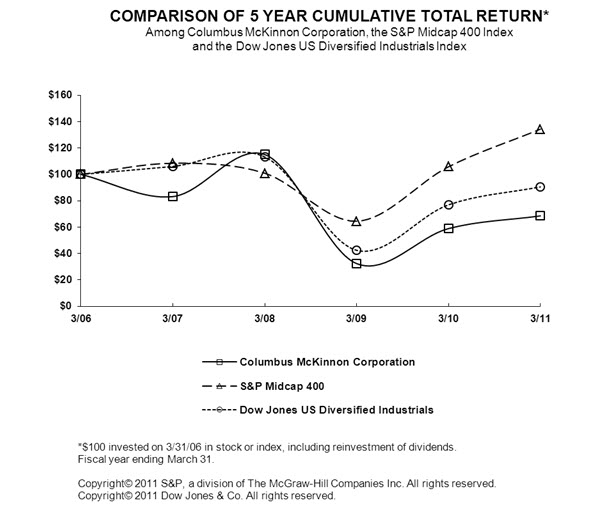
22
|
Item 6.
|
Selected Financial Data
|
The consolidated balance sheets as of March 31, 2011 and 2010, and the related statements of operations, cash flows and shareholders’ equity for the three years ended March 31, 2011 and notes thereto appear elsewhere in this annual report. The selected consolidated financial data presented below should be read in conjunction with, and are qualified in their entirety by “Management’s Discussion and Analysis of Results of Operations and Financial Condition,” our consolidated financial statements and the notes thereto and other financial information included elsewhere in this annual report.
|
|
Year ended March 31st
|
|||||||||||||||||||
|
|
( In millions, except for per share data)
|
|||||||||||||||||||
|
|
2011
|
2010
|
2009
|
2008
|
2007
|
|||||||||||||||
|
|
|
|
|
|
|
|||||||||||||||
|
Statements of Operations Data:
|
|
|
|
|
|
|||||||||||||||
|
Net sales
|
$ | 524.1 | $ | 476.1 | $ | 606.7 | $ | 593.8 | $ | 550.5 | ||||||||||
|
Cost of products sold
|
398.0 | 360.2 | 433.0 | 408.2 | 385.7 | |||||||||||||||
|
Gross profit
|
126.1 | 115.9 | 173.7 | 185.6 | 164.8 | |||||||||||||||
|
Selling expenses
|
62.9 | 64.4 | 72.6 | 69.9 | 59.4 | |||||||||||||||
|
General and administrative expenses
|
40.6 | 36.9 | 37.7 | 34.1 | 30.6 | |||||||||||||||
|
Restructuring charges (1)
|
2.2 | 16.5 | 1.9 | 0.8 | (0.1 | ) | ||||||||||||||
|
Impairment loss (2)
|
- | - | 107.0 | - | - | |||||||||||||||
|
Amortization of intangibles
|
1.8 | 1.9 | 1.0 | 0.1 | 0.2 | |||||||||||||||
|
Income (Loss) from operations
|
18.6 | (3.8 | ) | (46.5 | ) | 80.7 | 74.7 | |||||||||||||
|
Interest and debt expense
|
13.5 | 13.2 | 13.2 | 13.6 | 15.9 | |||||||||||||||
|
Cost of bond redemptions
|
3.9 | - | - | 1.8 | 5.8 | |||||||||||||||
|
Other (income) and expense, net
|
(3.9 | ) | (4.2 | ) | (1.6 | ) | (4.4 | ) | (7.7 | ) | ||||||||||
|
Income (Loss) before income taxes
|
5.1 | (12.8 | ) | (58.1 | ) | 69.7 | 60.7 | |||||||||||||
|
Income tax expense (benefit) (3)
|
41.4 | (5.3 | ) | 18.0 | 22.8 | 22.1 | ||||||||||||||
|
(Loss) income from continuing operations
|
(36.3 | ) | (7.5 | ) | (76.1 | ) | 46.9 | 38.6 | ||||||||||||
|
(Loss) income from discontinued operations (4)
|
0.4 | 0.5 | (2.3 | ) | (9.6 | ) | (4.5 | ) | ||||||||||||
|
Net (loss) income
|
$ | (35.9 | ) | $ | (7.0 | ) | $ | (78.4 | ) | $ | 37.3 | $ | 34.1 | |||||||
|
Diluted (loss) earnings per share from continuing operations
|
$ | (1.91 | ) | $ | (0.40 | ) | $ | (4.04 | ) | $ | 2.45 | $ | 2.04 | |||||||
|
Basic (loss) earnings per share from continuing operations
|
$ | (1.91 | ) | $ | (0.40 | ) | $ | (4.04 | ) | $ | 2.50 | $ | 2.09 | |||||||
|
Weighted average shares outstanding – assuming dilution
|
19.0 | 19.0 | 18.9 | 19.2 | 19.0 | |||||||||||||||
|
Weighted average shares outstanding – basic
|
19.0 | 19.0 | 18.9 | 18.7 | 18.5 | |||||||||||||||
|
|
||||||||||||||||||||
|
Balance Sheet Data (at end of period):
|
||||||||||||||||||||
|
Total assets
|
478.9 | 481.5 | 491.7 | 590.0 | 565.6 | |||||||||||||||
|
Total debt (5)
|
154.4 | 132.8 | 137.9 | 133.3 | 159.4 | |||||||||||||||
|
Total debt, net of cash and cash equivalents
|
74.3 | 68.8 | 98.7 | 57.3 | 110.7 | |||||||||||||||
|
Total shareholders’ equity
|
162.1 | 187.3 | 181.9 | 295.5 | 241.3 | |||||||||||||||
|
|
||||||||||||||||||||
|
Other Data:
|
||||||||||||||||||||
|
Net cash provided by operating activities
|
3.3 | 29.9 | 60.2 | 59.6 | 45.5 | |||||||||||||||
|
Net cash used in investing activities
|
(4.3 | ) | (1.4 | ) | (65.5 | ) | (8.6 | ) | (3.4 | ) | ||||||||||
|
Net cash provided by (used in) financing activities
|
15.8 | (5.4 | ) | (22.5 | ) | (28.6 | ) | (39.9 | ) | |||||||||||
|
Capital expenditures
|
12.5 | 7.2 | 12.2 | 12.5 | 10.5 | |||||||||||||||
23
|
|
(1)
|
Refer to “Results of Operations” in “Item 7. Management’s Discussion and Analysis of Results of Operations and Financial Condition” for a discussion of the restructuring charges related to fiscal 2011, 2010, and 2009.
|
|
|
(2)
|
The Company’s impairment testing is performed on an annual basis in the fourth quarter of each year. The Company recorded a $107,000,000 goodwill impairment charge in accordance with ASC Topic 350-20 during the fourth quarter of fiscal 2009. Refer to “Item 7. Management’s Discussion and Analysis of Results of Operations and Financial Condition” and Note 9 to our consolidated financial statements for additional information on Goodwill and Intangible Assets.
|
|
|
(3)
|
During 2011, the Company recorded non-cash charge of $42,983,000 included within its provision for income taxes. The majority of this charge relates to the Company’s determination that a full valuation allowance against its deferred tax assets generated in the U.S is necessary. Accounting rules require a reduction of the carrying amounts of deferred tax assets by a valuation allowance if, based on the available and objectively verifiable evidence, it is more likely than not that such assets will not be realized. The existence of cumulative losses for a certain threshold period is a significant form of negative evidence used in the assessment. If a cumulative loss threshold is met, the accounting rules indicate that forecasts of future profitability are generally not sufficient positive evidence to overcome the presumption that a valuation allowance is necessary.
|
|
|
(4)
|
In July 2008, the Company sold its integrated material handling conveyor systems business, Univeyor A/S and its results of operations have been reflected as discontinued operations for all periods presented. In May 2002, the Company sold substantially all of the assets of ASI. As part of the sale of ASI, the Company received an 8% subordinated note in the principal amount of $6,800,000 which is payable over 10 years beginning in August 2004. The full amount of this note has been reserved due to the uncertainty of collection. Principal payments received on the note are recorded as income from discontinued operations at the time of receipt. All interest and principal payments required under the note have been made to date. Refer to Note 4 to our consolidated financial statements for additional information on Discontinued Operations.
|
|
|
(5)
|
Total debt includes all debt, including the current portion, notes payable and subordinated debt.
|
24
|
Item 7.
|
Management’s Discussion and Analysis of Results of Operations and Financial Condition
|
This section should be read in conjunction with our consolidated financial statements included elsewhere in this annual report. Comments on the results of operations and financial condition below refer to our continuing operations, except in the section entitled “Discontinued Operations.”
EXECUTIVE OVERVIEW
We are a leading worldwide designer, manufacturer and marketer of material handling products, systems and services which efficiently and safely move, lift, position or secure material. Key products include hoists, actuators, cranes and lifting and rigging tools. The Company is focused on commercial and industrial applications that require the safety and quality provided by its superior design and engineering know-how.
Founded in 1875, we have grown to our current size and leadership position through organic growth and acquisitions. We developed our leading market position over our 136-year history by emphasizing technological innovation, manufacturing excellence and superior after-sale service. In addition, acquisitions significantly broadened our product lines and services and expanded our geographic reach, end-user markets and customer base. Ongoing initiatives include improving our productivity and increasing penetration of the Asian, Latin American and European marketplaces. In accordance with our strategy, we have been investing in our directed sales and marketing activities, new product development and “Lean” efforts across the Company. Shareholder value will be enhanced through continued emphasis on improvement of the fundamentals including market expansion, a high degree of customer satisfaction, new product development, manufacturing efficiency, cost containment, and efficient capital investment.
Over the course of our history, we have managed through many business cycles and our strong cash flow profile has helped us grow and expand globally. We stand with a strong capital structure which includes sufficient cash reserves, significant revolver availability with an expiration of May 2013, fixed-rate long-term debt which expires in 2019 and a strong cash flow business profile. We believe our liquidity strength and operational cost management actions have enabled us to withstand the recent global economic downturn. During fiscal 2010 we initiated projects to strategically reorganize our North American hoist and rigging operations, which were essentially completed during the first quarter of fiscal 2011. The projects included the closure of two manufacturing facilities and the significant downsizing of a third facility. The closures and downsizing resulted in a reduction of approximately 500,000 square feet of manufacturing space (or approximately 25% of total manufacturing space) and we expect to generate annual savings estimated at approximately $15,000,000.
Additionally our revenue base is now more geographically diverse than at any time in our Company’s history, with approximately 46% derived from customers outside the U.S. in fiscal 2011. We believe this will help balance the impact of changes that will occur in different global economies at different times. As in the past, we monitor both U.S. and Eurozone Industrial Capacity Utilization statistics as indicators of anticipated demand for our product. Since their June 2009 trough, these statistics have consistently improved through April 2011. In addition, we continue to monitor the potential impact of other global and U.S. trends including industrial production, energy costs, steel price fluctuations, interest rates, currency exchange and activity of end-user markets around the globe.
From a strategic perspective, we are investing in global markets and new products as we focus on our greatest opportunities for growth. We maintain a strong North American market share with significant leading market positions in hoists, lifting and sling chain, forged attachments and actuators. We seek to maintain and enhance our market share by continuing and focusing our sales and marketing activities directed toward select North American and global market sectors including energy, construction, entertainment, mining and food processing. Our fiscal 2009 acquisition of Pfaff is enhancing our European market penetration as well as strengthening our global actuator offering. Further, we continue to invest in emerging market penetration, including the geographic regions of Asia, Latin America, and Eastern Europe. We complement these activities with continued investments in new product development, particularly products with global reach.
Regardless of the economic climate and point in the economic cycle, we constantly explore ways to manage our operating margins as well as further improve our productivity and competitiveness. We have specific initiatives related to improved customer satisfaction, reduction of defects, shortened lead times, improved inventory turns and on-time deliveries, reduction of warranty costs, and improved working capital utilization. The initiatives are being driven by the continued implementation of our “Lean” efforts which are fundamentally changing our manufacturing and business processes to be more responsive to customer demand and improving on-time delivery and productivity. In addition to “Lean,” we are working to achieve these strategic initiatives through product simplification, the creation of centers of excellence, and improved supply chain management.
25
We continuously monitor market prices of steel. We purchase approximately $25,000,000 to $35,000,000 of steel annually in a variety of forms including rod, wire, bar, structural and others. Generally, as we experience fluctuations in our costs, we reflect them as price increases or surcharges to our customers with the goal of being margin neutral. Some of our steel costs have increased during this quarter primarily with regards to forged bar as the result of higher scrap and alloy surcharges.
We are also looking for opportunities for growth via strategic acquisitions or joint ventures. The focus of our acquisition strategy centers on opportunities for international market penetration and product line expansion in alignment with our existing core product offering.
We operate in a highly competitive and global business environment, and we are effectively managing through a global economic cycle. We face a variety of opportunities in those markets and geographies, including trends toward increased utilization of the global labor force and the expansion of market opportunities in Asia and other emerging markets. While we continue to execute our long-term growth strategy, we have weathered the current economic cycle with our strong capital structure, including a solid cash position and flexible cost base, aggressively addressing costs and restructuring to enhance future margin opportunities.
RESULTS OF OPERATIONS
Fiscal 2011 sales were $524,065,000, up 10.1%, or $47,882,000 compared with fiscal 2010. The increase in sales was primarily due to an increase of $52,785,000 in volume resulting from the economic recovery and market share gains. Further, price increases resulted in a $4,651,000 increase in sales. These increases were offset by a reduction of sales of $2,695,000 from the October 2009 divestiture of our American Lifts business as well as a negative foreign currency impact of $6,828,000. In fiscal 2010 sales were $476,183,000, down 21.5%, or $130,525,000 compared with fiscal 2009. Our Pfaff acquisition contributed $71,500,000 to our sales for fiscal 2010 with the remaining business being down 28.1%, or $158,000,000, excluding Pfaff. The decline in sales was primarily due to volume decline resulting from the global economic slow down. The divestiture of our American Lift business as well as fewer shipping days also contributed to lower sales in FY 2010 by approximately $5,000,000 but was partially offset by favorable foreign currency impact of approximately $3,500,000.
Our gross profit was approximately 126,052,000, 115,939,000, and 173,701,000 in fiscal 2011, 2010 and 2009, respectively. The fiscal 2011 increase in gross profit of 10,113,000 is the result of a $12,800,000 increase in volume, a $6,700,000 increase in restructuring benefits, $1,500,000 increase in savings on U.S. health and pension expenses, offset by a decrease of $6,800,000 from inefficiencies in our forgings operation, a decrease of $1,800,000 for increases in our product liability and asbestos related reserves, a decrease of $1,800,000 for increases in costs of materials, and freight and a decrease of $487,000 for currency translation, and other. The fiscal 2010 decline in gross profit of $57,762,000 or 33.3% compared with fiscal 2009 was mostly due to under absorption of costs due to lower volume in all markets. Restructuring charges related to factory consolidation of approximately $4,500,000 as well as a reserve related to an atypical product liability claim of $2,900,000 also contributed to lower margin in fiscal 2010.
Selling expenses were $62,910,000, $64,464,000, and $72,620,000 in fiscal 2011, 2010 and 2009, respectively. As a percentage of net sales, selling expenses were 12.0%, 13.5% and 12.0% in fiscal 2011, 2010 and 2009, respectively. Decreases in fiscal 2011 selling expense of $1,554,000 or 2.4% are due to reorganization efforts specifically in the Company’s North American sales operations, partially offset by investments in non-U.S markets and commissions on higher sales. Decreases in fiscal 2010 selling expense of $8,156,000 or 11.3% reflect aggressive efforts to reduce or eliminate costs as well as lower salaries, benefits and commissions by $3,300,000 on lower volume, offset by $500,000 in increased variable compensation expense.
General and administrative expenses were $40,592,000, $36,892,000 and $37,721,000 in fiscal 2011, 2010 and 2009, respectively. As a percentage of net sales, general and administrative expenses were 7.7%, 7.7% and 6.2% in fiscal 2011, 2010 and 2009, respectively. Fiscal 2011 general and administrative expenses increased by $3,700,000 or 10.0% primarily due to the Company’s investments in its management team in Asia and new product development. Fiscal 2010 general and administrative expenses decreased by $829,000 or 2.2% primarily due to lower pension/group health benefit costs, lower bad debt expense and other miscellaneous items, partially offset by increased variable compensation expense.
26
Restructuring charges of $2,200,000, $16,519,000 and $1,921,000, or 0.4%, 3.5% and 0.3% of net sales were recorded in fiscal 2011, 2010 and 2009, respectively. Fiscal 2010 restructuring charges resulted from the consolidation of our North American sales force, early retirement benefits offered and costs associated with the closure and downsizing of manufacturing facilities. Restructuring charges for fiscal 2011 were less than restructuring charges in fiscal 2010 as the activities initiated in fiscal 2010 were essentially complete by the end of the first quarter in fiscal 2011.
In the fourth quarter of 2009, we recorded an impairment charge of $107,000,000 ($5.67 per diluted share) associated with goodwill. Based on impairment testing performed in February 2009, we determined that impairment existed for goodwill related to our rest of products reporting unit. Refer to Note 9 to our consolidated financial statements for additional information on Goodwill and Intangible Assets. There were no goodwill impairments in fiscal 2011 or fiscal 2010.
Amortization of intangibles was $1,778,000, $1,876,000 and $998,000 in fiscal 2011, 2010 and 2009, respectively and primarily relate to amortization of intangible assets acquired in connection with our fiscal 2009 acquisition of Pfaff.
Interest and debt expense was $13,532,000, $13,225,000 and $13,148,000 in fiscal 2011, 2010 and 2009, respectively. As a percentage of net sales, interest and debt expense was 2.6%, 2.8% and 2.2% in fiscal 2011, 2010 and 2009, respectively.
We incurred costs of $3,939,000 in fiscal 2011 with none in fiscal 2010 and income of $244,000 in fiscal 2009, related to the repurchase of outstanding debt. Further discussion on this topic is included below in the Liquidity and Capital Resources section and Note 12 of our consolidated financial statements.
Investment (income) loss of ($3,041,000), ($1,544,000) and $2,889,000, in fiscal 2011 2010 and 2009, respectively, related to marketable securities held in the Company’s wholly owned captive insurance subsidiary. The fiscal 2011 $3,041,000 gain primarily is the result of the market recovery and sale of securities previously impaired in fiscal 2009. In fiscal 2009, the Company recorded a $4,000,000 charge related to unrealized losses on securities that were determined to be other than temporary in nature. See Note 7 to our consolidated financial statements for additional information on Marketable Securities and were included in other income (expense).
Foreign currency exchange loss (gain) was $452,000, ($344,000), and $3,018,000 in fiscal 2011, 2010 and 2009, respectively, as a result of foreign currency volatility related to purchases and intercompany debt.
Other income, net was $1,375,000, $2,260,000, and $3,939,000 in fiscal 2011, 2010 and 2009, respectively. Other income in fiscal 2010 includes a gain from the sale of the American Lifts business and a gain from the sale of an equity investment in Europe.
Income tax (benefit) expense as a percentage of (loss) income from continuing operations before income tax (benefit) expense was 817.6%, (41.5)% and 31.0% in fiscal 2011, 2010 and 2009, respectively. The unusual percentage experienced during the year ended March 31, 2011 is related to the recording of a deferred tax asset valuation allowance in the amount of $42,983,000. The effective rate for fiscal 2010 was positively impacted by foreign tax benefits and from U.S. state net operating loss benefits. Fiscal 2009 income from continuing operations was adjusted for the $107,000,000 impairment charge. After excluding the impact of the $107,000,000 impairment charge, none of which is deductible for tax purposes, the effective tax rate for fiscal 2009 was 36.8%.
LIQUIDITY AND CAPITAL RESOURCES
Cash and cash equivalents totalled $80,139,000, $63,968,000, and $39,236,000 at March 31, 2011, 2010 and 2009, respectively.
Net cash provided by operating activities was $3,280,000, $29,867,000 and $60,231,000 in fiscal 2011, 2010 and 2009, respectively. The $26,587,000 decrease in fiscal 2011 relative to fiscal 2010 was primarily due to increase in cash used for working capital needed to fund the growing sales as well as completion of restructuring activities. Favorable changes in the net working capital effects on cash flows from operating activities included $3,739,000 in trade accounts payable, and $4,298,000 in accrued and other non-current liabilities, partially offset by unfavorable changes in accounts receivable of $17,191,000, inventory of $31,325,000 and prepaid expenses and other assets of $7,347,000.
27
Net cash provided by operating activities was $29,867,000 in fiscal 2010, a decrease of $30,364,000 compared to fiscal 2009. The decrease in cash provided by operating activities in fiscal 2010 relative to fiscal 2009 was primarily due to lower operating performance on lower sales as a result of the continued weakness in the global economy as well as cash payments related to restructuring activities, partially offset by improved working capital management. Favorable changes, as compared to fiscal 2009, in the net working capital effects on cash flows from operating activities included $19,819,000 in inventory, $7,495,000 in trade accounts payable, and $1,821,000 in accrued and other non-current liabilities, partially offset by unfavorable changes in accounts receivable of $13,888,000 and prepaid expenses and other assets of $2,746,000.
Net cash used by investing activities was $4,344,000, $1,350,000 and $65,505,000 in fiscal 2011, 2010 and 2009, respectively. The fiscal 2011 increase in cash used of $2,994,000 compared to fiscal 2010 was primarily the result of a $5,298,000 increase for capital expenditures which included $3,642,000 as the initial investment in our global enterprise resource planning system and a $2,360,000 decrease in cash proceeds from the sale of assets offset by a $4,799,000 increase in cash generated from the net sales of marketable securities in fiscal 2011. The fiscal 2010 decrease in cash used of $64,155,000 compared to fiscal 2009 was primarily the result of $52,779,000 of cash used in fiscal 2009 for the Pfaff acquisition as well as lower capital expenditures in fiscal 2010. The fiscal 2011, 2010 and 2009 amounts included $12,543,000, $7,245,000 and $12,245,000 for capital expenditures. The fiscal 2011, 2010 and 2009 amounts benefited from $1,182,000, $3,542,000, and $1,593,000, respectively, of proceeds from business, property and asset divestitures.
Net cash generated by financing activities was $15,794,000 in fiscal 2011 compared with net cash used by financing activities of $5,418,000 and $22,527,000 in fiscal 2010 and 2009, respectively. The increase in cash generated by financing activities for fiscal 2011 compared to fiscal 2010 was due to the refinancing of the $124,855,000 outstanding 8 7/8% Notes with a new issuance of $150,000,000 7 7/8% Notes. Offsetting the proceeds from the offering was $3,154,000 paid for tender and call redemption premiums on the 8 7/8% Notes and $3,185,000 paid for direct financing costs which have been deferred. Additional increases in cash from financing activities relate to $443,000 from the change in ESOP debt guarantee offset by $337,000 in net repayments under revolving lines of credit in fiscal 2011. The decrease in cash used by financing activities for fiscal 2010 compared to fiscal 2009 was due to less net debt repayment of $4,215,000 and $14,612,000 of payments by the Company related to its divested business, Univeyor in fiscal 2009. Fiscal 2011, 2010 and 2009 include $0, $291,000 and $421,000, respectively, of proceeds from the exercise of employee stock options.
We believe that our cash on hand, cash flows, and borrowing capacity under our Revolving Credit Facility will be sufficient to fund our ongoing operations and budgeted capital expenditures for at least the next twelve months. This belief is dependent upon successful execution of our current business plan which includes cost management, finalizing the facility consolidations and effective working capital utilization. No material restrictions exist in accessing cash held by our non-U.S. subsidiaries. Additionally we expect to meet our U.S. funding needs without repatriating non-U.S. cash and incurring the incremental U.S. taxes.
We entered into an amended, restated and expanded revolving credit facility dated December 31, 2009. The new Revolving Credit Facility provides availability up to a maximum of $85,000,000 and expires December 31, 2013. Provided there is no default, we may, on a one-time basis, request an increase in the availability of the Revolving Credit Facility by an amount not exceeding $65,000,000, subject to lender approval. The unused portion of the Revolving Credit Facility totalled $70,705,000, net of outstanding borrowings of $0 and outstanding letters of credit of $14,295,000, as of March 31, 2011. The outstanding letters of credit at March 31, 2011 consisted of $8,824,000 in documentary letters of credit (including a significant letter of credit related to a large customer order, amounting to $6,527,000 which will mature in April 2012) and $5,471,000 of standby letters of credit.
Interest on the revolver is payable at varying Eurodollar rates based on LIBOR or prime plus a spread determined by our total leverage ratio amounting to 300 or 200 basis points, respectively, at March 31, 2011. The Revolving Credit Facility is secured by all U.S. inventory, receivables, equipment, real property, subsidiary stock (limited to 65% of non-U.S. subsidiaries) and intellectual property.
The corresponding credit agreement associated with the Revolving Credit Facility places certain debt covenant restrictions on us, including certain financial requirements and restrictions on dividend payments, with which we were in compliance as of March 31, 2011. Key financial covenants include a minimum fixed charge coverage ratio of 1.25x, a maximum total leverage ratio, net of cash, of 3.75x for the quarter ending March 31, 2011 and 3.50x thereafter, and maximum annual capital expenditures of $18,000,000 excluding capital expenditures for a global ERP system. Our actual fixed charges coverage ratio and total leverage ratio, as calculated per the terms of our Revolving Credit Facility, were 1.74x and 2.79x, respectively, at March 31, 2011.
28
During the fourth quarter of fiscal year 2011, the Company refinanced its 8 7/8% Notes with newly issued 7 7/8% Notes (“7 7/8% Notes”) in the amount of $150,000,000, expiring February 1, 2019. The proceeds of the 7 7/8% Notes were used to repurchase or redeem all of the outstanding 8 7/8% Notes amounting to $124,855,000 and to fund working capital and other corporate activities. The offering price of the 7 7/8% Notes was 98.545% after adjustment for the original issue discount. Provisions of the 7 7/8% Notes include, without limitation, restrictions on indebtedness, asset sales, and dividends and other restrictive payments. Until February 1, 2014, the Company may redeem up to 35% of the outstanding 7 7/8% Notes at a redemption price of 107.875% with the proceeds of equity offerings, subject to certain restrictions. On or after February 1, 2015, the 7 7/8% Notes are redeemable at the option of the Company, in whole or in part, at a redemption price of 103.938%, reducing to 100% on February 1, 2017. In the event of a Change of Control (as defined in the indenture for such notes), each holder of the 7 7/8% Notes may require us to repurchase all or a portion of such holder’s 7 7/8% Notes at a purchase price equal to 101% of the principal amount thereof. The 7 7/8% Notes are guaranteed by certain existing and future U.S. subsidiaries and are not subject to any sinking fund requirements.
Our capital lease obligations related to property and equipment leases amounted to $6,037,000 at March 31, 2011. Capital lease obligations are included in senior debt in the consolidated balance sheets.
Unsecured and uncommitted lines of credit are available to meet short-term working capital needs for certain of our subsidiaries operating outside of the U.S. The lines of credit are available on an offering basis, meaning that transactions under the line of credit will be on such terms and conditions, including interest rate, maturity, representations, covenants and events of default, as mutually agreed between our subsidiaries and the local bank at the time of each specific transaction. As of March 31, 2011, significant unsecured credit lines totalled approximately $10,154,000, of which $464,000 was drawn.
CONTRACTUAL OBLIGATIONS
The following table reflects a summary of our contractual obligations in millions of dollars as of March 31, 2011, by period of estimated payments due:
|
|
Total
|
Fiscal
2012 |
Fiscal 2013-
Fiscal 2014 |
Fiscal 2015-
Fiscal 2016 |
More Than
Five Years |
|||||||||||||||
|
Long-term debt obligations (a)
|
$ | 156.0 | $ | 1.1 | $ | 2.5 | $ | 1.4 | $ | 151.0 | ||||||||||
|
Operating lease obligations (b)
|
18.3 | 6.9 | 7.9 | 3.5 | - | |||||||||||||||
|
Purchase obligations (c)
|
- | - | - | - | - | |||||||||||||||
|
Interest obligations (d)
|
94.0 | 12.3 | 24.2 | 23.9 | 33.6 | |||||||||||||||
|
Letter of credit obligations
|
14.3 | 14.3 | - | - | - | |||||||||||||||
|
Bank guarantees
|
8.6 | 8.6 | ||||||||||||||||||
|
Uncertain tax positions
|
2.6 | - | 1.3 | 1.3 | - | |||||||||||||||
|
Projected pension and other postretirement obligation benefit payouts
|
120.5 | 10.3 | 21.6 | 23.1 | 65.5 | |||||||||||||||
|
Other long-term liabilities reflected on the Company’s balance sheet under GAAP (e)
|
68.6 | - | 24.0 | 24.7 | 19.9 | |||||||||||||||
|
Total
|
$ | 482.9 | $ | 53.5 | $ | 81.5 | $ | 77.9 | $ | 270.0 | ||||||||||
|
|
(a)
|
As described in Note 12 to consolidated financial statements.
|
|
|
(b)
|
As described in Note 19 to consolidated financial statements.
|
|
|
(c)
|
We have no purchase obligations specifying fixed or minimum quantities to be purchased. We estimate that, at any given point in time, our open purchase orders to be executed in the normal course of business approximate $40 million.
|
|
|
(d)
|
Estimated for our Senior Subordinated Notes due 2/1/19.
|
|
|
(e)
|
As described in Note 11 to our consolidated financial statements.
|
We have no additional off-balance sheet obligations that are not reflected above.
29
CAPITAL EXPENDITURES
In addition to keeping our current equipment and plants properly maintained, we are committed to replacing, enhancing and upgrading our property, plant and equipment to support new product development, improve productivity and customer responsiveness, reduce production costs, increase flexibility to respond effectively to market fluctuations and changes, meet environmental requirements, enhance safety and promote ergonomically correct work stations. Our capital expenditures for fiscal 2011, 2010 and 2009 were $12,500,000, $7,200,000 and $12,200,000, respectively. We expect capital expenditure spending in fiscal 2012 to be in the range of $13,000,000 to $15,000,000.
INFLATION AND OTHER MARKET CONDITIONS
Our costs are affected by inflation in the U.S. economy and, to a lesser extent, in non-U.S. economies including those of Europe, Canada, Mexico, South America and Asia-Pacific. We do not believe that general inflation has had a material effect on our results of operations over the periods presented primarily due to overall low inflation levels over such periods and our ability to generally pass on rising costs through annual price increases and surcharges. However, U.S. employee benefits costs such as health insurance, workers compensation insurance, pensions as well as energy and business insurance have exceeded general inflation levels. In the future, we may be further affected by inflation that we may not be able to pass on as price increases. With changes in worldwide demand for steel and fluctuating scrap steel prices over the past several years, we experienced fluctuations in our costs that we have reflected as price increases and surcharges to our customers. We believe we have been successful in instituting surcharges and price increases to pass on these material cost increases. We will continue to monitor our costs and reevaluate our pricing policies.
SEASONALITY AND QUARTERLY RESULTS
Our quarterly results may be materially affected by the timing of large customer orders, periods of high vacation and holiday concentrations, restructuring charges and other costs attributable to our facility rationalization program, divestitures, acquisitions and the magnitude of rationalization integration costs. Therefore, our operating results for any particular fiscal quarter are not necessarily indicative of results for any subsequent fiscal quarter or for the full fiscal year.
DISCONTINUED OPERATIONS
In May 2002, we completed the divestiture of substantially all of the assets of ASI which comprised the principal business unit in our former Solutions - Automotive segment. Proceeds from this sale included an 8% subordinated note in the principal amount of $6,800,000 payable over 10 years. Due to the uncertainty of its collection, the note was recorded at its estimated net realizable value of $0 at the time of the divestiture. Principal payments received on the note are recorded as income from discontinued operations at the time of receipt. Accordingly, $396,000, and $531,000 of income from discontinued operations was recorded in fiscal 2011, and 2010 respectively, net of tax. All interest and principal payments required under the note have been made to date.
CRITICAL ACCOUNTING POLICIES AND ESTIMATES
The preparation of financial statements in conformity with U.S. generally accepted accounting principles requires us to make estimates and assumptions that affect the amounts reported in our consolidated financial statements and accompanying notes. We continually evaluate the estimates and their underlying assumptions, which form the basis for making judgments about the carrying value of our assets and liabilities. Actual results inevitably will differ from those estimates. We have identified below the accounting policies involving estimates that are critical to our financial statements. Other accounting policies are more fully described in Note 2 of our consolidated financial statements.
Revenue Recognition. Sales are recorded when title passes to the customer which is generally at the time of shipment to the customer. The Company performs ongoing credit evaluations of its customers’ financial condition, but generally does not require collateral to support customer receivables. The credit risk is controlled through credit approvals, limits and monitoring procedures. Accounts receivable are reported at net realizable value and do not accrue interest. The Company establishes an allowance for doubtful accounts based upon factors surrounding the credit risk of specific customers, historical trends and other factors. Accounts receivable are charged against the allowance for doubtful accounts once all collection efforts have been exhausted. At March 31, 2011 the allowance for doubtful accounts totaled $3,166,000.
30
Pension and Other Postretirement Benefits. The determination of the obligations and expense for pension and postretirement benefits is dependent on our selection of certain assumptions that are used by actuaries in calculating such amounts. Those assumptions are disclosed in Note 13 to our fiscal 2011 consolidated financial statements and include the discount rates, expected long-term rate of return on plan assets and rates of future increases in compensation and healthcare costs.
The pension discount rate assumptions of 5.75%, 6%, and 7.25, as of March 31, 2011, 2010, and 2009, respectively, are primarily based on long-term AA rated corporate bond rates. The decrease in the discount rate for fiscal 2011 resulted in a $4,700,000 increase in the projected benefit obligation. The decrease in the discount rates for fiscal 2010 resulted in an $33,900,000 increase in the projected benefit obligation as of March 31, 2010. The rate of return on plan assets assumptions of 7.5% for each of the years ended March 31, 2011, 2010 and 2009 is based on the targeted plan asset allocation (approximately 70% equities and 30% fixed income) and their long-term historical returns. Investment gains of $15,010,000 in fiscal 2011 and $30,549,000 in fiscal 2010 with the fiscal 2011 decrease a result of less volatility in US capital markets in fiscal 2011. Our under-funded status for all pension plans as of March 31, 2011 and 2010 was $32,366,000 and $36,782,000, or 18.2% and 21.8% of the projected benefit obligation, respectively. Our pension contributions during fiscal 2011 and 2010 were approximately $7,796,000 and $18,026,000, respectively. The under-funded status may result in future pension expense increases. Pension expense for the March 31, 2012 fiscal year is expected to approximate $9,249,000, which is up from the fiscal 2011 amount of $6,836,000. The increase is primarily related to an amendment and curtailment charge in fiscal 2011 as described in Note 13. Pension funding contributions for the March 31, 2012 fiscal year is expected to increase by approximately $3,704,000 compared to fiscal 2011. The compensation increase assumption of 2% as of March 31, 2011, 2010, and 2009 is based on expected wage trends and historical patterns.
The healthcare costs inflation assumptions of 8.5%, 8.0% and 8.75% for fiscal 2012, 2011, and 2010, respectively, are based on anticipated trends. Healthcare costs in the United States have increased substantially over the last several years. If this trend continues, the cost of postretirement healthcare will increase in future years.
Insurance Reserves. Our accrued general and product liability reserves as described in Note 16 to consolidated financial statements involve actuarial techniques including the methods selected to estimate ultimate claims, and assumptions including emergence patterns, payment patterns, initial expected losses and increased limit factors. These actuarial estimates are subject to a high degree of uncertainty due to a variety of factors, including extended lag time in the reporting and resolution of claims, trends or changes in claim settlement patterns, insurance industry practices, and legal interpretations. As a result, actual costs could differ significantly from the estimated amounts. Adjustments to estimated reserves are recorded in the period in which the change in estimate occurs. Other insurance reserves such as workers compensation and group health insurance are based on actual historical and current claim data provided by third party administrators or internally maintained.
Accounts Receivable Reserves. Allowances for doubtful accounts and credit memo reserves are also judgmentally determined based on formulas applied to historical bad debt write-offs and credit memos issued, assessing potentially uncollectible customer accounts and analyzing the accounts receivable aging.
Impairment of depreciable and amortizable long-lived assets. Property, plant and equipment and certain intangibles are depreciated or amortized over their assigned lives. We test long-lived assets for impairment when events or changes in circumstances indicate that the carrying amount of those assets may not be recoverable and exceed their fair market value. The following summarizes the value of long-lived assets subject to impairment testing when events or circumstances indicate potential impairment (amounts in millions):
|
Balance as of
|
||||
|
|
March 31, 2011
|
|||
|
Property, plant and equipment, net
|
$ | 59.4 | ||
|
Acquired intangibles with estimable useful lives
|
18.1 | |||
|
Other assets
|
7.4 | |||
31
Impairment may exist if the carrying amount of the asset in question exceeds the sum of the undiscounted cash flows expected to result from the use of the asset. The impairment loss, if any, would be measured as the amount by which the carrying amount of a long-lived asset exceeds its fair market value as determined by appropriate valuation techniques.
Goodwill impairment testing. Our goodwill balance, $106,055,000 as of March 31, 2011 is subject to impairment testing. We test goodwill for impairment at least annually, as of the end of February, and more frequently whenever events occur or circumstances change that indicate there may be impairment. These events or circumstances could include a significant long-term adverse change in the business climate, poor indicators of operating performance, or a sale or disposition of a significant portion of a reporting unit.
We test goodwill at the reporting unit level, which is one level below our operating segment. We identify our reporting units by assessing whether the components of our operating segment constitute businesses for which discrete financial information is available and segment management regularly reviews the operating results of those components. We also aggregate components that have similar economic characteristics into single reporting units (for example, similar products and / or services, similar long-term financial results, product processes, classes of customers, etc.). We have four reporting units, only two of which have goodwill. Our Duff-Norton reporting unit and Rest of Products reporting unit have goodwill totaling $9,902,000 and $96,153,000, respectively, at March 31, 2011.
As a result of our annual impairment test as of February 28, 2011, the fair market value of our reporting units exceeded net book values and no goodwill impairment charges were recorded. Fair market value of the Duff-Norton and Rest of the Products reporting units exceeded net book value by approximately 29% and 112%, respectively. The goodwill impairment test consists of comparing the fair value of a reporting unit, determined using discounted cash flows, with its carrying amount including goodwill. If the carrying amount of the reporting unit exceeds the reporting unit’s fair value, the implied fair value of goodwill is compared to the carrying amount of goodwill. An impairment loss would be recognized for the amount by which the carrying amount of goodwill exceeds the implied fair value of goodwill.
Testing goodwill for impairment requires us to estimate fair values of reporting units using significant estimates and judgmental factors. The key estimates and factors used in our discounted cash flow valuation include revenue growth rates and profit margins based on internal forecasts, terminal value, and the weighted-average cost of capital used to discount future cash flows. The compound annual growth rate for revenue during the first five years of our projections was approximately 8%. The terminal value was calculated assuming projected growth rates of 2.0% after five years for the Duff-Norton reporting unit and 3.25% after five years for the Rest of Products reporting unit. These rates reflect our estimate of long-term growth into perpetuity and approximate the long-term gross domestic product growth expected on a global basis. Operating profit margins were projected to return to historical norms during fiscal 2012 and fiscal 2013 in the individual reporting units. The estimated weighted-average cost of capital for the reporting units was determined to be 14.0% based upon an analysis of similar companies and their debt to equity mix, their related volatility and the size of their market capitalization. We also consider any additional risk of each individual reporting unit achieving its forecasts, and adjust the weighted-average cost of capital applied when determining each reporting unit’s estimated fair value. Future changes in these estimates and assumptions could materially affect the results of our goodwill impairment tests. For example, a decline in the terminal growth rate greater than 50 basis points would decrease fair market value by $450,750 and $8,366,000 for the Duff Norton reporting unit and Rest of the Products reporting unit, respectively, or an increase in the weighted-average cost of capital by 100 basis points would result in a decrease in fair market value by $1,651,000 and $28,557,000 for the Duff-Norton reporting unit and Rest of the Products reporting units, respectively. Even with such changes the fair value of the reporting units would be greater than their net book values as of February 28, 2011, necessitating no Step 2 calculations.
We currently do not believe that any of our reporting units with goodwill are at risk of failing Step 1 of the goodwill impairment test; however if our actual operating results fall significantly below our projections, if the projected long-term revenue growth rates, profit margins, or terminal rates decline as a result of deteriorating market conditions, and/or the estimated weighted-average cost of capital increases significantly, future testing may indicate impairment of one or more of the Company’s reporting units and, as a result, the related goodwill may likely be impaired.
Marketable Securities. On a quarterly basis, we review our marketable securities for declines in market value that may be considered other than temporary. We generally consider market value declines to be other than temporary if there are declines for a period longer than six months and in excess of 20% of original cost. We also consider the nature of the underlying investments and other market conditions.
32
Deferred Tax Asset Valuation Allowance. During the third quarter ended December 31, 2010, the Company recorded a non-cash charge of $39,700,000 included within its provision for income taxes. This charge relates to the Company’s determination that a full valuation allowance against its deferred tax assets generated in the U.S. was necessary. The deferred tax assets relate principally to liabilities related to employee benefit plans and insurance reserves and U.S. net operating loss carryforwards. The U.S. net operating loss carryforwards have been generated primarily as a result of restructuring costs in fiscal years 2010 and 2011. Accounting rules require a reduction of the carrying amounts of deferred tax assets by a valuation allowance if, based on the available and objectively verifiable evidence, it is more likely than not that such assets will not be realized. The existence of cumulative losses for a certain threshold period is a significant form of negative evidence used in the assessment. During the third quarter ended December 31, 2010, the Company determined that it would be in a three-year cumulative pretax loss position in the U.S. at March 31, 2011 primarily due to restructuring-related charges incurred in the U.S. to-date in fiscal 2011, despite our expectations of future profitability. If a cumulative loss threshold is met, the accounting rules indicate that forecasts of future profitability are generally not sufficient positive evidence to overcome the presumption that a valuation allowance is necessary.
We recorded additional adjustments to the valuation allowance totaling $3,283,000 within our provision for income taxes during fiscal 2011 as a result of changes in the amounts of net deferred tax assets during the period and changes in judgment related to the expected realization of deferred tax assets of certain foreign subsidiaries.
The Company continues to believe that the strategic reorganization of its North American hoist and rigging operations that commenced in fiscal 2010 and which the Company substantially completed in the first quarter of fiscal 2011 will result in an estimated $15,000,000 in annual cost savings and such savings are ramping up during fiscal 2011 and into fiscal 2012. The recording of this non-cash charge does not impact the Company’s ability to realize the economic benefit of its deferred tax assets and net operating loss carryforwards on future tax returns. In future periods, the allowance could be reduced or reversed based on sufficient objectively verifiable evidence indicating that it is more likely than not that a portion or all of the Company’s deferred tax assets will be realized.
The Internal Revenue Code imposes limitations on a corporation’s ability to utilize NOLs if it experiences an “ownership change.” In general terms, an ownership change may result from transactions increasing the ownership of certain stockholders in the stock of a corporation by more than 50 percentage points over a three year period. If we were to experience an ownership change, utilization of our NOLs would be subject to an annual limitation determined by multiplying the market value of our outstanding shares of stock at the time of the ownership change by the applicable long-term tax-exempt rate. Any unused annual limitation may be carried over to later years within the allowed NOL carryforward period. The amount of the limitation may, under certain circumstances, be increased or decreased by built-in gains or losses held by us at the time of the change that are recognized in the five-year period after the change.
Effects of New Accounting Pronouncements
On April 1, 2010, the Company adopted the provisions of Accounting Standards Update No. 2010-06 “Improving Disclosures about Fair Value Measurements” (“ASU 2010-06”). ASU 2010-06 amends ASC Topic 820 to require additional disclosures regarding fair value measurements. Specifically ASU 2010-06 requires entities to disclose the amounts of significant transfers between Level 1 and Level 2 of the fair value hierarchy and the reasons for these transfers, the reasons for any transfers in or out of Level 3 and information in the reconciliation of recurring Level 3 measurements about purchases, sales, issuances and settlements on a gross basis. The adoption of these provisions did not have a material impact on the Company’s consolidated financial position, results of operations or cash flows.
In April 2010, the FASB issued the FASB Accounting Standards Update No. 2010-17 “Revenue Recognition — Milestone Method (Topic 605) Milestone Method of Revenue Recognition” (“ASU 2010-17”), which provides guidance on the criteria that should be met for determining whether the milestone method of revenue recognition is appropriate. A vendor can recognize consideration that is contingent upon achievement of a milestone in its entirety as revenue in the period in which the milestone is achieved only if the milestone meets all criteria to be considered substantive. The adoption of these provisions did not have a material impact on the Company’s consolidated financial position, results of operations or cash flows.
33
In December 2010, the FASB issued Accounting Standards Update No. 2010-28, When to Perform Step 2 of the Goodwill Impairment Test for Reporting Units with Zero or Negative Carrying Amounts (Topic 350)—Intangibles—Goodwill and Other (ASU 2010-28). ASU 2010-28 amends the criteria for performing Step 2 of the goodwill impairment test for reporting units with zero or negative carrying amounts and requires performing Step 2 if qualitative factors indicate that it is more likely than not that a goodwill impairment exists. The Company will adopt ASU 2010-28 in fiscal 2012 and any impairment to be recorded upon adoption, if any, will be recognized as an adjustment to the Company’s beginning retained earnings. The Company is currently evaluating the impact of the pending adoption of ASU 2010-28 on its condensed consolidated financial statements.
In December 2010, the FASB issued Accounting Standards Update 2010-29 (“ASU 2010-29”) which address diversity in practice about the interpretation of the pro forma revenue and earnings disclosure requirements for business combinations (Topic 805). This ASU specifies that if a public entity presents comparative financial statements, the entity should disclose revenue and earnings of the combined entity as though the business combination(s) that occurred during the current year had occurred as of the beginning of the comparable prior annual reporting period only. This ASU also expands the supplemental pro forma disclosures under Topic 805 to include a description of the nature and amount of material, nonrecurring pro forma adjustments directly attributable to the business combination included in the reported pro forma revenue and earnings. ASU 2010-29 is effective prospectively for business combinations for which the acquisition date is on or after the beginning of the first annual reporting period beginning on or after December 15, 2010. Early adoption is permitted. The Company is currently evaluating the impact of this ASU; however, the Company does not expect the adoption of this ASU will have a material impact on its consolidated financial statements.
Safe Harbor Statement under the Private Securities Litigation Reform Act of 1995
This report may include “forward-looking statements” within the meaning of the Private Securities Litigation Reform Act of 1995. Such statements involve known and unknown risks, uncertainties and other factors that could cause our actual results to differ materially from the results expressed or implied by such statements, including general economic and business conditions, conditions affecting the industries served by us and our subsidiaries, conditions affecting our customers and suppliers, competitor responses to our products and services, the overall market acceptance of such products and services, facility consolidations and other restructurings, our asbestos-related liability, the integration of acquisitions and other factors disclosed in our periodic reports filed with the Commission. Consequently such forward-looking statements should be regarded as our current plans, estimates and beliefs. We do not undertake and specifically decline any obligation to publicly release the results of any revisions to these forward-looking statements that may be made to reflect any future events or circumstances after the date of such statements or to reflect the occurrence of anticipated or unanticipated events.
34
|
Item 8.
|
Financial Statements and Supplementary Data.
|
Columbus McKinnon Corporation
|
Audited Consolidated Financial Statements as of March 31, 2011:
|
||||
|
Report of Ernst & Young LLP, Independent Registered Public Accounting Firm
|
F-2
|
|||
|
Consolidated Balance Sheets
|
F-3
|
|||
|
Consolidated Statements of Operations
|
F-4
|
|||
|
Consolidated Statements of Shareholders’ Equity
|
F-5
|
|||
|
Consolidated Statements of Cash Flows
|
F-6
|
|||
|
Notes to Consolidated Financial Statements
|
||||
|
1.
|
Description of Business
|
F-7
|
||
|
2.
|
Accounting Principles and Practices
|
F-7
|
||
|
3.
|
Acquisitions
|
F-11
|
||
|
4.
|
Divestitures
|
F-11
|
||
|
5.
|
Fair Value Measurements
|
F-12
|
||
|
6.
|
Inventories
|
F-14
|
||
|
7.
|
Marketable Securities
|
F-15
|
||
|
8.
|
Property, Plant, and Equipment
|
F-16
|
||
|
9.
|
Goodwill and Intangible Assets
|
F-17
|
||
|
10.
|
Derivative Instruments
|
F-19
|
||
|
11.
|
Accrued Liabilities and Other Non-current Liabilities
|
F-20
|
||
|
12.
|
Debt
|
F-21
|
||
|
13.
|
Pensions and Other Benefit Plans
|
F-24
|
||
|
14.
|
Employee Stock Ownership Plan (ESOP)
|
F-29
|
||
|
15.
|
Earnings per Share and Stock Plans
|
F-30
|
||
|
16.
|
Loss Contingencies
|
F-37
|
||
|
17.
|
Restructuring Charges
|
F-39
|
||
|
18.
|
Income Taxes
|
F-40
|
||
|
19.
|
Rental Expense and Lease Commitments
|
F-43
|
||
|
20.
|
Summary Financial Information
|
F-44
|
||
|
21.
|
Business Segment Information
|
F-49
|
||
|
22.
|
Selected Quarterly Financial Data (unaudited)
|
F-50
|
||
|
23.
|
Accumulated Other Comprehensive Loss
|
F-51
|
||
|
24.
|
Effects of New Accounting Pronouncements
|
F-51
|
||
| Schedule II – Valuation and Qualifying Accounts. | F-53 | |||
F-1
Report of Ernst & Young LLP, Independent Registered Public Accounting Firm
The Board of Directors and Shareholders of Columbus McKinnon Corporation
We have audited the accompanying consolidated balance sheets of Columbus McKinnon Corporation as of March 31, 2011 and 2010, and the related consolidated statements of operations, shareholders' equity and cash flows for each of the three years in the period ended March 31, 2011. Our audits also included the financial statement schedule listed in the Index at Item 15(2). These financial statements and schedule are the responsibility of the Company's management. Our responsibility is to express an opinion on these financial statements and schedule based on our audits.
We conducted our audits in accordance with the standards of the Public Company Accounting Oversight Board (United States). Those standards require that we plan and perform the audit to obtain reasonable assurance about whether the financial statements are free of material misstatement. An audit includes examining, on a test basis, evidence supporting the amounts and disclosures in the financial statements. An audit also includes assessing the accounting principles used and significant estimates made by management, as well as evaluating the overall financial statement presentation. We believe that our audits provide a reasonable basis for our opinion.
In our opinion, the financial statements referred to above present fairly, in all material respects, the consolidated financial position of Columbus McKinnon Corporation at March 31, 2011 and 2010 and the consolidated results of its operations and its cash flows for each of the three years in the period ended March 31, 2011, in conformity with U.S. generally accepted accounting principles. Also, in our opinion, the related financial statement schedule, when considered in relation to the basic financial statements taken as a whole, presents fairly in all material respects the information set forth therein.
As discussed in Note 13 to the consolidated financial statements, during the year ended March 31, 2009 the Company adopted the measurement date provisions and certain other provisions of FASB ASC Topic 715, Compensation – Retirement Plans.
We also have audited, in accordance with the standards of the Public Company Accounting Oversight Board (United States), Columbus McKinnon Corporation’s internal control over financial reporting as of March 31, 2011, based on criteria established in Internal Control-Integrated Framework issued by the Committee of Sponsoring Organizations of the Treadway Commission and our report dated May 27, 2011 expressed an unqualified opinion thereon.
/s/ Ernst & Young LLP
Buffalo, New York
May 27, 2011
F-2
COLUMBUS McKINNON CORPORATION
CONSOLIDATED BALANCE SHEETS
|
|
March 31,
|
|||||||
|
|
2011
|
2010
|
||||||
|
|
(In thousands, except share data)
|
|||||||
|
ASSETS
|
|
|
||||||
|
Current assets:
|
|
|
||||||
|
Cash and cash equivalents
|
$ | 80,139 | $ | 63,968 | ||||
|
Trade accounts receivable, less allowance for doubtful accounts ($3,166 and $4,240, respectively)
|
77,744 | 70,218 | ||||||
|
Inventories
|
90,031 | 79,822 | ||||||
|
Prepaid expenses and other
|
14,294 | 16,014 | ||||||
|
Total current assets
|
262,208 | 230,022 | ||||||
|
Net property, plant, and equipment
|
59,360 | 57,106 | ||||||
|
Goodwill
|
106,055 | 105,134 | ||||||
|
Other intangibles, net
|
18,089 | 19,031 | ||||||
|
Marketable securities
|
24,592 | 29,399 | ||||||
|
Deferred taxes on income
|
1,217 | 36,768 | ||||||
|
Other assets
|
7,351 | 4,037 | ||||||
|
Total assets
|
$ | 478,872 | $ | 481,497 | ||||
| LIABILITIES AND SHAREHOLDERS’ EQUITY | ||||||||
|
Current liabilities:
|
||||||||
|
Notes payable to banks
|
$ | 473 | $ | 841 | ||||
|
Trade accounts payable
|
37,174 | 33,480 | ||||||
|
Accrued liabilities
|
56,455 | 52,754 | ||||||
|
Restructuring reserve
|
47 | 2,755 | ||||||
|
Current portion of long-term debt
|
1,116 | 1,155 | ||||||
|
Total current liabilities
|
95,265 | 90,985 | ||||||
|
Senior debt, less current portion
|
4,949 | 5,966 | ||||||
|
Subordinated debt
|
147,867 | 124,855 | ||||||
|
Other non-current liabilities
|
68,645 | 72,413 | ||||||
|
Total liabilities
|
316,726 | 294,219 | ||||||
|
Shareholders’ equity:
|
||||||||
|
Voting common stock: 50,000,000 shares authorized; 19,171,428 and 19,122,266 shares issued and outstanding
|
191 | 191 | ||||||
|
Additional paid-in capital
|
184,884 | 182,385 | ||||||
|
(Accumulated deficit) Retained earnings
|
(1,072 | ) | 34,878 | |||||
|
ESOP debt guarantee: 88,097 and 115,766 shares
|
(1,407 | ) | (1,850 | ) | ||||
|
Accumulated other comprehensive loss
|
(20,450 | ) | (28,326 | ) | ||||
|
Total shareholders’ equity
|
162,146 | 187,278 | ||||||
|
Total liabilities and shareholders’ equity
|
$ | 478,872 | $ | 481,497 | ||||
See accompanying notes.
F-3
COLUMBUS McKINNON CORPORATION
|
|
Year Ended March 31,
|
|||||||||||
|
|
|
|
|
|||||||||
|
|
2011
|
2010
|
2009
|
|||||||||
|
|
(In thousands, except per share data)
|
|||||||||||
|
Net sales
|
$ | 524,065 | $ | 476,183 | $ | 606,708 | ||||||
|
Cost of products sold
|
398,013 | 360,244 | 433,007 | |||||||||
|
Gross profit
|
126,052 | 115,939 | 173,701 | |||||||||
|
Selling expenses
|
62,910 | 64,464 | 72,620 | |||||||||
|
General and administrative expenses
|
40,592 | 36,892 | 37,721 | |||||||||
|
Restructuring charges
|
2,200 | 16,519 | 1,921 | |||||||||
|
Impairment loss
|
- | - | 107,000 | |||||||||
|
Amortization of intangibles
|
1,778 | 1,876 | 998 | |||||||||
|
Income (loss) from operations
|
18,572 | (3,812 | ) | (46,559 | ) | |||||||
|
Interest and debt expense
|
13,532 | 13,225 | 13,148 | |||||||||
|
Cost of bond redemptions
|
3,939 | - | (244 | ) | ||||||||
|
Investment (income) loss
|
(3,041 | ) | (1,544 | ) | 2,889 | |||||||
|
Foreign currency exchange loss (gain)
|
452 | (344 | ) | 3,018 | ||||||||
|
Gain from litigation settlement
|
- | - | (3,330 | ) | ||||||||
|
Other income, net
|
(1,375 | ) | (2,260 | ) | (3,939 | ) | ||||||
|
Income (loss) from continuing operations before income tax expense (benefit)
|
5,065 | (12,889 | ) | (58,101 | ) | |||||||
|
Income tax expense (benefit)
|
41,411 | (5,345 | ) | 18,001 | ||||||||
|
Loss from continuing operations
|
(36,346 | ) | (7,544 | ) | (76,102 | ) | ||||||
|
|
||||||||||||
|
Income (loss) from discontinued operations (net of tax)
|
396 | 531 | (2,282 | ) | ||||||||
|
Net loss
|
$ | (35,950 | ) | $ | (7,013 | ) | $ | (78,384 | ) | |||
|
|
||||||||||||
|
Average basic shares outstanding
|
19,047 | 18,963 | 18,861 | |||||||||
|
Average diluted shares outstanding
|
19,047 | 18,963 | 18,861 | |||||||||
|
|
||||||||||||
|
Loss from continuing operations
|
$ | (1.91 | ) | $ | (0.40 | ) | $ | (4.04 | ) | |||
|
Income (loss) from discontinued operations
|
0.02 | 0.03 | (0.12 | ) | ||||||||
|
Basic loss per share
|
$ | (1.89 | ) | $ | (0.37 | ) | $ | (4.16 | ) | |||
|
|
||||||||||||
|
Diluted (loss) per share:
|
||||||||||||
|
Loss from continuing operations
|
$ | (1.91 | ) | $ | (0.40 | ) | $ | (4.04 | ) | |||
|
Income (loss) from discontinued operations
|
0.02 | 0.03 | (0.12 | ) | ||||||||
|
Diluted loss per share
|
$ | (1.89 | ) | $ | (0.37 | ) | $ | (4.16 | ) | |||
See accompanying notes.
F-4
COLUMBUS McKINNON CORPORATION
(In thousands, except share data)
|
|
Common Stock ($.01 par value)
|
Additional Paid-in Capital
|
Retained Earnings
|
ESOP Debt Guarantee
|
Accumulated Other Comprehensive Loss
|
Total Shareholders Equity
|
||||||||||||||||||
|
Balance at April 1, 2008
|
$ | 189 | $ | 178,457 | $ | 122,400 | $ | (2,824 | ) | $ | (2,741 | ) | $ | 295,481 | ||||||||||
|
Comprehensive loss:
|
||||||||||||||||||||||||
|
Net loss 2009
|
- | - | (78,384 | ) | - | - | (78,384 | ) | ||||||||||||||||
|
Change in foreign currency translation adjustment
|
- | - | - | - | (16,474 | ) | (16,474 | ) | ||||||||||||||||
|
Change in net unrealized gain on investments, net of tax of $228
|
- | - | - | - | 423 | 423 | ||||||||||||||||||
|
Change in pension liability and postretirement obligations, net of tax benefit of $ 12,565
|
- | - | - | - | (19,453 | ) | (19,453 | ) | ||||||||||||||||
| Total comprehensive income | (113,888 | ) | ||||||||||||||||||||||
|
ASC 715 measurement date adjustment, net of tax benefit of $ 545
|
- | - | (877 | ) | - | - | (877 | ) | ||||||||||||||||
|
Adjustment to initially apply EITF 06-10
|
- | - | (1,248 | ) | - | - | (1,248 | ) | ||||||||||||||||
|
Stock compensation - directors
|
- | 260 | - | - | - | 260 | ||||||||||||||||||
|
Stock options exercised, 46,375 shares
|
1 | 420 | - | - | - | 421 | ||||||||||||||||||
|
Stock compensation expense
|
- | 799 | - | - | - | 799 | ||||||||||||||||||
|
Tax benefit from exercise of stock options
|
- | 274 | - | - | - | 274 | ||||||||||||||||||
|
Earned 32,188 ESOP shares
|
- | 117 | - | 515 | - | 632 | ||||||||||||||||||
|
Balance at March 31, 2009
|
$ | 190 | $ | 180,327 | $ | 41,891 | $ | (2,309 | ) | $ | (38,245 | ) | $ | 181,854 | ||||||||||
|
Comprehensive income:
|
||||||||||||||||||||||||
|
Net loss 2010
|
- | - | (7,013 | ) | - | - | (7,013 | ) | ||||||||||||||||
|
Change in foreign currency translation adjustment
|
- | - | - | - | 4,789 | 4,789 | ||||||||||||||||||
|
Change in net unrealized gain on investments, net of tax of $ 1,090
|
- | - | - | - | 2,025 | 2,025 | ||||||||||||||||||
|
Change in derivatives qualifying as hedges
|
- | - | - | - | (58 | ) | (58 | ) | ||||||||||||||||
|
Change in pension liability and postretirement obligations, net of tax of $3,773
|
- | - | - | - | 3,163 | 3,163 | ||||||||||||||||||
|
Total comprehensive income
|
- | - | - | - | - | 2,906 | ||||||||||||||||||
|
Stock compensation - directors
|
- | 280 | - | - | - | 280 | ||||||||||||||||||
|
Stock options exercised, 45,500 shares
|
1 | 291 | - | - | - | 292 | ||||||||||||||||||
|
Stock compensation expense
|
- | 1,544 | - | - | - | 1,544 | ||||||||||||||||||
|
Tax effect of exercise of stock options
|
- | (5 | ) | - | - | - | (5 | ) | ||||||||||||||||
|
Earned 28,693 ESOP shares
|
- | (52 | ) | - | 459 | - | 407 | |||||||||||||||||
|
Balance at March 31, 2010
|
$ | 191 | $ | 182,385 | $ | 34,878 | $ | (1,850 | ) | $ | (28,326 | ) | $ | 187,278 | ||||||||||
|
Comprehensive income:
|
||||||||||||||||||||||||
|
Net loss 2011
|
(35,950 | ) | - | - | (35,950 | ) | ||||||||||||||||||
|
Change in foreign currency translation adjustment
|
- | - | - | - | 4,933 | 4,933 | ||||||||||||||||||
|
Change in net unrealized gain on investments
|
- | - | - | - | (329 | ) | (329 | ) | ||||||||||||||||
|
Change in derivatives qualifying as hedges
|
- | - | - | - | 239 | 239 | ||||||||||||||||||
|
Change in pension liability and postretirement obligations, net of tax of $952
|
- | - | - | - | 3,033 | 3,033 | ||||||||||||||||||
|
Total comprehensive income
|
- | - | - | - | - | (28,074 | ) | |||||||||||||||||
|
Stock compensation - directors
|
- | 450 | - | - | - | 450 | ||||||||||||||||||
|
Stock options exercised, 6,625 shares
|
- | 56 | - | - | - | 56 | ||||||||||||||||||
|
Stock compensation expense
|
- | 2,034 | - | - | - | 2,034 | ||||||||||||||||||
|
Tax effect of exercise of stock options
|
- | (68 | ) | - | - | - | (68 | ) | ||||||||||||||||
|
Earned 27,669 ESOP shares
|
- | 27 | - | 443 | - | 470 | ||||||||||||||||||
|
Balance at March 31, 2011
|
$ | 191 | $ | 184,884 | $ | (1,072 | ) | $ | (1,407 | ) | $ | (20,450 | ) | $ | 162,146 | |||||||||
See accompanying notes.
F-5
COLUMBUS McKINNON CORPORATION
|
Year ended March 31,
|
||||||||||||
|
2011
|
2010
|
2009
|
||||||||||
|
Operating activities:
|
(In thousands)
|
|||||||||||
|
Net loss
|
$ | (35,950 | ) | $ | (7,013 | ) | $ | (78,384 | ) | |||
|
Adjustments to reconcile net loss to net cash provided by operating activities:
|
||||||||||||
|
(Income) loss from discontinued operations
|
(396 | ) | (531 | ) | 2,282 | |||||||
|
Depreciation and amortization
|
11,050 | 12,490 | 10,590 | |||||||||
|
Deferred income taxes
|
40,773 | (8,675 | ) | (1,700 | ) | |||||||
|
(Gain) loss on sale of real estate/investments and other
|
(2,884 | ) | (2,515 | ) | 2,594 | |||||||
|
Loss (gain) on early retirement of bonds
|
3,939 | - | (300 | ) | ||||||||
|
Amortization/write-off of deferred financing costs
|
278 | 640 | 575 | |||||||||
|
Stock-based compensation
|
2,484 | 1,824 | 1,059 | |||||||||
|
Goodwill impairment loss
|
- | - | 107,000 | |||||||||
|
Non-cash restructuring charges
|
- | 1,835 | - | |||||||||
| Changes in operating assets and liabilities, net of effects of business acquisitions and divestitures: | ||||||||||||
|
Trade accounts receivable
|
(6,683 | ) | 10,508 | 24,396 | ||||||||
|
Inventories
|
(9,848 | ) | 21,477 | 1,658 | ||||||||
|
Prepaid expenses and other
|
(3,983 | ) | 941 | 2,955 | ||||||||
|
Other assets
|
(1,195 | ) | 1,228 | 1,960 | ||||||||
|
Trade accounts payable
|
4,027 | 288 | (7,207 | ) | ||||||||
|
Accrued and non-current liabilities
|
1,668 | (2,630 | ) | (4,451 | ) | |||||||
|
Net cash provided by operating activities from continuing operations
|
3,280 | 29,867 | 63,027 | |||||||||
|
Net cash used for operating activities from discontinued operations
|
- | - | (2,796 | ) | ||||||||
|
Net cash provided by operating activities
|
3,280 | 29,867 | 60,231 | |||||||||
|
Investing activities:
|
||||||||||||
|
Proceeds from sale of marketable securities
|
23,048 | 6,340 | 363 | |||||||||
|
Purchases of marketable securities
|
(16,427 | ) | (4,518 | ) | (2,968 | ) | ||||||
|
Capital expenditures
|
(12,543 | ) | (7,245 | ) | (12,245 | ) | ||||||
|
Proceeds from sale of assets
|
1,182 | 3,542 | 1,593 | |||||||||
|
Purchase of business
|
- | - | (52,779 | ) | ||||||||
|
Net cash used for investing activities from continuing operations
|
(4,740 | ) | (1,881 | ) | (66,036 | ) | ||||||
|
Net cash provided by investing activities from discontinued operations
|
396 | 531 | 531 | |||||||||
|
Net cash used for investing activities
|
(4,344 | ) | (1,350 | ) | (65,505 | ) | ||||||
|
Financing activities:
|
||||||||||||
|
Proceeds from exercise of stock options
|
- | 291 | 421 | |||||||||
|
Payment of bond redemption tender fees
|
(3,154 | ) | - | - | ||||||||
|
Payments under line-of-credit agreements
|
(511 | ) | (8,502 | ) | (10,623 | ) | ||||||
|
Borrowings under line-of-credit agreements
|
174 | 4,556 | 8,485 | |||||||||
|
Repayment of debt
|
(125,817 | ) | (964 | ) | (6,987 | ) | ||||||
|
Proceeds from issuance of long-term debt
|
147,844 | - | - | |||||||||
|
Payment of deferred financing costs
|
(3,185 | ) | (1,258 | ) | - | |||||||
|
Tax benefit from exercise of stock options
|
- | - | 274 | |||||||||
|
Change in ESOP debt guarantee
|
443 | 459 | 515 | |||||||||
|
Net cash provided by (used for) financing activities from continuing operations
|
15,794 | (5,418 | ) | (7,915 | ) | |||||||
|
Net cash used for financing activities from discontinued operations
|
- | - | (14,612 | ) | ||||||||
|
Net cash provided by (used for) financing activities
|
15,794 | (5,418 | ) | (22,527 | ) | |||||||
|
Effect of exchange rate changes on cash
|
1,441 | 1,633 | (8,957 | ) | ||||||||
|
Net change in cash and cash equivalents
|
16,171 | 24,732 | (36,758 | ) | ||||||||
|
Cash and cash equivalents at beginning of year
|
63,968 | 39,236 | 75,994 | |||||||||
|
Cash and cash equivalents at end of year
|
$ | 80,139 | $ | 63,968 | $ | 39,236 | ||||||
|
Supplementary cash flows data:
|
||||||||||||
|
Interest paid
|
$ | 15,556 | $ | 12,451 | $ | 12,815 | ||||||
|
Income taxes paid, net of refunds
|
$ | 946 | $ | 3,954 | $ | 9,673 | ||||||
See accompanying notes.
F-6
COLUMBUS McKINNNON CORPORATION
NOTES TO CONSOLIDATED FINANCIAL STATEMENTS
(tabular amounts in thousands, except share data)
1. Description of Business
Columbus McKinnon Corporation (the Company) is a leading designer, marketer and manufacturer of material handling products and services which efficiently and safely move, lift, position and secure material. Key products include hoists, rigging tools, cranes, and actuators. The Company’s material handling products are sold globally principally to third party distributors through diverse distribution channels, and to a lesser extent directly to end-users. During fiscal 2011, approximately 54% of sales were to customers in the United States.
2. Accounting Principles and Practices
Advertising
Costs associated with advertising are expensed in the year incurred and are included in selling expense in the consolidated statements of operations. Advertising expenses were $3,700,000, $3,020,000, and $4,883,000 in fiscal 2011, 2010, and 2009, respectively.
Cash and Cash Equivalents
The Company considers as cash equivalents all highly liquid investments with an original maturity of three months or less.
Concentrations of Labor
Approximately 13% of the Company’s employees are represented by four separate U.S. and Canadian collective bargaining agreements which terminate at various times between September 2011 and May 2014. Approximately 6% of the labor force is covered by collective bargaining agreements that will expire within one year.
Consolidation
These consolidated financial statements include the accounts of the Company and its global subsidiaries; all significant intercompany accounts and transactions have been eliminated. Our Mexican subsidiary closes three months earlier to facilitate consolidated reporting.
Financial Instruments
The carrying value of the Company’s current assets and current liabilities approximate their fair values based upon the relatively short maturity of those instruments.
F-7
COLUMBUS McKINNNON CORPORATION
NOTES TO CONSOLIDATED FINANCIAL STATEMENTS – (Continued)
(tabular amounts in thousands, except share data)
Foreign Currency Translations
The Company translates foreign currency financial statements as described in Financial Accounting Standards Board (FASB) Accounting Standards Codification (ASC) Topic 830, “Foreign Currency Matters.” Under this method, all items of income and expense are translated to U.S. dollars at average exchange rates for the year. All assets and liabilities are translated to U.S. dollars at the year-end exchange rate. Gains or losses on translations are recorded in accumulated other comprehensive loss in the shareholders’ equity section of the balance sheet. The functional currency is the foreign currency in which the foreign subsidiaries conduct their business. Gains and losses from foreign currency transactions are reported in foreign currency exchange (gain) loss. There were losses, including changes in the fair value of derivatives, of approximately $452,000 on foreign currency transactions in fiscal 2011. Including changes in the fair value of derivatives, there were gains of $344,000 and losses of $3,018,000 on foreign currency transactions in fiscal 2010 and 2009, respectively.
Gain from Litigation
During the fourth quarter of fiscal 2009, the Company settled a dispute with a previous service provider. The Company recorded a gain of $3,330,000 related to the settlement in the form of cash proceeds and a note receivable which was collected in fiscal 2010.
Goodwill
Goodwill is not amortized but is tested for impairment at least annually, in accordance with the provisions of ASC Topic 350-20-35-1. Goodwill impairment is deemed to exist if the net book value of a reporting unit exceeds its estimated fair value. The fair value of a reporting unit is determined using a discounted cash flow methodology. The Company’s reporting units are determined based upon whether discrete financial information is available and reviewed regularly, whether those units constitute a business, and the extent of economic similarities between those reporting units for purposes of aggregation. The Company’s reporting units identified under ASC Topic 350-20-35-33 are at the component level, or one level below the reporting segment level as defined under ASC Topic 280-10-50-10 “Segment Reporting – Disclosure.” The Company’s one segment is subdivided into four reporting units. See Note 9 for further discussion of goodwill and intangible assets.
Impairment of Long-Lived Assets
The Company assesses impairment of its long-lived assets in accordance with the provisions of ASC Topic 360 “Property, Plant, and Equipment.” This statement requires long-lived assets, such as property and equipment and purchased intangibles subject to amortization to be reviewed for impairment whenever events or changes in circumstances indicate that the carrying amount of an asset group may not be recoverable. Recoverability of assets to be held and used is measured by a comparison of the carrying amount of an asset group to estimated undiscounted future cash flows expected to be generated by the asset group. If the carrying amount of an asset group exceeds its estimated future cash flows, an impairment charge is recognized equal to the amount by which the carrying amount of the asset group exceeds the fair value of the asset group.
In assessing long-lived assets for an impairment loss, assets are grouped with other assets and liabilities at the lowest level for which identifiable cash flows are largely independent of the cash flows of other assets and liabilities. Asset grouping requires a significant amount of judgment. Accordingly, facts and circumstances will influence how asset groups are determined for impairment testing. In assessing long-lived assets for impairment, management considered the Company’s product line portfolio, customers and related commercial agreements, labor agreements and other factors in grouping assets and liabilities at the lowest level for which identifiable cash flows are independent. The Company considers projected future undiscounted cash flows, trends and other factors in its assessment of whether impairment conditions exist. While the Company believes that its estimates of future cash flows are reasonable, different assumptions regarding such factors as future production volumes, customer pricing, economics and productivity and cost initiatives, could significantly affect its estimates. In determining fair value of long-lived assets, management uses management estimates, discounted cash flow calculations, and appraisals where necessary.
F-8
COLUMBUS McKINNNON CORPORATION
NOTES TO CONSOLIDATED FINANCIAL STATEMENTS – (Continued)
(tabular amounts in thousands, except share data)
Intangible Assets
At acquisition, the Company estimates and records the fair value of purchased intangible assets which primarily consist of trade names, customer relationships and technology. The fair values are estimated based on management’s assessment as well as independent third party appraisals. Such valuations may include a discounted cash flow of anticipated revenues resulting from the acquired intangible asset.
Amortization of intangible assets with finite lives is recognized over their estimated useful lives using an amortization method that reflects the pattern in which the economic benefits of the intangible assets are consumed or otherwise realized. The straight line method is used for customer relationships. As a result of the negligible attrition rate in our customer base, the difference between the straight line method and attrition method is not considered significant. The estimated useful lives for our intangible assets range from 11 to 18 years.
Inventories
Inventories are valued at the lower of cost or market. Cost of approximately 46% of inventories at March 31, 2011 (52% at March 31, 2010) has been determined using the LIFO (last-in, first-out) method. Costs of other inventories have been determined using the FIFO (first-in, first-out) or average cost method. FIFO cost approximates replacement cost. Costs in inventory include components for direct labor and overhead costs.
Marketable Securities
All of the Company’s marketable securities, which consist of equity securities, have been classified as available-for-sale securities and are therefore recorded at their fair values with the unrealized gains and losses, net of tax, reported in accumulated other comprehensive loss in the shareholders’ equity section of the balance sheet unless unrealized losses are deemed to be other than temporary. In such instance, the unrealized losses are reported in the consolidated statements of operations within investment (income) loss. Estimated fair value is based on published trading values at the balance sheet dates. The cost of securities sold is based on the specific identification method. Interest and dividend income are included in investment (income) loss in the consolidated statements of operations.
The marketable securities are carried as long-term assets since they are held for the settlement of the Company’s general and products liability insurance claims filed through CM Insurance Company, Inc., a wholly owned captive insurance subsidiary. The marketable securities are not available for general working capital purposes.
Property, Plant, and Equipment
Property, plant, and equipment are stated at cost and depreciated principally using the straight-line method over their respective estimated useful lives (buildings and building equipment—15 to 40 years; machinery and equipment—3 to 18 years). When depreciable assets are retired, or otherwise disposed of, the cost and related accumulated depreciation are removed from the accounts and any resulting gain or loss is reflected in operating results.
Research and Development
Research and development costs as defined in ASC Topic 730, “Research and Development,” were $2,947,000, $2,592,000, and $4,451,000 for the years ended March 31, 2011, 2010 and 2009, respectively and are classified as general and administrative expense in the consolidated statements of operations.
F-9
COLUMBUS McKINNNON CORPORATION
NOTES TO CONSOLIDATED FINANCIAL STATEMENTS – (Continued)
(tabular amounts in thousands, except share data)
Revenue Recognition, Accounts Receivable and Concentration of Credit Risk
Sales are recorded when title passes to the customer which is generally at time of shipment to the customer. The Company performs ongoing credit evaluations of its customers’ financial condition, but generally does not require collateral to support customer receivables. The credit risk is controlled through credit approvals, limits and monitoring procedures. Accounts receivable are reported at net realizable value and do not accrue interest. The Company establishes an allowance for doubtful accounts based upon factors surrounding the credit risk of specific customers, historical trends and other factors. Accounts receivable are charged against the allowance for doubtful accounts once all collection efforts have been exhausted. The Company does not routinely permit customers to return product. However, sales returns are permitted in specific situations and typically include a restocking charge or the purchase of additional product. The Company has established an allowance for returns based upon historical trend rates.
Shipping and Handling Costs
Shipping and handling costs are a component of cost of products sold.
Stock-Based Compensation
The Company records stock-based compensation in accordance with ASC Topic 718, “Compensation – Stock Compensation.” This Statement requires all equity-based payments to employees, including grants of employee stock options, to be recognized in the statement of earnings based on the grant date fair value of the award. Stock compensation expense is included in cost of goods sold, selling, and general and administrative expense. The Company uses a straight-line method of attributing the value of stock-based compensation expense, subject to minimum levels of expense, based on vesting. See Note 15 for further discussion of stock-based compensation.
Reclassification
Certain prior year numbers have been reclassified to conform with current year reporting presentation.
Use of Estimates
The preparation of financial statements in conformity with U.S. generally accepted accounting principles requires management to make estimates and assumptions that affect the amounts reported in the financial statements and accompanying notes. Actual results could differ from those estimates.
Warranties
The Company offers warranties for certain products it sells. The specific terms and conditions of those warranties vary depending upon the product sold and the country in which the Company sold the product. The Company generally provides a basic limited warranty, including parts and labor for any product deemed to be defective for a period of one year. The Company estimates the costs that may be incurred under its basic limited warranty, based largely upon actual warranty repair costs history, and records a liability in the amount of such costs in the month that the product revenue is recognized. The resulting accrual balance is reviewed during the year. Factors that affect the Company’s warranty liability include the number of units sold, historical and anticipated rate of warranty claims, and cost per claim. Changes in the Company’s product warranty accrual are as follows:
|
|
2011
|
2010
|
||||||
|
Balance at beginning of year
|
$ | 926 | $ | 1,282 | ||||
|
Accrual for warranties issued
|
1,474 | 1,946 | ||||||
|
Warranties settled
|
(1,837 | ) | (2,302 | ) | ||||
|
Balance at end of year
|
$ | 563 | $ | 926 | ||||
F-10
COLUMBUS McKINNNON CORPORATION
NOTES TO CONSOLIDATED FINANCIAL STATEMENTS – (Continued)
(tabular amounts in thousands, except share data)
3. Acquisitions
On October 1, 2008, the Company acquired Pfaff Beteiligungs GmbH (“Pfaff-silberblau” or “Pfaff”), a Kissing, Germany based company with a leading European position in lifting, material handling and actuator products. This strategic acquisition continued the execution of the Company’s strategic plan to grow its revenue in complementary product lines and also broaden that revenue in non-U.S. markets. Pfaff-silberblau complements the Company’s existing material handling business in Europe and the U.S. and creates a global actuator business when combined with the Company’s U.S. based Duff-Norton actuator business. The Company is creating value from this acquisition through integrating the Pfaff business with the Columbus McKinnon European and U.S. based material handling businesses and Duff-Norton. Value is being created by cross selling products among these groups as well as reducing costs through business integration and procurement activities. The results of Pfaff-silberblau are included in the Company’s consolidated financial statements from the date of acquisition.
Pfaff’s revenue and net loss from the date of acquisition through March 31, 2009 totaled $43,498,000 and $13,942,000 respectively.
This transaction was accounted for under the purchase method of accounting. The aggregate purchase consideration for the acquisition of Pfaff-silberblau was $52,779,000 in cash and acquisition costs. The acquisition was funded with existing cash. The purchase price was allocated to the assets acquired and liabilities assumed based upon a valuation of respective fair values. The identifiable intangible assets consisted of trademarks with a value of $6,101,000 (18 year estimated useful life), customer relationships with a value of $15,092,000 (11 year estimated useful life), and technology with a value of $806,000 (14 year estimated useful life). The excess consideration over fair value was recorded as goodwill and approximated $27,769,000, none of which is deductible for tax purposes. The allocation of purchase consideration to the assets acquired and liabilities assumed is as follows:
|
Working capital
|
$ | 13,340 | ||
|
Property, plant and equipment
|
8,321 | |||
|
Other long term liabilities, net
|
(18,650 | ) | ||
|
Identifiable intangible assets
|
21,999 | |||
|
Goodwill
|
27,769 | |||
|
Total
|
$ | 52,779 |
4. Divestitures
As part of the continuing strategic evaluation of its businesses, the Company determined that its integrated material handling conveyor systems business (Univeyor A/S) no longer provided a strategic fit with its long-term growth and operational objectives. On July 25, 2008, the Company completed the sale of Univeyor A/S, which business represented the majority of the Company’s former “Solutions” segment. In accordance with the provisions of Financial Accounting Standards Board (“FASB”) Accounting Standards Codification (“ASC”) Topic 205-20-45-1, “Presentation of Financial Statements – Discontinued Operations”, the results of operations of Univeyor A/S have been classified as discontinued operations in the condensed statements of operations and statements of cash flows presented herein. In connection with the sale of Univeyor A/S on July 25, 2008, the Company used cash on hand to repay $15,191,000 in amounts outstanding on Univeyor’s lines of credit and fixed term bank debt.
Income from discontinued operations presented herein includes payments received on a note receivable related to the fiscal 2002 disposal of Automatic Systems, Inc. Due to the uncertainty surrounding the financial viability of the debtor, the note was recorded at the estimated net realizable value of $0 at the time of the divestiture. The note has a carrying value of $214,000 at March 31, 2011.
F-11
COLUMBUS McKINNNON CORPORATION
NOTES TO CONSOLIDATED FINANCIAL STATEMENTS – (Continued)
(tabular amounts in thousands, except share data)
Summarized statements of operations for discontinued operations are as follows:
|
|
Year Ended March 31,
|
|||||||||||
|
|
2011
|
2010
|
2009
|
|||||||||
|
|
(In thousands)
|
|||||||||||
|
Net revenue
|
$ | - | $ | - | $ | 8,982 | ||||||
|
Gain (loss) before income taxes
|
639 | 857 | (798 | ) | ||||||||
|
Income tax expense
|
243 | 326 | 326 | |||||||||
|
Gain (loss) from operations of discontinued businesses
|
396 | 531 | (1,124 | ) | ||||||||
|
Loss on sale of discontinued operation
|
- | - | (15,926 | ) | ||||||||
|
Tax benefit from sale of discontinued operation
|
- | - | 14,768 | |||||||||
|
Gain (loss) from discontinued operations
|
$ | 396 | $ | 531 | $ | (2,282 | ) | |||||
During fiscal 2010, as part of the continuing strategic evaluation of its businesses, the Company determined that its American Lifts business no longer provided a strategic fit with its long-term growth and operational objectives. The American Lifts business manufactured powered lift tables which enhance workplace ergonomics and were sold primarily to customers in the general manufacturing, construction, and air cargo industries. On October 30, 2009, the Company sold this business to a strategic buyer for $2,400,000 in cash. A $1,055,000 pre-tax gain on the sale is included in other income, net in the Company’s consolidated statements of operations for the year ended March 31, 2010. American Lifts has not been treated as a discontinued operation as its results from operations were immaterial to the overall consolidated financial results of the Company.
5. Fair Value Measurements
ASC Topic 820 “Fair Value Measurements and Disclosures” establishes the standards for reporting financial assets and liabilities and nonfinancial assets and liabilities that are recognized or disclosed at fair value on a recurring basis (at least annually). Under these standards, fair value is defined as the price that would be received to sell an asset or paid to transfer a liability (i.e. the "exit price") in an orderly transaction between market participants at the measurement date.
ASC Topic 820-10-35-37 establishes a hierarchy for inputs used in measuring fair value that maximizes the use of observable inputs and minimizes the use of unobservable inputs by requiring that the most observable inputs be used when available. Observable inputs are inputs that market participants would use in pricing the asset or liability developed based on market data obtained from sources independent of the Company. Unobservable inputs are inputs that reflect the Company's assumptions about the valuation techniques that market participants would use in pricing the asset or liability developed based on the best information available in the circumstances. The hierarchy is separated into three levels based on the reliability of inputs as follows:
Level 1 - Valuations based on quoted prices in active markets for identical assets or liabilities that the Company has the ability to access. Since valuations are based on quoted prices that are readily and regularly available in an active market, valuation of these products does not entail a significant degree of judgment.
Level 2 - Valuations based on quoted prices in markets that are not active or for which all significant inputs are observable, either directly or indirectly, involving some degree of judgment.
Level 3 - Valuations based on inputs that are unobservable and significant to the overall fair value measurement. The degree of judgment exercised in determining fair value is greatest for instruments categorized in Level 3.
The availability of observable inputs can vary from asset/liability to asset/liability and is affected by a wide variety of factors, including the type of asset/liability, whether the asset/liability is established in the marketplace, and other characteristics particular to the transaction. To the extent that valuation is based on models or inputs that are less observable or unobservable in the market, the determination of fair value requires more judgment. In certain cases, the inputs used to measure fair value may fall into different levels of the fair value hierarchy. In such cases, for disclosure purposes the level in the fair value hierarchy within which the fair value measurement in its entirety falls is determined based on the lowest level input that is significant to the fair value measurement in its entirety.
F-12
COLUMBUS McKINNNON CORPORATION
NOTES TO CONSOLIDATED FINANCIAL STATEMENTS – (Continued)
(tabular amounts in thousands, except share data)
Fair value is a market-based measure considered from the perspective of a market participant rather than an entity-specific measure. Therefore, even when market assumptions are not readily available, assumptions are required to reflect those that market participants would use in pricing the asset or liability at the measurement date.
When valuing our derivative portfolio, the Company uses readily observable market data in conjunction with commonly used valuation models. Consequently, the Company designates our derivatives as Level 2.
The following table provides information regarding financial assets and liabilities measured at fair value on a recurring basis:
|
|
|
Fair value measurements at reporting date using
|
||||||||||||||
|
Description
|
At March 31, 2011
|
Quoted prices in active markets for identical assets (Level 1)
|
Significant other observable inputs (Level 2)
|
Significant unobservable inputs (Level 3)
|
||||||||||||
|
Assets/(Liabilities):
|
|
|
|
|
||||||||||||
|
Marketable securities
|
$ | 24,592 | $ | 24,592 | $ | - | $ | - | ||||||||
|
Derivative liabilities
|
(1,397 | ) | - | (1,397 | ) | - | ||||||||||
As of March 31, 2011, the Company did not have any nonfinancial assets and liabilities that are recognized or disclosed at fair value on a recurring basis.
Interest and dividend income on marketable securities are recorded in investment (income) loss. Changes in the fair value of derivatives are recorded in foreign currency exchange (gain) loss and other comprehensive loss. Interest and dividend income on marketable securities are measured based upon amounts earned on their respective declaration dates. During fiscal 2009, the Company reduced the cost bases of certain marketable securities since it was determined that the unrealized losses on those securities were other than temporary in nature. This determination resulted in the recognition of a pre-tax charge to earnings of $4,014,000, classified within investment (income) loss. During fiscal 2011 and 2010, the Company sold a portion of these previously written down investments, which resulted in the recognition of a gain of approximately $1,852,000 and $606,000, respectively.
Assets that are measured on a non-recurring basis during fiscal 2011, 2010, and 2009 include the Company’s reporting units that are used to test goodwill for impairment on an annual or interim basis under the provisions of ASC Topic 350-20-35-1 “Intangibles, Goodwill and Other – Goodwill Subsequent Measurement”, as well as property, plant and equipment in circumstances when the Company determines that those assets are impaired under the provisions of ASC Topic 360-10-35-17 “Property Plant and Equipment – Subsequent Measurement.” Liabilities that are measured on a non-recurring basis during fiscal 2010 include the measurement of termination benefits in connection with the Company’s restructuring plan under the provisions of ASC Topic 420 “Exit or Disposal Cost Obligations”.
The Company applied the provisions of ASC Topic 350-20-35-1 during the annual goodwill impairment test performed as of February 28, 2011. Step I of the goodwill impairment test consisted of determining a fair value for each of the Company’s reporting units. The fair values for the Company’s reporting units cannot be determined using readily available quoted Level 1 inputs or Level 2 inputs that are observable in active markets. Therefore, the Company used a blended discounted cash flow and market-based valuation model to estimate the fair value of its reporting units, using Level 3 inputs. To estimate the fair values of reporting units, the Company uses significant estimates and judgmental factors. The key estimates and factors used in the discounted cash flow valuation model include revenue growth rates and profit margins based on internal forecasts, terminal growth rates, and the weighted-average cost of capital used to discount future cash flows. See Note 9 for the results of the Company’s February 28, 2011 annual goodwill impairment test.
F-13
COLUMBUS McKINNNON CORPORATION
NOTES TO CONSOLIDATED FINANCIAL STATEMENTS – (Continued)
(tabular amounts in thousands, except share data)
6. Inventories
Inventories consisted of the following:
|
|
March 31,
|
|||||||
|
|
2011
|
2010
|
||||||
|
At cost—FIFO basis:
|
|
|
||||||
|
Raw materials
|
$ | 44,769 | $ | 42,340 | ||||
|
Work-in-process
|
15,175 | 10,774 | ||||||
|
Finished goods
|
47,329 | 44,585 | ||||||
|
|
107,273 | 97,699 | ||||||
|
LIFO cost less than FIFO cost
|
(17,242 | ) | (17,877 | ) | ||||
|
Net inventories
|
$ | 90,031 | $ | 79,822 | ||||
The excess of FIFO over LIFO cost decreased primarily due to LIFO liquidation resulting in a $500,000 positive impact on fiscal 2011 income.
During 2011 the Company wrote off $411,000 in inventory related to restructuring activities.
F-14
COLUMBUS McKINNNON CORPORATION
NOTES TO CONSOLIDATED FINANCIAL STATEMENTS – (Continued)
(tabular amounts in thousands, except share data)
7. Marketable Securities
All of the Company’s marketable securities, which consist of equity securities, have been classified as available-for-sale securities and are therefore recorded at their fair values with the unrealized gains and losses, net of tax, reported in accumulated other comprehensive loss in the shareholders’ equity section of the balance sheet unless unrealized losses are deemed to be other-than-temporary. In such instances, the unrealized losses are reported in the consolidated statements of operations and retained earnings within investment (income) loss. Estimated fair value is based on published trading values at the balance sheet dates. The cost of securities sold is based on the specific identification method. Interest and dividend income are included in investment (income) loss in the consolidated statements of operations.
Marketable securities are carried as long-term assets since they are held for the settlement of the Company’s general and products liability insurance claims filed through CM Insurance Company, Inc., a wholly owned captive insurance subsidiary. The marketable securities are not available for general working capital purposes.
In accordance with ASC Topic 320-10-35-30 “Investments – Debt & Equity Securities – Subsequent Measurement,” the Company reviews its marketable securities for declines in market value that may be considered other-than-temporary. The Company generally considers market value declines to be other-than-temporary if they are declines for a period longer than six months and in excess of 20% of original cost, or when other evidence indicates impairment.
During the year ended March 31, 2009, because of uncertain market conditions and the duration at which certain securities had been trading below cost, the Company reduced the cost bases of certain equity securities since it was determined that the unrealized losses on those securities were other than temporary in nature. This determination resulted in the recognition of a pre-tax charge to earnings of $4,014,000 for the year ended March 31, 2009, classified within investment (income) loss. There were no other than temporary impairments for the years ended March 31, 2011 and 2010. During fiscal 2011 and 2010, the Company sold nearly all of these previously written down investments, which resulted in the recognition of a gain of approximately $1,852,000 and $606,000 respectively.
The following is a summary of available-for-sale securities at March 31, 2011:
|
|
Cost
|
Gross Unrealized Gains
|
Gross Unrealized Losses
|
Estimated Fair Value
|
||||||||||||
|
Equity securities
|
$ | 23,708 | $ | 1,064 | $ | 180 | $ | 24,592 | ||||||||
The aggregate fair value of investments and unrealized losses on available-for-sale securities in an unrealized loss position at March 31, 2011 are as follows:
|
|
Aggregate Fair Value
|
Unrealized Losses
|
||||||
|
Securities in a continuous loss position for less than 12 months
|
$ | 14,788 | $ | 159 | ||||
|
Securities in a continuous loss position for more than 12 months
|
1,035 | 21 | ||||||
|
|
$ | 15,823 | $ | 180 | ||||
The Company considered the nature of the investments, causes of previous impairments, the severity and duration of unrealized losses and other factors and determined that the unrealized losses at March 31, 2011 were temporary in nature.
F-15
COLUMBUS McKINNNON CORPORATION
NOTES TO CONSOLIDATED FINANCIAL STATEMENTS – (Continued)
(tabular amounts in thousands, except share data)
Net realized (losses) gains related to sales of marketable securities (excluding other-than-temporary impairments) were $2,358,037, $(238,000), and $7,000 in fiscal 2011, 2010 and 2009, respectively.
The following is a summary of available-for-sale securities at March 31, 2010:
|
|
Cost |
Gross Unrealized Gains
|
Gross Unrealized Losses
|
Estimated Fair Value
|
||||||||||||
|
Equity securities
|
$ | 26,771 | $ | 2,667 | $ | 39 | $ | 29,399 | ||||||||
The aggregate fair value of investments and unrealized losses on available-for-sale securities in an unrealized loss position at March 31, 2010 are as follows:
|
|
Aggregate Fair Value
|
Unrealized Losses
|
||||||
|
Securities in a continuous loss position for less than 12 months
|
$ | 2,295 | $ | 30 | ||||
|
Securities in a continuous loss position for more than 12 months
|
454 | 9 | ||||||
|
|
$ | 2,749 | $ | 39 | ||||
Net unrealized gains (losses) included in the balance sheet amounted to $884,000 at March 31, 2011 and $2,628,000 at March 31, 2010. The amounts, net of related income tax expense of $309,000 and $920,000 at March 31, 2011 and 2010, respectively, are reflected as a component of accumulated other comprehensive loss within shareholders’ equity.
In addition to the above, the Company has included unrealized gains of $804,000, net of tax, within accumulated other comprehensive loss related to an investment recorded in prepaid expenses and other current assets.
8. Property, Plant, and Equipment
Consolidated property, plant, and equipment of the Company consisted of the following:
|
|
March 31,
|
|||||||
|
|
2011
|
2010
|
||||||
|
Land and land improvements
|
$ | 4,670 | $ | 4,804 | ||||
|
Buildings
|
27,451 | 28,621 | ||||||
|
Machinery, equipment, and leasehold improvements
|
119,653 | 121,447 | ||||||
|
Construction in progress
|
7,198 | 2,335 | ||||||
|
|
158,972 | 157,207 | ||||||
|
Less accumulated depreciation
|
99,612 | 100,101 | ||||||
|
Net property, plant, and equipment
|
$ | 59,360 | $ | 57,106 | ||||
Buildings include assets recorded under capital leases amounting to $3,147,000 for each of the years ended March 31, 2011 and 2010. Machinery, equipment, and leasehold improvements include assets recorded under capital leases amounting to $5,940,000 and $5,613,000 for the years ended March 31, 2011 and 2010, respectively. Accumulated depreciation includes accumulated amortization of the assets recorded under capital leases amounting to $3,724,000 and $1,910,000 at March 31, 2011 and 2010, respectively.
F-16
COLUMBUS McKINNNON CORPORATION
NOTES TO CONSOLIDATED FINANCIAL STATEMENTS – (Continued)
(tabular amounts in thousands, except share data)
Depreciation expense, including amortization of assets recorded under capital leases, was $9,286,000, $10,613,000, and $9,592,000 for the years ended March 31, 2011, 2010 and 2009, respectively.
9. Goodwill and Intangible Assets
As discussed in Note 2, goodwill is not amortized but is tested for impairment at least annually, in accordance with the provisions of ASC Topic 350-20-35-1. Goodwill impairment is deemed to exist if the net book value of a reporting unit exceeds its estimated fair value. The fair value of a reporting unit is determined using a discounted cash flow methodology. The Company’s reporting units are determined based upon whether discrete financial information is available and reviewed regularly, whether those units constitute a business, and the extent of economic similarities between those reporting units for purposes of aggregation. The Company’s reporting units identified under ASC Topic 350-20-35-33 are at the component level, or one level below the reporting segment level as defined under ASC Topic 280-10-50-10 “Segment Reporting – Disclosure.” The Company has four reporting units. Only two of the four reporting units carry goodwill at March 31, 2011 and March 31, 2010. The Duff-Norton reporting unit (which designs, manufactures and sources mechanical and electromechanical actuators and rotary unions) had goodwill of $9,902,000 and $9,838,000 at March 31, 2011 and 2010, respectively, and the Rest of Products reporting unit (representing the hoist, chain, and forgings design, manufacturing, and distribution businesses) had goodwill of $96,153,000 and $95,296,000 at March 31, 2011 and 2010, respectively.
In accordance with ASC Topic 350-20-35-3, the measurement of impairment of goodwill consists of two steps. In the first step, the Company compares the fair value of each reporting unit to its carrying value. As part of the impairment analysis, the Company determines the fair value of each of its reporting units with goodwill using the income approach. The income approach uses a discounted cash flow methodology to determine fair value. This methodology recognizes value based on the expected receipt of future economic benefits. Key assumptions in the income approach include a free cash flow projection, an estimated discount rate, a long-term growth rate and a terminal value. These assumptions are based upon the Company’s historical experience, current market trends and future expectations.
During fiscal 2009, the generally weak economic conditions resulted in a rapid decline in business, a reduction in forecasted cash flows, and an increase in capital costs as a result of tightening credit markets. Based on this evaluation, the Company determined that the fair value of its Rest of Products reporting unit was less than its carrying value in the fourth quarter of fiscal 2009. Following this assessment, ASC Topic 350-20-35-8 required the Company to perform a second step in order to determine the implied fair value of goodwill in this reporting unit and to compare it to its carrying value. The activities in the second step included hypothetically valuing all of the tangible and intangible assets of the impaired reporting unit using market participant assumptions, as if the reporting unit had been acquired in a business combination. As a result of this assessment, the Company recorded a goodwill impairment charge of $107,000,000 in the fourth quarter of fiscal 2009. None of the charge related to goodwill was deductible for tax purposes.
As a result of the assessments for the years ended March 31, 2011 and 2010, the Company concluded that the balances of goodwill and intangible assets were not impaired, and therefore did not record impairment charges during the fiscal years ended March 31, 2011 and 2010.
Future impairment indicators, such as declines in forecasted cash flows, may cause additional significant impairment charges. Impairment charges could be based on such factors as the Company’s stock price, forecasted cash flows, assumptions used, control premiums or other variables.
Identifiable intangible assets acquired in a business combination are amortized over their estimated useful lives.
F-17
COLUMBUS McKINNNON CORPORATION
NOTES TO CONSOLIDATED FINANCIAL STATEMENTS – (Continued)
(tabular amounts in thousands, except share data)
A summary of changes in goodwill during the years ended March 31, 2011 and 2010 is as follows:
|
Balance at April 1, 2009
|
$ | 104,744 | ||
|
Currency translation
|
390 | |||
|
Balance at March 31, 2010
|
105,134 | |||
|
Currency translation
|
921 | |||
|
Balance at March 31, 2011
|
$ | 106,055 |
Intangible assets at March 31, 2011 are as follows:
|
|
Gross Carrying Amount
|
Accumulated Amortization
|
Net
|
|||||||||
|
Trademarks
|
$ | 6,136 | $ | (841 | ) | $ | 5,295 | |||||
|
Customer relationships
|
15,179 | (3,485 | ) | 11,694 | ||||||||
|
Other
|
1,339 | (239 | ) | 1,100 | ||||||||
|
Balance at March 31, 2011
|
$ | 22,654 | $ | (4,565 | ) | $ | 18,089 | |||||
Intangible assets at March 31, 2010 were as follows:
|
|
Gross Carrying Amount
|
Accumulated Amortization
|
Net
|
|||||||||
|
Trademarks
|
$ | 5,856 | $ | (481 | ) | $ | 5,375 | |||||
|
Customer relationships
|
14,487 | (1,996 | ) | 12,491 | ||||||||
|
Other
|
1,358 | (193 | ) | 1,165 | ||||||||
|
Balance at March 31, 2010
|
$ | 21,701 | $ | (2,670 | ) | $ | 19,031 | |||||
All of the Company’s intangibles assets are considered to have finite lives and are amortized. The weighted-average amortization periods are 18 years for trademarks, 11 years for customer relationships and 14 years for other. Total amortization expense was $1,778,000, $1,876,000, and $998,000 for fiscal 2011, 2010, and 2009, respectively. Based on the current amount of intangible assets, the estimated amortization expense for each of the succeeding five years is expected to be $1,890,000, $1,860,000, $1,830,000, and $1,810,000, and $1,780,000, respectively.
F-18
COLUMBUS McKINNNON CORPORATION
NOTES TO CONSOLIDATED FINANCIAL STATEMENTS – (Continued)
(tabular amounts in thousands, except share data)
10. Derivative Instruments
The Company uses derivative instruments to manage selected foreign currency exposures. The Company does not use derivative instruments for speculative trading purposes. All derivative instruments must be recorded on the balance sheet at fair value. For derivatives designated as cash flow hedges, the effective portion of changes in the fair value of the derivative is recorded as accumulated other comprehensive loss, or AOCL, and is reclassified to earnings when the underlying transaction has an impact on earnings. The ineffective portion of changes in the fair value of the derivative is reported in foreign currency exchange (gain) loss in the Company’s consolidated statement of operations. For derivatives not classified as cash flow hedges, all changes in market value are recorded as a foreign currency exchange (gain) loss in the Company’s consolidated statements of operations.
The Company has foreign currency forward agreements and a cross-currency swap in place to offset changes in the value of intercompany loans to certain foreign subsidiaries due to changes in foreign exchange rates. The notional amount of these derivatives is $14,264,000 and all contracts mature by September 30, 2013. These contracts are not designated as hedges.
The Company has foreign currency forward agreements in place to hedge changes in the value of recorded foreign currency liabilities due to changes in foreign exchange rates at the settlement date. The notional amount of those derivatives is $1,264,000 and all contracts mature within twelve months. These contracts are marked to market each balance sheet date and are not designated as hedges.
The Company has foreign currency forward agreements that are designated as cash flow hedges to hedge a portion of forecasted inventory purchases denominated in a foreign currency. The notional amount of those derivatives is $10,342,000 and all contracts mature within thirteen months of March 31, 2011.
The Company is exposed to credit losses in the event of non-performance by the counterparties on its financial instruments. All counterparties have investment grade credit ratings. The Company anticipates that these counterparties will be able to fully satisfy their obligations under the contracts.
The following is the pretax effect of derivative instruments on the consolidated statement of operations for the year ended March 31, 2011 (in thousands):
|
Derivatives Designated as Cash Flow Hedges
|
Amount of Gain or (Loss) Recognized in Other Comprehensive Income on Derivatives (Effective Portion)
|
Location of Gain or (Loss) Recognized in Income on Derivatives
|
Amount of Gain or (Loss) Reclassified from AOCL into Income (Effective Portion)
|
||||||
|
Foreign exchange contracts
|
$ | 217 |
Cost of products sold
|
$ | 38 | ||||
|
Derivatives Not Designated as Hedging Instruments
|
Location of (Gain) or Loss Recognized in Income on Derivatives
|
Amount of (Gain) or Loss Recognized in Income on Derivatives
|
||||
|
Foreign exchange contracts
|
Foreign currency exchange (gain) loss
|
$ | (209 | ) | ||
As of March 31, 2011, the Company had no derivatives designated as net investments or fair value hedges in accordance with ASC Topic 815, “Derivatives and Hedging.”
F-19
COLUMBUS McKINNNON CORPORATION
NOTES TO CONSOLIDATED FINANCIAL STATEMENTS – (Continued)
(tabular amounts in thousands, except share data)
The following is information relative to the Company’s derivative instruments in the consolidated balance sheet as of March 31, 2011 (in thousands):
|
Derivatives Designated as Hedging Instruments
|
Balance Sheet Location
|
Fair Value of Asset (Liability)
|
||||
|
Foreign exchange contracts
|
Other Assets
|
$ | 85 | |||
|
Foreign exchange contracts
|
Accrued Liabilities
|
$ | (439 | ) | ||
|
Derivatives Not Designated as Hedging Instruments
|
Balance Sheet Location
|
Fair Value of Asset (Liability)
|
||||
|
Foreign exchange contracts
|
Other Assets
|
$ | 3 | |||
|
Foreign exchange contracts
|
Accrued Liabilities
|
$ | (1,046 | ) | ||
11. Accrued Liabilities and Other Non-current Liabilities
Consolidated accrued liabilities of the Company consisted of the following:
|
|
March 31,
|
|||||||
|
|
2011
|
2010
|
||||||
|
Accrued payroll
|
$ | 17,966 | $ | 17,534 | ||||
|
Interest payable
|
2,600 | 4,902 | ||||||
|
Accrued workers compensation
|
1,719 | 2,301 | ||||||
|
Accrued income taxes payable
|
2,622 | 2,401 | ||||||
|
Accrued postretirement benefit obligation
|
1,021 | 1,169 | ||||||
|
Accrued health insurance
|
3,912 | 3,665 | ||||||
|
Accrued general and product liability costs
|
4,065 | 4,081 | ||||||
|
Customer advances and deposits
|
10,350 | 5,109 | ||||||
|
Other accrued liabilities
|
12,200 | 11,592 | ||||||
|
|
$ | 56,455 | $ | 52,754 | ||||
F-20
COLUMBUS McKINNNON CORPORATION
NOTES TO CONSOLIDATED FINANCIAL STATEMENTS – (Continued)
(tabular amounts in thousands, except share data)
Consolidated other non-current liabilities of the Company consisted of the following:
|
|
March 31,
|
|||||||
|
|
2011
|
2010
|
||||||
|
Accumulated postretirement benefit obligation
|
$ | 7,812 | $ | 7,909 | ||||
|
Accrued general and product liability costs
|
16,511 | 18,973 | ||||||
|
Accrued pension cost
|
31,467 | 36,179 | ||||||
|
Accrued workers compensation
|
1,717 | 1,764 | ||||||
|
Deferred income tax
|
4,702 | 5,644 | ||||||
|
Other non-current liabilities
|
6,436 | 1,944 | ||||||
|
|
$ | 68,645 | $ | 72,413 | ||||
12. Debt
Consolidated long-term debt of the Company consisted of the following:
|
|
March 31,
|
|||||||
|
|
2011
|
2010
|
||||||
|
Revolving Credit Facility due December 31, 2013
|
$ | - | $ | - | ||||
|
Capital lease obligations
|
6,037 | 6,974 | ||||||
|
Other senior debt
|
28 | 147 | ||||||
|
Total senior debt
|
6,065 | 7,121 | ||||||
|
8 7/8% Senior Subordinated Notes due November 1, 2013 with interest payable in semi-annual installments
|
- | 124,855 | ||||||
|
7 7/8% Senior Subordinated Notes due February 1, 2019 with interest payable in semi-annual installments (net of the unamortized discount of $2,133)
|
147,867 | - | ||||||
|
Total
|
$ | 153,932 | $ | 131,976 | ||||
|
Less current portion
|
1,116 | 1,155 | ||||||
|
|
$ | 152,816 | $ | 130,821 | ||||
The Revolving Credit Facility provides availability up to a maximum of $85,000,000 and has an initial term ending December 31, 2013.
F-21
COLUMBUS McKINNNON CORPORATION
NOTES TO CONSOLIDATED FINANCIAL STATEMENTS – (Continued)
(tabular amounts in thousands, except share data)
Provided there is no default, the Company may, on a one-time basis, request an increase in the availability of the Revolving Credit Facility by an amount not exceeding $65,000,000, subject to lender approval. The unused portion of the Revolving Credit Facility totalled $70,705,000, net of outstanding borrowings of $0 and outstanding letters of credit, issued under the credit facility, of $14,295,000, as of March 31, 2011. The outstanding letters of credit at March 31, 2011 consisted of $8,824,000 in documentary letters of credit (including a significant letter of credit related to a large customer order, amounting to $6,527,000 which will mature in April 2012) and $5,471,000 of standby letters of credit. Interest on the revolver is payable at varying Eurodollar rates based on LIBOR or prime plus a spread determined by the Company’s total leverage ratio amounting to 300 or 200 basis points, respectively, based on the Company’s leverage ratio at March 31, 2011. The Revolving Credit Facility is secured by all U.S. inventory, receivables, equipment, real property, subsidiary stock (limited to 65% of non-U.S. subsidiaries) and intellectual property.
The corresponding credit agreement associated with the Revolving Credit Facility places certain debt covenant restrictions on the Company, including certain financial requirements and restrictions on dividend payments, with which the Company was in compliance as of March 31, 2011. Key financial covenants include a minimum fixed charge coverage ratio of 1.25x, a maximum total leverage ratio, net of cash, of 3.75x for the quarter ending March 31, 2011 and 3.50x thereafter, and maximum annual capital expenditures of $18,000,000, excluding capital expenditures for a global ERP system.
The Company entered into a second amendment to its Revolving Credit Facility on December 16, 2010 to permit (i) the issuance of up to $175,000,000 of additional unsecured indebtedness upon repayment of the $124,855,000 Senior Subordinated 8 7/8% Notes which would have been due November 1, 2013; (ii) waive any requirement to apply the proceeds of such notes to reduce the revolving credit facility; (iii) adjust the maximum total leverage ratio to 4.00x and 3.75x for the quarters ending December 31, 2010 and March 31, 2011, respectively, and decrease to 3.50x for the quarter ending June 30, 2011 and thereafter; (iv) pre-approve a specific, potential acquisition and (v) pre-approve a specific, potential divestiture.
On February 8, 2011 the Company completed its cash tender offer and consent solicitation for $100,783,000 of its 8 7/8% Notes. The 8 7/8% Notes amounted to $124,855,000 prior to completion of the cash tender and were due November 1, 2013. The total consideration paid for each note validly tendered was $1,026 (including a $30 consent payment) per $1,000 principal amount of notes plus accrued and unpaid interest.
On February 28, 2011 the Company completed its call for redemption of all of the remaining $24,072,000 of its 8 7/8% Notes. The total consideration paid for each note validly tendered was $1,022.19 per $1,000 principal amount of notes plus accrued and unpaid interest.
Cash outlays related to the tender and call for redemption included $2,781,000 of accrued interest and $3,154,000 tender or redemption premium. In addition, the Company wrote off unamortized capitalized financing fees of $785,000 related to the 8 7/8% Notes. Expenses related to the tender or redemption premium and write off of unamortized capitalized financing fees were recorded in the quarter ended March 31, 2011 and are approximately $3,939,000. The Company funded the tender offer and consent payments, and related costs, with proceeds from the private placement of senior subordinated notes.
New Senior Subordinated 7 7/8% Notes (7 7/8% Notes) were issued on January 25, 2011 in the amount of $150,000,000. The offering price of the notes was 98.545% of par.
Provisions of the 7 7/8% Notes include, without limitation, restrictions on indebtedness, asset sales, and dividends and other restricted payments. Until February 1, 2014, the Company may redeem up to 35% of the outstanding 7 7/8% Notes at a redemption price of 107.875% with the proceeds of equity offerings, subject to certain restrictions. On or after February 1, 2015, the 7 7/8% Notes are redeemable at the option of the Company, in whole or in part, at a redemption price of 103.938%, reducing to 101.969% and 100% on February 1, 2016 and February 1, 2017, respectively and are due February 1, 2019. In the event of a Change of Control (as defined in the indenture for such notes), each holder of the 7 7/8% Notes may require the Company to repurchase all or a portion of such holder’s 7 7/8% Notes at a purchase price equal to 101% of the principal amount thereof. The 7 7/8% Notes are guaranteed by certain existing and future U.S. subsidiaries and are not subject to any sinking fund requirements. The Company has commenced its offer to exchange the Notes for a like principal of its new 7 7/8% Notes registered under the Securities Act of 1933. The offer to exchange will expire on June 2, 2011.
F-22
COLUMBUS McKINNNON CORPORATION
NOTES TO CONSOLIDATED FINANCIAL STATEMENTS – (Continued)
(tabular amounts in thousands, except share data)
The Company received net proceeds of approximately $147,844,000 on issuance of the 7 7/8% Notes after deduction of $2,156,000 of original issue discount. In addition, cash outlays related to the offering include $3,075,000 for offering costs which the Company recorded as capitalized financing fees. The deferred financing fees and original issue discount are being amortized to interest expense through the maturity date using the effective interest method in accordance with ASC Topic 835-30-35-2
The carrying amount of the Company’s revolving credit facility, notes payable to banks, and other senior debt approximate their fair values based on current market rates. The Company’s 7 7/8% Notes, which have a par value of $150,000,000 at March 31, 2011, have an approximate fair value of $154,875,000 based on quoted market prices.
On June 22, 2007, the Company recorded a capital lease resulting from the sale and partial leaseback of its facility in Charlotte, NC under a 10 year lease agreement. The Company also has capital leases on certain production machinery and equipment. The outstanding balance on the capital leases of $6,037,000 and $6,974,000 as of March 31, 2011 and 2010, respectively, is included in senior debt in the consolidated balance sheets.
The principal payments scheduled to be made as of March 31, 2011 on the above debt are as follows (in $ thousands):
|
2012
|
1,116 | |||
|
2013
|
1,252 | |||
|
2014
|
1,208 | |||
|
2015
|
852 | |||
|
2016
|
596 | |||
|
Thereafter
|
151,041 | |||
|
|
156,065 |
The Company’s Notes payable to banks consist primarily of draws against unsecured non-U.S. lines of credit. The Company’s other senior debt consists primarily of capital lease obligations as described above.
Non-U.S. Lines of Credit and Loans
Unsecured and uncommitted lines of credit are available to meet short-term working capital needs for certain of our subsidiaries operating outside of the U.S. The lines of credit are available on an offering basis, meaning that transactions under the line of credit will be on such terms and conditions, including interest rate, maturity, representations, covenants and events of default, as mutually agreed between our subsidiaries and the local bank at the time of each specific transaction. As of March 31, 2011, significant unsecured credit lines totaled approximately $10,154,000, of which $464,000 was drawn.
F-23
COLUMBUS McKINNNON CORPORATION
NOTES TO CONSOLIDATED FINANCIAL STATEMENTS – (Continued)
(tabular amounts in thousands, except share data)
13. Pensions and Other Benefit Plans
The Company provides retirement plans, including defined benefit and defined contribution plans, and postretirement benefit plans to certain employees. The Company applies ASC Topic 715 “Compensation – Retirement Benefits,” which required the recognition in pension and other postretirement benefits obligations and accumulated other comprehensive income of actuarial gains or losses, prior service costs or credits and transition assets or obligations that had previously been deferred. This statement also requires an entity to measure a defined benefit postretirement plan’s assets and obligations that determine its funded status as of the end of the fiscal year. The measurement date requirement was adopted in fiscal 2009, and was applied as a change in accounting principle, resulting in an $877,000, net of tax, cumulative-effect reduction to the opening balance of retained earnings.
Pension Plans
The Company provides defined benefit pension plans to certain employees. The Company uses March 31 as the measurement date. The following provides a reconciliation of benefit obligation, plan assets, and funded status of the plans:
|
March 31,
|
||||||||
|
2011
|
2010
|
|||||||
|
Change in benefit obligation:
|
|
|
||||||
|
Benefit obligation at beginning of year
|
$ | 168,918 | $ | 140,085 | ||||
|
Service cost
|
3,368 | 3,687 | ||||||
|
Interest cost
|
9,738 | 9,950 | ||||||
|
Actuarial loss
|
4,583 | 22,688 | ||||||
|
Benefits paid
|
(9,655 | ) | (8,168 | ) | ||||
|
Foreign exchange rate changes
|
808 | 676 | ||||||
|
Benefit obligation at end of year
|
$ | 177,760 | $ | 168,918 | ||||
|
Change in plan assets:
|
||||||||
|
Fair value of plan assets at beginning of year
|
$ | 132,136 | $ | 91,144 | ||||
|
Actual gain on plan assets
|
15,010 | 30,549 | ||||||
|
Employer contribution
|
7,796 | 18,026 | ||||||
|
Benefits paid
|
(9,655 | ) | (8,168 | ) | ||||
|
Foreign exchange rate changes
|
107 | 585 | ||||||
|
Fair value of plan assets at end of year
|
$ | 145,394 | $ | 132,136 | ||||
|
Funded status
|
$ | (32,366 | ) | $ | (36,782 | ) | ||
|
Unrecognized actuarial loss
|
43,620 | 47,739 | ||||||
|
Unrecognized prior service cost
|
1,018 | 1,251 | ||||||
|
Net amount recognized
|
$ | 12,272 | $ | 12,208 | ||||
|
Amounts recognized in the consolidated balance sheets are as follows:
|
||||||||
|
March 31,
|
||||||||
| 2011 | 2010 | |||||||
|
Accrued liabilities
|
$ | (899 | ) | $ | (603 | ) | ||
|
Other non-current liabilities
|
(31,467 | ) | (36,179 | ) | ||||
|
Deferred tax effect of accumulated other comprehensive loss
|
17,751 | 18,546 | ||||||
|
Accumulated other comprehensive loss
|
26,887 | 30,444 | ||||||
|
Net amount recognized
|
$ | 12,272 | $ | 12,208 | ||||
F-24
COLUMBUS McKINNNON CORPORATION
NOTES TO CONSOLIDATED FINANCIAL STATEMENTS – (Continued)
(tabular amounts in thousands, except share data)
In fiscal 2012, an estimated net loss of $2,793,000 and prior service cost of $229,000 for the defined benefit pension plans will be amortized from accumulated other comprehensive loss to net periodic benefit cost.
Net periodic pension cost included the following components:
|
2011
|
2010
|
2009
|
||||||||||
|
Service costs—benefits earned during the period
|
$ | 3,368 | $ | 3,687 | $ | 4,381 | ||||||
|
Interest cost on projected benefit obligation
|
9,738 | 9,950 | 8,969 | |||||||||
|
Expected return on plan assets
|
(9,865 | ) | (7,479 | ) | (9,234 | ) | ||||||
|
Net amortization
|
3,572 | 4,210 | 1,319 | |||||||||
|
Curtailment/settlement loss
|
23 | 2,417 | 457 | |||||||||
|
Net periodic pension cost
|
$ | 6,836 | $ | 12,785 | $ | 5,892 | ||||||
In fiscal 2010, the Company recorded a curtailment loss on the statement of operations within restructuring charges. Refer to Note 17 for further discussion.
Information for pension plans with a projected benefit obligation in excess of plan assets is as follows:
|
March 31,
|
||||||||
|
2011
|
2010
|
|||||||
|
Projected benefit obligation
|
$ | 177,760 | $ | 168,918 | ||||
|
Fair value of plan assets
|
145,047 | 132,136 | ||||||
Information for pension plans with an accumulated benefit obligation in excess of plan assets is as follows:
|
March 31,
|
||||||||
|
2011
|
2010
|
|||||||
|
Accumulated benefit obligation
|
$ | 172,830 | $ | 162,212 | ||||
|
Fair value of plan assets
|
145,047 | 132,136 | ||||||
Unrecognized gains and losses are amortized on a straight-line basis over the average remaining service period of active participants.
The weighted-average assumptions in the following table represent the rates used to develop the actuarial present value of the projected benefit obligation for the year listed and also net periodic pension cost for the following year:
|
|
2011
|
2010
|
2009
|
|||||||||
|
Discount rate
|
5.75 | % | 6.00 | % | 7.25 | % | ||||||
|
Expected long-term rate of return on plan assets
|
7.50 | 7.50 | 7.50 | |||||||||
|
Rate of compensation increase
|
2.00 | 2.00 | 2.00 | |||||||||
F-25
COLUMBUS McKINNNON CORPORATION
NOTES TO CONSOLIDATED FINANCIAL STATEMENTS – (Continued)
(tabular amounts in thousands, except share data)
The expected rates of return on plan asset assumptions are determined considering historical averages and real returns on each asset class.
The Company’s retirement plan target and actual asset allocations are as follows:
|
|
Target
|
Actual
|
||||||||||
|
|
2012
|
2011
|
2010
|
|||||||||
|
Equity securities
|
70 | % | 61 | % | 60 | % | ||||||
|
Fixed income
|
30 | 39 | 40 | |||||||||
|
Total plan assets
|
100 | % | 100 | % | 100 | % | ||||||
The Company has an investment objective for domestic pension plans to adequately provide for both the growth and liquidity needed to support all current and future benefit payment obligations. The investment strategy is to invest in a diversified portfolio of assets which are expected to satisfy the aforementioned objective and produce both absolute and risk adjusted returns competitive with a benchmark that is a blend of major US and international equity indexes and an aggregate bond fund. The shift to the targeted allocation is the result of management’s re-evaluation of its investment allocation. The targeted allocation will be accomplished as some plan assets governed by collective bargaining contracts will be transferred from fixed income into equity securities, as well as reallocation of remaining assets to achieve the desired balance during fiscal 2012.
The Company’s funding policy with respect to the defined benefit pension plans is to contribute annually at least the minimum amount required by the Employee Retirement Income Security Act of 1974 (ERISA). Additional contributions may be made to minimize PBGC premiums. The Company expects to contribute approximately $11,500,000 to its pension plans in fiscal 2012.
Information about the expected benefit payments for the Company’s defined benefit plans is as follows (in $ thousands):
|
2012
|
$ | 9,255 | ||
|
2013
|
9,633 | |||
|
2014
|
10,028 | |||
|
2015
|
10,439 | |||
|
2016
|
10,887 | |||
|
2017-2021
|
62,111 |
Postretirement Benefit Plans
The Company sponsors a defined benefit postretirement health care plan that provide medical and life insurance coverage to certain U.S. retirees and their dependents of one of its subsidiaries. Prior to the acquisition of this subsidiary, the Company did not sponsor any postretirement benefit plans. The Company pays the majority of the medical costs for certain retirees and their spouses who are under age 65. For retirees and dependents of retirees who retired prior to January 1, 1989, and are age 65 or over, the Company contributes 100% toward the American Association of Retired Persons (“AARP”) premium frozen at the 1992 level. For retirees and dependents of retirees who retired after January 1, 1989, the Company contributes $35 per month toward the AARP premium. The life insurance plan is noncontributory.
F-26
COLUMBUS McKINNNON CORPORATION
NOTES TO CONSOLIDATED FINANCIAL STATEMENTS – (Continued)
(tabular amounts in thousands, except share data)
The Company’s postretirement health benefit plans are not funded. The following sets forth a reconciliation of benefit obligation and the funded status of the plan:
|
March 31,
|
||||||||
|
2011
|
2010
|
|||||||
|
Change in benefit obligation:
|
|
|
||||||
|
Benefit obligation at beginning of year
|
$ | 9,078 | $ | 8,520 | ||||
|
Interest cost
|
476 | 586 | ||||||
|
Actuarial (gain) loss
|
(93 | ) | 738 | |||||
|
Benefits paid
|
(628 | ) | (766 | ) | ||||
|
Benefit obligation at end of year
|
$ | 8,833 | $ | 9,078 | ||||
|
Funded status
|
$ | (8,833 | ) | $ | (9,078 | ) | ||
|
Unrecognized actuarial loss
|
3,768 | 4,161 | ||||||
|
Net amount recognized
|
$ | (5,065 | ) | $ | (4,917 | ) | ||
Amounts recognized in the consolidated balance sheets are as follows:
|
|
March 31,
|
|||||||
|
|
2011
|
2010
|
||||||
|
Accrued liabilities
|
$ | (1,021 | ) | $ | (1,169 | ) | ||
|
Other non-current liabilities
|
(7,812 | ) | (7,909 | ) | ||||
|
Deferred tax effect of accumulated other comprehensive loss
|
1,507 | 1,664 | ||||||
|
Accumulated other comprehensive loss
|
2,261 | 2,497 | ||||||
|
Net amount recognized
|
(5,065 | ) | (4,917 | ) | ||||
In fiscal 2012, an estimated net loss of $326,000 for the defined benefit postretirement health care plans will be amortized from accumulated other comprehensive loss to net periodic benefit cost. In fiscal 2011, net periodic postretirement benefit cost included the following:
|
|
Year Ended March 31,
|
|||||||||||
|
|
2011
|
2010
|
2009
|
|||||||||
|
Service cost—benefits attributed to service during the period
|
$ | - | $ | - | $ | 1 | ||||||
|
Interest cost
|
476 | 586 | 587 | |||||||||
|
Net amortization
|
301 | 313 | 351 | |||||||||
|
Net periodic postretirement benefit cost
|
$ | 777 | $ | 899 | $ | 939 | ||||||
For measurement purposes, healthcare costs are assumed to increase 8.50% in fiscal 2012, grading down over time to 5.0% in six years. The discount rate used in determining the accumulated postretirement benefit obligation was 5.75% and 6.0% as of March 31, 2011 and 2010, respectively.
F-27
COLUMBUS McKINNNON CORPORATION
NOTES TO CONSOLIDATED FINANCIAL STATEMENTS – (Continued)
(tabular amounts in thousands, except share data)
Information about the expected benefit payments for the Company’s postretirement health benefit plans is as follows:
|
2012
|
$ | 1,021 | ||
|
2013
|
1,031 | |||
|
2014
|
986 | |||
|
2015
|
914 | |||
|
2016
|
860 | |||
|
2017-2021
|
3,482 |
Assumed medical claims cost trend rates have an effect on the amounts reported for the health care plans. A one-percentage point change in assumed health care cost trend rates would have the following effects
|
|
One Percentage
Point Increase |
One Percentage
Point Decrease |
||||||
|
Effect on total of service and interest cost components
|
$ | 25 | $ | (23 | ) | |||
|
Effect on postretirement obligation
|
495 | (446 | ) | |||||
The Company has collateralized split-dollar life insurance arrangements with two of its former officers. Under these arrangements, the Company pays certain premium costs on life insurance policies for the former officers. Upon the later of the death of the former officer or their spouse, the Company will receive all of the premiums paid to-date. On April 1, 2008, the Company adopted the guidance issued under ASC Topic 715 “Compensation – Retirement Benefits” relating to collateral split-dollar life insurance arrangements. In accordance with that guidance, an employer should recognize a liability for the postretirement benefit related to a collateral split-dollar life insurance arrangement. The provisions of this guidance were applied as a change in accounting principle through a $1,248,000 cumulative-effect adjustment to the opening balance of retained earnings recorded on April 1, 2008, the date of adoption. The net periodic pension cost for fiscal 2011 was $51,000 and the liability at March 31, 2011 is $3,510,000 and is included in other non-current liabilities in the consolidated balance sheet. The cash surrender value of the policies is $2,027,000 at March 31, 2011 and is included in other assets in the consolidated balance sheet.
Other Benefit Plans
The Company also sponsors defined contribution plans covering substantially all domestic employees. Participants may elect to contribute basic contributions. These plans provide for employer contributions based primarily on employee participation. The Company recorded a charge for such contributions of approximately $389,000, $340,000, and $1,684,000 for the years ended March 31, 2011, 2010 and 2009, respectively. Due to the significant economic downturn, the Company significantly reduced its contribution to the defined contribution plans in fiscal 2010 and 2011.
Fair Values of Plan Assets
The Company classified its investments within the categories of equity securities, fixed income securities, and cash equivalents, as the Company’s management bases its investment objectives and decisions from these three categories. The Company’s investment policy as it relates to its pension assets is to invest in broad-based mutual funds, with an investment objective of being diversified. Further the Company’s investment objective of its equity securities is long-term growth, its objective of the fixed income securities is long-term growth, consistency of income and preservation of capital, and its objective of cash equivalents is preservation of capital. It is the Company’s position that its investment policy and investment objectives as defined above reduce the risk of concentrations within its investments.
F-28
COLUMBUS McKINNNON CORPORATION
NOTES TO CONSOLIDATED FINANCIAL STATEMENTS – (Continued)
(tabular amounts in thousands, except share data)
The fair values of the Company’s defined benefit plans’ consolidated assets by asset category as of March 31 were as follows:
|
|
March 31,
|
|||||||
|
|
2011
|
2010
|
||||||
|
Asset categories:
|
|
|
||||||
|
Equity securities
|
$ | 88,556 | $ | 80,430 | ||||
|
Fixed income securities
|
55,690 | 50,875 | ||||||
|
Cash equivalents
|
1,148 | 831 | ||||||
|
Total
|
$ | 145,394 | $ | 132,136 | ||||
The Company’s investment policy as it relates to its pension assets is to invest in broad-based mutual funds, with an investment objective of being diversified. Further the Company’s investment objective of its equity securities is long-term growth, its objective of the fixed income securities is long-term growth, consistency of income and preservation of capital, and its objective of cash equivalents is preservation of capital. It is the Company’s position that its investment policy and investment objectives as defined above reduce the risk of concentrations within its investments. The fair values of our defined benefit plans’ consolidated assets were determined using the fair value hierarchy of inputs described in Note 5. The fair values by category of inputs as of March 31, 2011 were as follows:
|
|
Quoted Prices in Active Markets for Identical Assets
|
Significant Unobservable Inputs
|
|
|||||||||
|
|
(Level 1)
|
(Level 3)
|
Total
|
|||||||||
|
Asset categories:
|
|
|
|
|||||||||
|
Equity securities
|
$ | 88,556 | $ | - | $ | 88,556 | ||||||
|
Fixed income securities
|
39,818 | 15,872 | 55,690 | |||||||||
|
Cash equivalents
|
1,148 | - | 1,148 | |||||||||
|
Total
|
$ | 129,522 | $ | 15,872 | $ | 145,394 | ||||||
Level 1 fixed income securities consist of fixed income mutual funds with quoted market prices.
Fair value of Level 3 fixed income securities at the beginning of the year was $15,663,000. During fiscal 2011 fixed income securities earned investment return of $733,000 and had disbursements of $524,000 resulting in an ending balance of $15,872,000. These fixed income securities consist primarily of insurance contracts which are carried at their liquidation value based on actuarial calculations and the terms of the contracts.
In April 2011 the Company completed negotiations with one of its labor unions which resulted in an amendment to one of its pension plans. The Company has estimated that the curtailment charge resulting from this amendment, which will be recorded in fiscal 2012, will be $1,172,000.
In fiscal 2012, the Company intends to provide to the Pension Benefit Guaranty Corporation an irrevocable standby letter of credit in the amount of $3,866,000 related to the unfunded portion of a pension plan for employees at one of the Company’s recently closed manufacturing facilities. The irrevocable standby letter of credit is expected to be issued in June 2011.
14. Employee Stock Ownership Plan (ESOP)
The guidance in ASC Topic 718 "Compensation - Stock Compensation" and covered in sub-topic 718-40 "Employee Stock Ownership Plans" requires that compensation expense for ESOP shares be measured based on the fair value of those shares when committed to be released to employees, rather than based on their original cost. Also, dividends on those ESOP shares that have not been allocated or committed to be released to ESOP participants are not reflected as a reduction of retained earnings. Rather, since those dividends are used for debt service, a charge to compensation expense is recorded. Furthermore, ESOP shares that have not been allocated or committed to be released are not considered outstanding for purposes of calculating earnings per share.
F-29
COLUMBUS McKINNNON CORPORATION
NOTES TO CONSOLIDATED FINANCIAL STATEMENTS – (Continued)
(tabular amounts in thousands, except share data)
The obligation of the ESOP to repay borrowings incurred to purchase shares of the Company’s common stock is guaranteed by the Company; the unpaid balance of such borrowings, if any, would be reflected in the consolidated balance sheet as a liability. An amount equivalent to the cost of the collateralized common stock and representing deferred employee benefits has been recorded as a deduction from shareholders’ equity.
Substantially all of the Company’s U.S. non-union employees are participants in the ESOP. Contributions to the plan result from the release of collateralized shares as debt service payments are made. Compensation expense amounting to $466,000, $408,000, and $632,000 in fiscal 2011, 2010 and 2009, respectively, is recorded based on the guaranteed release of the ESOP shares at their fair market value. Dividends on allocated ESOP shares, if any, are recorded as a reduction of retained earnings and are applied toward debt service.
At March 31, 2011 and 2010, 512,903 and 623,137 of ESOP shares, respectively, were allocated or available to be allocated to participants’ accounts. At March 31, 2011 and 2010, 88,097 and 115,766 of ESOP shares were pledged as collateral to guarantee the ESOP term loans.
The fair market value of unearned ESOP shares at March 31, 2011 amounted to $1,626,000.
15. Earnings per Share and Stock Plans
Earnings per Share
The Company calculates earnings per share in accordance with ASC Topic 260, “Earnings per Share.” Basic earnings per share exclude any dilutive effects of options, warrants, and convertible securities. Diluted earnings per share include any dilutive effects of stock options, unvested restricted stock units, unvested performance shares, and unvested restricted stock. Stock options and performance shares with respect to 224,000 common shares and 25,000 common shares, respectively, were not included in the computation of diluted loss per share for fiscal 2011 because they were antidilutive as a result of the Company’s net loss. Stock options and performance shares with respect to 178,000 common shares and 15,000 common shares, respectively, were not included in the computation of diluted loss per share for fiscal 2010 because they were antidilutive as a result of the Company’s net loss. Stock options and performance shares with respect to 236,000 common shares and 28,000 common shares, respectively, were not included in the computation of diluted loss per share for fiscal 2009 because they were antidilutive as a result of the Company’s net loss.
The following table sets forth the computation of basic and diluted earnings per share:
|
Year Ended March 31,
|
||||||||||||
|
Numerator for basic and diluted earnings per share:
|
2011
|
2010
|
2009
|
|||||||||
|
Loss from continuing operations
|
$
|
(36,346
|
)
|
$
|
(7,544
|
)
|
$
|
(76,102
|
)
|
|||
|
Income (loss) from discontinued operations (net of tax)
|
396
|
531
|
(2,282
|
)
|
||||||||
|
Net loss
|
$
|
(35,950
|
)
|
$
|
(7,013
|
)
|
$
|
(78,384
|
)
|
|||
|
Denominators:
|
||||||||||||
|
Weighted-average common stock outstanding—denominator for basic EPS
|
19,047 | 18,863 | 18,861 | |||||||||
|
Effect of dilutive employee stock options
|
-
|
-
|
-
|
|||||||||
|
Adjusted weighted-average common stock outstanding and assumed conversions—denominator for diluted EPS
|
19,047
|
18,963
|
18,861
|
|||||||||
The weighted-average common stock outstanding shown above is net of unallocated ESOP shares (see Note 14).
F-30
COLUMBUS McKINNNON CORPORATION
NOTES TO CONSOLIDATED FINANCIAL STATEMENTS – (Continued)
(tabular amounts in thousands, except share data)
Stock Plans
The Company records stock-based compensation in accordance with ASC Topic 718, “Compensation – Retirement Benefits,” applying the modified prospective method. This Statement requires all equity-based payments to employees, including grants of employee stock options, to be recognized in the statement of earnings based on the grant date fair value of the award. Under the modified prospective method, the Company is required to record equity-based compensation expense for all awards granted after the date of adoption and for the unvested portion of previously granted awards outstanding as of the date of adoption.
Prior to the adoptions of the 2010 Long Term Incentive Plan, the Company maintained several different stock plans, specifically: 1995 Incentive Stock Option Plan, Non-Qualified Stock Option Plan, Restricted Stock Plan and 2006 Long Term Incentive Plan, collectively referred to as the “Prior Stock Plans”. The specifics of each of these plans are discussed below.
Stock based compensation expense was $2,034,000, $1,544,000, and $799,000 for fiscal 2011, 2010 and 2009, respectively. Stock compensation expense is included in cost of goods sold, selling, and general and administrative expense. The Company recognizes expense for all share–based awards over the service period, which is the shorter of the period until the employees’ retirement eligibility dates or the service period for the award for awards expected to vest. Accordingly, expense is generally reduced for estimated forfeitures. ASC Topic 718 requires forfeitures to be estimated at the time of grant and revised if necessary, in subsequent periods if actual forfeitures differ from those estimates.
The Company recognized compensation expense for stock option awards and unvested restricted share awards that vest based on time or market parameters straight-line over the requisite service period for vesting of the award.
Long Term Incentive Plan
On July 26, 2010, the shareholders of the Company approved the 2010 Long Term Incentive Plan (“LTIP”). The Company grants share based compensation to eligible participants under the LTIP. The total number of shares of common stock with respect to which awards may be granted under the plan is 1,250,000 including shares not previously authorized for issuance under any of the Prior Stock Plans and any shares not issued or subject to outstanding awards under the Prior Stock Plans. As of March 31, 2011, 1,248,609 shares remain for future grants. The LTIP was designed as an omnibus plan and awards may consist of non-qualified stock options, incentive stock options, stock appreciation rights, restricted stock, restricted stock units, or stock bonuses.
Under the plan, the granting of awards to employees may take the form of options, restricted shares, and performance shares. The Compensation Committee of our Board of Directors determines the number of shares, the term, the frequency and date, the type, the exercise periods, any performance criteria pursuant to which awards may be granted and the restriction and other terms and conditions of each grant in accordance with terms of our Plan.
Stock Option Plans
The Company granted stock options under the LTIP in 2011. Options granted have a maximum term of 10 years and vest ratably over a five or six year period from date of grant. Option awards provide for accelerated vesting as a result of reaching retirement age and a specified number of years of service. Existing prior to the adoption of the LTIP, the Company maintained two stock option plans, a Non-Qualified Stock Option Plan (Non-Qualified Plan) and an Incentive Stock Option Plan (Incentive Plan). Under the Non-Qualified Plan, options may be granted to officers and other key employees of the Company as well as to non-employee directors and advisors. As of March 31, 2011, no options have been granted to non-employees. Options granted under the Non-Qualified and Incentive Plans generally become exercisable over a four-year period at the rate of 25% per year commencing one year from the date of grant at an exercise price of not less than 100% of the fair market value of the common stock on the date of grant. Any option granted under the Non-Qualified plan may be exercised not earlier than one year from the date such option is granted. Any option granted under the Incentive Plan may be exercised not earlier than one year and not later than 10 years from the date such option is granted.
F-31
COLUMBUS McKINNNON CORPORATION
NOTES TO CONSOLIDATED FINANCIAL STATEMENTS – (Continued)
(tabular amounts in thousands, except share data)
A summary of option transactions during each of the three fiscal years in the period ended March 31, 2011 is as follows:
|
Shares
|
Weighted-average Exercise Price
|
Weighted-average Remaining Contractual Life (in years)
|
Aggregate Intrinsic Value
|
|||||||||||||
|
Outstanding at April 1, 2008
|
786,850 | $ | 12.91 |
|
|
|||||||||||
|
Granted
|
89,150 | 27.42 |
|
|||||||||||||
|
Exercised
|
(46,375 | ) | 9.07 | |||||||||||||
|
Cancelled
|
(103,970 | ) | $ | 22.69 | ||||||||||||
|
Outstanding at March 31, 2009
|
725,655 | 13.51 | ||||||||||||||
|
Granted
|
160,700 | 13.73 | ||||||||||||||
|
Exercised
|
(45,500 | ) | 6.40 | |||||||||||||
|
Cancelled
|
(194,596 | ) | $ | 21.11 | ||||||||||||
|
Outstanding at March 31, 2010
|
646,259 | 12.02 | ||||||||||||||
|
Granted
|
102,772 | 18.28 | ||||||||||||||
|
Exercised
|
(6,625 | ) | 8.52 | |||||||||||||
|
Cancelled
|
(22,323 | ) | 16.51 | |||||||||||||
|
Outstanding at March 31, 2011
|
720,083 | $ | 12.81 | 4.9 | $ | 4,598 | ||||||||||
|
Exercisable at March 31, 2011
|
481,495 | $ | 10.91 | 3.0 | $ | 4,026 | ||||||||||
The Company calculated intrinsic value for those options that had an exercise price lower than the market price of our common shares as of March 31, 2011. The aggregate intrinsic value of outstanding options as of March 31, 2011 is calculated as the difference between the exercise price of the underlying options and the market price of our common shares for the 521,018 options that were in-the-money at that date. The aggregate intrinsic value of exercisable options as of March 31, 2011 is calculated as the difference between the exercise price of the underlying options and the market price of our common shares for the 384,873 exercisable options that were in-the-money at that date. The Company's closing stock price was $18.46 as of March 31, 2011. The total intrinsic value of stock options exercised was $39,610, $324,000, and $773,000 during fiscal 2011, 2010 and 2009, respectively. As of March 31, 2011, there are 0 options available for future grants under the two stock option plans.
The fair value of shares that vested was $9.33, $12.32, and $4.20 during fiscal 2011, 2010 and 2009, respectively.
Cash received from option exercises under all share-based payment arrangements during fiscal 2011 was approximately $56,432. Proceeds from the exercise of stock options under stock option plans are credited to common stock at par value and the excess is credited to additional paid-in capital.
F-32
COLUMBUS McKINNNON CORPORATION
NOTES TO CONSOLIDATED FINANCIAL STATEMENTS – (Continued)
(tabular amounts in thousands, except share data)
As of March 31, 2011, $1,105,000 of unrecognized compensation cost related to non-vested stock options is expected to be recognized over a weighted-average period of approximately 3 years.
Exercise prices for options outstanding as of March 31, 2011, ranged from $5.46 to $28.45. The following table provides certain information with respect to stock options outstanding at March 31, 2011:
|
Range of Exercise Prices
|
Stock Options Outstanding
|
Weighted-average Exercise Price
|
Weighted-average Remaining Contractual Life
|
|||||||||
| 346,725 | $ | 7.46 | 1.9 | |||||||||
| Up to $10.00 | 260,125 | 15.46 | 8.3 | |||||||||
| $10.01 to $20.00 | 113,233 | 23.12 | 6.2 | |||||||||
|
$20.01 to $30.00
|
720,083 | $ | 12.81 | 4.9 | ||||||||
The following table provides certain information with respect to stock options exercisable at March 31, 2011:
|
Range of Exercise Prices
|
Stock Options Outstanding
|
Weighted-average Exercise Price
|
||||||
| 346,725 | $ | 7.46 | ||||||
| Up to $10.00 | 38,148 | 12.94 | ||||||
| $10.01 to $20.00 | 96,622 | 22.48 | ||||||
|
$20.01 to $30.00
|
481,495 | $ | 10.91 | |||||
F-33
COLUMBUS McKINNNON CORPORATION
NOTES TO CONSOLIDATED FINANCIAL STATEMENTS – (Continued)
(tabular amounts in thousands, except share data)
The fair value of stock options granted was estimated on the date of grant using a Black-Scholes option pricing model. The Black-Scholes option valuation model was developed for use in estimating the fair value of traded options which have no vesting restrictions and are fully transferable. In addition, option valuation models require the input of highly subjective assumptions including the expected stock price volatility. Because the Company’s employee stock options have characteristics significantly different from those of traded options, and because changes in the subjective input assumptions can materially affect the fair value estimate, in management’s opinion, the existing models do not necessarily provide a reliable single measure of the fair value of its employee stock options. The weighted-average fair value of the options was $9.29, $8.18, and $14.77 for options granted during fiscal 2011, 2010 and 2009, respectively. The following table provides the weighted-average assumptions used to value stock options granted during fiscal 2011, 2010 and 2009:
|
|
Year Ended March 31, 2011
|
Year Ended March 31, 2010
|
Year Ended March 31, 2009
|
|||||||||
|
Assumptions:
|
|
|
|
|||||||||
|
Risk-free interest rate
|
1.33 | % | 1.97 | % | 2.58 | % | ||||||
|
Dividend yield—Incentive Plan
|
0.0 | % | 0.0 | % | 0.0 | % | ||||||
|
Volatility factor
|
0.587 | 0.591 | 0.567 | |||||||||
|
Expected life—Incentive Plan
|
5.5 years
|
5.5 years
|
6.0 years
|
|||||||||
To determine expected volatility, the Company uses historical volatility based on daily closing prices of its Common Stock over periods that correlate with the expected terms of the options granted. The risk-free rate is based on the United States Treasury yield curve at the time of grant for the appropriate term of the options granted. Expected dividends are based on the Company's history and expectation of dividend payouts. The expected term of stock options is based on vesting schedules, expected exercise patterns and contractual terms.
Restricted Stock Units
The Company granted restricted stock units under the LTIP during fiscal 2011, 2010 and 2009 to employees as well as to the Company’s non-executive directors as part of their annual compensation. Restricted shares for employees vest ratably based on service one-third after each of years three, four, and five.
F-34
COLUMBUS McKINNNON CORPORATION
NOTES TO CONSOLIDATED FINANCIAL STATEMENTS – (Continued)
(tabular amounts in thousands, except share data)
A summary of the restricted stock unit awards granted under the Company’s LTIP plan as of March 31, 2011 is as follows:
| Shares |
Weighted-average Grant Date Fair Value
|
|||||||
|
Unvested at April 1, 2008
|
10,521 | $ | 23.96 | |||||
|
Granted
|
54,916 | 26.02 | ||||||
|
Vested
|
(5,260 | ) | 23.96 | |||||
|
Forfeited
|
(25,199 | ) | 28.45 | |||||
|
Unvested at March 31, 2009
|
34,978 | 23.95 | ||||||
|
Granted
|
78,647 | 13.30 | ||||||
|
Vested
|
(8,600 | ) | 22.40 | |||||
|
Forfeited
|
(5,434 | ) | 14.55 | |||||
|
Unvested at March 31, 2010
|
99,591 | 16.21 | ||||||
|
Granted
|
95,947 | 17.87 | ||||||
|
Vested
|
(25,318 | ) | 15.01 | |||||
|
Forfeited
|
(12,671 | ) | 18.30 | |||||
|
Unvested at March 31, 2011
|
157,549 | $ | 17.25 | |||||
Total unrecognized compensation cost related to unvested restricted stock units as of March 31, 2011 is $1,498,000 and is expected to be recognized over a weighted average period of 3 years. The fair value of restricted stock units that vested during the year ended March 31, 2011 and 2010 was $379,976 and $122,000, respectively.
Performance Shares
The Company granted performance shares under the LTIP during fiscal 2011, 2010, and 2009. Performance shares granted are based upon the Company’s performance over a three year period depending on the Company’s total shareholder return relative to a group of peer companies. Performance based nonvested shares are recognized as compensation expense based on fair value on date of grant, the number of shares ultimately expected to vest and the vesting period. For accounting purposes, the performance shares are considered to have a market condition. The effect of the market condition is reflected in the grant date fair value of the award and, thus compensation expense is recognized on this type of award provided that the requisite service is rendered (regardless of whether the market condition is achieved). The Company estimated the fair value of each performance share granted under the LTIP on the date of grant using a Monte Carlo simulation that uses the assumptions noted in the following table. Expected volatility is based upon the daily historical volatilities of Columbus McKinnon’s stock and our peer group. The risk free rate was based on zero coupon government bonds at the time of grant. The expected term represents the period from the grant date to the end of the three year performance period.
F-35
COLUMBUS McKINNNON CORPORATION
NOTES TO CONSOLIDATED FINANCIAL STATEMENTS – (Continued)
(tabular amounts in thousands, except share data)
|
|
Year Ended March 31, 2011
|
Year Ended March 31, 2010
|
Year Ended March 31, 2009
|
|||||||||
|
Assumptions:
|
|
|
|
|||||||||
|
Risk-free interest rate
|
1.29 | % | 1.21 | % | 2.50 | % | ||||||
|
Dividend yield
|
0.0 | % | 0.0 | % | 0.0 | % | ||||||
|
Volatility factor
|
0.635 | 0.641 | 0.479 | |||||||||
|
Expected life
|
2.87 years
|
2.87 years
|
2.87 years
|
|||||||||
A summary of the performance shares transactions during each of the three fiscal years in the period ended March 31, 2011 is as follows:
| Shares |
Weighted-average
Grant Date Fair Value |
|||||||
|
Unvested at April 1, 2008
|
34,457 | $ | 19.40 | |||||
|
Granted
|
20,669 | 28.07 | ||||||
|
Forfeited
|
(10,047 | ) | 22.60 | |||||
|
Unvested at March 31, 2009
|
45,079 | 22.66 | ||||||
|
Granted
|
64,614 | 17.12 | ||||||
|
Forfeited
|
(20,059 | ) | 19.40 | |||||
|
Vested
|
(8,062 | ) | 19.40 | |||||
|
Unvested at March 31, 2010
|
81,572 | 19.40 | ||||||
|
Granted
|
46,057 | 21.93 | ||||||
|
Forfeited
|
(21,014 | ) | 25.93 | |||||
|
Unvested at March 31, 2011
|
106,615 | $ | 19.20 | |||||
Total unrecognized compensation costs related to the unvested performance share awards as of March 31, 2011 was $1,042,000 and is expected be recognized over a weighted average period of 1.5 years. The fair value of performance shares that vested during the year ended March 31, 2011 and 2010 was $0 and $127,000, respectively.
Restricted Stock
The Company also maintains a Restricted Stock Plan. The Company charges compensation expense and shareholders’ equity for the market value of shares ratably over the restricted period. Grantees that remain continuously employed with the Company become vested in their shares five years after the date of the grant. As of March 31, 2011, there were no shares available for future grants under the Restricted Stock Plan.
No restricted stock was granted in fiscal 2010 or fiscal 2011. As of March 31, 2011, there are 1,000 shares of restricted stock outstanding with a weighted average fair value grant price of $30.72.
Directors Stock
During fiscal 2011, 2010 and 2009, a total of 17,664, 21,536, and 12,436 shares of stock, respectively, were granted under the LTIP to the Company’s non-executive directors as part of their annual compensation. The weighted average fair value grant price of those shares was $15.85, $13.00, and $20.96 for fiscal 2011, 2010 and 2009, respectively. The expense related to the shares for fiscal 2011, 2010 and 2009 was $450,000, $280,000, and $260,000, respectively.
F-36
COLUMBUS McKINNNON CORPORATION
NOTES TO CONSOLIDATED FINANCIAL STATEMENTS – (Continued)
(tabular amounts in thousands, except share data)
Shareholder Rights Plan
On May 19, 2009 the Company announced that its Board of Directors had adopted a Shareholder Rights Plan, pursuant to which a dividend distribution was declared of one preferred share purchase right to each outstanding common share of the Company. Subject to limited exceptions, the rights will be exercisable if a person or group acquires 20% or more of the Company’s common shares or announces a tender offer for 20% or more of the common shares. Under certain circumstances, each right will entitle shareholders to buy one one-thousandth of a share of the newly created series A junior participating preferred shares of the Company at an exercise price of $80.00 per share.
16. Loss Contingencies
From time to time, the Company is named a defendant in legal actions arising out of the normal course of business. The Company is not a party to any pending legal proceeding other than ordinary, routine litigation incidental to our business. The Company does not believe that any of our pending litigation will have a material impact on its business.
Accrued general and product liability costs are the actuarially estimated reserves based on amounts determined from loss reports, individual cases filed with the Company, and an amount for losses incurred but not reported. Future cash payments related to reserves for nonasbestos claims are not discounted due to their underlying uncertainty. Reserves for certain asbestos related claims are discounted using a risk free interest rate which ranged from 0.30% to 4.51% as of March 31, 2011. The aggregate amount of undiscounted reserves and discounted amounts were $21,831,000 and $1,255,000, respectively, as of March 31, 2011. The aggregate amount of undiscounted reserves and discounted amounts were $24,535,000 and $1,481,000, respectively, as of March 31, 2010. Payments over each of the next five years for the portion of asbestos reserves that the Company discounts are expected to be $200,000 per year and $3,400,000 thereafter. The liability for accrued general and product liability costs are funded by investments in marketable securities (see Notes 2 and 7).
The following table provides a reconciliation of the beginning and ending balances for accrued general and product liability:
|
|
Year Ended March 31,
|
|||||||||||
|
|
2011
|
2010
|
2009
|
|||||||||
|
Accrued general and product liability, beginning of year
|
$ | 23,054 | $ | 23,242 | $ | 20,771 | ||||||
|
Add provision for claims
|
6,447 | 5,061 | 4,052 | |||||||||
|
Deduct payments for claims
|
(8,925 | ) | (5,249 | ) | (1,581 | ) | ||||||
|
Accrued general and product liability, end of year
|
$ | 20,576 | $ | 23,054 | $ | 23,242 | ||||||
The per occurrence limits on our self-insurance for general and product liability coverage to Columbus McKinnon were $2,000,000 from inception through fiscal 2003 and $3,000,000 for fiscal 2004 and thereafter. In addition to the per occurrence limits, the Company’s coverage is also subject to an annual aggregate limit, applicable to losses only. These limits range from $2,000,000 to $6,000,000 for each policy year from inception through fiscal 2011.
Along with other manufacturing companies, the Company is subject to various federal, state and local laws relating to the protection of the environment. To address the requirements of such laws, the Company has adopted a corporate environmental protection policy which provides that all of its owned or leased facilities shall, and all of its employees have the duty to, comply with all applicable environmental regulatory standards, and the Company has initiated an environmental auditing program for our facilities to ensure compliance with such regulatory standards. The Company has also established managerial responsibilities and internal communication channels for dealing with environmental compliance issues that may arise in the course of our business. Because of the complexity and changing nature of environmental regulatory standards, it is possible that situations will arise from time to time requiring the Company to incur expenditures in order to ensure environmental regulatory compliance. However, the Company is not aware of any environmental condition or any operation at any of its facilities, either individually or in the aggregate, which would cause expenditures having a material adverse effect on its results of operations, financial condition or cash flows and, accordingly, has not budgeted any material capital expenditures for environmental compliance for fiscal 2012.
F-37
COLUMBUS McKINNNON CORPORATION
NOTES TO CONSOLIDATED FINANCIAL STATEMENTS – (Continued)
(tabular amounts in thousands, except share data)
Like many industrial manufacturers, the Company is involved in asbestos-related litigation. In continually evaluating costs relating to its estimated asbestos-related liability, the Company reviews, among other things, the incidence of past and recent claims, the historical case dismissal rate, the mix of the claimed illnesses and occupations of the plaintiffs, its recent and historical resolution of the cases, the number of cases pending against it, the status and results of broad-based settlement discussions, and the number of years such activity might continue. Based on this review, the Company has estimated its share of liability to defend and resolve probable asbestos-related personal injury claims. This estimate is highly uncertain due to the limitations of the available data and the difficulty of forecasting with any certainty the numerous variables that can affect the range of the liability. The Company will continue to study the variables in light of additional information in order to identify trends that may become evident and to assess their impact on the range of liability that is probable and estimable.
Based on actuarial information, the Company has estimated its asbestos-related aggregate liability, including related legal costs, to range between $7,000,000 and $17,000,000, using actuarial parameters of continued claims for a period of 18 to 30 years from March 31, 2011. The Company's estimation of its discounted asbestos-related aggregate liability that is probable and estimable, in accordance with U.S. generally accepted accounting principles approximates $11,000,000 which has been reflected as a liability in the consolidated financial statements as of March 31, 2011. The recorded liability does not consider the impact of any potential favorable federal legislation. This liability may fluctuate based on the uncertainty in the number of future claims that will be filed and the cost to resolve those claims, which may be influenced by a number of factors, including the outcome of the ongoing broad-based settlement negotiations, defensive strategies, and the cost to resolve claims outside the broad-based settlement program. Of this amount, management expects to incur asbestos liability payments of approximately $500,000 over the next 12 months. Because payment of the liability is likely to extend over many years, management believes that the potential additional costs for claims will not have a material after-tax effect on the financial condition of the Company or its liquidity, although the net after-tax effect of any future liabilities recorded could be material to earnings in a future period.
F-38
COLUMBUS McKINNNON CORPORATION
NOTES TO CONSOLIDATED FINANCIAL STATEMENTS – (Continued)
(tabular amounts in thousands, except share data)
17. Restructuring Charges
Beginning in fiscal 2010, as part of the business reorganization plan, the Company initiated strategic consolidation of its North American hoist and rigging operations. The process included the closure of two manufacturing facilities and the significant downsizing of a third facility. The closures and downsizing resulted in a reduction of approximately 500,000 square feet of manufacturing space and the generation of annual savings estimated at approximately $15,000,000. Restructuring charges recorded in the year ended March 31, 2011 relate to the continuation of the consolidation of the North American hoist and rigging operations. Charges recorded in the year ended March 31, 2011 included a write off of production supplies in the amount of $411,000 and other facility related costs of $2,208,000, offset by a gain in the sale of a closed facility in the amount of $419,000.
Also, in fiscal 2010, the Company consolidated its North American sales force and offered certain of its employees an incentive to voluntarily retire early. Charges related to the early retirement program were approximately $5,732,000 and consist of two benefits: a paid leave of absence and an enhanced pension benefit. The payments for the paid leave of absence are being made to the employees in installments on their regular pay dates. Charges for the enhanced pension benefit of $2,012,000 are recorded in long-term pension liabilities. Long-term pension liabilities are included in other non-current liabilities on the condensed consolidated balance sheets.
Restructuring reserves as of March 31, 2011 and March 31, 2010 consisted primarily of accrued severance costs and were $47,000 and $2,755,000, respectively.
The following provides a reconciliation of the activity related to restructuring reserves (in thousands):
|
|
Employee
|
Facility
|
Total
|
|||||||||
|
Reserve at April 1, 2008
|
$ | - | $ | 58 | $ | 58 | ||||||
|
Fiscal 2009 restructuring charges
|
1,823 | 98 | 1,921 | |||||||||
|
Cash payments
|
(521 | ) | (156 | ) | (677 | ) | ||||||
|
Reserve at March 31, 2009
|
$ | 1,302 | $ | - | $ | 1,302 | ||||||
|
Fiscal 2010 restructuring charges
|
11,475 | 5,044 | 16,519 | |||||||||
|
Cash payments
|
(7,592 | ) | (3,209 | ) | (10,801 | ) | ||||||
|
Reclassification of long-term pension liability
|
(2,430 | ) | - | (2,430 | ) | |||||||
|
Fixed asset impairment
|
- | (1,835 | ) | (1,835 | ) | |||||||
|
Reserve at March 31, 2010
|
$ | 2,755 | $ | - | $ | 2,755 | ||||||
|
Fiscal 2011 restructuring charges
|
- | 2,200 | 2,200 | |||||||||
|
Cash payments
|
(2,708 | ) | (1,789 | ) | (4,497 | ) | ||||||
|
Write-off of production supplies
|
- | (411 | ) | (411 | ) | |||||||
|
Reserve at March 31, 2011
|
$ | 47 | $ | - | $ | 47 | ||||||
F-39
COLUMBUS McKINNNON CORPORATION
NOTES TO CONSOLIDATED FINANCIAL STATEMENTS – (Continued)
(tabular amounts in thousands, except share data)
18. Income Taxes
The provision for income taxes differs from the amount computed by applying the statutory federal income tax rate to income from continuing operations before income tax expense. The sources and tax effects of the difference were as follows:
|
|
Year Ended March 31,
|
|||||||||||
|
|
2011
|
2010
|
2009
|
|||||||||
|
Expected tax at 35%
|
$ | 1,773 | $ | (4,511 | ) | $ | (20,335 | ) | ||||
|
State income taxes net of federal benefit
|
(936 | ) | (238 | ) | 309 | |||||||
|
Foreign taxes less than statutory provision
|
(683 | ) | (1,081 | ) | (1,136 | ) | ||||||
|
Permanent items
|
(119 | ) | 229 | 137 | ||||||||
|
Goodwill impairment
|
- | - | 37,450 | |||||||||
|
Valuation allowance
|
42,983 | - | - | |||||||||
|
Research & development credits
|
(812 | ) | - | - | ||||||||
|
Other
|
(795 | ) | 256 | 1,576 | ||||||||
|
Actual tax provision (benefit)
|
$ | 41,411 | $ | (5,345 | ) | $ | 18,001 | |||||
|
|
Year Ended March 31,
|
|||||||||||
|
|
2011
|
2010
|
2009
|
|||||||||
|
Current income tax (benefit) expense:
|
|
|
|
|||||||||
|
United States Federal
|
$ | (4,229 | ) | $ | - | $ | 13,963 | |||||
|
State taxes
|
49 | 913 | 291 | |||||||||
|
Foreign
|
4,818 | 2,417 | 5,447 | |||||||||
|
Deferred income tax expense (benefit):
|
- | |||||||||||
|
United States
|
40,621 | (7,745 | ) | (1,076 | ) | |||||||
|
Foreign
|
152 | (930 | ) | (624 | ) | |||||||
|
|
$ | 41,411 | $ | (5,345 | ) | 18,001 | ||||||
F-40
COLUMBUS McKINNNON CORPORATION
NOTES TO CONSOLIDATED FINANCIAL STATEMENTS – (Continued)
(tabular amounts in thousands, except share data)
The Company applies the liability method of accounting for income taxes as required by ASC Topic 740, “Income Taxes.” The tax effects of temporary differences that give rise to significant portions of the deferred tax assets and deferred tax liabilities are as follows:
|
|
March 31,
|
|||||||
|
|
2011
|
2010
|
||||||
|
Deferred tax assets:
|
|
|
||||||
|
Federal net operating loss carryforwards
|
$ | 10,709 | $ | 12,184 | ||||
|
State and foreign net operating loss carryforwards
|
5,189 | 3,703 | ||||||
|
Employee benefit plans
|
10,671 | 12,163 | ||||||
|
Insurance reserves
|
7,744 | 9,035 | ||||||
|
Accrued vacation and incentive costs
|
3,408 | 1,916 | ||||||
|
Federal tax credit carryforwards
|
6,584 | 4,974 | ||||||
|
Other
|
5,120 | 3,950 | ||||||
|
Valuation allowance
|
(45,836 | ) | (1,609 | ) | ||||
|
Gross deferred tax assets
|
3,589 | 46,316 | ||||||
|
Deferred tax liabilities:
|
||||||||
|
Inventory reserves
|
- | (2,355 | ) | |||||
|
Property, plant, and equipment
|
(1,822 | ) | (1,521 | ) | ||||
|
Intangible assets
|
(4,916 | ) | (5,167 | ) | ||||
|
Gross deferred tax liabilities
|
(6,738 | ) | (9,043 | ) | ||||
|
Net deferred tax (liabilities) assets
|
$ | (3,149 | ) | $ | 37,273 | |||
During 2011, the Company recorded a non-cash charge of $42,983,000 (or $2.26 per diluted share) included within its provision for income taxes. This charge relates to the Company’s determination that a full valuation allowance against its deferred tax assets generated in the U.S and three of the Company’s subsidiaries are necessary. Accounting rules require a reduction of the carrying amounts of deferred tax assets by a valuation allowance if, based on the available and objectively verifiable evidence, it is more likely than not that such assets will not be realized. The existence of cumulative losses for a certain threshold period is a significant form of negative evidence used in the assessment. If a cumulative loss threshold is met, the accounting rules indicate that forecasts of future profitability are generally not sufficient positive evidence to overcome the presumption that a valuation allowance is necessary.
The valuation allowance includes $1,240,000 and $545,000 related to foreign net operating losses at March 31, 2011 and 2010, respectively. The increase in foreign valuation allowance is primarily due to net operating losses in three of the Company’s subsidiaries. The Company’s valuation allowance related to foreign subsidiaries’ net operating losses have lives that range from five years to indefinite.
The Federal net operating losses have expiration dates ranging from 2030 to 2031. The state net operating losses have expiration dates ranging from 2015 through 2030. The Federal tax credits have expiration dates starting in 2014.
F-41
COLUMBUS McKINNNON CORPORATION
NOTES TO CONSOLIDATED FINANCIAL STATEMENTS – (Continued)
(tabular amounts in thousands, except share data)
Deferred income taxes are classified within the consolidated balance sheets based on the following breakdown:
|
|
March 31,
|
|||||||
|
|
2011
|
2010
|
||||||
|
Net current deferred tax asset
|
$ | 336 | $ | 6,149 | ||||
|
Net non-current deferred tax asset
|
1,217 | 36,768 | ||||||
|
Net non-current deferred tax liability
|
(4,702 | ) | (5,644 | ) | ||||
|
Net deferred tax (liability) asset
|
$ | (3,149 | ) | $ | 37,273 | |||
The Net current deferred tax assets are included in prepaid expenses. Net non-current deferred tax liabilities are included in other non-current liabilities.
Income (loss) from continuing operations before income tax expense includes foreign subsidiary income (loss) of $12,403,000, $8,769,000, and $(16,119,000) for the years ended March 31, 2011, 2010, and 2009, respectively. Income (loss) from discontinued operations reported in the statements of operations is net of tax expense (benefit) of $243,000, $326,000, and $(14,442,000) for the years ended March 31, 2011, 2010, and 2009, respectively. As of March 31, 2011, the Company had unrecognized deferred tax liabilities related to approximately $79,000,000 of cumulative undistributed earnings of foreign subsidiaries. These earnings are considered to be permanently invested in operations outside the United States. Determination of the amount of unrecognized deferred U.S. income tax liability with respect to such earnings is not practicable.
There were shares of common stock issued through restricted stock units, the exercise of non-qualified stock options, or through the disqualifying disposition of incentive stock options in the years ended March 31, 2011 and 2010, respectively. The tax benefits to the Company from these transactions, were recorded in additional paid-in capital rather than recognized as a reduction of income tax expense, was $68,000 and ($5,600) in 2011 and 2010, respectively. This tax shortfall (benefit) has also been recognized in the consolidated balance sheet as an increase (decrease) in deferred tax assets.
Changes in the Company’s uncertain income tax positions, excluding the related accrual for interest and penalties, are as follows:
|
|
2011
|
2010
|
2009
|
|||||||||
|
Beginning balance
|
$ | 3,577 | $ | 3,546 | $ | 2,447 | ||||||
|
Additions for prior year tax positions
|
27 | 20 | 12 | |||||||||
|
Additions for current year tax positions
|
93 | 260 | 1,327 | |||||||||
|
Reductions for prior year tax positions
|
(928 | ) | (33 | ) | (116 | ) | ||||||
|
Foreign currency translation
|
32 | (90 | ) | - | ||||||||
|
Lapses in statute limitations
|
(154 | ) | (126 | ) | (124 | ) | ||||||
|
Ending balance
|
$ | 2,647 | $ | 3,577 | $ | 3,546 | ||||||
The Company had $96,000 and $130,000 accrued for the payment of interest and penalties at March 31, 2011 and 2010, respectively. The Company recognizes interest expense or penalties related to uncertain tax positions as a part of income tax expense in its consolidated statements of operations.
Substantially all of the unrecognized tax benefits as of March 31, 2011 would impact the effective tax rate if recognized.
The Company and its subsidiaries file income tax returns in the U.S. and various state and local and foreign jurisdictions. The Internal Revenue Service has completed an examination of the Company’s U.S. income tax returns for 2007 and 2008, resulting in a reduction of AMT credit carry forwards of $256,000. Current examinations include an IRS audit of the Company’s 2009 return, a German audit of 2005 through 2007, and various state audits.
F-42
COLUMBUS McKINNNON CORPORATION
NOTES TO CONSOLIDATED FINANCIAL STATEMENTS – (Continued)
(tabular amounts in thousands, except share data)
The Company’s major jurisdictions are the United States and Germany. With few exceptions, the Company is no longer subject to tax examinations by tax authorities in the United States for tax years prior to March 31, 2008 and in Germany for tax years prior to December 31, 2005.
The Company does not anticipate that total unrecognized tax benefits will change significantly due to the settlement of audits or the expiration of statutes of limitations prior to March 31, 2012.
19. Rental Expense and Lease Commitments
Rental expense for the years ended March 31, 2011, 2010, and 2009 was $7,195,143, $5,463,000, and $5,695,000, respectively. The following amounts represent future minimum payment commitments as of March 31, 2011 under non-cancelable operating leases extending beyond one year:
|
Year Ended March 31,
|
Real Property
|
Vehicles/Equipment
|
Total
|
|||||||||
|
2012
|
$ | 3,898 | $ | 3,022 | $ | 6,920 | ||||||
|
2013
|
2,665 | 2,057 | 4,722 | |||||||||
|
2014
|
1,578 | 1,623 | 3,201 | |||||||||
|
2015
|
1,061 | 1,130 | 2,191 | |||||||||
|
2016 and thereafter
|
910 | 345 | 1,255 | |||||||||
|
Total
|
$ | 10,112 | $ | 8,177 | $ | 18,289 | ||||||
F-43
COLUMBUS McKINNNON CORPORATION
NOTES TO CONSOLIDATED FINANCIAL STATEMENTS – (Continued)
(tabular amounts in thousands, except share data)
20. Summary Financial Information
The following information sets forth the condensed consolidating summary financial information of the parent and guarantors, which guarantee the 7 7/8% Senior Subordinated Notes, and the nonguarantors. The guarantors are wholly owned and the guarantees are full, unconditional, joint and several.
As of and for the year ended March 31, 2011:
|
Parent
|
Guarantors
|
Non Guarantors
|
Eliminations
|
Consolidated
|
||||||||||||||||
|
As of March 31, 2011:
|
|
|
|
|
|
|||||||||||||||
|
Current assets:
|
|
|
|
|
|
|||||||||||||||
|
Cash
|
$ | 45,954 | $ | 7 | $ | 34,178 | $ | - | $ | 80,139 | ||||||||||
|
Trade accounts receivable
|
41,395 | 32 | 36,317 | - | 77,744 | |||||||||||||||
|
Inventories
|
25,937 | 18,497 | 47,597 | (2,000 | ) | 90,031 | ||||||||||||||
|
Prepaid expenses
|
(4,407 | ) | 698 | 16,404 | 1,599 | 14,294 | ||||||||||||||
|
Total current assets
|
108,879 | 19,234 | 134,496 | (401 | ) | 262,208 | ||||||||||||||
|
Net property, plant, and equipment
|
30,451 | 11,866 | 17,043 | - | 59,360 | |||||||||||||||
|
Goodwill and other intangibles, net
|
40,953 | 31,025 | 52,166 | - | 124,144 | |||||||||||||||
|
Intercompany balances
|
(56,929 | ) | 130,125 | (72,773 | ) | (423 | ) | - | ||||||||||||
|
Other non-current assets
|
4,278 | 4,152 | 26,492 | (1,762 | ) | 33,160 | ||||||||||||||
|
Investment in subsidiaries
|
241,387 | - | - | (241,387 | ) | - | ||||||||||||||
|
Total assets
|
$ | 369,019 | $ | 196,402 | $ | 157,424 | $ | (243,973 | ) | $ | 478,872 | |||||||||
|
Current liabilities
|
$ | 35,792 | $ | 15,774 | $ | 44,523 | $ | (824 | ) | $ | 95,265 | |||||||||
|
Long-term debt, less current portion
|
147,867 | 2,235 | 2,714 | - | 152,816 | |||||||||||||||
|
Other non-current liabilities
|
23,214 | 8,506 | 37,678 | (753 | ) | 68,645 | ||||||||||||||
|
Total liabilities
|
206,873 | 26,515 | 84,915 | (1,577 | ) | 316,726 | ||||||||||||||
|
Shareholders’ equity
|
162,146 | 169,887 | 72,509 | (242,396 | ) | 162,146 | ||||||||||||||
|
Total liabilities and shareholders’ equity
|
$ | 369,019 | $ | 196,402 | $ | 157,424 | $ | (243,973 | ) | $ | 478,872 | |||||||||
|
For the Year Ended March 31, 2011:
|
||||||||||||||||||||
|
Net sales
|
$ | 197,391 | $ | 148,905 | $ | 217,724 | $ | (39,955 | ) | $ | 524,065 | |||||||||
|
Cost of products sold
|
163,215 | 121,852 | 152,901 | (39,955 | ) | 398,013 | ||||||||||||||
|
Gross profit
|
34,176 | 27,053 | 64,823 | - | 126,052 | |||||||||||||||
|
Selling, general and administrative expenses
|
31,453 | 21,763 | 50,286 | - | 103,502 | |||||||||||||||
|
Restructuring charges
|
2,089 | - | 111 | - | 2,200 | |||||||||||||||
|
Amortization of intangibles
|
118 | 3 | 1,657 | - | 1,778 | |||||||||||||||
|
Income from operations
|
516 | 5,287 | 12,769 | - | 18,572 | |||||||||||||||
|
Interest and debt expense
|
11,739 | 1,436 | 357 | - | 13,532 | |||||||||||||||
|
Cost of bond redemptions
|
3,939 | - | - | - | 3,939 | |||||||||||||||
|
Other (income) and expense, net
|
(1,225 | ) | 21 | (2,760 | ) | - | (3,964 | ) | ||||||||||||
|
(Loss) income from continuing operations before income tax (benefit) expense
|
(13,937 | ) | 3,830 | 15,172 | - | 5,065 | ||||||||||||||
|
Income tax expense
|
32,951 | 3,125 | 5,273 | 62 | 41,411 | |||||||||||||||
|
Equity in income from continuing operations of subsidiaries
|
10,542 | - | - | (10,542 | ) | - | ||||||||||||||
|
(Loss) income from continuous operations
|
(36,346 | ) | 705 | 9,899 | (10,604 | ) | (36,346 | ) | ||||||||||||
|
Income from discontinued operations
|
396 | - | - | - | 396 | |||||||||||||||
|
Net (loss) income
|
$ | (35,950 | ) | $ | 705 | $ | 9,899 | $ | (10,604 | ) | $ | (35,950 | ) | |||||||
F-44
COLUMBUS McKINNNON CORPORATION
NOTES TO CONSOLIDATED FINANCIAL STATEMENTS – (Continued)
(tabular amounts in thousands, except share data)
|
Parent
|
Guarantors
|
Non Guarantors
|
Eliminations
|
Consolidated
|
||||||||||||||||
|
For the Year Ended March 31, 2011:
|
|
|
|
|
|
|||||||||||||||
|
Operating activities:
|
|
|
|
|
|
|||||||||||||||
|
Cash provided by (used for) operating activities
|
2,052 | 2,489 | (638 | ) | (623 | ) | 3,280 | |||||||||||||
|
Investing activities:
|
||||||||||||||||||||
|
Sales of marketable securities, net
|
712 | - | 5,909 | - | 6,621 | |||||||||||||||
|
Capital expenditures
|
(8,562 | ) | (1,673 | ) | (2,308 | ) | - | (12,543 | ) | |||||||||||
|
Proceeds from sale of business or assets
|
1,182 | - | - | - | 1,182 | |||||||||||||||
|
Net cash (used for) provided by investing activities from continuing operations
|
(6,668 | ) | (1,673 | ) | 3,601 | - | (4,740 | ) | ||||||||||||
|
Net cash provided by investing activities from discontinued operations
|
396 | - | - | - | 396 | |||||||||||||||
|
Net cash (used for) provided by investing activities
|
(6,272 | ) | (1,673 | ) | 3,601 | - | (4,344 | ) | ||||||||||||
|
Financing activities:
|
||||||||||||||||||||
|
Payment of tender fees
|
(3,154 | ) | - | - | - | (3,154 | ) | |||||||||||||
|
Net repayments under revolving line-of-credit agreements
|
- | - | (337 | ) | - | (337 | ) | |||||||||||||
|
Repayment of long-term debt
|
(124,855 | ) | (210 | ) | (752 | ) | - | (125,817 | ) | |||||||||||
|
Proceeds from the issuance of long-term debt
|
147,844 | - | - | - | 147,844 | |||||||||||||||
|
Deferred financing costs incurred
|
(3,185 | ) | - | - | - | (3,185 | ) | |||||||||||||
|
Dividends paid
|
- | - | - | - | - | |||||||||||||||
|
Other
|
443 | (774 | ) | - | 774 | 443 | ||||||||||||||
|
Net cash provided by (used for) financing activities
|
17,093 | (984 | ) | (1,089 | ) | 774 | 15,794 | |||||||||||||
|
Effect of exchange rate changes on cash
|
- | 151 | 1,441 | (151 | ) | 1,441 | ||||||||||||||
|
Net change in cash and cash equivalents
|
12,873 | (17 | ) | 3,315 | - | 16,171 | ||||||||||||||
|
Cash and cash equivalents at beginning of year
|
33,081 | 24 | 30,863 | - | 63,968 | |||||||||||||||
|
Cash and cash equivalents at end of year
|
$ | 45,954 | $ | 7 | $ | 34,178 | $ | - | $ | 80,139 | ||||||||||
F-45
COLUMBUS McKINNNON CORPORATION
NOTES TO CONSOLIDATED FINANCIAL STATEMENTS – (Continued)
(tabular amounts in thousands, except share data)
|
Parent
|
Guarantors
|
Non Guarantors
|
Eliminations
|
Consolidated
|
||||||||||||||||
|
As of March 31, 2010:
|
|
|
|
|
|
|||||||||||||||
|
Current assets:
|
|
|
|
|
|
|||||||||||||||
|
Cash
|
$ | 33,081 | $ | 24 | $ | 30,863 | $ | - | $ | 63,968 | ||||||||||
|
Trade accounts receivable
|
38,316 | 64 | 31,838 | - | 70,218 | |||||||||||||||
|
Inventories
|
26,023 | 16,057 | 39,742 | (2,000 | ) | 79,822 | ||||||||||||||
|
Prepaid expenses
|
3,432 | 874 | 11,056 | 652 | 16,014 | |||||||||||||||
|
Total current assets
|
100,852 | 17,019 | 113,499 | (1,348 | ) | 230,022 | ||||||||||||||
|
Net property, plant, and equipment
|
27,330 | 11,998 | 17,778 | - | 57,106 | |||||||||||||||
|
Goodwill and other intangibles, net
|
41,013 | 31,028 | 52,124 | - | 124,165 | |||||||||||||||
|
Intercompany balances
|
(79,763 | ) | 153,190 | (76,594 | ) | 3,167 | - | |||||||||||||
|
Other non-current assets
|
37,319 | 1,255 | 31,630 | - | 70,204 | |||||||||||||||
|
Investment in subsidiaries
|
248,915 | - | - | (248,915 | ) | - | ||||||||||||||
|
Total assets
|
$ | 375,666 | $ | 214,490 | $ | 138,437 | $ | (247,096 | ) | $ | 481,497 | |||||||||
|
Current liabilities
|
$ | 38,157 | $ | 13,176 | $ | 37,833 | $ | 1,819 | $ | 90,985 | ||||||||||
|
Long-term debt, less current portion
|
124,855 | 2,475 | 3,491 | - | 130,821 | |||||||||||||||
|
Other non-current liabilities
|
25,376 | 9,083 | 37,954 | - | 72,413 | |||||||||||||||
|
Total liabilities
|
188,388 | 24,734 | 79,278 | 1,819 | 294,219 | |||||||||||||||
|
Shareholders’ equity
|
187,278 | 189,756 | 59,159 | (248,915 | ) | 187,278 | ||||||||||||||
|
Total liabilities and shareholders’ equity
|
$ | 375,666 | $ | 214,490 | $ | 138,437 | $ | (247,096 | ) | $ | 481,497 | |||||||||
|
For the Year Ended March 31, 2010:
|
||||||||||||||||||||
|
Net sales
|
$ | 193,784 | $ | 117,854 | $ | 192,326 | $ | (27,781 | ) | $ | 476,183 | |||||||||
|
Cost of products sold
|
158,571 | 94,906 | 135,245 | (28,478 | ) | 360,244 | ||||||||||||||
|
Gross profit
|
35,213 | 22,948 | 57,081 | 697 | 115,939 | |||||||||||||||
|
Selling, general and administrative expenses
|
41,397 | 13,651 | 46,308 | - | 101,356 | |||||||||||||||
|
Restructuring charges
|
15,316 | - | 1,203 | - | 16,519 | |||||||||||||||
|
Amortization of intangibles
|
119 | 3 | 1,754 | - | 1,876 | |||||||||||||||
|
(Loss) income from operations
|
(21,619 | ) | 9,294 | 7,816 | 697 | (3,812 | ) | |||||||||||||
|
Interest and debt expense
|
11,865 | 493 | 867 | - | 13,225 | |||||||||||||||
|
Other (income) and expense, net
|
(1,893 | ) | (1,033 | ) | (1,222 | ) | - | (4,148 | ) | |||||||||||
|
(Loss) income from continuing operations before income tax (benefit) expense
|
(31,591 | ) | 9,834 | 8,171 | 697 | (12,889 | ) | |||||||||||||
|
Income tax (benefit) expense
|
(9,963 | ) | 2,739 | 1,687 | 192 | (5,345 | ) | |||||||||||||
|
Equity in income from continuing operations of subsidiaries
|
14,084 | - | - | (14,084 | ) | - | ||||||||||||||
|
(Loss) income from continuous operations
|
(7,544 | ) | 7,095 | 6,484 | (13,579 | ) | (7,544 | ) | ||||||||||||
|
Income from discontinued operations
|
531 | - | - | - | 531 | |||||||||||||||
|
Net (loss) income
|
$ | (7,013 | ) | $ | 7,095 | $ | 6,484 | $ | (13,579 | ) | $ | (7,013 | ) | |||||||
F-46
COLUMBUS McKINNNON CORPORATION
NOTES TO CONSOLIDATED FINANCIAL STATEMENTS – (Continued)
(tabular amounts in thousands, except share data)
|
Parent
|
Guarantors
|
Non Guarantors
|
Eliminations
|
Consolidated
|
||||||||||||||||
|
For the Year Ended March 31, 2010:
|
|
|
|
|
|
|||||||||||||||
|
Operating activities:
|
|
|
|
|
|
|||||||||||||||
|
Net cash provided by operating activities from continuing operations
|
$ | 28,418 | $ | (665 | ) | $ | 16,198 | $ | (14,084 | ) | $ | 29,867 | ||||||||
|
Cash provided by operating activities
|
28,418 | (665 | ) | 16,198 | (14,084 | ) | 29,867 | |||||||||||||
|
Investing activities:
|
- | - | - | - | - | |||||||||||||||
|
Purchases of marketable securities, net
|
(414 | ) | - | 2,236 | - | 1,822 | ||||||||||||||
|
Capital expenditures
|
(4,933 | ) | (1,674 | ) | (638 | ) | - | (7,245 | ) | |||||||||||
|
Investment in subsidiaries
|
(14,084 | ) | - | - | 14,084 | - | ||||||||||||||
|
Purchases of businesses, net of cash
|
- | 2,407 | 1,135 | - | 3,542 | |||||||||||||||
|
Net cash used by investing activities from continuing operations
|
(19,431 | ) | 733 | 2,733 | 14,084 | (1,881 | ) | |||||||||||||
|
Net cash provided by investing activities from discontinued operations
|
531 | - | - | - | 531 | |||||||||||||||
|
Net cash used by investing activities
|
(18,900 | ) | 733 | 2,733 | 14,084 | (1,350 | ) | |||||||||||||
|
Financing activities:
|
||||||||||||||||||||
|
Proceeds from exercise of stock options
|
291 | - | - | - | 291 | |||||||||||||||
|
Net repayments under revolving line-of-credit agreements
|
- | - | (3,946 | ) | - | (3,946 | ) | |||||||||||||
|
Repayment of debt
|
- | (130 | ) | (834 | ) | - | (964 | ) | ||||||||||||
|
Deferred financing costs incurred
|
(1,258 | ) | - | - | - | (1,258 | ) | |||||||||||||
|
Other
|
390 | 69 | - | - | 459 | |||||||||||||||
|
Net cash used by financing activities from continuing operations
|
(577 | ) | (61 | ) | (4,780 | ) | - | (5,418 | ) | |||||||||||
|
Net cash (used) provided by financing activities from discontinued operations
|
- | - | - | - | - | |||||||||||||||
|
Net cash used by financing activities
|
(577 | ) | (61 | ) | (4,780 | ) | - | (5,418 | ) | |||||||||||
|
Effect of exchange rate changes on cash
|
- | (13 | ) | 1,646 | - | 1,633 | ||||||||||||||
|
Net change in cash and cash equivalents
|
8,941 | (6 | ) | 15,797 | - | 24,732 | ||||||||||||||
|
Cash and cash equivalents at beginning of year
|
24,140 | 30 | 15,066 | - | 39,236 | |||||||||||||||
|
Cash and cash equivalents at end of year
|
$ | 33,081 | $ | 24 | $ | 30,863 | $ | - | $ | 63,968 | ||||||||||
F-47
COLUMBUS McKINNNON CORPORATION
NOTES TO CONSOLIDATED FINANCIAL STATEMENTS – (Continued)
(tabular amounts in thousands, except share data)
|
|
Parent
|
Guarantors
|
Non Guarantors
|
Eliminations
|
Consolidated
|
|||||||||||||||
|
For the Year Ended March 31, 2009:
|
|
|
|
|
|
|||||||||||||||
|
Net sales
|
$ | 288,928 | $ | 162,935 | $ | 197,200 | $ | (42,355 | ) | $ | 606,708 | |||||||||
|
Cost of products sold
|
217,628 | 124,573 | 132,829 | (42,023 | ) | 433,007 | ||||||||||||||
|
Gross profit (loss)
|
71,300 | 38,362 | 64,371 | (332 | ) | 173,701 | ||||||||||||||
|
Selling, general and administrative expenses
|
46,242 | 18,612 | 45,487 | - | 110,341 | |||||||||||||||
|
Restructuring charges
|
1,367 | 554 | - | - | 1,921 | |||||||||||||||
|
Impairment loss
|
48,000 | 26,000 | 33,000 | - | 107,000 | |||||||||||||||
|
Amortization of intangibles
|
117 | 3 | 878 | - | 998 | |||||||||||||||
|
Loss from operations
|
(24,426 | ) | (6,807 | ) | (14,994 | ) | (332 | ) | (46,559 | ) | ||||||||||
|
Interest and debt expense
|
10,793 | 1,497 | 858 | - | 13,148 | |||||||||||||||
|
Other (income) and expense, net
|
(4,833 | ) | (1,230 | ) | 4,457 | - | (1,606 | ) | ||||||||||||
|
Loss from continuing operations before income
|
||||||||||||||||||||
|
tax expense (benefit)
|
(30,386 | ) | (7,074 | ) | (20,309 | ) | (332 | ) | (58,101 | ) | ||||||||||
|
Income tax expense (benefit)
|
6,730 | 7,979 | 3,418 | (126 | ) | 18,001 | ||||||||||||||
|
Equity in (loss) income from continuing operations of subsidiaries
|
(38,986 | ) | - | - | 38,986 | - | ||||||||||||||
|
(Loss) income from continuous operations
|
(76,102 | ) | (15,053 | ) | (23,727 | ) | 38,780 | (76,102 | ) | |||||||||||
|
Loss from discontinued operations
|
(627 | ) | - | (1,655 | ) | - | (2,282 | ) | ||||||||||||
|
Equity in (loss) income from discontinued operations of subsidiaries (net of tax)
|
(1,655 | ) | - | - | 1,655 | - | ||||||||||||||
|
Net (loss) income
|
$ | (78,384 | ) | $ | (15,053 | ) | $ | (25,382 | ) | $ | 40,435 | $ | (78,384 | ) | ||||||
|
|
||||||||||||||||||||
|
For the Year Ended March 31, 2009:
|
||||||||||||||||||||
|
Operating activities:
|
||||||||||||||||||||
|
Net cash provided by operating activities from continuing operations
|
$ | (20,482 | ) | $ | 628 | $ | 43,895 | $ | 38,986 | $ | 63,027 | |||||||||
|
Net cash used by operating activities from discontinued operations
|
(2,233 | ) | - | (2,218 | ) | 1,655 | (2,796 | ) | ||||||||||||
|
Cash provided by operating activities
|
(22,715 | ) | 628 | 41,677 | 40,641 | 60,231 | ||||||||||||||
|
Investing activities:
|
||||||||||||||||||||
|
Purchases of marketable securities, net
|
- | - | (2,605 | ) | - | (2,605 | ) | |||||||||||||
|
Capital expenditures
|
(7,461 | ) | (1,910 | ) | (2,874 | ) | - | (12,245 | ) | |||||||||||
|
Proceeds from sale of PP&E
|
- | 1,593 | - | - | 1,593 | |||||||||||||||
|
Purchases of businesses, net of cash
|
- | - | (52,779 | ) | - | (52,779 | ) | |||||||||||||
|
Investment in subsidiaries
|
40,641 | - | - | (40,641 | ) | - | ||||||||||||||
|
Net cash used by investing activities from continuing operations
|
33,180 | (317 | ) | (58,258 | ) | (40,641 | ) | (66,036 | ) | |||||||||||
|
Net cash provided by investing activities from discontinued operations
|
531 | - | - | - | 531 | |||||||||||||||
|
Net cash used by investing activities
|
33,711 | (317 | ) | (58,258 | ) | (40,641 | ) | (65,505 | ) | |||||||||||
|
Financing activities:
|
||||||||||||||||||||
|
Proceeds from exercise of stock options
|
421 | - | - | - | 421 | |||||||||||||||
|
Net repayments under revolving line-of-credit agreements
|
- | - | (2,138 | ) | - | (2,138 | ) | |||||||||||||
|
Repayment of debt
|
(4,700 | ) | (191 | ) | (2,096 | ) | - | (6,987 | ) | |||||||||||
|
Other
|
789 | - | - | - | 789 | |||||||||||||||
|
Net cash used by financing activities from continuing operations
|
(3,490 | ) | (191 | ) | (4,234 | ) | - | (7,915 | ) | |||||||||||
|
Net cash (used) provided by financing activities from discontinued operations
|
(15,191 | ) | - | 579 | - | (14,612 | ) | |||||||||||||
|
Net cash used by financing activities
|
(18,681 | ) | (191 | ) | (3,655 | ) | - | (22,527 | ) | |||||||||||
|
Effect of exchange rate changes on cash
|
- | 251 | (9,208 | ) | - | (8,957 | ) | |||||||||||||
|
Net change in cash and cash equivalents
|
(7,685 | ) | 371 | (29,444 | ) | - | (36,758 | ) | ||||||||||||
|
Cash and cash equivalents at beginning of year
|
31,800 | (341 | ) | 44,535 | - | 75,994 | ||||||||||||||
|
Cash and cash equivalents at end of year
|
$ | 24,115 | $ | 30 | $ | 15,091 | $ | - | $ | 39,236 | ||||||||||
F-48
COLUMBUS McKINNNON CORPORATION
NOTES TO CONSOLIDATED FINANCIAL STATEMENTS – (Continued)
(tabular amounts in thousands, except share data)
21. Business Segment Information
ASC Topic 280, “Segment Reporting,” establishes the standards for reporting information about operating segments in financial statements. Historically the Company had two operating and reportable segments, Products and Solutions. The Solutions segment engaged primarily in the design, fabrication and installation of integrated material handling conveyor systems and service and in the design and manufacture of tire shredders, lift tables and light-rail systems. In fiscal 2009, the Company re-evaluated its operating and reportable segments in connection with the discontinuation of its integrated material handling conveyor systems and service business. With this divestiture, and in consideration of the quantitative contribution of the remaining portions of the Solutions segment to the Company as a whole and our products-orientated strategic growth initiatives, the Company determined that it now has only one operating and reportable segment for both internal and external reporting purposes
Financial information relating to the Company’s operations by geographic area is as follows:
|
|
Year Ended March 31,
|
|||||||||||
|
|
2011
|
2010
|
2009
|
|||||||||
|
Net sales:
|
|
|
|
|||||||||
|
United States
|
$ | 315,219 | $ | 291,564 | $ | 420,498 | ||||||
|
Europe
|
159,363 | 149,872 | 141,595 | |||||||||
|
Canada
|
16,847 | 12,081 | 15,052 | |||||||||
|
Other
|
32,636 | 22,666 | 29,563 | |||||||||
|
Total
|
$ | 524,065 | $ | 476,183 | $ | 606,708 | ||||||
|
|
||||||||||||
|
|
Year Ended March 31,
|
|||||||||||
|
|
2011 | 2010 | 2009 | |||||||||
|
Total assets:
|
||||||||||||
|
United States
|
$ | 282,925 | $ | 302,210 | $ | 321,656 | ||||||
|
Europe
|
152,020 | 139,064 | 134,027 | |||||||||
|
Canada
|
17,722 | 13,943 | 8,422 | |||||||||
|
Other
|
26,205 | 26,280 | 27,559 | |||||||||
|
Total
|
$ | 478,872 | $ | 481,497 | $ | 491,664 | ||||||
|
|
||||||||||||
|
|
Year Ended March 31,
|
|||||||||||
|
|
2011 | 2010 | 2009 | |||||||||
|
Long-lived assets:
|
||||||||||||
|
United States
|
$ | 114,295 | $ | 111,369 | $ | 113,043 | ||||||
|
Europe
|
64,015 | 64,458 | 66,760 | |||||||||
|
Other
|
$ | 5,194 | $ | 5,444 | $ | 7,379 | ||||||
|
Total
|
$ | 183,504 | $ | 181,271 | $ | 187,182 | ||||||
|
Note: Long-lived assets include net property, plant, and equipment, goodwill, and other intangibles, net.
|
||||||||||||
|
|
||||||||||||
|
Sales by major product group are as follows:
|
Year Ended March 31,
|
|||||||||||
|
|
2011 | 2010 | 2009 | |||||||||
|
|
||||||||||||
|
Hoists
|
$ | 287,905 | $ | 252,824 | $ | 331,822 | ||||||
|
Chain and forged attachments
|
108,590 | 95,862 | 132,492 | |||||||||
|
Industrial cranes
|
39,715 | 41,170 | 59,868 | |||||||||
|
Other
|
87,855 | 86,327 | 82,526 | |||||||||
|
Total
|
$ | 524,065 | $ | 476,183 | $ | 606,708 | ||||||
F-49
COLUMBUS McKINNNON CORPORATION
NOTES TO CONSOLIDATED FINANCIAL STATEMENTS – (Continued)
(tabular amounts in thousands, except share data)
22. Selected Quarterly Financial Data (Unaudited)
Below is selected quarterly financial data for fiscal 2011 and 2010:
|
|
Three Months Ended
|
|||||||||||||||
|
|
June 30,
|
September 30,
|
December 31,
|
March 31,
|
||||||||||||
|
|
2010
|
2010
|
2010
|
2011
|
||||||||||||
|
Net sales
|
$ | 119,087 | $ | 132,312 | $ | 128,696 | $ | 143,970 | ||||||||
|
Gross profit
|
28,015 | 31,241 | 29,351 | 37,445 | ||||||||||||
|
(Loss) income from operations
|
1,136 | 5,185 | 2,950 | 9,301 | ||||||||||||
|
Net (loss) income (1)
|
$ | (722 | ) | $ | 1,868 | $ | (39,639 | ) | $ | 2,543 | ||||||
|
|
||||||||||||||||
|
|
||||||||||||||||
|
Net (loss) income per share - basic
|
$ | (0.04 | ) | $ | 0.10 | $ | (2.08 | ) | $ | 0.13 | ||||||
|
|
||||||||||||||||
|
Net (loss) income per share - diluted
|
$ | (0.04 | ) | $ | 0.10 | $ | (2.08 | ) | $ | 0.13 | ||||||
|
|
Three Months Ended
|
|||||||||||||||
|
|
June 30,
|
September 30,
|
December 31,
|
March 31,
|
||||||||||||
|
2009
|
2009
|
2009
|
2010
|
|||||||||||||
|
Net sales
|
$ | 119,008 | $ | 115,234 | $ | 118,971 | $ | 122,970 | ||||||||
|
Gross profit
|
29,430 | 28,051 | 26,825 | 31,633 | ||||||||||||
|
(Loss) income from operations
|
(1,786 | ) | 543 | (2,543 | ) | (26 | ) | |||||||||
|
Net (loss) income
|
$ | (2,398 | ) | $ | (2,731 | ) | $ | (2,344 | ) | $ | 460 | |||||
|
|
||||||||||||||||
|
|
||||||||||||||||
|
Net (loss) income per share - basic
|
$ | (0.13 | ) | $ | (0.14 | ) | $ | (0.12 | ) | $ | 0.02 | |||||
|
|
||||||||||||||||
|
Net (loss) income per share - diluted
|
$ | (0.13 | ) | $ | (0.14 | ) | $ | (0.12 | ) | $ | 0.02 | |||||
|
(1)
|
During the quarter ended December 31, 2010, the Company recorded a non-cash charge of $39,700,000 included within its provision for income taxes. This charge relates to the Company’s determination that a full valuation allowance against its deferred tax assets generated in the U.S. was necessary.
|
Note: The per-share net income (loss) for the four quarters may not equal the per share net loss for the year due to rounding.
F-50
COLUMBUS McKINNNON CORPORATION
NOTES TO CONSOLIDATED FINANCIAL STATEMENTS – (Continued)
(tabular amounts in thousands, except share data)
23. Accumulated Other Comprehensive Loss
The components of accumulated other comprehensive loss is as follows:
|
|
March 31,
|
|||||||
|
|
2011
|
2010
|
||||||
|
Net unrealized investment gain (loss) – net of tax
|
$ | 1,379 | $ | 1,708 | ||||
|
Adjustment to pension liability– net of tax
|
(26,887 | ) | (31,112 | ) | ||||
|
Adjustment to other postretirement obligations – net of tax
|
(2,103 | ) | (2,497 | ) | ||||
|
Adjustment to split-dollar life insurance arrangements – net of tax
|
(2,029 | ) | (443 | ) | ||||
|
Foreign currency translation adjustment – net of tax
|
9,009 | 4,076 | ||||||
|
Derivatives qualifying as hedges – net of tax
|
181 | (58 | ) | |||||
|
Accumulated other comprehensive loss
|
$ | (20,450 | ) | $ | (28,326 | ) | ||
The deferred taxes associated with the items included in accumulated other comprehensive loss, net of deferred tax asset valuation allowances, were $0 and $19,291,000, for 2011 and 2010, respectively. Refer to Note 18 for discussion of the deferred tax asset valuation allowance. In the period subsequent to our initial recording of the valuation allowance in fiscal 2011, increases and decreases to both the deferred tax assets associated with items in accumulated other comprehensive loss, and the valuation allowance, have been recorded as offsets to comprehensive income.
As a result of the recording of a deferred tax asset valuation allowance in fiscal 2005, the Company recorded as an offsetting entry a $534,000 charge in the minimum pension liability component of other comprehensive income. With the reversal of that valuation allowance in fiscal 2006, the Company recorded the reversal of the valuation allowance as a reduction of income taxes in the consolidated statement of operations. This is in accordance with ASC Topic 740, “Income Taxes,” even though the valuation allowance was initially established by a charge against comprehensive income. This amount will remain indefinitely as a component of minimum pension liability adjustment.
The activity by year related to investments, including reclassification adjustments for activity included in earnings are as follows (all items shown net of tax):
|
|
Year Ended March 31,
|
|||||||||||
|
|
2011
|
2010
|
2009
|
|||||||||
|
Net unrealized investment gain (loss) at beginning of year
|
$ | 1,708 | $ | (317 | ) | $ | (740 | ) | ||||
|
Unrealized holdings gain (loss) arising during the period
|
1,484 | 2,393 | (3,584 | ) | ||||||||
|
Reclassification adjustments for (gain) loss included in earnings
|
(1,813 | ) | (368 | ) | 4,007 | |||||||
|
Net change in unrealized gain (loss) on investments
|
(329 | ) | 2,025 | 423 | ||||||||
|
Net unrealized investment gain (loss) at end of year
|
$ | 1,379 | $ | 1,708 | $ | (317 | ) | |||||
24. Effects of New Accounting Pronouncements
On April 1, 2010, the Company adopted the provisions of Accounting Standards Update No. 2010-06 “Improving Disclosures about Fair Value Measurements” (“ASU 2010-06”). ASU 2010-06 amends ASC Topic 820 to require additional disclosures regarding fair value measurements. Specifically ASU 2010-06 requires entities to disclose the amounts of significant transfers between Level 1 and Level 2 of the fair value hierarchy and the reasons for these transfers, the reasons for any transfers in or out of Level 3 and information in the reconciliation of recurring Level 3 measurements about purchases, sales, issuances and settlements on a gross basis. The adoption of these provisions did not have a material impact on the Company’s consolidated financial position, results of operations or cash flows.
F-51
COLUMBUS McKINNNON CORPORATION
NOTES TO CONSOLIDATED FINANCIAL STATEMENTS – (Continued)
(tabular amounts in thousands, except share data)
In April 2010, the FASB issued the FASB Accounting Standards Update No. 2010-17 “Revenue Recognition — Milestone Method (Topic 605) Milestone Method of Revenue Recognition” (“ASU 2010-17”), which provides guidance on the criteria that should be met for determining whether the milestone method of revenue recognition is appropriate. A vendor can recognize consideration that is contingent upon achievement of a milestone in its entirety as revenue in the period in which the milestone is achieved only if the milestone meets all criteria to be considered substantive. The adoption of these provisions did not have a material impact on the Company’s consolidated financial position, results of operations or cash flows.
In December 2010, the FASB issued Accounting Standards Update No. 2010-28, When to Perform Step 2 of the Goodwill Impairment Test for Reporting Units with Zero or Negative Carrying Amounts (Topic 350)—Intangibles—Goodwill and Other (ASU 2010-28). ASU 2010-28 amends the criteria for performing Step 2 of the goodwill impairment test for reporting units with zero or negative carrying amounts and requires performing Step 2 if qualitative factors indicate that it is more likely than not that a goodwill impairment exists. The Company will adopt ASU 2010-28 in fiscal 2012 and any impairment to be recorded upon adoption, if any, will be recognized as an adjustment to the Company’s beginning retained earnings. The Company is currently evaluating the impact of the pending adoption of ASU 2010-28 on its condensed consolidated financial statements.
In December 2010, the FASB issued Accounting Standards Update 2010-29 (“ASU 2010-29”) which address diversity in practice about the interpretation of the pro forma revenue and earnings disclosure requirements for business combinations (Topic 805). This ASU specifies that if a public entity presents comparative financial statements, the entity should disclose revenue and earnings of the combined entity as though the business combination(s) that occurred during the current year had occurred as of the beginning of the comparable prior annual reporting period only. This ASU also expands the supplemental pro forma disclosures under Topic 805 to include a description of the nature and amount of material, nonrecurring pro forma adjustments directly attributable to the business combination included in the reported pro forma revenue and earnings. ASU 2010-29 is effective prospectively for business combinations for which the acquisition date is on or after the beginning of the first annual reporting period beginning on or after December 15, 2010. Early adoption is permitted. The Company is currently evaluating the impact of this ASU; however, the Company does not expect the adoption of this ASU will have a material impact on its consolidated financial statements.
F-52
COLUMBUS McKINNON CORPORATION
SCHEDULE II—Valuation and qualifying accounts
March 31, 2011, 2010 and 2009
Dollars in thousands
|
|
|
Additions
|
|
|
||||||||||||||||
|
Description
|
Balance at Beginning of Period
|
Charged to Costs and Expenses
|
Charged to Other Accounts
|
Deductions
|
Balance at End of Period
|
|||||||||||||||
|
|
|
|
|
|
|
|||||||||||||||
|
Year ended March 31, 2011:
|
|
|
|
|
|
|||||||||||||||
|
Deducted from asset accounts:
|
|
|
|
|
|
|||||||||||||||
|
Allowance for doubtful accounts
|
$ | 4,240 | $ | 627 | $ | - | $ | 1,701 | (1) | $ | 3,166 | |||||||||
|
Deferred tax asset valuation allowance
|
1,609 | 42,983 | 1,244 | - | 45,836 | |||||||||||||||
|
Total
|
$ | 5,849 | $ | 43,610 | $ | 1,244 | $ | 1,701 | $ | 49,002 | ||||||||||
|
Reserves on balance sheet:
|
||||||||||||||||||||
|
Accrued general and product liability costs
|
$ | 23,054 | $ | 6,447 | $ | - | $ | 8,925 | (2) | $ | 20,576 | |||||||||
|
|
||||||||||||||||||||
|
|
||||||||||||||||||||
|
Year ended March 31, 2010:
|
||||||||||||||||||||
|
Deducted from asset accounts:
|
||||||||||||||||||||
|
Allowance for doubtful accounts
|
$ | 5,338 | $ | 553 | $ | - | $ | 1,651 | (1) | $ | 4,240 | |||||||||
|
Deferred tax asset valuation allowance
|
1,594 | - | 15 | - | 1,609 | |||||||||||||||
|
Total
|
$ | 6,932 | $ | 553 | $ | 15 | $ | 1,651 | $ | 5,849 | ||||||||||
|
Reserves on balance sheet:
|
||||||||||||||||||||
|
Accrued general and product liability costs
|
$ | 23,242 | $ | 5,061 | $ | - | $ | 5,249 | (2) | $ | 23,054 | |||||||||
|
|
||||||||||||||||||||
|
Year ended March 31, 2009:
|
||||||||||||||||||||
|
Deducted from asset accounts:
|
||||||||||||||||||||
|
Allowance for doubtful accounts
|
$ | 3,583 | $ | 2,447 | $ | 370 | (3) | $ | 1,062 | (1) | $ | 5,338 | ||||||||
|
Deferred tax asset valuation allowance
|
1,064 | - | 530 | (3) | - | 1,594 | ||||||||||||||
|
Total
|
$ | 4,647 | $ | 2,447 | $ | 900 | $ | 1,062 | $ | 6,932 | ||||||||||
|
Reserves on balance sheet:
|
||||||||||||||||||||
|
Accrued general and product liability costs
|
$ | 20,771 | $ | 4,052 | $ | - | $ | 1,581 | (2) | $ | 23,242 | |||||||||
____________________
|
(1)
|
Uncollectible accounts written off, net of recoveries
|
|
(2)
|
Insurance claims and expenses paid
|
|
(3)
|
Reserves at date of acquisition of subsidiary
|
F-53
|
Item 9.
|
Changes in and Disagreements with Accountants on Accounting and Financial Disclosures
|
None.
|
Item 9A.
|
Controls and Procedures
|
Management’s Evaluation of Disclosure Controls and Procedures
As of March 31, 2011, an evaluation was performed under the supervision and with the participation of our management, including the Chief Executive Officer and Chief Financial Officer, of the effectiveness of the design and operation of our disclosure controls and procedures. Based on that evaluation, our management, including the Chief Executive Officer and Chief Financial Officer, concluded that our disclosure controls and procedures were effective as of March 31, 2011. There were no changes in our internal controls or in other factors during our fourth quarter ended March 31, 2011.
Management’s Report on Internal Control Over Financial Reporting
Our management is responsible for establishing and maintaining adequate internal control over financial reporting, as such term is defined in Exchange Act Rules 13a-15(f) and 15d-15(f). Under the supervision and with the participation of our management, including our Chief Executive Officer and Chief Financial Officer, we conducted an evaluation of the effectiveness of our internal control over financial reporting as of March 31, 2011 based on the framework in Internal Control--Integrated Framework issued by the Committee of Sponsoring Organizations of the Treadway Commission (COSO). Based on that evaluation, our management concluded that our internal control over financial reporting was effective as of March 31, 2011.
The effectiveness of the Company’s internal control over financial reporting as of March 31, 20111 has been audited by Ernst & Young LLP, an independent registered public accounting firm, as stated in their report which is included herein.
Our management, including the CEO and CFO, does not expect that our disclosure controls or our internal control over financial reporting will prevent or detect all error and all fraud. A control system, no matter how well designed and operated, can provide only reasonable, not absolute, assurance that the control system’s objectives will be met. The design of a control system must reflect the fact that there are resource constraints, and the benefits of controls must be considered relative to their costs. Further, because of the inherent limitations in all control systems, no evaluation of controls can provide absolute assurance that misstatements due to error or fraud will not occur or that all control issues and instances of fraud, if any, have been detected. These inherent limitations include the realities that judgments in decision-making can be faulty and that breakdowns can occur because of simple error or mistake. Controls can also be circumvented by the individual acts of some persons, by collusion of two or more people, or by management override of the controls. The design of any system of controls is based in part on certain assumptions about the likelihood of future events, and there can be no assurance that any design will succeed in achieving its stated goals under all potential future conditions. Projections of any evaluation of controls effectiveness to future periods are subject to risks. Over time, controls may become inadequate because of changes in conditions or deterioration in the degree of compliance with policies or procedures.
Changes in Internal Control over Financial Reporting
There have been no changes in internal control over financial reporting during the most recent fiscal quarter that have materially affected, or are reasonably likely to materially affect, our internal control over financial reporting.
35
Report of Ernst & Young LLP, Independent Registered Public Accounting Firm
The Board of Directors and Shareholders of Columbus McKinnon Corporation
We have audited Columbus McKinnon Corporation’s internal control over financial reporting as of March 31, 2011, based on criteria established in Internal Control—Integrated Framework issued by the Committee of Sponsoring Organizations of the Treadway Commission (the COSO criteria). Columbus McKinnon Corporation’s management is responsible for maintaining effective internal control over financial reporting, and for its assessment of the effectiveness of internal control over financial reporting included in the accompanying Management’s Report on Internal Control Over Financial Reporting. Our responsibility is to express an opinion on the company’s internal control over financial reporting based on our audit.
We conducted our audit in accordance with the standards of the Public Company Accounting Oversight Board (United States). Those standards require that we plan and perform the audit to obtain reasonable assurance about whether effective internal control over financial reporting was maintained in all material respects. Our audit included obtaining an understanding of internal control over financial reporting, assessing the risk that a material weakness exists, testing and evaluating the design and operating effectiveness of internal control based on the assessed risk, and performing such other procedures as we considered necessary in the circumstances. We believe that our audit provides a reasonable basis for our opinion.
A company’s internal control over financial reporting is a process designed to provide reasonable assurance regarding the reliability of financial reporting and the preparation of financial statements for external purposes in accordance with generally accepted accounting principles. A company’s internal control over financial reporting includes those policies and procedures that (1) pertain to the maintenance of records that, in reasonable detail, accurately and fairly reflect the transactions and dispositions of the assets of the company; (2) provide reasonable assurance that transactions are recorded as necessary to permit preparation of financial statements in accordance with generally accepted accounting principles, and that receipts and expenditures of the company are being made only in accordance with authorizations of management and directors of the company; and (3) provide reasonable assurance regarding prevention or timely detection of unauthorized acquisition, use or disposition of the company’s assets that could have a material effect on the financial statements.
Because of its inherent limitations, internal control over financial reporting may not prevent or detect misstatements. Also, projections of any evaluation of effectiveness to future periods are subject to the risk that controls may become inadequate because of changes in conditions or that the degree of compliance with the policies or procedures may deteriorate.
In our opinion, Columbus McKinnon Corporation maintained, in all material respects, effective internal control over financial reporting as of March 31, 2011, based on the COSO criteria.
We also have audited, in accordance with the standards of the Public Company Accounting Oversight Board (United States), the consolidated balance sheets of Columbus McKinnon Corporation as of March 31, 2011 and 2010, and the related consolidated statements of operations, shareholders’ equity, and cash flows for each of the three years in the period ended March 31, 2011, and our report dated May 27, 2011 expressed an unqualified opinion thereon.
/s/ Ernst & Young LLP
Buffalo, New York
May 27, 2011
36
|
Item 9B.
|
Other Information
|
None.
PART III
|
Item 10.
|
Directors and Executive Officers of the Registrant
|
The information regarding Directors and Executive Officers of the Registrant will be included in a Proxy Statement to be filed with the Commission prior to July 29, 2011 and upon the filing of such Proxy Statement, is incorporated by reference herein.
The charters of our Audit Committee, Compensation and Succession Committee, and Governance and Nomination Committee are available on our website at www.cmworks.com and are available to any shareholder upon request to the Corporate Secretary. The information on the Company's website is not incorporated by reference into this Annual Report on Form 10-K.
We have adopted a code of ethics that applies to all of our employees, including our principal executive officer, principal financial officer and principal accounting officer, as well as our directors. Our code of ethics, the Columbus McKinnon Corporation Legal Compliance & Business Ethics Manual, is available on our website at www.cmworks.com. We intend to disclose any amendment to, or waiver from, the code of ethics that applies to our principal executive officer, principal financial officer or principal accounting officer otherwise required to be disclosed under Item 10 of Form 8-K by posting such amendment or waiver, as applicable, on our website.
|
Item 11.
|
Executive Compensation
|
The information regarding Executive Compensation will be included in a Proxy Statement to be filed with the Commission prior to July 29, 2011 and upon the filing of such Proxy Statement, is incorporated by reference herein.
|
Item 12.
|
Security Ownership of Certain Beneficial Owners and Management
|
The information regarding Security Ownership of Certain Beneficial Owners and Management and regarding equity compensation plan incorporation will be included in a Proxy Statement to be filed with the Commission prior to July 29, 2011 and upon the filing of such Proxy Statement, is incorporated by reference herein.
|
Item 13.
|
Certain Relationships and Related Transactions
|
The information regarding Certain Relationships and Related Transactions will be included in a Proxy Statement to be filed with the Commission prior to July 29, 2011 and upon the filing of such Proxy Statement, is incorporated by reference herein.
|
Item 14.
|
Principal Accountant Fees and Services
|
The information regarding Principal Accountant Fees and Services will be included in a Proxy Statement to be filed with the Commission prior to July 29, 2011 and upon the filing of such Proxy Statement, is incorporated by reference herein.
37
PART IV
|
Item 15.
|
Exhibits and Financial Statement Schedules
|
|
(1)
|
Financial Statements:
|
||
|
The following consolidated financial statements of Columbus McKinnon Corporation are included in Item 8:
|
|||
| Reference |
Page No.
|
||
|
Report of Ernst & Young LLP, Independent Registered Public Accounting Firm
|
F-2
|
||
|
Consolidated balance sheets - March 31, 2011 and 2010
|
F-3
|
||
|
Consolidated statements of operations – Years ended March 31, 2011, 2010, and 2009
|
F-4
|
||
|
Consolidated statements of shareholders’ equity – Years ended March 31, 2011, 2010, and 2009
|
F-5
|
||
|
Consolidated statements of cash flows – Years ended March 31, 2011, 2010 , and 2009
|
F-6
|
||
|
Notes to consolidated financial statements
|
F-7 to F-52
|
||
|
(2)
|
Financial Statement Schedule:
|
Page No.
|
|
|
Schedule II - Valuation and qualifying accounts
|
F-53
|
||
|
All other schedules for which provision is made in the applicable accounting regulation of the Securities and Exchange Commission are not required under the related instructions or are inapplicable and therefore have been omitted.
|
|||
38
|
(3)
|
Exhibits:
|
|
Exhibit
Number
|
Exhibit
|
|
|
3.1
|
Restated Certificate of Incorporation of the Registrant (incorporated by reference to Exhibit 3.1 to the Company’s Registration Statement No. 33-80687 on Form S-1 dated December 21, 1995).
|
|
|
3.2
|
Amended By-Laws of the Registrant (incorporated by reference to Exhibit 3. to the Company’s Current Report on Form 8-K dated May 17, 1999).
|
|
|
3.3
|
Certificate of Amendment to the Certificate of Incorporation of Columbus McKinnon Corporation, dated as of May 18, 2009 (incorporated by reference to Exhibit 3.1 to the Company’s Current Report on Form 8-K dated May 18, 2009).
|
|
|
4.1
|
Specimen common share certificate (incorporated by reference to Exhibit 4.1 to the Company’s Registration Statement No. 33-80687 on Form S-1 dated December 21, 1995.)
|
|
|
4.2
|
Indenture among Columbus McKinnon Corporation, Audubon Europe S.a.r.l., Crane Equipment & Service, Inc., Yale Industrial Products, Inc. and U.S. Bank National Association., as trustee, dated as of September 2, 2005 (incorporated by reference to Exhibit 4.5 to the Company’s Registration Statement No. 33-129142 on Form S-3 dated October 19, 2005).
|
|
|
4.3
|
Rights Agreement, dated as of May 18, 2009, between Columbus McKinnon Corporation and American Stock Transfer & Trust Company, LLC, which includes the form of Right Certificate as Exhibit B and the Summary of Rights to Purchase Preferred Stock as Exhibit C (incorporated by reference to Exhibit 4.1 to the Company’s Current Report on Form 8-K dated May 18, 2009).
|
|
|
#10.1
|
Agreement by and among Columbus McKinnon Corporation Employee Stock Ownership Trust, Columbus McKinnon Corporation and Marine Midland Bank, dated November 2, 1995 (incorporated by reference to Exhibit 10.6 to the Company’s Registration Statement No. 33-80687 on Form S-1 dated December 21, 1995).
|
|
|
#10.2
|
Columbus McKinnon Corporation Employee Stock Ownership Plan Restatement Effective April 1, 1989 (incorporated by reference to Exhibit 10.23 to the Company’s Registration Statement No. 33-80687 on Form S-1 dated December 21, 1995).
|
|
|
#10.3
|
Amendment No. 1 to the Columbus McKinnon Corporation Employee Stock Ownership Plan as Amended and Restated as of April 1, 1989, dated March 2, 1995 (incorporated by reference to Exhibit 10.24 to the Company’s Registration Statement No. 33-80687 on Form S-1 dated December 21, 1995).
|
|
|
#10.4
|
Amendment No. 2 to the Columbus McKinnon Corporation Employee Stock Ownership Plan, dated October 17, 1995 (incorporated by reference to Exhibit 10.38 to the Company’s Annual Report on Form 10-K for the fiscal year ended March 31, 1997).
|
|
|
#10.5
|
Amendment No. 3 to the Columbus McKinnon Corporation Employee Stock Ownership Plan, dated March 27, 1996 (incorporated by reference to Exhibit 10.39 to the Company’s Annual Report on Form 10-K for the fiscal year ended March 31, 1997).
|
|
|
#10.6
|
Amendment No. 4 of the Columbus McKinnon Corporation Employee Stock Ownership Plan as Amended and Restated as of April 1, 1989, dated September 30, 1996 (incorporated by reference to Exhibit 10.1 to the Company’s Quarterly Report on Form 10-Q for the quarterly period ended September 30, 1996).
|
|
|
#10.7
|
Amendment No. 5 to the Columbus McKinnon Corporation Employee Stock Ownership Plan as Amended and Restated as of April 1, 1989, dated August 28, 1997 (incorporated by reference to Exhibit 10.37 to the Company’s Annual Report on Form 10-K for the fiscal year ended March 31, 1998).
|
39
|
#10.8
|
Amendment No. 6 to the Columbus McKinnon Corporation Employee Stock Ownership Plan as Amended and Restated as of April 1, 1989, dated June 24, 1998 (incorporated by reference to Exhibit 10.38 to the Company’s Annual Report on Form 10-K for the fiscal year ended March 31, 1998).
|
|
|
#10.9
|
Amendment No. 7 to the Columbus McKinnon Corporation Employee Stock Ownership Plan as Amended and Restated as of April 1, 1989, dated April 30, 2000 (incorporated by reference to Exhibit 10.24 to the Company’s Annual Report on Form 10-K for the fiscal year ended March 31, 2000).
|
|
|
#10.10
|
Amendment No. 8 to the Columbus McKinnon Corporation Employee Stock Ownership Plan as Amended and Restated as of April 1, 1989, dated March 26, 2002 (incorporated by reference to Exhibit 10.30 to the Company’s Annual Report on Form 10-K for the fiscal year ended March 31, 2002).
|
|
|
#10.11
|
Amendment No. 9 to the Columbus McKinnon Corporation Employee Stock Ownership Plan as Amended and Restated as of April 1, 1989, dated March 27, 2003 (incorporated by reference to Exhibit 10.32 to the Company’s Annual Report on Form 10-K for the fiscal year ended March 31, 2003).
|
|
|
#10.12
|
Amendment No. 10 to the Columbus McKinnon Corporation Employee Stock Ownership Plan as Amended and Restated as of April 1, 1989, dated February 28, 2004 (incorporated by reference to Exhibit 10.12 to the Company’s Annual Report on Form 10-K for the fiscal year ended March 31, 2004).
|
|
|
#10.13
|
Amendment No. 11 to the Columbus McKinnon Corporation Employee Stock Ownership Plan as Amended and Restated as of April 1, 1989, dated December 19, 2003 (incorporated by reference to Exhibit 10.2 to the Company’s Quarterly Report on Form 10-Q for the quarterly period ended December 28, 2003).
|
|
|
#10.14
|
Amendment No. 12 to the Columbus McKinnon Corporation Employee Stock Ownership Plan as Amended and Restated as of April 1, 1989, dated March 17, 2005 (incorporated by reference to Exhibit 10.14 to the Company’s Annual Report on Form 10-K for the fiscal year ended March 31, 2005).
|
|
|
#10.15
|
Amendment No. 13 to the Columbus McKinnon Corporation Employee Stock Ownership Plan as Amended and Restated as of April 1, 1989, dated December 19, 2008 (incorporated by reference to Exhibit 10.1 to the Company’s Quarterly Report on Form 10-Q for the quarterly period ended December 28, 2008).
|
|
|
#10.16
|
Columbus McKinnon Corporation Personal Retirement Account Plan Trust Agreement, dated April 1, 1987 (incorporated by reference to Exhibit 10.25 to the Company’s Registration Statement No. 33-80687 on Form S-1 dated December 21, 1995).
|
|
|
#10.17
|
Amendment No. 1 to the Columbus McKinnon Corporation Employee Stock Ownership Trust Agreement (formerly known as the Columbus McKinnon Corporation Personal Retirement Account Plan Trust Agreement) effective November 1, 1988 (incorporated by reference to Exhibit 10.26 to the Company’s Registration Statement No. 33-80687 on Form S-1 dated December 21, 1995).
|
|
|
#10.18
|
Amendment and Restatement of Columbus McKinnon Corporation 1995 Incentive Stock Option Plan (incorporated by reference to Exhibit 10.25 to the Company’s Annual Report on Form 10-K for the fiscal year ended March 31, 1999).
|
|
|
#10.19
|
Second Amendment to the Columbus McKinnon Corporation 1995 Incentive Stock Option Plan, as amended and restated (incorporated by reference to Exhibit 10.2 to the Company’s Quarterly Report on Form 10-Q for the quarterly period ended September 29, 2002).
|
|
|
#10.20
|
Columbus McKinnon Corporation Restricted Stock Plan, as amended and restated (incorporated by reference to Exhibit 10.28 to the Company’s Registration Statement No. 33-80687 on Form S-1 dated December 21, 1995).
|
|
|
#10.21
|
Second Amendment to the Columbus McKinnon Corporation Restricted Stock Plan (incorporated by reference to Exhibit 10.3 to the Company’s Quarterly Report on Form 10-Q for the quarterly period ended September 29, 2002).
|
40
|
#10.22
|
Amendment and Restatement of Columbus McKinnon Corporation Non-Qualified Stock Option Plan (incorporated by reference to Exhibit 10.27 to the Company’s Annual Report on Form 10-K for the fiscal year ended March 31, 1999).
|
|
|
#10.23
|
Columbus McKinnon Corporation Thrift [401(k)] Plan 1989 Restatement Effective January 1, 1998 (incorporated by reference to Exhibit 10.2 to the Company’s Quarterly Report on Form 10-Q for the quarterly period ended December 27, 1998).
|
|
|
#10.24
|
Amendment No. 1 to the 1998 Plan Restatement of the Columbus McKinnon Corporation Thrift [401(k)] Plan, dated December 10, 1998 (incorporated by reference to Exhibit 10.29 to the Company’s Annual Report on Form 10-K for the fiscal year ended March 31, 1999).
|
|
|
#10.25
|
Amendment No. 2 to the 1998 Plan Restatement of the Columbus McKinnon Corporation Thrift [401 (k)] Plan, dated June 1, 2000 (incorporated by reference to Exhibit 10.33 to the Company’s Annual Report on Form 10-K for the fiscal year ended March 31, 2000).
|
|
|
#10.26
|
Amendment No. 3 to the 1998 Plan Restatement of the Columbus McKinnon Corporation Thrift [401 (k)] Plan, dated March 26, 2002 (incorporated by reference to Exhibit 10.39 to the Company’s Annual Report on Form 10-K for the fiscal year ended March 31, 2002).
|
|
|
#10.27
|
Amendment No. 4 to the 1998 Plan Restatement of the Columbus McKinnon Corporation Thrift [401(k)] Plan, dated May 10, 2002 (incorporated by reference to Exhibit 10.4 to the Company’s Quarterly Report on Form 10-Q for the quarterly period ended September 29, 2002).
|
|
|
#10.28
|
Amendment No. 5 to the 1998 Plan Restatement of the Columbus McKinnon Corporation Thrift [401(k)] Plan, dated December 20, 2002 (incorporated by reference to Exhibit 10.1 to the Company’s Quarterly Report on Form 10-Q for the quarterly period ended December 29, 2002).
|
|
|
#10.29
|
Amendment No. 6 to the 1998 Plan Restatement of the Columbus McKinnon Corporation Thrift [401(k)] Plan, dated May 22, 2003 (incorporated by reference to Exhibit 10.46 to the Company’s Annual Report on Form 10-K for the fiscal year ended March 31, 2003).
|
|
|
#10.30
|
Amendment No. 7 to the 1998 Plan Restatement of the Columbus McKinnon Corporation Thrift [401(k)] Plan, dated April 14, 2004 (incorporated by reference to Exhibit 10.28 to the Company’s Annual Report on Form 10-K for the fiscal year ended March 31, 2004).
|
|
|
#10.31
|
Amendment No. 8 to the 1998 Plan Restatement of the Columbus McKinnon Corporation Thrift [401(k)] Plan, dated December 19, 2003 (incorporated by reference to Exhibit 10.3 to the Company’s Quarterly Report on Form 10-Q for the quarterly period ended December 28, 2003).
|
|
|
#10.32
|
Amendment No. 9 to the 1998 Plan Restatement of the Columbus McKinnon Corporation Thrift [401(k)] Plan, dated March 16, 2004 (incorporated by reference to Exhibit 10.30 to the Company’s Annual Report on Form 10-K for the fiscal year ended March 31, 2004).
|
|
|
#10.33
|
Amendment No. 10 to the 1998 Plan Restatement of the Columbus McKinnon Corporation Thrift [401(k)] Plan, dated July 12, 2004 (incorporated by reference to Exhibit 10.3 to the Company’s Quarterly Report on Form 10-Q for the quarterly period ended July 4, 2004).
|
|
|
#10.34
|
Amendment No. 11 to the 1998 Plan Restatement of the Columbus McKinnon Corporation Thrift [401(k)] Plan, dated March 31, 2005 (incorporated by reference to Exhibit 10.33 to the Company’s Annual Report on Form 10-K for the fiscal year ended March 31, 2005).
|
|
|
#10.35
|
Amendment No. 12 to the 1998 Plan Restatement of the Columbus McKinnon Corporation Thrift [401(k)] Plan, dated December 27, 2005 (incorporated by reference to Exhibit 10.34 to the Company’s Annual Report on Form 10-K for the fiscal year ended March 31, 2006).
|
41
|
#10.36
|
Amendment No. 13 to the 1998 Plan Restatement of the Columbus McKinnon Corporation Thrift [401(k)] Plan, dated December 21, 2006 (incorporated by reference to Exhibit 10.35 to the Company’s Annual Report on Form 10-K for the fiscal year ended March, 31, 2007).
|
|
|
#10.37
|
Amendment No. 14 to the 1998 Plan Restatement of the Columbus McKinnon Corporation Thrift [401(k)] Plan, dated December 21, 2007 (incorporated by reference to Exhibit 10.36 to the Company’s Annual Report on Form 10-K for the fiscal year ended March 31, 2008).
|
|
|
#10.38
|
Amendment No. 15 to the 1998 Plan Restatement of the Columbus McKinnon Corporation Thrift [401(k)] Plan, dated January 29, 2009 (incorporated by reference to Exhibit 10.4 to the Company’s Quarterly Report on Form 10-Q for the quarterly period ended December 28, 2008).
|
|
|
#10.39
|
Columbus McKinnon Corporation Thrift 401(k) Plan Trust Agreement Restatement Effective August 9, 1994 (incorporated by reference to Exhibit 10.32 to the Company’s Registration Statement No. 33-80687 on Form S-1 dated December 21, 1995).
|
|
|
#10.40
|
Sale of $136 million 8 7/8% Notes due 2013 as filed on Form S-4 on December 21, 2005.
|
|
|
#10.41
|
Columbus McKinnon Corporation Monthly Retirement Benefit Plan Restatement Effective April 1, 1998 (incorporated by reference to Exhibit 10.1 to the Company’s Quarterly Report on Form 10-Q for the quarterly period ended December 27, 1998).
|
|
|
#10.42
|
Amendment No. 1 to the 1998 Plan Restatement of the Columbus McKinnon Corporation Monthly Retirement Benefit Plan, dated December 10, 1998 (incorporated by reference to Exhibit 10.32 to the Company’s Annual Report on Form 10-K for the fiscal year ended March 31, 1999).
|
|
|
#10.43
|
Amendment No. 2 to the 1998 Plan Restatement of the Columbus McKinnon Corporation Monthly Retirement Benefit Plan, dated May 26, 1999 (incorporated by reference to Exhibit 10.33 to the Company’s Annual Report on Form 10-K for the fiscal year ended March 31, 1999).
|
|
|
#10.44
|
Amendment No. 3 to the 1998 Plan Restatement of the Columbus McKinnon Corporation Monthly Retirement Benefit Plan, dated March 26, 2002 (incorporated by reference to Exhibit 10.44 to the Company’s Annual Report on Form 10-K for the fiscal year ended March 31, 2002).
|
|
|
#10.45
|
Amendment No. 4 to the 1998 Plan Restatement of the Columbus McKinnon Corporation Monthly Retirement Benefit Plan, dated December 20, 2002 (incorporated by reference to Exhibit 10.1 to the Company’s Quarterly Report on Form 10-Q for the quarterly period ended December 29, 2002).
|
|
|
#10.46
|
Amendment No. 5 to the 1998 Plan Restatement of the Columbus McKinnon Corporation Monthly Retirement Benefit Plan, dated February 28, 2004 (incorporated by reference to Exhibit 10.37 to the Company’s Annual Report on Form 10-K for the fiscal year ended March 31, 2004).
|
|
|
#10.47
|
Amendment No. 6 to the 1998 Plan Restatement of the Columbus McKinnon Corporation Monthly Retirement Benefit Plan, dated March 17, 2005 (incorporated by reference to Exhibit 10.41 to the Company’s Annual Report on Form 10-K for the fiscal year ended March 31, 2005).
|
|
|
#10.48
|
10.73
|
Amendment No. 7 to the 1998 Plan Restatement of the Columbus McKinnon Corporation Monthly Retirement Benefit Plan, dated December 28, 2005 (incorporated by reference to Exhibit 10.43 to the Company’s Annual Report on Form 10-K for the fiscal year ended March 31, 2006).
|
|
#10.49
|
Amendment No. 8 to the 1998 Plan Restatement of the Columbus McKinnon Corporation Monthly Retirement Benefit Plan, dated December 28, 2005 (incorporated by reference to Exhibit 10.1 to the Company’s Quarterly Report on Form 10-Q for the quarterly period ended December 31, 2006).
|
|
|
#10.50
|
Amendment No. 9 to the 1998 Plan Restatement of the Columbus McKinnon Corporation Monthly Retirement Benefit Plan, dated April 21, 2008 (incorporated by reference to Exhibit 10.47 to the Company’s Annual Report on Form 10-K for the fiscal year ended March 31, 2008).
|
42
|
#10.51
|
Amendment No. 10 to the 1998 Plan Restatement of the Columbus McKinnon Corporation Monthly Retirement Benefit Plan, dated December 19, 2008 (incorporated by reference to Exhibit 10.2 to the Company’s Quarterly Report on Form 10-Q for the quarterly period ended December 28, 2008).
|
|
|
#10.52
|
Columbus McKinnon Corporation Monthly Retirement Benefit Plan Trust Agreement Effective as of April 1, 1987 (incorporated by reference to Exhibit 10.34 to the Company’s Registration Statement No. 33-80687 on Form S-1 dated December 21, 1995).
|
|
|
#10.53
|
Employment agreement with Wolfgang Wegener dated December 31, 1996 (incorporated by reference to Exhibit 10.48 to the Company’s Annual Report on Form 10-K for the fiscal year ended March, 31, 2007).
|
|
|
#10.54
|
Columbus McKinnon Corporation 2006 Long Term Incentive Plan (incorporated by reference to Appendix A to the definitive Proxy Statement for the Annual Meeting of Stockholders of Columbus McKinnon Corporation held on July 31, 2006).
|
|
|
#10.55
|
Amendment No. 1 to the Columbus McKinnon Corporation 2006 Long Term Incentive Plan, dated December 30, 2008 (incorporated by reference to Exhibit 10.3 to the Company’s Quarterly Report on Form 10-Q for the quarterly period ended December 28, 2008).
|
|
|
#10.56
|
Form of Change in Control Agreement as entered into between Columbus McKinnon Corporation and each of Timothy T. Tevens, Karen L. Howard, Joseph J. Owen, Richard A. Steinberg, Timothy R. Harvey, Gene Buer, and Chuck Giesige.
|
|
|
#10.57
|
Form of Omnibus Code Section 409A Compliance Policy as entered into between Columbus McKinnon Corporation and each of Timothy T. Tevens, Karen L. Howard, Joseph J. Owen, Richard A. Steinberg, Timothy R. Harvey, Gene Buer, and Chuck Giesige.
|
|
|
# 10.58
|
Fourth amended and restated credit agreement dated as of December 31, 2009 (incorporated by reference to exhibit 10.1 to the Company’s Current Report on Form 8-K filed on January 14, 2010)
|
|
|
#10.59
|
2010 Long Term Incentive Plan effective July 26, 2010 (incorporated by reference to Exhibit 4.1 of the Company’s S-8 filed on August 12, 2010.
|
|
|
#10.60
|
First Amendment to the Company’s Fourth Amended and Restated Credit Agreement dated December 31, 2009. (incorporated by reference to Exhibit 10.1 of the Company’s Current Report on Form 8-K filed on August 26, 2010)
|
|
|
#10.61
|
Second Amendment to the Company’s Fourth Amended and Restated Credit Agreement dated December 31, 2009. (incorporated by reference to Exhibit 10.1 of the Company’s Current Report on Form 8-K filed on December 22, 2010)
|
|
|
#10.62
|
Indenture related to the Company’s 7.875% Senior Subordinated Notes due 2019 (incorporated by reference to exhibit 4.1 to the Company’s Current Report on Form 8-K filed on January 28, 2011)
|
|
|
#10.63
|
Registration Rights Agreement related to the Company’s 7.875% Senior Subordinated Notes due 2019 (incorporated by reference to exhibit 4.2 to the Company’s Current Report on Form 8-K filed on January 28, 2011)
|
|
|
#10.64
|
Supplemental Indenture related to the Company’s subsidiary guarantors as defined in the Indenture agreement related to the Company’s 7.875% Senior Subordinated Notes due 2019 (incorporated by reference to exhibit 4.3 to the Company’s Current Report on Form 8-K filed on January 28, 2011)
|
|
|
Subsidiaries of the Registrant.
|
||
|
Consent of Independent Registered Public Accounting Firm.
|
||
|
Certification of the principal executive officer pursuant to Rule 13a-14(a) of the Securities Exchange Act of 1934, as amended.
|
||
|
Certification of the principal financial officer pursuant to Rule 13a-14(a) of the Securities Exchange Act of 1934, as amended.
|
||
|
Certification of the principal executive officer and the principal financial officer pursuant to Rule 13a-14(b) of the Securities Exchange Act of 1934, as amended and 18 U.S.C. Section 1350, as adopted by pursuant to Section 906 of the Sarbanes-Oxley Act of 2002. The information contained in this exhibit shall not be deemed filed with the Securities and Exchange Commission nor incorporated by reference in any registration statement foiled by the Registrant under the Securities Act of 1933, as amended.
|
_________________
|
*
|
Filed herewith
|
|
#
|
Indicates a Management contract or compensation plan or arrangement
|
43
SIGNATURES
Pursuant to the requirements of Section 13 or 15(d) of the Securities Exchange Act of 1934, the registrant has duly caused this report to be signed on its behalf by the undersigned, thereunto duly authorized.
Date: May 27, 2011
|
COLUMBUS McKINNON CORPORATION
|
||
|
By:
|
/s/ Timothy T. Tevens
|
|
|
Timothy T. Tevens
|
||
|
President and Chief Executive Officer
|
||
Pursuant to the requirements of the Securities Exchange Act of 1934, this report has been signed below by the following persons on behalf of the registrant and in the capacities and on the dates indicated.
|
Signature
|
Title
|
Date
|
||
|
/s/ Timothy T. Tevens
|
President, Chief Executive Officer and Director
|
May 27, 2011
|
||
|
Timothy T. Tevens
|
(Principal Executive Officer)
|
|||
|
/s/ Karen L. Howard
|
Vice President – Finance and Chief Financial Officer
|
May 27, 2011
|
||
|
Karen L. Howard
|
(Principal Financial Officer and Principal Accounting Officer)
|
|||
|
/s/ Ernest R. Verebelyi
|
Chairman of the Board of Directors
|
May 27, 2011
|
||
|
Ernest R. Verebelyi
|
||||
|
/s/ Richard H. Fleming
|
Director
|
May 27, 2011
|
||
|
Richard H. Fleming
|
||||
|
/s/ Nicholas T. Pinchuk
|
Director
|
May 27, 2011
|
||
|
Nicholas T. Pinchuk
|
||||
|
/s/ Wallace W. Creek
|
Director
|
May 27, 2011
|
||
|
Wallace W. Creek
|
||||
|
/s/ Linda A. Goodspeed
|
Director
|
May 27, 2011
|
||
|
Linda A. Goodspeed
|
||||
|
/s/ Stephen Rabinowitz
|
Director
|
May 27, 2011
|
||
|
Stephen Rabinowitz
|
||||
|
/s/ Christian B. Ragot
|
Director
|
May 27, 2011
|
||
|
Christian B. Ragot
|
||||
|
/s/ Liam Mccarthy
|
Director
|
May 27, 2011
|
||
|
Liam McCarthy
|
44