Attached files
| file | filename |
|---|---|
| 8-K - 8-K - WESTMORELAND COAL Co | d676999d8k.htm |
December 2018 Discussion Materials Exhibit 99.1
Disclaimer This presentation contains statements about future events and expectations, which are "forward-looking statements." Any statement in this presentation that is not a statement of historical fact, including, but not limited to earnings guidance, estimates, forecasts, projections of financial results, expected future financial position, and business strategy, is a forward-looking statement. Such forward-looking statements and any other forward-looking statements made herein involve known and unknown risks, uncertainties and other factors, which may cause actual results of Westmoreland Coal Company and its subsidiaries, collectively, “Westmoreland” or the “Company”, to be materially different from any future results, performance or achievements expressed or implied by such forward-looking statements. Certain factors that could cause actual results to differ are discussed in our periodic filings with the Securities and Exchange Commission. No representation or warranty, express or implied, is made as to the accuracy or completeness of such information. Such forward-looking statements are inherently uncertain, and actual results may differ from expectations and past performance. Westmoreland assumes no responsibility to issue updates to any materials, including forward-looking statements, discussed in this presentation. This presentation contains certain financial measures that are not prepared in accordance with GAAP. These non-GAAP measures are not based on any standardized methodology prescribed by GAAP and are not necessarily comparable to similar measures presented by other companies and should not be considered in isolation or as a substitute for GAAP measures. This presentation shall not constitute an offer, nor a solicitation of an offer, of the sale or purchase of securities, nor shall any securities of Westmoreland be offered or sold in any jurisdiction in which such an offer, solicitation or sale would be unlawful. The information contained in this presentation has been provided by the Company without any representation or warranty as to the accuracy or completeness of such information. The Company assumes no responsibility for the accuracy of the information, assumptions, projections, forecasts or the completeness of this presentation and has no obligation to update any statements in this presentation. This presentation does not represent a fairness opinion, recommendation, valuation or opinion of any kind, and is necessarily incomplete and should be viewed solely in conjunction with the oral presentation provided by the Company and its advisors. Recipients of this presentation should not construe the contents of this presentation as legal, tax, or financial advice. Each recipient should consult its professional advisors as to the legal, tax, financial or other matters set forth in this presentation and, by accepting this presentation, the recipient confirms that it is not relying upon the information contained herein to make any decision. Under no circumstances and at no time should any recipient infer or consider that the potential transaction has occurred, or will occur, unless and until a definitive agreement with Westmoreland has been fully executed.
Table of Contents Important Note: Holders and potential holders of the Company’s indebtedness have the ability to access more detailed financial projections and performance optimization information in a virtual data room. Such information will specifically be designated “Non-Cleansing Information” and will be accessible only to those persons who (a) represent that they are holders of the Company’s indebtedness or considering the purchase of the Company’s indebtedness in the ordinary course of their business, (b) subject to certain permitted disclosures, agree to maintain the confidentiality of the “Non-Cleansing Information,” and (c) agree to use the “Non-Cleansing Information” solely for purposes of trading or potential trading in the Company’s indebtedness and for no other competitive purposes. To request access to such data room, please contact WCCNonCleansingInfoVDR@kirkland.com.

Section 1 Financial Projections
Approach and Key Assumptions Life of Mine (“LoM”) Business Plan Process and Approach: Westmoreland LoM business plan forecast incorporates the following: 2018 is a monthly, site by site forecast based on the Company’s 9+3 2018 forecast 2019-2065 forecasts are based on the LoM forecasts Overview: Westmoreland continues to seek extensions of key contracts and is continuing to support existing joint venture arrangements The business plan contemplates the prudent investment of capital in mine operations required to facilitate the supply of coal to fulfill contracts on a safe, cost effective and efficient basis. Mines nearing the end of their expected life are operated in a capital efficient manner in order to maximize cash flows Westmoreland will continue to develop export business by firming up volume and pricing in order to maximize returns and effectively manage pricing risk (longer-term considerations underway) Westmoreland will continue to enhance the business by seeking new customers and contract mining and reclamation opportunities that can result in economic benefit Management will continue to “right size” support functions in response to changes in the business
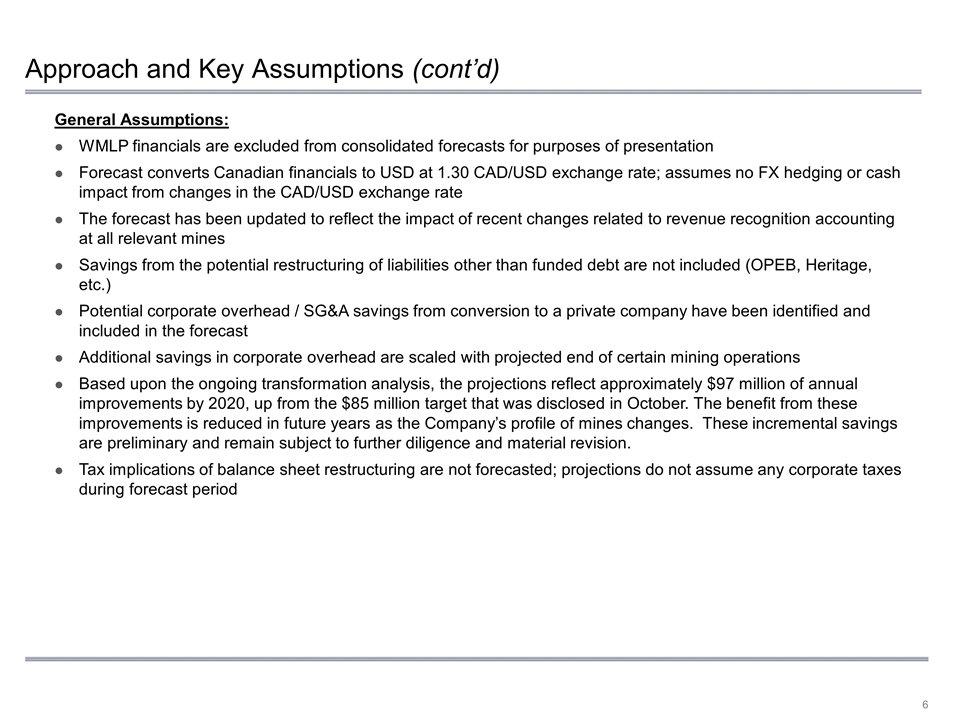
Approach and Key Assumptions (cont’d) General Assumptions: WMLP financials are excluded from consolidated forecasts for purposes of presentation Forecast converts Canadian financials to USD at 1.30 CAD/USD exchange rate; assumes no FX hedging or cash impact from changes in the CAD/USD exchange rate The forecast has been updated to reflect the impact of recent changes related to revenue recognition accounting at all relevant mines Savings from the potential restructuring of liabilities other than funded debt are not included (OPEB, Heritage, etc.) Potential corporate overhead / SG&A savings from conversion to a private company have been identified and included in the forecast Additional savings in corporate overhead are scaled with projected end of certain mining operations Based upon the ongoing transformation analysis, the projections reflect approximately $97 million of annual improvements by 2020, up from the $85 million target that was disclosed in October. The benefit from these improvements is reduced in future years as the Company’s profile of mines changes. These incremental savings are preliminary and remain subject to further diligence and material revision. Tax implications of balance sheet restructuring are not forecasted; projections do not assume any corporate taxes during forecast period
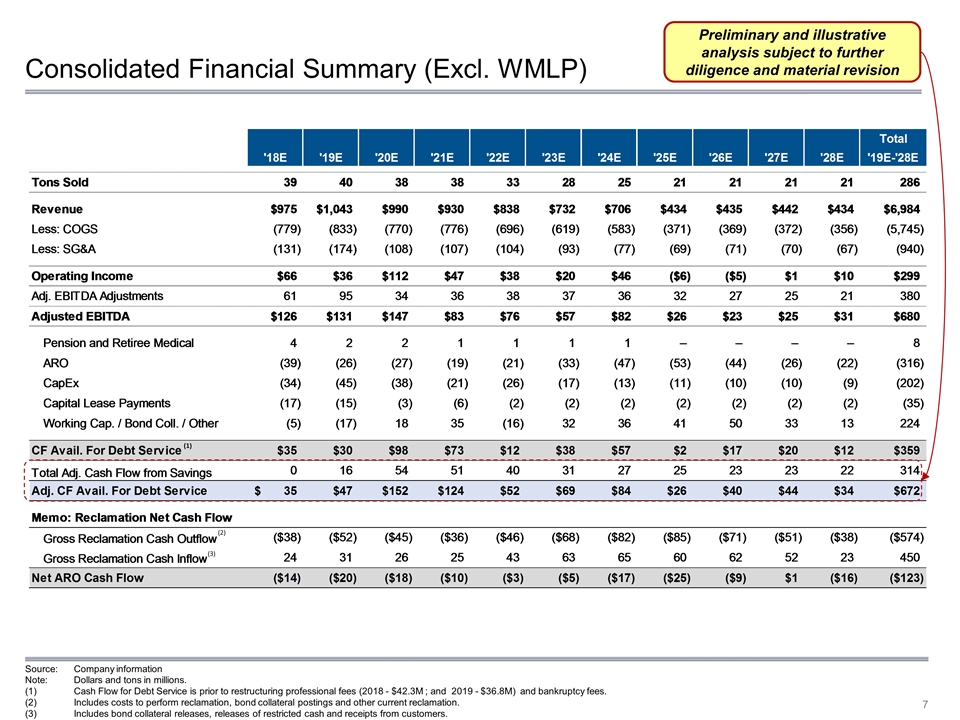
(3) Consolidated Financial Summary (Excl. WMLP) Source:Company information Note: Dollars and tons in millions. Cash Flow for Debt Service is prior to restructuring professional fees (2018 - $42.3M ; and 2019 - $36.8M) and bankruptcy fees. Includes costs to perform reclamation, bond collateral postings and other current reclamation. Includes bond collateral releases, releases of restricted cash and receipts from customers. Preliminary and illustrative analysis subject to further diligence and material revision (1) (2) (3)
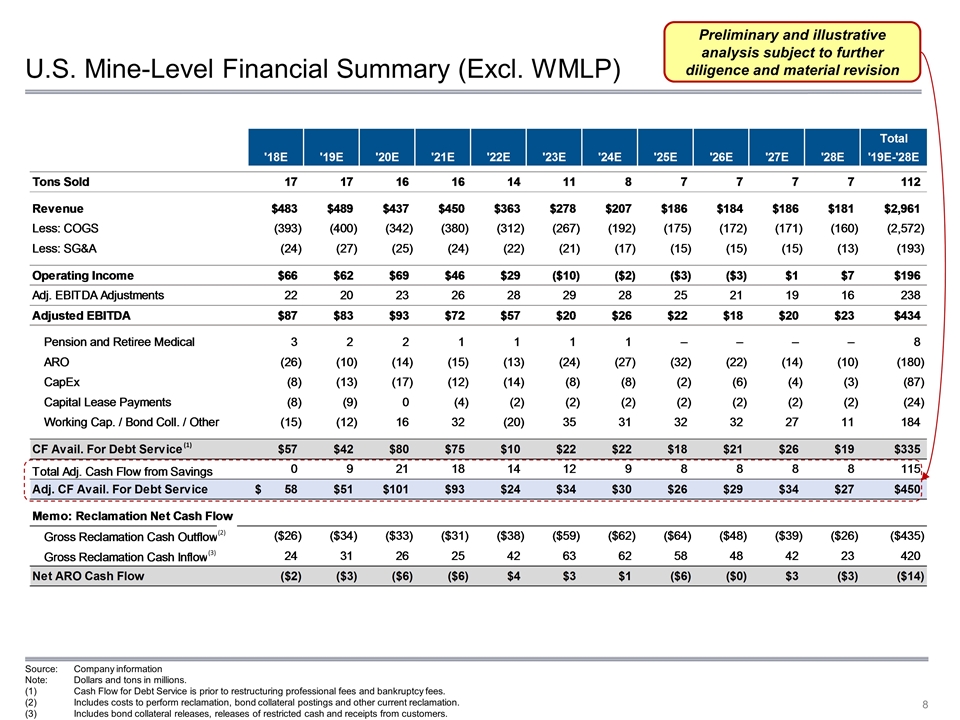
U.S. Mine-Level Financial Summary (Excl. WMLP) Preliminary and illustrative analysis subject to further diligence and material revision (1) (2) (3) Source:Company information Note: Dollars and tons in millions. Cash Flow for Debt Service is prior to restructuring professional fees and bankruptcy fees. Includes costs to perform reclamation, bond collateral postings and other current reclamation. Includes bond collateral releases, releases of restricted cash and receipts from customers.
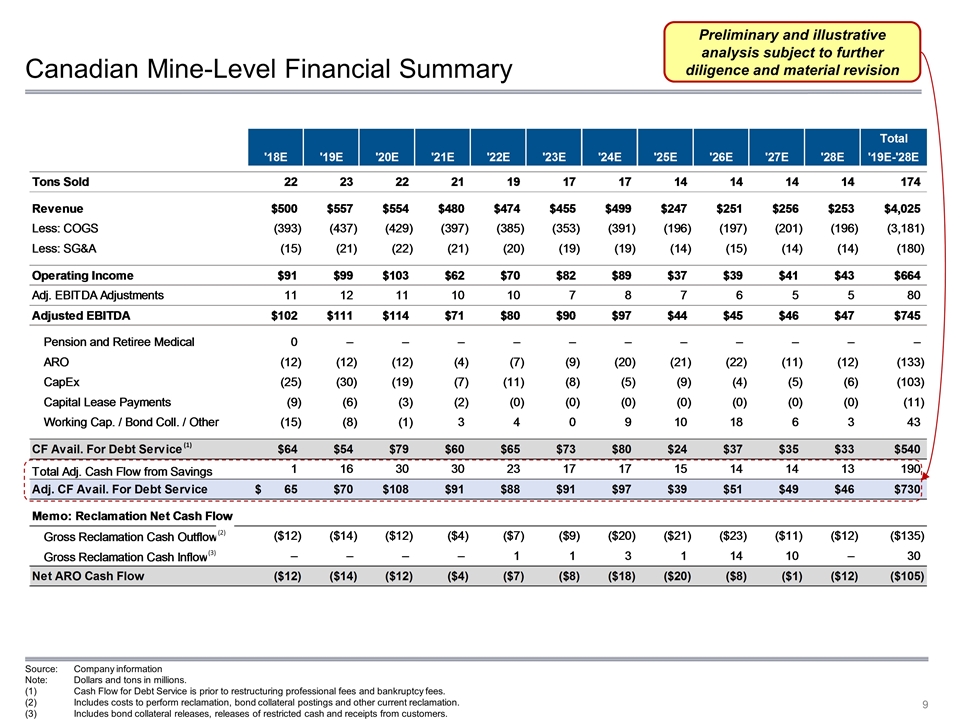
Canadian Mine-Level Financial Summary Preliminary and illustrative analysis subject to further diligence and material revision (1) (2) (3) Source:Company information Note: Dollars and tons in millions. Cash Flow for Debt Service is prior to restructuring professional fees and bankruptcy fees. Includes costs to perform reclamation, bond collateral postings and other current reclamation. Includes bond collateral releases, releases of restricted cash and receipts from customers.
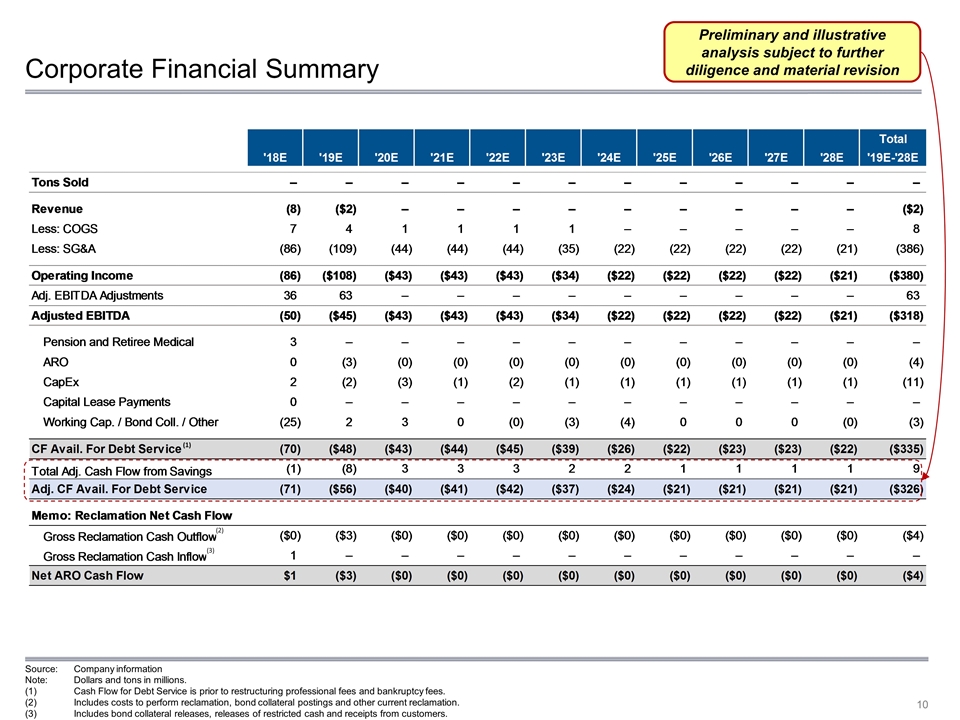
Corporate Financial Summary Preliminary and illustrative analysis subject to further diligence and material revision (1) (2) (3) Source:Company information Note: Dollars and tons in millions. Cash Flow for Debt Service is prior to restructuring professional fees and bankruptcy fees. Includes costs to perform reclamation, bond collateral postings and other current reclamation. Includes bond collateral releases, releases of restricted cash and receipts from customers.
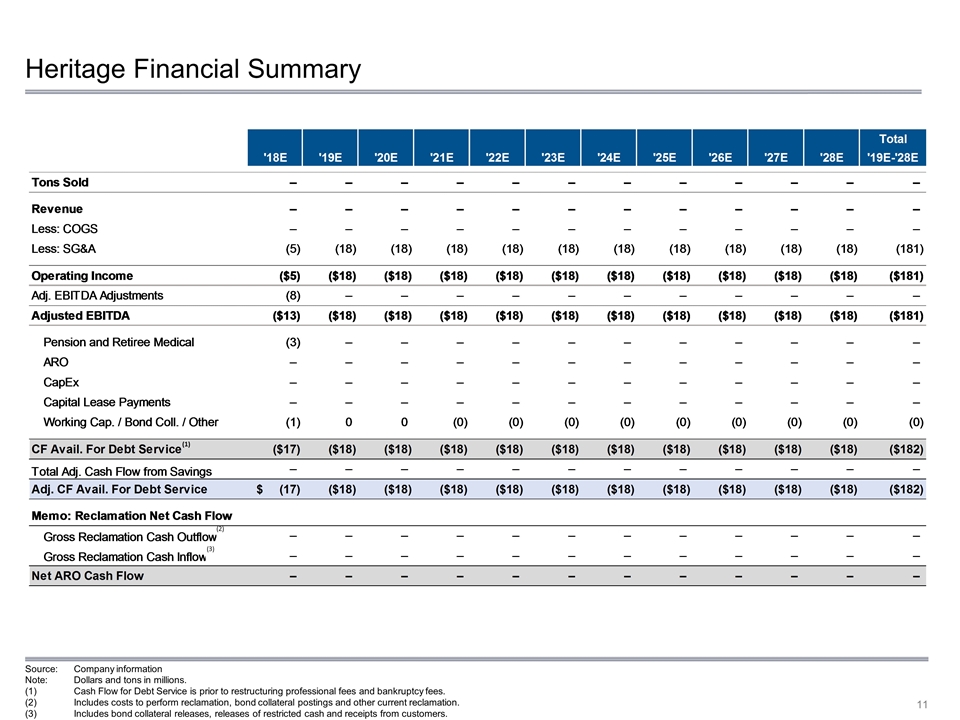
Heritage Financial Summary (1) (3) (2) Source:Company information Note: Dollars and tons in millions. Cash Flow for Debt Service is prior to restructuring professional fees and bankruptcy fees. Includes costs to perform reclamation, bond collateral postings and other current reclamation. Includes bond collateral releases, releases of restricted cash and receipts from customers.
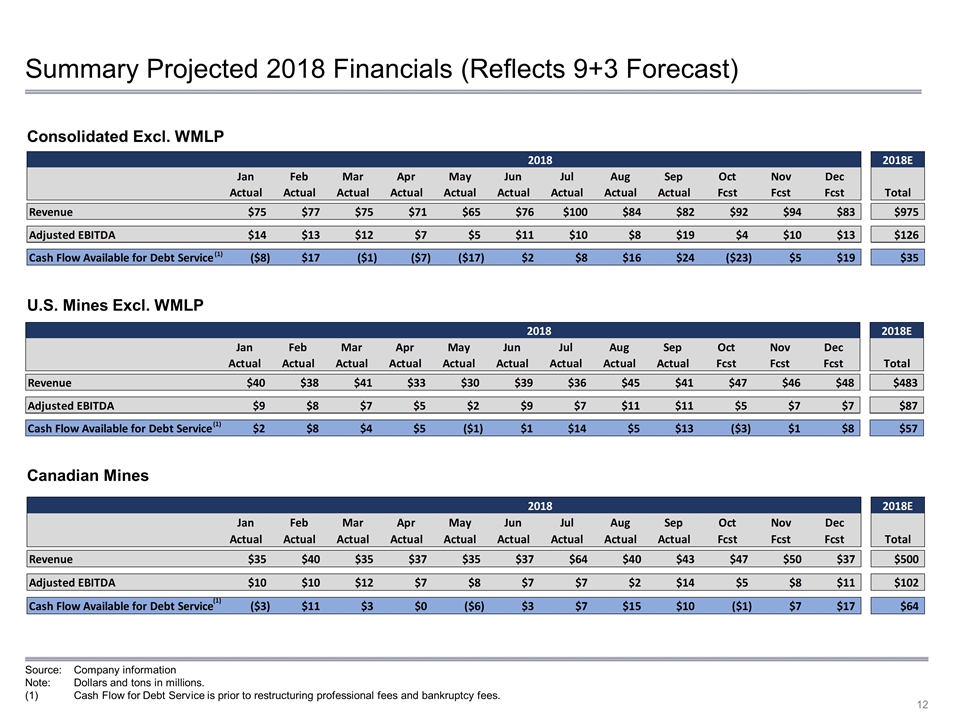
Summary Projected 2018 Financials (Reflects 9+3 Forecast) Source:Company information Note: Dollars and tons in millions. Cash Flow for Debt Service is prior to restructuring professional fees and bankruptcy fees. Consolidated Excl. WMLP U.S. Mines Excl. WMLP Canadian Mines (1) (1) (1)
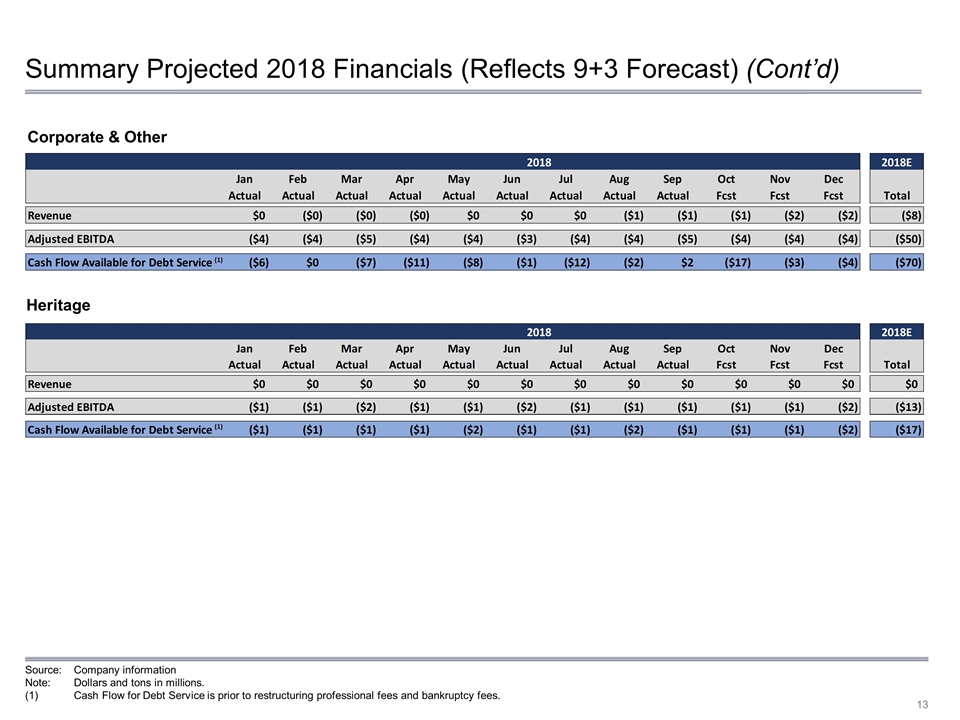
Summary Projected 2018 Financials (Reflects 9+3 Forecast) (Cont’d) Corporate & Other Heritage (1) (1) Source:Company information Note: Dollars and tons in millions. Cash Flow for Debt Service is prior to restructuring professional fees and bankruptcy fees.
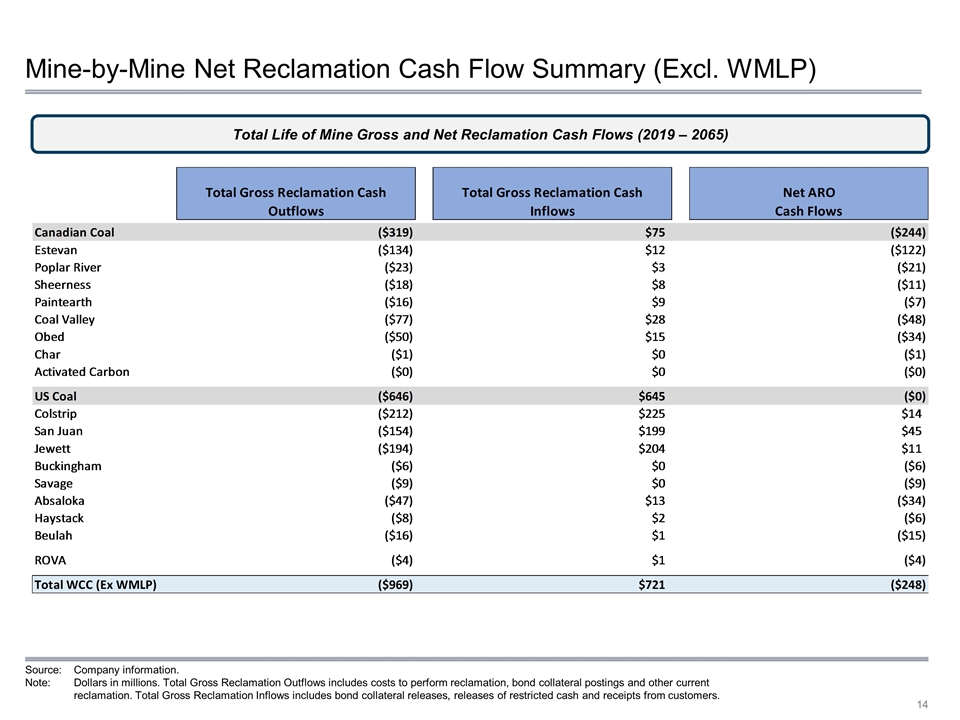
Mine-by-Mine Net Reclamation Cash Flow Summary (Excl. WMLP) Source:Company information. Note: Dollars in millions. Total Gross Reclamation Outflows includes costs to perform reclamation, bond collateral postings and other current reclamation. Total Gross Reclamation Inflows includes bond collateral releases, releases of restricted cash and receipts from customers. Total Life of Mine Gross and Net Reclamation Cash Flows (2019 – 2065)
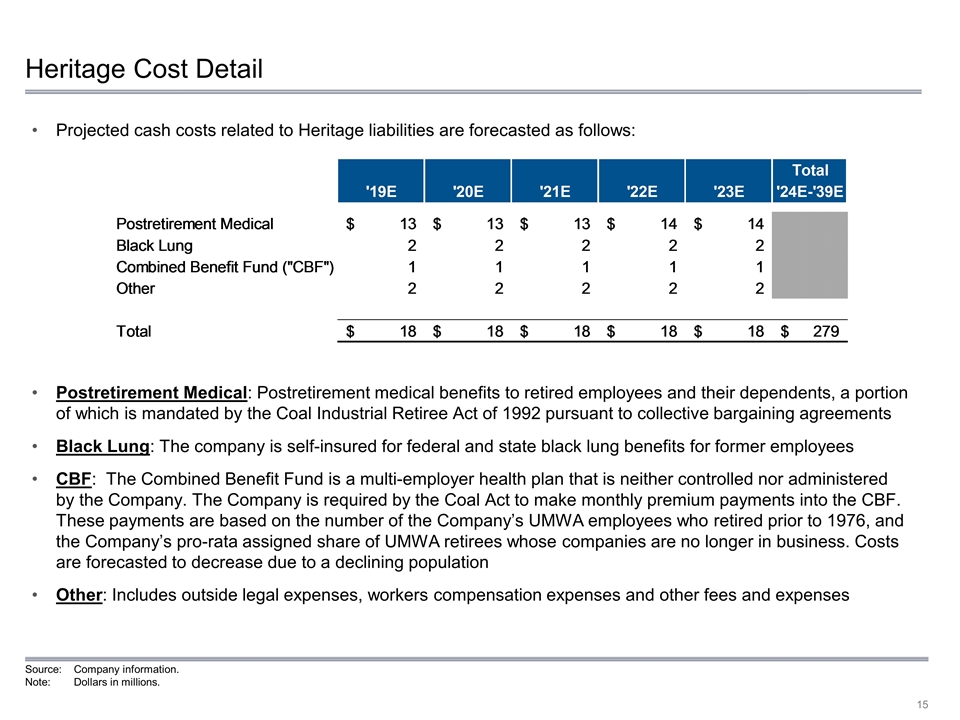
Heritage Cost Detail Projected cash costs related to Heritage liabilities are forecasted as follows: Postretirement Medical: Postretirement medical benefits to retired employees and their dependents, a portion of which is mandated by the Coal Industrial Retiree Act of 1992 pursuant to collective bargaining agreements Black Lung: The company is self-insured for federal and state black lung benefits for former employees CBF: The Combined Benefit Fund is a multi-employer health plan that is neither controlled nor administered by the Company. The Company is required by the Coal Act to make monthly premium payments into the CBF. These payments are based on the number of the Company’s UMWA employees who retired prior to 1976, and the Company’s pro-rata assigned share of UMWA retirees whose companies are no longer in business. Costs are forecasted to decrease due to a declining population Other: Includes outside legal expenses, workers compensation expenses and other fees and expenses Source:Company information. Note: Dollars in millions.
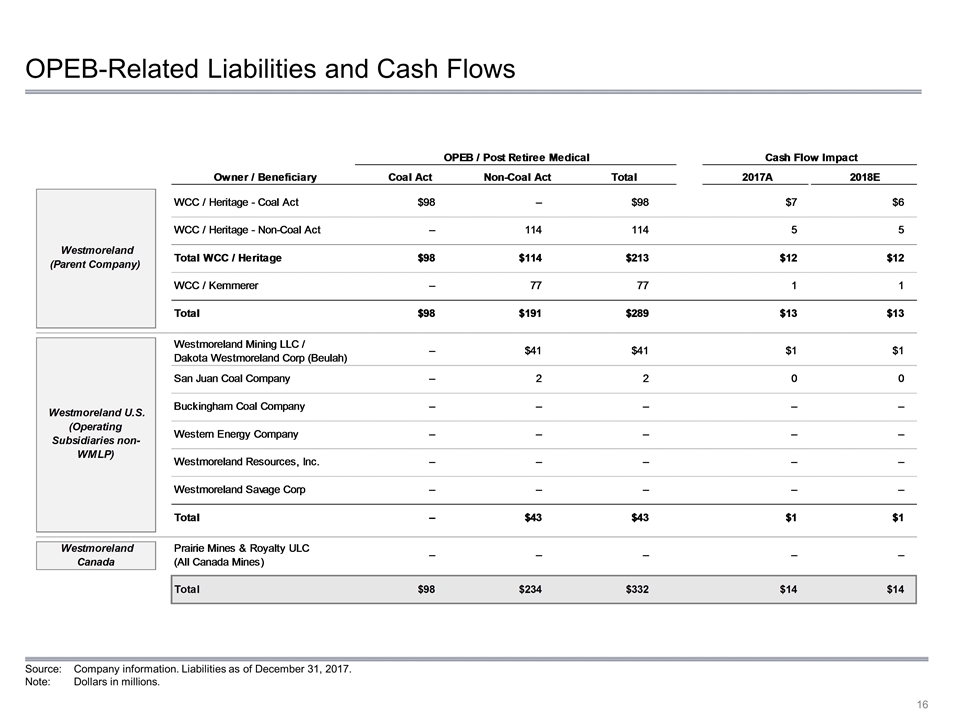
OPEB-Related Liabilities and Cash Flows (1) Source:Company information. Liabilities as of December 31, 2017. Note: Dollars in millions.
Section 2 Preliminary Findings of Performance Optimization Analysis
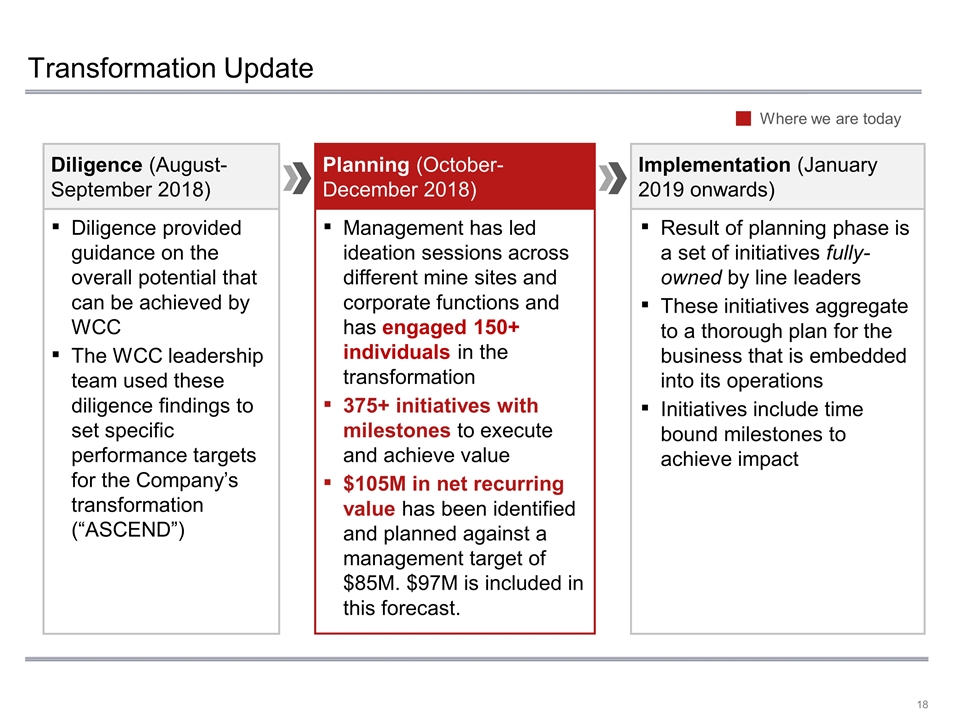
Transformation Update Result of planning phase is a set of initiatives fully-owned by line leaders These initiatives aggregate to a thorough plan for the business that is embedded into its operations Initiatives include time bound milestones to achieve impact Implementation (January 2019 onwards) Diligence provided guidance on the overall potential that can be achieved by WCC The WCC leadership team used these diligence findings to set specific performance targets for the Company’s transformation (“ASCEND”) Diligence (August-September 2018) Planning (October-December 2018) Management has led ideation sessions across different mine sites and corporate functions and has engaged 150+ individuals in the transformation 375+ initiatives with milestones to execute and achieve value $105M in net recurring value has been identified and planned against a management target of $85M. $97M is included in this forecast. Where we are today
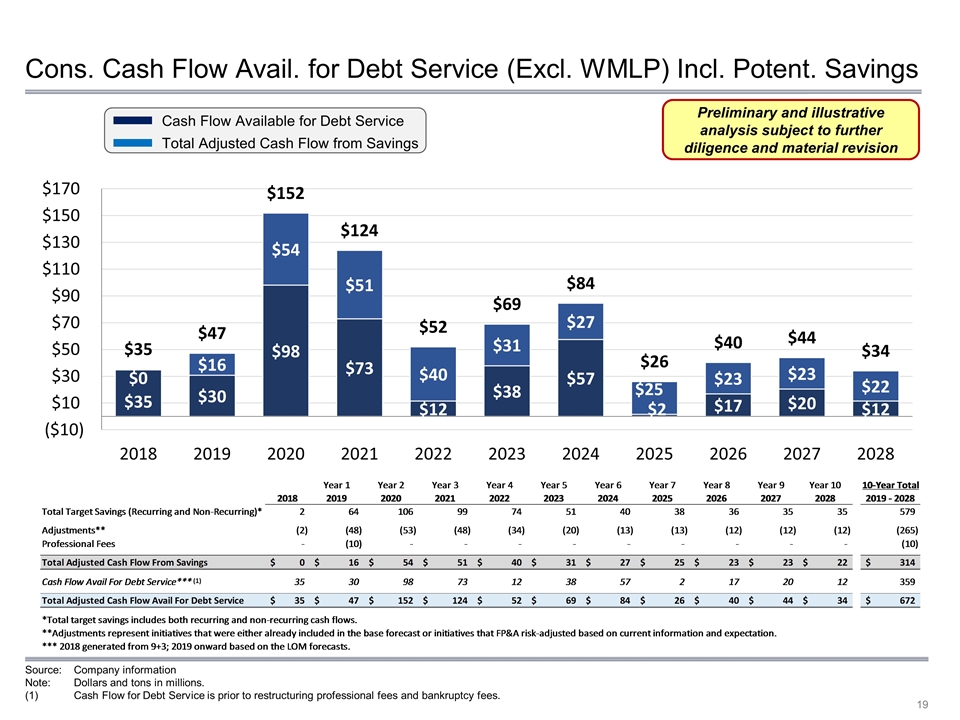
Cons. Cash Flow Avail. for Debt Service (Excl. WMLP) Incl. Potent. Savings Cash Flow Available for Debt Service Total Adjusted Cash Flow from Savings Preliminary and illustrative analysis subject to further diligence and material revision Source:Company information Note: Dollars and tons in millions. Cash Flow for Debt Service is prior to restructuring professional fees and bankruptcy fees. (1)
Section 3 13-Week Cash Flow Projections
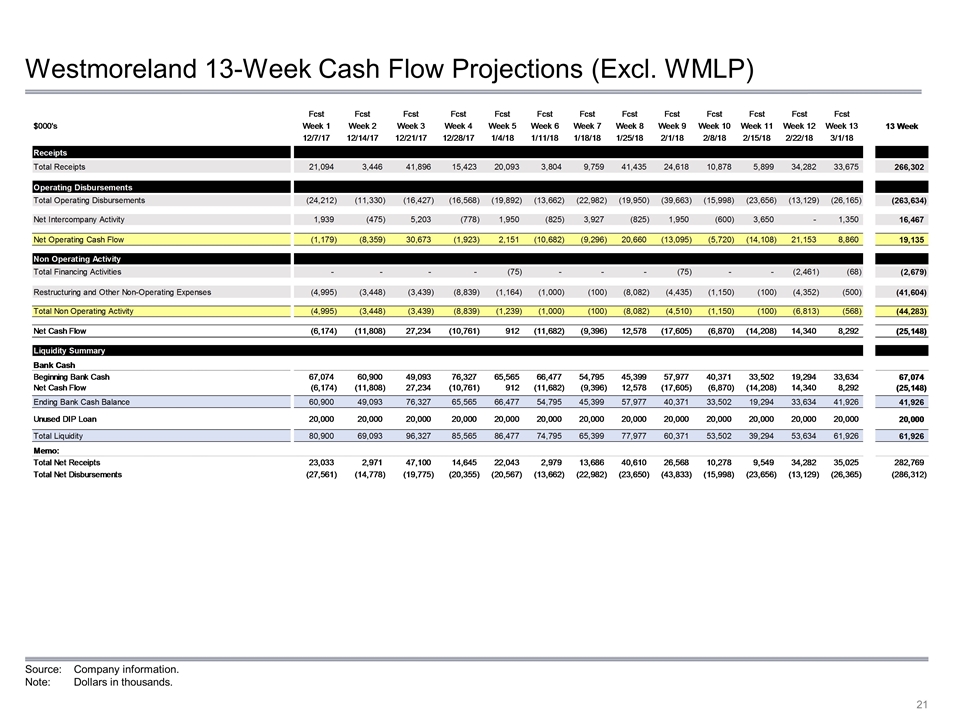
Westmoreland 13-Week Cash Flow Projections (Excl. WMLP) Source:Company information. Note: Dollars in thousands.
Non-GAAP Reconciliation and Measures Westmoreland defines EBITDA as earnings before interest expense, interest income, income taxes, depreciation, depletion, amortization and accretion expense. Adjusted EBITDA is defined by Westmoreland as EBITDA before certain charges to income such as advisory fees, loss on impairment, gains and/or losses on extinguishment of debt, foreign exchange, derivatives and the sale or disposal of assets, as well as customer payments received under loan and lease receivables, share based compensation, and other items which are not considered part of earnings from operations for comparison purposes to other companies’ normalized income. Westmoreland defined Cash Flow Available for Debt Service as Adjusted EBITDA less cash used for Pension and Retiree Medical expenses; Asset Retirement Reclamation; Capital Expenditures; Capital Lease Payments; and Working Capital, Bond Collateral, and Other. Adjusted EBITDA and Cash Flow Available for Debt Service are supplemental measures of financial performance that are not required by, or presented in accordance with, GAAP. Adjusted EBITDA and Cash Flow Available for Debt Service are key metrics used by Westmoreland to assess its operating performance and as a basis for strategic planning and forecasting and Westmoreland believes that Adjusted EBITDA and Cash Flow Available for Debt Service are useful to an investor in evaluating Westmoreland’s operating performance because each of these measures: is used widely by investors to measure a company’s operating performance without regard to items excluded from the calculation of such term, which can vary substantially from company to company depending upon accounting methods and book value of assets, capital structure and the method by which assets were acquired, among other factors; is used by rating agencies, lenders and other parties to evaluate our creditworthiness; and helps investors to more meaningfully evaluate and compare the results of our operations from period to period by removing the effect of our capital structure and asset base from our operating results. Adjusted EBITDA and Cash Flow Available for Debt Service are not measures calculated in accordance with GAAP. The items excluded from Adjusted EBITDA and Cash Flow Available for Debt Service are significant in assessing Westmoreland’s operating results. Adjusted EBITDA and Cash Flow Available for Debt Service have limitations as analytical tools, and should not be considered in isolation from, or as a substitute for, analysis of Westmoreland’s results as reported under GAAP. For example, Cash Flow Available for Debt Service: does not reflect income tax expenses or the cash requirements necessary to pay income taxes; does not reflect advisor and other fees related to Westmoreland’s restructuring and bankruptcy; and does not reflect the significant interest expense, or the cash requirements necessary to service interest or principal payments, on certain of Westmoreland’s debt obligations. In addition to the above, Adjusted EBITDA: does not reflect Westmoreland’s cash expenditures or future requirements for capital and major maintenance expenditures or contractual commitments; does not reflect changes in, or cash requirements for, Westmoreland’s working capital needs; In addition, although depreciation and amortization are non-cash charges, the assets being depreciated and amortized will often have to be replaced in the future, and Adjusted EBITDA does not reflect any cash requirements for such replacements. Other companies in Westmoreland’s industry and in other industries may calculate Adjusted EBITDA and Cash Flow Available for Debt Service differently from the way that Westmoreland does, limiting its usefulness as a comparative measure. Because of these limitations, Adjusted EBITDA and Cash Flow Available for Debt Service should not be considered as a measure of discretionary cash available to Westmoreland to invest in the growth of its business. Westmoreland compensates for these limitations by relying primarily on its GAAP results and using Adjusted EBITDA and Cash Flow Available for Debt Service only as supplemental data. Westmoreland has not provided a reconciliation of the forward‐looking non‐GAAP financial measure Adjusted EBITDA and Cash Flow Available for Debt Service to the most directly comparable GAAP financial measure, net income (loss) and Cash Flow Provided By (Used For) Operations, because the information necessary for a quantitative reconciliation of the forward‐looking non‐GAAP financial measure to the most directly comparable GAAP financial measure is not available to Westmoreland without unreasonable efforts. The probable significance of providing these forward‐looking non‐GAAP financial measures without the directly comparable GAAP financial measures is that such GAAP financial measures may be materially different from the corresponding non‐GAAP financial measures.
