Attached files
| file | filename |
|---|---|
| 8-K - 8-K - SELECT MEDICAL HOLDINGS CORP | a18-41048_18k.htm |
Forward-Looking Statements This presentation may contain forward-looking statements based managementexpectations.Numerousfactors,includingthose market conditions and those detailed from time-to-time in the on current relatedto Company’s filings with the Securities and Exchange Commission, may cause results to differ materially from those anticipated in the forward-looking statements. Many of the factors that will determine the Company’s future results are beyond the ability of the Company to control or predict. These statements are subject to risks and uncertainties and, therefore, actual results may differ materially.Readersshouldnotplaceunduerelianceonforward-looking statements, which reflect management’s views only as of the date hereof. The Company undertakes no obligation to revise or update any forward-looking statements, or to make any other forward-looking statements, whether as a result of new information, future events or otherwise.All references to “Select” used throughout this presentation refer to Select Medical Holdings Corporation and its subsidiaries. 2
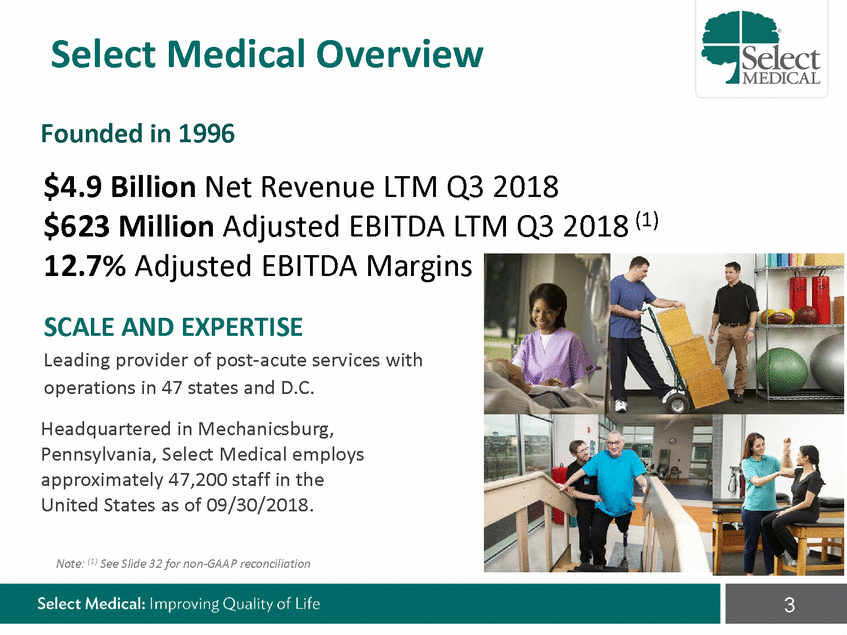
Select Medical Overview Founded in 1996 $4.9 Billion Net Revenue LTM Q3 2018 2018 (1) $623 Million Adjusted EBITDA LTM 12.7% Adjusted EBITDA Margins SCALE AND EXPERTISE Leading provider of post-acute services with operations in 47 states and D.C. Headquartered in Mechanicsburg, Pennsylvania, Select Medical employs approximately 47,200 staff in the United States as of 09/30/2018. Q3 Note: (1) See Slide 32 for non-GAAP reconciliation 3
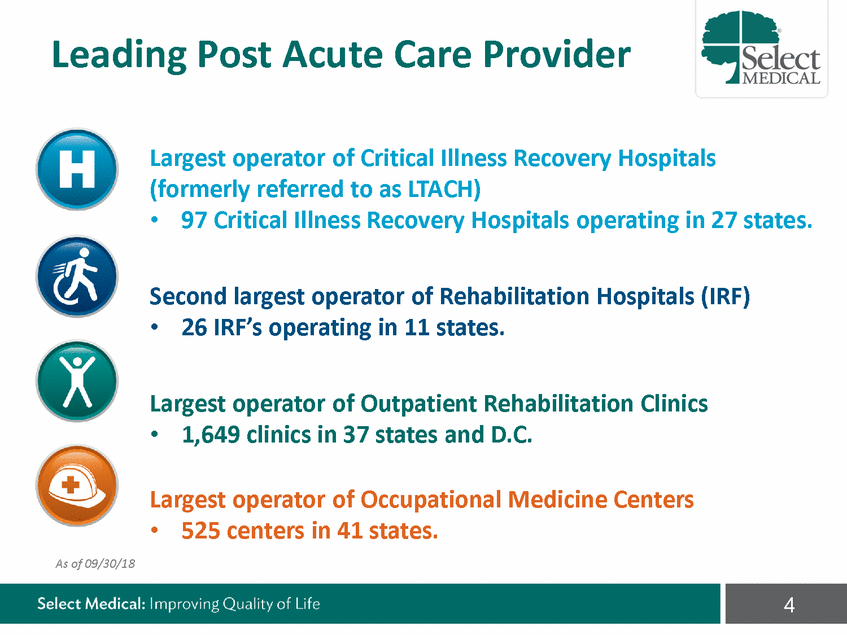
Leading Post Acute Care Provider Largest operator of Critical Illness Recovery Hospitals (formerly referred to as LTACH) • 97 Critical Illness Recovery Hospitals operating in 27 states. Second largest operator of Rehabilitation Hospitals (IRF) • 26 IRF’s operating in 11 states. Largest operator of Outpatient Rehabilitation Clinics • 1,649 clinics in 37 states and D.C. Largest operator of Occupational Medicine Centers • 525 centers in 41 states. As of 09/30/18 4
Recent Events Repricing On October 26, 2018 Select entered into an amendment to its senior credit facilities, reducing borrowing spreads on its term and revolving loans by 25 basis points. Concentra entered into an amendment to its first lien credit facilities, reducing borrowing spread revolving loans by 50 basis points. Ohio Health Joint Venture On July 12, 2018 Select and Ohio Health announced an expansion of its joint venture agreement to include outpatient rehabilitation through the contributions of 38 clinics into the joint venture. Baylor Joint Venture On June 26, 2018 Select and Baylor Scott & White Health expanded into the Austin Texas area with the acquisition of a 36 bed rehabilitation hospital and on July 1, 2018 added 22 outpatient rehabilitation clinics into the joint venture. Ochsner Health Joint Venture On May 1, 2018 Select and Ochsner Health opened a new 56 bed rehabilitation hospital in New Orleans. Select Refinancing On March 23, 2018 Select entered into an amendment to its senior credit facilities, reducing borrowing spreads on its term loans by 75 basis points and it revolving loans by 50 basis points. Concentra / US HealthWorks On February 1, 2018 the Company announced the completion of the merger between Concentra and US HealthWorks, and related financing. Banner Health Joint Venture On January 9, 2018 the Company announced the signing of a new joint venture agreement with Banner Health in Arizona. The joint venture will consist of more than 37 outpatient physical therapy centers and the construction of 3 new inpatient rehab hospitals to be completed by 2020. 5
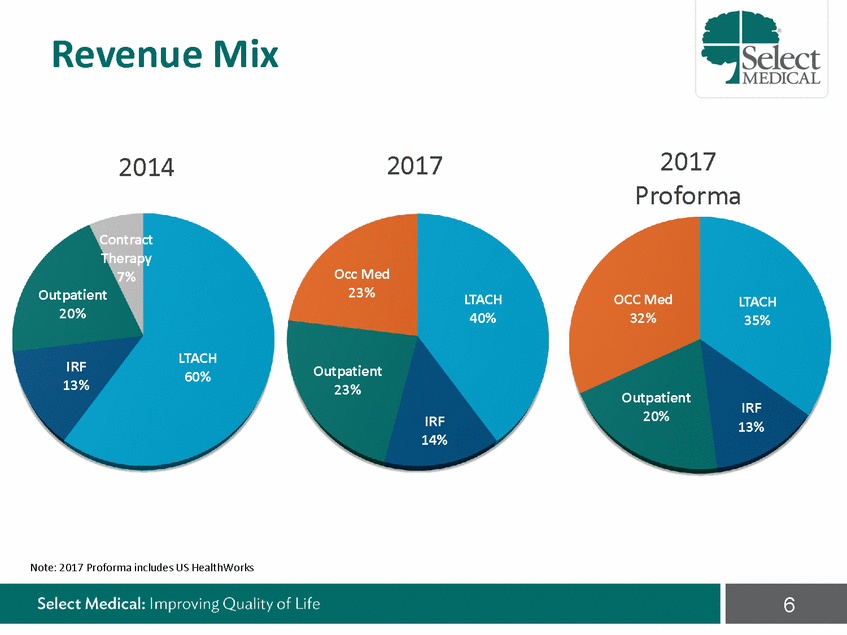
Revenue Mix 2017 Proforma 2017 2014 Contract Therapy 7% Outpatient 20% Occ Med 23% LTACH 40% OCC Med 32% LTACH 35% LTACH 60% IRF 13% Outpatient 23% Outpatient 20% IRF 13% IRF 14% Note: 2017 Proforma includes US HealthWorks 6
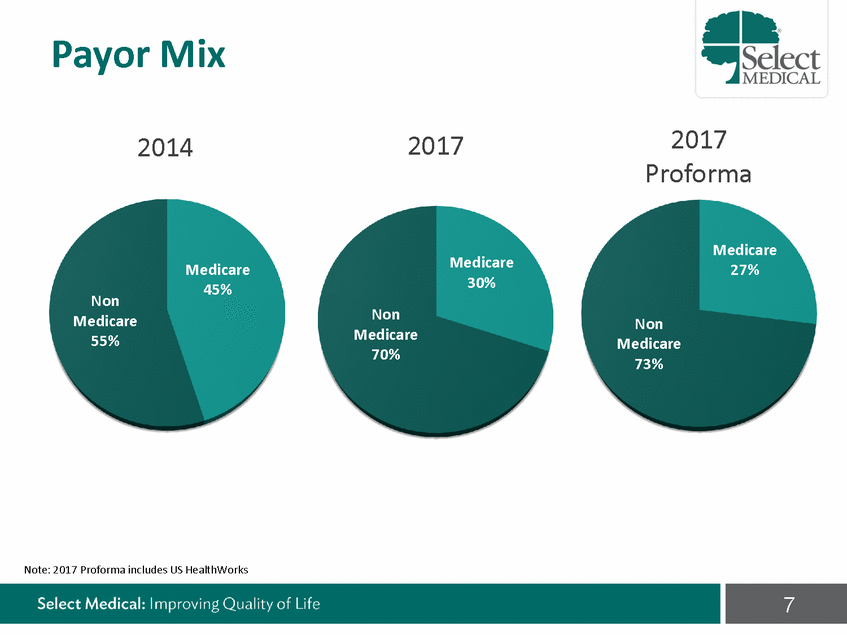
Payor Mix 2017 Proforma 2017 2014 Medicare 27% Medicare 30% Medicare 45% Non Medicare 55% Non Medicare 70% Non Medicare 73% Note: 2017 Proforma includes US HealthWorks 7
Payor Mix 2017 Proforma 2017 2014 Medicare 27% Medicare 30% Medicare 45% Non Medicare 55% Non Medicare 70% Non Medicare 73% Note: 2017 Proforma includes US HealthWorks 8
LTCH Legislation LTCH Patient Criteria passed in late December 2013 as part of Budget bill and SGR - effective beginning Q4 2015 –All LTCH’s under criteria as of September 2016. LTCH Rates for patients with; –3 day prior short term acute hospital ICU/CCU stay or –Ventilation patients for > 96 hours in the LTCH Other patients receive “site neutral” rate. –Bipartisan Budget Act of 2018 extended blended site neutral payment rates for additional 2 years through September 2019. • • 9
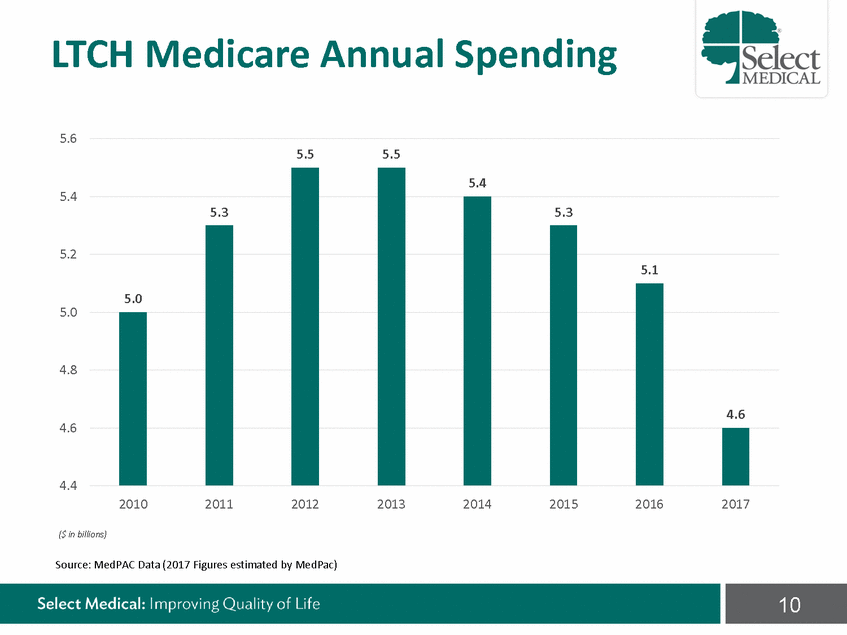
LTCH Medicare Annual Spending 5.6 5.5 5.5 5.4 5.2 5.0 4.8 4.6 4.4 2010 2011 2012 2013 2014 2015 2016 2017 ($ in billions) Source: MedPAC Data (2017 Figures estimated by MedPac) 10 5.4 5.3 5.3 5.0 5.1 4.6
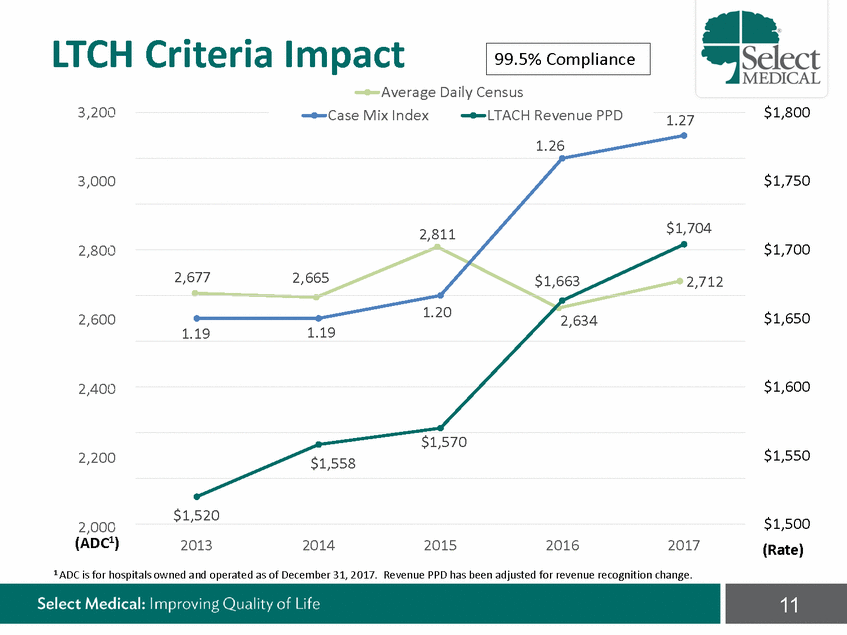
LTCH 3,200 Criteria Impact Average Daily Census $1,800 Case Mix Index LTACH Revenue PPD 1.26 1.27 3,000 $1,750 $1,704 2,811 $1,700 2,800 2,677 2,665 $1,663 2,712 1.20 $1,650 2,600 2,634 1.19 1.19 $1,600 2,400 $1,570 $1,550 2,200 $1,558 $1,520 $1,500 (Rate) 2,000 (ADC1) 2013 2014 2015 2016 2017 1 ADC is for hospitals owned and operated as of December 31, 2017. Revenue PPD has been adjusted for revenue recognition change. 11 99.5% Compliance
[LOGO]
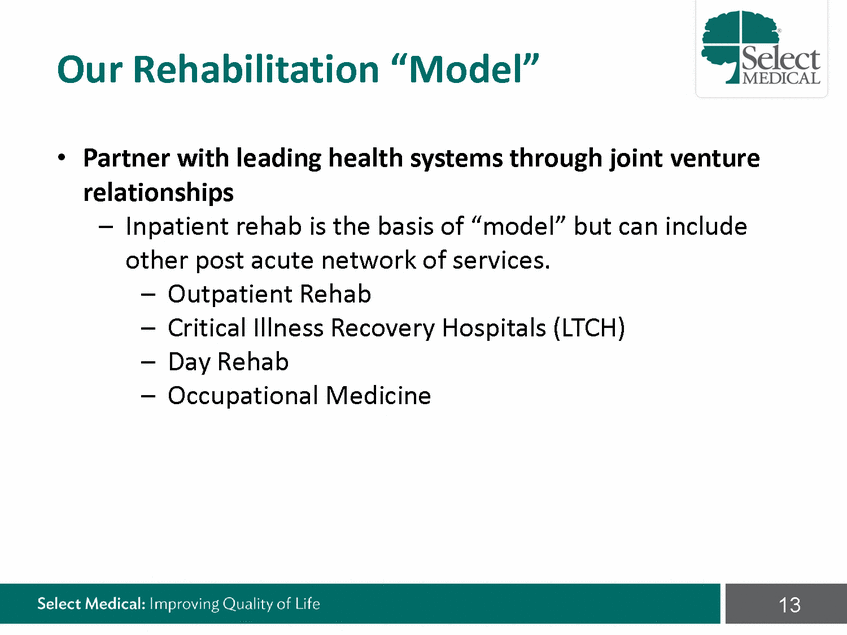
Our Rehabilitation “Model” • Partner with leading health systems through joint venture relationships – Inpatient rehab is the basis of “model” but can other post acute network of services. include – – – – Outpatient Rehab Critical Illness Recovery Day Rehab Hospitals (LTCH) Occupational Medicine 13
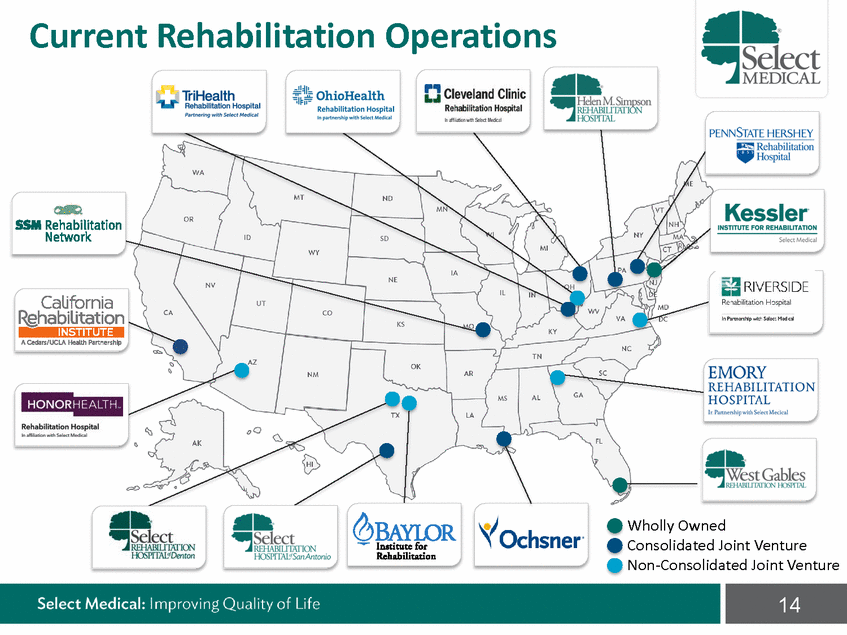
Current Rehabilitation Operations [JCleveland Clinic Rehabliitation Hospital ..ilfiiiltictl WCfl Sef!ld Uedcll _uJI' O·luh-ioHealth Rehabil itation Hospital In partners-hlp with Select Mtdiul STATE HERSHEY 1 1-'tNRI' ehabilitation · Hospital SSM Rehabilitation Network INSTITUTE FOR REHABIUTATION Se-lect Medical (3RIVERSIDE R.e abilitation H::.spital lr Pannershlpwitb Select Medea! ..-. ... eWholly Owned BAYlOR eConsolidated Joint Venture Non-Consolidated Joint Venture · Rehabilitation Select Medical: I mproving Quality of Lif e '<(Ochsner ........ IDatitute for ..Select .JRF.HABIUWION HOSPITi\L'(SanAntonio •select . JREJ-IABIU0010N HOSPfD\l:tDenton Rehabilitation Hospital lrl•Nilirion'lllithSel.au.diall CaUfornia BghabiUtation A Cedars/UClA HeaU.h rtnersh_, INSTITUTE
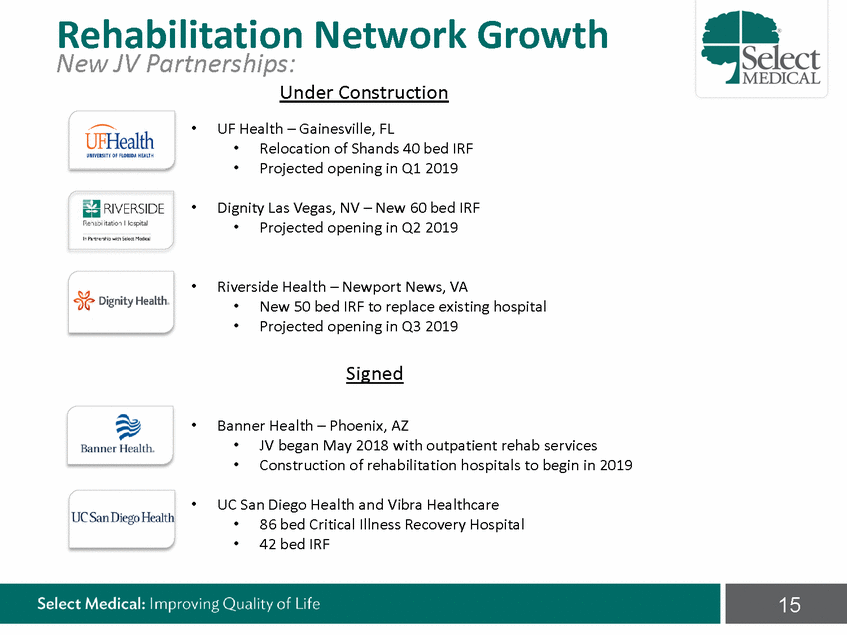
Rehabilitation Network Growth New JV Partnerships: Under Construction • UF Health – Gainesville, FL • • Relocation of Shands 40 bed IRF Projected opening in Q1 2019 • Dignity Las Vegas, NV – New 60 bed IRF • Projected opening in Q2 2019 • Riverside Health – Newport News, VA • • New 50 bed IRF to replace existing hospital Projected opening in Q3 2019 Signed • Banner Health – Phoenix, AZ • • JV began May 2018 with outpatient rehab services Construction of rehabilitation hospitals to begin in 2019 • UC San Diego Health and Vibra Healthcare • • 86 bed Critical Illness Recovery Hospital 42 bed IRF 15
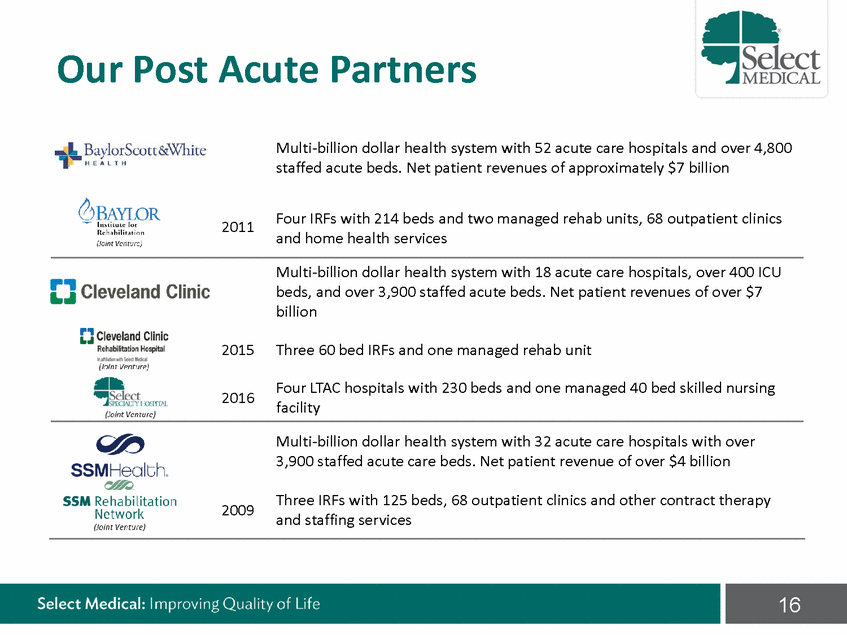
Our Post Acute Partners Multi-billion dollar health system with 52 acute care hospitals and over 4,800 staffed acute beds. Net patient revenues of approximately $7 billion Four IRFs with 214 beds and two managed rehab units, 68 outpatient clinics and home health services 2011 facility and staffing services 16 Multi-billion dollar health system with 18 acute care hospitals, over 400 ICU beds, and over 3,900 staffed acute beds. Net patient revenues of over $7 billion 2015Three 60 bed IRFs and one managed rehab unit 2016Four LTAC hospitals with 230 beds and one managed 40 bed skilled nursing Multi-billion dollar health system with 32 acute care hospitals with over 3,900 staffed acute care beds. Net patient revenue of over $4 billion 2009Three IRFs with 125 beds, 68 outpatient clinics and other contract therapy
[LOGO]
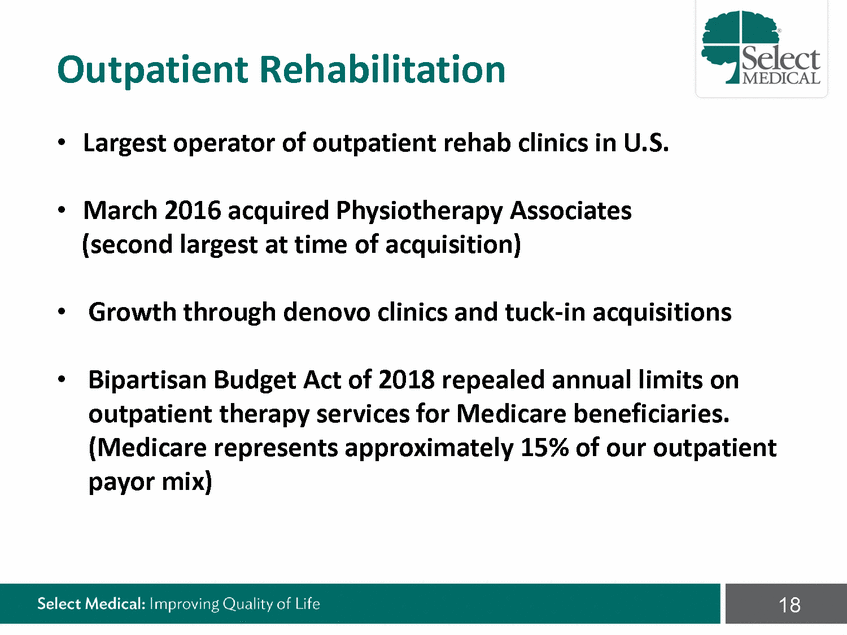
Outpatient Rehabilitation • Largest operator of outpatient rehab clinics in U.S. • March 2016 acquired Physiotherapy Associates (second largest at time of acquisition) • Growth through denovo clinics and tuck-in acquisitions • Bipartisan Budget Act of 2018 repealed annual limits on outpatient therapy services for Medicare beneficiaries. (Medicare represents approximately 15% of our outpatient payor mix) 18
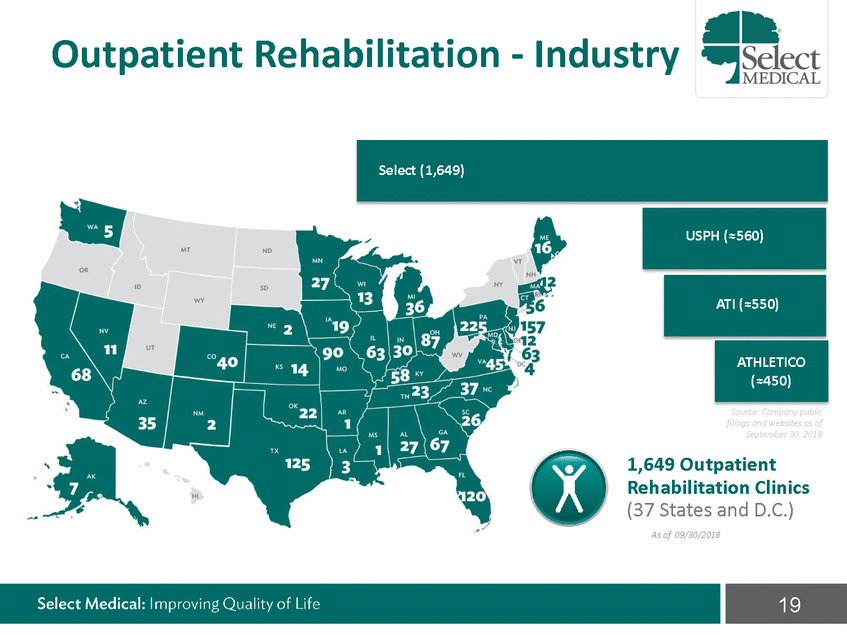
Outpatient Rehabilitation - Industry Source: Company public filings and websites as of September 30, 2018 1,649 Outpatient Rehabilitation Clinics (37 States and D.C.) As of 09/30/2018 19 ATHLETICO (≈450) ATI (≈550) USPH (≈560) Select (1,649)
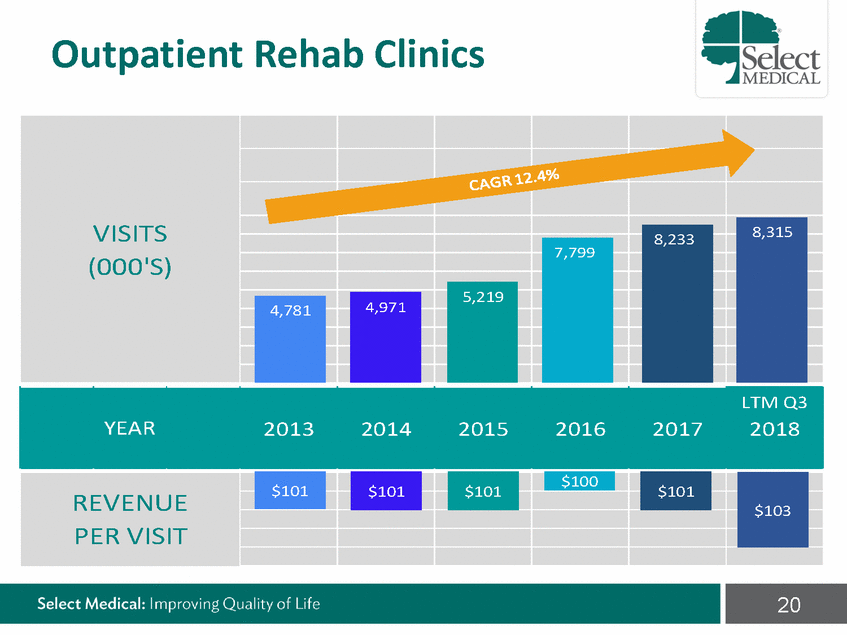
Outpatient Rehab Clinics 20 VISITS (000'S) 8,315 8,233 7,799 5,219 4,971 4,781 YEAR LTM Q3 2013 2014 2015 2016 2017 2018 REVENUE PER VISIT $101 $101 $101 $100 $101 $103
[LOGO]
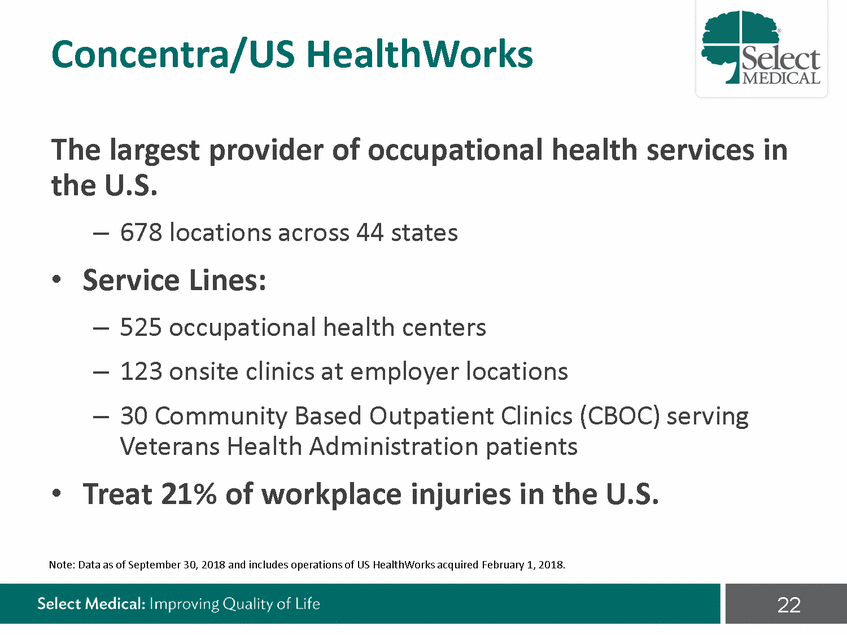
Concentra/US HealthWorks The largest provider of occupational the U.S. – 678 locations across 44 states health services in • Service Lines: – – – 525 occupational health centers 123 onsite clinics at employer locations 30 Community Based Outpatient Clinics Veterans Health Administration patients (CBOC) serving • Treat 21% of workplace injuries in the U.S. Note: Data as of September 30, 2018 and includes operations of US HealthWorks acquired February 1, 2018. 22
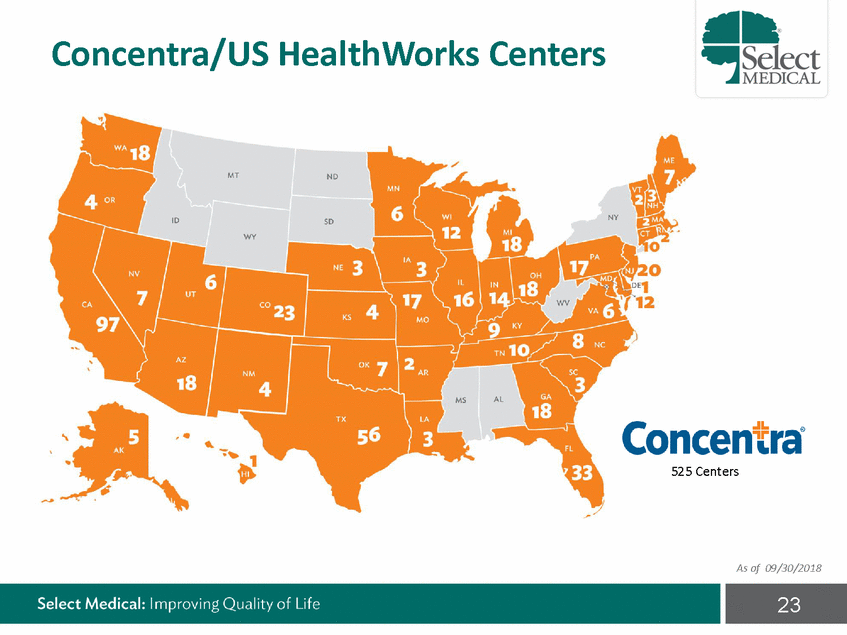
Concentra/US HealthWorks Centers 525 Centers As of 09/30/2018 23
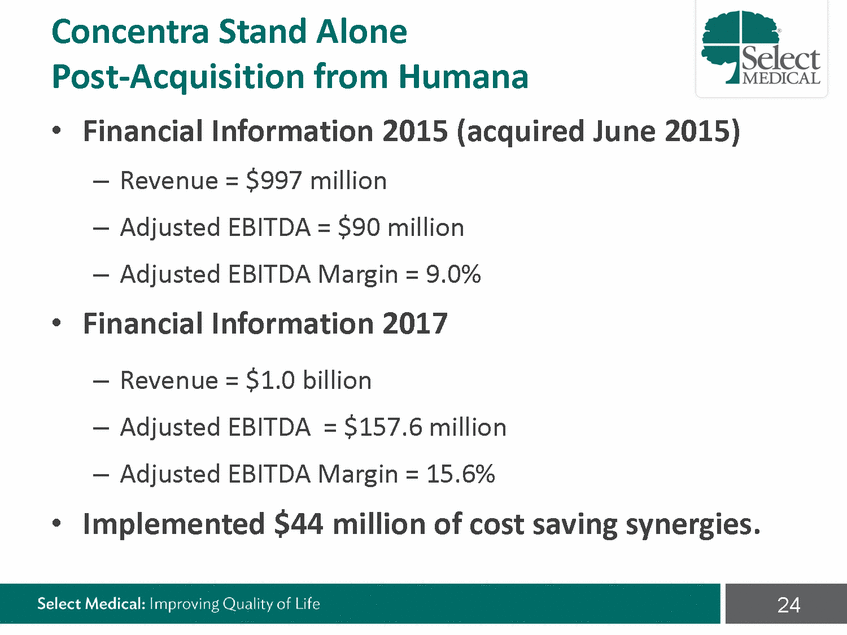
Concentra Stand Alone Post-Acquisition from Humana • Financial Information 2015 (acquired June 2015) – – – Revenue = $997 million Adjusted EBITDA = $90 million Adjusted EBITDA Margin = 9.0% • Financial Information 2017 – – – Revenue = $1.0 billion Adjusted EBITDA= $157.6 million Adjusted EBITDA Margin = 15.6% • Implemented $44 million of cost saving synergies. 24
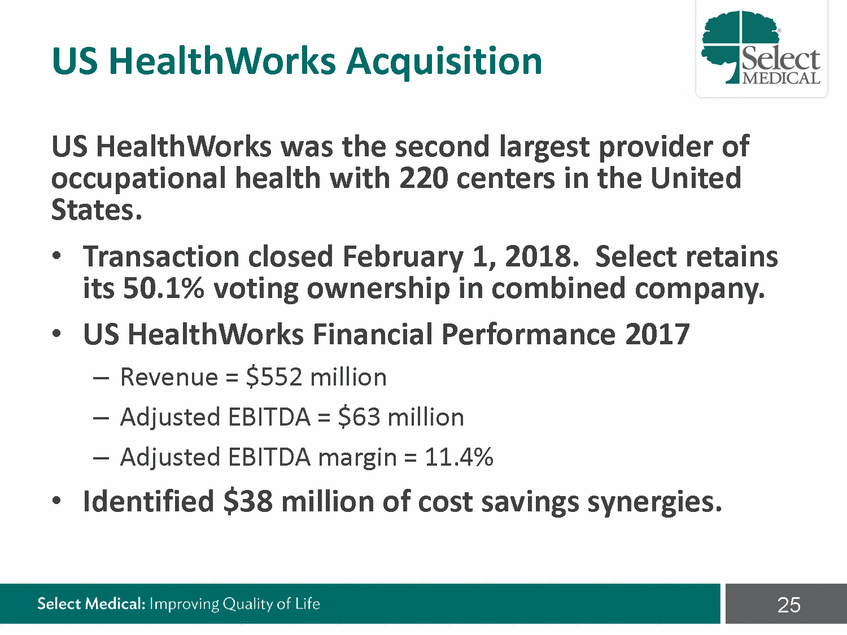
US HealthWorks Acquisition US HealthWorks was the second largest occupational health with 220 centers in States. provider of the United • Transaction closed February 1, 2018. Select retains its 50.1% voting ownership in combined company. US HealthWorks Financial Performance 2017 • – – – Revenue = $552 million Adjusted EBITDA = $63 million Adjusted EBITDA margin = 11.4% • Identified $38 million of cost savings synergies. 25
[LOGO]

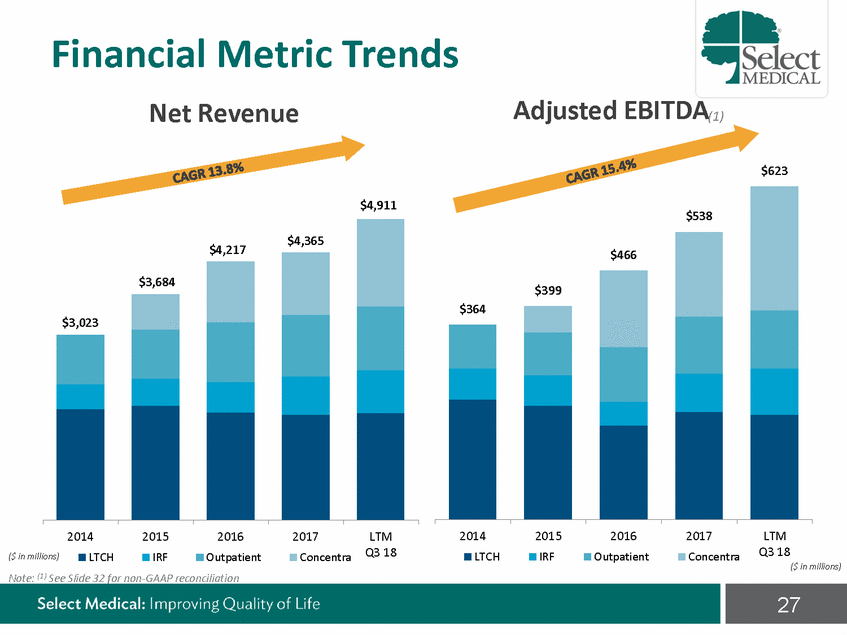
Financial Metric Trends Adjusted EBITDA(1) Net Revenue $623 $4,911 $4,217 2014 2015 2016 Outpatient 2017 LTM Q3 18 2014 2015 2016 Outpatient 2017 Concentra LTM Q3 18 LTCH IRF Concentra LTCH IRF ($ in millions) ($ in millions) Note: (1) See Slide 32 for non-GAAP reconciliation 27 $4,365 $3,684 $3,023 $538 $466 $399 $364
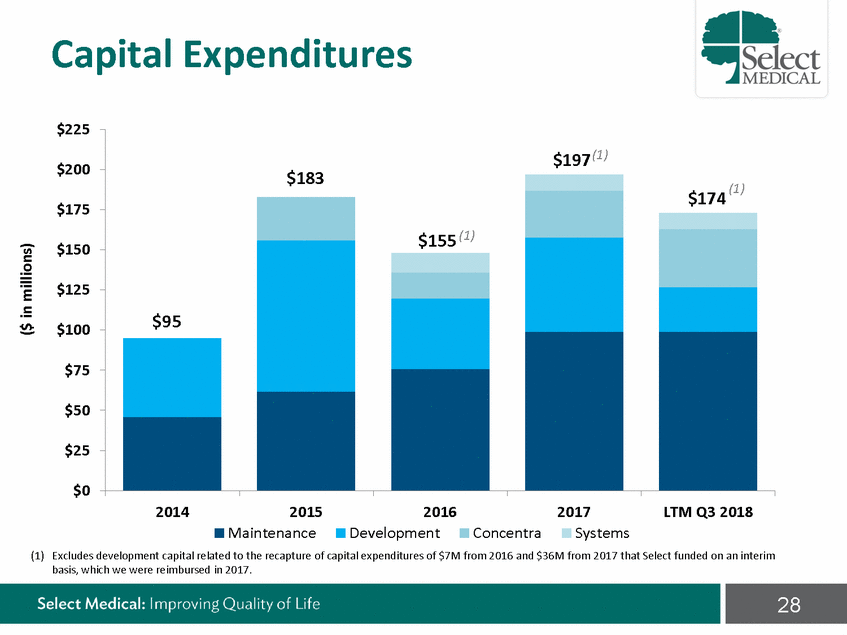
Capital Expenditures $225 $200 $175 $150 $125 $100 $75 $50 $25 $0 2014 2015 Maintenance 2016 Development 2017 LTM Q3 2018 Concentra Systems (1) Excludes development capital related to the recapture of capital expenditures of $7M from 2016 and $36M from 2017 that Select funded on an interim basis, which we were reimbursed in 2017. 28 ($ in millions) $197 (1) $183 (1) $174 $95 $155 (1)
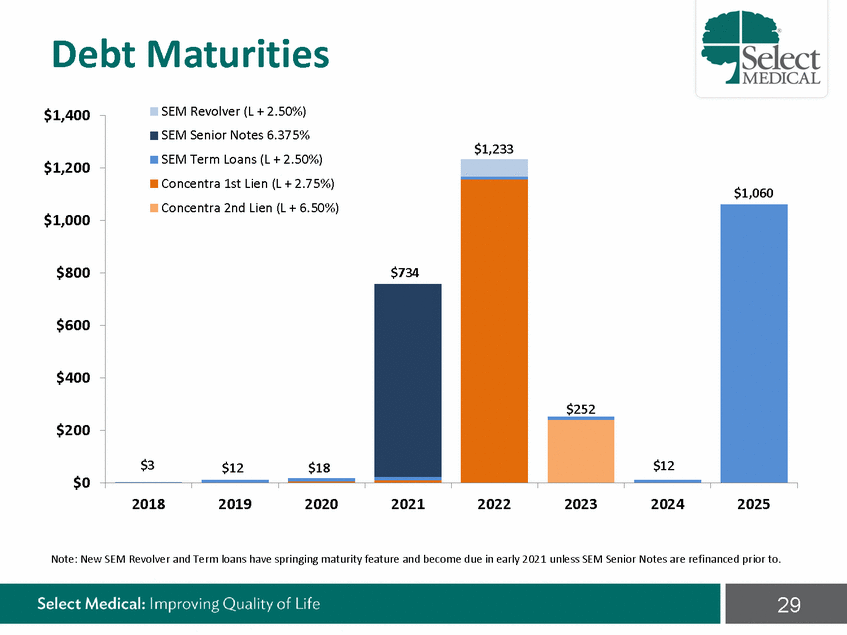
Debt Maturities SEM Revolver (L + 2.50%) $1,400 $1,233 $1,200 $1,000 $800 $600 $400 $200 $0 2018 2019 2020 2021 2022 2023 2024 2025 Note: New SEM Revolver and Term loans have springing maturity feature and become due in early 2021 unless SEM Senior Notes are refinanced prior to. 29 SEM Senior Notes 6.375% SEM Term Loans (L + 2.50%) Concentra 1st Lien (L + 2.75%) Concentra 2nd Lien (L + 6.50%) $734 $3$12$18 $1,060 $252 $12
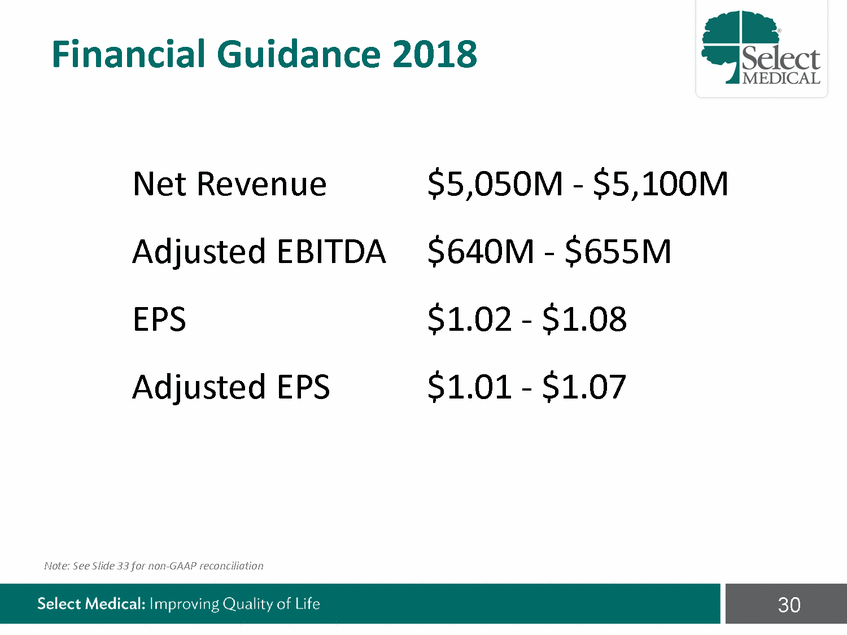
Financial Guidance 2018 Net Revenue $5,050M - $5,100M Adjusted EPS Adjusted EBITDA $640M - $655M $1.08 $1.07 $1.02 $1.01 - - EPS Note: See Slide 33 for non-GAAP reconciliation 30
Appendix: Additional Materials

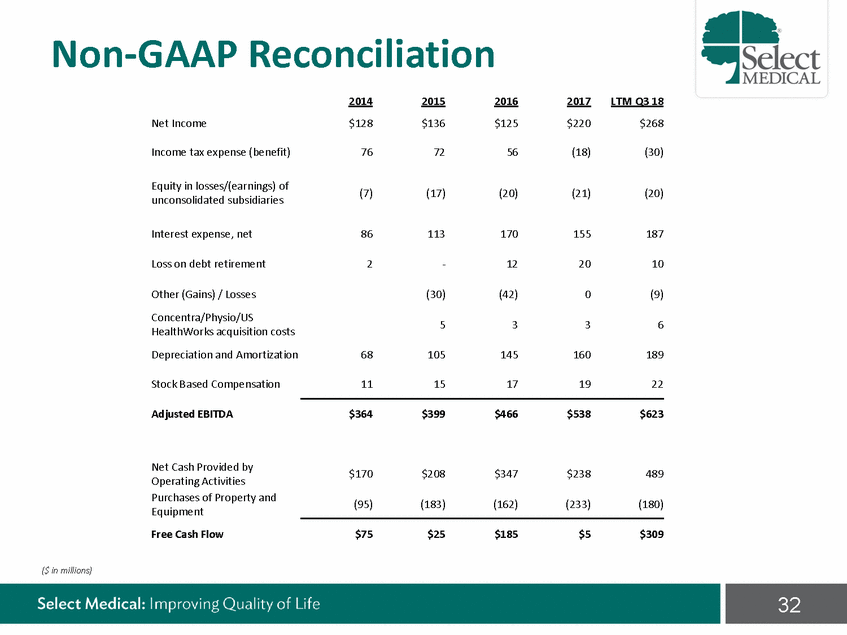
Non-GAAP Reconciliation 2014 $128 2015 $136 2016 $125 2017 $220 LTM Q3 18 Net Income $268 Income tax expense (benefit) 76 72 56 (18) (30) Equity in losses/(earnings) of unconsolidated subsidiaries (7) (17) (20) (21) (20) Interest expense, net 86 113 170 155 187 Loss on debt retirement 2 - 12 20 10 Other (Gains) / Losses Concentra/Physio/US HealthWorks acquisition costs Depreciation and Amortization (30) (42) 0 (9) 5 3 3 6 68 105 145 160 189 Stock Based Compensation 11 15 17 19 22 Adjusted EBITDA $364 $399 $466 $538 $623 Net Cash Provided by Operating Activities Purchases of Property and Equipment Free Cash Flow $170 $208 $347 $238 489 (95) (183) (162) (233) (180) $75 $25 $185 $5 $309 ($ in millions) 32
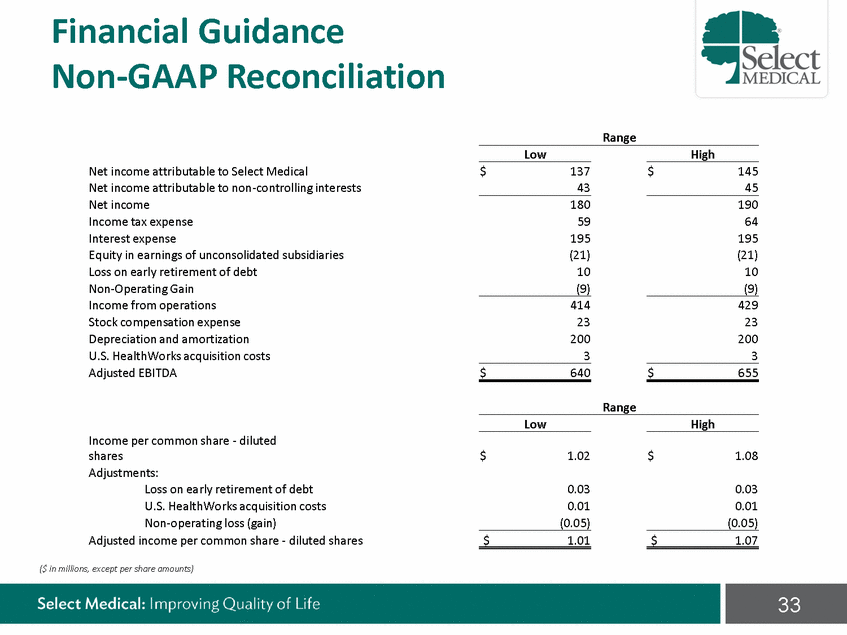
Financial Guidance Non-GAAP Reconciliation ($ in millions, except per share amounts) 33 Range Low High Net income attributable to Select Medical $ 137 $ 145 Net income attributable to non-controlling interests 43 45 Net income 180 190 Income tax expense 59 64 Interest expense 195 195 Equity in earnings of unconsolidated subsidiaries (21) (21) Loss on early retirement of debt 10 10 Non-Operating Gain (9) (9) Income from operations 414 429 Stock compensation expense 23 23 Depreciation and amortization 200 200 U.S. HealthWorks acquisition costs 3 3 Adjusted EBITDA $ 640 $ 655 Range Low High Income per common share - diluted shares $ 1.02 $ 1.08 Adjustments: Loss on early retirement of debt 0.03 0.03 U.S. HealthWorks acquisition costs 0.01 0.01 Non-operating loss (gain) (0.05) (0.05) Adjusted income per common share - diluted shares $ 1.01 $ 1.07
selectmedical.com/investor-relations/for-investors