Attached files
| file | filename |
|---|---|
| 8-K - FORM 8-K - BAY BANKS OF VIRGINIA INC | tv508377_8k.htm |
Exhibit 99.1
Investor Presentation December 2018
2 This investor presentation contains statements concerning Bay Banks of Virginia, Inc.’s expectations, plans, objectives, future financial performance and other statements that are not historical facts. These statements may constitute "forward - looking statements" as defined by federal securities laws. These statements may address issues that involve estimates and assumptions made by management, risks and uncertainties, and actual results could differ materially from historical results or those anticipated by such statements. Factors that could have a material adverse effect on the operations and future prospects of Bay Banks of Virginia include, but are not limited to, our ability to achieve the cost savings associated with the recent and planned initiatives and the expenses associated with those initiatives; our ability to successfully manage our growth or implement our growth strategy; changes in interest rates and general economic conditions; the legislative/regulatory climate; monetary and fiscal policies of the U. S. Government, including policies of the U.S . Treasury and Federal Reserve Board; the quality or composition of the loan or investment portfolios; demand for loan products; deposit flows; competition; demand for financial services in the company's market area; acquisitions and dispositions; and tax and accounting rules, principles, polices and guidelines and other risks and uncertainties described from time to time in Bay Banks of Virginia’s reports filed with the Securities and Exchange Commission. These risks and uncertainties should be considered in evaluating the forward - looking statements contained herein, and readers are cautioned not to place undue reliance on such statements, which speak only as of the date they are made. Except to the extent required by applicable law or regulation, Bay Banks of Virginia undertakes no obligation to revise or update publicly any forward - looking statements for any reason. Caution Forward - Looking Statements
3 Company History x Bay Banks of Virginia, Inc. is the holding company for Virginia Commonwealth Bank (VCB) and VCB Financial Group x With over 166 years of combined history as independent community banks, Bank of Lancaster and Virginia Commonwealth Bank merged on April 1, 2017 to enhance their shared mission of providing outstanding banking services to the local communities in which they operate, while improving returns to shareholders • Bank of Lancaster was the acquiring bank and subsequent to the merger assumed the Virginia Commonwealth Bank name x VCB currently has 20 banking offices located throughout the Richmond metro area and the Northern Neck and the Hampton Roads regions of Virginia, serving businesses, professionals and consumers with a wide variety of financial services, including retail and commercial banking and mortgage lending x VCB Financial Group provides management services for personal and corporate trusts, including estate planning, estate settlement, trust administrations, wealth management and insurance services
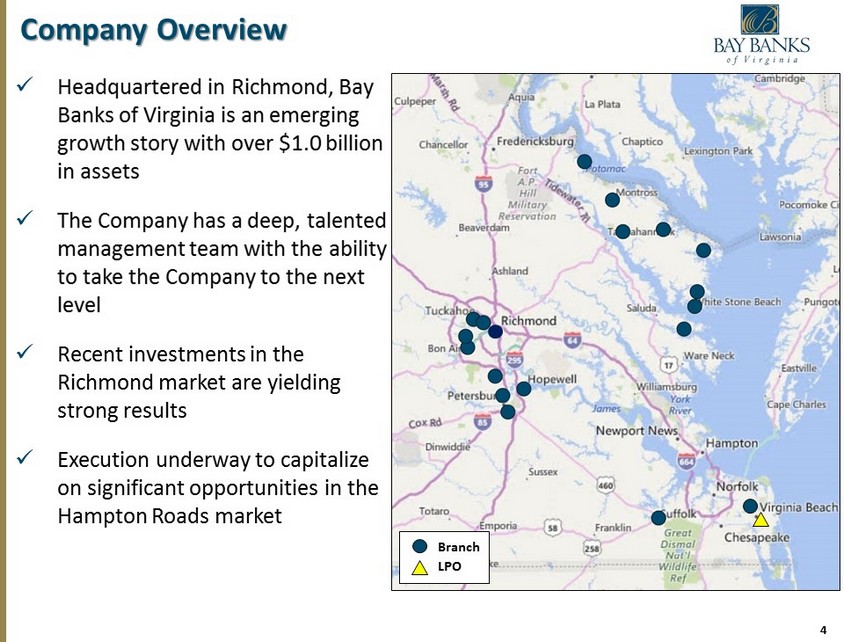
4 Company Overview x Headquartered in Richmond, Bay Banks of Virginia is an emerging growth story with over $1.0 billion in assets x The Company has a deep, talented management team with the ability to take the Company to the next level x Recent investments in the Richmond market are yielding strong results x Execution underway to capitalize on significant opportunities in the Hampton Roads market Branch LPO
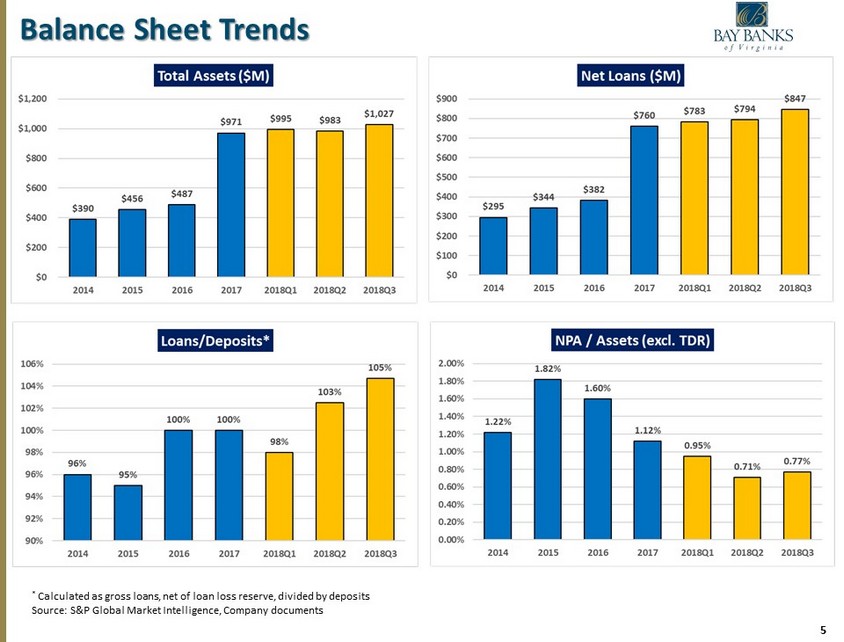
5 Balance Sheet Trends * Calculated as gross loans, net of loan loss reserve, divided by deposits Source: S&P Global Market Intelligence, Company documents
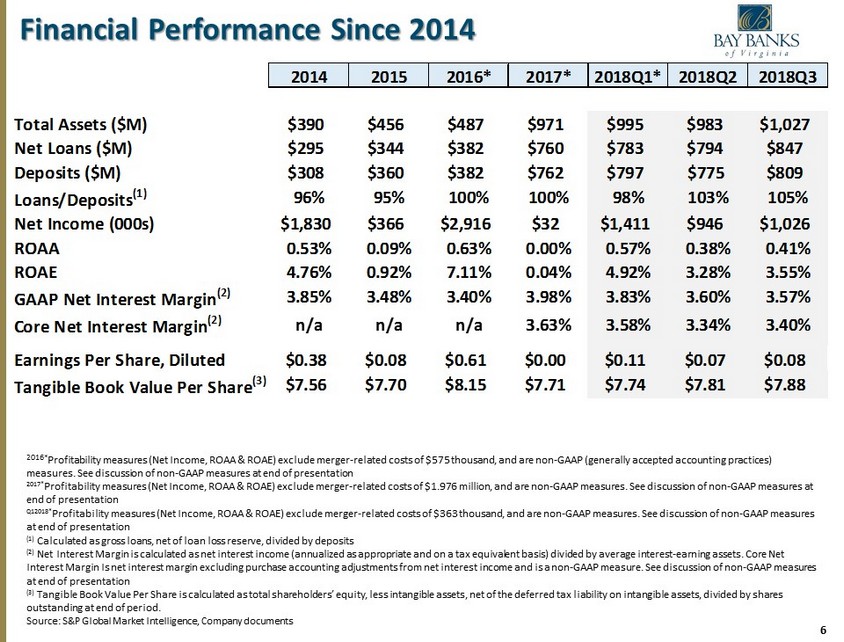
6 Financial Performance Since 2014 2016* P rofitability measures (Net Income, ROAA & ROAE) exclude merger - related costs of $575 thousand, and are non - GAAP (generally accepted accounting practices) measures. S ee discussion of non - GAAP measures at end of presentation 2017* P rofitability measures (Net Income, ROAA & ROAE) exclude merger - related costs of $1.976 million, and are non - GAAP measures. See discussion of non - GAAP measures at end of presentation Q12018* P rofitability measures (Net Income, ROAA & ROAE) exclude merger - related costs of $363 thousand, and are non - GAAP measures. See discussion of non - GAAP measures at end of presentation (1) Calculated as gross loans, net of loan loss reserve, divided by deposits (2) Net Interest Margin is calculated as net interest income (annualized as appropriate and on a tax equivalent basis) divided by average interest - earning assets. Core Net Interest Margin Is net interest margin excluding p urchase a ccounting adjustments from net interest income and is a non - GAAP measure. See discussion of non - GAAP measures at end of presentation (3) Tangible Book Value Per Share is calculated as total shareholders’ equity, less intangible assets, net of the deferred tax liability on intangible assets, divided by shares outstanding at end of period. Source: S&P Global Market Intelligence , Company documents 2014 2015 2016* 2017* 2018Q1* 2018Q2 2018Q3 2014 2015 2016 2017 2018Q1 2018Q2 2018Q3 Total Assets ($M) $390 $456 $487 $971 $995 $983 $1,027 Net Loans ($M) $295 $344 $382 $760 $783 $794 $847 Deposits ($M) $308 $360 $382 $762 $797 $775 $809 Loans/Deposits (1) 96% 95% 100% 100% 98% 103% 105% Net Income (000s) $1,830 $366 $2,916 $32 $1,411 $946 $1,026 ROAA 0.53% 0.09% 0.63% 0.00% 0.57% 0.38% 0.41% ROAE 4.76% 0.92% 7.11% 0.04% 4.92% 3.28% 3.55% GAAP Net Interest Margin (2) 3.85% 3.48% 3.40% 3.98% 3.83% 3.60% 3.57% Core Net Interest Margin (2) n/a n/a n/a 3.63% 3.58% 3.34% 3.40% Earnings Per Share, Diluted $0.38 $0.08 $0.61 $0.00 $0.11 $0.07 $0.08 Tangible Book Value Per Share (3) $7.56 $7.70 $8.15 $7.71 $7.74 $7.81 $7.88
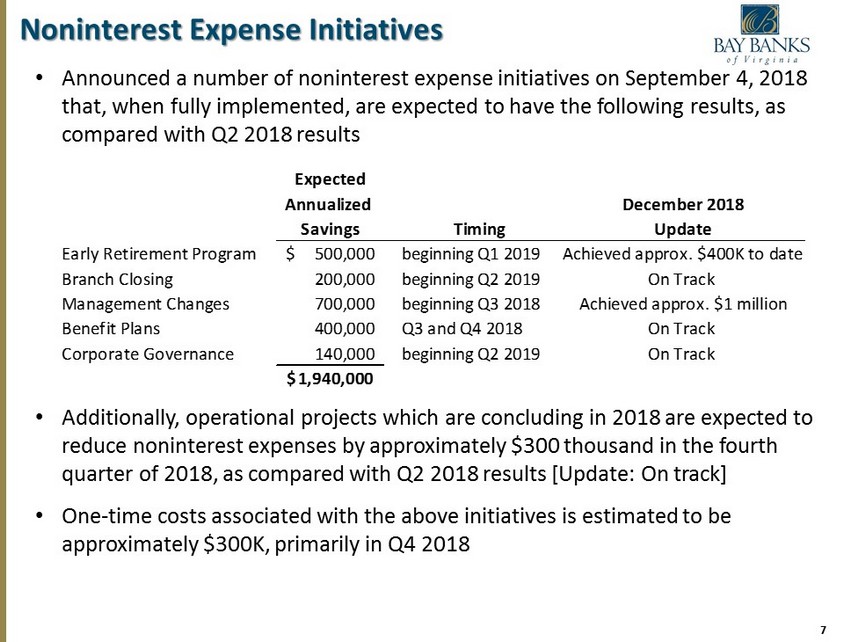
7 Noninterest Expense Initiatives • Announced a number of noninterest expense initiatives on September 4, 2018 that, when fully implemented, are expected to have the following results, as compared with Q2 2018 results • Additionally, operational projects which are concluding in 2018 are expected to reduce noninterest expenses by approximately $300 thousand in the fourth quarter of 2018, as compared with Q2 2018 results [Update: On track] • One - time costs associated with the above initiatives is estimated to be approximately $300K, primarily in Q4 2018 Expected Annualized December 2018 Savings Timing Update Early Retirement Program 500,000$ beginning Q1 2019 Achieved approx. $400K to date Branch Closing 200,000 beginning Q2 2019 On Track Management Changes 700,000 beginning Q3 2018 Achieved approx. $1 million Benefit Plans 400,000 Q3 and Q4 2018 On Track Corporate Governance 140,000 beginning Q2 2019 On Track 1,940,000$
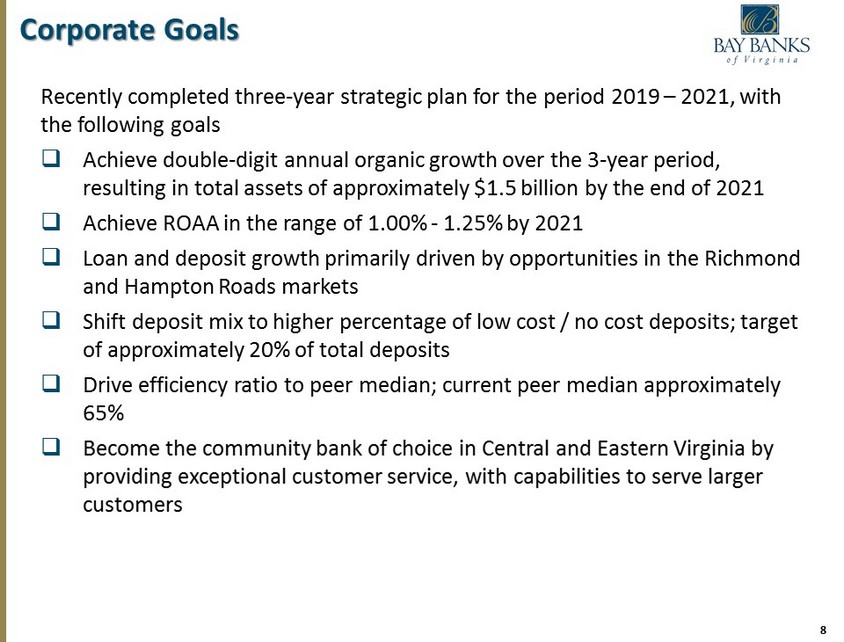
8 Recently completed three - year s trategic plan for the period 2019 – 2021, with the following goals □ Achieve double - digit annual organic growth over the 3 - year period, resulting in total assets of approximately $1.5 billion by the end of 2021 □ Achieve ROAA in the range of 1.00% - 1.25% by 2021 □ Loan and deposit growth primarily driven by opportunities in the Richmond and Hampton Roads markets □ Shift deposit mix to higher percentage of low cost / no cost deposits; target of approximately 20% of total deposits □ Drive efficiency r atio to peer median; current peer median approximately 65% □ Become the community bank of choice in Central and Eastern Virginia by providing exceptional customer service, with capabilities to serve larger customers Corporate Goals
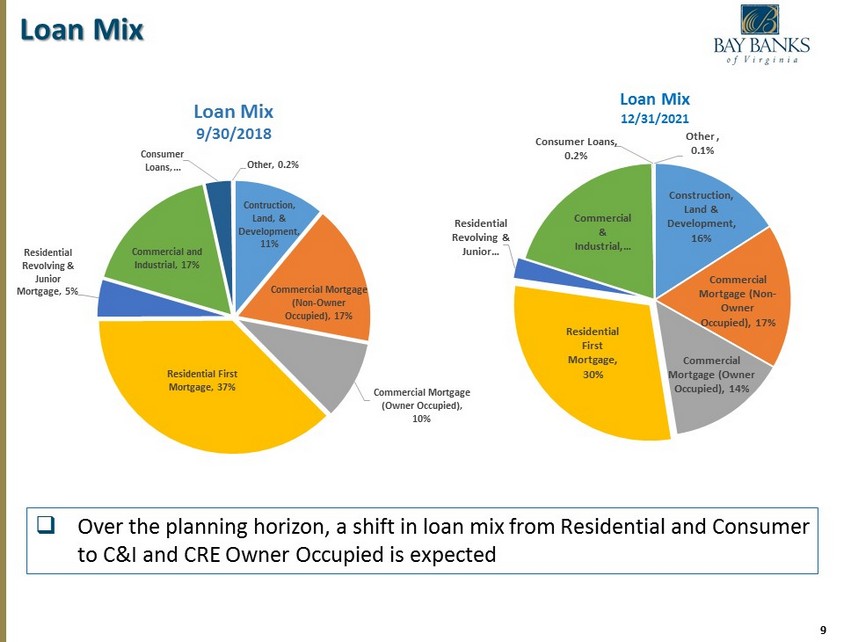
9 Loan Mix Construction, Land & Development , 16% Commercial Mortgage (Non - Owner Occupied) , 17% Commercial Mortgage (Owner Occupied) , 14% Residential First Mortgage , 30% Residential Revolving & Junior … Commercial & Industrial , … Consumer Loans , 0.2% Other , 0.1% Loan Mix 12/31/2021 □ Over the planning horizon, a shift in loan mix from Residential and Consumer to C&I and CRE Owner Occupied is expected Contruction, Land, & Development , 11% Commercial Mortgage (Non - Owner Occupied) , 17% Commercial Mortgage (Owner Occupied) , 10% Residential First Mortgage , 37% Residential Revolving & Junior Mortgage , 5% Commercial and Industrial , 17% Consumer Loans , … Other , 0.2% Loan Mix 9/30/2018
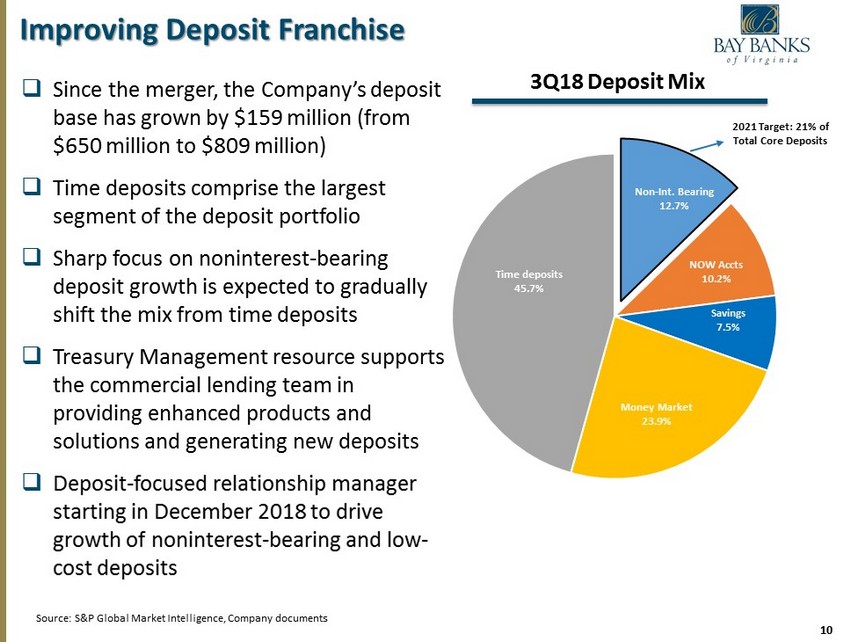
10 Non - Int. Bearing 12.7% NOW Accts 10.2% Savings 7.5% Money Market 23.9% Time deposits 45.7% 2021 Target: 21% of Total Core Deposits Source : S&P Global Market Intelligence, Company documents Improving Deposit Franchise 3 Q18 Deposit Mix □ Since the merger , the Company’s deposit base has grown by $159 million (from $650 million to $809 million) □ Time deposits comprise the largest segment of the deposit portfolio □ Sharp focus on noninterest - bearing deposit growth is expected to gradually shift the mix from time deposits □ Treasury Management resource supports the commercial lending team in providing enhanced products and solutions and generating new deposits □ Deposit - focused relationship manager starting in December 2018 to drive growth of noninterest - bearing and low - cost deposits
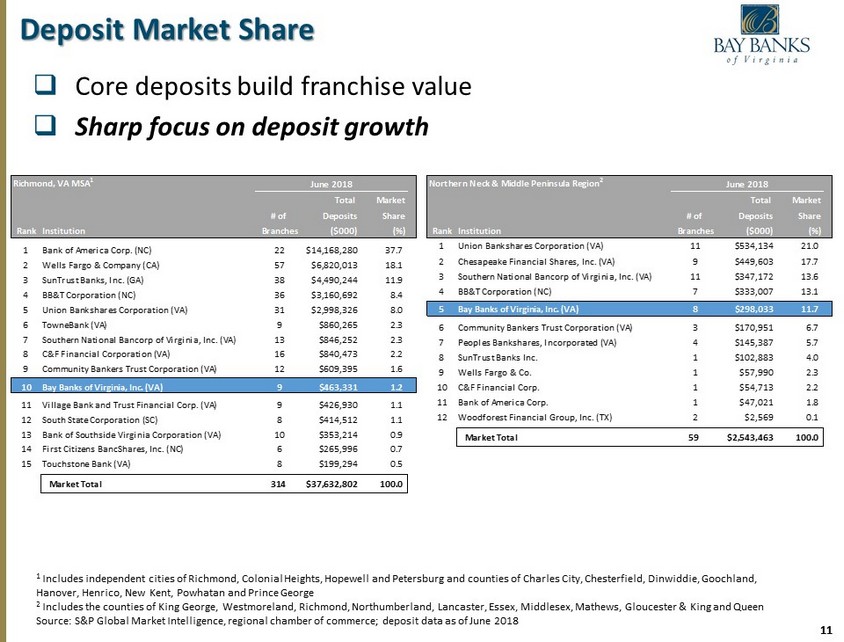
11 Deposit Market Share □ Core deposits build franchise value □ Sharp focus on deposit growth Northern Neck & Middle Peninsula Region 2 Total Market # of Deposits Share Rank Institution Branches ($000) (%) 1 Union Bankshares Corporation (VA) 11 $534,134 21.0 2 Chesapeake Financial Shares, Inc. (VA) 9 $449,603 17.7 3 Southern National Bancorp of Virginia, Inc. (VA) 11 $347,172 13.6 4 BB&T Corporation (NC) 7 $333,007 13.1 5 Bay Banks of Virginia, Inc. (VA) 8 $298,033 11.7 6 Community Bankers Trust Corporation (VA) 3 $170,951 6.7 7 Peoples Bankshares, Incorporated (VA) 4 $145,387 5.7 8 SunTrust Banks Inc. 1 $102,883 4.0 9 Wells Fargo & Co. 1 $57,990 2.3 10 C&F Financial Corp. 1 $54,713 2.2 11 Bank of America Corp. 1 $47,021 1.8 12 Woodforest Financial Group, Inc. (TX) 2 $2,569 0.1 Market Total 59 $2,543,463 100.0 June 2018 1 Includes independent cities of Richmond, Colonial Heights, Hopewell and Petersburg and counties of Charles City, Chesterfield , Dinwiddie, Goochland, Hanover, Henrico, New Kent, Powhatan and Prince George 2 Includes the counties of King George, Westmoreland, Richmond, Northumberland, Lancaster, Essex, Middlesex, Mathews, Glouceste r & King and Queen Source: S&P Global Market Intelligence, regional chamber of commerce; deposit data as of June 2018 Richmond, VA MSA 1 Total Market # of Deposits Share Rank Institution Branches ($000) (%) 1 Bank of America Corp. (NC) 22 $14,168,280 37.7 2 Wells Fargo & Company (CA) 57 $6,820,013 18.1 3 SunTrust Banks, Inc. (GA) 38 $4,490,244 11.9 4 BB&T Corporation (NC) 36 $3,160,692 8.4 5 Union Bankshares Corporation (VA) 31 $2,998,326 8.0 6 TowneBank (VA) 9 $860,265 2.3 7 Southern National Bancorp of Virginia, Inc. (VA) 13 $846,252 2.3 8 C&F Financial Corporation (VA) 16 $840,473 2.2 9 Community Bankers Trust Corporation (VA) 12 $609,395 1.6 10 Bay Banks of Virginia, Inc. (VA) 9 $463,331 1.2 11 Village Bank and Trust Financial Corp. (VA) 9 $426,930 1.1 12 South State Corporation (SC) 8 $414,512 1.1 13 Bank of Southside Virginia Corporation (VA) 10 $353,214 0.9 14 First Citizens BancShares, Inc. (NC) 6 $265,996 0.7 15 Touchstone Bank (VA) 8 $199,294 0.5 Market Total 314 $37,632,802 100.0 June 2018
12 Investment Opportunity x With over $1.0 billion in assets, Bay Banks of Virginia is the third largest community bank headquartered in Richmond and 16 th largest in the Commonwealth of Virginia x Deep, talented leadership team with the ability to take the Company to the next level x Emerging growth story with significant opportunities in Richmond and Hampton Roads markets x The Company expects improving profitability in near term future quarters as investments in Richmond and Hampton Roads markets are realized and results of certain noninterest expense initiatives are achieved
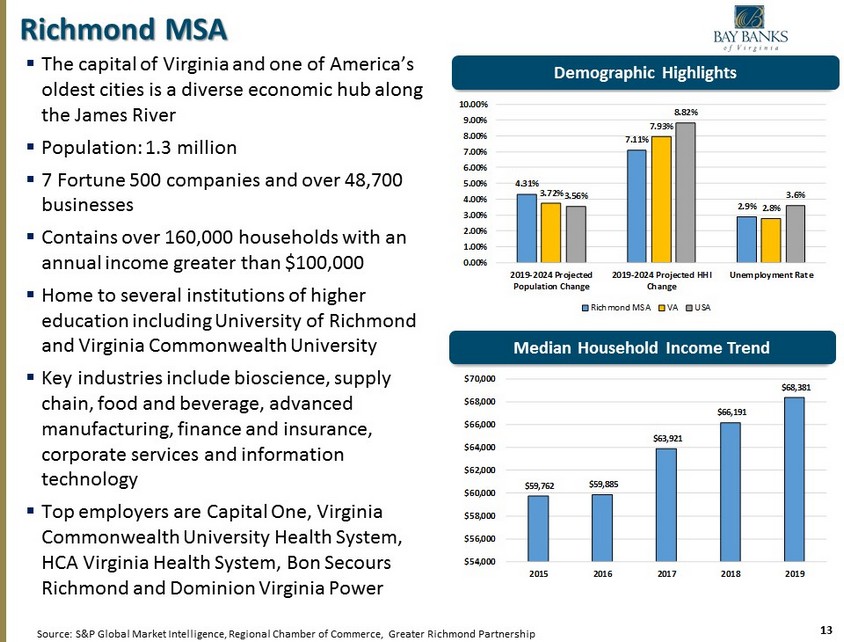
13 Richmond MSA Demographic Highlights Source: S&P Global Market Intelligence, Regional Chamber of Commerce, Greater Richmond Partnership Median Household Income Trend $59,762 $59,885 $63,921 $66,191 $68,381 $54,000 $56,000 $58,000 $60,000 $62,000 $64,000 $66,000 $68,000 $70,000 2015 2016 2017 2018 2019 4.31% 7.11% 2.9% 3.72% 7.93% 2.8% 3.56% 8.82% 3.6% 0.00% 1.00% 2.00% 3.00% 4.00% 5.00% 6.00% 7.00% 8.00% 9.00% 10.00% 2019-2024 Projected Population Change 2019-2024 Projected HHI Change Unemployment Rate Richmond MSA VA USA ▪ The capital of Virginia and one of America’s oldest cities is a diverse economic hub along the James River ▪ Population: 1.3 million ▪ 7 Fortune 500 companies and over 48,700 businesses ▪ Contains over 160,000 households with an annual income greater than $100,000 ▪ Home to several institutions of higher education including University of Richmond and Virginia Commonwealth University ▪ Key industries include bioscience, supply chain, food and beverage, advanced manufacturing, finance and insurance, corporate services and information technology ▪ Top employers are Capital One, Virginia Commonwealth University Health System, HCA Virginia Health System, Bon Secours Richmond and Dominion Virginia Power
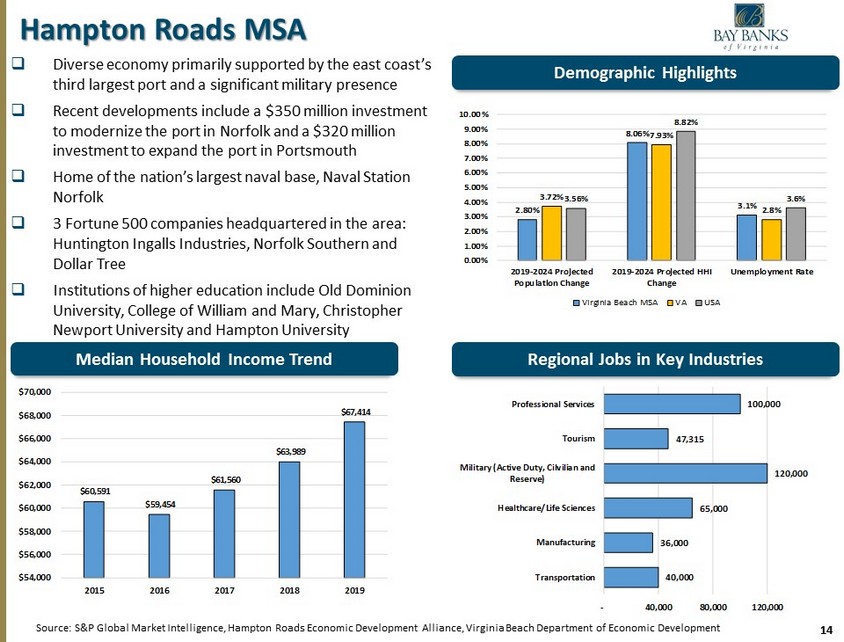
14 $60,591 $59,454 $61,560 $63,989 $67,414 $54,000 $56,000 $58,000 $60,000 $62,000 $64,000 $66,000 $68,000 $70,000 2015 2016 2017 2018 2019 40,000 36,000 65,000 120,000 47,315 100,000 - 40,000 80,000 120,000 Transportation Manufacturing Healthcare/Life Sciences Military (Active Duty, Cilvilian and Reserve) Tourism Professional Services 2.80% 8.06% 3.1% 3.72% 7.93% 2.8% 3.56% 8.82% 3.6% 0.00% 1.00% 2.00% 3.00% 4.00% 5.00% 6.00% 7.00% 8.00% 9.00% 10.00% 2019-2024 Projected Population Change 2019-2024 Projected HHI Change Unemployment Rate Virginia Beach MSA VA USA Hampton Roads MSA Demographic Highlights □ Diverse economy primarily supported by the east coast’s third largest port and a significant military presence □ Recent developments include a $350 million investment to modernize the port in Norfolk and a $320 million investment to expand the port in Portsmouth □ Home of the nation’s largest naval base, Naval Station Norfolk □ 3 Fortune 500 companies headquartered in the area: Huntington Ingalls Industries, Norfolk Southern and Dollar Tree □ Institutions of higher education include Old Dominion University, College of William and Mary, Christopher Newport University and Hampton University Source: S&P Global Market Intelligence, Hampton Roads Economic Development Alliance, Virginia Beach Department of Economic De vel opment Regional Jobs in Key Industries Median Household Income Trend
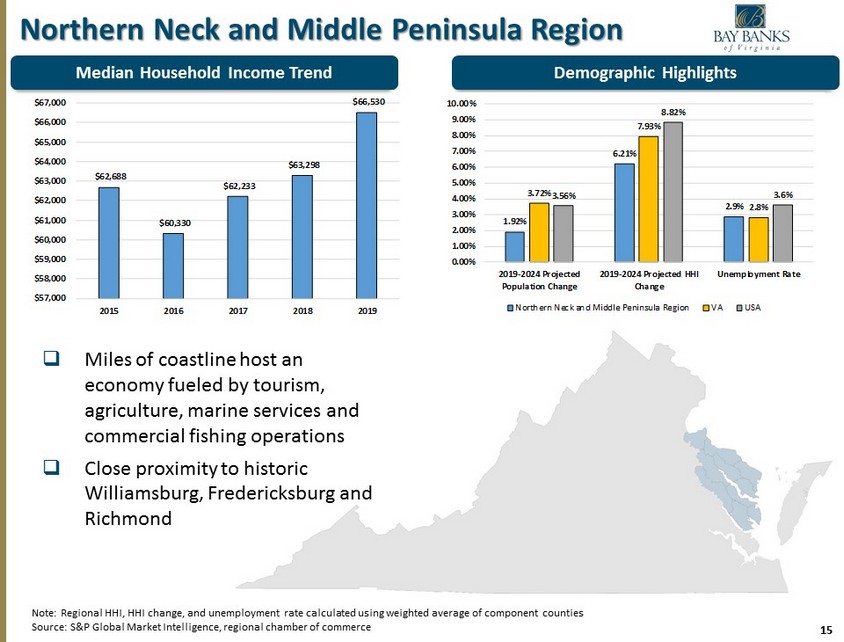
15 Northern Neck and Middle Peninsula Region Demographic Highlights □ Miles of coastline host an economy fueled by tourism, agriculture, marine services and commercial fishing operations □ Close proximity to historic Williamsburg, Fredericksburg and Richmond Note: Regional HHI, HHI change, and unemployment rate calculated using weighted average of component counties Source: S&P Global Market Intelligence, regional chamber of commerce 1.92% 6.21% 2.9% 3.72% 7.93% 2.8% 3.56% 8.82% 3.6% 0.00% 1.00% 2.00% 3.00% 4.00% 5.00% 6.00% 7.00% 8.00% 9.00% 10.00% 2019-2024 Projected Population Change 2019-2024 Projected HHI Change Unemployment Rate Northern Neck and Middle Peninsula Region VA USA $62,688 $60,330 $62,233 $63,298 $66,530 $57,000 $58,000 $59,000 $60,000 $61,000 $62,000 $63,000 $64,000 $65,000 $66,000 $67,000 2015 2016 2017 2018 2019 Median Household Income Trend
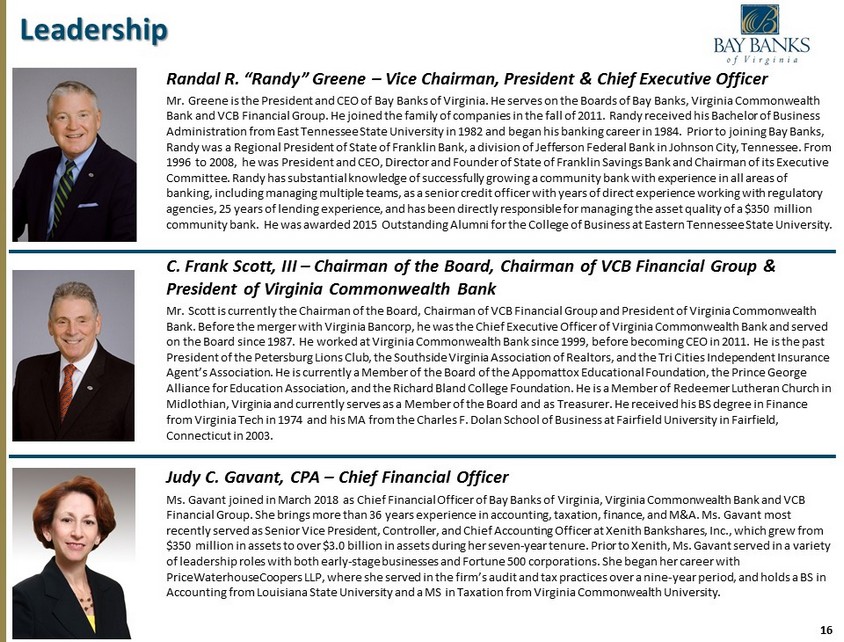
16 Randal R. “Randy” Greene – Vice Chairman, President & Chief Executive Officer Mr. Greene is the President and CEO of Bay Banks of Virginia. He serves on the Boards of Bay Banks, Virginia Commonwealth Bank and VCB Financial Group. He joined the family of companies in the fall of 2011. Randy received his Bachelor of Business Administration from East Tennessee State University in 1982 and began his banking career in 1984. Prior to joining Bay Banks, Randy was a Regional President of State of Franklin Bank, a division of Jefferson Federal Bank in Johnson City, Tennessee. From 1996 to 2008, he was President and CEO, Director and Founder of State of Franklin Savings Bank and Chairman of its Executive Committee. Randy has substantial knowledge of successfully growing a community bank with experience in all areas of banking, including managing multiple teams, as a senior credit officer with years of direct experience working with regulator y agencies, 25 years of lending experience, and has been directly responsible for managing the asset quality of a $350 million community bank. He was awarded 2015 Outstanding Alumni for the College of Business at Eastern Tennessee State University. C. Frank Scott, III – Chairman of the Board, Chairman of VCB Financial Group & President of Virginia Commonwealth Bank Mr. Scott is currently the Chairman of the Board, Chairman of VCB Financial Group and President of Virginia Commonwealth Bank. Before the merger with Virginia Bancorp, he was the Chief Executive Officer of Virginia Commonwealth Bank and served on the Board since 1987. He worked at Virginia Commonwealth Bank since 1999, before becoming CEO in 2011. He is the past President of the Petersburg Lions Club, the Southside Virginia Association of Realtors, and the Tri Cities Independent Insura nce Agent’s Association. He is currently a Member of the Board of the Appomattox Educational Foundation, the Prince George Alliance for Education Association, and the Richard Bland College Foundation. He is a Member of Redeemer Lutheran Church in Midlothian, Virginia and currently serves as a Member of the Board and as Treasurer. He received his BS degree in Finance from Virginia Tech in 1974 and his MA from the Charles F. Dolan School of Business at Fairfield University in Fairfield, Connecticut in 2003. Judy C. Gavant, CPA – Chief Financial Officer Ms. Gavant joined in March 2018 as Chief Financial Officer of Bay Banks of Virginia, Virginia Commonwealth Bank and VCB Financial Group. She brings more than 36 years experience in accounting, taxation, finance, and M&A. Ms. Gavant most recently served as Senior Vice President, Controller, and Chief Accounting Officer at Xenith Bankshares, Inc., which grew fro m $350 million in assets to over $3.0 billion in assets during her seven - year tenure. Prior to Xenith, Ms. Gavant served in a variety of leadership roles with both early - stage businesses and Fortune 500 corporations. She began her career with PriceWaterhouseCoopers LLP, where she served in the firm’s audit and tax practices over a nine - year period, and holds a BS in Accounting from Louisiana State University and a MS in Taxation from Virginia Commonwealth University. Leadership
17 Douglas F. Jenkins, Jr. – Chief Banking Officer Mr. Jenkins serves as Executive Vice President and Chief Banking Officer of Virginia Commonwealth Bank and Bay Banks of Virginia. Prior to the merger with Virginia Bancorp, he was Executive Vice President and Chief Banking Officer of Bank of Lancaster. Mr. Jenkins served as Senior Vice President of Bank of Lancaster from December 2009 until December 2011 and served as Senior Lending Officer from May 2008 until April 2013. From June 2011 until April 2013, he served as Retail Delivery Administrator. Prior to joining Bank of Lancaster in 2006 as a Vice President and Business Development Officer, Mr. Jenkins was a Vice President at SunTrust Bank, where he was a member of its Financial Institutions Group. C . Rodes “Dusty” Boyd, Jr . – Chief Lending Officer Mr. Boyd has served as Executive Vice President and Chief Lending Officer of Virginia Commonwealth Bank since April 2017. Mr. Boyd joined Virginia Commonwealth Bank in April 2011 as Executive Vice President and Chief Credit Officer, a role he served in until July 2012. Prior to joining Virginia Commonwealth Bank, Mr. Boyd was a Vice President in Commercial Banking with The Bank of Richmond and Gateway Bank from 2002 until 2009, and was the Richmond Market President for the Bank of Hampton Roads from March 2009 through December 2010. Mr. Boyd is currently serving a two - year term as Chairman of the Lending Executive Committee for the Virginia Bankers Association. Eric F . Nost – President & Chief Executive Officer of VCB Financial Group Mr. Nost, a financial services executive with over 30 years experience, leads Bay Banks’ wealth management subsidiary, VCB Financial Group, as President and CEO. Prior to Bay Banks, he managed a bank - owned investment firm, C&F Wealth Management Corp., building it to over $400 million in assets under management. A U.S. Navy veteran, Mr. Nost is a graduate of Virginia Military Institute, earned an MBA degree from Liberty University, and is a Certified Financial Planner. Leadership
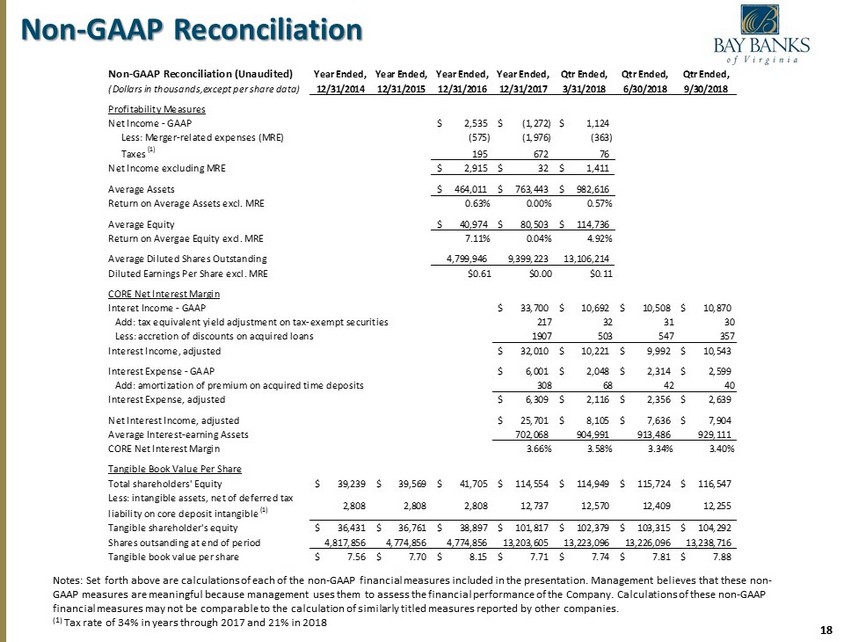
18 Non - GAAP Reconciliation Notes: Set forth above are calculations of each of the non - GAAP financial measures included in the presentation. Management believes that these non - GAAP measures are meaningful because management uses them to assess the financial performance of the Company . Calculations of these non - GAAP financial measures may not be comparable to the calculation of similarly titled measures reported by other companies . (1) Tax rate of 34% in years through 2017 and 21% in 2018 Non-GAAP Reconciliation (Unaudited) Year Ended, Year Ended, Year Ended, Year Ended, Qtr Ended, Qtr Ended, Qtr Ended, (Dollars in thousands,except per share data) 12/31/2014 12/31/2015 12/31/2016 12/31/2017 3/31/2018 6/30/2018 9/30/2018 Profitability Measures Net Income - GAAP 2,535$ (1,272)$ 1,124$ Less: Merger-related expenses (MRE) (575) (1,976) (363) Taxes (1) 195 672 76 Net Income excluding MRE 2,915$ 32$ 1,411$ Average Assets 464,011$ 763,443$ 982,616$ Return on Average Assets excl. MRE 0.63% 0.00% 0.57% Average Equity 40,974$ 80,503$ 114,736$ Return on Avergae Equity excl. MRE 7.11% 0.04% 4.92% Average Diluted Shares Outstanding 4,799,946 9,399,223 13,106,214 Diluted Earnings Per Share excl. MRE $0.61 $0.00 $0.11 CORE Net Interest Margin Interet Income - GAAP 33,700$ 10,692$ 10,508$ 10,870$ Add: tax equivalent yield adjustment on tax-exempt securities 217 32 31 30 Less: accretion of discounts on acquired loans 1907 503 547 357 Interest Income, adjusted 32,010$ 10,221$ 9,992$ 10,543$ Interest Expense - GAAP 6,001$ 2,048$ 2,314$ 2,599$ Add: amortization of premium on acquired time deposits 308 68 42 40 Interest Expense, adjusted 6,309$ 2,116$ 2,356$ 2,639$ Net Interest Income, adjusted 25,701$ 8,105$ 7,636$ 7,904$ Average Interest-earning Assets 702,068 904,991 913,486 929,111 CORE Net Interest Margin 3.66% 3.58% 3.34% 3.40% Tangible Book Value Per Share Total shareholders' Equity 39,239$ 39,569$ 41,705$ 114,554$ 114,949$ 115,724$ 116,547$ Less: intangible assets, net of deferred tax liability on core deposit intangible (1) 2,808 2,808 2,808 12,737 12,570 12,409 12,255 Tangible shareholder's equity 36,431$ 36,761$ 38,897$ 101,817$ 102,379$ 103,315$ 104,292$ Shares outsanding at end of period 4,817,856 4,774,856 4,774,856 13,203,605 13,223,096 13,226,096 13,238,716 Tangible book value per share 7.56$ 7.70$ 8.15$ 7.71$ 7.74$ 7.81$ 7.88$
www.vcb.bank