Attached files
| file | filename |
|---|---|
| EX-99.1 - EX-99.1 - RTW Retailwinds, Inc. | a18-40923_1ex99d1.htm |
| 8-K - 8-K - RTW Retailwinds, Inc. | a18-40923_18k.htm |
Cautionary Statement Regarding Forward Looking Statements This presentation contains forward-looking statements, including statements made within the meaning of the safe harbor provisions of the United States Private Securities Litigation Reform Act of 1995. Some of these statements can be identified by terms and phrases such as “expect,” “anticipate,” “believe,” “intend,” “estimate,” “continue,” “could,” “may,” “plan,” “project,” “predict,” and similar expressions and references to assumptions that the Company believes are reasonable and relate to its future prospects, developments and business strategies. Such statements are subject to various risks and uncertainties that could cause actual results to differ materially. These include, but are not limited to: (i) the Company’s dependence on mall traffic for its sales and the continued reduction in the volume of mall traffic; (ii) the Company’s ability to anticipate and respond to fashion trends; (iii) the impact of general economic conditions and their effect on consumer confidence and spending patterns; (iv) changes in the cost of raw materials, distribution services or labor; (v) the potential for economic conditions to negatively impact the Company's merchandise vendors and their ability to deliver products; (vi) the Company’s ability to open and operate stores successfully; (vii) seasonal fluctuations in the Company’s business; (viii) competition in the Company’s market, including promotional and pricing competition; (ix) the Company’s ability to retain, recruit and train key personnel; (x) the Company’s reliance on third parties to manage some aspects of its business; (xi) the Company’s reliance on foreign sources of production; (xii) the Company’s ability to protect its trademarks and other intellectual property rights; (xiii) the Company’s ability to maintain, and its reliance on, its information technology infrastructure; (xiv) the effects of government regulation; (xv) the control of the Company by its sponsors and any potential change of ownership of those sponsors; and (xvi) other risks and uncertainties as described in the Company’s documents filed with the SEC, including its most recent Annual Report on Form 10-K and subsequent Quarterly Reports on Form 10-Q. The Company undertakes no obligation to revise the forward-looking statements included in this press release to reflect any future events or circumstances.
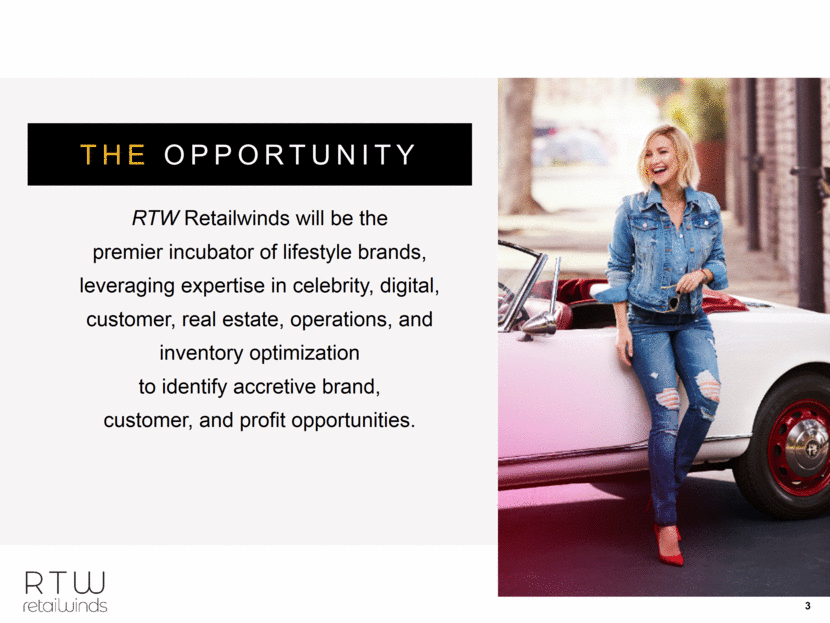
THE OPPORTUNITY RTW Retailwinds will be the premier incubator of lifestyle brands, leveraging expertise in celebrity, digital, customer, real estate, operations, and inventory optimization to identify accretive brand, customer, and profit opportunities.
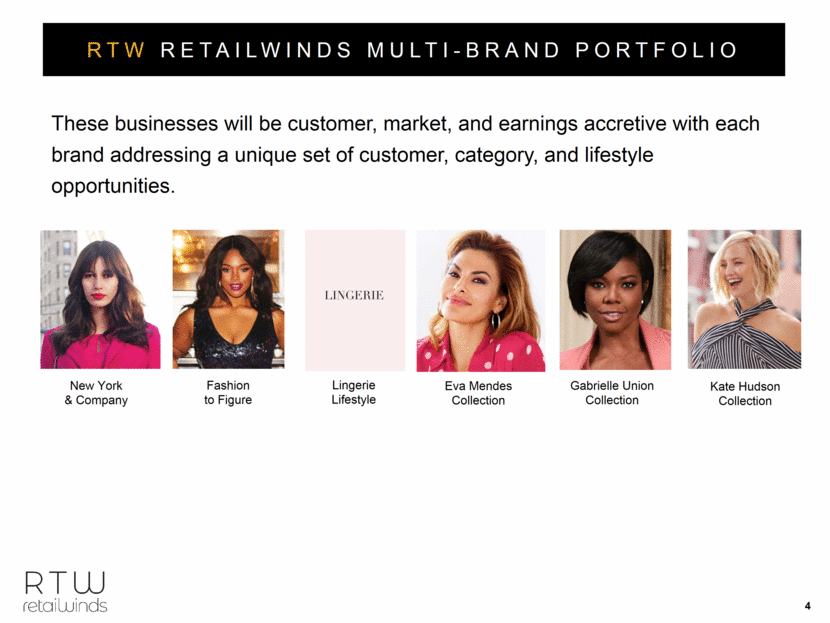
RTW RETAILWINDS MULTI-BRAND PORTFOLIO New York & Company Fashion to Figure Lingerie Lifestyle Eva Mendes Collection Gabrielle Union Collection Kate Hudson Collection These businesses will be customer, market, and earnings accretive with each brand addressing a unique set of customer, category, and lifestyle opportunities.
THE POWER OF THE MULTIBRAND PORTFOLIO NY &C LINGERIE LIFESTYLE FASHION TO FIGURE CELEBRITY BRANDS $1.6 billion opportunity $1 billion opportunity $150 million opportunity $200 million opportunity $250 million opportunity Leverage our expertise in celebrity, design, customer, real estate, operations, ecommerce, and inventory optimization to identify accretive brand, customer, and profit opportunities.
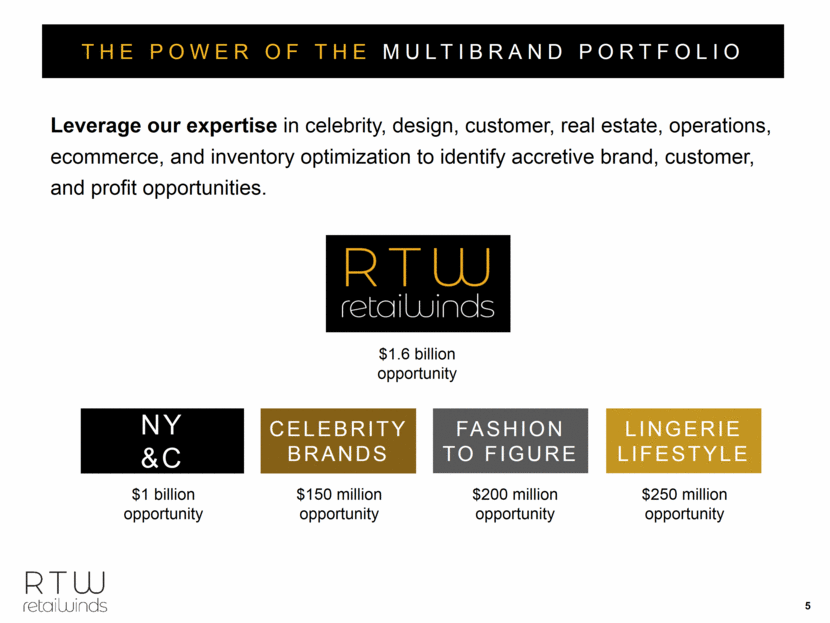
RTW RETAILWINDS STRATEGIC PRIORITIES HARNESS THE POWER OF MULTIBRAND FUEL BRAND INNOVATION DRIVE CUSTOMER AQUISITION INVEST IN DIGITAL AND DATA Capture the full benefit of multibrand structure and synergies. Accelerate product newness across all brands. Maximize opportunities to leverage existing customers and acquire new customers to the multibrand portfolio. Develop capabilities to leverage customer and data analytics, enhanced with investments in digital experience.
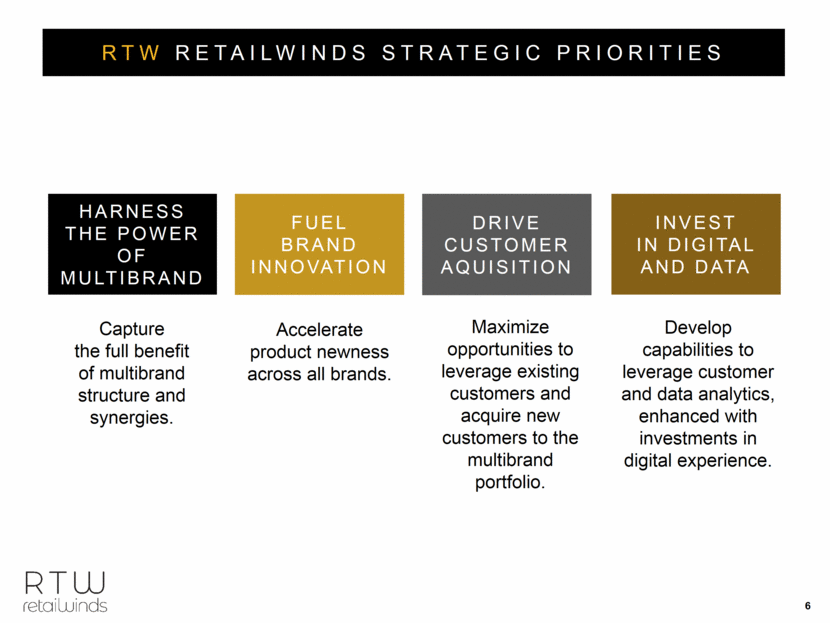
One of the largest women’s specialty retail apparel brands, nearly $1 billion in annual net sales 100 million site visits and 50 million store guests annually Celebrity Partnerships and Sub brands competitive points of assortment differentiation Eva Mendes and Gabrielle Union Partnerships represent nearly 10% of volume Introduction of Kate Hudson as the ambassador for SoHo Jeans sub brand and collection, to launch in March 2019 Lifestyle brand platform with strong sub brands Dominant Digital Channel, representing over 30% of annual volume delivering multi-year double-digit CAGR and 100 million annual visits 100% of store fleet omni-enabled Flexible real estate portfolio Approximately 70% of the fleet’s leases expiring within 2 years Select new store openings in premier centers Closed approximately 150 stores over the past 5 years Approximately $84 million in cash on-hand or $1.26 per share, with no debt Strong, tenured leadership team, with women representing 62% of executive management and 50% of board of directors THE NEW NEW YORK & COMPANY
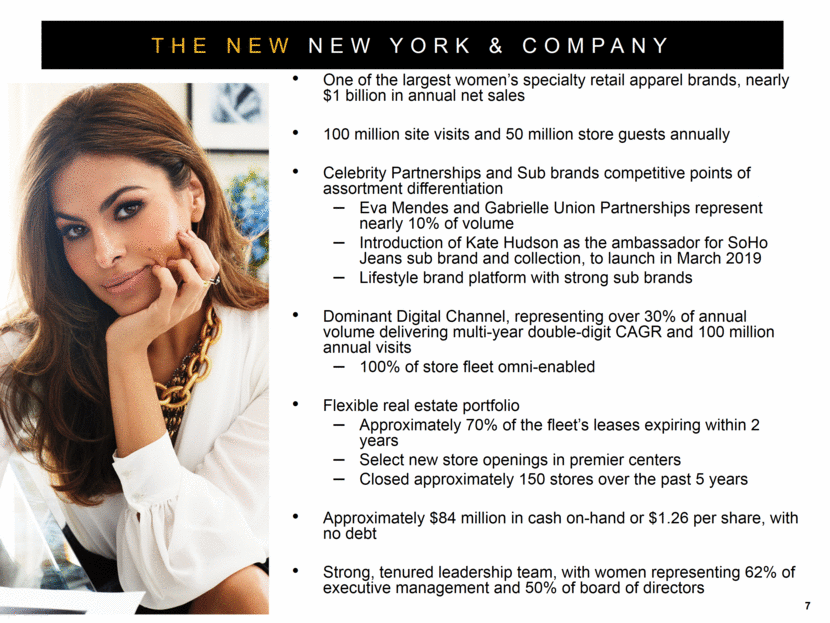
2019 2013 2014 2015 2016 2017 2018 Eva Mendes Collection launches Sep 2013 Eva Mendes Accessories collection launches Eva Mendes Party Apparel, side-by-side & shop-in-shop store concepts introduced in EM Collection. Five new Eva Mendes side-by-side concepts, 16 SBS and 25 SIS total Kate Hudson SoHo Jeans Ambassador Kate Hudson Collection Digital Native site launches Spring, 2019 Gabrielle Union Collection launches. 7th Ave Ambassador 24 new Eva Mendes shop-in- shop and one pop-up concept, 18 SBS and 47 SIS total 2016 Jennifer Hudson, Introduced as SoHo Jeans Brand Ambassador Celebrity Lifestyle Collaborations competitive points of assortment differentiation with the potential to reach 15% share of business. TIMELINE: CELEBRITY LIFESTYLE BRANDS
Q3 2018 RESULTS

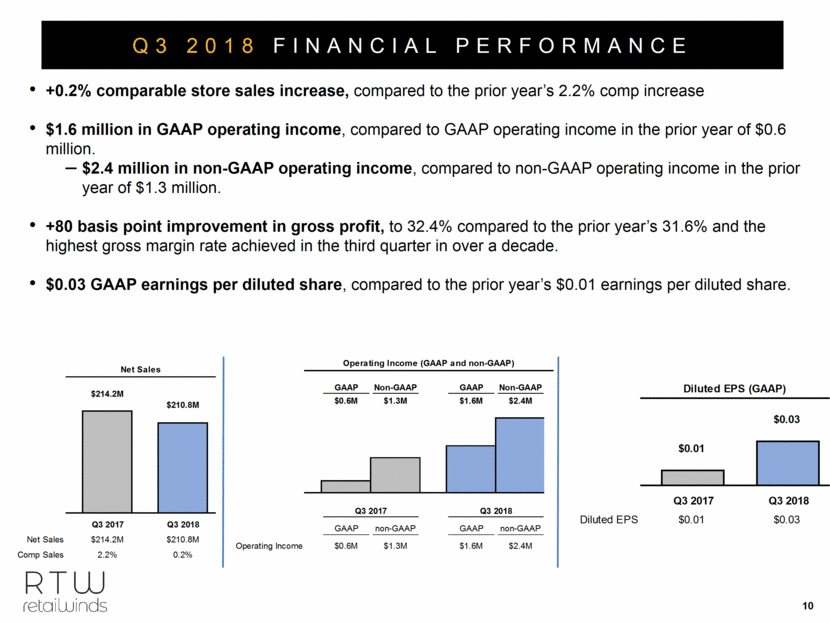
+0.2% comparable store sales increase, compared to the prior year’s 2.2% comp increase $1.6 million in GAAP operating income, compared to GAAP operating income in the prior year of $0.6 million. $2.4 million in non-GAAP operating income, compared to non-GAAP operating income in the prior year of $1.3 million. +80 basis point improvement in gross profit, to 32.4% compared to the prior year’s 31.6% and the highest gross margin rate achieved in the third quarter in over a decade. $0.03 GAAP earnings per diluted share, compared to the prior year’s $0.01 earnings per diluted share. Q3 2018 FINANCIAL PERFORMANCE $214.2M $210.8M Q3 2017 Q3 2018 Net Sales $214.2M $210.8M Comp Sales 2.2% 0.2% Net Sales GAAP Non-GAAP GAAP Non-GAAP $0.6M $1.3M $1.6M $2.4M GAAP non-GAAP GAAP non-GAAP Operating Income $0.6M $1.3M $1.6M $2.4M Operating Income (GAAP and non-GAAP) Q3 2017 Q3 2018 $0.03 $0.01 Q3 2017 Q3 2018 Diluted EPS $0.01 $0.03 Diluted EPS (GAAP)
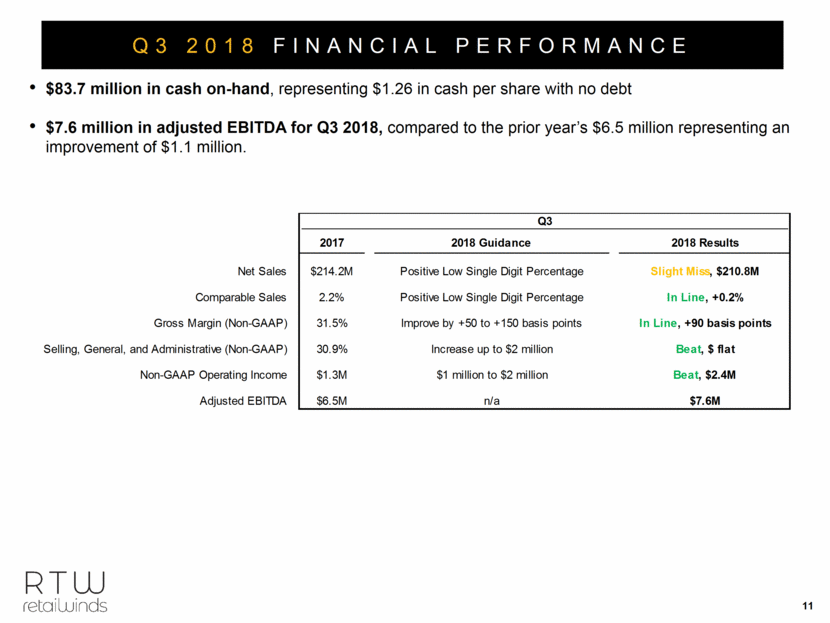
$83.7 million in cash on-hand, representing $1.26 in cash per share with no debt $7.6 million in adjusted EBITDA for Q3 2018, compared to the prior year’s $6.5 million representing an improvement of $1.1 million. Q3 2018 FINANCIAL PERFORMANCE 2017 2018 Guidance 2018 Results Net Sales $214.2M Positive Low Single Digit Percentage Slight Miss , $210.8M Comparable Sales 2.2% Positive Low Single Digit Percentage In Line , +0.2% Gross Margin (Non-GAAP) 31.5% Improve by +50 to +150 basis points In Line , +90 basis points Selling, General, and Administrative (Non-GAAP) 30.9% Increase up to $2 million Beat , $ flat Non-GAAP Operating Income $1.3M $1 million to $2 million Beat , $2.4M Adjusted EBITDA $6.5M n/a $7.6M Q3
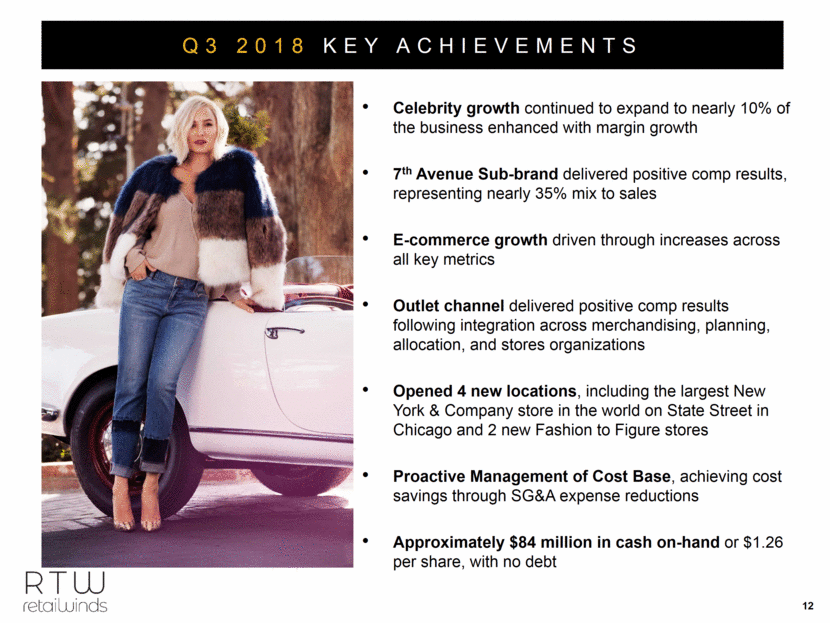
Celebrity growth continued to expand to nearly 10% of the business enhanced with margin growth 7th Avenue Sub-brand delivered positive comp results, representing nearly 35% mix to sales E-commerce growth driven through increases across all key metrics Outlet channel delivered positive comp results following integration across merchandising, planning, allocation, and stores organizations Opened 4 new locations, including the largest New York & Company store in the world on State Street in Chicago and 2 new Fashion to Figure stores Proactive Management of Cost Base, achieving cost savings through SG&A expense reductions Approximately $84 million in cash on-hand or $1.26 per share, with no debt Q3 2018 KEY ACHIEVEMENTS
Q4 2018 OUTLOOK

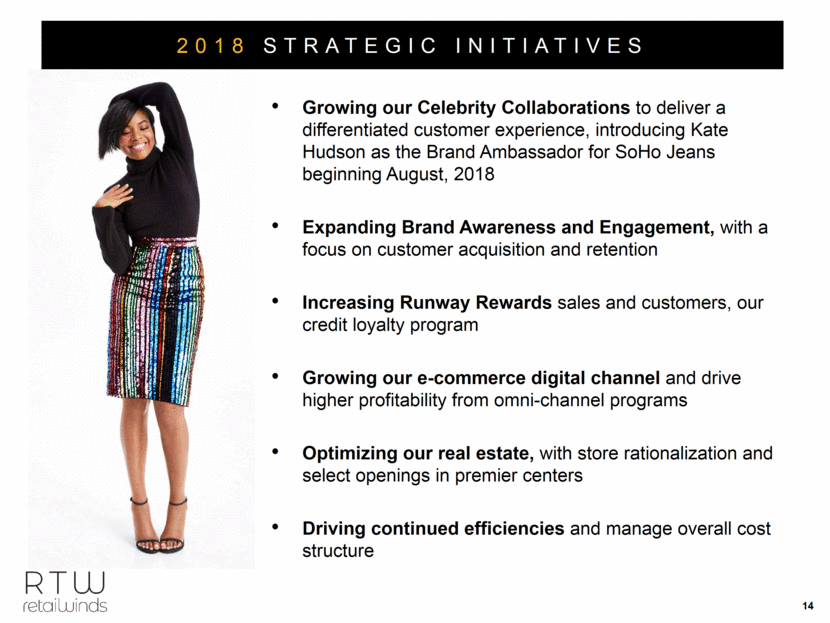
Growing our Celebrity Collaborations to deliver a differentiated customer experience, introducing Kate Hudson as the Brand Ambassador for SoHo Jeans beginning August, 2018 Expanding Brand Awareness and Engagement, with a focus on customer acquisition and retention Increasing Runway Rewards sales and customers, our credit loyalty program Growing our e-commerce digital channel and drive higher profitability from omni-channel programs Optimizing our real estate, with store rationalization and select openings in premier centers Driving continued efficiencies and manage overall cost structure 2018 STRATEGIC INITIATIVES
2Adjusted net sales exclude the impact of the prior year’s 53rd week Q4 2018 GUIDANCE 3Guidance provided as of November 29, 2018 1SG&A includes incremental costs to launch our new celebrity collaboration and investments in strategic business initiatives 2017 2018 Guidance Net Sales $278.7M Down High-Single Digit Percentage Net Sales ex 53rd Week $266.7M Down Mid-Single Digit Percentage Comparable Sales 3.0% Approximately flat Gross Margin (non-GAAP) 29.5% Approximately flat Selling, General, and Administrative (non-GAAP) 27.6% Decrease by $3 million to $4 million 1 Non-GAAP Operating Income $5.3M $1 million to $3 million Adjusted EBITDA $10.6M $6.5 million to $8.5 million Q4
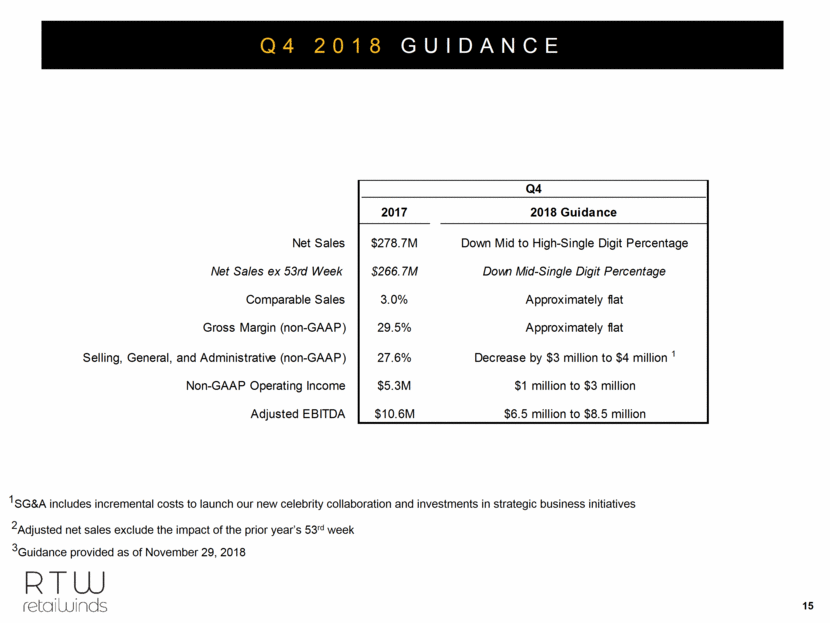
4Guidance provided as of November 29, 2018 1 The increase in SG&A reflects incremental costs to launch our new celebrity collaboration and investments in strategic business initiatives 2Prior year actuals inclusive of the 53rd week FALL SEASON 2018 GUIDANCE 3Adjusted net sales exclude the impact of the prior year’s 53rd week 2017 2018 Guidance Net Sales $492.9M Down Mid-Single Digit Percentage Net Sales ex 53rd Week $480.9M Down Low to Mid-Single Digit Percentage Comparable Sales 2.7% Approximately flat Gross Margin (non-GAAP) 30.4% Improve by up to +50 basis points Selling, General, and Administrative (non-GAAP) 29.0% Increase by approximately 100 basis points 1 GAAP Operating Income $5.6M $2.5 million to $4.5 million Non-GAAP Operating Income $6.5M $3.5 million to $5.5 million Adjusted EBITDA $17.2M $14 million to $16 million Fall Season
APPENDIX
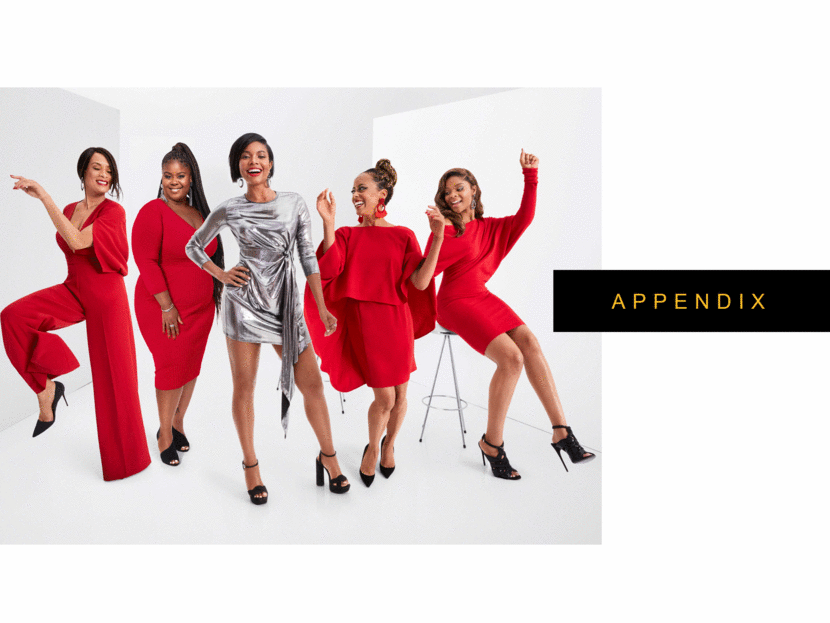
Q3 2018 P&L SUMMARY 2018 % of Sales 2017 % of Sales Net Sales 210,758 $ 214,182 $ Comp% 0.2% 2.2% Gross Profit 68,375 $ 32.4% 67,598 31.6% SG&A Expense 66,802 $ 31.7% 66,980 31.3% Operating Income 1,573 $ 0.7% 618 0.3% Net Income 1,725 $ 0.8% 352 $ 0.2% Earnings Per Diluted Share 0.03 $ 0.01 $ Weighted Average Diluted Shares Outstanding 66,289 64,099 Q3 P&L Summary
[LOGO]
