Attached files
| file | filename |
|---|---|
| EX-32.1 - EX-32.1 - RTW Retailwinds, Inc. | a2231729zex-32_1.htm |
| EX-31.2 - EX-31.2 - RTW Retailwinds, Inc. | a2231729zex-31_2.htm |
| EX-31.1 - EX-31.1 - RTW Retailwinds, Inc. | a2231729zex-31_1.htm |
| EX-23.2 - EX-23.2 - RTW Retailwinds, Inc. | a2231729zex-23_2.htm |
| EX-23.1 - EX-23.1 - RTW Retailwinds, Inc. | a2231729zex-23_1.htm |
| EX-10.12 - EX-10.12 - RTW Retailwinds, Inc. | a2231729zex-10_12.htm |
Use these links to rapidly review the document
TABLE OF CONTENTS
New York & Company, Inc. and Subsidiaries Consolidated Financial Statements Index to Financial Statements
UNITED STATES
SECURITIES AND EXCHANGE COMMISSION
Washington, D.C. 20549
FORM 10-K
ý |
ANNUAL REPORT PURSUANT TO SECTION 13 OR 15(d) OF THE SECURITIES EXCHANGE ACT OF 1934 |
|
For the fiscal year ended January 28, 2017 |
||
OR |
||
o |
TRANSITION REPORT PURSUANT TO SECTION 13 OR 15(d) OF THE SECURITIES EXCHANGE ACT OF 1934 |
|
For the transition period from to |
||
Commission File Number 1-32315
NEW YORK & COMPANY, INC.
(Exact name of registrant as specified in its charter)
| DELAWARE (State or other jurisdiction of incorporation or organization) |
33-1031445 (I.R.S. Employer Identification No.) |
|
330 West 34th Street, 9th Floor, NEW YORK, NEW YORK (Address of principal executive offices) |
10001 (Zip Code) |
(212) 884-2000
(Registrant's telephone number, including area code)
Securities registered pursuant to Section 12(b) of the Act:
| Title of each class | Name of each exchange on which registered | |
|---|---|---|
| Common Stock, par value $0.001 per share | New York Stock Exchange |
Securities registered pursuant to Section 12(g) of the Act: None.
(Title of Class)
Indicate by check mark if the registrant is a well-known seasoned issuer, as defined in Rule 405 of the Securities Act. Yes o No ý
Indicate by check mark if the registrant is not required to file reports pursuant to Section 13 or 15(d) of the Act. Yes o No ý
Indicate by check mark whether the registrant (1) has filed all reports required to be filed by Section 13 or 15(d) of the Exchange Act during the preceding 12 months (or for such shorter period that the registrant was required to file such reports), and (2) has been subject to such filing requirements for the past 90 days. Yes ý No o
Indicate by check mark whether the registrant has submitted electronically and posted on its corporate Web site, if any, every Interactive Data File required to be submitted and posted pursuant to Rule 405 of Regulation S-T (§ 232.405 of this chapter) during the preceding 12 months (or for such shorter period that the registrant was required to submit and post such files). Yes ý No o
Indicate by check mark if disclosure of delinquent filers pursuant to Item 405 of Regulation S-K is not contained herein, and will not be contained, to the best of registrant's knowledge, in definitive proxy or information statements incorporated by reference in Part III of this Form 10-K or any amendment to this Form 10-K. o
Indicate by check mark if the registrant is a large accelerated filer, an accelerated filer, a non-accelerated filer, or a smaller reporting company. See the definitions of "large accelerated filer," "accelerated filer" and "smaller reporting company" in Rule 12b-2 of the Exchange Act. (Check one):
| Large accelerated filer o | Accelerated filer ý | Non-accelerated filer o (Do not check if a smaller reporting company) |
Smaller reporting company o |
Indicate by check mark whether the registrant is a shell company (as defined in Rule 12b-2 of the Exchange Act). Yes o No ý
The aggregate market value of common stock held by non-affiliates as of July 29, 2016 was approximately $58.1 million, using the closing price per share of $1.86, as reported on the New York Stock Exchange as of such date.
The number of shares of registrant's common stock outstanding as of March 31, 2017 was 64,202,092.
DOCUMENTS INCORPORATED BY REFERENCE:
Part III incorporates certain information by reference to the Proxy Statement for the 2017 Annual Meeting of Stockholders.
ANNUAL REPORT ON FORM 10-K INDEX
2
Special Note Regarding Forward-Looking Statements
This Annual Report on Form 10-K includes forward-looking statements intended to qualify for safe harbors from liability established by the Private Securities Litigation Reform Act of 1995. Some of these statements can be identified by terms and phrases such as "anticipate," "believe," "intend," "estimate," "expect," "continue," "could," "may," "plan," "project," "predict" and similar expressions and include references to assumptions that the Company believes are reasonable and relate to its future prospects, developments and business strategies. Factors that could cause the Company's actual results to differ materially from those expressed or implied in such forward-looking statements include, but are not limited to, those discussed under the headings "Item 1A. Risk Factors" and "Item 7A. Quantitative and Qualitative Disclosures About Market Risk" in this Annual Report on Form 10-K.
The Company undertakes no obligation to revise the forward looking statements included in this Annual Report on Form 10-K to reflect any future events or circumstances. The Company's actual results, performance or achievements could differ materially from the results expressed or implied by these forward looking statements.
Overview
New York & Company, Inc. (together with its subsidiaries, the "Company") is a specialty retailer of women's fashion apparel and accessories, and the modern wear-to-work destination for women, providing fashion that is feminine, polished, on-trend and versatile. New York & Company, Inc. helps its customers feel confident, put-together, attractive and stylish by providing affordable fashion. The Company's proprietary branded New York & Company® merchandise is sold through its national network of retail stores and online at www.nyandcompany.com. The target customers for the Company's merchandise are women between the ages of 25 and 45. As of January 28, 2017, the Company operated 466 stores, including 123 New York & Company Outlet stores ("Outlets"), in 39 states.
The Company offers a merchandise assortment consisting of wear-to-work, casual apparel and accessories, including pants, dresses, jackets, knit tops, blouses, sweaters, denim, t-shirts, activewear, handbags, jewelry and shoes. The Company's merchandise reflects current fashions and fulfills a broad spectrum of its customers' lifestyle and wardrobe requirements.
The Company positions its retail stores and eCommerce store as a source of fashion, quality and value by providing its customers with an appealing merchandise assortment at attractive price points, generally below those of department stores and other specialty retailers. The Company's stores are typically concentrated in medium to large population centers of the United States and are located in shopping malls, lifestyle centers, outlet centers, and off-mall locations, including urban street locations.
The Company was founded in 1918 and operated as a subsidiary of L Brands, Inc. (NYSE: LB) ("L Brands"), formerly known as Limited Brands, Inc., from 1985 to 2002. New York & Company, Inc., formerly known as NY & Co. Group, Inc., was incorporated in the state of Delaware on November 8, 2002. It was formed to acquire all of the outstanding stock of Lerner New York Holding, Inc. ("Lerner Holding") and its subsidiaries from L Brands, an unrelated company. On November 27, 2002, Irving Place Capital, formerly known as Bear Stearns Merchant Banking, completed the acquisition of Lerner Holding and its subsidiaries from L Brands (the "acquisition of Lerner Holding"). On October 6, 2004, the Company completed an initial public offering and listed its common stock on the New York Stock Exchange.
The Company's fiscal year is a 52- or 53-week year that ends on the Saturday closest to January 31. The 52-week years ended January 28, 2017, January 30, 2016, and January 31, 2015 are
3
referred to herein as "fiscal year 2016," "fiscal year 2015," and "fiscal year 2014," respectively. The 53-week year ending February 3, 2018 is referred to herein as "fiscal year 2017."
The Company's Growth Strategies
Evolve as a Broader Lifestyle Brand
The Company's key merchandise initiatives and sub-brand strategy, highlighted by its celebrity partnerships, provide customers with trending fashion and a versatile assortment that the Company believes will broaden its reach as a lifestyle brand. Under the New York & Company brand, the Company currently has the following sub-brands: 7th Avenue Design Studio, Soho Jeans and Soho Street, and Eva Mendes Collection. In addition, the Company recently announced a new celebrity partnership with Gabrielle Union, who will serve as a brand ambassador for the Company's 7th Avenue Design Studio sub-brand and will launch a namesake collection to be sold exclusively at New York & Company. The Company believes that its key merchandise initiatives and sub-brand strategy differentiate it from its competitors and provides its customers fashion, quality and value with an appealing merchandise assortment at attractive price points.
Enhance Brand Image, Increase Customer Loyalty, and Drive Traffic
The Company seeks to build and enhance the recognition, appeal and reach of its New York & Company brand through its merchandise assortment, celebrity partnerships, expansion of its private label credit card and loyalty programs, best-in-class customer service, and consistent marketing in-store, on its website and through mobile devices, including tablets. The Company believes that its celebrity partnerships with Eva Mendes and Gabrielle Union elevate and differentiate its brand. The Company leverages its celebrity partnerships to create an emotional connection with its customers and increase brand awareness. The Company continually explores the addition of new celebrity partnerships.
As mall traffic continues to trend negatively, the Company has heightened its focus and resources towards its strategic marketing efforts to drive customer traffic into its stores. As part of the company-wide focus to increase traffic both online and at its brick-and-mortar stores, the Company plans to heavily promote its celebrity collaborations, further develop its brand ambassador program, host exciting events and experiences that resonate with its customers, along with maintaining new and fresh in-store marketing initiatives.
Expand Omni-Channel Capabilities
The Company is an omni-channel retailer with the goal of providing a seamless and consistent shopping experience across all channels of its business, allowing its customers to shop in stores, on mobile or desktop. The Company intends to continue to invest resources into omni-channel retail initiatives and leverage the enhanced customer shopping experience to drive additional traffic and increase sales across all channels of the business. Current omni-channel capabilities allow a customer to order from the Company's eCommerce website and pick up or return merchandise in-store. In addition, the Company has the ability to ship items from a store to fulfill a customer's order through the eCommerce website or from another store.
The Company views the eCommerce channel (www.nyandcompany.com) as its largest store providing the broadest selection of merchandise, including exclusive styles and extended sizes. The Company's eCommerce store is integral to the success of its omni-channel retail strategy, driving increased sales and traffic across all channels. The Company plans to continue allocating resources to improving its customers' shopping experience on its eCommerce store and mobile platform.
4
Optimize Existing Store Base
The Company is continually focused on optimizing the size and productivity of its existing New York & Company store base by relocating and remodeling/refreshing a portion of its existing stores annually. The reduction of non-productive selling square feet is an integral component of the Company's goal to improve productivity and profitability across its chain of stores. In addition, the Company will continue leveraging selling square feet in existing locations by converting a select number of New York & Company stores to a side-by-side or shop-in-shop format with a New York & Company store and Eva Mendes boutique. As of January 28, 2017, the Company operated 39 of these converted New York & Company stores, including 18 Eva Mendes side-by-side stores and 21 Eva Mendes shop-in-shop stores. The Company believes these store conversions will continue to increase traffic, net sales and profitability.
The Company plans to open a select number of new New York & Company stores annually. The Company has targeted locations where it believes it can increase market penetration and operate highly profitable New York & Company stores. During fiscal year 2017, the Company plans to open 6 to 10 New York & Company stores in highly desirable locations, with short-term leases and competitively priced rents, which were previously occupied by a close competitor and therefore require relatively low capital investment prior to opening.
Outlet stores continue to be a productive channel of growth for the Company. The Outlet stores offer a merchandise mix consisting of apparel and accessories that is approximately 90% exclusive to the Outlet stores, and some merchandise that can be found at New York & Company stores, as well as clearance merchandise. During fiscal year 2016, the Company converted 50 existing New York & Company stores to Outlet stores and experienced increased sales and profitability, as well as higher conversion and units per transaction. The Company plans to continue opening a select number of new Outlet stores each year.
Design and Merchandising
The Company's product development group, led by its merchant and design teams, is dedicated to consistently delivering to its customers high-quality and on trend fashion apparel and accessories at competitive prices. The Company seeks to provide its customers with key fashion items of the season and a versatile wardrobe that addresses customers' specific lifestyle needs. A broad assortment of coordinating apparel items and accessories complete this wardrobe. The Company's merchandising, marketing and promotional efforts encourage multiple-unit and outfit purchases.
In connection with the Company's multi-year business re-engineering program ("Project Excellence"), as discussed further in "Item 7. Management's Discussion and Analysis of Financial Condition and Results of Operations" in this Annual Report on Form 10-K, the Company performed a comprehensive review of its Go-To-Market strategy aimed at increasing speed to market and reducing costs associated with the related processes without sacrificing the quality of the merchandise. During fiscal year 2016, the Company completed the implementation of the process improvements identified through Project Excellence, which includes, among other things, leveraging the relationships and capabilities of its independent buying agents to reduce lead times and provide the most relevant merchandise and procure trending merchandise in order to meet its customers' fashion expectations. As a result, the Company has shortened its lead times by almost 7 weeks to an average of 36 weeks, and now has the ability to receive reorders of merchandise in approximately 12 weeks throughout most of the year, which the Company believes provides a competitive advantage.
While the Company delivers selected new items every two to four weeks to its stores in order to keep the merchandise current and to keep customers engaged, new product lines are introduced into the Company's stores in five major deliveries each year (spring, summer, fall, holiday and pre-spring). Product line development begins with the introduction of design concepts, key styles and its initial
5
assortment selection for the product line. From a speed to market perspective, the Company has made several improvements to its product development calendar, which have shortened the total supply chain timeline. These changes, along with the implementation of a formalized "Fast Track" product development process, enables the Company to more effectively leverage runway and trend intelligence; and combined with improvements to the Company's logistics network provides more rapid delivery of product from concept to in-store. The Company's designers focus on overall concepts and identify and interpret the fashion trends for the season, identifying those particular apparel items and accessories that will appeal to its target customer, designing the product line and presenting it to the Company's merchants for review. The Company's merchants are responsible for developing seasonal strategies in partnership with their planners, in addition to a detailed list of desired apparel pieces and accessories to guide the designers, as well as buying, testing, editing, product placement and pricing the line during the season on an ongoing basis. This integrated approach to design, merchandising and sourcing enables the Company to carry a merchandise assortment that addresses customer demand while attempting to minimize inventory risk and maximize sales and profitability.
Sourcing
The Company's sourcing approach focuses on quality, speed and cost in order to provide timely delivery of quality goods. This is accomplished by closely managing the product development cycle, from raw materials and garment production to store-ready packaging, logistics and customs clearance.
Sourcing Relationships. The Company purchases apparel and accessories products directly from manufacturers and in some instances from importers. The Company's relationships with its direct manufacturers are supported by independent buying agents, who help coordinate the Company's purchasing requirements with the factories. The Company's unit volumes, long-established vendor relationships and knowledge of fabric and production costs, combined with a flexible, diversified sourcing base, enable it to buy high-quality, low-cost goods. The Company is not subject to long-term production contracts with any of its vendors, manufacturers or buying agents. The Company's broad sourcing network allows it to meet its factory workplace standards; objectives of quality, cost, speed to market; and inventory efficiency by shifting merchandise purchases as required, and allows it to react quickly to changing market or regulatory conditions. The Company sources nearly all of its merchandise from three countries, with China, Vietnam and Indonesia representing approximately 97% of all merchandise purchases during fiscal year 2016. The Company utilized two major apparel agents, which together represented approximately 63% of the Company's merchandise purchases during fiscal year 2016; however, no individual factory represented more than approximately 7% of the Company's merchandise purchases. The Company expects to continue to utilize two major apparel agents for a large portion of it merchandise in fiscal year 2017, while maintaining a broad factory base, in order to reduce costs, maximize production and logistics assistance, and increase speed to market without sacrificing quality.
Quality Assurance and Compliance Monitoring. The Company entered into a transition services agreement with L Brands on November 27, 2002, as amended, in connection with the acquisition of Lerner Holding (the "transition services agreement"). As part of the transition services agreement, Independent Production Services ("IPS"), a unit of L Brands, provides the Company with monitoring of country of origin, point of fabrication compliance, compliance with the Company's Code of Business Conduct for Suppliers, labor standards, and supply chain security. The Company's independent buying agents also provide similar monitoring and compliance services. In addition, all of the factories that manufacture merchandise for the Company enter into a master sourcing agreement with the Company that specifies their obligations with respect to quality, safety and ethical business practices. IPS representatives visit apparel factories to ensure that the factory quality control associates understand and comply with the Company's requirements. The Company's independent buying agents and importers also conduct in-line factory and final quality audits.
6
The Company also engages two independent audit firms to visit each year a selection of factories that manufacture accessories for the Company to ensure that these factories understand and comply with the Company's Code of Business Conduct for Suppliers, labor standards and supply chain security standards.
Distribution and Logistics
L Brands provides the Company with certain warehousing and distribution services under the transition services agreement. All of the Company's merchandise is received, processed, warehoused and distributed through L Brands' distribution center in Columbus, Ohio. Details about each receipt are supplied to the Company's store inventory planners, who determine how the product should be distributed among the Company's stores based on current inventory levels, sales trends and specific product characteristics. Advance shipping notices are electronically communicated to the stores.
Under the transition services agreement, as amended, these services will terminate upon the earliest of the following: (i) 24 months from the date that L Brands notifies the Company that L Brands wishes to terminate the services; (ii) 24 months from the date that the Company notifies L Brands that the Company wishes to terminate the services; (iii) 60 days after the Company has given notice to L Brands that L Brands has failed to perform any material obligations under the agreement and such failure shall be continuing; (iv) 30 days after L Brands has given notice to the Company that the Company has failed to perform any material obligations under the agreement and such failure shall be continuing; (v) within 75 days of receipt of the annual proposed changes to the agreement schedules which outline the cost methodologies and estimated costs of the services for the coming year, if such proposed changes would result in a significant increase in the amount of service costs that the Company would be obligated to pay; (vi) 15 months after a change of control of the Company, at the option of L Brands; or (vii) upon reasonable notice under the prevailing circumstances by the Company to L Brands after a disruption of services due to force majeure that cannot be remedied or restored within a reasonable period of time. The Company believes that these services are provided at a competitive price and the Company anticipates continuing to use L Brands for these services.
The Company relies on a third-party to operate its eCommerce store, including fulfillment services. The third-party warehouse facility is located in Martinsville, Virginia. Merchandise is received in this location from L Brands' distribution center. The operation of the Company's eCommerce store is covered by a master services agreement that is in effect through April 30, 2018.
Real Estate
As of January 28, 2017, the Company operated 466 stores in 39 states, with an average of 5,080 selling square feet per store. The Company's growth and productivity statistics are reported based on selling square footage because management believes the use of selling square footage yields a more accurate measure of store productivity than gross square footage. All of the Company's stores are leased and are primarily located in medium to large population centers of the United States in shopping malls, lifestyle centers, outlet centers, and off-mall locations, including urban street locations.
7
Fiscal Year
|
Total stores open at beginning of fiscal year |
Number of stores opened during fiscal year |
Number of stores closed during fiscal year |
Number of stores remodeled during fiscal year |
Total stores open at end of fiscal year |
|||||||||||
|---|---|---|---|---|---|---|---|---|---|---|---|---|---|---|---|---|
2012 |
532 | 18 | (31 | ) | 13 | 519 | ||||||||||
2013 |
519 | 8 | (20 | ) | 7 | 507 | ||||||||||
2014 |
507 | 12 | (15 | ) | 11 | 504 | ||||||||||
2015 |
504 | 12 | (26 | ) | 8 | 490 | ||||||||||
2016 |
490 | 2 | (26 | ) | 2 | 466 | ||||||||||
Historical Selling Square Footage
Fiscal Year
|
Total selling square feet at beginning of fiscal year |
Increase in selling square feet for stores opened during fiscal year |
Reduction of selling square feet for stores closed during fiscal year |
Net reduction of selling square feet for stores remodeled during fiscal year |
Total selling square feet at end of fiscal year |
|||||||||||
|---|---|---|---|---|---|---|---|---|---|---|---|---|---|---|---|---|
2012 |
2,873,436 | 64,224 | (175,483 | ) | (36,904 | ) | 2,725,273 | |||||||||
2013 |
2,725,273 | 30,445 | (106,256 | ) | (12,388 | ) | 2,637,074 | |||||||||
2014 |
2,637,074 | 46,161 | (74,478 | ) | (11,769 | ) | 2,596,988 | |||||||||
2015 |
2,596,988 | 50,638 | (120,559 | ) | (15,638 | ) | 2,511,429 | |||||||||
2016 |
2,511,429 | 10,536 | (150,697 | ) | (4,074 | ) | 2,367,194 | |||||||||
Store Count by State as of January 28, 2017
State
|
# of Stores |
State | # of Stores |
State | # of Stores |
|||||||||
|---|---|---|---|---|---|---|---|---|---|---|---|---|---|---|
Alabama |
8 | Louisiana |
6 | North Carolina |
20 | |||||||||
Arizona |
6 | Maryland |
17 | Ohio |
19 | |||||||||
Arkansas |
2 | Massachusetts |
9 | Oklahoma |
2 | |||||||||
California |
47 | Michigan |
10 | Pennsylvania |
31 | |||||||||
Colorado |
5 | Minnesota |
3 | Rhode Island |
2 | |||||||||
Connecticut |
8 | Mississippi |
2 | South Carolina |
12 | |||||||||
Delaware |
2 | Missouri |
7 | South Dakota |
1 | |||||||||
Florida |
30 | Nebraska |
1 | Tennessee |
11 | |||||||||
Georgia |
19 | Nevada |
3 | Texas |
42 | |||||||||
Illinois |
17 | New Hampshire |
1 | Utah |
1 | |||||||||
Indiana |
6 | New Jersey |
31 | Virginia |
21 | |||||||||
Kansas |
1 | New Mexico |
1 | West Virginia |
2 | |||||||||
Kentucky |
8 | New York |
47 | Wisconsin |
5 | |||||||||
| | | | | | | | | | | | | | | |
|
Grand Total |
466 | ||||||||||||
| | | | | | | | | | | | | | | |
| | | | | | | | | | | | | | | |
| | | | | | | | | | | | | | | |
Site Selection. The Company's real estate department is responsible for new store site selection. While selecting a specific location for a new store, the Company targets high-traffic real estate in locations with demographics reflecting concentrations of the Company's target customers and a complementary tenant mix.
Each New York & Company store is approximately 4,000 to 6,000 selling square feet. Each Outlet store is approximately 3,000 to 5,000 selling square feet. In fiscal year 2017, the Company expects to open approximately 6 to 10 New York & Company stores with short-term leases, open 2 new Outlet stores, remodel/refresh 8 existing locations, and close between 34 and 38 stores, ending the fiscal year with between 436 and 444 stores, including 122 Outlet stores.
8
Store Display and Merchandising. The Company's stores are designed to effectively display its merchandise and create an upbeat atmosphere. Expansive front windows allow potential customers to see easily into the store and are used as a vehicle to highlight major merchandising and promotional events. The open floor design allows customers to readily view the majority of the merchandise on display, while store fixtures allow for the efficient display of garments and accessories. Merchandise displays are modified on a weekly basis based on sales trends and inventory receipts. The Company's in-store product presentation utilizes a variety of different fixtures to highlight the product line's breadth and versatility. Complete outfits are displayed throughout the store using garments from a variety of product categories. The Company displays complete outfits to demonstrate how its customers can combine different pieces in order to increase unit sales.
Pricing and Promotional Strategy. The Company's in-store pricing and promotional strategy is designed to drive customer traffic and promote brand loyalty. The promotional pricing strategy is designed to encourage multiple-unit sales. Select key items are also prominently displayed in store windows at competitive prices to drive traffic into the stores.
Inventory Management. The Company's inventory management systems, which support the Company's omni-channel retail strategy, are designed to maximize merchandise profitability and increase inventory turns. The Company constantly monitors inventory turns on the selling floor and uses pricing and promotions to maximize sales and profitability and to achieve inventory turn goals. The Company's inventory loss prevention program is integrated with the store operations and finance departments of its business. This program includes electronic article surveillance systems in a majority of stores as well as the monitoring of merchandise returns, merchandise voids, employee sales and deposits, and educating store personnel on loss prevention.
Field Sales Organization. New York & Company store operations are organized into four regions, and Outlet store operations are organized as one region. The five regions are organized into 40 districts. Each region is managed by a regional sales leader. The Company staffs approximately 40 district sales leaders, with each typically responsible for the sales and operations of 12 stores on average. Each store is usually staffed with a store sales leader and two additional support positions. Higher volume stores may have additional support positions as required. All stores are staffed with hourly sales associates. The Company has approximately 1,200 full-time in-store managers. The goal of the Company's field sales organization is to provide a memorable customer experience by creating an environment that is inspirational, exciting and fun. To accomplish this goal, the field sales organization is continuously engaged in various initiatives to improve talent assessment and acquisition processes, enhance brand education and communication training and increase engagement with the customer in store to drive sales and profitability. The Company seeks to instill enthusiasm and dedication in its store management personnel by maintaining an incentive/bonus plan for its field managers. The program is currently based on monthly sales performance and seasonal inventory loss targets. The Company believes that this program effectively creates incentives for its senior field professionals and aligns their interests with the financial goals of the Company. The Company evaluates merchandise fill, fitting room service, checkout service, and store appearance. Stores are required to meet or exceed established corporate standards to ensure the quality of the Company's customers' overall in-store experience.
The Company typically employs between 4,000 and 5,000 full- and part-time store sales associates, depending on the Company's seasonal needs. The Company has store operating policies and procedures and efficient point-of-sale ("POS") terminals and an in-store training program for new store employees. Detailed product descriptions are also provided to sales associates to enable them to gain familiarity with product offerings. The Company offers its sales associates a discount on the Company's apparel and accessories.
9
Brand Building and Marketing
The Company believes that its New York & Company brand is among its most important assets. The Company's ability to continuously evolve its brand to appeal to the changing needs and priorities of its target customer is a key source of its competitive advantage. The Company believes its exclusive merchandise and sub-brands, including 7th Avenue Design Studio, Soho Jeans and Soho Street, and Eva Mendes Collection, combined with accessories, proprietary merchandise designs, value pricing, merchandise quality, in-store merchandise display and store service differentiate its brand from its competitors and drives strong brand recognition and endorsement by its target customers. The Company is leveraging its existing partnership with celebrity, Eva Mendes, for the Eva Mendes Collection and plans to do the same in fiscal year 2017, with its new partnership with Gabrielle Union as a brand ambassador for the 7th Avenue Design Studio and her upcoming namesake collection. The Company leverages its celebrity partnerships to create an emotional connection with its customers and increase brand awareness. The Company is also exploring the addition of new celebrity partnerships.
The Company continues to invest in the development of its brand through, among other things, direct mail, Fashion Books, in-store marketing, digital marketing, email and text messaging programs, social media—Facebook, Instagram, Twitter, and Pinterest, public relations programs and select advertising. The Company also makes investments to enhance the overall customer experience through opening new stores, remodeling/refreshing existing stores, broadening its assortment online and consistently upgrading the online experience, both in desktop and mobile applications, including tablets, and focusing on customer service. The Company consistently communicates its brand image across all aspects of its business, including product design, store merchandising and shopping environments, channels of distribution, and marketing and advertising.
The Company believes that it is strategically important to communicate directly with its current customer base and with potential customers on a regular basis. The Company uses its customer database, which includes over five million customers who have made purchases within the last twelve months, to design marketing programs to attract its core customers.
Customer Credit
The Company has a credit card processing agreement with Comenity Bank, a bank subsidiary of Alliance Data Systems Corporation ("ADS"), that provides the services of the Company's proprietary credit card program ("NY&C PLCC"). The Company allows payments on this credit card to be made at its stores as a service to its customers. ADS owns the credit card accounts, with no recourse to the Company. All of the Company's proprietary credit cards carry the New York & Company brand. These cards provide purchasing power to customers and an additional channel for the Company to communicate product offerings.
On July 14, 2016, the Company entered into a Second Amended and Restated Private Label Credit Card Program Agreement, effectively dated May 1, 2016, with Comenity Bank, which replaced the existing agreement with ADS and has a term through April 30, 2026 (the "ADS Agreement"). Pursuant to the terms of the ADS Agreement, ADS has the exclusive right to provide private label credit cards to customers of the Company. In connection with the execution of the ADS Agreement, the Company received $40.0 million in signing bonuses. The signing bonuses were payable in two installments, of which $17.5 million was received on July 28, 2016, and $22.5 million was received on January 10, 2017. In addition, over the 10-year term of the ADS Agreement, the Company will receive an increased level of royalty payments based on a percentage of private label credit card sales. During fiscal year 2016, the Company recognized $11.0 million of revenue from royalties and the amortization of signing bonuses in connection with the ADS Agreement, as compared to recognizing $4.2 million of marketing credits in fiscal year 2015 under the previous agreement with ADS, which were recorded as a reduction to marketing expense within selling, general and administrative expenses.
10
The Company has a strong strategic focus on its private label credit card and loyalty programs to increase the number of credit card holders and sales to such customers. The NY&C PLCC accounted for 41% of total company sales in fiscal year 2016, up from 39% in fiscal year 2015, and NY&C PLCC customers spend two to three times more annually than customers that are not NY&C PLCC holders.
Information Technology
Information technology is a key component of the Company's business strategy and the Company is committed to utilizing technology to enhance its competitive position. The Company's information systems integrate data from field sales, eCommerce sales, design, merchandising, planning and distribution, and financial reporting functions. The Company's core business systems consist of both purchased and internally developed software, operating on Microsoft, Oracle, and IBM platforms. These systems are accessed over a company-wide network through which associates have access to many key business applications.
Sales, cash deposit and related credit card information are electronically collected from the stores' POS terminals and eCommerce website on a daily basis. During this process, the Company also obtains information concerning inventory receipts and transmits pricing, markdown and shipment notification data. In addition, where and as permitted by law, the Company collects customer transaction data to grow and update its customer database. The merchandising staff and merchandise planning staff evaluate the sales and inventory information collected from the stores to make key merchandise planning decisions, including orders and markdowns. These systems enhance the Company's ability to optimize sales while limiting markdowns, achieve planned inventory turns, reorder successful styles, and effectively distribute new inventory to the stores.
One of the Company's top priorities is optimizing its omni-channel retail strategy to provide a seamless and consistent customer shopping experience across store and eCommerce channels. The Company believes that its omni-channel retail strategy has improved its customers' shopping experiences, which will continue to enhance brand image and increase customer loyalty. The Company intends to continue to invest resources into omni-channel retail initiatives and leverage the enhanced customer shopping experience to drive additional traffic and increase sales across store and eCommerce channels. Currently, the Company is testing in-store digital kiosks, which provide customers the ability to browse and order product assortment that is not available in the store but can be accessed from another sales channel. The Company continues to evaluate the use of beacon technology and social shopping platforms as part of its technology innovation roadmap. The Company is investing in additional technology and services to enhance the customer experience on its digital channels: desktop and tablet, mobile web and mobile applications.
During the second quarter of fiscal year 2016, the Company completed the rollout of its new company-wide POS system upgrade, which includes new cash registers, scanners and tablets. The Company expects the new POS system to improve store productivity, increase security levels across the Company's operating systems and further support omni-channel initiatives.
The Company has implemented measures to prevent and detect security breaches and cyber incidents, and continues to invest in the fortification of its information systems, networks and infrastructure. The Company is dedicated to safeguarding the storage and transmission of customers' personal information, shopping preferences and credit card information, in addition to employee information and the Company's financial and strategic data.
11
Competition
The retail and apparel industries are highly competitive. The Company has positioned its stores as a source of fashion, quality and value by providing its customers with an appealing merchandise assortment at attractive price points generally below those of department stores and other specialty retailers. The Company competes with traditional department stores, specialty store retailers, discount apparel stores, international retailers opening large numbers of stores in the United States, and direct marketers for, among other things, customers, raw materials, market share, retail space, finished goods, sourcing and personnel. The Company differentiates itself from its competitors on the basis of its exclusive merchandise and sub-brands, including 7th Avenue Design Studio, Soho Jeans and Soho Street, Eva Mendes Collection, and Gabrielle Union's upcoming namesake collection, combined with accessories, proprietary merchandise designs, value pricing, merchandise quality, in-store merchandise display and store service.
Seasonality
The Company views the retail apparel market as having two principal selling seasons: spring (first and second quarter) and fall (third and fourth quarter). The Company's business experiences seasonal fluctuations in net sales and operating income, with a significant portion of its operating income typically realized during the fourth quarter. Seasonal fluctuations also affect inventory levels. The Company must carry a significant amount of inventory, especially before the holiday season selling period in the fourth quarter and prior to the Easter and Mother's Day holidays toward the latter part of the first quarter and beginning of the second quarter.
Intellectual Property
The Company's trademarks, including New York & Company®, NY&C®, NY Style®, Soho New York & Company Jeans®, Lerner®, and Lerner New York® brands, are registered or are subject to pending trademark applications with the United States Patent and Trademark Office and with registries of many foreign countries.
Employees and Labor Relations
As of January 28, 2017, the Company had a total of 5,885 employees of which 1,679 were full-time employees and 4,206 were part-time employees, who are primarily store associates. The number of part-time employees fluctuates depending on the Company's seasonal needs. The collective bargaining agreement with the Local 1102 unit of the Retail, Wholesale and Department Store Union (RWDSU) AFL-CIO is in effect through August 31, 2018. Approximately 8% of the Company's total employees are covered by collective bargaining agreements and are primarily non-management store associates. The Company believes its relationship with its employees is good.
Government Regulation
The Company is subject to employment laws and regulations, including minimum wage requirements, intellectual property laws, consumer protection laws and regulations (including those relating to advertising and promotions, privacy and product safety), truth-in-lending and other laws and regulations with respect to the operation of the Company's stores and business generally, such as zoning and occupancy ordinances governing the importation and exportation of merchandise and the use of the Company's proprietary credit cards. The Company monitors changes in these laws and believes that it is in material compliance with applicable laws with respect to these practices. Congress and many states are still considering cybersecurity legislation that, if enacted, could impose additional obligations upon the Company. In addition, the Company is subject to Securities and Exchange Commission rules and regulations, state laws, Sarbanes-Oxley requirements, new rules and regulations
12
issued pursuant to the Dodd-Frank Wall Street Reform and Consumer Protection Act, other U.S. public company regulations, and various other requirements mandated for the textiles and apparel industries such as the Consumer Product Safety Improvement Act of 2008, California's Proposition 65 and similar state laws.
The majority of the Company's merchandise is manufactured by factories located outside of the United States. These products are imported and are subject to U.S. customs laws, which impose tariffs for textiles and apparel. Any major changes in United States tax policy or trade relations, such as the disallowance of tax deductions for imported merchandise or the imposition of unilateral tariffs on imported goods, could have a material adverse effect on the Company's business, results of operations and liquidity. In addition, some of the Company's imported products are eligible for certain duty-advantaged programs, including but not limited to the North American Free Trade Agreement, the Andean Trade Preference Act, the U.S. Caribbean Basin Trade Partnership Act and the Caribbean Basin Initiative.
Available Information
The Company makes available free of charge on its website, http://www.nyandcompany.com, copies of its Annual Report on Form 10-K, Quarterly Reports on Form 10-Q, Current Reports on Form 8-K and amendments to those reports filed or furnished pursuant to Section 13(a) or 15(d) of the Securities Exchange Act of 1934, as amended (the "Exchange Act") as soon as reasonably practicable after filing or furnishing such material electronically with the United States Securities and Exchange Commission. Copies of the charters of each of the Company's Audit Committee, Compensation Committee, and Nomination & Governance Committee, as well as the Company's Corporate Governance Guidelines, Code of Business Conduct for Associates, Code of Conduct for Principal Executive Officers and Key Financial Associates, and Code of Business Conduct for Suppliers, are also available on the website.
A continued reduction in the volume of mall traffic could significantly reduce the Company's sales and leave it with unsold inventory, reducing the Company's profits or creating losses.
Many of the Company's stores are located in shopping malls. Sales at these stores are derived, in part, from the volume of traffic in those malls. The Company's sales volume and store traffic will be adversely affected by a continued decrease in the popularity of malls or other shopping centers in which the Company's stores are located, the closing of anchor stores important to driving mall traffic and therefore the Company's business, a decline in popularity of other stores in the malls or shopping centers in which the Company's stores are located, or a deterioration in the financial condition of shopping center operators or developers which could, for example, limit their ability to invest in improvements and finance tenant improvements for the Company and other retailers. Sales volume and mall traffic may be adversely affected by economic downturns in a particular area, competition from internet retailers, non-mall retailers and other malls where the Company does not have stores. A continued reduction in mall traffic as a result of these or any other factors could materially adversely affect the Company's business.
If the Company is not able to respond to fashion trends in a timely manner, develop new merchandise or launch new product lines successfully, it may be left with unsold inventory, experience decreased profits or incur losses or suffer reputational harm to its brand image.
The Company's success depends in part on management's ability to anticipate and respond to changing fashion tastes and consumer demands and to translate market trends into appropriate, saleable product offerings. Customer tastes and fashion trends change rapidly. If the Company is unable to successfully identify or react to changing styles or trends and misjudges the market for its
13
products or any new product lines, its sales may be lower, gross margins may be lower and the Company may be faced with a significant amount of unsold finished goods inventory. In response, the Company may be forced to increase its marketing promotions or price markdowns, which could have a material adverse effect on its financial condition and results of operations. The Company's brand image may also suffer if customers believe that it is no longer able to offer the latest fashions. The Company's Eva Mendes Collection is affiliated with a celebrity. If the Company experiences an unplanned interruption in the collaboration with Eva Mendes, for any number of reasons, it may result in a decrease in net sales and profitability.
Economic conditions may cause a decline in business and consumer spending which could adversely affect the Company's business and financial performance.
The Company's business is impacted by general economic conditions and their effect on consumer confidence and the level of consumer spending on the merchandise the Company offers. These economic factors include recessionary cycles, interest rates, currency exchange rates, economic growth, wage rates, unemployment levels, energy prices, availability of consumer credit, and consumer confidence, among others. Economic conditions could negatively affect consumer purchases of the Company's merchandise and adversely impact the Company's business, financial condition and results of operations. Economic conditions could also negatively impact the Company's merchandise vendors and their ability to deliver products and sustain profits and sufficient liquidity. To counteract potential cash flow problems, the Company's merchandise vendors may require letters of credit or attempt to increase prices, pass through increased costs or seek some other form of relief, which may adversely impact the Company's business, financial condition and results of operations. In addition, economic conditions could negatively impact the Company's retail landlords and their ability to maintain their shopping centers in a first-class condition and otherwise perform their obligations, which could negatively impact traffic in the Company's stores leading to a decrease in sales and profitability.
The raw materials used to manufacture the Company's products and its distribution and labor costs are subject to availability constraints and price volatility, which could result in increased costs.
The raw materials used to manufacture the Company's products are subject to availability constraints and price volatility caused by high demand for petroleum-based synthetic fabrics, weather, supply conditions, government regulations, economic climate and other unpredictable factors. The Company sources nearly all of its merchandise from three countries, with China, Vietnam and Indonesia representing approximately 97% of all merchandise purchases during fiscal year 2016. Any one of these countries could experience increased inflationary pressure, which could lead to increased costs for the Company. In addition, the Company's transportation and labor costs are subject to price volatility caused by the price of oil, supply of labor, governmental regulations, economic climate and other unpredictable factors. Increases in demand for, or the price of, raw materials, distribution services and labor, could have a material adverse effect on the Company's business, financial condition and results of operations.
Fluctuations in comparable store sales in any one of the Company's channels, including New York & Company stores, Outlets and eCommerce, or fluctuations in the Company's results of operations could cause the price of the Company's common stock to decline substantially.
A store is included in the comparable store sales calculation after it has completed 13 full fiscal months of operations from the store's opening date or once it has been reopened after remodeling if the gross square footage did not change by more than 20%. Sales from the Company's eCommerce store are included in comparable store sales. In addition, recognized royalty revenue and the amortization of signing bonuses received in connection with the new ADS Agreement are also included in comparable store sales.
14
The Company's results of operations have fluctuated in the past and can be expected to fluctuate in the future. Since the beginning of fiscal year 2004 through fiscal year 2016, the Company's quarterly comparable store sales have ranged from an increase of 14.1% to a decrease of 16.4%. The Company cannot ensure that it will be able to achieve consistency in its future sales and cannot ensure a high level of comparable store sales in the future.
The Company's comparable store sales and results of operations are affected by a variety of factors, including but not limited to:
- •
- fashion trends;
- •
- mall traffic;
- •
- the Company's ability to effectively market to its customers and drive traffic both online and into its stores;
- •
- calendar shifts of holiday or seasonal periods;
- •
- the effectiveness of the Company's supply chain and inventory management;
- •
- changes in the Company's merchandise mix;
- •
- the timing of promotional events;
- •
- weather conditions;
- •
- changes in general economic conditions and consumer spending patterns;
- •
- the Company's ability to retain, recruit and train qualified personnel; and
- •
- actions of competitors or mall anchor tenants.
If the Company's future comparable store sales fail to meet expectations, then the market price of the Company's common stock could decline substantially.
The Company's net sales, operating income and inventory levels fluctuate on a seasonal basis and decreases in sales or margins during the Company's peak seasons could have a disproportionate effect on its overall financial condition and results of operations.
The Company's business experiences seasonal fluctuations in net sales and operating income, with a significant portion of its operating income typically realized during its fourth quarter. Any decrease in sales or margins during this period could have a disproportionate effect on the Company's financial condition and results of operations. For further information related to seasonality and quarterly results, please refer to Note 14, "Quarterly Results," in the Notes to Consolidated Financial Statements appearing elsewhere in this Annual Report on Form 10-K.
Seasonal fluctuations also affect the Company's inventory levels. The Company must carry a significant amount of inventory, especially before the holiday season selling period in the fourth quarter and prior to the Easter and Mother's Day holidays toward the latter part of the first quarter and beginning of the second quarter. If the Company is not successful in selling its inventory, it may have to write down the value of its inventory or sell it at significantly reduced prices or the Company may not be able to sell such inventory at all, which could have a material adverse effect on the Company's financial condition and results of operations.
Since the Company relies significantly on international sources of production, it is at risk from a variety of factors that could leave it with inadequate or excess inventories, resulting in decreased profits or losses.
The Company purchases apparel and accessories in international markets, with a significant portion coming from China, Vietnam and Indonesia. Any major changes in United States tax policy or
15
trade relations, such as the disallowance of tax deductions for imported merchandise or the imposition of unilateral tariffs on imported goods, could have a material adverse effect on the Company's business, results of operations and liquidity. The Company does not have any long-term merchandise supply contracts and many of its imports are subject to existing or potential duties and tariffs. The Company competes with other companies for production facilities.
The Company also faces a variety of other risks generally associated with doing business in international markets and importing merchandise from abroad, such as:
- •
- political or labor instability in countries where vendors are located;
- •
- political or military conflict involving the United States, which could cause a delay in the transportation of the Company's products and an
increase in transportation costs;
- •
- heightened terrorism security concerns, which could subject imported goods to additional, more frequent or more thorough inspections, leading
to delays in deliveries or impoundment of goods for extended periods or could result in decreased scrutiny by customs officials for counterfeit goods, leading to lost sales and damage to the
reputation of the Company's brand;
- •
- natural disasters, disease epidemics and health related concerns, which could result in closed factories, reduced workforces, scarcity of raw
materials and scrutiny or embargoing of goods produced in infected areas;
- •
- the migration and development of manufacturers, which can affect where the Company's products are or will be produced;
- •
- imposition of regulations relating to imports and the Company's ability to adjust in a timely manner to changes in trade regulations, which
among other things, could limit the Company's ability to source products from countries that have the labor and expertise needed to manufacture its products on a cost-effective basis;
- •
- imposition of duties, taxes and other charges on imports;
- •
- labor disputes, such as labor strikes or unrest or disruptions at the ports through which the Company imports its goods; and
- •
- currency volatility.
Any of the foregoing factors, or a combination thereof, could have a material adverse effect on the Company's business.
The Company's manufacturers may be unable to manufacture and deliver products in a timely manner or meet its quality standards, which could result in lost sales, cancellation charges or excessive markdowns.
The Company purchases apparel and accessories directly from third-party manufacturers and in some instances from importers. The Company utilized two major apparel agents, which together represented approximately 63% of the Company's merchandise purchases during fiscal year 2016; however, no individual factory represented more than approximately 7% of the Company's merchandise purchases. The Company expects to continue to utilize two major apparel agents for a large portion of its merchandise in fiscal year 2017, while maintaining a broad factory base, in order to reduce costs, maximize production and logistics assistance, and increase speed to market without sacrificing quality. Similar to most other specialty retailers, the Company has short selling seasons for much of its inventory. Factors outside of the Company's control, such as manufacturing or shipping delays or quality problems, could disrupt merchandise deliveries and result in lost sales, product recalls, cancellation charges or excessive markdowns.
16
The Company plans to open a select number of new New York & Company stores and New York & Company Outlet stores, while relocating and remodeling/refreshing a portion of its existing store base annually. The Company may not be able to successfully open new stores, or relocate or remodel/refresh existing stores on a timely basis or at all. In addition, opening new stores and relocating or remodeling/refreshing existing stores may strain its resources and cause the performance of its existing stores to suffer.
The Company plans to open a select number of new New York & Company stores and New York & Company Outlet stores, while relocating and remodeling/refreshing a portion of its existing store base annually. The success of this strategy is dependent upon, among other things, the identification of suitable markets and sites for store locations, the negotiation of acceptable lease and renewal terms, including the renegotiation of existing rent concessions, the hiring, training and retention of competent sales personnel, and the effective management of inventory to meet the needs of new and existing stores on a timely basis. To the extent that the Company's new store openings are in existing markets, the Company may experience reduced net sales volumes in existing stores in those markets. The Company expects to fund its new stores through cash flow from operations and, if necessary, by borrowings under its revolving credit facility; however, if the Company experiences a decline in performance, the Company may slow or discontinue store openings. The Company may not be able to successfully execute any of these strategies on a timely basis. If the Company fails to successfully implement these strategies, its financial condition and results of operations would be adversely affected.
In addition, continued consolidation in the commercial retail real estate market could affect the Company's ability to successfully negotiate favorable lease and renewal terms for its stores in the future. Should significant consolidation continue, a large portion of the Company's store base could be concentrated with one or a few entities that could then be in a position to dictate unfavorable terms due to their significant negotiating leverage. If the Company is unable to negotiate favorable lease terms with these entities, this could affect its ability to profitably operate its stores, which could adversely affect the Company's financial condition and results of operations.
Because of the Company's focus on keeping its inventory at the forefront of fashion trends, extreme and/or unseasonable weather conditions could have a disproportionately large effect on the Company's business, financial condition and results of operations because it would be forced to mark down inventory.
Extreme weather conditions in the areas in which the Company's stores are located could have a material adverse effect on the Company's business, financial condition and results of operations. For example, heavy snowfall or other extreme weather conditions over a prolonged period might make it difficult for the Company's customers to travel to its stores. The Company's business is also susceptible to unseasonable weather conditions. For example, extended periods of unseasonably warm temperatures during the winter season or cool weather during the summer season could render a portion of the Company's inventory incompatible with those unseasonable conditions. These prolonged unseasonable weather conditions could adversely affect the Company's business, financial condition and results of operations.
If third parties who manage some aspects of the Company's business do not adequately perform their functions, the Company might experience disruptions in its business, leaving it with inadequate or excess inventories, among other adverse effects, resulting in decreased profits or losses.
L Brands handles the distribution of the Company's merchandise through its distribution facility in Columbus, Ohio pursuant to a transition services agreement. The efficient operation of the Company's stores is dependent on its ability to distribute merchandise to locations throughout the United States in a timely manner. The Company depends on L Brands to receive, sort, pack and distribute substantially all of the Company's merchandise. As part of the transition services agreement, L Brands contracts with third-party transportation companies to deliver the Company's merchandise from international
17
ports to their warehouses and to the Company's stores. Any failure by any of these third parties to respond adequately to the Company's warehousing and distribution needs would disrupt the Company's operations and negatively impact its profitability.
Additional services are also provided by L Brands and its subsidiaries and affiliates pursuant to the transition services agreement. IPS assists the Company with its monitoring of country of origin and point of fabrication compliance for U.S. Customs. IPS also monitors compliance with the Company's Code of Business Conduct for Suppliers, and labor standards and supply chain security standards. Any failure of L Brands or IPS to fulfill their obligations under the transition services agreement would disrupt the Company's operations and negatively impact its profitability.
Under the transition services agreement, as amended, these services will terminate upon the earliest of the following: (i) 24 months from the date that L Brands notifies the Company that L Brands wishes to terminate the services; (ii) 24 months from the date that the Company notifies L Brands that the Company wishes to terminate the services; (iii) 60 days after the Company has given notice to L Brands that L Brands has failed to perform any material obligations under the agreement and such failure shall be continuing; (iv) 30 days after L Brands has given notice to the Company that the Company has failed to perform any material obligations under the agreement and such failure shall be continuing; (v) within 75 days of receipt of the annual proposed changes to the agreement schedules which outline the cost methodologies and estimated costs of the services for the coming year, if such proposed changes would result in a significant increase in the amount of service costs that the Company would be obligated to pay; (vi) 15 months after a change of control of the Company, at the option of L Brands; or (vii) upon reasonable notice under the prevailing circumstances by the Company to L Brands after a disruption of services due to force majeure that cannot be remedied or restored within a reasonable period of time. The Company believes that these services are provided at a competitive price and the Company anticipates continuing to use L Brands for these services. The Company's failure to successfully replace the services could have a material adverse effect on the Company's business and prospects.
The Company uses a third party for its eCommerce operations, including order management, order fulfillment, customer care, and channel management services. A failure by the third party to adequately manage the Company's eCommerce operations may negatively impact the Company's profitability.
The Company relies on third parties to monitor Code of Business Conduct for Suppliers and labor standards compliance, supply chain security standards, and product quality requirements for its accessories business. Any failure by these third parties to adequately perform their functions may disrupt the Company's operations and negatively impact its reputation and its profitability.
The Company may rely on third parties for the implementation and/or management of certain aspects of its information technology infrastructure. Failure by any of these third parties to implement and/or manage the Company's information technology infrastructure effectively could disrupt its operations and negatively impact its profitability.
The Company relies on a third party to administer its proprietary credit card program. The inability of the administration company to effectively service the credit card program could materially limit credit availability for the Company's customers, which would negatively impact the Company's revenues and, consequently, its profitability.
A work stoppage resulting from, among other things, a dispute over a collective bargaining agreement covering employees of a third party relied on by the Company or employees of the Company, may cause disruptions in the Company's business and negatively impact its profitability.
18
The Company's marketing efforts rely upon the use of customer information. Restrictions on the availability or use of customer information could adversely affect the Company's marketing program, which could result in lost sales and a decrease in profits.
The Company uses its customer database to market to its customers. Any limitations imposed on the use of such consumer data, whether imposed by federal or state governments or business partners, could have an adverse effect on the Company's future marketing activity. In addition, while the Company is compliant with Payment Card Industry Data Security Standards ("PCI DSS"), to the extent the Company's or its business partners' security procedures and protection of customer information prove to be insufficient or inadequate, the Company may become subject to litigation or other claims, which could expose it to liability and cause damage to its reputation or brand.
The Company relies on its manufacturers to use acceptable ethical business practices, and if they fail to do so, the New York & Company brand name could suffer reputational harm and the Company's sales could decline or its inventory supply could be interrupted.
The Company requires its manufacturers to operate in compliance with applicable laws, rules and regulations regarding working conditions, employment practices, product quality and safety, and environmental compliance. Additionally, the Company imposes upon its business partners operating guidelines that require additional obligations in order to promote ethical business practices. The staff of third party inspection services companies, and the staff of the Company's non-exclusive buying agents and importers periodically visit and monitor the operations of the Company's manufacturers to determine compliance. However, the Company does not control its manufacturers or their labor and other business practices. If one of the Company's manufacturers violates labor or other laws or implements labor or other business practices that are generally regarded as unethical in the United States, the shipment of finished products to the Company could be interrupted, orders could be canceled, relationships could be terminated and the Company's reputation could be damaged. Any of these events could have a material adverse effect on the Company's revenues and, consequently, its results of operations.
The Company is subject to numerous laws and regulations, including federal and state minimum wage laws, that could affect its operations. Changes in such laws and regulations could affect its profitability and impact the operation of its business through delayed shipments of its goods, increased costs, fines or penalties.
The Company is subject to employment laws and regulations, including minimum wage requirements, intellectual property laws (including those relating to advertising and promotions, privacy and product safety), truth-in-lending and other laws and regulations with respect to the operation of the Company's stores and business generally, such as zoning and occupancy ordinances governing the importation and exportation of merchandise and the use of the Company's proprietary credit cards. In addition, the Company is subject to Securities and Exchange Commission rules and regulations, state laws, Sarbanes-Oxley requirements, new rules and regulations issued pursuant to the Dodd-Frank Wall Street Reform and Consumer Protection Act, other U.S. public company regulations, and various other requirements mandated for the textiles and apparel industries such as the Consumer Product Safety Improvement Act of 2008, California's Proposition 65 and similar state laws. Although the Company monitors changes in these laws, if these laws change without the Company's knowledge, or are violated by the Company's employees, importers, buying agents, manufacturers or distributors, the Company could experience delays in shipments and receipt of goods or be subject to fines or other penalties under the controlling laws or regulations, any of which could have a material adverse effect on the Company's business, financial condition and results of operations.
On April 4, 2016, the State of California passed legislation raising the hourly minimum wage to $15 by the end of year 2022. On the same day, the State of New York enacted similar legislation increasing the hourly minimum wage to $15 in New York City by the end of year 2018, and in other
19
parts of the state by the end of year 2021. Such legislation requires mandatory annual increases to the hourly minimum wage in the interim. As a result, on January 1, 2017, the Company increased the hourly minimum wage in California, New York City, and other parts of New York State, as well as a number of other states, as required. In addition, Congress and many states are still considering cybersecurity legislation that, if enacted, could impose additional obligations upon the Company.
Compliance with changes in these laws or regulations, including increasing minimum wage requirements throughout the United States, could result in increased costs to the Company and could impact operational efficiency, which could have a material adverse effect on the Company's financial condition and results of operations.
The Company may be unable to compete favorably in the highly competitive retail industry, and if it loses customers to its competitors, its sales could decrease causing a decrease in profits or losses.
The sale of apparel and accessories is highly competitive. Increased competition could result in price reductions, increased marketing expenditures and loss of market share, all of which could have a material adverse effect on the Company's financial condition and results of operations.
The Company competes for sales with a broad range of other retailers, including individual and chain fashion specialty stores, department stores, and international retailers opening large numbers of stores in the United States. In addition to the traditional store-based retailers, the Company also competes with direct marketers that sell similar lines of merchandise and target customers through catalogs and eCommerce.
Some of the Company's competitors may have greater financial, marketing and other resources available to them. In many cases, the Company's competitors sell their products in stores that are located in the same shopping malls as the Company's stores. In addition to competing for sales, the Company competes for favorable site locations and lease terms in shopping malls.
The Company may be unable to protect its trademarks, which could diminish the value of its brand.
The Company's trademarks are important to its success and competitive position. The Company's major trademarks are New York & Company, NY&C, NY Style, Soho New York & Company Jeans, Lerner, and Lerner New York and are protected in the United States and in some cases internationally. The Company engages in the following steps to protect and enforce its trademarks: file and prosecute trademark applications for registration in those countries where the marks are not yet registered; responding to office actions and examining attorneys in those countries where the marks are not yet registered; maintenance of its trademark portfolio in the United States; filings of statements of use, renewal documents, assignments, change of name and address forms; policing of marks and third party infringements; initiation and defense of opposition and/or cancellation proceedings, including discovery and preparation of evidence; and litigation, including filing enforcement lawsuits against third party infringers. The Company is susceptible to others imitating the Company's products and infringing on the Company's intellectual property rights. Imitation or counterfeiting of the Company's products or other infringement of the Company's intellectual property rights could diminish the value of its brand or otherwise adversely affect its revenues. The actions the Company has taken to establish and protect its trademarks may not be adequate to prevent imitation of its products by others or to prevent others from seeking to invalidate its trademarks or block sales of its products as a violation of the trademarks and intellectual property rights of others. In addition, others may assert rights in, or ownership of, trademarks and other intellectual property rights of the Company or in marks that are similar to the Company's or marks that the Company licenses and/or markets and the Company may not be able to successfully resolve these types of conflicts to its satisfaction. In some cases, there may be trademark owners who have prior rights to the Company's marks because the laws of certain countries may not protect intellectual property rights to the same extent as do the laws of the United States. In other
20
cases, there may be holders who have prior rights to similar marks. Failure to protect the Company's trademarks could result in a material adverse effect on the Company's business.
The Company relies on its information technology infrastructure, which includes third party and internally developed software, and purchased or leased hardware that support the Company's information technology, cybersecurity and various business processes. The Company's business, reputation and brand image could suffer if its infrastructure fails to perform as intended.
The Company relies on purchased or leased hardware and software licensed from third parties or internally developed in order to manage its business. The Company's ability to maintain and upgrade its information technology infrastructure is critical to the success of its business and the continued enhancement of its omni-channel retail strategy. This hardware and software may not continue to be available on commercially reasonable terms or at all. Any disruptions to the Company's infrastructure or loss of the right to use any of this hardware or software could affect the Company's operations, which could negatively affect the Company's business until corrected or until equivalent technology is either developed by the Company or, if available, is identified, obtained and integrated. In addition, the software underlying the Company's operations can contain undetected errors. The Company may be forced to modify its operations until such problems are corrected and, in some cases, may need to implement enhancements to correct errors that it does not detect. Problems with the software underlying the Company's operations could result in loss of revenue, unexpected expenses and capital costs, diversion of resources, loss of market share and damage to the Company's reputation which could adversely affect the Company's business, financial condition and results of operations. Furthermore, the Company's information systems initiatives and omni-channel retail strategy are complex and require managerial and financial expertise to implement successfully. If the Company is unable to successfully implement new information system initiatives and execute its omni-channel retail strategy, or if the Company's customers are not provided with the intended benefits, the Company's financial condition and results of operations could be adversely affected.
The Company and third parties that manage portions of the Company's secure data are subject to cybersecurity risks and incidents. The Company's business involves the storage and transmission of customers' personal information, shopping preferences and credit card information, in addition to employee information and the Company's financial and strategic data. The protection of the Company's customer, employee and Company data is vitally important to the Company. While the Company has implemented measures to prevent and detect security breaches and cyber incidents, and continues to invest in the fortification of its information systems, networks and infrastructure, any failure of these measures and any failure of third parties that assist the Company in managing its secure data could adversely affect the Company's business, financial condition and results of operations.
Because the Company's brand is associated with all of its New York & Company merchandise in addition to its stores, the Company's success depends heavily on the value associated with its brand. The New York & Company name is integral to the Company's existing business, as well as to the implementation of its strategy for growing and expanding its business. The New York & Company brand could be adversely affected if the Company's public image or reputation were to be tarnished, which could result in a material adverse effect on the Company's business. If the value associated with the Company's brand were to diminish, the Company's sales could decrease, causing lower profits or losses.
Risks associated with the Company's eCommerce store.
The Company operates an online store at www.nyandcompany.com, which is integral to the success of the Company's omni-channel retail strategy and where it sells its largest assortment of its merchandise. The Company's eCommerce operations are subject to numerous risks, including unanticipated operating problems, reliance on third-party computer hardware and software providers,
21
system failures, cybersecurity breaches and the need to invest in additional computer systems. The eCommerce operations also involve other risks that could have an impact on the Company's results of operations, including but not limited to diversion of sales from the Company's other stores, rapid technological change, liability for online content, credit card fraud and risks related to the failure of the computer systems that operate the website and its related support systems. If the Company is unable to successfully address and respond to these risks, revenues could be lost, costs could increase, and the Company's reputation may be damaged.
If the Company is unable to successfully develop and maintain a relevant and reliable omni-channel shopping experience for its customers, the Company's reputation could be adversely affected, sales could be lost and its profits could decrease.
One of the Company's long-term growth initiatives is the expansion of the omni-channel shopping experience it provides customers through the integration of its retail stores, eCommerce store and mobile applications. Omni-channel retailing is rapidly evolving and the Company's success depends on its ability to anticipate and implement innovations in customer experience and logistics in order to appeal to customers who increasingly rely on multiple channels to meet their shopping needs. If the Company is unable to innovate and successfully implement its omni-channel initiatives or does not meet customer expectations, revenues could be lost, costs could increase, and the Company's reputation may be damaged.
The Company is subject to customer payment-related risks that could increase its operating costs, expose it to fraud or theft, subject it to potential liability and potentially disrupt its business.
The Company accepts payments using a variety of methods, including cash, checks, credit and debit cards, PayPal, its private label credit cards and gift cards. Acceptance of these payment options subjects the Company to rules, regulations, contractual obligations and compliance requirements, including payment network rules and operating guidelines, data security standards and certification requirements, and rules governing electronic funds transfers. These requirements may change over time or be reinterpreted, making compliance more difficult or costly. The Company completed the implementation of the chip-and-PIN (or signature) technology in all of its stores and received certification during the third quarter of fiscal year 2016. The payment methods that the Company offers also subject it to potential fraud and theft by criminals. As a result, a data breach could have a material adverse effect on the Company's brand image, results of operations and financial condition.
The covenants in the Company's credit facilities, including its revolving credit facility and long-term debt, impose restrictions that may limit its operating and financial flexibility.
The Company's credit facilities contain a number of significant restrictions and covenants that limit its ability to:
- •
- incur additional indebtedness;
- •
- declare dividends, make distributions or redeem or repurchase capital stock, including the Company's common stock, or to make certain other
restricted payments or investments;
- •
- sell assets, including capital stock of restricted subsidiaries;
- •
- agree to payment restrictions affecting the Company's restricted subsidiaries;
- •
- consolidate, merge, sell or otherwise dispose of all or substantially all of the Company's assets;
- •
- incur liens;
- •
- alter the nature of the Company's business;
22
- •
- enter into sale/leaseback transactions;
- •
- conduct transactions with affiliates; and
- •
- designate the Company's subsidiaries as unrestricted subsidiaries.
In addition, the Company's credit facilities include other and more restrictive covenants and prohibit it from prepaying its other indebtedness while indebtedness under its credit facilities is outstanding. The agreement governing the Company's credit facilities also requires it to achieve specified financial and operating results and maintain compliance with specified financial ratios. The Company's ability to comply with these ratios may be affected by events beyond the Company's control.
The restrictions contained in the agreement governing the Company's credit facilities could:
- •
- limit the Company's ability to plan for or react to market conditions or meet capital needs or otherwise restrict its activities or business
plans; and
- •
- adversely affect the Company's ability to finance its operations, strategic acquisitions, investments or other capital needs or to engage in other business activities that would be in the Company's interest.
A breach of any of these restrictive covenants or the Company's inability to comply with the required financial ratios could result in a default under the agreement governing its credit facilities. If a default occurs, the lender under the credit facilities may elect to declare all borrowings outstanding, together with accrued interest and other fees, to be immediately due and payable.
The lender also has the right in these circumstances to terminate any commitments the lender has to provide further borrowings. If the Company is unable to repay outstanding borrowings when due, the lender under the credit facilities also has the right to proceed against the collateral, including the Company's available cash, granted to the lender to secure the indebtedness.
The Company may lose key personnel.
The Company believes that it has benefited from the leadership and experience of its Chief Executive Officer, Gregory J. Scott, and its other key executives. The loss of the services of any of these individuals could have a material adverse effect on the business and the prospects of the Company. Competition for key personnel in the retail industry is intense and the Company's future success will depend upon its ability to retain, recruit and train qualified personnel.
Provisions in the Company's restated certificate of incorporation and Delaware law may delay or prevent the Company's acquisition by a third party.
The Company's restated certificate of incorporation contains a "blank check" preferred stock provision. Blank check preferred stock enables the Company's Board of Directors, without stockholders' approval, to designate and issue additional series of preferred stock with such dividend, liquidation, conversion, voting or other rights, including the right to issue convertible securities with no limitation on conversion, as the Company's Board of Directors may determine, including rights to dividends and proceeds in a liquidation that are senior to the common stock.
These provisions may make it more difficult or expensive for a third party to acquire a majority of the Company's outstanding voting common stock. The Company is also subject to certain provisions of Delaware law which could delay, deter or prevent the Company from entering into a merger, acquisition, tender offer, proxy contest or other transaction that might otherwise result in the Company's stockholders receiving a premium over the market price for their stock.
23
Item 1B. Unresolved Staff Comments
None.
All of the Company's stores, encompassing approximately 3.0 million total gross square feet as of January 28, 2017, are leased under operating leases. The typical store lease is originally for a ten-year term and requires the Company to pay real estate taxes, common area maintenance charges, utilities and other landlord charges. As of January 28, 2017, approximately 50% of the Company's store leases could be terminated by the Company within one year or less, and 60% of the Company's store leases could be terminated within two years or less. On February 25, 2014, the Company entered into a lease for 182,709 square feet of office space at 330 West 34th Street, New York, New York which expires in 2030. Additionally, the Company owns a parcel of land located in Brooklyn, New York on which it operates one of its leased stores.
There are various claims, lawsuits and pending actions against the Company arising in the normal course of the Company's business. It is the opinion of management that the ultimate resolution of these matters will not have a material effect on the Company's financial condition, results of operations or cash flows.
Item 4. Mine Safety Disclosures
Not Applicable.
24
Item 5. Market for Registrant's Common Equity, Related Stockholder Matters and Issuer Purchases of Equity Securities
The Company's common stock is listed on the New York Stock Exchange under the symbol "NWY." The number of holders of record of common stock at March 31, 2017 was 146. The following table sets forth the high and low sale prices for the common stock on the New York Stock Exchange for the periods indicated:
| |
Market Price | ||||||
|---|---|---|---|---|---|---|---|
| |
High | Low | |||||
Fiscal Year 2016 |
|||||||
Fourth quarter |
$ | 2.60 | $ | 1.88 | |||
Third quarter |
$ | 2.71 | $ | 1.79 | |||
Second quarter |
$ | 3.85 | $ | 1.34 | |||
First quarter |
$ | 4.15 | $ | 1.82 | |||
Fiscal Year 2015 |
|||||||
Fourth quarter |
$ | 2.75 | $ | 2.00 | |||
Third quarter |
$ | 2.86 | $ | 2.08 | |||
Second quarter |
$ | 2.79 | $ | 2.18 | |||
First quarter |
$ | 3.11 | $ | 2.06 | |||
The Company has not declared or paid any dividends on its common stock since the acquisition of the Company by Irving Place Capital in November 2002. The Company currently expects to retain any future earnings for use in the operation and expansion of its business and does not anticipate paying any cash dividends in the foreseeable future. The Company's ability to pay dividends on its common stock is limited by the covenants of its credit facility and may be further restricted by the terms of any of its future debt or preferred securities.
25
Performance Graph
The following graph shows a comparison of the cumulative total return on an initial investment of $100 on January 28, 2012 in the Company's common stock, the Standard & Poor's SmallCap 600 Index and the Standard & Poor's 600 Apparel Retail Index. The comparison assumes the reinvestment of any dividends.
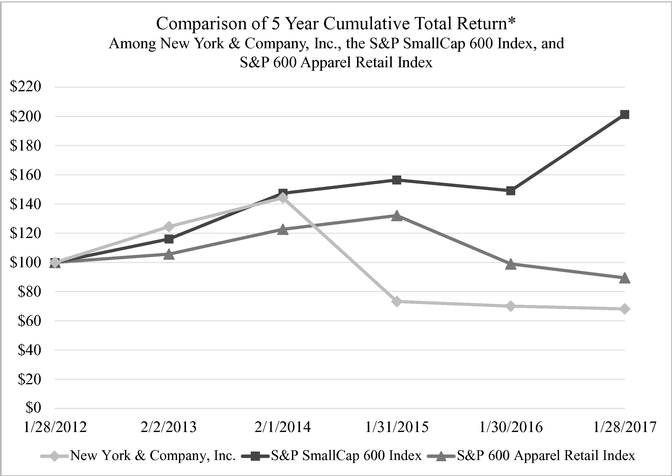
- *
- $100 invested on 1/28/12 in stock or index, including reinvestment of dividends.
Issuer Sales of Equity Securities
During fiscal year 2016, there were no unregistered sales of equity securities of the registrant.
26
Issuer Purchases of Equity Securities
The following table sets forth information concerning purchases made by the Company of its common stock for the periods indicated, pursuant to the Company's authorized share repurchase program:
Period
|
Total Number of Shares Purchased |
Average Price Paid Per Share |
Total Number of Shares Purchased as Part of Publicly Announced Program(1) |
Maximum Dollar Value of Shares that May Yet Be Purchased Under the Program(1) |
|||||||||
|---|---|---|---|---|---|---|---|---|---|---|---|---|---|
October 30, 2016 to November 26, 2016 |
23,624 | $ | 2.15 | 23,624 | $ | 3,988,877 | |||||||
November 27, 2016 to December 31, 2016 |
30,301 | $ | 1.98 | 30,301 | $ | 3,928,904 | |||||||
January 1, 2017 to January 28, 2017 |
— | $ | — | — | $ | 3,928,904 | |||||||
| | | | | | | | | | | | | | |
Total |
53,925 | $ | 2.06 | 53,925 | $ | 3,928,904 | |||||||
| | | | | | | | | | | | | | |
| | | | | | | | | | | | | | |
| | | | | | | | | | | | | | |
- (1)
- On July 14, 2016, the Company announced that its board of directors had authorized the repurchase of up to $5.0 million of the Company's common stock over the subsequent 12 months. Repurchases are expected to be made from time to time in the manner the Company believes appropriate, through open market or private transactions including through pre-established trading plans.
Item 6. Selected Financial Data
The following table sets forth selected consolidated financial data for New York & Company, Inc. and its subsidiaries for each of the periods presented. The consolidated financial data for the 52-week fiscal year ended January 28, 2017, referred to as "fiscal year 2016," 52-week fiscal year ended January 30, 2016, referred to as "fiscal year 2015," the 52-week fiscal year ended January 31, 2015, referred to as "fiscal year 2014," the 52-week fiscal year ended February 1, 2014, referred to as "fiscal year 2013," and the 53-week fiscal year ended February 2, 2013, referred to as "fiscal year 2012," have been derived from the audited consolidated financial statements of New York & Company, Inc. and its subsidiaries.
The selected consolidated financial data should be read in conjunction with "Item 7. Management's Discussion and Analysis of Financial Condition and Results of Operations" and the
27
Company's consolidated financial statements and the notes thereto appearing elsewhere in this Annual Report on Form 10-K.
(amounts in thousands, except per share data)
|
Fiscal Year 2016 (52-weeks) |
Fiscal Year 2015 (52-weeks) |
Fiscal Year 2014 (52-weeks) |
Fiscal Year 2013 (52-weeks) |
Fiscal Year 2012 (53-weeks) |
|||||||||||
|---|---|---|---|---|---|---|---|---|---|---|---|---|---|---|---|---|
Statements of operations data: |
||||||||||||||||
Net sales |
$ | 929,081 | $ | 950,108 | $ | 923,332 | $ | 939,163 | $ | 966,434 | ||||||
Cost of goods sold, buying and occupancy costs |
665,102 | 685,253 | 673,557 | 674,793 | 701,613 | |||||||||||
| | | | | | | | | | | | | | | | | |
Gross profit |
263,979 | 264,855 | 249,775 | 264,370 | 264,821 | |||||||||||
Selling, general and administrative expenses(1) |
279,362 | 272,960 | 265,371 | 261,293 | 262,569 | |||||||||||
| | | | | | | | | | | | | | | | | |
Operating (loss) income |
(15,383 | ) | (8,105 | ) | (15,596 | ) | 3,077 | 2,252 | ||||||||
Interest expense, net of interest income |
1,235 | 1,227 | 573 | 369 | 360 | |||||||||||
| | | | | | | | | | | | | | | | | |
(Loss) income before income taxes |
(16,618 | ) | (9,332 | ) | (16,169 | ) | 2,708 | 1,892 | ||||||||
Provision (benefit) for income taxes(2) |
673 | 737 | 716 | 314 | (208 | ) | ||||||||||
| | | | | | | | | | | | | | | | | |
Net (loss) income |
$ | (17,291 | ) | $ | (10,069 | ) | $ | (16,885 | ) | $ | 2,394 | $ | 2,100 | |||
| | | | | | | | | | | | | | | | | |
Basic (loss) earnings per share |
$ | (0.27 | ) | $ | (0.16 | ) | $ | (0.27 | ) | $ | 0.04 | $ | 0.03 | |||
| | | | | | | | | | | | | | | | | |
| | | | | | | | | | | | | | | | | |
| | | | | | | | | | | | | | | | | |
Diluted (loss) earnings per share |
$ | (0.27 | ) | $ | (0.16 | ) | $ | (0.27 | ) | $ | 0.04 | $ | 0.03 | |||
| | | | | | | | | | | | | | | | | |
| | | | | | | | | | | | | | | | | |
| | | | | | | | | | | | | | | | | |
Weighted average shares outstanding: |
||||||||||||||||
Basic shares of common stock |
63,356 | 63,154 | 62,825 | 62,313 | 61,516 | |||||||||||
| | | | | | | | | | | | | | | | | |
| | | | | | | | | | | | | | | | | |
| | | | | | | | | | | | | | | | | |
Diluted shares of common stock |
63,356 | 63,154 | 62,825 | 63,240 | 62,164 | |||||||||||
| | | | | | | | | | | | | | | | | |
| | | | | | | | | | | | | | | | | |
| | | | | | | | | | | | | | | | | |
(amounts in thousands)
|
Fiscal Year 2016 |
Fiscal Year 2015 |
Fiscal Year 2014 |
Fiscal Year 2013 |
Fiscal Year 2012 |
|||||||||||
|---|---|---|---|---|---|---|---|---|---|---|---|---|---|---|---|---|
Balance sheet data (at period end): |
||||||||||||||||
Cash and cash equivalents |
$ | 88,369 | $ | 61,432 | $ | 69,293 | $ | 69,723 | $ | 60,933 | ||||||
Working capital |
$ | 59,587 | $ | 42,035 | $ | 46,665 | $ | 52,418 | $ | 41,055 | ||||||
Total assets |
$ | 301,588 | $ | 283,460 | $ | 301,254 | $ | 288,753 | $ | 292,680 | ||||||
Capital lease obligations |
$ | 6,585 | $ | 3,915 | $ | 2,165 | $ | — | $ | — | ||||||
Total long-term debt(3) |
$ | 12,326 | $ | 13,167 | $ | 14,124 | $ | — | $ | — | ||||||
Stockholders' equity |
$ | 79,169 | $ | 93,771 | $ | 99,359 | $ | 113,215 | $ | 106,252 | ||||||
- (1)
- Fiscal
year 2016, fiscal year 2015, and fiscal year 2014 includes $5.7 million, $7.8 million, and $9.2 million of non-operating charges,
respectively. For further information related to the non-operating charges in fiscal year 2016, fiscal year 2015 and fiscal year 2014, please refer to the "Management's Discussion and Analysis of
Financial Condition and Results of Operations—Results of Operations" section below.
- (2)
- Since
July 2010, the Company continues to maintain a valuation allowance against its deferred tax assets until the Company believes it is more likely than not that
these assets will be realized in the future. If sufficient positive evidence arises in the future indicating that all or a portion of the deferred tax assets meet the more-likely-than-not standard
under Accounting Standards Codification™ Topic 740, "Income Taxes," the valuation allowance would be reversed accordingly in the period that such determination is made. For further
information related to the deferred tax valuation allowance, please refer to Note 11, "Income Taxes" in the Notes to Consolidated Financial Statements appearing elsewhere in this Annual Report
on Form 10-K.
- (3)
- On October 24, 2014, Lerner New York, Inc., Lernco, Inc. and Lerner New York Outlet, LLC (f.k.a. Lerner New York Outlet, Inc.), wholly-owned indirect subsidiaries of New York & Company, Inc., entered into a Fourth Amended and Restated Loan and Security Agreement with
28
Wells Fargo Bank, N.A., as Agent and Term Loan Agent and the lenders party thereto. For further information related to the Fourth Amended and Restated Loan and Security Agreement, please refer to the "Management's Discussion and Analysis of Financial Condition and Results of Operations—Liquidity and Capital Resources" section below.
Item 7. Management's Discussion and Analysis of Financial Condition and Results of Operations
The purpose of this section is to discuss and analyze the Company's consolidated financial condition, liquidity and capital resources, and results of operations. The following discussion should be read in conjunction with the Company's consolidated financial statements and the notes thereto appearing elsewhere in this Annual Report on Form 10-K.
Overview
New York & Company, Inc. is a specialty retailer of women's fashion apparel and accessories, and the modern wear-to-work destination for women, providing fashion that is feminine, polished, on-trend and versatile. New York & Company, Inc. helps its customers feel confident, put-together, attractive and stylish by providing affordable fashion. The Company's proprietary branded New York & Company® merchandise is sold through its national network of retail stores and online at www.nyandcompany.com. The target customers for the Company's merchandise are women between the ages of 25 and 45. As of January 28, 2017, the Company operated 466 stores in 39 states.
The Company's fiscal year is a 52- or 53-week year that ends on the Saturday closest to January 31. The 52-week years ended January 28, 2017, January 30, 2016, and January 31, 2015, are referred to herein as "fiscal year 2016," "fiscal year 2015," and "fiscal year 2014," respectively. The 53-week year ending February 3, 2018 is referred to herein as "fiscal year 2017."
General
Net Sales. Net sales consist of sales from comparable and non-comparable stores. A store is included in the comparable store sales calculation after it has completed 13 full fiscal months of operations from the store's opening date or once it has been reopened after remodeling if the gross square footage did not change by more than 20%. Sales from the Company's eCommerce store are included in comparable store sales. In addition, recognized royalty revenue and the amortization of signing bonuses received in connection with the new ADS Agreement, which amounted to $11.0 million in fiscal year 2016, are included in comparable store sales. Non-comparable store sales include new stores, stores relocated within the same shopping center and remodeled stores that have a change in gross square footage of more than 20%, which have not completed 13 full fiscal months of operations, sales from closed stores, and sales from stores closed or in temporary locations during periods of remodeling. In addition, in a year with 53 weeks, sales in the last week of the year are not included in determining comparable store sales. Net sales from the sale of merchandise at the Company's stores are recognized when the customer takes possession of the merchandise and the purchases are paid for, primarily with either cash or credit card. Net sales, including shipping fees billed to customers, from the sale of merchandise at the Company's eCommerce store are recognized when the merchandise is shipped to the customer and the purchases are paid for. A reserve is provided for projected merchandise returns based on prior experience.
The Company issues gift cards and merchandise credits which do not contain provisions for expiration or inactivity fees. The portion of the dollar value of gift cards and merchandise credits that ultimately is not used by customers to make purchases is known as breakage and will be recognized as revenue, if the Company determines it is not required to escheat such amounts to government agencies under state escheatment laws. The Company recognizes gift card and merchandise credit breakage as revenue as they each are redeemed over a two-year redemption period based on their respective
29
historical breakage rate. The Company considers the likelihood of redemption remote beyond a two-year redemption period, at which point any unrecognized breakage is recognized as revenue. The Company determined the redemption period and the breakage rate for gift cards and merchandise credits based on their respective historical redemption patterns.
Cost of Goods Sold, Buying and Occupancy Costs. Cost of goods sold, buying and occupancy costs is comprised of direct inventory costs for merchandise sold, distribution costs, shipping costs, payroll and related costs for design, sourcing, production, merchandising, planning and allocation personnel, and store occupancy and related costs.
Gross Profit. Gross profit represents net sales less cost of goods sold, buying and occupancy costs.
Selling, General and Administrative Expenses. Selling, general and administrative expenses include selling, store management and corporate expenses, including payroll and employee benefits, employment taxes, management information systems, marketing, insurance, legal, store pre-opening and other corporate level expenses. Store pre-opening expenses include store level payroll, grand opening event marketing, travel, supplies and other store opening expenses.
Fiscal Year 2016 Summary
The Company's overall strategy is to drive growth in each channel of its business, including New York & Company stores, New York & Company Outlet stores ("Outlets"), and its eCommerce store. During fiscal year 2016, the Company remained focused on the following strategic initiatives: (i) evolve as a broader lifestyle brand through the growth of the Company's sub-brand strategy, including 7th Avenue Design Studio, Soho Jeans (which featured Jennifer Hudson during fiscal year 2016) and Soho Street, and the Eva Mendes Collection; (ii) create a deeper emotional connection with its customer, acquire new private label credit card customers and grow its active customer database to drive traffic in all channels of the business; (iii) improve sales productivity and margins across each channel of the business; (iv) continue to evolve as an omni-channel retailer; and (v) implement its Go-To-Market process improvements to increase speed to market, delivering merchandise from concept to in-store faster.
Net sales for fiscal year 2016 were $929.1 million, as compared to $950.1 million for fiscal year 2015. Comparable store sales for fiscal year 2016 decreased 0.7%, as compared to an increase of 3.1% for fiscal year 2015. Net loss for fiscal year 2016 was $17.3 million, or a loss of $0.27 per diluted share, as compared to a net loss of $10.1 million, or a loss of $0.16 per diluted share, for fiscal year 2015. Non-GAAP adjusted net loss for fiscal year 2016 was $11.6 million, or a loss of $0.18 per diluted share, which excludes $5.7 million of non-operating charges. Non-GAAP adjusted net loss for fiscal year 2015 was $2.3 million, or a loss of $0.04 per diluted share, which excludes $7.8 million of non-operating charges. Please refer to the "Results of Operations" and "Reconciliation of GAAP to non-GAAP Financial Measures" sections below for a further discussion of the Company's operating results.
Capital spending for fiscal year 2016 was $18.3 million, as compared to $26.6 million for fiscal year 2015. During fiscal year 2016, the Company opened 2 New York & Company stores and converted 50 New York & Company stores to Outlet stores, remodeled/refreshed 15 existing stores, and closed 26 stores, ending fiscal year 2016 with 466 stores, including 123 Outlet stores and 2.4 million selling square feet in operation. Included in the New York & Company store count at January 28, 2017 are 18 New York & Company stores which feature Eva Mendes side-by-side stores and 21 New York & Company stores which feature Eva Mendes shop-in-shop boutiques, as well as 2 free-standing Eva Mendes stores. In addition to the store-related capital expenditures in fiscal year 2016, the Company continued to invest in its information technology infrastructure, including the expansion of its omni-channel strategy, eCommerce store and mobile applications.
30
On July 14, 2016, the Company entered into a Second Amended and Restated Private Label Credit Card Program Agreement, effectively dated May 1, 2016, with Comenity Bank, a bank subsidiary of Alliance Data Systems Corporation ("ADS"), which replaced the existing agreement with ADS and has a term through April 30, 2026 (the "ADS Agreement"). Pursuant to the terms of the ADS Agreement, ADS has the exclusive right to provide private label credit cards to customers of the Company. In connection with the execution of the ADS Agreement, the Company received $40.0 million in signing bonuses. The signing bonuses were payable in two installments, of which $17.5 million was received on July 28, 2016, and $22.5 million was received on January 10, 2017. In addition, over the 10-year term of the ADS Agreement, the Company will receive an increased level of royalty payments based on a percentage of private label credit card sales. During fiscal year 2016, private label credit card sales represented 41% of net sales, up from 39% in fiscal year 2015. For further information related to the ADS Agreement, please refer to Note 4, "Proprietary Credit Card" in the Notes to Consolidated Financial Statements appearing elsewhere in this Annual Report on Form 10-K.
During the second quarter of fiscal year 2016, the Company completed the rollout of its new company-wide POS system upgrade, which includes new cash registers, scanners and tablets. The Company expects the new POS system to improve store productivity, increase security levels across the Company's operating systems and further support omni-channel initiatives.
As previously disclosed, during the third quarter of fiscal year 2014, the Company engaged a leading global business advisory firm to assist the Company in analyzing its business processes and organizational structure in an effort to improve sales productivity and operating efficiencies, as well as to reduce the Company's overall cost structure. The Company refers to this business re-engineering program as "Project Excellence." The first phase of Project Excellence consisted of an organizational realignment initiated at the end of fiscal year 2014 and completed in fiscal year 2015. The Company completed the second phase of Project Excellence during the second quarter of fiscal year 2015, which consisted of: (i) a comprehensive review of the Company's Go-To-Market strategy aimed at improving operating efficiencies and reducing costs associated with the related processes, (ii) the reduction of indirect procurement costs, and (iii) additional workforce reductions in connection with the organizational realignment. The Company expects to recognize combined annual expense reductions of approximately $30 million upon the execution of the business improvement plans identified through both phases of Project Excellence; however, a portion of these savings are expected to be reinvested into the Company's strategic initiatives and longer-term growth strategies as discussed in "Item 1. Business" of this Annual Report on Form 10-K. Approximately $15 million of the $30 million of annual savings from Project Excellence is a reduction of selling, general and administrative expenses that began in fiscal year 2015, mitigating inflationary increases in certain fixed costs and an increase in variable expenses to support the growth in eCommerce and Outlet stores. The remaining $15 million of annual savings from Project Excellence is reflected as a reduction in product costs of approximately $10 million and a reduction in buying expenses resulting in improved gross margins that began in fiscal year 2016.
The Company's Go-To-Market process improvements identified through Project Excellence include, among other things, an improved product development calendar and the realignment and increased collaboration with the Company's key independent buying agents to reduce lead times and product cost. These changes, along with the implementation of a formalized "Fast Track" product development process, enables the Company to more effectively leverage runway and trend intelligence and, combined with improvements to the Company's logistics network, provide more rapid delivery of product from concept to in-store. As a result, the Company has shortened its lead times by almost 7 weeks to an average of 36 weeks, and now has the ability to receive reorders of merchandise in approximately 12 weeks throughout most of the year, which the Company believes provides a competitive advantage.
31
Looking forward to fiscal year 2017, the Company's overall strategy to drive growth in each channel of its business remains the same. The Company is focused on continuing to evolve as a broader lifestyle brand through its sub-brand strategy and expansion of the Eva Mendes Collection, as well as its recently announced partnership with celebrity Gabrielle Union, who will serve as a brand ambassador for the Company's 7th Avenue Design Studio sub-brand and will launch a namesake collection to be sold exclusively at New York & Company; enhance brand image and continue to increase customer loyalty, including by signing up new private label credit card customers; drive increased traffic both online and into stores; further expand its omni-channel capabilities; and leverage the Company's improved speed to market as described above in connection with Project Excellence, while staying focused on cost savings opportunities and increasing operating efficiencies across the organization.
In support of the strategic initiatives in fiscal year 2017, the Company will continue to invest in its technology infrastructure, eCommerce store and mobile applications, while opening a select number of new stores and optimizing its existing store base. During fiscal year 2017, the Company plans to open 6 to 10 new stores in highly desirable locations, with short-term leases and competitively priced rents, which were previously occupied by a close competitor and therefore require relatively low capital investment prior to opening.
Results of Operations
The following tables summarize the Company's results of operations as a percentage of net sales and selected store operating data for fiscal year 2016, fiscal year 2015, and fiscal year 2014:
(As a % of net sales)
|
Fiscal Year 2016 |
Fiscal Year 2015 |
Fiscal Year 2014 |
|||||||
|---|---|---|---|---|---|---|---|---|---|---|
Net sales |
100.0 | % | 100.0 | % | 100.0 | % | ||||
Cost of goods sold, buying and occupancy costs |
71.6 | % | 72.1 | % | 72.9 | % | ||||
| | | | | | | | | | | |
Gross profit |
28.4 | % | 27.9 | % | 27.1 | % | ||||
Selling, general and administrative expenses |
30.1 | % | 28.8 | % | 28.8 | % | ||||
| | | | | | | | | | | |
Operating loss |
(1.7 | )% | (0.9 | )% | (1.7 | )% | ||||
Interest expense, net |
0.1 | % | 0.1 | % | — | % | ||||
| | | | | | | | | | | |
Loss before income taxes |
(1.8 | )% | (1.0 | )% | (1.7 | )% | ||||
Provision for income taxes |
0.1 | % | 0.1 | % | 0.1 | % | ||||
| | | | | | | | | | | |
Net loss |
(1.9 | )% | (1.1 | )% | (1.8 | )% | ||||
| | | | | | | | | | | |
| | | | | | | | | | | |
| | | | | | | | | | | |
| |
Fiscal Year 2016 |
Fiscal Year 2015 |
Fiscal Year 2014 |
|||||||
|---|---|---|---|---|---|---|---|---|---|---|
| |
(amounts in thousands, except square foot data) |
|||||||||
Selected operating data: |
||||||||||
Comparable store sales (decrease) increase |
(0.7 | )% | 3.1 | % | (1.0 | )% | ||||
Net sales per average selling square foot(1)(4) |
$ | 375 | $ | 367 | $ | 351 | ||||
Net sales per average store(2)(4) |
$ | 1,920 | $ | 1,889 | $ | 1,818 | ||||
Average selling square footage per store(3) |
5,080 | 5,125 | 5,153 | |||||||
- (1)
- Net
sales per average selling square foot is defined as net sales divided by the average of beginning and monthly end of period selling square feet.
- (2)
- Net sales per average store is defined as net sales divided by the average of beginning and monthly end of period number of stores.
32
- (3)
- Average
selling square footage per store is defined as end of period selling square feet divided by end of period number of stores.
- (4)
- Effective first quarter of fiscal year 2016, the Company transitioned to a monthly average calculation from a two-point average calculation. Prior period metrics have been updated accordingly resulting in an immaterial impact.
The following table includes store count and selling square feet:
| |
Fiscal Year 2016 | Fiscal Year 2015 | Fiscal Year 2014 | ||||||||||||||||
|---|---|---|---|---|---|---|---|---|---|---|---|---|---|---|---|---|---|---|---|
Store count and selling square feet:
|
Store Count |
Selling Square Feet |
Store Count |
Selling Square Feet |
Store Count |
Selling Square Feet |
|||||||||||||
Stores open, beginning of period |
490 | 2,511,429 | 504 | 2,596,988 | 507 | 2,637,074 | |||||||||||||
New stores |
2 | 10,536 | 12 | 50,638 | 12 | 46,161 | |||||||||||||
Closed stores |
(26 | ) | (150,697 | ) | (26 | ) | (120,559 | ) | (15 | ) | (74,478 | ) | |||||||
Net impact of remodeled stores on selling square feet |
— | (4,074 | ) | — | (15,638 | ) | — | (11,769 | ) | ||||||||||
| | | | | | | | | | | | | | | | | | | | |
Stores open, end of period |
466 | 2,367,194 | 490 | 2,511,429 | 504 | 2,596,988 | |||||||||||||
| | | | | | | | | | | | | | | | | | | | |
| | | | | | | | | | | | | | | | | | | | |
| | | | | | | | | | | | | | | | | | | | |
Fiscal Year 2016 Compared to Fiscal Year 2015
Net Sales. Net sales for fiscal year 2016 were $929.1 million, as compared to $950.1 million for fiscal year 2015. Comparable store sales for fiscal year 2016 decreased 0.7%, as compared to an increase of 3.1% for fiscal year 2015. In the comparable store base, average dollar sales per transaction increased by 0.7%, while the number of transactions per average store decreased by 1.6%, as compared to fiscal year 2015. Contributing to the decrease in net sales was the Company's lower store base throughout fiscal year 2016, as compared to fiscal year 2015, partially offset by $11.0 million of royalties and the amortization of signing bonuses recognized as a result of the ADS Agreement, as well as continued growth in the eCommerce and Outlet channels, resulting from the Company's successful omni-channel initiatives and its sub-brand strategy, including the continued growth of the Eva Mendes Collection.
Gross Profit. Gross profit for fiscal year 2016 was $264.0 million, or 28.4% of net sales, as compared to $264.9 million, or 27.9% of net sales, in fiscal year 2015. The increase in gross profit as a percentage of net sales during fiscal year 2016, as compared to fiscal year 2015, reflects $11.0 million in benefits from the ADS Agreement, product cost reductions and efficiencies from vendor negotiations related to the implementation of Project Excellence, as well as a 30 basis point improvement in the leverage of buying and occupancy costs, partially offset by increased season-end product markdowns.
Selling, General and Administrative Expenses. Selling, general and administrative expenses were $279.4 million, or 30.1% of net sales, for fiscal year 2016, as compared to $273.0 million, or 28.8% of net sales, for fiscal year 2015. Fiscal year 2016 selling, general and administrative expenses include $5.7 million of non-operating charges, consisting of a $6.2 million legal expense accrual that the Company was required to record relating to an ongoing trademark infringement case where the Company received an unfavorable judgment, which the Company is in the process of challenging, partially offset by a $0.5 million non-operating legal accrual reversal. Fiscal year 2015 selling, general and administrative expenses include $7.8 million of non-operating charges, consisting primarily of $3.1 million of consulting fees associated with Project Excellence, $2.2 million of certain severance expenses, $2.2 million of charges related to a settlement of a wage and hour class action lawsuit in the state of California, and $0.3 million of certain other legal expenses.
Excluding these non-operating charges, selling, general and administrative expenses were $273.6 million, or 29.5% of net sales, for fiscal year 2016, as compared to $265.1 million, or 27.9% of
33
net sales, for fiscal year 2015. The increase in selling, general and administrative expenses, excluding non-operating charges, in fiscal year 2016, as compared to fiscal year 2015, is primarily related to an increase in variable expenses associated with the growth in eCommerce sales; increased marketing expenses due to investments in digital marketing and the elimination of $4.2 million in marketing credits earned under the old ADS private label credit card agreement which have been replaced by royalty payments under the new ADS Agreement and classified by the Company as revenue; and the elimination of insurance credits, which reduced fiscal year 2015 expenses. In addition, during fiscal years 2016 and 2015, the Company recorded $1.2 million and $0.3 million of non-cash asset impairment charges in selling, general and administrative expenses, respectively, related to underperforming stores.
Operating Loss. For the reasons discussed above, operating loss for fiscal year 2016 was $15.4 million, or 1.7% of net sales, as compared to an operating loss of $8.1 million, or 0.9% of net sales, during fiscal year 2015.
Interest Expense, Net. Net interest expense was $1.2 million for fiscal year 2016 and fiscal year 2015. Net interest expense in fiscal year 2016 and fiscal year 2015 is primarily due to interest on a $15.0 million, 5-year term loan (the "Term Loan"), described further in the "Long-Term Debt and Credit Facilities" section below.
Provision for Income Taxes. As previously disclosed, the Company continues to provide for adjustments to the deferred tax valuation allowance initially recorded during the second quarter of fiscal year 2010. For further information related to the deferred tax valuation allowance, please refer to Note 11, "Income Taxes" in the Notes to Consolidated Financial Statements appearing elsewhere in this Annual Report on Form 10-K.
Net Loss. For the reasons discussed above, net loss was $17.3 million, or a loss of $0.27 per diluted share, for fiscal year 2016. This compares to a net loss of $10.1 million, or a loss of $0.16 per diluted share, for fiscal year 2015.
Fiscal Year 2015 Compared to Fiscal Year 2014
Net Sales. Net sales for fiscal year 2015 were $950.1 million, as compared to $923.3 million for fiscal year 2014. Comparable store sales for fiscal year 2015 increased 3.1%, as compared to a decrease of 1.0% for fiscal year 2014. In the comparable store base, average dollar sales per transaction increased by 0.8%, and the number of transactions per average store increased by 2.3%, as compared to fiscal year 2014. The increase in net sales was driven by continued growth in the eCommerce and Outlet channels during fiscal year 2015, as compared to fiscal year 2014, resulting from the Company's successful omni-channel and merchandise initiatives, including its sub-brand strategy.
As a result of the contract negotiation during fiscal year 2014 between the International Longshore and Warehouse Union and the operators of West Coast ports, through which the Company processes a portion of its products, the Company's net sales and gross profit during fiscal year 2014 were negatively impacted by late merchandise deliveries due to shipping delays at West Coast ports, longer lead times, increased freight costs on goods diverted to the East Coast as part of the Company's contingency plans, and increased air freight to secure key merchandise items.
Gross Profit. Gross profit for fiscal year 2015 was $264.9 million, or 27.9% of net sales, as compared to $249.8 million, or 27.1% of net sales, in fiscal year 2014. The increase in gross profit as a percentage of net sales during fiscal year 2015, as compared to fiscal year 2014, was principally due to an 80 basis point increase in product margin, primarily attributable to improved product costs, combined with a 140 basis point improvement in the leverage of buying and occupancy costs resulting from decreased store occupancy costs and reduced buying payroll, offset by a 140 basis point increase in other cost of goods sold principally related to shipping costs associated with the significant growth in the Company's eCommerce business.
34
Selling, General and Administrative Expenses. Selling, general and administrative expenses were $273.0 million, or 28.8% of net sales, for fiscal year 2015, as compared to $265.4 million, or 28.8% of net sales, for fiscal year 2014. Fiscal year 2015 selling, general and administrative expenses include $7.8 million of non-operating charges, consisting primarily of $3.1 million of consulting fees associated with Project Excellence, $2.2 million of certain severance expenses, and $2.2 million of charges related to a settlement of a wage and hour class action lawsuit in the state of California, and $0.3 million of certain other legal expenses. Fiscal year 2014 selling, general and administrative expenses include $9.2 million of non-operating charges, consisting primarily of $4.1 million of duplicative rent expense related to the relocation of the Company's corporate headquarters, $3.0 million of severance expense and $1.7 million of consulting fees incurred in connection with Project Excellence, and $0.4 million of legal and other expenses.
Excluding these non-operating charges, selling, general and administrative expenses were $265.1 million, or 27.9% of net sales, for fiscal year 2015, as compared to $256.2 million, or 27.7% of net sales, for fiscal year 2014. The increase in selling, general and administrative expenses, excluding non-operating charges, in fiscal year 2015, as compared to fiscal year 2014, is primarily related to an increase in variable expenses associated with the growth in eCommerce sales and increased marketing expenses, which was partially offset by a reduction in payroll expenses resulting in large part from the Company's organizational realignment executed as part of Project Excellence. In addition, during fiscal years 2015 and 2014, the Company recorded $0.3 million and $0.9 million of non-cash asset impairment charges in selling, general and administrative expenses, respectively, related to underperforming stores.
Operating Loss. For the reasons discussed above, operating loss for fiscal year 2015 was $8.1 million, or 0.9% of net sales, as compared to an operating loss of $15.6 million, or 1.7% of net sales, during fiscal year 2014.
Interest Expense, Net. Net interest expense was $1.2 million and $0.6 million during fiscal year 2015 and fiscal year 2014, respectively. The increase in net interest expense in fiscal year 2015 as compared to fiscal year 2014 is primarily due to a full year of interest on a $15.0 million, 5-year term loan (the "Term Loan"), described further in the "Long-Term Debt and Credit Facilities" section below.
Provision for Income Taxes. As previously disclosed, the Company continues to provide for adjustments to the deferred tax valuation allowance initially recorded during the second quarter of fiscal year 2010. For further information related to the deferred tax valuation allowance, please refer to Note 11, "Income Taxes" in the Notes to Consolidated Financial Statements appearing elsewhere in this Annual Report on Form 10-K.
Net Loss. For the reasons discussed above, net loss was $10.1 million, or a loss of $0.16 per diluted share, for fiscal year 2015. This compares to a net loss of $16.9 million, or a loss of $0.27 per diluted share, for fiscal year 2014.
Reconciliation of GAAP to Non-GAAP Financial Measures
A reconciliation of the Company's GAAP to non-GAAP selling, general and administrative expenses, operating loss, net loss and loss per diluted share for fiscal year 2016, fiscal year 2015, and fiscal year 2014 is indicated below. This information reflects, on a non-GAAP basis, the Company's adjusted operating results after excluding certain non-operating charges, as described in the "Fiscal Year 2016 Compared to Fiscal Year 2015" and "Fiscal Year 2015 Compared to Fiscal Year 2014" sections above. This non-GAAP financial information is provided to enhance the user's overall understanding of the Company's current financial performance. Specifically, the Company believes the non-GAAP adjusted results provide useful information to both management and investors by excluding expenses that the Company believes are not indicative of the Company's continuing operating results. The non-GAAP financial information should be considered in addition to, not as a substitute for or as being superior to, measures of financial performance prepared in accordance with GAAP.
35
GAAP to Non-GAAP Financial Measures: Fiscal Year 2016, Fiscal Year 2015, and Fiscal Year 2014
| |
Fiscal Year 2016 | ||||||||||||
|---|---|---|---|---|---|---|---|---|---|---|---|---|---|
(Amounts in thousands, except per share amounts)
|
Selling, general and administrative expenses |
Operating loss |
Net loss | Loss per diluted share |
|||||||||
GAAP as reported |
$ | 279,362 | $ | (15,383 | ) | $ | (17,291 | ) | $ | (0.27 | ) | ||
Adjustments affecting comparability: |
|||||||||||||
Net legal settlement and fees (Includes $6.2M accrual for trademark infringement case) |
5,727 | 5,727 | 5,727 | ||||||||||
| | | | | | | | | | | | | | |
Total adjustments(1) |
5,727 | 5,727 | 5,727 | 0.09 | |||||||||
| | | | | | | | | | | | | | |
Non-GAAP as adjusted |
$ | 273,635 | $ | (9,656 | ) | $ | (11,564 | ) | $ | (0.18 | ) | ||
| | | | | | | | | | | | | | |
| | | | | | | | | | | | | | |
| | | | | | | | | | | | | | |
| |
Fiscal Year 2015 | ||||||||||||
|---|---|---|---|---|---|---|---|---|---|---|---|---|---|
(Amounts in thousands, except per share amounts)
|
Selling, general and administrative expenses |
Operating loss |
Net loss | Loss per diluted share |
|||||||||
GAAP as reported |
$ | 272,960 | $ | (8,105 | ) | $ | (10,069 | ) | $ | (0.16 | ) | ||
Adjustments affecting comparability: |
|||||||||||||
Consulting expense-Project Excellence |
3,129 | 3,129 | 3,129 | ||||||||||
Certain severance expenses |
2,213 | 2,213 | 2,213 | ||||||||||
Net reduction of moving expenses for new headquarters |
(124 | ) | (124 | ) | (124 | ) | |||||||
Executive relocation expense |
146 | 146 | 146 | ||||||||||
Legal expense |
2,452 | 2,452 | 2,452 | ||||||||||
| | | | | | | | | | | | | | |
Total adjustments(1) |
7,816 | 7,816 | 7,816 | 0.12 | |||||||||
| | | | | | | | | | | | | | |
Non-GAAP as adjusted |
$ | 265,144 | $ | (289 | ) | $ | (2,253 | ) | $ | (0.04 | ) | ||
| | | | | | | | | | | | | | |
| | | | | | | | | | | | | | |
| | | | | | | | | | | | | | |
| |
Fiscal Year 2014 | ||||||||||||
|---|---|---|---|---|---|---|---|---|---|---|---|---|---|
(Amounts in thousands, except per share amounts)
|
Selling, general and administrative expenses |
Operating loss |
Net loss | Loss per diluted share |
|||||||||
GAAP as reported |
$ | 265,371 | $ | (15,596 | ) | $ | (16,885 | ) | $ | (0.27 | ) | ||
Adjustments affecting comparability: |
|||||||||||||
Consulting expense-Project Excellence |
1,693 | 1,693 | 1,693 | ||||||||||
Certain severance expenses |
2,989 | 2,989 | 2,989 | ||||||||||
Duplicative rent expense for new headquarters |
4,118 | 4,118 | 4,118 | ||||||||||
Executive recruiting expense |
102 | 102 | 102 | ||||||||||
Legal expense |
250 | 250 | 250 | ||||||||||
| | | | | | | | | | | | | | |
Total adjustments(1) |
9,152 | 9,152 | 9,152 | 0.15 | |||||||||
| | | | | | | | | | | | | | |
Non-GAAP as adjusted |
$ | 256,219 | $ | (6,444 | ) | $ | (7,733 | ) | $ | (0.12 | ) | ||
| | | | | | | | | | | | | | |
| | | | | | | | | | | | | | |
| | | | | | | | | | | | | | |
- (1)
- The tax effect of $5.7 million, $7.8 million, and $9.2 million of non-operating expenses during fiscal year 2016, fiscal year 2015, and fiscal year 2014, respectively, is offset by a full valuation allowance against deferred tax assets.
36
Seasonality
The Company views the retail apparel market as having two principal selling seasons: spring (first and second quarter) and fall (third and fourth quarter). The Company's business experiences seasonal fluctuations in net sales and operating income, with a significant portion of its operating income typically realized during its fourth quarter. Any decrease in sales or margins during either of the principal selling seasons in any given year could have a disproportionate effect on the Company's financial condition and results of operations. Seasonal fluctuations also affect inventory levels. The Company must carry a significant amount of inventory, especially before the holiday season selling period in the fourth quarter and prior to the Easter and Mother's Day holidays toward the latter part of the first quarter and beginning of the second quarter.
Liquidity and Capital Resources
The Company's primary uses of cash are to fund working capital, operating expenses, debt service and capital expenditures related primarily to the construction of new stores, remodeling/refreshing of existing stores and development of the Company's information technology infrastructure and omni-channel strategy. Historically, the Company has financed these requirements from internally generated cash flow. The Company intends to fund its ongoing capital and working capital requirements, as well as debt service obligations, primarily through cash flows from operations, supplemented by borrowings under its credit facility, if needed. As of the date of this Annual Report on Form 10-K, the Company is in compliance with all debt covenants.
The Company may also use cash to repurchase shares of its common stock. On July 14, 2016, the Company announced that its board of directors had authorized the use of up to $5 million to repurchase the Company's common stock over a 12-month period. Repurchases are expected to be made from time to time in the manner the Company believes appropriate, through open market or private transactions including through pre-established trading plans. The Company is not obligated to acquire any particular amount of common stock. Repurchases are dependent on a number of factors including market conditions for the Company's common stock.
| |
January 28, 2017 |
January 30, 2016 |
January 31, 2015 |
|||||||
|---|---|---|---|---|---|---|---|---|---|---|
| |
(Amounts in thousands) |
|||||||||
Cash and cash equivalents |
$ | 88,369 | $ | 61,432 | $ | 69,293 | ||||
Working capital |
$ | 59,587 | $ | 42,035 | $ | 46,665 | ||||
| |
Fiscal Year 2016 |
Fiscal Year 2015 |
Fiscal Year 2014 |
|||||||
|---|---|---|---|---|---|---|---|---|---|---|
| |
(Amounts in thousands) |
|||||||||
Net cash provided by operating activities |
$ | 48,760 | $ | 20,649 | $ | 12,000 | ||||
Net cash used in investing activities |
$ | (18,308 | ) | $ | (26,502 | ) | $ | (26,527 | ) | |
Net cash (used in) provided by financing activities |
$ | (3,515 | ) | $ | (2,008 | ) | $ | 14,097 | ||
| | | | | | | | | | | |
Net increase (decrease) in cash and cash equivalents |
$ | 26,937 | $ | (7,861 | ) | $ | (430 | ) | ||
| | | | | | | | | | | |
| | | | | | | | | | | |
| | | | | | | | | | | |
Operating Activities
Net cash provided by operating activities was $48.8 million during fiscal year 2016, as compared to $20.6 million during fiscal year 2015. The increase in cash provided by operating activities during fiscal year 2016, as compared to fiscal year 2015, is primarily due to the ADS Agreement resulting in $40.0 million of signing bonuses received in fiscal year 2016, which was partially offset by an increase in the Company's operating loss as described in the "Results of Operations" section above, and changes in other assets and liabilities.
37
Net cash provided by operating activities was $20.6 million during fiscal year 2015, as compared to $12.0 million during fiscal year 2014. The increase in cash provided by operating activities during fiscal year 2015, as compared to fiscal year 2014, is primarily due to a $6.8 million improvement in net operating results, as compared to fiscal year 2014, as described in the "Results of Operations" section above. In addition, initiatives related to Project Excellence led to the extension of the Company's credit terms with certain vendors during fiscal year 2015, which contributed to the increase in cash provided by operating activities, as compared to fiscal year 2014.
Investing Activities
Net cash used in investing activities was $18.3 million, $26.5 million, and $26.5 million, during fiscal year 2016, fiscal year 2015, and fiscal year 2014, respectively. During fiscal year 2016, capital spending of $10.1 million was primarily related to the opening of 2 New York & Company stores, the conversion of 50 New York & Company stores to Outlet stores, and the remodeling/refreshing of 15 existing locations. The Company also invested $8.2 million in non-store capital projects, which principally represent investments in the Company's information technology infrastructure, including its omni-channel capabilities, eCommerce store and mobile applications.
During fiscal year 2015, capital spending of $13.8 million was primarily related to the opening of 8 new Outlet stores and 4 New York & Company stores, and the remodeling of 8 existing locations. The Company also invested $12.8 million in non-store capital projects, which principally represent investments in the Company's information technology infrastructure, including its omni-channel capabilities, eCommerce store and mobile applications. Net cash used in investing activities during fiscal year 2014 included $5.9 million of capital expenditures related to the build-out of the Company's new corporate headquarters and the related information technology infrastructure. In addition, during fiscal year 2014, capital spending of $16.1 million was related to the opening of 11 new Outlet stores, and 1 New York & Company store, and the remodeling of 11 existing locations. The Company also invested $4.8 million in non-store capital projects, which principally represent information technology to enhance its omni-channel capabilities and eCommerce website. These investments were partially offset by $0.3 million of insurance recoveries.
For fiscal year 2017, capital expenditures are expected to be below $20 million. In total, fiscal year 2017 capital expenditures reflect continued investments in the Company's information technology, including its omni-channel infrastructure, eCommerce store and mobile applications, and real estate spending to support opening a select number of new stores and remodeling/refreshing existing locations. In fiscal year 2017, the Company expects to open 2 new Outlet stores, remodel/refresh 8 existing stores, open 6 to 10 New York & Company stores with short-term leases, and close between 34 and 38 stores ending the fiscal year with between 436 and 444 stores, including 122 Outlet stores, and approximately 2.2 million selling square feet.
As of January 28, 2017, approximately 50% of the Company's store leases could be terminated by the Company within one year or less, and 60% of the Company's store leases could be terminated within two years or less.
Financing Activities
Net cash used in financing activities was $3.5 million in fiscal year 2016, as compared to $2.0 million in fiscal year 2015, and net cash provided by financing activities of $14.1 million in fiscal year 2014. Net cash used in financing activities during fiscal year 2016 consisted primarily of $1.2 million for principal payments on capital lease obligations, $1.1 million for the repurchase of 476,645 shares of the Company's common stock under its authorized share repurchase program, $1.0 million for quarterly repayments of the Term Loan, and $0.3 million of shares withheld for the
38
payment of employee payroll taxes, partially offset by $0.1 million of proceeds from the exercise of stock options.
Net cash used in financing activities during fiscal year 2015 consisted primarily of $1.0 million for quarterly repayments of the Term Loan, $0.6 million for principal payments on capital lease obligations, $0.3 million of shares withheld for payment of employee payroll taxes, and $0.2 million of financing costs. Net cash provided by financing activities for fiscal year 2014 consisted of $15.0 million of proceeds from the Term Loan and $0.3 million of proceeds from the exercise of stock options, partially offset by the payment of $0.6 million of financing costs, $0.3 million for the quarterly repayment of the Term Loan, $0.3 million of shares withheld for payment of employee payroll taxes, and $0.1 million for principal payments on a capital lease obligation.
Long-Term Debt and Credit Facilities
On October 24, 2014, Lerner New York, Inc., Lernco, Inc. and Lerner New York Outlet, LLC (f.k.a. Lerner New York Outlet, Inc.), wholly-owned indirect subsidiaries of New York & Company, Inc., entered into a Fourth Amended and Restated Loan and Security Agreement (the "Loan Agreement") with Wells Fargo Bank, National Association, as Agent and Term Loan Agent and the lender party thereto. The obligations under the Loan Agreement are guaranteed by New York & Company, Inc. and its other subsidiaries.
The Loan Agreement consists of: (i) a revolving credit facility that provides the Company with up to $100 million of credit, consisting of a $75 million revolving credit facility (which includes a sub-facility for issuance of letters of credit up to $45 million) with a fully committed accordion option that allows the Company to increase the revolving credit facility up to $100 million or decrease it to a minimum of $60 million, subject to certain restrictions, and (ii) a $15 million, 5-year term loan, bearing interest at the Adjusted Eurodollar Rate plus 4.50%. The Company used a portion of the proceeds from the Term Loan to pay for costs associated with the relocation and build-out of its new corporate headquarters at 330 West 34th Street, New York, New York and for general corporate purposes.
Under the terms of the Loan Agreement, the interest rates applicable to Revolving Loans are, at the Company's option, either at a floating rate equal to the Adjusted Eurodollar Rate plus a margin of between 1.50% and 1.75% per year for Eurodollar Rate Loans or a floating rate equal to the Prime Rate plus a margin of between 0.50% and 0.75% per year for Prime Rate Loans, depending upon the Company's Average Compliance Excess Availability. The Company pays to the lender under the revolving credit facility a monthly fee on outstanding commercial letters of credit at a rate of between 0.75% and 0.875% per year and on standby letters of credit at a rate of between 1.50% and 1.75% per year, depending upon the Company's Average Compliance Excess Availability, plus a monthly fee on a proportion of the unused commitments under the revolving credit facility at a rate of 0.25% per year.
The maximum borrowing availability under the Company's revolving credit facility is determined by a monthly borrowing base calculation based on applying specified advance rates against inventory and certain other eligible assets. As of January 28, 2017, the Company had availability under its revolving credit facility of $36.7 million, net of letters of credit outstanding of $14.5 million, as compared to availability of $36.6 million, net of letters of credit outstanding of $15.6 million, as of January 30, 2016. Included in the $14.5 million of letters of credit outstanding at January 28, 2017 are $0.3 million of trade letters of credit and $14.2 million of standby letters of credit primarily related to the Company's new corporate headquarters and certain insurance contracts. Standby letters of credit related to the Company's corporate headquarters are scheduled to be reduced by $2.0 million annually beginning in October 2017, for a total reduction of $6.0 million by October 2019.
Under the terms of the Loan Agreement, the Company is subject to a Minimum Excess Availability covenant of $7.5 million. The Loan Agreement contains other covenants and conditions, including restrictions on the Company's ability to pay dividends on its common stock, prepay the Term
39
Loan, incur additional indebtedness and to prepay, redeem, defease or purchase other indebtedness. Subject to such restrictions, the Company may incur more indebtedness for working capital, capital expenditures, stock repurchases, acquisitions and for other purposes.
The lender has been granted a pledge of the common stock of Lerner New York Holding, Inc. and certain of its subsidiaries, and a first priority security interest in substantially all other tangible and intangible assets of New York & Company, Inc. and its subsidiaries, as collateral for the Company's obligations under the Loan Agreement. In addition, New York & Company, Inc. and certain of its subsidiaries have fully and unconditionally guaranteed the obligations under the Loan Agreement, and such guarantees are joint and several.
Cash Requirements
The Company believes that cash flows from operations, its current cash balance and funds available under its credit facility will be sufficient to meet its working capital needs and planned capital expenditures through fiscal year 2017.
Off-Balance Sheet Arrangements
The Company does not have any off-balance sheet arrangements as defined by Item 303 (a) (4) of Regulation S-K.
Contractual Obligations
The following table summarizes the Company's contractual obligations as of January 28, 2017:
| |
|
Payments Due by Period(5) | ||||||||||||||
|---|---|---|---|---|---|---|---|---|---|---|---|---|---|---|---|---|
| |
Total obligations |
Less than one year |
One to three years |
Three to five years |
More than five years |
|||||||||||
| |
(Amounts in thousands) |
|||||||||||||||
Long-term debt(1) |
$ | 12,750 | $ | 1,000 | $ | 2,000 | $ | 9,750 | $ | — | ||||||
Capital leases(2) |
7,045 | 1,860 | 3,593 | 1,592 | — | |||||||||||
Operating leases(3) |
430,547 | 79,276 | 104,032 | 81,017 | 166,222 | |||||||||||
Purchase obligations(4) |
90,601 | 82,876 | 7,725 | — | — | |||||||||||
| | | | | | | | | | | | | | | | | |
Total contractual obligations |
$ | 540,943 | $ | 165,012 | $ | 117,350 | $ | 92,359 | $ | 166,222 | ||||||
| | | | | | | | | | | | | | | | | |
| | | | | | | | | | | | | | | | | |
| | | | | | | | | | | | | | | | | |
- (1)
- Does
not include any scheduled interest payments. Amounts are presented gross of unamortized deferred financing fees. For fiscal year 2017, interest expense related
to the Company's long-term debt is expected to be approximately $0.7 million.
- (2)
- Represents
future minimum lease payments under capital leases as of January 28, 2017.
- (3)
- Represents
future minimum lease payments under non-cancelable operating leases as of January 28, 2017. The minimum lease payments do not include common area
maintenance ("CAM") charges, real estate taxes or other landlord charges, which are also contractual obligations under store and office operating leases. In many of the Company's leases, CAM charges
are not fixed and can fluctuate from year to year. During fiscal year 2016, CAM charges and real estate taxes were $53.7 million and other landlord charges were $4.1 million.
- (4)
- Represents purchase orders for inventory and construction commitments for stores not yet received or recorded on the consolidated balance sheet, as well as contractual obligations for distribution and logistics services used in the normal course of business, and fees related to the Company's collaboration with Eva Mendes.
40
- (5)
- Not included in the above table are net potential cash obligations of $1.8 million associated with unrecognized tax benefits and $1.9 million associated with an underfunded pension liability due to the high degree of uncertainty regarding the timing of future cash outflows associated with such obligations. For further information related to unrecognized tax benefits and the underfunded pension liability, please refer to Note 11, "Income Taxes" and Note 7, "Employee Benefit Plans," respectively, in the Notes to Consolidated Financial Statements appearing elsewhere in this Annual Report on Form 10-K.
Commercial Commitments
The following table summarizes the Company's commercial commitments as of January 28, 2017:
| |
|
Amount of Commitment Per Period(2) | ||||||||||||||
|---|---|---|---|---|---|---|---|---|---|---|---|---|---|---|---|---|
| |
Total obligations |
Less than one year |
One to three years |
Three to five years |
More than five years |
|||||||||||
| |
(Amounts in thousands) |
|||||||||||||||
Trade letters of credit outstanding(1) |
$ | 304 | $ | 304 | $ | — | $ | — | $ | — | ||||||
Standby letters of credit(1) |
14,225 | 14,225 | — | — | — | |||||||||||
| | | | | | | | | | | | | | | | | |
Total commercial commitments |
$ | 14,529 | $ | 14,529 | $ | — | $ | — | $ | — | ||||||
| | | | | | | | | | | | | | | | | |
| | | | | | | | | | | | | | | | | |
| | | | | | | | | | | | | | | | | |
- (1)
- Issued
under its revolving credit facility. Standby letters of credit primarily relate to the Company's new corporate headquarters and certain insurance contracts.
At January 28, 2017, there were no outstanding borrowings under the revolving credit facility.
- (2)
- Excludes purchase orders for merchandise and supplies in the normal course of business.
Critical Accounting Policies
The preparation of financial statements in conformity with generally accepted accounting principles in the United States requires management to make estimates and assumptions that impact the amounts reported on the Company's consolidated financial statements and related notes. On an ongoing basis, management evaluates its estimates and judgments, including those related to inventories, long-lived assets, intangible assets, and income taxes. Management bases its estimates and judgments on historical experience and various other factors that are believed to be reasonable under the circumstances. Actual results may differ materially from these judgments. Management believes the following estimates and assumptions are most significant to reporting the Company's results of operations and financial position.
Inventory Valuation. Inventories are valued at the lower of average cost or market, on a weighted average cost basis, using the retail method. The Company records a charge to cost of goods sold, buying and occupancy costs for all inventory on-hand when a permanent retail price reduction is reflected in its stores. In addition, management makes estimates and judgments regarding, among other things, initial markup, markdowns, future demand and market conditions, all of which significantly impact the ending inventory valuation. If actual future demand or market conditions are different than those projected by management, future period merchandise margin rates may be unfavorably or favorably affected. Other significant estimates related to inventory include shrink and obsolete and excess inventory which are also based on historical results and management's operating projections.
Impairment of Long-Lived Assets. The Company evaluates long-lived assets in accordance with Financial Accounting Standards Board ("FASB") Accounting Standards CodificationTM ("ASC") Topic 360, "Property, Plant and Equipment." Long-lived assets are evaluated for recoverability whenever events or changes in circumstances indicate that an asset may have been impaired. The evaluation is performed at the individual store level, which is the lowest level for which identifiable
41
cash flows are largely independent of the cash flows of other groups of assets and liabilities. In evaluating long-lived assets for recoverability, the Company estimates the future cash flows at the individual store level that are expected to result from the use of each store's assets based on historical experience, omni-channel strategy, knowledge and market data assumptions. If the sum of the expected future undiscounted cash flows is less than the carrying amount of the long-lived assets, an impairment loss, equal to the excess of the carrying amount over the fair value of the assets, is recognized. An impairment loss could have a material adverse impact on the Company's financial condition and results of operations. For further information related to the impairment of long-lived assets, please refer to Note 5, "Property and Equipment," in the Notes to Consolidated Financial Statements appearing elsewhere in this Annual Report on Form 10-K.
Intangible Assets. The Company follows ASU 2012-02, "Testing Indefinite-Lived Intangible Assets for Impairment," which amends FASB ASC Topic 350, "Intangibles—Goodwill and Other" to permit an entity to first assess qualitative factors to determine if it is more likely than not that an indefinite-lived intangible asset is impaired and whether it is necessary to perform the impairment test of comparing the carrying amount with the recoverable amount of the indefinite-lived intangible asset.
The Company's intangible assets relate to the New York & Company trademarks, which were initially valued at $14.8 million. The trademarks were initially valued using the "relief from royalty method" and were determined to have indefinite lives by an independent appraiser. The Company's fiscal year 2016, fiscal year 2015, and fiscal year 2014 impairment tests resulted in a fair value that significantly exceeded the carrying amount of the Company's trademarks. The calculation of estimated fair values used in the evaluation of long-lived assets and intangible assets requires estimates of future cash flows, growth rates, discount rates and other variables that are based on historical experience, knowledge, and market data. If actual experience differs materially from management's estimates or if changes in strategic direction occur, an impairment charge may be required. Management's estimates may be affected by factors such as those outlined in "Item 1A. Risk Factors." An impairment loss could have a material adverse impact on the Company's results of operations. In addition to assessing qualitative factors that could impact the fair value of the New York & Company trademarks, the Company performed a sensitivity analysis on the key assumptions used in the trademark impairment analysis and has determined that a significant, negative change in the assumptions would not impact the Company's conclusion that no impairment was required.
Income Taxes. Income taxes are calculated in accordance with ASC Topic 740, "Income Taxes" ("ASC 740"), which requires the use of the liability method. Deferred tax assets and liabilities are recognized based on the difference between the financial statement carrying amounts of assets and liabilities and their respective tax bases. Inherent in the measurement of deferred balances are certain judgments and interpretations of enacted tax laws and published guidance with respect to applicability to the Company's operations. A valuation allowance is established against deferred tax assets when it is more likely than not that some portion or all of the deferred tax assets will not be realized. The provisions in ASC 740 related to accounting for uncertain tax positions prescribe a comprehensive model of how a company should recognize, measure, present and disclose in its financial statements uncertain tax positions that the company has taken or expects to take on a tax return. In accordance with these provisions, the Company recognizes a tax benefit when a tax position is more likely than not to be sustained upon examination, based solely on its technical merits. The Company measures the recognized tax benefit as the largest amount of tax benefit that has greater than a 50% likelihood of being realized upon the ultimate settlement with a taxing authority. The Company reverses a previously recognized tax benefit if it determines that the tax position no longer meets the more-likely-than-not threshold of being sustained. The Company accrues interest and penalties related to unrecognized tax benefits in income tax expense. For further information related to deferred tax assets and the related valuation allowance, please refer to Note 11, "Income Taxes," in the Notes to Consolidated Financial Statements appearing elsewhere in this Annual Report on Form 10-K.
42
Item 7A. Quantitative and Qualitative Disclosures About Market Risk
Interest Rates. The Company's market risks relate primarily to changes in interest rates. The Company's credit facility carries floating interest rates that are tied to the Adjusted Eurodollar Rate and the Prime rate and therefore, if the Company borrows under the credit facility, the consolidated statements of operations and the consolidated statements of cash flows will be exposed to changes in interest rates. As of January 28, 2017, the Company had no borrowings outstanding under its credit facility. The Company's long-term debt carries a floating interest rate that is tied to the Adjusted Eurodollar Rate and therefore, a 1.0% increase in interest rates would increase interest expense by approximately $0.1 million annually. The Company historically has not engaged in interest rate hedging activities.
Currency Exchange Rates. The Company historically has not been exposed to currency exchange rate risks with respect to inventory purchases as such expenditures have been, and continue to be, denominated in U.S. Dollars.
Item 8. Financial Statements and Supplementary Data
The financial statements and schedule included in Part IV, "Item 15. Exhibits and Financial Statement Schedules" of this Annual Report on Form 10-K are incorporated herein by reference.
Item 9. Changes in and Disagreements with Accountants on Accounting and Financial Disclosure
As disclosed in the Company's Current Report on Form 8-K, originally filed on May 5, 2016 and amended on June 3, 2016, the Company dismissed Ernst & Young LLP as its independent registered public accounting firm (after approval of the Company's board of directors, as recommended by the Company's audit committee), effective May 27, 2016.
Ernst & Young LLP's reports on the Company's consolidated financial statements as of and for the fiscal years ended January 30, 2016 and January 31, 2015 did not contain an adverse opinion or disclaimer of opinion and were not qualified or modified as to uncertainty, audit scope or accounting principles.
During the Company's two most recent fiscal years ended January 30, 2016 and January 31, 2015 and the subsequent interim period through May 27, 2016, (i) there were no disagreements within the meaning of Item 304(a)(1)(iv) of Regulation S-K, between the Company and Ernst & Young LLP on any matter of accounting principles or practices, financial statement disclosure, or auditing scope or procedure, any of which that, if not resolved to Ernst & Young LLP's satisfaction, would have caused Ernst & Young LLP to make reference to the subject matter of any such disagreement in connection with its reports for such years and interim period, and (ii) there were no reportable events within the meaning of Item 304(a)(1)(v) of Regulation S-K.
The Company provided Ernst & Young LLP with a copy of the above disclosures and requested that Ernst & Young LLP furnish a letter addressed to the Securities and Exchange Commission stating whether it agrees with the statements made herein. A copy of Ernst & Young LLP's letter dated June 3, 2016 was filed as Exhibit 16.1 to the Company's Current Report on Form 8-K/A, filed on June 3, 2016.
As disclosed in the Company's Current Report on Form 8-K, originally filed on May 5, 2016 and amended on June 3, 2016, the Company engaged BDO USA, LLP as the Company's new independent registered public accounting firm for the fiscal year ending January 28, 2017 (after approval of the Company's board of directors, as recommended by the Company's audit committee). This engagement was effective on May 27, 2016 immediately following the filing of the Company's Quarterly Report on Form 10-Q for the three months ended April 30, 2016.
43
During the Company's two most recent fiscal years ended January 30, 2016 and January 31, 2015 and the subsequent interim period preceding the engagement of BDO USA, LLP, neither the Company nor anyone on its behalf has consulted with BDO USA, LLP regarding (i) the application of accounting principles to a specified transaction, either completed or proposed, or the type of audit opinion that might be rendered on the Company's financial statements, and neither a written report nor oral advice was provided to the Company that BDO USA, LLP concluded was an important factor considered by the Company in reaching a decision as to any accounting, auditing, or financial reporting issue, (ii) any matter that was the subject of a disagreement within the meaning of Item 304(a)(1)(iv) of Regulation S-K, or (iii) any reportable event within the meaning of Item 304(a)(1)(v) of Regulation S-K.
Item 9A. Controls and Procedures
- (a)
- Evaluation of disclosure controls and procedures
The Company carried out an evaluation, as of January 28, 2017, under the supervision and with the participation of the Company's management, including the Company's Principal Executive Officer and Principal Financial Officer, of the effectiveness of the design and operation of the Company's disclosure controls and procedures pursuant to Rule 13a-15(e) and 15d-15(e) of the Securities Exchange Act of 1934, as amended. Based upon that evaluation, the Principal Executive Officer and Principal Financial Officer concluded that the Company's disclosure controls and procedures are effective in ensuring that all information required to be filed in this Annual Report on Form 10-K was (i) recorded, processed, summarized and reported within the time period specified in the Securities and Exchange Commission's rules and forms and (ii) that the disclosure controls and procedures include, without limitation, controls and procedures designed to ensure that information required to be disclosed by the Company in the reports that the Company files or submits under the Exchange Act is accumulated and communicated to the Company's management, including its Principal Executive and Principal Financial Officers, as appropriate to allow timely decisions regarding required disclosure.
- (b)
- Report of management on internal control over financial reporting
The Company's management is responsible for establishing and maintaining adequate internal control over financial reporting as defined in Rule 13a-15(f) and 15d-15(f) under the Securities Exchange Act of 1934, as amended. The Company's internal control over financial reporting is a process designed to provide reasonable assurance to the Company's management and Board of Directors regarding the reliability of financial reporting and the preparation and fair presentation of published financial statements in accordance with accounting principles generally accepted in the United States.
Because of its inherent limitations, internal control over financial reporting may not prevent or detect misstatements. Therefore, even those systems determined to be effective can provide only reasonable assurance with respect to financial statement preparation and presentation. Also, projections of any evaluation of the effectiveness to future periods are subject to the risk that controls may become inadequate because of changes in conditions, or that the degree of compliance with the policies or procedures may deteriorate.
Management assessed the effectiveness of the Company's internal control over financial reporting as of January 28, 2017. In making this assessment, management used the criteria established in the Internal Control—Integrated Framework report issued by the Committee of Sponsoring Organizations of the Treadway Commission (2013 framework) (the "COSO criteria").
Based upon management's assessment and the COSO criteria, the Company's Principal Executive Officer and Principal Financial Officer believe that the Company maintained effective internal control over financial reporting as of January 28, 2017.
44
The Company's independent auditors, BDO USA, LLP, an independent registered public accounting firm, have audited and reported on the consolidated financial statements of the Company and the effectiveness of the Company's internal control over financial reporting. The reports of the independent auditors appear on pages 51 and 52 herein and expressed unqualified opinions on the consolidated financial statements and the effectiveness of the Company's internal control over financial reporting.
- (c)
- Changes in internal control over financial reporting
There has been no change in the Company's internal control over financial reporting identified in connection with the evaluation required by paragraph (d) of Exchange Act Rule 13a-15 or 15d-15 that occurred during the Company's last fiscal quarter (the Company's fourth fiscal quarter in the case of an annual report) that has materially affected, or is reasonably likely to materially affect, the Company's internal control over financial reporting.
None.
45
Item 10. Directors, Executive Officers and Corporate Governance
The information required by this Item is incorporated herein by reference from the Company's Proxy Statement for the Annual Meeting of Stockholders to be held June 20, 2017.
Item 11. Executive Compensation
The information required by this Item is incorporated herein by reference from the Company's Proxy Statement for the Annual Meeting of Stockholders to be held June 20, 2017.
Item 12. Security Ownership of Certain Beneficial Owners and Management and Related Stockholder Matters
The information required by this Item is incorporated herein by reference from the Company's Proxy Statement for the Annual Meeting of Stockholders to be held June 20, 2017.
Item 13. Certain Relationships and Related Transactions, and Director Independence
The information required by this Item is incorporated herein by reference from the Company's Proxy Statement for the Annual Meeting of Stockholders to be held June 20, 2017.
Item 14. Principal Accountant Fees and Services
The information required by this Item is incorporated herein by reference from the Company's Proxy Statement for the Annual Meeting of Stockholders to be held June 20, 2017.
46
Item 15. Exhibits and Financial Statement Schedules
- (a)
- List
of documents filed as part of this Annual Report:
- 1.
- The
following consolidated financial statements of the Company are filed as part of this Annual Report:
- •
- Reports of Independent Registered Public Accounting Firms;
- •
- Consolidated Statements of Operations;
- •
- Consolidated Statements of Comprehensive Loss;
- •
- Consolidated Balance Sheets;
- •
- Consolidated Statements of Cash Flows;
- •
- Consolidated Statements of Stockholders' Equity; and
- •
- Notes to Consolidated Financial Statements.
- 2.
- Financial Statement Schedule II Valuation and Qualifying Accounts
Fiscal Year
|
Reserve Description |
Balance at beginning of period |
Additions Charged to Operations |
Deductions | Balance at end of period |
||||||||||
|---|---|---|---|---|---|---|---|---|---|---|---|---|---|---|---|
| |
|
(Amounts in thousands) |
|||||||||||||
2014 |
Sales Return Reserve | $ | 1,419 | $ | 32,861 | $ | 32,767 | $ | 1,513 | ||||||
2015 |
Sales Return Reserve | $ | 1,513 | $ | 38,638 | $ | 38,931 | $ | 1,220 | ||||||
2016 |
Sales Return Reserve | $ | 1,220 | $ | 41,134 | $ | 40,915 | $ | 1,439 | ||||||
- 3.
- Exhibits
The exhibits listed in the accompanying Exhibit Index are filed or incorporated by reference as part of this Form 10-K.
None.
47
Pursuant to the requirements of Section 13 or 15(d) of the Securities Exchange Act of 1934, as amended, the registrant has duly caused this report to be signed on its behalf by the undersigned, thereunto duly authorized, on April 11, 2017.
| NEW YORK & COMPANY, INC. (REGISTRANT) |
||
/s/ SHEAMUS TOAL Sheamus Toal Executive Vice President and Chief Financial Officer (Principal financial officer and Principal accounting officer) |
Pursuant to the requirements of the Securities Exchange Act of 1934, as amended, this report has been signed below by the following persons on behalf of the registrant and in the capacities indicated.
Name
|
Title
|
Date
|
||
|---|---|---|---|---|
| /s/ GREGORY J. SCOTT Gregory J. Scott |
Chief Executive Officer and Director (Principal executive officer) |
April 11, 2017 | ||
/s/ SHEAMUS TOAL Sheamus Toal |
Executive Vice President and Chief Financial Officer (Principal financial officer and Principal accounting officer) |
April 11, 2017 |
||
/s/ BODIL M. ARLANDER Bodil M. Arlander |
Director |
April 11, 2017 |
||
/s/ DAVID H. EDWAB David H. Edwab |
Director |
April 11, 2017 |
||
/s/ JAMES O. EGAN James O. Egan |
Director |
April 11, 2017 |
||
/s/ LORI H. GREELEY Lori H. Greeley |
Director |
April 11, 2017 |
48
Name
|
Title
|
Date
|
||
|---|---|---|---|---|
| /s/ CHRISTY HAUBEGGER Christy Haubegger |
Director | April 11, 2017 | ||
/s/ JOHN D. HOWARD John D. Howard |
Director |
April 11, 2017 |
||
/s/ GRACE NICHOLS Grace Nichols |
Director and Chair of the Board |
April 11, 2017 |
||
/s/ ARTHUR E. REINER Arthur E. Reiner |
Director |
April 11, 2017 |
49
New York & Company, Inc. and Subsidiaries
Consolidated Financial Statements
Index to Financial Statements
50
REPORT OF INDEPENDENT REGISTERED PUBLIC ACCOUNTING FIRM
To
Board of Directors and Stockholders
New York & Company, Inc.
New York, New York
We have audited the accompanying consolidated balance sheet of New York & Company, Inc. and subsidiaries (the "Company") as of January 28, 2017 and the related consolidated statements of operations, comprehensive loss, stockholders' equity, and cash flows for the year ended January 28, 2017. Our audit also included the financial statement schedule listed in the Index at Item 15(a) for the year ended January 28, 2017. These financial statements are the responsibility of the Company's management. Our responsibility is to express an opinion on these financial statements based on our audit.
We conducted our audit in accordance with the standards of the Public Company Accounting Oversight Board (United States). Those standards require that we plan and perform the audit to obtain reasonable assurance about whether the financial statements are free of material misstatement. An audit includes examining, on a test basis, evidence supporting the amounts and disclosures in the financial statements, assessing the accounting principles used and significant estimates made by management, as well as evaluating the overall financial statement presentation. We believe that our audit provides a reasonable basis for our opinion.
In our opinion, the consolidated financial statements referred to above present fairly, in all material respects, the financial position of New York & Company, Inc. and subsidiaries at January 28, 2017 and the results of their operations and their cash flows for the year ended January 28, 2017, in conformity with accounting principles generally accepted in the United States of America.
Also, in our opinion, the related financial statement schedule, when considered in relation to the basic financial statements taken as a whole, presents fairly in all material respects the information set forth therein.
/s/ BDO USA, LLP |
New
York, New York
April 11, 2017
51
REPORT OF INDEPENDENT REGISTERED PUBLIC ACCOUNTING FIRM
To
Board of Directors and Stockholders
New York & Company, Inc.
New York, New York
We have audited New York & Company, Inc. and subsidiaries' internal control over financial reporting as of January 28, 2017, based on criteria established in Internal Control—Integrated Framework (2013) issued by the Committee of Sponsoring Organizations of the Treadway Commission (the COSO criteria). New York & Company, Inc. and subsidiaries' management is responsible for maintaining effective internal control over financial reporting and for its assessment of the effectiveness of internal control over financial reporting, included in the accompanying Report of Management on Internal Control over Financial Reporting. Our responsibility is to express an opinion on the company's internal control over financial reporting based on our audit.
We conducted our audit in accordance with the standards of the Public Company Accounting Oversight Board (United States). Those standards require that we plan and perform the audit to obtain reasonable assurance about whether effective internal control over financial reporting was maintained in all material respects. Our audit included obtaining an understanding of internal control over financial reporting, assessing the risk that a material weakness exists, and testing and evaluating the design and operating effectiveness of internal control based on the assessed risk. Our audit also included performing such other procedures as we considered necessary in the circumstances. We believe that our audit provides a reasonable basis for our opinion.
A company's internal control over financial reporting is a process designed to provide reasonable assurance regarding the reliability of financial reporting and the preparation of financial statements for external purposes in accordance with generally accepted accounting principles. A company's internal control over financial reporting includes those policies and procedures that (1) pertain to the maintenance of records that, in reasonable detail, accurately and fairly reflect the transactions and dispositions of the assets of the company; (2) provide reasonable assurance that transactions are recorded as necessary to permit preparation of financial statements in accordance with generally accepted accounting principles, and that receipts and expenditures of the company are being made only in accordance with authorizations of management and directors of the company; and (3) provide reasonable assurance regarding prevention or timely detection of unauthorized acquisition, use, or disposition of the company's assets that could have a material effect on the financial statements.
Because of its inherent limitations, internal control over financial reporting may not prevent or detect misstatements. Also, projections of any evaluation of effectiveness to future periods are subject to the risk that controls may become inadequate because of changes in conditions, or that the degree of compliance with the policies or procedures may deteriorate.
In our opinion, New York & Company, Inc. and subsidiaries maintained, in all material respects, effective internal control over financial reporting as of January 28, 2017, based on the COSO criteria.
We also have audited, in accordance with the standards of the Public Company Accounting Oversight Board (United States), the consolidated balance sheet of New York & Company, Inc. and subsidiaries as of January 28, 2017, and the related consolidated statements of operations, comprehensive loss, stockholders' equity, and cash flows for the year ended January 28, 2017 and our report dated April 11, 2017, expressed an unqualified opinion thereon.
/s/ BDO USA, LLP |
New
York, New York
April 11, 2017
52
REPORT OF INDEPENDENT REGISTERED PUBLIC ACCOUNTING FIRM
The Board of Directors and Shareholders of New York & Company, Inc. and Subsidiaries
We have audited the accompanying consolidated balance sheet of New York & Company, Inc. and Subsidiaries (the "Company") as of January 30, 2016, and the related consolidated statements of operations, comprehensive loss, stockholders' equity and cash flows for each of the two years in the period ended January 30, 2016. Our audits also included the financial statement schedule listed in the Index at Item 15(a). These financial statements and schedule are the responsibility of the Company's management. Our responsibility is to express an opinion on these financial statements and schedule based on our audits.
We conducted our audits in accordance with the standards of the Public Company Accounting Oversight Board (United States). Those standards require that we plan and perform the audit to obtain reasonable assurance about whether the financial statements are free of material misstatement. An audit includes examining, on a test basis, evidence supporting the amounts and disclosures in the financial statements. An audit also includes assessing the accounting principles used and significant estimates made by management, as well as evaluating the overall financial statement presentation. We believe that our audits provide a reasonable basis for our opinion.
In our opinion, the financial statements referred to above present fairly, in all material respects, the consolidated financial position of New York & Company, Inc. and Subsidiaries at January 30, 2016, and the consolidated results of their operations and their cash flows for each of the two years in the period ended January 30, 2016, in conformity with U.S. generally accepted accounting principles. Also, in our opinion, the related financial statement schedule, when considered in relation to the basic financial statements taken as a whole, presents fairly in all material respects the information set forth therein.
/s/ ERNST & YOUNG LLP |
New
York, New York
April 14, 2016
53
New York & Company, Inc. and Subsidiaries
Consolidated Statements of Operations
(Amounts in thousands, except per share amounts)
|
Fiscal year ended January 28, 2017 (52-weeks) |
Fiscal year ended January 30, 2016 (52-weeks) |
Fiscal year ended January 31, 2015 (52-weeks) |
|||||||
|---|---|---|---|---|---|---|---|---|---|---|
Net sales |
$ | 929,081 | $ | 950,108 | $ | 923,332 | ||||
Cost of goods sold, buying and occupancy costs |
665,102 | 685,253 | 673,557 | |||||||
| | | | | | | | | | | |
Gross profit |
263,979 | 264,855 | 249,775 | |||||||
Selling, general and administrative expenses |
279,362 | 272,960 | 265,371 | |||||||
| | | | | | | | | | | |
Operating loss |
(15,383 | ) | (8,105 | ) | (15,596 | ) | ||||
Interest expense, net of interest income of $15, $11, and $5, respectively |
1,235 | 1,227 | 573 | |||||||
| | | | | | | | | | | |
Loss before income taxes |
(16,618 | ) | (9,332 | ) | (16,169 | ) | ||||
Provision for income taxes |
673 | 737 | 716 | |||||||
| | | | | | | | | | | |
Net loss |
$ | (17,291 | ) | $ | (10,069 | ) | $ | (16,885 | ) | |
| | | | | | | | | | | |
| | | | | | | | | | | |
| | | | | | | | | | | |
Basic loss per share |
$ | (0.27 | ) | $ | (0.16 | ) | $ | (0.27 | ) | |
| | | | | | | | | | | |
| | | | | | | | | | | |
| | | | | | | | | | | |
Diluted loss per share |
$ | (0.27 | ) | $ | (0.16 | ) | $ | (0.27 | ) | |
| | | | | | | | | | | |
| | | | | | | | | | | |
| | | | | | | | | | | |
Weighted average shares outstanding: |
||||||||||
Basic shares of common stock |
63,356 | 63,154 | 62,825 | |||||||
| | | | | | | | | | | |
| | | | | | | | | | | |
| | | | | | | | | | | |
Diluted shares of common stock |
63,356 | 63,154 | 62,825 | |||||||
| | | | | | | | | | | |
| | | | | | | | | | | |
| | | | | | | | | | | |
New York & Company, Inc. and Subsidiaries
Consolidated Statements of Comprehensive Loss
(Amounts in thousands)
|
Fiscal year ended January 28, 2017 (52-weeks) |
Fiscal year ended January 30, 2016 (52-weeks) |
Fiscal year ended January 31, 2015 (52-weeks) |
|||||||
|---|---|---|---|---|---|---|---|---|---|---|
Net loss |
$ | (17,291 | ) | $ | (10,069 | ) | $ | (16,885 | ) | |
Other comprehensive income (loss): |
||||||||||
Change in minimum pension liability, net of tax |
555 | 895 | (1,075 | ) | ||||||
| | | | | | | | | | | |
Comprehensive loss |
$ | (16,736 | ) | $ | (9,174 | ) | $ | (17,960 | ) | |
| | | | | | | | | | | |
| | | | | | | | | | | |
| | | | | | | | | | | |
See accompanying notes.
54
New York & Company, Inc. and Subsidiaries
Consolidated Balance Sheets
(Amounts in thousands, except per share amounts)
|
January 28, 2017 |
January 30, 2016 |
|||||
|---|---|---|---|---|---|---|---|
Assets |
|||||||
Current assets: |
|||||||
Cash and cash equivalents |
$ | 88,369 | $ | 61,432 | |||
Accounts receivable |
11,837 | 8,208 | |||||
Income taxes receivable |
144 | 47 | |||||
Inventories, net |
78,044 | 87,777 | |||||
Prepaid expenses |
18,746 | 19,442 | |||||
Other current assets |
824 | 858 | |||||
| | | | | | | | |
Total current assets |
197,964 | 177,764 | |||||
Property and equipment, net |
87,070 | 88,831 | |||||
Intangible assets |
14,879 | 14,879 | |||||
Other assets |
1,675 | 1,986 | |||||
| | | | | | | | |
Total assets |
$ | 301,588 | $ | 283,460 | |||
| | | | | | | | |
| | | | | | | | |
| | | | | | | | |
Liabilities and stockholders' equity |
|||||||
Current liabilities: |
|||||||
Current portion-long-term debt |
$ | 841 | $ | 841 | |||
Accounts payable |
68,068 | 82,225 | |||||
Accrued expenses |
69,294 | 52,424 | |||||
Income taxes payable |
174 | 239 | |||||
| | | | | | | | |
Total current liabilities |
138,377 | 135,729 | |||||
Long-term debt, net of current portion |
11,485 | 12,326 | |||||
Deferred rent |
30,039 | 34,351 | |||||
Other liabilities |
42,518 | 7,283 | |||||
| | | | | | | | |
Total liabilities |
222,419 | 189,689 | |||||
Commitments and contingencies |
|||||||
Stockholders' equity: |
|||||||
Common stock, voting, par value $0.001; 300,000 shares authorized; 65,844 and 65,479 shares issued and 64,367 and 64,479 shares outstanding at January 28, 2017 and January 30, 2016, respectively |
66 | 65 | |||||
Additional paid-in capital |
181,399 | 178,195 | |||||
Retained deficit |
(96,472 | ) | (79,181 | ) | |||
Accumulated other comprehensive loss |
(1,356 | ) | (1,911 | ) | |||
Treasury stock at cost; 1,477 and 1,000 shares at January 28, 2017 and January 30, 2016, respectively |
(4,468 | ) | (3,397 | ) | |||
| | | | | | | | |
Total stockholders' equity |
79,169 | 93,771 | |||||
| | | | | | | | |
Total liabilities and stockholders' equity |
$ | 301,588 | $ | 283,460 | |||
| | | | | | | | |
| | | | | | | | |
| | | | | | | | |
See accompanying notes.
55
New York & Company, Inc. and Subsidiaries
Consolidated Statements of Cash Flows
(Amounts in thousands)
|
Fiscal year ended January 28, 2017 (52-weeks) |
Fiscal year ended January 30, 2016 (52-weeks) |
Fiscal year ended January 31, 2015 (52-weeks) |
|||||||
|---|---|---|---|---|---|---|---|---|---|---|
Operating activities |
||||||||||
Net loss |
$ | (17,291 | ) | $ | (10,069 | ) | $ | (16,885 | ) | |
Adjustments to reconcile net loss to net cash provided by operating activities: |
||||||||||
Depreciation and amortization |
22,786 | 24,181 | 27,315 | |||||||
Loss from impairment charges |
1,197 | 327 | 911 | |||||||
Amortization of deferred financing costs |
189 | 201 | 131 | |||||||
Share-based compensation expense |
3,404 | 3,867 | 4,089 | |||||||
Changes in operating assets and liabilities: |
||||||||||
Restricted cash |
— | 1,509 | (1,509 | ) | ||||||
Accounts receivable |
(3,629 | ) | (948 | ) | (380 | ) | ||||
Income taxes receivable |
(97 | ) | 52 | — | ||||||
Inventories, net |
9,733 | 6,014 | (10,312 | ) | ||||||
Prepaid expenses |
696 | 1,139 | 560 | |||||||
Accounts payable |
(14,157 | ) | (4,256 | ) | 10,607 | |||||
Accrued expenses |
16,082 | (417 | ) | 5,538 | ||||||
Income taxes payable |
(65 | ) | (471 | ) | (365 | ) | ||||
Deferred rent |
(4,312 | ) | (818 | ) | (4,756 | ) | ||||
Other assets and liabilities |
34,224 | 338 | (2,944 | ) | ||||||
| | | | | | | | | | | |
Net cash provided by operating activities |
48,760 | 20,649 | 12,000 | |||||||
Investing activities |
||||||||||
Capital expenditures |
(18,308 | ) | (26,648 | ) | (26,781 | ) | ||||
Insurance recoveries |
— | 146 | 254 | |||||||
| | | | | | | | | | | |
Net cash used in investing activities |
(18,308 | ) | (26,502 | ) | (26,527 | ) | ||||
Financing activities |
||||||||||
Proceeds from long-term debt |
— | — | 15,000 | |||||||
Repayment of long-term debt |
(1,000 | ) | (1,000 | ) | (250 | ) | ||||
Payment of financing costs |
— | (161 | ) | (566 | ) | |||||
Purchase of treasury stock |
(1,079 | ) | — | — | ||||||
Proceeds from exercise of stock options |
121 | 16 | 299 | |||||||
Shares withheld for payment of employee payroll taxes |
(312 | ) | (297 | ) | (284 | ) | ||||
Principal payment on capital lease obligations |
(1,245 | ) | (566 | ) | (102 | ) | ||||
| | | | | | | | | | | |
Net cash (used in) provided by financing activities |
(3,515 | ) | (2,008 | ) | 14,097 | |||||
Net increase (decrease) in cash and cash equivalents |
26,937 | (7,861 | ) | (430 | ) | |||||
Cash and cash equivalents at beginning of period |
61,432 | 69,293 | 69,723 | |||||||
| | | | | | | | | | | |
Cash and cash equivalents at end of period |
$ | 88,369 | $ | 61,432 | $ | 69,293 | ||||
| | | | | | | | | | | |
| | | | | | | | | | | |
| | | | | | | | | | | |
Cash paid during the period for interest |
$ | 887 | $ | 900 | $ | 371 | ||||
| | | | | | | | | | | |
| | | | | | | | | | | |
| | | | | | | | | | | |
Cash paid during the period for taxes |
$ | 507 | $ | 526 | $ | 1,390 | ||||
| | | | | | | | | | | |
| | | | | | | | | | | |
| | | | | | | | | | | |
Non-cash capital lease transactions |
$ | 3,914 | $ | 2,317 | $ | 2,267 | ||||
| | | | | | | | | | | |
| | | | | | | | | | | |
| | | | | | | | | | | |
See accompanying notes.
56
New York & Company, Inc. and Subsidiaries
Consolidated Statements of Stockholders' Equity
| |
Common Stock | Treasury Stock | |
|
Accumulated Other Comprehensive Loss |
|
|||||||||||||||||||
|---|---|---|---|---|---|---|---|---|---|---|---|---|---|---|---|---|---|---|---|---|---|---|---|---|---|
| |
Additional Paid-in Capital |
Retained Deficit |
|
||||||||||||||||||||||
(Amounts in thousands)
|
Shares | Amount | Shares | Amount | Total | ||||||||||||||||||||
Balance at February 1, 2014 |
63,467 | $ | 64 | 1,000 | $ | (3,397 | ) | $ | 170,506 | $ | (52,227 | ) | $ | (1,731 | ) | $ | 113,215 | ||||||||
Issuance of common stock upon exercise of stock options and stock appreciation rights |
116 | 1 | — | — | 298 | — | — | 299 | |||||||||||||||||
Restricted stock issued and vesting of units |
832 | — | — | — | — | — | — | — | |||||||||||||||||
Restricted stock forfeits and shares withheld for employee payroll taxes |
(179 | ) | — | — | — | (284 | ) | — | — | (284 | ) | ||||||||||||||
Share-based compensation expense |
— | — | — | — | 4,089 | — | — | 4,089 | |||||||||||||||||
Net loss |
— | — | — | — | — | (16,885 | ) | — | (16,885 | ) | |||||||||||||||
Minimum pension liability adjustment, net of tax |
— | — | — | — | — | — | (1,075 | ) | (1,075 | ) | |||||||||||||||
| | | | | | | | | | | | | | | | | | | | | | | | | | |
Comprehensive loss, net of tax |
— | — | — | — | — | — | — | (17,960 | ) | ||||||||||||||||
| | | | | | | | | | | | | | | | | | | | | | | | | | |
Balance at January 31, 2015 |
64,236 | $ | 65 | 1,000 | $ | (3,397 | ) | $ | 174,609 | $ | (69,112 | ) | $ | (2,806 | ) | $ | 99,359 | ||||||||
Issuance of common stock upon exercise of stock options and stock appreciation rights |
8 | — | — | — | 16 | — | — | 16 | |||||||||||||||||
Restricted stock issued and vesting of units |
423 | — | — | — | — | — | — | — | |||||||||||||||||
Restricted stock forfeits and shares withheld for employee payroll taxes |
(188 | ) | — | — | — | (297 | ) | — | — | (297 | ) | ||||||||||||||
Share-based compensation expense |
— | — | — | — | 3,867 | — | — | 3,867 | |||||||||||||||||
Net loss |
— | — | — | — | — | (10,069 | ) | — | (10,069 | ) | |||||||||||||||
Minimum pension liability adjustment, net of tax |
— | — | — | — | — | — | 895 | 895 | |||||||||||||||||
| | | | | | | | | | | | | | | | | | | | | | | | | | |
Comprehensive loss, net of tax |
— | — | — | — | — | — | — | (9,174 | ) | ||||||||||||||||
| | | | | | | | | | | | | | | | | | | | | | | | | | |
Balance at January 30, 2016 |
64,479 | $ | 65 | 1,000 | $ | (3,397 | ) | $ | 178,195 | $ | (79,181 | ) | $ | (1,911 | ) | $ | 93,771 | ||||||||
Purchase of treasury stock |
(477 | ) | — | 477 | (1,071 | ) | (8 | ) | — | — | (1,079 | ) | |||||||||||||
Issuance of common stock upon exercise of stock options and stock appreciation rights |
46 | 1 | — | — | 120 | — | — | 121 | |||||||||||||||||
Restricted stock issued and vesting of units |
678 | — | — | — | — | — | — | — | |||||||||||||||||
Restricted stock forfeits and shares withheld for employee payroll taxes |
(359 | ) | — | — | — | (312 | ) | — | — | (312 | ) | ||||||||||||||
Share-based compensation expense |
— | — | — | — | 3,404 | — | — | 3,404 | |||||||||||||||||
Net loss |
— | — | — | — | — | (17,291 | ) | — | (17,291 | ) | |||||||||||||||
Minimum pension liability adjustment, net of tax |
— | — | — | — | — | — | 555 | 555 | |||||||||||||||||
| | | | | | | | | | | | | | | | | | | | | | | | | | |
Comprehensive loss, net of tax |
— | — | — | — | — | — | — | (16,736 | ) | ||||||||||||||||
| | | | | | | | | | | | | | | | | | | | | | | | | | |
Balance at January 28, 2017 |
64,367 | $ | 66 | 1,477 | $ | (4,468 | ) | $ | 181,399 | $ | (96,472 | ) | $ | (1,356 | ) | $ | 79,169 | ||||||||
| | | | | | | | | | | | | | | | | | | | | | | | | | |
| | | | | | | | | | | | | | | | | | | | | | | | | | |
| | | | | | | | | | | | | | | | | | | | | | | | | | |
See accompanying notes.
57
New York & Company, Inc. and Subsidiaries
Notes to Consolidated Financial Statements
January 28, 2017
1. Organization and Basis of Presentation of Financial Statements
New York & Company, Inc. (together with its subsidiaries, the "Company") is a specialty retailer of women's fashion apparel and accessories, providing fashion that is feminine, polished, on-trend and versatile. New York & Company, Inc. helps its customers feel confident, put-together, attractive and stylish by providing affordable fashion. The Company's proprietary branded New York & Company® merchandise is sold through its national network of retail stores and eCommerce store at www.nyandcompany.com. The target customers for the Company's merchandise are fashion-conscious, value-sensitive women between the ages of 25 and 45. As of January 28, 2017, the Company operated 466 stores in 39 states.
The Company's fiscal year is a 52- or 53-week year that ends on the Saturday closest to January 31. The accompanying consolidated financial statements include the accounts of the Company for the 52-weeks ended January 28, 2017 ("fiscal year 2016"), 52-weeks ended January 30, 2016 ("fiscal year 2015"), and 52-weeks ended January 31, 2015 ("fiscal year 2014"). All significant intercompany balances and transactions have been eliminated in consolidation.
The Company identifies its operating segments according to how its business activities are managed and evaluated. Its operating segments have been aggregated and are reported as one reportable segment based on the similar nature of products sold, production process, distribution process, target customers and economic characteristics. All of the Company's revenues are generated in the United States.
2. Summary of Significant Accounting Policies
Recently Issued Accounting Pronouncements
In May 2014, the Financial Accounting Standards Board ("FASB") issued Accounting Standards Update ("ASU") 2014-09, "Revenue from Contracts with Customers" ("ASU 2014-09"), which supersedes the revenue recognition requirements in FASB Accounting Standards Codification™ ("ASC") Topic 605, "Revenue Recognition" and requires entities to recognize revenue in a way that depicts the transfer of promised goods or services to customers in an amount that reflects the consideration to which an entity expects to be entitled to in exchange for those goods or services. In August 2015, the FASB issued ASU 2015-14, "Revenue from Contracts with Customers: Deferral of the Effective Date," which defers the effective date of ASU 2014-09 to annual reporting periods beginning after December 15, 2017, including interim reporting periods within those reporting periods. As amended, early adoption is permitted for annual reporting periods beginning after December 15, 2016, including interim reporting periods within those reporting periods. The standard may be applied retrospectively to each prior period presented or on a modified retrospective basis with the cumulative effect recognized as of the date of adoption. The Company is continuing to evaluate the impact of the adoption of this standard on its consolidated financial statements and related disclosures, but based on its current review, the Company plans to adopt ASU 2014-09 using the modified retrospective method, and the more significant change that the Company has identified relates to the timing of when revenue is recognized from its loyalty programs.
In February 2016, the FASB issued ASU 2016-02, "Leases" ("ASU 2016-02"), which is a comprehensive new lease standard that amends various aspects of existing accounting guidance for leases. The core principle of ASU 2016-02 will require lessees to present the assets and liabilities that
58
New York & Company, Inc. and Subsidiaries
Notes to Consolidated Financial Statements (Continued)
January 28, 2017
2. Summary of Significant Accounting Policies (Continued)
arise from leases on their balance sheets. ASU 2016-02 is effective for annual periods beginning after December 15, 2018, and interim periods within those fiscal years and requires modified retrospective adoption. Early adoption is permitted. The Company is currently evaluating the new standard and its impact on the Company's financial position and results of operations but expects that the adoption of ASU 2016-02 will result in a significant increase to its long-term assets and liabilities on the consolidated balance sheet.
In March 2016, the FASB issued ASU 2016-09, "Compensation—Stock Compensation: Improvements to Employee Share-Based Payment Accounting" ("ASU 2016-09"), which simplifies several aspects of accounting for employee share-based payment transactions, including the accounting for income taxes, forfeitures, and statutory tax withholding requirements, as well as classification within the statement of cash flows for certain components of share-based awards. ASU 2016-09 is effective for annual reporting periods beginning after December 15, 2016, including interim periods within those fiscal years. Early adoption is permitted, including adoption in an interim period. The adoption of ASU 2016-09 will not have a material impact on the Company's financial position or results of operations.
In August 2016, the FASB issued ASU 2016-15, "Classification of Certain Cash Receipts and Cash Payments" ("ASU 2016-15"), which addresses how certain cash receipts and cash payments are classified in the statement of cash flows with the objective of reducing the existing diversity in practice related to eight specific cash flow issues. ASU 2016-15 is effective for fiscal years beginning after December 15, 2017, and interim periods within those fiscal years, and requires retrospective adoption. Early adoption is permitted. The Company does not expect the adoption of ASU 2016-15 to have a material impact on the Company's financial position or results of operations.
In November 2016, the FASB issued ASU 2016-18, "Statement of Cash Flows: Restricted Cash" (ASU 2016-18"), which requires amounts generally described as restricted cash and restricted cash equivalents to be included within cash and cash equivalents when reconciling the beginning and ending balances shown on the consolidated statement of cash flows. ASU 2016-18 is effective for fiscal years beginning after December 15, 2017, and interim periods within those fiscal years, and requires retrospective adoption. Early adoption is permitted. The adoption of ASU 2016-18 will not have a material impact on the Company's financial position or results of operations.
In March 2017, the FASB issued ASU 2017-07, "Compensation-Retirement Benefits: Improving the Presentation of Net Periodic Pension Cost and Net Periodic Postretirement Benefit Cost" ("ASU 2017-07"), which requires: the disaggregation of the service cost component from the other components of net benefit costs in the income statement; provides explicit guidance on the presentation of service cost component and the other components of net benefit cost in the income statement; and allows only the service cost component of net benefit cost to be eligible for capitalization. ASU 2017-07 is effective for annual reporting periods beginning after December 15, 2017, and interim periods within those fiscal years, and requires retrospective adoption. Early adoption is permitted. The Company does not expect the adoption of ASU 2017-07 to have a material impact on Company's financial position or results of operations.
59
New York & Company, Inc. and Subsidiaries
Notes to Consolidated Financial Statements (Continued)
January 28, 2017
2. Summary of Significant Accounting Policies (Continued)
Revenue Recognition
Revenue from the sale of merchandise at the Company's stores is recognized at the time the customer takes possession of the related merchandise and the purchases are paid for, primarily with either cash or credit card. Revenue, including shipping fees billed to customers, from the sale of merchandise at the Company's eCommerce store is recognized when the merchandise is shipped to the customer and the purchases are paid for. Revenue for gift cards and merchandise credits is recognized at redemption. Prior to their redemption, gift cards and merchandise credits are recorded as a liability. Discounts and promotional coupons offered to customers are accounted for as a reduction of sales revenue at the time the coupons are tendered by the customer. The Company presents sales taxes collected from customers on a net basis (excluded from revenues).
The Company also recognizes revenue in connection with its new private label credit card agreement with Comenity Bank, a bank subsidiary of Alliance Data Systems Corporation ("ADS"), which replaced the existing agreement with ADS and has a term through April 30, 2026 (the "ADS Agreement"). Upon execution of the ADS Agreement, the Company recorded $40.0 million of deferred revenue, which will be amortized on a straight-line basis over the 10-year term of the ADS agreement. In addition, over the term of the ADS Agreement, the Company will receive an increased level of royalty revenue based on a percentage of private label credit card sales. For further information related to the ADS Agreement, please refer to Note 4, "Proprietary Credit Card" in the Notes to Consolidated Financial Statements appearing elsewhere in this Annual Report on Form 10-K.
The Company issues gift cards and merchandise credits which do not contain provisions for expiration or inactivity fees. The portion of the dollar value of gift cards and merchandise credits that ultimately is not used by customers to make purchases is known as breakage and will be recognized as revenue if the Company determines it is not required to escheat such amounts to government agencies under state escheatment laws. The Company recognizes gift card and merchandise credit breakage as revenue as they each are redeemed over a two-year redemption period based on their respective historical breakage rate. The Company considers the likelihood of redemption remote beyond a two-year redemption period, at which point any unrecognized breakage is recognized as revenue. The Company determined the redemption period and the breakage rates for gift cards and merchandise credits based on their respective historical redemption patterns.
During fiscal year 2016, fiscal year 2015, and fiscal year 2014 the Company recorded breakage revenue for gift cards and merchandise credits of $0.7 million, $0.8 million, and $0.8 million, respectively.
Reserve for Returns
The Company reserves for sales returns through reductions in sales and gross margin based upon historical merchandise returns experience and current sales levels.
Fair Value Measurements and Financial Instruments
The Company measures fair value in accordance with ASC 820 Topic, "Fair Value Measurements" ("ASC 820"). ASC 820 establishes a three-level fair value hierarchy that requires entities to maximize
60
New York & Company, Inc. and Subsidiaries
Notes to Consolidated Financial Statements (Continued)
January 28, 2017
2. Summary of Significant Accounting Policies (Continued)
the use of observable inputs and minimize the use of unobservable inputs when measuring fair value. The three levels of inputs used to measure fair value are as follows:
| Level 1: | Observable inputs such as quoted prices in active markets; | |
Level 2: |
Inputs, other than the quoted prices in active markets, that are observable either directly or indirectly; and |
|
Level 3: |
Unobservable inputs in which there is little or no market data and require the reporting entity to develop its own assumptions. |
The Company's financial instruments consist of cash and cash equivalents, short-term trade receivables, accounts payable, and long-term debt. The carrying values on the balance sheet for cash and cash equivalents, short-term trade receivables and accounts payable approximate their fair values due to the short-term maturities of such items. At January 28, 2017 and January 30, 2016, the carrying amount of long-term debt approximated its fair value due to the variable interest rate it carries.
Cash and Cash Equivalents
Cash and cash equivalents include all cash in banks, cash on-hand, and all short-term investments with an original maturity of three months or less when purchased.
Inventories
Inventories are valued at the lower of average cost or market, on a weighted average cost basis, using the retail method.
Deferred Rent
The Company recognizes fixed minimum rent expense on non-cancelable leases on a straight-line basis over the term of each individual lease including the build-out period. The difference between recognized rental expense and amounts payable under the lease is recorded as a deferred lease liability. In addition, the Company recognizes landlord allowances as a deferred lease liability, which is amortized over the term of the related lease as a reduction to rent expense. For contingent rent expense based upon sales, the Company estimates annual contingent rent expense and recognizes a portion each month based on actual sales. At January 28, 2017 and January 30, 2016, the deferred lease liability was $30.0 million and $34.4 million, respectively, and is reported as "Deferred rent" on the consolidated balance sheets.
Property and Equipment
Property and equipment are recorded at cost. Expenditures for new properties and improvements are capitalized, while the cost of repair and maintenance is charged to expense. Depreciation of property and equipment is provided on a straight-line basis over the estimated useful lives of the assets.
61
New York & Company, Inc. and Subsidiaries
Notes to Consolidated Financial Statements (Continued)
January 28, 2017
2. Summary of Significant Accounting Policies (Continued)
The estimated useful lives of property and equipment, for financial statement purposes, are as follows:
Depreciable Fixed Assets
|
Useful Life | |
|---|---|---|
Land |
— | |
Store fixtures and equipment |
3 - 10 years | |
Office furniture, fixtures and equipment |
3 - 15 years | |
Software |
5 years | |
Leasehold improvements |
Lesser of the useful life or the term of the lease |
Cost of Goods Sold, Buying and Occupancy Costs
Cost of goods sold, buying and occupancy costs is comprised of direct inventory costs for merchandise sold, distribution costs, shipping costs, payroll and related costs for the Company's design, sourcing, production, merchandising, planning and allocation personnel, and store occupancy and related costs.
Share-Based Compensation
The Company accounts for all share-based payments in accordance with FASB ASC Topic 718, "Compensation—Stock Compensation" ("ASC 718"). For further information related to share-based compensation, please refer to Note 8, "Share-Based Compensation."
Marketing
Marketing costs, which consist primarily of direct mail and point-of-sale ("POS") advertising costs, are expensed at the time the promotion is mailed or first appears in the store. For the following periods, marketing costs reported in "Selling, general and administrative expenses" on the consolidated statements of operations were as follows:
Fiscal Year
|
(Amounts in thousands) |
|||
|---|---|---|---|---|
2016 |
$ | 35,991 | ||
2015 |
$ | 35,181 | ||
2014 |
$ | 33,352 | ||
At January 28, 2017 and January 30, 2016, marketing costs reported in "Prepaid expenses" on the consolidated balance sheets amounted to $1.2 million and $1.8 million, respectively.
Pre-Opening Expenses
Costs, such as advertising and payroll costs, incurred prior to the opening of a new store are expensed as incurred.
Store Supplies
The initial inventory and subsequent shipments of supplies for new stores, including, but not limited to, hangers, signage, packaging and POS supplies, are expensed as incurred.
62
New York & Company, Inc. and Subsidiaries
Notes to Consolidated Financial Statements (Continued)
January 28, 2017
2. Summary of Significant Accounting Policies (Continued)
Deferred Financing Costs
In accordance with ASU 2015-03, "Simplifying the Presentation of Debt Issuance Costs," costs related to the issuance of debt are presented as a direct deduction from the carrying amount of the related debt liability in the consolidated balance sheets and amortized as interest expense over the term of the related debt. In accordance with ASU 2015-15, "Interest—Imputation of Interest: Presentation and Subsequent Measurement of Debt issuance Costs Associated with Line-of-Credit Arrangements," debt issuance costs related to the Company's revolving credit facility are capitalized as "Other assets" in the consolidated balance sheets and amortized as interest expense over the term of the credit facility. At January 28, 2017 and January 30, 2016, net deferred financing costs were $0.5 million and $0.7 million, respectively.
Interest Expense
Interest expense, net of interest income, includes interest primarily related to the Company's long-term debt, amortization of deferred financing costs, and revolving credit facility.
Impairment of Long-lived Assets
The Company evaluates the impairment of long-lived assets in accordance with ASC Topic 360, "Property, Plant and Equipment." Long-lived assets are evaluated for recoverability whenever events or changes in circumstances indicate that an asset may have been impaired. The evaluation is performed at the individual store level, which is the lowest level for which identifiable cash flows are largely independent of the cash flows of other groups of assets and liabilities. In evaluating long-lived assets for recoverability, the Company estimates the future cash flows at the individual store level that are expected to result from the use of each store's assets based on historical experience, omni-channel strategy, knowledge and market data assumptions. If the sum of the expected future undiscounted cash flows is less than the carrying amount of the long-lived assets, an impairment loss, equal to the excess of the carrying amount over the fair value of the assets, is recognized.
Intangible Assets
The Company follows ASU 2012-02, "Testing Indefinite-Lived Intangible Assets for Impairment," which amends FASB ASC Topic 350, "Intangibles—Goodwill and Other" to permit an entity to first assess qualitative factors to determine if it is more likely than not that an indefinite-lived intangible asset is impaired and whether it is necessary to perform the impairment test of comparing the carrying amount with the recoverable amount of the indefinite-lived intangible asset.
The Company's intangible assets relate to the New York & Company trademarks, which were initially valued at $14.8 million. The trademarks were initially valued using the "relief from royalty method" and were determined to have indefinite lives by an independent appraiser. The Company assesses trademarks for impairment annually as of December 31, or more frequently if an event occurs or circumstances change that would more likely than not reduce the fair value of trademarks below their carrying value. The Company's fiscal year 2016, fiscal year 2015, and fiscal year 2014 impairment tests resulted in a fair value that significantly exceeded the carrying amount of the Company's trademarks. In addition to assessing qualitative factors that could impact the fair value of the New
63
New York & Company, Inc. and Subsidiaries
Notes to Consolidated Financial Statements (Continued)
January 28, 2017
2. Summary of Significant Accounting Policies (Continued)
York & Company trademarks, the Company performed a sensitivity analysis on the key assumptions used in the trademark impairment analysis and has determined that a significant, negative change in the assumptions would not impact the Company's conclusion that no impairment was required.
Income Taxes
Income taxes are calculated in accordance with ASC Topic 740, "Income Taxes" ("ASC 740"), which requires the use of the liability method. Deferred tax assets and liabilities are recognized based on the difference between the financial statement carrying amounts of assets and liabilities and their respective tax bases. Inherent in the measurement of deferred balances are certain judgments and interpretations of enacted tax laws and published guidance with respect to applicability to the Company's operations. A valuation allowance is established against deferred tax assets when it is more likely than not that some portion or all of the deferred tax assets will not be realized. The provisions in ASC 740 related to accounting for uncertain tax positions prescribe a comprehensive model of how a company should recognize, measure, present and disclose in its financial statements uncertain tax positions that the company has taken or expects to take on a tax return. Under these provisions, the Company recognizes a tax benefit when a tax position is more likely than not to be sustained upon examination, based solely on its technical merits. The Company measures the recognized tax benefit as the largest amount of tax benefit that has greater than a 50% likelihood of being realized upon the ultimate settlement with a taxing authority. The Company reverses a previously recognized tax benefit if it determines that the tax position no longer meets the more-likely-than-not threshold of being sustained. The Company accrues interest and penalties related to unrecognized tax benefits in income tax expense.
Comprehensive Income (Loss)
Comprehensive income (loss) is calculated in accordance with ASC Topic 220, "Comprehensive Income." Comprehensive income (loss) includes net income (loss) and other comprehensive income (loss). The tax effect of other comprehensive income (loss) is offset by corresponding adjustments to the valuation allowance against deferred tax assets. The Company reports the components of other comprehensive income (loss) and accumulated other comprehensive loss in the consolidated financial statements included in this Annual Report on Form 10-K.
Earnings (Loss) Per Share
Basic earnings (loss) per share are computed by dividing net income (loss) by the weighted average number of shares of common stock outstanding for the period. Except when the effect would be anti-dilutive, diluted earnings (loss) per share are calculated based on the weighted average number of outstanding shares of common stock plus the dilutive effect of share-based awards calculated under the
64
New York & Company, Inc. and Subsidiaries
Notes to Consolidated Financial Statements (Continued)
January 28, 2017
2. Summary of Significant Accounting Policies (Continued)
treasury stock method. A reconciliation between basic and diluted earnings (loss) per share is as follows:
| |
Fiscal Year 2016 |
Fiscal Year 2015 |
Fiscal Year 2014 |
|||||||
|---|---|---|---|---|---|---|---|---|---|---|
| |
(Amounts in thousands, except per share amounts) |
|||||||||
Net loss |
$ | (17,291 | ) | $ | (10,069 | ) | $ | (16,885 | ) | |
| | | | | | | | | | | |
| | | | | | | | | | | |
| | | | | | | | | | | |
Basic loss per share |
||||||||||
Weighted average shares outstanding: |
||||||||||
Basic shares of common stock |
63,356 | 63,154 | 62,825 | |||||||
| | | | | | | | | | | |
| | | | | | | | | | | |
| | | | | | | | | | | |
Basic loss per share |
$ | (0.27 | ) | $ | (0.16 | ) | $ | (0.27 | ) | |
| | | | | | | | | | | |
| | | | | | | | | | | |
| | | | | | | | | | | |
Diluted loss per share |
||||||||||
Weighted average shares outstanding: |
||||||||||
Basic shares of common stock |
63,356 | 63,154 | 62,825 | |||||||
Plus impact of share-based awards |
— | — | — | |||||||
| | | | | | | | | | | |
Diluted shares of common stock |
63,356 | 63,154 | 62,825 | |||||||
| | | | | | | | | | | |
| | | | | | | | | | | |
| | | | | | | | | | | |
Diluted loss per share |
$ | (0.27 | ) | $ | (0.16 | ) | $ | (0.27 | ) | |
| | | | | | | | | | | |
| | | | | | | | | | | |
| | | | | | | | | | | |
The calculation of diluted loss per share for fiscal year 2016, fiscal year 2015, and fiscal year 2014 excludes the share-based awards listed in the following table due to their anti-dilutive effect, as determined under the treasury stock method:
| |
Fiscal Year 2016 |
Fiscal Year 2015 |
Fiscal Year 2014 |
|||||||
|---|---|---|---|---|---|---|---|---|---|---|
| |
(Amounts in thousands) |
|||||||||
Stock options |
334 | 465 | 528 | |||||||
Stock appreciation rights(1) |
6,869 | 6,116 | 4,163 | |||||||
Restricted stock and units |
631 | 656 | 797 | |||||||
| | | | | | | | | | | |
Total anti-dilutive shares |
7,834 | 7,237 | 5,488 | |||||||
| | | | | | | | | | | |
| | | | | | | | | | | |
| | | | | | | | | | | |
- (1)
- Each stock appreciation right ("SAR") referred to above represents the right to receive a payment measured by the increase in the fair market value of one share of common stock from the date of grant of the SAR to the date of exercise of the SAR. Upon exercise, the SARs will be settled in stock.
3. Significant Risks and Uncertainties
Use of Estimates
The preparation of consolidated financial statements in conformity with GAAP requires the Company's management to make estimates and assumptions that affect the reported amounts of assets and liabilities at the date of the financial statements and the reported amounts of revenues and
65
New York & Company, Inc. and Subsidiaries
Notes to Consolidated Financial Statements (Continued)
January 28, 2017
3. Significant Risks and Uncertainties (Continued)
expenses during the reporting period. On an ongoing basis, management evaluates its estimates and judgments, including those related to inventories, long-lived assets, intangible assets, and income taxes. Management bases its estimates and judgments on historical experience and various other factors that are believed to be reasonable under the circumstances. Actual results could differ from these estimates.
Concentration of Risk
The Company is subject to concentration of credit risk relating to cash, primarily store depository accounts, which are maintained with major financial institutions. The Company monitors the relative credit standing of these financial institutions and other entities and limits the amount of credit exposure with any one entity. The Company also monitors the creditworthiness of the entities to which it grants credit terms in the normal course of business.
The Company's largest country sources are China, Vietnam and Indonesia, which represented approximately 97% of merchandise purchases in fiscal year 2016. The Company utilized two major apparel agents, which together represented approximately 63% of the Company's merchandise purchases during fiscal year 2016; however, no individual factory represented more than approximately 7% of the Company's merchandise purchases. The Company expects to continue to utilize two major apparel agents for a large portion of its merchandise in fiscal year 2017, while maintaining a broad factory base, in order to reduce costs, maximize production and logistics assistance, and increase speed to market.
4. Proprietary Credit Card
The Company has a credit card processing agreement with ADS, which provides the services of the Company's proprietary credit card program. The Company allows payments on this credit card to be made at its stores as a service to its customers. ADS owns the credit card accounts, with no recourse from the Company. The Company's receivable due from ADS at any time represents the standard processing time of approximately three days. The amount due at January 28, 2017 and January 30, 2016 was $1.6 million and $2.0 million, respectively. The Company does not have any off-balance sheet arrangements with credit exposure.
On July 14, 2016, the Company entered into a Second Amended and Restated Private Label Credit Card Program Agreement, effectively dated May 1, 2016, with ADS, which replaced the existing agreement with ADS and has a term through April 30, 2026.
Pursuant to the terms of the ADS Agreement, ADS has the exclusive right to provide private label credit cards to customers of the Company. In connection with the execution of the ADS Agreement, the Company received $40.0 million in signing bonuses. The signing bonuses were payable in two installments, of which $17.5 million was received on July 28, 2016, and $22.5 million was received on January 10, 2017. Upon execution of the ADS Agreement, the Company recorded $40.0 million of deferred revenue, which will be amortized on a straight-line basis over the 10-year term of the ADS Agreement. As of January 28, 2017, $33.0 million of deferred revenue is included in "Other liabilities" and $4.0 million of deferred revenue is included in "Accrued expenses" on the consolidated balance sheet. In addition, over the term of the ADS Agreement, the Company will receive an increased level of royalty payments based on a percentage of private label credit card sales. During fiscal year 2016,
66
New York & Company, Inc. and Subsidiaries
Notes to Consolidated Financial Statements (Continued)
January 28, 2017
4. Proprietary Credit Card (Continued)
the Company recognized $11.0 million of revenue from royalties and the amortization of signing bonuses in connection with the ADS Agreement, as compared to recognizing $4.2 million of marketing credits in fiscal year 2015 under the previous agreement with ADS, which were recorded as a reduction to marketing expense within "Selling, general and administrative expenses" on the consolidated statement of operations. Under the previous agreement with ADS, marketing credits received by the Company were to be used for marketing of the Company's proprietary credit card program and other marketing-related activities, and as such the Company recorded these marketing credits as a reduction to marketing expense.
5. Property and Equipment
Property and equipment at January 28, 2017 and January 30, 2016 consist of the following:
| |
January 28, 2017 |
January 30, 2016 |
|||||
|---|---|---|---|---|---|---|---|
| |
(Amounts in thousands) |
||||||
Land |
$ | 117 | $ | 117 | |||
Store fixtures and equipment |
165,478 | 176,547 | |||||
Office furniture, fixtures, and equipment |
22,853 | 23,810 | |||||
Leasehold improvements |
158,080 | 162,139 | |||||
Software |
57,599 | 49,335 | |||||
Construction in progress |
846 | 1,269 | |||||
| | | | | | | | |
Total |
404,973 | 413,217 | |||||
Less accumulated depreciation |
317,903 | 324,386 | |||||
| | | | | | | | |
Property and equipment, net |
$ | 87,070 | $ | 88,831 | |||
| | | | | | | | |
| | | | | | | | |
| | | | | | | | |
Included in furniture, fixtures, and equipment above is $8.5 million and $4.6 million of assets recorded under capital leases as of January 28, 2017 and January 30, 2016, respectively.
Depreciation expense amounted to $22.8 million, $24.2 million, and $27.3 million for fiscal year 2016, fiscal year 2015, and fiscal year 2014, respectively.
The Company classifies long-lived store assets within level 3 of the fair value hierarchy as defined in ASC 820. The Company reported the following non-cash impairment charges related to underperforming store assets in fiscal year 2016, fiscal year 2015, and fiscal year 2014 in "Selling, general and administrative expenses" on the Company's consolidated statements of operations:
| |
Fiscal Year 2016 |
Fiscal Year 2015 |
Fiscal Year 2014 |
|||||||
|---|---|---|---|---|---|---|---|---|---|---|
| |
(Amounts in thousands) |
|||||||||
First quarter |
$ | — | $ | — | $ | 358 | ||||
Second quarter |
— | 232 | — | |||||||
Third quarter |
271 | 55 | 553 | |||||||
Fourth quarter |
926 | 40 | — | |||||||
| | | | | | | | | | | |
Total fiscal year impairment charges |
$ | 1,197 | $ | 327 | $ | 911 | ||||
| | | | | | | | | | | |
| | | | | | | | | | | |
| | | | | | | | | | | |
67
New York & Company, Inc. and Subsidiaries
Notes to Consolidated Financial Statements (Continued)
January 28, 2017
6. Commitments and Contingencies
The Company leases retail business locations, office and warehouse facilities, and automotive equipment under various non-cancelable operating leases expiring in various years through 2031. Leases on retail business locations typically specify minimum rentals plus common area maintenance ("CAM") charges, real estate taxes, other landlord charges and possible additional rentals based upon percentages of sales. Most of the retail business location leases have an original term of 10 years and some provide renewal options at rates specified in the leases. As of January 28, 2017, approximately 50% of the Company's store leases could be terminated by the Company within one year or less, and 60% of the Company's store leases could be terminated within two years or less.
On February 25, 2014, the Company entered into a lease for office space at 330 West 34th Street, New York, New York, which the Company moved its corporate headquarters to in December 2014 prior to the expiration of its previous lease at 450 West 33rd Street, New York, New York on January 15, 2015. The lease for the new corporate headquarters expires in 2030.
A summary of rent expense is as follows:
| |
Fiscal Year 2016 |
Fiscal Year 2015 |
Fiscal Year 2014 |
|||||||
|---|---|---|---|---|---|---|---|---|---|---|
| |
(Amounts in thousands) |
|||||||||
Fixed minimum rentals |
$ | 83,043 | $ | 85,509 | $ | 87,107 | ||||
Contingent rentals |
3,637 | 3,747 | 3,654 | |||||||
| | | | | | | | | | | |
Total store rentals |
86,680 | 89,256 | 90,761 | |||||||
Office space rentals |
9,544 | 9,431 | 5,661 | |||||||
Equipment rentals |
877 | 849 | 903 | |||||||
| | | | | | | | | | | |
Total rental expense |
$ | 97,101 | $ | 99,536 | $ | 97,325 | ||||
| | | | | | | | | | | |
| | | | | | | | | | | |
| | | | | | | | | | | |
Sublease rental income |
$ | — | $ | — | $ | 6 | ||||
| | | | | | | | | | | |
| | | | | | | | | | | |
| | | | | | | | | | | |
As of January 28, 2017, the aggregate minimum rent commitments under non-cancelable operating leases and capital leases are as follows:
| |
Operating Leases | Capital Leases | |||||||||||
|---|---|---|---|---|---|---|---|---|---|---|---|---|---|
Fiscal Year
|
Fixed Minimum Rent |
Principal | Interest | Total Payment |
|||||||||
| |
(Amounts in thousands) |
||||||||||||
2017 |
$ | 79,276 | $ | 1,657 | $ | 203 | $ | 1,860 | |||||
2018 |
57,036 | 1,718 | 142 | 1,860 | |||||||||
2019 |
46,996 | 1,654 | 79 | 1,733 | |||||||||
2020 |
43,204 | 1,141 | 32 | 1,173 | |||||||||
2021 |
37,813 | 415 | 4 | 419 | |||||||||
Thereafter |
166,222 | — | — | — | |||||||||
| | | | | | | | | | | | | | |
Total |
$ | 430,547 | $ | 6,585 | $ | 460 | $ | 7,045 | |||||
| | | | | | | | | | | | | | |
| | | | | | | | | | | | | | |
| | | | | | | | | | | | | | |
The minimum lease payments on operating leases above do not include CAM charges, real estate taxes or other landlord charges, which are also required contractual obligations under the Company's
68
New York & Company, Inc. and Subsidiaries
Notes to Consolidated Financial Statements (Continued)
January 28, 2017
6. Commitments and Contingencies (Continued)
store and office operating leases. In many of the Company's leases, CAM charges are not fixed and can fluctuate from year to year. During fiscal year 2016, CAM charges and real estate taxes were $53.7 million and other landlord charges were $4.1 million.
As of January 28, 2017, the Company had open purchase commitments of $76.2 million for inventory and $1.5 million for store construction.
Legal Proceedings
On February 10, 2017, the Company received an unfavorable judgment related to a trademark infringement case, which the Company is in the process of challenging. In connection with this ongoing dispute, the Company recorded a $6.2 million expense accrual during the fourth quarter of fiscal year 2016, which is reported in "Selling, general and administrative expenses" on the consolidated statement of operations.
There are various claims, lawsuits and pending actions against the Company arising in the normal course of the Company's business. It is the opinion of management that the ultimate resolution of these matters will not have a material effect on the Company's financial condition, results of operations or cash flows.
7. Employee Benefit Plans
Savings and Retirement Plan
The Company contributes to a defined contribution savings and retirement plan (the "SARP") qualifying under section 401(k) of the Internal Revenue Code. Participation in the SARP is available to all associates, if not covered by the pension plan discussed below, who have completed 1,000 or more hours of service with the Company during certain twelve-month periods and have attained the age of 21. Participants are able to contribute up to 100% of their pay to the SARP, subject to Internal Revenue Service ("IRS") limits. The Company matches 100% of the employee's contribution up to a maximum of 4% of the employee's eligible pay. The Company match is immediately vested.
The Company's costs under this plan were as follows:
Fiscal Year
|
(Amounts in thousands) |
|||
|---|---|---|---|---|
2016 |
$ | 1,639 | ||
2015 |
$ | 1,650 | ||
2014 |
$ | 1,759 | ||
Pension Plan
The Company sponsors a single employer defined benefit pension plan ("plan") covering substantially all union employees. Employees covered by collective bargaining agreements are primarily non-management store associates, representing approximately 8% of the Company's workforce at January 28, 2017. The plan provides retirement benefits for union employees who have attained the age of 21 and complete 1,000 or more hours of service in any calendar year following the date of
69
New York & Company, Inc. and Subsidiaries
Notes to Consolidated Financial Statements (Continued)
January 28, 2017
7. Employee Benefit Plans (Continued)
employment. The plan provides benefits based on length of service. The Company's funding policy for the pension plan is to contribute annually the amount necessary to provide for benefits based on accrued service and to contribute at least the minimum required by ERISA rules. The Company expects to contribute approximately $0.3 million to the plan during fiscal year 2017. The Company's pension plan weighted average asset allocation, by asset category, is as follows:
Asset Category
|
Fiscal Year 2016 |
Fiscal Year 2015 |
|||||
|---|---|---|---|---|---|---|---|
Equity securities |
68 | % | 66 | % | |||
Fixed income |
30 | % | 31 | % | |||
Cash and cash equivalents |
2 | % | 3 | % | |||
The Company's investment policy generally targets 65% to 70% in equity securities and 30% to 35% in fixed income.
The fair values of the pension plan assets at January 28, 2017, utilizing the fair value hierarchy in accordance with ASC 820, is as follows:
| |
|
Fair Value Measurements Using | |||||||||||
|---|---|---|---|---|---|---|---|---|---|---|---|---|---|
| |
January 28, 2017 |
Quoted Prices in Active Markets (Level 1) |
Significant Other Observable Inputs (Level 2) |
Significant Unobservable Inputs (Level 3) |
|||||||||
| |
(Amounts in thousands) |
||||||||||||
Equity securities: |
|||||||||||||
U.S. common stocks |
$ | 3,972 | $ | 3,972 | $ | — | $ | — | |||||
International common stocks |
509 | — | 509 | — | |||||||||
Fixed income securities: |
|||||||||||||
U.S. agency bonds |
838 | — | 838 | — | |||||||||
U.S. corporate bonds |
1,108 | — | 1,108 | — | |||||||||
U.S. mortgage-backed securities |
28 | — | 28 | — | |||||||||
Cash and cash equivalents: |
|||||||||||||
Cash and cash equivalents |
114 | 105 | 9 | — | |||||||||
| | | | | | | | | | | | | | |
Total |
$ | 6,569 | $ | 4,077 | $ | 2,492 | $ | — | |||||
| | | | | | | | | | | | | | |
| | | | | | | | | | | | | | |
| | | | | | | | | | | | | | |
70
New York & Company, Inc. and Subsidiaries
Notes to Consolidated Financial Statements (Continued)
January 28, 2017
7. Employee Benefit Plans (Continued)
The fair values of the pension plan assets at January 30, 2016, utilizing the fair value hierarchy in accordance with ASC 820, is as follows:
| |
|
Fair Value Measurements Using | |||||||||||
|---|---|---|---|---|---|---|---|---|---|---|---|---|---|
| |
January 30, 2016 |
Quoted Prices in Active Markets (Level 1) |
Significant Other Observable Inputs (Level 2) |
Significant Unobservable Inputs (Level 3) |
|||||||||
| |
(Amounts in thousands) |
||||||||||||
Equity securities: |
|||||||||||||
U.S. common stocks |
$ | 3,810 | $ | 3,810 | $ | — | $ | — | |||||
International common stocks |
497 | — | 497 | — | |||||||||
Fixed income securities: |
|||||||||||||
U.S. agency bonds |
840 | — | 840 | — | |||||||||
U.S. corporate bonds |
1,186 | — | 1,186 | — | |||||||||
U.S. mortgage-backed securities |
36 | — | 36 | — | |||||||||
Cash and cash equivalents: |
|||||||||||||
Cash and cash equivalents |
185 | 181 | 4 | — | |||||||||
| | | | | | | | | | | | | | |
Total |
$ | 6,554 | $ | 3,991 | $ | 2,563 | $ | — | |||||
| | | | | | | | | | | | | | |
| | | | | | | | | | | | | | |
| | | | | | | | | | | | | | |
In consideration of the fund's investment goals, demographics, time horizon available for investment and the overall risk tolerance of the board of trustees (consisting of two union trustees and two employer trustees) a long-term investment objective of long-term income and growth has been adopted for the fund's assets. This is a risk-averse balanced approach that seeks long-term growth in capital along with significant current income.
The following weighted average assumptions were used to determine benefit obligations:
| |
Fiscal Year 2016 |
Fiscal Year 2015 |
|||||
|---|---|---|---|---|---|---|---|
Discount rate |
3.90 | % | 4.00 | % | |||
The following weighted average assumptions were used to determine net periodic benefit cost:
| |
Fiscal Year 2016 |
Fiscal Year 2015 |
Fiscal Year 2014 |
|||||||
|---|---|---|---|---|---|---|---|---|---|---|
Discount rate |
4.00 | % | 3.30 | % | 4.30 | % | ||||
Long-term rate of return on assets |
8.00 | % | 8.00 | % | 8.00 | % | ||||
71
New York & Company, Inc. and Subsidiaries
Notes to Consolidated Financial Statements (Continued)
January 28, 2017
7. Employee Benefit Plans (Continued)
The measurement dates for fiscal year 2016 and fiscal year 2015 are January 28, 2017 and January 30, 2016, respectively, for the determination of benefit obligations. The following table provides information for the pension plan:
| |
Fiscal Year 2016 |
Fiscal Year 2015 |
|||||
|---|---|---|---|---|---|---|---|
| |
(Amounts in thousands) |
||||||
Change in benefit obligation: |
|||||||
Benefit obligation, beginning of period |
$ | 8,675 | $ | 10,226 | |||
Service cost |
337 | 342 | |||||
Interest |
344 | 320 | |||||
Actuarial gain |
(178 | ) | (1,545 | ) | |||
Benefits paid |
(661 | ) | (668 | ) | |||
| | | | | | | | |
Benefit obligation, end of period |
$ | 8,517 | $ | 8,675 | |||
| | | | | | | | |
| | | | | | | | |
| | | | | | | | |
Change in plan assets: |
|||||||
Fair value of plan assets, beginning of period |
$ | 6,554 | $ | 7,500 | |||
Actual gain (loss) on plan assets |
500 | (498 | ) | ||||
Benefits paid |
(661 | ) | (668 | ) | |||
Employer contributions |
176 | 220 | |||||
| | | | | | | | |
Fair value of plan assets, end of period |
$ | 6,569 | $ | 6,554 | |||
| | | | | | | | |
| | | | | | | | |
| | | | | | | | |
Funded status |
$ | (1,948 | ) | $ | (2,121 | ) | |
Unrecognized net actuarial loss |
2,623 | 3,193 | |||||
Unrecognized prior service credit |
(143 | ) | (158 | ) | |||
| | | | | | | | |
Net amount recognized |
$ | 532 | $ | 914 | |||
| | | | | | | | |
| | | | | | | | |
| | | | | | | | |
Amounts recognized in the consolidated balance sheets: |
|||||||
Accrued pension liability |
$ | (1,948 | ) | $ | (2,121 | ) | |
Accumulated other comprehensive loss |
2,480 | 3,035 | |||||
| | | | | | | | |
Net amount recognized |
$ | 532 | $ | 914 | |||
| | | | | | | | |
| | | | | | | | |
| | | | | | | | |
At January 28, 2017 and January 30, 2016, the Company reported a minimum pension liability of $1.9 million and $2.1 million, respectively, due to the underfunded status of the plan. The minimum pension liability is reported in "Other liabilities" on the consolidated balance sheets. Included in accumulated other comprehensive loss at January 28, 2017 is a net loss of $0.3 million that is expected to be recognized in net periodic benefit cost during fiscal year 2017.
72
New York & Company, Inc. and Subsidiaries
Notes to Consolidated Financial Statements (Continued)
January 28, 2017
7. Employee Benefit Plans (Continued)
Net periodic benefit cost includes the following components:
| |
Fiscal Year 2016 |
Fiscal Year 2015 |
Fiscal Year 2014 |
|||||||
|---|---|---|---|---|---|---|---|---|---|---|
| |
(Amounts in thousands) |
|||||||||
Service cost |
$ | 337 | $ | 342 | $ | 339 | ||||
Interest cost |
344 | 320 | 370 | |||||||
Expected return on plan assets |
(494 | ) | (581 | ) | (550 | ) | ||||
Amortization of unrecognized losses |
386 | 446 | 149 | |||||||
Amortization of prior service credit |
(15 | ) | (15 | ) | (15 | ) | ||||
| | | | | | | | | | | |
Net periodic benefit cost |
$ | 558 | $ | 512 | $ | 293 | ||||
| | | | | | | | | | | |
| | | | | | | | | | | |
| | | | | | | | | | | |
The following schedule shows the expected benefit payments over the next 10 years:
Fiscal Year
|
(Amounts in thousands) |
|||
|---|---|---|---|---|
2017 |
$ | 743 | ||
2018 |
704 | |||
2019 |
674 | |||
2020 |
658 | |||
2021 |
629 | |||
2022-2026 |
2,685 | |||
| | | | | |
Total |
$ | 6,093 | ||
| | | | | |
| | | | | |
| | | | | |
8. Share-Based Compensation
Amended and Restated 2006 Long-Term Incentive Plan. The Company's board of directors and stockholders approved the 2006 Long-Term Incentive Plan (the "2006 Plan") on May 3, 2006, and June 21, 2006, respectively. From time to time, the Company's stockholders approve amendments to the 2006 Plan to increase the number of shares reserved for issuance, among other matters. The aggregate number of shares of the Company's common stock that may be issued under the New York & Company, Inc. Amended and Restated 2006 Long-Term Incentive Plan (the "Amended and Restated 2006 Plan") is 12,668,496 shares, and the maximum number of shares which may be used for awards other than stock options or stock appreciation rights ("SARs") is 7,750,000 shares. These shares may be in whole or in part authorized and unissued or held by the Company as treasury shares.
Amended and Restated 2002 Stock Option Plan. The Company originally adopted the 2002 Stock Option Plan on November 27, 2002 and approved the Amended and Restated 2002 Stock Option Plan (the "2002 Plan") to become effective on October 13, 2004. As of November 27, 2012, the 2002 Plan expired and no new awards may be issued from the 2002 Plan.
Under the Amended and Restated 2006 Plan, the Company is able to grant share-based awards to its executives, consultants, directors, or other key employees. Options and SARs generally have a maximum term of up to 10 years. Upon grant of share-based awards, the compensation committee of the Company's board of directors will determine the exercise price, if applicable, and the term and
73
New York & Company, Inc. and Subsidiaries
Notes to Consolidated Financial Statements (Continued)
January 28, 2017
8. Share-Based Compensation (Continued)
conditions of any award pursuant to the Amended and Restated 2006 Plan. The exercise price of an incentive stock option and a SAR; however, may not be less than 100% of the fair market value of a share of common stock on the date of grant. The exercise price of an incentive stock option awarded to a person who owns stock constituting more than 10% of the total combined voting power of all classes of stock of the Company may not be less than 110% of the fair market value on such date and the option must be exercised within five years of the date of grant. The aggregate fair market value of common stock for which an incentive stock option is exercisable for the first time during any calendar year, under all equity incentive plans of the Company, may not exceed $0.1 million. Upon the exercise of a SAR, a participant will receive a number of shares of the Company's common stock equal in value to the excess of the fair market value of a share of common stock over the exercise price per share, multiplied by the number of shares in respect of which the SAR is exercised. Vesting provisions for all share-based awards are determined by the compensation committee of the Company's board of directors at the date of grant; however, subject to certain restrictions, all outstanding share-based awards may vest upon a sale of the Company. Shares that are not currently outstanding and are available for issuance at January 28, 2017 amounted to 1,548,870.
A summary of the Company's stock options and SARs outstanding as of January 28, 2017 and activity for fiscal year 2016 is presented below:
| |
Number of Shares |
Weighted Average Exercise Price |
Weighted Average Remaining Contractual Term (years) |
Aggregate Intrinsic Value |
|||||||||
|---|---|---|---|---|---|---|---|---|---|---|---|---|---|
| |
(Amounts in thousands) |
|
|
(Amounts in thousands) |
|||||||||
Outstanding, beginning of period |
6,974 | $ | 3.74 | ||||||||||
Granted |
1,714 | 2.23 | |||||||||||
Exercised |
(126 | ) | 3.37 | ||||||||||
Forfeited |
(674 | ) | 2.68 | ||||||||||
Expired |
(460 | ) | 4.87 | ||||||||||
| | | | | | | | | | | | | | |
Outstanding, end of period(1) |
7,428 | $ | 3.42 | 7.0 | $ | 36 | |||||||
| | | | | | | | | | | | | | |
| | | | | | | | | | | | | | |
| | | | | | | | | | | | | | |
Exercisable, end of period |
4,016 | $ | 4.09 | 5.5 | $ | 17 | |||||||
| | | | | | | | | | | | | | |
| | | | | | | | | | | | | | |
| | | | | | | | | | | | | | |
- (1)
- There were 307,018 stock options and 7,121,030 SARs outstanding as of January 28, 2017, of which 304,518 stock options and 3,711,136 SARs were vested. The non-vested options and SARs outstanding at January 28, 2017 vest subject to the passage of time through fiscal year 2020.
Aggregate intrinsic value for both outstanding and exercisable options and SARs, in the table above, represents the total pre-tax intrinsic value (the difference between the Company's closing stock price on the last trading day of fiscal year 2016 and the exercise price, multiplied by the number of in-the-money options and SARs) that would have been received by the option and SAR holders had all option and SAR holders exercised their options and SARs on January 28, 2017. This amount changes based on the fair market value of the Company's common stock. Total intrinsic value of options exercised for fiscal year 2016, fiscal year 2015, and fiscal year 2014 (based on the difference between
74
New York & Company, Inc. and Subsidiaries
Notes to Consolidated Financial Statements (Continued)
January 28, 2017
8. Share-Based Compensation (Continued)
the Company's stock price on the respective exercise date and the respective exercise price, multiplied by the number of respective options and SARs exercised) was approximately $0.1 million, $2,000, and $0.2 million, respectively.
In accordance with ASC 718, the fair value of each option and SAR granted is estimated on the date granted using the Black-Scholes option-pricing model for all employees and non-employee board members. The weighted average fair value for options and SARs granted during fiscal year 2016, fiscal year 2015, and fiscal year 2014 was $0.98, $1.03, and $1.61, respectively. The total fair value of share-based awards that vested during fiscal year 2016, fiscal year 2015, and fiscal year 2014 was $4.3 million, $4.7 million, and $4.2 million, respectively.
The following weighted average assumptions were used to value stock options and SARs:
| |
Fiscal Year 2016 |
Fiscal Year 2015 |
Fiscal Year 2014 |
|||||||
|---|---|---|---|---|---|---|---|---|---|---|
Expected volatility |
54.6 | % | 50.1 | % | 56.8 | % | ||||
Expected life |
4.3 years | 4.1 years | 4.4 years | |||||||
Risk-free interest rate |
1.19 | % | 1.49 | % | 1.64 | % | ||||
Expected dividend yield |
— | % | — | % | — | % | ||||
The risk-free interest rate used to value stock options and SARs is based on the U.S. Treasury yield curve in effect at the time of grant with maturity dates that coincide with the expected life of the options and SARs. The expected life represents the weighted average period the stock options and SARs are expected to remain outstanding and is based primarily on industry averages due to the Company's limited historical data for employee exercises. The Company's assumption for volatility is based on its historical volatility calculated on the grant date of an award for a period of time that coincides with the expected life of the options.
The following table summarizes the restricted stock and unit awards outstanding at January 28, 2017 and activity for fiscal year 2016:
| |
Shares | Weighted Average Grant Date Fair Value |
|||||
|---|---|---|---|---|---|---|---|
| |
(Amounts in thousands) |
|
|||||
Nonvested at January 30, 2016 |
1,292 | $ | 3.44 | ||||
Granted |
664 | $ | 2.11 | ||||
Vested |
(536 | ) | $ | 3.96 | |||
Forfeited |
(225 | ) | $ | 2.48 | |||
| | | | | | | | |
Nonvested at January 28, 2017 |
1,195 | $ | 2.65 | ||||
| | | | | | | | |
| | | | | | | | |
| | | | | | | | |
Not included in the table above are 300,000 shares of performance-based restricted stock granted in fiscal year 2016 to Mr. Scott, the Company's Chief Executive Officer, in connection with his annual performance review. The performance-based shares had a weighted average grant-date fair value of $3.72 and were scheduled to vest subject to the Company achieving minimum, target, and maximum operating income levels for fiscal year 2016, and Mr. Scott's continued employment through March
75
New York & Company, Inc. and Subsidiaries
Notes to Consolidated Financial Statements (Continued)
January 28, 2017
8. Share-Based Compensation (Continued)
2019. The Company did not meet the minimum operating income target, and as such the 300,000 shares were cancelled as of January 28, 2017.
The fair value of restricted stock and units is based on the closing stock price of an unrestricted share of the Company's common stock on the grant date. Each vested stock unit is convertible into one share of the Company's common stock. The non-vested shares outstanding at January 28, 2017 vest subject to the passage of time through fiscal year 2019.
Total share-based compensation expense attributable to all share-based awards was $3.4 million, $3.9 million, and $4.1 million in fiscal year 2016, fiscal year 2015, and fiscal year 2014, respectively. The Company recognizes share-based compensation expense in the consolidated statements of operations over the requisite service period for each share-based payment award. The Company recognized a tax benefit in the consolidated statements of operations related to share-based compensation expense of $1.3 million, $1.5 million, and $1.6 million in fiscal year 2016, fiscal year 2015, and fiscal year 2014, respectively. The tax benefit recognized in fiscal year 2016, fiscal year 2015, and fiscal year 2014 consolidated statements of operations was offset by corresponding adjustments to the valuation allowance against deferred tax assets. In addition, as a result of the deferred tax valuation allowance, the Company did not recognize an excess benefit related to the exercise of options and SARs during fiscal year 2016, fiscal year 2015, and fiscal year 2014. For further information related to the deferred tax valuation allowance, please refer to Note 11, "Income Taxes." Unamortized share-based compensation expense at January 28, 2017 was $4.8 million and will be recognized in the consolidated statements of operations over a weighted average period of 1.6 years.
9. Accrued Expenses
Accrued expenses consist of the following:
| |
January 28, 2017 |
January 30, 2016 |
|||||
|---|---|---|---|---|---|---|---|
| |
(Amounts in thousands) |
||||||
Gift cards and merchandise credits |
$ | 15,390 | $ | 13,567 | |||
Sourcing and distribution |
14,106 | 5,937 | |||||
Legal settlement and fees |
6,342 | 2,774 | |||||
Compensation and benefits |
5,347 | 5,677 | |||||
Other taxes |
4,620 | 5,090 | |||||
ADS deferred revenue |
4,000 | — | |||||
Other accrued expenses |
19,489 | 19,379 | |||||
| | | | | | | | |
Total accrued expenses |
$ | 69,294 | $ | 52,424 | |||
| | | | | | | | |
| | | | | | | | |
| | | | | | | | |
10. Long-Term Debt and Credit Facilities
On October 24, 2014, Lerner New York, Inc., Lernco, Inc. and Lerner New York Outlet, LLC (f.k.a. Lerner New York Outlet, Inc.), wholly-owned indirect subsidiaries of New York & Company, Inc., entered into a Fourth Amended and Restated Loan and Security Agreement (the "Loan Agreement") with Wells Fargo Bank, National Association, as Agent and Term Loan Agent and the lender party thereto. The obligations under the Loan Agreement are guaranteed by New York & Company, Inc. and its other subsidiaries.
76
New York & Company, Inc. and Subsidiaries
Notes to Consolidated Financial Statements (Continued)
January 28, 2017
10. Long-Term Debt and Credit Facilities (Continued)
The Loan Agreement consists of: (i) a revolving credit facility that provides the Company with up to $100 million of credit, consisting of a $75 million revolving credit facility (which includes a sub-facility for issuance of letters of credit up to $45 million) with a fully committed accordion option that allows the Company to increase the revolving credit facility up to $100 million or decrease it to a minimum of $60 million, subject to certain restrictions, and (ii) a $15 million, 5-year term loan, bearing interest at the Adjusted Eurodollar Rate plus 4.50% (the "Term Loan"). The Company used a portion of the proceeds from the Term Loan to pay for costs associated with the relocation and build-out of its new corporate headquarters at 330 West 34th Street, New York, New York and for general corporate purposes. In accordance with the Loan Agreement, the Term Loan balance, gross of unamortized deferred financing fees, will be repaid as follows:
| |
Total | Fiscal Year 2017 |
Fiscal Year 2018 |
Fiscal Year 2019 |
Fiscal Year 2020 |
|||||||||||
|---|---|---|---|---|---|---|---|---|---|---|---|---|---|---|---|---|
| |
(Amounts in thousands) |
|||||||||||||||
Term Loan |
$ | 12,750 | $ | 1,000 | $ | 1,000 | $ | 1,000 | $ | 9,750 | ||||||
| | | | | | | | | | | | | | | | | |
| | | | | | | | | | | | | | | | | |
| | | | | | | | | | | | | | | | | |
Under the terms of the Loan Agreement, the interest rates applicable to Revolving Loans are, at the Company's option, either at a floating rate equal to the Adjusted Eurodollar Rate plus a margin of between 1.50% and 1.75% per year for Eurodollar Rate Loans or a floating rate equal to the Prime Rate plus a margin of between 0.50% and 0.75% per year for Prime Rate Loans, depending upon the Company's Average Compliance Excess Availability. The Company pays to the lender under the revolving credit facility a monthly fee on outstanding commercial letters of credit at a rate of between 0.75% and 0.875% per year and on standby letters of credit at a rate of between 1.50% and 1.75% per year, depending upon the Company's Average Compliance Excess Availability, plus a monthly fee on a proportion of the unused commitments under the revolving credit facility at a rate of 0.25% per year.
The maximum borrowing availability under the Company's revolving credit facility is determined by a monthly borrowing base calculation based on applying specified advance rates against inventory and certain other eligible assets. As of January 28, 2017, the Company had availability under its revolving credit facility of $36.7 million, net of letters of credit outstanding of $14.5 million, as compared to availability of $36.6 million, net of letters of credit outstanding of $15.6 million, as of January 30, 2016. Included in the $14.5 million of letters of credit outstanding at January 28, 2017 are $0.3 million of trade letters of credit and $14.2 million of standby letters of credit primarily related to the Company's new corporate headquarters and certain insurance contracts. Standby letters of credit related to the Company's corporate headquarters are scheduled to be reduced by $2.0 million annually beginning in October 2017, for a total reduction of $6.0 million by October 2019.
Under the terms of the Loan Agreement, the Company is subject to a Minimum Excess Availability covenant of $7.5 million. The Loan Agreement contains other covenants and conditions, including restrictions on the Company's ability to pay dividends on its common stock, prepay the Term Loan, incur additional indebtedness and to prepay, redeem, defease or purchase other indebtedness. Subject to such restrictions, the Company may incur more indebtedness for working capital, capital expenditures, stock repurchases, acquisitions and for other purposes.
The lender has been granted a pledge of the common stock of Lerner New York Holding, Inc. and certain of its subsidiaries, and a first priority security interest in substantially all other tangible and
77
New York & Company, Inc. and Subsidiaries
Notes to Consolidated Financial Statements (Continued)
January 28, 2017
10. Long-Term Debt and Credit Facilities (Continued)
intangible assets of New York & Company, Inc. and its subsidiaries, as collateral for the Company's obligations under the Loan Agreement. In addition, New York & Company, Inc. and certain of its subsidiaries have fully and unconditionally guaranteed the obligations under the Loan Agreement, and such guarantees are joint and several.
11. Income Taxes
Income tax expense consists of:
| |
Fiscal Year 2016 |
Fiscal Year 2015 |
Fiscal Year 2014 |
|||||||
|---|---|---|---|---|---|---|---|---|---|---|
| |
(Amounts in thousands) |
|||||||||
Federal: |
||||||||||
Current |
$ | — | $ | — | $ | — | ||||
Deferred |
— | — | — | |||||||
State and Local: |
||||||||||
Current |
673 | 737 | 716 | |||||||
Deferred |
— | — | — | |||||||
| | | | | | | | | | | |
|
$ | 673 | $ | 737 | $ | 716 | ||||
| | | | | | | | | | | |
| | | | | | | | | | | |
| | | | | | | | | | | |
The components of items giving rise to the net deferred income tax assets (liabilities) recognized in the Company's consolidated balance sheets are as follows:
| |
January 28, 2017 |
January 30, 2016 |
|||||
|---|---|---|---|---|---|---|---|
| |
Non-current | Non-current | |||||
| |
(Amounts in thousands) |
||||||
Deferred income tax assets: |
|||||||
Accrued expenses |
$ | 17,289 | $ | 16,229 | |||
Inventory |
1,127 | 1,177 | |||||
Fixed assets and intangible assets |
7,131 | 7,765 | |||||
Net operating loss |
43,125 | 37,477 | |||||
Other assets |
11,267 | 11,344 | |||||
| | | | | | | | |
Subtotal |
79,939 | 73,992 | |||||
Valuation allowance |
(73,075 | ) | (66,675 | ) | |||
| | | | | | | | |
Total deferred income tax assets |
$ | 6,864 | $ | 7,317 | |||
| | | | | | | | |
Deferred income tax liabilities: |
|||||||
Prepaid costs |
$ | (6,864 | ) | $ | (7,317 | ) | |
| | | | | | | | |
Total deferred income tax liabilities |
$ | (6,864 | ) | $ | (7,317 | ) | |
| | | | | | | | |
Net deferred tax assets (liabilities) |
$ | — | $ | — | |||
| | | | | | | | |
| | | | | | | | |
| | | | | | | | |
The Company continues to maintain a valuation allowance against its deferred tax assets until the Company believes it is more likely than not that these assets will be realized in the future. If sufficient
78
New York & Company, Inc. and Subsidiaries
Notes to Consolidated Financial Statements (Continued)
January 28, 2017
11. Income Taxes (Continued)
positive evidence arises in the future indicating that all or a portion of the deferred tax assets meet the more-likely-than-not standard under ASC 740, the valuation allowance would be reversed accordingly in the period that such determination is made.
As of January 28, 2017, the Company had $602.5 million of various state net operating loss carryforwards and $100.5 million of federal net operating loss carryforwards.
The state net operating loss carryforwards are reported on a pre-apportioned basis that applies to various states with varying tax laws and expiration dates. Below is a summary of the Company's loss carryforwards and when they expire:
Tax Year Ended
|
State NOL Carryover (Amounts in thousands) |
The Earliest Expiration Starts at the Beginning of Fiscal Year |
Years Remaining |
|||||
|---|---|---|---|---|---|---|---|---|
2/3/2007 |
$ | 4,914 | FY2012 | 10 | ||||
2/2/2008 |
50,698 | FY2013 | 11 | |||||
1/31/2009 |
48,738 | FY2014 | 12 | |||||
1/30/2010 |
67,229 | FY2015 | 13 | |||||
1/29/2011 |
78,728 | FY2016 | 14 | |||||
1/28/2012 |
66,164 | FY2017 | 15 | |||||
2/2/2013 |
30,185 | FY2018 | 1 to 16 | |||||
2/1/2014 |
44,850 | FY2019 | 2 to 17 | |||||
1/31/2015 |
76,337 | FY2020 | 3 to 18 | |||||
1/30/2016 |
64,619 | FY2021 | 4 to 19 | |||||
1/28/2017 |
70,037 | FY2022 | 5 to 20 | |||||
| | | | | | | | | |
|
$ | 602,499 | ||||||
| | | | | | | | | |
| | | | | | | | | |
| | | | | | | | | |
Tax Year Ended
|
Federal NOL Carryover (Amounts in thousands) |
The Earliest Expiration Starts at the Beginning of Fiscal Year |
Years Remaining |
|||||||
|---|---|---|---|---|---|---|---|---|---|---|
1/29/2011 |
$ | 29,499 | FY2031 | 14 | ||||||
1/28/2012 |
23,897 | FY2032 | 15 | |||||||
1/31/2015 |
21,549 | FY2035 | 18 | |||||||
1/30/2016 |
10,018 | FY2036 | 19 | |||||||
1/28/2017 |
15,501 | FY2037 | 20 | |||||||
| | | | | | | | | | | |
|
$ | 100,464 | ||||||||
| | | | | | | | | | | |
| | | | | | | | | | | |
| | | | | | | | | | | |
79
New York & Company, Inc. and Subsidiaries
Notes to Consolidated Financial Statements (Continued)
January 28, 2017
11. Income Taxes (Continued)
A reconciliation of the statutory federal income tax expense is as follows:
| |
Fiscal Year 2016 |
Fiscal Year 2015 |
Fiscal Year 2014 |
|||||||
|---|---|---|---|---|---|---|---|---|---|---|
| |
(Amounts in thousands) |
|||||||||
Statutory 35% federal tax |
$ | (5,816 | ) | $ | (3,265 | ) | $ | (5,660 | ) | |
State and local income taxes, net of federal income tax benefit |
(1,002 | ) | 326 | (638 | ) | |||||
Federal tax credit |
(380 | ) | (320 | ) | (358 | ) | ||||
Basis adjustment |
151 | 193 | 733 | |||||||
Permanent difference |
218 | 195 | 216 | |||||||
Valuation allowance |
6,619 | 3,018 | 6,630 | |||||||
Other, net |
883 | 590 | (207 | ) | ||||||
| | | | | | | | | | | |
Income tax expense |
$ | 673 | $ | 737 | $ | 716 | ||||
| | | | | | | | | | | |
| | | | | | | | | | | |
| | | | | | | | | | | |
The Company files U.S. federal income tax returns and income tax returns in various state and local jurisdictions. The Company is no longer subject to U.S. federal income tax examinations for tax years through 2012. With limited exception, the Company is no longer subject to state and local income tax examinations for tax years through 2012.
A reconciliation of the beginning and ending amounts of unrecognized tax benefits in accordance with ASC 740 is as follows:
| |
Fiscal Year 2016 |
Fiscal Year 2015 |
Fiscal Year 2014 |
|||||||
|---|---|---|---|---|---|---|---|---|---|---|
| |
(Amounts in thousands) |
|||||||||
Unrecognized tax benefits at beginning of period |
$ | 4,696 | $ | 3,872 | $ | 3,883 | ||||
Additions based on tax positions related to the current year |
25 | 214 | 108 | |||||||
Additions for tax positions of prior years |
263 | 611 | 61 | |||||||
Reductions for tax positions of prior years |
(3,159 | ) | (1 | ) | (50 | ) | ||||
Settlements |
— | — | (66 | ) | ||||||
Reductions for lapse of statute of limitations |
(1 | ) | — | (64 | ) | |||||
| | | | | | | | | | | |
Unrecognized tax benefits at end of period |
$ | 1,824 | $ | 4,696 | $ | 3,872 | ||||
| | | | | | | | | | | |
| | | | | | | | | | | |
| | | | | | | | | | | |
The Company recognizes accrued interest and penalties related to unrecognized tax benefits in income tax expense. During fiscal year 2016, fiscal year 2015 and fiscal year 2014 the Company recorded interest and penalties in the consolidated statements of operations of $0.2 million, $0.3 million and $0.1 million, respectively. At January 28, 2017 and January 30, 2016, the Company had accrued $0.7 million and $0.6 million respectively, for the potential payment of interest and penalties. The Company does not anticipate any significant increases or decreases to the balance of unrecognized tax benefits during the next twelve months. Of the total $1.8 million of unrecognized tax benefits at January 28, 2017, approximately $1.3 million, if recognized, would affect the Company's effective tax rate.
80
New York & Company, Inc. and Subsidiaries
Notes to Consolidated Financial Statements (Continued)
January 28, 2017
12. Redeemable Preferred Stock
The Company is authorized to issue 5,000,000 shares of preferred stock, $0.001 par value. At January 28, 2017 and January 30, 2016, there were no shares of preferred stock outstanding.
13. Share Repurchases
Effective July 14, 2016, the Company's board of directors authorized the repurchase of up to $5 million of the Company's common stock over the subsequent 12 months. Repurchases will be made from time to time in the manner the Company believes appropriate, through open market or private transactions including through pre-established trading plans.
Purchases will be made in compliance with SEC rules and regulations, subject to market conditions, applicable legal requirements, and other relevant factors. The Company is not obligated to acquire any particular amount of common stock.
During fiscal year 2016, the Company repurchased 476,645 shares of its common stock for a total cost of approximately $1.1 million, including commission.
14. Quarterly Results (Unaudited)
The following tables set forth the Company's quarterly consolidated statements of operations data for the last eight fiscal quarters and such information expressed as a percentage of net sales. This unaudited quarterly information has been prepared on the same basis as the annual audited financial statements and includes all necessary adjustments, consisting only of normal recurring adjustments that the Company considers necessary to present fairly the financial information for the quarters presented.
| |
Fiscal Year 2016 Quarter ended |
Fiscal Year 2015 Quarter ended |
|||||||||||||||||||||||
|---|---|---|---|---|---|---|---|---|---|---|---|---|---|---|---|---|---|---|---|---|---|---|---|---|---|
Statements of Operations data
|
April 30, 2016 |
July 30, 2016 |
October 29, 2016 |
January 28, 2017 |
May 2, 2015 |
August 1, 2015 |
October 31, 2015 |
January 30, 2016 |
|||||||||||||||||
| |
(Amounts in thousands, except per share data) |
||||||||||||||||||||||||
Net sales |
$ | 216,038 | $ | 232,819 | $ | 213,901 | $ | 266,323 | $ | 223,390 | $ | 235,696 | $ | 219,750 | $ | 271,272 | |||||||||
Gross profit |
$ | 59,887 | $ | 67,050 | $ | 63,984 | $ | 73,058 | $ | 64,247 | $ | 67,133 | $ | 63,695 | $ | 69,780 | |||||||||
Operating (loss) income |
$ | (5,398 | ) | $ | 1,340 | $ | (2,103 | ) | $ | (9,222 | ) | $ | (4,245 | ) | $ | 435 | $ | (4,917 | ) | $ | 622 | ||||
Net (loss) income |
$ | (5,716 | ) | $ | 945 | $ | (2,532 | ) | $ | (9,988 | ) | $ | (4,671 | ) | $ | (146 | ) | $ | (5,336 | ) | $ | 84 | |||
Basic (loss) earnings per share of common stock |
$ | (0.09 | ) | $ | 0.01 | $ | (0.04 | ) | $ | (0.16 | ) | $ | (0.07 | ) | $ | (0.00 | ) | $ | (0.08 | ) | $ | 0.00 | |||
| | | | | | | | | | | | | | | | | | | | | | | | | | |
| | | | | | | | | | | | | | | | | | | | | | | | | | |
| | | | | | | | | | | | | | | | | | | | | | | | | | |
Diluted (loss) earnings per share of common stock |
$ | (0.09 | ) | $ | 0.01 | $ | (0.04 | ) | $ | (0.16 | ) | $ | (0.07 | ) | $ | (0.00 | ) | $ | (0.08 | ) | $ | 0.00 | |||
| | | | | | | | | | | | | | | | | | | | | | | | | | |
| | | | | | | | | | | | | | | | | | | | | | | | | | |
| | | | | | | | | | | | | | | | | | | | | | | | | | |
Weighted average shares outstanding: |
|||||||||||||||||||||||||
Basic shares of common stock. |
63,277 | 63,461 | 63,459 | 63,226 | 62,983 | 63,174 | 63,224 | 63,233 | |||||||||||||||||
| | | | | | | | | | | | | | | | | | | | | | | | | | |
| | | | | | | | | | | | | | | | | | | | | | | | | | |
| | | | | | | | | | | | | | | | | | | | | | | | | | |
Diluted shares of common stock |
63,277 | 63,936 | 63,459 | 63,226 | 62,983 | 63,174 | 63,224 | 63,607 | |||||||||||||||||
| | | | | | | | | | | | | | | | | | | | | | | | | | |
| | | | | | | | | | | | | | | | | | | | | | | | | | |
| | | | | | | | | | | | | | | | | | | | | | | | | | |
| |
Fiscal Year 2016 Quarter ended |
Fiscal Year 2015 Quarter ended |
|||||||||||||||||||||||
|---|---|---|---|---|---|---|---|---|---|---|---|---|---|---|---|---|---|---|---|---|---|---|---|---|---|
(as a % of net sales)
|
April 30, 2016 |
July 30, 2016 |
October 29, 2016 |
January 28, 2017 |
May 2, 2015 |
August 1, 2015 |
October 31, 2015 |
January 30, 2016 |
|||||||||||||||||
Net sales |
100.0 | % | 100.0 | % | 100.0 | % | 100.0 | % | 100.0 | % | 100.0 | % | 100.0 | % | 100.0 | % | |||||||||
Gross profit |
27.7 | % | 28.8 | % | 29.9 | % | 27.4 | % | 28.8 | % | 28.5 | % | 29.0 | % | 25.7 | % | |||||||||
Operating (loss) income |
(2.5 | )% | 0.6 | % | (1.0 | )% | (3.5 | )% | (1.9 | )% | 0.2 | % | (2.2 | )% | 0.2 | % | |||||||||
Net (loss) income |
(2.6 | )% | 0.4 | % | (1.2 | )% | (3.8 | )% | (2.1 | )% | (0.1 | )% | (2.4 | )% | — | % | |||||||||
81
New York & Company, Inc. and Subsidiaries
Notes to Consolidated Financial Statements (Continued)
January 28, 2017
14. Quarterly Results (Unaudited) (Continued)
Business Re-engineering Program and Adjustments Affecting Comparability of Quarterly Financial Information
As previously disclosed, during the third quarter of fiscal year 2014, the Company engaged a leading global business advisory firm to assist the Company in analyzing its business processes and organizational structure in an effort to improve sales productivity and operating efficiencies, as well as to reduce the Company's overall cost structure. The Company refers to this business re-engineering program as "Project Excellence." The first phase of Project Excellence consisted of an organizational realignment initiated at the end of fiscal year 2014 and completed in fiscal year 2015. The Company completed the second phase of Project Excellence during the second quarter of fiscal year 2015, which consisted of: (i) a comprehensive review of the Company's Go-To-Market strategy aimed at improving operating efficiencies and reducing costs associated with the related processes, (ii) the reduction of indirect procurement costs, and (iii) additional workforce reductions in connection with the organizational realignment. The Company expects to recognize combined annual expense reductions of approximately $30 million upon the execution of the business improvement plans identified through both phases of Project Excellence; however, a portion of these savings are expected to be reinvested into the Company's strategic initiatives and longer-term growth strategies as discussed in "Item 1. Business" of this Annual Report on Form 10-K. Approximately $15 million of the $30 million of annual savings from Project Excellence is a reduction of selling, general and administrative expenses that began in fiscal year 2015, mitigating inflationary increases in certain fixed costs and an increase in variable expenses to support the growth in eCommerce and Outlet stores. The remaining $15 million of annual savings from Project Excellence is reflected as a reduction in product costs of approximately $10 million and a reduction in buying expenses resulting in improved gross margins that began in fiscal year 2016.
The Company recorded the following charges in 'Selling, general and administrative expenses" on the consolidated statements of operations during fiscal year 2016 that affect comparability:
- •
- Third quarter ended October 29, 2016 includes a $0.5 million legal accrual reversal.
- •
- Fourth quarter ended January 28, 2017 includes a $6.2 million expense accrual relating to an ongoing trademark infringement case in which the Company received an unfavorable judgment and is in the process of challenging.
The Company recorded the following charges in "Selling, general and administrative expenses" on the consolidated statements of operations during fiscal year 2015 that affect comparability:
- •
- First quarter ended May 2, 2015 includes $2.9 million of charges consisting of $2.5 million of consulting fees incurred in
connection with Project Excellence and $0.7 million of certain severance expenses, partially offset by a $0.3 million reduction of expenses related to the relocation of the Company's
corporate headquarters.
- •
- Second quarter ended August 1, 2015 includes $2.0 million of charges consisting of $0.9 million of certain severance
expenses, $0.6 million of consulting fees incurred in connection with Project Excellence, $0.4 million of certain legal expenses and $0.2 million of corporate moving expenses.
- •
- Third quarter ended October 31, 2015 includes $2.3 million of charges consisting primarily of $2.2 million of charges
related to a settlement of a wage and hour class action lawsuit in the state of California and $0.1 million of consulting fees incurred in connection with Project Excellence.
- •
- Fourth quarter ended January 30, 2016 includes $0.6 million of charges consisting primarily of certain severance expenses.
82
| Exhibit No. |
Description | ||
|---|---|---|---|
| 3.1 | Restated Certificate of Incorporation.† | ||
3.2 |
Amended and Restated Bylaws.†† |
||
9.1 |
Stockholders Agreement by and among New York & Company, Inc. and the stockholders party thereto, dated August 25, 2004.** |
||
9.2 |
Amendment No. 4 to Stockholders Agreement by and among New York & Company, Inc. and the stockholders party thereto, dated May 22, 2006.††† |
||
9.3 |
Amendment No. 5 to Stockholders Agreement by and among New York & Company, Inc. and the stockholders party thereto, dated August 16, 2006.+ |
||
9.4 |
Amendment No. 6 to Stockholders Agreement by and among New York & Company, Inc. and the stockholders party thereto, dated May 10, 2011.(c) |
||
9.5 |
Amendment No. 7 to Stockholders Agreement by and among New York & Company, Inc. and the stockholders party thereto, dated March 13, 2012.(d) |
||
10.1 |
Employment Letter, dated as of April 28, 2010, between New York & Company, Inc. and Gregory Scott. TTT |
||
10.2 |
Employment Letter, dated as of November 3, 2008, between New York & Company, Inc. and Sheamus Toal.†††† |
||
10.3 |
Employment Letter, dated as of November 9, 2011, between New York & Company, Inc. and Faeth Bradley.(d) |
||
10.4 |
Offer Letter and Employment Letter, dated as of October 24, 2014, between New York & Company, Inc. and John Worthington.(e) |
||
10.5 |
Transition Services Agreement by and between Lerner New York Holding, Inc. and Limited Brands, Inc., dated as of November 27, 2002.* |
||
10.6 |
Amendment No. 1 to Transition Services Agreement, dated as of November 27, 2002, between Lerner New York Holding, Inc., New York & Company, Inc. as successor-in-interest to NY & Co. Group, Inc. and Limited Brands, Inc., as amended on April 19, 2006. T |
||
10.7 |
Amendment No. 2 to Transition Services Agreement, dated as of November 27, 2002, between Lerner New York Holding, Inc., New York & Company, Inc. as successor-in-interest to NY & Co. Group, Inc. and Limited Brands, Inc., as amended on October 11, 2007.†††† |
||
10.8 |
Amendment No. 3 to Transition Services Agreement, dated as of November 27, 2002, between Lerner New York Holding, Inc., New York & Company, Inc. as successor-in-interest to NY & Co. Group, Inc. and Limited Brands, Inc., as amended on July 17, 2008.†††† |
||
10.9 |
Amendment No. 4 to Transition Services Agreement, dated as of November 27, 2002, between Lerner New York Holding, Inc., New York & Company, Inc. as successor-in-interest to NY & Co. Group, Inc. and Limited Brands, Inc., as amended on April 6, 2009.†††† |
||
83
| Exhibit No. |
Description | ||
|---|---|---|---|
| 10.10 | Amendment No. 5 to Transition Services Agreement, dated as of November 27, 2002, between Lerner New York Holding, Inc., New York & Company, Inc. as successor-in-interest to NY & Co. Group, Inc. and Limited Brands, Inc., as amended on March 16, 2010.††††† | ||
10.11 |
Amendment No. 6 to Transition Services Agreement, dated as of November 27, 2002, between Lerner New York Holding, Inc., New York & Company, Inc. as successor-in-interest to NY & Co. Group, Inc. and Limited Brands, Inc., as amended on September 14, 2010.(a) |
||
10.12 |
Amendment No. 7 to Transition Services Agreement, dated as of November 27, 2002, between Lerner New York Holding, Inc., New York & Company, Inc. as successor-in-interest to NY & Co. Group, Inc. and Limited Brands, Inc., as amended on December 26, 2016. |
||
10.13 |
Fourth Amended and Restated Loan and Security Agreement made by and among Lerner New York, Inc., Lernco, Inc. and Lerner New York Outlet, Inc., wholly-owned indirect subsidiaries of New York & Company, Inc., and Wells Fargo Bank, N.A., as Agent and Sole Lender, dated as of October 24, 2014.(e) |
||
10.14 |
Post-Closing Letter to the Fourth Amended and Restated Loan and Security Agreement made by and among Lerner New York, Inc., Lernco, Inc. and Lerner New York Outlet, Inc., wholly-owned indirect subsidiaries of New York & Company, Inc., and Wells Fargo Bank, N.A., as Agent and Sole Lender, dated as of October 24, 2014.(e) |
||
10.15 |
Amendment No. 1 to Second Amended and Restated Collateral Assignment of Trademarks made among Lernco, Inc. and Lerner New York Outlet, Inc. in favor of Wells Fargo Bank, N.A., as Agent for itself and Sole Lender named in the Fourth Amended and Restated Loan and Security Agreement, dated as of October 24, 2014.(e) |
||
10.16 |
Amendment No. 1 to Amended and Restated Collateral Assignment of Trademarks made among Lerner New York, Inc. in favor of Wells Fargo Bank, N.A., as Agent for itself and Sole Lender named in the Fourth Amended and Restated Loan and Security Agreement, dated as of October 24, 2014.(e) |
||
10.17 |
Copyright Collateral Assignment and Security Agreement made by and among Lernco Inc. and New York & Company, Inc., and Wells Fargo Bank, N.A., as Agent for itself and Sole Lender named in the Fourth Amended and Restated Loan and Security Agreement, dated October 24, 2014.(e) |
||
10.18 |
Patent Collateral Assignment and Security Agreement made by and among Lerner New York, Inc. and New York & Company, Inc., and Wells Fargo Bank, N.A. as Agent for itself and Sole Lender named in the Fourth Amended and Restated Loan and Security Agreement, dated October 24, 2014.(e) |
||
10.19 |
Third Amended and Restated Guarantee, made by New York & Company, Inc., Lerner New York Holding, Inc., Nevada Receivable Factoring, Inc., New York & Company Stores, Inc. (formerly known as Associated Lerner Shops of America, Inc.), and Lerner New York GC, LLC, in favor of Wells Fargo Bank, N.A., as Agent and Sole Lender named in the Third Amended and Restated Loan and Security Agreement, dated as of August 10, 2011.(b) |
||
84
| Exhibit No. |
Description | ||
|---|---|---|---|
| 10.20 | Collateral Assignment of Transition Services Documents, made by Lerner New York Holding, Inc. and New York & Company, Inc., in favor of Wells Fargo Bank, N.A., as Agent and Sole Lender named in the Third Amended and Restated Loan and Security Agreement, dated as of August 10, 2011.(b) | ||
10.21 |
Second Amended and Restated Stock Pledge Agreement by and between Lerner New York, Inc. and Wachovia Bank, National Association, as Agent for itself and the other Lender named in the Second Amended and Restated Loan and Security Agreement, dated as of August 22, 2007. TT |
||
10.22 |
Second Amended and Restated Stock Pledge Agreement by and between Lerner New York Holding, Inc. and Wachovia Bank, National Association, as Agent for itself and the other Lender named in the Second Amended and Restated Loan and Security Agreement, dated as of August 22, 2007. TT |
||
10.23 |
Second Amended and Restated Stock Pledge Agreement by and between New York & Company, Inc. and Wachovia Bank, National Association, as Agent for itself and the other Lender named in the Second Amended and Restated Loan and Security Agreement, dated as of August 22, 2007. TT |
||
10.24 |
Second Amended and Restated Intercompany Subordination Agreement made among the Obligors, as defined in the Second Amended and Restated Loan and Security Agreement, and Wachovia Bank, National Association, as Agent for itself and the other Lender named in the Second Amended and Restated Loan and Security Agreement, dated as of August 22, 2007. TT |
||
10.25 |
Form of Amended and Restated 2002 Stock Option Plan that became effective immediately prior to the consummation of the Company's initial public offering.** |
||
10.26 |
Form of Amended and Restated 2006 Long-Term Incentive Plan, as amended and restated on June 21, 2014, approved by the Company's Stockholders on June 21, 2014.*** |
||
10.27 |
Second Amended and Restated Private Label Credit Card Program Agreement By and Among Comenity Bank and New York & Company, Inc., Lerner New York, Inc., and Nevada Receivable Factoring, Inc. dated as of July 14, 2016 (confidential treatment has been requested for portions of this agreement).(f) |
||
21.1 |
Subsidiaries of the Registrant.††††† |
||
23.1 |
Consent of BDO USA, LLP, Independent Registered Public Accounting Firm. |
||
23.2 |
Consent of Ernst & Young LLP, Independent Registered Public Accounting Firm. |
||
31.1 |
Certification by the Chief Executive Officer, pursuant to Section 302 of the Sarbanes-Oxley Act of 2002, dated April 11, 2017. |
||
31.2 |
Certification by the Chief Financial Officer, pursuant to Section 302 of the Sarbanes-Oxley Act of 2002, dated April 11, 2017. |
||
32.1 |
Written Statement of the Chief Executive Officer and the Chief Financial Officer pursuant to Section 906 of the Sarbanes-Oxley act of 2002, dated April 11, 2017. |
||
101.INS |
XBRL Instance Document. |
||
101.SCH |
XBRL Taxonomy Extension Schema Document. |
||
101.CAL |
XBRL Taxonomy Extension Calculation Linkbase Document. |
||
85
| Exhibit No. |
Description | ||
|---|---|---|---|
| 101.DEF | XBRL Taxonomy Definition Linkbase Document. | ||
101.LAB |
XBRL Taxonomy Extension Label Linkbase Document. |
||
101.PRE |
XBRL Taxonomy Extension Presentation Linkbase Document. |
||
- †
- Incorporated
by reference from the Company's Annual Report on Form 10-K for the fiscal year ended January 29, 2005, as filed with the SEC on
April 19, 2005.
- ††
- Incorporated
by reference from the Company's Current Report on Form 8-K filed with the SEC on March 18, 2014.
- †††
- Incorporated
by reference from the Company's Annual Report on Form 10-K for the fiscal year ended February 3, 2007,
as filed with the SEC on April 6, 2007.
- ††††
- Incorporated
by reference from the Company's Annual Report on Form 10-K for the fiscal year ended
January 31, 2009, as filed with the SEC on April 7, 2009.
- †††††
- Incorporated
by reference from the Company's Annual Report on Form 10-K for the fiscal year
ended January 30, 2010, as filed with the SEC on April 6, 2010.
- T
- Incorporated by reference from the Company's Quarterly Report on Form 10-Q for the quarter ended April 29, 2006, as filed with
the SEC on June 8, 2006.
- TT
- Incorporated by reference from the Company's Quarterly Report on Form 10-Q for the quarter ended August 4, 2007, as filed with
the SEC on September 7, 2007.
- TTT
- Incorporated by reference from the Company's Quarterly Report on Form 10-Q for the quarter ended May 1, 2010, as filed with
the SEC on June 10, 2010.
- *
- Incorporated
by reference from Amendment No. 1 to the Company's Registration Statement on Form S-1 as filed with the SEC on July 9, 2004.
- **
- Incorporated
by reference from Amendment No. 3 to the Company's Registration Statement on Form S-1 as filed with the SEC on September 14, 2004.
- ***
- Incorporated
by reference from the Company's Registration Statement on Form S-8 as filed with the SEC on February 12, 2015.
- +
- Incorporated
by reference from the Company's Current Report on Form 8-K filed with the SEC on August 17, 2006.
- (a)
- Incorporated
by reference from the Company's Annual Report on Form 10-K for the fiscal year ended January 29, 2011, as filed with the SEC on
April 11, 2011.
- (b)
- Incorporated
by reference from the Company's Quarterly Report on Form 10-Q for the quarter ended July 30, 2011, as filed with the SEC on
September 8, 2011.
- (c)
- Incorporated
by reference from the Company's Quarterly Report on Form 10-Q for the quarter ended October 29, 2011, as filed with the SEC on
December 8, 2011.
- (d)
- Incorporated
by reference from the Company's Annual Report on Form 10-K for the fiscal year ended January 28, 2012, as filed with the SEC on
April 9, 2012.
- (e)
- Incorporated
by reference from the Company's Quarterly Report on Form 10-Q for the quarter ended November 1, 2014, as filed with the SEC on
December 11, 2014.
- (f)
- Incorporated by reference from the Company's Quarterly Report on Form 10-Q for the quarter ended July 30, 2016, as filed with the SEC on August 31, 2016
86