Attached files
| file | filename |
|---|---|
| 8-K - 8-K - Smart Sand, Inc. | a8-kx11x18x18xjefferiescon.htm |

Mine to Wellsite Solutions 2018 Jefferies Energy Conference November 28, 2018

Disclaimer Forward-Looking Statements This presentation contains forward-looking statements within the meaning of the federal securities laws. Statements that are predictive in nature, that depend upon or refer to future events or conditions or that include the words “believe,” “expect,” “anticipate,” “intend,” “estimate” and other expressions that are predictions of or indicate future events and trends and that do not relate to historical matters identify forward-looking statements. Our forward-looking statements include statements about our business strategy, our industry, our future profitability, our expected capital expenditures and the impact of such expenditures on our performance, the costs of being a publicly traded corporation and our capital programs. A forward-looking statement may include a statement of the assumptions or bases underlying the forward-looking statement. We believe that we have chosen these assumptions or bases in good faith and that they are reasonable. Factors that could cause our actual results to differ materially from the results contemplated by such forward-looking statements include, but are not limited to (i) large or multiple customer defaults, including defaults resulting from actual or potential insolvencies, (ii) the level of production of crude oil, natural gas and other hydrocarbons and the resultant market prices of crude oil, natural gas, natural gas liquids and other hydrocarbons, (iii) changes in general economic and geopolitical conditions; (iv) competitive conditions in our industry, (v) changes in the long-term supply of and demand for oil and natural gas, (vi) actions taken by our customers, competitors and third-party operators, (vii) changes in the availability and cost of capital, (viii) our ability to successfully implement our business plan, (ix) our ability to complete growth projects on time and on budget, (x) the price and availability of debt and equity financing (including changes in interest rates), (xi) changes in our tax status, (xii) technological changes, (xiii) operating hazards, natural disasters, weather-related delays, casualty losses and other matters beyond our control, (xiv) the effects of existing and future laws and governmental regulations (or the interpretation thereof), (xv) failure to secure or maintain contracts with our largest customers or non-performance of any of those customers under the applicable contract, (xvi) the effects of future litigation, and such other factors discussed or referenced in the “Risk Factors” and "Management's Discussion and Analysis of Financial Condition and Results of Operations“ sections of the Form 10-K and the Form 10-Qs filed by the Company with U.S Securities and Exchange Commission (the “SEC”) on March 15, 2018, May 10, 2018, August 9, 2018 and November 8, 2018, respectively. You should not place undue reliance on our forward-looking statements. Although forward-looking statements reflect our good faith beliefs at the time they are made, forward-looking statements involve known and unknown risks, uncertainties and other factors, including the factors described in the preceding paragraph, which may cause our actual results, performance or achievements to differ materially from anticipated future results, performance or achievements expressed or implied by such forward-looking statements. You should also carefully consider the statements under the heading “Note About Forward-Looking Statements” in the Annual Report on Form 10-K for the year ended December 31, 2017. Any forward-looking statement speaks only as of the date on which such statement is made, and we undertake no obligation to publicly update or revise any forward-looking statement, whether as a result of new information, future events, changed circumstances or otherwise, unless required by law. In this presentation, assumptions were made with respect to industry performance, general business and economic conditions and other matters. Any estimates contained in these analyses – whether expressed or implied are based on estimates and are not necessarily indicative of actual values or predictive of future results or values, which may be significantly more or less favorable than as set forth herein. The Company reserves the right to change any or all of the estimates included herein whether as a result of any changes in the above referenced information, market factors or otherwise. Industry and Market Data This presentation has been prepared by the Company and includes market data and other statistical information from third-party sources, including independent industry publications, or other published independent sources. Although the Company believes these third-party sources are reliable as of their respective dates, the Company has not independently verified the accuracy or completeness of this information. 1

Disclaimer (cont’d) Reserves Mineral resources and reserves are typically classified by confidence (reliability) levels based on the level of exploration, consistency and assurance of geologic knowledge of the deposit. This classification system considers different levels of geoscientific knowledge and varying degrees of technical and economic evaluation. Mineral reserves are derived from in situ resources through application of modifying factors, such as mining, analytical, economic, marketing, legal, environmental, social and governmental factors, relative to mining methods, processing techniques, economics and markets. In estimating our reserves, our independent reserve engineer does not classify a resource as a reserve unless that resource can be demonstrated to have reasonable certainty to be recovered economically in accordance with the modifying factors listed above. “Reserves” are defined by SEC Industry Guide 7 as that part of a mineral deposit that could be economically and legally extracted or produced at the time of the reserve determination. Industry Guide 7 defines “proven (measured) reserves” as reserves for which (a) quantity is computed from dimensions revealed in outcrops, trenches, workings or drill holes; grade and/or quality are computed from the results of detailed sampling and (b) the sites for inspection, sampling and measurement are spaced so closely and the geologic character is so well defined that size, shape, depth and mineral content of reserves are well-established. Industry Guide 7 defines “probable (indicated) reserves” as reserves for which quantity and grade and/or quality are computed from information similar to that used for proven (measured) reserves, but the sites for inspection, sampling, and measurement are farther apart or are otherwise less adequately spaced. The degree of assurance, although lower than that for proven (measured) reserves, is high enough to assume continuity between points of observation. Non-GAAP Information This presentation also contains information about the Company’s EBITDA, Adjusted EBITDA, and contribution margin, which are not measures derived in accordance with U.S. generally accepted accounting principles (“GAAP”) and which exclude components that are important to understanding the Company’s financial performance. We define EBITDA as our net income, plus (i) depreciation, depletion, accretion and amortization expense; (ii) income tax expense (benefit); (iii) interest expense and (iv) franchise taxes. We define Adjusted EBITDA as EBITDA, plus (i) gain or loss on sale of fixed assets or discontinued operations, (ii) integration and transition costs associated with specified transactions, including our initial public offering, (iii) equity compensation, (iv) acquisition and development costs, (v) non- recurring cash charges related to restructuring, retention and other similar actions, (vi) earn-out and contingent consideration obligations, (vii) non-cash charges and unusual or non-recurring charges. We believe that our presentation of EBITDA and Adjusted EBITDA will provide useful information to investors in assessing our financial condition and results of operations. Net income is the GAAP measure most directly comparable to EBITDA and Adjusted EBITDA. EBITDA and Adjusted EBITDA should not be considered alternatives to net income presented in accordance with GAAP. Because EBITDA and Adjusted EBITDA may be defined differently by other companies in our industry, our definition of EBITDA and Adjusted EBITDA may not be comparable to similarly titled measures of other companies, thereby diminishing its utility. Reconciliations of EBITDA and Adjusted EBITDA to net income, the most directly comparable GAAP financial measure, can be found in the Appendix to this presentation. We also use contribution margin, which we define as total revenues less costs of goods sold excluding depreciation, depletion and amortization, to measure our financial and operating performance. Contribution margin excludes other operating expenses and income, including costs not directly associated with the operations of our business such as accounting, human resources, information technology, legal, sales and other administrative activities. We believe contribution margin is a meaningful measure because it provides an operating and financial measure of our ability to generate margin in excess of our operating cost base. A reconciliation of contribution margin to gross profit, the most directly comparable GAAP financial measure, can be found in the Appendix to this presentation. 2

Key Investment Highlights Long-lived, Strong High-Quality Industry Reserve Base Fundamentals Focus on Logistics Safety and and Last Mile Environmental Advantage Stewardship Mine to Wellsite Solutions Significant Strong Organic Balance Sheet Growth and Financial Potential Experienced Flexibility Management Team

Multi-Faceted Growth Strategy Maximize Significant Organic Growth Potential at Oakdale Annual nameplate capacity increased to 5.5 million tons during 2Q 2018 Strong long term O&G industry fundamentals driving organic growth Development of Future Expansion Opportunities Hixton available for future development Two locations under lease in the Permian that are available for future development Optimizing Logistics Infrastructure Capitalize on dual-serve rail capabilities at Oakdale to potentially reduce transportation costs Van Hook transload terminal in the Bakken commenced operations in April 2018 Acquired Quickthree Solutions, Inc., a manufacturer of portable vertical frac sand storage solutions at the wellsite, in June 2018 Look to invest in opportunities to efficiently manage sand from the mine to wellsite - Additional “in-basin” delivery points Focusing on Cost Profile and Process Improvements Low royalty rates and minimal yield loss due to quality of sand reserves drive lower operating costs Continue to evaluate efficiency initiatives at Oakdale to reduce overall cost structure Maintaining Financial Strength and Flexibility Access to capital markets and ample liquidity provides opportunity to pursue growth initiatives 4

Significant Organic Growth Potential Oakdale Expansion Expanded to 5.5 million tons of annual nameplate capacity during 2Q 2018 Integrated plant design with new enclosed wet and dry plants for year-round processing Transloading Terminal (Van Hook, North Dakota) Commenced operations in April 2018 Signed long-term take-or-pay contract with an anchor customer at in-basin pricing Near-term $15.5 million paid consideration Growth Expected to result in incremental “in-basin” sales volumes Last Mile Solution Acquired Quickthree Solutions, Inc. in June 2018 which will provide us with a portable silo solution for delivery of frac sand to the wellsite Consideration consisted of approximately $30 million in cash and up to $12.75 million in potential earn-outs paid out over a three-year period as units are manufactured Oakdale Proven reserves of ~321 million tons provides significant ability to ramp annual nameplate processing capacity at Oakdale up to ~9 million tons Hixton ~100 million tons of proven reserves Future Growth Fully permitted and readily available for future expansion Well positioned for rebound in Canadian and increased U.S drilling activity Potential Permian Greenfield Mine Opportunities Under Evaluation to Provide Geographic Diversification of Mining Asset Base Minimal upfront cost to acquire acreage Low royalty rates Potential rail access for delivery of Northern White into the Permian Basin and/or shipment of Permian sand out to other locations 5
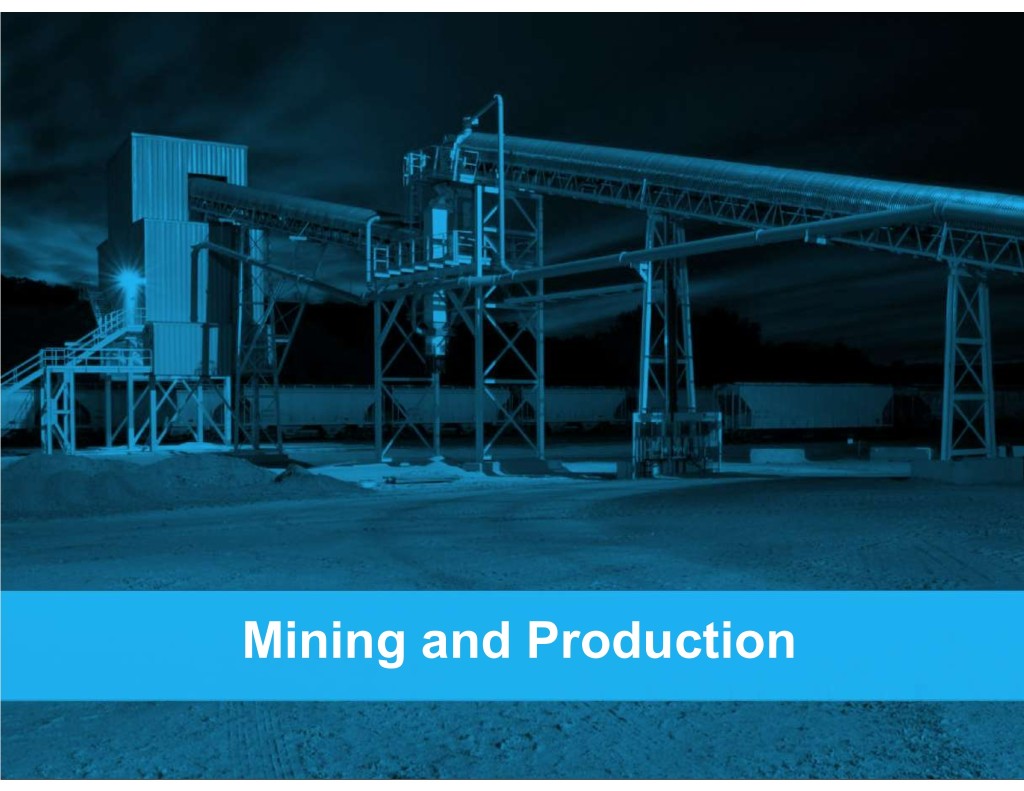
Mining and Production

Northern White Operations Overview Smart Sand – Overview Reserve Locations Smart Sand – fully integrated frac sand services Oakdale, WI – 1,196 acres company and low-cost producer of high-quality (Monroe County, WI) Northern White raw frac sand Hixton, WI – 959 acres 81% Finer Mesh Reserve (Jackson County, WI) (40/70, 100 mesh) The Company owns a Northern White raw frac sand mine, processing facility and a multi-unit train rail logistics loadout on the Canadian Pacific rail network, a Class I rail line, near Oakdale, Wisconsin The Company’s Byron location is a multi-unit train capable facility on a Class I rail line owned by Union Pacific, ~3.5 miles ~45 miles away from the Oakdale facility between locations The Company owns rights to operate a unit train capable Rail line transloading terminal in Van Hook, North Dakota Class I Rail Lines access to Canadian National all major basins Smart Sand owns a second property available for future Canadian Pacific development in Hixton, Wisconsin Union Pacific Sand Reserve Overview (1) Significant Organic Growth Potential Hixton Oakdale Facility Hixton Site Proven 100% Nameplate Capacity Growth Potential (mm tons / year): 100mm tons 421mm 3.5 Potential Tons 9.0 Future Oakdale Development Proven 100% 5.5 321mm tons Current Nameplate Oakdale Expansion (2) Long-Term Oakdale Capacity Potential Potential Nameplate Capacity Source: Smart Sand Management, Company disclosures. (1) Reserves data as of December 31, 2017. (2) Further development and permitting at the Oakdale facility could ultimately allow for production of up to 9 million tons of raw frac sand per year. 7

Oakdale Facility: High Quality Northern White Raw Frac Sand 8

Byron Transload 9

Cost-Effective, Differentiated Process On-site Mining / Excavation Conveyer Belt to On-site Wet Plant Wet Plant Cleans and Sorts Product Dry Plant Dries and Sorts Product Unit Trains Deliver Dry Sand to Basin Low Cost Structure Due to Several Key Attributes: − Low royalty rates ($0.50 per ton on 20/70 sand) − Higher mining yields due to balance of coarse and fine mineral reserve deposits − Minimal trucking required; reserves, processing plants, and rail facilities are centralized Evaluating Other Initiatives to Reduce Mining and Operating Costs 10

West Texas Mine Options (Permian Basin) 4,219 acres under lease in Winkler and Crane counties in the Permian Basin Total upfront consideration paid <$5 million 20 year leases with the option to renew for an additional 20 years Low minimum royalty Provides Smart Sand with ability to provide sand directly to customers in the Permian Basin in the future with the ability to access rail 11
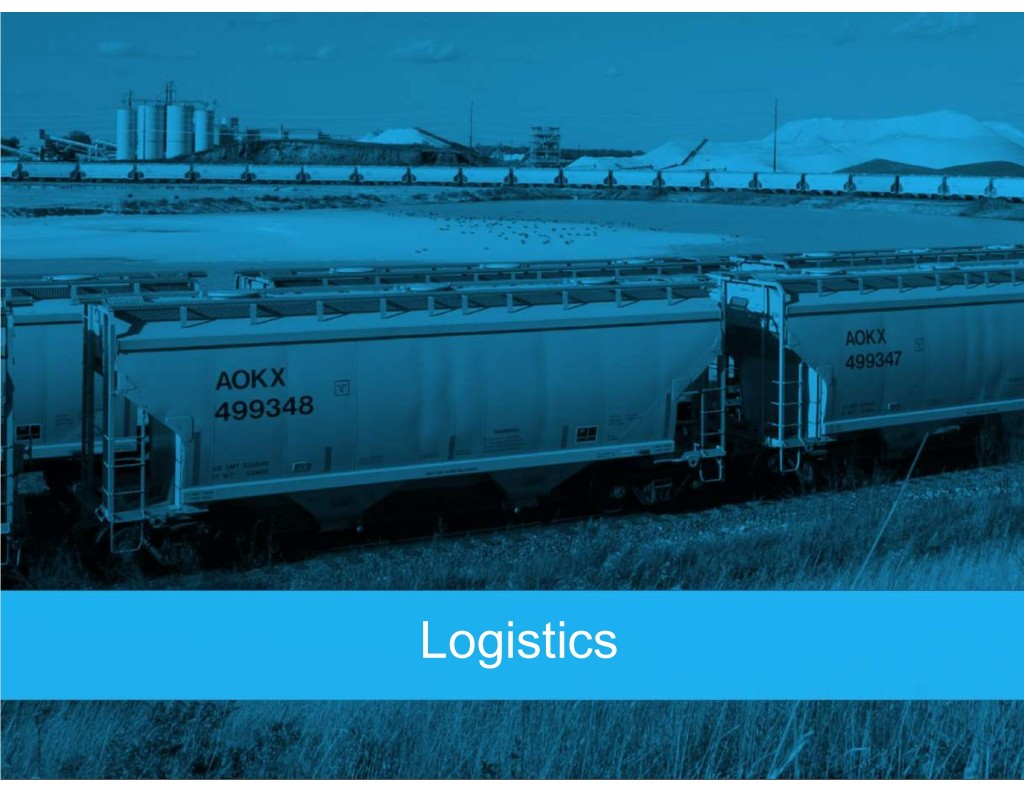
Logistics
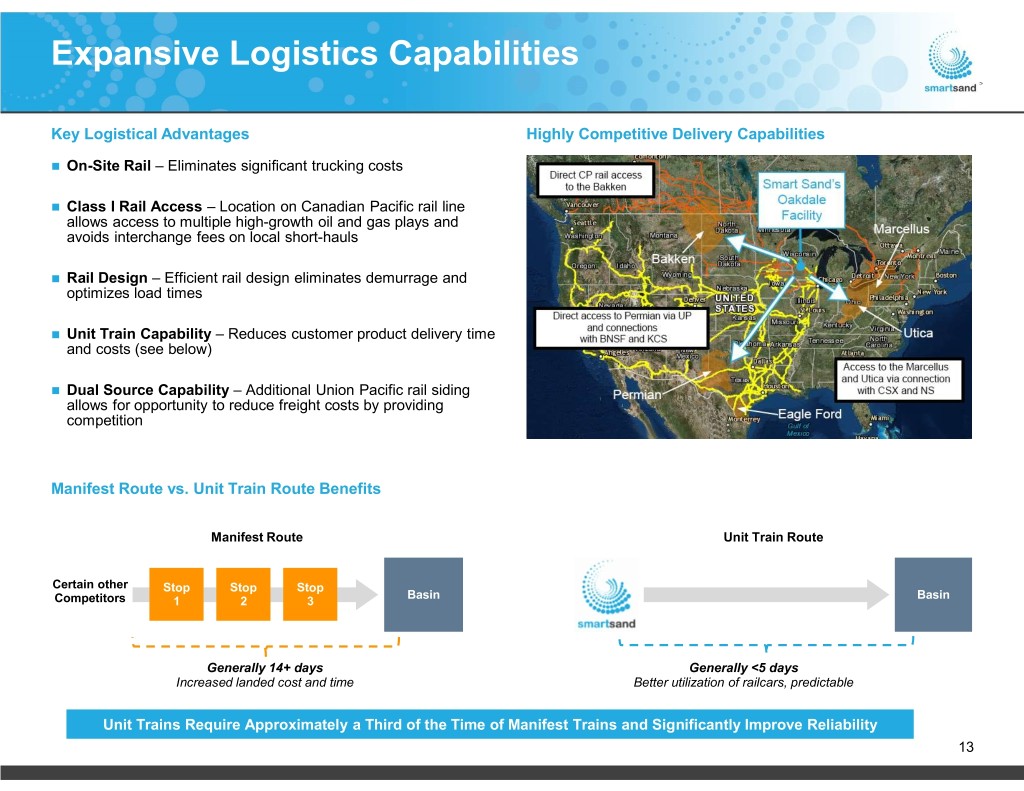
Expansive Logistics Capabilities Key Logistical Advantages Highly Competitive Delivery Capabilities On-Site Rail – Eliminates significant trucking costs Class I Rail Access – Location on Canadian Pacific rail line allows access to multiple high-growth oil and gas plays and avoids interchange fees on local short-hauls Rail Design – Efficient rail design eliminates demurrage and optimizes load times Unit Train Capability – Reduces customer product delivery time and costs (see below) Dual Source Capability – Additional Union Pacific rail siding allows for opportunity to reduce freight costs by providing competition Manifest Route vs. Unit Train Route Benefits Manifest Route Unit Train Route Certain other Stop Stop Stop Basin Basin Competitors 1 2 3 Generally 14+ days Generally <5 days Increased landed cost and time Better utilization of railcars, predictable Unit Trains Require Approximately a Third of the Time of Manifest Trains and Significantly Improve Reliability 13

Van Hook Terminal Location: Van Hook, ND Commenced operations in April 2018 Signed long-term take-or-pay contract with an anchor customer at in-basin pricing $15.5 million paid consideration Evaluating options to increase capacity Expected to result in incremental in-basin sales volumes Van Hook Terminal 14
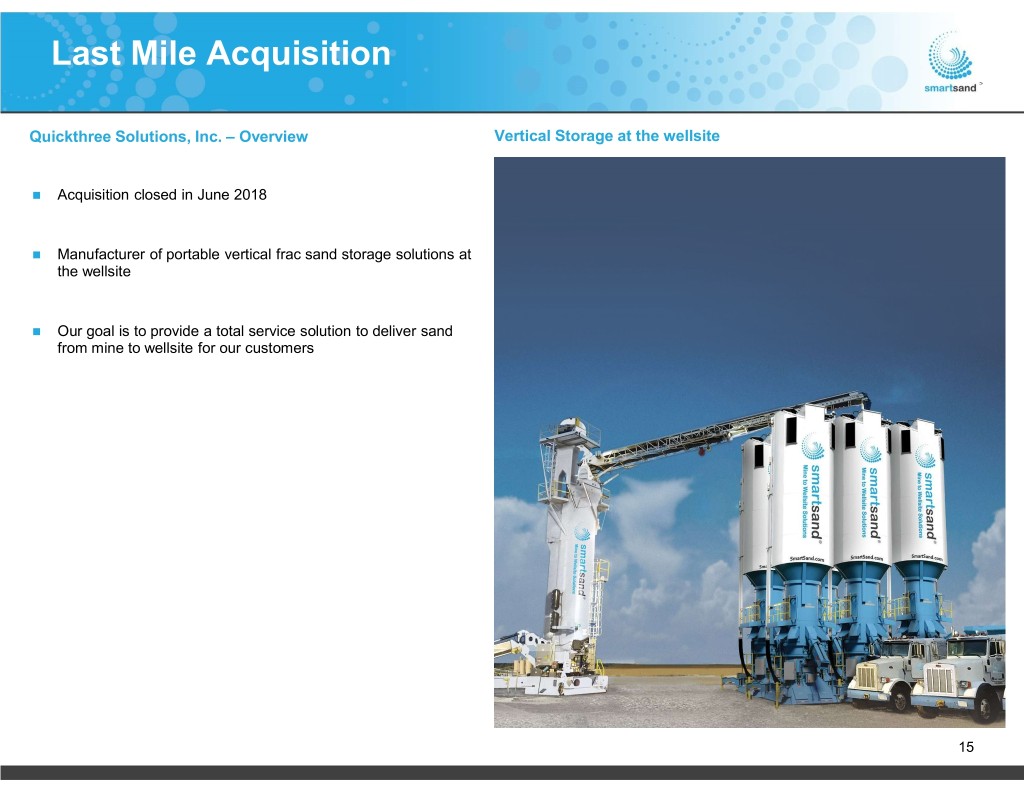
Last Mile Acquisition Quickthree Solutions, Inc. – Overview Vertical Storage at the wellsite Acquisition closed in June 2018 Manufacturer of portable vertical frac sand storage solutions at the wellsite Our goal is to provide a total service solution to deliver sand from mine to wellsite for our customers 15
Industry Overview

Industry Trends Driving Growth in Sand Demand U.S. New Well Drilling & Proppant Demand 30,000 180 160 25,000 140 20,000 120 100 15,000 80 10,000 60 40 5,000 New New US Horizontal Wells 20 0 - Millions of Proppant of Tons 2013 2014 2015 2016 2017 2018E 2019E 2020E New Horizontal Wells Proppant Demand (Mil Tons) Proppant Per Well Proppant / Well (Millions of pounds) 18 16 14 12 10 8 6 4 2 0 Q1 14 Q1 14 Q2 14 Q3 14 Q4 15 Q1 15 Q2 15 Q3 15 Q4 16 Q1 16 Q2 16 Q3 16 Q4 17 Q1 17 Q2 17 Q3 17 Q4 18E Q1 18E Q2 18E Q3 18E Q4 Source: Spears and Associates Hydraulic Fracturing Market Report Q4 2017 and Supplement, Q2 2018. 17

Market Growth Potential More Wells Drilled … More Stages/Well … More Proppant/Foot … More Proppant/ Well … More Proppant Demand 2014 Average 2015 Average 2016 Average 2017 Average 2018E New Horizontal Rigs Drilled 24,622 16,492 9,275 17,619 19,975 Avg. Lateral Length/Well 6,801 ft. 6,883 ft. 7,088 ft. 7,133 ft. 7,347 ft. Pounds/Lateral Foot 869.3 lbs/ft 997.6 lbs/ft 1,187.6 lbs/ft 1,408.6 lbs/ft 1,627.8 lbs/ft Pounds/Well 5.8M lbs. 7.2M lbs. 9.3M lbs. 11.5M lbs. 14.2M lbs. Estimated Tons/Well 2,900 tons 3,600 tons 4,650 tons 5,750 tons 7,100 tons Total Proppant Demand 72.7M tons 59.7M tons 43.7M tons 102.6M tons 141.6M tons (1) Total Frac Sand Demand 65.5M tons 53.7M tons 39.3M tons 92.3M tons 127.4M tons Source: Spears and Associates Hydraulic Fracturing Market Report Q4 2017 and Supplement, Q1 2018 & company estimates. (1) Assumes that frac sand represents 90% of total proppant demand. 18
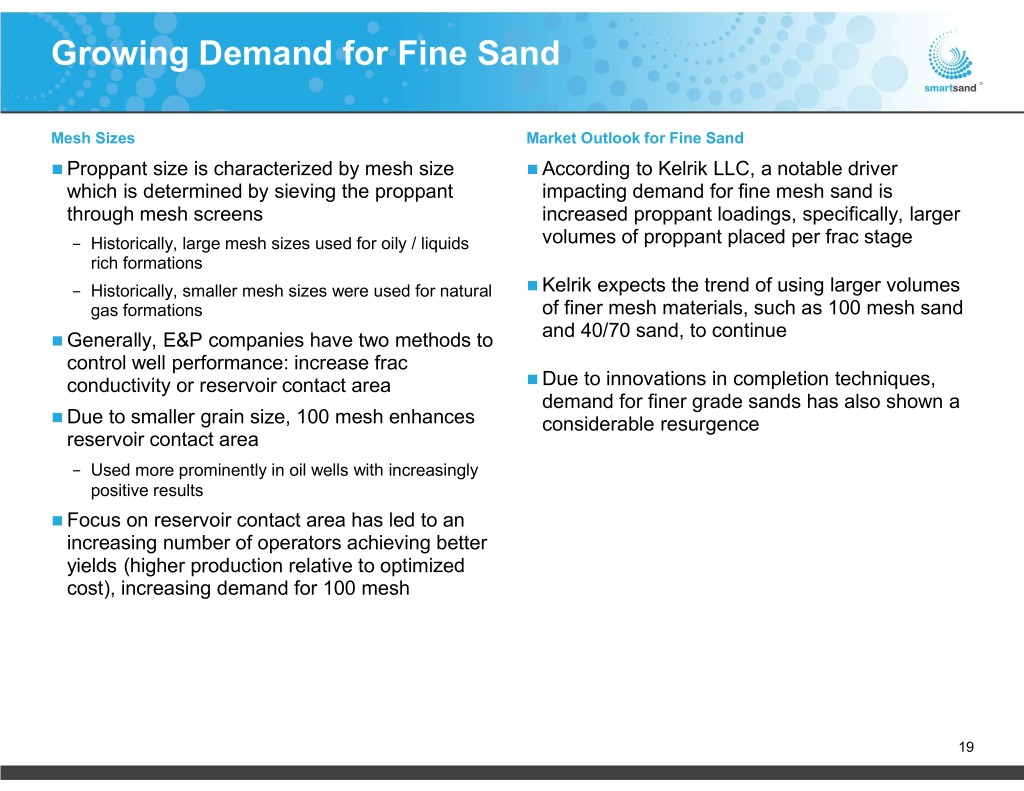
Growing Demand for Fine Sand Mesh Sizes Market Outlook for Fine Sand Proppant size is characterized by mesh size According to Kelrik LLC, a notable driver which is determined by sieving the proppant impacting demand for fine mesh sand is through mesh screens increased proppant loadings, specifically, larger − Historically, large mesh sizes used for oily / liquids volumes of proppant placed per frac stage rich formations − Historically, smaller mesh sizes were used for natural Kelrik expects the trend of using larger volumes gas formations of finer mesh materials, such as 100 mesh sand and 40/70 sand, to continue Generally, E&P companies have two methods to control well performance: increase frac conductivity or reservoir contact area Due to innovations in completion techniques, demand for finer grade sands has also shown a Due to smaller grain size, 100 mesh enhances considerable resurgence reservoir contact area − Used more prominently in oil wells with increasingly positive results Focus on reservoir contact area has led to an increasing number of operators achieving better yields (higher production relative to optimized cost), increasing demand for 100 mesh 19

Financial Overview

Summary Financials Quarterly Sales Volumes Quarterly Revenue (thousands of tons) ($ in millions) $63.1 839 823 $54.4 706 723 653 $43.0 $42.6 $39.3 (1) Q3'17A Q4'17A Q1'18A Q2'18A Q3'18A Q3'17A Q4'17A Q1'18A Q2'18A(2) Q3'18A (3) Contribution Margin/Ton Quarterly Adjusted EBITDA ($ in millions) $ 32.95 $22.1 $ 28.19 $19.3 $ 22.45 $ 17.82 $11.6 $ 14.27 $8.9 $5.9 Q3'17A Q4'17A Q1'18A Q2'18A Q3'18A Q3'17A(1) Q4'17A Q1'18A Q2'18A Q3'18A Contribution Margin (1) Includes monthly minimum / shortfall payments of $1.2 million for 3Q’17 (2) Includes monthly minimum / shortfall payments of $0.7 million for 2Q’18 (3) Includes monthly minimum / shortfall payments of $1.4 million for 3Q’18 21

Why Smart Sand? Expanded Oakdale to 5.5 million tons of annual nameplate processing capacity in 2Q 2018 Available capacity at Oakdale to capture near-term volume growth High Quality Long-lived, high-quality reserve base to support existing operations as well as potential future expansions Core Asset Base On-site multi-unit train rail access to Canadian Pacific and nearby at Oakdale access to Union Pacific (Class I) Integrated mining, plant and rail facilities to reduce costs In-basin terminals and innovative last mile logistics Additional Hixton available for future expansion Growth Locations in the Permian available for future development Significant balance sheet flexibility and liquidity Financial Ability to use cash flow generation from Oakdale operations to Flexibility support growth initiatives 22
Appendix
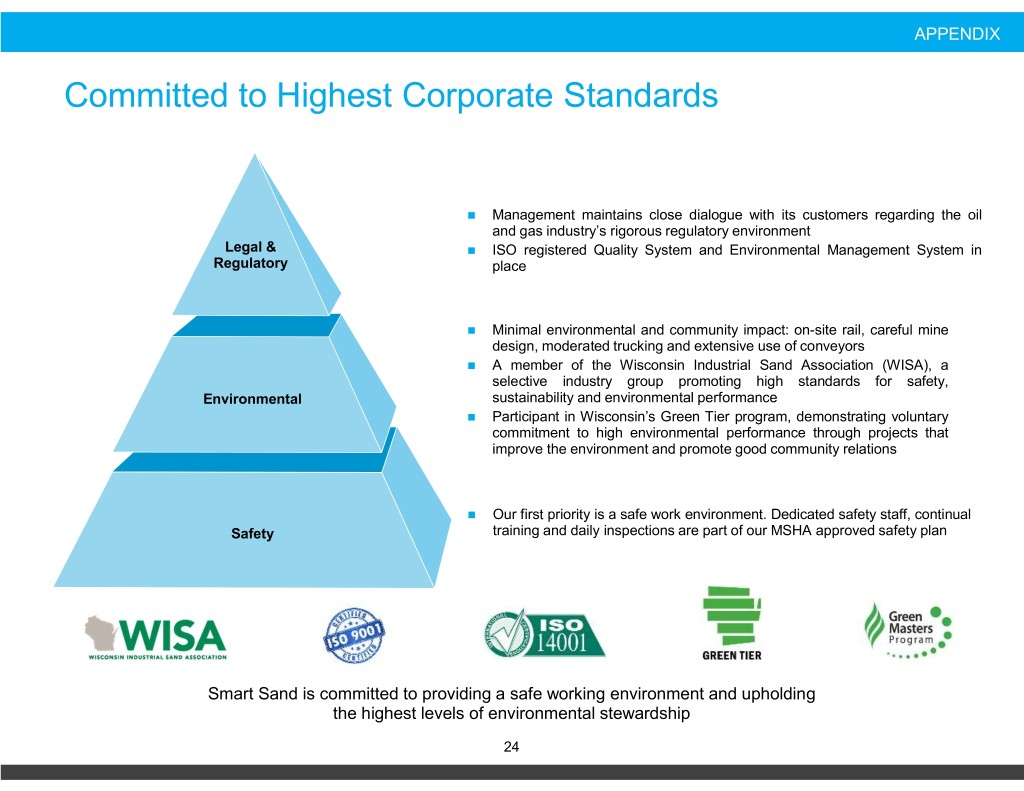
APPENDIX Committed to Highest Corporate Standards Management maintains close dialogue with its customers regarding the oil and gas industry’s rigorous regulatory environment Legal & ISO registered Quality System and Environmental Management System in Regulatory place Minimal environmental and community impact: on-site rail, careful mine design, moderated trucking and extensive use of conveyors A member of the Wisconsin Industrial Sand Association (WISA), a selective industry group promoting high standards for safety, Environmental sustainability and environmental performance Participant in Wisconsin’s Green Tier program, demonstrating voluntary commitment to high environmental performance through projects that improve the environment and promote good community relations Our first priority is a safe work environment. Dedicated safety staff, continual Safety training and daily inspections are part of our MSHA approved safety plan Smart Sand is committed to providing a safe working environment and upholding the highest levels of environmental stewardship 24

APPENDIX Income Statement For the Year ended Year ended Year ended Nine months ended Dec 31, 2015 Dec 31, 2016 Dec 31, 2017 September 30, 2018 ($ in millions) (audited) (audited) (audited) (unaudited) Revenues(1) $47.7 $59.2 $137.2 160.2 Cost of sales 21.0 26.6 100.3 110.7 Gross profit 26.7 32.7 36.9 49.5 Operating expenses Salaries, benefits and payroll taxes 5.1 7.4 8.2 8.6 Depreciation and amortization 0.4 0.4 0.5 1.2 Selling, general and administrative 4.7 4.5 9.5 10.2 Gain on contingent consideration 0.0 0.0 0.0 (2.1) Total operating expenses 10.1 12.3 18.2 17.9 Income from operations 16.6 20.4 18.7 31.7 Preferred stock interest expense (5.1) (5.6) – – Other interest expense (2.7) (2.9) (0.5) (1.4) Other income 0.4 8.9 0.5 0.1 Total other expense (7.5) 0.4 0.0 (1.3) Loss on extinguishment of debt – (1.1) – – Income (loss) before income tax expense 9.1 19.7 18.7 30.4 Income tax expense (benefit) 4.1 9.4 (2.8) 7.3 Net income (loss) 5.0 10.3 21.5 23.1 Adjusted EBITDA 23.9 37.9 30.6 47.2 Capital expenditures 29.4 2.5 51.1 111.6 Sales volumes (tons) 750,675 826,414 2,449,227 2,384,000 (1) Includes monthly minimum / shortfall payments of $10.1 million for 2015, $20.9 million for 2016, $1.2 million for 2017 and $2.1 million for 2018. Note: Figures may not tie due to rounding. 25
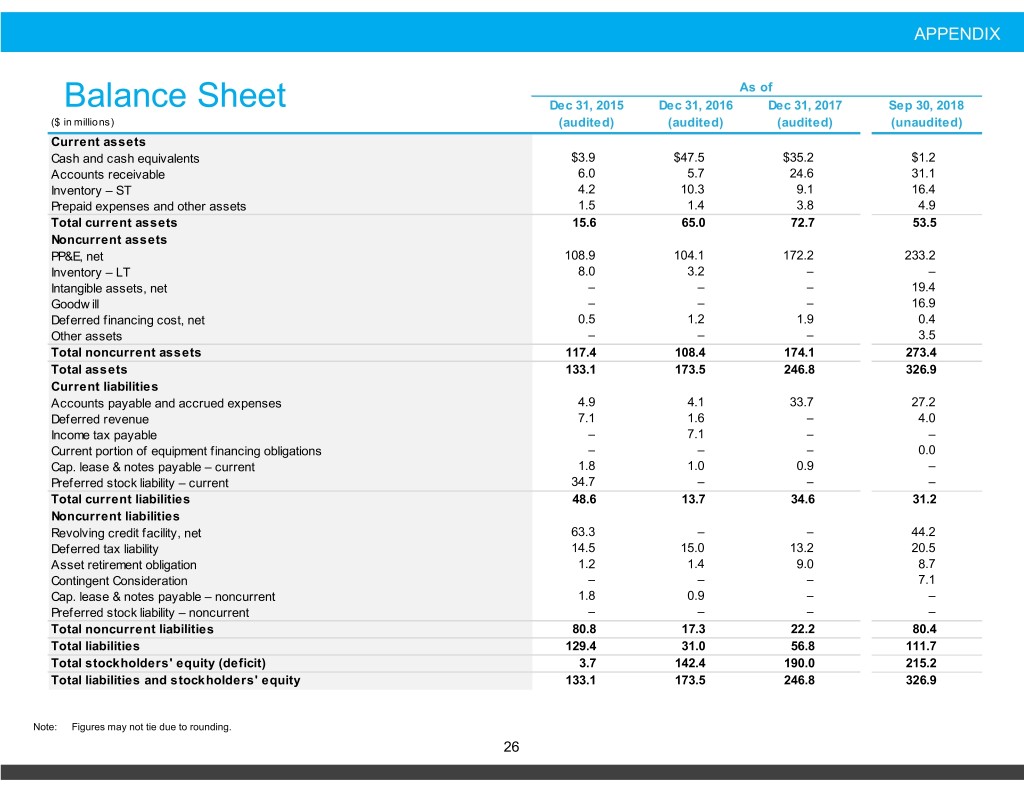
APPENDIX As of Balance Sheet Dec 31, 2015 Dec 31, 2016 Dec 31, 2017 Sep 30, 2018 ($ in millions) (audited) (audited) (audited) (unaudited) Current assets Cash and cash equivalents $3.9 $47.5 $35.2 $1.2 Accounts receivable 6.0 5.7 24.6 31.1 Inventory – ST 4.2 10.3 9.1 16.4 Prepaid expenses and other assets 1.5 1.4 3.8 4.9 Total current assets 15.6 65.0 72.7 53.5 Noncurrent assets PP&E, net 108.9 104.1 172.2 233.2 Inventory – LT 8.0 3.2 – – Intangible assets, net – – – 19.4 Goodw ill – – – 16.9 Deferred financing cost, net 0.5 1.2 1.9 0.4 Other assets – – – 3.5 Total noncurrent assets 117.4 108.4 174.1 273.4 Total assets 133.1 173.5 246.8 326.9 Current liabilities Accounts payable and accrued expenses 4.9 4.1 33.7 27.2 Deferred revenue 7.1 1.6 – 4.0 Income tax payable – 7.1 – – Current portion of equipment financing obligations – – – 0.0 Cap. lease & notes payable – current 1.8 1.0 0.9 – Preferred stock liability – current 34.7 – – – Total current liabilities 48.6 13.7 34.6 31.2 Noncurrent liabilities Revolving credit facility, net 63.3 – – 44.2 Deferred tax liability 14.5 15.0 13.2 20.5 Asset retirement obligation 1.2 1.4 9.0 8.7 Contingent Consideration – – – 7.1 Cap. lease & notes payable – noncurrent 1.8 0.9 – – Preferred stock liability – noncurrent – – – – Total noncurrent liabilities 80.8 17.3 22.2 80.4 Total liabilities 129.4 31.0 56.8 111.7 Total stockholders' equity (deficit) 3.7 142.4 190.0 215.2 Total liabilities and stockholders' equity 133.1 173.5 246.8 326.9 Note: Figures may not tie due to rounding. 26
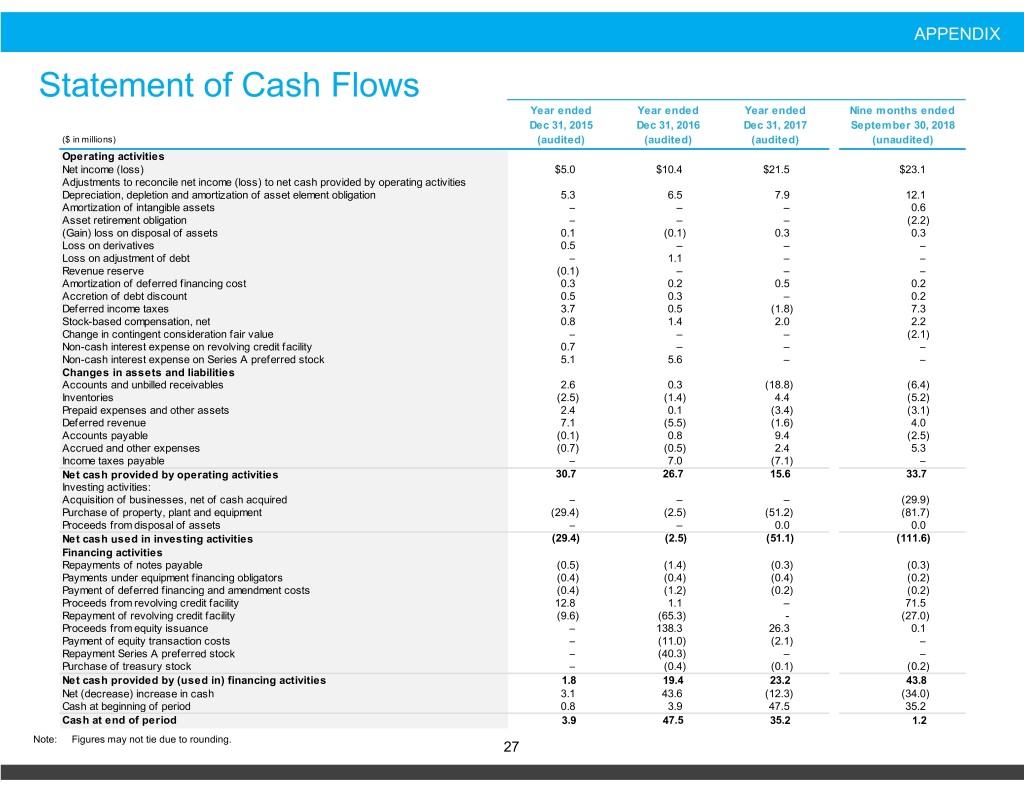
APPENDIX Statement of Cash Flows Year ended Year ended Year ended Nine months ended Dec 31, 2015 Dec 31, 2016 Dec 31, 2017 September 30, 2018 ($ in millions) (audited) (audited) (audited) (unaudited) Operating activities Net income (loss) $5.0 $10.4 $21.5 $23.1 Adjustments to reconcile net income (loss) to net cash provided by operating activities Depreciation, depletion and amortization of asset element obligation 5.3 6.5 7.9 12.1 Amortization of intangible assets – – – 0.6 Asset retirement obligation – – – (2.2) (Gain) loss on disposal of assets 0.1 (0.1) 0.3 0.3 Loss on derivatives 0.5 – – – Loss on adjustment of debt – 1.1 – – Revenue reserve (0.1) – – – Amortization of deferred financing cost 0.3 0.2 0.5 0.2 Accretion of debt discount 0.5 0.3 – 0.2 Deferred income taxes 3.7 0.5 (1.8) 7.3 Stock-based compensation, net 0.8 1.4 2.0 2.2 Change in contingent consideration fair value – – – (2.1) Non-cash interest expense on revolving credit facility 0.7 – – – Non-cash interest expense on Series A preferred stock 5.1 5.6 – – Changes in assets and liabilities Accounts and unbilled receivables 2.6 0.3 (18.8) (6.4) Inventories (2.5) (1.4) 4.4 (5.2) Prepaid expenses and other assets 2.4 0.1 (3.4) (3.1) Deferred revenue 7.1 (5.5) (1.6) 4.0 Accounts payable (0.1) 0.8 9.4 (2.5) Accrued and other expenses (0.7) (0.5) 2.4 5.3 Income taxes payable – 7.0 (7.1) – Net cash provided by operating activities 30.7 26.7 15.6 33.7 Investing activities: Acquisition of businesses, net of cash acquired – – – (29.9) Purchase of property, plant and equipment (29.4) (2.5) (51.2) (81.7) Proceeds from disposal of assets – – 0.0 0.0 Net cash used in investing activities (29.4) (2.5) (51.1) (111.6) Financing activities Repayments of notes payable (0.5) (1.4) (0.3) (0.3) Payments under equipment financing obligators (0.4) (0.4) (0.4) (0.2) Payment of deferred financing and amendment costs (0.4) (1.2) (0.2) (0.2) Proceeds from revolving credit facility 12.8 1.1 – 71.5 Repayment of revolving credit facility (9.6) (65.3) - (27.0) Proceeds from equity issuance – 138.3 26.3 0.1 Payment of equity transaction costs – (11.0) (2.1) – Repayment Series A preferred stock – (40.3) – – Purchase of treasury stock – (0.4) (0.1) (0.2) Net cash provided by (used in) financing activities 1.8 19.4 23.2 43.8 Net (decrease) increase in cash 3.1 43.6 (12.3) (34.0) Cash at beginning of period 0.8 3.9 47.5 35.2 Cash at end of period 3.9 47.5 35.2 1.2 Note: Figures may not tie due to rounding. 27

APPENDIX EBITDA Reconciliation Year ended December 31, ($ in thousands) 2015 2016 2017 Net income (loss) $4,990 $10,379 $21,526 Depreciation, depletion, accretion and amortization 5,318 6,445 7,300 Income tax (benefit) expense 4,129 9,394 (2,809) Interest expense 7,826 8,436 700 Franchise taxes 35 21 339 EBITDA $22,298 $34,675 $27,056 (Gain) Loss on sale of fixed assets (1) 39 (59) 253 Integration and transition costs – – 16 Initial public offering related costs (2) 221 725 – Equity compensation (3) 792 1,426 1,652 Acquisition and development costs (4) 76 – 845 Cash charges related to restructuring and retention (5) – – 279 Non-cash charges (6) 469 21 514 Loss on extinguishment of debt (7) – 1,051 – Adjusted EBITDA $23,881 $37,839 $30,615 (1) Includes losses related to the sale and disposal of certain assets in property, plant and equipment. (2) For the year ended December 31, 2016, represents IPO-related bonuses. For the years ended December 31, 2016 and 2015, we incurred $725 and $221 of expenses related to previous IPO activities, respectively. (3) Represents the non-cash expenses for stock-based awards issued to our employees and employee stock purchase plan compensation expense. (4) Represents costs related to current development project activities. (5) Represents costs associated with the retention and relocation of employees. (6) Represents accretion of asset retirement obligations and loss on derivatives. For the years ended December 31, 2016 and 2015, we incurred a loss of $5 and $445 related to a propane derivative contract, respectively. (7) Reflects the loss on extinguishment of debt related to our November 2016 financing transaction. 28
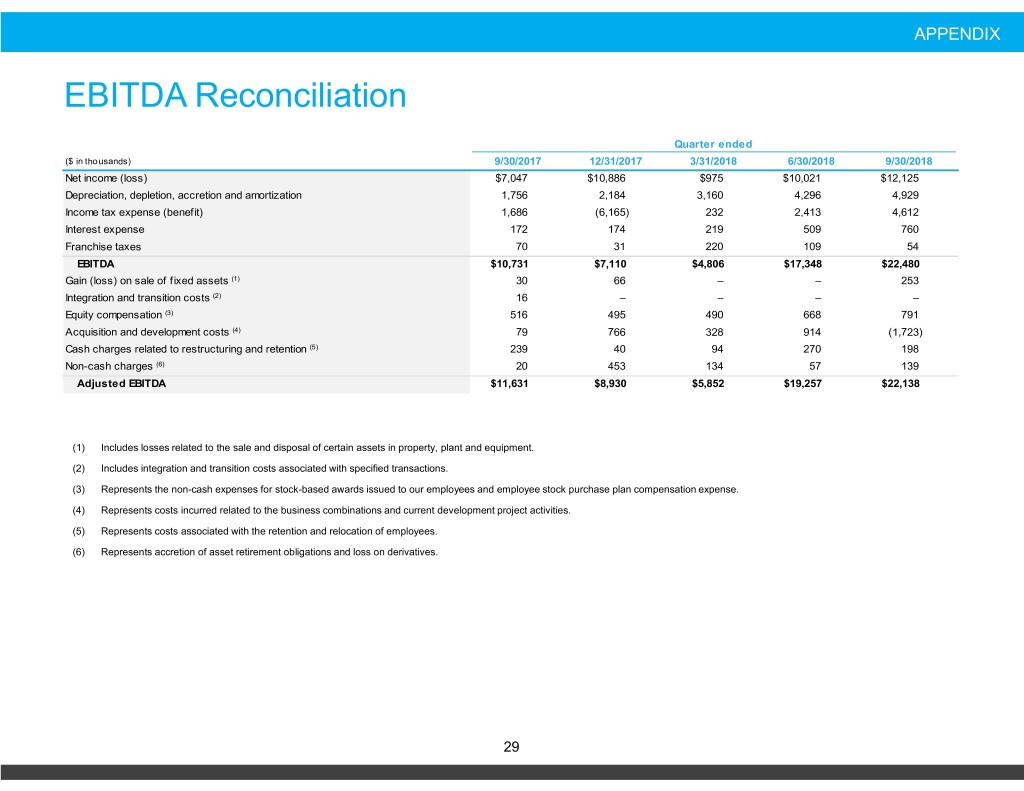
APPENDIX EBITDA Reconciliation Quarter ended ($ in thousands) 9/30/2017 12/31/2017 3/31/2018 6/30/2018 9/30/2018 Net income (loss) $7,047 $10,886 $975 $10,021 $12,125 Depreciation, depletion, accretion and amortization 1,756 2,184 3,160 4,296 4,929 Income tax expense (benefit) 1,686 (6,165) 232 2,413 4,612 Interest expense 172 174 219 509 760 Franchise taxes 70 31 220 109 54 EBITDA $10,731 $7,110 $4,806 $17,348 $22,480 Gain (loss) on sale of fixed assets (1) 30 66 – – 253 Integration and transition costs (2) 16 – – – – Equity compensation (3) 516 495 490 668 791 Acquisition and development costs (4) 79 766 328 914 (1,723) Cash charges related to restructuring and retention (5) 239 40 94 270 198 Non-cash charges (6) 20 453 134 57 139 Adjusted EBITDA $11,631 $8,930 $5,852 $19,257 $22,138 (1) Includes losses related to the sale and disposal of certain assets in property, plant and equipment. (2) Includes integration and transition costs associated with specified transactions. (3) Represents the non-cash expenses for stock-based awards issued to our employees and employee stock purchase plan compensation expense. (4) Represents costs incurred related to the business combinations and current development project activities. (5) Represents costs associated with the retention and relocation of employees. (6) Represents accretion of asset retirement obligations and loss on derivatives. 29

APPENDIX Contribution Margin Reconciliation Quarter ended ($ in thousands) 9/30/2017 12/30/2017 3/31/2018 6/30/2018 9/30/2018 Revenue $39,329 $43,037 $42,628 $54,448 $63,146 Cost of goods sold 26,297 32,938 35,413 34,678 40,595 Gross profit 13,032 10,099 7,215 19,770 22,551 Depreciation, depletion, and accretion of asset retirment obligations 1,628 2,490 3,106 3,878 4,567 Contribution margin $14,660 $12,589 $10,321 $23,648 $27,118 Contribution margin per ton $22.45 $17.82 $14.28 $28.19 $32.95 Note: Figures may not tie due to rounding. 30
