Attached files
| file | filename |
|---|---|
| 8-K - 8-K - Agiliti Health, Inc. | a18-36281_18k.htm |
Important information The information in this presentation relates to a proposed business combination among Federal Street Acquisition Corp. (“FSAC”) and Universal Hospital Services, Inc. (“UHS”). The proposed business combination involves a series of mergers by which FSAC and UHS will become subsidiaries of a new holding company called Agiliti, Inc. (“Agiliti”). References to Agiliti in this presentation are to the historical business of UHS, which will be operated under the new holding company. This presentation is for informational purposes only and has been prepared to assist interested parties in making their own evaluation with respect to the proposed business combination and for no other purpose. The information contained herein is not, and should not be assumed to be, complete. None of FSAC, UHS or Agiliti is under any obligation to update or keep current the information contained in this presentation, to remove any outdated information from this presentation, or to expressly mark it as being outdated. No securities commission or securities regulatory authority or other regulatory body or other authority in the United States or any other jurisdiction has in any way passed upon the merits of, or the accuracy and adequacy of, this presentation. You should not construe the contents of this presentation as legal, accounting, business or tax advice and you should consult your own professional advisors as to the legal, accounting, business, tax, financial or other matters contain herein. None of FSAC, UHS or Agiliti nor any of their respective affiliates, directors, officers, management, employees, representatives or advisors make any representation or warranty, express or implied, as the accuracy or completeness of any of the information contained herein, or any other information (whether communicated in written or oral form) transmitted or made available to you. Recipients of this presentation will be deemed to expressly disclaim any and all liability of any of the foregoing persons relating to or resulting from the use of this presentation or such other information (including without limitation, any market analysis and financial projections that may be contained herein or provided in connection herewith) by you or any of your directors, partners, officers, employees, affiliates, agents and representatives. Forward-looking Statements Certain statements made herein include forward looking statements within the meaning of the “safe harbor” provisions of the United States Private Securities Litigation Reform Act of 1995. Specifically, the words “estimates,” “projected,” “expects,” “anticipates,” “forecasts,” “plans,” “intends,” “believes,” “seeks,” “may,” “will,” “should,” “future,” “propose” and variations of these words or similar expressions (or the negative versions of such words or expressions) are intended to identify forward-looking statements. These forward-looking statements are not guarantees of future performance, conditions or results, and involve a number of known and unknown risks, uncertainties, assumptions and other important factors, many of which are outside FSAC’s or UHS’s management’s control, that could cause actual results or outcomes to differ materially from those discussed in the forward-looking statements. These risks and uncertainties include, but are not limited to, those factors described in the section entitled “Risk Factors” in the Prospectus/Proxy Statement (as defined below) and those described in the section entitled “Risk Factors” in UHS’s annual report on Form 10-K for the year ended December 31, 2017 filed with the Securities and Exchange Commission (“SEC”), as well as UHS’s other filings with the SEC. Important factors, among others, that may affect actual results or outcomes include: the inability to complete the transactions contemplated by the proposed business combination; the inability to recognize the anticipated benefits of the proposed business combination, which may be affected by, among other things, the amount of cash available following any redemptions by FSAC stockholders; the ability to meet NASDAQ’s listing standards following the consummation of the transactions contemplated by the proposed business combination; and costs related to the proposed business combination. Important factors that could cause the combined company’s actual results or outcomes to differ materially from those discussed in the forward-looking statements include: UHS’s history of net losses; the need for substantial cash to operate and expand the combined company’s business as planned; the combined company’s expected substantial outstanding debt following the business combination; a decrease in the number of patients the combined company’s customers serve; the combined company’s ability to effect change in the manner in which healthcare providers traditionally procure medical equipment; the absence of long-term commitments with customers; the combined company’s ability to renew contracts with group purchasing organizations and integrated delivery networks; changes in reimbursement rates and policies by third-party payors; the impact of healthcare reform initiatives; the impact of significant regulation of the healthcare industry and the need to comply with those regulations; the effect of prolonged negative changes in domestic and global economic conditions; difficulties or delays in the combined company’s continued expansion into certain of UHS’s businesses/geographic markets and developments of new businesses/geographic markets; additional credit risks in increasing business with home care providers and nursing homes, impacts of equipment product recalls or obsolescence; and increases in vendor costs that cannot be passed through to the combined company’s customers. Neither FSAC nor UHS undertakes any obligation to update or revise any forward-looking statements, whether as a result of new information, future events or otherwise, except as required by law. Non-GAAP Financial Measures EBITDA, Adjusted EBITDA, Accrual CapEx and Bookings are non-GAAP measures. UHS believes these non-GAAP measures provide useful information to management and investors regarding UHS’s business and results of operations. Because these measures are not in conformity with GAAP, we urge you to review UHS’s audited financial statements filed with the SEC. Definitions of these non-GAAP measures and reconciliations to the most comparable GAAP measure are included elsewhere in this presentation.
Additional Information about the Proposed Business Combination and Where to Find It FSAC filed an amended preliminary proxy statement with the SEC on September 26, 2018 for use at the special meeting of stockholders to approve the business combination with UHS. The preliminary proxy statement forms part of a Registration Statement on Form S-4 with respect to the securities being issued by Agiliti in the transaction (the “Prospectus/Proxy Statement”). The Prospectus/Proxy Statement will be mailed to FSAC stockholders as of a record date to be established for voting on the proposed business combination. INVESTORS AND SECURITY HOLDERS OF FSAC AND UHS ARE URGED TO READ THE PROSPECTUS/PROXY STATEMENT AND OTHER RELEVANT DOCUMENTS THAT HAVE BEEN FILED WITH THE SEC CAREFULLY AND IN THEIR ENTIRETY BECAUSE THEY CONTAIN IMPORTANT INFORMATION ABOUT THE PROPOSED TRANSACTION. Investors and security holders may obtain free copies of the Prospectus/Proxy Statement and other documents containing important information about FSAC, UHS and Agiliti through the website maintained by the SEC at http://www.sec.gov. Copies of the documents filed with the SEC by FSAC can be obtained free of charge on FSAC’s website at http://www.thl.com/fsac or by directing a written request to Federal Street Acquisition Corp., 100 Federal Street, 35th Floor, Boston, MA 02110, (617) 227-1050. Participants in the Solicitation FSAC, UHS, Agiliti and their respective directors and executive officers, under SEC rules, may be deemed to be participants in the solicitation of proxies of FSAC’s stockholders in connection with the proposed transaction. Investors and security holders may obtain more detailed information regarding the names and interests in the proposed transaction of FSAC’s directors and officers in the Prospectus/Proxy Statement. Information regarding the persons who may, under SEC rules, be deemed participants in the solicitation of proxies to FSAC’s shareholders in connection with the proposed business combination is set forth in the Prospectus/Proxy Statement. Additional information regarding the interests of participants in the solicitation of proxies in connection with the proposed business combination is included in the Prospectus/Proxy Statement. No Offer or Solicitation This communication shall neither constitute an offer to sell or the solicitation of an offer to buy any securities, nor shall there be any sale of securities in any jurisdiction in which the offer, solicitation or sale would be unlawful prior to the registration or qualification under the securities laws of any such jurisdiction. Important information
Presenters Chief Executive Officer 4 TOM LEONARD SCOTT SPERLING Executive Chairman, FSAC Co-President, THL
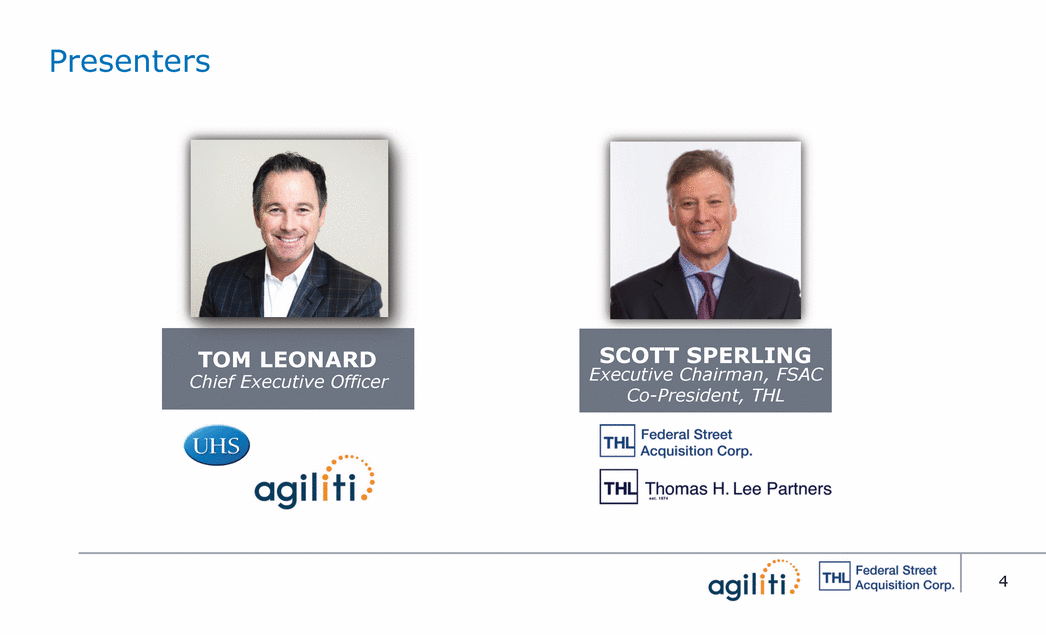
Overview of FederalStreet Acquisition Corp. • • Premier private equity and credit platforms Deep experience in health care with relationships developed over 40 years • -adde -term partner who will support capital Sponsorship markets activities and contribute industry expertise Strong alignment of interest given material FSAC Sponsor ownership • Group Operationally intensive approach to creating value • • Hands-On Operational Engagement Focused hel nies their potential and maximize upside for all shareholders Used to help mitigate impact of down cycles • Experience Experienced team with operating expertise and access to THL network • • • Decades of investment and operating experience Ability to leverage THL platform for operational support Strong oversight from experienced independent directors Experienced Team and Board An investment in FSAC is not an investment in THL, a THL fund or a THL portfolio company. The historical results of THL, its funds and portfolio companies are not necessarily indicative of future performance of FSAC or any business combination it may make. 5 $460M Capital Equity capital raised July 2017 for growth and liquidity Access to High Value Resources THL Partners + Strategic Resource FSAC Partnership Highlights Who We Are
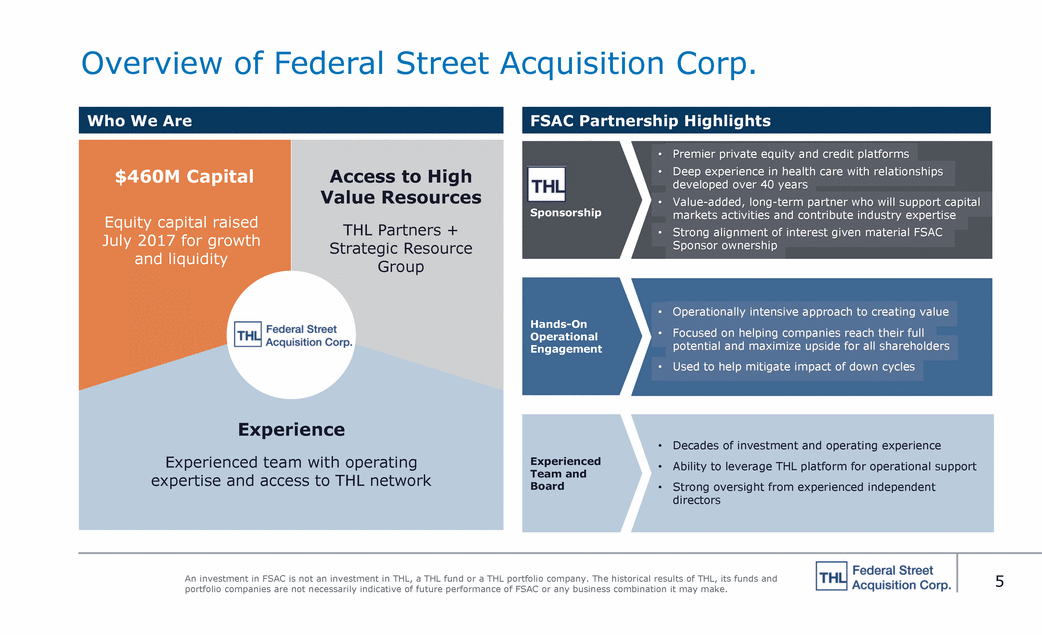
THLPrivateEquityhasspecialexpertiseinhealthcare Decades of deep experience in a broad range of health care companies In In the the past 3 years, acquired 7 health care companies totaling $7.5 billion of enterprise value • • last 25 years, invested in 16 health care companies with more than $23 billion of enterprise value and Devices 1 1 1 1 1 1 1 1 1 and portfolio companies are not necessarily indicative of future performance of FSAC or any business combination it may make. 1 Represents current portfolio company not fully exited as of 06/30/18. An investment in FSAC is not an investment in THL, a THL fund or a THL portfolio company. The historical results of THL, its funds 6 Consumer Health Care Pharma and Pharma Services Provider and Provider-based Services Broad-based Outsourced Services and Technology
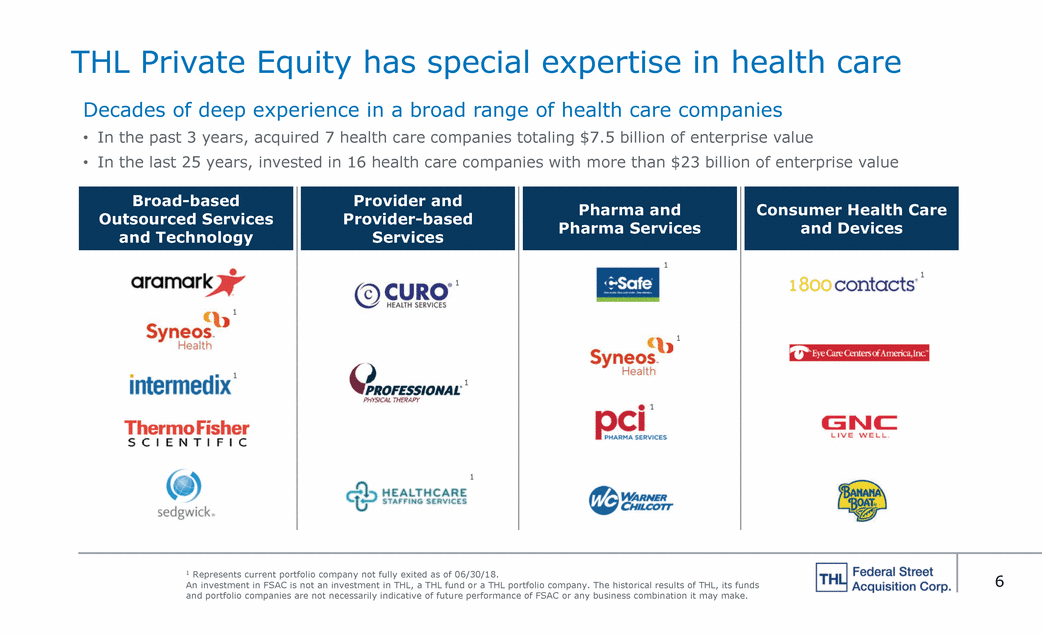
(1) FSAC believes Agiliti meets five key criteria for attractive risk-adjusted returns Agiliti benefits from macro trends affecting health care Aging demographic and push toward broader access to health care and improved patient care Increased cost pressure on health care systems leading to outsourcing a broad array of non-core activities Rapid expansion of hospitals to ambulatory and specialty care settings further accelerates move to outsourcing Proliferation of increasingly complex equipment with higher degrees of technical specialization Agiliti has demonstrated a significant and tangible competitive advantage Superior commercial infrastructure that spans across all major health care markets Proven ability to improve utilization rates of both complex and simple equipment Agiliti continues to accelerate top-line growth Increasing revenue by utilizing its competitive advantages with new and existing customers Pursuing numerous accretive acquisition opportunities Agiliti has transformed to a higher growth, high value-added services model Increasing key competencies in higher value-added services further improves FCF conversion and continues to accelerate Adj. EBITDA – Accrual Capital Expenditures Expanding relationships with customers through broadened solution offerings and capabilities is driving higher revenue growth rates Agiliti management team joined in 2015 and has demonstrated strong and consistent performance Transformed business model to higher ROIC and FCF paradigm generating 13.5% EBITDA – Accrual CapEx CAGR since 2015 Achieving more than 95% recurring revenue provides predictability as well as an advantaged growth platform 1 The proposed business combination between FSAC and UHS involves a series of mergers by which FSAC and UHS will become subsidiaries of a new holding company called Agiliti. References to Agiliti in this presentation are to the historical business of UHS, which will be operated under the new holding company. 7 Management teams that can be or are great Business models that can generate strong growth and free cash flow Opportunities to drive top-line growth in multiple ways Companies with a sustainable competitive advantage Markets with strong secular growth
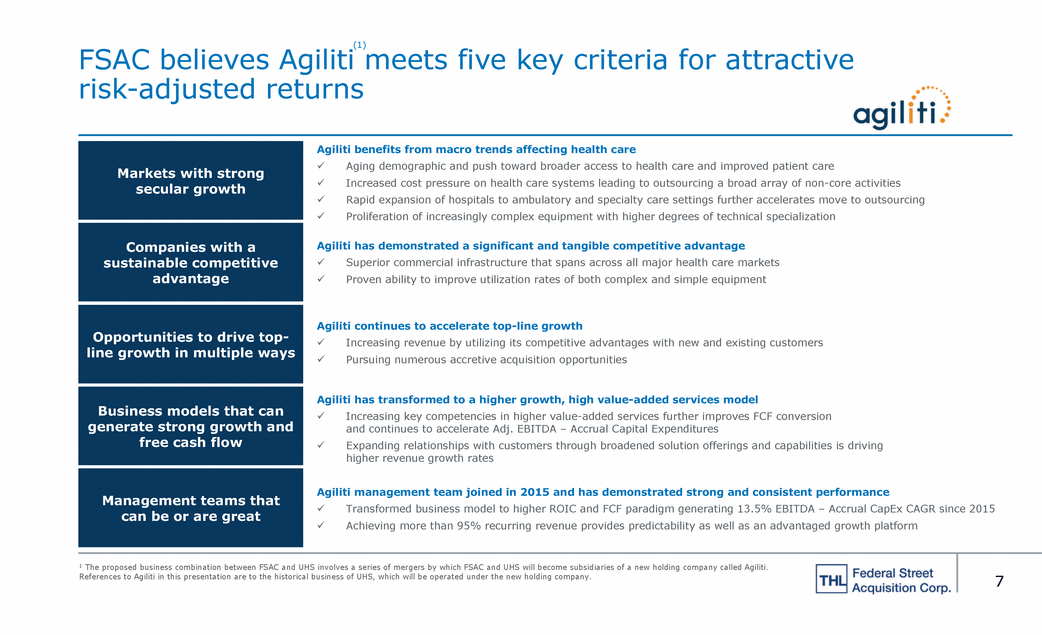
Transactionsummary ($ in millions, except per share value) Public4 comparables 3 UHS Illustrative Share Price 1 (x) Pro Forma Shares Outstanding $10.00 106.3 FD Enterprise Value / 2018F Adj. EBITDA 2018F Adj. EBITDA to growth multiple FD Enterprise Value / 2019F Adj. EBITDA 2019F Adj. EBITDA to growth multiple 11.6x 1.2x 10.2x 1.0x 16.8x 1.7x 15.4x 1.0x Fully Distributed Equity Value Plus: Pro Forma Net Debt $1,063 677 Fully Distributed Enterprise Value $1,740 3 Transaction Multiples 2018F Adj. EBITDA FD Enterprise Value / 2018F Adj. EBITDA 2019F Adj. EBITDA FD Enterprise Value / 2019F Adj. EBITDA $150 11.6x $170 10.2x Existing Shareholder Rollover 22% Sources FSAC Cash New Debt Raised Existing Capital Leases Rollover Existing Shareholder Rollover Additional Common Equity $460 660 17 238 250 Public 43% Total Sources $1,625 Uses Cash to Existing Shareholders Repayment of Existing Net Debt Existing Capital Leases Rollover Existing Shareholder Rollover Fees & Expenses $630 695 17 238 45 Additional Equity (THL) 2 30% Additional Equity (Other investors) 5% Total Uses $1,625 EBITDA guidance of $145 – 150M for 2018F and $165 – 170M for 2019F and midpoint of long-term growth rate guidance of 9 – 11%. 4 Public comparables based off 08/09/2018 close. 5 Net debt and capital leases are as of 6/30/2018. 1 Includes an estimated 23.8 million shares issued to existing UHS shareholders, 46.0 million shares held by public FSAC shareholders, 25.0 million shares issued to PIPE investors and 11.5 million sponsor shares; excludes FSAC warrants, which are currently out-of-the-money; all share information throughout this presentation assumes no redemptions by public shareholders, assumes a $10.00 per share price for illustrative purposes and assumes conversion of the class F sponsor shares into class A common shares on a 1:1 basis in connection with the business combination. 2 Includes 100,000 shares held by FSAC BoD members and additional class A common stock to be purchased in the private placement. 3 Multiples based on high ends of Adj. 8 Sources and uses5 Illustrative pro forma economic ownership1 Comparable valuation Illustrative pro forma valuation
1 Agiliti Company overview 1 The proposed business combination between FSAC and UHS involves a series of mergers by which FSAC and UHS will become subsidiaries of a new holding company called Agiliti. References to Agiliti in this presentation are to the historical business of UHS, which will be operated under the new holding company.
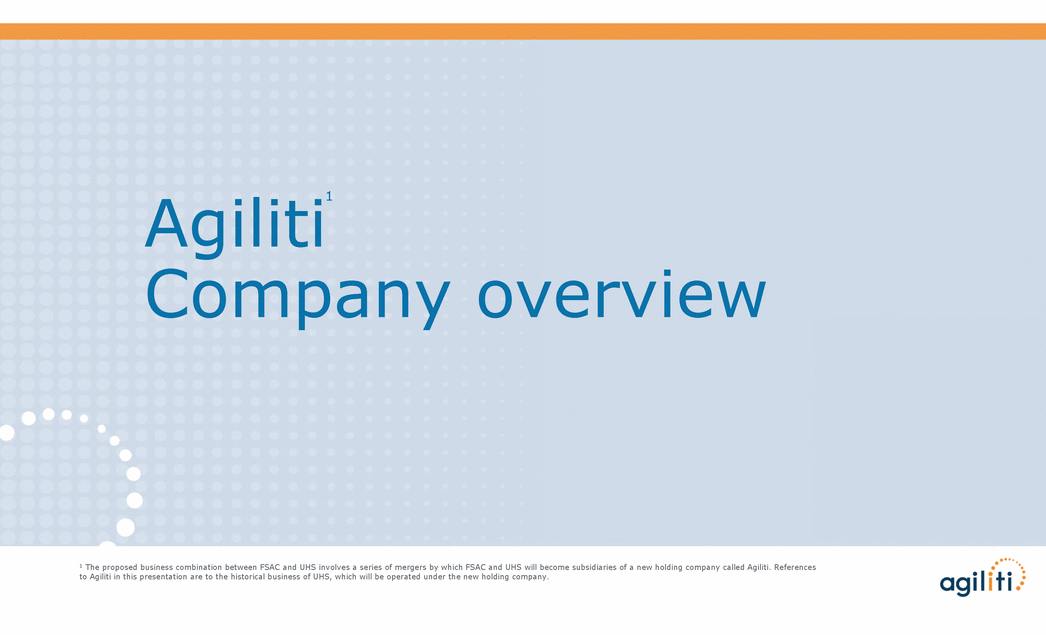
Investmenthighlights Agiliti is the leading provider of end-to-end medical equipment solutions across the health care delivery continuum Large and growing market, driven by increased medical equipment at the patient bedside and fragmented processes within increasingly complex delivery systems • Highly differentiated value proposition and improve delivery of patient care Unmatched operational infrastructure health care markets Long runway for organic growth with opportunities among existing customers Clear path to augmenting strong organic M&A opportunities aligned with imperative to reduce costs • • with nationwide footprint across all major • new business and share-of-wallet • growth profile with tuck-in and strategic • Attractive financial profile, with highly visible, recurring revenue, and accelerating cash generation Experienced and proven management team • 10
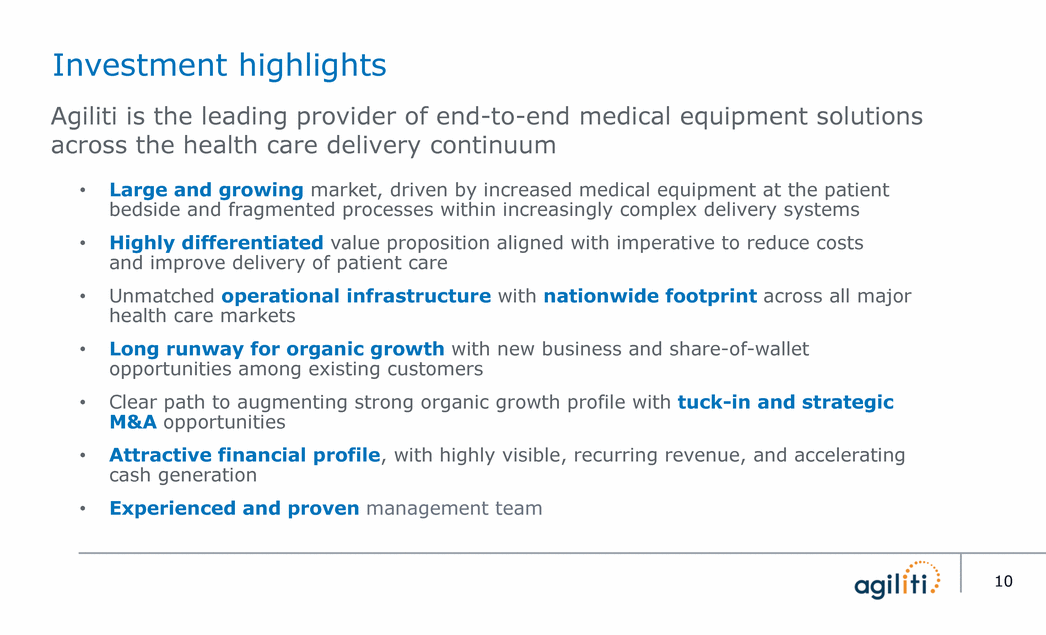
Agiliti at a glance Leadingprovider ofend-to-end medicalequipmentsolutions $539M June LTM Revenue % Revenue by End-to-End Service Offering EQUIPMENT SOLUTIONS ON-SITE MANAGED SERVICES CLINICAL ENGINEERING 1 $146M June LTM EBITDA Supply Chain On-demand supplemental rental Clinical expertise supporting specialized In-market service and delivery protocols 95% Recurring Revenue Nursing End-to-end onsite service, delivery, tracking Patient-ready devices when and where needed 8.4% June LTM EBITDA Growth Clinical Engineering Preventive maintenance and biomedical repair services for a complete range of modalities 1 Ref. UHS Q2 Earnings presentation for reconciliation of Q2 2018 Adjusted EBITDA and Accrual CapEx. 11 44% 28% 28%
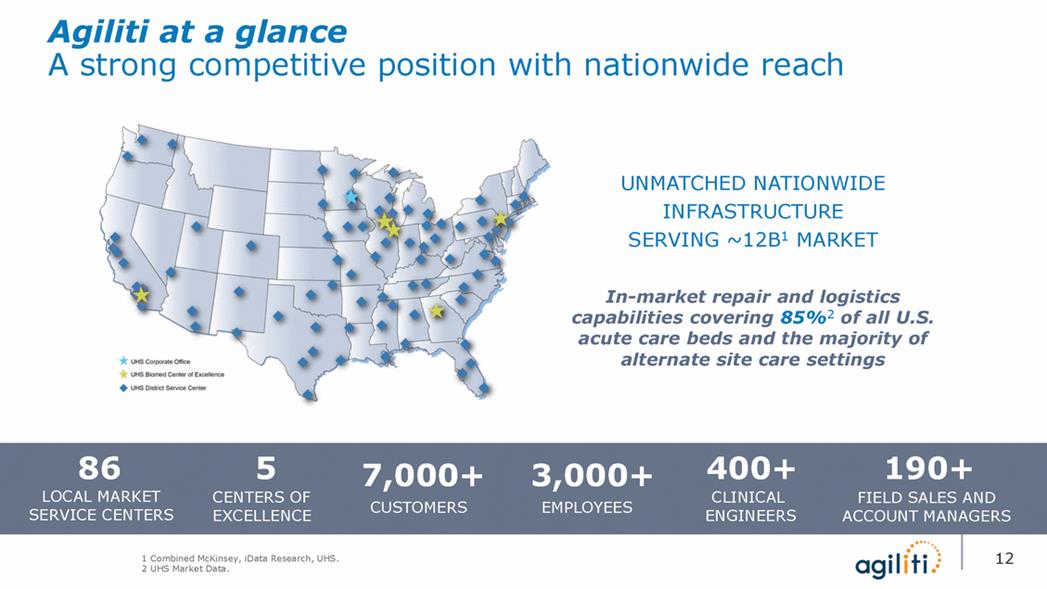
In-market repair and logistics capabilities covering 85%2 of all U.S. acute care beds and the majority of alternate site care settings 86 5 7,000+ 3,000+ 400+ 190+ LOCAL MARKET SERVICE CENTERS CUSTOMERS CENTERS OF EXCELLENCE EMPLOYEES CLINICAL ENGINEERS FIELD SALES AND ACCOUNT MANAGERS Agiliti at a glance A strong competitive position with nationwide reach UNMATCHED NATIONWIDE INFRASTRUCTURE SERVING ~12B1 MARKET 1 Combined McKinsey, iData Research, UHS. 2 UHS Market Data.
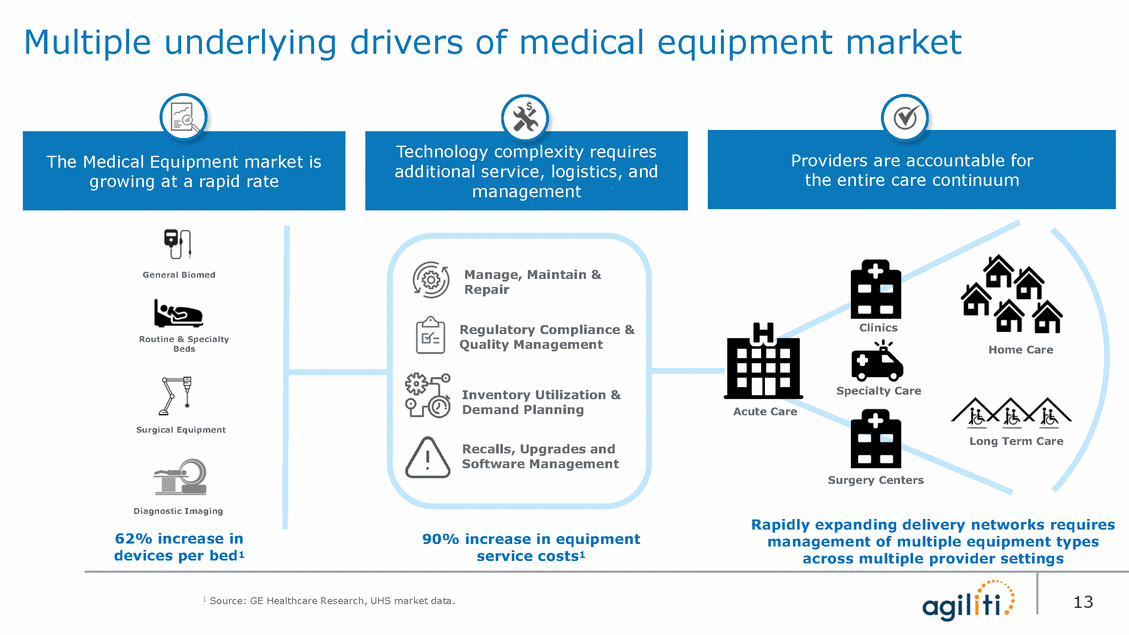
Multiple underlying drivers of medical equipment market additional service, logistics, and Manage, Maintain & Repair General Biomed Regulatory Compliance & Quality Management Clinics Routine & Specialty Beds Home Care Specialty Care Inventory Utilization & Demand Planning Acute Care Surgical Equipment Long Term Care Recalls, Upgrades and Software Management Surgery Centers Diagnostic Imaging Rapidly expanding delivery networks requires management of multiple equipment types across multiple provider settings 62% increase in devices per bed1 90% increase in equipment service costs1 1 Source: GE Healthcare Research, UHS market data. 13 Technology complexity requires management Providers are accountable for the entire care continuum The Medical Equipment market is growing at a rapid rate
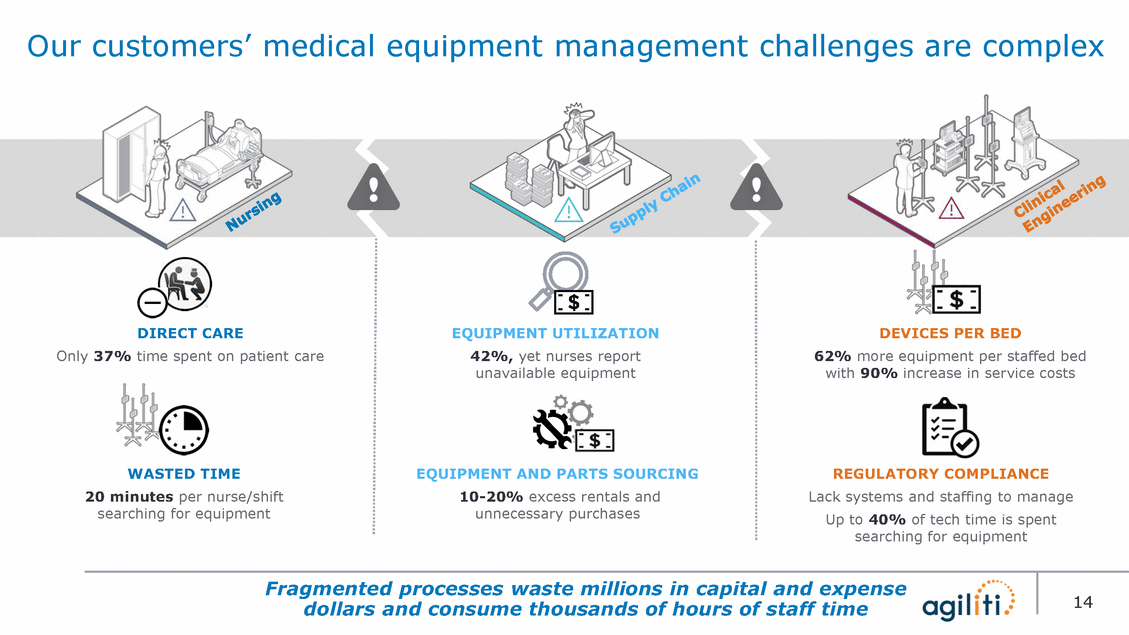
Our customers’ medical equipment management challenges are complex DIRECT CARE Only 37% time spent on patient care EQUIPMENT UTILIZATION 42%, yet nurses report unavailable equipment DEVICES PER BED 62% more equipment per staffed bed with 90% increase in service costs WASTED TIME 20 minutes per nurse/shift searching for equipment EQUIPMENT AND PARTS SOURCING 10-20% excess rentals and unnecessary purchases REGULATORY COMPLIANCE Lack systems and staffing to manage Up to 40% of tech time is spent searching for equipment Fragmented processes waste millions in capital and expense dollars and consume thousands of hours of staff time 14
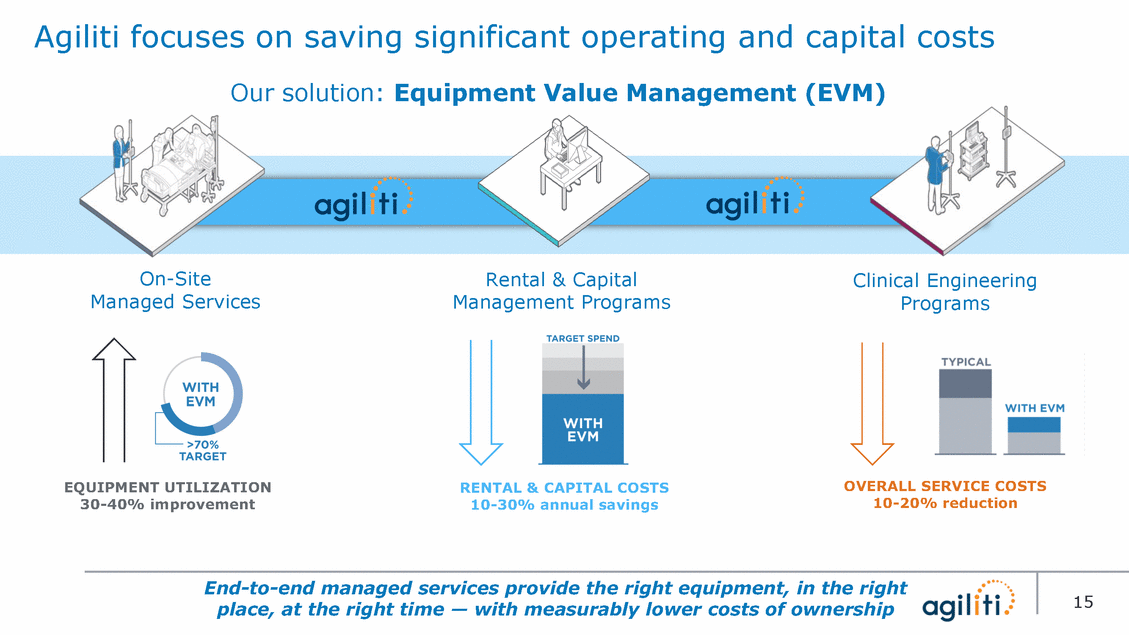
Agiliti focuses on saving significant operating and capital (EVM) costs Our solution: Equipment Value Management On-Site Managed Services Rental & Capital Management Programs Clinical Engineering Programs OVERALL SERVICE COSTS 10-20% reduction EQUIPMENT UTILIZATION 30-40% improvement RENTAL & CAPITAL COSTS 10-30% annual savings End-to-end managed services provide the right equipment, in the right place, at the right time — with measurably lower costs of ownership 15
Expanding share of wallet — EVM CASE STUDY • A large academic health care system that includes a 484-bed, Level-1 trauma acute care hospital, and outpatient and primary care clinics; located in the Midwest • $1.5M in first year savings: On pace to exceed the five-year goal of more than $5M in savings to customer $284K in capital avoidance through UHS advisory services Improved regulatory compliance as demonstrated by 100% device Preventative Maintenance Completion: Regulatory visits within 8-months of go-live found zero nonconformance issues or opportunities for improvement • • • Difficulty with equipment management, nurse satisfaction, rising costs, and regulatory compliance Limited visibility to key data and analytics around total cost of equipment ownership and equipment utilization • • Leveraged success of on-site program to extend relationship to comprehensive UHS solution set • Added Clinical Engineering in Q2 2017 • Added SES business in Q2 2018 • • 16-year customer of equipment rental services Demonstrated the value of a connected equipment management solution through our EVM framework Implemented On-Site Equipment Management Program in Q4 2016 Implemented fully outsourced CES Program in Q2 2017 • $8.4 $10.0 • $5.0 $0.0 2016A 2017A LTM Q2 2018 16 $6.3 $0.3 Revenue ($M) Agiliti strategy and solution UHS benefits Customer challenge Impact to customer Customer overview Results Background
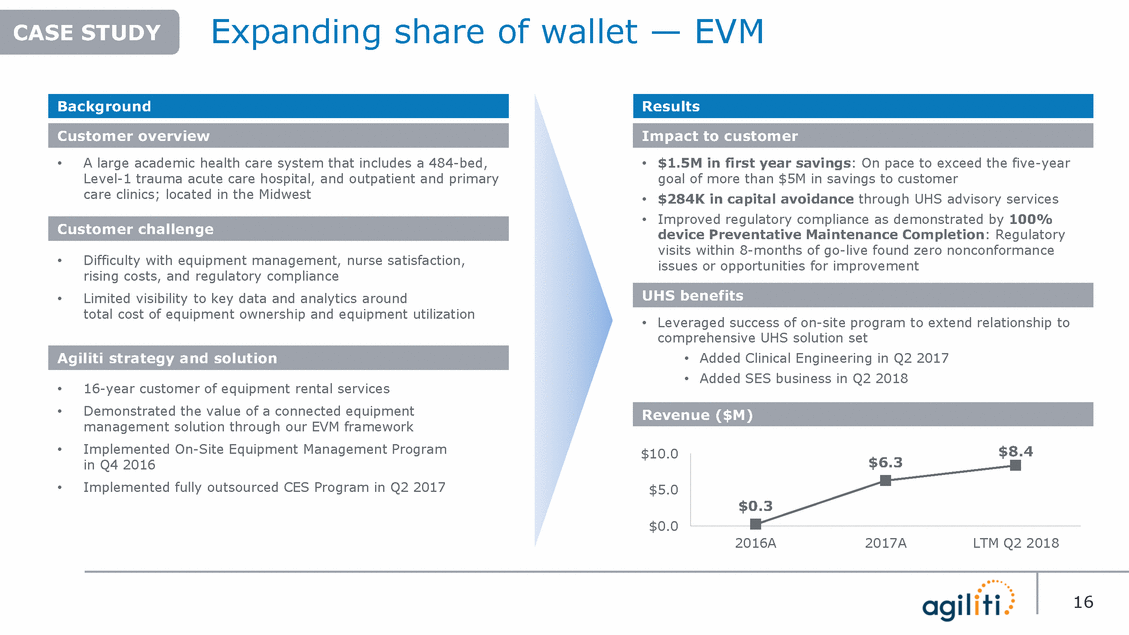
We enjoy a large and expanding market with a growth… long runway for future In-House vs Outsourced Market $12B1 U.S. market opportunity Agiliti participates in a Currently, more than $4.8B2 is contracted annually across Equipment Solutions, On-site Managed Services, and Clinical Engineering Services LTM June 2018, Agilti generated $539M in revenue, capturing just 11%3 of the current market Agiliti enjoys 16%4 share-of-wallet in its customer base, with significant opportunity for sustained above-market growth 4 UHS historical revenue divided by annual contracted market in UHS customer base ($539M/3.3B). 1 Combined McKinsey, iData Research, UHS. 2 Combined McKinsey, iData Research, public filings, UHS. 3 UHS historical revenue divided by annual contracted market ($539M/4.8B). 17 $12B U.S. market opportunity $4.8B is contracted annually Contracted revenue in Customer base $3.3B $539M Agiliti Revenue
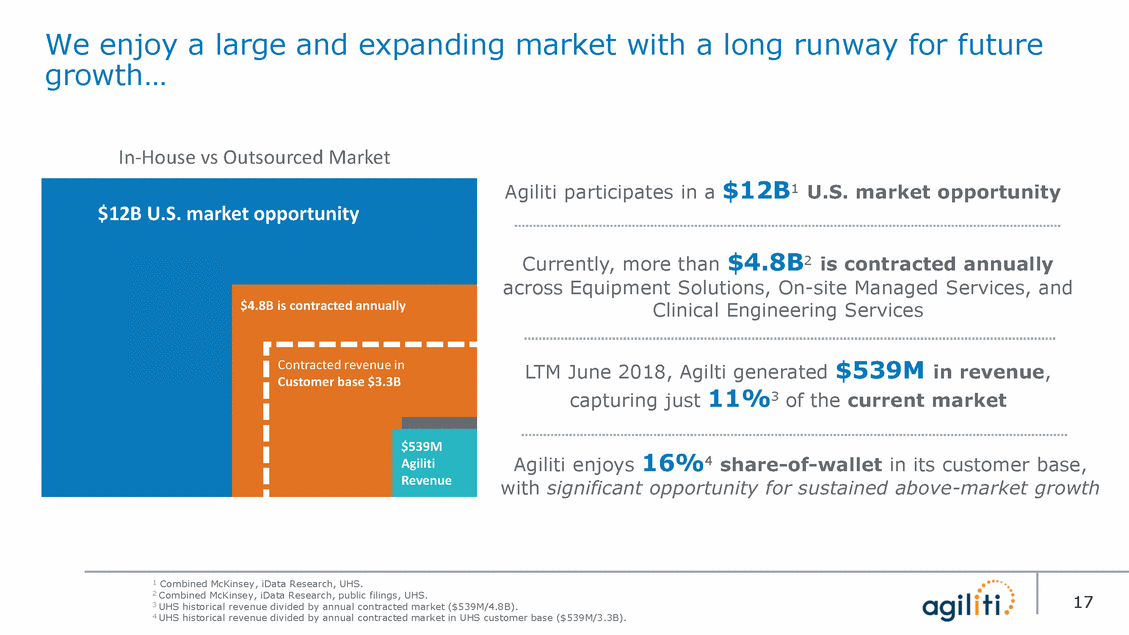
…and the market opportunity is most significant in low-capital intensity services, where we have focused our strategy. In-House vs Outsourced Market Market Size by Solution $12B U.S. market opportunity $4.8B is contracted annually Contracted revenue in Customer base $3.3B $539M Agiliti Revenue 3 McKinsey 1 Internal 2 PNR Internal analysis; SES (beds) estimated from iData Research report estimating approx. $1.1B ($760M – Rental Acute, $326M Rental non-acute); Internal Analysis 18 $12B U.S. market opportunity Clinical Engineering Solutions ~$9.5B3 Onsite Managed Services ~$1B1 Equipment Solutions ~$1.5B2
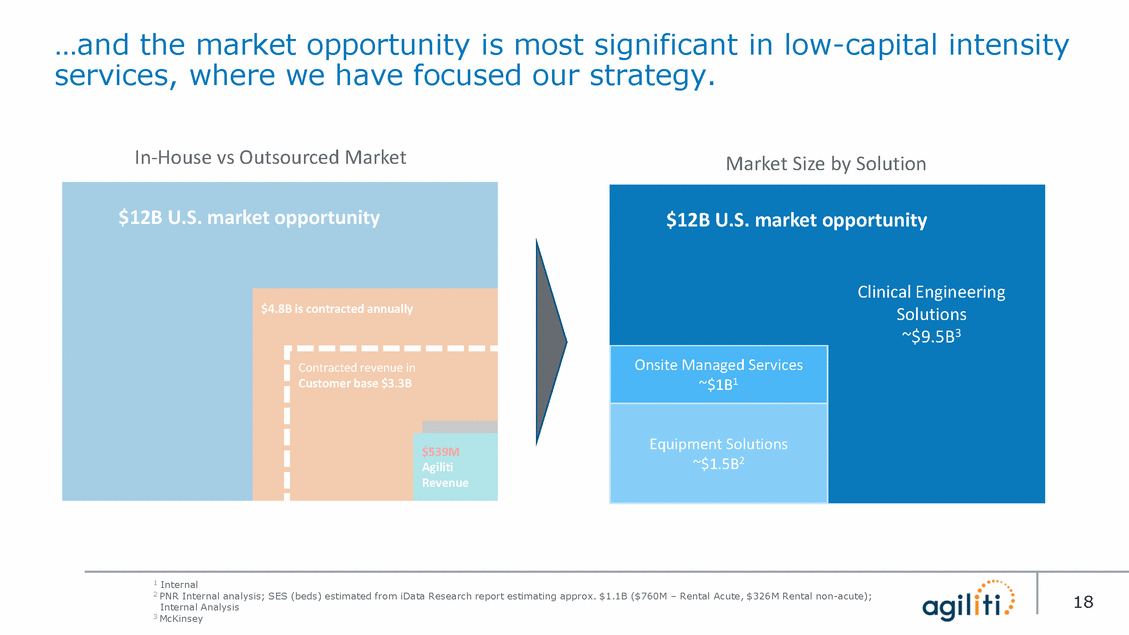
Agiliti is well positioned for category leadership DIFFERENTIATORS Clinical Engineering Programs National in-market service & logistics footprint Flexible Technician Labor Force Onsite Managed Programs Equipment Rental Programs ISO 13485:2016 Certified Device Vendor Agnostic Diversified manufacturers GE, Siemens… Hill-Rom, Joerns… Diversified services Sodexo, Crothall… Niche companies Freedom Medical, US Med-Equip… Trimedx, BC Technical… Comparison based on publicly available information Partial 19 EQUIPMENT VALUE MANAGEMENT
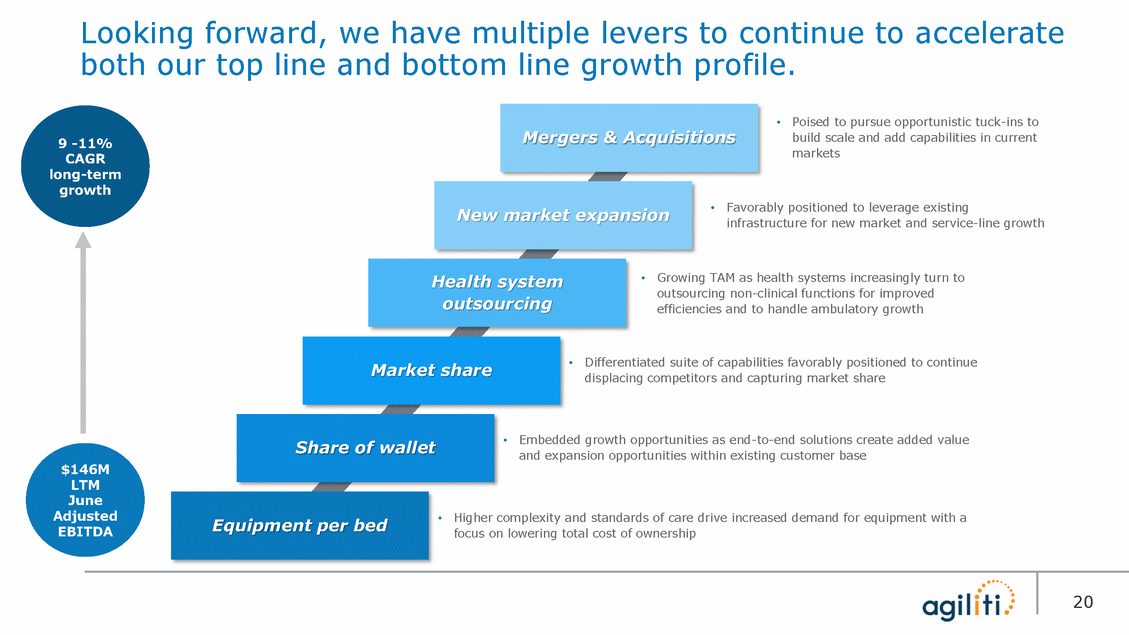
Looking forward, we have multiple levers to continue to accelerate both our top line and bottom line growth profile. •Poised to pursue opportunistic tuck-ins to build scale and add capabilities in current markets 9 -11% CAGR long-term growth •Favorably positioned to leverage existing infrastructure for new market and service-line growth •Growing TAM as health systems increasingly turn to outsourcing non-clinical functions for improved efficiencies and to handle ambulatory growth • Differentiated suite of capabilities favorably positioned to continue displacing competitors and capturing market share • Embedded growth opportunities as end-to-end solutions create added value and expansion opportunities within existing customer base $146M LTM June Adjusted EBITDA •Higher complexity and standards of care drive increased demand for equipment with a focus on lowering total cost of ownership 20 Equipment per bed Share of wallet Market share Health system outsourcing New market expansion Mergers & Acquisitions
Company results Key financial and operational metrics
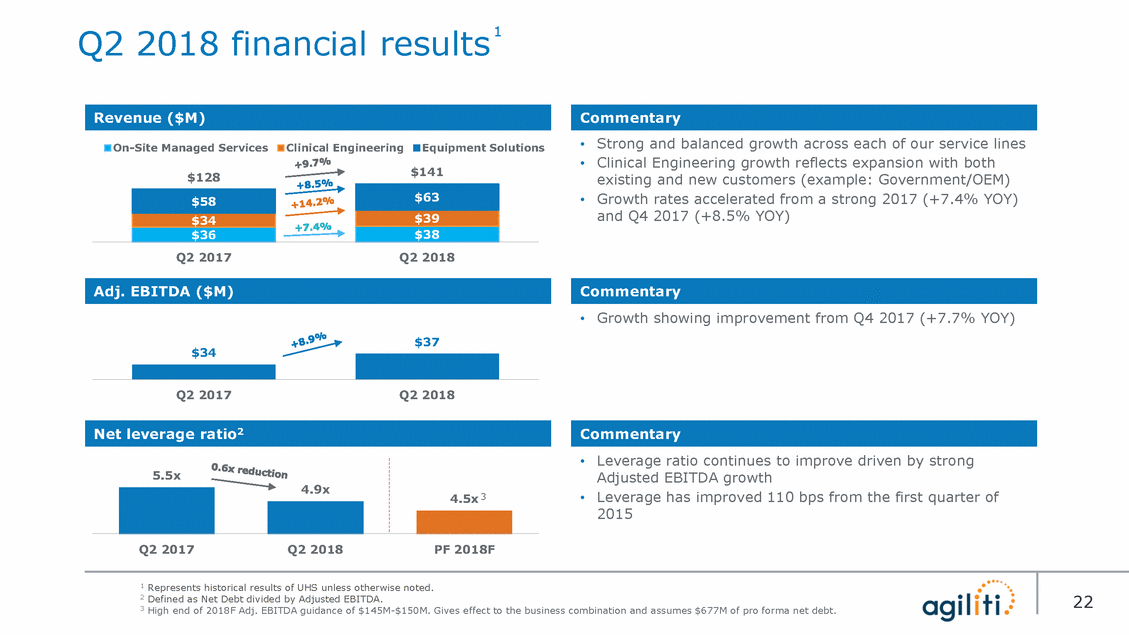
1 Q2 2018 financial results Strong and balanced growth across each of our service lines Clinical Engineering growth reflects expansion with both existing and new customers (example: Government/OEM) Growth rates accelerated from a strong 2017 (+7.4% YOY) and Q4 2017 (+8.5% YOY) • • On-Site Managed Services Clinical EngineeringEquipment Solutions $141 $128 • Q2 2017 Q2 2018 • Growth showing improvement from Q4 2017 (+7.7% YOY) $37 $34 Q2 2017 Q2 2018 • Leverage ratio continues to improve driven by strong Adjusted EBITDA growth Leverage has improved 110 bps from the first quarter of 2015 • Q2 2017 Q2 2018 PF 2018F 1 Represents historical results of UHS unless otherwise noted. 2 Defined as Net Debt divided by Adjusted EBITDA. 3 High end of 2018F Adj. EBITDA guidance of $145M-$150M. Gives effect to the business combination and assumes $677M of pro forma net debt. 22 5.5x 4.5x 3 4.9x Commentary Net leverage ratio2 Commentary Adj. EBITDA ($M) $63 $58 $39 $34 $36 $38 Commentary Revenue ($M)
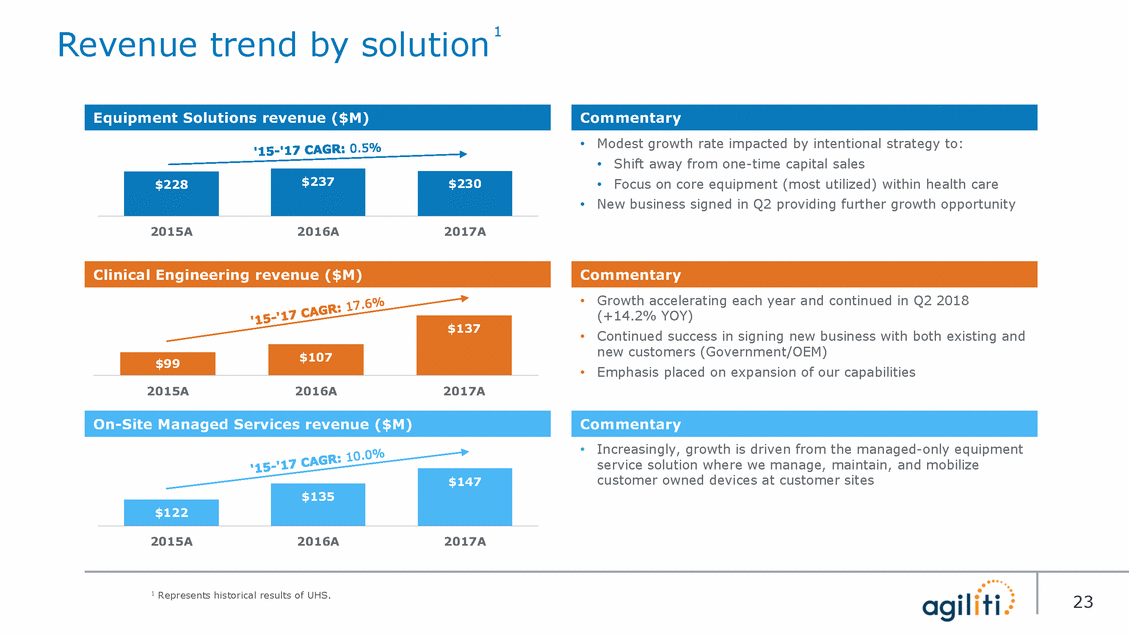
1 Revenue trend by solution • Modest growth rate impacted by intentional strategy to: •Shift away from one-time capital sales •Focus on core equipment (most utilized) within health care New business signed in Q2 providing further growth opportunity $228 • 2015A 2016A 2017A Growth accelerating each year and continued in Q2 2018 (+14.2% YOY) Continued success in signing new business with both existing and new customers (Government/OEM) Emphasis placed on expansion of our capabilities • • • 2015A 2016A 2017A • Increasingly, growth is driven from the managed-only equipment service solution where we manage, maintain, and mobilize customer owned devices at customer sites 2015A 2016A 2017A 1 Represents historical results of UHS. 23 $147 $135 $122 Commentary On-Site Managed Services revenue ($M) $137 $107 $99 Commentary Clinical Engineering revenue ($M) $237 $230 Commentary Equipment Solutions revenue ($M)
EBITDA – Accrual CapEx detail1 Adjusted EBITDA and Adjusted • Revenue growth in all three service lines driving Adjusted EBITDA growth Q2’18 Adjusted EBITDA accelerated +8.9% YOY $1502 • • $130 SG&A expenses well positioned for continued leverage $123 2015A 2016A 2017A 2018F • Adjusted EBITDA – Accrual CapEx growing at double digit rates with capital expenditures declining as a percentage of revenue as we pivot toward a higher mix of clinical engineering and the managed-only portion of on-site managed services 3 $100 2015A 2016A 2017A 2018F 3 High end of 2018F Adj. EBITDA guidance of $145M-$150M and midpoint of Capex guidance of $45M-$55M, consistent with historical guidance provided in Q2 2018 earnings presentation. See Annex A for reconciliation of net income to Adjusted EBITDA and a reconciliation of cash used in investing activities to accrual CapEx under GAAP. 1 Represents historical results of UHS. 2 High end of 2018F Adj. EBITDA guidance of $145M-$150M. 24 $88 $68$72 Adj. EBITDA – Accrual CapEx ($M) Commentary $138 Adj. EBITDA ($M) Commentary
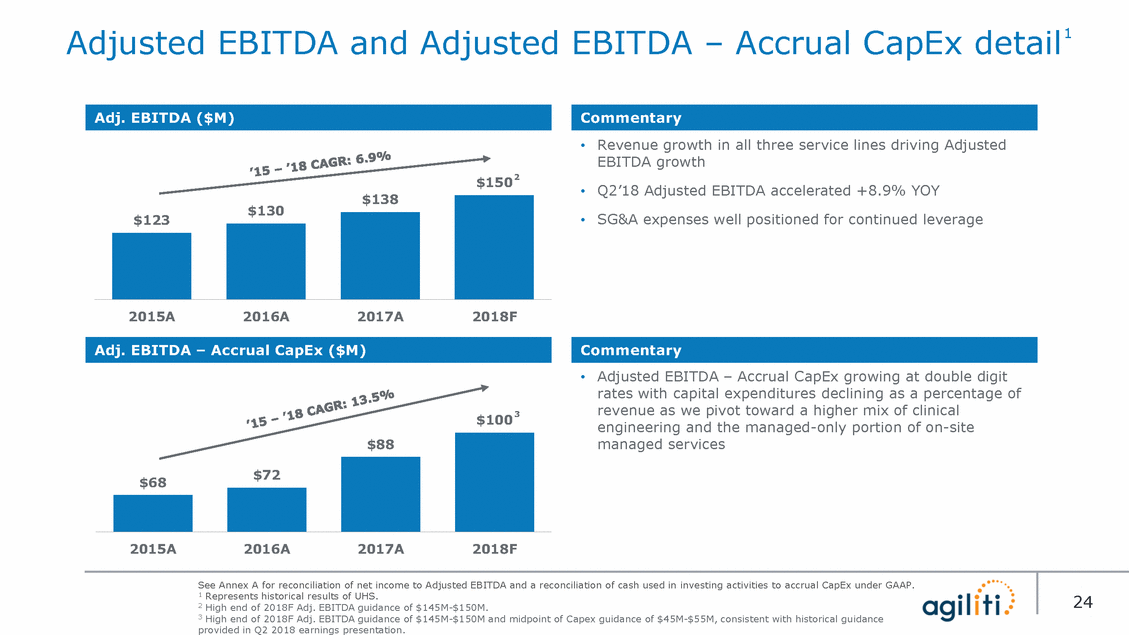
Financial guidance Guidance Guidance Revenue Growth 9 – 11% 9 – 11% Adjusted EBITDA $145 – 150M $165 – 170M 0.4x to 0.6x deleveraging 1 PF Net Leverage Ratio 4.5x 1 Gives effect to the business combination and assumes $677M of pro forma net debt. Financial guidance is subject to change. None of FSAC, UHS or Agiliti is under any obligation to update this financial guidance. See “Important Information” at the beginning of this presentation. 25 $M20182019
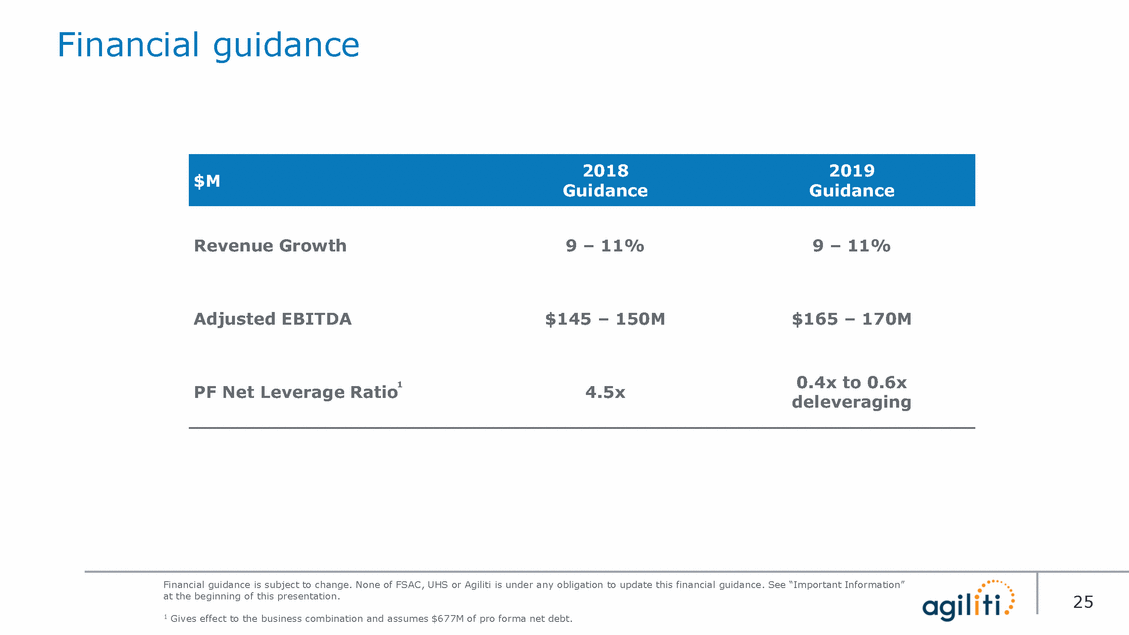
Bookings1 LTM Bookings by quarter New Management Team 100%+ LTM Bookings growth over the last 3 years $85 32%+ LTM Bookings growth vs prior LTM period $65 We continue gaining market momentum $45 $25 Q3 '15 Q4 '15 Q1 '16 Q2 '16 Q3 '16 Q4 '16 Q1 '17 Q2 '17 Q3 '17 Q4 '17 Q1 '18 Q2 '18 1 LTM Bookings is defined as the trailing 4 quarters of Bookings, with a Booking defined as the 1-year value of a new customer contract. Excludes renewal contracts, one-time sales, and the remaining value of a contract beyond its initial 12 months. These figures are estimates, the metric is not a GAAP measure, and is utilized as an internal metric to track sales team performance. Agiliti does not intend to make public bookings disclosures in the future. 26
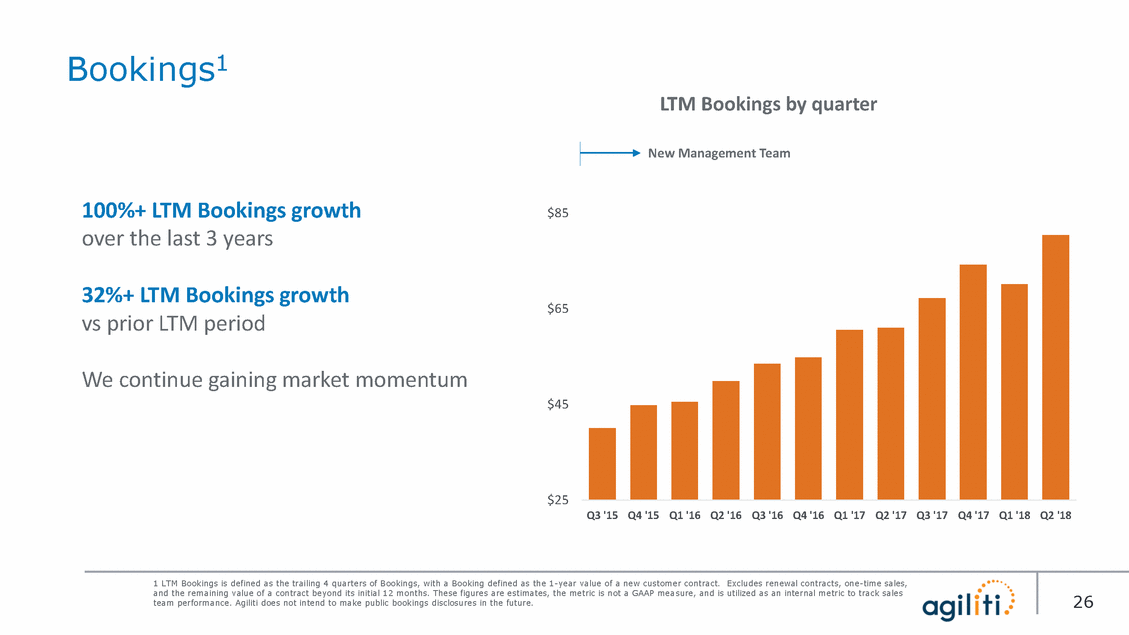
Recurring Revenue Annual customer revenue attrition1 New Management Team 95%+ Annually recurring revenue Agiliti is experiencing less than 5% average annual customer revenue loss1, a healthy trend that is expected to continue '14 '15 16 '17 '18 Q2 LTM 1 Defined as a customer that had revenue in the prior year but has zero revenue in the current year; Excludes one-time sales 27 7.8% 6.6% 4.8% 4.4% 4.2%
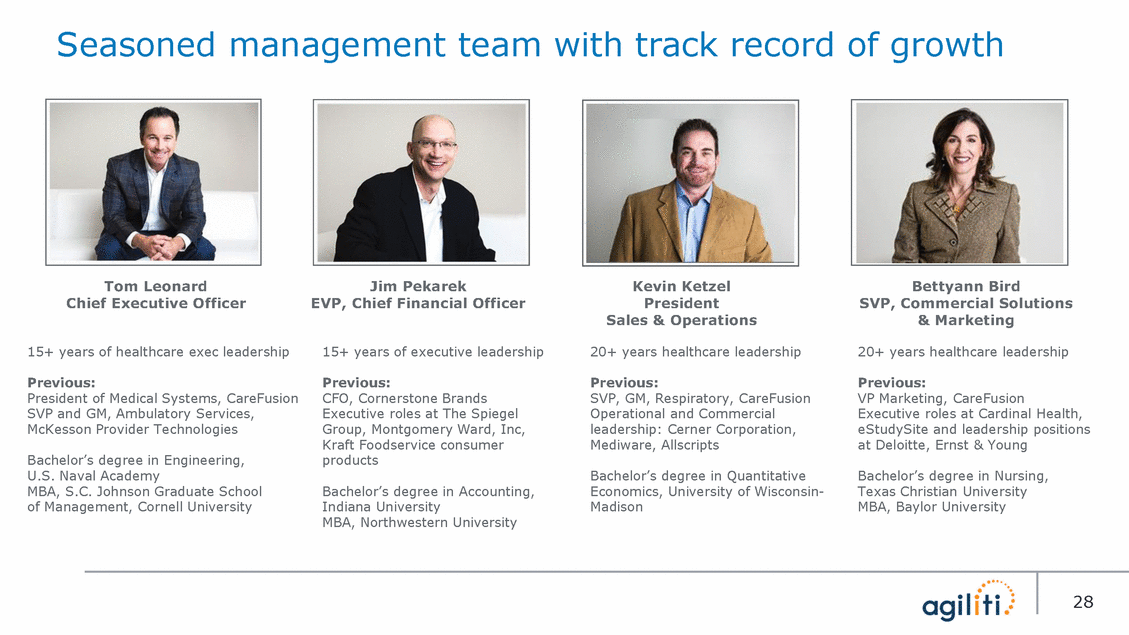
Seasoned management team with track record of growth Tom Leonard Chief Executive Officer Jim Pekarek EVP, Chief Financial Officer Kevin Ketzel President Sales & Operations Bettyann Bird SVP, Commercial Solutions & Marketing 15+ years of healthcare exec leadership 15+ years of executive leadership 20+ years healthcare leadership 20+ years healthcare leadership Previous: President of Medical Systems, CareFusion SVP and GM, Ambulatory Services, McKesson Provider Technologies Previous: CFO, Cornerstone Brands Executive roles at The Spiegel Group, Montgomery Ward, Inc, Kraft Foodservice consumer products Previous: SVP, GM, Respiratory, CareFusion Operational and Commercial leadership: Cerner Corporation, Mediware, Allscripts Previous: VP Marketing, CareFusion Executive roles at Cardinal Health, eStudySite and leadership positions at Deloitte, Ernst & Young Bachelor’s degree in Engineering, U.S. Naval Academy MBA, S.C. Johnson Graduate School of Management, Cornell University Bachelor’s degree in Quantitative Economics, University of Wisconsin-Madison Bachelor’s degree in Nursing, Texas Christian University MBA, Baylor University Bachelor’s degree in Accounting, Indiana University MBA, Northwestern University 28
Investment highlights Agiliti is the leading provider of end-to-end medical equipment solutions across the health care delivery continuum • Large and growing market, driven by increased medical equipment at the patient bedside and fragmented processes within increasingly complex delivery systems Highly differentiated value proposition aligned with imperative to reduce costs and improve delivery of patient care Unmatched operational infrastructure with nationwide footprint across all major health care markets Long runway for organic growth with new business and share-of-wallet opportunities among existing customers Clear path to augmenting strong organic growth profile with tuck-in and strategic M&A opportunities Attractive financial profile, with highly visible, recurring revenue, and accelerating cash generation Experienced and proven management team • • • • • • 29
Thank you.

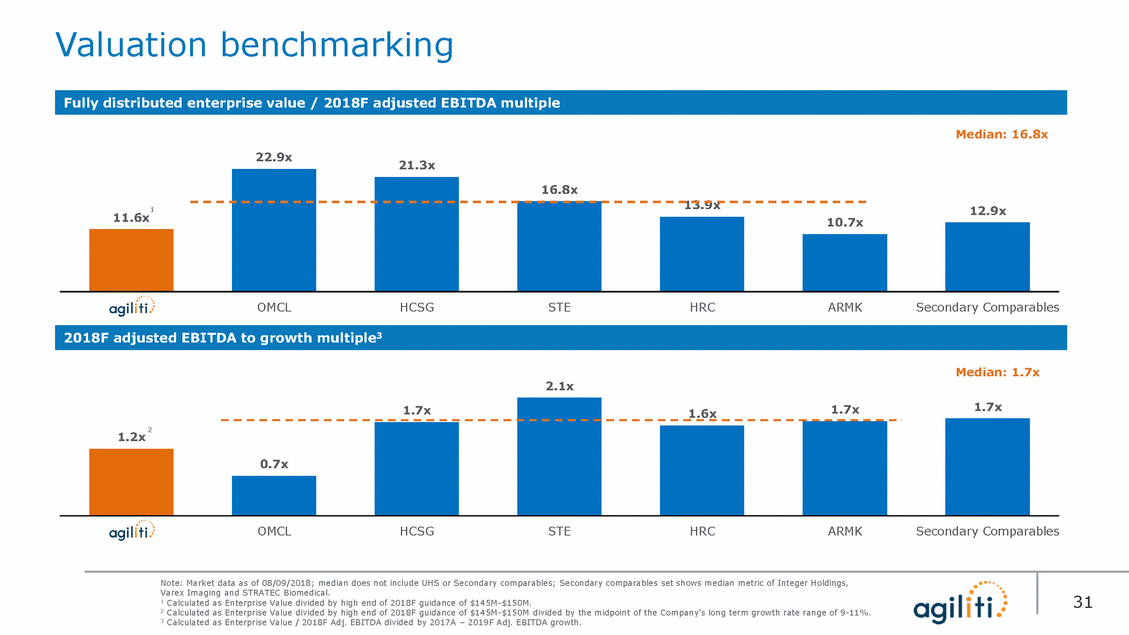
Valuation benchmarking Median: 16.8x 22.9x 21.3x UHS OMCL HCSG STE HRC ARMK Secondary Comparables Median: 1.7x 2.1x 1.2x UHS OMCL HCSG STE HRC ARMK Secondary Comparables 2 Calculated as Enterprise Value divided by high end of 2018F guidance of $145M-$150M divided by the midpoint of the Company’s long term growth rate range of 9-11%. 3 Calculated as Enterprise Value / 2018F Adj. EBITDA divided by 2017A – 2019F Adj. EBITDA growth. Note: Market data as of 08/09/2018; median does not include UHS or Secondary comparables; Secondary comparables set shows median metric of Integer Holdings, Varex Imaging and STRATEC Biomedical. 1 Calculated as Enterprise Value divided by high end of 2018F guidance of $145M-$150M. 31 2 1.7x 1.6x1.7x 1.7x 0.7x 2018F adjusted EBITDA to growth multiple3 1 11.6x 12.9x 16.8x 13.9x 10.7x Fully distributed enterprise value / 2018F adjusted EBITDA multiple
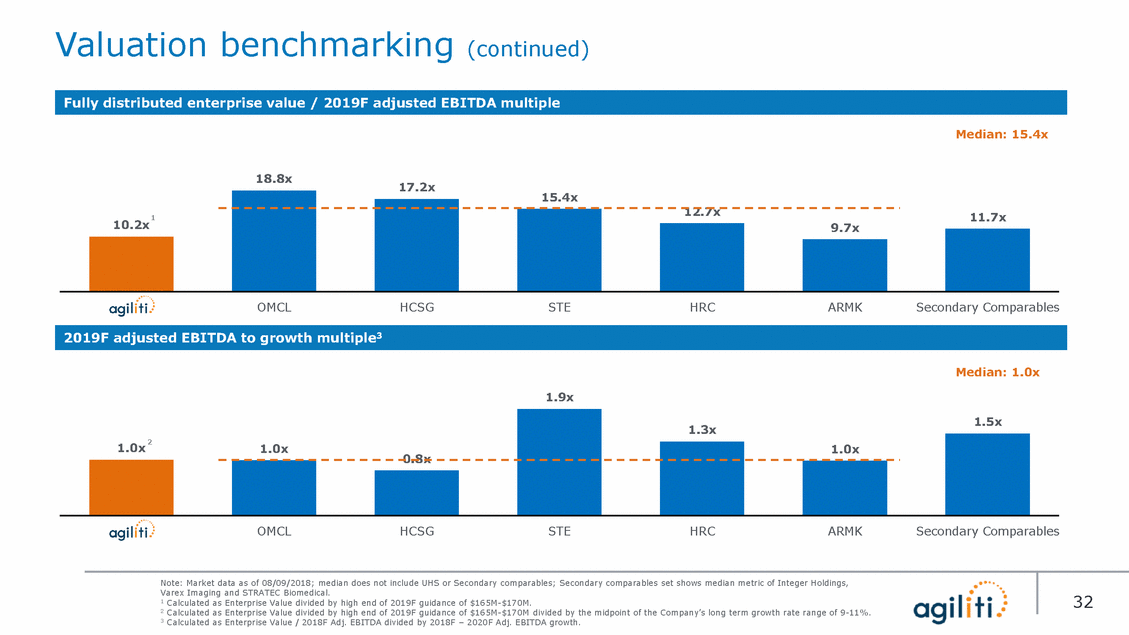
Valuation benchmarking (continued) Median: 15.4x 18.8x 17.2x 15.4x UHS OMCL HCSG STE HRC ARMK Secondary Comparables Median: 1.0x 1.9x 0.8x UHS OMCL HCSG STE HRC ARMK Secondary Comparables 2 Calculated as Enterprise Value divided by high end of 2019F guidance of $165M-$170M divided by the midpoint of the Company’s long term growth rate range of 9-11%. 3 Calculated as Enterprise Value / 2018F Adj. EBITDA divided by 2018F – 2020F Adj. EBITDA growth. Note: Market data as of 08/09/2018; median does not include UHS or Secondary comparables; Secondary comparables set shows median metric of Integer Holdings, Varex Imaging and STRATEC Biomedical. 1 Calculated as Enterprise Value divided by high end of 2019F guidance of $165M-$170M. 32 2 1.0x 1.0x 1.3x 1.5x 1.0x 2019F adjusted EBITDA to growth multiple3 1 10.2x 11.7x 12.7x 9.7x Fully distributed enterprise value / 2019F adjusted EBITDA multiple
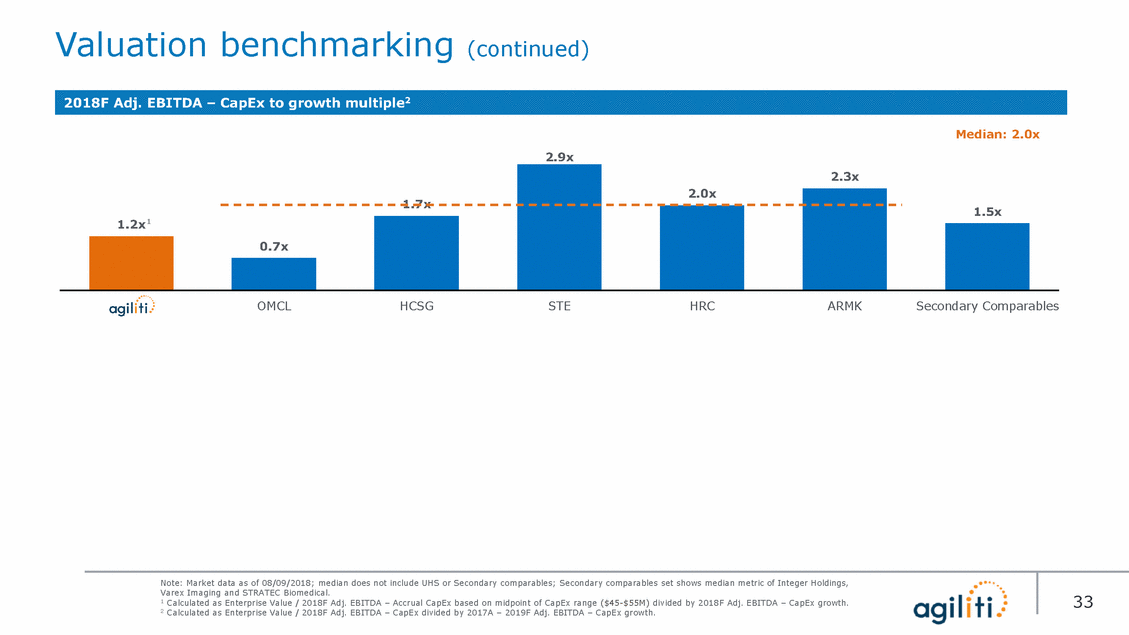
Valuation benchmarking (continued) Median: 2.0x 2.9x 1.7x UHS OMCL HCSG STE HRC ARMK Secondary Comparables 2 Calculated as Enterprise Value / 2018F Adj. EBITDA – CapEx divided by 2017A – 2019F Adj. EBITDA – CapEx growth. Note: Market data as of 08/09/2018; median does not include UHS or Secondary comparables; Secondary comparables set shows median metric of Integer Holdings, Varex Imaging and STRATEC Biomedical. 1 Calculated as Enterprise Value / 2018F Adj. EBITDA – Accrual CapEx based on midpoint of CapEx range ($45-$55M) divided by 2018F Adj. EBITDA – CapEx growth. 33 1.2x1 2.3x 1.5x 2.0x 0.7x 2018F Adj. EBITDA – CapEx to growth multiple2
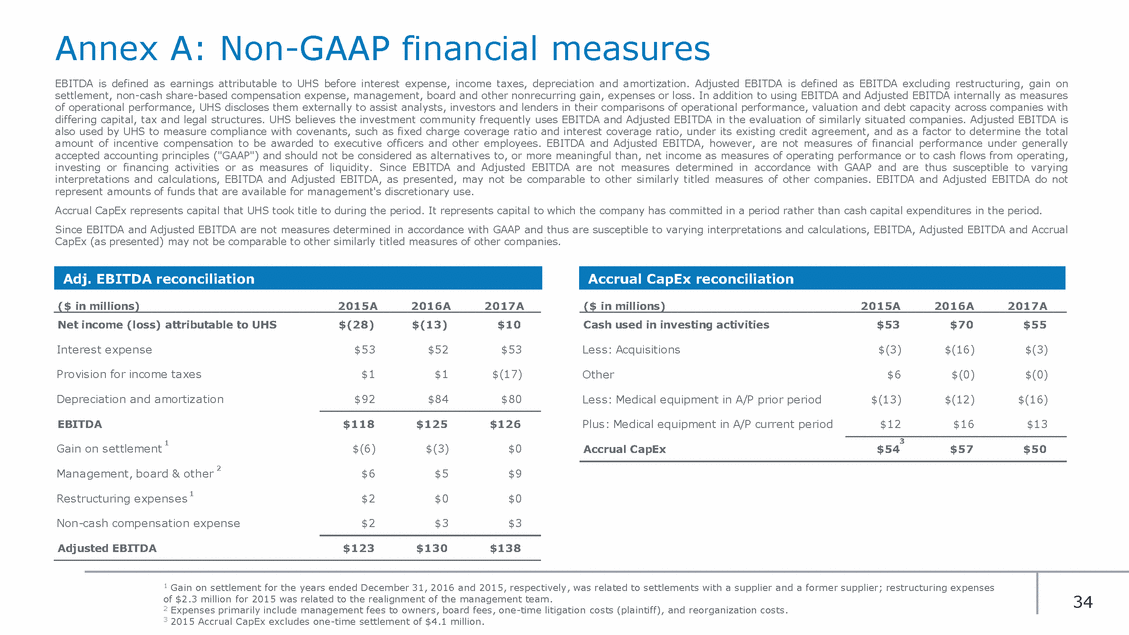
Annex A: Non-GAAP financial measures EBITDA is defined as earnings attributable to UHS before interest expense, income taxes, depreciation and amortization. Adjusted EBITDA is defined as EBITDA excluding restructuring, gain on settlement, non-cash share-based compensation expense, management, board and other nonrecurring gain, expenses or loss. In addition to using EBITDA and Adjusted EBITDA internally as measures of operational performance, UHS discloses them externally to assist analysts, investors and lenders in their comparisons of operational performance, valuation and debt capacity across companies with differing capital, tax and legal structures. UHS believes the investment community frequently uses EBITDA and Adjusted EBITDA in the evaluation of similarly situated companies. Adjusted EBITDA is also used by UHS to measure compliance with covenants, such as fixed charge coverage ratio and interest coverage ratio, under its existing credit agreement, and as a factor to determine the total amount of incentive compensation to be awarded to executive officers and other employees. EBITDA and Adjusted EBITDA, however, are not measures of financial performance under generally accepted accounting principles ("GAAP") and should not be considered as alternatives to, or more meaningful than, net income as measures of operating performance or to cash flows from operating, investing or financing activities or as measures of liquidity. Since EBITDA and Adjusted EBITDA are not measures determined in accordance with GAAP and are thus susceptible to varying interpretations and calculations, EBITDA and Adjusted EBITDA, as presented, may not be comparable to other similarly titled measures of other companies. EBITDA and Adjusted EBITDA do not represent amounts of funds that are available for management's discretionary use. Accrual CapEx represents capital that UHS took title to during the period. It represents capital to which the company has committed in a period rather than cash capital expenditures in the period. Since EBITDA and Adjusted EBITDA are not measures determined in accordance with GAAP and thus are susceptible to varying interpretations and calculations, EBITDA, Adjusted EBITDA and Accrual CapEx (as presented) may not be comparable to other similarly titled measures of other companies. ($ in millions) 2015A 2016A 2017A ($ in millions) 2015A 2016A 2017A Net income (loss) attributable to UHS $(28) $(13) $10 Cash used in investing activities $53 $70 $55 Interest expense $53 $52 $53 Less: Acquisitions $(3) $(16) $(3) Provision for income taxes $1 $1 $(17) Other $6 $(0) $(0) Depreciation and amortization $92 $84 $80 Less: Medical equipment in A/P prior period $(13) $(12) $(16) EBITDA $118 $125 $126 Plus: Medical equipment in A/P current period $12 $16 $13 3 $54 1 Gain on settlement $(6) $(3) $0 Accrual CapEx $57 $50 2 Management, board & other Restructuring expenses 1 $6 $5 $9 $2 $0 $0 Non-cash compensation expense $2 $3 $3 Adjusted EBITDA $123 $130 $138 3 2015 Accrual CapEx excludes one-time settlement of $4.1 million. 1 Gain on settlement for the years ended December 31, 2016 and 2015, respectively, was related to settlements with a supplier and a former supplier; restructuring expenses of $2.3 million for 2015 was related to the realignment of the management team. 2 Expenses primarily include management fees to owners, board fees, one-time litigation costs (plaintiff), and reorganization costs. 34 Adj. EBITDA reconciliation Accrual CapEx reconciliation
