Attached files
| file | filename |
|---|---|
| EX-32.2 - EX-32.2 - Agiliti Health, Inc. | a09-36116_1ex32d2.htm |
| EX-31.1 - EX-31.1 - Agiliti Health, Inc. | a09-36116_1ex31d1.htm |
| EX-31.2 - EX-31.2 - Agiliti Health, Inc. | a09-36116_1ex31d2.htm |
| EX-32.1 - EX-32.1 - Agiliti Health, Inc. | a09-36116_1ex32d1.htm |
| EX-12.1 - EX-12.1 - Agiliti Health, Inc. | a09-36116_1ex12d1.htm |
| EX-10.21 - EX-10.21 - Agiliti Health, Inc. | a09-36116_1ex10d21.htm |
UNITED STATES
SECURITIES AND EXCHANGE COMMISSION
Washington, D. C. 20549
FORM 10-K
(Mark One)
x Annual Report pursuant to Section 13 or 15(d) of the Securities Exchange Act of 1934
for the fiscal year ended December 31, 2009
or
o Transition report pursuant to Section 13 or 15(d) of the Securities Exchange Act of 1934
for the transition period from to .
Commission File Number: 000-20086
UNIVERSAL HOSPITAL SERVICES, INC.
(Exact name of registrant as specified in its charter)
|
Delaware |
|
41-0760940 |
|
(State or other jurisdiction of |
|
(I.R.S. Employer |
|
incorporation or organization) |
|
Identification No.) |
7700 France Avenue South, Suite 275
Edina, Minnesota 55435-5228
(Address of principal executive offices, including zip code)
(952) 893-3200
(Registrant’s telephone number, including area code)
Securities registered pursuant to Section 12(b) of the Act: None
Securities registered pursuant to Section 12(g) of the Act: None
Indicate by check mark if the registrant is a well-known seasoned issuer, as defined in Rule 405 of the Securities Act. Yes o No x
Indicate by check mark if the registrant is not required to file reports pursuant to Section 13 or Section 15(d) of the Act. Yes x No o
Indicate by check mark whether the registrant (1) has filed all reports required to be filed by Section 13 or 15(d) of the Securities Exchange Act of 1934 during the preceding 12 months (or for such shorter period that the registrant was required to file such reports), and (2) has been subject to such filing requirements for the past 90 days. Yes o No x
Indicate by check mark whether the registrant has submitted electronically and posted on its corporate Web site, if any, every Interactive Data File required to be submitted and posted pursuant to Rule 405 of Regulation S-T (Section 232.405 of this chapter) during the preceding 12 months (or for such shorter period that the registrant was required to submit and post such files). Yes o No x
Indicate by check mark if disclosure of delinquent filers pursuant to Item 405 of Regulation S-K (Section 229.405 of this chapter) is not contained herein, and will not be contained, to the best of registrant’s knowledge, in definitive proxy or information statements incorporated by reference in Part III of this Form 10-K or any amendment to this Form 10-K. x
Indicate by check mark whether the registrant is a large accelerated filer, an accelerated filer, a non-accelerated filer or a smaller reporting company. See the definitions of “large accelerated filer,” “accelerated filer” and “smaller reporting company” in Rule 12b-2 of the Exchange Act (Check one):
|
Larger accelerated filer o |
|
Accelerated filer o |
|
|
|
|
|
Non-accelerated filer x |
|
Smaller reporting company o |
|
(Do not check if a smaller reporting company) |
|
|
Indicate by check mark whether the registrant is a shell company (as defined in Rule 12b-2 of the Exchange Act). Yes o No x
The number of shares of common stock, $.01 par value, outstanding as of March 1, 2010 was 1,000.
DOCUMENTS INCORPORATED BY REFERENCE
None.
UNIVERSAL HOSPITAL SERVICES, INC.
|
|
|
PAGE |
|
|
|
|
|
1 |
||
|
20 |
||
|
30 |
||
|
30 |
||
|
30 |
||
|
ITEM 4 |
Reserved |
|
|
|
|
|
|
31 |
||
|
31 |
||
|
Management’s Discussion and Analysis of Financial Condition and Results of Operations |
35 |
|
|
66 |
||
|
67 |
||
|
Changes in and Disagreements with Accountants on Accounting and Financial Disclosure |
68 |
|
|
68 |
||
|
69 |
||
|
|
|
|
|
69 |
||
|
78 |
||
|
Security Ownership of Certain Beneficial Owners and Management and Related Stockholder Matters |
106 |
|
|
Certain Relationships, Related Transactions and Director Independence |
109 |
|
|
110 |
||
|
|
|
|
|
111 |
ITEM 1: Business
OUR COMPANY
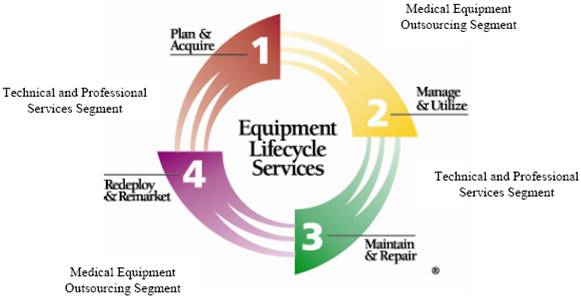
Universal Hospital Services, Inc. (“we”, “our”, “us”, the “Company”, or “UHS”) is a leading nationwide provider of medical equipment outsourcing and lifecycle solutions to the United States health care industry. Our customers include national, regional and local acute and long term acute care hospitals, alternate site providers (such as long term acute care hospitals, skilled nursing facilities, specialty hospitals, nursing homes, and home care providers) and medical equipment manufacturers. We provide our customers solutions across the spectrum of the equipment life cycle as a result of our position as one of the industry’s largest purchasers and outsourcers of medical equipment. During the year ended December 31, 2009, we owned or managed over 520,000 pieces of medical equipment consisting of 330,000 owned or managed pieces in our Medical Equipment Outsourcing segment and 190,000 pieces of customer owned equipment we managed in our Technical and Professional Services segment. Our diverse medical equipment outsourcing customer base includes more than 4,200 acute care hospitals and approximately 4,250 alternate site providers. We also have relationships with more than 200 medical equipment manufacturers and many of the nation’s largest group purchasing organizations (“GPOs”) and many of the integrated delivery networks (“IDNs”). All of our solutions leverage our nationwide network of 84 offices and our more than 70 years of experience managing and servicing all aspects of medical equipment. Our fees are paid directly by our customers rather than from direct reimbursement from third-party payors, such as private insurers, Medicare, or Medicaid. We commenced operations in 1939, originally incorporated in Minnesota in 1954 and reincorporated in Delaware in 2001.
As one of the nation’s leading medical equipment lifecycle solutions companies, we design and offer comprehensive solutions for our customers that help reduce capital and operating expenses, increase equipment and staff productivity and support improved patient safety and outcomes.
We report our financial results in three segments to reflect how we manage our business. Our reporting segments consist of Medical Equipment Outsourcing, Technical and Professional Services, and Medical Equipment Sales and Remarketing. We evaluate the performance of our reporting segments based on gross margin and gross margin, before purchase accounting adjustments. The accounting policies of the individual reporting segments are the same as those of the entire company. Our revenue, profits, and assets for our reporting segments for the prior three years are described in “Item 6 — Selected Financial Data.”
On May 31, 2007, UHS Holdco, Inc. (“Parent”) acquired all of the outstanding capital stock of the Company for approximately $712.0 million in cash less debt, tender premium and accrued interest and capitalized leases per the terms of the Agreement and Plan of Merger, dated as of April 15, 2007, by and among the Company, Parent and Parent’s wholly owned subsidiary (“Merger Sub”), and related documents which resulted in the occurrence of the events outlined in Note 3 to our audited financial statements in Part IV of this Annual Report on Form 10-K which we collectively refer to as the “Transaction” or the “Acquisition.” Parent is owned by affiliates of Irving Place Capital Merchant Manager III, L.P. (formerly known as Bear Stearns Merchant Manager III, L.P.) and certain members of our management, whom we collectively refer to as the “equity investors.” Parent and Merger Sub are corporations that were formed, for the purpose of completing the Acquisition, by Bear Stearns Merchant Banking, which was affiliated with Bear Stearns & Co. Inc. and which became an independent firm on November 1, 2008, changing its name to Irving Place Capital (“IPC”).
In conjunction with the Acquisition, the Company initiated a cash tender offer to purchase its $260.0 million outstanding aggregate principal amount of its 10.125% Senior Notes due 2011, which the Company completed for $235.0 million of such notes on May 31, 2007, and Merger Sub issued $230.0 million in aggregate principal amount of its Floating Rate Notes due 2015 and $230.0 million in aggregate principal amount of its PIK Toggle Notes due 2015 (the PIK Toggle Notes and the Floating Rate Notes are collectively referred to as the “Notes”). Concurrently with the closing of the Acquisition, Merger Sub merged with and into the Company, which was the surviving corporation and the Company assumed Merger Sub’s obligations with respect to the Notes and related second lien senior indenture dated as of May 31, 2007, between us and Wells Fargo Bank, National Association, as trustee (“Second Lien Senior Indenture”).
In 2007, the Acquisition and the allocation of the purchase price to the opening balance sheet accounts of the Successor were recorded as of the beginning of the first day of our new accounting period (June 1, 2007).
Although the Company continued as the surviving legal entity after the Acquisition, the accompanying information presents our results preceding the Acquisition (“Predecessor”) and the periods following the Acquisition (“Successor”). All references to the years ended December 31, 2009 and 2008 and seven months ended December 31, 2007 refer to our Successor results. All references to the five months ended May 31, 2007 and year ended December 31, 2006 and 2005 refer to our Predecessor results.
Medical Equipment Outsourcing Segment - Manage & Utilize
Our flagship business is our Medical Equipment Outsourcing segment, which accounted for $232.6 million, or approximately 78.3%, of our revenues for the year ended December 31, 2009. This segment represented 77.4%, 76.6%, and 78.9%, of total revenue for the year ended December 31, 2008, the seven months ended December 31, 2007 and the five months ended May 31, 2007, respectively. During the year ended December 31, 2009 we owned or managed over 330,000 pieces in our Medical Equipment Outsourcing segment, primarily in the categories of respiratory therapy, newborn care, critical care, patient monitors, patient handling (such as beds, stretchers and wheelchairs), pressure area management (such as therapy surfaces) and wound therapy. Historically, we have purchased and owned directly the equipment used in our Medical Equipment Outsourcing programs. During 2007, we entered into “revenue sharing” agreements with a select few manufacturers of equipment where the manufacturers retain ownership of the equipment, but UHS takes possession and manages the rental of the equipment to customers. We may enter into more of such arrangements in the future. Such arrangements are less capital intensive for us. In January 2010, one of these agreements was modified such that the Company purchased the manufacturer’s equipment it had managed and the revenue share portion of the agreement was terminated.
We currently provide outsourcing services to more than 4,200 acute care hospitals and 4,250 alternate site providers in the United States, including some of the nation’s premier health care institutions.
We perform regular and preventative maintenance on the equipment and retain detailed records for documentation. We repair, test and clean the equipment. Our service includes prompt replacement of non-working equipment and the flexibility to upgrade technology as a customer’s product of choice changes. We have three primary outsourcing programs:
· Supplemental and Peak Needs Usage;
· Customized Outsourcing Agreements; and
· Asset Management Partnership Program (“AMPP”).
We have contracts in place with many the leading national GPOs for both the acute care and alternate site markets. We also have agreements directly with national acute care and alternate site providers. We expect much of our future growth in this segment to be driven by our customers outsourcing more of their medical equipment needs and taking full advantage of our diversified product offering, customized outsourcing agreements and AMPP programs.
Our Medical Equipment Outsourcing Programs provide a range of services for our customers:
· Supplemental and Peak Needs Usage. Our traditional equipment solution for customers is renting patient-ready, medical equipment on a supplemental or peak needs basis. Many of our customers have traditionally owned only the amounts and types of such equipment necessary to service their usual and customary patient census and their typical range of treatment offerings. Our customers rely on us to fulfill many of their equipment needs when they experience a spike or peak in patient census, do not have the resources to maintain their owned equipment in patient-ready condition or require equipment for less common treatments. We rent equipment on a daily, monthly or pay-per-use basis. Supplemental and peak needs activity is impacted by changes in hospital patient census and patient acuity, which typically fluctuate on a seasonal basis;
· Customized Outsourcing Agreements. We also offer our customers the opportunity to obtain medical equipment through tailored outsourcing agreements. By committing to a tailored outsourcing agreement, our customers are able to secure the availability of an identified pool of patient-ready equipment and to pay for it on a monthly, yearly or pay-per-use basis. We continue to maintain and repair the equipment during the term of the agreement; and
· Asset Management Partnership Programs. Our AMPP solution allows our customers to fully outsource the responsibilities and costs of effectively managing medical equipment at their facilities, with the added benefit of enhancing equipment utilization. With UHS asset management, equipment types and quantities are adjusted to meet changes in patient census and acuity. Our employees work at the customers’ sites to integrate our equipment management process and proprietary management software technology tools into the customers’ day-to-day operations. We assume full responsibility for having equipment where and when it is needed at the customer’s facility, removing equipment that is no longer in use and sanitizing, testing and repairing equipment as needed between each patient use. We also perform required training and ‘‘in service’’ sessions to keep our customers’ staffs fully-trained and knowledgeable about the use and operation of key equipment. As of December 31, 2009, we had 61 AMPP programs.
We believe that a multi-billion dollar market exists for these services, including the rental and management of medical equipment.
Our Medical Equipment Outsourcing Programs enable health care providers to replace the fixed costs of owning and/or leasing medical equipment with variable costs that are more closely related to their patient census and patient acuity. They also eliminate significant capital costs associated with equipment acquisitions and liability associated with equipment ownership. The increased flexibility and solutions provided to our customers allows them to:
· access our extensive data and expertise on the cost, performance, features and functions of all major items of medical equipment;
· increase productivity of available equipment;
· reduce maintenance and management costs through the use of our technology and knowledgeable outsourcing staff;
· increase the productivity and satisfaction of their nursing staff by allowing them to focus on primary patient care responsibilities, leading to lower attrition rates;
· reduce the risk of hospital-acquired infections;
· mitigate the risks and costs associated with product recalls or modifications;
· reduce equipment obsolescence risk; and
· facilitate compliance with regulatory and recordkeeping requirements and manufacturers’ specifications on tracking and maintenance of medical equipment.
Technical and Professional Services Segment — Plan & Acquire; Maintain & Repair
Our Technical and Professional Services segment accounted for $42.4 million, or approximately 14.2%, of our revenues for the year ended December 31, 2009. This segment represented 15.6%, 16.9% and 13.8% of total revenue for the year ended December 31, 2008, the seven months ended December 31, 2007 and the five months ended May 31, 2007, respectively. We leverage our over 70 years of experience and our extensive equipment database in repairing and maintaining medical equipment. We offer a broad range of inspection, preventative maintenance, repair, logistic and consulting services through our team of approximately 325 technicians and professionals located throughout the United States in our nationwide network of offices, and managed over 190,000 units of customer owned equipment during the year ended December 31, 2009. In addition, during the year ended December 31, 2009, we serviced over 330,000 units that we own or directly manage. As part of our strategy to grow our Technical and Professional Services segment, we acquired the assets of the ICMS division of Intellamed, Inc. on April 1, 2007.
Our Technical and Professional Services segment offerings provide a complementary alternative for customers that wish to own their medical equipment but lack the infrastructure, expertise, or scale to perform routine maintenance, repair, record keeping, and lifecycle analysis and planning functions.
Our technicians are trained and certified on a wide range of equipment on an ongoing basis directly by equipment manufacturers. Current certifications are maintained and technicians are cross trained to create valuable resources for our customers. We also operate a quality assurance department to develop and document our own quality standards for our equipment. We utilize proprietary recordkeeping software to record these services and the records we maintain meet the applicable standards of The Joint Commission, the National Fire Protection Association (“NFPA”) and the Food and Drug Administration (“FDA”). These maintenance records are available to our customers and to regulatory agencies to verify the maintenance of the equipment. We have three primary service programs:
· Supplemental Maintenance and Repair Services. We provide maintenance and repair services on a scheduled and unscheduled basis to supplement the customer’s current maintenance management practices. As part of the supplemental and repair services, we provide service documentation that supports the customer’s regulatory reporting requirements. Our maintenance and repair service offerings include fee-for-service arrangements, scheduled maintenance and inspection services, full service maintenance, inspection and repair services and vendor management services in which we manage the manufacturer and/or third-party vendors for service delivery, typically on laboratory and radiology equipment.
· Customized Health Care Asset Management Program (“CHAMP®”). We also provide full and part-time on site, resident-based equipment maintenance programs that deliver all the benefits of our supplemental maintenance and repair programs, but with the addition of a medical equipment management program. This is a coordinated management of customer owned equipment utilizing UHS employees, subcontractors, and a broad range of equipment management consulting services. As of December 31, 2009, we had 183 resident CHAMP programs within this segment.
· Consulting Services. We provide equipment consulting services as part of our other equipment management programs or as stand alone services. Some examples of our consulting services include technology baseline assessments, product comparison research and equipment utilization studies.
Customers
· Urban and Teaching Hospitals. We provide our services to large urban and teaching hospitals on a supplemental and fully outsourced basis. Our services are requested by in-house hospital biomedical departments on a supplemental basis because of our extensive expertise with a wide range of medical equipment. Our service offerings allow hospital staffed biomedical departments to meet the technical requirements and workload demands on their in-house departments.
· Small Hospitals and Critical Access Hospitals. We offer full lifecycle asset management solutions, including professional and technical services, to small hospitals (those with fewer than 150 beds) and Critical Access Hospitals. Critical Access Hospitals are rural community hospitals that receive cost-based Medicare reimbursement. These hospitals typically lack the scale and resources to create comprehensive capital plans, or to evaluate, acquire, manage, maintain, repair and dispose of medical equipment. With the CHAMP program we assume the complete responsibility for this process and consult with the hospital to create and implement this function.
· Alternate Site Providers. We offer our technical and repair services to alternate site providers (such long term acute care hospitals, skilled nursing facilities, specialty hospitals, nursing homes and home health care providers). Our national infrastructure and presence allows our national customers to eliminate a fragmented local approach to a systematic singular solution. Our nationwide service and repair network allows equipment to be efficiently repaired locally on site, or picked up and repaired in one of our local offices.
· Manufacturers. We provide our logistical and technical services to medical equipment manufacturers. Manufacturers utilize UHS to augment and support manufacturers’ current technical staffs that are experiencing service supply issues during peak needs, FDA recall issues or as a complete outsourced technical provider. Our offerings include equipment logistics, parts and demonstration management programs. Work is performed on a depot or on-site basis. UHS offerings include warranty repair, non-warranty repair, product recall, field upgrades, routine maintenance, onsite installation, and in-service education.
We contract with some GPOs to offer our Technical and Professional Services.
Medical Equipment Sales and Remarketing Segment - Redeploy & Remarket
Our Medical Equipment Sales and Remarketing segment accounted for $22.2 million, or approximately 7.5%, of our revenues for the year ended December 31, 2009. This segment represented 7.0%, 6.5%, and 7.3% of total revenue for the year ended December 31, 2008, the seven months ended December 31, 2007 and the five months ended May 31, 2007, respectively. This segment includes three distinct business activities:
· Medical Equipment Remarketing and Disposal. We are one of the nation’s largest buyers and sellers of pre-owned medical equipment. We buy, source, remarket and dispose of pre-owned medical equipment for our customers and for our own behalf. We provide our customers with the ability to sell their unneeded medical equipment for immediate cash or credit. We provide fair market value assessments and buy-out proposals on equipment the customer intends to trade in for equipment upgrades so that the customer can evaluate the manufacturers’ or alternative offers. Customers can also take advantage of our disposal services,
where we dispose of equipment that has no remaining economic value in a safe and environmentally appropriate manner.
We remarket pre-owned medical equipment to hospitals, alternate site providers, veterinarians and equipment brokers. This segment of our business focuses on providing solutions to customers that have capital budget dollars available to purchase equipment. We offer a wide range of equipment including equipment we use in our outsourcing programs and diagnostic, ultrasound and x-ray equipment.
· Specialty Medical Equipment Sales and Distribution. We use our national infrastructure to provide sales and distribution services to manufacturers of specialty medical equipment on a limited basis. Our distribution services include providing demonstrations services and product maintenance services. We act as a distributor for only a limited number of products that are particularly suited to our national distribution network or that fit with our ability to provide technical support. We currently sell equipment in selected product lines including, but not limited to, respiratory percussion vests, continuous passive motion machines, patient monitors, patient handling equipment and infant security systems.
· Sales of Disposables. We offer our customers single use disposable items. Most of these items are used in connection with our outsourced equipment. We offer these products as a convenience to customers and to complement our full medical equipment lifecycle solutions.
BUSINESS OPERATIONS
District Offices
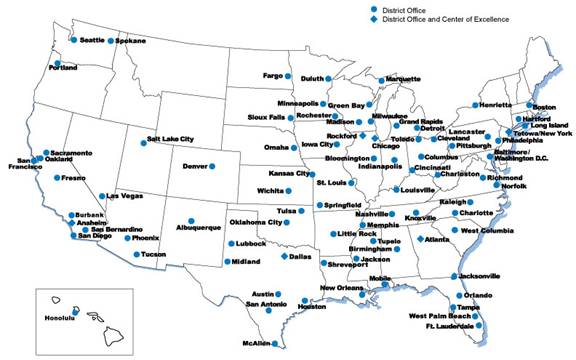
As of December 31, 2009, we operated 84 market based district offices, which allow us to provide our equipment lifecycle solutions to customers in virtually all markets throughout the United States. Each district office is responsible for servicing their local health care market. Each office maintains an inventory of locally demanded equipment, parts, supplies, and other items tailored to accommodate the needs of individual customers within its geographical area. Should additional or unusual equipment be required by one of our customers, a district office can draw upon the resources of all of our other districts. With access to over 330,000 owned or managed pieces of equipment available for customer use, we can most often obtain the necessary equipment within 24 hours.
Depending on the district office size and demands, our district offices are staffed by multi-disciplined teams of sales professionals, service representatives, customer service technicians, and biomedical equipment technicians trained to provide the spectrum of services we offer our customers. Employees providing resident-based services through our AMPP and CHAMP programs are supported by site based managers and/or the district offices in the markets where their customers are located.
Centers of Excellence
Our district office network is supported by six strategically located technical Centers of Excellence. These Centers focus on providing highly specialized technical services and support. The Centers of Excellence also provide overflow support, technical expertise, training programs, and specialized depot service functions for our district offices. All specialized depot work required by our manufacturer customers resides within these Centers of Excellence. All six of our Centers of Excellence are certified as being in compliance with International Organization for Standardization (“ISO”) 9001:2008 and ISO 13485:2003 standards as a quality commitment to our customers.
Centralized Functions
Our corporate office is located in Edina, Minnesota. We have centralized many of the key elements of our equipment and service offerings in order to create standardization, and to maximize our operating efficiencies and uniformity of service. Some of the critical aspects of our business that we have centralized include contract administration, purchasing, pricing, logistics and information technology.
Medical Equipment Fleet
We acquire or manage medical equipment to meet our customers’ needs in seven primary product areas: respiratory therapy, newborn care, critical care, patient monitors, patient handling, pressure area management and wound therapy. We maintain one of the most technologically advanced equipment fleets in the industry, routinely acquiring new and pre-owned equipment to enhance our fleet. Our specialized equipment portfolio managers evaluate new products each year to keep abreast of current market technology and to determine whether to add new products to our equipment fleet. In making equipment purchases, we consider a variety of factors, including manufacturer credibility, repair and maintenance costs, anticipated user demand, equipment mobility and anticipated obsolescence. Historically, we have purchased and owned directly the equipment used in our Medical Equipment Outsourcing programs. During 2007, we entered into “revenue sharing” agreements with a select number of manufacturers of equipment where the manufacturers retain ownership of the equipment, but we take possession and manage the rental of the equipment to customers. We may enter into more of such arrangements in the future. In January 2010, one of these agreements was modified such that the Company purchased the manufacturer’s equipment it had managed and the revenue share portion of the agreement was terminated. During the year ended December 31, 2009, we owned or managed over 330,000 pieces of equipment available for use by our customers.
In 2009, our ten largest manufacturers of medical equipment supplied approximately 78% (measured in dollars spent) of our direct medical equipment purchases. In 2009, our two largest medical equipment suppliers, respectively, accounted for approximately 38% and 9% of our medical equipment purchases (measured in dollars spent).
We seek to ensure availability of equipment at favorable prices. We generally do not enter into long-term fixed price contracts with suppliers of our equipment. We may receive price discounts related to the volume and timing of our purchases. The purchase price we pay for equipment generally ranges from $1,000 to $25,000 per item.
OUR STRENGTHS
We believe our business model presents an attractive value proposition to our customers and has resulted in significant growth in recent years. We service customers across the spectrum of the equipment lifecycle as a result of our position as one of the industry’s largest purchasers, outsourcers and resellers of medical equipment.
We attribute our historical success to, and believe that our potential for future growth comes from, the following strengths:
Unique position in the health care arena. We believe that we are the only national company providing full medical equipment lifecycle services to the health care industry. While we have competitors that may offer products and services in various stages of the lifecycle, none provide the comprehensive approach to customers that we do. Our extensive relationships with more than 4,200 hospitals, approximately 4,250 alternate site
providers, over 200 medical equipment manufacturers and many of the nation’s largest GPOs and many of the IDNs, of which many are long-standing, present a unique position and value proposition in the health care arena.
We are uniquely positioned in the health care industry as a result of our:
· investment in our large and modern fleet of medical equipment;
· diversified product offering and customized solutions;
· nationwide infrastructure for service and logistics;
· proprietary medical equipment management software and tools;
· commitment to customer service that has earned us a reputation as a leader in quality, value, and service in our industry; and
· extensive knowledge and experience in acquiring, managing, maintaining and remarketing medical equipment.
Large, modern equipment fleet. We own or manage an extensive, modern fleet of medical equipment, which during the year ended December 31, 2009, consisted of over 330,000 units available for use to our customers. This modern equipment fleet, along with our quality assurance programs and tools, places us in a leadership position in the areas of quality and patient safety. It also places us in a unique position to service “high end” acute care hospitals, such as teaching, research or specialty institutions that demand the most current technology to satisfy the increasingly complex needs of their patients.
Nationwide infrastructure. We have a broad, nationwide staff, facility, and vehicle service network coupled with focused and customized operations at the local level. Our extensive network of district offices and Centers of Excellence and our 24-hours-a-day, 365 days-a-year service capabilities enable us to compete effectively for large, national contracts as well as to drive growth regionally and locally.
Proprietary software and asset management tools. We have used our more than 70 years of experience and our extensive database of equipment management information to develop sophisticated software technology and management tools. These tools have allowed us to become a leader in meeting the demands of customers by delivering sophisticated asset management programs that we use to drive cost efficiencies, equipment productivity, caregiver satisfaction, and better patient outcomes. We believe that our continued and significant investment in new tools and technology will help us to continue to distinguish our offerings to the health care industry.
Superior customer service. We have a long-standing reputation among our customers for outstanding service and quality. This reputation is largely due to our strong customer service culture, which is continuously reinforced through management commitment and significant investment in hiring and training resources. We strive to seamlessly integrate our employees and service offerings into the operations of our customers. This aggressive focus on customer service has helped us achieve a high customer retention rate.
Proven management team. We have an industry leading management team with significant depth of health care experience. Our management team has successfully supervised the development of our competitive strategy, continually enhanced and expanded our service and product offerings, established our nationwide coverage and furthered our reputation as an industry leader for quality, value, and service.
Industry with favorable fundamentals. Our business benefits from the overall favorable trends in health care in general and our segments in particular. There is a fundamental shift in the needs of hospitals and alternate site providers from supplemental and peak needs supply of medical equipment to full equipment lifecycle asset management programs. This move to full outsourcing is not unlike trends in similar services at hospitals including food service, laundry, professional staffing and technology. The strong fundamentals in our Medical Equipment Outsourcing segment are being driven by the following trends:
· Favorable demographic trends. According to the U.S. Census Bureau, individuals aged 65 and older in the United States comprise the fastest growing segment of the population. This segment is expected to grow to approximately 80 million individuals by 2030. This represents a 42% increase in the 65 and older segment of the population over the next 20 years. As a result, over time, the number of patients and the volume of hospital admissions are expected to grow. The aging population and increasing life expectancy are driving demand for health care services.
· Increase in obesity. The U.S. population is getting heavier, with 49 states reportedly now having obesity prevalence rates over 20% as of 2008, compared to zero states with such rates in 1996 (Source: CDC U.S. Obesity Trends 1985-2008). According to the CDC, the increase in obesity prevalence rates translates into annual obesity related health care costs in excess of $110 billion and accounts for approximately 27% of the increase in medical costs. Therefore, health care facilities must be prepared for the medical needs of obese and morbidly obese patients.
· Increased capital and operating expense pressures and regulatory scrutiny. Hospitals continue to experience restricted capital and operating budgets, while the cost and complexity of medical equipment increases. Furthermore, the increasing complexity and sophistication of medical equipment brings with it more record keeping and regulatory scrutiny of the use and maintenance of medical equipment in the care setting. We expect that hospitals will increasingly look to us to source these capital equipment needs and manage medical equipment to achieve capital and operating expense savings, operating efficiencies, and regulatory compliance.
· Caregiver retention and satisfaction. Hospitals continue to experience nursing and other caregiver retention and job satisfaction pressures. We expect that with these internal pressures, hospitals will increasingly turn to our programs to outsource medical equipment management duties and related management challenges.
· Demand for better patient safety and outcomes. Hospitals across the United States are focused on improving patient safety and outcomes, which includes efforts to minimize the incidence of hospital-acquired infections, patient falls and pressure ulcers. Hospitals turn to us to assist them in managing their equipment to help them to minimize these incidents, thereby improving patient safety and outcomes while reducing the cost of these events.
Strong value proposition. With our focus and expertise in medical equipment lifecycle solutions, we are able to create a strong value proposition for our customers. All of our equipment lifecycle solutions focus on delivering our customers with:
· lower capital and operating costs;
· enhanced staff productivity and satisfaction; and
· improved patient safety and outcomes.
No direct third-party payor reimbursement risk. Many health care providers rely on payment from patients or reimbursement from third-party payors. Our fees are paid directly by our customers, rather than by third-party payors, such as Medicare, Medicaid, managed care organizations or indemnity insurers. Accordingly, our exposure to uncollectible patient or reimbursement receivables or Medicare or Medicaid reimbursement changes is reduced, as evidenced by our bad debt expense of approximately 0.5% of total revenues for the year ended December 31, 2009.
GROWTH STRATEGY
Historically, we have experienced significant and sustained organic and strategic growth. Our overall growth strategy is to continue to grow both organically and through strategic acquisitions.
Organic Growth
We believe that the following external and market factors will provide us significant growth opportunities:
· the aging population;
· increasing life expectancy;
· increasing obesity and patient acuity;
· continued increase in the number, complexity and sophistication of medical technologies;
· increasing cost and staffing pressures in hospitals;
· continuing growth of outsourcing of non-core functions by hospitals, alternate site providers and manufacturers; and
· increasing demand by payors and providers for equipment based solutions.
Our organic growth will be driven internally by the following factors:
· growing our outsourcing business through customer education and increasing the numbers and types of equipment we offer in our programs;
· converting peak needs rental and biomedical service customers to fully outsourced resident-based programs;
· growing our less capital intensive technical and professional services, equipment sales and remarketing and outsourcing revenue share businesses;
· increasing the number of hospitals, alternative care facilities and manufacturers to which we provide services;
· expanding and deepening our relationships with customers and manufacturers to develop more effective and comprehensive offerings tailored to the unique needs of caregivers.
Acquisitions
Since 2005, we have made and successfully integrated two acquisitions that have helped us expand our business, adding additional service offerings, and enabling us to penetrate new geographic regions. We intend to continue to pursue a disciplined course of growing our business with complementary acquisitions, and we regularly evaluate potential acquisitions.
COMPETITION
An analysis of our competition as it relates to our three business segments follows:
Medical Equipment Outsourcing Segment
We believe that the strongest competition to our Medical Equipment Outsourcing solutions lies in the direct purchase or lease of equipment by our customers or potential customers, and assuming management of this equipment themselves. The vast majority of acute care hospitals and alternate site providers view outsourcing primarily as a means of meeting short-term or peak supplemental needs, rather than as a long-term alternative to purchasing or leasing equipment and managing that equipment through its full lifecycle. Although we believe that we can demonstrate the cost-effectiveness of outsourcing patient-ready medical equipment and its management in the health care setting, we believe that many health care providers will continue to purchase or lease and manage internally a substantial portion of their medical equipment until they are educated in the advantages and efficiencies of outsourcing.
Our two largest national competitors in medical equipment outsourcing are Kinetic Concepts, Inc. and Hill-Rom Holdings, Inc. Our other competition consists of regional or local companies and some medical equipment manufacturers and dealers that provide equipment outsourcing to augment their medical equipment sales.
Technical and Professional Services Segment
As with Medical Equipment Outsourcing, the strongest competition to the technical and professional services we offer lies in customers obtaining these services through their in-house departments and personnel. Although we believe we can consistently demonstrate the economic and qualitative value of our offerings, the vast majority of our potential customers choose to maintain and repair their equipment themselves. In addition to in-house departments, we face significant and direct competition in the technical and professional services area from many national, regional and local service providers, as well as from medical equipment manufacturers. We believe that through our nationwide network of highly trained technicians, strong customer relationships and extensive equipment database, we offer customers an attractive alternative for performing biomedical repair services on their equipment.
Medical Equipment Sales and Remarketing Segment
In medical equipment sales, we face significant direct competition from a variety of manufacturers and distributors on a nationwide basis, which compete primarily based on price. As a result, we are selective in our pursuit of these opportunities. The equipment remarketing market is highly fragmented with low barriers to entry. In addition to manufacturers seeking to control the remarketing and disposal of their own products, we compete with a number of localized or specialized providers of remarketing and disposal services.
EMPLOYEES
We had 1,520 regular employees as of December 31, 2009, including 1,365 full-time and 155 part-time employees. Of such employees, 143 were sales representatives, 1,219 were operations personnel and 158 were employed in corporate support functions.
None of our employees are covered by a collective bargaining agreement, and we have experienced no work stoppages to date. We believe that our relations with our employees are good.
INTELLECTUAL PROPERTY
We use ‘‘UHS®’’ and the UHS logo in connection with our services and have registered these marks with the United States Patent and Trademark Office. We also have registered “Equipment Lifecycle Services®,” the Equipment Lifecycle Services logo and “CHAMP®” with the United States Patent and Trademark Office. United States service
mark registrations are generally for a term of 10 years, renewable every 10 years if the mark is used in the regular course of business.
We have a domain name registration for UHS.com, which serves as our main website, and my.UHS.com and myservice.UHS.com, which are web-based tools that provide 24 hour on-demand access to equipment reports for all equipment outsourced or maintained by us.
We have developed a number of proprietary software programs to directly service or support our customers including the Asset Information Management System for Central Services (“AIMS/CS”), Resource for Equipment Documentation System (“REDS”) and Operator Error Identification System (“OEIS”). AIMS/CS is a medical equipment inventory management system that allows UHS to track the location and usage of equipment we are managing at the customers’ location in our AMPP program. Our proprietary REDS and OEIS programs are specifically designed to help customers meet medical equipment documentation and reporting needs under applicable regulations and standards, such as those promulgated by the FDA and The Joint Commission. We have also developed proprietary software tools that allow our employees to manage and maintain our extensive equipment fleet and serve our customers more effectively and efficiently.
While our proprietary software programs and tools are important, no one such item or group of such items is of material significance to us as a whole.
MARKETING
We market our programs primarily through our direct sales force, which consisted of 143 professional sales representatives as of December 31, 2009. Our direct sales force is organized into two regions and ten sales divisions. We support our direct sales force with clinicians and solution specialists, who provide expert support to our AMPP and CHAMP programs and for our patient handling and wound care solutions. Our national accounts team also supports our direct sales force through its focus on securing national and regional contracts.
We also market through our website, www.uhs.com, participation in numerous national and regional conventions and interaction with industry groups and opinion leaders.
In our marketing efforts, we primarily target key decision makers, such as administrators, chief executive officers, chief financial officers, chief medical officers, and chief nursing officers as well as directors and managers of functional departments, such as materials management, purchasing, pharmacy, biomedical services, and central supply. We also promote our programs and services to hospital, manufacturer, and alternate site provider groups and associations.
SEASONALITY/BUSINESS INTERRUPTION
Quarterly operating results are typically affected by seasonal factors. Historically, our first and fourth quarters are the strongest, reflecting increased hospital census and patient acuity during the fall and winter months. Our business can also be impacted by natural disasters, such as hurricanes and earthquakes, which affect our ability to transfer equipment to and from our customers and equipment recalls, which can cause equipment to be removed from market use. We also see declines in our business in down economic cycles with high levels of unemployment. Our customers typically see weaker census and higher levels of indigent patients during these times, causing them to use fewer of our solutions.
REGULATORY MATTERS
Sarbanes-Oxley
There were no significant external costs incurred during the years ended December 31, 2009, 2008 and 2007, related to compliance with Section 404 of the Sarbanes-Oxley Act of 2002 (“SOX”). On October 2, 2009, the Securities and Exchange Commission (“SEC”) announced that the compliance date for non-accelerated filers (such as UHS) to include in their annual reports an auditor’s attestation report on internal control over financial reporting was extended to the first fiscal year ending on or after June 15, 2010.
Regulation of Medical Equipment
Our customers are subject to documentation and safety reporting regulations and standards with respect to the medical equipment they use, including those established by the FDA, The Joint Commission and the NFPA. Some states and municipalities also have similar regulations.
Our REDS and OEIS programs (see description under the heading “Intellectual Property” in Item 1 of this Annual Report on Form 10-K) are specifically designed to help customers meet documentation and reporting needs under such regulations and standards. We also monitor changes in regulations and standards and work to accommodate the needs of customers by providing specific product and manufacturer information upon request. Manufacturers of medical equipment are subject to regulation by agencies and organizations such as the FDA, Underwriters Laboratories and the NFPA. We believe that all medical equipment we outsource conforms to these regulations.
The Safe Medical Devices Act of 1990 (“SMDA”), which amended the Food, Drug and Cosmetic Act (“FDCA”), requires manufacturers, user facilities and importers of medical devices to report deaths and serious injuries which a device has or may have caused or to which a device has or may have contributed. In addition, the SMDA requires the establishment and maintenance of adverse event files and various other FDA reports. Manufacturers and importers are also required to report certain device malfunctions. We
work with our customers to assist them in meeting their reporting obligations under the FDCA, including those requirements added by the SMDA.
As a distributor of medical devices, we are required by the FDCA to maintain device complaint records containing any incident information regarding the identity, quality, durability, reliability, safety, effectiveness or performance of a device. We are required to retain copies of these records for a period of two years from the date of inclusion of the record in the file or for a period of time equivalent to the expected life of the device, whichever is greater, even if we cease to distribute the device. Finally, we are required to provide authorized FDA employees access to copy and verify these records upon their request. We have current compliance records regarding maintenance, repairs, modification and user-error with respect to all of our equipment.
Besides the FDA, a number of states regulate medical device distributors and wholesalers either through pharmacy or device distributor licensure. Currently, we hold such licenses in 14 states. Some licensure regulations and statutes in additional states may apply to our activities. Although our failure to possess such licenses in these states for our existing operations may subject us to certain monetary fines, we do not believe the extent of such fines, in the aggregate, would be material to our liquidity, financial condition or results of operation.
In addition, we are required to provide information to the manufacturer regarding the permanent disposal or any change in ownership of certain categories of medical outsourcing equipment. We believe our medical equipment tracking systems are in compliance with these regulations.
The Health Insurance Portability and Accountability Act of 1996 (“HIPAA”) applies to certain covered entities, including health plans, health care clearinghouses and health care providers. HIPAA regulations protect individually identifiable health information, including information in an electronic format, by, among other things, setting forth specific standards under which such information may be used and disclosed, providing patients rights to obtain and amend their health information and establishing certain administrative requirements for covered entities.
Because of our self-insured health plans, we are a covered entity under the HIPAA regulations. Also, we may be obligated to comply with certain HIPAA requirements as a business associate of various health care providers. In addition, various state legislatures have enacted and may continue to enact additional privacy legislation that is not preempted by the federal law, which may impose additional burdens on us. Moreover, other federal privacy legislation may be enacted. Accordingly, we have made and, as new standards go into effect, we expect to continue to make administrative, operational and information infrastructure changes in order to comply with these requirements.
Third-Party Reimbursement
Our fees are paid directly by our customers rather than through direct reimbursement from third-party payors, such as Medicare or Medicaid. We do not bill the patient, the insurer or other third-party payors directly for services provided for hospital or alternate site provider inpatients or outpatients. Sometimes our customers are eligible to receive third-party reimbursement for our services. Consequently, the reimbursement policies of such third-party payors have a direct effect on the ability of health care providers to pay for our services and an indirect effect on our level of charges. Also, in certain circumstances, third-party payors may take regulatory or other action against service providers even though the service provider does not receive direct reimbursement from third-party payors.
Hospitals and alternate site providers face cost containment pressures from public and private insurers and other managed care providers, such as health maintenance organizations, preferred provider organizations and managed fee-for-service plans, as these organizations continue to place controls on the reimbursement and utilization of health care services. We believe that these payors have followed or will follow the government in limiting the services that are reimbursed and in exerting downward pressure on prices. In addition to promoting managed care plans, employers are increasingly self funding their benefit programs and shifting costs to employees through increased deductibles, co-payments and employee contributions. Hospitals and health care facilities are also experiencing an increase in uncompensated care or “charity care,” which causes increased economic pressures on these organizations. We believe that these cost reduction efforts will place additional pressures on health care providers’ operating margins and will encourage efficient equipment management practices such as the use of our outsourcing and AMPP solutions.
Liability and Insurance
Although we do not manufacture any medical equipment, our business entails the risk of claims related to the outsourcing, sale and service of medical equipment. In addition, our instruction of hospital and alternate site provider employees with respect to the use of equipment and our professional consulting services are sources of potential claims. We have not suffered a material loss due to a claim. However, any such claim, if made, could have a material adverse effect on our business. While we do not currently provide any services that require us to work directly with patients, expansion of services in the future could involve such activities and subject us to claims from patients.
We maintain a number of insurance policies, including commercial general liability coverage (product and premises liability insurance), automobile liability insurance, worker’s compensation insurance and professional liability insurance. We also maintain excess liability coverage. Our policies are subject to annual renewal. We believe that our current insurance coverage is adequate. Claims exceeding such coverage may be made and we may not be able to continue to obtain liability insurance at acceptable levels of cost and coverage.
Our business is subject to various risks and uncertainties. Any of the risks discussed below, or elsewhere in this Form 10-K or our other filings with the SEC, could materially adversely affect our business, financial condition or results of operations.
Our substantial indebtedness could adversely affect our financial health and prevent us from fulfilling our obligations under our indebtedness.
We have a significant amount of indebtedness which could have important consequences.
For example, it could:
· make it more difficult for us to satisfy our debt obligations;
· increase our vulnerability to general adverse economic, industry and competitive conditions;
· require us to dedicate a substantial portion of our cash flow from operations to payments on our indebtedness, thereby reducing the availability of our cash flow to fund working capital, capital expenditures, research and development efforts and other general corporate purposes;
· limit our flexibility in planning for, or reacting to, changes in our business and the industry in which we operate;
· place us at a competitive disadvantage compared to our competitors that have less leverage;
· limit our ability to borrow additional funds;
· limit our ability to make investments in technology and infrastructure improvements; and
· limit our ability to make significant acquisitions.
Our ability to satisfy our debt obligations will depend on our future operating performance. This, to a certain extent, is subject to general economic, financial, competitive, legislative, regulatory and other factors that are beyond our control. Our business may not continue to generate sufficient cash flow from operations and future borrowings may not be available to us in an amount sufficient to enable us to pay our indebtedness or to fund our other liquidity needs. If we are unable to make our interest payments or to repay our debt at maturity, we may have to obtain alternative financing, which may not be available to us.
If we are unable to fund our significant cash needs, we may be unable to expand our business as planned or to service our debt.
We require substantial cash to operate our Medical Equipment Outsourcing programs and service our debt. Our outsourcing programs require us to invest a significant amount of cash in medical equipment purchases. To the extent that such expenditures cannot be funded from our operating cash flow, borrowings under our senior secured credit facility or other financing sources, we may not be able to grow as currently planned. We currently expect that over the next 12 months, we will invest approximately $90.0 million
in new and pre-owned medical equipment and other capital expenditures. This estimate is subject to numerous assumptions, including revenue growth, the number of AMPP program signings, and any significant changes in GPO contracts. In addition, a substantial portion of our cash flow from operations must be dedicated to servicing our debt and there are significant restrictions on our ability to incur additional indebtedness under the Second Lien Senior Indenture and the credit agreement governing our senior secured credit facility.
Primarily because of our debt service obligations and debt refinancing charges and elevated depreciation and amortization charges we have incurred subsequent to the Transaction, we have had a history of net losses. If we consistently incur net losses, it could result in our inability to finance our business in the future. We had net losses of $18.6, $23.5, $16.1, and $47.5 million during the years ended December 31, 2009 and 2008, the seven months ended December 31, 2007 and the five months ended May 31, 2007, respectively. Our ability to use our United States federal income tax net operating loss carryforwards to offset our future taxable income may be limited. If we are limited in our ability to use our net operating loss carryforwards in future years in which we have taxable income, we will pay more current taxes than if we were able to utilize our net operating loss carryforwards without limitation, which could harm our results of operations and liquidity.
We may not be able to obtain funding on acceptable terms or at all under our existing credit facilities or otherwise because of the deterioration of the credit and capital markets. Thus, we may be unable to expand our business as planned or to service our debt.
Global financial markets and economic conditions continue to be disrupted and volatile due to a variety of factors, including significant write-offs in the financial services sector and the current weak economic conditions. As a result, the cost of raising money in the debt and equity capital markets has increased while the availability of funds from those markets has diminished. In particular, as a result of concerns about the stability of financial markets and the solvency of lending counterparties, the cost of obtaining money from the credit markets generally has increased as many lenders and institutional investors have increased interest rates, enacted tighter lending standards, refused to refinance existing debt on similar terms or at all and reduced, or in some cases ceased, to provide funding to borrowers. In addition, lending counterparties under our existing revolving credit facilities may be unwilling or unable to meet their funding obligations. If funding is not available when needed, or is available only on unfavorable terms, we may be unable to meet our obligations as they come due. Moreover, without adequate funding, we may be unable to execute our growth strategy, complete future acquisitions, or take advantage of other business opportunities or respond to competitive pressures, any of which could have a material adverse effect on our revenues and results of operations.
We have risks related to our pension plan, which could impact our financial position.
The Company has a defined benefit pension plan covering certain current and former employees. Although benefits under the pension plan were frozen in 2002, funding obligations under our pension plan continues to be impacted by the performance of the financial markets. If the financial markets do not provide the long-term returns that are expected, the likelihood of our being required to make contributions will increase. The equity markets can be, and recently have been, volatile, and therefore our estimate of future contribution requirements can change dramatically in relatively short periods of time.
If our customers’ patient census or services decrease, the revenues generated by our business could decrease.
Our operating results are dependent in part on the amount and types of equipment necessary to service our customers’ needs, which are heavily influenced by the number of patients our customers serve at any time (which we refer to as “patient census”) and the services those patients receive. At times of lower patient census, our customers have a decreased need for our services on a supplemental or peak needs basis. During severe economic downturns like the one we are currently experiencing, the number of hospital admissions and inpatient surgeries decline as consumers reduce their use of non-essential health care services. Our operating results can also vary depending on the timing and severity of the cold and flu season, local, regional or national epidemics, and the impact of national catastrophes, as well as other factors affecting patient census and service demand.
A continuation of the global economic downturn could continue to adversely affect our customers and suppliers or have new, additional adverse effects on them, which could have further adverse effects on our operating results and financial position.
We believe our customers have been adversely affected by the current global economic downturn and, the volatility of the credit and capital markets over the past year, which have led to declines in commercial and consumer spending. The impact of the global economic downturn on our customers may result in, among other things, decreased patient census, decreased number of non-essential patient services, increased uncompensated care and bad debt, increased difficulty obtaining financing on favorable terms and tighter capital and operating budgets. Many of our customers depend on investment income to supplement inadequate third-party payor reimbursement. The recent disruption in the capital and credit markets has adversely affected the value of many investments, reducing our customers’ ability to access cash reserves to fund their operations. If current economic conditions continue or worsen, our customers may seek to further reduce their costs and may be unable to pay for our services, resulting in reduced orders, slower payment cycles, increased bad debt, and customer bankruptcies.
Our suppliers also may be negatively impacted by the economic downturn and tighter capital and credit markets. If our key suppliers experience financial difficulty and are unable to deliver to us the equipment we require, we could be forced to seek alternative
sources of medical equipment or to purchase equipment on less favorable terms, or we could be unable to fulfill our requirements. A delay in procuring equipment or an increase in the cost to purchase equipment could limit our ability to provide equipment to customers on a timely and cost-effective basis.
All of these factors related to a general economic downturn, which are out of our control, could have a negative impact on our financial condition.
We have relationships with certain key suppliers, and adverse developments concerning these suppliers could delay our ability to procure equipment or provide certain services, or increase our cost of purchasing equipment.
We purchased medical equipment from approximately 150 manufacturers in 2009. Our ten largest manufacturers of medical equipment accounted for approximately 78% of our direct medical equipment purchases in 2009. Adverse developments concerning key suppliers or our relationships with them could force us to seek alternative sources for our medical equipment or to purchase such equipment on less unfavorable terms. A delay in procuring equipment or an increase in our cost to purchase equipment could limit our ability to provide equipment to our customers on a timely and cost-effective basis. In addition, if we do not to have access to certain parts, or if manufacturers do not provide access to the appropriate equipment manuals or training, we may not be able to provide certain technical and professional services.
If we are unable to change the manner in which health care providers traditionally procure medical equipment, we may not be able to achieve significant revenue growth.
We believe that the strongest competition to our outsourcing solutions is the direct purchase or capital lease of medical equipment, and self-management of that equipment. Many hospitals and alternate site providers view outsourcing primarily as a means of meeting short-term or peak supplemental needs, rather than as a long-term, effective and cost-efficient alternative to purchasing or leasing equipment. Many health care providers may continue to purchase or lease a substantial portion of their medical equipment and to manage and maintain it on their own.
Our competitors may engage in significant competitive practices or sell significant amounts of surplus equipment, which could cause us to lose market share, reduce prices, or increase expenditures.
Our competition may engage in competitive practices that could cause us to lose market share, reduce our prices, or increase our expenditures. For example, competitors may sell significant amounts of surplus equipment, thereby decreasing the demand for our equipment rental services.
Our competitors may bundle products and services offered to customers, some of which we do not offer.
If competitors offer their products and services to customers on a combined basis with reduced prices, and we do not offer some of these products or cannot offer them on comparable terms, we may have a competitive disadvantage that will lower the demand for our services.
A substantial portion of our revenues come from customers with which we do not have long-term commitments, and cancellations by or disputes with customers could decrease the amount of revenues we generate, thereby reducing our ability to operate and expand our business.
For the year ended December 31, 2009, approximately 62% of our outsourcing revenue was derived from customers that contracted with us or from hospitals and other providers that purchased equipment or services from us through a GPO that contracted with us on behalf of its members. The source of the remaining 38% of revenue was from customers that do not purchase equipment or services from us through a contract. Our customers are generally not obligated to outsource our equipment under long-term commitments. In addition, many of our customers do not sign written contracts with us fixing the rights and obligations of the parties regarding matters such as billing, liability, warranty or use. Therefore, we face risks such as fluctuations in usage, inaccurate or false reporting of usage by customers and disputes over liabilities related to equipment use. We do not have written contracts with some of our AMPP customers for which we provide a substantial portion of the medical equipment that they use and provide substantial staffing resources. The non-contracted services we provide could be terminated by the customer without notice or payment of any termination fee. A large number of such terminations may adversely affect our ability to generate revenue growth and sufficient cash flows to support our growth plans. In addition, those customers with long-term commitments may have contracts that do not permit us to raise our prices, yet our cost to serve may increase. Any of these risks could reduce our ability to operate and expand our business.
Consolidation in the health care industry may lead to a reduction in the prices we charge, thereby decreasing our revenues.
Many hospitals and alternate site providers have combined to create health systems or IDNs. We believe this trend may continue. Any resulting IDN or health systems may have greater bargaining power over us, which could lead to a reduction in the prices we charge and a reduction in our revenues.
Our growth strategy depends in part on our ability to successfully identify and manage our acquisitions and a failure to do so could impede our revenue growth, thereby weakening our industry position.
As part of our growth strategy, we intend to pursue acquisitions or other strategic relationships within the health care industry that we believe will enable us to generate
revenue growth. Future acquisitions may involve significant cash expenditures that could impede our revenue growth. In addition, our efforts to execute our acquisition strategy may be affected by our ability to identify suitable candidates and successfully bid, finance, negotiate and close acquisitions. We regularly evaluate potential acquisitions. We may not be successful in acquiring other businesses, and the businesses we do acquire in the future may not ultimately produce returns that justify our related investment.
Acquisitions may involve numerous risks, including:
· difficulties assimilating personnel and integrating distinct business cultures;
· diversion of management’s time and resources from existing operations;
· potential loss of key employees or customers of acquired companies; and
· exposure to unforeseen liabilities of acquired companies.
If we are unable to continue to grow through acquisitions, our ability to generate revenue growth may be impaired.
Uncertainty surrounding health care reform initiatives remains. Depending on the scope and form of final health care reform legislation and its implementation, our business may be adversely affected.
The current presidential administration continues to push to reform health care in the United States. Health care reform legislation and its implementation could present challenges to our business, for example by resulting in an increase in the number of persons who have health care insurance, thereby reducing health care providers’ charity care and bad debt. The funding and form of health care reimbursement for the newly covered uninsured, however, remains unknown. Provider revenue per service may decline if funding sources include reductions in Medicare and Medicaid reimbursement. Furthermore, reform may impose changes in health care delivery, reimbursement, operations or record keeping that are not compatible with our current offerings.
The regulatory and political environment for health care can significantly influence health care providers’ decisions related to medical equipment. Historically, health care reform and political uncertainty have resulted in a change in how our customers purchase our services and have adversely affected our revenues. At this time, it is not possible for us to determine which health care reform initiatives will be adopted, when they will be adopted, how they will be financed or what impact they may have on our operating results or financial condition.
Changes in third-party payor reimbursement for health care items and services may affect our customers’ ability to pay for our services, which could cause us to reduce our prices or adversely affect our ability to collect payments.
Although our customers are health care providers that pay us directly for the services we deliver, they rely on third-party payor reimbursement for a substantial portion of their
operating revenue. Third-party payors include government payors like Medicare and Medicaid and private payors like insurance companies and managed care organizations. Third-party payors continue to engage in widespread efforts to control health care costs. Their cost containment initiatives include efforts to control utilization of services and limit reimbursement amounts. Reimbursement limitations can take many forms, including discounts, non-payment for certain care (for example, care associated with certain hospital-acquired conditions) and fixed payment rates for particular treatment modalities or plans, regardless of the provider’s actual costs in caring for a patient. Reimbursement policies have a direct effect on our customers’ ability to pay us for our services and an indirect effect on the prices we charge. Ongoing concerns about rising health care costs may cause more restrictive reimbursement policies to be implemented in the future. Restrictions on the amounts or manner of reimbursements to health care providers may affect the financial strength of our customers and amount our customers are able to pay for our services.
We depend on key personnel and our inability to attract and retain key personnel could harm our business.
Our financial performance is dependent in significant part on our ability to hire, develop and retain key personnel, including our senior executives, sales professionals, sales specialists, hospital management employees and other qualified workers. We have experienced and will continue to experience intense competition for these resources. The loss of the services of one or more of our senior executives or other key personnel could significantly undermine our management expertise, key relationships with customers and suppliers, and our ability to provide efficient, quality health care services.
If we are unable to maintain existing contracts or contract terms with, or enter into new contracts with GPOs or IDNs, we may lose customers and/or the associated revenues.
Our revenue maintenance and growth depends, in part, on access to customers through contracts with GPOs and IDNs. In the past, we have been able to maintain and renew such contracts and expand the services we offer under such contracts. If we are unable to maintain our GPO or IDN contracts, or if the GPOs or IDNs seek additional discounts or other more beneficial terms on behalf of their members, we may lose a portion of existing business with, or revenues from, customers that are members of such GPOs and IDNs.
Our cash flow fluctuates during the year because operating income as a percentage of revenue fluctuates with our quarterly operating results and we make semi-annual debt service payments.
Our results of operations have been and can be expected to be subject to quarterly fluctuations. We may experience increased revenues in the first and fourth quarters of the year, depending upon the timing and severity of the cold and flu season and the related increased hospital census and medical equipment usage during that season. Because a significant portion of our expenses are relatively fixed over these periods, our
operating income as a percentage of revenue tends to increase during the first and fourth quarter of each year. If the cold and flu season is delayed by as little as one month, or is less severe than in prior periods, our quarterly operating results for a current period can vary significantly from prior periods. Our quarterly results can also fluctuate as a result of such other factors as the timing of acquisitions, new AMPP agreements or new office openings.
A portion of our revenues are derived from home care providers and nursing homes, and these health care providers may pose additional credit risks.
Our nursing home and home care customers may pose additional credit risks since they are generally less financially sound than hospitals. These customers continue to face cost pressures. We may incur losses in the future due to the credit risks, including potential bankruptcy filings, associated with any of these customers.
Our customers operate in a highly regulated environment. Regulations affecting them could cause us to incur additional expenses associated with compliance and licensing. We could be assessed fines and face possible exclusion from participation in state and federal health care programs if we violate laws or regulations applicable to our business.
The health care industry is required to comply with extensive and complex laws and regulations at the federal, state and local government levels. While the majority of these regulations do not directly apply to us, there are some that do, including the Food, Drug and Cosmetic Act (“FDCA”) and certain state pharmaceutical licensing requirements. Although we believe we are in compliance with the FDCA, if the FDA expands the reporting requirements under the FDCA, we may be required to comply with the expanded requirements and may incur substantial additional expenses in doing so. With respect to state requirements, we are currently licensed in 14 states and may be required to obtain additional licenses, permits and registrations as state requirements change. Our failure to possess such licenses for our existing operations may subject us to certain additional expenses.
In addition to the FDCA and state licensing requirements, we are impacted by federal and state laws and regulations aimed at protecting the privacy of individually identifiable health information, among other things, and detecting and preventing fraud, abuse and waste with respect to federal and state health care programs. Some of these laws and regulations apply directly to us. Additionally, many of our customers require us to abide by their policies relating to patient privacy, state and federal anti-kickback acts, and state and federal false claim acts and whistleblower protections.
Given that our industry is heavily regulated, we may be subject to additional regulatory requirements. If our operations are found to be in violation of any governmental regulations to which we or our customers are subject, we may be subject to the applicable penalty associated with the violation. Penalties, damages, fines, or curtailment of our operations could significantly increase our cost of doing business, leading to difficulty
generating sufficient income to support our business. Also, if we are found to have violated certain federal or state laws or regulations regarding Medicare, Medicaid or other governmental funding sources, we could be subject to fines and possible exclusion from participation in federal and state health care programs.
Although we do not manufacture any medical equipment, we own a large fleet of medical equipment, which may be subject to equipment recalls or obsolescence.
We incur significant expenditures to maintain a large and modern equipment fleet. Our equipment may be subject to recalls that could be expensive to implement and could result in revenue loss while the associated equipment is removed from service. We may be required to incur additional costs to repair or replace the equipment at our own expense or we may choose to purchase incremental new equipment from a supplier not affected by the recall. Additionally, our relationship with our customers may be damaged if we cannot promptly replace the equipment that has been recalled.
Our success depends, in part, on our ability to respond effectively to changes in technology. Because we maintain a large fleet of equipment, we are subject to the risk of equipment obsolescence. If advancements in technology render a substantial portion of our equipment fleet obsolete, or if a competing technology becomes available that our customers prefer, we may experience a decrease in demand for our products, which could adversely affect our operating results and cause us to invest in new technology to maintain our market share and operating margins.
Although we do not manufacture any medical equipment, our business entails the risk of claims related to the medical equipment that we outsource and service. We may not have adequate insurance to cover a claim, and it may be more expensive or difficult for us to obtain adequate insurance in the future.
We may be liable for claims related to the use of our medical equipment or to our maintenance or repair of a customer’s medical equipment. Any such claims, if made and upheld, could make our business more expensive to operate and therefore less profitable. We may be subject to claims exceeding our insurance coverage or we may not be able to continue to obtain liability insurance at acceptable levels of cost and coverage. If we are found liable for any significant claims that are not covered by insurance, our liquidity and operating results could be materially adversely affected. In addition, litigation relating to a claim could adversely affect our existing and potential customer relationships, create adverse public relations and divert management’s time and resources from the operation of the business.
We may incur increased costs that we cannot pass through to our customers.
Our customer contracts may include limitations on our ability to increase prices over the term of the contract. On the other hand, we rely on third parties, including subcontractors, to provide some of our services and supplies and we do not always have fixed pricing
contracts with these subcontractors. Therefore, we are at risk of incurring increased costs that we are unable to pass through to our customers.
Any failure of our management information systems could harm our business and operating results.
We depend on our management information systems to actively manage our medical equipment fleet, control capital spending, and provide fleet information, including rental history, condition and availability of our medical equipment. These functions enhance our ability to optimize fleet utilization and redeployment. The inability of our management information systems to operate as we anticipate could damage our reputation with our customers, disrupt our business or result in, among other things, decreased revenues and increased overhead costs. Any such failure could harm our business and results of operations.
There are inherent limitations in all internal control systems over financial reporting, and misstatements due to error or fraud may occur and not be detected.
While we have taken actions designed to address compliance with the internal control over financial reporting and disclosure controls and other requirements of the Sarbanes-Oxley Act of 2002 and the rules and regulations promulgated by the SEC implementing these requirements, there are inherent limitations in our ability to control all circumstances. Our management, including our Chief Executive Officer, Chief Financial Officer and Chief Accounting Officer, does not expect that our internal control over financial reporting and disclosure controls will prevent all error and all fraud. A control system, no matter how well conceived and operated, can provide only reasonable, not absolute, assurance that the objectives of the control system are met. In addition, the design of a control system must reflect the fact that there are resource constraints and the benefit of controls must be relative to their costs. Because of the inherent limitations in all control systems, no evaluation of controls can provide absolute assurance that all control issues and instances of fraud, if any, in our Company have been detected. These inherent limitations include the realities that judgments in decision-making can be faulty and that breakdowns can occur because of simple errors or mistakes. Further, controls can be circumvented by individual acts of some persons, by collusion of two or more persons, or by management override of the controls. The design of any system of controls also is based in part upon certain assumptions about the likelihood of future events, and there can be no assurance that any design will succeed in achieving its stated goals under all potential future conditions. Over time, a control may be inadequate because of changes in conditions, such as growth of the Company or increased transaction volume, or the degree of compliance with the policies or procedures may deteriorate. Because of the inherent limitations in a cost-effective control system, misstatements due to error or fraud may occur and not be detected.
The interests of our principal equity holder may not be aligned with the interests of our other security holders.
IPC beneficially owns securities representing approximately 96% of the voting equity interests of Parent, and therefore indirectly controls our affairs and policies. Circumstances may occur in which the interests of our principal equity holder could be in conflict with the interests of our other security holders. In addition, our principal equity holder may have an interest in pursuing dividends, acquisitions, divestitures, capital expenditures or other transactions that, in its judgment, could enhance its equity investment, even though these transactions might involve risks to our other security holders.
ITEM 1B: Unresolved Staff Comments
None.
As of December 31, 2009, we operated 84 full service district offices and six technical service Centers of Excellence. We lease our district offices, averaging approximately 7,000 square feet, and our Centers of Excellence. None of our offices are dedicated to a single business segment. Our corporate office is located at a 41,000 square foot leased facility in Edina, Minnesota.
The Company, from time to time, may become involved in litigation arising out of operations in the normal course of business. Asserted claims are subject to many uncertainties and the outcome of individual matters is not predictable with assurance.
On October 19, 2009, Freedom Medical, Inc. filed a lawsuit against the Company and others in U.S. District Court for the Eastern District of Texas. The federal complaint alleges violation of state and federal antitrust laws, tortuous interference with business relationships, business disparagement and common law conspiracy in connection with the biomedical equipment rental market. Freedom Medical, Inc. is seeking unspecified damages and injunctive relief. While we believe these claims are without merit, and will vigorously defend against them, we are unable at this time to determine the ultimate outcome of this matter or determine the effect it may have on our business, financial condition or results of operations.
As of December 31, 2009, we were not a party to any other pending legal proceedings the adverse outcome of which could reasonably be expected to have a material adverse effect on our operating results, financial position or cash flows.
ITEM 5: Market for Registrant’s Common Equity, Related Stockholder Matters and Issuer Purchases of Equity Securities
As of March 1, 2010, Parent owns, and at all times during 2009 and 2008 Parent has owned, all 1,000 shares of our common stock, par value $.01 per share. There is no established public trading market for our common stock, and during 2009 and 2008, we did not declare or pay a cash dividend on any class of our common stock. Historically, we have paid no cash dividends and we do not expect to pay them in the foreseeable future. Our debt instruments contain certain restrictions on our ability to pay cash dividends on our common stock (see the information regarding our Notes and senior secured credit facility contained under the caption “Liquidity and Capital Resources” in Item 7 of this Annual Report on Form 10-K).
We did not repurchase any of our equity securities during 2009.
ITEM 6: Selected Financial Data
The selected financial data is presented below under the captions “Statement of Operations Data,” “Other Financial Data,” “Other Operating Data” and “Balance Sheet Data” for and as of the periods presented below. The selected financial data presented below is qualified in its entirety by, and should be read in conjunction with, the financial statements and notes thereto and other financial and statistical information included elsewhere in this Annual Report on Form 10-K, including the information contained under the caption “Management’s Discussion and Analysis of Financial Condition and Results of Operations” in Item 7 of this Annual Report on Form 10-K.
In connection with the Transaction, the Company incurred significant indebtedness and is highly leveraged (see “Liquidity and Capital Resources” under Item 7 to this Annual Report on Form 10-K.) In addition, the purchase price paid in connection with the Acquisition has been allocated to state the acquired assets and liabilities at fair value. The accounting adjustments increased the carrying value of our property and equipment and inventory, established intangible assets for our customer relationships, supply agreement, trade names and trademarks, technology database and non-compete agreements and revalued our long-term benefit plan obligations, among other things. Subsequent to the Transaction, interest expense, non-cash depreciation and amortization charges have significantly increased. As a result, our Successor financial statements are not comparable to our Predecessor financial statements. For a further description of the Transaction see Item 7 to this Annual Report on Form 10-K.
|
|
|
|
|
|
|
Seven |
|
|
Five |
|
|
|
|
|
||||||
|
|
|
|
|
|
|
Months |
|
|
Months |
|
|
|
|
|
||||||
|
|
|
|
|
|
|
Ended |
|
|
Ended |
|
|
|
|
|
||||||
|
|
|
Years Ended December 31, |
|
December 31, |
|
|
May 31, |
|
Years Ended December 31, |
|
||||||||||
|
|
|
2009 |
|
2008 |
|
2007 |
|
|
2007 |
|
2006 |
|
2005 |
|
||||||
|
(in thousands) |
|
(Successor) |
|
(Successor) |
|
(Successor) |
|
|
(Predecessor) |
|
(Predecessor) |
|
(Predecessor) |
|
||||||
|
Statement of Operations Data: |
|
|
|
|
|
|
|
|
|
|
|
|
|
|
||||||
|
Total revenues |
|
$ |
297,204 |
|
$ |
289,119 |
|
$ |
156,454 |
|
|
$ |
107,522 |
|
$ |
225,075 |
|
$ |
215,904 |
|
|
Cost of medical equipment outsourcing, sales and service |
|
196,536 |
|
191,930 |
|
106,422 |
|
|
62,696 |
|
130,872 |
|
127,049 |
|
||||||
|
Gross margin |
|
100,668 |
|
97,189 |
|
50,032 |
|
|
44,826 |
|
94,203 |
|
88,855 |
|
||||||
|
|
|
|
|
|
|
|
|
|
|
|
|
|
|
|
||||||
|
Selling, general and administrative: |
|
|
|
|
|
|
|
|
|
|
|
|
|
|
||||||
|
Transaction and related costs |
|
— |
|
— |
|
306 |
|
|
26,891 |
|
— |
|
— |
|
||||||
|
Intangible asset impairment charge |
|
— |
|
4,000 |
|
— |
|
|
— |
|
— |
|
— |
|
||||||
|
Other selling, general and administrative |
|
84,225 |
|
85,166 |
|
48,647 |
|
|
28,692 |
|
61,940 |
|
58,455 |
|
||||||
|
Total selling, general and administrative |
|
84,225 |
|
89,166 |
|
48,953 |
|
|
55,583 |
|
61,940 |
|
58,455 |
|
||||||
|
Operating income (loss) |
|
16,443 |
|
8,023 |
|
1,079 |
|
|
(10,757 |
) |
32,263 |
|
30,400 |
|
||||||
|
Interest expense |
|
46,505 |
|
46,878 |
|
26,322 |
|
|
13,829 |
|
31,599 |
|
31,127 |
|
||||||
|
Loss on extinguishment of debt |
|
— |
|
— |
|
1,041 |
|
|
22,396 |
|
— |
|
— |
|
||||||
|
Income (loss) before income taxes |
|
(30,062 |
) |
(38,855 |
) |
(26,284 |
) |
|
(46,982 |
) |
664 |
|
(727 |
) |
||||||
|
Provision (benefit) for income taxes |
|
(11,489 |
) |
(15,359 |
) |
(10,188 |
) |
|
492 |
|
612 |
|
842 |
|
||||||
|
Net income (loss) |
|
$ |
(18,573 |
) |
$ |
(23,496 |
) |
$ |
(16,096 |
) |
|
$ |
(47,474 |
) |
$ |
52 |
|
$ |
(1,569 |
) |
|
|
|
|
|
|
|
Seven |
|
|
Five |
|
|
|
|
|
||||||
|
|
|
|
|
|
|
Months |
|
|
Months |
|
|
|
|
|
||||||
|
|
|
|
|
|
|
Ended |
|
|
Ended |
|
|
|
|
|
||||||
|
|
|
Years Ended December 31, |
|
December 31, |
|
|
May 31, |
|
Years Ended December 31, |
|
||||||||||
|
|
|
2009 |
|
2008 |
|
2007 |
|
|
2007 |
|
2006 |
|
2005 |
|
||||||
|
(dollars in thousands) |
|
(Successor) |
|
(Successor) |
|
(Successor) |
|
|
(Predecessor) |
|
(Predecessor) |
|
(Predecessor) |
|
||||||
|
Other Financial Data: |
|
|
|
|
|
|
|
|
|
|
|
|
|
|
||||||
|
Net cash provided by (used in) operating activities |
|
$ |
55,988 |
|
$ |
56,249 |
|
$ |
(4,495 |
) |
|
$ |
34,318 |
|
$ |
48,871 |
|
$ |
43,963 |
|
|
Net cash used in investing activities |
|
(50,550 |
) |
(71,395 |
) |
(370,870 |
) |
|
(48,060 |
) |
(51,711 |
) |
(40,631 |
) |
||||||
|
Net cash provided by (used in) financing activities |
|
$ |
(17,444 |
) |
$ |
27,152 |
|
$ |
375,365 |
|
|
$ |
13,742 |
|
$ |
2,840 |
|
$ |
(3,332 |
) |
|
|
|
|
|
|
|
|
|
|
|
|
|
|
|
|
||||||
|
Other Operating Data (as of end of period): |
|
|
|
|
|
|
|
|
|
|
|
|
|
|
||||||
|
Medical equipment (approximate number of owned outsourcing units) |
|
223,000 |
|
211,000 |
|
194,000 |
|
|
185,000 |
|
173,000 |
|
161,000 |
|
||||||
|
District offices |
|
84 |
|
84 |
|
80 |
|
|
79 |
|
79 |
|
75 |
|
||||||
|
Number of outsourcing hospital customers |
|
4,200 |
|
4,125 |
|
3,875 |
|
|
3,800 |
|
3,600 |
|
3,200 |
|
||||||
|
Number of total outsourcing customers |
|
8,450 |
|
8,150 |
|
7,450 |
|
|
7,200 |
|
6,900 |
|
6,300 |
|
||||||
|
|
|
|
|
|
|
|
|
|
|
|
|
|
|
|
||||||
|
Depreciation and amortization |
|
$ |
87,047 |
|
$ |
85,823 |
|
$ |
48,813 |
|
|
$ |
22,823 |
|
$ |
45,454 |
|
$ |
46,327 |
|
|
Intangible asset impairment charge |
|
— |
|
4,000 |
|
— |
|
|
— |
|
— |
|
— |
|
||||||
|
EBITDA(1)(2) |
|
103,490 |
|
97,846 |
|
48,851 |
|
|
(10,330 |
) |
77,717 |
|
74,984 |
|
||||||
|
|
|
As of December 31, |
|
|
As of December 31, |
|
|||||||||||
|
|
|
2009 |
|
2008 |
|
2007 |
|
|
2006 |
|
2005 |
|
|||||
|
(in thousands) |
|
(Successor) |
|
(Successor) |
|
(Successor) |
|
|
(Predecessor) |
|
(Predecessor) |
|
|||||
|
Balance Sheet Data: |
|
|
|
|
|
|
|
|
|
|
|
|
|||||
|
Working capital (3) |
|
$ |
32,352 |
|
$ |
22,754 |
|
$ |
18,778 |
|
|
$ |
20,913 |
|
$ |
19,379 |
|
|
Total assets |
|
835,403 |
|
877,725 |
|
878,752 |
|
|
265,006 |
|
249,185 |
|
|||||
|
Total debt |
|
518,619 |
|
531,343 |
|
497,335 |
|
|
310,191 |
|
300,480 |
|
|||||
|
Shareholders’ equity (deficiency) |
|
173,991 |
|
188,451 |
|
223,695 |
|
|
(92,981 |
) |
(96,799 |
) |
|||||
(1) EBITDA is defined as earnings before interest expense, income taxes, depreciation and amortization. In addition to using EBITDA internally as a measure of operational performance, we disclose it externally to assist analysts, investors and lenders in their comparisons of operational performance, valuation and debt capacity across companies with differing capital, tax and legal structures. Management also understands that some industry analysts and investors consider EBITDA as a supplementary non-GAAP financial measure useful in analyzing a company’s ability to service debt. EBITDA, however, is not a measure of financial performance under Generally Accepted Accounting Principals (“GAAP”) and should not be considered as an alternative to, or more meaningful than, net income as a measure of operating performance or to cash flows from operating, investing or financing activities or as a measure of liquidity. Since EBITDA is not a measure determined in accordance with GAAP and is thus susceptible to varying interpretations and calculations, EBITDA, as presented, may not be comparable to other similarly titled measures of other companies. EBITDA does not represent an amount of funds that is available for management’s discretionary use. See note 2 below for a reconciliation of net cash provided by operating activities to EBITDA.
(2) The following is a reconciliation of net cash provided by operating activities to EBITDA:
|
|
|
|
|
|
|
Seven |
|
|
Five |
|
|
|
|
|
||||||
|
|
|
|
|
|
|
Months |
|
|
Months |
|
|
|
|
|
||||||
|
|
|
|
|
|
|
Ended |
|
|
Ended |
|
|
|
|
|
||||||
|
|
|
Years Ended December 31, |
|
December 31, |
|
|
May 31, |
|
Years Ended December 31, |
|
||||||||||
|
|
|
2009 |
|
2008 |
|
2007 |
|
|
2007 |
|
2006 |
|
2005 |
|
||||||
|
(in thousands) |
|
(Successor) |
|
(Successor) |
|
(Successor) |
|
|
(Predecessor) |
|
(Predecessor) |
|
(Predecessor) |
|
||||||
|
Net cash provided by (used in) operating activities |
|
$ |
55,988 |
|
$ |
56,249 |
|
$ |
(4,495 |
) |
|
$ |
34,318 |
|
$ |
48,871 |
|
$ |
43,963 |
|
|
Changes in operating assets and liabilities |
|
6,159 |
|
3,601 |
|
34,502 |
|
|
(27,805 |
) |
678 |
|
2,327 |
|
||||||
|
Other non-cash expenses |
|
6,327 |
|
6,477 |
|
2,710 |
|
|
(31,164 |
) |
(4,043 |
) |
(3,275 |
) |
||||||
|
Provision (benefit) for income taxes |
|
(11,489 |
) |
(15,359 |
) |
(10,188 |
) |
|
492 |
|
612 |
|
842 |
|
||||||
|
Interest expense |
|
46,505 |
|
46,878 |
|
26,322 |
|
|
13,829 |
|
31,599 |
|
31,127 |
|
||||||
|
EBITDA |
|
$ |
103,490 |
|
$ |
97,846 |
|
$ |
48,851 |
|
|
$ |
(10,330 |
) |
$ |
77,717 |
|
$ |
74,984 |
|
(3) Represents total current assets (excluding cash and cash equivalents) less total current liabilities (excluding current portion of long-term debt).
Segment Information
|
|
|
Year Ended December 31, 2009 |
|
|
|
|||||||||||
|
|
|
(Successor) |
|
|
|
|||||||||||
|
(in thousands) |
|
Medical |
|
Technical and |
|
Medical |
|
Corporate and |
|
Total |
|
|||||
|
Revenues |
|
$ |
232,623 |
|
$ |
42,395 |
|
$ |
22,186 |
|
$ |
— |
|
$ |
297,204 |
|
|
Cost of revenue |
|
83,553 |
|
30,539 |
|
18,177 |
|
— |
|
132,269 |
|
|||||
|
Medical equipment depreciation |
|
64,267 |
|
— |
|
— |
|
— |
|
64,267 |
|
|||||
|
Gross margin |
|
$ |
84,803 |
|
$ |
11,856 |
|
$ |
4,009 |
|
$ |
— |
|
$ |
100,668 |
|
|
|
|
|
|
|
|
|
|
|
|
|
|
|||||
|
Total assets |
|
$ |
420,940 |
|
$ |
85,867 |
|
$ |
18,603 |
|
$ |
309,993 |
|
$ |
835,403 |
|
|
|
|
Year Ended December 31, 2008 |
|
|
|
|||||||||||
|
|
|
(Successor) |
|
|
|
|||||||||||
|
(in thousands) |
|
Medical |
|
Technical and |
|
Medical |
|
Corporate and |
|
Total |
|
|||||
|
Revenues |
|
$ |
223,676 |
|
$ |
45,225 |
|
$ |
20,218 |
|
$ |
— |
|
$ |
289,119 |
|
|
Cost of revenue |
|
82,030 |
|
32,676 |
|
15,473 |
|
— |
|
130,179 |
|
|||||
|
Medical equipment depreciation |
|
61,751 |
|
— |
|
— |
|
— |
|
61,751 |
|
|||||
|
Gross margin |
|
$ |
79,895 |
|
$ |
12,549 |
|
$ |
4,745 |
|
$ |
— |
|
$ |
97,189 |
|
|
|
|
|
|
|
|
|
|
|
|
|
|
|||||
|
Total assets |
|
$ |
432,643 |
|
$ |
86,559 |
|
$ |
18,603 |
|
$ |
339,920 |
|
$ |
877,725 |
|
|
|
|
Seven Months Ended December 31, 2007 |
|
|
|
|||||||||||
|
|
|
(Successor) |
|
|
|
|||||||||||
|
(in thousands) |
|
Medical |
|
Technical and |
|
Medical |
|
Corporate and |
|
Total |
|
|||||
|
Revenues |
|
$ |
119,808 |
|
$ |
26,437 |
|
$ |
10,209 |
|
$ |
— |
|
$ |
156,454 |
|
|
Cost of revenue |
|
43,104 |
|
19,855 |
|
9,005 |
|
— |
|
71,964 |
|
|||||
|
Medical equipment depreciation |
|
34,458 |
|
— |
|
— |
|
— |
|
34,458 |
|
|||||
|
Gross margin |
|
$ |
42,246 |
|
$ |
6,582 |
|
$ |
1,204 |
|
$ |
— |
|
$ |
50,032 |
|
|
|
|
|
|
|
|
|
|
|
|
|
|
|||||
|
Total assets |
|
$ |
447,240 |
|
$ |
91,856 |
|
$ |
18,746 |
|
$ |
320,910 |
|
$ |
878,752 |
|
|
|
|
Five Months Ended May 31, 2007 |
|
|
|
|||||||||||
|
|
|
(Predecessor) |
|
|
|
|||||||||||
|
|
|
Medical |
|
Technical and |
|
Medical |
|
Corporate and |
|
Total |
|
|||||
|
Revenues |
|
$ |
84,855 |
|
$ |
14,800 |
|
$ |
7,867 |
|
$ |
— |
|
$ |
107,522 |
|
|
Cost of revenue |
|
27,694 |
|
10,124 |
|
6,366 |
|
— |
|
44,184 |
|
|||||
|
Medical equipment depreciation |
|
18,512 |
|
— |
|
— |
|
— |
|
18,512 |
|
|||||
|
Gross margin |
|
$ |
38,649 |
|
$ |
4,676 |
|
$ |
1,501 |
|
$ |
— |
|
$ |
44,826 |
|
Segment assets for the three business segments (excluding Corporate and Unallocated) primarily include goodwill and intangible assets, which is consistent with the Company’s reporting to its Chief Operating Decision Maker. Other assets are not allocated to the three business segments. Thus, assets included in Corporate and Unallocated contain all other Company assets.
Item 7: Management’s Discussion and Analysis of Financial Condition and Results of Operations
OVERVIEW
We are a leading nationwide provider of medical equipment outsourcing and lifecycle solutions to the United States health care industry. Our customers include national, regional and local acute care hospitals, alternate site providers (such long term acute care hospitals, skilled nursing facilities, specialty hospitals, nursing homes, and home care providers) and medical equipment manufacturers. We provide our customers solutions across the spectrum of the equipment life cycle as a result of our position as one of the industry’s largest purchasers and outsourcers of medical equipment. During the year ended December 31, 2009, we owned or managed over 520,000 pieces of medical equipment consisting of 330,000 owned or managed pieces in our Medical Equipment Outsourcing segment and 190,000 pieces of customer owned equipment we managed in our Technical and Professional Services segment. Our diverse medical equipment outsourcing customer base includes more than 4,200 acute care hospitals and approximately 4,250 alternate site providers. We also have relationships with more than 200 medical equipment manufacturers and many of the nation’s largest group purchasing organizations (“GPOs”) and many of the integrated delivery networks (“IDNs”). All of our solutions leverage our nationwide network of 84 offices and our more than 70 years of experience managing and servicing all aspects of medical equipment. Our fees are paid directly by our customers rather than from direct reimbursement from third-party payors, such as private insurers, Medicare, or Medicaid. We commenced operations in 1939, originally incorporated in Minnesota in 1954 and reincorporated in Delaware in 2001.
As one of the nation’s leading medical equipment lifecycle services companies, we design and offer comprehensive solutions for our customers that help reduce capital and operating expenses while increasing equipment and staff productivity and support improved patient safety and outcomes.
We report our financial results in three segments to reflect how we manage our business. Our reporting segments consist of Medical Equipment Outsourcing, Technical and Professional Services, and Medical Equipment Sales and Remarketing. We evaluate the performance of our reporting segments based on gross margin and gross margin, before purchase accounting adjustments. The accounting policies of the individual reporting segments are the same as those of the entire company. Our revenue, profits, and assets for our reporting segments for the prior five years are described in “Item 6 — Selected Financial Data.”
We present the non-GAAP financial measure gross margin, before purchase accounting adjustments, because we use this measure to monitor and evaluate the operational performance of our business and to assist analysts, investors and lenders in their comparisons of operational performance across companies, many of whose results will not include similar adjustments. A reconciliation of the non-GAAP financial measure to its equivalent Generally Accepted Accounting Principals (“GAAP”) measure is therefore included in the respective tables.
On May 31, 2007, UHS Holdco, Inc. (“Parent”) acquired all of the outstanding capital stock of the Company for approximately $712.0 million in cash less debt, tender premium and accrued interest and capitalized leases per the terms of the Agreement and Plan of Merger, dated as of April 15, 2007, by and among the Company, Parent and Parent’s wholly owned subsidiary, Merger Sub, and related documents which resulted in the occurrence of the events outlined in Note 3 to our audited financial statements in Part IV of this Annual Report on Form 10-K which we collectively refer to as the “Transaction” or the “Acquisition.” Parent is owned by affiliates of Irving Place Capital Merchant Manager III, L.P. (formerly known as Bear Stearns Merchant Manager III, L.P.) and certain members of our management, whom we collectively refer to as the “equity investors.” Parent and Merger Sub are corporations that were formed, for the purpose of completing the Acquisition, by Bear Stearns Merchant Banking, which was affiliated with Bear Stearns & Co. Inc. and which became an independent firm on November 1, 2008, changing its name to Irving Place Capital (“IPC”).
In conjunction with the Acquisition, the Company initiated a cash tender offer to purchase its $260.0 million outstanding aggregate principal amount of its 10.125% Senior Notes due 2011, which the Company completed for $235.0 million of such notes on May 31, 2007, and Merger Sub issued $230.0 million in aggregate principal amount of its Floating Rate Notes due 2015 and $230.0 million in aggregate principal amount of its PIK Toggle Notes due 2015 (the PIK Toggle Notes and the Floating Rate Notes are collectively referred to as the “Notes”). Concurrently with the closing of the Acquisition, Merger Sub merged with and into the Company, which was the surviving corporation and the Company assumed Merger Sub’s obligations with respect to the Notes and related second lien senior indenture dated as of May 31, 2007, between us and Wells Fargo Bank, National Association, as trustee (“Second Lien Senior Indenture”).
In 2007, the Acquisition and the allocation of the purchase price to the opening balance sheet accounts of the Successor were recorded as of the beginning of the first day of our new accounting period (June 1, 2007).
Although the Company continued as the surviving legal entity after the Acquisition, the accompanying information presents our results preceding the Acquisition (“Predecessor”) and the periods subsequent to the Acquisition (“Successor”). All references to the years ended December 31, 2009 and 2008, and the seven months ended December 31, 2007 refer to our Successor results. All references to the five months ended May 31, 2007 and prior years refer to our Predecessor results.
CRITICAL ACCOUNTING POLICIES
Although we underwent significant ownership and organizational changes in 2007, as a result of the Transaction, our critical accounting policies have remained consistent between Predecessor and Successor.
The preparation of consolidated financial statements in conformity with accounting principles generally accepted in the United States of America requires management to make certain estimates and assumptions that affect the reported amounts of assets and liabilities and disclosure of contingent assets and liabilities at the date of the financial statements and the reported amounts of revenues and expenses during the reporting period. Management bases these estimates on historical experience and other assumptions believed to be reasonable under the circumstances. However, actual results could differ from these estimates. Management believes the critical accounting policies and areas that require more significant judgments and estimates used in the preparation of our consolidated financial statements to be:
· allowance for doubtful accounts;
· recoverability and valuation of long-lived and intangible assets, including goodwill;
· self-insurance reserves for worker’s compensation, employee health care and auto insurance plans;
· potential litigation liabilities; and
· income taxes.
We estimate the allowance for doubtful accounts considering a number of factors, including:
· historical experience;
· aging of the accounts receivable; and
· specific information obtained by us on the condition and the current creditworthiness of our customers.
If the financial condition of our customers were to deteriorate and affect the ability of our customers to make payments on their accounts, we may be required to increase our allowance by recording additional bad debt expense. Likewise, should the financial condition of our customers improve and result in payments or settlements of previously reserved amounts, we may be required to record a reduction in bad debt expense to reverse the recorded allowance.
For indefinite lived intangible assets, including goodwill and trade names, we review for impairment annually and upon the occurrence of certain events as required by Accounting Standards Codification (“ASC”) Topic 350, “Intangibles — Goodwill and Other.” We monitor the occurrence of certain events quarterly. For goodwill, possible impairment is evaluated based on the estimated fair value of each reporting unit. Our reporting units are Medical Equipment Outsourcing, Technical and Professional Services,
and Medical Equipment Sales and Remarketing. The fair value of each reporting unit incorporates multiple inputs including discounted cash flow calculations, peer company earnings multiples, and assumptions that market participants would make in valuing the reporting unit. Other assumptions include future business growth, earnings projections, capital expenditures, changes in working capital and the weighted average cost of capital used for purposes of discounting. Projecting discounted future cash flows requires us to make significant estimates regarding the assumptions noted above. The projections also take into account several factors including current and estimated economic trends and outlook, and other factors which are beyond our control. Each reporting unit constitutes a business for which discrete financial information is available and management reviews its operating results. As of December 31, 2009, the fair value of goodwill for each reporting unit significantly exceeded its respective carrying value. No goodwill impairments have been recognized in 2009, 2008 or 2007.
We annually review for impairment our trade names that have indefinite lives and are not amortized. Our calculation of estimated fair value is made using the “relief from royalty method,” which assumes that a trade name has a fair value equal to the present value of the royalty attributed to it. The royalty income attributable to a trade name represents the hypothetical cost savings that are derived from owning the trade name versus paying royalties to license the trade name from another owner. Accordingly, we estimate a fair royalty that a licensee would pay, on a percentage of revenue basis, to obtain a license to utilize the trade name for each of our Medical Equipment Outsourcing and Technical and Professional Services segments. In the fourth quarter of 2008 we recognized a $4.0 million impairment loss related to our Technical and Professional Service segment trade names. As of December 31, 2009, the estimated fair values of our Medical Equipment Outsourcing segment trade name and our Technical and Professional Services segment trade name significantly exceeded their respective carrying value.
For long-lived and amortizable intangible assets, an impairment is evaluated when an event (such as those noted in ASC 360-10-35-21) is indicated. This evaluation is conducted at the lowest level of identifiable cash flows for the long-lived and amortizable asset subject to evaluation. If there is an indication of impairment based on this evaluation, possible impairment is evaluated based on the estimated fair value of the long-lived or amortizable asset in comparison to its carrying value. Our amortizable intangible assets consist of the following discrete items: customer relationships, a supply agreement, a technology database, non-compete agreements and favorable lease agreements. For other long-lived assets, primarily movable medical equipment, we continuously monitor specific makes/models for events such as product recalls or obsolescence.
We estimate our liability for worker’s compensation and auto self-insurance plans by applying insurance industry standard loss development factors to our experienced claims information. Significant changes in claims activity would have a direct impact on the amount of expense we recognize in association with these self-insurance programs. Self-insurance costs related to our employee health care are accrued based upon the aggregate
of the liability for reported claims and estimated liability for claims development and incurred but not reported.
As disclosed in Item 3, the Company, from time to time, may become involved in litigation arising out of operations in the normal course of business. Accruals for loss contingencies associated with these matters are made when it is determined that a liability is probable and the amount can be reasonably estimated. The assessment of the probable liabilities is based on the facts and circumstances known at the time that the financial statements are being prepared. For cases in which it is determined that a liability has been incurred but only a range for the potential loss exists, the minimum amount of the range is recorded and subsequently adjusted as better information becomes available. Accruals for defense related costs are made upon becoming informed of potential litigation and once we have sufficient information to reasonably estimate our defense costs.
Judgment, uncertainty, and estimates are significant aspects of our income tax accrual process that accounts for the effects of current and deferred income taxes. Uncertainty associated with the application of tax statutes and regulations and the outcomes of tax audits and appeals require that judgment and estimates be made in the accrual process and in the calculation of our Effective Tax Rate (“ETR”).
Our ETR is also highly impacted by assumptions. ETR calculations are revised based on the best available year-end tax assumptions (income levels, deductions, credits, etc.); adjusted in the following year after returns are filed, with the tax accrual estimates being trued-up to the actual amounts claimed on the tax returns; and further adjusted after examinations by taxing authorities have been completed.
We evaluate the recoverability of our deferred tax assets by scheduling the expected reversals of non-tax deferred tax assets and liabilities in order to determine whether net operating loss carry forwards are recoverable prior to expiration in accordance with ASC 740-10-30-18. If future earnings or other assumptions are required in order for such future tax benefits to be realized, we will evaluate whether a valuation allowance is required.
Guidance related to accounting for uncertainty in income taxes, now codified as ASC Topic 740, “Income Taxes,” has impacted the income tax accrual process in that the new accounting rule requires that only tax benefits that meet the “more likely than not” recognition threshold can be recognized or continue to be recognized. The change in the unrecognized tax benefits needs to be reasonably estimated based on evaluation of the nature of uncertainty, the nature of events that could cause the change and an estimate of the range of reasonably possible changes. At any period end, and as new developments occur, management will use prudent business judgment to cease recognition of appropriate amounts of tax benefits. Unrecognized tax benefits can be recognized as issues are favorably resolved and loss exposures decline.
As disputes with the IRS and state tax authorities are resolved over time, we may need to adjust our unrecognized tax benefits to the updated estimates needed to satisfy tax and
interest obligations for the related issues. These adjustments may be favorable or unfavorable.
PREDECESSOR ACQUISITIONS
As part of our growth strategy, we regularly review and evaluate potential acquisition opportunities.
On April 1, 2007, we completed the acquisition of customer contracts and other assets of the ICMS division of Intellamed, Inc. (“Intellamed”), located in Bryan, Texas. The purchase price was $14.6 million including direct costs and the assumption of certain liabilities, taking into account certain adjustments and a holdback. The asset purchase agreement governing this acquisition provided for additional consideration to be paid if certain revenue targets are met during the two years following this acquisition. We have not recorded any such additional consideration.
We financed the foregoing acquisition with borrowings under our Amended Credit Agreement (see “Liquidity and Capital Resources” below).
RESULTS OF OPERATIONS
The following table provides information on the percentages of certain items of selected financial data compared to total revenues. The table also indicates the percentage increase or decrease comparing fiscal 2009 to 2008. The percentage increase or decrease comparing the 2007 periods with fiscal 2008 is not presented because we do not consider these results to be comparable due to the Transaction.
|
|
|
|
|
|
|
|
|
|
|
Percent |
|
|
|
|
|
|
|
|
|
|
|
|
|
Increase |
|
|
|
|
|
Percent of Total Revenues |
|
(Decrease) |
|
|||||||
|
|
|
|
|
|
|
Seven Months |
|
|
Five Months |
|
Year Ended |
|
|
|
|
Year Ended |
|
Year Ended |
|
Ended |
|
|
Ended |
|
2009 over |
|
|
|
|
December 31, |
|
December 31, |
|
December 31, |
|
|
May 31, |
|
Year Ended |
|
|
|
|
2009 |
|
2008 |
|
2007 |
|
|
2007 |
|
2008 |
|
|
|
|
(Successor) |
|
(Successor) |
|
(Successor) |
|
|
(Predecessor) |
|
(Successor) |
|
|
Revenue |
|
|
|
|
|
|
|
|
|
|
|
|
|
Medical equipment outsourcing |
|
78.3 |
% |
77.4 |
% |
76.6 |
% |
|
78.9 |
% |
4.0 |
% |
|
Technical and professional services |
|
14.2 |
|
15.6 |
|
16.9 |
|
|
13.8 |
|
(6.3 |
) |
|
Medical equipment sales and remarketing |
|
7.5 |
|
7.0 |
|
6.5 |
|
|
7.3 |
|
9.7 |
|
|
Total revenues |
|
100.0 |
% |
100.0 |
% |
100.0 |
% |
|
100.0 |
% |
2.8 |
% |
|
|
|
|
|
|
|
|
|
|
|
|
|
|
|
Cost of Revenue |
|
|
|
|
|
|
|
|
|
|
|
|
|
Cost of medical equipment outsourcing |
|
28.1 |
|
28.4 |
|
27.6 |
|
|
25.8 |
|
1.9 |
|
|
Cost of technical and professional services |
|
10.3 |
|
11.2 |
|
12.7 |
|
|
9.4 |
|
(6.5 |
) |
|
Cost of medical equipment sales and remarketing |
|
6.1 |
|
5.4 |
|
5.8 |
|
|
5.9 |
|
17.5 |
|
|
|
|
|
|
|
|
|
|
|
|
|
|
|
|
Movable medical equipment depreciation |
|
21.6 |
|
21.4 |
|
22.0 |
|
|
17.2 |
|
4.1 |
|
|
Total costs of medical equipment outsourcing, technical and professional services and medical equipment sales and remarketing |
|
66.1 |
|
66.4 |
|
68.1 |
|
|
58.3 |
|
2.4 |
|
|
Gross margin |
|
33.9 |
|
33.6 |
|
31.9 |
|
|
41.7 |
|
3.6 |
|
|
|
|
|
|
|
|
|
|
|
|
|
|
|
|
Selling, general and administrative |
|
28.4 |
|
29.4 |
|
31.1 |
|
|
26.7 |
|
(1.1 |
) |
|
Transaction and related costs |
|
— |
|
— |
|
0.2 |
|
|
25.0 |
|
|
* |
|
Intangible asset impairment charge |
|
— |
|
1.4 |
|
— |
|
|
— |
|
|
* |
|
Operating income (loss) |
|
5.5 |
|
2.8 |
|
0.6 |
|
|
(10.0 |
) |
104.9 |
|
|
|
|
|
|
|
|
|
|
|
|
|
|
|
|
Interest expense |
|
15.6 |
|
16.2 |
|
16.8 |
|
|
12.9 |
|
(0.8 |
) |
|
Loss on extinguishment of debt |
|
— |
|
— |
|
0.7 |
|
|
20.8 |
|
|
* |
|
Loss before income taxes |
|
(10.1 |
) |
(13.4 |
) |
(16.9 |
) |
|
(43.7 |
) |
(22.6 |
) |
|
|
|
|
|
|
|
|
|
|
|
|
|
|
|
Provision (benefit) for income taxes |
|
(3.9 |
) |
(5.3 |
) |
(6.5 |
) |
|
0.5 |
|
(25.2 |
) |
|
Net Loss |
|
(6.2 |
)% |
(8.1 |
)% |
(10.4 |
)% |
|
(44.2 |
)% |
(21.0 |
)% |
* Not meaningful
Results of Operations for the Year Ended December 31, 2009 compared to the Year Ended December 31, 2008
Medical Equipment Outsourcing Segment — Manage & Utilize
|
|
|
|
|
|
|
|
|
|
|
|||
|
|
|
Year Ended |
|
|
|
|
|
|||||
|
|
|
December 31, |
|
|
|
|
|
|||||
|
(in thousands) |
|
2009 |
|
2008 |
|
Change |
|
% Change |
|
|||
|
Total revenue |
|
$ |
232,623 |
|
$ |
223,676 |
|
$ |
8,947 |
|
4.0 |
% |
|
Cost of revenue |
|
83,553 |
|
82,030 |
|
1,523 |
|
1.9 |
|
|||
|
Medical equipment depreciation |
|
64,267 |
|
61,751 |
|
2,516 |
|
4.1 |
|
|||
|
Gross margin |
|
$ |
84,803 |
|
$ |
79,895 |
|
$ |
4,908 |
|
6.1 |
|
|
|
|
|
|
|
|
|
|
|
|
|||
|
Gross margin % |
|
36.5 |
% |
35.7 |
% |
|
|
|
|
|||
|
|
|
|
|
|
|
|
|
|
|
|||
|
Gross margin |
|
$ |
84,803 |
|
$ |
79,895 |
|
$ |
4,908 |
|
6.1 |
|
|
Purchase accounting adjustments, primarily non-cash charges related to step-up in carrying value of medical equipment |
|
14,147 |
|
15,906 |
|
(1,759 |
) |
(11.1 |
) |
|||
|
Gross margin, before purchase accounting adjustments |
|
$ |
98,950 |
|
$ |
95,801 |
|
$ |
3,149 |
|
3.3 |
% |
|
|
|
|
|
|
|
|
|
|
|
|||
|
Gross margin %, before purchase accounting adjustments |
|
42.5 |
% |
42.8 |
% |
|
|
|
|
|||
Total revenue in the Medical Equipment Outsourcing segment for the year ended December 31, 2009 increased by $8.9 million, or 4.0%, to $232.6 million as compared to the same period of 2008. The increase was primarily driven through the net addition of 13 Asset Management Partnership Program (“AMPP”) customers during 2009 and increased revenues driven by incremental business from new and existing technology, both owned and managed.
Total cost of revenue in the segment for the year ended December 31, 2009 increased by $1.5 million, or 1.9%, to $83.6 million as compared to the same period of 2008. Cost of revenue in this segment relates primarily to employee-related expenses, equipment repair and maintenance charges related to our movable medical equipment fleet, occupancy and freight charges. During the year ended December 31, 2009, we experienced increased employee-related expenses of $2.4 million partially offset by decreases in our freight and other expenses of $0.6 and $0.3 million, respectively.
Medical equipment depreciation for the year ended December 31, 2009 increased by $2.5 million, or 4.1%, to $64.3 million as compared to the same period of 2008. The increase is primarily attributable to the timing of medical equipment purchases, as approximately 40% of our medical equipment purchases for the year ended December 31, 2008 occurred during the fourth quarter of 2008. This resulted in a full year of depreciation expense related to these assets for the year ended December 31, 2009. Medical equipment depreciation for the years ended December 31, 2009 and 2008 includes $13.3 and $14.7 million, respectively, of charges relating to purchase accounting adjustments related to the 2007 step-up in carrying value of medical equipment.
Gross margin percentage for the Medical Equipment Outsourcing segment was 36.5% and 35.7%, for the years ended December 31, 2009 and 2008, respectively.
Gross margin percentage, before purchase accounting adjustments was 42.5% and 42.8%, for the years ended December 31, 2009 and 2008, respectively.
Technical and Professional Services Segment — Plan & Acquire; Maintain & Repair
|
|
|
|
|
|
|
|
|
|
|
|||
|
|
|
Year Ended |
|
|
|
|
|
|||||
|
|
|
December 31, |
|
|
|
|
|
|||||
|
(in thousands) |
|
2009 |
|
2008 |
|
Change |
|
% Change |
|
|||
|
Total revenue |
|
$ |
42,395 |
|
$ |
45,225 |
|
$ |
(2,830 |
) |
(6.3 |
)% |
|
Cost of revenue |
|
30,539 |
|
32,676 |
|
(2,137 |
) |
(6.5 |
) |
|||
|
Gross margin |
|
$ |
11,856 |
|
$ |
12,549 |
|
$ |
(693 |
) |
(5.5 |
) |
|
|
|
|
|
|
|
|
|
|
|
|||
|
Gross margin % |
|
28.0 |
% |
27.7 |
% |
|
|
|
|
|||
|
|
|
|
|
|
|
|
|
|
|
|||
|
Gross margin |
|
$ |
11,856 |
|
$ |
12,549 |
|
$ |
(693 |
) |
(5.5 |
) |
|
Purchase accounting adjustments, primarily non-cash charges related to favorable lease commitments |
|
17 |
|
27 |
|
(10 |
) |
(37.0 |
) |
|||
|
Gross margin, before purchase accounting adjustments |
|
$ |
11,873 |
|
$ |
12,576 |
|
$ |
(703 |
) |
(5.6 |
)% |
|
|
|
|
|
|
|
|
|
|
|
|||
|
Gross margin %, before purchase accounting adjustments |
|
28.0 |
% |
27.8 |
% |
|
|
|
|
|||
Total revenue in the Technical and Professional Services segment for the year ended December 31, 2009 decreased by $2.8 million, or 6.3% to $42.4 million as compared to the same period of 2008. During the year ended December 31, 2009, we experienced a decrease of $2.5 million and $0.3 million in our manufacturer service and other revenues, respectively. The decrease was primarily attributable to the episodic nature of the manufacturer services unit of our business.
Total cost of revenue in the segment for the year ended December 31, 2009 decreased by $2.1 million, or 6.5% to $30.5 million as compared to the same period of 2008. Cost of revenue consists primarily of employee-related expenses, vendor expenses and occupancy charges. This decrease was primarily attributable to a decrease in expenses associated with our manufacturer services unit and third-party vendor expenses of $2.1 and $1.3 million, respectively, partially offset by an increase in employee labor related and other charges of $1.0 and $0.3 million, respectively.
Gross margin percentage for the Technical and Professional Services segment was 28.0% and 27.7% for the years ended December 31, 2009 and 2008, respectively. Gross margin percentage will fluctuate based on the variability of third-party vendor expenses in our Customized Health Care Asset Management Program (CHAMP) and supplemental service programs.
Medical Equipment Sales and Remarketing Segment — Redeploy & Remarket
|
|
|
|
|
|
|
|
|
|
|
|||
|
|
|
Year Ended |
|
|
|
|
|
|||||
|
|
|
December 31, |
|
|
|
|
|
|||||
|
(in thousands) |
|
2009 |
|
2008 |
|
Change |
|
% Change |
|
|||
|
Total revenue |
|
$ |
22,186 |
|
$ |
20,218 |
|
$ |
1,968 |
|
9.7 |
% |
|
Cost of revenue |
|
18,177 |
|
15,473 |
|
2,704 |
|
17.5 |
|
|||
|
Gross margin |
|
$ |
4,009 |
|
$ |
4,745 |
|
$ |
(736 |
) |
(15.5 |
) |
|
|
|
|
|
|
|
|
|
|
|
|||
|
Gross margin % |
|
18.1 |
% |
23.5 |
% |
|
|
|
|
|||
|
|
|
|
|
|
|
|
|
|
|
|||
|
Gross margin |
|
$ |
4,009 |
|
$ |
4,745 |
|
$ |
(736 |
) |
(15.5 |
) |
|
Purchase accounting adjustments, primarily non-cash charges related to step-up in carrying value of our medical equipment |
|
877 |
|
842 |
|
35 |
|
4.2 |
|
|||
|
Gross margin, before purchase accounting adjustments |
|
$ |
4,886 |
|
$ |
5,587 |
|
$ |
(701 |
) |
(12.5 |
)% |
|
|
|
|
|
|
|
|
|
|
|
|||
|
Gross margin %, before purchase accounting adjustments |
|
22.0 |
% |
27.6 |
% |
|
|
|
|
|||
Total revenue in the Medical Equipment Sales and Remarketing segment for the year ended December 31, 2009 increased by $2.0 million, or 9.7%, to $22.2 million as compared to the same period of 2008. The increase was primarily driven by an increase in new equipment and disposable sales of $1.7 and $1.8 million, respectively, partially offset by a decrease in pre-owned equipment sales of $1.5 million.
Total cost of revenue in the segment for the year ended December 31, 2009 increased by $2.7 million, or 17.5%, to $18.2 million as compared to the same period of 2008. The increase was primarily due to an increase in the cost of new equipment, disposables sales, and other expenses of $2.0, $1.4 and $0.3 million, respectively, offset by a decrease in the cost of pre-owned equipment sales of $1.0 million. During the years ended December 31, 2009 and 2008, purchase accounting adjustments of $0.9 and $0.8 million, respectively, primarily related to the increase in the carrying value of medical equipment and inventory, impacted the cost of revenue.
Gross margin percentage for the Medical Equipment Sales and Remarketing segment was 18.1% and 23.5% for the years ended December 31, 2009 and 2008, respectively.
Gross margin percentage, before purchase accounting adjustments, for the Medical Equipment Sales and Remarketing segment was 22.0% and 27.6% for the years ended December 31, 2009 and 2008, respectively.
During the year ended December 31, 2009, gross margin percentage and gross margin percentage, before purchase accounting adjustments, were negatively impacted by larger individual sales with lower margins. Margins and activity in this segment will fluctuate based on the transactional nature of the business.
Selling, General and Administrative and Interest Expense
|
|
|
|
|
|
|
|
|
|
|
|||
|
|
|
Year Ended |
|
|
|
|
|
|||||
|
|
|
December 31, |
|
|
|
|
|
|||||
|
(in thousands) |
|
2009 |
|
2008 |
|
$ Change |
|
% Change |
|
|||
|
Selling, general and administrative |
|
$ |
84,225 |
|
$ |
85,166 |
|
$ |
(941 |
) |
(1.1 |
)% |
|
Intangible Asset Impairment Charge |
|
— |
|
4,000 |
|
(4,000 |
) |
|
* |
|||
|
Interest expense |
|
46,505 |
|
46,878 |
|
(373 |
) |
(0.8 |
) |
|||
* Not meaningful
Selling, General and Administrative
Selling, general, and administrative expenses for the year ended December 31, 2009 decreased by $0.9 million, or 1.1%, to $84.2 million as compared to the same period of 2008. Selling, general, and administrative expenses consist primarily of employee-related expenses, professional fees, occupancy charges, bad debt expense, depreciation and amortization. The decrease is primarily attributable to lower amortization, stock option, bad debt, and other expense of $1.4, $1.2, $0.5 and $0.4 million, respectively. These decreases were partially offset by an increase in employee-related expenses and outside services of $1.5 and $1.1 million, respectively. Selling, general, and administrative expense as a percentage of total revenue was 28.4% and 29.4% for the years ended December 31, 2009 and 2008, respectively.
Interest Expense
Interest expense for the year ended December 31, 2009 decreased by $0.4 million, or 0.8%, to $46.5 million as compared to the same period of 2008. The decrease is primarily attributable to lower average interest rates on our senior secured credit facility. Interest expense includes amortization of deferred financing fees associated with our debt of $2.4 million for each of the years ended December 31, 2009 and 2008, respectively.
Income Taxes
Income tax benefit was $11.5 and $15.4 million for the years ended December 31, 2009 and 2008, respectively. We moved from a net deferred tax asset position prior to the Transaction, where tax expense related primarily to minimum state taxes due to valuation allowances established for net operating losses not recognized, to a net deferred tax liability position after the Transaction. Management believes the valuation allowance is no longer necessary as we determined that it was more likely than not that the benefits of these deferred tax assets will be realized.
Net Loss
Net loss was $18.6 and $23.5 million for the years ended December 31, 2009 and 2008, respectively. Net loss for the year ended December 31, 2008 was impacted by a $4.0 million intangible asset impairment charge related our Technical and Professional Service segment trade name.
EBITDA
Earnings Before Interest, Taxes, Depreciation and Amortization (“EBITDA”) was $103.5 and $97.8 million for the years ended December 31, 2009 and 2008, respectively. EBITDA for the year ended December 31, 2009 was negatively impacted by purchasing accounting adjustments related to the transaction, offset by increased activity in our Medical Equipment Outsourcing segment.
EBITDA is defined as earnings before interest expense, income taxes, depreciation and amortization. In addition to using EBITDA internally as measure of operational performance, we disclose it externally to assist analysts, investors and lenders in their comparisons of operational performance, valuation and debt capacity across companies with differing capital, tax and legal structures. Management also understands that some industry analysts and investors consider EBITDA as a supplementary non-GAAP financial measure useful in analyzing a company’s ability to service debt. EBITDA, however, is not a measure of financial performance under GAAP and should not be considered as an alternative to, or more meaningful than, net income as a measure of operating performance or to cash flows from operating, investing or financing activities or as a measure of liquidity. Since EBITDA is not a measure determined in accordance with GAAP and is thus susceptible to varying interpretations and calculations, EBITDA, as presented, may not be comparable to other similarly titled measures of other companies. EBITDA does not represent an amount of funds that is available for management’s discretionary use.
For a reconciliation of EBITDA to net cash provided by operating activities, see note (2) under the caption “Selected Financial Data” in Item 6 of this Annual Report on Form 10-K.
Results of Operations for the Year ended December 31, 2008 (Successor) compared to the Seven Months Ended December 31, 2007 (Successor) and Five Months Ended May 31, 2007 (Predecessor)
Medical Equipment Outsourcing Segment — Manage & Utilize
|
|
|
|
|
Seven Months |
|
|
Five Months |
|
|||
|
|
|
Year Ended |
|
Ended |
|
|
Ended |
|
|||
|
|
|
December 31, |
|
December 31, |
|
|
May 31, |
|
|||
|
|
|
2008 |
|
2007 |
|
|
2007 |
|
|||
|
(in thousands) |
|
(Successor) |
|
(Successor) |
|
|
(Predecessor) |
|
|||
|
Total revenue |
|
$ |
223,676 |
|
$ |
119,808 |
|
|
$ |
84,855 |
|
|
Cost of revenue |
|
82,030 |
|
43,104 |
|
|
27,694 |
|
|||
|
Medical equipment depreciation |
|
61,751 |
|
34,458 |
|
|
18,512 |
|
|||
|
Gross margin |
|
$ |
79,895 |
|
$ |
42,246 |
|
|
$ |
38,649 |
|
|
|
|
|
|
|
|
|
|
|
|||
|
Gross margin % |
|
35.7 |
% |
35.3 |
% |
|
45.5 |
% |
|||
|
|
|
|
|
|
|
|
|
|
|||
|
Gross margin |
|
$ |
79,895 |
|
$ |
42,246 |
|
|
$ |
38,649 |
|
|
Purchase accounting adjustments, primarily non-cash charges related to step-up in carrying value of medical equipment |
|
15,906 |
|
9,889 |
|
|
— |
|
|||
|
Gross margin, before purchase accounting adjustments |
|
$ |
95,801 |
|
$ |
52,135 |
|
|
$ |
38,649 |
|
|
|
|
|
|
|
|
|
|
|
|||
|
Gross margin %, before purchase accounting adjustments |
|
42.8 |
% |
43.5 |
% |
|
45.5 |
% |
|||
Total revenue in the Medical Equipment Outsourcing segment was $223.7, $119.8, and $84.9 million for the year ended December 31, 2008, seven months ended December 31, 2007, and five months ended May 31, 2007, respectively. During the year ended December 31, 2008, we experienced increased revenues driven by organic and competitive takeaways in our acute care and AMPP customer base and incremental business from new and existing technology, both owned and managed.
Total cost of revenue in the segment was $82.0, $43.1, and $27.7 million for the year ended December 31, 2008, seven months ended December 31, 2007, and five months ended May 31, 2007, respectively. Cost of revenue in this segment relates primarily to employee related expenses, equipment repair and maintenance charges related to our movable medical equipment fleet, occupancy and freight charges. Cost of revenue for the year ended December 31, 2008 and seven months ended December 31, 2007 include $1.0 and $1.1 million, respectively, of charges relating to losses on disposals of equipment which was revalued in conjunction with the Transaction. During the year ended December 31, 2008, we experienced increased freight, employee, and vehicle related expenses, a portion of which related to building our infrastructure for new business opportunities.
Medical equipment depreciation was $61.8, $34.5, and $18.5 million for the year ended December 31, 2008, seven months ended December 31, 2007, and five months ended May 31, 2007, respectively. Medical equipment depreciation for the year ended December 31, 2008 and seven months ended December 31, 2007 include $14.7 and $8.6 million, respectively, of charges relating to purchase accounting adjustments. In May 2007, we determined that certain pieces of respiratory equipment in our medical equipment fleet were impaired as defined by guidance now codified as ASC Topic 350, Property, Plant, and Equipment,” and we wrote-off all $0.9 million of this equipment’s remaining net book value.
Gross margin percentage for the Medical Equipment Outsourcing segment was 35.7%, 35.3%, and 45.5% for the year ended December 31, 2008, seven months ended December 31, 2007, and five months ended May 31, 2007, respectively. Gross margin percentage for the year ended December 31, 2008 and seven months ended December 31, 2007 was negatively impacted by purchase accounting adjustments relating primarily to our medical equipment fleet.
Gross margin percentage, before purchase accounting adjustments was 42.8%, 43.5%, and 45.5% for the year ended December 31, 2008, seven months ended December 31, 2007, and five months ended May 31, 2007, respectively.
Technical and Professional Services Segment — Plan & Acquire; Maintain & Repair
|
|
|
|
|
Seven Months |
|
|
Five Months |
|
|||
|
|
|
Year Ended |
|
Ended |
|
|
Ended |
|
|||
|
|
|
December 31, |
|
December 31, |
|
|
May 31, |
|
|||
|
|
|
2008 |
|
2007 |
|
|
2007 |
|
|||
|
(in thousands) |
|
(Successor) |
|
(Successor) |
|
|
(Predecessor) |
|
|||
|
Total revenue |
|
$ |
45,225 |
|
$ |
26,437 |
|
|
$ |
14,800 |
|
|
Cost of revenue |
|
32,676 |
|
19,855 |
|
|
10,124 |
|
|||
|
Gross margin |
|
$ |
12,549 |
|
$ |
6,582 |
|
|
$ |
4,676 |
|
|
|
|
|
|
|
|
|
|
|
|||
|
Gross margin % |
|
27.7 |
% |
24.9 |
% |
|
31.6 |
% |
|||
|
|
|
|
|
|
|
|
|
|
|||
|
Gross margin |
|
$ |
12,549 |
|
$ |
6,582 |
|
|
$ |
4,676 |
|
|
Purchase accounting adjustments, primarily non-cash charges related to favorable lease commitments |
|
27 |
|
24 |
|
|
— |
|
|||
|
Gross margin, before purchase accounting adjustments |
|
$ |
12,576 |
|
$ |
6,606 |
|
|
$ |
4,676 |
|
|
|
|
|
|
|
|
|
|
|
|||
|
Gross margin %, before purchase accounting adjustments |
|
27.8 |
% |
25.0 |
% |
|
31.6 |
% |
|||
Total revenue in the Technical and Professional Services segment was $45.2, $26.4, and $14.8 million for the year ended December 31, 2008, seven months ended December 31, 2007, and five months ended May 31, 2007, respectively. Revenue for the Successor periods benefited from the acquisition of the assets of the ICMS division of Intellamed on April 1, 2007, and increased manufacturer service activity, partially offset by continued
sales force attention on converting new customers in our Medical Equipment Outsourcing segment as well as selected contract terminations.
Total cost of revenue in the segment was $32.7, $19.9, and $10.1 million for the year ended December 31, 2008, seven months ended December 31, 2007, and five months ended May 31, 2007, respectively. Cost of revenue consists primarily of employee related expenses, vendor expenses and occupancy charges.
Gross margin percentage for the Technical and Professional Services segment was 27.7%, 24.9%, and 31.6% for the year ended December 31, 2008, seven months ended December 31, 2007, and five months ended May 31, 2007, respectively. Gross margin percentage will fluctuate based on the variability of third-party vendor expenses in our CHAMP and supplemental service programs.
Medical Equipment Sales and Remarketing Segment — Redeploy & Remarket
|
|
|
|
|
Seven Months |
|
|
Five Months |
|
|||
|
|
|
Year Ended |
|
Ended |
|
|
Ended |
|
|||
|
|
|
December 31, |
|
December 31, |
|
|
May 31, |
|
|||
|
|
|
2008 |
|
2007 |
|
|
2007 |
|
|||
|
(in thousands) |
|
(Successor) |
|
(Successor) |
|
|
(Predecessor) |
|
|||
|
Total revenue |
|
$ |
20,218 |
|
$ |
10,209 |
|
|
$ |
7,867 |
|
|
Cost of revenue |
|
15,473 |
|
9,005 |
|
|
6,366 |
|
|||
|
Gross margin |
|
$ |
4,745 |
|
$ |
1,204 |
|
|
$ |
1,501 |
|
|
|
|
|
|
|
|
|
|
|
|||
|
Gross margin % |
|
23.5 |
% |
11.8 |
% |
|
19.1 |
% |
|||
|
|
|
|
|
|
|
|
|
|
|||
|
Gross margin |
|
$ |
4,745 |
|
$ |
1,204 |
|
|
$ |
1,501 |
|
|
Purchase accounting adjustments, primarily non-cash charges related to step-up in carrying value of inventories and medical equipment |
|
842 |
|
979 |
|
|
— |
|
|||
|
Gross margin, before purchase accounting adjustments |
|
$ |
5,587 |
|
$ |
2,183 |
|
|
$ |
1,501 |
|
|
|
|
|
|
|
|
|
|
|
|||
|
Gross margin %, before purchase accounting adjustments |
|
27.6 |
% |
21.4 |
% |
|
19.1 |
% |
|||
Total revenue in the Medical Equipment Sales and Remarketing segment was $20.2, $10.2, and $7.9 million for the year ended December 31, 2008, seven months ended December 31, 2007, and five months ended May 31, 2007, respectively.
Total cost of revenue in the segment was $15.5, $9.0, and $6.4 million for the year ended December 31, 2008, seven months ended December 31, 2007, and five months ended May 31, 2007, respectively. Cost of revenue in this segment consists primarily of cost of inventory and equipment sold and occupancy charges. During the year ended December 31, 2008 and seven months ended December 31, 2007, purchase accounting adjustments of $0.8 and $1.0 million, respectively, primarily related to the increase in the carrying value of medical equipment and inventory, impacted the cost of revenue.
Gross margin percentage for the Medical Equipment Sales and Remarketing segment was 23.5%, 11.8%, and 19.1% for the year ended December 31, 2008, seven months ended December 31, 2007, and five months ended May 31, 2007, respectively. Purchase accounting adjustments negatively impacted the gross margin percentage for the year ended December 31, 2008 and seven months ended December 31, 2007. Margins during each of the seven and five month 2007 periods were negatively impacted by larger individual sales with lower margins.
Gross margin percentage, before purchase accounting adjustments, for the Medical Equipment Sales and Remarketing segment was 27.6%, 21.4%, and 19.1% for the year ended December 31, 2008, seven months ended December 31, 2007, and five months ended May 31, 2007, respectively. Margins and activity in this segment will fluctuate based on the transactional nature of the business.
Selling, General and Administrative, Transaction and Related Costs, Intangible asset Impairment Charges, Interest Expense, and Loss on Extinguishment of Debt
|
|
|
|
|
Seven Months |
|
|
Five Months |
|
|||
|
|
|
Year Ended |
|
Ended |
|
|
Ended |
|
|||
|
|
|
December 31, |
|
December 31, |
|
|
May 31, |
|
|||
|
|
|
2008 |
|
2007 |
|
|
2007 |
|
|||
|
(in thousands) |
|
(Successor) |
|
(Successor) |
|
|
(Predecessor) |
|
|||
|
Selling, general and administrative |
|
$ |
85,166 |
|
$ |
48,647 |
|
|
$ |
28,692 |
|
|
Transaction and related costs |
|
— |
|
306 |
|
|
26,891 |
|
|||
|
Intangible asset Impairment charge |
|
4,000 |
|
— |
|
|
— |
|
|||
|
Interest expense |
|
46,878 |
|
26,322 |
|
|
13,829 |
|
|||
|
Loss on extinguishment of debt |
|
— |
|
1,041 |
|
|
22,396 |
|
|||
Selling, General and Administrative
Selling, general and administrative expense was $85.2, $48.6, and $28.7 million for the year ended December 31, 2008, seven months ended December 31, 2007, and five months ended May 31, 2007, respectively. Selling, general and administrative expenses consist primarily of employee-related expenses, professional fees, occupancy charges, bad debt expense, depreciation and amortization. Expenses during the year ended December 31, 2008 and seven months ended December 31, 2007 include $15.7 and $9.4 million, respectively, of charges related to the amortization of our intangible assets which were recorded at fair value in connection with the Transaction and non-cash stock-based compensation expense related to the 2007 Stock Option Plan of Parent of $2.5 and $2.4 million, respectively. Expenses during the five months ended May 31, 2007 include expense related to our 2003 Stock Option Plan of $1.2 million. Selling, general and administrative expense as a percentage of total revenue was 29.4%, 31.1%, and 26.7% for the year ended December 31, 2008, seven months ended December 31, 2007, and five months ended May 31, 2007 respectively.
Transaction and Related Costs
We incurred $0.3 and $26.9 million of expenses in connection with the Transaction during the seven months ended December 31, 2007 and five months ended May 31, 2007, respectively. During the seven months ended December 31, 2007, these expenses consisted primarily of accounting and legal fees. During the five months ended May 31, 2007, these expenses consisted primarily of accounting, legal, investment banking advisory and restructuring expenses totaling $13.7 million, expensed IPC fees of $6.5 million and stock-based compensation expense related to the accelerated vesting of options under our 2003 Stock Option Plan of $6.7 million.
Impairment Charge
In the fourth quarter of 2008 we recognized a $4.0 million impairment loss related to our Technical and Professional Service segment trade names. Our review was based on an hypothetical royalty value associated with the present value of estimated future cash flows of our Technical and Professional Services segment.
Interest Expense
Interest expense was $46.9, $26.3, and $13.8 million for the year ended December 31, 2008, seven months ended December 31, 2007, and five months ended May 31, 2007, respectively. Interest expense during the year ended December 31, 2008 and seven months ended December 31, 2007 includes interest charges related to the increased debt issued in connection with the Transaction, partially offset by lower average interest rates. Interest expense includes amortization of deferred financing fees associated with our debt of $2.4, $1.4, and $0.7 million for the year ended December 31, 2008, seven months ended December 31, 2007, and five months ended May 31, 2007.
Loss on Extinguishment of Debt
During the seven months ended December 31, 2007, we incurred $1.0 million of expense related to the purchase of $15.0 million of our 10.125% Senior Notes, due 2011. The expense consisted of a call premium of $0.7 million and the write-off of $0.3 million of unamortized deferred financing costs.
During the five months ended May 31, 2007, we incurred $22.4 million of expense related to the purchase of $235.0 million of our 10.125% Senior Notes and the termination of our Amended Credit Agreement in connection with the Transaction. The expense consisted of call premiums of $16.1 million related to our 10.125% Senior Notes and the write-off of $6.3 million of unamortized deferred financing costs related to our 10.125% Senior Notes and Amended Credit Agreement.
Income Taxes
Income tax (benefit) expense was $(15.4), $(10.2), and $0.5 million for the year ended December 31, 2008, seven months ended December 31, 2007, and five months ended May 31, 2007, respectively. We moved from a net deferred tax asset position prior to the Transaction, where tax expense related primarily to minimum state taxes due to valuation allowances established for net operating losses not recognized, to a net deferred tax liability position after the Transaction. Management believes the valuation allowance is no longer necessary as we determined that it was more likely than not that the benefits of these deferred tax assets will be realized.
Net Loss
Net loss was $23.5, $16.1, and $47.5 million for the year ended December 31, 2008, seven months ended December 31, 2007, and five months ended May 31, 2007, respectively. Net loss for the year ended December 31, 2008 and seven months ended December 31, 2007 was impacted by Transaction related purchase accounting adjustments and interest associated with our Notes, partially offset by strong revenues in our Medical Equipment Outsourcing Segment and income tax benefit. Net loss for the year ended December 31, 2008 was further impacted by a $4.0 million intangible asset impairment charge related our Technical and Professional Service segment trade name. Net loss for the five months ended May 31, 2007, was impacted by $26.9 million of Transaction and related costs and $22.4 million of loss on the extinguishment of debt.
EBITDA
Earnings Before Interest, Taxes, Depreciation and Amortization (“EBITDA”) was $97.8, $48.9, and $(10.3) million for the year ended December 31, 2008, seven months ended December 31, 2007, and five months ended May 31, 2007, respectively. EBITDA for the year ended December 31, 2008 was negatively impacted by purchasing accounting adjustments related to the transaction, offset by increased activity in our Medical Equipment Outsourcing segment. EBITDA for the seven months ended December 31, 2007 was primarily impacted by purchase accounting adjustments related to the Transaction and loss on the extinguishment of debt. EBITDA for the five months ended May 31, 2007 was primarily impacted by Transaction and related expenses and loss on the extinguishment of debt.
EBITDA is defined as earnings before interest expense, income taxes, depreciation and amortization. In addition to using EBITDA internally as measure of operational performance, we discloses it externally to assist analysts, investors and lenders in their comparisons of operational performance, valuation and debt capacity across companies with differing capital, tax and legal structures. Management also understands that some industry analysts and investors consider EBITDA as a supplementary non-GAAP financial measure useful in analyzing a company’s ability to service debt. EBITDA, however, is not a measure of financial performance under GAAP and should not be considered as an alternative to, or more meaningful than, net income as a measure of
operating performance or to cash flows from operating, investing or financing activities or as a measure of liquidity. Since EBITDA is not a measure determined in accordance with GAAP and is thus susceptible to varying interpretations and calculations, EBITDA, as presented, may not be comparable to other similarly titled measures of other companies. EBITDA does not represent an amount of funds that is available for management’s discretionary use.
For a reconciliation of EBITDA to net cash provided by operating activities, see note 2 under the caption “Selected Financial Data” in Item 6 of this Annual Report on Form 10-K.
LIQUIDITY AND CAPITAL RESOURCES
Financing Structure. Our major sources of funds are comprised of $230.0 million PIK Toggle Notes, $230.0 million Floating Rate Notes, $135.0 million senior secured credit facility, $9.9 million 10.125% Senior Notes, and $12.4 million of vehicle leases.
PIK Toggle Notes. On May 31, 2007, Merger Sub issued $230.0 million aggregate original principal amount of 8.50% / 9.25% PIK Toggle Notes (the “PIK Toggle Notes”) under the Second Lien Senior Indenture (see “Second Lien Senior Indenture” below). At the closing of the Transaction, as the surviving corporation in the Acquisition, we assumed all the obligations of Merger Sub under the Second Lien Senior Indenture.
For any interest payment period through June 1, 2011, we may, at our option, elect to pay cash interest, PIK interest or 50% cash interest and 50% PIK interest. Cash interest on the PIK Toggle Notes accrues at the rate of 8.50% per annum. PIK interest on the PIK Toggle Notes accrues at the rate of 9.25% per annum. After June 1, 2011, we are required to make all interest payments on the PIK Toggle Notes entirely as cash interest. All PIK Toggle Notes mature on June 1, 2015. Interest on the PIK Toggle Notes is payable semiannually in arrears on each June 1 and December 1. As of December 31, 2009, we intend to make future payments in the form of cash interest.
We may redeem some or all of the PIK Toggle Notes at any time prior to June 1, 2011, at a price equal to 100% of the principal amount thereof, plus the applicable premium (as defined by the Second Lien Senior Indenture), plus accrued and unpaid interest, if any, to the date of redemption. In addition, on or before June 1, 2010, we may redeem up to 40% of the aggregate principal amount of the PIK Toggle Notes with the net proceeds of certain equity offerings.
Except as noted above, we cannot redeem the PIK Toggle Notes until June 1, 2011. Thereafter we may redeem some or all of the PIK Toggle Notes at the redemption prices (expressed as percentages of principal amount) set forth below plus accrued and unpaid interest, if any, on the PIK Toggle Notes redeemed, to the applicable redemption date, if redeemed during the 12-month period beginning on June 1 of the years indicated below, subject to the rights of noteholders:
|
Year |
|
Percentage |
|
|
2011 |
|
104.250 |
% |
|
2012 |
|
102.125 |
% |
|
2013 and thereafter |
|
100.000 |
% |
Upon the occurrence of a change of control, each holder of the PIK Toggle Notes has the right to require us to repurchase some or all of such holder’s PIK Toggle Notes at a price in cash equal to 101% of the aggregate principal amount thereof plus accrued and unpaid interest, and PIK Interest, if any, to the date of purchase.
Our PIK Toggle Notes are subject to certain debt covenants which are described below under the heading “Second Lien Senior Indenture.”
Floating Rate Notes. On May 31, 2007, Merger Sub issued $230.0 million aggregate original principal amount of Floating Rate Notes (the “Floating Rate Notes”) under the Second Lien Senior Indenture (see “Second Lien Senior Indenture” below). Interest on the Floating Rate Notes is reset for each semi-annual interest period and is calculated at the current LIBOR rate plus 3.375%. At December 31, 2009, our LIBOR-based rate was 3.859%, which includes the credit spread noted above. Interest on the Floating Rate Notes is payable semiannually, in arrears, on each June 1 and December 1. At the closing of the Transaction, as the surviving corporation in the Acquisition, we assumed all the obligations of Merger Sub under the Second Lien Senior Indenture. The Floating Rate Notes mature on June 1, 2015.
We may redeem some or all of the Floating Rate Notes at the redemption prices (expressed as percentages of principal amount) set forth below plus accrued and unpaid interest, if any, on the Floating Rate Notes redeemed, to the applicable redemption date, if redeemed during the 12-month period beginning on June 1 of the years indicated below, subject to the rights of noteholders:
|
Year |
|
Percentage |
|
|
2009 |
|
102.000 |
% |
|
2010 |
|
101.000 |
% |
|
2011 and thereafter |
|
100.000 |
% |
Upon the occurrence of a change of control, each holder of the Floating Rate Notes has the right to require us to repurchase some or all of such holder’s Floating Rate Notes at a price in cash equal to 101% of the aggregate principal amount thereof plus accrued and unpaid interest, if any, to the date of purchase.
Our Floating Rate Notes are subject to certain debt covenants which are described below under the heading “Second Lien Senior Indenture.”
Interest Rate Swap. In June 2007, we entered into an interest rate swap agreement for $230.0 million, which has the effect of converting the interest rate applicable to our
$230.0 million of Floating Rate Notes to fixed interest rates. The effective date for the interest rate swap agreement was December 2007 and the expiration date is May 2012.
The interest rate swap agreement qualifies for cash flow hedge accounting under ASC Topic 815, “Derivatives and Hedging.” Both at inception and on an on-going basis, we must perform an effectiveness test. In accordance with ASC Topic 815, the fair value of the interest rate swap agreement at December 31, 2009 is included as a cash flow hedge on our balance sheet. The change in fair value was recorded as a component of accumulated other comprehensive loss on our balance sheet, net of tax, since the instrument was determined to be an effective hedge at December 31, 2009. We have not recorded any amounts due to ineffectiveness for any periods presented. We expect to reclassify approximately $6.2 million into earnings, currently recorded in accumulated other comprehensive loss, in the next 12 months.
As a result of our interest rate swap agreement, we expect the effective interest rate on our $230.0 million Floating Rate Notes to be 9.065% through May 2012.
Second Lien Senior Indenture. Our PIK Toggle Notes and Floating Rate Notes, or the Notes, are guaranteed, jointly and severally, on a second priority senior secured basis, by certain of our future domestic subsidiaries. We do not currently have any subsidiaries. The Notes are our second priority senior secured obligations and rank:
· equal in right of payment with all of our existing and future unsecured and unsubordinated indebtedness, and effectively senior to any such unsecured indebtedness to the extent of the value of collateral;
· senior in right of payment to all of our and our guarantor’s existing and future subordinated indebtedness;
· effectively junior to our senior secured credit facility and other obligations that are secured by first priority liens on the collateral securing the Notes or that are secured by a lien on assets that are not part of the collateral securing the Notes, in each case, to the extent of the value of such collateral or assets; and
· structurally subordinated to any indebtedness and other liabilities (including trade payables) of any of our future subsidiaries that are not guarantors.
The Second Lien Senior Indenture governing the Notes contains covenants that limit our and our guarantors’ ability, subject to certain definitions and exceptions, and certain of our future subsidiaries’ ability to:
· incur additional indebtedness;
· pay cash dividends or distributions on our capital stock or repurchase our capital stock or subordinated debt;
· issue redeemable stock or preferred stock;
· issue stock of subsidiaries;
· make certain investments;
· transfer or sell assets;
· create liens on our assets to secure debt;
· enter into transactions with affiliates; and
· merge or consolidate with another company.
The Second Lien Senior Indenture specifies certain events of default, including among others, failure to pay principal, interest or premium, violation of covenants and agreements, cross-defaults to other material agreements, bankruptcy events, invalidity of guarantees, and a default in the performance by us of the security documents relating to the Second Lien Senior Indenture. Some events of default will be triggered only after certain grace or cure periods have expired, or provide for materiality thresholds. In the event certain bankruptcy-related defaults occur, the Notes will become due and payable immediately. If any other default occurs, the Trustee (and in some cases the noteholders) would be entitled to take various actions, including acceleration of amounts due under the Second Lien Senior Indenture.
Senior Secured Credit Facility. In connection with the Transaction, the Company and Parent entered into a new first lien senior secured asset-based revolving credit facility providing for loans in an amount of up to $135.0 million pursuant to a credit agreement, dated as of May 31, 2007, with a group of financial institutions. We refer to this credit facility as the “senior secured credit facility.” The senior secured credit facility is available for working capital and general corporate purposes, including permitted investments, capital expenditures and debt repayments, on a fully revolving basis, subject to the terms and conditions set forth in the credit documents in the form of revolving loans, swing line loans and letters of credit.
The senior secured credit facility provides financing of up to $135.0 million, subject to a borrowing base calculated on the basis of certain of our eligible accounts receivable, inventory and equipment. As of December 31, 2009, we had $93.0 million of availability under our senior secured credit facility based on a borrowing base of $135.0 million less borrowings of $38.4 million and after giving effect to $3.6 million used for letters of credit.
The senior secured credit facility matures on May 31, 2013. Our obligations under the senior secured credit facility are secured by a first priority security interest in substantially all of our assets, excluding a pledge of our and Parent’s capital stock, any joint ventures and certain other exceptions. Our obligations under the senior secured credit facility are unconditionally guaranteed by our Parent.
The senior secured credit facility provides that we have the right at any time to request up to $50.0 million of additional commitments, but the lenders are under no obligation to provide any such additional commitments, and any increase in commitments will be subject to customary conditions precedent, such as an absence of any default or events of default. If we were to request any such additional commitments and the existing lenders or new lenders were to agree to provide such commitments, the senior secured credit facility size could be increased to up to $185.0 million, but our ability to borrow would still be limited by the amount of the borrowing base.
Borrowings under the senior secured credit facility accrue interest (including a credit spread varying with facility usage):
· at a per annum rate equal to 0.50% above the rate announced from time to time by the agent as the “prime rate” payable quarterly in arrears; and
· at a per annum rate equal to 1.50% above the adjusted LIBOR rate used by the agent, for the respective interest rate period determined at our option, payable in arrears upon cessation of the interest rate period elected.
At December 31, 2009, we had LIBOR-based rates which were accruing interest at rates ranging from 1.731% to 1.734%, each of which include the credit spread noted above. At December 31, 2009, we had a prime rate borrowing which was accruing interest at 4.000%, which includes the credit spread noted above.
Overdue principal, interest and other amounts will bear interest at a rate per annum equal to 2% in excess of the applicable interest rate. The applicable margins of the senior secured credit facility will be subject to adjustment based upon leverage ratios. The senior secured credit facility also provides for customary letter of credit fees, closing fees, unused line fees and other fees.
The senior secured credit facility requires our compliance with various affirmative and negative covenants. Pursuant to the affirmative covenants, we and Parent will, among other things, deliver financial and other information to the agent, provide notice of certain events (including events of default), pay our obligations, maintain our properties, maintain the security interest in the collateral for the benefit of the agent and the lenders and maintain insurance.
Among other restrictions, and subject to certain definitions and exceptions, the senior secured credit facility restricts our ability to:
· incur indebtedness;
· create or permit liens;
· declare or pay dividends and certain other restricted payments;
· consolidate, merge or recapitalize;
· acquire or sell assets;
· make certain investments, loans or other advances;
· enter into transactions with affiliates;
· change our line of business; and
· enter into hedging transactions.
The senior secured credit facility also contains a financial covenant that is calculated if our available borrowing capacity is less than $15.0 million for a certain period. Such covenant consists of a minimum ratio of trailing four-quarter EBITDA to cash interest expense, as defined in the credit agreement dated May 31, 2007.
The senior secured credit facility specifies certain events of default, including among others, failure to pay principal, interest or fees, violation of covenants, inaccuracy of representations or warranties, bankruptcy events, certain ERISA-related events, cross-defaults to other material agreements, change of control events, and invalidity of guarantees or security documents. Some events of default will be triggered only after certain cure periods have expired, or will provide for materiality thresholds. If such a default occurs, the lenders under the senior secured credit facility would be entitled to take various actions, including all actions permitted to be taken by a secured creditor and the acceleration of amounts due under the senior secured credit facility.
10.125% Senior Notes. The 10.125% Senior Notes (“Senior Notes”) mature on November 1, 2011. Interest on the Senior Notes accrues at the rate of 10.125% per annum and is payable semiannually on each May 1 and November 1.
On May 17, 2007, we entered into a supplemental indenture to the Indenture governing our Senior Notes, dated as of October 17, 2003, between the Company and Wells Fargo Bank, National Association, as trustee. The Indenture governs the terms of the Senior Notes. The supplemental indenture amended the Indenture.
The amendments to the Indenture that are set forth in the supplemental indenture (the “Amendments”) became operative after we purchased all of the Senior Notes validly tendered and not withdrawn pursuant to our tender offer and consent solicitation. As of May 11, 2007, holders of Senior Notes representing an amount greater than a majority of the principal amount of outstanding Senior Notes had validly tendered their Senior Notes and consented to the execution of the supplemental indenture. The Amendments eliminated from the Indenture:
· requirements to file reports with the Securities and Exchange Commission (“SEC”);
· requirements to pay taxes;
· limitations on our ability to use defenses against usury;
· the limitation on restricted payments;
· the limitation on payment of dividends and other payment restrictions affecting subsidiaries;
· limitations on incurrence of indebtedness and issuance of preferred stock;
· limitations on asset sales and requirements to repurchase the Senior Notes with excess proceeds thereof;
· limitations on affiliate transactions;
· limitations on liens;
· limitations on the businesses in which we and our subsidiaries may engage;
· requirements to preserve corporate existence;
· requirements to purchase the Senior Notes upon a change of control;
· limitation on the issuance of guarantees of indebtedness;
· limitations on the payments for consent from holders of Senior Notes;
· limitations on mergers, consolidation and sale of assets with respect to us;
· limitations on mergers or consolidation of, or transfer of assets of, guarantors; and
· certain events of default.
In May 2007, in connection with the Transaction, we tendered for all of our outstanding Senior Notes, pursuant to their terms. On May 31, 2007, $235.0 million of our Senior Notes were purchased. We paid $253.1 million, including a call premium of $16.1 million and accrued interest of $2.0 million to complete the purchase. We used proceeds from the issuance of our Notes to redeem a portion of our Senior Notes.
On June 13, 2007, we purchased an additional $15.1 million of our remaining Senior Notes, pursuant to their terms. We paid $15.9 million of cash including a call premium of $0.7 million and accrued interest of $0.1 million to complete the purchase.
We have the right to redeem some or all of the remaining $9.9 million of Senior Notes at the principal amount, plus accrued and unpaid interest, if any, subject to the rights of the noteholders.
Termination of Our Amended Credit Agreement. In connection with the Transaction, we repaid all outstanding balances and terminated our Amended Credit Agreement.
Liquidity
Our principal sources of liquidity are expected to be cash flows from operating activities and borrowings under our senior secured credit facility, which matures in May 2013. It is anticipated that our principal uses of liquidity will be to fund capital expenditures related to purchases of medical equipment, provide working capital, meet debt service requirements and finance our strategic plans.
We require substantial cash to operate our Medical Equipment Outsourcing programs and service our debt. Our outsourcing programs require us to invest a significant amount of cash in medical equipment purchases. To the extent that such expenditures cannot be funded from our operating cash flow, borrowing under our senior secured credit facility or other financing sources, we may not be able to conduct our business or grow as currently planned. We currently expect that over the next 12 months, we will invest approximately $90.0 million in new medical equipment and other capital expenditures. This estimate is subject to numerous assumptions, including revenue growth and the number of AMPP program signings.
If we are unable to generate sufficient cash flow from operations in order to service our debt, we will be forced to take actions such as reducing or delaying capital expenditures, selling assets, restructuring or refinancing our debt, electing to pay PIK interest on our PIK Toggle Notes, or seeking additional equity capital. This, to a certain extent, is subject to general economic, financial, competitive, legislative, regulatory and other factors that are beyond our control. If we are unable to repay our debt at maturity, we may have to obtain alternative financing, which may not be available to us.
The following table sets forth selected historical information regarding our cash flows:
|
|
|
|
|
|
|
Seven |
|
|
Five |
|
||||
|
|
|
|
|
|
|
Months |
|
|
Months |
|
||||
|
|
|
|
|
|
|
Ended |
|
|
Ended |
|
||||
|
|
|
Years Ended December 31, |
|
December 31, |
|
|
May 31, |
|
||||||
|
|
|
2009 |
|
2008 |
|
2007 |
|
|
2007 |
|
||||
|
(in thousands) |
|
(Successor) |
|
(Successor) |
|
(Successor) |
|
|
(Predecessor) |
|
||||
|
Other Financial Data: |
|
|
|
|
|
|
|
|
|
|
||||
|
Net cash provided by (used in) operating activities |
|
$ |
55,988 |
|
$ |
56,249 |
|
$ |
(4,495 |
) |
|
$ |
34,318 |
|
|
Net cash used in investing activities |
|
(50,550 |
) |
(71,395 |
) |
(370,870 |
) |
|
(48,060 |
) |
||||
|
Net cash provided by (used in) financing activities |
|
(17,444 |
) |
27,152 |
|
375,365 |
|
|
13,742 |
|
||||
Net cash provided by (used in) operating activities was $56.0, $56.2, $(4.5) and $34.3, million for the years ended December 31, 2009 and 2008, the seven months ended December 31, 2007 and the five months ended May 31, 2007, respectively. During the seven months ended December 31, 2007, net cash used in operating activities was impacted by the cash payments related to the previously accrued loss on extinguishment of debt of $16.8 million and $19.7 million of previously accrued Transaction costs. Cash provided by operating activities for the years ended December 31, 2009 and 2008 was not affected by Transaction costs.
Net cash used in investing activities was $50.6, $71.4, $370.9 and $48.1 million for the years ended December 31, 2009 and 2008, the seven months ended December 31, 2007 and the five months ended May 31, 2007, respectively. During the year ended December 31, 2009 net cash used in investing activities was primarily impacted by lower equipment purchases compared to the same period of 2008. During the seven months ended December 31, 2007, net cash used in investing activities was primarily comprised of $335.1 million used for the Acquisition of Universal Hospital Services, Inc. by Parent. During the five months ended May 31, 2007, net cash used in investing activities was impacted by $14.6 million for the acquisition of the assets of the ICMS division of Intellamed.
Net cash provided by (used in) financing activities was $(17.4), $27.2, $375.4, and $13.7 million for the years ended December 31, 2009 and 2008, the seven months ended December 31, 2007 and the five months ended May 31, 2007, respectively. During the year ended December 31, 2009, we had a net pay down of our senior secured credit facility of $10.6 million compared to net increase in borrowings of $29.5 million during the year ended December 31, 2008. During the seven months ended December 31, 2007, net cash provided by financing activities benefited from the issuance of our Notes and cash equity contributions of $460.0 and $239.8 million, respectively and, partially offset by cash outlays related to the purchase of certain Predecessor debt.
Off-Balance Sheet Arrangements
As part of our ongoing business, we do not participate in transactions that generate relationships with unconsolidated entities or financial partnerships, such as entities often
referred to as structured finance or special purpose entities (“SPEs”), which would have been established for the purpose of facilitating off-balance sheet arrangements or other contractually narrow or limited purposes. As of December 31, 2009, we do not have any SPE transactions.
Contractual Obligations. The following is a summary as of December 31, 2009, of our future contractual obligations:
|
|
|
Payments due by period |
|
|||||||||||||
|
(in thousands) |
|
|
|
|
|
|
|
|
|
2015 and |
|
|||||
|
Contractual Obligations |
|
Total |
|
2010 |
|
2011-2012 |
|
2013-2014 |
|
Beyond |
|
|||||
|
Long-term debt principal obligations |
|
$ |
518,619 |
|
$ |
4,062 |
|
$ |
14,129 |
|
$ |
39,877 |
|
$ |
460,551 |
|
|
Interest on Senior Notes |
|
2,014 |
|
1,007 |
|
1,007 |
|
— |
|
— |
|
|||||
|
Interest on Notes (1) |
|
159,649 |
|
40,400 |
|
70,374 |
|
39,100 |
|
9,775 |
|
|||||
|
Interest on capital lease obligations |
|
612 |
|
308 |
|
219 |
|
79 |
|
6 |
|
|||||
|
Operating lease obligations |
|
28,045 |
|
5,706 |
|
9,325 |
|
7,455 |
|
5,559 |
|
|||||
|
Purchase obligations |
|
3,877 |
|
3,877 |
|
— |
|
— |
|
— |
|
|||||
|
Pension obligations (2) |
|
685 |
|
685 |
|
— |
|
— |
|
— |
|
|||||
|
Unrecognized tax positions (3) |
|
2,100 |
|
— |
|
— |
|
— |
|
— |
|
|||||
|
Total contractual obligations |
|
$ |
715,601 |
|
$ |
56,045 |
|
$ |
95,054 |
|
$ |
86,511 |
|
$ |
475,891 |
|
|
|
|
|
|
|
|
|
|
|
|
|
|
|||||
|
Other commercial commitments: |
|
|
|
|
|
|
|
|
|
|
|
|||||
|
Stand by letter of credit |
|
$ |
3,575 |
|
$ |
— |
|
$ |
— |
|
$ |
— |
|
$ |
— |
|
|
(1) |
|
In June 2007, we entered into an interest rate swap agreement that is accounted for as a cash flow hedge. The interest rate swap agreement is effective through May 2012. Interest rates through the interest rate swap agreement period were prepared using our expected effective interest rate. Interest rates subsequent to the termination date of the interest rate swap agreement have not been included as we cannot reasonably estimate future interest payments (See “Interest Rate Swap” above). If the interest rate on our $230.0 million of Floating Rate Notes was 3.859%, after the expiration of the swap, interest payments on these Floating Rate Notes would be $8.9 million annually. |
|
(2) |
|
While our pension liability at December 31, 2009 was approximately $6.4 million, we cannot reasonably estimate required payments beyond 2010 due to changing actuarial and market conditions. |
|
(3) |
|
We cannot reasonably determine the exact timing of payments related to our unrecognized tax positions. |
Based on the level of operating performance expected in 2010, we believe our cash from operations, together with additional borrowings under our senior secured credit facility, will meet our liquidity needs for the foreseeable future, exclusive of any borrowings that we may make to finance potential acquisitions. However, if during that period or thereafter we are not successful in generating sufficient cash flows from operations or in raising additional capital when required in sufficient amounts and on terms acceptable to us, our business could be adversely affected. As of December, 31, 2009, we had $93.0 million of unused borrowing availability under our senior secured credit facility based on a borrowing base of $135.0 million less borrowings of $38.4 million and after giving effect to $3.6 million used for letters of credit.
Our levels of borrowing are further restricted by the financial covenants set forth in our senior secured credit facility agreement and the Second Lien Senior Indenture governing
our Notes, which covenants are summarized above. As of December 31, 2009, we were in compliance with all covenants under the senior secured credit facility.
Our expansion and acquisition strategy may require substantial capital. Sufficient funding for future acquisitions may not be available under our existing revolving credit facility, and we may not be able to raise any necessary additional funds through bank financing or the issuance of equity or debt securities on terms acceptable to us, if at all.
RECENT ACCOUNTING PRONOUNCEMENTS
Standards Adopted
In June 2009, the Financial Accounting Standards Board (“FASB”) issued guidance now codified as FASB ASC Topic 105, “Generally Accepted Accounting Principles,” (the Codification), which establishes the ASC as the single source of authoritative nongovernmental GAAP, except for SEC rules and interpretive releases, which are sources of authoritative GAAP for SEC registrants. ASC Topic 105 does not change current GAAP, but is intended to simplify user access to all authoritative GAAP by providing all authoritative literature related to a particular topic in one place. These provisions of the standard are effective for interim and annual periods ending after September 15, 2009 and the Company adopted the provisions for the quarter ended September 30, 2009. Accordingly, the provisions are effective for the Company for the current fiscal reporting period. On the effective date of the standard, the Codification superseded all then-existing non-SEC accounting and reporting standards, and all other non-grandfathered non-SEC accounting literature not included in the Codification became non-authoritative. The adoption of this pronouncement did not have an impact on the Company’s financial condition or results of operations, but does impact our financial reporting process by eliminating all references to pre-codification standards.
In August 2009, the FASB issued Accounting Standards Update No. 2009-05 (“ASC Update 2009-05”), an update to ASC 820, Fair Value Measurements and Disclosures. This update provides amendments to reduce potential ambiguity in financial reporting when measuring the fair value of liabilities. Among other provisions, this update provides clarification for circumstances in which a quoted price in an active market for the identical liability is not available, a reporting entity is required to measure fair value using one or more of the valuation techniques described in ASC Update 2009-05. The adoption of this update did not have a material impact on the Company’s financial condition or results of operations.
In May 2009, the FASB issued, and we adopted, guidance now codified as ASC Topic 855, “Subsequent Events,” which was effective for interim and annual periods after June 15, 2009 and amended on February 24, 2010. ASC Topic 855 established general standards of accounting for and disclosure of events that occur after the balance sheet date but before financial statements are issued or are available to be issued. ASC Topic 855 stipulates the period after the balance sheet date during which management of a reporting entity should evaluate events or transactions that may occur for potential
recognition or disclosure in the financial statements, the circumstances under which an entity should recognize events or transactions occurring after the balance sheet date in its financial statements and the disclosures that an entity should make about events or transactions that occurred after the balance sheet date through the date the financial statements are issued.
In April 2009, the FASB issued guidance, now codified, to address concerns about (1) measuring the fair value of financial instruments when the markets become inactive and quoted prices may reflect distressed transactions and (2) recording impairment charges on investments in debt securities. The FASB also issued guidance, now codified, to require disclosures of fair values of certain financial instruments in interim financial statements.
ASC Topic 820, “Fair Value Measurements and Disclosures,” provides additional guidance to highlight and expand on the factors that should be considered in estimating fair value when there has been a significant decrease in market activity for a financial asset. FASB ASC Topic 820 also requires new disclosures relating to fair value measurement inputs and valuation techniques (including changes in inputs and valuation techniques).
ASC Topic 320, “Investments — Debt and Equity Securities,” changes (1) the trigger for determining whether an other-than-temporary impairment exists and (2) the amount of an impairment charge to be recorded in earnings. To determine whether an other-than-temporary impairment exists, an entity will be required to assess the likelihood of selling a security prior to recovering its cost basis. This is a change from the former requirement for an entity to assess whether it has the intent and ability to hold a security to recovery or maturity. ASC Topic 320 also expands and increases the frequency of existing disclosure about other-than-temporary impairments and requires new disclosures of the significant inputs used in determining a credit loss, as well as a roll forward of that amount each period.
ASC Topic 825, “Financial Instruments,” increases the frequency of fair value disclosures from annual to quarterly to provide financial statement users with more timely information about the effects of current market conditions on their financial instruments.
We adopted the three above ASC Topics during the second quarter of 2009. The adoption of the above guidance did not have a material effect on the Company’s financial condition, results of operations or cashflows.
In December 2009, we adopted guidance now codified as ASC Topic 715, “Compensation — Retirement Benefits” that requires more detailed disclosures about employers’ pension plan assets. New disclosures include more information on investment strategies, major categories of plan assets, concentrations of risk within plan assets and valuation techniques used to measure the fair value of plan assets. This new standard required new disclosures only, and had no impact on our consolidated financial position,
results of operations or cash flows. These new disclosures are included in Note 13 to our audited financial statements in Part IV of this Annual Report on Form 10-K.
In March 2008, the FASB issued guidance now codified as ASC Topic 815, “Derivatives and Hedging.” ASC Topic 815 requires companies to provide enhanced disclosures about derivative instruments and hedging activities to provide a better understanding of their effects on a company’s financial position, financial performance, and cash flows. We adopted the disclosure provisions of ASC Topic 815 on January 1, 2009. The adoption of the above standard did not have a material effect on our financial condition, results of operations or cashflows.
We enter into derivative instruments for risk management purposes only, including derivatives designated as hedging instruments under ASC Topic 815, “Derivatives and Hedging.” We are a party to an interest rate swap that is designated as a fair value hedge for a portion of our long-term debt. By using this instrument, we are exposed, from time to time, to credit risk and market risk. Credit risk is the risk that the counterparty will fail to perform under the terms of the derivative contract. When the fair value of a derivative contract is positive, the counterparty owes us, which creates credit risk for us. We minimize this credit risk by entering into transactions with high quality counterparties. Market risk is the risk that a change in interest rates will result in an adverse effect on the value of a financial instrument.
In December 2007, the FASB issued guidance now codified as ASC Topic 805, “Business Combinations,” which establishes principles and requirements for how an acquirer in a business combination recognizes and measures in its financial statements the identifiable assets acquired, the liabilities assumed, and any noncontrolling interest; recognizes and measures the goodwill acquired in the business combination or a gain from a bargain purchase; and determines what information to disclose to enable users of the financial statements to evaluate the nature and financial effects of the business combination. ASC Topic 805 is to be applied prospectively to business combinations for which the acquisition date is on or after the beginning of an entity’s fiscal year that begins on or after December 15, 2008. We adopted ASC Topic 805 on January 1, 2009 and apply the provisions to applicable business combinations on a prospective basis.
Standards Issued Not Yet Adopted
In October 2009, the FASB issued Accounting Standards Update (“ASU”), 2009-13, Revenue Recognition (Topic 605): Multiple Deliverable Revenue Arrangements — A Consensus of the FASB Emerging Issues Task Force.” This update provides application guidance on whether multiple deliverables exist, how the deliverables should be separated and how the consideration should be allocated to one or more units of accounting. This update establishes a selling price hierarchy for determining the selling price of a deliverable. The selling price used for each deliverable will be based on vendor-specific objective evidence, if available, third-party evidence if vendor-specific objective evidence is not available, or estimated selling price if neither vendor-specific or third-party evidence is available. The Company will be required to apply this guidance
prospectively for revenue arrangements entered into or materially modified after January 1, 2011. We are currently evaluating the impact of the provisions of ASU 2009-13.
FORWARD LOOKING STATEMENTS
Safe Harbor Statement under the Private Securities Litigation Reform Act of 1995
We believe statements in this Annual Report on Form 10-K looking forward in time involve risks and uncertainties. The following factors, among others, could adversely affect our business, operations and financial condition causing our actual results to differ materially from those expressed in any forward-looking statements:
· our history of net losses and substantial interest expense;
· our substantial outstanding debt and debt service obligations;
· our need for substantial cash to operate and expand our business as planned;
· restrictions imposed by the terms of our debt;
· a decrease in the number of patients our customers are serving;
· the effect of prolonged negative changes in domestic and global economic conditions;
· our ability to effect change in the manner in which health care providers traditionally procure medical equipment;
· the absence of long-term commitments with customers;
· difficulties or delays in our continued expansion into certain of our businesses/geographic markets and developments of new businesses/geographic markets;
· the impact of health care reform initiatives;
· changes in third-party payor reimbursement rates for health care items and services;
· our ability to maintain existing contracts with GPOs and IDNs and enter into new contracts with additional GPOs and IDNs ;
· additional credit risks in increasing business with home care providers and nursing homes;
· the impact of significant regulation of the health care industry and the need to comply with those regulations;
· impacts of equipment product recalls or obsolescence;
· increases in vendor costs that cannot be passed through to our customers; and
· the risk factors as set forth in Item 1A.
We undertake no obligation, and specifically decline any obligation, to publicly update or revise any forward-looking statements, whether as a result of new information, future events or otherwise. In light of these risks, uncertainties and assumptions, the forward-looking events included in this Annual Report on Form 10-K might not occur.
ITEM 7A: Quantitative and Qualitative Disclosures about Market Risk
We are exposed to market risk arising from adverse changes in interest rates, fuel costs, and pension valuation. We do not enter into derivatives or other financial instruments for speculative purposes.
Interest Rates
We use both fixed and variable rate debt as sources of financing. As of December 31, 2009, we had approximately $518.6 million of total debt outstanding, of which $38.4 million was bearing interest at variable rates. The weighted average interest rate for that variable rate debt, as of December 31, 2009, was 1.845%. Based on variable debt levels at December 31, 2009 and 2008, a 1.0 percentage point change in interest rates on variable rate debt would have resulted in annual interest expense fluctuating approximately $0.4 and $0.5 million, respectively.
In June 2007, we entered into an interest rate swap agreement for $230.0 million, which has the effect of converting our $230.0 of Floating Rate Notes to fixed interest rates. The effective date for the interest rate swap agreement was December 2007 and the expiration date is May 2012.
The interest rate swap agreement qualifies for cash flow hedge accounting under ASC Topic 815, “Derivatives and Hedging.” Both at inception and on an on-going basis, we must perform an effectiveness test. In accordance with ASC Topic 815, the fair value of the interest rate swap agreement at December 31, 2009 is included as a cash flow hedge on our balance sheet. The change in fair value was recorded as a component of accumulated other comprehensive loss, net of tax, on our balance sheet since the instrument was determined to be an effective hedge at December 31, 2009. We have not recorded any amounts due to ineffectiveness for any periods presented. We expect to reclassify approximately $6.2 million into earnings, currently recorded in accumulated other comprehensive loss, in the next 12 months. As a result of our interest rate swap agreement, we expect the effective interest rate on our $230.0 million Floating Rate Notes to be 9.065% through May 2012.
Fuel Costs
We are exposed to market risks related to changes in the price of gasoline used to fuel our fleet of delivery and sales vehicles. A hypothetical 10% increase in the average December 2009 and December 2008 prices of unleaded gasoline, assuming gasoline usage levels for the years then ended, would lead to an annual increase in fuel costs of approximately $0.3 millions and $0.2 million, respectively.
Pension
Our pension plan assets, which were approximately $12.2 and $9.9 million at December 31, 2009 and 2008, respectively, are subject to volatility that can be caused by fluctuations in general economic conditions. Continued market volatility and disruption
could cause further declines in asset values and if this occurs, we may need to make additional pension plan contributions in future years. A hypothetical 10% decrease in the fair value of plan assets at December 31, 2009 and 2008 would lead to a decrease in the funded status of the plan of approximately $1.2 and $1.0 million, respectively.
Other Market Risk
As of December 31, 2009, we have no other material exposure to market risk.
ITEM 8: Financial Statements and Supplementary Data
The following table sets forth certain unaudited quarterly financial data for 2009 and 2008. In our opinion, this unaudited information has been prepared on the same basis as the audited information and includes all adjustments (consisting only of normal recurring adjustments) necessary to present fairly the information set forth therein. The operating results for any one quarter are not necessarily indicative of results for any future period.
Selected Quarterly Finanical Information
(Unaudited)
|
|
|
Year Ended December 31, 2009 |
|
||||||||||
|
|
|
Quarter Ended |
|
||||||||||
|
(dollars in thousands) |
|
March 31 |
|
June 30 |
|
September 30 |
|
December 31 |
|
||||
|
Total revenues |
|
$ |
73,930 |
|
$ |
72,836 |
|
$ |
72,237 |
|
$ |
78,201 |
|
|
Gross margin |
|
$ |
25,843 |
|
$ |
25,164 |
|
$ |
23,142 |
|
$ |
26,519 |
|
|
Gross margin % |
|
35.0 |
% |
34.5 |
% |
32.0 |
% |
33.9 |
% |
||||
|
Net loss |
|
$ |
(4,790 |
) |
$ |
(4,803 |
) |
$ |
(4,882 |
) |
$ |
(4,098 |
) |
|
Net cash provided by operating activities |
|
18,551 |
|
6,796 |
|
27,372 |
|
3,269 |
|
||||
|
Net cash used in investing activities |
|
(9,887 |
) |
(5,777 |
) |
(12,176 |
) |
(22,710 |
) |
||||
|
Net cash provided by (used in) financing activities |
|
$ |
12,730 |
|
$ |
(30,919 |
) |
$ |
(14,896 |
) |
$ |
15,641 |
|
|
|
|
Year Ended December 31, 2008 |
|
||||||||||
|
|
|
Quarter Ended |
|
||||||||||
|
|
|
March 31 |
|
June 30 |
|
September 30 |
|
December 31 |
|
||||
|
Total revenues |
|
$ |
75,444 |
|
$ |
71,684 |
|
$ |
70,979 |
|
$ |
71,012 |
|
|
Gross margin |
|
$ |
28,395 |
|
$ |
23,580 |
|
$ |
21,912 |
|
$ |
23,302 |
|
|
Gross margin % |
|
37.6 |
% |
32.9 |
% |
30.9 |
% |
32.8 |
% |
||||
|
Net loss |
|
$ |
(3,186 |
) |
$ |
(6,054 |
) |
$ |
(7,110 |
) |
$ |
(7,146 |
) |
|
Net cash provided by operating activities |
|
18,898 |
|
9,373 |
|
22,724 |
|
5,254 |
|
||||
|
Net cash used in investing activities |
|
(29,031 |
) |
(13,872 |
) |
(8,748 |
) |
(19,744 |
) |
||||
|
Net cash provided by (used in) financing activities |
|
$ |
10,133 |
|
$ |
4,850 |
|
$ |
(14,327 |
) |
$ |
26,496 |
|
The Report of the Independent Registered Public Accounting Firm, Financial Statements, and Schedules are set forth in Part IV, Item 15 of this Annual Report of Form 10-K.
ITEM 9: Changes in and Disagreements with Accountants on Accounting and Financial Disclosure
None.
ITEM 9A(T): Controls and Procedures
Evaluation of Disclosure Controls and Procedures. Our management is responsible for establishing and maintaining effective disclosure controls and procedures, as defined under Rule 13a-15(e) of the Securities Exchange Act of 1934 (the “Exchange Act”). As of the end of the period covered by this report, we performed an evaluation, under the supervision and with the participation of our management, including our Chief Executive Officer and Chief Financial Officer, of the effectiveness of our disclosure controls and procedures. Based upon, and as of the date of, that evaluation, our Chief Executive Officer and Chief Financial Officer concluded that our disclosure controls and procedures were effective to ensure that information required to be disclosed by us in the reports that our Company files or submits to the SEC under the Exchange Act is recorded, processed, summarized and reported within the time periods specified in the SEC’s rules and forms, and that such information is accumulated and communicated to our management, including our Chief Executive Officer and Chief Financial Officer, as appropriate to allow timely decisions regarding required disclosure.
Management’s Annual Report on Internal Control over Financial Reporting. Our management is responsible for establishing and maintaining adequate internal control over financial reporting. Internal control over financial reporting is defined in Rules 13a-15(f) and 15d-15(f) promulgated under the Exchange Act as a process designed by, or under the supervision of our principal executive and principal financial officer and effected by our board of directors, management and other personnel, to provide reasonable assurance regarding the reliability of financial reporting and the preparation of financial statements for external purposes in accordance with GAAP. Such internal control includes those policies and procedures that:
· pertain to the maintenance of records that in reasonable detail accurately and fairly reflect the transactions and dispositions of the assets;
· provide reasonable assurance that transactions are recorded as necessary to permit preparation of financial statements in accordance with GAAP, and that receipts and expenditures of the Company are being made only in accordance with authorizations of management and directors; and
· provide reasonable assurance regarding prevention or timely detection of unauthorized acquisition, use or disposition of our assets that could have a material effect on the financial statements.
Our management assessed the effectiveness of our internal control over financial reporting as of December 31, 2009. In making this assessment, it used the criteria set forth in Internal Control — Integrated Framework issued by the Committee of
Sponsoring Organizations of the Treadway Commission. Based on this assessment, management has determined that, as of December 31, 2009, our internal control over financial reporting is effective based on those criteria.
This annual report does not include an attestation report of the Company’s registered public accounting firm regarding internal control over financial reporting. Management’s report was not subject to attestation by the Company’s registered public accounting firm pursuant to temporary rules of the SEC that permit the Company to provide only management’s report in this annual report.
|
/s/ Gary D. Blackford |
|
/s/ Rex T. Clevenger |
|
Gary D. Blackford |
|
Rex T. Clevenger |
|
Chairman of the Board and |
|
Executive Vice President and |
|
Chief Executive Officer |
|
Chief Financial Officer |
Changes in Internal Control over Financial Reporting. There were no changes in our internal control over financial reporting during the quarter ended December 31, 2009, that have materially affected, or are reasonably likely to materially affect, our internal control over financial reporting.
None.
ITEM 10: Directors, Executive Officers and Corporate Governance
EXECUTIVE OFFICERS AND DIRECTORS
The following table sets forth the ages and the current positions of our executive officers and directors as of March 1, 2010.
|
Name |
|
Age |
|
Position |
|
Gary D. Blackford |
|
52 |
|
Chairman of the Board and Chief Executive Officer |
|
Rex T. Clevenger |
|
52 |
|
Executive Vice President and Chief Financial Officer |
|
Timothy W. Kuck |
|
52 |
|
Executive Vice President and Chief Operating Officer |
|
Jeffrey L. Singer |
|
48 |
|
Executive Vice President, Sales |
|
Diana J. Vance-Bryan |
|
53 |
|
Senior Vice President and General Counsel |
|
Walter T. Chesley |
|
55 |
|
Senior Vice President, Human Resources and Development |
|
William Heintze |
|
51 |
|
Senior Vice President, National Accounts |
|
David Lawson |
|
53 |
|
Senior Vice President, Information and Strategic Resources |
|
Scott M. Madson |
|
49 |
|
Vice President, Controller, and Chief Accounting Officer |
|
Barry P. Schochet |
|
58 |
|
Director |
|
Bret D. Bowerman |
|
33 |
|
Director |
|
David Crane |
|
53 |
|
Director |
|
John D. Howard |
|
57 |
|
Director |
|
Kevin L. Roberg |
|
58 |
|
Director |
|
Mark M. McKenna |
|
61 |
|
Director |
|
Robert Juneja |
|
39 |
|
Director |
|
David E. Dovenberg |
|
65 |
|
Advisor to Audit Committee |
Gary D. Blackford has been Chairman of the Board of Directors and Chief Executive Officer since 2007. Earlier, Mr. Blackford had been President, Chief Executive Officer and a member of the Board of Directors since 2002. He currently serves on the Board of Directors of Wright Medical Group, Inc. (NASDAQ: WMGI). Mr. Blackford holds a Bachelor of Business Administration degree from The University of Iowa, a Juris Doctor degree from Creighton University and received a Certified Public Accountant certificate in 1983. Mr. Blackford has extensive business experience and demonstrated management ability at senior levels. He has served as a director of both private and public companies and has served as the chief executive officer of public and private companies the past ten years.
Rex T. Clevenger joined us in 2004 as Senior Vice President and Chief Financial Officer and became Executive Vice President and Chief Financial Officer in 2007. He has over 30 years of financial operations and capital markets experience, including extensive capital attraction, corporate finance and planning roles. He is a graduate of the University of Missouri, holds a Bachelor of Science degree in Business Administration and received a Certified Public Accountant certificate in 1981.
Timothy W. Kuck was named Executive Vice President and Chief Operating Officer in 2007. Mr. Kuck had served as Senior Vice President of Operations since 2005 and from 2004 to 2005 served as Regional Vice President for our central region. He has over 20 years of progressive managerial experience in sales, operations, finance and corporate administration. Mr. Kuck holds a Bachelor of Arts degree from Augustana College and a Juris Doctor degree from the University of Minnesota Law School. Mr. Kuck also received a Certified Public Accountant certificate in 1983.
Jeffrey L. Singer was named Executive Vice President, Sales and Marketing in 2007. Mr. Singer had served as Senior Vice President, Asset Optimization since 2003. Mr. Singer has over 25 years of health care industry experience, focusing on medical equipment
acquisition, management and sales. He holds a Bachelor of Science degree in Marketing and Logistics from the University of Missouri.
Diana Vance-Bryan joined us in 2006 as Senior Vice President and General Counsel. She has 25 years of legal experience, primarily in the health care sector. From 2004 to 2006, Ms. Vance-Bryan served as Vice President and General Counsel of Novartis Nutrition Corporation, a leading manufacturer of medical nutrition products, which was acquired by Nestlè in 2007. Ms. Vance-Bryan is a graduate of Mercy Hospital School of Nursing, and received a Bachelor of Science degree in Nursing from The University of Iowa College of Nursing and a Juris Doctor degree from The University of Iowa College of Law.
David G. Lawson has been the Senior Vice President of Information and Strategic Resources since 2007. Prior to that time, Mr. Lawson had been the Senior Vice President of Technology, Professional Services, Marketing and Facilities since 2002. He has over 30 years of technology experience, 20 of those in the health care/financial services industries. He holds a Bachelor of Science degree in Hospital Administration from Concordia College.
Walter T. Chesley joined us in 2003 as Senior Vice President, Human Resources and Development. He has over 25 years of human resources experience. Mr. Chesley has a Bachelor of Science degree in Communications and Public Relations from Boston University and a Juris Doctor degree from the American University Washington College of Law.
William S. Heintze has been the Senior Vice President of Strategic Sales since 2009. Prior to that time, Mr. Heintze had been the Senior Vice President of National Accounts since 2004. He is responsible for managing our relationships with GPOs, IDNs, patient care solutions, resident-based programs, and manufacturers. Mr. Heintze has over 25 years of sales and marketing experience and holds a Bachelor of Business Administration degree from The University of Iowa.
Scott M. Madson joined us in 2006 as Controller and Chief Accounting Officer and was named Vice President in 2008. He has over 25 years of accounting and financial management experience, most recently with Nextel Partners, Inc., a wireless telecommunications provider and predecessor to Sprint Nextel Corporation, where he served as Controller from 2004 to 2006. Mr. Madson received a Certified Public Accountant certificate in 1984 and received a Bachelor of Science degree in accounting from the University of Minnesota.
Barry P. Schochet has served as a director and as a member of our audit committee since 2008. Mr. Schochet currently is President and Chief Executive Officer of BPS Health Ventures, LLC, a health care consulting and equity investment firm, a position he has held since 2005. From 1995 until 2005, he served in several executive capacities at Tenet Healthcare Corporation (NASDAQ: THC), including Vice Chairman. Through its subsidiaries, Tenet owns and operates acute care hospitals and related health care
services. Mr. Schochet serves as a board member of Broadlane, Inc., and as an advisor to TriCap Technology Group and The Beryl Companies. Mr. Schochet holds a Master’s degree in hospital administration from George Washington University and a Bachelor of Arts degree in Zoology from the University of Maine. Mr. Schochet brings to our board sophisticated health care system management and purchasing expertise.
Bret D. Bowerman has been a director and a member of our audit committee since 2007. Mr. Bowerman is a Vice President of Irving Place Capital, formerly known as Bear Stearns Merchant Banking (“BSMB”). When with BSMB, Mr. Bowerman held the position of Senior Associate. Prior to joining BSMB in 2007, Mr. Bowerman worked as a Research Analyst at investment manager GoldenTree Asset Management from 2006 to 2007. Mr. Bowerman holds a Master of Business Administration degree from the Wharton School of the University of Pennsylvania and a Bachelor of Arts degree in Economics from Washington & Lee University. Mr. Bowerman has a deep understanding of financial issues, which makes him a skilled advisor.
David Crane has been a director and a member of our compensation committee since 2008. Mr. Crane currently serves as Executive Chairman of NewHope Bariatrics, Inc. NewHope Bariatrics, in partnership with physicians, owns and manages ambulatory surgery centers dedicated to meeting the needs of the morbidly obese patient. Mr. Crane served as a director of Orion HealthCorp, Inc. (NASDAQ: ORNH) from 2004 to 2008, as a director of Pediatric Services of America, Inc. from 2003 to 2007, and as a director of Alveolus Inc. from 2002 to 2008. Mr. Crane was on the Board of Trustees of the Charlotte Latin School from 2000 to 2008. Mr. Crane holds a Master of Business Administration degree from Harvard Business School and a Bachelor of Arts degree from Yale College. Mr. Crane contributes experience in the growing specialty of bariatric medicine and the vantage of a provider system striving to achieve superior patient outcomes and optimal financial performance.
John D. Howard became a director in 2007. Mr. Howard has served since November 2008 as Chief Executive Officer of Irving Place Capital, formerly BSMB, a leading institutional private equity firm focused on making equity investments in middle-market companies. Prior to November 2008, Mr. Howard was the founder and Chief Executive Officer of BSMB and a Senior Managing Director of the investment bank Bear, Stearns & Co. Inc. (NASDAQ: BSCBM). He currently serves on the board of directors of Stuart Weitzman Holdings, LLC, Multi Packaging Solutions Company, New York & Company, Inc. and Vitamin Shoppe, Inc. (NASDAQ: VSI). Additionally, Mr. Howard is a member of the Advisory Board of the Yale School of Management and a trustee of Mount Sinai Hospital. Mr. Howard holds a Master of Business Administration degree from the Yale School of Management and a Bachelor of Arts degree from Trinity College. Having served on multiple boards of directors, and as a veteran of private equity finance, Mr. Howard brings a deep understanding of corporate governance and financial strategy on which he can draw while serving as a member of our board.
Kevin L. Roberg has been a director and has served as chairman of our audit committee since 2007. Mr. Roberg is the founder and since 1998 has served as a managing partner
of Kelsey Capital Management, a private investment firm, and since 1999 has been a general partner with the Menlo Park, California-based health care venture capital firm Delphi Ventures. Mr. Roberg is also a director of Thomas and Betts Corporation (TNB: NYSE), Snap Fitness, Inc., Ryan Companies US, Inc., Idea Drilling, Novologix, Inc., Yale Mechanical Inc., Lake Air Metal Products, LLC, and ProStaff, Inc. From 2007 to 2008, Mr. Roberg served as interim Chairman and CEO of ProStaff, Inc., following the death of its founder. Mr. Roberg was also President/CEO of ValueRx (a subsidiary of Value Health) from 1995 to 1998. Mr. Roberg received a Bachelor of Science degree from The University of Iowa. Mr. Roberg has held a variety of executive positions in the staffing and health care field. From 1974 to 1998, he gained valuable health care industry experience as a clinic administrator, health care foundation executive, a managed care executive, and a national prescription drug management leader. Since 1998 Mr. Roberg’s focus has mainly been serving of public health care boards and health care investing.
Mark M. McKenna has served as a director and as a member of our compensation committee since 2008. Mr. McKenna has over 30 years of health care industry experience. Mr. McKenna retired as the President and Chief Executive Officer of Novation, LLC, a health care services company, in 2006. He had served as the President of Novation since 1999. Mr. McKenna serves as a director of SterilMed, Inc., Suture Express, Inc., LifeNexus, Inc., Systagenix Wound Management and The MED Group. Mr. McKenna holds a Master of Business Administration degree from Suffolk University and a Bachelor of Science degree in Business Administration from Boston College. As a seasoned manager and director in a variety of health care companies, particularly leadership of a major health care services contracting company, Mr. McKenna understands the dynamic of purchasing within our industry.
Robert Juneja has been a director and has served as chairman of our compensation committee since 2007. Mr. Juneja is a Senior Managing Director and Partner of Irving Place Capital, formerly BSMB. When with BSMB Mr. Juneja held the title of Partner and was Senior Managing Director of Bear, Stearns & Co. Inc. (NASDAQ: BSCBM) since 2007. Mr. Juneja joined BSMB in 2000 and focused on investments in financial services and health care services. Mr. Juneja serves on the board of directors of Manifold Capital Corp., Alter Moneta Holdings, Caribbean Financial Group, Cavalry Investments Holdings, and Churchill Financial Holdings. Mr. Juneja holds a Master of Business Administration degree from the Wharton School of the University of Pennsylvania and a Bachelor of Arts degree in Mathematics from the University of Michigan. Mr. Juneja has extensive knowledge of complex financial and operational issues facing health care organizations today.
David E. Dovenberg has served in an advisory capacity to our audit committee since June 2008. Mr. Dovenberg had been Non-Executive Chairman of the Board from 2004 to 2008 and was Chairman of the Board from 2001 to 2004. He holds a Master’s degree in Economics from the University of Minnesota and a Bachelor of Arts degree from Gustavus Adolphus College.
MEETINGS AND COMMITTEES OF THE BOARD OF DIRECTORS
The Board of Directors
Each member of our board of directors is expected to devote sufficient time, energy and attention to ensure diligent performance of his or her duties. Our board met four times during 2009 with all members present. We believe that Kevin Roberg, Mark McKenna and Barry Schochet are independent as defined under the current rules of The NASDAQ Stock Market LLC (“NASDAQ”). John Howard, Robert Juneja and Bret Bowerman are not considered to be independent due to their respective relationships with IPC and Parent, David Crane is not considered to be independent because he serves as a senior advisor to IPC, and Mr. Blackford is not considered to be independent because he serves as chairman of the board and chief executive officer of Parent and as our chairman and chief executive officer.
Under a securityholders agreement among Parent, IPC/UHS, L.P. and IPC/UHS Co-Investment Partners, L.P., which are both affiliates of IPC (together, “IPC/UHS”), Gary D. Blackford and Kathy Blackford (together, “Blackford”) and certain other securityholders of Parent (referred to, with Blackford, as the “Parent Securityholders”), IPC/UHS, the Parent Securityholders and their respective permitted transferees have agreed to vote all of their Parent securities so that the following individuals are elected to and continue to serve on our board of directors:
· three representatives (the “Irving Place Capital Directors”) designated by the holders of at least a majority of the common stock and common stock equivalents included in the Parent securities issued or issuable to IPC/UHS or any permitted transferees of IPC/UHS, and
· the chief executive officer of the Company, currently Gary Blackford, provided that Mr. Blackford is entitled to remain as a director following the termination of his employment with the Company so long as (i) he continues to own at least 50% of the Parent securities owned by him as of the date of the securityholders agreement, and (ii) he is not employed by, or consulting for, any competitor of the Company or any of its subsidiaries.
In addition, the Parent Securityholders have agreed to vote all of their Parent securities so that any committee of the Company will include at least two Irving Place Capital Directors, and, for so long as he is a director, our chief executive officer, unless he waives this right or unless our board of directors desires to exclude officers from such committee.
John Howard, Robert Juneja and Bret Bowerman are the current Irving Place Capital Directors designated to serve on our board of directors. Mr. Bowerman also serves on our audit committee, and Mr. Juneja also serves on our compensation committee.
Committees of the Board of Directors
Audit Committee
Our audit committee members are Kevin Roberg, Bret Bowerman and Barry Schochet. David Dovenberg serves in an advisory capacity to the audit committee but is not a member of the committee and does not vote on matters before the committee. Mr. Roberg is the chairman. The audit committee met four times during 2009 with all members present at each meeting. The audit committee, among other things:
· reviews the results of the independent registered public accounting firm’s annual audit and its required communication on any significant adjustments, management judgments and estimates, new accounting policies and disagreements with management;
· reviews and discusses with management and our independent registered public accounting firm our quarterly financial statements and our audited financial statements, and approves the filing of the audited annual financial statements included in the Company’s Annual Report on Form 10-K filed with the Securities and Exchange Commission;
· reviews and oversees the performance of our independent registered public accounting firm;
· reviews written disclosures and the letter from the independent accountant required by the applicable requirements of the Public Company Accounting Oversight Board regarding the independent accountant’s communications with the audit committee concerning independence, and discusses with the independent accountant the independent accountant’s independence;
· approves the fees and other significant compensation to be paid to the independent auditors, and pre-approves all permissible non-audit services to be performed by the independent auditors;
· reviews the adequacy of our system of internal accounting controls;
· reviews and periodically reassesses the audit committee charter;
· discusses with the independent auditors the annual financial statements, the results of its audit and the matters required to be communicated to audit committees in accordance with Statement on Auditing Standards No. 61, Communication with Audit Committees;
· oversees the preparation of and approves the report of the audit committee for inclusion in the Company’s Annual Report on Form 10-K for filing with the SEC.
· oversees the application of the Company’s related person transaction policy and its code of business conduct and ethics;
· assesses whether management has a review system in place that is reasonably designed to satisfy legal requirement with respect to the Company’s financial statements, reports and other financial information disseminated to governmental organizations and the public;
· reviews the types of issues reported to the Company Hotline, which is a reporting system used by employees to pose questions about, or report violation or suspected violations of the Company’s code of business conduct and ethics, and
periodically review with Company’s counsel reports made to the Company’s Hotline;
· reviews the valuation of the Company in connection with Parent’s determination of the exercise price of stock option awards; and
· conducts periodic self-evaluations of its performance.
Under current NASDAQ rules, our current audit committee would not be deemed to be comprised solely of independent directors since Mr. Bowerman is an Irving Place Capital Director and is associated with IPC and Parent. We believe that Mr. Roberg and Mr. Schochet are independent directors under current NASDAQ rules.
Our board has determined that Mr. Roberg, who is chairman of the audit committee, qualifies as an “audit committee financial expert” as that term is defined under Item 407(d)(5) of Regulation S-K. The board believes that Mr. Roberg is independent as defined under current NASDAQ rules.
Compensation Committee
Our compensation committee consists of Robert Juneja, David Crane, and Mark McKenna. The compensation committee met two times during 2009 with all members present at each meeting. The compensation committee, among other things:
· assists the board in overseeing the Company’s management compensation policies and practices, including evaluating annually the performance of the Company’s executive officers and determining and approving the compensation of our executive officers (including our chief executive officer);
· reviews and approves equity compensation programs for employees;
· reviews the objectives of the Company’s management compensation programs, and reviews and authorizes any employment, compensation, benefit or severance arrangement with any executive officer (current or former);
· prepares or oversees the preparation of and approves the Compensation Discussion and Analysis required by the rules of the Securities and Exchange Commission;
· retains consultants or experts as it deems necessary in the performance of its responsibilities;
· produces an annual compensation committee report for inclusion in the Company’s Annual Report on Form 10-K filed with the Securities and Exchange Commission;
· determines the annual compensation to be paid to the named executive officers; and
· makes regular reports to the board of directors concerning executive compensation.
Under current NASDAQ rules, our current compensation committee would not be deemed to be comprised solely of independent directors, because Mr. Juneja is an Irving
Place Capital Director associated with IPC and Parent and Mr. Crane is associated with IPC. We believe that Mr. McKenna is independent under current NASDAQ rules.
LIMITATION ON LIABILITY AND INDEMNIFICATION MATTERS
Delaware law and our certificate of incorporation and bylaws provide that we shall, under certain circumstances and subject to certain limitations, indemnify any person made or threatened to be made a party to a proceeding by reason of that person’s former or present official capacity with us against judgments, penalties, fines, settlements and reasonable expenses. Any such person also is entitled, subject to limitations, to payment or reimbursement of reasonable expenses in advance of the final disposition of the proceeding.
Pursuant to provisions of the Delaware General Corporation Law, we have adopted provisions in our certificate of incorporation that provide that our directors shall not be personally liable to us or our stockholders for monetary damages for a breach of fiduciary duty as a director, subject to certain exceptions.
At present, we are aware of no pending litigation or proceeding involving any of our directors, officers, employees or agents where indemnification will be required or permitted. We are not aware of any threatened litigation or proceeding that might result in a claim for indemnification.
CODE OF BUSINESS CONDUCT AND ETHICS
We have adopted a code of conduct and ethics for all employees, directors and officers, including our chief executive officer, chief financial officer and chief accounting officer. Our code of conduct and ethics can be found at our internet website, www.uhs.com. We intend to satisfy the disclosure requirement under Item 5.05 of Form 8-K regarding an amendment to, or waiver from, a provision of our code of conduct and ethics by posting such information on our website at the address specified above.
ITEM 11: Executive Compensation
COMPENSATION DISCUSSION AND ANALYSIS
Introduction
In this compensation discussion and analysis we discuss our compensation program, including our compensation philosophy and objectives and each component of compensation for our chief executive officer, chief financial officer, and the other individuals included in the Summary Compensation Table below (collectively, the “named executive officers”).
The compensation paid to our named executive officers for fiscal 2009 was determined by the compensation committee in March 2009 in consultation with our chief executive officer, and recommended to our board of directors for final approval, which also occurred in March 2009. The compensation committee has the authority to retain an independent compensation consultant to assist in making recommendations regarding executive officer compensation, but did not do so in 2009.
Compensation Philosophy and Objectives
We strive to ensure that we are able to attract and retain talented employees and reward performance. We also believe that the most effective executive compensation program is one that is designed to reward the achievement of specific annual and long-term strategic goals of our company. Accordingly, our compensation committee (and our board, in ratifying the compensation committee’s determination) evaluates both performance and compensation to ensure both that the compensation provided to key executives is fair and reasonable, and that it remains competitive relative to the compensation paid to similarly situated executives of a group of peer companies in the same or similar industries, adjusted for our size and private company status. To these ends, our compensation committee and board of directors have determined that our executive compensation program for our named executive officers should include base salary, annual performance-based incentive and long-term equity (stock option) compensation that rewards performance as measured against established goals, and competitive health, dental and other benefits.
Overview of Compensation Program and Process
We have structured our compensation program to motivate the named executive officers to achieve the business goals set by us, and to reward them for achieving these goals. In furtherance of this, our compensation committee conducts an annual review of our total compensation program to achieve the following goals:
· provide fair, reasonable and competitive compensation;
· link compensation with our business plans;
· reward achievement of both company and individual performance; and
· attract and retain talented executives who are critical to the Company’s success.
We believe that these goals reflect the importance of pay for performance by providing our named executive officers with an opportunity to earn compensation for above average performance. The compensation for each named executive officer includes (1) a base salary that we believe is competitive with salary levels for similarly situated executives of our peer companies, adjusted for our size and private company status, and (2) incentive compensation that is contingent upon achievement of specific corporate and individual objectives.
Management has a role in the compensation process. Gary Blackford, our chief executive officer, presents to the compensation committee an evaluation of each named executive officer’s individual performance, including his own. He also makes annual base salary and performance-based incentive compensation recommendations for each named executive officer. The compensation committee has the discretion to accept, reject or modify the chief executive officer’s recommendations. The other named executive officers are not present during these discussions.
In 2009 the compensation committee considered certain elements of total compensation against a group of publicly traded companies in the same or related industries (the “Peer Group”). In fiscal 2009 our compensation committee reviewed the compensation, including base salary and incentive compensation, paid to executives in the Peer Group, and considered the performance evaluations and recommendations presented by Mr. Blackford in determining the appropriate compensation for each named executive officer. Due to the greater breadth of responsibilities held by our chief executive officer, his total compensation is higher than the other named executive officers. In approving the compensation for our named executive officers, including our chief executive officer, our board of directors also considered the recommendations of our compensation committee, as well as our company’s performance and the need to attract, retain, and motivate our executives.
It is challenging for us to identify a group of similarly situated peer companies, because the identity of competitors varies among our three business segments, and great variability exists in the size and scope of activities among health care industry businesses, including our competitors. For purposes of determining our 2009 compensation, our compensation committee determined that it was appropriate to select the following companies for inclusion in the Peer Group based on the sensitivity of each Peer Group member to similar marketplace trends, and industry sector:
· Hill-Rom Holdings, Inc. and Kinetic Concepts, Inc., our two biggest competitors in our Medical Equipment Outsourcing segment;
· Lifepoint Hospitals, Inc., Community Health Systems, Inc. and Kindred Healthcare, Inc., each of which operates acute care hospitals;
· Universal Health Services, Inc., which operates acute care hospitals, behavioral health facilities, and ambulatory centers;
· Cardinal Health, Inc., a supplier of certain of our products; and
· Alliance Imaging, Inc., an outsourced, diagnostic imaging services company.
The Peer Group typically is re-evaluated each year, and consistent with that practice, on November 30, 2009, the compensation committee re-examined its selection of companies to comprise the Peer Group, taking into consideration data compiled from public sources, investment banks, compensation consultants and independent analysts about companies that are comparable to UHS, as well as information available about other companies that operate within the health care industry or that reflect the following attributes:
· a business model of providing outsourced solutions consistent with UHS’ current focus;
· an organic and acquisitive growth profile similar to UHS;
· a technology solutions focus consistent with UHS’ approach; and
· a lack of direct reimbursement risk from third-party payors such as Medicare and Medicaid.
The compensation committee determined that it was appropriate to update the Peer Group based on the Company’s evolving business mix and revenue sources, expanding business offerings, current and forecasted growth profile, and evolving strategy, which includes a solutions-based focus. Accordingly, the compensation committee determined that for purposes of 2010 compensation the Peer Group will consist of the following companies:
· Stericycle, Inc., a company that outsources medical waste disposal services;
· CareFusion Corporation, a supplier of certain of our products;
· Healthcare Services Group, Inc., a company that outsources housekeeping and dietary services to medical facilities;
· MedAssets, Inc., a provider of supply chain consulting and revenue cycle management services for health systems, hospitals and health care providers;
· Computer Programs and Systems, Inc., a provider of information technology needs to community health care providers; and
· Kinetic Concepts, Inc., one of our largest competitors in our Medical Equipment Outsourcing segment.
2009 Executive Compensation Components
For fiscal 2009 the principal components of compensation for our named executive officers were base salary and annual performance-based incentive compensation, each of which is addressed in greater detail below. Each named executive officer also has severance and/or change of control benefits, and is eligible to participate in our long-term savings plan and the broad-based benefit and welfare plans that are available to our employees in general. One of our named executive officers also participates in our Employees’ Pension Plan (the “Pension Plan”), which was frozen on December 31, 2002 and under which no additional participants were permitted after that date. In addition, the named executive officers are eligible to receive stock option awards from Parent under its stock option plan. Although these awards are determined solely by Parent’s board of directors, our compensation committee considers the option awards in assessing each named executive officer’s compensation package and whether such package is consistent with our compensation program philosophy and objectives.
We do not have an established formula or target for allocating between cash and non-cash compensation, or between short-term and long-term incentive compensation. Instead, our goal is to ensure that the compensation we pay is sufficient to attract and retain executive officers, and to reward them for performance that meets the goals set by our compensation committee.
Setting Executive Compensation
The compensation committee determines the total compensation for our named executive officers based on a consideration of the following factors:
· the scope of responsibility of each named executive officer;
· market data from Peer Group companies;
· an assessment of the positions of similarly situated executives within the Peer Group and internal comparisons to the compensation received by those executives;
· internal review of each named executive officer’s compensation, both individually and relative to other named executive officers;
· individual performance of each named executive officer, which is assessed based on factors such as fulfillment of job responsibilities, the financial and operating performance of the activities directed by each named executive officer, experience and potential;
· the total compensation paid to each named executive officer in past years (including long-term equity (stock option) compensation awarded by Parent under its stock option plan);
· performance evaluations for each named executive officer, delivered by Mr. Blackford; and
· Mr. Blackford’s recommendations regarding the annual base salary and performance-based incentive compensation for each named executive officer.
Base Salary
We provide our named executive officers with a base salary to compensate them for services rendered. Salary levels are typically considered in March of each year as part of our performance review process and upon a promotion or other change in job responsibility. Merit-based increases to salaries of the named executive officers are based on the compensation committee’s assessment of the individual’s performance.
Base salary ranges are determined for each named executive officer based on his or her position and responsibility and utilizing our compensation committee’s knowledge and expertise regarding the market, with reference to market data regarding Peer Group compensation compiled from public sources, compensation consultants and independent analysts. Base salary ranges are designed so that salary opportunities for a given position will be targeted at the midpoint of the base salary established for each range.
In March 2009, the compensation committee determined to increase the base salaries of each of the named executive officers based, in each case, on the compensation committee’s assessment of the individual’s performance. The increases became effective April 1, 2009.
Annual Performance-Based Incentive Compensation
The annual performance-based incentive compensation component is offered through the Executive Incentive Program (the “EIP”), an annual cash incentive program that provides our executive officers with an opportunity to earn annual incentive awards based on the Company’s financial performance and the executive officers’ achievement of individual objectives. Under the EIP, our named executive officers can earn incentive awards that are based on a percentage of base salary, with the percentage for each officer (other than our chief executive officer, whose percentage is specified in his employment agreement with us) set at a level the compensation committee has determined is consistent with his or her level of accountability and impact on our operations. The percentage of base salary for our named executive officers varies from 65% to 85% of base salary. In setting the percentage of base salary for each executive officer (other than our chief executive officer), the compensation committee considers the incentive compensation paid to executives in the Peer Group.
The corporate financial objective under the EIP relates to earnings before interest, income tax, depreciation and amortization (“EBITDA”), as adjusted for stock-based compensation, transaction and related expenses, loss on extinguishment of debt, other, and board of director expenses (“Adjusted EBITDA”). The minimum, target and maximum levels for achievement of the corporate financial objective are proposed each year by our chief executive officer and in March 2009 the minimum, target and maximum levels for achievement of the corporate financial objective for 2009 EIP awards were determined by our compensation committee. Awards are based on the achievement of the objective for the current year, calculated by comparing actual and target Adjusted EBITDA for that fiscal year.
For the 2009 EIP awards to each named executive officer, each 1% directional variance to target has a five percent multiplier effect on the amount of the potential EIP award with bookends at 110% and 93% of target, correlating to a multiplier effect to incentive levels of 150% to 65%, respectively. Named executive officers participating in the EIP receive no payment under the EIP, unless the Company achieves the minimum performance level (93% of target). Named executive officers receive a payment ranging from 65% to 100% of the target award opportunity if the Company achieves a performance level ranging from 93% to 100% of target, and a payment ranging from 100% up to 150% of the target award opportunity if the Company achieves a performance level ranging from 100% to 110% of target. Although our chief executive officer’s potential EIP award is governed by his employment agreement, which provides bookends for his potential EIP award at 110% and 90% of target (rather than 110% and 93%) and with a potential payment range from 0% to 170% (rather than 0% to 150%), the compensation committee determined it appropriate to align the chief executive
officer’s 2009 EIP Program with the other named executive officers, and the chief executive officer agreed to such alignment for fiscal 2009.
In addition to using EBITDA and Adjusted EBITDA internally as a measure of operational performance, we disclose it externally to assist analysts, investors and lenders in their comparisons of operational performance, valuation and debt capacity across companies with differing capital, tax and legal structures. EBITDA, however, is not a measure of financial performance under GAAP and should not be considered as an alternative to, or more meaningful than, net income as a measure of operating performance or to cash flows from operating, investing or financing activities as a measure of liquidity. Because EBITDA is not a measure of GAAP and is thus susceptible to varying interpretations and calculations, EBITDA, as presented, may not be comparable to other similarly titled measures of other companies. EBITDA does not represent an amount of funds that is available for management’s discretionary use. Adjusted EBITDA is included because certain compensation plans are based upon this measure.
The named executive officers earn 50% of the actual EIP award based on actual Adjusted EBITDA results versus target. The remaining 50% of the actual Adjusted EBITDA results versus target is earned based on attainment of each named executive officer’s specific annual and quarterly objectives, which are tied to the executive officer’s specific areas of responsibility, and to leadership competencies.
For fiscal 2009 the compensation committee reviewed the Company’s performance against the corporate financial objective, and reviewed the achievement of each named executive officer’s individual objectives on the basis of the performance evaluation delivered by Mr. Blackford. Awards were determined by the compensation committee based on these results.
During the past five years, the Company achieved performance in excess of the target two times, but did not achieve the maximum performance level. The payout percentage in the past five years ranged between approximately 100% and 164% of the participant’s target award opportunity. Generally, the minimum, target and maximum levels for achievement of the corporate financial objective are set, so that the relative difficulty of achieving the target is consistent from year to year.
Awards granted to named executive officers under the EIP in March 2010 for performance in 2009 are reflected in the “Non-equity Incentive Plan” column of the Summary Compensation Table on page 87. The Company expects to pay the EIP award in March 2010.
Severance and/or Change of Control Benefits
The Company has adopted an Executive Severance Pay Plan that provides for severance benefits for certain of our senior executive officers, including Timothy Kuck, Jeffrey Singer and Diana Vance-Bryan, who are named executive officers. In addition, we have
entered into employment agreements with Gary Blackford, our chief executive officer, and Rex Clevenger, our chief financial officer. These employment agreements provide for severance and/or change of control benefits for Mr. Blackford and Mr. Clevenger. Severance and/or change in control benefits serve several purposes and are designed to:
· aid in the attraction and retention of the executives as a competitive practice;
· keep the executives focused on running the business, impartial and objective when confronted with transactions that could result in a change of control; and
· encourage our executives to act in the best interest of our stockholder in evaluating transactions.
For a detailed discussion of the foregoing, please refer to the caption “Potential Payments Upon Termination or Change in Control” below.
Long-Term Savings Plan and Other Benefits
The Company has adopted a Long-Term Savings Plan, which is a tax-qualified retirement savings plan pursuant to which all employees, including the named executive officers, are able to contribute to the plan the lesser of up to 60% of their annual salary or the limit prescribed by the Internal Revenue Service (“IRS”) on a pre-tax basis. The Company will match 50% of up to 6% of base pay that is contributed to the Long-Term Savings Plan, subject to the limits prescribed by the IRS, excluding any catch-up contributions. Matching contributions and any earnings on the matching contributions are vested in accordance with the following schedule:
|
Years of |
|
Vesting |
|
|
Service |
|
Percentage |
|
|
Less than 1 |
|
— |
|
|
1 |
|
33 |
% |
|
2 |
|
66 |
% |
|
3 |
|
100 |
% |
Long-Term Equity Incentive (Stock Option) Compensation
Following the Transaction, a new stock option plan was adopted by Parent, and all outstanding awards under our former equity-based compensation plan (whether or not then vested or exercisable) were cancelled. Holders of vested options received in consideration for the cancellation of their vested options an amount equal to the product of:
· the number of shares of common stock issuable upon the exercise of such vested options, and
· the per share merger consideration in the Transaction minus the exercise price for such vested options, less withholding taxes.
The 2007 Stock Option Plan of Parent (“2007 Stock Option Plan”) provides for the award of stock options to the named executive officers and is designed to:
· enhance the link between the creation of stockholder value and long-term executive incentive compensation;
· provide an opportunity for increased equity ownership of Parent by executives; and
· maintain competitive levels of total compensation.
Stock option award levels vary among participants based on their positions within the Company. Consistent with past practice, broad-based stock option awards were granted in June of 2007, following a change in control of the Company, which occurred in connection with the Transaction. Thereafter, options are expected to be granted at approximately the same time each year during the first quarter and are granted to individuals who were newly hired or who were promoted or who increased their job responsibilities during the past 12-month period. None of the named executive officers received a grant of options in 2009. The exercise price of stock option awards under the 2007 Stock Option Plan is equal to the fair market value of Parent’s common stock on the grant date as determined by the board of directors of Parent. The ultimate value of an award depends on Parent’s stock price. For a detailed discussion of the new stock option plan, see discussion under the heading “2007 Stock Option Plan” below.
Retirement Plans
Effective December 31, 2002, benefit accruals under our Pension Plan were frozen for all participants and no new participants have been or will be permitted to enter the Pension Plan after that date. Mr. Singer is the only named executive officer who participates in the Pension Plan.
Under the Pension Plan, all employees who attained age 21 and who completed one year of service prior to December 31, 2002, were eligible to participate in the Pension Plan. Additional service or compensation changes of participants after that date are not considered for purposes of computing participant accrued benefit. However, accumulated service after December 31, 2002 continues to be taken into account for purposes of determining a participant’s vested interest and entitlement to an early retirement subsidy and certain death benefits.
Participants earn the right to receive certain benefits upon termination of employment, including retirement at the normal retirement age of 65 or upon early retirement on or after age 55. Normal retirement benefits are calculated as more particularly illustrated below. Benefits vest according to the following schedule and are 100% vested at normal retirement.
|
Years of |
|
Vesting |
|
|
Service |
|
Percentage |
|
|
Less than 3 |
|
— |
|
|
3 |
|
20 |
% |
|
4 |
|
40 |
% |
|
5 |
|
60 |
% |
|
6 |
|
80 |
% |
|
7 |
|
100 |
% |
The formulas below provide an illustration as to how the retirement benefits are calculated.
Normal Retirement
First Formula
|
1.6% |
X |
Average |
X |
Years of |
- |
Social |
= |
Monthly |
Second Formula
|
Years of Credited Service |
X |
$6.00 |
= |
Monthly Benefit |
(1) Average monthly pay primarily includes base salary and EIP awards.
Early retirement benefits are determined generally in the same manner as described above for normal retirement benefit, but are adjusted to reflect the actuarially determined adjusted payout period.
Other Benefits
Our named executive officers are eligible to participate in the same broad-based benefit and welfare plans that are made available to our employees in general. In addition, if Mr. Blackford elects not to participate in our group health plan, but rather obtains health coverage directly though an insurer approved by our board of directors, we will reimburse Mr. Blackford for the reasonable cost of such coverage in accordance with the terms of his employment agreement with us.
TAX AND ACCOUNTING IMPLICATIONS
Deductibility of Executive Compensation
The compensation committee reviews and considers the Company’s deductibility of executive compensation. We believe that compensation paid under our EIP is generally 100% deductible for federal income tax purposes, except that potential “excess parachute payments” exist with respect to our named executive officers. Section 280G of the
Internal Revenue Code of 1986, as amended (the “Code”), provides that the Company may not deduct compensation paid in connection with a change of control that is treated as an excess parachute payment. In certain circumstances, the compensation committee may elect to approve compensation that is not fully deductible to ensure competitive levels of compensation for our executive officers. For 2009, we believe that all executive officer compensation paid will be fully deductible.
Accounting for Stock-Based Compensation
Beginning January 1, 2006, we began accounting for our stock-based compensation, namely, stock options issued under the 2003 Stock Option Plan and 2007 Stock Option Plan, as required by ASC Topic 718, “Compensation — Stock Compensation.”
While Parent established the 2007 Stock Option Plan, compensation expense related to service provided by the Company’s employees, including the named executive officers, is recognized in the Company’s Statements of Operations with an offsetting Payable to Parent liability.
COMPENSATION COMMITTEE REPORT
The compensation committee has reviewed and discussed the Compensation Discussion and Analysis required by Item 402(b) of Regulation S-K with management and, based on this review and discussion, recommended to the board of directors that the Compensation Discussion and Analysis be included in this Annual Report on Form 10-K.
THE COMPENSATION COMMITTEE
Robert Juneja
David Crane
Mark McKenna
EXECUTIVE COMPENSATION
The following tables and accompanying narrative disclosure should be read in conjunction with the Compensation Discussion and Analysis.
SUMMARY COMPENSATION TABLE
The table below sets forth the total compensation awarded to, earned by or paid to the named executive officers for our 2009, 2008, and 2007 fiscal years.
The named executive officers were not entitled to receive payments which would be characterized as “Bonus” payments for the years ended December 31, 2009, 2008, or 2007, except that Mr. Clevenger and Ms. Vance-Bryan each received a cash bonus payment in 2007 in connection with the Transaction. Amounts listed under the “Non-Equity Incentive Plan Compensation” column were determined in accordance with the “2009 Executive Incentive Plan Targets,” filed as Exhibit 10.21 to this Annual Report on Form 10-K for the year ended December 31, 2009, as approved by the compensation
committee of our board of directors. The non-equity incentive plan compensation is expected to be paid in March 2010.
|
|
|
|
|
|
|
|
|
|
|
|
|
Change in |
|
|
|
|
|
|||||||
|
|
|
|
|
|
|
|
|
|
|
|
|
Pension |
|
|
|
|
|
|||||||
|
|
|
|
|
|
|
|
|
|
|
|
|
Value and |
|
|
|
|
|
|||||||
|
|
|
|
|
|
|
|
|
|
|
Non-Equity |
|
Non-Qualified |
|
|
|
|
|
|||||||
|
|
|
|
|
|
|
|
|
|
|
Incentive |
|
Deferred |
|
|
|
|
|
|||||||
|
|
|
|
|
|
|
|
|
Option |
|
Plan |
|
Compensation |
|
All Other |
|
|
|
|||||||
|
Name and |
|
|
|
Salary |
|
Bonus |
|
Awards |
|
Compensation |
|
Earnings |
|
Compensation |
|
Total |
|
|||||||
|
Principal Position |
|
Year |
|
($) |
|
($) (1) |
|
($) (2) |
|
($) (3) |
|
($) (4) |
|
($) (5) |
|
($) |
|
|||||||
|
Gary D. Blackford |
|
2009 |
|
$ |
480,957 |
|
$ |
— |
|
$ |
503,657 |
|
$ |
408,800 |
|
N/A |
|
$ |
7,214 |
|
$ |
1,400,628 |
|
|
|
Chairman of the Board and |
|
2008 |
|
$ |
446,206 |
|
$ |
— |
|
$ |
1,007,355 |
|
$ |
379,275 |
|
N/A |
|
$ |
6,693 |
|
$ |
1,839,529 |
|
|
|
Chief Executive Officer (6) |
|
2007 |
|
$ |
423,385 |
|
$ |
— |
|
$ |
2,865,500 |
|
$ |
590,200 |
|
N/A |
|
$ |
32,963 |
|
$ |
3,912,048 |
|
|
|
|
|
|
|
|
|
|
|
|
|
|
|
|
|
|
|
|
|
|||||||
|
Rex T. Clevenger |
|
2009 |
|
$ |
349,330 |
|
$ |
— |
|
$ |
104,205 |
|
$ |
262,000 |
|
N/A |
|
$ |
7,350 |
|
$ |
722,885 |
|
|
|
Executive Vice President |
|
2008 |
|
$ |
324,089 |
|
$ |
— |
|
$ |
208,418 |
|
$ |
243,067 |
|
N/A |
|
$ |
6,900 |
|
$ |
782,474 |
|
|
|
and Chief Financial Officer |
|
2007 |
|
$ |
310,522 |
|
$ |
75,000 |
|
$ |
588,944 |
|
$ |
381,900 |
|
N/A |
|
$ |
7,749 |
|
$ |
1,364,115 |
|
|
|
|
|
|
|
|
|
|
|
|
|
|
|
|
|
|
|
|
|
|||||||
|
Timothy W. Kuck |
|
2009 |
|
$ |
252,783 |
|
$ |
— |
|
$ |
86,837 |
|
$ |
176,900 |
|
N/A |
|
$ |
7,350 |
|
$ |
523,870 |
|
|
|
Executive Vice President |
|
2008 |
|
$ |
234,518 |
|
$ |
— |
|
$ |
173,682 |
|
$ |
164,163 |
|
N/A |
|
$ |
6,900 |
|
$ |
579,263 |
|
|
|
and Chief Operating Officer |
|
2007 |
|
$ |
223,592 |
|
$ |
— |
|
$ |
774,363 |
|
$ |
256,700 |
|
N/A |
|
$ |
6,708 |
|
$ |
1,261,363 |
|
|
|
|
|
|
|
|
|
|
|
|
|
|
|
|
|
|
|
|
|
|||||||
|
Jeffrey L. Singer |
|
2009 |
|
$ |
242,780 |
|
$ |
— |
|
$ |
86,837 |
|
$ |
169,900 |
|
$ |
4,182 |
|
$ |
7,350 |
|
$ |
506,867 |
|
|
Executive Vice President, |
|
2008 |
|
$ |
224,682 |
|
$ |
— |
|
$ |
173,682 |
|
$ |
157,277 |
|
$ |
6,193 |
|
$ |
6,740 |
|
$ |
568,574 |
|
|
Sales and Marketing |
|
2007 |
|
$ |
211,692 |
|
$ |
— |
|
$ |
478,801 |
|
$ |
243,000 |
|
$ |
— |
|
$ |
6,351 |
|
$ |
939,844 |
|
|
|
|
|
|
|
|
|
|
|
|
|
|
|
|
|
|
|
|
|||||||
|
Diana Vance-Bryan |
|
2009 |
|
$ |
219,993 |
|
$ |
— |
|
$ |
43,419 |
|
$ |
143,100 |
|
N/A |
|
$ |
6,600 |
|
$ |
413,112 |
|
|
|
Senior Vice President and |
|
2008 |
|
$ |
204,098 |
|
$ |
— |
|
$ |
86,840 |
|
$ |
138,300 |
|
N/A |
|
$ |
6,123 |
|
$ |
435,361 |
|
|
|
General Counsel |
|
2007 |
|
$ |
195,554 |
|
$ |
25,000 |
|
$ |
425,171 |
|
$ |
208,500 |
|
N/A |
|
$ |
5,866 |
|
$ |
860,091 |
|
|
(1) The amounts in the “Bonus” column reflect a cash bonus payment made in connection with the Transaction to certain of our named executive officers.
(2) The amounts in the “Option Awards” column reflect the dollar amount recognized for financial statement reporting purposes for the years ended December 31, 2009, 2008, and 2007, respectively, in accordance with ASC Topic 718 of awards pursuant to the 2003 Stock Option Plan and the 2007 Stock Option Plan. The expense includes amounts from awards granted before 2009. Assumptions used in the calculation of these amounts are included in Note 11 to our audited financial statements for the fiscal year ended December 31, 2009 set forth in Part IV, Item 15 of this Annual Report on Form 10-K. As a result of the Transaction, unvested options granted under our Predecessor 2003 Stock Option Plan became fully vested and accelerated expense was recorded in accordance with ASC Topic 718 in 2007. A reconciliation of 2007 Option award expense is included below.
|
|
|
|
|
|
|
2007 Stock |
|
|
|
||||
|
|
|
2003 Stock Option Plan |
|
Option Plan |
|
|
|
||||||
|
|
|
Recurring |
|
Accelerated |
|
Recurring |
|
Total Option |
|
||||
|
Name |
|
Expense |
|
Expense |
|
Expense |
|
Award Expense |
|
||||
|
Gary D. Blackford |
|
$ |
263,893 |
|
$ |
1,594,252 |
|
$ |
1,007,355 |
|
$ |
2,865,500 |
|
|
Rex T. Clevenger |
|
42,281 |
|
338,245 |
|
208,418 |
|
588,944 |
|
||||
|
Timothy W. Kuck |
|
54,830 |
|
545,851 |
|
173,682 |
|
774,363 |
|
||||
|
Jeffrey L. Singer |
|
39,296 |
|
265,823 |
|
173,682 |
|
478,801 |
|
||||
|
Diana Vance-Bryan |
|
23,826 |
|
314,505 |
|
86,840 |
|
425,171 |
|
||||
(3) The amounts in the “Non-Equity Incentive Plan Compensation” column reflect the cash awards to the named executive officers under the EIP, which is discussed in detail on page 82 under the caption “Annual Performance-Based Incentive Compensation.”
(4) The amount in the “Change in Pension Value and Non-Qualified Deferred Compensation Earnings” column for Mr. Singer, the only named executive officer covered by the Pension Plan, reflects the change in the present value of Mr. Singer’s benefits under the Pension Plan using interest rate and mortality rate assumptions consistent with those used in our audited financial statements and includes amounts which Mr. Singer may not be entitled to receive because such amounts are not vested. The amount shown for Mr. Singer does not include declines of $2,875 in the present value of the benefit provided under the Pension Plan for 2007. The Pension Plan is discussed in detail on page 85 under the caption “Retirement Plans.”
(5) The amounts in the “All Other Compensation” column reflect our contributions for all of the named executive officers, except for the 2007 amounts for Mr. Blackford (6), to the Long-Term Savings Plan, discussed in detail on page 84 under the caption “Long-Term Savings Plan and Other Benefits.”
(6) The amount in the “All Other Compensation” column for Mr. Blackford in 2007 reflects legal fees incurred by us for Mr. Blackford in connection with the Transaction of $26,612 and our contribution to the Long-Term Savings Plan of $6,351.
2009 GRANTS OF PLAN-BASED AWARDS
|
|
|
|
|
Estimated Future Payouts |
|
|||||||
|
|
|
Grant |
|
Threshold |
|
Target |
|
Maximum |
|
|||
|
Name |
|
Date |
|
($) |
|
($) |
|
($) |
|
|||
|
Gary D. Blackford |
|
N/A |
|
$ |
— |
|
$ |
408,813 |
|
$ |
694,982 |
|
|
|
|
|
|
|
|
|
|
|
|
|||
|
Rex T. Clevenger |
|
N/A |
|
$ |
— |
|
$ |
261,998 |
|
$ |
392,997 |
|
|
|
|
|
|
|
|
|
|
|
|
|||
|
Timothy W. Kuck |
|
N/A |
|
$ |
— |
|
$ |
176,948 |
|
$ |
265,422 |
|
|
|
|
|
|
|
|
|
|
|
|
|||
|
Jeffrey L. Singer |
|
N/A |
|
$ |
— |
|
$ |
169,946 |
|
$ |
254,919 |
|
|
|
|
|
|
|
|
|
|
|
|
|||
|
Diana Vance-Bryan |
|
N/A |
|
$ |
— |
|
$ |
142,995 |
|
$ |
214,493 |
|
(1) The amounts shown under “Estimated Future Payments Under Non-Equity Incentive Plan Awards” reflect the minimum, target and maximum payment levels, respectively, under the Company’s EIP, which is discussed in detail on page 82. These amounts are based on the named executive officer’s base salary and position for the year ending and as of December 31, 2009. The 2009 EIP payout is included in the “Non-Equity Incentive Plan Compensation” column in the Summary Compensation Table.
(2) No equity or option awards were granted to the name executive officers during fiscal year 2009.
OUTSTANDING EQUITY AWARDS AT DECEMBER 31, 2009 (1)
|
|
|
OPTION AWARDS (2) |
|
|||||||||||
|
Name |
|
Grant Date |
|
Number of |
|
Number of |
|
Equity Incentive |
|
Option |
|
Option |
|
|
|
|
|
|
|
|
|
|
|
|
|
|
|
|
|
|
|
Gary D. Blackford |
|
6/18/2007 |
|
6,041,425 |
|
3,625,104 |
|
4,833,471 |
|
$ |
1.00 |
|
6/17/2017 |
|
|
|
|
|
|
|
|
|
|
|
|
|
|
|
|
|
|
Rex T. Clevenger |
|
6/18/2007 |
|
1,249,950 |
|
750,021 |
|
1,000,029 |
|
$ |
1.00 |
|
6/17/2017 |
|
|
|
|
|
|
|
|
|
|
|
|
|
|
|
|
|
|
Timothy W. Kuck |
|
6/18/2007 |
|
1,041,625 |
|
625,018 |
|
833,357 |
|
$ |
1.00 |
|
6/17/2017 |
|
|
|
|
|
|
|
|
|
|
|
|
|
|
|
|
|
|
Jeffrey L. Singer |
|
6/18/2007 |
|
1,041,625 |
|
625,018 |
|
833,357 |
|
$ |
1.00 |
|
6/17/2017 |
|
|
|
|
|
|
|
|
|
|
|
|
|
|
|
|
|
|
Diana Vance-Bryan |
|
6/18/2007 |
|
520,813 |
|
312,509 |
|
416,678 |
|
$ |
1.00 |
|
6/17/2017 |
|
(1) All outstanding equity awards are option awards granted under Parent’s 2007 Stock Option Plan, discussed in detail on page 84 under the caption “Long-Term Equity Incentive (Stock Option) Compensation.”
(2) Half of the options granted under the 2007 Stock Option Plan for our named executive officers vest over a six-year period of service with 16.66% vesting on December 31 of each year of the six-year period, with such unvested options included in the “Number of Securities Underlying Unexercised Options Unexercisable” column. The remaining half of the options vest over a six-year period, subject to the Company’s attainment of certain performance objectives, with 16.66% vesting on December 31 of each year of the six-year period with such unvested options included in the “Equity Incentive Plan Awards: Number of Securities Underlying Unexercised Unearned Options” column. The 2007 Stock Option Plan is discussed in detail under the caption “2007 Stock Option Plan” below.
2009 PENSION BENEFITS
The table below shows the actuarial present value of accumulated benefits payable to Jeffrey Singer, the only participating named executive officer, including the number of years of service credited to him, under our Pension Plan determined using interest rate and mortality rate assumptions consistent with those used in our financial statements. Information regarding our Pension Plan is discussed under the caption “Retirement Plans” on page 85.
|
Name (1) |
|
Plan Name |
|
Number of |
|
Present Value |
|
Payments |
|
||
|
Gary D. Blackford (1) |
|
N/A |
|
N/A |
|
N/A |
|
N/A |
|
||
|
Rex T. Clevenger (1) |
|
N/A |
|
N/A |
|
N/A |
|
N/A |
|
||
|
Timothy W. Kuck (1) |
|
N/A |
|
N/A |
|
N/A |
|
N/A |
|
||
|
Jeffrey L. Singer |
|
UHS Employees’ Pension Plan |
|
4.4 |
|
$ |
42,112 |
|
$ |
— |
|
|
Diana Vance-Bryan (1) |
|
N/A |
|
N/A |
|
N/A |
|
N/A |
|
||
(1) Mr. Blackford, Mr. Clevenger, Mr. Kuck, and Ms. Vance-Bryan are not eligible to participate in our Pension Plan.
(2) Includes amounts which the named executive officer may not currently be entitled to receive because the amount is not vested.
POTENTIAL PAYMENTS UPON TERMINATION OR CHANGE IN CONTROL
POTENTIAL PAYMENTS UNDER EMPLOYMENT AGREEMENTS
In connection with the Transaction, IPC negotiated new employment agreements between the Company and each of Mr. Blackford and Mr. Clevenger. The employment agreements were amended and restated on December 31, 2008, to comply with Section 409A of the Internal Revenue Code (“Code”). Section 409A of the Code imposes certain requirements on nonqualified deferred compensation plans and arrangements. Final regulations under Section 409A became effective on January 1, 2009. The terms of the amended and restated employment agreements, as they related to the possible payments upon termination of each of the aforementioned named executive officers, are summarized below and are economically equivalent to the benefits Mr. Blackford and Mr. Clevenger were entitled to before, with the timing of payments and certain other provisions modified to comply with Section 409A. The amounts shown below assume that termination of employment was effective as of December 31, 2009, include amounts earned through that date, and are estimates of the amounts which would be paid out to the named executive officers upon their termination. The actual amounts paid can only be determined at the time of each named executive officer’s separation from us.
Gary D. Blackford — Employment Agreement
The following termination and Change of Control payments are payable under Mr. Blackford’s employment agreement, contingent upon Mr. Blackford or his representative executing and delivering a release of all claims against the Company and all present and former directors, officers, agents, representatives, executives, successors and assignees of the Company and its direct or indirect owners within 45 days of the date of termination, provided 15 days have elapsed since such execution without any revocation thereof by Mr. Blackford or his representative.
Payments Made Upon Death or Disability
In the event of death or disability, Mr. Blackford or his legal representative will receive, on the 61st day following termination, a lump sum payment consisting of the following:
· 100% of his current base salary;
· $11,350 intended for health and welfare benefits; and
· earned and unpaid EIP compensation for the calendar year ending prior to the date of termination, if any.
The Company also will pay Mr. Blackford or his legal representative Mr. Blackford’s pro rata EIP award for the calendar year in which his employment terminates, at the time the Company pays EIP awards to other senior executives for that same calendar year. Additionally, Mr. Blackford will receive accrued vested benefits through any benefit plan, program or arrangement of the Company at the times specified therein.
“Disability” means the named executive officer becomes physically or mentally disabled, whether totally or partially, either permanently or so that the named executive officer is unable substantially and competently to perform his duties for 180 days during any 12-month period during the term of his employment agreement.
Payments Made Upon Termination Without Cause or Resignation For Good Reason
If we terminate Mr. Blackford’s employment without Cause or he resigns for Good Reason, Mr. Blackford will receive, on the 61st day following termination, a lump sum payment consisting of the following:
· 185% of his current base salary;
· $11,350 intended for health and welfare benefits; and
· earned and unpaid bonus for the calendar year ending prior to the date of termination, if any.
The Company also will pay Mr. Blackford his pro rata EIP award for the calendar year in which his employment terminates, at the time the Company pays EIP awards to other senior executives for that same calendar year. Additionally, Mr. Blackford will receive accrued vested benefits through any benefit plan, program or arrangement of the Company at the times specified therein.
“Cause” means:
· the commission by the named executive officer of a felony for which he is convicted; or
· the material breach by the named executive officer of his agreements or obligations under his employment agreement described in a written notice to the named executive officer that is not capable of being cured or has not been cured within 30 days after receipt.
Mr. Blackford will have “Good Reason” for termination if other than for Cause any of the following has occurred:
· Mr. Blackford’s base salary or EIP target percentage has been reduced, other than in connection with an across-the-board reduction, not to exceed 5% of the then current base salary, of approximately the same percentage in executive compensation to executive employees imposed by our board of directors in response to negative financial results or other adverse circumstances affecting us;
· our board of directors establishes an unachievable and commercially unreasonable adjusted EBITDA target that we must achieve for the named executive officer to
receive an EIP under his employment agreement and Mr. Blackford provides written notice of his objection to the board of directors within ten business days;
· Mr. Blackford is not elected or re-elected to the board of directors;
· we have reduced or reassigned a material portion of Mr. Blackford’s duties, have diminished his title, have required Mr. Blackford to relocate outside the greater Minneapolis area, have relocated our corporate headquarters outside the greater Minneapolis area or have removed or relocated outside the greater Minneapolis area a material number of our employees or senior management, in each case without Mr. Blackford’s written consent; or
· we have breached in any material respect the employment agreement of Mr. Blackford.
Payments Made Upon Termination for Cause or Resignation Without Good Reason
If we terminate Mr. Blackford’s employment under his employment agreement for Cause or Mr. Blackford resigns without Good Reason, all of Mr. Blackford’s rights to payments, other than payment for services already rendered and any other benefits otherwise due, cease upon the date of termination.
Payments Made Upon a Change of Control
In the event of the termination without Cause or resignation for Good Reason of Mr. Blackford at any time within six months before, or 24 months following, a Change of Control, or the termination of employment by Mr. Blackford for any reason during the 30-day period following the six month anniversary of the Change of Control, and notwithstanding and in lieu of amounts provided for resignation without Cause or for resignation for Good Reason, Mr. Blackford will receive, on the 61st day following termination, a lump sum payment consisting of the following:
· 285% of his current base salary;
· $11,350 intended for health and welfare benefits; and
· earned and unpaid bonus for the calendar year ending prior to the date of termination, if any.
However, if Mr. Blackford’s employment terminates within six months prior to a Change in Control due to termination by the Company without Cause or due to termination by Mr. Blackford for Good Reason, then Mr. Blackford will receive payments in accordance with the provisions noted under the heading “Payments Made Upon Termination Without Cause or Resignation For Good Reason,” and within 30 days following the Change in Control, Mr. Blackford will receive an additional lump sum payment equal to the difference between the payment already received and the amount required under the Change in Control provisions noted above.
The Company also will pay Mr. Blackford his pro rata EIP award for the calendar year in which his employment terminates, at the time the Company pays EIP awards to other senior executives for that same calendar year. Additionally, Mr. Blackford will receive
accrued vested benefits through any benefit plan, program or arrangement of the Company at the times specified therein.
If any payment or benefit received or to be received by Mr. Blackford in connection with a Change in Control of us constitutes a “parachute payment,” within the meaning of Section 280G(b)(2) of the Code which would be subject to the excise tax imposed by Section 4999 of the Code (the “Excise Tax”), then Mr. Blackford will receive from us an additional cash payment (the “Gross-Up Payment”) so that, after payment by Mr. Blackford of all taxes, including income taxes (and any related interest and penalties imposed with respect thereto) and the Excise Tax imposed upon the Gross-Up Payment, Mr. Blackford retains an amount of the Gross-Up Payment equal to the Excise Tax imposed on the parachute payments. The Gross-Up Payment will be paid to Mr. Blackford or deposited with the government as withholding in a lump sum payment no later than 90 days following the date on which Mr. Blackford is required to pay the Excise Tax, but in no event later than the end of the tax year following the tax year in which Mr. Blackford submits the Excise Tax to the government.
“Change of Control” means (i) when any “person” (as defined in Section 13(d) and 14(d) of the Securities Exchange Act of 1934 (“Exchange Act”)) (other than the Company, IPC Manager III, L.P. (formerly known as Bear Stearns Merchant Banking Manager III, L.P.) or its affiliates, any trustee or other fiduciary holding securities under an employee benefit plan of the Company or any Subsidiary, or any corporation owned, directly or indirectly, by the stockholder or stockholders, as the case may be, of the Company, in substantially the same proportions as their ownership of stock of the Company), acquires, in a single transaction or a series of transactions (whether by merger, consolidation, reorganization or otherwise), (A) “beneficial ownership” (as defined in Rule 13d-3 under the Exchange Act) of securities representing more than 50% of the combined voting power of the Company (or, prior to a public offering, more than 50% of the Company’s outstanding shares of common stock), or (B) substantially all or all of the assets of the Company and its Subsidiaries on a consolidated basis or (ii) a merger, consolidation, reorganization or similar transaction of the Company with a “person” (as defined above) if, following such transaction, the holders of a majority of the Company’s outstanding voting securities in the aggregate immediately prior to such transaction do not own at least a majority of the outstanding voting securities in the aggregate of the surviving corporation immediately after such transaction. “Subsidiary” means any corporation in an unbroken chain of corporations beginning with the Company if, at the time of a Change of Control, each of the corporations (other than the last corporation in the unbroken chain) owns stock possessing 50% or more of the total combined voting power of all classes of stock in one of the other corporations in the chain.
The following table shows the potential payments upon a termination or Change of Control of us pursuant to Mr. Blackford’s employment agreement.
|
Gary D. Blackford Chairman of the Board and Chief Excecutive Officer |
|
|
|
|
|
For Good |
|
Without |
|
|
|
||||
|
|
|
|
|
Reason or |
|
Good Reason |
|
Change of |
|
||||
|
|
|
|
|
Without |
|
or With |
|
Contol |
|
||||
|
|
|
Death or |
|
Cause |
|
Cause |
|
Related |
|
||||
|
|
|
Disability |
|
Termination |
|
Termination |
|
Termination |
|
||||
|
Executive Benefits and |
|
on |
|
on |
|
on |
|
on |
|
||||
|
Payments Upon Separation |
|
12/31/2009 |
|
12/31/2009 |
|
12/31/2009 |
|
12/31/2009 |
|
||||
|
Compensation: |
|
|
|
|
|
|
|
|
|
||||
|
Non-Equity Incentive Plan |
|
$ |
408,813 |
|
$ |
408,813 |
|
$ |
— |
|
$ |
408,813 |
|
|
Stock Options |
|
5,739,354 |
|
5,739,354 |
|
5,739,354 |
|
13,775,000 |
|
||||
|
|
|
|
|
|
|
|
|
|
|
||||
|
Benefits and Perquisites: |
|
|
|
|
|
|
|
|
|
||||
|
Health and Welfare Benefits |
|
11,350 |
|
11,350 |
|
— |
|
11,350 |
|
||||
|
Severance Payments |
|
467,240 |
|
864,395 |
|
— |
|
1,331,635 |
|
||||
|
|
|
|
|
|
|
|
|
|
|
||||
|
Total |
|
$ |
6,626,758 |
|
$ |
7,023,912 |
|
$ |
5,739,354 |
|
$ |
15,526,798 |
|
Rex Clevenger — Employment Agreement
The following termination and Change of Control payments are payable under Mr. Clevenger’s employment agreement, contingent upon Mr. Clevenger or his representative executing and delivering a release of all claims against the Company and all present and former directors, officers, agents, representatives, executives, successors and assignees of the Company and its direct or indirect owners within 45 days of the date of termination, provided 15 days have elapsed since such execution without any revocation thereof by Mr. Clevenger or his representative.
Payments Made Upon Death or Disability
In the event of death or disability, Mr. Clevenger or his legal representative will receive, on the 61st day following termination, a lump sum payment consisting of the following:
· 100% of his current base salary;
· $11,350 intended for health and welfare benefits; and
· earned and unpaid bonus for the calendar year ending prior to the date of termination, if any.
Additionally, Mr. Clevenger will receive accrued vested benefits through any benefit plan, program or arrangement of the Company at the times specified therein.
“Disability” means the named executive officer becomes physically or mentally disabled, whether totally or partially, either permanently or so that the named executive officer is unable substantially and competently to perform his duties for 180 days during any 12-month period during the term of his employment agreement.
Payments Made Upon Termination Without Cause or Resignation For Good Reason
If we terminate Mr. Clevenger’s employment without Cause or he resigns for Good Reason, Mr. Clevenger will receive, on the 61st day following termination, a lump sum payment consisting of the following:
· 175% of his current base salary;
· $11,350 intended for health and welfare benefits; and
· earned and unpaid bonus for the calendar year ending prior to the date of termination, if any.
The Company also will pay Mr. Clevenger his pro rata EIP award for the calendar year in which his employment terminates, at the time the Company pays EIP awards to other senior executives for that same calendar year. Additionally, Mr. Clevenger will receive accrued vested benefits through any benefit plan, program or arrangement of the Company at the times specified therein.
“Cause” means:
· the commission by the named executive officer of a felony for which he is convicted; or
· the material breach by the named executive officer of his agreements or obligations under his employment agreement described in a written notice to the named executive officer that is not capable of being cured or has not been cured within 30 days after receipt.
Mr. Clevenger will have “Good Reason” for termination if, other than for Cause, any of the following has occurred:
· Mr. Clevenger’s base salary or EIP target percentage has been reduced, other than in connection with an across-the-board reduction, not to exceed 5% of the then current base salary, of approximately the same percentage in executive compensation to executive employees imposed by our board of directors in response to negative financial results or other adverse circumstances affecting us;
· our board of directors establishes an unachievable and commercially unreasonable adjusted EBITDA target that we must achieve for the named executive officer to receive an EIP under his employment agreement and Mr. Clevenger provides written notice of his objection to the board of directors within ten business days;
· we have reduced or reassigned a material portion of Mr. Clevenger’s duties, have diminished his title, have required Mr. Clevenger to relocate outside the greater Minneapolis, Minnesota area, have relocated our corporate headquarters outside the greater Minneapolis area or have removed or relocated outside the greater Minneapolis area a material number of our employees or senior management, in each case without Mr. Clevenger’s written consent; or
· we have breached, in any material respect, the employment agreement of Mr. Clevenger.
Payments Made Upon Termination for Cause or Resignation Without Good Reason
If we terminated Mr. Clevenger’s employment under his employment agreement for Cause or he resigns without Good Reason, all of Mr. Clevenger’s rights to payments, other than payment for services already rendered and any other benefits otherwise due, cease upon the date of termination.
Payments Made Upon a Change of Control
If we terminate Mr. Clevenger’s employment without Cause or Mr. Clevenger resigns for Good Reason at any time within six months before, or 24 months following, a Change of Control and notwithstanding and in lieu of amounts provided for resignation without Cause or for resignation for Good Reason, Mr. Clevenger is entitled to receive, on the 61st day following termination, a lump sum payment consisting of the following:
· 262.5% of his current base salary;
· $11,350 intended for health and welfare benefits; and
· earned and unpaid bonus for the calendar year ending prior to the date of termination, if any.
The Company also will pay Mr. Clevenger his pro rata EIP award for the calendar year in which his employment terminates, at the time the Company pays EIP awards to other senior executives for that same calendar year. Additionally, Mr. Clevenger will receive accrued vested benefits through any benefit plan, program or arrangement of the Company at the times specified therein.
However, if Mr. Clevenger’s employment terminates within six months prior to a Change in Control due to termination by the Company without Cause or due to termination by Mr. Clevenger for Good Reason, then Mr. Clevenger will receive payments in accordance with the provisions noted under the heading “Payments Made Upon Termination Without Cause or Resignation For Good Reason,” and within 30 days following the Change in Control, Mr. Clevenger will receive an additional lump sum payment equal to the difference between the payment already received and the amount required under the Change in Control provisions noted above.
“Change of Control” means (i) when any “person” (as defined in Section 13(d) and 14(d) of the Exchange Act) (other than the Company, IPC Manager III, L.P. or its affiliates, any trustee or other fiduciary holding securities under an employee benefit plan of the Company or any Subsidiary, or any corporation owned, directly or indirectly, by the stockholder or stockholders, as the use may be, of the Company, in substantially the same proportions as their ownership of stock of the Company), acquires, in a single transaction or a series of transactions (whether by merger, consolidation, reorganization or otherwise), (A) “beneficial ownership” (as defined in Rule 13d-3 under the Exchange Act) of securities representing more than 50% of the combined voting power of the Company (or, prior to a public offering, more than 50% of the Company’s outstanding shares of common stock), or (B) substantially all or all of the assets of the Company and its Subsidiaries on a consolidated basis or (ii) a merger, consolidation, reorganization or
similar transaction of the Company with a “person” (as defined above) if, following such transaction, the holders of a majority of the Company’s outstanding voting securities in the aggregate immediately prior to such transaction do not own at least a majority of the outstanding voting securities in the aggregate of the surviving corporation immediately after such transaction. “Subsidiary” means any corporation in an unbroken chain of corporations beginning with the Company if, at the time of a Change of Control, each of the corporations (other than the last corporation in the unbroken chain) owns stock possessing 50% or more of the total combined voting power of all classes of stock in one of the other corporations in the chain.
The following table shows the potential payments upon a termination or Change of Control of us under Mr. Clevenger’s employment agreement.
|
Rex T. Clevenger |
|
Executive Vice President and Chief Finanical Officer |
|
|
|
|
|
For Good |
|
Without |
|
|
|
||||
|
|
|
|
|
Reason or |
|
Good Reason |
|
Change of |
|
||||
|
|
|
|
|
Without |
|
or With |
|
Contol |
|
||||
|
|
|
Death or |
|
Cause |
|
Cause |
|
Related |
|
||||
|
|
|
Disability |
|
Termination |
|
Termination |
|
Termination |
|
||||
|
Executive Benefits and |
|
on |
|
on |
|
on |
|
on |
|
||||
|
Payments Upon Separation |
|
12/31/2009 |
|
12/31/2009 |
|
12/31/2009 |
|
12/31/2009 |
|
||||
|
Compensation: |
|
|
|
|
|
|
|
|
|
||||
|
Non-Equity Incenive Plan |
|
$ |
261,998 |
|
$ |
261,998 |
|
$ |
— |
|
$ |
261,998 |
|
|
Stock Options |
|
1,187,453 |
|
1,187,453 |
|
1,187,453 |
|
2,850,000 |
|
||||
|
|
|
|
|
|
|
|
|
|
|
||||
|
Benefits and Perquisites: |
|
|
|
|
|
|
|
|
|
||||
|
Health and Welfare Benefits |
|
11,350 |
|
11,350 |
|
— |
|
11,350 |
|
||||
|
Severance Payments |
|
339,367 |
|
593,892 |
|
— |
|
890,838 |
|
||||
|
|
|
|
|
|
|
|
|
|
|
||||
|
Total |
|
$ |
1,800,167 |
|
$ |
2,054,693 |
|
$ |
1,187,453 |
|
$ |
4,014,186 |
|
POTENTIAL PAYMENTS UNDER OUR EXECUTIVE SEVERANCE PAY PLAN
On June 1, 2007 we adopted an Executive Severance Pay Plan, which the compensation committee amended on December 31, 2008 to comply with Section 409A of the Code. The amended Executive Severance Pay Plan provides benefits that are economically equivalent to the benefits the covered senior executives were entitled to under the June 1, 2007 plan, with the timing of payment and certain other provisions modified to comply with Section 409A. Additionally, references to the controller were removed, because our controller, who serves as our chief accounting officer, became a vice president during 2008, and as a vice president, he is entitled to benefits generally available to all vice presidents under the Executive Severance Pay Plan.
The Executive Severance Pay Plan covers our executive vice presidents, senior vice presidents and vice presidents who are not covered by an employment agreement with the Company. Executives covered by the Executive Severance Pay Plan include the
following named executive officers: Timothy Kuck, Jeffrey Singer and Diana Vance-Bryan. The terms of the Executive Severance Pay Plan, as they related to the possible payments upon termination of each of the aforementioned named executive officers, are summarized below. The amounts shown assume that termination was effective as of December 31, 2009, include amounts earned through that date and are estimates of the amounts which would be paid out to the named executive officers upon their termination. The actual amounts paid can only be determined at the time of each named executive officer’s separation from us.
Payments Made Upon Termination for Cause, Resignation Except for Good Reason, upon a Change in Control, Death or Disability
In the event of termination of employment for Cause, voluntary resignation except for Good Reason, upon a Change in Control or upon the death or disability of a named executive officer, no severance benefits are payable.
“Cause” means:
· the executive’s continued failure, whether willful, intentional, or grossly negligent, after written notice, to perform substantially the executive’s duties (the “duties”) as determined by the executive’s immediate supervisor, or the chief executive officer, or a senior vice president of the Company (other than as a result of a disability);
· dishonesty or fraud in the performance of the executive’s duties or a material breach of the executive’s duty of loyalty to the Company or its subsidiaries;
· conviction or confession of an act or acts on the executive’s part constituting a felony under the laws of the United States or any state thereof or any misdemeanor which materially impairs such executive’s ability to perform the duties;
· any willful act or omission on the executive’s part which is materially injurious to the financial condition or business reputation of the Company or any of its subsidiaries; or
· any breach by the executive of any non-competition, non-solicitation, non-disclosure or confidentiality agreement applicable to the executive.
“Change of Control” means:
· any event as a result of which IPC Manager III, L.P. and its affiliates collectively cease to own and control all of the economic and voting rights associated with ownership of at least 50.1% of the outstanding capital stock of Company; or
· any sale or transfer of all or substantially all of the assets of the Company.
“Resignation for Good Reason” means any of the following has occurred and the named executive officer has given notice thereof within 90 days of the event, we have not cured within 30 days of receipt of such notice, and the named executive officer terminates employment within 60 days thereafter:
· we have reduced or reassigned a material portion of the executive’s duties;
· the executive’s base salary has been materially reduced other than in connection with an across-the-board reduction of approximately the same percentage in executive compensation to employees imposed by our board of directors in response to negative financial results or other adverse circumstances affecting us; or
· we have required the executive to relocate in excess of 50 miles from the location where the executive is currently employed.
Payments Made Upon Termination Without Cause or Resignation for Good Reason
If we terminate the named executive officer’s employment without Cause (other than death or disability) or the named executive officer resigns for Good Reason and the named executive officer signs a General Release within 45 days of the date of termination, the named executive officer will receive his or her then current salary on a bi-weekly payment schedule and COBRA benefits, if so elected by the named executive officer, for the 12-month period following termination (“Severance Period”), provided the time period allowed by the Company for rescission of the General Release has elapsed. The first payments will be made on the 61st day following the date of termination and will include any such payment(s) that would otherwise have been made prior to the time the General Release was effective. “General Release” means a written release of all claims against us and our affiliates in the form presented by us, which includes confidentiality, non-competition, non-solicitation and no-hire provisions.
A failure to execute a General Release within 45 days of the named executive officer’s date of termination or a subsequent rescission of such General Release within the time allowed will result in the loss of any rights to receive payments or benefits under the Executive Severance Pay Plan.
If the named executive officer finds other employment within 12 months from the date of termination, the amount of salary payable and COBRA benefits to the named executive officer will be reduced by the value of the compensation and benefits that the named executive officer receives in the named executive officer’s new employment.
If the named executive officer resigns for Good Reason, the named executive officer will receive a pro rata payment under our EIP, based on days employed, for the then current calendar year in which the termination occurs, payable at the time the EIP award is paid to our other senior executives.
The following tables show the potential payments to each of the named executive officers covered by our Executive Severance Pay Plan upon a termination or Change of Control.
|
Timothy W. Kuck |
|
Executive Vice President and Chief Operating Officer |
|
|
|
Without |
|
For Good |
|
Contol |
|
|||
|
|
|
Cause |
|
Reason |
|
Related |
|
|||
|
|
|
Termination |
|
Termination |
|
Termination |
|
|||
|
Executive Benefits and |
|
on |
|
on |
|
on |
|
|||
|
Payments Upon Separation |
|
12/31/2009 |
|
12/31/2009 |
|
12/31/2009 |
|
|||
|
Compensation: |
|
|
|
|
|
|
|
|||
|
Non-Equity Incenive Plan |
|
$ |
— |
|
$ |
176,948 |
|
$ |
— |
|
|
Stock Options |
|
989,544 |
|
989,544 |
|
2,375,000 |
|
|||
|
|
|
|
|
|
|
|
|
|||
|
Benefits and Perquisites: |
|
|
|
|
|
|
|
|||
|
Health and Welfare Benefits |
|
— |
|
12,150 |
|
— |
|
|||
|
Severance Payments |
|
245,574 |
|
245,574 |
|
— |
|
|||
|
|
|
|
|
|
|
|
|
|||
|
Total |
|
$ |
1,235,118 |
|
$ |
1,424,216 |
|
$ |
2,375,000 |
|
|
Jeffrey L. Singer |
|
Executive Vice President, Sales |
|
|
|
Without |
|
For Good |
|
Contol |
|
|||
|
|
|
Cause |
|
Reason |
|
Related |
|
|||
|
|
|
Termination |
|
Termination |
|
Termination |
|
|||
|
Executive Benefits and |
|
on |
|
on |
|
on |
|
|||
|
Payments Upon Separation |
|
12/31/2009 |
|
12/31/2009 |
|
12/31/2009 |
|
|||
|
Compensation: |
|
|
|
|
|
|
|
|||
|
Non-Equity Incenive Plan |
|
$ |
— |
|
$ |
169,946 |
|
$ |
— |
|
|
Stock Options |
|
989,544 |
` |
989,544 |
|
2,375,000 |
|
|||
|
|
|
|
|
|
|
|
|
|||
|
Benefits and Perquisites |
|
|
|
|
|
|
|
|||
|
Health and Welfare Benefits |
|
— |
|
12,150 |
|
— |
|
|||
|
Severance Payments |
|
235,856 |
|
235,856 |
|
— |
|
|||
|
|
|
|
|
|
|
|
|
|||
|
Total |
|
$ |
1,225,400 |
|
$ |
1,407,496 |
|
$ |
2,375,000 |
|
|
Diana Vance-Bryan |
|
Senior Vice President and General Counsel |
|
|
|
Without |
|
For Good |
|
Contol |
|
|||
|
|
|
Cause |
|
Reason |
|
Related |
|
|||
|
|
|
Termination |
|
Termination |
|
Termination |
|
|||
|
Executive Benefits and |
|
on |
|
on |
|
on |
|
|||
|
Payments Upon Separation |
|
12/31/2009 |
|
12/31/2009 |
|
12/31/2009 |
|
|||
|
Compensation: |
|
|
|
|
|
|
|
|||
|
Non-Equity Incenive Plan |
|
$ |
— |
|
$ |
138,300 |
|
$ |
— |
|
|
Stock Options |
|
494,772 |
|
494,772 |
|
1,187,500 |
|
|||
|
|
|
|
|
|
|
|
|
|||
|
Benefits and Perquisites: |
|
|
|
|
|
|
|
|||
|
Health and Welfare Benefits |
|
— |
|
12,150 |
|
— |
|
|||
|
Severance Payments |
|
213,719 |
|
213,719 |
|
— |
|
|||
|
|
|
|
|
|
|
|
|
|||
|
Total |
|
$ |
708,491 |
|
$ |
858,941 |
|
$ |
1,187,500 |
|
2003 STOCK OPTION PLAN
The Company’s 2003 Stock Option Plan provided for the grants of stock options to any of our full or part-time employees, including officers and directors who were also employees. The exercise price for the stock options equaled the estimated fair market value of our common stock on the date such options were granted, as determined by our board of directors. We also were permitted to grant stock options to non-employee directors and consultants or independent contractors providing services to us. The exercise price for the options generally was equal to the fair market value of our common stock on the date such options were granted, as determined by our board of directors. However, the board had discretion to issue such options at exercise prices lower than fair market value. The 2003 Stock Option Plan was administered by the compensation committee. Our board of directors was permitted to amend, alter, suspend, discontinue or terminate the plan at any time, and either the compensation committee or the board of directors was permitted to amend or terminate any outstanding award, except that an outstanding award could not be amended or terminated without the holder’s consent if such amendment or termination would adversely affect the rights of the holder.
The board of directors discontinued the 2003 Stock Option Plan on May 31, 2007, in connection with the Transaction and there are no options outstanding under this plan. As a result of the Transaction, unvested options granted under our Predecessor 2003 Stock Option Plan became fully vested and accelerated expense was recorded in accordance with ASC Topic 718. Holders of vested options received in consideration for the cancellation of their vested options an amount equal to the product of:
· the number of shares of common stock issuable upon the exercise of such vested options, and
· the per share merger consideration in the Transaction minus the exercise price for such vested options, less withholding taxes.
2007 STOCK OPTION PLAN
On May 31, 2007, in connection with the Transaction, our Parent’s board of directors adopted the 2007 Stock Option Plan. The 2007 Stock Option Plan provides for the issuance of approximately 43.9 million nonqualified stock options of our Parent to any of our and Parent’s executives, including the named executive officers, other key employees and to consultants and certain directors. The options allow for the purchase of shares of common stock of our Parent at prices no lower than the stock’s fair market value at the date of grant. The exercise price of the stock option awards granted during the years ended December 31, 2009 and 2008 and for the seven months ended December 31, 2007 was set reasonably and in good faith by Parent’s board of directors and compensation committee and is equal to the market value of Parent’s common stock on the grant date. The exercise price of options issued during the year ended December 31, 2009 was determined through a variety of factors including peer group multiples, merger and acquisition multiples, and discounted cash flow analyses. The exercise prices of options issued during the year ended December 31, 2008 and seven months ended December 31,
2007 was determined by reference to the then recent per share valuation of Parent resulting from the Transaction as detailed below.
|
(in thousands, except per share amount) |
|
|
|
|
|
|
|
|
|
|
|
Equity Contribution at May 31, 2007 from Irving Place Capital and UHS Management to Parent |
|
$ |
248,794 |
|
|
|
|
|
|
|
|
Parent shares issued and outstanding at May 31, 2007 |
|
248,794 |
|
|
|
|
|
|
|
|
|
Per share Parent valuation at May 31, 2007 |
|
$ |
1.00 |
|
The 2007 Stock Option Plan is administered by Parent’s board of directors and compensation committee, which has the authority to select the persons to whom awards are granted, to determine the exercise price, if any, and the number of shares of common stock covered by such awards, and to set other terms and conditions of awards, including any vesting schedule. Parent’s board of directors is permitted to amend, alter, suspend, discontinue or terminate the plan at any time, and either the Parent’s compensation committee or Parent’s board of directors is permitted to amend or terminate any outstanding award, except that an outstanding award may not be amended or terminated without the holder’s consent if such amendment or termination would adversely affect the rights of the holder.
While the terms of the options to be granted under the 2007 Stock Option Plan will be determined at the time of grant, our employee stock options issued in fiscal 2009, 2008 and 2007 will expire 10 years from the date of grant. Option grants to directors are 100% fixed vesting options, with 16.66% vesting on each December 31 over a six-year period. Option grants to employees are comprised of 50% fixed vesting and 50% performance vesting options. Fixed vesting options vest over a six-year service period with 16.66% vesting on December 31 of each year of the six-year period, subject to the option holder not ceasing employment with Parent or the Company. Performance vesting options vest over a six-year period with 16.66% vesting on December 31 of each year of the six-year period, subject to the option holder not ceasing employment with Parent or the Company, and to the Company’s attainment of either an adjusted EBITDA target for the then current year or an aggregate adjusted EBITDA target, as set forth in the respective form of option agreement. Upon a sale of Parent or the Company, all of the unvested options with fixed vesting schedules will vest and become exercisable, and the unvested options that vest upon the achievement of established performance targets will vest and become exercisable upon IPC’s achievement of a certain internal rate of return on its investment in Parent, subject to certain conditions. An employee’s unvested options are forfeited when employment is terminated, and vested options must be exercised within a prescribed time period on or following termination to avoid forfeiture. Before the exercise of an option, the holder has no rights as a stockholder regarding the shares subject to the option, including voting rights.
DIRECTOR COMPENSATION
Under our existing policy, we pay each of our independent directors cash compensation of $30,000 per year for their service as independent directors. Members of our audit committee who are independent also receive an annual fee of $5,000 ($10,000 for the chair), and members of our compensation committee who our board determines are independent receive an annual fee of $3,000. These amounts are reviewed by the board from time to time, and all amounts are pro-rated for partial year directorship or membership, as appropriate. Directors who are not independent do not receive compensation for services on the board of directors. Although David Crane serves as a senior advisor to IPC, we consider him to be independent for compensation purposes. David Dovenberg, who is an advisor to our audit committee and not a director, is an employee and receives no compensation for his audit committee advisory services.
Independent directors are eligible to receive grants of stock options under the 2007 Stock Option Plan, subject to the approval of Parent’s board of directors. In addition, we reimburse our independent directors for all out-of-pocket expenses incurred in connection with their activities as members of the board, provided that they are expected to follow travel and expense guidelines established for all of our officers and directors.
2009 Cash Compensation
In 2009, each of our independent directors (Mr. Roberg, Mr. Schochet, Mr. McKenna, and Mr. Crane) received cash compensation of $30,000 for his service as an independent director. In addition, the following annual fees were paid based on committee memberships:
· Mr. Crane received cash compensation of $3,000 for his service as a member of our compensation committee. Mr. Crane received an aggregate amount of $33,000 during 2009.
· Mr. McKenna received cash compensation of $3,000 for his service as a member of our compensation committee. Mr. McKenna received an aggregate amount of $33,000 during 2009.
· Mr. Roberg received cash compensation of $10,000 for his service as chairman of our audit committee. Mr. Roberg received an aggregate amount of $40,000 during 2009.
· Mr. Schochet received cash compensation of $5,000 for his service as a member of our audit committee. Mr. Schochet received an aggregate amount of $35,000 during 2009.
Stock Option Compensation
For 2009, no director received a grant of stock options under the 2007 Stock Option Plan for service as a director.
In April 2008, Mr. McKenna, Mr. Schochet, and Mr. Crane each received a grant of stock options to purchase 300,000 shares of Parent’s common stock at the market value of Parent’s common stock on the grant date of $1.00 per share under and pursuant to the terms of the 2007 Stock Option Plan, for their service as our independent directors. In December 2007, Mr. Roberg received a grant of stock options to purchase 300,000 shares of Parent’s common stock at the market value of Parent’s common stock on the grant date of $1.00 per share under and pursuant to the terms of the 2007 Stock Option Plan, for his service as our director and chairman of the audit committee.
Until a stock option vests and is exercised, the underlying share cannot be voted. These stock options vest over a six-year period of service with 16.66% of the grant vesting each year. The 2007 Stock Option Plan is discussed in detail under the caption “2007 Stock Option Plan” above.
2009 Director Compensation Table
The table below summarized the compensation paid by the Company to directors for the fiscal year ended December 31, 2009:
|
|
|
Fees |
|
|
|
|
|
|||
|
|
|
Earned |
|
|
|
|
|
|||
|
|
|
or Paid |
|
Option |
|
|
|
|||
|
|
|
in Cash |
|
Awards |
|
Total |
|
|||
|
Name (1) |
|
($) (2) |
|
($) (3) |
|
($) |
|
|||
|
Barry Schochet |
|
$ |
35,000 |
|
$ |
18,549 |
|
$ |
53,549 |
|
|
Bret D. Bowerman |
|
— |
|
— |
|
— |
|
|||
|
David Crane |
|
33,000 |
|
18,549 |
|
51,549 |
|
|||
|
John D. Howard |
|
— |
|
— |
|
— |
|
|||
|
Kevin L. Roberg |
|
40,000 |
|
19,465 |
|
59,465 |
|
|||
|
Mark M. McKenna |
|
33,000 |
|
18,549 |
|
51,549 |
|
|||
|
Robert Juneja |
|
— |
|
— |
|
— |
|
|||
(1) Only the members of our board who are independent for compensation purposes receive compensation for their service as directors.
(2) The amount in the “Fees Earned or Paid in Cash” column for Mr. Schochet, Mr. Crane, Mr. Roberg, and Mr. McKenna represents retainer and committee fees as discussed in detail on 104 under the caption “2009 Cash Compensation.”
(3) The amounts in the “Option Awards” column reflect the dollar amount recognized for financial statement reporting purposes for the year ended December 31, 2009, in accordance with ASC Topic 718, of awards pursuant to the 2007 Stock Option Plan. The amounts include expense from awards granted before 2009. Assumptions used in the calculation of these amounts are included in Note 11 to our audited financial statements for the fiscal year ended December 31, 2009 set forth in Part IV, Item 15 of this Annual Report on Form 10-K. As of December 31, 2009, Mr. Roberg, Mr. McKenna, Mr. Schochet, and Mr. Crane each had 300,000 options outstanding and 100,000 options exercisable under the 2007 Stock Option Plan.
COMPENSATION COMMITTEE INTERLOCKS AND INSIDER PARTICIPATION
During fiscal 2009, the directors serving on the compensation committee of our board of directors were Mr. Juneja, Mr. Crane, and Mr. McKenna, none of whom has served as an officer or employee of UHS.
For a discussion of the related person transactions between or among the foregoing compensation committee members, their affiliates and us, see Item 12 of this Annual Report on Form 10-K.
Our board of directors has considered the compensation policies and practices that are generally applicable to all employees, including our non-executive officers, and has concluded that such policies and practices do not create risks that are reasonably likely to have a material adverse effect on us.
ITEM 12: Security Ownership of Certain Beneficial Owners and Management and Related Stockholder Matters
SECURITY OWNERSHIP OF CERTAIN BENEFICIAL OWNERS AND MANAGEMENT
All of our capital stock is owned by Parent. IPC and certain members of our management team own all of the capital stock of Parent. The following table sets forth certain information known to us, based on information provided by Parent, regarding the beneficial ownership of the common stock of Parent as of March 1, 2010 by:
· each person who is the beneficial owner of more than 5% of its outstanding voting stock;
· each member of the board of directors of Parent and our named executive officers; and
· all of our directors and executive officers as a group.
To our knowledge, each such stockholder has sole voting and investment power as to the common stock shown unless otherwise noted. Beneficial ownership of the common stock listed in the table has been determined in accordance with the applicable rules and regulations promulgated under the Exchange Act.
|
Name of Beneficial Owner (1) |
|
Number of Shares |
|
Percentage of |
|
|
|
|
|
|
|
|
|
Principal Stockholders: |
|
|
|
|
|
|
IPC/UHS, L.P. (3) (11) (12) |
|
175,000,000 |
|
67.1 |
|
|
IPC/UHS Co-Investment Partners, L.P. (3) (11) (12) |
|
63,913,306 |
|
24.5 |
|
|
|
|
|
|
|
|
|
Directors and Named Executive Officers: |
|
|
|
|
|
|
Gary D. Blackford (4) |
|
9,965,812 |
|
3.8 |
|
|
Rex T. Clevenger (5) |
|
1,349,950 |
|
* |
|
|
Timothy W. Kuck (6) |
|
1,541,479 |
|
* |
|
|
Jeffrey L. Singer (7) |
|
3,033,234 |
|
1.2 |
|
|
Diana Vance-Bryan (8) |
|
520,813 |
|
* |
|
|
Barry P. Schochet (9) |
|
100,000 |
|
* |
|
|
Bret D. Bowerman (10) |
|
— |
|
— |
|
|
David Crane (9) |
|
100,000 |
|
* |
|
|
John D. Howard (11) |
|
238,913,306 |
|
91.7 |
|
|
Kevin L. Roberg (9) |
|
100,000 |
|
* |
|
|
Mark M. McKenna (9) |
|
100,000 |
|
* |
|
|
Robert Juneja (12) |
|
238,913,306 |
|
91.7 |
|
|
All directors and executive officers as a group (17 persons) |
|
259,222,323 |
|
99.5 |
|
* Denotes less than one percent.
(1) Unless otherwise specified, the address of each of the named individuals is c/o Universal Hospital Services, Inc., 7700 France Avenue South, Suite 275, Edina, Minnesota 55435.
(2) Percentage of beneficial ownership is based on the aggregate of 248,793,717 shares of Parent’s common stock outstanding as of March 1, 2010 and 11,857,876 options exercisable or becoming exercisable for our directors and executive officers within 60 days of March 1, 2010. The percentage of beneficial ownership for all holders has been rounded to the nearest 1/10th of a percentage.
(3) IPC III GP, LLC may be deemed a beneficial owner of shares of UHS Holdco, Inc. due to its status as a general partner of IPC/UHS, L.P. and IPC/UHS Co-Investment Partners, L.P. GP, LLC disclaims beneficial ownership of any such shares of which it is not the holder of record.
(4) Includes 1,333,275 shares of common stock held by Mr. Blackford’s wife and 738,448 shares of common stock held by Mr. Blackford’s children, which may collectively be deemed to be beneficially owned by Mr. Blackford, and options to purchase 6,041,425 shares of common stock that are exercisable or become exercisable within 60 days of March 1, 2010.
(5) Includes options to purchase 1,249,950 shares of common stock that are exercisable or become exercisable within 60 days of March 1, 2010.
(6) Includes options to purchase 1,041,625 shares of common stock that are exercisable or become exercisable within 60 days of March 1, 2010.
(7) Includes options to purchase 1,041,625 shares of common stock that are exercisable or become exercisable within 60 days of March 1, 2010.
(8) Includes options to purchase 520,813 shares of common stock that are exercisable or become exercisable within 60 days of March 1, 2010.
(9) Includes options to purchase 100,000 shares of common stock that are exercisable or become exercisable within 60 days of March 1, 2010, for each of Mr. Roberg, Mr. Crane, Mr. McKenna, and Mr. Schochet.
(10) Mr. Bowerman is a vice-president of Irving Place Capital. His address is c/o Irving Place Capital, 277 Park Avenue, 39th Floor, New York, New York 10172.
(11) Mr. Howard is the Chief Executive Officer of Irving Place Capital, an independent private equity firm located in New York, NY. IPC/UHS, L.P. and IPC/UHS Co-Investment Partners, L.P. were previously known as BSMB/UHS, L.P. and BSMB/UHS Co-Investment Partners, L.P. On October 31, 2008, Bear Stearns Merchant Banking, commonly known as “BSMB,” which was affiliated with Bear Stearns & Co. Inc., spun out into an independent firm and changed its name to “Irving Place Capital.” Mr. Howard, by virtue of his status as the sole member of JDH Management, LLC, may be deemed to share beneficial ownership of shares owned of record by Irving Place Capital and IPC/UHS, L.P. and IPC/UHS Co-Investment Partners, L.P. Mr. Howard has investment and voting power with respect to shares owned by Irving Place Capital and IPC/UHS, L.P. and IPC/UHS Co-Investment Partners, L.P., but disclaims beneficial ownership of such shares except to the extent of his pecuniary interest therein. Irving Place Capital has the right to designate three persons to the Company’s board of directors pursuant to the securityholders agreement referred to under “MEETINGS AND COMMITTEES OF THE BOARD OF DIRECTORS - The Board of Directors.” The address for Mr. Howard and each of the entities identified in this footnote is c/o Irving Place Capital, 277 Park Avenue, 39th Floor, New York, New York 10172.
(12) Mr. Juneja is a Senior Managing Director and Partner of Irving Place Capital. His address is c/o Irving Place Capital, 277 Park Avenue, 39th Floor, New York, New York 10172.
EQUITY COMPENSATION PLAN
The following table summarizes, as of December 31, 2009, the shares of Parent’s common stock subject to outstanding awards or available for future awards under Parent’s 2007 Stock Option Plan.
|
Plan Category |
|
Number of Securities to be Issued |
|
Weighted-Average Exercise Price |
|
Number of Securitites Remaining |
|
|
|
Equity Compensation Plans Approved by Security Holders |
|
37,526,583 |
|
$ |
1.00 |
|
6,378,190 |
|
|
|
|
|
|
|
|
|
|
|
|
Equity Compensation Plans Not Approved by Security Holders |
|
— |
|
— |
|
— |
|
|
|
Total |
|
37,526,583 |
|
$ |
1.00 |
|
6,378,190 |
|
(1) The exercise price of the stock option award is equal to the market value of Parent’s common stock on the grant date as determined reasonably and in good faith by the Parent’s board of directors and compensation committee. The exercise price of options issued during the year ended December 31, 2009 was determined through a variety of factors including peer group multiples, merger and acquisition multiples, and discounted cash flow analyses. The exercise prices of options issued during the year ended December 31, 2008 and seven months ended December 31, 2007 was determined by reference to the then recent per share valuation of Parent resulting from the Transaction as detailed below.
|
(in thousands, except per share amount) |
|
|
|
|
|
|
|
|
|
|
|
Equity Contribution at May 31, 2007 from Irving Place Capital and UHS Management to Parent |
|
$ |
248,794 |
|
|
|
|
|
|
|
|
Parent shares issued and outstanding at May 31, 2007 |
|
248,794 |
|
|
|
|
|
|
|
|
|
Per share Parent valuation at May 31, 2007 |
|
$ |
1.00 |
|
(2) Represents shares remaining available under Parent’s 2007 Stock Option Plan.
ITEM 13: Certain Relationships and Related Transactions, and Director Independence
TRANSACTIONS WITH RELATED PERSONS
The board of directors has adopted a written policy and written procedures regarding transactions with related persons. On an annual basis, each director and executive officer is obligated to complete a director and officer questionnaire, which requires disclosure of any transactions in which we are a participant and the director, executive officer or any member of his immediate family (each a “related person”), have a direct or indirect material interest. The policy and procedures charge the audit committee with the review, approval and/or ratification of any material transactions with a related person. In determining whether to authorize, approve and/or ratify a transaction, the audit committee will use any process and review any information that it determines is reasonable in light of the circumstances in order to determine if the transaction is fair and reasonable and on terms no less favorable to the Company than could be obtained in a comparable arm’s length transaction with an unrelated third party to the Company. The audit committee may, but is not required to, seek bids, quotes or independent valuations from unaffiliated third parties sufficient to enable the audit committee to assess the fairness of the transaction to the Company.
MANAGEMENT AGREEMENTS
Payments under the management agreements described below may be made only to the extent permitted by our senior secured credit facility and the Second Lien Senior Indenture governing our Notes.
On May 31, 2007, in connection with the Transaction, we and IPC entered into a professional services agreement pursuant to which general advisory and management services are provided to us with respect to financial and operating matters. IPC is an
owner of Parent, and the following members of our board of directors are associated with IPC: John Howard, Robert Juneja and Bret Bowerman. In addition, David Crane, a director, provides consulting services to IPC. The professional services agreement requires us to pay an annual advisory fee for ongoing advisory and management services equal to the greater of $500,000 or 0.75% of our Adjusted EBITDA (as defined in the professional services agreement) for the immediately preceding fiscal year, payable in quarterly installments, provided that the annual advisory fee for the fiscal year ending December 31, 2007 shall be $500,000, as adjusted for the partial year. We paid IPC approximately $780,000 in 2009 for advisory and management services.
The professional services agreement was amended and restated as of February 1, 2008, to state that IPC may provide to us certain strategic services in exchange for a portion of the fees that would have been payable by us to IPC as advisory fees under the original professional services agreement, provided that the aggregate of the advisory and strategic services fees do not exceed the greater of $500,000 or 0.75% of our Adjusted EBITDA (as defined in the professional services agreement) for the immediately preceding fiscal year.
DIRECTOR INDEPENDENCE
Information regarding the independence of our directors is incorporated by reference to the appropriate information in Item 10 above, under “MEETINGS AND COMMITTEES OF THE BOARD OF DIRECTORS - The Board of Directors.”
ITEM 14: Principal Accountant Fees and Services
Deloitte and Touche LLP (“D&T”) has served as our independent registered public accounting firm since June 20, 2007. The following table presents fees for professional services rendered by D&T during our years ended December 31, 2009 and 2008.
|
Types of Fees |
|
2009 |
|
2008 |
|
||
|
Audit Fees (1) |
|
$ |
353,000 |
|
$ |
385,000 |
|
|
Tax Fees (2) |
|
45,000 |
|
— |
|
||
(1) Audit fees consist of services rendered for the audit of the annual financial statements, including required quarterly reviews, statutory and regulatory filings or engagements and services that generally only the auditor can reasonably be expected to provide.
(2) Tax fees are for professional services rendered for tax compliance, tax advice and tax planning.
All decisions regarding selection of independent registered public accounting firms and approval of accounting services and fees are made by our audit committee in accordance with the provisions of the Sarbanes-Oxley Act of 2002 and related SEC rules. There are no exceptions to the policy of securing prior approval by our audit committee for any service provided by our independent registered public accounting firm.
PART IV
ITEM 15: Exhibits and Financial Statement Schedules
(a) The following documents are filed as part of this Report:
1. Financial Statements
Reports of Independent Registered Public Accounting Firm
Balance Sheets as of December 31, 2009 and 2008
Statements of Operations for the year ended December 31, 2009, the year ended December 31, 2008, the seven months ended December 31, 2007 and the five months ended May 31, 2007
Statements of Shareholders’ Equity (Deficiency) and Other Comprehensive Income (Loss) for the year ended December 31, 2009, the year ended December 31, 2008, the seven months ended December 31, 2007 and the five months ended May 31, 2007
Statements of Cash Flows for the year ended December 31, 2009, the year ended December 31, 2008, the seven months ended December 31, 2007 and the five months ended May 31, 2007
Notes to Financial Statements
2. Financial Statement Schedule required to be filed by Item 8 and Paragraph (c) of this Item 15.
Schedule II -Valuation and Qualifying Accounts (follows the signature page)
All other supplemental financial schedules are omitted as not applicable or not required under the rules of Regulation S-X or the information is presented in the financial statements or notes thereto.
3. Exhibits
|
2.1 |
|
Agreement and Plan of Merger, dated as of April 15, 2007, by and among UHS Holdco, Inc., UHS Merger Sub, Inc., Universal Hospital Services, Inc. and J.W. Childs Equity Partners III, L.P., as representative (incorporated by reference to Exhibit 10.1 to Form 10-Q filed with the Securities and Exchange Commission on May 8, 2007, File No. 000-20086). |
|
3.1 |
|
Amended and Restated Certificate of Incorporation of Universal Hospital Services, Inc. (incorporated by reference to Exhibit 3.1 to Form 10-Q filed with the Securities and Exchange Commission on August 14, 2007, File No. 000-20086). |
|
3.2 |
|
Amended and Restated By-laws of Universal Hospital Services, Inc. (incorporated by reference to Exhibit 3.2 to Form 10-Q filed with the Securities and Exchange Commission on August 14, 2007, File No. 000-20086). |
|
4.1 |
|
Indenture, dated as of May 31, 2007, relating to the Second Lien Senior Secured Floating Rate Notes due 2015 and the 8.50%/9.25% Second Lien Senior Secured PIK Toggle Notes due 2015, between UHS Merger Sub, Inc. and Wells Fargo Bank, National Association, as trustee (incorporated by reference to Exhibit 4.1 to Form 10-Q filed with the Securities and Exchange Commission on August 14, 2007, File No. 000-20086). |
|
4.2 |
|
Supplemental Indenture, dated as of May 31, 2007, relating to the Second Lien Senior Secured Floating Rate Notes due 2015 and the 8.50%/9.25% Second Lien Senior Secured PIK Toggle Notes due 2015, between Universal Hospital Services, Inc. and Wells Fargo Bank, National Association, as trustee (incorporated by reference to Exhibit 4.2 to Form 10-Q filed with the Securities and Exchange Commission on August 14, 2007, File No. 000-20086). |
|
4.3 |
|
Indenture, dated as of October 17, 2003, relating to the 10.125% Senior Notes due 2011, between Universal Hospital Services, Inc. and Wells Fargo Bank, National Association, as Trustee (incorporated by reference to Form 10-Q filed with the Securities and Exchange Commission on November 12, 2003, File No. 000-20086). |
|
4.4 |
|
First Supplemental Indenture, dated as of May 16, 2007, relating to the 10.125% Senior Notes due 2011, between Universal Hospital Services, Inc. and Wells Fargo Bank, National Association, as trustee (incorporated by reference to Exhibit 4.3 to Form 10-Q filed with the Securities and Exchange Commission on August 14, 2007, File No. 000-20086). |
|
4.5 |
|
Registration Rights Agreement, dated as of May 31, 2007, among UHS Merger Sub, Inc. and the initial purchasers named therein (incorporated by reference to Exhibit 4.4 to Form 10-Q filed with the Securities and Exchange Commission on August 14, 2007, File No. 000-20086). |
|
4.6 |
|
Joinder to Registration Rights Agreement, dated as of May 31, 2007, among Universal Hospital Services, Inc. and the initial purchasers named therein (incorporated by reference to Exhibit 4.5 to Form 10-Q filed with the Securities and Exchange Commission on August 14, 2007, File No. 000-20086). |
|
4.7 |
|
Form of Second Lien Senior Secured Floating Rate Note due 2015 (included in Exhibit 4.1). |
|
4.8 |
|
Form of 8.50% / 9.25% Second Lien Senior Secured PIK Toggle Note due 2015 (included in Exhibit 4.1). |
|
4.9 |
|
Form of 10.125% Senior Notes, due 2011 in the aggregate principal amount outstanding of $9,945,000 (incorporated by reference to Exhibit 4.7 to Form S-4 filed with the Securities and Exchange Commission on December 30, 2003, File No. 333-111606). |
|
10.1 |
|
Amended and Restated Credit Agreement dated as of May 26, 2005, among Universal Hospital Services, Inc., as Borrower, the other credit parties signatory thereto, as Credit Parties, the lenders signatory thereto from time to time, as Lenders, and General Electric Capital Corporation, as Agent, Administrative Agent, Collateral Agent and Lender, and GECC Capital Markets Group, Inc. as Sole Lead Arranger and Sole Bookrunner (incorporated by reference to Exhibit 10.21 to Form 8-K filed with the Securities and Exchange Commission on May 31, 2005, File No. 000-20086). |
|
10.2 |
|
Amendment No. 1 to Credit Agreement dated as of February 13, 2007 by and among Universal Hospital Services, Inc., General Electric Capital Corporation, as agent for lenders, and the lenders party thereto (incorporated by reference to Exhibit 10.16 to Form 8-K filed with the Securities and Exchange Commission on February 28, 2007, File No. 000-20086). |
|
10.3 |
|
Asset Purchase Agreement dated February 23, 2007 by and between Universal Hospital Services, Inc. and Intellamed, Inc. (incorporated by reference to Exhibit 10.14 to Form 8-K filed with the Securities and Exchange Commission on February 28, 2007, File No. 000-20086). |
|
10.4 |
|
Letter Agreement dated February 27, 2007 between Universal Hospital Services, Inc. and Intellamed, Inc. (incorporated by reference to Exhibit 10.15 to Form 8-K filed with the Securities and Exchange Commission on February 28, 2007, File No. 000-20086). |
|
10.5 |
|
Credit Agreement, dated as of May 31, 2007, among UHS Merger Sub, Inc., Universal Hospital Services, Inc., UHS Holdco, Inc., the lenders party thereto, Merrill Lynch Capital, a division of Merrill Lynch Business Financial Services, Inc. (“ML Capital”), as administrative agent, Bank of America, N.A., as documentation agent, and ML Capital, Bear, Stearns & Co. Inc. and Wachovia Capital Markets, LLC, as joint lead arrangers and joint bookrunners (incorporated by reference to Exhibit 10.1 to Form 10-Q filed with the Securities and Exchange Commission on August 14, 2007, File No. 000-20086). |
|
10.6 |
|
Guaranty, dated as of May 31, 2007, among UHS Holdco, Inc. and the secured parties named therein (incorporated by reference to Exhibit 10.2 to Form 10-Q filed with the Securities and Exchange Commission on August 14, 2007, File No. 000-20086). |
|
10.7 |
|
First Lien Security Agreement, dated May 31, 2007, among UHS Merger Sub, Inc., Universal Hospital Services, Inc. and ML Capital, as collateral agent (incorporated by reference to Exhibit 10.3 to Form 10-Q filed with the Securities and Exchange Commission on August 14, 2007, File No. 000-20086). |
|
10.8 |
|
Trademark Security Agreement, dated May 31, 2007, among UHS Merger Sub, Inc., Universal Hospital Services, Inc., UHS Holdco, Inc. and ML Capital, as collateral agent (incorporated by reference to Exhibit 10.4 to Form 10-Q filed with the Securities and Exchange Commission on August 14, 2007, File No. 000-20086). |
|
10.9 |
|
Second Lien Security Agreement, dated May 31, 2007, among UHS Merger Sub, Inc., Universal Hospital Services, Inc. and Wells Fargo Bank, National Association, as collateral agent (incorporated by reference to Exhibit 10.5 to Form 10-Q filed with the Securities and Exchange Commission on August 14, 2007, File No. 000-20086). |
|
10.10 |
|
Second Lien Trademark Security Agreement, dated May 31, 2007, among UHS Merger Sub, Inc., Universal Hospital Services, Inc., UHS Holdco, Inc. and Wells Fargo Bank, National Association, as collateral agent (incorporated by reference to Exhibit 10.6 to Form 10-Q filed with the Securities and Exchange Commission on August 14, 2007, File No. 000-20086). |
|
10.11 |
|
Second Lien Copyright Security Agreement, dated May 31, 2007, among UHS Merger Sub, Inc., Universal Hospital Services, Inc., UHS Holdco, Inc. and Wells Fargo Bank, National Association, as collateral agent (incorporated by reference to Exhibit 10.7 to Form 10-Q filed with the Securities and Exchange Commission on August 14, 2007, File No. 000-20086). |
|
10.12 |
|
Second Lien Patent Security Agreement, dated May 31, 2007, among UHS Merger Sub, Inc., Universal Hospital Services, Inc., UHS Holdco, Inc. and Wells Fargo Bank, National Association, as collateral agent (incorporated by reference to Exhibit 10.8 to Form 10-Q filed with the Securities and Exchange Commission on August 14, 2007, File No. 000-20086). |
|
10.13 |
|
Securityholders Agreement, dated as of May 31, 2007, by and among UHS Holdco, Inc., IPC/UHS L.P. (formerly known as BSMB/UHS L.P.) and IPC/UHS Co-Investment Partners, L.P. (formerly known as BSMB/UHS Co-Investment Partners, L.P.), Gary D. Blackford and Kathy Blackford, and each of the other persons listed therein (incorporated by reference to Exhibit 10.9 to Form 10-Q filed with the Securities and Exchange Commission on August 14, 2007, File No. 000-20086). |
|
10.14 |
|
Stock Option Plan of UHS Holdco, Inc. (incorporated by reference to Exhibit 10.17 to Form 10-Q filed with the Securities and Exchange Commission on August 14, 2007, File No. 000-20086).** |
|
10.15 |
|
Form of Option Agreement with UHS Holdco, Inc. (incorporated by reference to Exhibit 10.18 to Form 10-Q filed with the Securities and Exchange Commission on August 14, 2007, File No. 000-20086).** |
|
10.16 |
|
Amended and Restated Professional Services Agreement, dated as of February 1, 2008, by and between Universal Hospital Services, Inc. and Irving Place Capital Merchant Manager III, L.P. (formerly known as Bear Stearns Merchant Manager III, L.P.) (incorporated by reference to Exhibit 10.23 to Form 10-K/A filed with the Securities and Exchange Commission on March 12, 2008, File No. 000-20086) |
|
10.17 |
|
Amended and Restated Employment Agreement, dated as of December 31, 2009, between Universal Hospital Services, Inc. and Gary D. Blackford. (incorporated by reference to Exhibit 10.17 to Form 10-K filed with the Securities and Exchange Commission on March 12, 2009, File No. 000-20086) ** |
|
10.18 |
|
Amended and Restated Employment Agreement, dated as of December 31, 2009, between Universal Hospital Services, Inc. and Rex T. Clevenger. (incorporated by reference to Exhibit 10.18 to Form 10-K filed with the Securities and Exchange Commission on March 12, 2009, File No. 000-20086) ** |
|
10.19 |
|
Amended and Restated Employment Agreement, dated as of December 31, 2009, between Universal Hospital Services, Inc. and Walter T. Chesley. (incorporated by reference to Exhibit 10.19 to Form 10-K filed with the Securities and Exchange Commission on March 12, 2009, File No. 000-20086)** |
|
10.20 |
|
Executive Severance Pay Plan, dated December 31, 2009. (incorporated by reference to Exhibit 10.20 to Form 10-K filed with the Securities and Exchange Commission on March 12, 2009, File No. 000-20086) ** |
|
10.21 |
* |
2010 Executive Incentive Plan Targets. ** |
|
12.1 |
* |
Statement regarding the computation of ratio of earnings to fixed charges. |
|
31.1 |
* |
Certification of Principal Executive Officer Pursuant to Section 302 of the Sarbanes Oxley Act of 2002. |
|
31.2 |
* |
Certification of Principal Financial Officer Pursuant to Section 302 of the Sarbanes Oxley Act of 2002. |
|
32.1 |
* |
Certification of Gary D. Blackford Pursuant to Section 906 of the Sarbanes-Oxley Act of 2002. |
|
32.2 |
* |
Certification of Rex T. Clevenger Pursuant to Section 906 of the Sarbanes-Oxley Act of 2002. |
* Filed herewith
** Indicates management contracts, compensatory plans or arrangements required to be filed pursuant to Item 601(b)(10)(iii)(A) of Regulation S-K.
SIGNATURES
Pursuant to the requirements of Section 13 or 15(d) of the Securities Exchange Act of 1934, the registrant has duly caused this report to be signed on its behalf by the undersigned thereunto duly authorized on March 10, 2010.
|
|
UNIVERSAL HOSPITAL SERVICES, INC. |
|
|
|
By |
/s/ Gary D. Blackford |
|
|
|
Gary D. Blackford |
|
|
|
Chairman of the Board and Chief Executive Officer |
Pursuant to the requirements of the Securities Exchange Act of 1934, this report has been signed by the following persons on behalf of the registrant and in the capacities indicated on March 10, 2010.
|
/s/ Gary D. Blackford |
|
Chairman of the Board and Chief Executive Officer (Principal Executive Officer) |
|
Gary D. Blackford |
|
|
|
|
|
|
|
/s/ Rex T. Clevenger |
|
Executive Vice President and Chief Financial Officer (Principal Financial Officer) |
|
Rex T. Clevenger |
|
|
|
|
|
|
|
/s/ Scott M. Madson |
|
Vice President, Controller, and Chief Accounting Officer (Principal Accounting Officer) |
|
Scott M. Madson |
|
|
|
|
|
|
|
/s/ Barry P. Schochet |
|
Director |
|
Barry P. Schochet |
|
|
|
|
|
|
|
/s/ Bret D. Bowerman |
|
Director |
|
Bret D. Bowerman |
|
|
|
|
|
|
|
/s/ David Crane |
|
Director |
|
David Crane |
|
|
|
|
|
|
|
/s/ John D. Howard |
|
Director |
|
John D. Howard |
|
|
|
|
|
|
|
/s/ Kevin L. Roberg |
|
Director |
|
Kevin L. Roberg |
|
|
|
/s/ Mark M. McKenna |
|
Director |
|
Mark M. McKenna |
|
|
|
|
|
|
|
/s/ Robert Juneja |
|
Director |
|
Robert Juneja |
|
|
SUPPLEMENTAL INFORMATION TO BE FURNISHED WITH REPORTS FILED PURSUANT TO SECTION 15(d) OF THE ACT BY REGISTRANTS WHICH HAVE NOT REGISTERED SECURITIES PURSUANT TO SECTION 12 OF THE ACT
No annual report relating to the fiscal year ended December 31, 2009 or proxy statement with respect to any annual or other meeting of security holders has been sent to security holders, nor will such information be sent to security holders.
Universal Hospital Services, Inc.
Schedule II - Valuation and Qualifying Accounts
(in thousands)
|
|
|
|
|
Additions |
|
|
|
|
|
|||||||
|
Description |
|
Balance- |
|
Charged to |
|
Charged to |
|
Deductions |
|
Balance-End |
|
|||||
|
Allowance for Doubtful Accounts |
|
|
|
|
|
|
|
|
|
|
|
|||||
|
|
|
|
|
|
|
|
|
|
|
|
|
|||||
|
Year Ended December 31, 2009 |
|
$ |
2,450 |
|
$ |
1,546 |
|
$ |
— |
|
1,546 |
|
$ |
2,450 |
|
|
|
Year ended December 31, 2008 |
|
1,500 |
|
2,018 |
|
— |
|
1,068 |
|
2,450 |
|
|||||
|
Seven months ended December 31, 2007 |
|
1,250 |
|
854 |
|
— |
|
604 |
|
1,500 |
|
|||||
|
Five months ended May 31, 2007 |
|
1,350 |
|
193 |
|
— |
|
293 |
|
1,250 |
|
|||||
|
|
|
|
|
|
|
|
|
|
|
|
|
|||||
|
Allowance for Inventory Obsolescence |
|
|
|
|
|
|
|
|
|
|
|
|||||
|
|
|
|
|
|
|
|
|
|
|
|
|
|||||
|
Year Ended December 31, 2009 |
|
$ |
912 |
|
$ |
(1 |
) |
$ |
— |
|
$ |
129 |
|
$ |
782 |
|
|
Year ended December 31, 2008 |
|
662 |
|
377 |
|
— |
|
127 |
|
912 |
|
|||||
|
Seven months ended December 31, 2007 |
|
448 |
|
331 |
|
— |
|
117 |
|
662 |
|
|||||
|
Five months ended May 31, 2007 |
|
475 |
|
256 |
|
— |
|
283 |
|
448 |
|
|||||
|
|
|
|
|
|
|
|
|
|
|
|
|
|||||
|
Income Tax Valuation Allowance |
|
|
|
|
|
|
|
|
|
|
|
|||||
|
|
|
|
|
|
|
|
|
|
|
|
|
|||||
|
Year Ended December 31, 2009 |
|
$ |
— |
|
$ |
— |
|
$ |
— |
|
$ |
— |
|
$ |
— |
|
|
Year ended December 31, 2008 |
|
— |
|
— |
|
— |
|
— |
|
— |
|
|||||
|
Seven months ended December 31, 2007 |
|
— |
|
— |
|
— |
|
— |
|
— |
|
|||||
|
Five months ended May 31, 2007 |
|
9,945 |
|
— |
|
(9,945 |
) |
— |
|
— |
|
|||||
Universal Hospital Services, Inc.
As of December 31, 2009 and 2008 and for the years ended
December 31, 2009 and 2008, the seven months ended
December 31, 2007 and the five months ended May 31, 2007
|
|
Page(s) |
|
|
|
|
F-1 |
|
|
|
|
|
Financial Statements |
|
|
|
|
|
F-2 |
|
|
|
|
|
F-3 |
|
|
|
|
|
Statements of Shareholders’ Equity (Deficiency) and Other Comprehensive Income (Loss) |
F-4 |
|
|
|
|
F-5 to F-6 |
|
|
|
|
|
F-7 to F-40 |
Universal Hospital Services, Inc.
REPORT OF INDEPENDENT REGISTERED PUBLIC ACCOUNTING FIRM
To the Board of Directors and Shareholders of
Universal Hospital Services, Inc.
We have audited the accompanying balance sheets of Universal Hospital Services, Inc. (the “Company”) as of December 31, 2009 and 2008 and the related statements of operations, shareholders’ equity (deficiency), and cash flows for the years ended December 31, 2009 and December 31, 2008 (successor), the seven month period ended December 31, 2007 (successor), and the five month period ended May 31, 2007 (predecessor). Our audits also included the financial schedule listed in the Index at Item 15. These financial statements and financial statement schedule are the responsibility of the Company’s management. Our responsibility is to express an opinion on the financial statements and financial statement schedule based on our audits.
We conducted our audits in accordance with the standards of the Public Company Accounting Oversight Board (United States). Those standards require that we plan and perform the audit to obtain reasonable assurance about whether the financial statements are free of material misstatement. The Company is not required to have, nor have we been engaged to perform, an audit of its internal control over financial reporting. Our audits included consideration of internal control over financial reporting as a basis for designing audit procedures that are appropriate in the circumstances, but not for the purpose of expressing an opinion on the effectiveness of the Company’s internal control over financial reporting. Accordingly, we express no such opinion. An audit also includes examining, on a test basis, evidence supporting the amounts and disclosures in the financial statements, assessing the accounting principles used and significant estimates made by management, as well as evaluating the overall financial statement presentation. We believe that our audits provide a reasonable basis for our opinion.
In our opinion, such financial statements present fairly, in all material respects, the financial positions of Universal Hospital Services, Inc. as of December 31, 2009 and December 31, 2008 and the results of their operations and their cash flows for the years ended December 31 2009 and December 31, 2008 (successor), the seven month period ended December 31, 2007 (successor), and the five month period ended May 31, 2007 (predecessor), in conformity with accounting principles generally accepted in the United States of America. Also, in our opinion, such financial statement schedule, when considered in relation to the basic financial statements taken as a whole, presents fairly in all material respects the information set forth therein.
Deloitte & Touche LLP
Minneapolis, Minnesota
March 10, 2010
Universal Hospital Services, Inc.
(in thousands, except share and per share information)
|
|
|
December 31, |
|
December 31, |
|
||
|
|
|
2009 |
|
2008 |
|
||
|
|
|
(Successor) |
|
(Successor) |
|
||
|
Assets |
|
|
|
|
|
||
|
Current assets: |
|
|
|
|
|
||
|
Cash and cash equivalents |
|
$ |
— |
|
$ |
12,006 |
|
|
Short-term investments |
|
— |
|
1,500 |
|
||
|
Accounts receivable, less allowance for doubtful accounts of $2,450 at December 31, 2009 and December 31, 2008 |
|
60,079 |
|
54,113 |
|
||
|
Inventories |
|
5,236 |
|
5,627 |
|
||
|
Deferred income taxes |
|
8,733 |
|
6,025 |
|
||
|
Other current assets |
|
2,983 |
|
2,815 |
|
||
|
Total current assets |
|
77,031 |
|
82,086 |
|
||
|
|
|
|
|
|
|
||
|
Property and equipment, net: |
|
|
|
|
|
||
|
Medical equipment, net |
|
197,859 |
|
215,643 |
|
||
|
Property and office equipment, net |
|
19,406 |
|
22,728 |
|
||
|
Total property and equipment, net |
|
217,265 |
|
238,371 |
|
||
|
|
|
|
|
|
|
||
|
Other long-term assets: |
|
|
|
|
|
||
|
Goodwill |
|
280,211 |
|
280,211 |
|
||
|
Other intangibles, net |
|
248,653 |
|
262,848 |
|
||
|
Other, primarily deferred financing costs, net |
|
12,243 |
|
14,209 |
|
||
|
Total assets |
|
$ |
835,403 |
|
$ |
877,725 |
|
|
|
|
|
|
|
|
||
|
Liabilities and Shareholders’ Equity |
|
|
|
|
|
||
|
Current liabilities: |
|
|
|
|
|
||
|
Current portion of long-term debt |
|
$ |
4,062 |
|
$ |
3,555 |
|
|
Book overdrafts |
|
3,302 |
|
7,170 |
|
||
|
Accounts payable |
|
18,075 |
|
17,976 |
|
||
|
Accrued compensation |
|
10,432 |
|
12,154 |
|
||
|
Accrued interest |
|
3,696 |
|
3,880 |
|
||
|
Other accrued expenses |
|
9,174 |
|
6,146 |
|
||
|
Total current liabilities |
|
48,741 |
|
50,881 |
|
||
|
|
|
|
|
|
|
||
|
Long-term debt, less current portion |
|
514,557 |
|
527,788 |
|
||
|
Pension and other long-term liabilities |
|
6,465 |
|
8,248 |
|
||
|
Interest rate swap |
|
21,286 |
|
27,167 |
|
||
|
Payable to Parent |
|
6,342 |
|
5,012 |
|
||
|
Deferred income taxes |
|
64,021 |
|
70,178 |
|
||
|
|
|
|
|
|
|
||
|
Commitments and contingencies (Note 9) |
|
|
|
|
|
||
|
|
|
|
|
|
|
||
|
Shareholders’ equity |
|
|
|
|
|
||
|
Common stock, $0.01 par value; 1,000 shares authorized, issued and outstanding at December 31, 2009 and December 31, 2008 |
|
— |
|
— |
|
||
|
|
|
|
|
|
|
||
|
Additional paid-in capital |
|
248,794 |
|
248,794 |
|
||
|
Accumulated deficit |
|
(58,165 |
) |
(39,592 |
) |
||
|
Accumulated other comprehensive loss |
|
(16,638 |
) |
(20,751 |
) |
||
|
Total shareholders’ equity |
|
173,991 |
|
188,451 |
|
||
|
Total liabilities and shareholders’ equity |
|
$ |
835,403 |
|
$ |
877,725 |
|
The accompanying notes are an integral part of these financial statements.
Universal Hospital Services, Inc.
(in thousands)
|
|
|
|
|
|
|
Seven |
|
|
Five |
|
||||
|
|
|
|
|
|
|
Months |
|
|
Months |
|
||||
|
|
|
Year Ended |
|
Year Ended |
|
Ended |
|
|
Ended |
|
||||
|
|
|
December 31, |
|
December 31, |
|
December 31, |
|
|
May 31, |
|
||||
|
|
|
2009 |
|
2008 |
|
2007 |
|
|
2007 |
|
||||
|
|
|
(Successor) |
|
(Successor) |
|
(Successor) |
|
|
(Predecessor) |
|
||||
|
Revenue |
|
|
|
|
|
|
|
|
|
|
||||
|
Medical equipment outsourcing |
|
$ |
232,623 |
|
$ |
223,676 |
|
$ |
119,808 |
|
|
$ |
84,855 |
|
|
Technical and professional services |
|
42,395 |
|
45,225 |
|
26,437 |
|
|
14,800 |
|
||||
|
Medical equipment sales and remarketing |
|
22,186 |
|
20,218 |
|
10,209 |
|
|
7,867 |
|
||||
|
Total revenues |
|
297,204 |
|
289,119 |
|
156,454 |
|
|
107,522 |
|
||||
|
|
|
|
|
|
|
|
|
|
|
|
||||
|
Cost of Sales |
|
|
|
|
|
|
|
|
|
|
||||
|
Cost of medical equipment outsourcing |
|
83,553 |
|
82,030 |
|
43,104 |
|
|
27,694 |
|
||||
|
Cost of technical and professional services |
|
30,539 |
|
32,676 |
|
19,855 |
|
|
10,124 |
|
||||
|
Cost of medical equipment sales and remarketing |
|
18,177 |
|
15,473 |
|
9,005 |
|
|
6,366 |
|
||||
|
Medical equipment depreciation |
|
64,267 |
|
61,751 |
|
34,458 |
|
|
18,512 |
|
||||
|
Total costs of medical equipment outsourcing, technical and professional services and medical equipment sales and remarketing |
|
196,536 |
|
191,930 |
|
106,422 |
|
|
62,696 |
|
||||
|
Gross margin |
|
100,668 |
|
97,189 |
|
50,032 |
|
|
44,826 |
|
||||
|
|
|
|
|
|
|
|
|
|
|
|
||||
|
Selling, general and administrative |
|
84,225 |
|
85,166 |
|
48,647 |
|
|
28,692 |
|
||||
|
Transaction and related costs |
|
— |
|
— |
|
306 |
|
|
26,891 |
|
||||
|
Intangible asset impairment charge |
|
— |
|
4,000 |
|
— |
|
|
— |
|
||||
|
Operating income (loss) |
|
16,443 |
|
8,023 |
|
1,079 |
|
|
(10,757 |
) |
||||
|
|
|
|
|
|
|
|
|
|
|
|
||||
|
Interest expense |
|
46,505 |
|
46,878 |
|
26,322 |
|
|
13,829 |
|
||||
|
Loss on extinguishment of debt |
|
— |
|
— |
|
1,041 |
|
|
22,396 |
|
||||
|
Loss before income taxes |
|
(30,062 |
) |
(38,855 |
) |
(26,284 |
) |
|
(46,982 |
) |
||||
|
|
|
|
|
|
|
|
|
|
|
|
||||
|
Provision (benefit) for income taxes |
|
(11,489 |
) |
(15,359 |
) |
(10,188 |
) |
|
492 |
|
||||
|
Net loss |
|
$ |
(18,573 |
) |
$ |
(23,496 |
) |
$ |
(16,096 |
) |
|
$ |
(47,474 |
) |
The accompanying notes are an integral part of these financial statements.
Universal Hospital Services, Inc.
Statements of Shareholders’ Equity (Deficiency) and Other Comprehensive Income (Loss)
(in thousands, except share and per share information)
|
|
|
|
|
|
|
|
|
Accumulated |
|
Total |
|
|||||
|
|
|
|
|
Additional |
|
|
|
Other |
|
Shareholders’ |
|
|||||
|
|
|
Common |
|
Paid-in |
|
Accumulated |
|
Comprehensive |
|
Equity |
|
|||||
|
|
|
Stock |
|
Capital |
|
Deficit |
|
Income (Loss) |
|
(Deficiency) |
|
|||||
|
|
|
|
|
|
|
|
|
|
|
|
|
|||||
|
Predecessor: |
|
|
|
|
|
|
|
|
|
|
|
|||||
|
Balances at December 31, 2006 |
|
$ |
1,235 |
|
$ |
2,488 |
|
$ |
(93,527 |
) |
$ |
(3,177 |
) |
$ |
(92,981 |
) |
|
Issuance of 16,664 shares of common stock |
|
— |
|
19 |
|
— |
|
— |
|
19 |
|
|||||
|
Stock-based compensation |
|
— |
|
7,957 |
|
— |
|
— |
|
7,957 |
|
|||||
|
Comprehensive loss: |
|
|
|
|
|
|
|
|
|
|
|
|||||
|
Net loss |
|
— |
|
— |
|
(47,474 |
) |
— |
|
|
|
|||||
|
Comprehensive loss |
|
|
|
|
|
|
|
|
|
(47,474 |
) |
|||||
|
Balances at May 31, 2007 |
|
$ |
1,235 |
|
$ |
10,464 |
|
$ |
(141,001 |
) |
$ |
(3,177 |
) |
$ |
(132,479 |
) |
|
|
|
|
|
|
|
|
|
|
|
|
|
|||||
|
Successor: |
|
|
|
|
|
|
|
|
|
|
|
|||||
|
Equity contributions / issuance of common stock |
|
$ |
— |
|
$ |
248,794 |
|
$ |
— |
|
$ |
— |
|
$ |
248,794 |
|
|
Comprehensive loss: |
|
|
|
|
|
|
|
|
|
|
|
|||||
|
Net loss |
|
— |
|
— |
|
(16,096 |
) |
— |
|
|
|
|||||
|
Unrealized loss on minimum pension liability adjustment, net of tax of $7 |
|
— |
|
— |
|
— |
|
(12 |
) |
|
|
|||||
|
Unrealized loss on cash flow hedge, net of tax of $5,690 |
|
— |
|
— |
|
— |
|
(8,991 |
) |
|
|
|||||
|
Total Comprehensive loss |
|
|
|
|
|
|
|
|
|
(25,099 |
) |
|||||
|
Balances at December 31, 2007 |
|
— |
|
248,794 |
|
(16,096 |
) |
(9,003 |
) |
223,695 |
|
|||||
|
Comprehensive loss: |
|
|
|
|
|
|
|
|
|
|
|
|||||
|
Net loss |
|
— |
|
— |
|
(23,496 |
) |
— |
|
|
|
|||||
|
Unrealized loss on minimum pension liability adjustment, net of tax of $2,906 |
|
— |
|
— |
|
— |
|
(4,384 |
) |
|
|
|||||
|
Unrealized loss on cash flow hedge, net of tax of $5,122 |
|
— |
|
— |
|
— |
|
(7,364 |
) |
|
|
|||||
|
Total Comprehensive loss |
|
|
|
|
|
|
|
|
|
(35,244 |
) |
|||||
|
Balances at December 31, 2008 |
|
— |
|
248,794 |
|
(39,592 |
) |
(20,751 |
) |
188,451 |
|
|||||
|
Comprehensive loss: |
|
|
|
|
|
|
|
|
|
|
|
|||||
|
Net loss |
|
— |
|
— |
|
(18,573 |
) |
— |
|
|
|
|||||
|
Unrealized gain on minimum pension liability adjustment, net of tax of $373 |
|
— |
|
— |
|
— |
|
572 |
|
|
|
|||||
|
Unrealized gain on cash flow hedge, net of tax of $2,340 |
|
— |
|
— |
|
— |
|
3,541 |
|
|
|
|||||
|
Total Comprehensive loss |
|
|
|
|
|
|
|
|
|
(14,460 |
) |
|||||
|
Balances at December 31, 2009 |
|
$ |
— |
|
$ |
248,794 |
|
$ |
(58,165 |
) |
$ |
(16,638 |
) |
$ |
173,991 |
|
The accompanying notes are an integral part of these financial statements.
Universal Hospital Services, Inc.
(in thousands)
|
|
|
Year Ended |
|
Seven Months Ended |
|
|
Five Months Ended |
|
||||||
|
|
|
December 31, |
|
December 31, |
|
|
May 31, |
|
||||||
|
|
|
2009 |
|
2008 |
|
2007 |
|
|
2007 |
|
||||
|
|
|
(Successor) |
|
(Successor) |
|
(Successor) |
|
|
(Predecessor) |
|
||||
|
Cash flows from operating activities: |
|
|
|
|
|
|
|
|
|
|
||||
|
Net loss |
|
$ |
(18,573 |
) |
$ |
(23,496 |
) |
$ |
(16,096 |
) |
|
$ |
(47,474 |
) |
|
Adjustments to reconcile net loss to net cash provided by (used in) operating activities: |
|
|
|
|
|
|
|
|
|
|
||||
|
Depreciation |
|
72,762 |
|
70,163 |
|
39,387 |
|
|
21,625 |
|
||||
|
Amortization of intangibles and deferred financing costs |
|
16,692 |
|
18,067 |
|
10,837 |
|
|
1,913 |
|
||||
|
Intangible asset impairment charge |
|
— |
|
4,000 |
|
— |
|
|
— |
|
||||
|
Non-cash write off of deferred financing cost |
|
— |
|
— |
|
290 |
|
|
6,305 |
|
||||
|
Tender premium for purchase of 10.125% senior notes |
|
— |
|
— |
|
751 |
|
|
16,090 |
|
||||
|
Provision for doubtful accounts |
|
1,546 |
|
2,018 |
|
854 |
|
|
194 |
|
||||
|
Provision for inventory obsolescence |
|
(1 |
) |
377 |
|
330 |
|
|
256 |
|
||||
|
Non-cash charges related to step-up carrying value of inventory |
|
— |
|
— |
|
200 |
|
|
— |
|
||||
|
Non-cash stock-based compensation expense |
|
1,330 |
|
2,540 |
|
2,471 |
|
|
7,957 |
|
||||
|
Loss on sales and disposals of equipment |
|
158 |
|
1,682 |
|
1,336 |
|
|
(745 |
) |
||||
|
Deferred income taxes |
|
(11,767 |
) |
(15,501 |
) |
(10,353 |
) |
|
392 |
|
||||
|
Changes in operating assets and liabilities: |
|
|
|
|
|
|
|
|
|
|
||||
|
Accounts receivable |
|
(7,511 |
) |
(4,725 |
) |
(5,904 |
) |
|
(3,481 |
) |
||||
|
Inventories |
|
392 |
|
(1,774 |
) |
405 |
|
|
(252 |
) |
||||
|
Other operating assets |
|
(609 |
) |
(545 |
) |
(15 |
) |
|
643 |
|
||||
|
Accounts payable |
|
1,097 |
|
4,377 |
|
(772 |
) |
|
590 |
|
||||
|
Other operating liabilities |
|
472 |
|
(934 |
) |
(28,216 |
) |
|
30,305 |
|
||||
|
Net cash provided by (used in) operating activities |
|
55,988 |
|
56,249 |
|
(4,495 |
) |
|
34,318 |
|
||||
|
Cash flows from investing activities: |
|
|
|
|
|
|
|
|
|
|
||||
|
Medical equipment purchases |
|
(48,827 |
) |
(69,224 |
) |
(34,695 |
) |
|
(34,040 |
) |
||||
|
Property and office equipment purchases |
|
(4,700 |
) |
(4,679 |
) |
(2,947 |
) |
|
(1,720 |
) |
||||
|
Proceeds from disposition of property and equipment |
|
3,119 |
|
2,508 |
|
1,841 |
|
|
2,290 |
|
||||
|
Acquisition of ICMS division of Intellamed, Inc |
|
— |
|
— |
|
— |
|
|
(14,590 |
) |
||||
|
Acquisition of Universal Hospital Services, Inc. by Parent |
|
— |
|
— |
|
(335,069 |
) |
|
— |
|
||||
|
Other |
|
(142 |
) |
— |
|
— |
|
|
— |
|
||||
|
Net cash used in investing activities |
|
(50,550 |
) |
(71,395 |
) |
(370,870 |
) |
|
(48,060 |
) |
||||
|
Cash flows from financing activities: |
|
|
|
|
|
|
|
|
|
|
||||
|
Proceeds under amended credit agreement |
|
— |
|
— |
|
— |
|
|
73,625 |
|
||||
|
Payments under amended credit agreement |
|
— |
|
— |
|
(74,550 |
) |
|
(42,075 |
) |
||||
|
Proceeds under senior secured credit facility |
|
78,000 |
|
104,450 |
|
59,223 |
|
|
— |
|
||||
|
Payments under senior secured credit facility |
|
(88,600 |
) |
(74,925 |
) |
(39,748 |
) |
|
— |
|
||||
|
Payments of principal under capital lease obligations |
|
(4,477 |
) |
(4,554 |
) |
(2,730 |
) |
|
(1,618 |
) |
||||
|
Proceeds from (purchase of) short term investments used as collateral |
|
1,500 |
|
(1,500 |
) |
— |
|
|
— |
|
||||
|
Payment of deferred financing costs |
|
— |
|
(69 |
) |
(17,529 |
) |
|
— |
|
||||
|
Proceeds from issuance of bonds |
|
— |
|
— |
|
460,000 |
|
|
— |
|
||||
|
Repayment of 10.125% senior notes |
|
— |
|
— |
|
(250,055 |
) |
|
— |
|
||||
|
Tender premium for purchase of 10,125% senior notes |
|
— |
|
— |
|
(751 |
) |
|
(16,090 |
) |
||||
|
Cash equity contributions |
|
— |
|
— |
|
239,754 |
|
|
— |
|
||||
|
Change in book overdrafts |
|
(3,867 |
) |
3,750 |
|
1,751 |
|
|
(119 |
) |
||||
|
Proceeds from issuance of common stock |
|
— |
|
— |
|
— |
|
|
19 |
|
||||
|
Net cash provided by (used in) financing activities |
|
(17,444 |
) |
27,152 |
|
375,365 |
|
|
13,742 |
|
||||
|
Net change in cash and cash equivalents |
|
(12,006 |
) |
12,006 |
|
— |
|
|
— |
|
||||
|
|
|
|
|
|
|
|
|
|
|
|
||||
|
Cash and cash equivalents at the beginning of period |
|
12,006 |
|
— |
|
— |
|
|
— |
|
||||
|
Cash and cash equivalents at the end of period |
|
$ |
— |
|
$ |
12,006 |
|
$ |
— |
|
|
$ |
— |
|
The accompanying notes are an integral part of these financial statements.
Universal Hospital Services, Inc.
Statements of Cash Flows
(in thousands)
|
|
|
Year Ended |
|
Seven Months Ended |
|
|
Five Months Ended |
|
||||||
|
|
|
December 31, |
|
December 31, |
|
|
May 31, |
|
||||||
|
|
|
2009 |
|
2008 |
|
2007 |
|
|
2007 |
|
||||
|
|
|
(Successor) |
|
(Successor) |
|
(Successor) |
|
|
(Predecessor) |
|
||||
|
Supplemental cash flow information: |
|
|
|
|
|
|
|
|
|
|
||||
|
Interest paid |
|
$ |
44,295 |
|
$ |
44,374 |
|
$ |
21,446 |
|
|
$ |
17,599 |
|
|
Income taxes paid |
|
$ |
238 |
|
$ |
384 |
|
$ |
(51 |
) |
|
$ |
61 |
|
|
Non-cash activities: |
|
|
|
|
|
|
|
|
|
|
||||
|
Medical equipment purchases included in accounts payable (at end of period) |
|
$ |
4,695 |
|
$ |
5,693 |
|
$ |
8,952 |
|
|
$ |
5,103 |
|
|
Deferred financing costs included in accounts payable (at end of period) |
|
$ |
— |
|
$ |
— |
|
$ |
69 |
|
|
$ |
— |
|
|
Capital lease additions |
|
$ |
2,353 |
|
$ |
9,037 |
|
$ |
2,913 |
|
|
$ |
2,142 |
|
|
Equity contributions from management shareholders |
|
$ |
— |
|
$ |
— |
|
$ |
9,039 |
|
|
$ |
— |
|
The accompanying notes are an integral part of these financial statements.
Universal Hospital Services, Inc.
As of December 31, 2009 and 2008 and for the years ended
December 31, 2009 and 2008, the seven months ended
December 31, 2007 and the five months ended May 31, 2007
1. Description of Business
Universal Hospital Services, Inc. (“we”, “our”, “us”, the “Company” or “UHS”) is a nationwide provider of medical equipment outsourcing and lifecycle services to the health care industry. The Company’s services fall into three reporting segments: medical equipment outsourcing, technical and professional services, and medical equipment sales and remarketing.
On May 31, 2007, UHS Holdco, Inc. (“Parent”) acquired all of the outstanding capital stock of the Company for approximately $712.0 million in cash less debt, tender premium and accrued interest and capitalized leases. Parent is owned by affiliates of Irving Place Capital Merchant Manager III, L.P. (formerly known as Bear Stearns Merchant Manager III, L.P.) and certain members of our management, whom we collectively refer to as the “equity investors.” Parent and Parent’s wholly owned subsidiary (“Merger Sub”) are corporations that were formed for the purpose of completing the Acquisition by Bear Stearns Merchant Banking, which was affiliated with Bear Stearns & Co. Inc. and which became an independent firm on November 1, 2008, changing its name to Irving Place Capital.
In conjunction with the Acquisition, the Company initiated a cash tender offer to purchase its $260.0 million outstanding aggregate principal amount of its 10.125% Senior Notes due 2011, which the Company completed for $235.0 million of such notes on May 31, 2007, and Merger Sub issued $230.0 million in aggregate principal amount of its Floating Rate Notes due 2015 and $230.0 million in aggregate principal amount of its PIK Toggle Notes due 2015 (The PIK Toggle Notes and the Floating Rate Notes are collectively referred to as the “Notes”). Concurrently with the closing of the Acquisition, Merger Sub merged with and into the Company, which was the surviving corporation and the Company assumed Merger Sub’s obligations with respect to the Notes and related second lien senior indenture dated as of May 31, 2007, between us and Wells Fargo Bank, National Association, as trustee (“Second Lien Senior Indenture”).
The Agreement and Plan of Merger, dated as of April 15, 2007, by and among the Company, Parent and Merger Sub and related documents resulted in the occurrence of the events outlined in Note 3 to these audited financial statements, which we collectively refer to as the “Transaction” or the “Acquisition.”
Although the Company continued as the surviving legal entity after the Acquisition, the accompanying information presents our results preceding the Acquisition (“Predecessor”) and the periods subsequent to the acquisition (“Successor”). All references to the years ended December 31, 2009 and 2008, and the seven months ended December 31, 2007 refer to our Successor results. All references to the five months ended May 31, 2007 refer to our Predecessor results.
The Acquisition and the allocation of the purchase price to the opening balance sheet accounts of the Successor have been recorded as of the beginning of the first day of our new accounting period (June 1, 2007).
2. Significant Accounting Policies
Although we underwent significant ownership and organizational changes in 2007, as a result of the Transaction, our significant accounting policies have remained consistent between Predecessor and Successor.
Cash and Cash Equivalents
The Company considers money market accounts and other highly liquid investments purchased with an original maturity of three months or less to be cash equivalents.
Short-term Investments
Marketable securities with original purchase maturities greater than three months, but less than twelve months are classified as short-term investments. At December 31, 2008, the Company purchased a six-month certificate of deposit for $1.5 million that served as collateral for bank purchase card financing. The certificate of deposit was replaced in July of 2009 with a letter of credit.
Accounts Receivable and Allowance for Doubtful Accounts
Trade accounts receivable are recorded at the invoiced amount. Concentrations of credit risk with respect to trade accounts receivable are limited due to the number of customers and their geographical distribution. The Company performs initial and ongoing credit evaluations of its customers and maintains allowances for potential credit losses. The allowance for doubtful accounts is based on historical loss experience and estimated exposure on specific trade receivables.
Inventories
Inventories consist of supplies and equipment held for resale and are valued at the lower of cost or market. Cost is determined by the average cost method, which approximates the first-in, first-out (“FIFO”) method.
Medical Equipment
Depreciation of medical equipment is provided on the straight-line method over the equipment’s estimated useful life, generally four to seven years. The cost and accumulated depreciation of medical equipment retired or sold is eliminated from their respective accounts and the resulting gain or loss is recorded as gain or loss on sales and disposals of equipment in the period the asset is retired or sold.
Property and Office Equipment
Property and office equipment includes property, leasehold improvements and office equipment.
Depreciation and amortization of property and office equipment is provided on the straight-line method over the lesser of the remaining useful life or lease term for leasehold improvements, and 3 to 10 years for shop and office equipment. The cost and accumulated depreciation or amortization of property and equipment retired or sold is eliminated from their respective accounts and the resulting gain or loss is recorded in selling, general and administrative expense in the period the asset is retired or sold.
Goodwill
Goodwill represents the excess of the cost of acquired businesses over the fair value of identifiable tangible net assets and identifiable intangible assets purchased.
Goodwill is tested at least annually for impairment, and is tested for impairment more frequently if events or changes in circumstances indicate that the asset might be impaired. The impairment test is performed using a two-step process. In the first step, the fair value of each reporting unit is compared with the carrying amount of the reporting unit, including goodwill. If the estimated fair value is less than the carrying amount of the reporting unit, there is an indication that goodwill impairment exists and a second step must be completed in order to determine the amount of the goodwill impairment, if any, that should be recorded. In the second step, an impairment loss is recognized for any excess of the carrying amount of the reporting unit’s goodwill over the implied fair value of that goodwill. The implied fair value of goodwill is determined by allocating the fair value of the reporting unit in a manner similar to a purchase price allocation. Each reporting unit constitutes a business for which discrete financial information is available and management reviews its operating results. Our reporting units are Medical Equipment Outsourcing, Technical and Professional Services, and Medical Equipment Sales and Remarketing. The fair value of each reporting unit incorporates multiple inputs including discounted cash flow calculations, peer company earnings multiples, and assumptions that market participants would make in valuing the reporting unit. Other assumptions include future business growth, earnings projections, capital expenditures, changes in working capital and the weighted average cost of capital used for purposes of discounting. Projecting discounted future cash flows requires us to make significant estimates regarding the assumptions noted above. The projections also take into account several factors including current and estimated economic trends and outlook, and other factors which are beyond our control.
We completed step one of our annual goodwill impairment evaluation during the fourth quarter with each reporting unit’s fair value exceeding its carrying value. Accordingly, step two of the impairment analysis was not required. Goodwill was not found to be impaired during any of the periods presented.
Other Intangible Assets
Other intangible assets primarily include customer relationships, supply agreement, trade names and trademarks, technology database and non-compete agreements. With the exception of trade names, which have indefinite lives, other intangible assets are amortized over their estimated economic lives of two to thirteen years that results in a remaining weighted-average useful life of approximately 10 and 11 years at the years ended December 31, 2009 and 2008, respectfully. The straight-line method of amortization generally reflects an appropriate allocation of the cost of the intangible assets to earnings in proportion to the amount of economic benefits obtained by the Company in each reporting period. However, for certain of our customer relationships we use the sum-of-the-years-digits amortization method to more appropriately allocate the cost to earnings in proportion to the estimated amount of economic benefit obtained. Intangible assets with indefinite lives are tested for impairment on an annual basis. Our calculation of estimated fair value is made using the “relief from royalty method,” which assumes that a trade name has a fair value equal to the present value of the royalty attributed to it. The royalty income attributable to a trade name represents the hypothetical cost savings that are derived from owning the trade name versus paying royalties to license the trade name from another owner. Accordingly, we estimate a fair royalty that a licensee would pay, on a percentage of revenue basis, to obtain a license to utilize the trade name for each of our Medical Equipment Outsourcing and Technical and Professional Services segments. See Note 7 for further information regarding the $4.0 million impairment loss recognized in 2008 for technical and professional service segment trade names. Amortizable intangibles are measured for impairment consistent with the process utilized for long-lived assets as described below. Our amortizable intangible assets consist of the following discrete items: Customer relationships, a supply agreement, a technology database, non-compete agreements and favorable lease agreements.
Long-Lived Assets
The Company periodically reviews its long-lived assets for impairment and assesses whether significant events or changes in business circumstances indicate that the carrying value of the assets may not be recoverable and when an event (such as those noted in Accounting Standards Codification (“ASC”) 360-10-35-21) is indicated. An impairment loss is recognized when the carrying amount of an asset exceeds the anticipated future undiscounted cash flows expected to result from the use of the asset and its eventual disposition. For other long-lived assets, primarily movable medical equipment, we continuously monitor specific makes/models for events such as product recalls or obsolescence. The amount of the impairment loss to be recorded, if any, is calculated by the excess of the asset’s carrying value over its fair value.
Deferred Financing Costs
Financing costs associated with issuing debt are deferred and amortized over the related terms using the straight-line method, which approximates the effective interest rate method. Accumulated amortization of our deferred financing costs was $6.2 and $3.8 million at December 31, 2009 and 2008, respectively.
Purchase Accounting
We account for acquisitions in accordance with the provisions of ASC Topic 805 “Business Combinations,” whereby the purchase price paid to effect the acquisition is allocated to state the acquired assets and liabilities at fair value with excess purchase price being recorded as goodwill.
Revenue Recognition
Medical equipment is outsourced on both short-term and long-term arrangements, and outsourced revenue is recorded in income as equipment is utilized based on an agreed rate per use or time period. Any changes to the rate are billed on a prospective basis. Technical and professional services revenue is recognized as services are provided. Medical equipment sales and remarketing revenues consist of (1) sales of medical equipment and related parts and single-use disposable items to customers and (2) sales of medical equipment that include installation services. The Company follows the provisions of ASC Topic 605, “Revenue Recognition,” in recognizing these revenues as they are realized and earned once an arrangement exists, delivery has occurred and services rendered, and the price is fixed and collectability is reasonably assured. Sales of medical equipment as well as related parts and single-use disposable items are recognized at the point of delivery, if performed by us, or at the point of shipment, when risk of loss has passed to the customer. Because of the short-term nature of equipment installation projects, sales that include installation services are recognized when the earnings cycle is complete—installation has been completed, the equipment becomes operational and the customer has accepted it. All revenues are recognized net of any sales taxes.
The Company reports only its portion of revenues earned under certain revenue share arrangements in accordance with ASC Topic 605-45 “Principal Agent Considerations,” because, among other factors, the equipment manufacturer retains title to the equipment, maintains general inventory and physical loss risk of equipment on rental and because we earn a fixed percentage of the billings to customers.
Operating Leases
The Company leases all of its district, corporate and other operating locations under operating leases and recognizes rent expense on a straight-line basis over the lease terms. Rent holidays and rent escalation clauses, which provide for scheduled rent increases during the lease term, are taken into account in computing straight-line rent expense included in our Statements of Operations. The
difference between the rent due under the stated periods of the leases compared to that of the straight-line basis is recorded as a component of other long-term liabilities in the Balance Sheets. Landlord funded lease incentives, including tenant improvement allowances provided for our benefit, are recorded as leasehold improvement assets and as deferred rent in the Balance Sheets and are amortized to depreciation expense and as rent expense credits, respectively.
Income Taxes
The Company accounts for deferred income taxes utilizing ASC Topic 740, “Income Taxes.” ASC Topic 740 requires the asset and liability method, whereby deferred tax assets and liabilities are recognized based on the tax effects of temporary differences between the financial statement and the tax bases of assets and liabilities, as measured at current enacted tax rates. When appropriate, the Company evaluates the need for a valuation allowance to reduce deferred tax assets. Management believes the valuation allowance is no longer necessary as we determined that it was more likely than not that the benefits of these deferred tax assets will be realized.
In June 2006, Financial Accounting Standards Board (“FASB”) issued guidance now codified in ASC Topic 740, “Income Taxes.” The guidance clarifies the accounting for uncertainty in income taxes recognized in an enterprise’s financial statements and prescribes a recognition threshold and measurement attributes of income tax positions taken or expected to be taken on a tax return.
Interest and penalties associated with uncertain income tax positions is classified as income tax expense. The Company has not recorded any material income tax related interest or penalties during any of the periods presented.
Derivative Financial Instrument
We have an interest rate swap agreement which we use as a derivative financial instrument to manage our interest rate exposure. We do not use financial instruments for trading or other speculative purposes.
ASC Topic 815, “Derivatives and Hedging,” establishes accounting and reporting standards requiring that derivative instruments be recorded on the balance sheet as either an asset or liability measured at fair value. The statement requires that changes in the derivative’s fair value be recognized currently in earnings unless specific hedge accounting criteria are met. If hedge accounting criteria are met, the changes in a derivative’s fair value (for a cash flow hedge) are deferred in stockholders’ equity (deficiency) as a component of other comprehensive income (loss). These deferred gains and losses are recognized as income in the period in which hedged cash flows occur. The ineffective portions of hedge returns are recognized as earnings.
In June 2007 we entered into an interest rate swap agreement for $230.0 million, which has the effect of converting our $230.0 of Floating Rate Notes to fixed interest rates. The effective date for the swap agreement is December 2007; the expiration date is May 2012. See Note 8, Long-Term Debt, for a detailed description of our interest rate swap.
Fair Value of Other Financial Instruments
The Company considers that the carrying amount of financial instruments, including accounts receivable, accounts payable and accrued liabilities, approximate fair value due to their short maturities. The fair value of our outstanding PIK Toggle Notes, Floating Rate Notes and 10.125% Senior Notes, based on the quoted market price for the same or similar issues of debt, is approximately:
|
|
|
December 31, |
|
December 31, |
|
||
|
(in millions) |
|
2009 |
|
2008 |
|
||
|
PIK Toggle Notes |
|
$ |
227.1 |
|
$ |
162.4 |
|
|
Floating Rate Notes |
|
193.8 |
|
139.4 |
|
||
|
10.125% Senior Notes |
|
9.8 |
|
9.8 |
|
||
Segment Information
The Company’s business is managed and internally reported as three segments: Medical Equipment Outsourcing, Technical and Professional Services, and Medical Equipment Sales and Remarketing. Note 16 contains additional segment information.
Stock-Based Compensation
We record compensation expense associated with stock options in accordance with ASC Topic 718, “Compensation — Stock Compensation.” Note 11 contains the significant assumptions used in determining the underlying fair value of options and disclosures as required under ASC Topic 718.
Comprehensive Income (Loss)
Comprehensive income (loss) is comprised of net loss and other comprehensive income (loss). Other comprehensive income (loss) includes unrealized gains and losses from derivatives designated as cash flow hedges and minimum pension liability adjustments. These amounts are presented in the Statements of Shareholders’ Equity (Deficiency) and Other Comprehensive Income (Loss).
Use of Estimates
The preparation of financial statements in conformity with accounting principles generally accepted in the United States of America (“GAAP”) requires management to make estimates and assumptions that affect the reported amounts of assets and liabilities and disclosure of contingent assets and liabilities at the date of the financial statements and the reported amounts of revenues and expenses during the reporting period. Actual results could differ from those estimates.
Recent Accounting Pronouncements
Standards Adopted
In June 2009, FASB issued guidance now codified as FASB ASC Topic 105, “Generally Accepted Accounting Principles,”(the Codification), which establishes the ASC as the single source of authoritative nongovernmental GAAP, except for Securities and Exchange Commission (“SEC”) rules and interpretive releases, which are sources of authoritative GAAP for SEC registrants. ASC Topic 105 does not change current GAAP, but is intended to simplify user access to all authoritative GAAP by providing all authoritative literature related to a particular topic in one place. These provisions of the standard are effective for interim and annual periods ending after September 15, 2009 and the Company adopted the provisions for the quarter ended September 30, 2009. Accordingly, the provisions are effective for the Company for the current fiscal reporting period. On the effective date of the standard, the Codification superseded all then-existing non-SEC accounting and reporting standards, and all other non-grandfathered non-SEC accounting literature not included in the Codification became non-authoritative. The adoption of this pronouncement did not have an impact on the Company’s financial condition or results of operations, but does impact our financial reporting process by eliminating all references to pre-codification standards.
In August 2009, the FASB issued Accounting Standards Update No. 2009-05 (“ASC Update 2009-05”), an update to ASC 820, Fair Value Measurements and Disclosures. This update provides
amendments to reduce potential ambiguity in financial reporting when measuring the fair value of liabilities. Among other provisions, this update provides clarification that in circumstances in which a quoted price in an active market for the identical liability is not available, a reporting entity is required to measure fair value using one or more of the valuation techniques described in ASC Update 2009-05. The adoption of this update did not have a material impact on the Company’s financial condition or results of operations.
In May 2009, the FASB issued, and we adopted, guidance now codified as ASC Topic 855, “Subsequent Events,” which was effective for interim and annual periods after June 15, 2009 and amended on February 24, 2010. ASC Topic 855 established general standards of accounting for and disclosure of events that occur after the balance sheet date but before financial statements are issued or are available to be issued. ASC Topic 855 stipulates the period after the balance sheet date during which management of a reporting entity should evaluate events or transactions that may occur for potential recognition or disclosure in the financial statements, the circumstances under which an entity should recognize events or transactions occurring after the balance sheet date in its financial statements and the disclosures that an entity should make about events or transactions that occurred after the balance sheet date through the date the financial statements are issued.
In April 2009, the FASB issued guidance, now codified, to address concerns about (1) measuring the fair value of financial instruments when the markets become inactive and quoted prices may reflect distressed transactions and (2) recording impairment charges on investments in debt securities. The FASB also issued guidance, now codified, to require disclosures of fair values of certain financial instruments in interim financial statements.
ASC Topic 820, “Fair Value Measurements and Disclosures,” provides additional guidance to highlight and expand on the factors that should be considered in estimating fair value when there has been a significant decrease in market activity for a financial asset. FASB ASC Topic 820 also requires new disclosures relating to fair value measurement inputs and valuation techniques (including changes in inputs and valuation techniques).
ASC Topic 320, “Investments — Debt and Equity Securities,” changes (1) the trigger for determining whether an other-than-temporary impairment exists and (2) the amount of an impairment charge to be recorded in earnings. To determine whether an other-than-temporary impairment exists, an entity will be required to assess the likelihood of selling a security prior to recovering its cost basis. This is a change from the former requirement for an entity to assess whether it has the intent and ability to hold a security to recovery or maturity. ASC Topic 320 also expands and increases the frequency of existing disclosure about other-than-temporary impairments and requires new disclosures of the significant inputs used in determining a credit loss, as well as a roll forward of that amount each period.
ASC Topic 825, “Financial Instruments,” increases the frequency of fair value disclosures from annual to quarterly to provide financial statement users with more timely information about the effects of current market conditions on their financial instruments.
We adopted the three above ASC Topics during the second quarter of 2009. The adoption of the above guidance did not have a material effect on the Company’s financial condition, results of operations or cashflows.
In December 2009, we adopted guidance now codified as ASC Topic 715, “Compensation — Retirement Benefits” that requires more detailed disclosures about employers’ pension plan assets. New disclosures include more information on investment strategies, major categories of plan assets,
concentrations of risk within plan assets and valuation techniques used to measure the fair value of plan assets. This new standard required new disclosures only, and had no impact on our consolidated financial position, results of operations or cash flows. These new disclosures are included in Note 13.
In March 2008, the FASB issued guidance now codified as ASC Topic 815, “Derivatives and Hedging.” ASC Topic 815 requires companies to provide enhanced disclosures about derivative instruments and hedging activities to provide a better understanding of their effects on a company’s financial position, financial performance, and cash flows. We adopted the disclosure provisions of ASC Topic 815 on January 1, 2009. The adoption of the above standard did not have a material effect on the Company’s financial condition, results of operations or cashflows.
We enter into derivative instruments for risk management purposes only, including derivatives designated as hedging instruments under ASC Topic 815, “Derivatives and Hedging.” We are a party to an interest rate swap that is designated as a fair value hedge for a portion of our long-term debt. By using this instrument, we are exposed, from time to time, to credit risk and market risk. Credit risk is the risk that the counterparty will fail to perform under the terms of the derivative contract. When the fair value of a derivative contract is positive, the counterparty owes us, which creates credit risk for us. We minimize this credit risk by entering into transactions with high quality counterparties. Market risk is the risk that a change in interest rates will result in an adverse effect on the value of a financial instrument.
In December 2007, the FASB issued guidance now codified as ASC Topic 805, “Business Combinations,” which establishes principles and requirements for how an acquirer in a business combination recognizes and measures in its financial statements the identifiable assets acquired, the liabilities assumed, and any noncontrolling interest; recognizes and measures the goodwill acquired in the business combination or a gain from a bargain purchase; and determines what information to disclose to enable users of the financial statements to evaluate the nature and financial effects of the business combination. ASC Topic 805 is to be applied prospectively to business combinations for which the acquisition date is on or after the beginning of an entity’s fiscal year that begins on or after December 15, 2008. We adopted ASC Topic 805 on January 1, 2009 and apply the provisions to applicable business combinations on a prospective basis.
Standards Issued Not Yet Adopted
In October 2009, the FASB issued Accounting Standards Update (“ASU”), 2009-13, Revenue Recognition (Topic 605): Multiple Deliverable Revenue Arrangements — A Consensus of the FASB Emerging Issues Task Force.” This update provides application guidance on whether multiple deliverables exist, how the deliverables should be separated and how the consideration should be allocated to one or more units of accounting. This update establishes a selling price hierarchy for determining the selling price of a deliverable. The selling price used for each deliverable will be based on vendor-specific objective evidence, if available, third-party evidence if vendor-specific objective evidence is not available, or estimated selling price if neither vendor-specific or third-party evidence is available. The Company will be required to apply this guidance prospectively for revenue arrangements entered into or materially modified after January 1, 2011. We are currently evaluating the impact of the provisions of ASU 2009-13.
3. The Transaction
The Acquisition was completed on May 31, 2007 and was comprised of:
· the purchase by the equity investors of all of the issued and outstanding shares of common stock and option interests of the Company for approximately $335.1 million (excluding non-cash consideration of $9.0 million), which is comprised of the purchase price of approximately $712.0 million less debt, tender premium and accrued interest and capitalized leases;
· equity investments from Parent funded by Irving Place Capital (formerly Bear Stearns Merchant Banking) in the amount of $238.9 million, management rollover of $9.0 million and management contributions of $0.9 million;
· the entry into by Merger Sub of a new $135.0 million senior secured credit facility;
· the issuance by Merger Sub of $230.0 million of Floating Rate Notes and $230.0 million of PIK Toggle Notes; and
· the retirement of $309.6 million of the existing indebtedness of the Predecessor, which was approximately $334.6 million as of May 31, 2007 (excluding approximately $7.7 million of pre-existing capital leases which remained outstanding), including the repayment of $235.0 million of our $260.0 million existing 10.125% Senior Notes due 2011 for which we completed a tender offer and consent solicitation on May 31, 2007, and the repayment of the outstanding balance ($74.6 million) on our previous $125.0 million amended and restated credit agreement (“Amended Credit Agreement”) that we had entered into on May 26, 2005, with a bank group led by General Electric Capital Corporation.
The Acquisition occurred simultaneously with:
· the closing of the financing and equity investments described above; and
· the merger of Merger Sub with and into the Company, with the Company as the surviving corporation, and the payment of approximately $712.0 million as merger consideration.
Transaction and Related Costs. During the five months ended May 31, 2007, we incurred $26.9 million of expenses in connection with the Transaction. These expenses consisted primarily of:
· accounting, legal, investment banking advisory and restructuring expenses totaling $13.7 million;
· Irving Place Capital fee expensed of $6.5 million (see Note 12); and
· stock-based compensation expense related to the accelerated vesting of options under our 2003 Stock Option Plan of $6.7 million upon the occurrence of the Transaction.
Loss on Extinguishment of Debt. In connection with the Transaction, as detailed above, Predecessor incurred $22.4 million of expense associated with the purchase of $235.0 million of our 10.125% Senior Notes in May 2007. The expense consisted of a call premium of $16.1 million and the write-off of $6.3 million of unamortized deferred financing costs related to our repurchased 10.125% Senior Notes and Amended Credit Agreement.
Purchase Accounting
The purchase price paid to effect the Acquisition is allocated to state the acquired assets and liabilities at fair value. The Acquisition and the allocation of the purchase price to the opening balance sheet accounts of the Successor has been recorded as of the beginning of the first day of our new accounting period (June 1, 2007). The purchase price was $712.0 million and the total consideration was approximately $344.1 million (including non-cash management rollover and direct costs). The sources and uses of funds in connection with the Transaction and the partial redemption of our 10.125% Senior Notes are summarized below:
|
(in millions) |
|
|
|
|
|
Sources: |
|
|
|
|
|
Existing 10.125% Senior Notes |
|
$ |
25.0 |
|
|
Floating Rate Notes |
|
230.0 |
|
|
|
PIK Toggle Notes |
|
230.0 |
|
|
|
Capitalized leases |
|
7.7 |
|
|
|
Equity contribution (cash) |
|
239.8 |
|
|
|
Equity contribution (non-cash) |
|
9.0 |
|
|
|
Cash on hand |
|
1.4 |
|
|
|
Total Sources |
|
$ |
742.9 |
|
|
|
|
|
|
|
|
Uses: |
|
|
|
|
|
Consideration paid (including non-cash consideration of $9.0) |
|
$ |
342.9 |
|
|
Payment of existing debt |
|
309.6 |
|
|
|
Tender premium and accrued interest |
|
18.6 |
|
|
|
Capitalized leases |
|
7.7 |
|
|
|
Existing 10.125% Senior Notes |
|
25.0 |
|
|
|
Buyer fees (including direct costs of $1.2) |
|
30.9 |
|
|
|
Seller fees |
|
8.2 |
|
|
|
Total Uses |
|
$ |
742.9 |
|
The following tables reconcile the total sources and uses of funds to the purchase price and the purchase price to the total consideration:
Reconciliation of Sources and Uses to Purchase Price
(in millions)
|
Total of Sources and Uses |
|
$ |
742.9 |
|
|
Less: Buyer fees (including direct costs of $1.2) |
|
(30.9 |
) |
|
|
Purchase price (1) |
|
$ |
712.0 |
|
Reconciliation of Purchase Price to Total Consideration
(in millions)
|
Purchase Price (1) |
|
$ |
712.0 |
|
|
Direct costs |
|
1.2 |
|
|
|
Indebtedness (2) |
|
(360.9 |
) |
|
|
Seller fees |
|
(8.2 |
) |
|
|
Total Consideration |
|
$ |
344.1 |
|
(1) Per Agreement and Plan of Merger.
(2) As defined in the Agreement and Plan of Merger, “funded indebtedness” includes long-term debt ($334.6 million for both debt retired and remaining), tender premium and accrued interest ($18.6 million) and capitalized leases ($7.7 million) as of May 31, 2007.
In connection with the purchase price allocation, we estimated the fair values of our long-lived and intangible assets, inventories and liabilities based upon assumptions related to the future cash flows, discount rates and asset lives utilizing currently available information. We have recorded purchase accounting adjustments to increase the carrying value of our property and equipment and inventory, to establish intangible assets for our customer relationships, supply agreement, trade names and trademarks, technology database, non-compete agreements, favorable lease commitments and to revalue our long-term benefit plan obligations, among other things. As additional information became available, that was primarily related to the tax impact of valuation analysis and the tax impact of the Transaction itself, we revised the preliminary purchase accounting adjustments during the fourth quarter of 2007 and finalized our purchase accounting adjustment during the second quarter of 2008. The final purchase accounting adjustments, as reflected in our December 31, 2008 balance sheet, were as follows:
|
(in millions) |
|
|
|
|
|
||
|
|
|
|
|
|
|
||
|
Cash Consideration: |
|
|
|
|
|
||
|
Paid to shareholders and option holders |
|
|
|
$ |
333.9 |
|
|
|
Direct costs |
|
|
|
1.2 |
|
||
|
|
|
|
|
335.1 |
|
||
|
Non-Cash Consideration |
|
|
|
9.0 |
|
||
|
Total Consideration |
|
|
|
$ |
344.1 |
|
|
|
|
|
|
|
|
|
||
|
|
|
|
|
|
|
||
|
Net assets acquired at historical cost |
|
|
|
$ |
(132.5 |
) |
|
|
|
|
|
|
|
|
||
|
Adjustments to state acquired assets at fair value: |
|
|
|
|
|
||
|
Increase carrying value of inventories |
|
$ |
0.2 |
|
|
|
|
|
Increase carrying value of medical equipment |
|
59.7 |
|
|
|
||
|
Increase in carrying value of property and office equipment |
|
2.3 |
|
|
|
||
|
Write-off of historical goodwill and other intangibles |
|
(59.8 |
) |
|
|
||
|
Record intangible assets acquired: |
|
|
|
|
|
||
|
Customer relationships |
|
87.0 |
|
|
|
||
|
Supply agreement |
|
26.0 |
|
|
|
||
|
Trade names and trademarks |
|
170.0 |
|
|
|
||
|
Technology database |
|
7.0 |
|
|
|
||
|
Non-compete agreements |
|
1.8 |
|
|
|
||
|
Record favorable lease commitments |
|
0.1 |
|
|
|
||
|
Write-off of historical deferred rent credits |
|
2.4 |
|
|
|
||
|
Decrease in long-term pension liability |
|
0.8 |
|
|
|
||
|
Increase in other accrued liabilities |
|
(0.3 |
) |
|
|
||
|
Tax impact of valuation adjustments |
|
(100.8 |
) |
|
|
||
|
|
|
|
|
196.4 |
|
||
|
Net assets acquired at fair value |
|
|
|
63.9 |
|
||
|
|
|
|
|
|
|
||
|
Excess purchase price recorded as goodwill |
|
|
|
$ |
280.2 |
|
|
Our trade names and trademarks have indefinite lives and are not subject to amortization. Our trade names and trademarks and goodwill are reviewed at least annually for impairment. Our goodwill is generally not deductible for income tax purposes.
4. Acquisitions by Predecessor
On April 1, 2007, we completed the acquisition of customer contracts and other assets of the ICMS division of Intellamed, Inc. (“Intellamed”), located in Bryan, Texas. The purchase price was $14.6 million including direct costs and the assumption of certain liabilities, having taken into account certain adjustments and a holdback. The purchase agreement provided for additional consideration to be paid if certain revenue targets are obtained during the two years following the acquisition. We have not recorded any such consideration. The operations of the acquired entity have been included in the Company’s technical and professional services segment results of operations since the date of acquisition.
The Company acquired the assets of Intellamed in order to expand its customer base and as part of its strategy of growing its technical and professional services segment. The purchase price of this
acquisition was determined based on an evaluation of the assets, liabilities assumed, cash flow potential and comparable prices for similar businesses. This acquisition was financed by borrowings under the Company’s revolving credit facility.
5. Fair Value Measurements
In September 2006, the FASB issued guidance now codified as ASC Topic 820, “Fair Value Measurements and Disclosure,” which establishes a consistent framework for measuring fair value and expands disclosures on fair value measurements. ASC Topic 820 was effective for the Company starting in fiscal 2008 with respect to financial assets and liabilities. In addition the Company adopted the non-financial asset and liability provisions ASC Topic 820 on January 1, 2009. The adoption of the non-financial asset and liability provisions of ASC Topic 820 had no impact on our financial statements as of January 1, 2009 and will be applied on a prospective basis.
Financial assets and liabilities measured at fair value on a recurring basis as of December 31, 2009 and 2008, in accordance with ASC Topic 820, are summarized in the following table by type of inputs applicable to the fair value measurements:
|
|
|
Fair Value at December 31, 2009 |
|
Fair Value at December 31, 2008 |
|
||||||||||||||||||||
|
|
|
Level 1 |
|
Level 2 |
|
Level 3 |
|
Total |
|
Level 1 |
|
Level 2 |
|
Level 3 |
|
Total |
|
||||||||
|
Assets: |
|
|
|
|
|
|
|
|
|
|
|
|
|
|
|
|
|
||||||||
|
Short term investments |
|
$ |
— |
|
$ |
— |
|
$ |
— |
|
$ |
— |
|
$ |
— |
|
$ |
1,500 |
|
$ |
— |
|
$ |
1,500 |
|
|
|
|
|
|
|
|
|
|
|
|
|
|
|
|
|
|
|
|
||||||||
|
Liabilities: |
|
|
|
|
|
|
|
|
|
|
|
|
|
|
|
|
|
||||||||
|
Interest Rate Swap |
|
$ |
— |
|
$ |
21,286 |
|
$ |
— |
|
$ |
21,286 |
|
$ |
— |
|
$ |
27,167 |
|
$ |
— |
|
$ |
27,167 |
|
A description of the inputs used in the valuation of assets and liabilities is summarized as follows:
Level 1 — Inputs represent unadjusted quoted prices for identical assets or liabilities exchanged in active markets.
Level 2 — Inputs include directly or indirectly observable inputs other than Level 1 inputs such as quoted prices for similar assets or liabilities exchanged in active or inactive markets; quoted prices for identical assets or liabilities exchanged in inactive markets; other inputs that are considered in fair value determinations of the assets or liabilities, such as interest rates and yield curves that are observable at commonly quoted intervals, volatilities, prepayment speeds, loss severities, credit risks and default rates; and inputs that are derived principally from or corroborated by observable market data by correlation or other means.
Level 3 — Inputs include unobservable inputs used in the measurement of assets and liabilities. Management is required to use its own assumptions regarding unobservable inputs because there is little, if any, market activity in the assets or liabilities or related observable inputs that can be corroborated at the measurement date. Measurements of non-exchange traded derivative contract assets and liabilities are primarily based on valuation models, discounted cash flow models or other valuation techniques that are believed to be used by market participants. Unobservable inputs require management to make certain projections and assumptions about the information that would be used by market participants in pricing assets or liabilities.
6. Book Overdrafts
The Company typically does not maintain cash balances at its principal bank under a policy whereby the net amount of collected balances and cleared checks is, at the Company’s option, applied to or drawn from our credit facility on a daily basis.
7. Selected Financial Statement Information
Accounts Receivable
Accounts receivable at December 31, consists of the following:
|
(in thousands) |
|
2009 |
|
2008 |
|
||
|
|
|
|
|
|
|
||
|
Accounts receivable |
|
$ |
62,529 |
|
$ |
56,563 |
|
|
Less: Allowance for doubtful accounts |
|
(2,450 |
) |
(2,450 |
) |
||
|
Accounts receivable, net |
|
$ |
60,079 |
|
$ |
54,113 |
|
Property and Equipment
Our property and equipment at December 31, consists of the following:
|
(in thousands) |
|
2009 |
|
2008 |
|
||
|
Medical Equipment |
|
$ |
349,801 |
|
$ |
309,837 |
|
|
Less: Accumulated depreciation |
|
(151,942 |
) |
(94,194 |
) |
||
|
Medical equipment, net |
|
197,859 |
|
215,643 |
|
||
|
Leasehold improvements |
|
5,477 |
|
4,903 |
|
||
|
Office equipment and vehicles |
|
31,996 |
|
29,686 |
|
||
|
Propery and office equipment |
|
37,473 |
|
34,589 |
|
||
|
Less: Accumulated depreciation and amortization |
|
(18,067 |
) |
(11,861 |
) |
||
|
Property and office equipment, net |
|
19,406 |
|
22,728 |
|
||
|
Total property and equipment, net |
|
$ |
217,265 |
|
$ |
238,371 |
|
|
|
|
|
|
|
|
||
|
Property and equipment financed under capital leases, net |
|
$ |
10,286 |
|
$ |
12,377 |
|
Other Intangible Assets and Goodwill
Our other intangible assets and goodwill as of December 31, 2009 and 2008, by reporting segment, consist of the following:
|
|
|
Customer |
|
Supply |
|
Technology |
|
Non-Compete |
|
Favorable Lease |
|
Trade Names |
|
|
|
|||||||
|
(in thousands) |
|
Relationships |
|
Agreement |
|
Database |
|
Agreements |
|
Agreements |
|
(indefinite lives) |
|
Goodwill |
|
|||||||
|
Medical Equipment Outsourcing |
|
|
|
|
|
|
|
|
|
|
|
|
|
|
|
|||||||
|
Balance at January 1, 2008 |
|
$ |
71,500 |
|
$ |
24,833 |
|
$ |
— |
|
$ |
— |
|
$ |
— |
|
$ |
143,000 |
|
$ |
207,907 |
|
|
Final purchase price allocation adjustments |
|
— |
|
— |
|
— |
|
— |
|
— |
|
— |
|
(1,954 |
) |
|||||||
|
Amortization |
|
(10,643 |
) |
(2,000 |
) |
— |
|
— |
|
— |
|
— |
|
— |
|
|||||||
|
Balance at December 31, 2008 |
|
|
60,857 |
|
|
22,833 |
|
— |
|
— |
|
— |
|
|
143,000 |
|
|
205,953 |
|
|||
|
Other |
|
— |
|
— |
|
— |
|
|
90 |
|
— |
|
— |
|
— |
|
||||||
|
Amortization |
|
(9,786 |
) |
(2,000 |
) |
— |
|
(7 |
) |
— |
|
— |
|
— |
|
|||||||
|
Balance at December 31, 2009 |
|
$ |
51,071 |
|
$ |
20,833 |
|
$ |
— |
|
$ |
83 |
|
$ |
— |
|
$ |
143,000 |
|
$ |
205,953 |
|
|
|
|
|
|
|
|
|
|
|
|
|
|
|
|
|
|
|||||||
|
Technical and Professional Services |
|
|
|
|
|
|
|
|
|
|
|
|
|
|
|
|||||||
|
Balance at January 1, 2008 |
|
$ |
8,596 |
|
$ |
— |
|
$ |
— |
|
$ |
— |
|
$ |
— |
|
$ |
27,000 |
|
$ |
56,260 |
|
|
Final purchase price allocation adjustments |
|
— |
|
— |
|
— |
|
— |
|
— |
|
— |
|
(605 |
) |
|||||||
|
Intangible asset impairment charge |
|
— |
|
— |
|
— |
|
— |
|
— |
|
(4,000 |
) |
— |
|
|||||||
|
Amortization |
|
(692 |
) |
— |
|
— |
|
— |
|
— |
|
— |
|
— |
|
|||||||
|
Balance at December 31, 2008 |
|
|
7,904 |
|
— |
|
— |
|
— |
|
— |
|
|
23,000 |
|
|
55,655 |
|
||||
|
Amortization |
|
(692 |
) |
— |
|
— |
|
— |
|
— |
|
— |
|
— |
|
|||||||
|
Balance at December 31, 2009 |
|
$ |
7,212 |
|
$ |
— |
|
$ |
— |
|
$ |
— |
|
$ |
— |
|
$ |
23,000 |
|
$ |
55,655 |
|
|
|
|
|
|
|
|
|
|
|
|
|
|
|
|
|
|
|||||||
|
Sales and Remarketing |
|
|
|
|
|
|
|
|
|
|
|
|
|
|
|
|||||||
|
Balance at January 1, 2008 |
|
$ |
— |
|
$ |
— |
|
$ |
— |
|
$ |
— |
|
$ |
— |
|
$ |
— |
|
$ |
18,746 |
|
|
Final purchase price allocation adjustments |
|
— |
|
— |
|
— |
|
— |
|
— |
|
— |
|
(143 |
) |
|||||||
|
Amortization |
|
— |
|
— |
|
— |
|
— |
|
— |
|
— |
|
— |
|
|||||||
|
Balance at December 31, 2008 |
|
— |
|
— |
|
— |
|
— |
|
— |
|
— |
|
18,603 |
|
|||||||
|
Amortization |
|
— |
|
— |
|
— |
|
— |
|
— |
|
— |
|
— |
|
|||||||
|
Balance at December 31, 2009 |
|
$ |
— |
|
$ |
— |
|
$ |
— |
|
$ |
— |
|
$ |
— |
|
$ |
— |
|
$ |
18,603 |
|
|
|
|
|
|
|
|
|
|
|
|
|
|
|
|
|
|
|||||||
|
Corporate and Unallocated |
|
|
|
|
|
|
|
|
|
|
|
|
|
|
|
|||||||
|
Balance at January 1, 2008 |
|
$ |
— |
|
$ |
— |
|
$ |
6,183 |
|
$ |
1,276 |
|
$ |
119 |
|
$ |
— |
|
$ |
— |
|
|
Final purchase price allocation adjustments |
|
— |
|
— |
|
— |
|
— |
|
— |
|
— |
|
— |
|
|||||||
|
Amortization |
|
— |
|
— |
|
(1,400 |
) |
(900 |
) |
(24 |
) |
— |
|
— |
|
|||||||
|
Balance at December 31, 2008 |
|
— |
|
— |
|
4,783 |
|
376 |
|
95 |
|
— |
|
— |
|
|||||||
|
Amortization |
|
— |
|
— |
|
(1,400 |
) |
(376 |
) |
(24 |
) |
— |
|
— |
|
|||||||
|
Balance at December 31, 2009 |
|
$ |
— |
|
$ |
— |
|
$ |
3,383 |
|
$ |
— |
|
$ |
71 |
|
$ |
— |
|
$ |
— |
|
|
|
|
|
|
|
|
|
|
|
|
|
|
|
|
|
|
|||||||
|
Total |
|
|
|
|
|
|
|
|
|
|
|
|
|
|
|
|||||||
|
Balance at January 1, 2008 |
|
$ |
80,096 |
|
$ |
24,833 |
|
$ |
6,183 |
|
$ |
1,276 |
|
$ |
119 |
|
$ |
170,000 |
|
$ |
282,913 |
|
|
Final purchase price allocation adjustments |
|
— |
|
— |
|
— |
|
— |
|
— |
|
— |
|
(2,702 |
) |
|||||||
|
Intangible asset impairment charge |
|
— |
|
— |
|
— |
|
— |
|
— |
|
(4,000 |
) |
— |
|
|||||||
|
Amortization |
|
(11,335 |
) |
(2,000 |
) |
(1,400 |
) |
(900 |
) |
(24 |
) |
— |
|
— |
|
|||||||
|
Balance at December 31, 2008 |
|
68,761 |
|
22,833 |
|
4,783 |
|
376 |
|
95 |
|
166,000 |
|
280,211 |
|
|||||||
|
Other |
|
— |
|
— |
|
— |
|
90 |
|
— |
|
— |
|
— |
|
|||||||
|
Amortization |
|
(10,478 |
) |
(2,000 |
) |
(1,400 |
) |
(383 |
) |
(24 |
) |
— |
|
— |
|
|||||||
|
Balance at December 31, 2009 |
|
$ |
58,283 |
|
$ |
20,833 |
|
$ |
3,383 |
|
$ |
83 |
|
$ |
71 |
|
$ |
166,000 |
|
$ |
280,211 |
|
Total amortization expense related to intangible assets was approximately $14.3, $15.7, and $9.4 million for the years ended December 31, 2009 and 2008 and the seven months ended December 31, 2007, respectively.
As of December 31, 2009, management performed its testing of impairment of goodwill as well as medical equipment outsourcing and technical and professional services trade names. Fair values were estimated using estimates, judgments, and assumptions (See Note 2) that management believes were appropriate in the circumstances. There is no aggregate goodwill impairment for any of the periods presented in our financial statements. The Company recorded an impairment charge of $4.0 million in the fourth quarter of 2008 related to its technical and professional services segment trade name. The impairment charge reflects modestly lower future revenues from the technical and professional services segment than were expected at the date of the Transaction due
to poorer economic conditions and increased focus on growth in the Company’s traditional medical equipment outsourcing business, asset management partnership programs and manufacturer revenue share programs.
At December 31, 2009, future estimated amortization expense related to intangible assets for each of the years ended December 31, 2010 to 2014 and thereafter is estimated as follows:
|
(in thousands) |
|
|
|
|
|
|
|
|
|
|
|
2010 |
|
$ |
13,059 |
|
|
2011 |
|
12,202 |
|
|
|
2012 |
|
10,523 |
|
|
|
2013 |
|
9,077 |
|
|
|
2014 |
|
8,212 |
|
|
|
Thereafter |
|
29,580 |
|
|
|
|
|
$ |
82,653 |
|
Future amortization expense is an estimate. Actual amounts may change due to additional intangible asset acquisitions, impairment, accelerated amortization or other events.
8. Long-Term Debt
Long-term debt at December 31, consists of the following:
|
(in thousands) |
|
2009 |
|
2008 |
|
||
|
PIK Toggle Notes |
|
$ |
230,000 |
|
$ |
230,000 |
|
|
Floating Rate Notes |
|
230,000 |
|
230,000 |
|
||
|
Senior secured credit facility |
|
38,400 |
|
49,000 |
|
||
|
10.125% Senior Notes |
|
9,945 |
|
9,945 |
|
||
|
Capital lease obligations |
|
10,274 |
|
12,398 |
|
||
|
|
|
518,619 |
|
531,343 |
|
||
|
Less: Current portion of long-term debt |
|
(4,062 |
) |
(3,555 |
) |
||
|
Total long-term debt |
|
$ |
514,557 |
|
$ |
527,788 |
|
PIK Toggle Notes. On May 31, 2007, Merger Sub issued $230.0 million aggregate original principal amount of 8.50% / 9.25% PIK Toggle Notes (the “PIK Toggle Notes”) under the Second Lien Senior Indenture (see “Second Lien Senior Indenture” below). At the closing of the Transaction, as the surviving corporation in the Acquisition, we assumed all the obligations of Merger Sub under the Second Lien Senior Indenture.
For any interest payment period through June 1, 2011, the Company may, at its option, elect to pay cash interest, PIK interest or 50% cash interest and 50% PIK interest. Cash interest on the PIK Toggle Notes accrues at the rate of 8.50% per annum. PIK interest on the PIK Toggle Notes accrues at the rate of 9.25% per annum. After June 1, 2011, the Company is required to make all interest payments on the PIK Toggle Notes entirely as cash interest. All PIK Toggle Notes mature on June 1, 2015. Interest on the PIK Toggle Notes is payable semiannually in arrears on each June 1 and December 1.
As of December 31, 2009, we intend to make future payments in the form of cash interest.
We may redeem some or all of the PIK Toggle Notes at any time prior to June 1, 2011, at a price equal to 100% of the principal amount thereof, plus the applicable premium (as defined by the Second Lien Senior Indenture), plus accrued and unpaid interest, if any, to the date of redemption. In addition, on or before June 1, 2010, we may redeem up to 40% of the aggregate principal amount of the PIK Toggle Notes with the net proceeds of certain equity offerings.
Except as noted above, we cannot redeem the PIK Toggle Notes until June 1, 2011. Thereafter we may redeem some or all of the PIK Toggle Notes at the redemption prices (expressed as percentages of principal amount) set forth below plus accrued and unpaid interest, if any, on the PIK Toggle Notes redeemed, to the applicable redemption date, if redeemed during the 12-month period beginning on June 1 of the years indicated below, subject to the rights of noteholders:
|
Year |
|
Percentage |
|
|
2011 |
|
104.250 |
% |
|
2012 |
|
102.125 |
% |
|
2013 and thereafter |
|
100.000 |
% |
Upon the occurrence of a change of control, each holder of the PIK Toggle Notes has the right to require the Company to repurchase some or all of such holder’s PIK Toggle Notes at a price in cash equal to 101% of the aggregate principal amount thereof plus accrued and unpaid interest, and PIK Interest, if any, to the date of purchase.
Our PIK Toggle Notes are subject to certain debt covenants which are described below under the heading “Second Lien Senior Indenture.”
Floating Rate Notes. On May 31, 2007, Merger Sub issued $230.0 million aggregate original principal amount of Floating Rate Notes (the “Floating Rate Notes”) under the Second Lien Senior Indenture (see “Second Lien Senior Indenture” below). Interest on the Floating Rate Notes is reset for each semi-annual interest period and is calculated at the current LIBOR rate plus 3.375%. At December 31, 2009, our LIBOR-based rate was 3.859%, which includes the credit spread noted above. Interest on the Floating Rate Notes is payable semiannually, in arrears, on each June 1 and December 1. At the closing of the Transaction, as the surviving corporation in the Acquisition, we assumed all the obligations of Merger Sub under the Second Lien Senior Indenture. The Floating Rate Notes mature on June 1, 2015.
We may redeem some or all of the Floating Rate Notes at the redemption prices (expressed as percentages of principal amount) set forth below plus accrued and unpaid interest, if any, on the Floating Rate Notes redeemed, to the applicable redemption date, if redeemed during the 12-month period beginning on June 1 of the years indicated below, subject to the rights of noteholders:
|
Year |
|
Percentage |
|
|
2009 |
|
102.000 |
% |
|
2010 |
|
101.000 |
% |
|
2011 and thereafter |
|
100.000 |
% |
Upon the occurrence of a change of control, each holder of the Floating Rate Notes has the right to require the Company to repurchase some or all of such holder’s Floating Rate Notes at a price in
cash equal to 101% of the aggregate principal amount thereof plus accrued and unpaid interest, if any, to the date of purchase.
Our Floating Rate Notes are subject to certain debt covenants which are described below under the heading “Second Lien Senior Indenture.”
Interest Rate Swap. In June 2007, we entered into an interest rate swap agreement for $230.0 million, which has the effect of converting the interest rate applicable to our $230.0 million of Floating Rate Notes to fixed interest rates. The effective date for the interest rate swap agreement was December 2007 and the expiration date is May 2012.
The interest rate swap agreement qualifies for cash flow hedge accounting under ASC Topic 815, “Derivatives and Hedging.” Both at inception and on an on-going basis, we must perform an effectiveness test. In accordance with ASC Topic 815, the fair value of the interest rate swap agreement at December 31, 2009 is included as a cash flow hedge on our balance sheet. The change in fair value was recorded as a component of accumulated other comprehensive loss on our balance sheet, net of tax, since the instrument was determined to be an effective hedge at December 31, 2009. We have not recorded any amounts due to ineffectiveness for any periods presented. We expect to reclassify approximately $6.2 million into earnings, currently recorded in accumulated other comprehensive loss, in the next 12 months.
As a result of our interest rate swap agreement, we expect the effective interest rate on our $230.0 million Floating Rate Notes to be 9.065% through May 2012.
Second Lien Senior Indenture. Our PIK Toggle Notes and Floating Rate Notes, or the Notes, are guaranteed, jointly and severally, on a second priority senior secured basis, by certain of our future domestic subsidiaries. We do not currently have any subsidiaries. The Notes are our second priority senior secured obligations and rank:
· equal in right of payment with all of our existing and future unsecured and unsubordinated indebtedness, and effectively senior to any such unsecured indebtedness to the extent of the value of collateral;
· senior in right of payment to all of our and our guarantor’s existing and future subordinated indebtedness;
· effectively junior to our senior secured credit facility and other obligations that are secured by first priority liens on the collateral securing the Notes or that are secured by a lien on assets that are not part of the collateral securing the Notes, in each case, to the extent of the value of such collateral or assets; and
· structurally subordinated to any indebtedness and other liabilities (including trade payables) of any of our future subsidiaries that are not guarantors.
The Second Lien Senior Indenture governing the Notes contains covenants that limit our and our guarantors’ ability, subject to certain definitions and exceptions, and certain of our future subsidiaries’ ability to:
· incur additional indebtedness;
· pay cash dividends or distributions on our capital stock or repurchase our capital stock or subordinated debt;
· issue redeemable stock or preferred stock;
· issue stock of subsidiaries;
· make certain investments;
· transfer or sell assets;
· create liens on our assets to secure debt;
· enter into transactions with affiliates; and
· merge or consolidate with another company.
The Second Lien Senior Indenture specifies certain events of default, including among others, failure to pay principal, interest or premium, violation of covenants and agreements, cross-defaults to other material agreements, bankruptcy events, invalidity of guarantees, and a default in the performance by us of the security documents relating to the Second Lien Senior Indenture. Some events of default will be triggered only after certain grace or cure periods have expired, or provide for materiality thresholds. In the event certain bankruptcy-related defaults occur, the Notes will become due and payable immediately. If any other default occurs, the Trustee (and in some cases the noteholders) would be entitled to take various actions, including acceleration of amounts due under the Second Lien Senior Indenture.
Senior Secured Credit Facility. In connection with the Transaction, the Company and Parent entered into a new first lien senior secured asset-based revolving credit facility providing for loans in an amount of up to $135.0 million pursuant to a credit agreement, dated as of May 31, 2007, with a group of financial institutions. We refer to this credit facility as the “senior secured credit facility.” The senior secured credit facility is available for working capital and general corporate purposes, including permitted investments, capital expenditures and debt repayments, on a fully revolving basis, subject to the terms and conditions set forth in the credit documents in the form of revolving loans, swing line loans and letters of credit.
The senior secured credit facility provides financing of up to $135.0 million, subject to a borrowing base calculated on the basis of certain of our eligible accounts receivable, inventory and equipment. As of December 31, 2009, we had $93.0 million of availability under our senior secured credit facility based on a borrowing base of $135.0 million less borrowings of $38.4 million and after giving effect to $3.6 million used for letters of credit.
The senior secured credit facility matures on May 31, 2013. Our obligations under the senior secured credit facility are secured by a first priority security interest in substantially all of our assets, excluding a pledge of our and Parent’s capital stock, any joint ventures and certain other exceptions. Our obligations under the senior secured credit facility are unconditionally guaranteed by our Parent.
The senior secured credit facility provides that we have the right at any time to request up to $50.0 million of additional commitments, but the lenders are under no obligation to provide any such additional commitments, and any increase in commitments will be subject to customary conditions precedent, such as an absence of any default or events of default. If we were to request any such additional commitments and the existing lenders or new lenders were to agree to provide such commitments, the senior secured credit facility size could be increased to up to $185.0 million, but our ability to borrow would still be limited by the amount of the borrowing base.
Borrowings under the senior secured credit facility accrue interest (including a credit spread varying with facility usage):
· at a per annum rate equal to 0.50% above the rate announced from time to time by the agent as the “prime rate” payable quarterly in arrears; and
· at a per annum rate equal to 1.50% above the adjusted LIBOR rate used by the agent, for the respective interest rate period determined at our option, payable in arrears upon cessation of the interest rate period elected.
At December 31, 2009, we had two one-month LIBOR-based rates which were accruing interest at rates of 1.731% and 1.734%, which in each case includes the credit spread noted above. At December 31, 2009, we had a prime borrowing which was accruing interest at 4.000%, including the credit spread noted above.
Overdue principal, interest and other amounts will bear interest at a rate per annum equal to 2% in excess of the applicable interest rate. The applicable margins of the senior secured credit facility will be subject to adjustment based upon leverage ratios. The senior secured credit facility also provides for customary letter of credit fees, closing fees, unused line fees and other fees.
The senior secured credit facility requires our compliance with various affirmative and negative covenants. Pursuant to the affirmative covenants, we and Parent will, among other things, deliver financial and other information to the agent, provide notice of certain events (including events of default), pay our obligations, maintain our properties, maintain the security interest in the collateral for the benefit of the agent and the lenders and maintain insurance.
Among other restrictions, and subject to certain definitions and exceptions, the senior secured credit facility restricts our ability to:
· incur indebtedness;
· create or permit liens;
· declare or pay dividends and certain other restricted payments;
· consolidate, merge or recapitalize;
· acquire or sell assets;
· make certain investments, loans or other advances;
· enter into transactions with affiliates;
· change our line of business; and
· enter into hedging transactions.
The senior secured credit facility also contains a financial covenant that is calculated if our available borrowing capacity is less than $15.0 million for a certain period. Such covenant consists of a minimum ratio of trailing four-quarter Earnings Before Interest, Taxes, Depreciation, and Amortization (“EBITDA”) to cash interest expense, as defined in the credit agreement dated May 31, 2007.
The senior secured credit facility specifies certain events of default, including among others, failure to pay principal, interest or fees, violation of covenants, inaccuracy of representations or warranties, bankruptcy events, certain ERISA-related events, cross-defaults to other material agreements, change of control events, and invalidity of guarantees or security documents. Some events of default will be triggered only after certain cure periods have expired, or will provide for materiality thresholds. If such a default occurs, the lenders under the senior secured credit facility would be entitled to take various actions, including all actions permitted to be taken by a secured creditor and the acceleration of amounts due under the senior secured credit facility.
10.125% Senior Notes. Our Senior Notes (“Senior Notes”) mature on November 1, 2011. Interest on the Senior Notes accrues at the rate of 10.125% per annum and is payable semiannually on each May 1 and November 1.
On May 17, 2007, we entered into a supplemental indenture to the Indenture governing our Senior Notes, dated as of October 17, 2003, between the Company and Wells Fargo Bank, National Association, as trustee.
The amendments to the Indenture that are set forth in the supplemental indenture (the “Amendments”) became operative after we purchased all of the Senior Notes validly tendered and not withdrawn pursuant to our tender offer and consent solicitation. As of May 11, 2007, holders of Senior Notes representing an amount greater than a majority of the principal amount of outstanding Senior Notes had validly tendered their Senior Notes and consented to the execution of the supplemental indenture. The Amendments eliminated from the Indenture:
· requirements to file reports with the SEC;
· requirements to pay taxes;
· limitations on the Company to use defenses against usury;
· the limitation on restricted payments;
· the limitation on payment of dividends and other payment restrictions affecting subsidiaries;
· limitations on incurrence of indebtedness and issuance of preferred stock;
· limitations on asset sales and requirements to repurchase the Senior Notes with excess proceeds thereof;
· limitations on affiliate transactions;
· limitations on liens;
· limitations on the businesses in which the Company and its subsidiaries may engage;
· requirements to preserve corporate existence;
· requirements to purchase the Senior Notes upon a change of control;
· limitation on the issuance of guarantees of indebtedness;
· limitations on the payments for consent from holders of Senior Notes;
· limitations on mergers, consolidation and sale of assets with respect to the Company;
· limitations on mergers or consolidation of, or transfer of assets of, guarantors; and
· certain events of default.
In May 2007, in connection with the Transaction, we tendered for all of our outstanding Senior Notes, pursuant to their terms. On May 31, 2007, $235.0 million of our Senior Notes were purchased. We paid $253.1 million, including a call premium of $16.1 million and accrued interest of $2.0 million to complete the purchase. We used proceeds from the issuance of our Notes to redeem a portion of our Senior Notes.
On June 13, 2007, we purchased an additional $15.1 million of our remaining Senior Notes, pursuant to their terms. We paid $15.9 million of cash including a call premium of $0.7 million and accrued interest of $0.1 million to complete the purchase.
The Company has the right to redeem some or all of the remaining $9.9 million of Senior Notes at the principal amount, plus accrued and unpaid interest, if any, subject to the rights of the noteholders.
Termination of Our Amended Credit Agreement. In connection with the Transaction, we repaid all outstanding balances and terminated our Amended Credit Agreement.
Maturities of Long-Term Debt. At December 31, 2009, maturities of long-term debt for each of our fiscal years ending December 31, 2010 to 2014 and thereafter, are estimated as follows:
|
(in thousands) |
|
|
|
|
|
2010 |
|
$ |
4,062 |
|
|
2011 |
|
12,574 |
|
|
|
2012 |
|
1,555 |
|
|
|
2013 |
|
39,155 |
|
|
|
2014 |
|
722 |
|
|
|
Thereafter |
|
460,551 |
|
|
|
|
|
$ |
518,619 |
|
9. Commitments and Contingencies
Rental expenses were approximately $8.3, $8.5, $4.8 and $3.0, million for the years ended December 31, 2009 and 2008, the seven months ended December 31, 2007 and the five months ended May 31, 2007, respectively. At December 31, 2009, the Company is committed under various noncancellable operating leases for its district, corporate and other operating locations with annual rental commitments for each of the years ending December 31, 2010 to 2014 and thereafter of the following:
|
(in thousands) |
|
|
|
|
|
2010 |
|
$ |
5,706 |
|
|
2011 |
|
4,856 |
|
|
|
2012 |
|
4,469 |
|
|
|
2013 |
|
3,949 |
|
|
|
2014 |
|
3,506 |
|
|
|
Thereafter |
|
5,559 |
|
|
|
|
|
$ |
28,045 |
|
The Company, from time to time, may become involved in litigation arising out of operations in the normal course of business. Asserted claims are subject to many uncertainties and the outcome of individual matters is not predictable with assurance.
On October 19, 2009, Freedom Medical, Inc. filed a lawsuit against the Company and others in U.S. District Court for the Eastern District of Texas. The federal complaint alleges violation of state and federal antitrust laws, tortuous interference with business relationships, business disparagement and common law conspiracy in connection with the biomedical equipment rental market. Freedom Medical, Inc. is seeking unspecified damages and injunctive relief. While we believe these claims are without merit, and will vigorously defend against them, we are unable at this time to determine the ultimate outcome of this matter or determine the effect it may have on our business, financial condition or results of operations.
As of December 31, 2009, we were not a party to any other pending legal proceedings the adverse outcome of which could reasonably be expected to have a material adverse effect on our operating results, financial position or cash flows.
The Company, in the ordinary course of business, could be subject to liability claims related to employees and the equipment that it rents and services. Asserted claims are subject to many uncertainties and the outcome of individual matters is not predictable with assurance. While the ultimate resolution of these actions may have an impact on the Company’s financial results for a particular reporting period, management believes that any such resolution would not have a material adverse effect on the financial position, results of operations or cash flows of the Company.
10. Shareholder’s Equity
Common Stock
On May 31, 2007, in conjunction with the Transaction, the Predecessor retired all 123,480,264.21 of common shares and the Successor authorized and issued 1,000 new shares of common stock with a par value of $0.01 per share.
Accumulated Other Comprehensive Loss
|
|
|
December 31, |
|
December 31, |
|
||
|
|
|
2009 |
|
2008 |
|
||
|
Unrealized loss on minimum pension liability adjustment, net of tax |
|
$ |
(3,824 |
) |
$ |
(4,396 |
) |
|
Unrealized loss on cash flow hedge, net of tax |
|
(12,814 |
) |
(16,355 |
) |
||
|
|
|
|
|
|
|
||
|
Accumulated Other Comprehensive Loss |
|
$ |
(16,638 |
) |
$ |
(20,751 |
) |
11. Stock-Based Compensation
Successor
On May 31, 2007, and in connection with the Transaction, Parent’s board of directors adopted a new stock option plan (“2007 Stock Option Plan.”) The 2007 Stock Option Plan provides for the issuance of 43.9 million nonqualified stock options of Parent to any of its and Parent’s executives, other key employees and to consultants and certain non-employee directors. The options allow for the purchase of shares of common stock of Parent at prices equal to the stock’s fair market value at the date of grant.
Options granted have a ten-year contractual term and vest over approximately six years. For option grants to its employees, half of the options have fixed vesting schedules and the other half of the options vest upon the achievement of established performance targets. For option grants to its directors, all of the options vest on a fixed schedule. Upon a sale of Parent or the Company, all of the unvested options with fixed vesting schedules will vest and become exercisable, and the unvested options that vest upon the achievement of established performance targets will vest and become exercisable upon Irving Place Capital’s achievement of a certain internal rate of return on its investment in Parent, subject to certain conditions. The shares issued to a grantee upon the exercise of such grantee’s options will be subject to certain restrictions on transferability as provided in the 2007 Stock Option Plan. Grantees are subject to non-competition, non-solicitation and confidentiality requirements as set forth in their respective stock option grant agreements. Forfeited options are available for future issue.
A summary of the status of Parent’s 2007 Stock Option Plan as of and for the years ended December 31, 2009 and 2008 and the seven months ended December 31, 2007 is detailed below:
|
(in thousands except exercise price and years) |
|
Number of |
|
Weighted |
|
Aggregate |
|
Weighted |
|
||
|
Approved for issuance at May 31, 2007 |
|
43,905 |
|
|
|
|
|
|
|
||
|
|
|
|
|
|
|
|
|
|
|
||
|
Granted |
|
36,864 |
|
$ |
1.00 |
|
|
|
|
|
|
|
Exercised |
|
— |
|
|
|
|
|
|
|
||
|
Forfeited or expired |
|
(374 |
) |
1.00 |
|
|
|
|
|
||
|
|
|
|
|
|
|
|
|
|
|
||
|
Outstanding at December 31, 2007 |
|
36,490 |
|
1.00 |
|
$ |
— |
|
9.5 |
|
|
|
|
|
|
|
|
|
|
|
|
|
||
|
Granted |
|
955 |
|
1.00 |
|
|
|
|
|
||
|
Exercised |
|
— |
|
|
|
|
|
|
|
||
|
Forfeited or expired |
|
(705 |
) |
1.00 |
|
|
|
|
|
||
|
|
|
|
|
|
|
|
|
|
|
||
|
Outstanding at December 31, 2008 |
|
36,740 |
|
1.00 |
|
$ |
— |
|
8.5 |
|
|
|
|
|
|
|
|
|
|
|
|
|
||
|
Granted |
|
1,569 |
|
1.00 |
|
|
|
|
|
||
|
Exercised |
|
— |
|
|
|
|
|
|
|
||
|
Forfeited or expired |
|
(782 |
) |
1.00 |
|
|
|
|
|
||
|
|
|
|
|
|
|
|
|
|
|
||
|
Outstanding at December 31, 2009 |
|
37,527 |
|
$ |
1.00 |
|
$ |
35,651 |
|
7.5 |
|
|
|
|
|
|
|
|
|
|
|
|
||
|
Exercisable at December 31, 2009 |
|
14,924 |
|
$ |
1.00 |
|
$ |
14,178 |
|
7.6 |
|
|
|
|
|
|
|
|
|
|
|
|
||
|
Expected to Vest at December 31, 2009 |
|
9,718 |
|
$ |
1.00 |
|
$ |
9,232 |
|
7.6 |
|
|
|
|
|
|
|
|
|
|
|
|
||
|
Remaining authorized options not yet issued |
|
6,378 |
|
|
|
|
|
|
|
||
The exercise price of the stock option award is equal to the market value of Parent’s common stock on the grant date as determined reasonably and in good faith by the Parent’s board of directors and compensation committee. The exercise price of options issued during the year ended December 31, 2009 was determined through a variety of factors including peer group multiples, merger and acquisition multiples, and discounted cash flow analyses. The exercise prices of options issued during the year ended December 31, 2008 and seven months ended December 31, 2007 was determined by reference to the then recent per share valuation of Parent resulting from the Transaction as detailed below.
|
Equity Contribution at May 31, 2007 from Irving Place Capital and UHS Management to Parent |
|
$ |
248,794 |
|
|
Parent shares issued and outstanding at May 31, 2007 |
|
248,794 |
|
|
|
Per share Parent valuation at May 31, 2007 |
|
$ |
1.00 |
|
The intrinsic value of a stock award is the amount by which the market value of the underlying stock exceeds the exercise price of the award.
We determine the fair value of options using the Black-Scholes option pricing model. The estimated fair value of options, including the effect of estimated forfeitures, is recognized as expense on a straight-line basis over the options’ vesting periods. The following assumptions were used in determining the fair value of stock options granted during the years ended December 31, 2009 and 2008 and the seven months ended December 31, 2007, under the Black-Scholes model:
|
|
|
|
|
|
|
Seven Months |
|
|
|
|
Year Ended |
|
Year Ended |
|
Ended |
|
|
|
|
December 31, |
|
December 31, |
|
December 31, |
|
|
|
|
2009 |
|
2008 |
|
2007 |
|
|
|
|
|
|
|
|
|
|
|
Risk-free interest rate |
|
2.20% |
|
2.85% |
|
3.71% to 4.97% |
|
|
Expected volatility |
|
37.90% |
|
30.50% |
|
29.50% to 30.50% |
|
|
Dividend Yield |
|
N/A |
|
N/A |
|
N/A |
|
|
Expected option life (years) |
|
6.6 |
|
6.6 |
|
6.5 to 6.8 |
|
|
Black Scholes Value of Options |
|
$0.42 |
|
$0.37 |
|
$0.39 - $0.42 |
|
Expected volatility is based on an independent valuation of the stock of companies within our peer group. Given the lack of a true comparable company, the peer group consists of selected public health care companies representing our suppliers, customers and competitors within certain product lines. The risk free-interest rate is based on the U.S. Treasury yield curve in effect at the grant date based on the expected option life. The expected option life represents the result of the “simplified” method applied to “plain vanilla” options granted during the period, as provided within ASC Topic 718, “Compensation - Stock Compensation.” Parent used the simplified method as Parent does not have sufficient historical exercise experience to provide a basis upon which to estimate the expected term.
Although Parent grants the stock options, the Company recognizes compensation expense related to these options since the services are performed for its benefit. For the years ended December 31, 2009 and 2008 and the seven months ended December 31, 2007, we recognized non-cash stock compensation expense of $1.3, $2.5, and $2.5 million, respectively, which is primarily included in selling, general and administrative expenses. At December 31, 2009, unearned non-cash stock-based compensation related to our fixed vesting options, that we expect to recognize as expense over the next 3.0 years, totals approximately $4.0 million, net of our estimated forfeiture rate of 2.0%. Unearned non-cash stock-based compensation related to the performance vesting options totaling approximately $4.8 million, net of our estimated forfeiture rate of 2.0%, would be recognized over the next 5.7 years only if the performance targets are met. The expense could be accelerated upon the sale of Parent or the Company.
Predecessor
We adopted guidance now codified as ASC Topic 718, “Compensation — Stock Compensation,” using the modified prospective application method. Under this method we have applied the provisions of this statement to new and modified awards, as well as to the non-vested portion of awards granted before the required effective date and outstanding at such time.
The Predecessor established the 2003 Stock Option Plan which allowed for the granting of stock option awards to the Company’s employees and consultants or independent contractors. All outstanding non-vested options as of May 31, 2007 were vested in connection with the Transaction. All vested options were cancelled subsequent to payment of Transaction consideration. We recorded non-cash charges for stock-based compensation expense of approximately $8.0 million during the first five months of 2007 in relation to our 2003 Stock Option Plan, $6.7 million of which resulted from the accelerated vesting described above.
Stock option activity, including the corresponding weighted average exercise price, as of and for the five months ended May 31, 2007 is as follows (shares in thousands, per share amounts in dollars):
|
Option Activity |
|
2007 |
|
|
Options outstanding at beginning of year |
|
16,309 |
|
|
Options granted |
|
— |
|
|
Options exercised |
|
(17 |
) |
|
Options forfeited or expired |
|
(170 |
) |
|
Options cancelled |
|
(16,122 |
) |
|
|
|
|
|
|
Options outstanding at end of period |
|
— |
|
|
|
|
|
|
|
Options exercisable at end of period |
|
— |
|
|
|
|
|
|
|
Options remaining to be issued |
|
— |
|
|
Weighted-Average Exercise Price Per Share |
|
2007 |
|
|
|
Options granted |
|
NA |
|
|
|
Options exercised |
|
$ |
1.17 |
|
|
Options forfeited or expired |
|
$ |
1.43 |
|
|
Options cancelled |
|
$ |
1.13 |
|
|
At end of period |
|
|
|
|
|
Outstanding |
|
NA |
|
|
|
Exercisable |
|
NA |
|
|
We determined the fair value of options using the Black-Scholes option pricing model. The estimated fair value of options, including the effect of estimated forfeitures, was recognized as expense on a straight-line basis over the options’ vesting periods.
The total intrinsic value of options exercised during the five months ended May 31, 2007 was negligible.
For each of the periods presented, options were granted with option strike prices based on the estimated fair market values of the Company’s common stock on the date of the grant, as determined by the Company’s board of directors. Our board of directors considered multiple valuation metrics and methods and determined that the most appropriate method for the Company, given its unique attributes, was an Enterprise Value to EBITDA approach. In order to determine this fair market value, during 2004, we applied the Enterprise Value to EBITDA multiple per our sale of equity to new common shareholders as part of our late 2003 recapitalization. Beginning in 2005, we began using an average market multiple approach using the average Enterprise Value to forecasted EBITDA multiple from a comparable group of publicly traded health care companies. Given the lack of a truly comparable peer company, our comparable group was determined by using public market players in a generally capital-intensive setting, with attributes of our customer base, suppliers and competitors. We then applied a discount to such multiple in arriving at the fair market value of our common shares, in order to account for the lack of liquidity in our shares as well as minority ownership. This discount rate was determined through an analysis of the restrictions on the transferability of our stock, our impression of the generally accepted range for such discount factors for privately held companies based upon broad capital market discussions, our
progress toward a capital event of some type and the inherent risk that such a capital event would not be consummated. After considering these factors, the Company determined appropriate aggregate discounts of 25% during 2004, 2005 and through the first quarter of 2006. Thereafter, the aggregate discount was reduced to 7.5% in order to account for the increased likelihood of a capital event.
12. Related Party Transactions
Successor
Management Agreement
On May 31, 2007, in connection with the Transaction, we and Irving Place Capital entered into a professional services agreement pursuant to which general advisory and management services are provided to us with respect to financial and operating matters. Irving Place Capital is an owner of Parent, and the following members of our board of directors are associated with Irving Place Capital: John Howard, Robert Juneja and Bret Bowerman. In addition, David Crane, a director, provides consulting services to Irving Place Capital. The professional services agreement requires us to pay an annual fee for ongoing advisory and management services equal to the greater of $0.5 million or 0.75% of our Adjusted EBITDA (as defined in the professional services agreement) for the immediately preceding fiscal year, payable in quarterly installments, provided that the annual advisory fee for the fiscal year ended December 31, 2007 shall be $0.5 million, as adjusted for the partial year. The professional services agreement also required us to pay a transaction fee in the amount of $10.0 million for services rendered in connection with the Transaction, $3.5 million of which was included in deferred financing costs on the balance sheet and the remaining portion was expensed. The $10.0 million fee was paid at the consummation of the Transaction on May 31, 2007. The professional services agreement provides that Irving Place Capital will be reimbursed for its reasonable out-of-pocket expenses in connection with certain activities undertaken pursuant to the professional services agreement and will be indemnified for liabilities incurred in connection with its role under the professional services agreement, other than for liabilities resulting from its gross negligence or willful misconduct. The term of the professional services agreement commenced on May 31, 2007 and will remain in effect unless and until either party notifies the other of its desire to terminate, we are sold to a third-party purchaser or we consummate a qualified initial public offering, as defined in the professional services agreement. The total professional services agreement fees paid to Irving Place Capital were $0.8, $0.7, and $0.3 million for the years ended December 31, 2009 and 2008 and the seven months ended December 31, 2007 respectively.
2007 Stock Option Plan
Parent established the 2007 Stock Option Plan. Compensation expense related to service provided by the Company’s employees is recognized in the accompanying Statements of Operations with an offsetting Payable to Parent liability, which is not expected to be settled within the next twelve months.
Business Relationship
In the ordinary course of business, we entered into an operating lease for our Minneapolis, Minnesota district office with Ryan Companies US, Inc. (“Ryan”), which began on May 1, 2007. On November 29, 2007, we added a new member to our board of directors who is also a director of Ryan. During the years ended December 31, 2009 and 2008, we made rent payments to a Ryan affiliate totaling $328,000 and $334,000. Between November 29, 2007 and December 31, 2007 we made rent payments to a Ryan affiliate totaling $49,000.
On April 1, 2008, we added three new directors to our Board of Directors. One of our new directors also is a director of Broadlane, Inc. (“Broadlane”), a health care group purchasing
organization that serves many of our customers. During the year ended December 31, 2009 and the nine months ended December 31, 2008, we paid Broadlane approximately $519,000 and $427,000 in administrative fees, respectively. On December 31, 2009, accounts payable includes approximately $52,000 in amounts due to Broadlane.
The Company believes that the aforementioned arrangements and relationships were provided in the ordinary course of business at prices and on terms similar to those that would result from arm’s length negotiation between unrelated parties.
Predecessor
Management Agreement
Prior to May 31, 2007, the Company was a party to management agreements with J. W. Childs Associates, L.P. (an affiliate of Childs) (“Childs Associates”) and Halifax Capital Partners, L.P. (“Halifax”) (together “Predecessor Equity Sponsors”) pursuant to which the Company paid the Predecessor Equity Sponsors an annual management fee totaling $480,000 in consideration of their ongoing consulting and management advisory services. The agreements were terminated upon the consummation of the Transaction.
13. Employee Benefit Plans
In September 2006, the FASB issued guidance now codified as ASC Topic 718, “Compensation — Retirement Benefits.” ASC Topic 718 requires employers to recognize the under funded or over funded status of a defined benefit post retirement plan as an asset or liability in its statements of financial position and to recognize changes in the funded status in the year in which the changes occur through accumulated other comprehensive income. Additionally, ASC Topic 718 requires employers to measure the funded status of a plan as of the date of its year-end statement of financial position. At the time of adoption of ASC Topic 718, the full funded status of our defined benefit post retirement plan had been recognized in prior years’ purchase accounting due to the Transaction. The adoption had no impact to the measurement date used in our year-end statement of financial position as related to our noncontributory defined benefit pension plan.
Pension plan benefits are to be paid to eligible employees after retirement based primarily on years of credited service and participants’ compensation. The Company uses a December 31 measurement date. Effective December 31, 2002, the Company froze the benefits under the pension plan. The change in benefit obligation, pension plan assets and funded status as of and for the years ended December 31, 2009 and 2008.
Change in Benefit Obligation
|
(in thousands) |
|
2009 |
|
2008 |
|
||
|
Benefit obligations at beginning of the Year |
|
$ |
17,772 |
|
$ |
16,402 |
|
|
Interest cost |
|
1,065 |
|
1,033 |
|
||
|
Actuarial loss |
|
527 |
|
1,039 |
|
||
|
Benefits paid |
|
(756 |
) |
(702 |
) |
||
|
Benefit obligation at end of the year |
|
$ |
18,608 |
|
$ |
17,772 |
|
Change in Plan Assets
|
(in thousands) |
|
2009 |
|
2008 |
|
||
|
Fair value of plan assets at beginning of year |
|
$ |
9,925 |
|
$ |
14,817 |
|
|
Actuarial gain on plan assets |
|
2,673 |
|
(5,020 |
) |
||
|
Benefits paid |
|
(756 |
) |
(702 |
) |
||
|
Employer contribution |
|
360 |
|
830 |
|
||
|
Fair value of plan assets at end of year |
|
$ |
12,202 |
|
$ |
9,925 |
|
Funded Status
|
(in thousands) |
|
2009 |
|
2008 |
|
||
|
Funded Status |
|
$ |
(6,406 |
) |
$ |
(7,847 |
) |
|
Unrecognized net actuarial loss/ Accumulated Other Comprehensive Loss |
|
6,365 |
|
7,310 |
|
||
|
Net (accrued) amount recognized |
|
$ |
(41 |
) |
$ |
(537 |
) |
A summary of our pension plan projected benefit obligation, accumulated obligation and fair value of pension plan assets at December 31, are as follows:
|
(in thousands) |
|
2009 |
|
2008 |
|
||
|
Projected benefit obligation |
|
$ |
18,608 |
|
$ |
17,772 |
|
|
Accumulated benefit obligation (“ABO”) |
|
18,608 |
|
17,772 |
|
||
|
Fair value of plan assets |
|
12,202 |
|
9,925 |
|
||
|
ABO less Fair value of plan assets |
|
6,406 |
|
7,847 |
|
||
Net Periodic Benefit Cost (Benefit)
The components of net periodic benefit cost (benefit) are as follows:
|
|
|
|
|
|
|
Seven Months |
|
|
Five Months |
|
||||
|
|
|
Year Ended |
|
Year Ended |
|
Ended |
|
|
Ended |
|
||||
|
|
|
December 31, |
|
December 31, |
|
December 31, |
|
|
May 31, |
|
||||
|
|
|
2009 |
|
2008 |
|
2007 |
|
|
2007 |
|
||||
|
(in thousands) |
|
(Successor) |
|
(Successor) |
|
(Successor) |
|
|
(Predecessor) |
|
||||
|
Interest cost |
|
$ |
1,065 |
|
$ |
1,033 |
|
$ |
594 |
|
|
$ |
421 |
|
|
Expected return on plan assets |
|
(1,213 |
) |
(1,231 |
) |
(688 |
) |
|
(452 |
) |
||||
|
Recognized net actuarial loss |
|
12 |
|
— |
|
— |
|
|
73 |
|
||||
|
Net periodic benefit cost (benefit) |
|
$ |
(136 |
) |
$ |
(198 |
) |
$ |
(94 |
) |
|
$ |
42 |
|
Pension Plan Assets
Our target pension plan asset allocation and actual pension plan allocation of assets at December 31, are as follows:
|
|
|
Target |
|
|
|
|
|
|
Asset Category |
|
Allocation |
|
2009 |
|
2008 |
|
|
Equity securities |
|
70 |
% |
71 |
% |
61 |
% |
|
Debt securities and cash |
|
30 |
|
29 |
|
39 |
|
|
|
|
100 |
% |
100 |
% |
100 |
% |
The pension plan assets are invested with the objective of maximizing long-term returns while minimizing material losses in order to meet future benefit obligations when they come due.
The Company utilizes an investment approach with a mix of equity and debt securities used to maximize the long-term return on assets. Risk tolerance is established through consideration of pension plan liabilities, funded status and corporate financial condition. The investment portfolio consists of a diversified blend of mutual funds and fixed-income investments. Investment risk is measured and monitored on an ongoing basis through quarterly investment portfolio reviews and annual asset and liability reviews.
Fair Value Measurement
The following table presents our plan assets using the fair value hierarchy as of December 31, 2009.
|
(in thousands) |
|
Level 1 |
|
Level 2 |
|
Level 3 |
|
Total |
|
||||
|
|
|
|
|
|
|
|
|
|
|
||||
|
Equity Securities |
|
$ |
8,643 |
|
$ |
— |
|
$ |
— |
|
$ |
8,643 |
|
|
Debt Securities and Cash |
|
3,559 |
|
— |
|
— |
|
3,559 |
|
||||
|
|
|
$ |
12,202 |
|
$ |
— |
|
$ |
— |
|
$ |
12,202 |
|
Investments in Equity and Debt Securities are valued at the net asset value of units held at the end of the period based upon the value of the underlying investments as determined by quoted market prices. These investments are classified as Level 1.
Contributions
The Company contributed $0.4, $0.8, $0.6, and $0.5 million to the pension plan during the years ended December 31, 2009 and 2008, the seven months ended December 31, 2007 and five months ended May 31, 2007, respectively. The Company expects to make contributions of approximately $0.7 million in 2010.
Estimated Future Benefit Payments
The following benefit payments are expected to be paid:
Estimated Future Benefit Payments
|
(in thousands) |
|
|
|
|
|
2010 |
|
$ |
755 |
|
|
2011 |
|
749 |
|
|
|
2012 |
|
784 |
|
|
|
2013 |
|
804 |
|
|
|
2014 |
|
855 |
|
|
|
2015 to 2019 |
|
5,049 |
|
|
Pension Plan Assumptions
The following weighted-average assumptions were used as of each of the years ended December 31, as follows:
|
|
|
2009 |
|
2008 |
|
2007 |
|
|
Weighted-average actuarial assumptions used to determine benefit obligations: |
|
|
|
|
|
|
|
|
Discount rate |
|
5.92 |
% |
6.10 |
% |
6.47 |
% |
|
Expected return on assets |
|
8.00 |
% |
8.00 |
% |
8.00 |
% |
|
|
|
|
|
|
|
|
|
|
Weighted-average assumptions used to determine net periodic benefit cost (benefit): |
|
|
|
|
|
|
|
|
Discount rate |
|
6.10 |
% |
6.47 |
% |
6.15 |
% |
|
Expected return on assets |
|
8.00 |
% |
8.00 |
% |
8.00 |
% |
|
Rate of compensation increase |
|
N/A |
|
N/A |
|
N/A |
|
These assumptions are reviewed on an annual basis. In determining the expected return on asset assumption, the Company evaluates the long-term returns earned by the pension plan, the mix of investments that comprise pension plan assets and forecasts of future long-term investment returns.
Other Employee Benefits
The Company also sponsors a defined contribution plan, which qualifies under Section 401(k) of the Internal Revenue Code of 1986, as amended (the “Code”) and covers substantially all of the Company’s employees. Employees may contribute annually up to 60% of their base compensation on a pre-tax basis (subject to Internal Revenue Service limitation). The company matching contribution is 50% of the first 6% of base compensation that an employee contributes. We made matching contributions to the plan of approximately $1.3, $1.3, $0.5 and $0.6 million for the years ended December 31, 2009 and 2008, the seven months ended December 31, 2007 and the five months ended May 31, 2007, respectively.
The Company is self-insured for employee health care up to $130,000 per member per plan year and aggregate claims up to 125% of expected claims per plan year. Also, the Company purchases workers’ compensation and automobile liability coverage with related deductibles. The Company is liable for workers’ compensation and automobile liability claims up to $250,000 and $100,000 per individual claim, respectively. Self-insurance and deductible costs are included in other accrued expenses in the Balance Sheets and are accrued based upon the aggregate of the liability for reported claims and an actuarially determined estimated liability for claims development and incurred but not reported.
14. Income Taxes
The provision (benefit) for income taxes consists of the following:
|
|
|
|
|
|
|
Seven Months |
|
|
Five Months |
|
||||
|
|
|
Year Ended |
|
Year Ended |
|
Ended |
|
|
Ended |
|
||||
|
|
|
December 31, |
|
December 31, |
|
December 31, |
|
|
May 31, |
|
||||
|
|
|
2009 |
|
2008 |
|
2007 |
|
|
2007 |
|
||||
|
|
|
(Successor) |
|
(Successor) |
|
(Successor) |
|
|
(Predecessor) |
|
||||
|
Current - State |
|
$ |
221 |
|
$ |
142 |
|
$ |
165 |
|
|
$ |
100 |
|
|
Current - Federal |
|
|
57 |
|
|
— |
|
|
— |
|
|
|
— |
|
|
Deferred |
|
(11,767 |
) |
(15,501 |
) |
(10,353 |
) |
|
392 |
|
||||
|
|
|
$ |
(11,489 |
) |
$ |
(15,359 |
) |
$ |
(10,188 |
) |
|
$ |
492 |
|
Reconciliations between the Company’s effective income tax rate and the U.S. statutory rate follow:
|
|
|
|
|
|
|
Seven Months |
|
|
Five Months |
|
|
|
|
Year Ended |
|
Year Ended |
|
Ended |
|
|
Ended |
|
|
|
|
December 31, |
|
December 31, |
|
December 31, |
|
|
May 31, |
|
|
|
|
2009 |
|
2008 |
|
2007 |
|
|
2007 |
|
|
|
|
(Successor) |
|
(Successor) |
|
(Successor) |
|
|
(Predecessor) |
|
|
Statutory U.S. Federal income tax rate |
|
(35.0 |
)% |
(35.0 |
)% |
(35.0 |
)% |
|
(34.0 |
)% |
|
State income taxes, net of U.S. Federal income tax |
|
(4.8 |
) |
(4.8 |
) |
(4.8 |
) |
|
(5.5 |
) |
|
Valuation allowance |
|
0.0 |
|
0.0 |
|
0.0 |
|
|
37.7 |
|
|
Permanent items |
|
0.7 |
|
0.5 |
|
0.4 |
|
|
2.6 |
|
|
Minimum state taxes |
|
0.0 |
|
0.0 |
|
0.6 |
|
|
0.2 |
|
|
Other |
|
0.9 |
|
(0.2 |
) |
0.0 |
|
|
0.0 |
|
|
Effective income tax rate |
|
(38.2 |
)% |
(39.5 |
)% |
(38.8 |
)% |
|
1.0 |
% |
The components of the Company’s overall deferred tax assets and liabilities at December 31, 2009 and 2008, are as follows:
|
|
|
December 31, |
|
December 31, |
|
||
|
(in thousands) |
|
2009 |
|
2008 |
|
||
|
Deferred tax assets |
|
|
|
|
|
||
|
Accounts receivable |
|
$ |
975 |
|
$ |
975 |
|
|
Accrued compensation and pension |
|
5,194 |
|
4,050 |
|
||
|
Inventories |
|
327 |
|
400 |
|
||
|
Other assets |
|
3,867 |
|
3,078 |
|
||
|
Unrealized loss on cash flow hedge |
|
8,472 |
|
10,813 |
|
||
|
Unrealized loss on pension |
|
2,533 |
|
2,906 |
|
||
|
Net operating loss carryforwards |
|
53,094 |
|
53,035 |
|
||
|
Deferred tax assets |
|
74,462 |
|
75,257 |
|
||
|
|
|
|
|
|
|
||
|
Deferred tax liabilities |
|
|
|
|
|
||
|
Accelerated depreciation and amortization |
|
(129,561 |
) |
(138,513 |
) |
||
|
Prepaid assets |
|
(189 |
) |
(897 |
) |
||
|
Total deferred tax liabiliites |
|
(129,750 |
) |
(139,410 |
) |
||
|
|
|
|
|
|
|
|
|
|
Net deferred tax liability |
|
$ |
(55,288 |
) |
$ |
(64,153 |
) |
At December 31, 2009, the Company had available unused federal net operating loss carryforwards of approximately $134.1 million. The net operating loss carryforwards will expire at various dates from 2019 through 2029.
The Company moved from a net deferred tax asset position prior to the Transaction, where tax expense related primarily to minimum state taxes due to valuation allowances established for net
operating losses not recognized, to a net deferred tax liability position after the Transaction. Management believes the valuation allowance is no longer necessary as we determined that it was more likely than not that the benefits of these deferred tax assets will be realized.
We evaluate the recoverability of our deferred tax assets by scheduling the expected reversals of non-tax deferred tax assets and liabilities in order to determine whether net operating loss carry forwards are recoverable prior to expiration in accordance with ASC 740-10-30-18. If future earnings or other assumptions are required in order for such future tax benefits to be realized, we will evaluate whether a valuation allowance is required.
Under the Code, certain corporate stock transactions into which the Company has entered or may enter in the future could limit the amount of net operating loss carryforwards which may be utilized on an annual basis to offset taxable income in future periods.
ASC Topic 740 clarifies the accounting for uncertainty in income taxes recognized in an enterprise’s financial statements and prescribes a recognition threshold and measurement process for financial statement recognition and measurement of a tax position taken or expected to be taken in a tax return. ASC Topic 740 also provides guidance on derecognition, classification, interest and penalties, accounting in interim periods, disclosure and transition.
Based on our evaluation, we have concluded that no significant unrecognized tax benefits existed prior to May 31, 2007. Our evaluation was performed for the tax years ended December 31, 2006, 2007, 2008, and 2009, the tax years that remain subject to examination by major tax jurisdictions as of December 31, 2009. We do not believe there will be any material changes in our unrecognized tax positions over the next twelve months.
A reconciliation of the beginning and ending amount of unrecognized tax benefit for the years ended December 31, 2009, 2008 and 2007:
|
(in thousands) |
|
|
|
|
|
|
|
|
|
|
|
Unrecognized tax benefits balance at January 1, 2007 |
|
$ |
— |
|
|
Gross increases for tax positions in 2007 |
|
2,100 |
|
|
|
Unrecognized tax benefits balance at December 31, 2007 |
|
2,100 |
|
|
|
Gross increases for tax positions in 2008 |
|
— |
|
|
|
Unrecognized tax benefits balance at December 31, 2008 |
|
2,100 |
|
|
|
Gross increases for tax positions in current period |
|
— |
|
|
|
Unrecognized tax benefits balance at December 31, 2009 |
|
$ |
2,100 |
|
All of the unrecognized tax benefits at December 31, 2009 would affect the remaining balance attributable to the Transaction in accordance with ASC Topic 740.
15. Securityholders Agreement
In connection with the Transactions, Irving Place Capital and certain members of our management that acquired securities of Parent in connection with the merger entered into a securityholders agreement that governs certain relationships among, and contain certain rights and obligations of, such stockholders. The securityholders agreement, among other things:
· limits the ability of the stockholders to transfer their securities in Parent, except in certain permitted transfers as defined therein;
· provides for certain co-sale rights; and
· provides for certain rights of first refusal with respect to transfers by stockholders other than to certain permitted transferees.
16. Business Segments
The Company operates in three reportable segments:
· Medical equipment outsourcing is the segment which the Company provides medical equipment outsourcing services to its customers, including more than 4,200 acute care hospitals and 4,250 alternate site providers in the United States, including some of the nation’s premier health care institutions.
· Technical and professional services offers a broad range of inspection, preventative maintenance, repair, logistic and consulting services through the Company’s team of over 325 technicians and professionals located in its nationwide network of offices.
· Medical equipment sales and remarketing is the segment through which the Company buys, sources, remarkets and disposes of pre-owned medical equipment for its customers through the Company’s Asset Recovery Program; provides sales and distribution of specialty medical equipment; and offers its customers disposable items that are used on a single use basis.
The Company identifies its segments based on its organizational structure and its internal reporting.
|
|
|
|
|
|
|
Seven Months |
|
|
Five Months |
|
||||
|
|
|
Year Ended |
|
Year Ended |
|
Ended |
|
|
Ended |
|
||||
|
|
|
December 31, |
|
December 31, |
|
December 31, |
|
|
May 31, |
|
||||
|
|
|
2009 |
|
2008 |
|
2007 |
|
|
2007 |
|
||||
|
(in thousands) |
|
(Successor) |
|
(Successor) |
|
(Successor) |
|
|
(Predecessor) |
|
||||
|
Medical Equipment Outsourcing |
|
|
|
|
|
|
|
|
|
|
||||
|
Net Sales |
|
$ |
232,623 |
|
$ |
223,676 |
|
$ |
119,808 |
|
|
$ |
84,855 |
|
|
Gross margin |
|
84,803 |
|
79,895 |
|
42,246 |
|
|
38,649 |
|
||||
|
Assets |
|
420,940 |
|
432,643 |
|
447,240 |
|
|
|
|
||||
|
Amortization and Depreciation |
|
11,793 |
|
12,643 |
|
7,667 |
|
|
450 |
|
||||
|
Technical and Professional Services |
|
|
|
|
|
|
|
|
|
|
||||
|
Net Sales |
|
42,395 |
|
45,225 |
|
26,437 |
|
|
14,800 |
|
||||
|
Gross margin |
|
11,856 |
|
12,549 |
|
6,582 |
|
|
4,676 |
|
||||
|
Assets |
|
85,867 |
|
86,559 |
|
91,856 |
|
|
|
|
||||
|
Amortization and Depreciation |
|
692 |
|
692 |
|
404 |
|
|
745 |
|
||||
|
Intangible asset impairment charge |
|
— |
|
4,000 |
|
— |
|
|
— |
|
||||
|
Medical Equipment Sales and Remarketing |
|
|
|
|
|
|
|
|
|
|
||||
|
Net Sales |
|
22,186 |
|
20,218 |
|
10,209 |
|
|
7,867 |
|
||||
|
Gross margin |
|
4,009 |
|
4,745 |
|
1,204 |
|
|
1,501 |
|
||||
|
Assets |
|
18,603 |
|
18,603 |
|
18,746 |
|
|
|
|
||||
|
Amortization and Depreciation |
|
— |
|
— |
|
— |
|
|
3 |
|
||||
|
Corporate and Unallocated |
|
|
|
|
|
|
|
|
|
|
||||
|
Assets |
|
309,993 |
|
339,920 |
|
320,910 |
|
|
|
|
||||
|
Amortization and Depreciation |
|
74,562 |
|
72,488 |
|
40,742 |
|
|
21,625 |
|
||||
|
Capital Expenditures |
|
53,527 |
|
73,903 |
|
37,642 |
|
|
35,760 |
|
||||
|
Total Company Assets, Amortization and Depreciation and Capital Expenditures |
|
|
|
|
|
|
|
|
|
|
||||
|
Assets |
|
835,403 |
|
877,725 |
|
878,752 |
|
|
|
|
||||
|
Amortization and Depreciation |
|
87,047 |
|
85,823 |
|
48,813 |
|
|
22,823 |
|
||||
|
Capital Expenditures |
|
53,527 |
|
73,903 |
|
37,642 |
|
|
35,760 |
|
||||
|
Impairment charge |
|
— |
|
4,000 |
|
— |
|
|
— |
|
||||
|
Total Gross Margin and Reconciliation to Loss Before Income Taxes |
|
|
|
|
|
|
|
|
|
|
||||
|
Total gross margin |
|
$ |
100,668 |
|
$ |
97,189 |
|
$ |
50,032 |
|
|
$ |
44,826 |
|
|
Selling, general and administrative |
|
84,225 |
|
85,166 |
|
48,647 |
|
|
28,692 |
|
||||
|
Transaction and Related Costs |
|
— |
|
— |
|
306 |
|
|
26,891 |
|
||||
|
Intangible asset impairment charge |
|
— |
|
4,000 |
|
— |
|
|
— |
|
||||
|
Interest expense |
|
46,505 |
|
46,878 |
|
26,322 |
|
|
13,829 |
|
||||
|
Loss on extinguishment of debt |
|
— |
|
— |
|
1,041 |
|
|
22,396 |
|
||||
|
Loss before income tax |
|
$ |
(30,062 |
) |
$ |
(38,855 |
) |
$ |
(26,284 |
) |
|
$ |
(46,982 |
) |
Gross margin represents net revenues less total direct costs.
Segment assets for the three business segments (excluding Corporate and Unallocated) primarily include goodwill and intangible assets, which is consistent with the Company’s reporting to its Chief Operating Decision Maker, other assets are not allocated to the three business segments. Thus, assets included in Corporate and Unallocated contain all other Company assets.