Attached files
| file | filename |
|---|---|
| EX-32.2 - EX-32.2 - General Finance CORP | d550471dex322.htm |
| EX-32.1 - EX-32.1 - General Finance CORP | d550471dex321.htm |
| EX-31.2 - EX-31.2 - General Finance CORP | d550471dex312.htm |
| EX-31.1 - EX-31.1 - General Finance CORP | d550471dex311.htm |
| EX-23.1 - EX-23.1 - General Finance CORP | d550471dex231.htm |
| EX-21.1 - EX-21.1 - General Finance CORP | d550471dex211.htm |
Table of Contents
UNITED STATES
SECURITIES AND EXCHANGE COMMISSION
Washington, D.C. 20549
FORM 10-K
| ☑ | ANNUAL REPORT PURSUANT TO SECTION 13 OR 15(d) OF THE SECURITIES EXCHANGE ACT OF 1934 |
For the Fiscal Year Ended June 30, 2018
OR
| ☐ | TRANSITION REPORT PURSUANT TO SECTION 13 OR 15(d) OF THE SECURITIES EXCHANGE ACT OF 1934 |
Commission file number 001-32845

(Exact name of registrant as specified in its charter)
| Delaware (State or other Jurisdiction of Incorporation or Organization) |
32-0163571 (I.R.S. Employer Identification No.) | |
| 39 East Union Street Pasadena, California 91103 (Address of Principal Executive Offices) |
(626) 584-9722 (Registrant’s telephone number, including area code) | |
Securities registered pursuant to Section 12(b) of the Act:
| Title of Each Class |
Name of Each Exchange On Which Registered | |
| Common Stock, $0.0001 par value | NASDAQ Global Market | |
| 9.00% Series C Cumulative Redeemable Perpetual Preferred Stock (Liquidation Preference $100 per share) |
NASDAQ Global Market | |
| 8.125% Senior Notes due 2021 | NASDAQ Global Market |
Securities registered pursuant to Section 12(g) of the Act:
None
Indicate by check mark if the registrant is a well-known seasoned issuer, as defined in Rule 405 the Securities Act. Yes ☐ No ☑
Indicate by check mark if the registrant is not required to file reports pursuant to Section 13 or Section 15(d) of the Act. Yes ☐ No ☑
Indicate by check mark whether the registrant: (1) has filed all reports required to be filed by Section 13 or 15(d) of the Securities Exchange Act of 1934 during the preceding 12 months (or for such shorter period that the registrant was required to file such reports) and (2) has been subject to such filing requirements for the last 90 days. Yes ☑ No ☐
Indicate by check mark whether the registrant has submitted electronically and posted on its corporate Web site, if any, every Interactive Data File required to be submitted and posted pursuant to Rule 405 of Regulation S-T (§232.405 of this chapter) during the preceding 12 months (or for such shorter period that the registrant was required to submit and post such files).
| Yes ☒ | No ☐ |
Indicate by check mark if disclosure of delinquent filers pursuant to Item 405 of Regulation S-K is not contained herein, and will not be contained, to the best of registrant’s knowledge, in definitive proxy or information statements incorporated by reference in Part III of this Form 10-K or any amendment to this Form 10-K. ☑
Indicate by check mark whether the registrant is a large accelerated filer, an accelerated filer, a non-accelerated filer, a smaller reporting company, or an emerging growth company. See definition of “large accelerated filer,” “accelerated filer,” non-accelerated filer,” “smaller reporting company” and “emerging growth company” in Rule 12b-2 of the Exchange Act.
| Large accelerated filer ☐ |
Accelerated filer ☑ | Non-accelerated filer ☐ (Do not check if a smaller reporting company) |
Smaller reporting company ☐ | |||
| Emerging growth company ☐ | ||||||
If an emerging growth company, indicate by check mark if the registrant has elected not to use the extended transition period for complying with any new or revised financial accounting standards provided pursuant to Section 13(a) of the Exchange Act. ☐
Indicate by check mark whether the registrant is a shell company (as defined in Rule 12b-2 of the Exchange Act). Yes ☐ No ☑
The aggregate market value of Common Stock held by non-affiliates of the Registrant on December 31, 2017 was approximately $82,941,000 based on a closing price of $6.80 for the Common Stock on such date. For purposes of this computation, all executive officers and directors have been deemed to be affiliates. Such determination should not be deemed to be an admission that such executive officers and directors are, in fact, affiliates of the Registrant.
There were 27,098,871 shares of the Registrant’s Common Stock outstanding as of August 31, 2018.
DOCUMENTS INCORPORATED BY REFERENCE
Portions of the Registrant’s Proxy Statement for its 2018 Annual Meeting of Stockholders are incorporated by reference into Part III of this Annual Report on Form 10-K. In addition, certain exhibits are incorporated into Part IV, Item 15. of this Annual Report on Form 10-K by reference to other reports and registration statements of the Registrant, which have been filed with the Securities and Exchange Commission.
Table of Contents
GENERAL FINANCE CORPORATION
2018 ANNUAL REPORT ON FORM 10-K
| Page | ||
| SAFE HARBOR STATEMENT | ii | |
| PART I | ||
| I-1 | ||
| I-21 | ||
| I-38 | ||
| I-39 | ||
| I-41 | ||
| I-41 | ||
| PART II | ||
| II-1 | ||
| II-4 | ||
| Item 7. Management’s Discussion and Analysis of Financial Condition and Results of Operations |
II-6 | |
| Item 7A. Quantitative and Qualitative Disclosures About Market Risk |
II-20 | |
| II-21 | ||
| Item 9. Changes in and Disagreements with Accountants on Accounting and Financial Disclosure |
II-21 | |
| II-21 | ||
| II-22 | ||
| PART III | ||
| Item 10. Directors, Executive Officers and Corporate Governance |
III-1 | |
| III-1 | ||
| III-1 | ||
| Item 13. Certain Relationships and Related Transactions, and Director Independence |
III-1 | |
| III-1 | ||
| PART IV | ||
| IV-1 | ||
| IV-4 | ||
| SIGNATURES | SIG | |
i
Table of Contents
This Annual Report on Form 10-K, including the documents incorporated by reference into this Annual Report on Form 10-K, contains forward-looking statements within the meaning of Section 27A of the Securities Act of 1933, as amended, referred to in this Annual Report on Form 10-K as the Securities Act, and Section 21E of the Securities Exchange Act of 1934, as amended, referred to in this Annual Report on Form 10-K as the Exchange Act. Forward-looking statements involve risks and uncertainties that could cause results or outcomes to differ materially from those expressed in the forward-looking statements. Forward-looking statements may include, without limitation, statements relating to our plans, strategies, objectives, expectations and intentions and are intended to be made pursuant to the safe harbor provisions of the Private Securities Litigation Reform Act of 1995. Some of the forward-looking statements can be identified by the use of forward-looking terms such as “believes,” “expects,” “may,” “will,” “should,” “could,” “seek,” “intends,” “plans,” “estimates,” “anticipates” or other comparable terms. A number of important factors could cause actual results to differ materially from those in the forward-looking statements. The risks and uncertainties discussed in “Risk Factors” should be considered in evaluating our forward-looking statements. You should not place undue reliance on our forward-looking statements. Further, any forward-looking statement speaks only as of the date on which it is made, and we undertake no obligation to update or revise any forward-looking statements.
ii
Table of Contents
References to “we,” “us,” “our” or the “Company” refer to General Finance Corporation, a Delaware corporation (“GFN”), and its consolidated subsidiaries. These subsidiaries include GFN U.S. Australasia Holdings, Inc., a Delaware corporation (“GFN U.S.”); GFN Insurance Corporation, an Arizona corporation (“GFNI”); GFN North America Leasing Corporation, a Delaware corporation (“GFNNA Leasing”); GFN North America Corp., a Delaware corporation (“GFNNA”); GFN Realty Company, LLC, a Delaware limited liability company (“GFNRC”); GFN Manufacturing Corporation, a Delaware corporation (“GFNMC”), and its subsidiary, Southern Frac, LLC, a Texas limited liability company (collectively “Southern Frac”); Pac-Van, Inc., an Indiana corporation, and its Canadian subsidiary, PV Acquisition Corp., an Alberta corporation (collectively “Pac-Van”); and Lone Star Tank Rental Inc., a Delaware corporation (“Lone Star”); GFN Asia Pacific Holdings Pty Ltd, an Australian corporation (“GFNAPH”), and its subsidiaries, GFN Asia Pacific Finance Pty Ltd, an Australian corporation (“GFNAPF”), Royal Wolf Holdings Limited, an Australian corporation (“RWH”), and its Australian and New Zealand subsidiaries (collectively, “Royal Wolf”).
Overview
Founded in 2005, we are a leading specialty rental services company offering portable storage, modular space and liquid containment solutions, with a diverse and expanding lease fleet of 85,812 units as of June 30, 2018. Our primary 95 branch locations across North America and the Asia-Pacific offer a wide range of portable storage units, including our core 20-feet and 40-feet steel containers, office container, mobile office and modular space products and steel tanks that provide our customers a flexible, cost-effective and convenient way to meet their temporary storage and space needs. Our units are easily customized to satisfy our customers’ specific application needs and include numerous value-added components. We provide our storage solutions to a diverse base of over 47,000 customers across a broad range of industries, including the commercial, construction, transportation, industrial, energy, manufacturing, mining, retail, consumer, education and government sectors. Our customers utilize our storage and space units for a wide variety of applications, including the temporary storage of materials, supplies, equipment, retail merchandise inventories, documents and liquid storage and for office use.
We focus on leasing rather than selling our units. Approximately 64% of our total non-manufacturing revenues for the year ended June 30, 2018 (“FY 2018”) were derived from leasing activities. We believe our business model is compelling because it is driven by lease fleet assets that:
| • | generate a recurring revenue stream with average lease durations of over 12 months; |
| • | possess long useful lives of 20 to 30 years with high residual values; |
| • | return the original equipment cost through revenue within four years on average; |
| • | operate at high lease fleet utilization levels, historically between 70% and 85%; |
| • | require low maintenance expenditures; and |
| • | earn attractive margins. |
Our lease fleet is comprised of three distinct specialty rental equipment categories that possess attractive asset characteristics and serve our customers’ on-site temporary needs and applications. These categories match the sectors we serve and which we collectively refer to as the “portable services industry” – portable (or mobile) storage, modular space and liquid containment.
Our portable storage category is segmented into two products: (1) storage containers, which primarily consist of new and used steel shipping containers under International Organization for Standardization (“ISO”) standards, that provide a flexible, low cost alternative to warehousing, while offering greater security, convenience and immediate accessibility; and (2) freight containers, which are designed for either transport of products by road and rail and are only offered in our Asia-Pacific territory.
Our modular space category is segmented into three products: (1) office containers, which are referred to as portable container buildings in the Asia-Pacific, are either modified or specifically manufactured containers that provide self-contained office space with maximum design flexibility. Office containers in the United States are oftentimes referred to as ground level offices (“GLOs”); (2) modular buildings, which provide customers with flexible space solutions and are often modified to customer specifications and (3) mobile offices, which are re-locatable units with aluminum or wood exteriors and wood (or steel) frames on a steel carriage fitted with axles, and which allow for an assortment of “add-ons” to provide convenient temporary space solutions.
Our liquid containment category includes portable liquid storage tanks that are manufactured 500-barrel capacity steel containers with fixed axles for transport. These units can be utilized for a variety of applications across a wide range of industries, including refinery, petrochemical and industrial plant maintenance, oil and gas services, environmental remediation and field services,
I-1
Table of Contents
infrastructure building construction, marine services, pipeline construction and maintenance, tank terminal services, waste management, wastewater treatment and landfill services.
Summary Organization Chart (1) (2)
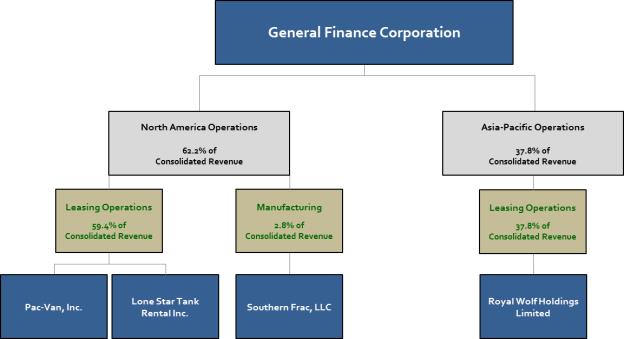
| (1) | Summary organization chart is illustrative and does not reflect our legal operating structure. |
| (2) | Reflects consolidated revenues for FY 2018. |
Industry Overview
We compete in three distinct, but related, sectors of the specialty rental services industry: portable storage, modular space and liquid containment, which we refer to collectively as the “portable services industry.”
Portable Storage
The storage industry includes two principal markets, fixed self-storage and portable storage. The fixed self-storage market consists of permanent structures located away from customer locations used primarily by consumers to temporarily store excess household goods. We do not participate in the fixed self-storage market with permanent structures. The portable storage market, in which we primarily operate, differs from the fixed self-storage market in that it brings the storage solution to the customer’s location and addresses the need for secure, temporary storage with immediate access to the storage unit. The advantages of portable storage include convenience, immediate accessibility, improved security and lower costs. In contrast to fixed self-storage, the portable storage market is primarily used by businesses and offers a flexible, secure, cost-effective and convenient alternative to constructing permanent warehouse space or storing items at an offsite facility. A broad range of industries, including the construction, industrial, commercial, retail and government sectors, utilize portable storage equipment to meet both their short-term and permanent storage needs.
The portable storage industry is fragmented in each of our geographic markets, with numerous participants in local markets leasing and selling portable storage units. While we are not aware of any published third-party analysis of either the Asia-Pacific or North American portable storage markets, we believe the portable storage sector has experienced steady growth since the 1990s and is achieving increased market share compared to other storage alternatives because of an increasing awareness of the benefits that portable storage units offer, including the availability, convenience, security and cost benefits of portable storage, as well as an increasing number of new applications for portable storage units.
Modular Space
Modular space solutions, including modular buildings, mobile offices and portable container buildings, are used primarily by businesses to address either temporary or permanent space needs. We believe modular space delivers four core benefits compared to permanent buildings or structures: reusability, timely solutions, lower costs and flexibility.
I-2
Table of Contents
Modular buildings may offer customers significant cost savings over permanent construction and can generally be installed more quickly because site work and fabrication can take place concurrently. In addition, modular solutions are not site specific and can be configured in a number of ways to meet multiple needs. Finally, modular buildings are reusable and will generally serve a wide variety of uses during their life span. A variety of industries utilize modular space solutions, including construction, resources, government, education, retail and special events, among others.
The Modular Building Institute, in its 2017 Relocatable Buildings Annual Data Report, estimated that the North American modular space (or relocatable) sector generated approximately $4.0 billion in annual revenue. The sector has experienced growth over the last thirty plus years as the number of applications for modular space has expanded and recognition of the product’s positive attributes has grown. By outsourcing their space needs, customers are able to achieve flexibility, preserve capital for core operations, and convert fixed costs into variable costs. The IBIS World Industry Report published in November 2017 estimated that the portable container buildings market in Australia generated revenue of AUS$2.0 billion ($1.5 billion), of which approximately AUS$1.3 billion ($1.0 billion) related to the markets in which we offer a competing product. We believe that we are well positioned to benefit from any growth in the North American and Asia-Pacific modular space markets.
We expect that the modular space market will grow over the long-term, driven in part by increasing awareness of the advantages of modular space. Additionally, we believe that the advantages of modular space over permanent buildings and structures of reusability, timely solutions, lower costs, and flexibility are highly valued in many of the end markets we serve. We further believe the increased penetration of modular space solutions in additional end markets will also continue to drive market growth.
Liquid Containment
Portable liquid storage tank containers are used in environmental and industrial applications to temporarily store hazardous and nonhazardous liquids and semi-solids. The tanks are used by customers across a wide variety of end markets, including chemical, refinery and industrial plant maintenance, environmental remediation, infrastructure building construction, marine services, oil and gas exploration and field services, pipeline construction and maintenance, tank terminal services, wastewater treatment and waste management and landfill services. Liquid containment end market demand is recurring and is driven by the non-discretionary nature of required customer maintenance cycles, an increasing enforcement of existing environmental regulations, a growing outsourcing of liquid containment solutions and an increasing level of vendor consolidation. We believe that the rental industry in the U.S. for liquid containment equipment is fragmented and generated approximately $1.4 billion of annual rental revenues in 2013 – 2014. As a result of the decline in oil and gas prices during the latter part of our year ended June 30, 2015, the size of the liquid containment sector has contracted. However, oil and gas drilling and production activity increased in FY 2018, particularly in the Permian Basin of Texas. We believe that we can leverage our branch network, existing relationships and operating philosophies to successfully compete in this sector. Our research indicated that many of the companies that used containment solutions also used portable storage and mobile office products.
Competitive Strengths
Leading Provider with Strong Presence in Served Markets
We believe we are a leading provider of portable storage, modular space and liquid containment solutions in all of the territories we serve. In North America, Pac-Van is a recognized national provider of portable storage, modular buildings and mobile offices on a national, regional and local basis. Lone Star is a market leader in portable liquid storage tank rental and related services in the Permian Basin in West Texas and the Eagle Ford Shale in South Texas. In the Asia-Pacific area, we believe Royal Wolf is the leading provider in Australia and New Zealand of portable storage containers, portable container buildings and freight containers. Royal Wolf is represented in all major metropolitan areas, and we believe it maintains the largest branch network and container fleet, with an estimated 40% market share, of any storage container company in Australia and New Zealand.
Superior Service Focus
Our operating infrastructure in each of our markets is designed to ensure that we consistently meet or exceed customer expectations. Our scalable management information systems and administrative support services enhance our customer service capabilities by enabling our operating management teams to access real time information on product availability, customer reservations, customer usage history and rates on a national, regional and local level. We believe these capabilities enable us to provide superior customer service, allowing us to attract new and retain existing customers. With the goal of delivering “best in class” customer service, we began collecting customer responses on net promoter scores (“NPS”) in North America at Pac-Van, which track customer willingness to recommend our products and services, and for FY 2018 our customers gave us a NPS of 85, which we believe is the leading score in our sector. In the Asia Pacific at Royal Wolf our customers there gave us a NPS of 61 in FY 2018. In addition, over 80% of our consolidated total leasing revenues in FY 2018 were derived from repeat customers, which we believe is a result of our superior customer service.
I-3
Table of Contents
Extensive Reach and Capabilities
Through our expansive primary branch network of 95 locations, we maintain national service capabilities in our markets. In North America, our branches serve 49 of the top 100 U.S. Metropolitan Statistical Areas, or MSAs. With our expansion into Alberta and British Columbia, we are now also able to serve the western provinces in Canada. Our Lone Star branches are strategically positioned to be able to respond quickly and maximize service opportunities with customers in the Permian Basin and Eagle Ford Shale. We also have branch offices located in every state in Australia and on both the North and South Islands of New Zealand. We are the only portable storage container company in these Asia-Pacific markets with a national infrastructure and workforce.
Geographic, Product and End Market Diversification
Our specialty rental units are used in a wide variety of applications, and we have established strong relationships with a diversified customer base in both our North American and Asia-Pacific venues. Our customers range from large companies with a national presence to small local businesses. On a consolidated basis, during FY 2017 we served over 47,000 customers in over 20 industries. In FY 2018, our largest customer in each venue accounted for less than 10% of the respective venue’s revenues and our 20 largest customers in each venue accounted for less than 25% of the respective venue’s revenues. We believe that the breadth of our products and services limits the impact of changes within any given customer or industry.
High Quality Fleet with Attractive Asset Characteristics
Our branch offices maintain our lease fleet to consistent quality standards. Maintenance costs are expensed as incurred and branch managers and operations staff are responsible for managing a maintenance program aimed at providing equipment to customers that meets or exceeds customer expectations and industry standards. All of our lease fleet carries signage reflecting its respective brands, which is important to ongoing name recognition in our markets. Our lease fleet possesses attractive asset characteristics, including long economic useful lives with high residual values, predictable and recurring revenue streams, low maintenance expense, rapid payback periods, high incremental leasing margins and favorable tax attributes. We believe these characteristics allow us to generate high returns on invested capital relative to other rental services sectors and a level of discretion in investing this capital.
Experienced Management Team
We believe our management team’s experience and long tenure with our company and within the industry give us a strong competitive advantage. Our current senior executive management team in FY 2018, led by our Executive Chairman of the Board, Ronald F. Valenta, who has been with us since our inception, has successfully entered new markets, expanded our customer base and integrated a number of meaningful acquisitions. He stepped down as Chief Executive Officer and assumed the title of Executive Chairman of the Board in January 2018. Jody Miller, who became President in January 2017, became our Chief Executive Officer in January 2018 and has been Chief Executive Officer of GFNNA Leasing since June 2015. He has spent over 25 years in the equipment rental industry.
Neil Littlewood, who became Chief Executive Officer of Royal Wolf in July 2016, has over 14 years of senior experience in the rental/hire industry and Pac-Van’s Chief Executive Officer and President, Theodore M. Mourouzis, joined Pac-Van in 1997 and has been integral to our successful growth in North America.
Lone Star’s management team has extensive experience in the oil and gas industry and emphasizes safety training and monitoring for all employees.
Our senior management, as well as corporate, regional and branch managers across all of our operating companies, has been integral in developing and maintaining our high level of customer service, deploying technology to improve operational efficiencies and successfully integrating acquisitions.
Business Strategy
Our business strategy consists of the following:
Focus on High Margin Core Leasing Business
We focus on growing our core leasing business because it provides recurring revenues from specialty rental assets that (1) have long useful lives of over 20 years; (2) generate rapid payback of unit investment through revenue in less than four years on average;
I-4
Table of Contents
and (3) have high residual values of up to 70% of original equipment cost. We have successfully increased leasing revenues as a percentage of our consolidated non-manufacturing revenues from 29% in fiscal year 2007 to 64% for FY 2018. We believe that we can continue to generate substantial demand for our leasing products as the industry is still relatively underdeveloped in our markets. With new uses for our products continually emerging, we believe many more applications for our specialty rental solutions are still yet to be developed.
Generate Organic Growth
We define organic growth as an increase in lease revenues on a year-over-year basis at our branches in operation for at least one year, excluding leasing revenue attributed to same-market acquisitions. We continue to focus on increasing the number of our lease fleet units. We believe that our high quality lease fleet and superior customer service enable us to increase our lease rates and utilization rates over time. We generate organic growth within our existing markets through sales and marketing programs designed to increase brand recognition, expand market awareness of the uses of our specialty rental units and differentiate our products from our competitors.
Leverage Our Infrastructure
Our branch network infrastructure covers a broad geographic area and is capable of serving significant additional customer volume while incurring a minimal amount of incremental fixed costs. With our established branch network and infrastructure we generate significant adjusted earnings before interest, income taxes, impairment, depreciation and amortization and other non-operating costs and income (“Adjusted EBITDA”) margins on incremental units deployed. Our objective is to add volume by organically growing the lease fleet across our locations and through strategic acquisitions. Asset purchases of “tuck-in” competitors and adding new units to our fleet allow us to more effectively leverage our infrastructure. Between June 30, 2007 and June 30, 2018, our lease fleet grew from approximately 16,000 units to over 85,000 units, representing a 16% compound annual growth rate, and our Adjusted EBITDA margin expanded from 17% in the fiscal year ended June 30, 2008 to 25% in FY 2018.
Opportunistically Enter New Geographic Markets
We believe a long-term opportunity exists for us to significantly expand the size of our branch network in North America by opening up to 30 new locations in attractive markets. Additionally, we expect to open select satellite branch locations in our Asia-Pacific territory to expand our service reach to attractive but more remote areas of Australia and New Zealand.
Pursue Select Strategic Acquisitions
Acquisitions represent an attractive means for us to further leverage our infrastructure, add complementary product lines, enter new geographic regions and accelerate our growth and margin expansion opportunities. We operate in fragmented industries, and we seek to identify acquisition candidates that we believe would be earnings accretive. We have a proven integration model that we have effectively used to integrate 48 acquisitions since May 31, 2007.
Continue New Product Innovation
We have a history of developing innovative new product concepts to better service our customers’ needs. Our in-house capabilities and third party modification capabilities allow us to customize units to meet customer specifications. We have introduced many new product innovations, including temporary prison holding cells, hoarding units, blast-resistant units, workforce living accommodations, temporary retail frontage units and observatory units customized from storage containers. In the Asia-Pacific area we offer over 100 container-based designs for the portable services industry. We believe these innovative new product offerings differentiate us in the market.
Products and Services
Portable Storage
Our portable storage products primarily consist of steel storage containers and freight containers. Storage containers are steel structures, which are generally eight feet wide and eight and one-half feet high; and are built to ISO standards for carrying ocean cargo. They typically vary in size from 10 feet to 48 feet in length, with 20-foot and 40-foot length containers being the most common. Storage containers consist of new and used shipping containers that provide a flexible, low cost alternative to warehousing, while offering greater security, convenience and immediate accessibility. Storage containers include general purpose dry storage, refrigerated and specialty containers in a range of standard and modified sizes, designs and capacities. Specialty containers include solar lit blast-resistant, hoarding and hazardous waste units. In FY2018 we introduced our patent-pending safety containers, marketed as PV3 Safety Containers in the United States, CK3 Safety Containers in Canada and the Wolf Lock Premium Container in the Asia/Pacific region.
I-5
Table of Contents
Our freight containers are specifically designed for transport of products by road and rail, and include curtain-side, refrigerated and bulk cargo containers, together with a range of standard and industry-specific dry freight containers. Freight container products are only offered in our Asia-Pacific territory. These products are designed for long useful lives. A portion of our fleet consists of used storage containers of eight to thirteen years in age, a time at which their useful life as ocean-going shipping containers is over according to the standards promulgated by the ISO. Because we do not have the same stacking and strength requirements that apply in the ocean-going shipping industry, we have no need for these containers to meet ISO standards. We purchase these containers in large quantities, refurbish them by removing any rust and paint them with a rust inhibiting paint, further customize them, and add our decals and branding.
Modular Space
Our modular space products include office container products, modular buildings and mobile offices. Our office container products (portable building containers and ground level office containers, or GLOs) are either modified or specifically-manufactured containers that provide secure and convenient office space with maximum design flexibility. Floor plans can either be all office space, with features similar to those found in mobile offices, or a combination of office and storage space. Due to their construction, office containers provide greater security than traditional field offices, and since they sit at ground level they do not require stairs for entry and exit. Modular buildings are factory-built, highly customizable portable structures constructed for diverse applications, ranging from schools to restaurants to medical offices and ranging in size from 1,000 to over 30,000 square feet. Mobile offices are factory built, single-unit structures that are re-locatable and used primarily for temporary office space. Mobile offices are generally built on frames that are connected to axles and wheels and have either a fixed or removable hitch for easy transportation. Mobile offices can be equipped with HVAC systems, lighting, electrical wiring, phone jacks, desk tops, shelving and other features normally associated with basic office space. Mobile offices generally have wood siding, carpeting, high ceilings, custom windows and glass storefront doors, which provide a professional, customer-friendly building in which to conduct business. In addition to offering modular buildings for rent, in the Asia-Pacific area, we also provide customers with the ability to customize buildings using our in-house engineering team.
Liquid Containment
Our liquid containment products, primarily portable liquid storage tanks, are manufactured steel containers with fixed steel axles and rear wheels for transport designed to hold liquids and semi-solids. Our product line currently focuses on 500-barrel capacity steel tanks, but also includes acid, gas buster, oil test tanks and various specially-built tanks. Products typically include features such as guardrails, safety stairways, multiple entry ways, a sloped bottom for easy cleaning, an epoxy lining and various feed and drain lines. A number of value-added services are offered with liquid containment products, including transportation, on-site setup and the servicing of equipment 24 hours a day, 7 days a week.
I-6
Table of Contents
The tables below provide details of our lease fleet by product category and unit types at June 30, 2018, 2017 and 2016; and for FY 2018, the year ended June 30, 2017 (“FY 2017”) and the year ended June 30, 2016 (“FY 2016”).
| FY 2018 | ||||||||||||||||
| Product Category |
Unit Type | Description | Industry Applications | Number of Units as of June 30, 2018 |
Average Monthly Lease Rate |
Average Utilization | ||||||||||
| North America |
Asia- Pacific |
North America |
Asia- Pacific | |||||||||||||

|
Storage Containers |
Dry storage, refrigerated and specialty containers | Classroom equipment storage, Construction equipment and tool storage, Disaster shelters, Landscaping sheds, Recreational equipment storage, Retail inventory storage | 56,524 | $122 | A$138 | 77% | 88% | ||||||||
| Freight Containers |
Dry freight, curtain-side, refrigerated, bulk cargo containers | Freight transportation | 7,501 | NA | A$135 | NA | 75% | |||||||||

|
Office Containers |
Storage containers, modified to include office space | General administrative office space, Military installations, Workforce living accommodations, Bank branches, Classrooms /Education, Construction offices, Daycare facilities, Dormitories, General administrative office space, Healthcare facilities, Rental facilities, Retail space, Shelters | 12,014 | $340 | A$286 | 83% | 70% | ||||||||
| Modular Buildings |
Portable structures used for a variety of applications |
1,179 | $767 | NA | 84% | NA | ||||||||||
| Mobile Offices |
Relocatable wood-framed temporary office space | 4,447 | $292 | NA | 82% | NA | ||||||||||

|
Portable Liquid Storage Tanks |
Steel tanks, acid tanks, gas buster tanks and oil test tanks |
Well-site liquid containment needs, Expansion / upgrade projects, Highway construction/Groundwater sewage, Infrastructure projects, Major industrial projects, Mining pit pump work, Municipal sewer and water projects, Non-residential construction projects, Pipeline construction and maintenance, Refinery turnarounds | 4,147 | $783 | NA | 78% | NA | ||||||||
I-7
Table of Contents
| FY 2017 | ||||||||||||||||
| Product Category |
Unit Type | Description | Industry Applications | Number of Units as of June 30, 2017 |
Average Monthly Lease Rate |
Average Utilization | ||||||||||
| North America |
Asia- Pacific |
North America |
Asia- Pacific | |||||||||||||
|
|
Storage
|
51,528 | $121 | A$139 | 75% | 86% | ||||||||||
|
Freight
|
8,272 | NA | A$135 | NA | 70% | |||||||||||
|
|
Office
|
11,157 | $321 | A$268 | 78% | 74% | ||||||||||
|
Modular
|
SEE PRECEDING CHART |
1,167 | $774 | NA | 81% | NA | ||||||||||
|
Mobile
|
4,491 | $282 | NA | 78% | NA | |||||||||||
|
|
Portable
|
4,097 | $533 | NA | 48% | NA | ||||||||||
I-8
Table of Contents
| FY 2016 | ||||||||||||||||
| Product Category |
Unit Type | Description | Industry Applications | Number of Units as of June 30, 2016 |
Average Monthly Lease Rate |
Average Utilization | ||||||||||
| North America |
Asia- Pacific |
North America |
Asia- Pacific | |||||||||||||
|
|
Storage
|
50,276 | $121 | A$139 | 74% | 85% | ||||||||||
|
Freight
|
8,868 | NA | A$132 | NA | 70% | |||||||||||
|
|
Office
|
9,673 | $317 | A$308 | 80% | 70% | ||||||||||
|
Modular
|
SEE PRECEDING CHART | 1,142 | $772 | NA | 81% | NA | ||||||||||
|
Mobile
|
4,590 | $278 | NA | 76% | NA | |||||||||||
|
|
Portable
|
4,056 | $699 | NA | 43% | NA | ||||||||||
Ancillary Products and Services
We deliver and, where necessary, install our products directly on customers’ premises. These services are either provided by our in-house personnel and transportation equipment or outsourced to third parties. We also provide ancillary products such as steps, ramps, furniture, portable toilets, security systems, shelving, mud pumps, hoses, splitter valves, tee connectors and other items to our customers for their use in connection with leased equipment. In addition, with our liquid containment products, a variety of spill prevention and secondary containment products are rented to our customers to ensure compliance with the Environmental Protection Agency’s Spill Prevention, Control and Countermeasure (SPCC) rule/regulations. Spill containment systems, or berms, are designed to protect against leaks or spills by covering the land under a steel tank with an impermeable plastic that has barrier walls. In the case of a spill, the liquid is captured within the containment system, thereby limiting danger to the environment.
In response to the reduced demand of its portable liquid storage tanks, our North American manufacturing operations began manufacturing a variety of other steel-based products, including:
| • | Chassis |
| • | Storm Shelters |
| • | Blast-Resistant Modules |
| • | Specialty Tanks |
| • | Trash Hoppers |
Designed for transporting containers safely on the road, the chassis are made with high quality components, are
I-9
Table of Contents
fully customizable and all chassis sales are backed with both a five year limited warranty on axles as well as a five year warranty on workmanship.
Storm shelters are designed for above ground installation, thereby protecting homeowners from a natural disaster. The shelters come in two different wall designs (corrugated or smooth) and in two different standard sizes. Custom sizes are also available to accommodate specific needs. All storm shelters are Texas Tech Wind Institute Certified and compliant with ICC 500 2014 and FEMA 361.
Blast resistant modules, designed to protect individuals and materials from external explosions, come in three standard sizes of 8 by 20 feet, 8 by 40 feet and 12 by 40 feet. All modules have an 8 PSI blast rating and can be fabricated with a ballistic rating upon request.
Specialty tanks consist primarily of portable fuel tanks and tanks used in the agriculture industry to store chemicals. In particular, portable fuel tanks allow the end user to work more efficiently and can reduce costs by accessing fleet fuel on the job site. Specialty tanks are manufactured similar to liquid containment tanks for the oil and gas industry using a structural steel understructure.
Ideal for any industry needing to process, dispose or relocate materials, trash hoppers work well in multi-story building construction applications, as they can be attached to a telehandler and elevated to accept discarded materials or trash. These trash hoppers are constructed of 3/16” corrugated plate steel, making them stronger and more durable than our competitors.
Sales
We complement our core leasing business by selling existing lease fleet assets or assets purchased specifically for resale. The sale of lease fleet units has historically been a cost effective method of replenishing and upgrading the lease fleet. We also provide additional services when selling units. These services range from delivery to full scale turnkey solutions. In a turnkey solution, we provide not only the underlying equipment but also a full range of project related services, which may include foundation, specialty interior finishes, subleasing generators and landscaping, as may be necessary to make the equipment fully operational for the customer.
Product Lives and Durability
Our portable storage, modular space and liquid containment units have long estimated useful lives of 20-30 years. The age of our rental equipment, which can be a key price factor in some rental businesses, has only a modest impact on rental rates. This high value retention is due to the fact that our lease fleet units have virtually no technology obsolescence risk, do not possess engines, have few moving parts, have low maintenance requirements and are used in non-destructive applications, all differentiating characteristics from many other classes of rental equipment.
Ongoing maintenance to our fleet is performed on an as-needed basis and is intended to maintain the value and rental-ready condition of our units. Maintenance requirements on portable storage units can include removing rust and dents, patching small holes, repairing floors, painting and replacing seals around the doors. Maintenance requirements for modular space units can include repairs of floors, doors, air conditioning units, windows, roofs and electric wiring. Maintenance requirements for liquid containment units include cleaning the unit to eliminate any residual material and inspecting and repairing the lining, if needed. Maintenance is performed by in-house fleet technicians and third-party vendors, depending on the branch and complexity of the work. Maintenance and repair costs of our lease fleet are included as direct costs of leasing operations and expensed as incurred whether performed by in house technicians or by third party vendors. We believe our maintenance program ensures a high quality fleet that supports both leasing and sales operations.
Our lease fleet units are recorded at cost and depreciated on the straight-line basis, in accordance with accounting principles generally accepted in the United States, up to 20 years after the date they are put in service, down to their estimated residual values. Because we have a history of selling units for gains, we believe our lease fleet’s estimated residual value is at or below net realizable value.
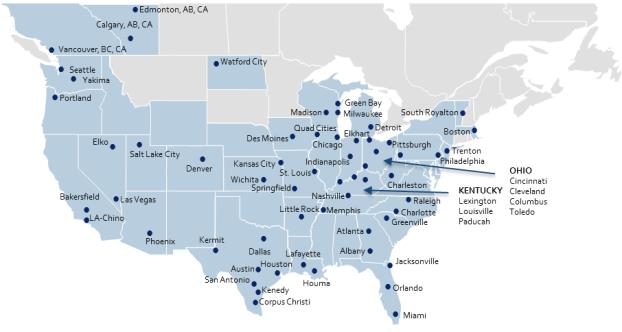
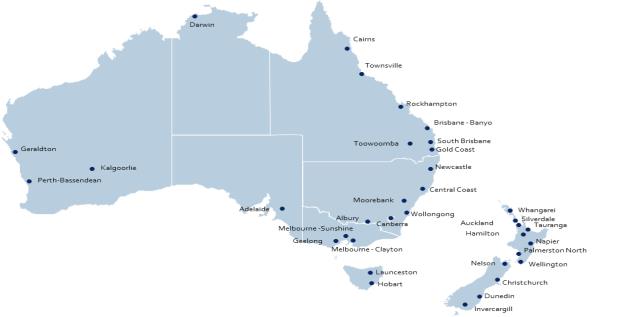
Geographic Network
Our service locations are segmented into two operating areas: North America and Asia-Pacific. In North America, these service locations are called branches and in our Asia-Pacific area they are referred to as Customer Service Centers, or “CSCs.” Our primary North American branch network consists of 57 branch locations in the United States and three in Canada, and our primary Asia-Pacific network consists of 23 CSCs in Australia and 12 in New Zealand.
I-10
Table of Contents
Our network enables us to maintain product availability and provide customer service within regional and local markets. Customers benefit because they are provided with improved service availability, reduced time to occupancy, better access to sales representatives, the ability to inspect units prior to rental and lower freight costs. We, in turn, benefit because we are able to spread regional overhead and marketing costs over a large lease base, redeploy units within our network to optimize utilization, discourage potential competitors by providing ample local supply and service local customers in a more cost efficient manner. Through our network, we develop local market knowledge and strong customer relationships while our corporate-based marketing group manages our brand image, web presence and lead generation programs.
The following maps show our existing branch and CSC locations as of June 30, 2018.
North America
Asia-Pacific
I-11
Table of Contents
North America
In North America, branch offices are generally headed by a branch manager and are organized into four regions, which are managed by four regional vice presidents each with more than 15 years of experience in the industry. In addition to a branch manager, each branch may also have its own sales force and a transportation department that will deliver and pick up lease fleet units from customers in certain remote areas. Branch managers are integral to our success and performance-based incentive bonuses are a portion of their compensation.
Our two Lone Star branch locations allow us to be near our customers’ production and drilling sites. In addition to benefitting from greater product availability and timely service, these branch locations enable many of our customers to realize lower transportation costs, which is a significant value proposition as they aim to control costs. These locations are managed by a general manager working closely with the organization’s Department of Transportation (“DOT”) compliance and safety officer. Each location also has a superintendent that oversees the operations and yard foremen, who are responsible for the drivers and mechanics.
Asia-Pacific
We believe that our Asia-Pacific CSC network is the largest of any storage container company in Australia and New Zealand, and management estimates that we have approximately 40% market share in the region. We are represented in all major metropolitan areas and are the only container leasing and sales company with a nationally integrated infrastructure and workforce. A typical CSC consists of a leased site of approximately two to five acres with a sales office, forklifts and all-weather container repair workshop. CSC office staffing ranges from two to 15 people and include a branch manager supported by the appropriate level of sales, operations and administrative personnel. Yard and workshop staffing usually ranges between one and 12 people and can consist of welders, spray painters, boilermakers, forklift drivers and production supervisors. CSC inventory usually ranges between 150 and 700 storage containers at any one time, depending on market size and throughput demand. Each CSC has a branch manager who has overall supervisory responsibility for all activities of the CSC. Branch managers report to one of our State Managers for Australia and Sales Managers (North and South Islands) for New Zealand who in turn report to an Executive General Manager who reports to the CEO. Performance-based incentive bonuses are a portion of the compensation for the CSC, State, Island and branch managers. Each branch has its own sales force, forklifts to load, transport and unload units and a storage yard staff responsible for unloading and stacking units. Steel units can be stored by stacking them three-high to maximize usable ground area. Our larger branches also have a fleet maintenance department to make modifications to the containers and maintain the branch’s forklifts and other equipment. Our smaller branches perform preventative maintenance tasks and outsource major repairs.
We lease all of our branch locations and Royal Wolf’s corporate and administrative offices in Gordon, New South Wales. All of our major leased properties have remaining lease terms of up to 22 years and we believe that satisfactory alternative properties can be found in all of our markets, if we do not renew these existing leased properties.
Reference is made to “Item 2. Properties” for a more detailed description of our geographic locations.
Customers and End Markets
We have a diverse customer base consisting of over 47,000 customers, who operate in a broad variety of over 20 industries in our North American and Asia-Pacific venues. Our customers consist of large national corporations, as well as many local companies and organizations. As a result, in each venue no customer contributed more than 10% of the respective venue’s FY 2018 revenues. Our end markets include construction, commercial, transportation, industrial, energy, manufacturing, mining, retail, consumer, education and government. We believe the end market and geographic diversification of our customer base reduces the business exposure to a significant downturn in any particular industry or geography.
I-12
Table of Contents
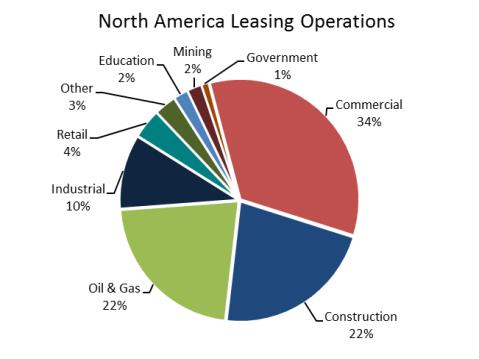
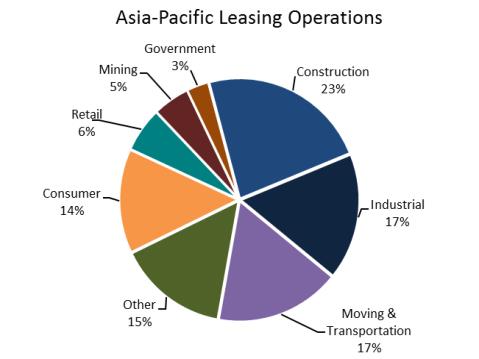
The diversity for our leasing operations is depicted in the following charts showing total revenue breakdown by end markets for FY 2018:
I-13
Table of Contents
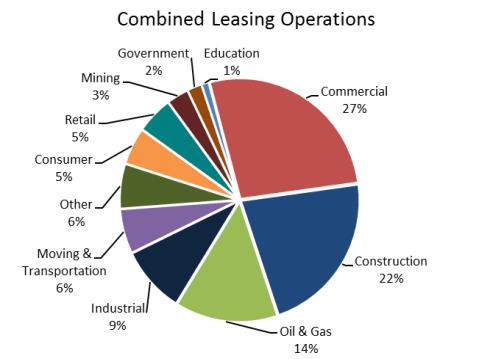
The following provides an overview of the end markets served by our leasing operations:
| • | Construction - general contractors, residential homebuilders and subcontractors |
| • | Industrial - industrial and manufacturing customers including a broad array of manufacturers, telecommunications, distribution, utilities, refuse, recycling and bottling companies |
| • | Commercial - businesses that provide service to both commercial businesses and individual consumers, including wholesalers, health care facilities, veterinary offices, entertainment companies and religious institutions |
| • | Oil & Gas and Mining - Customers in specific sectors of the extractive industries |
| • | Government - federal agencies, state and local governments, fire departments, correctional institutions, and the U.S. military |
| • | Retail - large national chains, small local stores, shopping centers and restaurants |
| • | Education - public schools, private schools and day care facilities |
| • | Consumer – mass market of individuals or groups, not businesses, such as families, sporting teams and community groups in the Asia-Pacific area |
| • | Moving & Transportation - freight providers for primarily road and rail transport in the Asia-Pacific area |
| • | Other - all other customers |
We differentiate ourselves from competitors in several ways. In our portable storage and modular space businesses, we provide a diverse set of competitively priced products and, in our Asia-Pacific market, we leverage our engineering team to provide customized units upon customer request. In our liquid containment business, we leverage long-standing customer relationships and not only provide liquid containment units, but also bundle units with transportation, on-site set-up, and the servicing of equipment 24 hours a day, 7 days a week. Our customer-centric approach is designed to ensure that our businesses consistently meet or exceed customer expectations. We believe this focus on customer service attracts new and retains existing customers. With the goal of delivering “best in class” customer service, we began collecting customer responses on net promoter scores (“NPS”) in North America at Pac-Van during the year ended June 30, 2015, which track customer willingness to recommend our products and services, and from October 2014 to June 2015 our customers gave us a NPS of 82. In FY 2016 and in both FY 2017 and FY 2018, our customers gave us a NPS of 83 and 85, respectively. In FY 2017, we began collecting customer responses on NPS in the Asia Pacific at Royal Wolf and in both FY 2017 and FY 2018 our customers there gave us a NPS of 61. In addition, over 80% of our consolidated total leasing revenues in FY 2018 were derived from repeat customers, which we believe is a result of our superior customer service.
Sales and Marketing
In North America, members of our sales teams act as primary customer service representatives and are responsible for fielding calls, obtaining credit applications, quoting prices, following up on quotes and handling orders. Our sales teams are responsible for developing and managing local relationships, as well as handling both inbound and outbound calls. They also assist customers in defining their space needs, assess potential
I-14
Table of Contents
opportunities, quote deals, close transactions and obtain the necessary documentation. Upon completing a lease or a sale, the sales team works closely with the local branch operations team to ensure that customer expectations are met or exceeded, relative to equipment quality and delivery timing. Our marketing group is primarily responsible for lead generation, digital marketing, advertising campaigns, producing company literature, creating promotional sales tools and oversight of customer relationship management systems. We market services through a number of promotional vehicles, including website, search engine optimization (SEO), search engine marketing (SEM), signage on our equipment, outbound sales efforts, targeted mailings, and trade shows and live chat. We believe this approach to marketing is consistent with the local nature of our business and allows each branch to employ a customized marketing plan that fosters growth within its particular market. As a result of our national footprint and strong service levels, we are seeking and securing national account agreements with large retailers, construction companies and other large businesses. We provide ongoing training to our sales teams, monitor call quality and survey our customers to ensure that customer interactions meet our quality and service standards. Our lease fleet carries signage reflecting our brands, which is important to ongoing name recognition.
Our sales and marketing strategy in the Asia-Pacific is designed to reach thousands of potential customers. Communication with potential customers is predominantly generated through a combination of internal advertising SEO and SEM, print media advertising, telemarketing, website, customer referrals, signage and decal awareness, direct mail, video, television, radio, social media and live chat. The customer hiring or buying process is being driven by customer awareness of the products combined with price shopping. We believe that while a typical customer may shop a limited number of suppliers, the customer does not spend much time doing so because the potential cost savings is relatively low compared to the value of their time. Our goals are to be one of the suppliers that potential customers call and to make the experience as easy as possible for that customer.
Fleet Management and Information Systems
Fleet Management
Fleet information is updated daily at the branch level, which provides management with the ability to monitor branch operations on a daily, weekly, monthly and ad hoc basis with on-line access to utilization, leasing and sale fleet unit levels and revenues by branch or geographic region. In managing our fleet, we regularly relocate containers between branches to meet changes in regional demand and optimize inventory levels. We have close relationships with the national road and rail hauling companies that enable us to transport the majority of containers interstate at attractive rates.
Ongoing maintenance to our North American leasing fleet is performed on an as-needed basis and is intended to maintain the value and rental-ready condition of our units. We use both in-house fleet technicians and third-party vendors to perform maintenance, depending on the branch and complexity of the work. Maintenance requirements on containers are generally minor and include removing rust and dents, patching small holes, repairing floors, painting and replacing seals around the doors. Maintenance requirements for container offices, mobile offices and modular buildings tend to be more significant than for storage equipment and may involve repairs of floors, doors, air conditioning units, windows, roofs and electric wiring. Portable liquid storage tanks require simple maintenance, including cleaning the unit to eliminate any residual material and inspecting and repairing the lining, if needed. Whether performed by us or a third party, the cost of maintenance and repair of our lease fleet is included as direct costs of leasing operations and is expensed as incurred. We believe our maintenance program ensures a high quality fleet that supports both leasing and sales operations.
In the Asia-Pacific, most of our fleet is comprised of new and refurbished and customized storage containers, manufactured steel containers and record storage units, along with our freight and accommodation units. These products are designed for long useful lives. A portion of our fleet consists of used storage containers of eight to thirteen years in age, a time at which their useful life as ocean-going shipping containers is over according to the standards promulgated by ISO. Because we do not have the same stacking and strength requirements that apply in the ocean-going shipping industry, we have no need for these containers to meet ISO standards. We purchase these containers in large quantities, refurbish them by removing any rust and paint them with a rust inhibiting paint, further customize them and add our decals and branding. We maintain our steel containers on a regular basis by painting them on average once every three to five years, removing rust, spot welding and occasionally replacing the wooden floor or other parts. This periodic maintenance keeps the container in good condition and is designed to maintain the unit’s value and rental rates comparable to new units.
I-15
Table of Contents
Information Systems
We utilize management information systems across each of our businesses to support fleet management and targeted marketing efforts, and we believe they are tailored to satisfactorily meet each of our businesses’ specific needs for efficient operation.
In our North American portable storage and modular space business, we utilize Microsoft Dynamics Navision and a rental module Armada at all of our branches to monitor operations at branches on a daily, weekly, monthly and ad hoc basis. Lease fleet information is updated daily at the branch level and verified through routine physical inventories by branch personnel, providing management with online access to utilization, lease fleet unit detail and rental revenues by branch and geographic region. In addition, an electronic file for each unit showing its lease history and current location and status is maintained in the information system. Branch salespeople utilize the system to obtain information regarding unit condition and availability. The database tracks individual units by serial number and provides comprehensive information including cost, condition and other financial and unit specific information. In FY 2018 we added a business intelligence corporate performance management software package, Microsoft SQL Server Reporting Services, or SSRS, to our information system platform.
In our Asia-Pacific portable storage and modular space businesses, our management information systems, including Microsoft Dynamics Navision and CRM, Armada, TCM and Power BI, are scalable and provide us with critical information to manage our business. Utilizing our systems, we track a number of key operating and financial metrics including utilization, lease rates, profitability, customer trends and fleet data. All our branches use the CRM Platform for surveying, and Navision and Armada for day to day processing. TCM, Power BI and Navision provide branch managers with vital data for financial, inventory and customer reports. In the year ending June 30, 2019, we intend to further develop our Navision and Armada capabilities, refine and further automate reporting, roll-out Dynamics CRM for Sales, develop a Customer Portal for self-management and business interaction, and continue to provide efficiency through system improvements and mobility solutions.
Our North American manufacturing business utilizes the enterprise resource planning (ERP) business system, SyteLine, which provides comprehensive functionality, including order processing, inventory, purchasing, planning and scheduling, production, cost management, project tracking, accounting and customer service.
Product Procurement
North America
Our North American leasing operations closely monitor fleet capital expenditures, which include fleet purchases and any capitalized improvements to existing units. Pac-Van’s top four suppliers of units for FY 2017 represented approximately 44% of all fleet purchases and the top ten suppliers represented approximately 69% of all fleet purchases. We purchase our Pac-Van lease fleet from a network of third-party suppliers. All of our mobile offices are built by an established network of manufacturing partners to standard specifications, which may vary depending on regional preferences. In addition, we build these units to meet state building code requirements and generally obtain multi-state certificates enabling us to move equipment among our branch network to meet changing demand and supply conditions. Like mobile offices, we procure modular buildings from an established network of manufacturing partners to meet state building requirements and generally obtain multiple state certificates for each unit.
On October 1, 2012, we acquired 90% of the membership interests of Southern Frac. Southern Frac manufactures primarily portable liquid storage containers in Waxahachie, Texas for oil and gas exploration and production, but it can also manufacture for, among others, the chemical and industrial, environmental remediation, waste water treatment and waste management sectors. During FY 2016, Southern Frac introduced other high-quality steel-based products, including container chassis, under the name “Southern Fabrication Specialties.”
Our North American leasing operations has historically purchased its tank fleet from several manufacturers but expects Southern Frac to be its primary supplier of steel tanks going forward. However, if needed, we have an established network of steel tank manufacturing partners located throughout the United States. Lone Star purchases its other containment solutions, pumps and hoses from a network of other manufacturing providers.
We believe that Southern Frac will continue to provide a substantial portion of the portable liquid storage containers requirements to our North American leasing operations, including a portion of their GLO requirements, as well as generate leasing referrals.
Capital investments are adjusted to match business needs and to respond to changing economic conditions. We do not generally enter into long-term purchase contracts with manufacturers, and we can modify our capital investment activities in response to market conditions. Our North American leasing operations supplement fleet spending with acquisitions. Although the timing and amount of acquisitions are difficult to predict, management
I-16
Table of Contents
considers its acquisition strategy to be opportunistic and attempts to adjust its fleet spending patterns as favorable acquisition opportunities become available.
Asia-Pacific
In the Asia-Pacific area, we purchase marine cargo containers from a wide variety of international shipping lines and container leasing companies and new container products directly from storage container manufacturers in China. We believe we are the largest buyer of both new and used storage container products for the Australia and New Zealand markets. The majority of used storage containers purchased is standard 20-foot and 40-foot units which we convert, refurbish or customize. We purchase new storage container products in the Asia-Pacific area under purchase orders issued to container manufacturers, which the manufacturers may or may not accept or be able to fill. There are several alternative sources of supply for storage containers. Though we are not dependent upon any one manufacturer in purchasing storage container products, if one or more suppliers did not timely fill our purchase orders or did not properly manufacture the ordered products, our reputation and financial condition also could be harmed. The top four suppliers represented approximately 89% of all fleet purchases during FY 2018.
Competition
Portable Storage
The portable storage markets in North America, Australia and New Zealand are highly fragmented. In most locations within its markets, Pac-Van and Royal Wolf compete with several national and regional competitors. Our largest competitors in the portable storage sector in North America are Mobile Mini, Williams Scotsman (WillScot Corporation), McGrath RentCorp, Haulaway, Allied Leasing, Eagle Leasing and National Trailer Storage. We believe we are the market share leader in Australia and New Zealand. Our primary competitors in these markets include CGM-CMA Group, and the SCF Group (Simply Containers) as well as smaller, full and part-time operators. Local competitors are regionally focused, and are usually more capital-constrained. Therefore, in general, they are heavily reliant on monthly sales performance, have slow growing rental fleets and have limited ability to handle larger volume contracts or customer accounts. We believe that participants in this sector compete on the basis of customer relationships, price, service, as well as breadth and quality of equipment offered.
Modular Space
The modular space sector is highly competitive in each of the markets in which we compete. Our largest North American competitors, Williams Scotsman (WillScot Corporation), Mobile Modular (McGrath RentCorp) and Mobile Mini have greater market share or product availability in some markets, as well as greater financial resources and pricing flexibility. Other regional competitors include Vanguard Modular, Design Space and Satellite Shelters. In the Australian portable container buildings market, Royal Wolf maintains a small presence and competes primarily with three large participants who manufacture their own units and most of whom offer units for both lease and sale to customers. These competitors are Coates Hire, Atco Structures & Logistics and Ausco Modular (Algeco Scotsman). We believe we compete on the basis of service, quality, customer relationships and price. We believe that our reputation for customer service and a wide selection of units allow us to compete effectively. The major barrier to entry for new participants is the degree of market penetration necessary to create a wide profile with contractors and clients. Penetrating and competing with the range of products and number of depots and agencies offered by incumbent operators tend to inhibit new entrants. As we already maintain a national sale and distribution network, established supply channels and a strong profile in our target markets, many of the barriers to entry applicable to other new entrants are not applicable to us.
Liquid Containment
The liquid containment sector is highly competitive. We compete in this sector based upon product availability, product quality, price, service and reliability. As with the other industries we serve, the competition consists of national, regional and local companies. Some of the national competitors, notably BakerCorp, Rain For Rent and Adler Tanks (McGrath RentCorp), have significantly larger tank lease fleet and may have greater financial and marketing resources, more established relationships and greater name recognition in the market than we do. As a result, the competitors with these advantages may be better able to attract customers and provide their products and services at lower rental rates.
I-17
Table of Contents
Employees
As of June 30, 2018, we had a total of 875 employees. None of our employees are covered by a collective bargaining agreement and management believes its relationship with employees is good. We have never experienced any material labor disruption and are unaware of any efforts or plan to organize our employees. The employee groups are as follows:
| North America | Asia-Pacific | |||||||||||||||
|
|
|
|||||||||||||||
| Leasing | Manufacturing | Corporate | Leasing | |||||||||||||
|
|
|
|||||||||||||||
| Corporate executive |
— | — | 5 | — | ||||||||||||
| Regional executive and administrative staff | 43 | 12 | 2 | 24 | ||||||||||||
| Senior and branch management |
77 | — | — | 34 | ||||||||||||
| Sales and marketing |
81 | — | — | 78 | ||||||||||||
| Branch operations and administration |
333 | — | — | 128 | ||||||||||||
| Manufacturing |
— | 58 | — | — | ||||||||||||
|
|
|
|||||||||||||||
| 534 | 70 | 7 | 264 | |||||||||||||
|
|
|
|||||||||||||||
I-18
Table of Contents
Executive Officers of the Registrant
The following information is provided as of June 30, 2018 regarding our executive officers. No family relationship exists between any executive officer.
| Name | Age | Position | ||||
| Ronald F. Valenta |
59 | Executive Chairman of the Board | ||||
| Jody Miller |
51 | President and Chief Executive Officer | ||||
| Charles E. Barrantes |
66 | Executive Vice President and Chief Financial Officer | ||||
| Christopher A. Wilson |
51 | General Counsel, Vice President and Secretary | ||||
| Jeffrey A. Kluckman |
57 | Executive Vice President of Global Business Development | ||||
| Neil Littlewood |
57 | Chief Executive Officer of Royal Wolf Holdings Limited | ||||
| Theodore Mourouzis |
55 | Chief Executive Officer and President of Pac-Van, Inc. | ||||
Ronald F. Valenta assumed the title of Executive Chairman of the Board in January 2018. Mr. Valenta has served as a director since our inception and our Chairman of the Board since June 2014. He was our President from inception until January 2017 and Chief Executive Officer from inception until January 2018. From May 2011 to October 2017, Mr. Valenta served as a director of Royal Wolf Holdings Limited. From 1988 to 2003, Mr. Valenta served as the President and Chief Executive Officer of Mobile Services Group, Inc., a portable storage company he founded, and from 2003 to 2006, Mr. Valenta was a director of the National Portable Storage Association, a storage industry non-profit organization that he co-founded. From 1985 to 1989, Mr. Valenta was a Senior Vice President of Public Storage, Inc., and from 1980 to 1985, Mr. Valenta was employed by the accounting firm of Arthur Andersen & Co. in Los Angeles.
Jody Miller became our Chief Executive Officer in January 2018 and has served as our President since January 2017. Mr. Miller was our Executive Vice President from June 2015 to January 2017 and has been the Chief Executive Officer of GFN North America Leasing Corporation since June 2015 and has served on the board of Royal Wolf Holdings Limited since 2016. Prior to joining us, Mr. Miller spent over 25 years in the equipment rental industry, including at Mobile Mini, Inc. as Executive Vice President and Chief Operations Officer for five years, Mobile Services Group, Inc. as Senior Vice President for five years, and RSC Holdings, Inc. for fifteen years; where he held many positions, including Regional Vice President for seven years. Mr. Miller is a 1990 graduate of Central Missouri State University.
Charles E. Barrantes has served as our Executive Vice President and Chief Financial Officer since September 2006. Prior to joining us, Mr. Barrantes was Vice President and Chief Financial Officer for Royce Medical Company from early 2005 to its sale in late 2005. From 1999 to early 2005, he was Chief Financial Officer of Earl Scheib, Inc., a public company that operated over 100 retail paint and body shops. Mr. Barrantes has over 35 years of experience in accounting and finance, starting with more than a decade with Arthur Andersen & Co.
Christopher A. Wilson has served as our General Counsel, Vice President and Secretary since December 2007. Prior to joining us, Mr. Wilson was the general counsel and assistant secretary of Mobile Services Group, Inc. from February 2002 to December 2007. Mr. Wilson practiced corporate law as an associate at Paul, Hastings, Janofsky & Walker LLP from 1998 to February 2002. Mr. Wilson graduated with a B.A. from Duke University in 1989 and a J.D. from Loyola Law School of Los Angeles in 1993.
Jeffrey A. Kluckman is our Executive Vice President of Global Business Development. Jeff started with us in September 2011. Prior to joining us, among other things, he held the role of vice president of mergers and acquisitions for portable storage solutions provider Mobile Mini, Inc. and, earlier, similar positions with Mobile Services Group, Inc., which was acquired by Mobile Mini in 2008, and RSC Equipment Rental, Inc. In his near 20-year background in the rental services sector, including the mobile storage, modular space and equipment rental industries, Mr. Kluckman successfully completed more than 145 transactions. Mr. Kluckman received an accounting degree from Northern Illinois University.
Neil Littlewood became Chief Executive Officer of Royal Wolf in July 2016. He joined Royal Wolf in March 2013 in the role of Executive General Manager, North East. Neil has over 13 years of senior experience in the rental/hire industry including executive roles at Coates Hire and Australian Temporary Fencing. Prior to this, Neil spent 20 years as an Army Officer including being in charge of recruiting for the Australian Army and retiring as Lieutenant Colonel. He is a graduate of the Royal Military College Duntroon and holds a Bachelor of Arts and Masters in Management from the University of New South Wales.
I-19
Table of Contents
Theodore Mourouzis became Chief Executive Officer of Pac-Van, Inc. in April 2017 and has served as its President since August 2006. He previously served as its Chief Operating Officer since 1999 and as its Vice President of Finance from 1997 until 1999. Prior to his employment with Pac-Van, Mr. Mourouzis was a controller for a 3M joint venture, served four years in management consulting with Deloitte & Touche, and was president of a picture framing distributor and the chief financial officer of its holding company. He received his undergraduate degree from Stanford University in 1985 and a Masters of Business Administration from The Wharton School of the University of Pennsylvania in 1991.
Trademarks
North America
We own trademarks important to our North American leasing operations, including Pac-Van®, “We’ve Put Thousands of U.S. Businesses In Space®,” “Expect More. We’ll Deliver®” and the “Container King” logo in Canada. Material trademarks are registered in the U.S. Patent and Trademark Office (“USPTO”). On March 27, 2018, we filed an application for the “PV 3 Safety Container,” and, on May 29, 2018, filed an amendment to allege use of the trademark, which was accepted by the USPTO on July 12, 2018. We are currently preparing a response to the USPTO office action to proceed with registration of the trademark. Registrations for such trademarks in the U.S. will last indefinitely as long as we continue to use and maintain the trademarks and renew filings with the applicable governmental offices.
Asia-Pacific
We entered into a licensing agreement with Triton Corporation in May 2008 for the use of the “Royal Wolf” name and trademark in connection with its retail sales and leasing of intermodal cargo containers and other container applications in the domestic storage market within Australia and New Zealand and surrounding islands in the Pacific Islands region. We paid Triton Corporation $740,000 to license the trademark. The license will continue in perpetuity as long as Royal Wolf continues to use the “Royal Wolf” name and trademark as the exclusive name for its business and mark for its products, subject to the termination provisions of the license. The license may be terminated by the licensor upon 30 days notice in the event Royal Wolf breaches its obligations under the license and will terminate automatically if Royal Wolf becomes insolvent or ceases to sell products under the trademark for a continuous period of 30 months. We sold the “Royal Wolf” name and trademark to Royal Wolf in May 2011 in connection with the Australian initial public offering of RWH. There are no claims pending against Royal Wolf challenging its right to use the “Royal Wolf” name and trade mark within Royal Wolf’s region of business. In September 2017, we reacquired the RWH shares that were issued in the initial public offering and not previously owned.
Available information
Our Internet website address is www.generalfinance.com. This reference to our Internet website does not incorporate by reference the information contained on or hyperlinked from our Internet website into this Annual Report on Form 10-K. Such information should not be considered part of this Annual Report on Form 10-K. The Internet websites for our operating units are Royal Wolf (www.royalwolf.com.au and www.royalwolf.co.nz), Pac-Van (www.pacvan.com), Lone Star (www.lonestartank.com) and Southern Frac (www.southernfrac.com and www.southernfabricationspecialties.com). We are required to file Annual Reports on Form 10-K and Quarterly Reports on Form 10-Q with the Securities and Exchange Commission (“SEC”) on a regular basis and are required to disclose certain material events in a current report on Form 8-K. The public may read and obtain a copy of any materials we file with the SEC through our Internet website noted above, which is hyperlinked to the SEC’s Internet website that contains reports, proxy and information statements and other information regarding issuers that file electronically with the SEC. The SEC’s Internet website is located at http://www.sec.gov.
I-20
Table of Contents
In addition to the other information in our Annual Report on Form 10-K, you should consider the risks described below that we believe may be material to investors in evaluating us. This section contains forward-looking statements, and in considering these statements, you should refer to the qualifications and limitations on our forward-looking statements that are described in SAFE HARBOR STATEMENT before the beginning of Item 1.
Economic conditions and global capital and credit market disruptions may adversely affect our business, financial condition and results of operations.
An economic slowdown in the United States and/or globally, including reduced oil and gas and non-residential construction activity, would adversely affect our business. Worsening conditions could adversely affect, among other things, the collection of our trade receivables on a timely basis, resulting in additional reserves for uncollectible accounts; and, in the event of continued contraction in product sales and leasing, could lead to a build-up of inventory and lease fleet levels and a decline in revenues. In addition, we engage in borrowing and repayment activities under our revolving credit facilities on an almost daily basis and have not had any disruption in our ability to access our revolving credit facilities as needed. However, disruptions in the global capital and credit markets, such as those that occurred in the global financial crisis during the latter part of the past decade, could increase the likelihood that one or more of our lenders may be unable to honor its commitments under our revolving credit facilities, which could have an adverse effect on our business, financial condition and results of operations.
We operate with a significant amount of indebtedness, borrowed primarily under senior secured credit facilities, which include various restrictions, including liens on all or substantially all of our assets, variable interest rates and contains restrictive covenants.
Our substantial indebtedness could have adverse consequences, such as:
| • | require us to dedicate a substantial portion of our cash flow from operations to payments on our indebtedness, which could reduce the availability of our cash flow to fund future operating capital, capital expenditures, acquisitions and other general corporate purposes; |
| • | expose us to the risk of increases in interest rates, as a substantial portion of our borrowings on our secured senior credit facilities are at variable rates of interest; |
| • | require us to sell assets to reduce indebtedness or influence our decisions about whether to do so; |
| • | increase our vulnerability to general adverse economic and industry conditions; |
| • | limit our flexibility in planning for, or reacting to, changes in our business and industry; |
| • | prohibit us from making strategic acquisitions or pursuing business opportunities; and |
| • | limit, along with the financial and other restrictive covenants in our indebtedness, among other things, our ability to borrow additional funds. |
Violating covenants in these agreements could have a material adverse effect on our business, financial condition and results of operations; including substantially increasing our cost of borrowing and restricting our future operations, if not cured or waived. In addition, the lenders may be able to terminate any commitments they had made to supply us with further funds. Accordingly, we may not be able to fully repay our debt obligations, if some or all of our debt obligations are accelerated upon an event of default.
Our senior credit agreements also contain various restrictive covenants that limit the operations of our business. Among other things, these agreements include covenants and restrictions relating to:
| • | payments and distributions to GFN; |
| • | liens, loans and investments; |
| • | debt and hedging arrangements; |
| • | mergers, acquisitions and asset sales; |
| • | transactions with affiliates; and |
| • | changes in business activities. |
In addition, we may incur substantial debt to complete business combinations. The incurrence of debt could result in:
| • | default and foreclosure on our assets if our operating revenues after a business combination are insufficient to repay our debt obligations; |
| • | our immediate payment of all principal and accrued interest, if any, if the debt security is payable on demand; and |
| • | our inability to obtain necessary additional financing if the agreements governing such indebtedness restrict our ability to obtain such financing while the debt instrument is outstanding. |
I-21
Table of Contents
The amount our North American leasing operations can borrow under its senior credit agreement depends in part on the value of its lease fleet. If the value of the lease fleet declines under appraisals our lenders receive, the amount we can borrow will decline by a similar amount. Several covenants with our lenders are affected by changes in the value of the lease fleet. We would be in breach of certain of these covenants if the value of the North American lease fleet drops below specified levels. If this happens, we may not be able to borrow the amounts we need to expand our business both organically and through acquisitions, make payments and distributions to GFN, and we may be forced to liquidate a portion of our existing fleet.
While we believe we will remain in compliance with the covenants in agreements governing such indebtedness in the foreseeable future and that our relationships with our senior lenders are good, there is no assurance our lenders would consent to an amendment or waiver in the event of noncompliance; or that such consent would not be conditioned upon the receipt of a cash payment, revised principal payout terms, increased interest rates or restrictions in the expansion of the credit facilities for the foreseeable future; or that our senior lenders would not exercise rights that would be available to them, including, among other things, demanding payment of outstanding borrowings. In addition, our ability to obtain additional capital or alternative borrowing arrangements at reasonable rates may be adversely affected. All or any of these adverse events would further limit our flexibility in planning for or reacting to downturns in our business.
See also the significant risks related primarily to our 9.00% Series C Cumulative Redeemable Perpetual Preferred Stock (the “Series C Preferred Shares” or “Series C Preferred Stock”) and our 8.125% Senior Notes (the “Senior Notes”), that are due in July 2021. In addition, reference is made to Notes 3 and 5 of Notes to Consolidated Financial Statements for more information regarding our Series C Preferred Stock and indebtedness.
We may need additional capital which we may be unable to obtain.
Our business is capital intensive and any inability to obtain capital in the amounts and at the times when needed, may have a material adverse effect on our business, financial condition and results of operations, including substantially increasing our cost of borrowing and restricting our future operations and impairing our ability to grow, improve and maintain our leased assets. We have a significant amount of our outstanding senior indebtedness maturing in the foreseeable future. We may not have sufficient cash flow from our operations to repay amounts coming due and, if we are unable to refinance this indebtedness, it could have a material adverse effect on our business.
Declines in demand for our products and services could also lead to increased borrowings and reduced collateral values which could lower the amounts we can borrow under our senior credit facilities; which could, in turn, restrict our ability to grow our business.
If we are unable to collect on contracts with customers, our operating results could be materially adversely affected.
Some of our customers may have liquidity issues and may not be able to fulfill the terms of their rental agreements with us. Historically, accounts receivable write-offs have not been significant. However, if we are unable to manage credit risk issues, or if a large number of customers have financial difficulties at the same time, our credit losses could increase above historical levels and our operating results would be adversely affected. Delinquencies and credit losses generally can be expected to increase during economic slowdowns or recessions.
Demand for a portion of our lease fleet and manufacturing products in North America is, to a significant degree, dependent on the levels of expenditures and drilling activity by the oil and gas industry and can fluctuate significantly in a short period of time. A substantial or an extended decline in oil and gas prices could result in lower expenditures and reduced drilling by the oil and gas industry, which could have a material adverse effect on our financial condition, results of operations and cash flows.
Demand for a portion of our lease fleet and manufacturing products in North America depends, to a significant degree, on the level of expenditures by the oil and gas industry for the exploration, development and production of oil and natural gas reserves and can fluctuate significantly in a short period of time. These expenditures are generally dependent on numerous factors and events over which we have no control, including the industry’s view of current and future oil and natural gas prices, future economic growth and the resulting impact on demand for oil and natural gas. Declines, as well as anticipated declines, in oil and gas prices could result in the reduction of drilling activity, project modifications, delays or cancellations, general business disruptions and delays in payment of, or nonpayment of, amounts that are owed to us. The oil and gas industry has historically experienced volatile prices for oil and gas and periodic downturns, which have been characterized by diminished demand for oilfield services and downward pressure on vendor prices charged. A significant and/or extended downturn in the oil and gas industry could result in a reduction in demand for our products, specifically our portable liquid containment products and services in North America, reduce the amounts we are able to borrow under our senior secured credit facilities and could adversely affect our financial condition, results of operations and cash flows.
I-22
Table of Contents
Changes in regulatory, or governmental, oversight of hydraulic fracturing could materially adversely affect the demand for our portable liquid containment products.
Oil and gas exploration and extraction (including the use of tanks for hydraulic fracturing of gas and oil shale) are subject to numerous local, state and federal regulations. The hydraulic fracturing method of extraction has come under scrutiny in several states and by the federal government due to the potential adverse effects that hydraulic fracturing, and the liquids and chemicals used, may have on water quality and public health. In addition, the disposal of wastewater from the hydraulic fracturing process into injection wells may be proven to increase the rate of seismic activity near drill sites and could result in regulatory changes, delays or interruption of future activity. Changes in these regulations could limit, interrupt or stop exploration and extraction activities, which would negatively impact the demand for our portable liquid containment products and services in North America.
We are subject to fluctuations in the rates of exchanges in the translation of our foreign operations into the U.S dollar for financial reporting purposes.
Fluctuations in the rates of exchange for the U.S. dollar against the Australian, New Zealand and Canadian dollars could significantly affect our results of operations through lower than anticipated reported revenues and profitability as a result of the translation of our foreign operations’ financial results into U.S. dollars.
A write-off of all or a part of our goodwill and intangibles would hurt our operating results and reduce our stockholders’ equity.
As a result of our acquisitions, we have recorded significant amounts of goodwill and intangible assets. Goodwill represents the excess of the total purchase price of these acquisitions over the fair value of the net assets acquired. We are not permitted to amortize goodwill under U.S. accounting standards and, instead, we review goodwill (as well as intangible assets) for impairment. Impairment may result from, among other things, deterioration in the performance of acquired businesses, adverse market conditions and adverse changes in applicable laws or regulations, including changes that restrict the activities of the acquired business. In the event impairment is identified, a charge to earnings would be recorded. Although it does not affect our cash flow, a write-off of all or a part of our goodwill or intangibles would adversely affect our operating results and equity.
Reference is made to Note 2 of Notes to Consolidated Financial Statements for more information regarding goodwill and intangible assets.
Future acquisitions of businesses and greenfield expansions could subject us to additional business, operating and industry risks, the impact of which cannot presently be evaluated, and which could adversely impact our capital structure.
We intend to pursue acquisition opportunities and greenfield expansions in an effort to diversify our investments and grow our business. Any business we acquire may cause us to be affected by numerous risks inherent in the target’s business operations. If we acquire a business in an industry characterized by a high level of risk, we may be affected by the currently unascertainable risks of that industry. Although we will endeavor to evaluate the risks inherent in a particular industry or target business, we cannot assure that we will be able to properly ascertain or assess all of the significant risk factors. In addition, integrating acquired businesses, greenfield expansions and assets into our business can be difficult and risky, especially if the acquired business or assets involve an industry segment with which our management has limited experience or where there are limited synergies with our current businesses. Our integration of acquired businesses and realization of all synergies or efficiencies that we believe may result from such acquisitions or expansions may not come to fruition, which could negatively impact our business.
The financing of any acquisition we complete could adversely impact our capital structure as any such financing would likely include the borrowing of additional funds and/or the issuance of additional equity securities. Increasing our indebtedness could increase the risk of a default that would entitle the holder to declare all of such indebtedness due and payable and/or to seize any collateral securing the indebtedness. In addition, default under one debt instrument could in turn permit lenders under other debt instruments to declare borrowings outstanding under those other instruments to be due and payable pursuant to cross default clauses. The issuance of additional equity securities may significantly reduce the equity interest of our stockholders and/or adversely affect prevailing market prices for our common stock.
Reference is made to Note 4 of Notes to Consolidated Financial Statements for more information regarding acquisitions.
I-23
Table of Contents
While part of our long-term business strategy is to acquire additional businesses, there is no assurance that we will be able to identify businesses that we can acquire upon terms we believe acceptable, or if such acquisitions require additional financing, that we could obtain such additional financing.
We cannot ascertain the availability of businesses to acquire, nor the capital requirements for future transactions. We cannot assure that, if required, additional financing will be available on acceptable terms, if at all. To the extent that additional financing proves to be unavailable when needed to consummate a particular acquisition, we would be compelled to either restructure the transaction or abandon that particular acquisition. In addition, if we consummate a future acquisition, we may require additional financing to fund the operations or growth of the target business. The failure to secure additional financing may impact the continued development or growth of the target business and could adversely impact our operating results.
Our long-term growth plan involves an element of risk and could strain our management resources. Failure to retain key executives could adversely affect our operations and could impede our ability to execute our business plan and growth strategy.
We intend to pursue a growth strategy involving organic and non-organic growth. There is a no guarantee that such growth will occur or be successful. We may incur significant capital expenditures in connection with expansion plans that may not be realized or may not deliver the earnings that are expected. In addition, our expansion plans may, in the future, give rise to unforeseen risks or problems, and our future performance will depend in large part on our ability to manage our long-term planned growth that could strain our existing management, human and other resources. To successfully manage this growth, we must continue to add competent managers and employees and improve our operating, financial and other internal procedures and controls. We also must effectively motivate, train and manage employees. If we do not manage our growth effectively, it would adversely affect our future operating results.
Our growth strategies, operational guidance, capital allocation and capital markets support are managed largely by our existing corporate officers; as well as the senior management teams at our operating units in the Asia-Pacific area and North America. The continued success of our businesses will depend largely on the efforts and abilities of our corporate executives and the operational senior management teams. These key personnel have an understanding of our businesses that cannot be readily duplicated. However, we do not have key-man insurance on any of these key personnel. The loss of any of these key personnel could impair our ability to execute our business plan and growth strategy and could have a material adverse effect on our operating results.
Our long-term growth plan may include the expansion of operations into markets outside of North America and the Asia-Pacific area. Such international expansion may not prove successful, and may divert significant capital, resources and management’s time and attention and adversely affect our on-going operations.
To date, we have conducted all of our business within North America and the Asia-Pacific area. However, we may in the future enter international markets, which would require substantial amounts of management time and attention. Our products and overall business approach may not be accepted in other markets to the extent needed to make our international expansion profitable. In addition, the additional demands on management from these activities may detract from our efforts in our current markets and adversely affect our operating results therein. Any international expansion will expose us to the risks normally associated with conducting international business operations, including unexpected changes in regulatory requirements, changes in foreign legislation, possible foreign currency controls, currency exchange rate fluctuations or devaluations, tariffs, difficulties in staffing and managing foreign operations, difficulties in obtaining and managing vendors and distributors, potential negative tax consequences and asset management difficulties.
We may issue shares of our capital stock that would reduce the equity interest of our stockholders and could cause a change in control of our ownership.
We may seek to finance future transactions, including business combinations, or improve our financial position by issuing additional shares of our common stock and/or preferred stock. The issuance of any number of shares of our common stock or of our preferred stock:
| • | may significantly reduce the equity interest of investors; |
| • | may subordinate the rights of holders of common stock if preferred stock is issued with rights senior to those afforded to our common stock; |
| • | may cause a change in control if a substantial number of our shares of common stock are issued, which may affect, among other things, our ability to use our net operating loss carry forwards, if any, and could result in the resignation or removal of our present officers and directors; and |
I-24
Table of Contents
| • | may adversely affect prevailing market prices for our common stock. |
Because we have depended to a large extent on the success of our leasing operations, the failure to effectively and quickly remarket lease units that are returned could materially and adversely affect our results of operations.
Historically, our average monthly lease fleet utilization has averaged between 70% and 85% and the typical lease term has averaged over twelve months. These factors have provided us with a fairly predictable revenue stream. However, if utilization rates decline or should a significant number of our lease units be returned during any short period of time, we would have to re-lease a large supply of units at similar rates to maintain historic revenues from these operations. Our failure to effectively maintain historical utilization rates or remarket a large influx of units returning from leases could have a material adverse effect on our results of operations and cash flows.
The supply and cost of used ISO containers fluctuates, which can affect our pricing.
We purchase, remanufacture and modify used ISO containers in order to expand our rental fleet. If used ISO container prices increase substantially, these price increases could increase our expenses, particularly if we are not able (due to competitive reasons or otherwise) to raise our rental rates to absorb this increased cost. Conversely, an oversupply of used ISO containers may cause container prices to fall. In such event, competitors may then lower the rental rates on their storage units. As a result, we may need to lower our rental rates to remain competitive. Therefore, fluctuations in the used ISO container market could cause our revenues and our earnings to decline.
Our lease fleet is subject to residual value risk upon disposition, and may not sell at the prices or in the quantities we expect.
A significant portion of our revenues are from unit sales out of our lease fleet. The market value of any given unit of our lease fleet could be less than its depreciated value at the time it is sold. The market value of used rental equipment depends on several factors, including:
| • | the market price for new equipment of a like kind; |
| • | the age of the equipment at the time it is sold, as well as wear and tear on the equipment relative to its age; |
| • | the supply of used equipment on the market; |
| • | technological advances relating to the equipment; |
| • | worldwide and domestic demand for used equipment; and |
| • | general economic conditions. |
We include in operating income the difference between the sales price and the depreciated value of an item of equipment sold. Changes in our assumptions regarding depreciation could change our depreciation expense, as well as the gain or loss realized upon disposal of lease fleet. Sales of units from our lease fleet at prices that fall significantly below its carrying value will have an adverse impact on our results of operations.
New tariffs on steel imports could result in increased container prices.
In June 2018, the U.S. government issued part 2 of the 25% ad valorem tariff that is expected to be applied to Chinese exports to the U.S. The list of proposed products and commodities that would be subject to this 25% tariff includes ISO containers. While containers involved in typical import/export shipping activities are considered instruments of international trade and not typically subject to tariffs, it is possible that the U.S. government could view containers as being subject to the proposed tariff once they are sold into the United States. Since a significant portion of portable storage containers currently in the United States were originally manufactured in China to transport goods before eventually being sold for domestic use, the proposed tariff would immediately increase the cost of new and used containers being sold into the United States. In August 2018, the U.S. government determined that a tariff would not be applied to ISO containers. However, if in the future it is reconsidered and a tariff is applied, such an action would result in increased steel container prices, which could adversely affect our results of operations and financial condition.
Unionization by some or all of our employees could cause increases in operating costs.
Our employees are not presently covered by collective bargaining agreements. Unions may attempt to organize our employees in the future. We are unable to predict the outcome of any continuing or future efforts to organize our employees, the terms of any future labor agreements, or the effect, if any, those agreements might have on our operations or financial performance.
I-25
Table of Contents
We are subject to laws and governmental regulations and actions that affect our operating results and financial condition.
Our business is subject to regulation and taxation under a wide variety of foreign and U.S. federal, state and local laws, regulations and policies including those imposed by the SEC, the Internal Revenue Service, the Dodd-Frank Wall Street Reform and Consumer Protection Act and NASDAQ, as well as applicable labor laws. Although we have policies and procedures designed to comply with applicable laws and regulations, failure to comply with the various laws and regulations may result in civil and criminal liability, fines and penalties, increased costs of compliance, additional taxation and restatement of our financial statements.
There can also be no assurance that, in response to current economic conditions or the current political environment or otherwise, laws and regulations will not be implemented or changed in ways that adversely affect our operating results and financial condition, such as recently adopted legislation that expands health care coverage costs or facilitates union activity or federal legislative proposals to increase taxation and operating costs.
Our effective tax rate may change and become less predictable as our business expands, making our future after-tax results less predictable.
We continue to consider expansion opportunities domestically and internationally for our leasing businesses. Since the our effective tax rate depends on business levels, personnel and assets located in various jurisdictions, further expansion into new markets or acquisitions may change the effective tax rate in the future and may make it, and consequently our after-tax results, less predictable going forward. In addition, the enactment of future tax law changes by federal, state and international taxing authorities may impact our income tax provision and deferred tax liabilities.
Failure to comply with internal control attestation requirements could lead to loss of public confidence in our financial statements and negatively impact our stock price.
As a public reporting company, we are required to comply with the Sarbanes-Oxley Act of 2002, including Section 404, and the related rules and regulations of the SEC, including expanded disclosures and accelerated reporting requirements. Compliance with Section 404 and other related requirements has increased our costs and will continue to require additional management resources. We may need to continue to implement additional finance and accounting systems, procedures and controls to satisfy new reporting requirements, and there is no assurance that future assessments of the adequacy of our internal controls over financial reporting will be favorable. If we are unable to obtain future unqualified reports as to the effectiveness of our internal control over financial reporting, investors could lose confidence in the reliability of our internal control over financial reporting, which could, among other things, adversely affect our stock price.
Our self-insured loss reserves through our captive insurance company may be inadequate to cover our ultimate liability.
We have insurance policies with coverage that we believe are adequate, including auto liability, general liability, directors and officers liability and workers compensation. Effective on February 1, 2017, we became self-insured for auto liability and general liability through GFNI, our wholly-owned captive insurance company. Claims and expenses are reported when it is probable that a loss has occurred and the amount of the loss can be reasonably estimated. These losses include an estimate of claims that have been incurred but not reported. We record reserves (included in “Trade payables and accrued liabilities” in our consolidated balance sheets) to cover estimated losses for our self-insured general liability and auto liability. The determination of these loss reserves is based upon a number of factors, including current and historical claims activity, claims payment patterns and developments in any existing claims. Accordingly, reserves do not represent an exact calculation of liability and can be affected by both internal and external events, such as adverse developments on existing claims or changes in claims handling procedures, administrative costs and legal fees, inflation, and legal trends and legislative changes. Loss reserves are adjusted from time to time to reflect new claims, claim developments, or systemic changes, and such adjustments are reflected in the results of the periods in which the loss reserves are changed. Though we believe the loss reserves recorded at our consolidated balance sheet dates are adequate, because of the uncertainties that surround estimating losses we cannot be certain that such reserves will cover the ultimate liability. If our loss reserves are insufficient to cover our actual losses, we would incur additional charges that could be material to our consolidated results of operations and financial condition.
We are exposed to various possible claims relating to our business and our insurance may not fully protect us.
We are exposed to various possible claims relating to our business. These possible claims include those relating to: (i) personal injury or death caused by container products, mobile offices or modular units leased or sold by us; (ii) accidents involving our vehicles and our employees; (iii) employment-related claims; (iv) property damage; (v) commercial claims and (vi) environmental contamination. We believe that we have adequate insurance coverage for the protection of our assets and operations. However, our insurance may not fully protect us for certain types of claims, such
I-26
Table of Contents
as claims for punitive damages or for damages arising from intentional misconduct, which are often alleged in third-party lawsuits.
In addition, we may be exposed to uninsured liability at levels in excess of our policy limits. If we are found liable for any significant claims that are not covered by insurance, our liquidity and operating results could be materially adversely affected. It is possible that our insurance carriers may disclaim coverage for any class action and derivative lawsuits against us. It is also possible that some or all of the insurance that is currently available to us will not be available in the future on economically reasonable terms or not available at all. In addition, whether we are covered by insurance or not, certain claims may have the potential for negative publicity surrounding such claims, which may adversely impact our operating results, value of our public securities, or give rise to additional similar claims being filed.
Disruptions in our information technology systems could limit our ability to effectively monitor and control our operations and adversely affect our operations.
Our information technology systems facilitate our ability to monitor and control our operations and adjust to changing market conditions. Any disruption in our information technology systems or the failure of these systems to operate as expected could, depending on the magnitude of the problem, adversely affect our operating results by limiting our capacity to effectively transact business, monitor and control our operations and adjust to changing market conditions in a timely manner. Like other companies, our information technology systems may be vulnerable to a variety of interruptions due to our own error or events beyond our control, including, but not limited to, cyber-security breaches, natural disasters, terrorist attacks, telecommunications failures, computer viruses, hackers and other security issues. The failure of these systems to operate effectively could result in substantial harm or inconvenience to us or our customers. This could include the improper use of personal information or other “identity theft.” Each of these situations or data privacy breaches may cause delays in customer service, reduce efficiency in our operations, require significant capital investments to remediate the problem, or result in negative publicity that could harm our reputation and results.
In addition, the delay or failure to implement information system upgrades and new systems effectively could disrupt our business, distract management’s focus and attention from our business operations and growth initiatives and increase our implementation and operating costs, any of which could negatively impact our operations and operating results.
The price of our common stock may fluctuate significantly, which may make it difficult for stockholders to resell common stock when they want or at a price they find attractive.
We expect that the market price of our common stock will fluctuate. Our common stock price can fluctuate as a result of a variety of factors, many of which are beyond our control. These factors include:
| • | actual or anticipated variations in our quarterly operating results; |
| • | changes in interest rates and other general economic conditions; |
| • | significant acquisitions or business combinations, strategic partnerships, joint ventures or capital commitments by or involving us or our competitors; |
| • | operating and stock price performance of other companies that investors deem comparable to us; |
| • | news reports relating to trends, concerns, litigation, regulatory changes and other issues in our industry; |
| • | geopolitical conditions such as acts or threats of terrorism or military conflicts; |
| • | relatively low trading volume; and |
| • | significant concentration of ownership in our common stock. |
If equity research analysts do not publish research or reports about our business or if they issue unfavorable commentary or downgrade our common stock, the price of our common stock could decline.
The trading market for our common stock will rely in part on the research and reports that equity research analysts publish about us and our business. We do not control these analysts. The price of our stock could decline if one or more equity analysts downgrade our stock or if those analysts issue other unfavorable commentary or cease publishing reports about us or our business.
We do not currently intend to pay dividends on our common stock, which may limit the return on your investment in us.
Except for payment of dividends on our preferred stock, we intend to retain all available funds and any future earnings for use in the operation and expansion of our business and do not anticipate paying any cash dividends on our common stock in the foreseeable future.
I-27
Table of Contents
Significant Risks Related Primarily to Our Leasing Operations in North America
General or localized economic downturns or weakness may adversely affect our customers, in particular those in the oil and gas and construction industries, which may reduce demand for our products and services and negatively impact our future revenues and results of operations.
A significant portion of our revenues in our North American leasing operations is derived from customers who are in industries and businesses that are cyclical in nature and subject to changes in general economic conditions, including the oil and gas and the construction industries. Although the variety of our products, the breadth of our customer base and the number of markets we serve throughout North America limit our exposure to economic downturns, general economic downturns or localized downturns in markets where we operate could reduce demand for our products, especially in the construction or oil and gas industries, and negatively impact our future revenues, results of operations and cash flows.
In the oil and gas industry, lower or the perception of lower or unstable domestic oil or gas prices have an adverse effect on our portable liquid containment business. Such market conditions cause customers to limit or stop exploration and extraction activities, resulting in lower rental demand and rates for our portable liquid containment products. Also, a weak U.S. economy may negatively impact infrastructure construction and industrial activity. Any of these factors would adversely affect our cash flows and financial performance and could result in excess lease fleet or impairment charges.
We may be brought into tort or environmental litigation or held responsible for cleanup of spills if the customer fails to perform, or an accident occurs in the use of our tank container products, which could materially adversely affect our business, future operating results or financial position.
Our portable liquid tank containers and containment products are used by customers to store non-hazardous and certain hazardous liquids on customer sites. Customers are responsible for proper operation of our fleet equipment while on lease and returning a cleaned and undamaged container upon completion of use, but we cannot always assure that these responsibilities are fully met in all cases. Our operations are subject to operational hazards, including accidents or equipment issues that can cause pollution and other damage to the environment. Hazards inherent in the oil and natural gas industry, such as, but not limited to, accidents, blowouts, explosions, pollution and other damage to the environment, fires and hydrocarbon spills, may delay or halt operations at extraction sites which we service. These conditions can cause:
| • | personal injury or loss of life; |
| • | liabilities from accidents by our fleet of trucks and other equipment; |
| • | damage to or destruction of property, equipment and the environment; and |
| • | the suspension of operations. |
In the event of a spill or accident, we may be brought into a lawsuit or enforcement action by either our customer or a third party on numerous potential grounds, including that an inherent flaw in a container tank contributed to the accident or that the container tank had suffered some undiscovered harm from a previous customer’s use. In the event of a spill caused by our customers, we may be held responsible for cleanup under environmental laws and regulations concerning obligations of suppliers of rental products to effect remediation. In addition, applicable environmental laws and regulations may impose liability on us for conduct of third parties, or for actions that complied with applicable regulations when taken, regardless of negligence or fault. Substantial damage awards have also been made in certain jurisdictions against lessors of industrial equipment based upon claims of personal injury, property damage, and resource damage caused by the use of various products. While we try to take reasonable precautions that our lease equipment is in good and safe condition prior to lease and carry insurance to protect against certain risks of loss or accidents, liability could adversely impact our profitability.
We maintain insurance coverage that we believe to be customary in the industry against these hazards. We may not be able to maintain adequate insurance in the future at rates we consider reasonable. In addition, insurance may not be available to cover any or all of the risks to which we are subject, or, even if available, the coverage provided by such insurance may be inadequate, or insurance premiums or other costs could make such insurance prohibitively expensive. It is likely that, in our insurance renewals, our premiums and deductibles will be higher, and certain insurance coverage either will be unavailable or considerably more expensive than it has been in the recent past. In addition, our insurance is subject to coverage limits, and some policies exclude coverage for damages resulting from environmental contamination.
I-28
Table of Contents
The portable storage industry in North America is highly competitive and fragmented, and we face significant competition that may lead to our inability to increase or maintain our prices, which could have a material adverse impact on our results of operations.
The portable storage industry in North America is highly competitive and fragmented. Many of the markets in which we operate are served by numerous competitors, ranging from national companies to smaller multi-regional companies and small, independent businesses with a limited number of locations. Some of these competitors currently offer products outside of our offerings or may have better brand recognition in some market sectors. If these competitors use their brand awareness to promote products that compete with our product offerings, customers may choose these competitors’ products over ours, and we could lose business. A number of our competitors are competing aggressively on the basis of pricing and may drive down prices. Additionally, general economic factors could drive down market prices. To the extent that we choose to match our competitors’ declining prices, it could harm our results of operations as we would have lower margins. To the extent that we choose not to match or remain within a reasonable competitive distance from our competitors’ pricing, it could also harm our results of operations, as we may lose rental volume.
The portable liquid containment rental industry is highly competitive, and competitive pressures could impair our ability to increase market share and to rent or sell, equipment at favorable prices.
The portable liquid containment rental industry is highly competitive. We compete against national, regional and local companies, some of which are significantly larger than we are and have greater financial and marketing resources than we have. Some of our competitors also have longer operating histories, lower cost rental equipment and lower cost structures and more established relationships with equipment manufacturers than we have. In addition, certain of our competitors are more geographically diverse than we are and have greater name recognition among customers than we do. As a result, our competitors that have these advantages may be better able to attract customers.
We believe that local relationships, equipment quality, service levels and fleet size are key competitive factors in the portable liquid containment industry. From time to time, we or our competitors may attempt to compete aggressively by lowering rental rates or prices. Competitive pressures could adversely affect our future revenues and operating results by depressing the rental rates. To the extent we lower lease rates or increase our fleet size in order to retain or increase market share, our operating margins would be adversely impacted. In addition, we may not be able to match a larger competitor’s price reductions or fleet investment because of its greater financial resources, all of which could adversely impact our future operating results.
Seasonality of the portable liquid containment industry may impact future quarterly results.
Activity may decline in our second quarter months of November and December and our third quarter months of January and February. These months may have lower rental activity in parts of the country where inclement weather may delay, or suspend, customer projects. The impact of these delays may be to decrease the number of frac tank containers on lease until companies are able to resume their projects when weather improves. These seasonal factors may impact our future quarterly results in each year’s second and third quarters.
A key for success in the oil and gas industry in North America is our ability to continue to employ and retain skilled and unskilled personnel. Any difficulty we experience replacing or adding personnel could adversely affect our business.
We may not be able to find enough skilled and unskilled labor to meet our needs, which could limit our growth. Oil and gas business activity historically decreases or increases with the prices of oil and natural gas. We may have problems retaining and finding enough laborers in the future, particularly if the demand for our portable liquid containment products and fluid management services increases significantly in a relatively short period of time. Other factors may also inhibit our ability to find enough workers to meet our employment needs. We believe that a key to our success in the oil and gas industry in North America is our ability to continue to employ and retain skilled and unskilled personnel. Our inability to employ or retain personnel generally could have a significant adverse effect on our operations.
A substantial portion of the revenues of Lone Star are earned from a limited number of major customers, and the loss of any one or more of these customers could adversely affect our results of operations.
Lone Star earns a substantial portion of its revenue from a limited number of major customers. One or more of these customers could cancel their leases and cease doing business with Lone Star for a variety of reasons beyond our control. The loss of one or more of these major customers could adversely affect our results of operations.
I-29
Table of Contents
We face significant competition in the modular space industry, especially from several national competitors in the United States who have greater financial resources and pricing flexibility than we do. If we are unable to compete successfully, we could lose customers and our future revenues could decline.
Although our competition varies significantly by market, the modular space markets in which we compete are dominated primarily by four participants and are highly competitive. In addition, we compete with a number of large to mid-sized regional competitors, as well as many smaller, full and part-time operators in many local regions. The modular space industry is highly competitive, subject to stiff pricing competition and almost all of the competitors have portable storage product offerings. The primary modular national competitors with portable storage product offerings have greater financial resources and pricing flexibility. If they focus on portable storage and are unable to compete successfully, we could lose customers and our future revenues and results of operations could decline.
Failure to comply with applicable regulations could harm our business and financial condition, resulting in lower operating results and cash flows.
Similar to conventionally constructed buildings, companies in the modular building industry are subject to regulations by multiple governmental agencies at the federal, state and local level relating to environmental, zoning, health and safety, labor and transportation, among other matters. New governmental regulations in these or other areas may increase our acquisition cost of new rental equipment, limit the use of or make obsolete some of our existing fleet, or increase our costs of rental operations. Failure to comply with these laws or regulations could impact our business or harm our reputation and result in higher capital or operating expenditures or the imposition of penalties or restrictions on our operations. Compliance with building codes and regulations entails a certain amount of risk as state and local government authorities do not necessarily interpret building codes and regulations in a consistent manner, particularly where applicable regulations may be unclear and subject to interpretation. These regulations often provide broad discretion to governmental authorities that oversee these matters, which can result in unanticipated delays or increases in the cost of compliance in particular markets. The construction and modular industries have developed many “best practices” which are constantly evolving. Some of our peers and competitors may adopt practices that are more or less stringent than ours. When, and if, regulatory standards are clarified, the effect of the clarification may be to impose rules on our business and practices retroactively, at which time, we may not be in compliance with such regulations and we may be required to incur costly remediation. If we are unable to pass these increased costs on to our customers, our profitability, operating cash flows and financial condition could be negatively impacted.
Significant increases in raw material costs could increase our operating costs significantly and harm our future results of operations.
We purchase raw materials, including metals, lumber, siding and roofing and other products, to construct and modify modular buildings and to modify containers to its customers’ requirements. We also maintain a truck fleet to deliver units to and return units from customers. During periods of rising prices for raw materials, especially oil and fuel for delivery vehicles, and in particular when the prices increase rapidly or to levels significantly higher than normal, we may incur significant increases in operating costs and may not be able to pass price increases through to customers in a timely manner, which could harm our future results of operations.
Failure by our manufacturers to sell and deliver products in a timely fashion may harm our reputation and financial condition.
We currently purchase new modular buildings and components, mobile offices and container products directly from manufacturers. Although we are not dependent on any one manufacturer and are able to purchase products from a variety of suppliers, the failure of one or more of our suppliers to timely manufacture and deliver storage containers to us could adversely affect our operations. We purchase new modular buildings and components, mobile offices and storage containers under purchase orders issued to various manufacturers, which the manufacturers may or may not accept or be able to fill. We have no contracts with any supplier. If these suppliers do not timely fill our purchase orders, or do not properly manufacture the ordered products, our reputation and financial condition could be harmed.
Some zoning laws restrict the use of our storage units and therefore limit our ability to offer products in all markets.
Many of our customers use our storage units to store goods on their own properties. Local zoning laws in some of our markets prohibit customers from maintaining mobile offices or storage containers on their properties or require that mobile offices or storage containers be located out of sight from the street. If local zoning laws in one or more of our geographic markets were to ban or restrict our products from being stored on customers’ sites, our business in that market could suffer.
I-30
Table of Contents
As Department of Transportation regulations increase, our operations could be negatively impacted and competition for qualified drivers could increase.
We operate in the United States pursuant to operating authority granted by the U.S. Department of Transportation (“DOT”). Our company drivers must comply with the safety and fitness regulations of the DOT, including those relating to drug and alcohol testing and hours-of-service. Such matters as equipment weight and dimensions also are subject to government regulations. Our safety record could be ranked poorly compared to our peer firms. A poor fleet ranking may result in the loss of customers or difficulty attracting and retaining qualified drivers which could affect our results of operations. Should additional rules be enacted in the future, compliance with such rules could result in additional costs.
A tightening transportation-related labor market could adversely affect Lone Star
Lone Star’s ability to remain productive and competitive depends on its ability to attract and retain transportation personnel in particular skilled truck drivers. The national tightening of the transportation related labor market due to a shortage of skilled truck drivers may inhibit Lone Star’s ability to hire and retain this segment of our employee base. Additionally, rising wages paid to skilled truck drivers may pose a risk to Lone Star’s margins if it is unable to pass on such higher costs through rate increases. These labor factors could have a material adverse effect on our results of operations.
Significant Risks Related Primarily to Our Leasing Operations in the Asia-Pacific
The future performance of Royal Wolf depends on customer demand for portable container solutions as well as the expansion of the portable container solutions products market in Australia.
Any reduction in customer demand, failure of customer demand to grow, or failure of Royal Wolf to meet changes in customer demand or preferences may adversely affect Royal Wolf’s businesses, operational performance, growth prospects and financial position. For example, if expected growth in the portable container buildings market fails to come to fruition, or if businesses and individuals no longer demand portable container buildings at current levels, Royal Wolf’s return on its portable container building investments could be negatively impacted. The demand for Royal Wolf’s assets is dependent on the key industry segments into which Royal Wolf sells and lease assets, such as oil and gas, mining, construction, industrial and retail. A significant reduction in the business climate in these industry segments, could negatively impact Royal Wolf’s results of operations.
The success and ability to drive future growth is dependent to a large extent on brand reputation.
Royal Wolf believes its brand reputation is a key driver in its success and its ability to drive future growth. Any adverse change to the reputation of Royal Wolf may adversely affect the Company’s businesses, operational performance and financial condition. Royal Wolf licenses the “Royal Wolf” trademark in Australia, New Zealand and surrounding islands in the Asia-Pacific region. There is a risk that use of the “Royal Wolf” brand by third parties in jurisdictions in which Royal Wolf does not own the trademark may adversely impact the Royal Wolf brand and consequently its business.
Royal Wolf’s ability to achieve its long-term business strategy is dependent to a certain extent on its supply chain and purchasing.
Royal Wolf’s long-term business strategy assumes a certain level of growth in Australian and New Zealand demand for container based solutions. Royal Wolf’s ability to meet this demand is dependent, to a certain extent, on the ability of Royal Wolf to purchase storage containers economically and on a timely basis. Historically, Royal Wolf has successfully worked with shipping lines and international container leasing companies to purchase used containers, and with manufacturers and brokers, including in China, to purchase new containers, but there can be no guarantee of this in the future. Changes to shipping line practices with respect to used containers, and adverse changes in trade practices, regulations and relations between Australia and its trading partners, including China, could adversely impact Royal Wolf’s ability to purchase containers or impact the price at which Royal Wolf is able to purchase containers.
Historically, Royal Wolf has relied on internal supply chain and sourcing arrangements, international suppliers and the logistics industry to relocate containers. Changes to these arrangements, constraints on the supply chain, failure of suppliers to deliver or deliver in a timely manner or material increases in the price of new or used containers could have an adverse impact on Royal Wolf’s business, operational performance, profit margins and financial results. Royal Wolf purchases new storage container products under purchase orders issued to container manufacturers, which the manufacturers may or may not accept or be able to fill. There are several alternative sources of supply for storage containers. Though Royal Wolf is not dependent upon any one manufacturer in purchasing storage container products, the failure of one or more of its suppliers to timely deliver containers to Royal Wolf could adversely affect its operations. If these suppliers do not timely fill Royal Wolf’s purchase orders or do not properly manufacture the ordered products, Royal Wolf’s reputation and financial condition also could be harmed.
I-31
Table of Contents
Royal Wolf conducts its business in a highly competitive sector.
Royal Wolf’s faces competition in the portable buildings, freight and portable storage markets. Royal Wolf also faces potentially significant competition from modular industry companies who have non-container portable building offerings, especially several national competitors in Australia who have greater financial resources and pricing flexibility than Royal Wolf. As a result, Royal Wolf is subject to potential competition from new domestic and foreign competitors and the provision of new products or services, aggressive pricing and lease rates offered by existing competitors. Competition varies by region and Royal Wolf may not always be able to match its competitors in service levels, functionality and price in each or all regions. The emergence of a new competitor with international reach, or increased focus on the rental model by existing competitors, particularly with an extensive distribution network, could have an adverse effect on Royal Wolf’s business, financial condition, results of operations and growth prospects. Also, continued service improvement by competitors may result in Royal Wolf’s customers using substitutes in place of some of Royal Wolf’s products. Royal Wolf may not always be able to match its competitors in both functionality and price, which could negatively impact Royal Wolf’s revenues. In addition, some of Royal Wolf’s unique products are the subject of patent applications only and there is no guarantee that those applications will become effective. If the patent applications do not become effective, there is a risk that Royal Wolf’s competitors could produce similar rival products, which may have an adverse effect on Royal Wolf.
Royal Wolf is subject to foreign exchange rate fluctuations.
Royal Wolf is subject to exchange rate fluctuations, particularly as it sources a substantial portion of its portable container solutions fleet from China in purchases, which are U.S. dollar-denominated. While Royal Wolf has a hedging policy to mitigate this risk, unhedged exchange rate fluctuations in the Australian dollar relative to the U.S. dollar and, to a lesser extent, the New Zealand dollar, may adversely affect the financial performance of Royal Wolf, including its financial position, cash flows, distributions and growth prospects.
Royal Wolf is subject to Australian and New Zealand taxation and tariff regulation.
Significant recent reforms and current proposals for further reforms to tax laws in the jurisdictions within which Royal Wolf operates may give rise to uncertainty. The precise scope and impact of future changes to tax laws may not be known. Royal Wolf is also subject to import tariffs with respect to the portable container products it sources from overseas. Any changes to such tax or tariff laws (including the imposition of, or increases to, such taxes or tariffs), their interpretation or the manner in which they are administered by the relevant government agency or the current rate of company income tax or import tariff may impact the operational or financial performance of Royal Wolf (or customers in its key end markets).
Royal Wolf may face a tightening labor force and is subject to Workplace Health and Safety regulations.
Royal Wolf’s ability to remain productive, profitable and competitive and to effect its planned growth initiatives depends on its ability to attract and retain workers. Tightening of the labor market in key regions due to a shortage of suitably skilled workers may inhibit Royal Wolf’s ability to hire and retain employees. Additionally, rising wages paid to employees may pose a risk to Royal Wolf’s margins if it is unable to pass on such higher costs through price increases. Royal Wolf is also subject to Workplace Health and Safety regulations. If Royal Wolf is not able to maintain its working conditions to meet Workplace Health and Safety regulations it may impact Royal Wolf’s operations and ability to attract and retain workers and also result in contravention of those regulations, which may give rise to potential criminal and civil liability and also damage Royal Wolf’s brand and reputation.
Significant Risks Related Primarily to Our Manufacturing Operations in North America
Demand for our manufacturing products in North America is to a significant degree dependent on the levels of expenditures and drilling activity by the oil and gas industry, primarily in Texas, and can fluctuate significantly in a short period of time. The viability of our manufacturing operations during times of reductions in domestic drilling activity and demand for our portable liquid containment products may be significantly reliant on the commercial success of other steel-based products to industry sectors outside of the oil and gas market.
The substantial downturn in the domestic oil and gas industry since the second quarter of our fiscal year ended June 30, 2015 has resulted in lower expenditures and reduced drilling, which in turn has had a material adverse effect on the results of operations and cash flows of our manufacturing operations in North America. In order to remain commercially viable and diversify outside of the portable liquid containment business, our
I-32
Table of Contents
manufacturing operations have focused on introducing steel-based products for non-oil and gas markets, which include a chassis product line targeted to the North American transportation market, the production of GLOs for the portable storage market, the production of storm shelters for the consumer market, the production of blast-resistant modules for the industrial market and the production of specialty portable fuel tanks for the agricultural market. While we closely monitor the situation and are hopeful of the commercial success of these new steel-based products, there is no assurance that such commercial success or viability will be attained. In FY 2016, operating losses from reduced demand of our portable liquid containment tanks and related products and the manufacturing inefficiencies inherent in the introduction of new product lines resulted in the recording of goodwill and trade name impairment charges. Reference is made to Note 2 of Notes to Consolidated Financial Statements for more information regarding these impairment charges.
Significant competition in the oil and gas industry in which Southern Frac produces its portable liquid containment products may result in its competitors offering new or better products and services or lower prices, which could result in a loss of customers and a decrease in revenues.
The portable liquid storage tank container manufacturing industry is highly competitive. Southern Frac competes with other manufacturers of varying sizes, some of which have substantial financial resources. Manufacturers compete primarily on the quality of their products, customer relationships, service availability and cost. Barriers to entry are low. As a result, it is possible that additional competitors could enter the market at any time. If Southern Frac is unable to successfully compete with other portable liquid storage tank container manufacturers it could lose customers and our revenues may decline.
Seasonality of the portable liquid containment industry may impact future quarterly results.
While the oil and gas industry is extremely volatile, historically, activity may typically decline in our second quarter months of November and December and our third quarter months of January and February. These months may have lower rental activity in parts of the country where inclement weather may delay, or suspend, customer projects. The impact of these delays may be to decrease the number of frac tank containers sold until companies are able to resume their projects when weather improves. These seasonal factors may impact Southern Frac’s future operating results in each fiscal year’s second and third quarters.
Difficulties Associated with Fixed Capacity Levels
Southern Frac’s ability to increase manufacturing capacity may require significant investments in equipment and personnel. To the extent that we make investments to increase manufacturing capacity and demand for our products is not sustained, our results of operations and financial condition may be adversely affected. Conversely, if we choose not to make investments to increase manufacturing capacity, our ability to meet customer demand for our products and increase revenues may be adversely affected. Additionally, operating our facilities at near full capacity levels may cause us to incur labor costs at premium rates in order to meet customer requirements, experience increased maintenance expenses or require us to replace our machinery and equipment on an accelerated basis, each of which could cause our results of operations and financial condition to be adversely affected.
Implementation of Operational Improvements
As part of our ongoing focus on being a low-cost provider of high quality products, we periodically analyze our business to further improve our operations. Our continued analysis may include identifying and implementing opportunities for: (i) further rationalization of manufacturing capacity; (ii) streamlining of selling, general and administrative overhead; or (iii) efficient investment in new equipment and the upgrading of existing equipment. We may be unable to successfully identify or implement plans targeting these initiatives, or fail to realize the benefits of the plans we have already implemented, as a result of operational difficulties, a weakening of the economy or other factors.
Cost reductions may not fully offset decreases in the prices of our products due to the time required to develop and implement cost reduction initiatives. Additional factors, such as inconsistent customer ordering patterns, increasing product complexity and heightened quality standards, may also make it more difficult to reduce our costs. It is also possible that as we incur costs to implement improvement strategies, the initial impact on our financial position, results of operations and cash flow may be adverse and we may not be able to successfully realize sufficient cost savings to mitigate this adverse impact.
Southern Frac’s business could be harmed if we fail to maintain proper inventory levels.
Southern Frac is required to maintain sufficient inventories to accommodate the needs of its customers including, in many cases, short lead times on delivery requirements. We purchase raw materials on a regular basis in an effort to maintain our inventory at levels that we believe are sufficient to satisfy the anticipated needs of our customers based upon orders, customer volume expectations, historic buying practices and market conditions.
I-33
Table of Contents
Inventory levels in excess of customer demand may result in the use of higher-priced inventory to fill orders reflecting lower selling prices, if steel prices have significantly decreased. These events could adversely affect our financial results. Conversely, if we underestimate demand for our products or if our suppliers fail to supply quality products in a timely manner, we may experience inventory shortages. Inventory shortages could result in unfilled orders, negatively impacting our customer relationships and resulting in lost revenues, which could harm our business and adversely affect our financial results.
Southern Frac’s future operating results may be affected by fluctuations in raw material prices, and it may be unable to pass on any increases in raw material costs to its customers.
Southern Frac’s principal raw material is steel. The steel industry as a whole has been cyclical, and at times availability and steel prices can be volatile due to a number of factors beyond our control. These factors include general economic conditions, domestic and worldwide demand, the influence of hedge funds and other investment funds participating in commodity markets, curtailed production from major suppliers due to factors such as the closing or idling of facilities, accidents or equipment breakdowns, repairs or catastrophic events, labor costs or problems, competition, new laws and regulations, import duties, tariffs, energy costs, availability and cost of steel inputs (e.g., ore, scrap, coke and energy), currency exchange rates and other factors. This volatility, as well as any increases in raw material costs, could significantly affect our steel costs and adversely impact our financial results. If our suppliers increase the prices of our critical raw materials, we may not have alternative sources of supply. In addition, in an environment of increasing prices for steel and other raw materials, competitive conditions may impact how much of the price increases we can pass on to our customers. To the extent we are unable to pass on future price increases in our raw materials to customers, our financial results could be adversely affected. Also, if steel prices decrease, competitive conditions may impact how quickly we must reduce our prices to our customers, and we could be forced to use higher-priced raw materials to complete orders for which the selling prices have decreased. Decreasing steel prices could also require us to write-down the value of our inventory to reflect current market pricing.
The loss of key supplier relationships could adversely affect Southern Frac.
Southern Frac has developed relationships with certain steel and other suppliers which have been beneficial to us by providing more assured delivery and a more favorable all-in cost, which includes price and shipping costs. If any of those relationships were disrupted, it could have an adverse effect on delivery times and the overall cost and quality of our raw materials, which could have a negative impact on our business. In addition, we do not have long-term contracts with any of our suppliers. If, in the future, we are unable to obtain sufficient amounts of steel and other products at competitive prices and on a timely basis from our traditional suppliers, we may be unable to obtain these products from alternative sources at competitive prices to meet our delivery schedule, which could have a material adverse effect on our results of operations.
The costs of manufacturing Southern Frac’s products and its ability to supply customers could be negatively impacted if we experience interruptions in deliveries of needed raw materials or supplies.
If, for any reason, Southern Frac’s supply of steel is curtailed or it otherwise is unable to obtain the quantities it needs at competitive prices, our business could suffer and our financial results could be adversely affected. Such interruptions could result from a number of factors, including a shortage of capacity in the supplier base of raw materials, energy or the inputs needed to make steel or other supplies, a failure of suppliers to fulfill their supply or delivery obligations, financial difficulties of suppliers resulting in the closing or idling of supplier facilities, other significant events affecting supplier facilities, significant weather events and other factors, all of which are beyond our control.
A tightening Texas labor force could adversely affect Southern Frac
Southern Frac’s ability to remain productive and competitive depends on its ability to attract and retain workers. Tightening of the labor market in Texas due to a shortage of suitably semi-skilled workers may inhibit Southern Frac’s ability to hire and retain employees. Additionally, rising wages paid to employees may pose a risk to Southern Frac’s margins if it is unable to pass on such higher costs through price increases. These labor factors could have a material adverse effect on our results of operations.
Significant Risks Related Primarily to Our Series C Preferred Stock
We cannot assure that quarterly dividends on, or any other payments in respect of, the Series C Preferred Shares will be made timely or at all.
We cannot assure that we will be able to pay quarterly dividends on the Series C Preferred Shares or to redeem the Series C Preferred Shares, if we wanted to do so. Quarterly dividends on our Series C Preferred Shares will be paid from funds legally available for such purpose when, as and if
I-34
Table of Contents
declared by our board of directors. Certain factors may influence our decision, or adversely affect our ability, to pay dividends on, or make other payments in respect of, our Series C Preferred Shares, including, among other things:
| • | the amount of our available cash or other liquid assets, including the impact of any liquidity shortfalls caused by the below-described restrictions on the ability of our subsidiaries to generate and transfer cash to us; |
| • | our ability to service and refinance our current and future indebtedness; |
| • | changes in our cash requirements to fund capital expenditures, acquisitions or other operational or strategic initiatives; |
| • | our ability to borrow or raise additional capital to satisfy our capital needs; |
| • | restrictions imposed by our existing, or any future, credit facilities, debt securities or leases, including restricted payment and leverage covenants that could limit our ability to make payments to holders of the Series C Preferred Shares; |
| • | limitations on our subsidiaries’ ability to distribute cash to us due to third parties holding equity interests in those subsidiaries; and |
| • | limitations on cash payments to shareholders under Delaware law, including limitations that require dividend payments be made out of surplus or, subject to certain limitations, out of net profits for the then-current or preceding year in the event there is no surplus. |
| • | our ability to maintain a Fixed Charge Ratio, as defined, of no less than 2.00. |
Based on its evaluation of these and other relevant factors, our board of directors may, in its sole discretion, decide not to declare a dividend on the Series C Preferred Shares for any quarterly period for any reason, regardless of whether we have funds legally available for such purpose. In such event, a holder’s sole recourse will be its rights as a holder of Series C Preferred Shares, which includes the right to cumulative dividends and, under certain specified circumstances, to additional interest and limited conditional voting rights.
GFN’s ability, as a holding company, to make payments in respect of the Series C Preferred Shares depends on the ability of our subsidiaries to transfer funds to us.
GFN is a holding company and, accordingly, substantially all of our operations are conducted through our subsidiaries. As a result, GFN’s cash flow and ability to make dividend payments to our stockholders depend on the earnings of our subsidiaries, the distribution from our subsidiaries and compliance with the covenants governing the indebtedness of our subsidiaries, including, without limitation, covenants of the senior credit facilities of our subsidiaries that permit dividends and other payments from such subsidiaries to GFN. Payments by our subsidiaries to GFN are also contingent upon those subsidiaries’ earnings and business considerations. Furthermore, GFN’s right to receive any assets of any of our subsidiaries upon their liquidation, reorganization or otherwise, and thus the ability of a holder of Series C Preferred Stock to benefit indirectly from such distribution, will be subject to the prior claims of the subsidiaries’ creditors.
The terms of the revolving senior secured credit facility with a syndicate led by Wells Fargo Bank, National Association (“Wells Fargo”) limit the ability of our North American Leasing operations to upstream funds to GFN that would be used to pay dividends on the Series C Preferred Stock. If the amount of the dividends payable on the Series C Preferred Stock exceeds the amount of the funds our North American Leasing operations are permitted to pay GFN, and GFN is unable to generate sufficient cash from its other subsidiaries for a dividend payment, GFN may not be able to make the required dividend payment on the Series C Preferred Stock. Our ability to pay dividends or make other payments to the holders of our Series C Preferred Shares will be adversely affected if the senior credit facility prohibits the transfer of funds to GFN.
The Series C Preferred Shares represent perpetual equity interests.
The Series C Preferred Shares represent perpetual equity interests in us and, unlike our indebtedness, will not entitle the holders thereof to receive payment of a principal amount at a particular date. As a result, holders of the Series C Preferred Shares may be required to bear the financial risks of an investment in the Series C Preferred Shares for an indefinite period of time. In addition, the Series C Preferred Shares will rank junior to all our indebtedness and other liabilities, and to any other senior securities we may issue in the future with respect to assets available to satisfy claims against us. In addition, the lack of a fixed mandatory redemption date for the Series C Preferred Shares will increase your reliance on the secondary market for liquidity purposes.
Investors should not expect us to redeem the Series C Preferred Shares on the date the Series C Preferred Shares become redeemable by the Company or on any particular date afterwards.
I-35
Table of Contents
The shares of Series C Preferred Shares have no maturity or mandatory redemption date and are not redeemable at the option of investors under any circumstances. By their terms, the Series C Preferred Shares may be redeemed by us at our option either in whole or in part at any time on or after May 17, 2018. Any decision we may make at any time regarding whether to redeem the Series C Preferred Shares will depend upon a wide variety of factors, including our evaluation of our capital position, our capital requirements and general market conditions at that time. However, investors should not assume that we will redeem the Series C Preferred Shares at any particular time, or at all.
Increases in market interest rates may adversely affect the trading price of our Series C Preferred Shares.
One of the factors that will influence the trading price of our Series C Preferred Shares will be the dividend yield on the Series C Preferred Shares relative to market interest rates. An increase in market interest rates may reduce demand for our Series C Preferred Shares and would likely increase our borrowing costs and potentially decrease funds available for distribution. Accordingly, higher market interest rates could cause the market price of our Series C Preferred Shares to decrease.
The Series C Preferred Shares have not been rated and the lack of a rating may adversely affect the trading price of the Series C Preferred Shares.
We have not sought to obtain a rating for the Series C Preferred Shares, and the shares may never be rated. It is possible, however, that one or more rating agencies might independently determine to assign a rating to the Series C Preferred Shares or that we may elect to obtain a rating of our Series C Preferred Shares in the future. In addition, we may elect to issue other securities for which we may seek to obtain a rating. The market value of the Series C Preferred Shares could be adversely affected if:
| • | any ratings assigned to the Series C Preferred Shares in the future or to other securities we issue in the future are lower than market expectations or are subsequently lowered or withdrawn; |
| • | or ratings for such other securities would imply a lower relative value for the Series C Preferred Shares. |
The interests of holders in the Series C Preferred Shares could be diluted by our issuance of additional shares of preferred stock, including additional Series C Preferred Shares, and by other transactions.
Our charter currently authorizes the issuance of up to one million shares of preferred stock in one or more classes or series, and we will be permitted, without notice to or consent of the holders of Series C Preferred Shares, to issue additional Series C Preferred Shares or other securities that have rights junior to such shares, up to the maximum aggregate number of authorized shares of our preferred stock. The issuance of additional preferred stock on a parity with or senior to our Series C Preferred Shares would dilute the interests of the holders of our Series C Preferred Shares, and any issuance of preferred stock senior to or on a parity with our Series C Preferred Shares or of additional indebtedness could adversely affect our ability to pay dividends on, redeem or pay the liquidation preference on our Series C Preferred Shares. We cannot assure that quarterly dividends on, or any other payments in respect of, the Series C Preferred Shares will be made timely or at all and there are effectively no provisions relating to our Series C Preferred Shares that protect the holders of our Series C Preferred Shares in the event of a highly leveraged or other transaction, including a merger or the sale, lease or conveyance of all or substantially all our assets or business; any of which might adversely affect the holders of our Series C Preferred Shares.
A holder of Series C Preferred Shares has extremely limited voting rights.
Voting rights as a holder of Series C Preferred Shares will be extremely limited. However, in the event that six quarterly dividends, whether consecutive or not, payable on Series C Preferred Shares are in arrears or a listing failure has occurred and is continuing, the holders of Series C Preferred Shares will have the right, voting together as a class with all other classes or series of parity securities upon which like voting rights have been conferred and are exercisable, to elect two additional directors to serve on our board of directors.
The Series C Preferred Shares are not convertible, and purchasers may not realize a corresponding benefit if the trading price of our common stock rises.
The Series C Preferred Shares are not convertible into our common shares and do not have exchange rights or entitled or subject to any preemptive or similar rights. Accordingly, the market value of the Series C Preferred Shares may depend to some degree on, among other things, dividend and interest rates for other securities and other investment alternatives and our actual and perceived ability to make dividend or other payments in respect of our Series C Preferred Shares rather than the trading price of our common stock. In addition, our right to redeem the Series C Preferred Shares on or after May 17, 2018 or in the event of a change in control could impose a ceiling on their value.
I-36
Table of Contents
Significant Risks Related Primarily to Our Senior Notes
The Senior Notes are not rated, and the issuance of a credit rating could adversely affect the market price of the Senior Notes.
At their issuance, the Senior Notes were not rated by any credit rating agency. However, the Senior Notes may subsequently be rated by one or more of the credit rating agencies. If the Senior Notes are rated, the rating could be lower than expected, and such a rating could have an adverse effect on the market price of the Senior Notes. Furthermore, credit rating agencies revise their ratings from time to time and could lower or withdraw any rating issued with respect to the Senior Notes. Any real or anticipated downgrade or withdrawal of any ratings of the Senior Notes could have an adverse effect on the market price or liquidity of the Senior Notes.
Ratings reflect only the views of the issuing credit rating agency or agencies and are not recommendations to purchase, sell or hold any particular security, including the Senior Notes. In addition, ratings do not reflect market prices or suitability of a security for a particular investor, and any future rating of the Senior Notes may not reflect all risks related to us and our business or the structure or market value of the Senior Notes.
We are the sole obligor of the Senior Notes, and our direct and indirect subsidiaries do not guarantee our obligations under the Senior Notes and do not have any obligation with respect to the Senior Notes. Furthermore, your right to receive payment on the Senior Notes will be structurally subordinated to the liabilities of our subsidiaries.
GFN is a holding company with no business operations or assets other than the capital stock of its direct and indirect subsidiaries. Consequently, we will be dependent on loans, dividends and other payments from these subsidiaries to make payments of principal and interest on the Senior Notes. However, our subsidiaries are separate and distinct legal entities, and they will have no obligation, contingent or otherwise, to pay the amounts due under the Senior Notes or to make any funds available to pay those amounts, whether by dividend, distribution, loan or other payments. Holders of the Senior Notes will not have any direct claim on the cash flows or assets of our direct and indirect subsidiaries.
The ability of our subsidiaries to pay dividends and make other payments to us will depend on their cash flows and earnings, which, in turn, will be affected by all of the factors discussed in our Annual Report on Form 10-K. The ability of our direct and indirect subsidiaries to pay dividends and make distributions to us may be restricted by, among other things, applicable laws and regulations and by the terms of the agreements into which they enter. If we are unable to obtain funds from our direct and indirect subsidiaries as a result of restrictions under their debt or other agreements, applicable laws and regulations or otherwise, we may not be able to pay cash interest or principal on the Senior Notes when due.
The Senior Notes are structurally subordinated to all indebtedness of our subsidiaries. While the indenture governing the Senior Notes will limit the indebtedness and activities of these subsidiaries, holders of indebtedness of, and trade creditors of, our subsidiaries, are entitled to payments of their claims from the assets of such subsidiaries before those assets are made available for distribution to us, as direct or indirect shareholder. Accordingly, in the event that any of our subsidiaries becomes insolvent, liquidates or otherwise reorganizes:
| • | the creditors of such subsidiary (including the holders of the Senior Notes) will have no right to proceed against such subsidiary’s assets; and |
| • | the creditors of such subsidiary, including trade creditors, will generally be entitled to payment in full from the sale or other disposal of assets of such subsidiary before we, as direct or indirect stockholder, will be entitled to receive any distributions from such subsidiary. |
GFN’s ability, as a holding company, to make payments in respect of the Senior Notes depends on the ability of our subsidiaries to transfer funds to us.
GFN’s cash flow and ability to make payments in respect of the Senior Notes depends on the earnings of our subsidiaries, the distribution from our subsidiaries and compliance with the covenants governing the indebtedness of our subsidiaries, including, without limitation, covenants of the senior credit facilities of our subsidiaries that permit dividends and other payments from such subsidiaries to GFN. Payments by our subsidiaries to GFN are also contingent upon those subsidiaries’ earnings and business considerations. Furthermore, GFN’s right to receive any assets of any of our subsidiaries upon their liquidation, reorganization or otherwise, and thus the ability of a holder of Senior Notes to benefit indirectly from such distribution, will be subject to the prior claims of the subsidiaries’ creditors.
I-37
Table of Contents
The terms of the revolving senior credit facility with a syndicate led by Wells Fargo limit the ability of our North American Leasing operations to upstream funds to GFN that would be used to pay interest on the Senior Notes. If the amount of the interest payable on the Senior Notes exceeds the amount of the funds our North American Leasing operations are permitted to pay GFN, and GFN is unable to generate sufficient cash from its other subsidiaries for an interest payment, GFN may not be able to make the required interest payment on the Senior Notes. Our ability to pay interest or principal to the holders of our Senior Notes will be adversely affected if the senior credit facility prohibits the transfer of funds to GFN.
We may be unable to repurchase the Senior Notes upon a change of control.
In the event of a “change of control,” as defined in the indenture governing our Senior Notes, we must offer to purchase the Senior Notes at a purchase price equal to 101% of the principal amount, plus accrued and unpaid interest to the date of repurchase. In the event that we are required to make such offer with respect to the Senior Notes, there can be no assurance that we would have sufficient funds available to purchase any Senior Notes, and we may be required to refinance the Senior Notes. There can be no assurance that we would be able to accomplish a refinancing or, if a refinancing were to occur, that it would be accomplished on commercially reasonable terms. The revolving credit facilities of our subsidiaries prohibit us from repurchasing any of the Senior Notes, except under limited circumstances. The revolving credit facilities of our subsidiaries also provide that certain change of control events would constitute a default. In the event a change of control occurs at a time when we are prohibited from purchasing the Senior Notes, we could seek the consent of the lenders under the revolving credit facilities of our U.S. subsidiaries to purchase the Senior Notes. If we did not obtain such consent, we would remain prohibited from purchasing the Senior Notes. In this case, our failure to purchase would constitute an event of default under the indenture governing the Senior Notes.
Changes in the credit markets could adversely affect the market price of the Senior Notes.
The market price for the Senior Notes will be based on a number of factors, including:
| • | the prevailing interest rates being paid by other companies similar to us; and |
| • | and the overall condition of the financial markets. |
The conditions of the credit markets and prevailing interest rates have fluctuated in the past and can be expected to fluctuate in the future. Fluctuations in these factors could have an adverse effect on the price and liquidity of the Senior Notes.
An increase in market interest rates could result in a decrease in the relative value of the Senior Notes.
In general, as market interest rates rise, Senior Notes bearing interest at a fixed rate generally decline in value. Consequently, if you purchase these Senior Notes and market interest rates increase, the market values of your Senior Notes may decline. We cannot predict the future level of market interest rates.
We could enter into various transactions that could increase the amount of our outstanding debt, or adversely affect our capital structure or credit rating, or otherwise adversely affect holders of the Senior Notes.
Subject to certain exceptions relating to incurring certain liens or entering into certain sale and leaseback transactions, the terms of the Senior Notes do not prevent us from entering into a variety of acquisition, divestiture, refinancing, recapitalization or other highly leveraged transactions. As a result, we could enter into any such transaction even though the transaction could increase the total amount of our outstanding indebtedness, adversely affect our capital structure or credit rating or otherwise adversely affect the holders of the Senior Notes.
Redemption may adversely affect your return on the Senior Notes.
We have the right to redeem some or all of the Senior Notes prior to maturity. We may redeem the Senior Notes at times when prevailing interest rates may be relatively low compared to rates at the time of issuance of the Senior Notes. Accordingly, you may not be able to reinvest the redemption proceeds in a comparable security at an effective interest rate as high as that of the Senior Notes.
Item 1B. Unresolved Staff Comments
None.
I-38
Table of Contents
We lease the locations in our North American leasing operations, except for Pac-Van’s corporate offices and two branch locations. Most of the major leased properties have remaining lease terms of at least one year and we believe that satisfactory alternative properties could be found in all of our North American markets, if necessary. The following table shows information about our primary branches and other properties in North America as of June 30, 2018:
|
Location |
Function/Uses |
|||||
| United States: |
||||||
| Albany, GA |
Leasing and sales | |||||
| Atlanta, GA |
Leasing and sales | |||||
| Austin, TX |
Leasing and sales | |||||
| Bakersfield, CA |
Leasing and sales | |||||
| Boston, MA |
Leasing and sales | |||||
| Charleston, WV |
Leasing and sales | |||||
| Charlotte, NC |
Leasing and sales | |||||
| Chicago, IL (owned) |
Leasing and sales | |||||
| Cincinnati, OH |
Leasing and sales | |||||
| Cleveland, OH |
Leasing and sales | |||||
| Columbus, OH |
Leasing and sales | |||||
| Corpus Christi, TX |
Leasing and sales | |||||
| Dallas, TX |
Leasing and sales | |||||
| Denver, CO |
Leasing and sales | |||||
| Des Moines, IA |
Leasing and sales | |||||
| Detroit, MI |
Leasing and sales | |||||
| Elkhart, IN |
Leasing and sales | |||||
| Elko, NV |
Leasing and sales | |||||
| Chino-Los Angeles, CA |
Leasing and sales | |||||
| Green Bay, WI (c) |
Leasing and sales | |||||
| Greenville, SC |
Leasing and sales | |||||
| Houma, LA |
Leasing and sales | |||||
| Houston, TX |
Leasing and sales | |||||
| Indianapolis, IN |
Leasing and sales | |||||
| Indianapolis, IN (owned) |
Corporate office | |||||
| Jacksonville, FL |
Leasing and sales | |||||
| Kansas City, MO |
Leasing and sales | |||||
| Kenedy, TX (a) |
Leasing and sales | |||||
| Kermit, TX (b) |
Leasing and sales | |||||
| Lafayette, LA |
Leasing and sales | |||||
| Las Vegas, NV |
Leasing and sales | |||||
| Lexington, KY |
Leasing and sales | |||||
| Little Rock, AK |
Leasing and sales | |||||
| Louisville, KY |
Leasing and sales | |||||
| Madison, WI |
Leasing and sales | |||||
| Memphis, TN (owned) |
Leasing and sales | |||||
| Miami, FL |
Leasing and sales | |||||
| Milwaukee, WI |
Leasing and sales | |||||
| Nashville, TN |
Leasing and sales | |||||
| New Brunswick (Trenton), NJ |
Leasing and sales | |||||
| Orlando, FL |
Leasing and sales | |||||
| Paducah, KY |
Leasing and sales | |||||
| Philadelphia, PA |
Leasing and sales | |||||
| Phoenix, AZ (c) |
Leasing and sales | |||||
| Pittsburgh, PA |
Leasing and sales | |||||
| Portland, OR |
Leasing and sales | |||||
| Milan, IL (Quad Cities) |
Leasing and sales | |||||
| Raleigh, NC |
Leasing and sales | |||||
| Royalton, VT |
Leasing and sales | |||||
| Salt Lake City, UT |
Leasing and sales |
I-39
Table of Contents
| San Antonio, TX |
Leasing and sales | |||||
| Seattle, WA |
Leasing and sales | |||||
| Springfield, MO |
Leasing and sales | |||||
| St. Louis, MO |
Leasing and sales | |||||
| Toledo, OH |
Leasing and sales | |||||
| Watford City, ND |
Leasing and sales | |||||
| Wichita, KS |
Leasing and sales | |||||
| Yakima, WA |
Leasing and sales | |||||
| Canada: | ||||||
| Edmonton, AB (c) |
Leasing and sales | |||||
| Calgary, AB |
Leasing and sales | |||||
| Vancouver, BC |
Leasing and sales |
| (a) | There is another associated location in Karnes County, TX, but it does not conduct leasing and sales. |
| (b) | There are other associated locations in Goldsmith, Midland and Mentone, TX, but they do not conduct leasing and sales. |
| (c) | There is also a fleet maintenance and modification facility in this market. |
Southern Frac’s 40,000 square foot manufacturing facility located in Waxahachie, Texas is on a 7.4 acre property, which we purchased in December 2012. In addition, Southern Frac has two contiguous leased properties that include administrative offices and warehouse space, as well as additional parking, with lease terms through February 2019 and March 2019 with a three-year renewal option on each lease.
We lease our GFN corporate headquarters in Pasadena, California, effective January 31, 2008, from an affiliate of our former chief executive officer, who is also the executive chairman of the board of directors. The term of the lease is five years, with two five-year renewal options, and the rent is adjusted yearly based on the consumer price index. On October 11, 2012, we exercised the first option to renew the lease for an additional five-year term commencing February 1, 2013 and on August 7, 2017, exercised our second option for an additional five-year term commencing on February 1, 2018. We also lease a small office in Northbrook, Illinois. The term of the lease is through October 31, 2018.
We locate our Asia-Pacific CSCs (or branches) in markets with attractive demographics and strong growth prospects. Within each market, we have located our CSCs in areas that allow for easy delivery of portable storage units to our customers over a wide geographic area. In addition, when cost effective, we seek high visibility locations. Our CSCs maintain an inventory of portable storage units available for lease, and most of our CSCs also provide storage of units under lease at the site (“on-site storage”). Several CSCs have multiple leases of adjoining or contiguous properties and the CSCs are all leased. The following table shows information about our primary CSCs and other properties by country (Australia and New Zealand) at June 30, 2018 and we believe these properties are suitable and adequate:
| Location |
Functions/Uses | |||||
| Australia: |
||||||
| Adelaide |
Leasing, on-site storage and sales | |||||
| Albury |
Leasing, on-site storage and sales | |||||
| Brisbane – Weyba Street Banyo |
Leasing, on-site storage and sales | |||||
| Brisbane – Armada Place Banyo (special projects and modifications) | Leasing and sales (not a CSC) | |||||
| South Brisbane - Meadowbrook |
Leasing, on-site storage and sales | |||||
| Cairns Cairns |
Leasing, on-site storage and sales | |||||
| Canberra |
Leasing, on-site storage and sales | |||||
| Melbourne East – Clayton |
Leasing, on-site storage and sales | |||||
| Melbourne West - Sunshine |
Leasing, on-site storage and sales | |||||
| Darwin |
Leasing, on-site storage and sales | |||||
| Geelong (Vic) |
Leasing, on-site storage and sales | |||||
| Geraldton |
Leasing, on-site storage and sales | |||||
| Gold Coast |
Leasing, on-site storage and sales | |||||
| Gosford – Central Coast |
Leasing, on-site storage and sales | |||||
| Hobart - Tasmania |
Leasing, on-site storage and sales | |||||
| Kalgoorlie (WA) |
Leasing, on-site storage and sales | |||||
| Launceston - Tasmania |
Leasing, on-site storage and sales |
I-40
Table of Contents
| Gordon |
Head office (Not a CSC) | |||||
| Sydney – Moorebank |
Leasing, on-site storage and sales | |||||
| Newcastle |
Leasing, on-site storage and sales | |||||
| Perth – Bassendean |
Leasing, on-site storage and sales | |||||
| Rockhampton |
Leasing, on-site storage and sales | |||||
| Toowoomba |
Leasing, on-site storage and sales | |||||
| Townsville |
Leasing, on-site storage and sales | |||||
| Wollongong |
Leasing, on-site storage and sales | |||||
| New Zealand: |
||||||
| Auckland – Jarvis Way |
Head Office, Leasing, on-site storage and sales | |||||
| Christchurch |
Leasing, on-site storage and sales | |||||
| Dunedin |
Leasing, on-site storage and sales | |||||
| Hamilton |
Leasing, on-site storage and sales | |||||
| Invercargill |
Leasing, on-site storage and sales | |||||
| Napier |
Leasing, on-site storage and sales | |||||
| Nelson |
Leasing, on-site storage and sales | |||||
| Palmerston North |
Leasing, on-site storage and sales | |||||
| Silverdale/Albany |
Leasing, on-site storage and sales | |||||
| Tauranga/Bay of Plenty |
Leasing, on-site storage and sales | |||||
| Wellington |
Leasing, on-site storage and sales | |||||
| Whangarei |
Leasing, on-site storage and sales | |||||
During FY 2018, effective March 31, 2018, Royal Wolf relocated its corporate headquarters from Hornsby to Gordon in New South Wales. The term of the lease is for ten years, including a five-year renewal option, with rent adjusted yearly by 4%.
We are not involved in any material lawsuits or claims arising out of the normal course of our business. We have insurance policies to cover general liability and workers compensation related claims. In our opinion, the ultimate amount of liability not covered by insurance under pending litigation and claims, if any, will not have a material adverse effect on our financial position, operating results or cash flows.
Reference is made to Note 10 of Notes to Consolidated Financial Statements for further discussion of commitments and contingencies, including any legal proceedings.
Item 4. Mine Safety Disclosures
Not applicable.
I-41
Table of Contents
Item 5. Market for Registrant’s Common Equity, Related Stockholder Matters and Issuer Purchases of Equity Securities
Our common stock is listed on The NASDAQ Global Market (NASDAQ) under the symbol “GFN.” The following tables set forth, for the periods indicated, the range of high and low closing sales prices for our common stock.
| Common Stock | ||||||||
| High | Low | |||||||
| Year Ended June 30, 2018: |
||||||||
| Fourth Quarter |
$ | 13.55 | $ | 7.10 | ||||
| Third Quarter |
7.50 | 6.80 | ||||||
| Second Quarter |
6.80 | 5.10 | ||||||
| First Quarter |
5.15 | 4.55 | ||||||
|
|
|
|
|
|||||
| Year Ended June 30, 2017: |
||||||||
| Fourth Quarter |
$ | 5.20 | $ | 4.70 | ||||
| Third Quarter |
5.70 | 4.95 | ||||||
| Second Quarter |
5.60 | 4.00 | ||||||
| First Quarter |
4.67 | 4.20 | ||||||
|
|
|
|
|
|||||
Record Holders
As of August 1, 2018, there were 64 holders of record of our common stock. The number of record holders was determined from the records of our transfer agent and does not include beneficial owners of our common stocks whose shares are held in the names of various security brokers, dealers and registered clearing agencies. We believe that there are thousands of beneficial owners.
Dividend Policy
We have not paid any dividends on our common stock to date. The payment of dividends in the future will be contingent upon our revenues and earnings, if any, capital requirements and general financial condition. The payment of any dividends will be within the discretion of our board of directors. It is the present intention of our board of directors to retain all earnings, if any, for use in our business operations and, accordingly, our board does not anticipate declaring any dividends in the foreseeable future.
Sales of Unregistered Securities
Information required is not applicable or has been previously included in either a Quarterly Report on Form 10-Q or in a Current Report on Form 8-K.
II-1
Table of Contents
Equity Compensation Plans
The following table sets forth information concerning our equity compensation plans (see Note 9 of Notes to Consolidated Financial Statements) as of June 30, 2018:
| Plan category |
(a) Number of securities to be issued upon exercise of outstanding options, warrants and rights |
(b) Weighted-average exercise price of outstanding options, warrants and rights |
(c) Number of securities remaining available for future issuance under equity compensation plans (excluding securities reflected in column (a)) |
|||||||||||||||||||||||||||
| Equity compensation plans approved by security holders |
1,824,910 | $ | 4.52 | 871,160 (i) | ||||||||||||||||||||||||||
| Equity compensation plans not approved by security holders |
— | — | — | |||||||||||||||||||||||||||
|
|
|
|
|
|
|
|||||||||||||||||||||||||
| Total |
1,824,910 | $ | 4.52 | 871,160 (i) | ||||||||||||||||||||||||||
|
|
|
|
|
|
|
|||||||||||||||||||||||||
(i) Reduced by the issuance under the equity compensation plans of 1,293,791 restricted stock units (RSU) and restricted (non-vested equity) and non-restricted shares.
II-2
Table of Contents
Stock Performance Graph
The following Performance Graph and related information shall not be deemed “soliciting material” or “filed” with the SEC, nor should such information be incorporated by reference into any future filings under the Securities Act or the Exchange Act, except to the extent that we specifically incorporate it by reference in such filing.
The following graph compares the five-year cumulative total return on our common stock with the cumulative total returns (assuming reinvestment of dividends) on the Standard and Poor’s (“S&P”) Small Cap 600 Index and the Russell 2000 Index if $100 were invested in our common stock and each index on June 30, 2013.
| Period Ending | ||||||||||||||||||||||||
| Index | 06/30/13 | 06/30/14 | 06/30/15 | 06/30/16 | 06/30/17 | 06/30/18 | ||||||||||||||||||
| General Finance Corporation |
100.00 | 204.30 | 112.26 | 91.40 | 110.75 | 291.40 | ||||||||||||||||||
| Russell 2000 Index |
100.00 | 123.64 | 131.66 | 122.80 | 153.01 | 179.89 | ||||||||||||||||||
| S&P SmallCap 600 Index |
100.00 | 125.54 | 133.97 | 133.93 | 164.02 | 197.65 | ||||||||||||||||||
II-3
Table of Contents
Item 6. Selected Financial Data
The following tables summarize our selected financial data for each of the five years ended June 30, 2018 and should be read in conjunction with the audited consolidated financial statements included in “Item 8 Financial Statements and Supplementary Data” and “Item 7. Management’s Discussion and Analysis of Financial Condition and Results of Operations.”
Consolidated Statement of Operations Information:
|
|
|
|||||||||||||||||||
| Year Ended June 30, | ||||||||||||||||||||
|
|
|
|||||||||||||||||||
| 2014 | 2015 | 2016 | 2017 | 2018 | ||||||||||||||||
|
|
|
|||||||||||||||||||
| Sales: |
||||||||||||||||||||
| Lease inventories and fleet |
$ | 116,448 | $ | 90,275 | $ | 111,439 | $ | 95,764 | $ | 122,467 | ||||||||||
| Manufactured units |
19,647 | 13,981 | 6,179 | 4,895 | 9,850 | |||||||||||||||
|
|
|
|||||||||||||||||||
| 136,095 | 104,256 | 117,618 | 100,659 | 132,317 | ||||||||||||||||
| Leasing |
151,010 | 199,569 | 168,233 | 176,269 | 214,985 | |||||||||||||||
|
|
|
|||||||||||||||||||
| 287,105 | 303,825 | 285,851 | 276,928 | 347,302 | ||||||||||||||||
|
|
|
|||||||||||||||||||
| Operating income |
40,041 | 43,043 | 14,383 | 19,066 | 43,699 | |||||||||||||||
| Other expense, net |
(13,272) | (21,301) | (19,860) | (19,938) | (53,485) | |||||||||||||||
| Income (loss) before provision for income taxes |
26,769 | 21,742 | (5,477) | (872) | (9,786) | |||||||||||||||
| Net income (loss) |
15,149 | 13,045 | (3,286) | (847) | (9,107) | |||||||||||||||
| Net income (loss) attributable to common stockholders |
3,904 | 3,475 | (9,025) | (6,620) | (11,964) | |||||||||||||||
|
|
|
|||||||||||||||||||
| Net income (loss) per common share: |
||||||||||||||||||||
| Basic |
$ | 0.16 | $ | 0.13 | $ | (0.35 | ) | $ | (0.25 | ) | $ | (0.46) | ||||||||
| Diluted |
0.15 | 0.13 | (0.35 | ) | (0.25 | ) | (0.46) | |||||||||||||
|
|
|
|||||||||||||||||||
| Consolidated Balance Sheet Information:
|
| |||||||||||||||||||
|
|
|
|||||||||||||||||||
| June 30, | ||||||||||||||||||||
| 2014 | 2015 | 2016 | 2017 | 2018 | ||||||||||||||||
|
|
|
|||||||||||||||||||
| Trade and other receivables, net |
$ | 61,474 | $ | 47,641 | $ | 38,067 | $ | 44,390 | $ | 50,525 | ||||||||||
| Inventories |
27,402 | 36,875 | 34,609 | 29,648 | 22,731 | |||||||||||||||
| Lease fleet, net |
396,552 | 410,985 | 419,345 | 427,275 | 429,388 | |||||||||||||||
| Total assets |
664,915 | 684,377 | 673,574 | 675,314 | 689,687 | |||||||||||||||
| Trade payables and accrued liabilities |
53,838 | 37,590 | 43,476 | 42,774 | 50,545 | |||||||||||||||
| Senior and other debt |
299,303 | 353,940 | 352,220 | 355,638 | 427,218 | |||||||||||||||
| Total equity |
257,885 | 234,356 | 224,612 | 223,248 | 141,785 | |||||||||||||||
|
|
|
|||||||||||||||||||
II-4
Table of Contents
Selected Unaudited Quarterly Financial Data
The following table sets forth unaudited operating data for each quarter of the years ended June 30, 2018 and June 30, 2017. This quarterly information has been prepared on the same basis as the annual consolidated financial statements and, in the opinion of management, contains all significant adjustments necessary to state fairly the information set forth herein. These quarterly results are not necessarily indicative of future results, growth rates or quarter-to-quarter comparisons.
| First Quarter |
Second Quarter |
Third Quarter |
Fourth Quarter |
|||||||||||||
| (in thousands, except per share data) | ||||||||||||||||
| For the Fiscal Year Ended June 30, 2018: |
||||||||||||||||
| Revenues |
$ | 76,917 | $ | 92,130 | $ | 84,421 | $ | 93,834 | ||||||||
| Gross profit |
6,699 | 10,281 | 7,745 | 10,601 | ||||||||||||
| Operating income |
5,647 | 15,059 | 10,872 | 12,121 | ||||||||||||
| Net income (loss) (a) |
(844) | 2,974 | (563) | (10,674) | ||||||||||||
| Net income (loss) attributable to common stockholders |
(965) | 2,052 | (1,485) | (11,566) | ||||||||||||
|
|
|
|||||||||||||||
| Net income (loss) per common share: |
||||||||||||||||
| Basic |
$ | (0.04) | $ | 0.08 | $ | (0.06) | $ | (0.44) | ||||||||
| Diluted |
(0.04) | 0.08 | (0.06) | (0.44) | ||||||||||||
|
|
|
|||||||||||||||
| For the Fiscal Year Ended June 30, 2017: |
||||||||||||||||
| Revenues |
$ | 62,798 | $ | 72,327 | $ | 68,464 | $ | 73,339 | ||||||||
| Gross profit |
6,222 | 6,795 | 6,183 | 6,908 | ||||||||||||
| Operating income |
3,663 | 7,097 | 3,610 | 4,696 | ||||||||||||
| Net income (loss) |
(744) | 1,370 | (1,071) | (402) | ||||||||||||
| Net loss attributable to common stockholders |
(2,137) | (639) | (2,079) | (1,765) | ||||||||||||
|
|
|
|||||||||||||||
| Net loss per common share: |
||||||||||||||||
| Basic |
$ | (0.08) | $ | (0.02) | $ | (0.08) | $ | (0.07) | ||||||||
| Diluted |
(0.08) | (0.02) | (0.08) | (0.07) | ||||||||||||
|
|
|
|||||||||||||||
(a) Includes pretax charges of $1,717, $504 and $11,498 in the second, third and fourth quarter, respectively, for the change in valuation of a bifurcated derivative in a convertible note (see Note 5 of Notes to Consolidated Financial Statements).
II-5
Table of Contents
Item 7. Management’s Discussion and Analysis of Financial Condition and Results of Operations
The following discussion of our financial condition and results of operations should be read together with the consolidated financial statements and the accompanying notes thereto included elsewhere in this Annual Report on Form 10-K. This discussion includes forward-looking statements that involve risks and uncertainties. Our actual results may differ significantly from those anticipated or discussed in those forward-looking statements as a result of various factors; including, but not limited to, those described in Item 1A. “Risk Factors.”
References to “we,” “us,” “our” or the “Company” refer to General Finance Corporation, a Delaware corporation (“GFN”), and its consolidated subsidiaries. These subsidiaries include GFN U.S. Australasia Holdings, Inc., a Delaware corporation (“GFN U.S.”); GFN Insurance Corporation, an Arizona corporation (“GFNI”); GFN North America Leasing Corporation, a Delaware corporation (“GFNNA Leasing”); GFN North America Corp., a Delaware corporation (“GFNNA”); GFN Realty Company, LLC, a Delaware limited liability company (“GFNRC”); GFN Manufacturing Corporation, a Delaware corporation (“GFNMC”), and its subsidiary, Southern Frac, LLC, a Texas limited liability company (collectively “Southern Frac”); Pac-Van, Inc., an Indiana corporation, and its Canadian subsidiary, PV Acquisition Corp., an Alberta corporation (collectively “Pac-Van”); and Lone Star Tank Rental Inc., a Delaware corporation (“Lone Star”); GFN Asia Pacific Holdings Pty Ltd, an Australian corporation (“GFNAPH”), and its subsidiaries, GFN Asia Pacific Finance Pty Ltd, an Australian corporation (“GFNAPF”), Royal Wolf Holdings Limited, an Australian corporation (“RWH”), and its Australian and New Zealand subsidiaries (collectively, “Royal Wolf”).
Overview
Founded in October 2005, we are a leading specialty rental services company offering portable (or mobile) storage, modular space and liquid containment solutions in these three distinct, but related industries, which we collectively refer to as the “portable services industry.”
We have two geographic areas that include four operating segments; the Asia-Pacific (or Pan-Pacific) area, consisting of Royal Wolf (which leases and sells storage containers, portable container buildings and freight containers in Australia and New Zealand) and North America, consisting of Pac-Van (which leases and sells storage, office and portable liquid storage tank containers, modular buildings and mobile offices), and Lone Star (which leases portable liquid storage tank containers and containment products, as well as provides certain fluid management services, to the oil and gas industry in the Permian and Eagle Ford basins of Texas), which are combined to form our “North American Leasing” operations, and Southern Frac (which manufactures portable liquid storage tank containers and other steel-related products). As of June 30, 2018, our two geographic leasing operations primarily lease and sell their products through 23 customer service centers (“CSCs”) in Australia, 12 CSCs in New Zealand, 57 branch locations in the United States and three branch locations in Canada. At that date, we had 264 and 611 employees and 42,305 and 43,507 lease fleet units in the Asia-Pacific area and North America, respectively.
Our lease fleet is comprised of three distinct specialty rental equipment categories that possess attractive asset characteristics and serve our customers’ on-site temporary needs and applications. These categories match the sectors comprising the portable services industry.
Our portable storage category is segmented into two products: (1) storage containers, which primarily consist of new and used steel shipping containers under International Organization for Standardization (“ISO”) standards, that provide a flexible, low cost alternative to warehousing, while offering greater security, convenience and immediate accessibility; and (2) freight containers, which are designed for transport of products either by road and rail and are only offered in our Asia-Pacific territory.
Our modular space category is segmented into three products: (1) office containers, which are referred to as portable container buildings in the Asia-Pacific, are either modified or specifically manufactured containers that provide self-contained office space with maximum design flexibility. Office containers in the United States are oftentimes referred to as ground level offices (“GLOs”); (2) modular buildings, which provide customers with flexible space solutions and are often modified to customer specifications and (3) mobile offices, which are re-locatable units with aluminum or wood exteriors and wood (or steel) frames on a steel carriage fitted with axles, and which allow for an assortment of “add-ons” to provide convenient temporary space solutions.
Our liquid containment category includes portable liquid storage tanks that are manufactured 500-barrel capacity steel containers with fixed axles for transport. These units are regularly utilized for a variety of applications across a wide range of industries, including refinery, petrochemical and industrial plant maintenance, oil and gas services, environmental remediation and field services, infrastructure building construction, marine services, pipeline construction and maintenance, tank terminal services, waste management, wastewater treatment and landfill services.
II-6
Table of Contents
Results of Operations
Year Ended June 30, 2018 (“FY 2018”) Compared to Year Ended June 30, 2017 (“FY 2017”)
The following compares our FY 2018 results of operations with our FY 2017 results of operations.
Revenues. Revenues increased by $70.4 million, or 25%, to $347.3 million in FY 2018 from $276.9 million in FY 2017. This consisted of increases of $42.5 million, or 26%, in revenues in our North American leasing operations, $22.9 million increase, or 21%, in revenues in the Asia-Pacific area and $5.0 million, or 102%, in manufacturing revenues from Southern Frac. The effect of the average currency exchange rate of the stronger Australian dollar relative to the U.S. dollar in FY 2018 versus FY 2017 enhanced the translation of revenues from the Asia-Pacific area. The average currency exchange rate of one Australian dollar during FY 2018 was $0.7755 U.S. dollar compared to $0.7541 U.S. dollar during FY 2017. In Australian dollars, total revenues in the Asia-Pacific area increased by 18% in FY 2018 from FY 2017.
Excluding Lone Star (doing business solely in the oil and gas sector), total revenues of our North American leasing operations increased by $21.6 million, or 15%, in FY 2018 from FY 2017, primarily in the commercial, construction, industrial, oil and gas, services, mining and government sectors, which increased by an aggregate $19.8 million between the periods, offset somewhat by reductions in primarily the education and retail sectors of $1.6 million. At Lone Star, revenues significantly increased by $20.9 million, or 109%, from $19.1 million in FY 2017 to $40.0 million in FY 2018. The revenue increase in the Asia-Pacific area occurred primarily in the utilities, transportation, construction, mining, retail, wholesale and special events sectors, which increased between the periods by an aggregate $26.6 million, and were partially offset by a total decrease of $5.1 million in the oil and gas and industrials sectors.
Sales and leasing revenues represented 36% and 64% of total non-manufacturing revenues, respectively, in FY 2018, compared to 35% and 65% of total non-manufacturing revenues, respectively in FY 2017.
Non-manufacturing sales during FY 2018 amounted to $122.4 million, compared to $95.7 million during FY 2017; representing an increase of $26.7 million, or 28%. This consisted of increases of $18.9 million, or 39%, in sales in the Asia-Pacific area and $7.8 million, or 16%, in our North American leasing operations. The increase in the Asia-Pacific area was comprised of increases of $17.0 million ($4.4 million decrease due to lower unit sales, $19.9 million increase due to higher average prices and a $1.5 million increase due to foreign exchange movements) in the CSC operations and $1.9 million ($0.5 million increase due to higher unit sales, $1.2 million increase due to higher average prices and a $0.2 million increase due to foreign exchange movements) in the national accounts group, and occurred primarily in the utilities, transportation, construction, mining and retail sectors, which increased between the periods by $21.0 million and was partially offset by a decrease of $2.9 million in the oil and gas and industrial sectors. FY 2018 included four large sales, one in the transportation sector and three in the utilities sector, totaling approximately $16.1 million (approximately AUS$21.1 million); whereas FY 2017 had two large sales, one each in the energy and transportation sectors, totaling $2.7 million (AUS$3.5 million). In Australian dollars, total sales in the Asia-Pacific area increased by 36% in FY 2018 from FY 2017. In our North American leasing operations, the sales increase in FY 2018 from FY 2017 was primarily in the commercial, construction, oil and gas, services and government sectors, which increased by a total of $7.6 million between the periods; offset somewhat by a decrease of $1.8 million in the education and mining sectors. The increase at Southern Frac was due primarily from sales of portable liquid containment tanks, which increased by 354% in FY 2018 from FY 2017, as sales on all other steel-based products decreased by 16% in FY 2018 from FY 2017.
Leasing revenues totaled $215.0 million in FY 2018, an increase of $38.7 million, or 22%, from $176.3 million in FY 2017. This consisted of increases of $34.7 million, or 30%, in North America and $4.0 million, or 7%, in the Asia-Pacific area. In Australian dollars, leasing revenues increased by 4% percent in the Asia-Pacific area in FY 2018 from FY 2017.
In the Asia-Pacific area, average utilization in the retail and the national accounts group operations was 85% and 71%, respectively, during FY 2018, as compared to 84% and 67%, respectively, in FY 2017. The overall average utilization increased to 82% in FY 2018 from 80% in FY 2017; and the average monthly lease rate of containers was AUS$160 in FY 2018 and AUS$158 in FY 2017. The composite average monthly number of units on lease was over 800 higher in FY 2018, as compared to FY 2017. The leasing revenue increase in the Asia-Pacific area occurred primarily in the construction, mining, industrial, transportation, special events and retail sectors, which increased between the periods by $5.8 million, and was partially offset by a decrease of $2.9 million in the oil and gas sector. FY 2017 included a recovery of $2.2 million (AUS$2.8) million from a lease settlement payment made by a former oil and gas customer.
II-7
Table of Contents
In our North American leasing operations, average utilization rates were 77%, 83%, 78%, 82% and 84% and average monthly lease rates were $122, $340, $783, $292 and $767 for storage containers, office containers, frac tank containers, mobile offices and modular units, respectively, during FY 2018; as compared to 75%, 78%, 48%, 78% and 81% and average monthly lease rates were $121, $321, $533, $282 and $774 for storage containers, office containers, frac tank containers, mobile offices and modular units in FY 2017, respectively. The average composite utilization rate was 78% FY 2018 and 73% in FY 2017, and the composite average monthly number of units on lease was over 4,400 higher in FY 2018 as compared to FY 2017. The increase in leasing revenues between the periods was across the board, but primarily in the oil and gas, commercial, construction, industrial and mining sectors, which increased by $33.3 in FY 2018 from FY 2017. Excluding Lone Star, total leasing revenues of our North American leasing operations increased by $13.8 million, or 14%, in FY 2018 from FY 2017.
Cost of Sales. Cost of sales from our lease inventories and fleet (which is the cost related to our sales revenues only and exclusive of the line items discussed below) increased by $19.6 million from $68.2 million during FY 2017 to $87.8 million during FY 2018, and our gross profit percentage from these non-manufacturing sales deteriorated slightly to 28% in FY 2018 from 29% in FY 2017. Cost of sales from our manufactured products totaled $9.2 million in FY 2018, as compared to $6.3 million in FY 2017, resulting in a slight gross profit of $0.7 million in FY 2018 and a gross loss of $1.4 million during FY 2017. The low profitability or loss during both periods was due primarily to the lack of production from our portable liquid containment tanks and other steel-based products. A greater amount of portable liquid containment tanks were sold out of inventory in FY 2018, as compared to FY 2017, and because these units had been written down to net realizable value, the gross profit effect was minimal despite the increase in sales between the periods. In addition, production levels on all other steel-based products decreased by 43% in FY 2018 from FY 2017.
Direct Costs of Leasing Operations and Selling and General Expenses. Direct costs of leasing operations and selling and general expenses increased in the aggregate by $22.9 million from $144.0 million during FY 2017 to $166.9 million during FY 2018. As a percentage of revenues, however, these costs decreased to 48% during FY 2018 from 52% in FY 2017 due to the higher revenues being primarily driven by increases in average units on lease and average lease rates between the periods in both North America and the Asia-Pacific area, without a proportionate increase in infrastructure costs.
Depreciation and Amortization. Depreciation and amortization increased slightly by $0.5 million to $39.8 million in FY 2018 from $39.3 million in FY 2017, substantially all in the Asia-Pacific, which increased by $0.4 million and included the translation effect of a stronger Australian dollar to the U.S. dollar in FY 2018 versus FY 2017. Depreciation and amortization in our North American operations increased by only $0.1 million in FY 2018 from FY 2017.
Interest Expense. Interest expense of $34.0 million in FY 2018 increased by $14.3 million from $19.7 million in FY 2017. In the Asia-Pacific area, the significantly higher interest expense between the periods of $12.1 million was due primarily to a higher weighted-average interest rate of 10.1% (which does not include the effect of translation, interest rate swap contracts and options, the accretion of interest and the amortization of deferred financing costs) in FY 2018 from the 5.0% in FY 2017, higher average borrowings and by a stronger Australian dollar between the periods. In North America, the higher interest expense of $2.2 million between the periods was due primarily to the weighted-average interest rate of 6.2% (which does not include the effect of the accretion of interest and amortization of deferred financing costs) in FY 2018 being higher than the 5.3% in FY 2017.
Change in Valuation of Bifurcated Derivative. FY 2018 includes a non-cash charge of $13.7 million for the loss on the change in the valuation of the stand-alone bifurcated derivative in the Bison Capital Convertible Note (see Note 5 of Notes to Consolidated Financial Statements).
Foreign Exchange and Other. The currency exchange rate of one Australian dollar to one U.S. dollar was $0.74425 at June 30, 2016, $0.76869 at June 30, 2017 and $0.7411 at June 30, 2018. In FY 2017 and FY 2018, net unrealized and realized foreign exchange gains (losses) totaled $(375,000) and $(39,000), and $(6,138,000) and $(451,000), respectively. In addition, in FY 2017 and FY 2018, net unrealized exchange gains (losses) on forward exchange contracts totaled $(12,000) and $697,000, respectively.
Income Taxes. Our income tax provision for FY 2018, which derived an effective tax rate of 6.9%, was comprised of:
(i) A charge of $0.8 million, primarily as a result of the nondeductible expense of the change in valuation of the bifurcated derivative in the Bison Capital Convertible Note (see Note 5 of Notes to Consolidated Financial Statements);
(ii) As a result of the enactment on December 22, 2017 of the Act, a tax benefit of $1.6 million for, among other things, the re-measurement of approximately $7.0 million for our estimated deferred tax assets and liabilities for temporary differences and NOL and FTC carryforwards reasonably estimated to be existing at December 22, 2017, and from the current statutory rate of 35% to the new corporate rate of either 28% (if the temporary timing differences are expected to roll off in FY 2018) or 21 percent (if the temporary timing differences and NOL carryforwards are expected to
II-8
Table of Contents
remain as of June 30, 2018). This estimated tax benefit was offset by approximately $4.8 million for the estimated transition tax on the mandatory repatriation of accumulated foreign earnings and a $0.3 million valuation allowance that was established to offset previously recognized FTC carryforward deferred tax assets that we believe will not be realized, and other adjustments totaling approximately $0.3 million (see Note 2 of Notes to Consolidated Financial Statements); and
(iii) A net tax charge of $0.1 million for the net of excess tax benefits and forfeitures on equity compensation awards (see Note 2 of Notes to Consolidated Financial Statements).
The effective income tax rate in FY 2017 was 40.0% and in both periods, the effective tax rate differs from the U.S. federal tax rate of 28% in FY 2018 and 35% in FY 2017 primarily because of state income taxes from the filing of tax returns in multiple U.S. states and the effect of doing business and filing income tax returns in foreign jurisdictions; including some large nondeductible permanent differences in the Asia Pacific area, primarily the valuation of the embedded derivative.
Preferred Stock Dividends. In both FY 2018 and FY 2017, we paid $3.7 million primarily on our 9.00% Series C Cumulative Redeemable Perpetual Preferred Stock.
Noncontrolling Interests. Noncontrolling interests in the Royal Wolf and, in FY 2017, Southern Frac results of operations were a decrease of $0.8 million to the net loss in FY 2018 and an increase to the net loss of $2.1 million in FY 2017.
Net Loss Attributable to Common Stockholders. Net loss attributable to common stockholders was $12.0 million in FY 2018 versus a net loss of $6.6 million in FY 2017, an increase of approximately $5.4 million, primarily as a result of the non-cash charge of $13.7 million for the change in the valuation of the stand-alone bifurcated derivative in the Bison Capital Convertible Note and higher interest expense; offset somewhat by higher operating profit in both North America and the Asia-Pacific area.
FY 2017 Compared to Year Ended June 30, 2016 (“FY 2016”)
The following compares our FY 2017 results of operations with our FY 2016 results of operations.
Revenues. Revenues decreased $9.0 million, or 3%, to $276.9 million in FY 2017 from $285.9 million in FY 2016. This consisted of a $3.8 million increase, or 2%, in revenues in our North American leasing operations; which were more than offset by decreases of $11.6 million, or 10%, in revenues in the Asia-Pacific area and $1.2 million, or approximately 20%, in manufacturing revenues from Southern Frac. The effect of the average currency exchange rate of the stronger Australian dollar relative to the U.S. dollar in FY 2017 versus FY 2016 enhanced the translation of revenues from the Asia-Pacific area. The average currency exchange rate of one Australian dollar during FY 2017 was $0.7541 U.S. dollar compared to $0.7287 U.S. dollar during FY 2016. As a result, FY 2017 total revenues in the Asia-Pacific area were impacted by an approximately 3% favorable foreign exchange translation effect when compared to FY 2016. In Australian dollars, total revenues in the Asia-Pacific area decreased by 13% in FY 2017 from FY 2016.
Excluding Lone Star (doing business solely in the oil and gas sector), total revenues of our North American leasing operations increased by $8.1 million, or 6%, in FY 2017 from FY 2016, primarily in the commercial, industrial, government, mining and education sectors, which increased by an aggregate $18.0 million between the periods; and was partially offset by reductions in the oil and gas, services, construction and retail sectors totaling $10.0 million. At Lone Star, revenues declined by $4.3 million, or 18%, from $23.4 million in FY 2016 to $19.1 million in FY 2017. The revenue decrease in the Asia-Pacific area occurred primarily in the transportation, oil and gas and consumer sectors, which decreased between the periods by $13.8 million, and was partially offset by an increase of $1.8 million in the construction sector.
Sales and leasing revenues represented 35% and 65% of total non-manufacturing revenues, respectively, in FY 2017, compared to 40% and 60% of total non-manufacturing revenues, respectively in FY 2016.
Sales during FY 2017 amounted to $100.6 million, compared to $117.6 million during FY 2016; representing a decrease of $17.0 million, or 14%. This consisted of a $15.4 million decrease, or 24%, in sales in the Asia-Pacific area, a decrease of $0.4 million, or 1%, in our North American leasing operations and a decrease in manufacturing sales of $1.2 million at Southern Frac. The decrease in the Asia-Pacific area was comprised of a decrease of $2.3 million ($2.6 million decrease due to lower unit sales, $1.0 million decrease due to lower average prices and a $1.3 million increase due to foreign exchange movements) in the CSC operations and a decrease of $13.1 million ($9.9 million decrease due to lower unit sales, $3.4 million decrease due to lower average prices and a $0.2 million increase due to foreign exchange movements) in the national accounts group, and occurred primarily in transportation, construction, oil and gas, consumer and moving and storage sectors, which decreased between the periods by $17.3 million; offset somewhat by increases in the mining and industrial sectors totaling $2.5 million. FY 2016 included several low-margin sales in the transportation
II-9
Table of Contents
sector in the Asia-Pacific area totaling approximately $14.0 million (approximately AUS$19.4 million), whereas FY 2017 had two large sales, one each in the energy and transportation sectors, totaling $2.7 million (AUS$3.5 million). In Australian dollars, total sales in the Asia-Pacific area decreased by 27% in FY 2017 from FY 2016. In our North American leasing operations, the sales decrease in FY 2017 from FY 2016 was primarily in the services, construction and oil and gas sectors, which decreased by a total of $9.4 million between the periods; offset somewhat by increases in primarily the commercial, industrial, government and mining sectors, which increased by over $9.0 million. The decrease at Southern Frac was due to the continued low demand for our portable liquid containment tanks caused by soft oil and gas drilling activity, primarily in Texas. Sales at Southern Frac in both periods were primarily from chassis and other steel-based product lines.
Leasing revenues totaled $176.3 million in FY 2017, an increase of $8.0 million, or 3%, from $168.3 million in FY 2016. This consisted of increases of $3.8 million, or 7%, in the Asia-Pacific area, and $4.2 million, or 4%, in North America. In Australian dollars, leasing revenues increased by 3% in the Asia-Pacific area in FY 2017 from FY 2016.
In the Asia-Pacific area, average utilization in the retail and the national accounts group operations was 84% and 67%, respectively, during FY 2017, as compared to 83% and 68%, respectively, in FY 2016. The overall average utilization was 80% during both periods; and the average monthly lease rate of containers was AUS$158 in FY 2017 versus AUS$159 in FY 2016, caused primarily by a lower average lease rate in portable container buildings between the periods. Leasing revenues in FY 2017 increased from FY 2016 despite the lower composite monthly lease rate between the periods primarily because of the composite average monthly number of units on lease was approximately 600 higher in FY 2017 as compared to FY 2016, and a stronger Australian dollar between the periods . Leasing revenues increased in most sectors, but primarily in construction, transportation and special events, which increased by a total of $4.8 million between the periods; offset somewhat by decreases of an aggregate $2.1 million in the mining and industrial sectors.
In our North American leasing operations, average utilization rates were 75%, 78%, 48%, 78% and 81% and average monthly lease rates were $121, $321, $533, $282 and $774 for storage containers, office containers, frac tank containers, mobile offices and modular units, respectively, during FY 2017; as compared to 74%, 80%, 43%, 76% and 81% and average monthly lease rates were $121, $317, $699, $278 and $772 for storage containers, office containers, frac tank containers, mobile offices and modular units in FY 2016, respectively. The average composite utilization rate was 73% FY 2017 and 71% in FY 2016, and the composite average monthly number of units on lease was over 3,200 higher in FY 2017 as compared to FY 2016. The increase in leasing revenues between the periods was primarily in the commercial, construction and industrial sectors, which increased by $9.4 in FY 2017 from FY 2016; offset somewhat by decreases in FY 2017 from FY 2016 in the oil and gas and retail sectors totaling $6.3 million. Excluding Lone Star, total leasing revenues of our North American leasing operations increased by $8.5 million, or 10%, in FY 2017 from FY 2016.
Cost of Sales. Cost of sales from our lease inventories and fleet (which is the cost related to our sales revenues only and exclusive of the line items discussed below) decreased by $14.5 million from $82.7 million during FY 2016 to $68.2 million during FY 2017, and our gross profit percentage from these non-manufacturing sales improved to 29% in FY 2017 from 26% in FY 2016, primarily as a result of the low-margin sales in the Asia-Pacific area in FY 2016 discussed above. Cost of sales from our manufactured products totaled $6.3 million in FY 2017, as compared to $10.1 million in FY 2016, resulting in reducing our gross margin loss from $3.9 million in FY 2016 to $1.4 million in FY 2017. The loss incurred during both periods was due primarily to the lack of production and sales volume from our portable liquid containment tanks and other steel-based products, primarily chassis.
Direct Costs of Leasing Operations and Selling and General Expenses. Direct costs of leasing operations and selling and general expenses increased by $6.2 million from $137.8 million during FY 2016 to $144.0 million during FY 2017. As a percentage of revenues, these costs increased to 52% during FY 2017 from 48% in FY 2016 due to operating expenses not proportionately decreasing with lower revenues, primarily as a result of the adverse effect of lower lease rates between the periods in the oil and gas market in North America, the overall lower average lease rate in the Asia-Pacific area and the beneficial effect on the percentage of the higher revenues in FY 2016 from the low-margin sales in the Asia-Pacific area discussed above.
Impairment of Goodwill. In FY 2016, we recognized a non-cash impairment charge of $2.7 million to the goodwill recorded in our North American manufacturing operations as a result of the Southern Frac acquisition. Reference is made to Note 2 of Notes to Condensed Consolidated Financial Statements for further discussion regarding goodwill.
Depreciation and Amortization. Depreciation and amortization increased by $1.5 million to $39.3 million in FY 2017 from $37.8 million in FY 2016. This consisted of an increase of $2.3 million in the Asia-Pacific, or 16%, primarily as a result of the translation effect of a stronger Australian
II-10
Table of Contents
dollar to the U.S. dollar in FY 2017 versus FY 2016 (in Australian dollars, depreciation and amortization increased by 12%); which offset somewhat by a $0.8 million decrease in North America, consisting of decreases at Lone Star and Southern Frac of $0.8 million and $0.4 million, respectively, and a $0.4 million increase at Pac-Van, primarily as a result of our increased investment in lease fleet purchases and business acquisitions.
Interest Expense. Interest expense of $19.7 million in FY 2017 was comparable to FY 2016. In North America, the higher interest expense of $1.4 million was due to the weighted-average interest rate of 5.3% (which does not include the effect of the accretion of interest and amortization of deferred financing costs) in FY 2017 being higher than the 4.9% in FY 2016, as well as the average borrowings being comparatively higher between the periods. In the Asia-Pacific area, reduced interest expense of $1.4 million was due to the weighted-average interest rate of 5.0% (which does not include the effect of translation, interest rate swap contracts and options and the amortization of deferred financing costs) in FY 2017 being lower than the 5.4% in FY 2016, as well as average borrowings being comparatively lower between the periods. However, this was partially offset by the stronger Australian dollar between the periods.
Foreign Exchange and Other. The currency exchange rate of one Australian dollar to one U.S. dollar was $0.7658 at June 30, 2015, $0.74425 at June 30, 2016 and $0.76869 at June 30, 2017. In FY 2016 and FY 2017, net unrealized and realized foreign exchange gains (losses) totaled $(103,000) and $80,000, and $(375,000) and $39,000, respectively. In addition, in FY 2016 and FY 2017, unrealized exchange losses on forward exchange contracts totaled $367,000 and $12,000, respectively. In FY 2016, we sold our owned real properties in the Asia-Pacific area for a net gain of $109,000.
Income Taxes. Our effective income tax rate was 2.9% and 40.0% in FY 2017 and FY 2016, respectively. In FY 2016, the effective tax rate is greater than the U.S. federal tax rate of 35% primarily because of state income taxes from the filing of tax returns in multiple U.S. states and the effect of doing business and filing income tax returns in foreign jurisdictions. In FY 2017, the effective tax rate is lower than the U.S. federal tax rate primarily as a result of adjustments to estimated state deferred tax liabilities, net of U.S. federal tax benefit, totaling $297,000, which more than offset the same multijurisdictional factors present in FY 2016.
Preferred Stock Dividends. In both FY 2017 and FY 2016, we paid $3.7 million primarily on our 9.00% Series C Cumulative Redeemable Perpetual Preferred Stock.
Noncontrolling Interests. Noncontrolling interests in the Royal Wolf and Southern Frac results of operations were approximately $2.1 million in both FY 2017 and FY 2016.
Net Loss Attributable to Common Stockholders. Net loss attributable to common stockholders was $6.6 million in FY 2017 versus $9.0 million in FY 2016, an improvement of $2.4 million, primarily as a result of higher operating profit in North America (FY 2016 included a pretax impairment charge of $2.7 million) and a stronger Australian dollar between the periods, offset somewhat by lower operating profit in the Asia-Pacific area.
II-11
Table of Contents
Measures not in Accordance with Generally Accepted Accounting Principles in the United States (“U.S. GAAP”)
Earnings before interest, income taxes, impairment, depreciation and amortization and other non-operating costs and income (“EBITDA”) and adjusted EBITDA are supplemental measures of our performance that are not required by, or presented in accordance with, U.S. GAAP. These measures are not measurements of our financial performance under U.S. GAAP and should not be considered as alternatives to net income, income from operations or any other performance measures derived in accordance with U.S. GAAP or as an alternative to cash flow from operating, investing or financing activities as a measure of liquidity. Adjusted EBITDA is a non-U.S. GAAP measure. We calculate adjusted EBITDA to eliminate the impact of certain items we do not consider to be indicative of the performance of our ongoing operations. You are encouraged to evaluate each adjustment and whether you consider each to be appropriate. In addition, in evaluating adjusted EBITDA, you should be aware that in the future, we may incur expenses similar to the expenses excluded from our presentation of adjusted EBITDA. Our presentation of adjusted EBITDA should not be construed as an inference that our future results will be unaffected by unusual or non-recurring items. We present adjusted EBITDA because we consider it to be an important supplemental measure of our performance and because we believe it is frequently used by securities analysts, investors and other interested parties in the evaluation of companies in our industry, many of which present EBITDA and a form of adjusted EBITDA when reporting their results. Adjusted EBITDA has limitations as an analytical tool, and should not be considered in isolation, or as a substitute for analysis of our results as reported under U.S. GAAP. Because of these limitations, adjusted EBITDA should not be considered as a measure of discretionary cash available to us to invest in the growth of our business or to reduce our indebtedness. We compensate for these limitations by relying primarily on our U.S. GAAP results and using adjusted EBITDA only supplementally. The following table shows our adjusted EBITDA and the reconciliation from net income (in thousands):
| Year Ended June 30, | ||||||||||||||||||||
|
|
|
|||||||||||||||||||
| 2014 | 2015 | 2016 | 2017 | 2018 | ||||||||||||||||
|
|
|
|||||||||||||||||||
| Net income (loss) |
$ | 15,149 | $ | 13,045 | $ | (3,286) | $ | (847) | $ | (9,107) | ||||||||||
| Add — |
||||||||||||||||||||
| Provision (benefit) for income taxes |
11,620 | 8,697 | (2,191) | (25) | (679) | |||||||||||||||
| Loss on change in valuation of bifurcated derivative in Convertible Note |
— | — | — | — | 13,719 | |||||||||||||||
| Foreign exchange and other |
1,372 | 273 | 309 | 351 | 5,887 | |||||||||||||||
| Interest expense |
11,952 | 21,096 | 19,648 | 19,653 | 33,991 | |||||||||||||||
| Interest income |
(52) | (68) | (97) | (66) | (112) | |||||||||||||||
| Depreciation and amortization |
27,127 | 38,571 | 38,634 | 40,092 | 40,335 | |||||||||||||||
| Impairment of goodwill and trade name |
— | — | 3,068 | — | — | |||||||||||||||
| Share-based compensation expense |
1,938 | 2,174 | 2,388 | 1,374 | 3,658 | |||||||||||||||
| Expenses of postponed public equity offering |
— | 365 | — | — | — | |||||||||||||||
| Inventory write-downs and related |
— | — | 1,630 | — | — | |||||||||||||||
| Non-recurring severance costs and CEO retirement compensation at Royal Wolf |
— | — | 727 | — | — | |||||||||||||||
| Refinancing costs not capitalized |
— | — | — | 437 | — | |||||||||||||||
|
|
|
|||||||||||||||||||
| Adjusted EBITDA |
$ | 69,106 | $ | 84,153 | $ | 60,830 | $ | 60,969 | $ | 87,692 | ||||||||||
|
|
|
|||||||||||||||||||
Our business is capital intensive, so from an operating level we focus primarily on EBITDA and adjusted EBITDA to measure our results. These measures provide us with a means to track internally generated cash from which we can fund our interest expense and fleet growth objectives. In managing our business, we regularly compare our adjusted EBITDA margins on a monthly basis. As capital is invested in our established branch (or CSC) locations, we achieve higher adjusted EBITDA margins on that capital than we achieve on capital invested to establish a new branch, because our fixed costs are already in place in connection with the established branches. The fixed costs are those associated with yard and delivery equipment, as well as advertising, sales, marketing and office expenses. With a new market or branch, we must first fund and absorb the start-up costs for setting up the new branch facility, hiring and developing the management and sales team and developing our marketing and advertising programs. A new branch will have low adjusted EBITDA margins in its early years until the number of units on rent increases. Because of our higher operating margins on incremental lease revenue, which we realize on a branch-by-branch basis, when the branch achieves leasing revenues sufficient to cover the branch’s fixed costs, leasing revenues in excess of the break-even amount produce large increases in profitability and adjusted EBITDA margins. Conversely, absent significant growth in leasing revenues, the adjusted EBITDA margin at a branch will remain relatively flat on a period by period comparative basis.
II-12
Table of Contents
Liquidity and Financial Condition
Though we have raised capital at the corporate level to primarily assist in the funding of acquisitions and lease fleet expenditures, as well as for general purposes, our operating units substantially fund their operations through secured bank credit facilities that require compliance with various covenants. These covenants require our operating units to, among other things; maintain certain levels of interest or fixed charge coverage, EBITDA (as defined), utilization rate and overall leverage.
Asia-Pacific Leasing Senior Credit Facility
Our operations in the Asia-Pacific area had an AUS$150,000,000 secured senior credit facility, as amended, under a common terms deed arrangement with the Australia and New Zealand Banking Group Limited (“ANZ”) and Commonwealth Bank of Australia (“CBA”) (the “ANZ/CBA Credit Facility”). On October 26, 2017, RWH and its subsidiaries, Deutsche Bank AG, Sydney Branch (“Deutsche Bank”), CSL Fund (PB) Lux Sarl II, Aiguilles Rouges Lux Sarl II, Perpetual Corporate Trust Limited and P.T. Limited entered into a Syndicated Facility Agreement (the “Syndicated Facility Agreement”). Pursuant to the Syndicated Facility Agreement, the parties entered into a three-year, $92,637,500 (AUS$125,000,000) senior secured credit facility (the “Deutsche Bank Credit Facility”) and repaid the ANZ/CBA Credit Facility on November 3, 2017. The Deutsche Bank Credit Facility initially consisted of a $14,822,000 (AUS$20,000,000) Facility A that will amortize semi-annually; a $62,993,500 (AUS$85,000,000) Facility B that has no scheduled amortization; and a $14,822,000 (AUS$20,000,000) revolving Facility C that is used for working capital, capital expenditures and general corporate purposes. On June 25, 2018, RWH and its subsidiaries amended the Deutsche Bank Credit Facility to increase by approximately $6,784,700 (NZ$10,000,000) the amount that can be borrowed under Facility B. The Deutsche Bank Credit Facility is secured by substantially all of the assets and by the pledge of all the capital stock of the subsidiaries of RWH and matures on November 3, 2020.
Bison Capital Notes
On September 19, 2017, Bison Capital, GFN, GFN U.S., GFNAPH and GFNAPF, entered into that certain Amended and Restated Securities Purchase Agreement dated September 19, 2017 (the “Amended Securities Purchase Agreement”). On September 25, 2017, pursuant to the Amended Securities Purchase Agreement, GFNAPH and GFNAPF issued and sold to Bison an 11.9% secured senior convertible promissory note dated September 25, 2017 in the original principal amount of $26,000,000 (the “Convertible Note”) and an 11.9% secured senior promissory note dated September 25, 2017 in the original principal amount of $54,000,000 (the “Senior Term Note” and collectively with the Convertible Note, the “Bison Capital Notes”). Net proceeds from the sale of the Bison Capital Notes were used to repay in full all principal, interest and other amounts due under the term loan to Credit Suisse (see Note 5 of Notes to Consolidated Financial Statements), to acquire the 49,188,526 publicly-traded shares of RWH not owned by the Company (see Note 4 of Notes to consolidated Financial Statements) and to pay all related fees and expenses. The Bison Capital Notes have a maturity of five years and are secured by a first priority security interest over all of the assets of GFN U.S., GFNAPH and GFNAPF, by the pledge by GFN U.S. of the capital stock of GFNAPH and GFNAPF and by of all of the capital stock of RWH.
North America Senior Credit Facility
Our North America leasing (Pac-Van and Lone Star) and manufacturing operations (Southern Frac) have a combined $237,000,000 senior secured revolving credit facility, as amended, with a syndicate led by Wells Fargo Bank, National Association (“Wells Fargo”) that also includes East West Bank, CIT Bank, N.A., the Canadian Imperial Bank of Commerce (“CIBC”), KeyBank, National Association, Bank Hapoalim B.M. and Associated Bank, N.A. (the “Wells Fargo Credit Facility”). The Wells Fargo Credit Facility matures on March 24, 2022, assuming our publicly-traded senior notes due July 31, 2021(see below) are extended at least 90 days past this scheduled maturity date; otherwise the Wells Fargo Credit Facility would mature on March 24, 2021. There is also a separate loan agreement with Great American Capital Partners (“GACP”), where GACP provided a First In Last Out Term Loan (”FILO Term Loan”) within the Wells Fargo Credit Facility in the amount of $20,000,000, and inclusive in the $237,000,000 total amount.
The Wells Fargo Credit Facility is secured by substantially all of the rental fleet, inventory and other assets of our North American leasing and manufacturing operations. The FILO Term Loan also contains a first priority lien on the same collateral, but on a “last out basis,” after all of the outstanding obligations to the primary lenders in the Wells Fargo Credit Facility have been satisfied. The Wells Fargo Credit Facility effectively not only finances our North American operations, but also the funding requirements for the Series C Preferred Stock and the publicly-traded unsecured senior notes (see below). The maximum amount of intercompany dividends that Pac-Van and Lone Star are allowed to pay in each fiscal year to GFN for the funding requirements of GFN’s senior and other debt and the Series C Preferred Stock are (a) the lesser of $5,000,000 for the Series C Preferred Stock or the amount equal to the dividend rate of the Series C Preferred Stock and its aggregate liquidation preference and the actual amount of dividends required to be paid to the Series C Preferred Stock; and (b) $6,300,000 for the public offering of unsecured senior notes or the actual amount
II-13
Table of Contents
of annual interest required to be paid; provided that (i) the payment of such dividends does not cause a default or event of default; (ii) each of Pac-Van and Lone Star is solvent; (iii) excess availability, as defined, is $5,000,000 or more under the Wells Fargo Credit Facility; (iv) the fixed charge coverage ratio, as defined, will be greater than 1.25 to 1.00; and (v) the dividends are paid no earlier than ten business days prior to the date they are due.
Corporate Senior Notes
On June 18, 2014, we completed the sale of unsecured senior notes (the “Senior Notes”) in a public offering for an aggregate principal amount of $72,000,000. On April 24, 2017, we completed the sale of a “tack-on” offering of our publicly-traded Senior Notes for an aggregate principal amount of $5,390,000 that was priced at $24.95 per denomination. Net proceeds were $5,190,947, after deducting an aggregate original issue discount (“OID”) of $10,780 and underwriting discount of $188,273. In both offerings, we used at least 80% of the gross proceeds to reduce indebtedness at Pac-Van and Lone Star under the Wells Fargo Credit Facility in order to permit the payment of intercompany dividends by Pac-Van and Lone Star to GFN to fund the interest requirements of the Senior Notes. For the ‘tack-on” offering, this amounted to $4,303,376 of the net proceeds. The Company has total outstanding publicly-traded Senior Notes in an aggregate principal amount of $77,390,000. The Senior Notes bear interest at the rate of 8.125% per annum, mature on July 31, 2021 and are not subject to any sinking fund. Interest on the Senior Notes is payable quarterly in arrears on January 31, April 30, July 31 and October 31, commencing on July 31, 2014. The Senior Notes rank equally in right of payment with all of our existing and future unsecured senior debt and senior in right of payment to all of its existing and future subordinated debt. The Senior Notes are effectively subordinated to any of our existing and future secured debt, to the extent of the value of the assets securing such debt. The Senior Notes are structurally subordinated to all existing and future liabilities of our subsidiaries and are not guaranteed by any of our subsidiaries.
Reference is made to Notes 3 and 5 of Notes to Consolidated Financial Statements for further discussion of our equity transactions and senior and other debt, respectively, and Note 13 for a discussion of recent developments.
We currently do not pay a dividend on our common stock and do not intend on doing so in the foreseeable future.
Capital Deployment and Cash Management
Our business is capital intensive, and we acquire leasing assets before they generate revenues, cash flow and earnings. These leasing assets have long useful lives and require relatively minimal maintenance expenditures. Most of the capital we deploy into our leasing business historically has been used to expand our operations geographically, to increase the number of units available for lease at our branch and CSC locations and to add to the breadth of our product mix. Our operations have generally generated annual cash flow which would include, even in profitable periods, the deferral of income taxes caused by accelerated depreciation that is used for tax accounting.
As we discussed above, our principal source of capital for operations consists of funds available from the senior secured credit facilities at our operating units. We also finance a smaller portion of capital requirements through finance leases and lease-purchase contracts. We intend to continue utilizing our operating cash flow and net borrowing capacity primarily to expanding our container sale inventory and lease fleet through both capital expenditures and accretive acquisitions; as well as paying dividends on the Series C Preferred Stock and 8.00% Series B Cumulative Preferred Stock (“Series B Preferred Stock”), if and when declared by our Board of Directors. While we have always owned a majority interest in Royal Wolf and its results and accounts are included in our consolidated financial statements, access to its operating cash flows, cash on hand and other financial assets and the borrowing capacity under its senior credit facility are limited to us in North America contractually by its senior lenders and, to a certain extent, as a result of Royal Wolf having been a publicly-listed entity on the Australian Stock Exchange.
Supplemental information pertaining to our consolidated sources and uses of cash is presented in the table below (in thousands):
| Year Ended June 30, | ||||||||||||
|
|
|
|||||||||||
| 2016 | 2017 | 2018 | ||||||||||
|
|
|
|||||||||||
| Net cash provided by operating activities |
$ | 48,822 | $ | 35,307 | $ | 58,775 | ||||||
|
|
|
|||||||||||
| Net cash used in investing activities |
$ | (35,378) | $ | (30,722) | $ | (114,500) | ||||||
|
|
|
|||||||||||
| Net cash provided by (used in) financing activities |
$ | (5,577) | $ | (6,159) | $ | 70,721 | ||||||
|
|
|
|||||||||||
II-14
Table of Contents
Cash Flow for FY 2018 Compared to FY 2017
Operating activities. Our operations provided cash of $58.8 million during FY 2018 versus $35.3 million during FY 2017, an increase in cash of $23.5 million between the periods. Net loss in FY 2018 of $9.1 million was $8.3 million higher than the net loss in FY 2017 of $0.8 million. However, our management of operating assets and liabilities in FY 2018, when compared to FY 2017, increased cash by $11.2 million. Historically we have experienced significant variations in operating assets and liabilities between periods when conducting our business in due course. Non-cash adjustments relating to depreciation and amortization, including amortization of deferred financing costs, accretion of interest and interest deferred on the Senior Term Note also increased cash between the periods by $4.8 million, from $41.9 million in FY 2017 to $46.7 million in FY 2018; and non-cash share-based compensation of $3.7 million in FY 2018 further increased operating cash flows by $2.3 million, when compared to $1.4 million in FY 2017. In the first quarter of FY 2017 a benefit of $0.7 million was recorded at Royal Wolf, primarily for the reversal of expenses recognized for unvested performance grants to key employees under its Long Term Incentive Plan (see Note 8 of Notes to Consolidated Financial Statements). The non-cash charge of $13.7 million for the change in the valuation of the stand-alone bifurcated derivative in the Convertible Note (see Note 5 of Notes to Consolidated Financial Statements) increased operating cash flow in FY 2018 and, additionally, net unrealized gains and losses from foreign exchange and derivative instruments (see Note 6 of Notes to Consolidated Financial Statements), which affect operating results but are non-cash addbacks for cash flow purposes, increased cash by $6.1 million between the periods, from a cash reduction of $0.7 million in FY 2017 to a cash increase of $5.4 million in FY 2018. Somewhat offsetting these increases were the net gain on the sales of lease fleet, which reduced operating cash flows by $8.5 million in FY 2018 and by $3.7 million in FY 2017, a reduction of $4.8 million between the periods; and, additionally, operating cash flows were reduced by non-cash adjustments for deferred income taxes in FY 2018 and FY 2017 of $3.0 million and $1.2 million, respectively.
Investing Activities. Net cash used in investing activities was $114.5 million during FY 2018, as compared to $30.7 million used during FY 2017, resulting in a net increase in the use of cash between the periods of $83.8 million. In FY 2018, we used $73.3 million and $15.1 million of cash to acquire the noncontrolling interest of Royal Wolf and make four business acquisitions in North America, respectively (see Note 4 of Notes to Consolidated Financial Statements). In FY 2017, we made three business acquisitions (two in North America and one in the Asia-Pacific area) for cash of $5.0 million. Purchases of property, plant and equipment, or rolling stock (maintenance capital expenditures), were $4.8 million in FY 2018 and $3.7 million in FY 2017, an increase of $1.1 million. In both periods, proceeds from sales of property, plant and equipment were not significant. Net capital expenditures of lease fleet (purchases, net of proceeds from sales of lease fleet) were $21.1 million in FY 2018 as compared to $21.8 million in FY 2017, a slight decrease of $0.7 million. In FY 2018, net capital expenditures of lease fleet were approximately $19.0 million in North America, as compared to $10.7 million in FY 2017, an increase of $8.3 million; and net capital expenditures of lease fleet in the Asia Pacific totaled $2.1 million in FY 2018, versus $11.1 million in FY 2017, a decrease of $9.0 million. The amount of cash that we use during any period in investing activities is almost entirely within management’s discretion and we have no significant long-term contracts or other arrangements pursuant to which we may be required to purchase at a certain price or a minimum amount of goods or services.
Financing Activities. Net cash provided from financing activities was $70.7 million during FY 2018, as compared to $6.2 million cash used during FY 2017, an increase to cash between the periods of $76.9 million. In FY 2018, we issued the Bison Capital Notes for proceeds totaling $80.0 million to, among other things, acquire the noncontrolling interest of Royal Wolf (see above) and repay the principal of $10.0 million due under the term loan to Credit Suisse (see Note 5 of Notes to Consolidated Financial Statements). Cash of $3.7 million was used during both periods to pay dividends on primarily our Series C Preferred Stock and, in FY 2018 and FY 2017, Royal Wolf paid a capital stock dividend of $1.0 million and $1.9 million, respectively, to the noncontrolling interests (see Note 3 of Notes to Consolidated Financial Statements). In FY 2018 and FY 2017, financing activities also included net borrowings and repayments of $89.4 million and $3.3 million, respectively, on existing credit facilities and, in FY 2017, we completed the sale of a “tack-on” offering of our publicly-traded Senior Notes for an aggregate principal amount of $5.4 million. These financing activities on our existing credit facilities and Senior Notes were primarily to fund our investment in the container lease fleet, make business acquisitions, pay dividends, manage our operating assets and liabilities and, in FY 2018, $81.5 million was borrowed from the Deutsche Bank Credit Facility to repay the ANZ/CBA Credit Facility (see Note 5 of Notes to Consolidated Financial Statements). In addition, deferred financing costs related to the Bison Capital Notes and Deutsche Bank Credit Facility totaled $4.0 million in FY 2018 and, in FY 2017, we paid deferred financing costs of $2.8 million primarily for the amendment and extension of our senior secured credit facilities in both North America and the Asia-Pacific area, as well as for the “tack-on” offering of our publicly-traded Senior Notes.
Cash Flow for FY 2017 Compared to FY 2016
Operating activities. Our operations provided cash of $35.7 million during FY 2017 versus providing $48.8 million during FY 2016, a decrease of $13.1 million. While the net loss of $0.8 million in FY 2017 was $2.5 less than the $3.3 million net loss in FY 2016, our management of operating assets and liabilities in FY 2017, when compared to FY 2016, reduced cash by $17.7 million. The primary reason for this was the increase in trade and other receivables and the timing on the satisfaction of trade payables, accrued liabilities and unearned revenues during FY 2017 that, when compared
II-15
Table of Contents
to FY 2016, reduced cash by $21.3 million between the periods. In FY 2017 these operating accounts reduced cash by $7.3 million, whereas in FY 2016 they increased cash by $14.0 million. While historically we have experienced significant variations in operating assets and liabilities between periods when conducting our business in due course, having a more than usual impact this time was our days sales outstanding (“DSO”) in trade receivables in the Asia-Pacific area, which increased to 49 days at June 30, 2017, as compared to 36 days at June 30, 2016, which was an exceptional DSO. The main factors contributing to the increase are the economic climate within Australia, which is being adversely impacted by an apparent lack of business confidence, coupled with our increased activity in the building and construction industry, whose payment profile is usually 60 days. However, we do expect this situation to normalise to a more standard 40 - 45 days in the Asia-Pacific region as a result of, among other things, improved collection efforts and system improvements. In addition, net unrealized gains and losses from foreign exchange and derivative instruments (see Note 6 of Notes to Consolidated Financial Statements), which affect operating results but are non-cash addbacks for cash flow purposes, caused a net increase of $0.7 million to operating cash flows in FY 2017 versus a net increase of $0.5 million in FY 2016. Further, non-cash adjustments relating to impairment of goodwill, depreciation, amortization (including amortization of deferred financing costs) and accretion of interest also decreased cash between the periods by $1.8 million, from $43.7 million in FY 2016 to $41.9 million in FY 2017. In FY 2016 operating cash flows increased by $3.1 million as a result of the non-cash addback of the goodwill and trade name impairment charge recognized at Southern Frac. Finally, while operating cash flows were enhanced by non-cash share-based compensation of $1.4 million in FY 2017 and $2.4 million in FY 2016, it resulted in a decrease of $1.0 million between the periods. During the first quarter of FY 2017, a benefit of $0.7 million was recorded at Royal Wolf; primarily for the reversal of expenses recognized for unvested performance grants to key employees under its Long Term Incentive Plan (see Note 9 of Notes to Consolidated Financial Statements). Offsetting these reductions somewhat were the non-cash adjustments of deferred income taxes and gains on the sales of lease fleet, which increased cash from operating activities by $3.0 million and $2.7 million, respectively, in FY 2017 from FY 2016.
Investing Activities. Net cash used in investing activities was $30.7 million during FY 2017, as compared to $35.4 million used during FY 2016, resulting in an increase to cash of $4.7 million. Purchases of property, plant and equipment (or rolling stock) were $3.7 million in FY 2017 and $4.2 million in FY 2016, a decrease of $0.5 million. In FY 2017, proceeds from sales of property, plant and equipment were only $0.3 million, as compared to $10.6 million in FY 2016, when all of our owned real properties in the Asia-Pacific area were sold for $10.3 million. Net capital expenditures of lease fleet (purchases, net of proceeds from sales of lease fleet) were $21.8 million in FY 2017 as compared to $20.8 million in FY 2016, a decrease of $1.0 million. In FY 2017, net capital expenditures of lease fleet were approximately $10.7 million in North America, as compared to $14.7 million in FY 2016, a decrease of $4.0 million; and net capital expenditures of lease fleet in the Pan Pacific totaled $11.1 million in FY 2017, versus $6.1 million in FY 2016, an increase of $5.0 million. The amount of cash that we use during any period in investing activities is almost entirely within management’s discretion and we have no significant long-term contracts or other arrangements pursuant to which we may be required to purchase at a certain price or a minimum amount of goods or services. In FY 2017, we made three business acquisitions (two in North America and one in the Asia-Pacific area) for cash of $5.0 million; as compared to six business acquisitions (four in North America and two in the Asia-Pacific area) during FY 2016 for cash totaling $20.7 million (see Note 4 of Notes to Consolidated Financial Statements).
Financing Activities. Net cash used in financing activities was $6.2 million during FY 2017, as compared to net cash used of $5.6 million during FY 2016, a decrease to cash of $0.6 million. In FY 2017 and FY 2016, financing activities included net reductions of $3.3 million and net borrowings of $1.3 million, respectively, on existing credit facilities. In addition, in FY 2017, we completed the sale of a “tack-on” offering of our publicly-traded Senior Notes for an aggregate principal amount of $5.4 million. These financing activities on our existing credit facilities and Senior Notes were primarily to fund our investment in the container lease fleet and business acquisitions and, in FY 2017, for the management of operating assets and liabilities. Cash of $3.7 million was used during both periods to pay dividends on primarily our Series C Preferred Stock and, in FY 2017 and FY 2016, Royal Wolf paid capital stock dividends of $1.9 million and $2.9 million, respectively, to noncontrolling interests (see Note 3 of Notes to Consolidated Financial Statements). Additionally, during FY 2016, $0.2 million of cash was used to make a distribution to the noncontrolling interest of Southern Frac. During FY 2017, we paid deferred financing costs of $2.8 million primarily for the amendment and extension of our senior secured credit facilities in both North America and the Asia-Pacific area, as well as for the “tack-on” offering of our publicly-traded Senior Notes.
Asset Management
Receivables and inventories were $50.5 million and $22.7 million at June 30, 2018 and $44.4 million and $29.6 million at June 30, 2017, respectively. At June 30, 2018, DSO in trade receivables were 35 days and 47 days in the Asia-Pacific area and our North American leasing operations, as compared to 49 days and 46 days at June 30, 2017, respectively. Effective asset management is always a significant focus as we strive to apply appropriate credit and collection controls and maintain proper inventory levels to enhance cash flow and profitability.
II-16
Table of Contents
The net book value of our total lease fleet was $429.4 million at June 30, 2018, as compared to $427.3 million at June 30, 2017. At June 30, 2018, we had 85,812 units (24,037 units in retail operations in Australia, 8,046 units in national account group operations in Australia, 10,222 units in New Zealand, which are considered retail; and 43,507 units in North America) in our lease fleet, as compared to 80,712 units (23,222 units in retail operations in Australia, 8,871 units in national account group operations in Australia, 10,137 units in New Zealand, which are considered retail; and 38,482 units in North America) at June 30, 2017. At those dates, 68,712 units (20,102 units in retail operations in Australia, 5,038 units in national account group operations in Australia, 8,705 units in New Zealand, which are considered retail; and 34,867 units in North America); and 63,321 units (19,554 units in retail operations in Australia, 5,287 units in national account group operations in Australia, 8,930 units in New Zealand, which are considered retail; and 29,550 units in North America) were on lease, respectively.
In the Asia-Pacific area, the lease fleet was comprised of 34,507 storage and freight containers and 7,798 portable building containers at June 30, 2018; and 34,625 storage and freight containers and 7,605 portable building containers at June 30, 2017. At those dates, units on lease were comprised of 28,301 storage and freight containers and 5,544 portable building containers; and 28,280 storage and freight containers and 5,491 portable building containers, respectively.
In North America, the lease fleet was comprised of 29,518 storage containers, 4,216 office containers (GLOs), 4,147 portable liquid storage tank containers, 4,447 mobile offices and 1,179 modular units at June 30, 2018; and 25,175 storage containers, 3,552 office containers (GLOs), 4,097 portable liquid storage tank containers, 4,491 mobile offices and 1,167 modular units at June 30, 2017. At those dates, units on lease were comprised of 23,040 storage containers, 3,620 office containers, 3,405 portable liquid storage tank containers, 3,792 mobile offices and 1,010 modular units; 19,296 storage containers, 2,885 office containers, 2,672 portable liquid storage tank containers, 3,732 mobile offices and 965 modular units, respectively.
Contractual Obligations and Commitments
Our material contractual obligations and commitments consist of outstanding borrowings under our credit facilities discussed above and operating leases for facilities and office equipment. The table below provides a summary of our contractual obligations and reflects expected payments due as of June 30, 2018 and does not reflect changes that could arise after that date (dollars in thousands).
| Total | Within 1 Year |
Within 1 to 2 Years |
Within 2 to 3 Years |
Within 3 to 4 Years |
Within 4 to 5 Years |
More than 5 Years |
||||||||||||||||||||||
|
|
|
|||||||||||||||||||||||||||
| Deutsche Bank Credit Facility | $ | 81,781 | $ | 9,263 | $ | 4,936 | $ | 67,582 | $ | — | $ | — | $ | — | ||||||||||||||
| Interest payment obligations under the Deutsche Bank Credit Facility (a) | 12,170 | 5,532 | 5,023 | 1,615 | — | — | — | |||||||||||||||||||||
| Bison Capital Notes | 82,013 | — | — | — | — | 82,013 | — | |||||||||||||||||||||
| Interest payment obligations under the Bison Capital Notes (b) | 45,478 | 10,736 | 10,736 | 10,736 | 10,736 | 2,534 | — | |||||||||||||||||||||
| Wells Fargo Credit Facility | 183,949 | 1,500 | 2,000 | 2,000 | 178,449 | — | — | |||||||||||||||||||||
| Interest payment obligations under the Wells Fargo Credit Facility (c) | 37,915 | 10,427 | 10,198 | 9,936 | 7,354 | — | — | |||||||||||||||||||||
| Senior Notes | 77,390 | — | — | — | 77,390 | — | — | |||||||||||||||||||||
| Interest payment obligations under the Senior Notes (d) | 19,388 | 6,288 | 6,288 | 6,288 | 524 | — | — | |||||||||||||||||||||
| Other (e) | 6,652 | 3,042 | 2,007 | 719 | 194 | 590 | 100 | |||||||||||||||||||||
| Other interest payment obligations (f) | 695 | 349 | 177 | 85 | 53 | 27 | 4 | |||||||||||||||||||||
| Operating leases (g) | 45,655 | 10,311 | 8,346 | 6,590 | 4,880 | 3,981 | 11,547 | |||||||||||||||||||||
|
|
|
|||||||||||||||||||||||||||
| Total | $ | 593,086 | $ | 57,448 | $ | 49,711 | $ | 105,551 | $ | 279,580 | $ | 89,145 | $ | 11,651 | ||||||||||||||
|
|
|
|||||||||||||||||||||||||||
| (a) | Interest payment obligations under the Deutsche Bank Credit Facility, which are subject to a variable rate, were calculated using a weighted –average rate during the fourth quarter of FY 2018 of 7.17%. |
| (b) | Interest payment obligations under the Bison Capital Notes were calculated using an effective rate of 13.09%. |
| (c) | Interest payment obligations under the Wells Fargo Credit Facility, which are subject to a variable rate, were calculated using a rate at June 30, 2018 of 13.091% on the $20,000 FILO Term Loan and 4.823% on the remaining balance. |
| (d) | Interest payment obligations under the Senior Notes were calculated using the stated rate of 8.125%. |
| (e) | Includes primarily equipment financing and real estate mortgage. |
| (f) | Other interest payment obligations were calculated using a weighted –average rate during the fourth quarter of FY 2018 of 6.8% (interest payments subsequent to June 30, 2023 are considered immaterial and are not calculated). |
| (g) | See Note 10 of Notes to Consolidated Financial Statements. |
II-17
Table of Contents
We estimate the annual distribution requirements with respect to our Series C Preferred Stock and Series B Preferred Stock outstanding at June 30, 2018 to be approximately $3.7 million. Dividends are paid when and if declared by our Board of Directors and accumulate if not paid.
Off-Balance Sheet Arrangements
We do not maintain any off-balance sheet transactions, arrangements, obligations or other relationships with unconsolidated entities or others that are reasonably likely to have a material current or future effect on our financial condition, changes in financial condition, revenues or expenses, results of operations, liquidity, capital expenditures or capital resources.
Seasonality
Although demand from certain customer segments can be seasonal, our operations as a whole are not seasonal to any significant extent. We experience a reduction in sales volumes at Royal Wolf during Australia’s summer holiday break from mid-December to the end of January, followed by February being a short working day month. However, this reduction in sales typically is counterbalanced by increased levels of lease revenues derived from the removals, or moving and storage industry, which experiences its seasonal peak of personnel relocations during this same summer holiday break. Demand from some of Pac-Van’s customers can be seasonal, such as in the construction industry, which tends to increase leasing activity in the first and fourth quarters of our fiscal year; while customers in the retail industry tend to lease more units in the second quarter. Our business at Lone Star and Southern Frac, which has been significantly derived from the oil and gas industry, may decline in our second quarter months of November and December and our third quarter months of January and February, particularly if inclement weather delays, or suspends, customer projects.
Environmental and Safety
Our operations, and the operations of many of our customers, are subject to numerous federal and local laws and regulations governing environmental protection and transportation. These laws regulate such issues as wastewater, storm water and the management, storage and disposal of, or exposure to, hazardous substances. We are not aware of any pending environmental compliance or remediation matters that are reasonably likely to have a material adverse effect on our business, financial position or results of operations. However, the failure by us to comply with applicable environmental and other requirements could result in fines, penalties, enforcement actions, third party claims, remediation actions, and could negatively impact our reputation with customers. We have a company-wide focus on safety and have implemented a number of measures to promote workplace safety.
Impact of Inflation
We believe that inflation has not had a material effect on our business. However, during periods of rising prices and, in particular when the prices increase rapidly or to levels significantly higher than normal, we may incur significant increases in our operating costs and may not be able to pass price increases through to our customers in a timely manner, which could harm our future results of operations.
Critical Accounting Estimates
Our discussion and analysis of our financial condition and results of operations are based upon our consolidated financial statements, which have been prepared in accordance with U.S. GAAP. The preparation of these financial statements requires us to make estimates and judgments that affect the reported amounts of assets, liabilities, revenues and expenses. On an ongoing basis, we re-evaluate all of our estimates. We base our estimates on historical experience and on various other assumptions that are believed to be reasonable under the circumstances, the results of which form the basis for making judgments about the carrying values of assets and liabilities that are not readily apparent from other sources. Actual results may materially differ from these estimates under different assumptions or conditions as additional information becomes available in future periods. We believe the following are the more significant judgments and estimates used in the preparation of our consolidated financial statements.
We are required to estimate the collectability of our trade receivables. Accordingly, we maintain allowances for doubtful accounts for estimated losses that may result from the inability of our customers to make required payments. On a recurring basis, we evaluate a variety of factors in assessing the ultimate realization of these receivables, including the current credit-worthiness of our customers, days sales outstanding trends, a review of historical collection results and a review of specific past due receivables. If the financial condition of our customers were to deteriorate, resulting in an
II-18
Table of Contents
impairment of their ability to make payments, additional allowances may be required, resulting in decreased operating income. Prior to FY 2016, uncollectible accounts were generally within the range of our expectations; however, in FY 2016 and FY 2017 we incurred more than our historically normal provision and write-offs for bad debts, primarily for customers in the oil and gas sector.
We lease and sell a fleet of storage, portable building, office and portable liquid storage tank containers, modular buildings and mobile offices to our customers. Leases to customers, which have varying terms, generally qualify as operating leases unless there is a bargain purchase option at the end of the lease term. Revenue is recognized as earned in accordance with the lease terms established by the lease agreements and when collectability is reasonably assured. Revenue from sales of equipment is recognized upon delivery and when collectability is reasonably assured, while revenue from the sales of manufactured units are recognized when title and risk of loss transfers to the purchaser, generally upon shipment. Certain arrangements to sell units under long-term construction-type sales contracts are accounted for under the percentage of completion method. Under this method, income is recognized in proportion to the incurred costs to date under the contract to estimated total costs. There were no such arrangements in FY 2017 and FY 2018. The lease fleet (or lease or rental equipment) is recorded at cost and depreciated on the straight-line basis over the estimated useful life (5 — 20 years), after the date the units are put in service, down to their estimated residual values (up to 70% of cost). In our opinion, estimated residual values are at or below net realizable values. We periodically review these depreciation policies in light of various factors, including the practices of the larger competitors in the industry, and our own historical experience.
For the issuances of stock options, we follow the fair value provisions of Financial Accounting Standards Board (“FASB”) Accounting Standards Codification (“ASC”) Topic 718, Compensation — Stock Compensation. FASB ASC Topic 718 requires recognition of employee share-based compensation expense in the statements of income over the vesting period based on the fair value of the stock option at the grant date. The pricing model we use for determining fair values of the purchase option is the Black-Scholes Pricing Model. Valuations derived from this model are subject to ongoing internal and external verification and review. The model uses market-sourced inputs such as interest rates, market prices and volatilities. Selection of these inputs involves management’s judgment and may impact operating income. In particular, we use a volatility rate based on the performance of our common stock, which yields a higher rate. In addition we use a risk-free interest rate, which is the rate on U.S. Treasury instruments, for a security with a maturity that approximates the estimated remaining expected term of the stock option.
The purchase consideration of acquired businesses have been allocated to the assets and liabilities acquired based on the estimated fair values on the respective acquisition dates. Based on these values, the excess purchase consideration over the fair value of the net assets acquired was allocated to goodwill. We account for goodwill in accordance with FASB ASC Topic 350, Intangibles — Goodwill and Other. FASB ASC Topic 350 prohibits the amortization of goodwill and intangible assets with indefinite lives and requires these assets be reviewed for impairment. We operate two reportable geographic areas and the vast majority of goodwill recorded was in the acquisitions of Royal Wolf, Pac-Van, Southern Frac and Lone Star.
We assesses the potential impairment of goodwill on an annual basis or if a determination is made based on a qualitative assessment that it is more likely than not (i.e., greater than 50%) that the fair value of the reporting unit is less than its carrying amount. Qualitative factors which could cause an impairment include (1) significant underperformance relative to historical, expected or projected future operating results; (2) significant changes in the manner of use of the acquired businesses or the strategy for our overall business; (3) significant changes during the period in our market capitalization relative to net book value; and (4) significant negative industry or general economic trends. Prior to June 30, 2017, if we did determine that fair value is more likely than not less than the carrying amount, a quantitative two-step impairment test process would be applied. The first step in this quantitative process is a screen for potential impairment where the fair value of the reporting unit is compared to its carrying value to determine if the goodwill is impaired. If the fair value of the reporting unit exceeds the carrying value of the net assets assigned to that unit, then goodwill is not impaired and no further testing is required. If, however, the carrying value of the net assets assigned to the reporting unit were to exceed its fair value, then the second step is performed by determining the implied fair value of a reporting unit’s goodwill and comparing it to the carrying value of the goodwill. This would involve allocating the fair value of the reporting unit to its respective assets and liabilities (as if it had been acquired in a separate and individual business combination and the fair value was the price paid to acquire it), with the excess of the fair value over the amounts assigned being the implied fair value of goodwill. If the implied fair value is less than the carrying value of the goodwill, an impairment loss would be recorded for the difference. In January 2017, the FASB issued Accounting Standards Update (“ASU”) No. 2017-04, which removed the requirement for a Step 2 goodwill impairment test and permitted early adoption for interim or annual goodwill impairment tests performed on dates on or after January 1, 2017. We adopted ASU No. 2017-04 effective June 30, 2017 and any goodwill impairment will now be the amount by which a reporting unit’s carrying value exceeds its fair value, but the loss recognized should not exceed the total amount of goodwill allocated to that reporting unit. During FY 2016, we determined that qualitative factors in our North American leasing and manufacturing operations, pertaining primarily to conditions in the oil and gas market, required an update of the step one impairment analysis for Lone Star and Southern Frac. This updated analysis calculated that even though the excess of the estimated fair value of Lone Star over the carrying value of its invested capital declined to approximately 11% of the book value of its net assets, its implied value of goodwill was still greater than its carrying value. However, we determined that the implied value of Southern Frac’s
II-19
Table of Contents
goodwill was less than the carrying value of its goodwill, resulting in an impairment charge of $2,681,000 at March 31, 2016. Our annual impairment analysis performed at June 30, 2017 and 2018 concluded that the fair value of each of its reporting units was greater than their respective carrying amounts. We base our fair value estimates on assumptions that we believe are reasonable, but are uncertain and subject to changes in market conditions.
Intangible assets include those with indefinite (trademark and trade name) and finite (primarily customer base and lists, non-compete agreements and deferred financing costs) useful lives. Customer base and lists and non-compete agreements are amortized on the straight-line basis over the expected period of benefit which range from one to fourteen years. Costs to obtaining long-term financing are deferred and amortized over the term of the related revolving line of credit senior debt using the straight-line method. Amortizing the deferred financing costs using the straight-line method does not produce significantly different results than that of the effective interest method. We review intangible assets (those assets resulting from acquisitions) for impairment if we determine, based on a qualitative assessment, that it is more likely than not (i.e., greater than 50%) that fair value might be less than the carrying amount. If we determine that fair value is more likely than not less than the carrying amount, then impairment would be quantitatively tested, using historical cash flows and other relevant facts and circumstances as the primary basis for estimates of future cash flows. If we determine that fair value is not likely to be less than the carrying amount, then no further testing would be required. We conducted our review at each fiscal yearend, which did not result in an impairment adjustment at June 30, 2017 and 2018, but did result in an impairment write-down at June 30, 2016 of $387,000 to the carrying amount of the trade name recorded at Southern Frac. Determining the fair value of intangible assets involves the use of significant estimates and assumptions, which we believe are reasonable, but are uncertain and subject to changes in market conditions.
We have a convertible note which conversion rights are an embedded derivative that requires bifurcation and separate accounting of its fair value as a standalone derivative. We determine the fair value of this bifurcated derivative using a valuation model and market prices and reassess its fair value at the end of each reporting period, or more frequently as deemed necessary, with any changes in value reported in the consolidated statements of operations.
In preparing our consolidated financial statements, we recognize income taxes in each of the jurisdictions in which we operate. For each jurisdiction, we estimate the actual amount of taxes currently payable or receivable as well as deferred tax assets and liabilities attributable to temporary differences between the financial statement carrying amounts of existing assets and liabilities and their respective tax bases. Deferred income tax assets and liabilities are measured using enacted tax rates expected to apply to taxable income in the years in which these temporary differences are expected to be recovered or settled. The effect on deferred tax assets and liabilities of a change in tax rates is recognized in income in the period that includes the enactment date. A valuation allowance would be provided for those deferred tax assets for which it is more likely than not that the related benefits will not be realized. In determining the amount of the valuation allowance, we consider estimated future taxable income as well as feasible tax planning strategies in each jurisdiction. If we determine that we will not realize all or a portion of our deferred tax assets, we would increase our valuation allowance with a charge to income tax expense or offset goodwill if the deferred tax asset was acquired in a business combination. Conversely, if we determine that we will ultimately be able to realize all or a portion of the related benefits for which a valuation allowance has been provided, all or a portion of the related valuation allowance would be reduced with a credit to income tax expense except if the valuation allowance was created in conjunction with a tax asset in a business combination.
Reference is made to Note 2 of Notes to Consolidated Financial Statements for a further discussion of our significant accounting policies.
Impact of Recently Issued Accounting Pronouncements
Reference is made to Note 2 of Notes to Consolidated Financial Statements for a discussion of recently issued accounting pronouncements that could potentially impact us.
Item 7A. Quantitative and Qualitative Disclosures about Market Risk
Market risk is the sensitivity of income to changes in interest rates, foreign exchanges and other market-driven rates or prices. Exposure to interest rates and currency risks arises in the normal course of our business and we may use derivative financial instruments to hedge exposure to fluctuations in foreign exchange rates and interest rates. We believe we have no material market risks to our operations, financial position or liquidity as a result of derivative activities, including forward-exchange contracts.
Reference is made to Notes 5 and 6 of Notes to Consolidated Financial Statements for a discussion of our senior and other debt and financial instruments.
II-20
Table of Contents
Item 8. Financial Statements and Supplementary Data
| Index to Consolidated Financial Statements: | ||||
| F-1 | ||||
| F-2 | ||||
| Consolidated Statements of Operations for the years ended June 30, 2016, 2017 and 2018 |
F-3 | |||
| F-4 | ||||
| Consolidated Statements of Equity for the years ended June 30, 2016, 2017 and 2018 |
F-5 | |||
| Consolidated Statements of Cash Flows for the years ended June 30, 2016, 2017 and 2018 |
F-7 | |||
| F-8 | ||||
Item 9. Changes in and Disagreements with Accountants on Accounting and Financial Disclosure
None.
Item 9A. Controls and Procedures
Conclusion Regarding the Effectiveness of Disclosure Controls and Procedures
We maintain disclosure controls and procedures that are designed to ensure that information required to be disclosed in reports we file and submit under the Securities Exchange Act of 1934, as amended (“Exchange Act”), is recorded, processed, summarized and reported within the time periods specified in accordance with SEC guidelines and that such information is communicated to management, including our Chief Executive Officer and Chief Financial Officer, to allow timely decisions regarding required disclosure based on the definition of “disclosure controls and procedures” in the Exchange Act. In designing and evaluating our disclosure controls and procedures, we recognized that any controls and procedures, no matter how well designed and operated, can provide only reasonable assurance of achieving the desired control objectives and that our management necessarily was required to apply its judgment in evaluating the cost-benefit relationship of possible controls and procedures in reaching that level of reasonable assurance. Under the supervision and with the participation of our management, including our Chief Executive Officer and Chief Financial Officer, we evaluated the effectiveness of our disclosure controls and procedures, as required by Exchange Act, as of the end of the period covered by this report. Based on that evaluation, our Chief Executive Officer and Chief Financial Officer concluded that our disclosure controls and procedures were effective at the reasonable assurance level.
Management’s Report on Internal Control over Financial Reporting
Management is responsible for establishing and maintaining adequate internal control over financial reporting, as such term is defined in Exchange Act. Internal control over financial reporting is a process designed to provide reasonable assurance regarding the reliability of financial reporting and the preparation of financial statements for external purposes in accordance with generally accepted accounting principles. Internal control over financial reporting includes those policies and procedures that (1) pertain to the maintenance of records that, in reasonable detail, accurately and fairly reflect the transactions and dispositions of assets; (2) provide reasonable assurance that transactions are recorded as necessary to permit preparation of financial statements in conformity with U.S. generally accepted accounting principles, and that receipts and expenditures are being made only in accordance with authorizations of management and directors; and (3) provide reasonable assurance regarding prevention or timely detection of unauthorized acquisition, use, or disposition of assets that could have a material effect on the financial statements.
A control system, no matter how well conceived and operated, can provide only reasonable, not absolute, assurance that the objectives of the controls system are met. Because of the inherent limitations in all controls systems, no evaluation of controls can provide absolute assurance that all control issues and instances of fraud, if any, have been detected. Under the supervision and with the participation of management, we assessed the effectiveness of our internal control over financial reporting based on the criteria in Internal Control — Integrated Framework issued by the
II-21
Table of Contents
Committee of Sponsoring Organizations of the Treadway Commission. Based on our evaluation under the criteria in Internal Control — Integrated Framework (2013), we concluded that our internal control over financial reporting was effective as of June 30, 2018.
Our independent registered public accounting firm, Crowe LLP, audited our internal control over financial reporting as of June 30, 2018, as stated in their report in the section entitled “Report of Independent Registered Public Accounting Firm” included elsewhere in this Annual Report on Form 10-K.
Changes in Internal Control over Financial Reporting
There were no changes in our internal control over financial reporting during the quarter ended June 30, 2018 that have materially affected, or are reasonably likely to materially affect, our internal control over financial reporting.
None.
II-22
Table of Contents
Certain information required by Part III is omitted from this Annual Report on Form 10-K because we will file a definitive Proxy Statement for the 2018 Annual Meeting of Stockholders, pursuant to Regulation 14A of the Securities Exchange Act of 1934 (the “Proxy Statement”), not later than 120 days after the end of the fiscal year covered by this Annual Report on Form 10-K and the applicable information included in the Proxy Statement is incorporated herein by reference.
Item 10. Directors, Executive Officers and Corporate Governance
Information concerning our executive officers is set forth in Item 1. of this Annual Report on Form 10-K under the caption “Executive Officers of the Registrant.”
We have adopted a code of ethics that applies to our directors, officers (including our principal executive and principal financial and accounting officers) and employees. A copy of these code of ethics is available free of charge on the “Corporate Governance” section of our website at www.generalfinance.com or by a written request addressed to the Corporate Secretary, General Finance Corporation, 39 East Union Street, Pasadena, California 91103. We intend to satisfy any disclosure requirement under Item 5.05 of Form 8-K regarding an amendment to, or waiver from, a provision of the code of ethics by posting such information on our web site at the address and location specified above.
Other information required by this Item is incorporated herein by reference to information included in the Proxy Statement.
Item 11. Executive Compensation
Information required by this Item is incorporated herein by reference to information included in the Proxy Statement.
Item 12. Security Ownership of Certain Beneficial Owners and Management and Related Stockholder Matters
Information required by this Item is incorporated herein by reference to information included in the Proxy Statement
Item 13. Certain Relationships and Related Transactions, and Director Independence
Information required by this Item is incorporated herein by reference to information included in the Proxy Statement
Item 14. Principal Accountant Fees and Services
Information required by this Item is incorporated herein by reference to information included in the Proxy Statement.
III-1
Table of Contents
Item 15. Exhibits, Financial Statement Schedules
(a) Financial Statements
(1) The financial statements required in this Annual Report on Form 10-K are included in Item 8. Financial Statements and Supplementary Data.
(2) Financial statement schedule:
Schedule I — Condensed Financial Information of Registrant (Parent Company Information)
All other supplemental schedules have been omitted since the required information is not present in amounts sufficient to require submission of the schedule, or because the required information is included in the consolidated financial statements or notes thereto.
(b) Exhibits
IV-1
Table of Contents
IV-2
Table of Contents
IV-3
Table of Contents
(a) Filed herewith.
Not applicable.
IV-4
Table of Contents
EXHIBIT INDEX
Table of Contents
Pursuant to the requirements of Section 13 or 15(d) of the Securities Exchange Act of 1934, the registrant has duly caused this report to be signed on its behalf by the undersigned, thereunto duly authorized.
| General Finance Corporation | ||||||
| By: | /s/ Jody E. Miller |
September 7, 2018 | ||||
| Name: Jody E. Miller Title: Chief Executive Officer |
||||||
Pursuant to the requirements of the Securities Exchange Act of 1934, this report has been signed below by the following persons on behalf of the registrant and in the capacities and on the dates indicated:
| Signature |
Title |
Date | ||||
| /s/ Jody E. Miller |
Chief Executive Officer (Principal Executive Officer) | September 7, 2018 | ||||
| Jody E. Miller | ||||||
| /s/ Charles E. Barrantes |
Executive Vice President and Chief Financial Officer (Principal Accounting and Financial Officer) | September 7, 2018 | ||||
| Charles E. Barrantes | ||||||
| /s/ Ronald F. Valenta |
Executive Chairman of the Board | September 7, 2018 | ||||
| Ronald F. Valenta | ||||||
| /s/ James B. Roszak |
Lead Independent Director | September 7, 2018 | ||||
| James B. Roszak | ||||||
| /s/ Manuel Marrero |
Director | September 7, 2018 | ||||
| Manuel Marrero | ||||||
| /s/ Susan L. Harris |
Director | September 7, 2018 | ||||
| Susan L. Harris | ||||||
| /s/ Larry D. Tashjian |
Director | September 7, 2018 | ||||
| Larry D. Tashjian | ||||||
| /s/ William H. Baribault |
Director | September 7, 2018 | ||||
| William H. Baribault | ||||||
| /s/ Douglas B. Trussler |
Director | September 7, 2018 | ||||
| Douglas B. Trussler | ||||||
SIG
Table of Contents
REPORT OF INDEPENDENT REGISTERED PUBLIC ACCOUNTING FIRM
To the Board of Directors and Stockholders
General Finance Corporation
Pasadena, California
Opinions on the Financial Statements and Internal Control over Financial Reporting
We have audited the accompanying consolidated balance sheets of General Finance Corporation (the “Company”) as of June 30, 2018 and 2017, the related consolidated statements of operations, comprehensive income/loss, equity, and cash flows for each of the years in the three-year period ended June 30, 2018, and the related notes and schedules (collectively referred to as the “financial statements”). We also have audited the Company’s internal control over financial reporting as of June 30, 2018, based on criteria established in Internal Control – Integrated Framework: (2013) issued by the Committee of Sponsoring Organizations of the Treadway Commission (COSO).
In our opinion, the financial statements referred to above present fairly, in all material respects, the financial position of the Company as of June 30, 2018 and 2017, and the results of its operations and its cash flows for each of the years in the three-year period ended June 30, 2018 in conformity with accounting principles generally accepted in the United States of America. Also in our opinion, the Company maintained, in all material respects, effective internal control over financial reporting as of June 30, 2018, based on criteria established in Internal Control – Integrated Framework: (2013) issued by COSO.
Basis for Opinions
The Company’s management is responsible for these financial statements, for maintaining effective internal control over financial reporting, and for its assessment of the effectiveness of internal control over financial reporting, included in the accompanying Management’s Report on Internal Control over Financial Reporting. Our responsibility is to express an opinion on the Company’s financial statements and an opinion on the Company’s internal control over financial reporting based on our audits. We are a public accounting firm registered with the Public Company Accounting Oversight Board (United States) (“PCAOB”) and are required to be independent with respect to the Company in accordance with the U.S. federal securities laws and the applicable rules and regulations of the Securities and Exchange Commission and the PCAOB.
We conducted our audits in accordance with the standards of the PCAOB. Those standards require that we plan and perform the audits to obtain reasonable assurance about whether the financial statements are free of material misstatement, whether due to error or fraud, and whether effective internal control over financial reporting was maintained in all material respects.
Our audits of the financial statements included performing procedures to assess the risks of material misstatement of the financial statements, whether due to error or fraud, and performing procedures that respond to those risks. Such procedures included examining, on a test basis, evidence regarding the amounts and disclosures in the financial statements. Our audits also included evaluating the accounting principles used and significant estimates made by management, as well as evaluating the overall presentation of the financial statements. Our audit of internal control over financial reporting included obtaining an understanding of internal control over financial reporting, assessing the risk that a material weakness exists, and testing and evaluating the design and operating effectiveness of internal control based on the assessed risk. Our audits also included performing such other procedures as we considered necessary in the circumstances. We believe that our audits provide a reasonable basis for our opinions.
Definition and Limitations of Internal Control Over Financial Reporting
A company’s internal control over financial reporting is a process designed to provide reasonable assurance regarding the reliability of financial reporting and the preparation of financial statements for external purposes in accordance with generally accepted accounting principles. A company’s internal control over financial reporting includes those policies and procedures that (1) pertain to the maintenance of records that, in reasonable detail, accurately and fairly reflect the transactions and dispositions of the assets of the company; (2) provide reasonable assurance that transactions are recorded as necessary to permit preparation of financial statements in accordance with generally accepted accounting principles, and that receipts and expenditures of the company are being made only in accordance with authorizations of management and directors of the company; and (3) provide reasonable assurance regarding prevention or timely detection of unauthorized acquisition, use, or disposition of the company’s assets that could have a material effect on the financial statements.
Because of its inherent limitations, internal control over financial reporting may not prevent or detect misstatements. Also, projections of any evaluation of effectiveness to future periods are subject to the risk that controls may become inadequate because of changes in conditions, or that the degree of compliance with the policies or procedures may deteriorate.
/s/ Crowe LLP
We have served as the Company’s auditor since 2009.
Sherman Oaks, California
September 7, 2018
F-1
Table of Contents
GENERAL FINANCE CORPORATION AND SUBSIDIARIES
CONSOLIDATED BALANCE SHEETS
(In thousands, except share and per share data)
| June 30, 2017 | June 30, 2018 | |||||||
|
|
|
|||||||
| Assets |
||||||||
| Cash and cash equivalents |
$ | 7,792 | $ | 21,617 | ||||
| Trade and other receivables, net of allowance for doubtful accounts of $6,387 and $5,687 at June 30, 2017 and June 30, 2018, respectively |
44,390 | 50,525 | ||||||
| Inventories |
29,648 | 22,731 | ||||||
| Prepaid expenses and other |
8,923 | 8,023 | ||||||
| Property, plant and equipment, net |
23,388 | 22,310 | ||||||
| Lease fleet, net |
427,275 | 429,388 | ||||||
| Goodwill |
105,129 | 109,943 | ||||||
| Other intangible assets, net |
28,769 | 25,150 | ||||||
|
|
|
|
|
|||||
| Total assets |
$ | 675,314 | $ | 689,687 | ||||
|
|
|
|
|
|||||
| Liabilities |
||||||||
| Trade payables and accrued liabilities |
$ | 42,774 | $ | 50,545 | ||||
| Income taxes payable |
— | 361 | ||||||
| Unearned revenue and advance payments |
15,548 | 19,226 | ||||||
| Senior and other debt, net |
355,638 | 427,218 | ||||||
| Fair value of bifurcated derivative in Convertible Note |
— | 15,583 | ||||||
| Deferred tax liabilities |
38,106 | 34,969 | ||||||
|
|
|
|
|
|||||
| Total liabilities |
452,066 | 547,902 | ||||||
|
|
|
|
|
|||||
| Commitments and contingencies (Note 10) |
— | — | ||||||
| Equity |
||||||||
| Cumulative preferred stock, $.0001 par value: 1,000,000 shares authorized; 400,100 shares issued and outstanding (in series) and liquidation value of $40,722 at June 30, 2017 and 2018 |
40,100 | 40,100 | ||||||
| Common stock, $.0001 par value: 100,000,000 shares authorized; 26,611,688 shares issued and outstanding at June 30, 2017 and 27,017,606 at June 30, 2018 |
3 | 3 | ||||||
| Additional paid-in capital |
120,370 | 139,547 | ||||||
| Accumulated other comprehensive loss |
(12,355) | (17,091) | ||||||
| Accumulated deficit |
(12,972) | (21,278) | ||||||
|
|
|
|
|
|||||
| Total General Finance Corporation stockholders’ equity |
135,146 | 141,281 | ||||||
| Equity of noncontrolling interests |
88,102 | 504 | ||||||
|
|
|
|
|
|||||
| Total equity |
223,248 | 141,785 | ||||||
|
|
|
|
|
|||||
| Total liabilities and equity |
$ | 675,314 | $ | 689,687 | ||||
|
|
|
|
|
|||||
The accompanying notes are an integral part of these consolidated financial statements.
F-2
Table of Contents
GENERAL FINANCE CORPORATION AND SUBSIDIARIES
CONSOLIDATED STATEMENTS OF OPERATIONS
(In thousands, except share and per share data)
| Year Ended June 30, | ||||||||||||
|
|
|
|||||||||||
| 2016 | 2017 | 2018 | ||||||||||
|
|
|
|||||||||||
| Revenues |
||||||||||||
| Sales: |
||||||||||||
| Lease inventories and fleet |
$111,439 | $ | 95,764 | $ | 122,467 | |||||||
| Manufactured units |
6,179 | 4,895 | 9,850 | |||||||||
|
|
|
|||||||||||
| 117,618 | 100,659 | 132,317 | ||||||||||
| Leasing |
168,233 | 176,269 | 214,985 | |||||||||
|
|
|
|||||||||||
| 285,851 | 276,928 | 347,302 | ||||||||||
|
|
|
|||||||||||
| Costs and expenses |
||||||||||||
| Cost of Sales: |
||||||||||||
| Lease inventories and fleet (exclusive of the items shown separately below) |
82,683 | 68,215 | 87,779 | |||||||||
| Manufactured units |
10,063 | 6,336 | 9,212 | |||||||||
| Direct costs of leasing operations |
69,134 | 76,306 | 89,201 | |||||||||
| Selling and general expenses |
68,697 | 67,705 | 77,650 | |||||||||
| Impairment of goodwill and trade name |
3,068 | — | — | |||||||||
| Depreciation and amortization |
37,823 | 39,300 | 39,761 | |||||||||
|
|
|
|||||||||||
| Operating income |
14,383 | 19,066 | 43,699 | |||||||||
| Interest income |
97 | 66 | 112 | |||||||||
| Interest expense (includes cash flow hedge reclassifications from AOCI of an unrealized gain of $1,073 in 2017 and $12 in 2018) |
(19,648) | (19,653) | (33,991) | |||||||||
| Loss on change in valuation of bifurcated derivative in Convertible Note (Note 5) |
— | — | (13,719) | |||||||||
| Foreign exchange and other |
(309) | (351) | (5,887) | |||||||||
|
|
|
|||||||||||
| (19,860) | (19,938) | (53,485) | ||||||||||
|
|
|
|||||||||||
| Loss before benefit for income taxes |
(5,477) | (872) | (9,786) | |||||||||
| Benefit for income taxes |
(2,191) | (25) | (679) | |||||||||
|
|
|
|||||||||||
| Net loss |
(3,286) | (847) | (9,107) | |||||||||
| Preferred stock dividends |
(3,668) | (3,658) | (3,658) | |||||||||
| Noncontrolling interest |
(2,071) | (2,115) | 801 | |||||||||
|
|
|
|||||||||||
| Net loss attributable to common stockholders |
$ | (9,025) | $ | (6,620) | $ | (11,964) | ||||||
|
|
|
|||||||||||
| Net loss per common share: |
||||||||||||
| Basic |
$ | (0.35) | $ | (0.25) | $ | (0.46) | ||||||
| Diluted |
(0.35) | (0.25) | (0.46) | |||||||||
|
|
|
|||||||||||
| Weighted average shares outstanding: |
||||||||||||
| Basic |
26,060,823 | 26,348,344 | 26,269,931 | |||||||||
| Diluted |
26,060,823 | 26,348,344 | 26,269,931 | |||||||||
|
|
|
|||||||||||
The accompanying notes are an integral part of these consolidated financial statements.
F-3
Table of Contents
GENERAL FINANCE CORPORATION AND SUBSIDIARIES
CONSOLIDATED STATEMENTS OF COMPREHENSIVE INCOME/LOSS
(In thousands, except share and per share data)
| Year Ended June 30, | ||||||||||||
|
|
|
|||||||||||
| 2016 | 2017 | 2018 | ||||||||||
|
|
|
|||||||||||
| Net loss |
$ | (3,286) | $ | (847) | $ | (9,107) | ||||||
| Other comprehensive income (loss): |
||||||||||||
| Change in fair value, net of cash flow hedge reclassifications to the statement of operations of an unrealized gain of $1,073 in 2017 and $12 in 2018, and net of income tax effect of $325 and $28 in 2017 and 2018, respectively | 406 | (222) | (80) | |||||||||
| Cumulative translation adjustment |
(2,543) | 3,814 | 1,988 | |||||||||
|
|
|
|||||||||||
| Total comprehensive income (loss) |
(5,423) | 2,745 | (7,199) | |||||||||
| Allocated to noncontrolling interests
|
|
(1,190)
|
|
|
(3,933)
|
|
|
(1,095)
|
| |||
|
|
|
|||||||||||
| Comprehensive loss allocable to General Finance Corporation stockholders |
$ | (6,613) | $ | (1,188) | $ | (8,294) | ||||||
|
|
|
|||||||||||
The accompanying notes are an integral part of these consolidated financial statements.
F-4
Table of Contents
GENERAL FINANCE CORPORATION AND SUBSIDIARIES
CONSOLIDATED STATEMENTS OF EQUITY
(In thousands, except share data)
| Cumulative Preferred Stock |
Common Stock |
Additional Paid-In Capital |
Accumulated Other |
Accumulated Deficit |
Total General Finance |
Equity of Noncontrolling Interests |
Total Equity |
|||||||||||||||||||||||||
|
|
|
|||||||||||||||||||||||||||||||
| Balance at June 30, 2015 |
$ | 40,100 | $ | 3 | $ | 124,288 | $ | (12,873) | $ | (4,653) | $ | 146,865 | $ | 87,491 | $ | 234,356 | ||||||||||||||||
|
|
|
|||||||||||||||||||||||||||||||
| Share-based compensation |
— | — | 1,908 | — | — | 1,908 | 480 | 2,388 | ||||||||||||||||||||||||
| Preferred stock dividends |
— | — | (3,668) | — | — | (3,668) | — | (3,668) | ||||||||||||||||||||||||
| Dividends and distributions by subsidiaries | — | — | — | — | — | — | (3,081) | (3,081) | ||||||||||||||||||||||||
| Issuance of 13,000 shares of common stock on exercises of stock options | — | — | 40 | — | — | 40 | — | 40 | ||||||||||||||||||||||||
| Grant of net 196,894 shares of restricted stock | — | — | — | — | — | — | — | — | ||||||||||||||||||||||||
| Net income (loss) |
— | — | — | — | (5,357) | (5,357) | 2,071 | (3,286) | ||||||||||||||||||||||||
| Fair value change in derivative, net of related tax effect |
— | — | — | 207 | — | 207 | 199 | 406 | ||||||||||||||||||||||||
| Cumulative translation adjustment | — | — | — | (1,463) | — | (1,463) | (1,080) | (2,543) | ||||||||||||||||||||||||
|
|
|
|||||||||||||||||||||||||||||||
| Total comprehensive income (loss) |
— | — | — | — | — | (6,613) | 1,190 | (5,423) | ||||||||||||||||||||||||
|
|
|
|||||||||||||||||||||||||||||||
| Balance at June 30, 2016 |
40,100 | 3 | 122,568 | (14,129) | (10,010) | 138,532 | 86,080 | 224,612 | ||||||||||||||||||||||||
|
|
|
|||||||||||||||||||||||||||||||
| Share-based compensation |
— | — | 1,406 | — | — | 1,406 | (32) | 1,374 | ||||||||||||||||||||||||
| Preferred stock dividends |
— | — | (3,658) | — | — | (3,658) | — | (3,658) | ||||||||||||||||||||||||
| Dividends and distributions by subsidiaries | — | — | — | — | — | — | (1,879) | (1,879) | ||||||||||||||||||||||||
| Issuance of 21,500 shares of common stock on exercises of stock options | — | — | 54 | — | — | 54 | — | 54 | ||||||||||||||||||||||||
| Grant of 22,112 shares of common stock | — | — | — | — | — | — | — | — | ||||||||||||||||||||||||
| Grant of net 349,304 shares of restricted stock | — | — | — | — | — | — | — | — | ||||||||||||||||||||||||
| Net income (loss) |
— | — | — | — | (2,962) | (2,962) | 2,115 | (847) | ||||||||||||||||||||||||
| Fair value change in derivative, net of related tax effect |
— | — | — | (113) | — | (113) | (109) | (222) | ||||||||||||||||||||||||
| Cumulative translation adjustment | — | — | — | 1,887 | — | 1,887 | 1,927 | 3,814 | ||||||||||||||||||||||||
|
|
|
|||||||||||||||||||||||||||||||
| Total comprehensive income (loss) |
— | — | — | — | — | (1,188) | 3,933 | 2,745 | ||||||||||||||||||||||||
|
|
|
|||||||||||||||||||||||||||||||
| Balance at June 30, 2017 |
$ | 40,100 | $ | 3 | $ | 120,370 | $ | (12,355) | $ | (12,972) | $ | 135,146 | $ | 88,102 | $ | 223,248 | ||||||||||||||||
|
|
|
|||||||||||||||||||||||||||||||
The accompanying notes are an integral part of these consolidated financial statements.
F-5
Table of Contents
GENERAL FINANCE CORPORATION AND SUBSIDIARIES
CONSOLIDATED STATEMENTS OF EQUITY
(In thousands, except share data)
| Cumulative Preferred Stock |
Common Stock |
Additional Paid-In Capital |
Accumulated Other |
Accumulated Deficit |
Total General Finance |
Equity of Noncontrolling Interests |
Total Equity |
|||||||||||||||||||||||||
|
|
|
|||||||||||||||||||||||||||||||
| Share-based compensation |
$ | — | $ | — | $ | 3,067 | $ | — | $ | — | $ | 3,067 | $ | 591 | $ | 3,658 | ||||||||||||||||
| Preferred stock dividends |
— | — | (3,658) | — | — | (3,658) | — | (3,658) | ||||||||||||||||||||||||
| Dividends and distributions by subsidiaries | — | — | — | — | — | — | (1,038) | (1,038) | ||||||||||||||||||||||||
| Issuance of 237,260 shares of common stock on exercises of stock options | — | — | 1,150 | — | — | 1,150 | — | 1,150 | ||||||||||||||||||||||||
| Grant of net 125,885 shares of restricted stock | — | — | — | — | — | — | — | — | ||||||||||||||||||||||||
| Grant of 42,773 shares of common stock | — | — | — | — | — | — | — | — | ||||||||||||||||||||||||
| Refund from terminated Royal Wolf LTI Plan trust | — | — | 338 | — | — | 338 | — | 338 | ||||||||||||||||||||||||
| Net loss |
— | — | — | — | (8,306) | (8,306) | (801) | (9,107) | ||||||||||||||||||||||||
| Fair value change in derivative, net of related tax effect |
— | — | — | (141) | — | (141) | 61 | (80) | ||||||||||||||||||||||||
| Cumulative translation adjustment | — | — | — | 153 | — | 153 | 1,835 | 1,988 | ||||||||||||||||||||||||
|
|
|
|||||||||||||||||||||||||||||||
| Total comprehensive income | — | — | — | — | — | (8,294) | 1,095 | (7,199) | ||||||||||||||||||||||||
|
|
|
|||||||||||||||||||||||||||||||
| Acquisition of noncontrolling interest in Royal Wolf | — | — | 18,280 | (4,748) | — | 13,532 | (88,246) | (74,714) | ||||||||||||||||||||||||
|
|
|
|||||||||||||||||||||||||||||||
| Balance at June 30, 2018 | $ | 40,100 | $ | 3 | $ | 139,547 | $ | (17,091) | $ | (21,278) | $ | 141,281 | $ | 504 | $ | 141,785 | ||||||||||||||||
|
|
|
|||||||||||||||||||||||||||||||
The accompanying notes are an integral part of these consolidated financial statements.
F-6
Table of Contents
GENERAL FINANCE CORPORATION AND SUBSIDIARIES
CONSOLIDATED STATEMENTS OF CASH FLOWS
(In thousands)
| Year Ended June 30, | ||||||||||||
|
|
|
|||||||||||
| 2016 | 2017 | 2018 | ||||||||||
|
|
|
|||||||||||
| Cash flows from operating activities: |
||||||||||||
| Net loss |
$ | (3,286) | $ | (847) | $ | (9,107) | ||||||
| Adjustments to reconcile net income (loss) to cash flows from operating activities: |
||||||||||||
| Gain on sales and disposals of property, plant and equipment |
(61) | (126) | (2) | |||||||||
| Gain on sales of lease fleet |
(6,384) | (3,700) | (8,464) | |||||||||
| Gain on bargain purchase of businesses |
(72) | — | — | |||||||||
| Unrealized foreign exchange loss |
103 | 375 | 6,138 | |||||||||
| Unrealized loss (gain) on forward exchange contracts |
367 | 12 | (697) | |||||||||
| Unrealized gain on interest rate swaps |
— | (1,073) | (12) | |||||||||
| Impairment of goodwill and trade name |
3,068 | — | — | |||||||||
| Change in valuation of bifurcated derivative in Convertible Note |
— | — | 13,719 | |||||||||
| Depreciation and amortization |
38,634 | 40,092 | 40,335 | |||||||||
| Amortization of deferred financing costs |
1,466 | 1,504 | 2,293 | |||||||||
| Accretion of interest |
536 | 316 | 822 | |||||||||
| Interest deferred on Senior Term Note |
— | — | 3,272 | |||||||||
| Share-based compensation expense |
2,388 | 1,374 | 3,658 | |||||||||
| Deferred income taxes |
(4,195) | (1,194) | (2,981) | |||||||||
| Changes in operating assets and liabilities (excluding assets and liabilities from acquisitions): |
||||||||||||
| Trade and other receivables, net |
9,486 | (5,445) | (6,446) | |||||||||
| Inventories |
4,813 | 6,253 | 7,021 | |||||||||
| Prepaid expenses and other |
(1,498) | 492 | 1,170 | |||||||||
| Trade payables, accrued liabilities and unearned revenues |
4,511 | (1,843) | 6,975 | |||||||||
| Income taxes |
(1,054) | (883) | 1,081 | |||||||||
|
|
|
|||||||||||
| Net cash provided by operating activities |
48,822 | 35,307 | 58,775 | |||||||||
|
|
|
|||||||||||
| Cash flows from investing activities: |
||||||||||||
| Business acquisitions, net of cash acquired |
(20,658) | (4,993) | (15,084) | |||||||||
| Acquisition of noncontrolling interest in Royal Wolf |
— | — | (73,251) | |||||||||
| Proceeds from sales of property, plant and equipment |
10,609 | 267 | 281 | |||||||||
| Purchases of property, plant and equipment |
(4,224) | (3,693) | (4,784) | |||||||||
| Proceeds from sales of lease fleet |
28,547 | 24,030 | 27,481 | |||||||||
| Purchases of lease fleet |
(49,320) | (45,812) | (48,566) | |||||||||
| Other intangible assets |
(332) | (521) | (577) | |||||||||
|
|
|
|||||||||||
| Net cash used in investing activities |
(35,378) | (30,722) | (114,500) | |||||||||
|
|
|
|||||||||||
| Cash flows from financing activities: |
||||||||||||
| Repayments of equipment financing activities |
(651) | (483) | (512) | |||||||||
| Repayment of Credit Suisse Term Loan |
— | — | (10,000) | |||||||||
| Repayment of ANZ/CBA Credit Facility |
— | — | (81,521) | |||||||||
| Proceeds from issuance of Bison Notes |
— | — | 80,000 | |||||||||
| Proceeds from (repayments of) senior and other debt borrowings, net |
1,989 | (2,782) | 89,942 | |||||||||
| Proceeds from issuances of 8.125% senior notes |
— | 5,390 | — | |||||||||
| Deferred financing costs |
(206) | (2,801) | (3,980) | |||||||||
| Proceeds from issuances of common stock |
40 | 54 | 1,150 | |||||||||
| Dividends and distributions by subsidiaries |
(3,081) | (1,879) | (1,038) | |||||||||
| Refund from terminated Royal Wolf LTI Plan trust |
— | — | 338 | |||||||||
| Preferred stock dividends |
(3,668) | (3,658) | (3,658) | |||||||||
|
|
|
|||||||||||
| Net cash provided by (used in) financing activities |
(5,577) | (6,159) | 70,721 | |||||||||
|
|
|
|||||||||||
| Net increase (decrease) in cash |
7,867 | (1,574) | 14,996 | |||||||||
| Cash and equivalents at beginning of period |
3,716 | 9,342 | 7,792 | |||||||||
| The effect of foreign currency translation on cash
|
|
(2,241)
|
|
|
24
|
|
|
(1,171)
|
| |||
|
|
|
|||||||||||
| Cash and equivalents at end of period |
$ | 9,342 | $ | 7,792 | $ | 21,617 | ||||||
|
|
|
|||||||||||
| Supplemental disclosure of cash flow information: |
||||||||||||
| Cash paid during the period: |
||||||||||||
| Interest |
$ | 17,519 | $ | 18,914 | $ | 31,091 | ||||||
| Income taxes |
4,163 | 2,479 | 543 | |||||||||
|
|
|
|||||||||||
Non-cash investing and financing activities (see Note 4):
The Company included non-cash holdback amounts totaling $1,849, $376 and $1,044 as part of the consideration for business acquisitions during the year ended June 30, 2016, 2017 and 2018, respectively.
The accompanying notes are an integral part of these consolidated financial statements.
F-7
Table of Contents
GENERAL FINANCE CORPORATION AND SUBSIDIARIES
NOTES TO CONSOLIDATED FINANCIAL STATEMENTS
Note 1. Organization and Business Operations
General Finance Corporation (“GFN”) was incorporated in Delaware in October 2005. References to the “Company” in these Notes are to GFN and its consolidated subsidiaries. These subsidiaries include GFN U.S. Australasia Holdings, Inc., a Delaware corporation (“GFN U.S.”); GFN Insurance Corporation, an Arizona corporation (“GFNI”); GFN North America Leasing Corporation, a Delaware corporation (“GFNNA Leasing”); GFN North America Corp., a Delaware corporation (“GFNNA”); GFN Realty Company, LLC, a Delaware limited liability company (“GFNRC”); GFN Manufacturing Corporation, a Delaware corporation (“GFNMC”), and its subsidiary, Southern Frac, LLC, a Texas limited liability company (collectively “Southern Frac”); Pac-Van, Inc., an Indiana corporation, and its Canadian subsidiary, PV Acquisition Corp., an Alberta corporation (collectively “Pac-Van”); and Lone Star Tank Rental Inc., a Delaware corporation (“Lone Star”); GFN Asia Pacific Holdings Pty Ltd, an Australian corporation (“GFNAPH”), and its subsidiaries, GFN Asia Pacific Finance Pty Ltd, an Australian corporation (“GFNAPF”), Royal Wolf Holdings Limited, an Australian corporation (“RWH”), and its Australian and New Zealand subsidiaries (collectively, “Royal Wolf”).
The Company does business in three distinct, but related industries, mobile storage, modular space and liquid containment (which are collectively referred to as the “portable services industry”), in two geographic areas; the Asia-Pacific (or Pan-Pacific) area, consisting of Royal Wolf (which leases and sells storage containers, portable container buildings and freight containers in Australia and New Zealand) and North America, consisting of Pac-Van (which leases and sells storage, office and portable liquid storage tank containers, modular buildings and mobile offices) and Lone Star (which leases portable liquid storage tank containers and containment products, as well as provides certain fluid management services, to the oil and gas industry in the Permian and Eagle Ford basins of Texas), which are combined to form our North American leasing operations, and Southern Frac (which manufactures portable liquid storage tank containers and other steel-related products).
Note 2. Summary of Significant Accounting Policies
Basis of Presentation
The consolidated financial statements have been prepared on the accrual basis of accounting in accordance with accounting principles generally accepted in the United States.
Unless otherwise indicated, references to “FY 2016,” “FY 2017” and “FY 2018” are to the fiscal years ended June 30, 2016, 2017 and 2018, respectively.
Principles of Consolidation
The consolidated financial statements include the accounts of the Company and its wholly-owned and majority-owned subsidiaries. All significant intercompany accounts and transactions have been eliminated.
Foreign Currency Translation
The Company’s functional currencies for its foreign operations are the respective local currencies, the Australian (“AUS”) and New Zealand (“NZ”) dollars in the Asia-Pacific area and the Canadian (“C”) dollar in North America. All adjustments resulting from the translation of the accompanying consolidated financial statements from the functional currency into reporting currency are recorded as a component of stockholders’ equity in accordance with Financial Accounting Standards Board (“FASB”) Accounting Standards Codification (“ASC”) Topic 830, Foreign Currency Matters. All assets and liabilities are translated at the rates in effect at the balance sheet dates; and revenues, expenses, gains and losses are translated using the average exchange rates during the periods. Transactions in foreign currencies are translated at the foreign exchange rate prevailing at the date of the transaction. Monetary assets and liabilities denominated in foreign currencies at the balance sheet date are translated to the functional currency at the foreign exchange rate prevailing at that date. Foreign exchange differences arising on translation are recognized in the statement of operations. Non-monetary assets and liabilities that are measured in terms of historical cost in a foreign currency are translated using the exchange rate at the date of the transaction. Non-monetary assets and liabilities denominated in foreign currencies that are stated at fair value are translated to the functional currency at foreign exchange rates prevailing at the dates the fair value was determined.
F-8
Table of Contents
GENERAL FINANCE CORPORATION AND SUBSIDIARIES
NOTES TO CONSOLIDATED FINANCIAL STATEMENTS
Segment Information
FASB ASC Topic 280, Segment Reporting, establishes standards for the way companies report information about operating segments in annual financial statements. It also establishes standards for related disclosures about products and services, geographic areas and major customers. Based on the provisions of FASB ASC Topic 280 and the manner in which the chief operating decision maker analyzes the business, the Company has determined it has two separately reportable geographic areas that include four operating segments, North America (leasing and manufacturing, including corporate headquarters) and the Asia-Pacific area (the leasing operations of Royal Wolf).
Use of Estimates
The preparation of consolidated financial statements in conformity with accounting principles generally accepted in the United States requires management to make estimates and assumptions that affect the reported amounts of assets and liabilities and disclosure of contingent assets and liabilities at the date of the consolidated financial statements, and the reported amounts of revenues and expenses during the reporting period. Actual results could differ from those estimates. Material estimates that are particularly susceptible to significant changes include assumptions used in assigning value to identifiable intangible assets at the acquisition date, the assessment for impairment of goodwill, the assessment for impairment of other intangible assets, the allowance for doubtful accounts, share-based compensation expense, residual value of the lease fleet and deferred tax assets and liabilities. Assumptions and factors used in the estimates are evaluated on an annual basis or whenever events or changes in circumstances indicate that the previous assumptions and factors have changed. The results of the analysis could result in adjustments to estimates.
Cash Equivalents
The Company considers highly liquid investments with maturities of three months or less, when purchased, to be cash equivalents. The Company maintains its cash in bank deposit accounts that, at times, may exceed federally insured limits. The Company has not experienced any losses in such accounts. The Company believes it is not exposed to any significant credit risk on its cash balances.
Inventories
Inventories are stated at the lower of cost or fair value (net realizable value) and consist of primarily finished goods for containers, modular buildings and mobile offices held for sale or lease; as well as raw materials, work in-process and finished goods of manufactured portable liquid storage tank containers. Costs for leasing operations are assigned to individual items on the basis of specific identification and include expenditures incurred in acquiring the inventories and bringing them to their existing condition and location; while costs for manufactured units are determined using the first-in, first-out method. Net realizable value is the estimated selling price in the ordinary course of business. Expenses of marketing, selling and distribution to customers, as well as costs of completion, are estimated and are deducted from the estimated selling price to establish net realizable value. Inventories are comprised of the following (in thousands):
| June 30, | ||||||||
|
|
|
|||||||
| 2017 | 2018 | |||||||
|
|
|
|||||||
| Finished goods |
$ | 25,564 | $ | 18,971 | ||||
| Work in-process |
1,844 | 1,442 | ||||||
| Raw materials |
2,240 | 2,318 | ||||||
|
|
|
|||||||
| $ | 29,648 | $ | 22,731 | |||||
|
|
|
|||||||
Derivative Financial Instruments
The Company may use derivative financial instruments to hedge its exposure to foreign currency and interest rate risks arising from operating, financing and investing activities. The Company does not hold or issue derivative financial instruments for trading purposes. However, derivatives that do not qualify for hedge accounting are accounted for as trading instruments. Derivative financial instruments are recognized initially at fair value. Subsequent to initial recognition, derivative financial instruments are stated at fair value. The gain or loss on the remeasurement to fair value on unhedged (or the ineffective portion of hedged) derivative financial instruments is recognized in the statement of operations. Also, as more fully discussed in Note 5, the Company accounts for the fair value of an embedded derivative in a convertible note that required bifurcation.
F-9
Table of Contents
GENERAL FINANCE CORPORATION AND SUBSIDIARIES
NOTES TO CONSOLIDATED FINANCIAL STATEMENTS
Accounting for Stock Options
For the issuances of stock options, the Company follows the fair value provisions of FASB ASC Topic 718, Stock Compensation, which require recognition of employee share-based compensation expense in the statements of operations over the vesting period based on the fair value of the stock option at the grant date. For stock options granted to non-employee consultants, the Company recognizes compensation expense measured at their fair value at each reporting date. Therefore, the stock options issued to non-employee consultants are subject to periodic fair value adjustments recorded in share-based compensation over the vesting period.
Fair Value
Fair values of financial instruments are estimated using relevant market information and other assumptions, as more fully disclosed in Note 6. Fair value estimates would involve uncertainties and matters of significant judgment regarding interest rates, credit risk, prepayments and other factors, especially in the absence of broad markets for particular items. Changes in assumptions or in market conditions could significantly affect these estimates
Property, Plant and Equipment
Owned assets
Property, plant and equipment are stated at cost, less accumulated depreciation and impairment losses. The cost of self-constructed assets includes the cost of materials, direct labor, the initial estimate (where relevant) of the costs of dismantling and removing the items and restoring the site on which they are located; and an appropriate allocation of production overhead, where applicable. Depreciation for property, plant and equipment is recorded on the straight-line basis over the estimated useful lives of the related asset. The residual value, the useful life and the depreciation method applied to an asset are reassessed at least annually.
Property, plant and equipment consist of the following (in thousands):
| Estimated Useful Life |
June 30, | |||||||||||
|
|
|
|||||||||||
| 2017 | 2018 | |||||||||||
|
|
|
|||||||||||
| Land |
— | $ | 2,168 | $ | 2,168 | |||||||
| Building and improvements |
10 — 40 years | 4,890 | 4,893 | |||||||||
| Transportation and plant equipment (including capital lease assets) |
3 — 20 years | 39,899 | 43,078 | |||||||||
| Furniture, fixtures and office equipment |
3 — 10 years | 10,683 | 11,959 | |||||||||
|
|
|
|||||||||||
| 57,640 | 62,098 | |||||||||||
| Less accumulated depreciation and amortization |
(34,252) | (39,788) | ||||||||||
|
|
|
|||||||||||
| $ | 23,388 | $ | 22,310 | |||||||||
|
|
|
|||||||||||
Capital leases
Leases under which substantially all the risks and benefits incidental to ownership of the leased assets are assumed by the Company are classified as capital leases. Other leases are classified as operating leases. A lease asset and a lease liability equal to the present value of the minimum lease payments, or the fair value of the leased item, whichever is the lower, are capitalized and recorded at the inception of the lease. Lease payments are apportioned between the finance charges and reduction of the lease liability so as to achieve a constant rate of interest on the remaining balance of the liability. Finance charges are charged directly to the statement of operations. Capitalized leased assets are depreciated over the shorter of the estimated useful life of the asset or the lease term. Capitalized leased assets as of June 30, 2018 and 2017, include gross costs of $6,660,000 and $4,440,000, and accumulated
amortization of $3,247,000 and $2,047,000, resulting in a net book value of $3,413,000 and $2,393,000, respectively.
F-10
Table of Contents
GENERAL FINANCE CORPORATION AND SUBSIDIARIES
NOTES TO CONSOLIDATED FINANCIAL STATEMENTS
Operating leases
Payments made under operating leases are expensed on the straight-line basis over the term of the lease, except where an alternative basis is more representative of the pattern of benefits to be derived from the leased property. Where leases have fixed rate increases, these increases are accrued and amortized over the entire lease period, yielding a constant periodic expense over the term of the lease.
Lease Fleet
The Company has a fleet of storage, portable building, office and portable liquid storage tank containers, mobile offices, modular buildings and steps that it primarily leases to customers under operating lease agreements with varying terms. The value of the lease fleet (or lease or rental equipment) is recorded at cost and depreciated on the straight-line basis over the estimated useful life (5 - 20 years), after the date the units are put in service, down to their estimated residual values (up to 70% of cost). In the opinion of management, estimated residual values are at or below net realizable values. The Company periodically reviews these depreciation policies in light of various factors, including the practices of the larger competitors in the industry, and its own historical experience. Costs incurred on lease fleet units subsequent to initial acquisition are capitalized when it is probable that future economic benefits in excess of the originally assessed performance will result; otherwise, they are expensed as incurred. At June 30, 2017 and 2018, the gross costs of the lease fleet were $534,197,000 and $555,263,000, respectively. Units in the lease fleet are also available for sale. The cost of sales of a unit in the lease fleet is recognized at the carrying amount at the date of sale.
Impairment of Long-Lived Assets
The Company periodically reviews for the impairment of long-lived assets and assesses when an event or change in circumstances indicates the carrying value of an asset may not be recoverable. An impairment loss would be recognized when estimated future cash flows expected to result from the use of the asset and the eventual disposition is less than its carrying amount. The Company has determined that no impairment provision related to long-lived assets was required to be recorded as of June 30, 2017 and 2018.
Goodwill
The purchase consideration of acquired businesses have been allocated to the assets and liabilities acquired based on the estimated fair values on the respective acquisition dates (see Note 4). Based on these values, the excess purchase consideration over the fair value of the net assets acquired was allocated to goodwill. The Company accounts for goodwill in accordance with FASB ASC Topic 350, Intangibles — Goodwill and Other. FASB ASC Topic 350 prohibits the amortization of goodwill and intangible assets with indefinite lives and requires these assets be reviewed for impairment. The Company operates two reportable geographic areas and the vast majority of goodwill recorded was in the acquisitions of Royal Wolf, Pac-Van, Southern Frac and Lone Star.
The Company assesses the potential impairment of goodwill on an annual basis or if a determination is made based on a qualitative assessment that it is more likely than not (i.e., greater than 50%) that the fair value of the reporting unit is less than its carrying amount. Qualitative factors which could cause an impairment include (1) significant underperformance relative to historical, expected or projected future operating results; (2) significant changes in the manner of use of the acquired businesses or the strategy for the Company’s overall business; (3) significant changes during the period in the Company’s market capitalization relative to net book value; and (4) significant negative industry or general economic trends. Prior to June 30, 2017, if the Company did determine that fair value is more likely than not less than the carrying amount, a quantitative two-step impairment test process would be applied. The first step in this quantitative process is a screen for potential impairment where the fair value of the reporting unit is compared to its carrying value to determine if the goodwill is impaired. If the fair value of the reporting unit exceeds the carrying value of the net assets assigned to that unit, then goodwill is not impaired and no further testing is required. If, however, the carrying value of the net assets assigned to the reporting unit were to exceed its fair value, then the second step is performed by determining the implied fair value of a reporting unit’s goodwill and comparing it to the carrying value of the goodwill. This would involve allocating the fair value of the reporting unit to its respective assets and liabilities (as if it had been acquired in a separate and individual business combination and the fair value was the price paid to acquire it), with the excess of the fair value over the amounts assigned being the implied fair value of goodwill. If the implied fair value is less than the carrying value of the goodwill, an impairment loss would be recorded for the difference. In January 2017, the FASB issued Accounting Standards Update (“ASU”) No. 2017-04, which removed the requirement for a Step 2 goodwill impairment test and permitted early adoption for interim or annual goodwill impairment tests performed on dates on
F-11
Table of Contents
GENERAL FINANCE CORPORATION AND SUBSIDIARIES
NOTES TO CONSOLIDATED FINANCIAL STATEMENTS
or after January 1, 2017. The Company adopted ASU No. 2017-04 effective June 30, 2017 and any goodwill impairment will now be the amount by which a reporting unit’s carrying value exceeds its fair value, but the loss recognized should not exceed the total amount of goodwill allocated to that reporting unit.
During FY 2016, the Company determined that qualitative factors in its North American leasing and manufacturing operations, pertaining primarily to conditions in the oil and gas market, required an update of the step one impairment analysis for Lone Star and Southern Frac. This updated analysis calculated that even though the excess of the estimated fair value of Lone Star over the carrying value of its invested capital declined to approximately 11% of the book value of its net assets, its implied value of goodwill was still greater than its carrying value. However, the Company determined that the implied value of Southern Frac’s goodwill was less than the carrying value of its goodwill, resulting in an impairment charge of $2,681,000 at March 31, 2016. The Company’s annual impairment assessment at June 30, 2017 and 2018 concluded that the fair value of the goodwill of each of its reporting units was greater than their respective carrying amounts. Determining the fair value of a reporting unit requires judgment and involves the use of significant estimates and assumptions. The Company based its fair value estimates on assumptions that it believes are reasonable, but are uncertain and subject to changes in market conditions.
The change in the balance of goodwill was as follows (in thousands):
| June 30, | ||||||||||||
|
|
|
|||||||||||
| 2016 | 2017 | 2018 | ||||||||||
|
|
|
|||||||||||
| Beginning of year (a) |
$ | 99,344 | $ | 102,546 | $ | 105,129 | ||||||
| Additions to goodwill |
6,367 | 1,673 | 5,827 | |||||||||
| Impairment of goodwill |
(2,681) | — | — | |||||||||
| Other adjustments, primarily foreign translation effect |
(484) | 910 | (1,013) | |||||||||
|
|
|
|||||||||||
| End of year (b) |
$ | 102,546 | $ | 105,129 | $ | 109,943 | ||||||
|
|
|
|||||||||||
| (a) | Net of accumulated impairment losses of $13,491 at June 30, 2015, and $16,172 at June 30, 2016 and 2017. |
| (b) | Net of accumulated impairment losses of $16,172 at June 30, 2016, 2017 and 2018. |
Goodwill recorded from domestic acquisitions of businesses under asset purchase agreements is deductible for U.S. federal income tax purposes over 15 years, even though goodwill is not amortized for financial reporting purposes.
Intangible Assets
Intangible assets include those with indefinite (trademark and trade name) and finite (primarily customer base and lists, non-compete agreements and deferred financing costs) useful lives. Customer base and lists and non-compete agreements are amortized on the straight-line basis over the expected period of benefit which range from one to fourteen years. Costs to obtain long-term financing are deferred and amortized over the term of the related revolving line of credit senior debt using the straight-line method. Amortizing the deferred financing costs using the straight-line method does not produce significantly different results than that of the effective interest method. Intangible assets consist of the following (in thousands):
| June 30, 2017 | June 30, 2018 | |||||||||||||||||||||||
|
|
|
|||||||||||||||||||||||
| Gross Carrying Amount |
Accumulated Amortization |
Net Carrying Amount |
Gross Carrying Amount |
Accumulated Amortization |
Net Carrying Amount |
|||||||||||||||||||
|
|
|
|||||||||||||||||||||||
| Trademark and trade name |
$ | 5,486 | $ | (453) | $ | 5,033 | $ | 5,486 | $ | (453) | $ | 5,033 | ||||||||||||
| Customer base and lists |
47,647 | (31,223) | 16,424 | 29,057 | (14,150) | 14,907 | ||||||||||||||||||
| Non-compete agreements |
9,622 | (6,678) | 2,944 | 9,005 | (7,130) | 1,875 | ||||||||||||||||||
| Deferred financing costs |
4,855 | (2,250) | 2,605 | 3,522 | (1,905) | 1,617 | ||||||||||||||||||
| Other |
4,006 | (2,243) | 1,763 | 4,683 | (2,965) | 1,718 | ||||||||||||||||||
|
|
|
|||||||||||||||||||||||
| $ | 71,616 | $ | (42,847) | $ | 28,769 | $ | 51,753 | $ | (26,603) | $ | 25,150 | |||||||||||||
|
|
|
|||||||||||||||||||||||
F-12
Table of Contents
GENERAL FINANCE CORPORATION AND SUBSIDIARIES
NOTES TO CONSOLIDATED FINANCIAL STATEMENTS
The Company reviews intangible assets (those assets resulting from acquisitions) for impairment if it determines, based on a qualitative assessment, that it is more likely than not (i.e., greater than 50%) that fair value might be less than the carrying amount. If the Company determines that fair value is more likely than not less than the carrying amount, then impairment would be quantitatively tested, using historical cash flows and other relevant facts and circumstances as the primary basis for estimates of future cash flows. If it determines that fair value is not likely to be less than the carrying amount, then no further testing would be required. The Company conducted its review at each yearend, which did not result in an impairment adjustment at June 30, 2017 and 2018, but did result in an impairment write-down at June 30, 2016 of $387,000 to the carrying amount of the trade name recorded at Southern Frac. This write-down is included in the caption “Impairment of goodwill and trade name” in the accompanying consolidated statements of operations. Determining the fair value of intangible assets involves the use of significant estimates and assumptions, which the Company believes are reasonable, but are uncertain and subject to changes in market conditions.
The estimated future amortization of intangible assets with finite useful lives as of June 30, 2018 is as follows (in thousands):
| Year Ending June 30, |
||||
| 2019 |
$ | 5,488 | ||
| 2020 |
3,755 | |||
| 2021 |
2,687 | |||
| 2022 |
2,134 | |||
| 2023 |
1,474 | |||
| Thereafter |
4,579 | |||
|
|
|
|||
| $ | 20,117 | |||
|
|
|
The weighted-average remaining useful life of the finite intangible assets was approximately 9.0 years at June 30, 2018.
Defined Contribution Benefit Plan
Obligations for contributions to defined contribution benefit plans are recognized as an expense in the statement of operations as incurred. Contributions to defined contribution benefit plans in FY 2016, FY 2017 and FY 2018 were $1,507,000, $1,586,000 and $1,552,000, respectively.
Revenue Recognition
The Company leases and sells new and used storage, office, building and portable liquid storage tank containers, modular buildings and mobile offices to its customers, as well as providing other ancillary products and services. Leases to customers generally qualify as operating leases unless there is a bargain purchase option at the end of the lease term. Revenue is recognized as earned in accordance with the lease terms established by the lease agreements and when collectability is reasonably assured. Revenue from sales of the lease fleet is generally recognized upon delivery and when collectability is reasonably assured and revenue from the sales of manufactured units are recognized when title and risk of loss transfers to the purchaser, generally upon shipment. Certain arrangements to sell units under long-term construction-type sales contracts are accounted for under the percentage of completion method. Under this method, income is recognized in proportion to the incurred costs to date under the contract to estimated total costs. There were no such arrangements in FY 2017 and FY 2018.
Unearned revenue includes end of lease services not yet performed by the Company (such as transport charges for the pick-up of a unit where the actual pick-up has not yet occurred as the unit is still leased), advance rentals and deposit payments.
Advertising
Advertising costs are generally expensed as incurred. Direct-response advertising costs are monitored through call logs and advertising source codes, are capitalized when paid and amortized over the period in which the benefit is derived. However, the amortization period of the prepaid balance never exceeds 12 months. At June 30, 2017 and 2018, prepaid advertising costs were not significant. Advertising costs expensed were approximately $3,284,000, $3,478,000 and $3,834,000 for FY 2016, FY 2017and FY 2018, respectively.
F-13
Table of Contents
GENERAL FINANCE CORPORATION AND SUBSIDIARIES
NOTES TO CONSOLIDATED FINANCIAL STATEMENTS
Shipping and Handling Costs
The Company reports shipping and handling costs, primarily related to outbound freight in its North American manufacturing operations, as a component of selling and general expenses. Shipping and handling costs totaled $219,000, $172,000 and $483,000 in FY 2016, FY 2017 and FY 2018, respectively. Freight charges billed to customers are recorded as revenue and included in sales.
Income Taxes
The Company uses the asset and liability method of accounting for income taxes. Under this method, deferred tax assets and liabilities are recorded for temporary differences between the financial reporting basis and income tax basis of assets and liabilities at the balance sheet date multiplied by the applicable tax rates. Valuation allowances are established when necessary to reduce deferred tax assets to the amount expected to be realized. Income tax expense is recorded for the amount of income tax payable or refundable for the period increased or decreased by the change in deferred tax assets and liabilities during the period. The Company files U.S. Federal tax returns, multiple U.S. state (and state franchise) tax returns and Australian, New Zealand and Canadian tax returns. For U.S. Federal tax purposes, all periods subsequent to June 30, 2014 are subject to examination by the U.S. Internal Revenue Service (“IRS”); and, for U.S. state tax purposes, with few exceptions and depending on the state, periods subsequent to June 30, 2012 are subject to examination by the respective state’s taxation authorities. Periods subsequent to June 30, 2014, June 30, 2013 and June 30, 2011 are subject to examination by the respective taxation authorities in Canada, Australia and New Zealand, respectively. Tax records are required to be kept for five years and seven years in Australia and New Zealand, respectively. The Company believes that its income tax filing positions and deductions would be sustained on audit and does not anticipate any adjustments that would result in a material change. Therefore, no reserves for uncertain income tax positions have been recorded. In addition, the Company does not anticipate that the total amount of unrecognized tax benefit related to any particular tax position will change significantly within the next 12 months. The Company’s policy for recording interest and penalties, if any, will be to record such items as a component of income taxes.
Recently Enacted U.S. Federal Tax Legislation
Introduced initially as the Tax Cuts and Jobs Act, the Act to Provide for Reconciliation Pursuant to Titles II and V of the Concurrent Resolution on the Budget for Fiscal Year 2018 (the “Act”) was enacted on December 22, 2017. The Act applies to corporations generally beginning with taxable years starting after December 31, 2017, or the fiscal year ending June 30, 2019 for the Company, and reduces the corporate tax rate from a graduated set of rates with a maximum 35% tax rate to a flat 21% tax rate. Additionally, the Act introduces other changes that impact corporations, including a net operating loss (“NOL”) deduction annual limitation, an interest expense deduction annual limitation, elimination of the alternative minimum tax, and immediate expensing of the full cost of qualified property. The Act also introduces an international tax reform that moves the U.S. toward a territorial system, in which income earned in other countries will generally not be subject to U.S. taxation. However, the accumulated foreign earnings of certain foreign corporations will be subject to a one-time transition tax, which can be elected to be paid over an eight-year tax transition period, using specified percentages, or in one lump sum. NOL and foreign tax credit (“FTC”) carryforwards can be used to offset the transition tax liability. Any transition tax to be paid on accumulated foreign earnings is not expected to be significant since the Company has available NOL and FTC carryforwards to offset any transitional taxes that would be otherwise payable.
In accordance with ASC Topic 740, Income Taxes, the Company re-measured its deferred income tax assets and liabilities for, among other things, temporary differences and NOL and FTC carryforwards reasonably estimated to be existing at December 22, 2017, from the current statutory rate of 35% to the new corporate rate of either 28% (if the temporary timing differences are expected to roll off in FY 2018) or 21 percent (if the temporary timing differences and NOL carryforwards are expected to remain as of June 30, 2018). This re-measurement resulted in an estimated benefit of approximately $6,979,000, which was recognized through the provision (benefit) for income taxes in the accompanying consolidated statements of operations. This estimated tax benefit was offset by approximately $4,843,000 for the estimated transition tax and a valuation allowance of $330,000 that was established to offset previously recognized FTC carryforward deferred tax assets that the Company believes will not be realized, and other adjustments totaling approximately $299,000. Both the estimated transition tax and valuation allowance are considered provisional amounts that require further analysis. These provisional amounts are subject to adjustment during a measurement period which should not extend beyond one year from the enactment date of the Act as in accordance with Staff Accounting Bulletin No. 118.
F-14
Table of Contents
GENERAL FINANCE CORPORATION AND SUBSIDIARIES
NOTES TO CONSOLIDATED FINANCIAL STATEMENTS
Net Income per Common Share
Basic net income per common share is computed by dividing net income attributable to common stockholders by the weighted-average number of shares of common stock outstanding during the periods. Diluted net income per common share reflects the potential dilution that could occur if securities or other contracts to issue common stock were exercised, vested or converted into common stock or resulted in the issuance of common stock that then shared in the earnings of the Company. The potential dilutive securities (common stock equivalents) the Company had outstanding related to stock options, non-vested equity shares, restricted stock units and convertible debt. The following is a reconciliation of weighted average shares outstanding used in calculating earnings per common share:
|
|
|
|||||||||||
| FY 2016 | FY 2017 | FY 2018 | ||||||||||
|
|
|
|||||||||||
| Basic |
26,060,823 | 26,348,344 | 26,269,931 | |||||||||
| Dilutive effect of common stock equivalents |
— | — | — | |||||||||
|
|
|
|||||||||||
| Diluted |
26,060,823 | 26,348,344 | 26,269,931 | |||||||||
|
|
|
|||||||||||
Potential common stock equivalents totaling 2,183,224, 1,635,025 and 5,475,347 for FY 2016, FY 2017 and FY 2018, respectively, have been excluded from the computation of diluted earnings per share because the effect is anti-dilutive.
Recently Issued Accounting Pronouncements
In May 2014, the FASB issued Accounting Standards Update (“ASU”) No. 2014-09, Revenue from Contracts with Customers (Topic 606). ASU 2014-09 completes the joint effort by the FASB and IASB to improve financial reporting by creating common revenue recognition guidance for U.S. GAAP and International Financial Reporting Standards (“IFRS”). The ASU 2014-09 revenue recognition model virtually replaces all existing revenue recognition guidance and applies to all companies that enter into contracts with customers to transfer goods or services. ASU 2014-09 (as updated by ASU 2015-14 in August 2015, ASU No. 2016-08 in March 2016, ASU No. 10 in April 2016, ASU No. 12 in May 2016 and ASU No. 2016-20 in December 2016) is effective for public entities for interim and annual reporting periods beginning after December 15, 2017. Public and nonpublic entities have the choice to apply ASU 2014-09 either retrospectively to each reporting period presented or by recognizing the cumulative effect of applying ASU 2014-09 at the date of initial application and not adjusting comparative information. The Company will adopt the new revenue standard in the first quarter of its fiscal year ending June 30, 2019 using the modified retrospective adoption method and does not expect the adoption to have a material impact on its consolidated financial statements,.
In February 2016, the FASB issued new lease accounting guidance in ASU No. 2016-02, Leases (Topic 842). This new guidance was initiated as a joint project with the International Accounting Standards Board to simplify lease accounting and improve the quality of and comparability of financial information for users. This new guidance, as updated by ASU No. 2018-01 (January 2018), ASU No. 2018-10 (July 2018) and ASU No. 2018-11 (July 2018), would eliminate the concept of off-balance sheet treatment for “operating leases” for lessees for the vast majority of lease contracts. Under ASU No. 2016-02, at inception, a lessee must classify all leases with a term of over one year as either finance or operating, with both classifications resulting in the recognition of a defined “right-of-use” asset and a lease liability on the balance sheet. However, recognition in the income statement will differ depending on the lease classification, with finance leases recognizing the amortization of the right-of-use asset separate from the interest on the lease liability and operating leases recognizing a single total lease expense. Lessor accounting under ASU No. 2016-02 would be substantially unchanged from the previous lease requirements under U.S. GAAP. ASU No. 2016-02 will take effect for public companies in fiscal years beginning after December 15, 2018, including interim periods within those fiscal years. Early adoption is permitted and for leases existing at, or entered into after, the beginning of the earliest comparative period presented in the financial statements, lessees and lessors must apply a modified retrospective transition approach. During FY 2018, the Company evaluated this new accounting standard and engaged professionals in the new lease accounting implementation and related real estate consulting industry to assist in determining the effect of the new standard as of July 1, 2018. The Company currently has over 120 real estate leases worldwide and evaluated each of these leases in accordance with the new lease accounting standard under ASC Topic 842. As of July 1, 2018, the Company estimates that the right of use asset to be recorded on its consolidated balance sheet would be approximately $59.0 million to $68.3 million and that the related liability would be approximately $60.8 million to $70.2 million related to operating leases. The difference between the right of use asset and related lease liability is predominantly deferred rent and other related lease expenses under the new lease accounting standard. The difference in the ranges is due to the presumed renewal of leases whereby the exercise of the renewal
F-15
Table of Contents
GENERAL FINANCE CORPORATION AND SUBSIDIARIES
NOTES TO CONSOLIDATED FINANCIAL STATEMENTS
option is twelve months or less from July 1, 2018. The Company will continue to evaluate existing renewal options in excess of one year as to the probability of exercising renewal options and is currently evaluating its equipment and other finance leases and its lessor accounting under the new standard. In addition, the Company is evaluating its proposed transition method in accordance with guidance issued by the FASB in July 2018. The Company will continue this effort in a manner to be appropriately prepared for its implementation on or before July 1, 2019.
In March 2016, the FASB issued ASU No. 2016-09, Compensation – Stock Compensation (Topic 718). Under ASU No. 2016-09, all excess tax benefits and tax deficiencies related to equity compensation will be recognized in the income statement as they occur. This will replace the current guidance, which requires tax benefits that exceed compensation cost (windfalls) to be recognized in equity, and tax deficiencies (shortfalls) to be recognized in equity to the extent of previously recognized windfalls. It will also eliminate the need to maintain a “windfall pool,” and will remove the requirement to delay recognizing a windfall until it reduces current taxes payable. ASU No. 2016-09 will also change the cash flow presentation of excess tax benefits, classifying them as operating inflows, consistent with other cash flows related to income taxes. In addition, this ASU allows a policy election to either continue to reduce share-based compensation expense for forfeitures in future periods, or to recognize forfeitures as they occur. The Company implemented ASU No. 2016-09 in FY 2018, elected to recognize forfeitures as they occur and, because it was not significant, recorded the $107,000 tax charge for the cumulative-effect adjustment for previously unrecognized excess tax benefits and the tax-effect of the difference between the fair value estimate of awards historically expected to be forfeited and the fair value estimate of awards actually forfeited in the accompanying consolidated statement of operations. The tax effect for excess tax benefits and forfeitures in FY 2018 was a tax benefit of $38,000.
In August 2017, the FASB issued ASU No. 2017-12, Derivatives and Hedging (Topic 815) – Targeted Improvements to Accounting for Hedging Activities. ASU No. 2017-12 expands hedge accounting for both non-financial and financial risk components and refines the measurement of hedge results in an attempt to better reflect an entity’s hedging strategies. The ASU also amends the presentation and disclosure requirements and changes how entities assess hedge effectiveness. The effective date of ASU No. 2017-12 for public companies is for fiscal years beginning after December 15, 2018 and interim periods within those fiscal years, though early adoption is permitted. The new standard must be adopted using a modified retrospective transition with a cumulative effect adjustment recorded to opening retained earnings as of the initial adoption date. The Company is evaluating the effect that ASU No. 2017-12 will have on the consolidated financial statements and related disclosures, but does not currently believe it will be significant.
Note 3. Equity Transactions
Preferred Stock
Upon issuance of shares of preferred stock, the Company records the liquidation value as the preferred equity in the consolidated balance sheet, with any underwriting discount and issuance or offering costs recorded as a reduction in additional paid-in capital.
Series B Preferred Stock
The Company has outstanding privately-placed 8.00% Series B Cumulative Preferred Stock, par value of $0.0001 per share and liquidation value of $1,000 per share (“Series B Preferred Stock”). The Series B Preferred Stock is offered primarily in connection with business combinations. At June 30, 2017 and June 30, 2018, the Company had outstanding 100 shares of Series B Preferred Stock with an aggregate liquidation preference totaling $102,000. The Series B Preferred Stock is not convertible into GFN common stock, has no voting rights, except as required by Delaware law, and is redeemable after February 1, 2014; at which time it may be redeemed at any time, in whole or in part, at the Company’s option. Holders of the Series B Preferred Stock are entitled to receive, when declared by the Company’s Board of Directors, annual dividends payable quarterly in arrears on the 31st day of January, July and October and on the 30th day of April of each year. In the event of any liquidation or winding up of the Company, the holders of the Series B Preferred Stock will have preference to holders of common stock.
F-16
Table of Contents
GENERAL FINANCE CORPORATION AND SUBSIDIARIES
NOTES TO CONSOLIDATED FINANCIAL STATEMENTS
Series C Preferred Stock
The Company has outstanding publicly-traded 9.00% Series C Cumulative Redeemable Perpetual Preferred Stock, liquidation preference $100.00 per share (the “Series C Preferred Stock”). At June 30, 2017 and 2018, the Company had outstanding 400,000 shares of Series C Preferred Stock with an aggregate liquidation preference totaling $40,620,000. Dividends on the Series C Preferred Stock are cumulative from the date of original issue and will be payable on the 31st day of each January, July and October and on the 30th day of April when, as and if declared by the Company’s Board of Directors. Commencing on May 17, 2018, the Company may redeem, at its option, the Series C Preferred Stock, in whole or in part, at a cash redemption price of $100.00 per share, plus any accrued and unpaid dividends to, but not including, the redemption date. Among other things, the Series C Preferred Stock has no stated maturity, is not subject to any sinking fund or other mandatory redemption, and is not convertible into or exchangeable for any of the Company’s other securities. Holders of the Series C Preferred Stock generally will have no voting rights, except for limited voting rights if dividends payable on the outstanding Series C Preferred Stock are in arrears for six or more consecutive or non-consecutive quarters, and under certain other circumstances. If the Company fails to maintain the listing of the Series C Preferred Stock on the NASDAQ Stock Market (“NASDAQ”) for 30 days or more, the per annum dividend rate will increase by an additional 2.00% per $100.00 stated liquidation value ($2.00 per annum per share) so long as the listing failure continues. In addition, in the event of any liquidation or winding up of the Company, the holders of the Series C Preferred Stock will have preference to holders of common stock and are pair passu with the Series B Preferred Stock. The Series C Preferred Stock is listed on NASDAQ under the symbol “GFNCP.”
Dividends
As of June 30, 2018, since issuance, dividends paid or payable totaled $93,000 for the Series B Preferred Stock and dividends paid totaled $18,098,000 for the Series C Preferred Stock. The characterization of dividends to the recipients for Federal income tax purposes is made based upon the earnings and profits of the Company, as defined by the Internal Revenue Code.
Royal Wolf Dividends
On August 12, 2015, the Board of Directors of Royal Wolf declared a dividend of AUS$0.05 per RWH share payable on October 2, 2015 to shareholders of record on September 17, 2015; and on February 8, 2016, the Board of Directors of Royal Wolf declared a dividend of AUS$0.03 per RWH share payable on April 4, 2016 to shareholders of record on March 16, 2016, respectively.
On August 10, 2016, the Board of Directors of Royal Wolf declared a dividend of AUS$0.025 per RWH share payable on October 4, 2016 to shareholders of record on September 16, 2016 and on February 7, 2017, the Board of Directors of Royal Wolf declared a dividend of AUS$0.025 per RWH share payable on April 4, 2017 to shareholders of record on March 16, 2017.
On August 2, 2017, Royal Wolf paid a special dividend of AUS$0.0265 per RWH share to shareholders of record on July 18, 2017 (see Note 4).
The consolidated financial statements reflect the amount of the dividends pertaining to the noncontrolling interest.
Note 4. Acquisitions
The Company can enhance its business and market share by entering into new markets in various ways, including starting up a new location or acquiring a business consisting of container, modular unit or mobile office assets of another entity. An acquisition generally provides the Company with operations that enables it to at least cover existing overhead costs and is preferable to a start-up or greenfield location. The acquisition(s) discussed below were completed primarily to expand the Company’s container lease fleet. The accompanying consolidated financial statements include the operations of the acquired businesses from the dates of acquisition.
F-17
Table of Contents
GENERAL FINANCE CORPORATION AND SUBSIDIARIES
NOTES TO CONSOLIDATED FINANCIAL STATEMENTS
FY 2016 Acquisitions
On August 28, 2015, the Company, through Pac-Van, purchased the business of Mobile Storage Solutions of Mo., LLC (“MSS”) for $1,497,000, which included a deferred purchase price promissory note of $613,000, bearing interest at 2.00% per annum and due in January 2016, and a holdback amount of $139,000. MSS leased and sold storage and office containers and storage trailers in Springfield, Missouri.
On October 16, 2015, the Company, through Pac-Van, purchased the container business of McKinney Trailer Rentals, Inc., d/b/a McKinney Container Rentals & Sales (“McKinney”), for $15,264,000, which included holdback and other adjustment amounts totaling $940,000. McKinney leased and sold storage (including refrigerated) containers and chassis and other units in the Seattle and Tacoma area.
On October 29, 2015, the Company, through Royal Wolf, purchased the container business of Spacewise (Aust) Pty Limited (“Spacewise”), for $281,000 (AUS$390,000), which included holdback and other adjustment amounts totaling $56,000 (AUS$78,000). Spacewise is based in Sydney, New South Wales.
On December 23, 2015, the Company, through Royal Wolf, purchased the container business of W.A. Container Services Pty Limited (“W.A. Container”), for $321,000 (AUS$439,000), which included holdback and other adjustment amounts totaling $66,000 (AUS$90,000). W.A. Container is based in Perth, West Australia.
On February 19, 2016, the Company, through Pac-Van, purchased the container business of Box Service Company, Inc. (“BSC”) for $461,000, which included a holdback of $35,000. BSC is based in Houston, Texas.
On April 4, 2016, the Company, through Pac-Van, purchased the container business of Aran Trading, Ltd. (“Aran”), for $4,755,000, which included a holdback of $500,000 paid to an escrow account. Aran, which is located in Salisbury, Massachusetts, leases and sells storage containers and trailers in the New England area.
The allocations for the acquisitions in FY 2016 to tangible and intangible assets acquired and liabilities assumed based on their estimated fair market values were as follows (in thousands):
| MSS August 28, 2015 |
McKinney October 16, 2015 |
Aran April 4, 2016 |
Other Acquisitions |
Total | ||||||||||||||||
|
|
|
|||||||||||||||||||
| Fair value of the net tangible assets acquired and liabilities assumed: |
||||||||||||||||||||
| Trade and other receivables |
$ | — | $ | 1,580 | $ | 97 | $ | — | $ | 1,677 | ||||||||||
| Inventories |
— | — | — | 23 | 23 | |||||||||||||||
| Prepaid expenses and other |
— | 8 | — | — | 8 | |||||||||||||||
| Property, plant and equipment |
60 | 531 | 206 | 77 | 874 | |||||||||||||||
| Lease fleet |
933 | 6,278 | 2,897 | 730 | 10,838 | |||||||||||||||
| Accounts payables and accrued liabilities |
— | (984) | — | (22) | (1,006) | |||||||||||||||
| Unearned revenue and advance payments |
(27) | (2) | (175) | (56) | (260) | |||||||||||||||
|
|
|
|||||||||||||||||||
| Total net tangible assets acquired and liabilities assumed |
966 | 7,411 | 3,025 | 752 | 12,154 | |||||||||||||||
| Fair value of intangible assets acquired: |
||||||||||||||||||||
| Non-compete agreement |
132 | 239 | 52 | 76 | 499 | |||||||||||||||
| Customer lists/relationships |
226 | 2,371 | 353 | 104 | 3,054 | |||||||||||||||
| Other |
— | 89 | 416 | — | 505 | |||||||||||||||
| Goodwill |
173 | 5,154 | 909 | 131 | 6,367 | |||||||||||||||
|
|
|
|||||||||||||||||||
| Total intangible assets acquired |
531 | 7,853 | 1,730 | 311 | 10,425 | |||||||||||||||
|
|
|
|||||||||||||||||||
| Total purchase consideration |
$ | 1,497 | $ | 15,264 | $ | 4,755 | $ | 1,063 | $ | 22,579 | ||||||||||
|
|
|
|||||||||||||||||||
Revenues and net income for McKinney since the date of acquisition in FY 2016 totaled $7,494,000 and $1,219,000, respectively. The FY 2016 operating results of all acquisitions prior to and since their respective dates of acquisition were not considered significant.
F-18
Table of Contents
GENERAL FINANCE CORPORATION AND SUBSIDIARIES
NOTES TO CONSOLIDATED FINANCIAL STATEMENTS
FY 2017 Acquisitions
On July 22, 2016, the Company, through Pac-Van, purchased the container business of The Great Container Company, Ltd. (“GCC”), for $662,000 (C$869,000), which included holdback and other adjustment amounts totaling $102,000 (C$133,000). GCC is located in Vancouver, British Columbia.
On July 27, 2016, the Company, through Pac-Van, purchased the business of Container Systems Storage, Inc. (“CSS”), for $1,667,000, which included holdback and other adjustment amounts totaling approximately $120,000. CSS, which is located in Yakima, Washington, leases and sells storage containers in the state of Washington and in northern Oregon.
On December 1, 2016, the Company, through Royal Wolf, purchased the container businesses of All Direct Container Sales Pty Limited and ADC Storage Pty Limited as Trustee for the ADC Storage Unit Trust (collectively “All Direct”), for $3,040,000 (AUS$4,109,000), which included holdback and other adjustment amounts totaling $154,000 (AUS$209,000). All Direct leases and sells containers in the southeast Queensland market, particularly in the Brisbane, Gold Coast and Toowoomba regions.
The allocations for the acquisitions in FY 2017 to tangible and intangible assets acquired and liabilities assumed based on their estimated fair market values was as follows (in thousands):
| GCC July 22, 2016 |
CSS July 27, 2016 |
All Direct December 1, 2016 |
Total | |||||||||||||
|
|
|
|||||||||||||||
| Fair value of the net tangible assets acquired and liabilities assumed: |
||||||||||||||||
| Trade and other receivables |
$ | 5 | $ | 57 | $ | — | $ | 62 | ||||||||
| Inventories |
66 | 211 | — | 277 | ||||||||||||
| Property, plant and equipment |
23 | 44 | 44 | 111 | ||||||||||||
| Lease fleet |
352 | 615 | 1,646 | 2,613 | ||||||||||||
| Accounts payables and accrued liabilities |
— | (7) | (45) | (52) | ||||||||||||
| Unearned revenue and advance payments |
(21) | (36) | — | (57) | ||||||||||||
| Deferred income taxes |
— | (241) | (201) | (442) | ||||||||||||
|
|
|
|||||||||||||||
| Total net tangible assets acquired and liabilities assumed |
425 | 643 | 1,444 | 2,512 | ||||||||||||
| Fair value of intangible assets acquired: |
||||||||||||||||
| Non-compete agreement |
21 | 29 | 350 | 400 | ||||||||||||
| Customer lists/relationships |
138 | 312 | 334 | 784 | ||||||||||||
| Goodwill |
78 | 683 | 912 | 1,673 | ||||||||||||
|
|
|
|||||||||||||||
| Total intangible assets acquired |
237 | 1,024 | 1,596 | 2,857 | ||||||||||||
|
|
|
|||||||||||||||
| Total purchase consideration |
$ | 662 | $ | 1,667 | $ | 3,040 | $ | 5,369 | ||||||||
|
|
|
|||||||||||||||
The FY 2017 operating results of all acquisitions prior to and since their respective dates of acquisition were not considered significant.
F-19
Table of Contents
GENERAL FINANCE CORPORATION AND SUBSIDIARIES
NOTES TO CONSOLIDATED FINANCIAL STATEMENTS
Acquisition of Noncontrolling Interest of Royal Wolf
On July 12, 2017, the Company announced that it commenced, through GFNAPH, an off-market takeover offer and entered into a binding takeover bid implementation agreement with the independent directors of RWH to acquire the approximately 49.2 million ordinary (common) shares of RWH not owned by the Company. The takeover offer was for AUS$1.83 per share in cash, less a special dividend declared by RWH of AUS$0.0265 per share (see Note 3), for total purchase consideration to be paid by the Company of AUS$88,712,000 ($70,401,000), or AUS$1.8035 per share. For the takeover offer, the Company used AUS$2,516,000 ($1,997,000) borrowed under its North America senior secured revolving credit facility (see Note 5) and received financing totaling $80,000,000 from Bison Capital Equity Partners V, L.P. and its affiliates (“Bison Capital”), of which $10,000,000 was used for the repayment of the term loan due to Credit Suisse AG, Singapore Branch (“Credit Suisse”) (See Note 5). At September 8, 2017, the closing of the takeover bid offer period, the Company received valid acceptances for approximately 48.1 million shares, which in combination with the 51.2 million RWH shares previously owned by the Company represented approximately 99% of the total shares outstanding. The Company deposited in escrow the entire amount of the purchase consideration required to acquire all 49.2 million of the RWH shares owned by the noncontrolling interest shareholders, with owners of the 48.1 million shares accepting the takeover bid offer paid on or before September 29, 2017, and the remaining 1.1 million shares paid on or around October 31, 2017.
The accounting for the purchase consideration and total transaction-related costs of $70,402,000 and $2,299,000 (net of income tax effect of $550,000), respectively, as well as the adjustment to the accumulated other comprehensive income (loss) and reclassification of the noncontrolling interest of Royal Wolf to the Company’s equity accounts, have been recorded as equity transactions in the accompanying consolidated balance sheet in FY 2018.
FY 2018 Acquisitions
On September 1, 2017, the Company, through Pac-Van, purchased the container businesses of Advantage Storage Trailer, LLC and Big Star Container, LLC (collectively “Advantage”) for approximately $1,576,000, which included a general indemnity holdback of $155,000. Advantage is located in Austin and San Antonio, Texas.
On December 1, 2017, the Company, through Pac-Van, purchased the container and mobile office business of Gauthier Homes, Inc. (“Gauthier”) for approximately $10,371,000, which included a general indemnity holdback of $457,000. Gauthier is located in Carencro (Lafayette) and Houma, Louisiana.
On January 26, 2018, the Company, through Pac-Van, purchased the container and storage trailer business of Lucky’s Lease, Inc. (“Lucky’s”) for approximately $3,369,000, which included a general indemnity and other holdbacks of $307,000. Lucky’s is located in South Royalton, Vermont.
On April 6, 2018, the Company, through Pac-Van, purchased the container and storage trailer business of Acorn Storage Trailers, Inc. (“Acorn”) for approximately $812,000, which included a general indemnity and other holdbacks of $125,000. Acorn is located in Bowling Green, Kentucky.
F-20
Table of Contents
GENERAL FINANCE CORPORATION AND SUBSIDIARIES
NOTES TO CONSOLIDATED FINANCIAL STATEMENTS
The allocation for the acquisition in FY 2018 to tangible and intangible assets acquired and liabilities assumed based on their estimated fair market values was as follows (in thousands):
| Advantage September 1, 2017 |
Gauthier December 1, 2017 |
Lucky’s Lease January 26, 2018 |
Acorn April 6, 2018 |
Total | ||||||||||||||||
|
|
|
|||||||||||||||||||
| Fair value of the net tangible assets acquired and liabilities assumed: |
||||||||||||||||||||
| Trade and other receivables |
$ | — | $ | 390 | $ | — | $ | — | $ | 390 | ||||||||||
| Inventories |
234 | 444 | 203 | 85 | 966 | |||||||||||||||
| Property, plant and equipment |
55 | 339 | 135 | 32 | 561 | |||||||||||||||
| Lease fleet |
558 | 4,216 | 1,092 | 341 | 6,207 | |||||||||||||||
| Unearned revenue and advance payments |
(25) | (237) | (36) | (14) | (312) | |||||||||||||||
|
|
|
|||||||||||||||||||
| Total net tangible assets acquired and liabilities assumed |
822 | 5,152 | 1,394 | 444 | 7,812 | |||||||||||||||
| Fair value of intangible assets acquired: |
||||||||||||||||||||
| Non-compete agreement |
56 | 143 | 44 | 130 | 373 | |||||||||||||||
| Customer lists/relationships |
97 | 1,085 | 676 | 8 | 1,866 | |||||||||||||||
| Other |
— | 250 | — | — | 250 | |||||||||||||||
| Goodwill |
601 | 3,741 | 1,255 | 230 | 5,827 | |||||||||||||||
|
|
|
|||||||||||||||||||
| Total intangible assets acquired |
754 | 5,219 | 1,975 | 368 | 8,316 | |||||||||||||||
|
|
|
|||||||||||||||||||
| Total purchase consideration |
$ | 1,576 | $ | 10,371 | $ | 3,369 | $ | 812 | $ | 16,128 | ||||||||||
|
|
|
|||||||||||||||||||
The FY 2018 operating results prior to and since the respective date of acquisition were not considered significant.
Goodwill recognized is attributable primarily to expected corporate synergies, the assembled workforce and other factors. In FY 2016, the goodwill recognized in the Spacewise and W.A. Container acquisitions is not deductible for U.S. income tax purposes, but all other goodwill recognized during FY 2016 is deductible. The estimated fair value of the tangible and intangible assets acquired and liabilities assumed exceeded the purchase prices of Spacewise resulting in estimated bargain purchase gain of $72,000 in FY 2016. This gain has been recorded as non-operating income in the accompanying consolidated statements of operations. In FY 2017, the goodwill recognized in the GCC, CSS and All Direct acquisitions are not deductible for U.S. income tax purposes. The goodwill recognized in the FY 2018 acquisitions is deductible for U.S. income tax purposes.
The Company incurred approximately $422,000 during FY 2016, $44,000 during FY 2017 and $163,000 during FY 2018 of incremental transaction costs associated with acquisition-related activity that were expensed as incurred and are included in selling and general expenses in the accompanying consolidated statements of operations.
F-21
Table of Contents
GENERAL FINANCE CORPORATION AND SUBSIDIARIES
NOTES TO CONSOLIDATED FINANCIAL STATEMENTS
Note 5. Senior and Other Debt
Asia-Pacific Leasing Senior Credit Facility
The Company’s operations in the Asia-Pacific area had an AUS$150,000,000 secured senior credit facility, as amended, under a common terms deed arrangement with the Australia and New Zealand Banking Group Limited (“ANZ”) and Commonwealth Bank of Australia (“CBA”) (the “ANZ/CBA Credit Facility”). On October 26, 2017, RWH and its subsidiaries, Deutsche Bank AG, Sydney Branch (“Deutsche Bank”), CSL Fund (PB) Lux Sarl II, Aiguilles Rouges Lux Sarl II, Perpetual Corporate Trust Limited and P.T. Limited entered into a Syndicated Facility Agreement (the “Syndicated Facility Agreement”). Pursuant to the Syndicated Facility Agreement, the parties entered into a three-year, $92,637,500 (AUS$125,000,000) senior secured credit facility (the “Deutsche Bank Credit Facility”) and repaid the ANZ/CBA Credit Facility on November 3, 2017. The Deutsche Bank Credit Facility initially consisted of a $14,822,000 (AUS$20,000,000) Facility A that will amortize semi-annually; a $62,993,500 (AUS$85,000,000) Facility B that has no scheduled amortization; and a $14,822,000 (AUS$20,000,000) revolving Facility C that is used for working capital, capital expenditures and general corporate purposes. On June 25, 2018, RWH and its subsidiaries amended the Deutsche Bank Credit Facility to increase by approximately $6,784,700 (NZ$10,000,000) the amount that can be borrowed under Facility B. Borrowings bear interest at the rate of 5.0% per annum until delivery of the first compliance certificate and thereafter at the bank bill swap interest rate in Australia (“BBSY”), plus a margin of 4.25% to 5.50% per annum, as determined by net leverage. The Deutsche Bank Credit Facility is secured by substantially all of the assets and by the pledge of all the capital stock of the subsidiaries of RWH and matures on November 3, 2020, at which time an exit fee of up to approximately $1,519,300 (A$2,050,000) is owed depending on the final amounts borrowed. In addition, the Deutsche Bank Credit Facility is subject to certain financial and other customary covenants, including, among other things, compliance with specified net leverage and debt requirement or fixed charge ratios based on earnings before interest, income taxes, impairment, depreciation and amortization and other non-operating costs and income (“EBITDA”), as defined.
At June 30, 2018, the Deutsche Bank Credit Facility totaled $79,745,000 (A$107,604,000), net of deferred financing costs of $2,036,000 (A$2,747,000), and availability, including cash at the bank, totaled $31,406,000 (AUS$42,377,000).
The above amounts were translated based upon the exchange rate of one Australian dollar to 0.7411 U.S. dollar and one New Zealand dollar to 0.67847 U.S. dollar at June 30, 2018.
Bison Capital Notes
General
On September 19, 2017, Bison Capital, GFN, GFN U.S., GFNAPH and GFNAPF, entered into that certain Amended and Restated Securities Purchase Agreement dated September 19, 2017 (the “Amended Securities Purchase Agreement”). On September 25, 2017, pursuant to the Amended Securities Purchase Agreement, GFNAPH and GFNAPF issued and sold to Bison an 11.9% secured senior convertible promissory note dated September 25, 2017 in the original principal amount of $26,000,000 (the “Convertible Note”) and an 11.9% secured senior promissory note dated September 25, 2017 in the original principal amount of $54,000,000 (the “Senior Term Note” and collectively with the Convertible Note, the “Bison Capital Notes”). Net proceeds from the sale of the Bison Capital Notes were used to repay in full all principal, interest and other amounts due under the term loan to Credit Suisse (see below), to acquire the 49,188,526 publicly-traded shares of RWH not owned by the Company and to pay all related fees and expenses.
F-22
Table of Contents
GENERAL FINANCE CORPORATION AND SUBSIDIARIES
NOTES TO CONSOLIDATED FINANCIAL STATEMENTS
The Bison Capital Notes have a maturity of five years and bear interest from the date of issuance, payable quarterly in arrears beginning on January 2, 2018. The Bison Capital Notes may be prepaid at 102% of the original principal amount, plus accrued interest, after the first anniversary and prior to the second anniversary of issuance, at 101% of the original principal amount, plus accrued interest, after the second anniversary and prior to the third anniversary of issuance and with no prepayment premium after the third anniversary of issuance. The Company may elect to defer interest under the Bison Capital Notes until the second anniversary of issuance. Interest on the Bison Capital Notes are payable in Australian dollars, but the principal must be repaid in U.S. dollars. The Bison Capital Notes are secured by a first priority security interest over all of the assets of GFN U.S., GFNAPH and GFNAPF, by the pledge by GFN U.S. of the capital stock of GFNAPH and GFNAPF and by of all of the capital stock of RWH. The Bison Capital Notes are subject to all terms, conditions and covenants set forth in the Amended Securities Purchase Agreement. The Amended Securities Purchase Agreement contains certain financial and other customary and restrictive covenants, including, among other things, a minimum EBITDA requirement to equal or exceed AUS$30,000,000 per trailing 12-month period. In addition, the Bison Capital Notes must be repaid upon a change of control, as defined. At June 30, 2018, the principal balance of the Senior Term Note was $57,272,000, which includes interest the Company has elected to defer.
Convertible Note
At any time prior to maturity, Bison Capital may convert unpaid principal and interest under the Convertible Note into shares of GFN common stock based upon a price of $8.50 per share (3,058,824 shares based on the original $26,000,000 principal amount), subject to adjustment as described in the Convertible Note. If GFN common stock trades above 150% of the conversion price over 30 consecutive trading days and the aggregate dollar value of all GFN common stock traded on NASDAQ exceeds $600,000 over the last 20 consecutive days of the same 30-day period, GFN may force Bison Capital to convert all or a portion of the Convertible Note. The Convertible Note also provides that Bison Capital shall not be entitled, and GFN shall not be obligated, to convert the Convertible Note into shares of GFN common stock if such conversion would result in holders of the Convertible Note beneficially owning in excess of 5,200,000 shares of GFN common stock, or approximately 19.5% of the number of shares of GFN common stock outstanding immediately prior to issuance of the Convertible Note. The Convertible Note grants Bison Capital and holders of the Convertible Note a preemptive right to invest in any issuance GFN equity securities, options or warrants to maintain its proportionate interest in GFN common stock, after giving effect to the conversion of the entire Convertible Note. In addition, the Convertible Note includes a provision which requires GFNAPH and GFNAPF to pay Bison Capital, via the payment of principal, interest and the value of GFN common stock received upon conversion of all or a portion of the Convertible Note, a minimum return of 1.75 times the original principal amount. This minimum rate of return will be recorded at $806,000 per year, or $201,500 per quarter, as an accretion in the accompanying consolidated statements of operations. The Convertible Note must also be repaid upon a change of control, as defined. In the event that Bison Capital or holders of the Convertible Note receive aggregate proceeds in excess of $48,900,000 from the sale of GFN common stock received from conversion of the Convertible Note, then 50% of the interest accrued and actually paid to Bison Capital (such amount, the “Price Increase”) shall be repaid by Bison Capital or holders of the Convertible Note by either (i) paying such Price Increase to GFNAPH or GFNAPF in the form of cash, (ii) returning to GFN shares of GFN Common Stock with a value equal to the Price Increase or (iii) any combination of (i) or (ii) above that if the aggregate equals the Price Increase. The value of the GFN common stock for purposes of the return of shares to GFN shall be deemed to be the average price per share of GFN common stock realized by the Convertible Note holder in the sale of such shares. The Convertible Note holder may satisfy such obligations by returning to GFN shares of GFN common stock with an aggregate value equivalent to the Price Increase.
The Company evaluated the Convertible Note and determined that certain conversion rights were an embedded derivative that required bifurcation because they were not deemed to be clearly and closely related to the Convertible Note. As a result, the Company separately accounts for these conversion rights as a standalone derivative. As of the date of issuance on September 25, 2017, the fair value of this bifurcated derivative was determined to be $1,864,000, resulting in a principal balance of $24,136,000 for the Convertible Note. The Company determines the fair value of the bifurcated derivative using a valuation model and market prices and reassesses its fair value at the end of each reporting period or more frequently as deemed necessary, with any changes in value reported in the accompanying consolidated statements of operations. At June 30, 2018, the fair value of this bifurcated derivative was $15,583,000 (using, among other things, the Company’s market price for its common stock of $13.55 per share at June 30, 2018, and assumptions of a risk-free interest rate of 2.22%, an expected volatility of 25% on the company’s assets and no expected dividend) and the principal balance of the Convertible Note was $24,741,000, which includes accretion for the minimum rate of return.
At June 30, 2018, the Bison Capital Notes totaled $81,048,000, net of deferred financing costs of $965,000.
F-23
Table of Contents
GENERAL FINANCE CORPORATION AND SUBSIDIARIES
NOTES TO CONSOLIDATED FINANCIAL STATEMENTS
North America Senior Credit Facility
The North America leasing (Pac-Van and Lone Star) and manufacturing operations (Southern Frac) have a combined $237,000,000 senior secured revolving credit facility, as amended, with a syndicate led by Wells Fargo Bank, National Association (“Wells Fargo”) that also includes East West Bank, CIT Bank, N.A., the Canadian Imperial Bank of Commerce (“CIBC”), KeyBank, National Association, Bank Hapoalim B.M. and Associated Bank, N.A. (the “Wells Fargo Credit Facility”). The Wells Fargo Credit Facility matures on March 24, 2022, assuming the Company’s publicly-traded senior notes due July 31, 2021(see below) are extended at least 90 days past this scheduled maturity date; otherwise the Wells Fargo Credit Facility would mature on March 24, 2021. There is also a separate loan agreement with Great American Capital Partners (“GACP”), where GACP provided a First In Last Out Term Loan (”FILO Term Loan”) within the Wells Fargo Credit Facility in the amount of $20,000,000, and inclusive in the $237,000,000 total amount. The FILO Term Loan has the same maturity date and commences principal amortization on October 1, 2018 at $500,000 per quarter. The FILO Term Loan has a prepayment fee of 3.00% of the prepaid amount if prepaid prior to the first anniversary, 2.00% of the prepaid amount if prepaid prior to the second anniversary and 1.00% of the prepaid amount if prepaid prior to the third anniversary.
The Wells Fargo Credit Facility is secured by substantially all of the rental fleet, inventory and other assets of the Company’s North American leasing and manufacturing operations. The FILO Term Loan also contains a first priority lien on the same collateral, but on a “last out basis,” after all of the outstanding obligations to the primary lenders in the Wells Fargo Credit Facility have been satisfied. The Wells Fargo Credit Facility effectively not only finances the North American operations, but also the funding requirements for the Series C Preferred Stock (see Note 3) and the publicly-traded unsecured senior notes. The maximum amount of intercompany dividends that Pac-Van and Lone Star are allowed to pay in each fiscal year to GFN for the funding requirements of GFN’s senior and other debt and the Series C Preferred Stock are (a) the lesser of $5,000,000 for the Series C Preferred Stock or the amount equal to the dividend rate of the Series C Preferred Stock and its aggregate liquidation preference and the actual amount of dividends required to be paid to the Series C Preferred Stock; and (b) $6,300,000 for the public offering of unsecured senior notes or the actual amount of annual interest required to be paid; provided that (i) the payment of such dividends does not cause a default or event of default; (ii) each of Pac-Van and Lone Star is solvent; (iii) excess availability, as defined, is $5,000,000 or more under the Wells Fargo Credit Facility; (iv) the fixed charge coverage ratio, as defined, will be greater than 1.25 to 1.00; and (v) the dividends are paid no earlier than ten business days prior to the date they are due.
Borrowings under the Wells Fargo Credit Facility accrue interest, at the Company’s option, either at the base rate, plus 0.5% and a range of 1.00% to 1.50%, or the LIBOR rate, plus 1.0% and a range of 2.50% to 3.00%. The FILO Term Loan within the Wells Fargo Credit Facility bears interest at 11.00% above the LIBOR rate, with a LIBOR rate floor of 1.00%. The Wells Fargo Credit Facility contains, among other things, certain financial covenants, including fixed charge coverage ratios, and other covenants, representations, warranties, indemnification provisions, and events of default that are customary for senior secured credit facilities; including a covenant that would require repayment upon a change in control, as defined. At June 30, 2018, borrowings and availability under the Wells Fargo Credit Facility totaled $183,949,000 and $46,424,000, respectively.
Credit Suisse Term Loan
On March 31, 2014, the Company entered into a $25,000,000 facility agreement, as amended, with Credit Suisse (“Credit Suisse Term Loan”) as part of the financing for the acquisition of Lone Star and, on April 3, 2014, the Company borrowed the $25,000,000 available to it. The Credit Suisse Term Loan provided that the amount borrowed would bear interest at LIBOR plus 7.50% per year, would be payable quarterly and that all principal and interest would mature on July 1, 2018. In addition, the Credit Suisse Term Loan was secured by a first ranking pledge over substantially all shares of RWH owned by GFN U.S., required a certain coverage maintenance ratio in U.S. dollars based on the value of the RWH shares and, among other things, that an amount equal to six-months interest be deposited in an interest reserve account pledged to secure repayment of all amounts borrowed. The Company had repaid, prior to maturity, $15,000,000 of the outstanding borrowings of the Credit Suisse Term Loan and, as of June 30, 2017, $9,920,000 remained outstanding, net of unamortized debt issuance costs of $80,000. On September 25, 2017, in connection with the acquisition of the noncontrolling interest of Royal Wolf (see Note 4), the Credit Suisse Term Loan was fully repaid.
F-24
Table of Contents
GENERAL FINANCE CORPORATION AND SUBSIDIARIES
NOTES TO CONSOLIDATED FINANCIAL STATEMENTS
Senior Notes
On June 18, 2014, the Company completed the sale of unsecured senior notes (the “Senior Notes”) in a public offering for an aggregate principal amount of $72,000,000. On April 24, 2017, the Company completed the sale of a “tack-on” offering of its publicly-traded Senior Notes for an aggregate principal amount of $5,390,000 that was priced at $24.95 per denomination. Net proceeds were $5,190,947, after deducting an aggregate original issue discount (“OID”) of $10,780 and underwriting discount of $188,273. In both offerings, the Company used at least 80% of the gross proceeds to reduce indebtedness at Pac-Van and Lone Star under the Wells Fargo Credit Facility in order to permit the payment of intercompany dividends by Pac-Van and Lone Star to GFN to fund the interest requirements of the Senior Notes. For the ‘tack-on” offering, this amounted to $4,303,376 of the net proceeds. The Company has total outstanding publicly-traded Senior Notes in an aggregate principal amount of $77,390,000 ($75,319,000 and $75,824,000, net of unamortized debt issuance costs of $2,071,000 and $1,566,000, at June 30, 2017 and 2018, respectively).
The Senior Notes were issued in minimum denominations of $25 and integral multiples of $25 in excess thereof and pursuant to the First Supplemental Indenture (the “First Supplemental Indenture”) dated as of June 18, 2014 by and between the Company and Wells Fargo, as trustee (the “Trustee”). The First Supplemental Indenture supplements the Indenture entered into by and between the Company and the Trustee dated as of June 18, 2014 (the “Base Indenture” and, together with the First Supplemental Indenture, the “Indenture”). The Senior Notes bear interest at the rate of 8.125% per annum, mature on July 31, 2021 and are not subject to any sinking fund. Interest on the Senior Notes is payable quarterly in arrears on January 31, April 30, July 31 and October 31, commencing on July 31, 2014. The Senior Notes rank equally in right of payment with all of the Company’s existing and future unsecured senior debt and senior in right of payment to all of its existing and future subordinated debt. The Senior Notes are effectively subordinated to any of the Company’s existing and future secured debt, to the extent of the value of the assets securing such debt. The Senior Notes are structurally subordinated to all existing and future liabilities of the Company’s subsidiaries and are not guaranteed by any of the Company’s subsidiaries.
The Company had an option, prior to July 31, 2017, to redeem the Senior Notes in whole or in part upon the payment of 100% of the principal amount of the Senior Notes being redeemed, plus any additional amount required by the Indenture. In addition, the Company may have redeemed up to 35% of the aggregate outstanding principal amount of the Senior Notes before July 31, 2017 with the net cash proceeds from certain equity offerings at a redemption price of 108.125% of the principal amount plus accrued and unpaid interest. The Company has not redeemed any of its Senior Notes.
If the Company sells certain of its assets or experiences specific kinds of changes in control, as defined, it must offer to redeem the Senior Notes. The Company may, at its option, at any time and from time to time, on or after July 31, 2017, redeem the Senior Notes in whole or in part. The Senior Notes will be redeemable at a redemption price initially equal to 106.094% of the principal amount of the Senior Notes (and which declines each year on July 31) plus accrued and unpaid interest to the date of redemption. On and after any redemption date, interest will cease to accrue on the redeemed Senior Notes.
The Indenture contains covenants which, among other things, limit the Company’s ability to make certain payments, to pay dividends and to incur additional indebtedness if the incurrence of such indebtedness would cause the company’s consolidated fixed charge coverage ratio, as defined in the Indenture, to be below 2.0 to 1.0. The Senior Notes are listed on NASDAQ under the symbol “GFNSL.”
Other
At June 30, 2018, equipment financing and other debt totaled $6,652,000.
The Company was in compliance with the financial covenants under all its credit facilities as of June 30, 2018.
The weighted-average interest rate in the Asia-Pacific area was 5.4%, 5.0% and 10.1% in FY 2016, FY 2017 and FY 2018, respectively; which does not include the effect of translation, derivative valuation, amortization of deferred financing costs and accretion. The weighted-average interest rate in North America was 4.9%, 5.3% and 6.2% in FY 2016, FY 2017 and FY 2018, respectively, which does not include the effect of the amortization of deferred financing costs and accretion.
F-25
Table of Contents
GENERAL FINANCE CORPORATION AND SUBSIDIARIES
NOTES TO CONSOLIDATED FINANCIAL STATEMENTS
Senior and other debt consisted of the following at June 30, 2017 and 2018 (in thousands):
| June 30, | ||||||||
|
|
|
|||||||
| 2017 | 2018 | |||||||
|
|
|
|||||||
| ANZ/CBA Credit Facility |
$ | 81,051 | $ | — | ||||
| Deutsche Bank Credit Facility |
— | 79,745 | ||||||
| Bison Capital Notes |
— | 81,048 | ||||||
| Wells Fargo Credit Facility |
180,946 | 183,949 | ||||||
| Credit Suisse Term Loan |
9,920 | — | ||||||
| Senior Notes |
75,319 | 75,824 | ||||||
| Equipment Financing and Other |
8,402 | 6,652 | ||||||
|
|
|
|||||||
| $ | 355,638 | $ | 427,218 | |||||
|
|
|
|||||||
Scheduled Maturities on Senior and Other Debt
The scheduled maturities for the senior credit facilities senior subordinated notes and other debt at June 30, 2018 were as follows (in thousands):
| Year Ending June 30, |
||||||||
| 2019 |
$ | 13,805 | ||||||
| 2020 |
8,943 | |||||||
| 2021 |
70,301 | |||||||
| 2022 |
256,033 | (a) | ||||||
| 2023 |
82,603 | |||||||
| Thereafter |
100 | |||||||
|
|
|
|||||||
| 431,785 | ||||||||
| Less – deferred financing costs |
(4,567) | |||||||
|
|
|
|||||||
| $ | 427,218 | |||||||
|
|
|
|||||||
(a) Wells Fargo Credit Facility is reflected as maturing on March 24, 2022.
Note 6. Financial Instruments
Fair Value Measurements
FASB ASC Topic 820, Fair Value Measurements and Disclosures, defines fair value as the price that would be received from selling an asset or paid to transfer a liability in an orderly transaction between market participants. As such, fair value is a market-based measurement that should be determined based on assumptions that market participants would use in pricing an asset or liability. As a basis for considering such assumptions, FASB ASC Topic 820 establishes a three-tier fair value hierarchy, which prioritizes the inputs used in measuring fair value, as follows:
Level 1 - Observable inputs such as quoted prices in active markets for identical assets or liabilities;
Level 2 - Observable inputs, other than Level 1 inputs in active markets, that are observable either directly or indirectly; and
Level 3 - Unobservable inputs in which there is little or no market data, which require the reporting entity to develop its own assumptions.
F-26
Table of Contents
GENERAL FINANCE CORPORATION AND SUBSIDIARIES
NOTES TO CONSOLIDATED FINANCIAL STATEMENTS
The Company’s derivative instruments are not traded on a market exchange; therefore, the fair values are determined using valuation models that include assumptions about yield curve at the reporting dates as well as counter-party credit risk. The assumptions are generally derived from market-observable data. The Company has consistently applied these calculation techniques to all periods presented, which are considered Level 2. Derivative instruments measured at fair value and their classification in the consolidated balances sheets and statements of operations are as follows (in thousands):
| Derivative – Fair Value (Level 2) |
||||||||||
|
Type of Derivative Contract |
Balance Sheet Classification | June 30, 2017 | June 30, 2018 | |||||||
|
|
|
|
|
|
||||||
| Swap Contracts |
Trade payables and accrued liabilities | $ | 96 | $ | 223 | |||||
| Forward-Exchange Contracts |
Trade and other receivables | — | 298 | |||||||
| Forward-Exchange Contracts |
Trade payables and accrued liabilities | 299 | — | |||||||
| Bifurcated Derivative |
Fair value of bifurcated derivative in Convertible Note | — | 15,583 | |||||||
|
|
|
|
|
|||||||
| Type of Derivative Contract |
Statement of Operations Classification | FY 2016 | FY 2017 | FY 2018 | ||||||||||
|
|
|
|
|
|||||||||||
| Swap Contracts |
Unrealized gain included in interest expense | $ | — | $ | 1,073 | $ | 12 | |||||||
| Forward-Exchange Contracts |
Unrealized foreign currency exchange gain (loss) | (367) | (12 | ) | 697 | |||||||||
| Bifurcated Derivative |
Loss on change in valuation of bifurcated derivative in Convertible Note | — | — | 13,719 | ||||||||||
|
|
|
|||||||||||||
Interest Rate Swap Contracts
The Company’s exposure to market risk for changes in interest rates relates primarily to its senior and other debt obligations. The Company’s policy is to manage its interest expense by using a mix of fixed and variable rate debt.
To manage its exposure to variable interest rates in a cost-efficient manner, the Company has entered into interest rate swaps and interest rate options, in which the Company agreed to exchange, at specified intervals, the difference between fixed and variable interest amounts calculated by reference to an agreed-upon notional principal amount. These swaps and options were designated to hedge changes in the interest rate of a portion of the outstanding borrowings in the Asia-Pacific area. In FY 2017, the Company entered into two interest rate swaps that were designated as cash flow hedges. The Company expected these derivatives to remain effective during their remaining terms, but recorded any changes in the portion of the hedges considered ineffective in interest expense in the consolidated statement of operations. There was no ineffective portion recorded in FY 2017 and, in FY 2018, these two interest rate swap contracts were closed, with the Company incurring break costs of $148,000. In January 2018, the Company entered into another interest rate swap contract that was also designated as a cash flow hedge. The Company expects this derivative to remain highly effective during its term; however, any changes in the portion of the hedge considered ineffective would also be recorded in interest expense in the consolidated statement of operations. In FY 2018, the Company recorded in interest expense an unrealized gain of $12,000 for the portion considered ineffective.
The Company’s interest rate derivative instruments were not traded on a market exchange; therefore, the fair values were determined using valuation models which include assumptions about the interest rate yield curve at the reporting dates (Level 2 fair value measurement). As of June 30, 2017 and 2018, the open interest rate swap contracts were as follows (dollars in thousands):
F-27
Table of Contents
GENERAL FINANCE CORPORATION AND SUBSIDIARIES
NOTES TO CONSOLIDATED FINANCIAL STATEMENTS
| June 30, | June 30, | |||||||
|
|
|
|||||||
| 2017 | 2018 | |||||||
| Notional amounts |
$ | 30,748 | $ | 37,055 | ||||
| Fixed/Strike Rates |
2.0025% - 2.2900% | 7.414% | ||||||
| Floating Rates |
1.6650% | 7.16% | ||||||
| Fair Value of Combined Contracts |
$ | (96) | $ | (223) | ||||
|
|
|
|
|
|||||
Foreign Currency Risk
The Company has transactional currency exposures. Such exposure arises from sales or purchases in currencies other than the functional currency. The currency giving rise to this risk is primarily U.S. dollars. Royal Wolf has a bank account denominated in U.S. dollars into which a small number of customers pay their debts. This is a natural hedge against fluctuations in the exchange rate. The funds are then used to pay suppliers, avoiding the need to convert to Australian dollars. Royal Wolf uses forward currency and participating forward contracts to eliminate the currency exposures on the majority of its transactions denominated in foreign currencies, either by transaction if the amount is significant, or on a general cash flow hedge basis. The forward currency and participating forward contracts are always in the same currency as the hedged item. The Company believes that financial instruments designated as foreign currency hedges are highly effective. However documentation of such as required by ASC Topic 815 does not exist. Therefore, all movements in the fair values of these hedges are reported in the statement of operations in the period in which fair values change. As of June 30, 2017, there were 16 open forward exchange contracts that mature between July 2017 and December 2017; and as of June 30, 2018, there were 32 open forward exchange that mature between July 2018 and November 2018, as follows (dollars in thousands):
| June 30, | June 30, | |||||||
|
|
|
|||||||
| 2017 | 2018 | |||||||
| Notional amounts |
$ | 7,687 | $ | 8,950 | ||||
| Exchange/Strike Rates (AUD to USD) |
0.69304 – 0.75650 | 0.68142 – 0.80004 | ||||||
| Fair Value of Combined Contracts |
$ | (299) | $ | 298 | ||||
|
|
|
|
|
|||||
In FY 2016, FY 2017 and FY 2018, net unrealized and realized foreign exchange gains (losses) totaled$(103,000) and $80,000, $(375,000) and $(39,000) and $(6,138,00) and $(451,000), respectively.
Fair Value of Other Financial Instruments
The fair value of the Company’s borrowings under the Senior Notes was determined based on a Level 1 input and for borrowings under its senior credit facilities and Credit Suisse Term Loan determined based on Level 3 inputs; including a comparison to a group of comparable industry debt issuances (“Industry Comparable Debt Issuances”) and a study of credit (“Credit Spread Analysis”). Under the Industry Comparable Debt Issuance method, the Company compared the debt facilities to several industry comparable debt issuances. This method consisted of an analysis of the offering yields compared to the current yields on publicly traded debt securities. Under the Credit Spread Analysis, the Company first examined the implied credit spreads, which are based on data published by the United States Federal Reserve. Based on this analysis the Company was able to assess the credit market. The fair value of the Company’s senior credit facilities as of June 30, 2017 and 2018 was determined to be approximately $347,236,000 and $423,029,000, respectively. The Company also determined that the fair value of its equipment financing and other debt of $8,402,000 and $6,652,000 at June 30, 2017 and 2018, respectively, approximated or would not vary significantly from their carrying values.
Under the provisions of FASB ASC Topic 825, Financial Instruments, the carrying value of the Company’s other financial instruments (consisting primarily of cash and cash equivalents, net receivables, trade payables and accrued liabilities) approximate fair value.
F-28
Table of Contents
GENERAL FINANCE CORPORATION AND SUBSIDIARIES
NOTES TO CONSOLIDATED FINANCIAL STATEMENTS
Credit Risk and Allowance for Doubtful Accounts
Financial instruments potentially exposing the Company to concentrations of credit risk consist primarily of receivables. Concentrations of credit risk with respect to receivables are limited due to the large number of customers spread over a large geographic area in many industry sectors and no single customer accounted for more than 10% of consolidated revenues or trade receivables during and at the periods presented. However, in our North American leasing operations a significant portion of the business activity are with companies in the construction and energy (oil and gas and mining) industries. Revenues from the construction industry totaled $42,510,000 in FY 2016; and revenues and receivables from the construction industry totaled $40,739,000 and $5,521,000 during FY 2017 and at June 30, 2017, respectively; and $44,427,000 and $6,298,000 during FY 2018 and at June 30, 2018, respectively. Revenues of $29,913,000, $24,964,000 and $49,053,000 during FY 2016, FY 2017and FY 2018, respectively; and receivables of $6,568,000 and $11,869,000 at June 30, 2017 and 2018, respectively, were from the energy industry.
The Company’s receivables related to sales of lease inventories and fleet are generally secured by the equipment sold to the customer. The Company’s receivables related to leasing operations are primarily amounts generated from both off-site and on-site customers. The Company has the right to repossess lease equipment for nonpayment. It is the Company’s policy that all customers who wish to purchase or lease containers on credit terms are subject to credit verification procedures and the Company will agree to terms with customers believed to be creditworthy. In addition, receivable balances are monitored on an ongoing basis with the result that the Company’s exposure to bad debts is not typically significant; however, in FY 2016 the Company has provided more than historically normal provision and write-offs for bad debts, primarily for customers in the energy sector. Net allowance for doubtful accounts provided and uncollectible accounts written off, net of recoveries and other, was $5,570,000 and $3,357,000, $2,529,000 and $5,060,000, and $1,850,000 and $2,570,000 for FY 2016, FY 2017 and FY 2018, respectively. The translation gain (loss) to the allowance for doubtful accounts for FY 2017 and FY 2018 was $42,000 and $20,000, respectively. There was no translation gain or loss in FY 2016.
With respect to credit risk arising from the other significant financial assets of the Company, which comprise cash and cash equivalents, available-for-sale financial assets and certain derivative instruments, the Company’s exposure to credit risk arises from default of the counter party, with a maximum exposure equal to the carrying amount of these instruments. As the counter party for derivative instruments is nearly always a bank, the Company has assessed this as a low risk.
Note 7. Income Taxes
Income (loss) before provision for income taxes consisted of the following (in thousands):
|
|
|
|||||||||||
| FY 2016 | FY 2017 | FY 2018 | ||||||||||
|
|
|
|||||||||||
| North America |
$ | (13,607) | $ | (8,234) | $ | 11,739 | ||||||
| Asia-Pacific |
8,130 | 7,362 | (21,525) | |||||||||
|
|
|
|||||||||||
| $ | (5,477) | $ | (872) | $ | (9,786) | |||||||
|
|
|
|||||||||||
F-29
Table of Contents
GENERAL FINANCE CORPORATION AND SUBSIDIARIES
NOTES TO CONSOLIDATED FINANCIAL STATEMENTS
The provision (benefit) for income taxes consisted of the following (in thousands):
|
|
|
|||||||||||
| FY 2016 | FY 2017 | FY 2018 | ||||||||||
|
|
|
|||||||||||
| Current: |
||||||||||||
| U.S. Federal |
$ | — | $ | — | $ | — | ||||||
| State |
203 | 172 | 481 | |||||||||
| Foreign |
1,842 | 703 | 1,925 | |||||||||
|
|
|
|||||||||||
| 2,045 | 875 | 2,406 | ||||||||||
|
|
|
|||||||||||
| Deferred: |
||||||||||||
| U.S. Federal |
(4,364) | (3,351) | (1,323) | |||||||||
| State |
(39) | (120) | 844 | |||||||||
| Foreign |
167 | 2,571 | (2,606) | |||||||||
|
|
|
|||||||||||
| (4,236) | (900) | (3,085) | ||||||||||
|
|
|
|||||||||||
| $ | (2,191) | $ | (25) | $ | (679) | |||||||
|
|
|
|||||||||||
The components of the net deferred tax liability are as follows (in thousands):
| June 30, | ||||||||
| 2017 | 2018 | |||||||
|
|
|
|||||||
| Deferred tax assets: |
||||||||
| Net operating loss and tax credit carryforwards |
$ | 40,310 | $ | 21,094 | ||||
| Accrued compensation and other benefits |
2,867 | 3,025 | ||||||
| Allowance for doubtful accounts |
1,846 | 1,314 | ||||||
| Deferred revenue and expenses |
0 | 4,252 | ||||||
|
|
|
|||||||
| Total deferred tax assets |
45,023 | 29,685 | ||||||
|
|
|
|||||||
| Deferred tax liabilities: |
||||||||
| Accelerated tax depreciation and amortization |
(82,214) | (64,324) | ||||||
| Deferred revenue and expenses |
(915) | — | ||||||
|
|
|
|||||||
| Total deferred tax liabilities |
(83,129) | (64,324) | ||||||
|
|
|
|||||||
| Valuation allowance |
— | (330) | ||||||
|
|
|
|||||||
| Net deferred tax liabilities |
$ | (38,106) | $ | (34,969) | ||||
|
|
|
|||||||
At June 30, 2018, the Company had a U.S. federal net operating loss carryforward of $89,960,000, which expires if unused during fiscal years 2021 – 2038, and state net operating loss carryforwards of $29,792,000, which will begin expiring in fiscal year 2019. As a result of transactions of its publicly-held common stock, it is possible to have a change in ownership for federal income tax purposes, which can limit the amount of net operating loss currently available as a deduction. The Company has determined that, as of June 30, 2018, there was not a significant limitation from any such ownership changes. However, as a result of the stock ownership change in the Pac-Van acquisition in October 2008, the available deduction of the net operating loss carryforward of $17,611,000 is generally limited to approximately $2,400,000 on a yearly basis until the fiscal year 2022.
F-30
Table of Contents
GENERAL FINANCE CORPORATION AND SUBSIDIARIES
NOTES TO CONSOLIDATED FINANCIAL STATEMENTS
For income tax purposes, deductible compensation related to non-qualified stock option awards is based on the value of the award when realized, which may be different than the compensation expense recognized in the consolidated financial statements, which is based on the award value on the date of grant. The difference between the value of the award upon grant and the value of the award when ultimately realized creates either additional tax benefits or a tax shortfall. Prior to July 1, 2017, tax benefits resulting from tax deductions in excess of the compensation cost recognized for share-based awards would have been recognized as increases to additional paid in capital only if an incremental income tax benefit would be realized after considering all other tax attributes presently available. Tax shortfalls, which would occur when the tax deduction for share-based awards is less than the compensation cost recognized, would have been recorded as a reduction to additional paid in capital to the extent that, cumulatively, the shortfalls do not exceed the cumulative excess tax benefits recognized (including excess tax benefits not yet recognized in additional paid in capital). Should cumulative tax shortfalls have exceeded cumulative excess tax benefits, the difference would have been reflected as additional tax expense in the consolidated financial statements. The Company did not recognize excess tax benefits in FY 2016 or FY 2017 because it has not paid U.S. federal income taxes in those years. Effective July 1, 2017, the difference between the deductible compensation related to share-based awards based on the value of the award when realized and the compensation expense recognized in the consolidated financial statements based on the award value on the date of grant is recognized upon realization as an additional tax expense or benefit in the consolidated statements of operations.
Management evaluates the ability to realize its deferred tax assets on a quarterly basis and adjusts the amount of its valuation allowance if necessary. No valuation allowance had been determined to be required as of June 30, 2017. As of June 30, 2018, the Company recorded a valuation allowance of $330,000 for foreign tax credit carryforwards that it believes will not be realized.
A reconciliation of the U.S. federal statutory rate to the Company’s effective tax rate is as follows:
|
|
|
|||||||||||
| FY 2016 | FY 2017 | FY 2018 | ||||||||||
|
|
|
|||||||||||
| Federal statutory rate |
35.0% | 35.0% | 28.0% | |||||||||
| Adjustment to estimated state deferred tax liability, net of U.S. federal tax benefit (a) |
— | (34.1) | — | |||||||||
| Change in valuation of bifurcated derivative in Convertible Note |
— | — | (42.7) | |||||||||
| State and Asia-Pacific taxes, net of U.S. federal tax benefit |
5.0 | (2.1) | 6.0 | |||||||||
| Adjustment of net deferred tax liability for enacted tax rate change by the Act |
— | — | 18.8 | |||||||||
| Adjustment for previously unrecognized net tax deficiency related to equity compensation activity prior to July 1, 2017 |
— | — | (1.1) | |||||||||
| Net tax benefit related to equity compensation activity |
— | — | 0.4 | |||||||||
| Valuation allowance |
— | — | (3.4) | |||||||||
| Other |
— | 4.1 | 0.9 | |||||||||
|
|
|
|||||||||||
| Effective tax rate |
40.0% | 2.9% | 6.9% | |||||||||
|
|
|
|||||||||||
(a) Adjustment for estimated state taxes of $297,000.
Note 8. Related-Party Transactions
Effective January 31, 2008, the Company entered into a lease with an affiliate of the Company’s then Chief Executive Officer (now Executive Chairman of the Board of Directors) for its corporate headquarters in Pasadena, California. The rent is $7,393 per month, effective March 1, 2009, plus allocated charges for common area maintenance, real property taxes and insurance, for approximately 3,000 square feet of office space. The term of the lease is five years, with two five-year renewal options, and the rent is adjusted yearly based on the consumer price index. On October 11, 2012, the Company exercised the first option to renew the lease for an additional five-year term commencing February 1, 2013 and on August 7, 2017, it exercised its second option for an additional five-year term commencing on February 1, 2018. Rental payments were $110,000 in FY 2016, $113,000 in FY 2017 and $112,000 in FY 2018.
F-31
Table of Contents
GENERAL FINANCE CORPORATION AND SUBSIDIARIES
NOTES TO CONSOLIDATED FINANCIAL STATEMENTS
The premises of Pac-Van’s Las Vegas branch are owned by and were leased from the then acting branch manager through December 31, 2016. From January 1, 2017 through May 12, 2017, the use of the premises was rented on a month-to-month basis. Effective May 12, 2017, the Company entered into a lease agreement through December 31, 2020 for rental of $10,876 per month and the right to extend the term of the lease for three two-year options, with the monthly rental increasing at each option period from $11,420 to $12,590 per month. Rental payments on these premises totaled $118,000 in FY 2016, $124,000 in FY 2017 and $131,000 in FY 2018.
Note 9. Equity Plans
On September 11, 2014, the Board of Directors of the Company adopted the 2014 Stock Incentive Plan (the “2014 Plan”), which was approved by the stockholders at the Company’s annual meeting on December 4, 2014 and amended and restated by the stockholders at the annual meeting on December 3, 2015. The 2014 Plan is an “omnibus” incentive plan permitting a variety of equity programs designed to provide flexibility in implementing equity and cash awards, including incentive stock options, nonqualified stock options, restricted stock grants (“non-vested equity shares”), restricted stock units, stock appreciation rights, performance stock, performance units and other stock-based awards. Participants in the 2014 Plan may be granted any one of the equity awards or any combination of them, as determined by the Board of Directors or the Compensation Committee. Upon the approval of the 2014 Plan by the stockholders, the Company suspended further grants under its previous equity plans, the General Finance Corporation 2006 Stock Option Plan (the “2006 Plan”) and the 2009 Stock Incentive Plan (the “2009 Plan”) (collectively the “Predecessor Plans”), which had a total of 2,500,000 shares reserved for grant. Any stock options which are forfeited under the Predecessor Plans will become available for grant under the 2014 Plan, but the total number of shares available under the 2014 Plan will not exceed the 1,500,000 shares reserved for grant under the 2014 Plan, plus any options which were forfeited or are available for grant under the Predecessor Plans. If not sooner terminated by the Board of Directors, the 2014 Plan will expire on December 4, 2024, which is the tenth anniversary of the date it was approved by the Company’s stockholders. The 2006 Plan expired on June 30, 2016 and the 2009 Plan will expire on December 10, 2019. On December 7, 2017, the stockholders approved an amendment unanimously approved by the Board of Directors of the Company that increased the number of shares reserved for issuance under the 2014 Plan by 1,000,000 shares, from 1,500,000 to 2,500,000 shares of common stock, plus any options which were forfeited or are available for grant under the 2009 Plan. The Predecessor Plans and the 2014 Plan are referred to collectively as the “Stock Incentive Plan.”
There have been no grants or awards of stock appreciation rights, performance stock or performance units under the Stock Incentive Plan. All grants to-date consist of incentive and non-qualified stock options that vest over a period of up to five years (“time-based”), non-qualified stock options that vest over varying periods that are dependent on the attainment of certain defined EBITDA and other targets (“performance-based”), non-vested equity shares (“restricted stock”) and restricted stock units (“RSU”). At June 30, 2018, 871,160 shares remained available for grant.
On June 8, 2016 (the “June 2016 Grant”), ”), the Company granted time-based options to 21 key employees of GFN, Pac-Van, Lone Star and Southern Frac to purchase 106,700 shares of common stock at an exercise price equal to the closing market price of the Company’s common stock as of that date, or $4.11 per share. The options under the June 2016 Grant vest over 36 months from the date of grant. The weighted-average fair value of the stock options in the June 2016 Grant was $2.87, determined using the Black-Scholes option-pricing model using the following assumptions: a risk-free interest rate of 1.47%, an expected life of 7.5 years, an expected volatility of 72.9% and no expected dividend.
On February 7, 2017 (the “February 2017 Grant”), the Company granted time-based options to an officer of GFN to purchase 225,000 shares of common stock at an exercise price equal to the closing market price of the Company’s common stock as of that date, or $5.10 per share. The options under the February 2017 Grant vest over 36 months from the date of grant. The weighted-average fair value of the stock options in the February 2017 Grant was $3.35, determined using the Black-Scholes option-pricing model using the following assumptions: a risk-free interest rate of 2.13%, an expected life of 7.5 years, an expected volatility of 65.1% and no expected dividend.
On December 15, 2017 (the “December 2017 Grant”), the Company granted time-based options to an officer of GFN to purchase 225,000 shares of common stock at an exercise price equal to the closing market price of the Company’s common stock as of that date, or $6.25 per share. The options under the December 2017 Grant vest over 36 months from the date of grant. The fair value of the stock options in the December 2017 Grant was $3.45, determined using the Black-Scholes option-pricing model using the following assumptions: a risk-free interest rate of 2.26%, an expected life of 7.5 years, an expected volatility of 50.5% and no expected dividend.
F-32
Table of Contents
GENERAL FINANCE CORPORATION AND SUBSIDIARIES
NOTES TO CONSOLIDATED FINANCIAL STATEMENTS
On February 6, 2018 (the “February 2018 Grant”), the Company granted time-based options to a key employee of Royal Wolf to purchase 81,280 shares of common stock at an exercise price equal to the closing market price of the Company’s common stock as of that date, or $7.15 per share. The options under the February 2018 Grant vest over 28.8 months from the date of grant. The fair value of the stock options in the February 2018 Grant was $4.00, determined using the Black-Scholes option-pricing model using the following assumptions: a risk-free interest rate of 2.66%, an expected life of 7.5 years, an expected volatility of 50.5% and no expected dividend.
In FY 2018, the weighted-average fair value of the stock options granted to officers and key employees was $3.60. Since inception, the range of the fair value of the stock options granted (other than to non-employee consultants) and the assumptions used are as follows:
| Fair value of stock options |
$0.81 - $6.35 | |||
|
| ||||
| Assumptions used: |
||||
| Risk-free interest rate |
1.19% - 4.8% | |||
| Expected life (in years) |
7.5 | |||
| Expected volatility |
26.5% - 84.6% | |||
| Expected dividends |
— | |||
|
| ||||
At June 30, 2018, there were no significant outstanding stock options held by non-employee consultants that were not fully vested. A summary of the Company’s stock option activity and related information for FY 2016, FY 2017 and FY 2018 follows:
| Number of
|
Weighted-
|
Weighted-
|
||||||||||||
|
|
|
|||||||||||||
| Outstanding at June 30, 2015 |
2,110,191 | $ | 5.35 | |||||||||||
| Granted |
106,700 | 4.11 | ||||||||||||
| Exercised |
(13,000) | 3.09 | ||||||||||||
| Forfeited or expired |
(20,667) | 6.05 | ||||||||||||
|
|
|
|||||||||||||
| Outstanding at June 30, 2016 |
2,183,224 | $ | 5.30 | 4.6 | ||||||||||
|
|
|
|||||||||||||
| Exercisable at June 30, 2016 |
1,852,190 | $ | 5.24 | 3.8 | ||||||||||
|
|
|
|||||||||||||
| Number of
|
Weighted-
|
Weighted-
|
||||||||||||
|
|
|
|||||||||||||
| Outstanding at June 30, 2016 |
2,183,224 | $ | 5.30 | |||||||||||
| Granted |
225,000 | 5.10 | ||||||||||||
| Exercised |
(21,500) | 2.50 | ||||||||||||
| Forfeited or expired |
(325,667) | 7.75 | ||||||||||||
|
|
|
|||||||||||||
| Outstanding at June 30, 2017 |
2,061,057 | $ | 4.92 | 4.9 | ||||||||||
|
|
|
|||||||||||||
| Exercisable at June 30, 2017 |
1,632,256 | $ | 4.78 | 3.8 | ||||||||||
|
|
|
|||||||||||||
F-33
Table of Contents
GENERAL FINANCE CORPORATION AND SUBSIDIARIES
NOTES TO CONSOLIDATED FINANCIAL STATEMENTS
| Number of
|
Weighted-
|
Weighted-
|
||||||||||||
|
|
|
|||||||||||||
| Outstanding at June 30, 2017 |
2,061,057 | $ | 4.92 | |||||||||||
| Granted |
306,280 | 6.49 | ||||||||||||
| Exercised |
(237,260) | 4.85 | ||||||||||||
| Forfeited or expired |
(305,167) | 8.96 | ||||||||||||
|
|
|
|||||||||||||
| Outstanding at June 30, 2018 |
1,824,910 | $ | 4.52 | 5.8 | ||||||||||
|
|
|
|||||||||||||
| Vested and expected to vest at June 30, 2018 |
1,824,910 | $ | 4.52 | 5.8 | ||||||||||
|
|
|
|||||||||||||
| Exercisable at June 30, 2018 |
1,333,564 | $ | 4.01 | 4.5 | ||||||||||
|
|
|
|||||||||||||
At June 30, 2018, outstanding time-based options and performance-based options totaled 1,227,790 and 597,120, respectively. Also at that date, the Company’s market price for its common stock was $13.55 per share, which was above the exercise prices of all of the outstanding stock options, and the intrinsic value of the outstanding stock options at that date was $16,716,000. Share-based compensation of $8,192,000 related to stock options has been recognized in the consolidated statements of operations, with a corresponding benefit to equity, from inception through June 30, 2018. At that date, there remains $1,405,000 of unrecognized compensation expense to be recorded on a straight-line basis over the remaining weighted-average vesting period of 1.7 years.
A deduction is not allowed for U.S. income tax purposes with respect to non-qualified options granted in the United States until the stock options are exercised or, with respect to incentive stock options issued in the United States, unless the optionee makes a disqualifying disposition of the underlying shares. The amount of any deduction will be the difference between the fair value of the Company’s common stock and the exercise price at the date of exercise. Accordingly, there is a deferred tax asset recorded for the U.S. tax effect of the financial statement expense recorded related to stock option grants in the United States. Effective July 1, 2017, the tax effect of the U.S. income tax deduction in excess of the financial statement expense, if any, will be recorded as a benefit in the consolidated statement of operations.
A summary of the Company’s restricted stock and RSU activity follows:
| Restricted Stock | RSU |
|||||||||||||
| Shares | Weighted-Average Grant Date Fair Value |
Shares | Weighted-Average Grant Date Fair Value |
|||||||||||
|
|
|
|
|
|
||||||||||
| Nonvested at June 30, 2015 |
293,983 | $ | 6.18 | — | $ | — | ||||||||
| Granted |
263,007 | 4.10 | — | — | ||||||||||
| Vested |
(117,370) | 6.10 | — | — | ||||||||||
| Forfeited |
(66,113) | 9.25 | — | — | ||||||||||
|
|
|
|
|
|
|
|
||||||||
| Nonvested at June 30, 2016 |
373,507 | 4.20 | — | — | ||||||||||
| Granted |
349,304 | 4.10 | — | — | ||||||||||
| Vested |
(242,501) | 6.10 | — | — | ||||||||||
| Forfeited |
— | — | — | — | ||||||||||
|
|
|
|
|
|
|
|
||||||||
| Nonvested at June 30, 2017 |
480,310 | 4.54 | — | — | ||||||||||
| Granted |
125,885 | 9.69 | 211,763 | 7.15 | ||||||||||
| Vested |
(226,345) | 4.42 | — | — | ||||||||||
| Forfeited |
— | — | — | — | ||||||||||
|
|
|
|
|
|
|
|
||||||||
| Nonvested at June 30, 2018 |
379,850 | $ | 6.32 | 211,763 | $ | 7.15 | ||||||||
|
|
|
|
|
|
|
|
||||||||
F-34
Table of Contents
GENERAL FINANCE CORPORATION AND SUBSIDIARIES
NOTES TO CONSOLIDATED FINANCIAL STATEMENTS
Share-based compensation of $3,176,000 and $252,000 related to restricted stock and RSU, respectively, has been recognized in the consolidated statements of operations, with a corresponding benefit to equity, from inception through June 30, 2018. At that date, there remains $1,235,000 and $1,262,000 of unrecognized compensation expense to be recorded on a straight-line basis over the remaining vesting period of over approximately 0.29 year – 2.95 years and 2.00 years, respectively, for the restricted stock and RSU.
On October 12, 2016, the Company granted a total of 22,112 equity shares to an officer of GFN at a value equal to the closing market price of the Company’s common stock as of that date, or $4.45 per share. The fair value of this equity share grant of $98,000 has been recognized in the consolidated statements of operations as share-based compensation, with a corresponding benefit to equity.
On January 2, 2018, the Company granted a total of 42,773 equity shares to an officer of GFN at a value equal to the closing market price of the Company’s common stock as of that date, or $6.80 per share. The fair value of this equity share grant of $291,000 has been recognized as share-based compensation in the consolidated statements of operations, with a corresponding benefit to equity.
Royal Wolf Long Term Incentive Plan
Royal Wolf established the Royal Wolf Long Term Incentive Plan (the “LTI Plan”) in conjunction with its initial public offering in May 2011. Under the LTI Plan, the RWH Board of Directors may have granted, at its discretion, options, performance rights and/or restricted shares of RWH capital stock to Royal Wolf employees and executive directors. Vesting terms and conditions were up to four years and, generally, were subject to performance criteria based primarily on enhancing shareholder returns using a number of key financial benchmarks, including EBITDA. In addition, unless the RWH Board determined otherwise, if an option, performance right or restricted share had not lapsed or been forfeited earlier, it would have terminated at the seventh anniversary from the date of grant. It was intended that up to one percent of RWH’s outstanding capital stock would be reserved for grant under the LTI Plan and a trust was established to hold RWH shares for this purpose. However, since the Company held more than 50% of the outstanding shares of RWH capital stock, RWH shares reserved for grant under the LTI Plan were purchased in the open market. The LTI Plan, among other provisions, did not permit the transfer, sale, mortgage or encumbering of options, performance rights and restricted shares without the prior approval of the RWH Board. In the event of a change of control, the RWH Board, at its discretion, would have determined whether, and how many, unvested options, performance rights and restricted shares would have vested. In addition, if, in the RWH Board’s opinion, a participant acted fraudulently or dishonestly or was in breach of his obligations to Royal Wolf, the RWH Board may have deemed any options, performance rights and restricted shares held by or reserved for the participant to have lapsed or been forfeited.
With the Company’s acquisition of the noncontrolling interest of Royal Wolf (see Note 4), the LTI Plan was terminated in September 2017 and the RWH Board determined that 582,370 performance rights were deemed vested, resulting in payments totaling A$1,066,000 ($835,000) to participants. At the date of its termination, Royal Wolf had granted, net of forfeitures, 2,582,723 performance rights to key management personnel under the LTI Plan. Also, through the date of termination, 677,953 of the performance rights had been converted into RWH capital stock through purchases in the open market. In FY 2016, FY 2017 and FY 2018, share-based compensation of $959,000, $(74,000) and $1,207,000, respectively, related to the LTI Plan had been recognized in the consolidated statements of operations, with a corresponding benefit to equity. In addition, in FY 2018, $338,000 (A$458,000) was refunded back to Royal Wolf by the trust established to make the open market purchases of RWH shares reserved for grant under the LTI Plan. This refund was recorded as a benefit to equity.
F-35
Table of Contents
GENERAL FINANCE CORPORATION AND SUBSIDIARIES
NOTES TO CONSOLIDATED FINANCIAL STATEMENTS
Note 10. Commitments and Contingencies
Operating Lease Rentals
The Company leases primarily facilities and office equipment under operating leases. The leases have terms of between one and nine years, some with an option to renew the lease after that period. None of the leases includes contingent rentals. There are no restrictions placed upon the lessee by entering into these leases. Non-cancellable operating lease rentals at June 30, 2018 are payable as follows (in thousands):
| Year Ending June 30, |
||||
| 2019 |
$ | 10,311 | ||
| 2020 |
8,346 | |||
| 2021 |
6,590 | |||
| 2022 |
4,880 | |||
| 2023 |
3,981 | |||
| Thereafter |
11,547 | |||
|
|
|
|||
| $ | 45,655 | |||
|
|
|
Rental expense on non-cancellable operating leases was $10,382,000, $11,911,000 and $13,004,000 in FY 2016, FY 2017 and FY 2018, respectively.
Sales-Type and Operating Fleet Leases
Future minimum receipts under sales-type and operating fleet leases at June 30, 2018 are as follows (in thousands):
| Year Ending June 30, |
||||
| 2019 |
$ | 18,276 | ||
| 2020 |
4,065 | |||
| 2021 |
1,532 | |||
| 2022 |
866 | |||
| 2023 |
119 | |||
| Thereafter |
45 | |||
|
|
|
|||
| $ | 24,903 | |||
|
|
|
Self-Insurance
The Company has insurance policies to cover auto liability, general liability, directors and officers liability and workers compensation-related claims. Effective on February 1, 2017, the Company became self-insured for auto liability and general liability through GFNI, a wholly-owned captive insurance company, up to a maximum of $1,200,000 per policy period. Claims and expenses are reported when it is probable that a loss has occurred and the amount of the loss can be reasonably estimated. These losses include an estimate of claims that have been incurred but not reported. At June 30, 2017 and June 30, 2018, reported liability totaled $129,000 and $691,000, respectively, and has been recorded in the caption “Trade payables and accrued liabilities” in the accompanying consolidated balance sheets.
Other Matters
The Company is not involved in any material lawsuits or claims arising out of the normal course of business. The nature of its business is such that disputes can occasionally arise with employees, vendors (including suppliers and subcontractors) and customers over warranties, contract specifications and contract interpretations among other things. The Company assesses these matters on a case-by-case basis as they arise. Reserves are established, as required, based on its assessment of its exposure. The Company has insurance policies to cover property and workers compensation related claims. In the opinion of management, the ultimate amount of liability not covered by insurance under pending litigation and claims, if any, will not have a material adverse effect on our financial position, operating results or cash flows.
F-36
Table of Contents
GENERAL FINANCE CORPORATION AND SUBSIDIARIES
NOTES TO CONSOLIDATED FINANCIAL STATEMENTS
Note 11. Detail of Certain Accounts
Trade payables and accrued liabilities consist of the following (in thousands):
| June 30, | ||||||||
|
|
|
|||||||
| 2017 | 2018 | |||||||
|
|
|
|||||||
| Trade payables |
$ | 21,810 | $ | 23,142 | ||||
| Checks written in excess of bank balance |
1,660 | 1,295 | ||||||
| Payroll and related |
9,207 | 11,012 | ||||||
| Taxes, other than income |
1,812 | 1,820 | ||||||
| Fair value of interest swap and forward currency exchange contacts |
395 | 223 | ||||||
| Accrued interest |
1,841 | 4,005 | ||||||
| Deferred consideration |
1,956 | 2,568 | ||||||
| Self-insured reported liability |
129 | 691 | ||||||
| Other accruals |
3,964 | 5,789 | ||||||
|
|
|
|||||||
| $ | 42,774 | $ | 50,545 | |||||
|
|
|
|||||||
Note 12. Segment Reporting
We have two geographic areas that include four operating segments; the Asia-Pacific area, consisting of the leasing operations of Royal Wolf, and North America, consisting of the combined leasing operations of Pac-Van and Lone Star, and the manufacturing operations of Southern Frac. Discrete financial data on each of the Company’s products is not available and it would be impractical to collect and maintain financial data in such a manner. In managing the Company’s business, senior management focuses on primarily growing its leasing revenues and operating cash flow (EBITDA), and investing in its lease fleet through capital purchases and acquisitions.
F-37
Table of Contents
GENERAL FINANCE CORPORATION AND SUBSIDIARIES
NOTES TO CONSOLIDATED FINANCIAL STATEMENTS
Transactions between reportable segments included in the tables below are recorded on an arms-length basis at market in conformity with U.S. GAAP and the Company’s significant accounting policies (see Note 2). The tables below represent the Company’s revenues from external customers, share-based compensation expense, depreciation and amortization, operating income, interest income and expense, expenditures for additions to long-lived assets (consisting of lease fleet and property, plant and equipment), long-lived assets and goodwill; as attributed to its geographic and operating segments (in thousands):
| FY 2018 | ||||||||||||||||||||||||||||||||
| North America | ||||||||||||||||||||||||||||||||
| Leasing | ||||||||||||||||||||||||||||||||
| Pac-Van | Lone Star | Combined | Manufacturing | Corporate and Intercompany Adjustments |
Total | Asia – Pacific Leasing |
Consolidated | |||||||||||||||||||||||||
|
|
|
|
|
|||||||||||||||||||||||||||||
| Revenues: |
||||||||||||||||||||||||||||||||
| Sales |
$ | 55,438 | $ | 20 | $ | 55,458 | $ | 13,565 | $ | (3,715) | $ | 65,308 | $ | 67,009 | $ | 132,317 | ||||||||||||||||
| Leasing |
112,027 | 39,960 | 151,987 | - | (1,132) | 150,855 | 64,130 | 214,985 | ||||||||||||||||||||||||
|
|
|
|
|
|
|
|||||||||||||||||||||||||||
| $ | 167,465 | $ | 39,980 | $ | 207,445 | $ | 13,565 | $ | (4,847) | $ | 216,163 | $ | 131,139 | $ | 347,302 | |||||||||||||||||
|
|
|
|
|
|
|
|||||||||||||||||||||||||||
| Share-based compensation |
$ | 309 | $ | 41 | $ | 350 | $ | 46 | $ | 1,749 | $ | 2,145 | $ | 1,513 | $ | 3,658 | ||||||||||||||||
|
|
|
|
|
|
|
|||||||||||||||||||||||||||
| Depreciation and amortization |
$ | 14,233 | $ | 9,161 | $ | 23,394 | $ | 574 | $ | (731) | $ | 23,237 | $ | 17,098 | $ | 40,335 | ||||||||||||||||
|
|
|
|
|
|
|
|||||||||||||||||||||||||||
| Operating income |
$ | 28,689 | $ | 8,798 | $ | 37,487 | $ | (351) | $ | (6,709) | $ | 30,427 | $ | 13,272 | $ | 43,699 | ||||||||||||||||
|
|
|
|
|
|
|
|||||||||||||||||||||||||||
| Interest income |
$ | - | $ | - | $ | - | $ | - | $ | 9 | $ | 9 | $ | 103 | $ | 112 | ||||||||||||||||
|
|
|
|
|
|
|
|||||||||||||||||||||||||||
| Interest expense |
$ | 9,172 | $ | 1,770 | $ | 10,942 | $ | 384 | $ | 7,291 | $ | 18,617 | $ | 15,374 | $ | 33,991 | ||||||||||||||||
|
|
|
|
|
|
|
|||||||||||||||||||||||||||
| Additions to long-lived assets |
$ | 33,628 | $ | 3,326 | $ | 36,954 | $ | 131 | $ | (334) | $ | 36,751 | $ | 16,599 | $ | 53,350 | ||||||||||||||||
|
|
|
|||||||||||||||||||||||||||||||
| At June 30, 2018 | ||||||||||||||||||||||||||||||||
| Long-lived assets |
$ | 264,651 | $ | 49,352 | $ | 314,003 | $ | 2,083 | $ | (10,099) | $ | 305,987 | $ | 145,711 | $ | 451,698 | ||||||||||||||||
|
|
|
|||||||||||||||||||||||||||||||
| Goodwill |
$ | 61,693 | $ | 20,782 | $ | 82,475 | $ | - | $ | - | $ | 82,475 | $ | 27,468 | $ | 109,943 | ||||||||||||||||
|
|
|
|||||||||||||||||||||||||||||||
F-38
Table of Contents
GENERAL FINANCE CORPORATION AND SUBSIDIARIES
NOTES TO CONSOLIDATED FINANCIAL STATEMENTS
| FY 2017 | ||||||||||||||||||||||||||||||||
| North America | ||||||||||||||||||||||||||||||||
| Leasing | ||||||||||||||||||||||||||||||||
| Pac-Van | Lone Star | Combined | Manufacturing | Corporate and Intercompany Adjustments |
Total | Asia – Pacific Leasing |
Consolidated | |||||||||||||||||||||||||
|
|
|
|
|
|||||||||||||||||||||||||||||
| Revenues: |
||||||||||||||||||||||||||||||||
| Sales |
$ | 47,640 | $ | - | $ | 47,640 | $ | 6,944 | $ | (2,049) | $ | 52,535 | $ | 48,124 | $ | 100,659 | ||||||||||||||||
| Leasing |
97,383 | 19,097 | 116,480 | - | (291) | 116,189 | 60,080 | 176,269 | ||||||||||||||||||||||||
|
|
|
|
|
|
|
|||||||||||||||||||||||||||
| $ | 145,023 | $ | 19,097 | $ | 164,120 | $ | 6,944 | $ | (2,340) | $ | 168,724 | $ | 108,204 | $ | 276,928 | |||||||||||||||||
|
|
|
|
|
|
|
|||||||||||||||||||||||||||
| Share-based compensation |
$ | 333 | $ | 41 | $ | 374 | $ | 62 | $ | 1,012 | $ | 1,448 | $ | (74) | $ | 1,374 | ||||||||||||||||
|
|
|
|
|
|
|
|||||||||||||||||||||||||||
| Depreciation and amortization |
$ | 13,663 | $ | 9,666 | $ | 23,329 | $ | 792 | $ | (728) | $ | 23,393 | $ | 16,699 | $ | 40,092 | ||||||||||||||||
|
|
|
|
|
|
|
|||||||||||||||||||||||||||
| Operating income (loss) |
$ | 19,551 | $ | (3,916) | $ | 15,635 | $ | (2,430) | $ | (4,907) | $ | 8,298 | $ | 10,768 | $ | 19,066 | ||||||||||||||||
|
|
|
|
|
|
|
|||||||||||||||||||||||||||
| Interest income |
$ | - | $ | - | $ | - | $ | - | $ | 25 | $ | 25 | $ | 41 | $ | 66 | ||||||||||||||||
|
|
|
|
|
|
|
|||||||||||||||||||||||||||
| Interest expense |
$ | 7,304 | $ | 1,369 | $ | 8,673 | $ | 392 | $ | 7,325 | $ | 16,390 | $ | 3,263 | $ | 19,653 | ||||||||||||||||
|
|
|
|
|
|
|
|||||||||||||||||||||||||||
| Additions to long-lived assets |
$ | 26,024 | $ | 47 | $ | 26,071 | $ | - | $ | (247) | $ | 25,824 | $ | 23,681 | $ | 49,505 | ||||||||||||||||
|
|
|
|
|
|
|
|||||||||||||||||||||||||||
| At June 30, 2017 | ||||||||||||||||||||||||||||||||
| Long-lived assets |
$ | 244,973 | $ | 52,158 | $ | 297,131 | $ | 2,526 | $ | (10,521) | $ | 289,136 | $ | 161,527 | $ | 450,663 | ||||||||||||||||
|
|
|
|
|
|
|
|||||||||||||||||||||||||||
| Goodwill |
$ | 55,882 | $ | 20,782 | $ | 76,664 | $ | - | $ | - | $ | 76,664 | $ | 28,465 | $ | 105,129 | ||||||||||||||||
|
|
|
|
|
|
|
|||||||||||||||||||||||||||
| FY 2016 | ||||||||||||||||||||||||||||||||
| North America | ||||||||||||||||||||||||||||||||
| Leasing | ||||||||||||||||||||||||||||||||
| Pac-Van | Lone Star | Combined | Manufacturing | Corporate and Intercompany Adjustments |
Total | Asia – Pacific Leasing |
Consolidated | |||||||||||||||||||||||||
|
|
|
|
|
|||||||||||||||||||||||||||||
| Revenues: |
||||||||||||||||||||||||||||||||
| Sales |
$ | 47,973 | $ | - | $ | 47,973 | $ | 8,130 | $ | (1,951) | $ | 54,152 | $ | 63,466 | $ | 117,618 | ||||||||||||||||
| Leasing |
88,877 | 23,378 | 112,255 | - | (275) | 111,980 | 56,253 | 168,233 | ||||||||||||||||||||||||
|
|
|
|
|
|
|
|||||||||||||||||||||||||||
| $ | 136,850 | $ | 23,378 | $ | 160,228 | $ | 8,130 | $ | (2,226) | $ | 166,132 | $ | 119,719 | $ | 285,851 | |||||||||||||||||
|
|
|
|
|
|
|
|||||||||||||||||||||||||||
| Share-based compensation |
$ | 374 | $ | 22 | $ | 396 | $ | 100 | $ | 933 | $ | 1,429 | $ | 959 | $ | 2,388 | ||||||||||||||||
|
|
|
|
|
|
|
|||||||||||||||||||||||||||
| Impairment of goodwill and trade name |
$ | - | $ | - | $ | - | $ | 3,068 | $ | - | $ | 3,068 | $ | - | $ | 3,068 | ||||||||||||||||
|
|
|
|
|
|
|
|||||||||||||||||||||||||||
| Depreciation and amortization |
$ | 13,154 | $ | 10,529 | $ | 23,683 | $ | 1,343 | $ | (746) | $ | 24,280 | $ | 14,354 | $ | 38,634 | ||||||||||||||||
|
|
|
|
|
|
|
|||||||||||||||||||||||||||
| Operating income (loss) |
$ | 17,984 | $ | (1,541) | $ | 16,443 | $ | (9,464) | $ | (5,430) | $ | 1,549 | $ | 12,834 | $ | 14,383 | ||||||||||||||||
|
|
|
|
|
|
|
|||||||||||||||||||||||||||
| Interest income |
$ | - | $ | - | $ | - | $ | - | $ | - | $ | 5 | $ | 92 | $ | 97 | ||||||||||||||||
|
|
|
|
|
|
|
|||||||||||||||||||||||||||
| Interest expense |
$ | 5,802 | $ | 1,453 | $ | 7,255 | $ | 291 | $ | 7,473 | $ | 15,019 | $ | 4,629 | $ | 19,648 | ||||||||||||||||
|
|
|
|
|
|
|
|||||||||||||||||||||||||||
| Additions to long-lived assets |
$ | 32,225 | $ | 245 | $ | 32,470 | $ | 183 | $ | (97) | $ | 32,556 | $ | 20,988 | $ | 53,544 | ||||||||||||||||
|
|
|
|
|
|
|
|||||||||||||||||||||||||||
F-39
Table of Contents
GENERAL FINANCE CORPORATION AND SUBSIDIARIES
NOTES TO CONSOLIDATED FINANCIAL STATEMENTS
Intersegment net revenues related to sales of primarily portable liquid storage containers and ground level offices from Southern Frac to the North American leasing operations totaled $1,951,000, $2,049,000 and $3,715,000 during FY 2016, FY 2017 and FY 2018, respectively; and intrasegment net revenues in the North American leasing operations related to primarily the leasing of portable liquid storage containers from Pac-Van to Lone Star totaled $1,000,000 during FY 2018.
Note 13. Subsequent Events
On July 2, 2018, the Company, through Royal Wolf, purchased the container business of Spacewise (N.Z.) Limited (“Spacewise NZ”), for approximately $7,396,000 (NZ$10,901,000) which included holdback and other adjustment amounts totaling approximately $625,000 (NZ$921,000). Spacewise operates from eight major locations in New Zealand.
On July 13, 2018, the Company announced that its Board of Directors declared a cash dividend of $2.30 per share on the Series C Preferred Stock (see Note 3). The dividend is for the period commencing on April 30, 2018 through July 30, 2018, and payable on July 31, 2018 to holders of record as of July 30, 2018.
On August 9, 2018, the Company, through Pac-Van, purchased the container and trailer business of Delmarva Trailer Sales and Rentals, Inc. (“Delmarva”) for approximately $470,000, which included a general indemnity and other adjustments of $157,000. Delmarva is located in Elkridge (Baltimore/D.C. area), Maryland.
On September 6, 2018, the Company elected to force the conversion of the aggregate $26,000,000 principal balance of the Convertible Note into shares of GFN common stock (see Note 5).
F-40
Table of Contents
SCHEDULE I — CONDENSED FINANCIAL INFORMATION OF REGISTRANT
GENERAL FINANCE CORPORATION
(PARENT COMPANY INFORMATION)
CONDENSED BALANCE SHEETS
| June 30, | ||||||||
| 2017 | 2018 | |||||||
| (in thousands) | ||||||||
| Cash and cash equivalents |
$ | 3,944 | $ | 89 | ||||
| Property and equipment, net |
20 | 14 | ||||||
| Other assets |
13,597 | 19,489 | ||||||
| Investment and intercompany accounts |
205,048 | 200,294 | ||||||
|
|
|
|
|
|||||
| Total Assets |
$ | 222,609 | $ | 219,886 | ||||
|
|
|
|
|
|||||
| Accounts payable, accrued and other liabilities |
$ | 2,224 | $ | 2,781 | ||||
| Senior and other debt |
85,239 | 75,824 | ||||||
| General Finance Corporation stockholders’ equity |
135,146 | 141,281 | ||||||
|
|
|
|
|
|||||
| Total Liabilities and Stockholders’ Equity |
$ | 222,609 | $ | 219,886 | ||||
|
|
|
|
|
|||||
S-1
Table of Contents
SCHEDULE I — CONDENSED FINANCIAL INFORMATION OF REGISTRANT
GENERAL FINANCE CORPORATION
(PARENT COMPANY INFORMATION)
CONDENSED STATEMENTS OF OPERATIONS
| Year Ended June 30, | ||||||||||||
| 2016 | 2017 | 2018 | ||||||||||
| (in thousands) | ||||||||||||
| General and administrative expenses |
$ | 6,030 | $ | 5,501 | $ | 7,058 | ||||||
|
|
|
|
|
|
|
|||||||
| Equity in earnings (losses) of subsidiaries |
(11,842) | (8,568) | (16,886) | |||||||||
| Intercompany income |
14,959 | 13,806 | 16,138 | |||||||||
| Interest expense |
(7,473) | (7,325) | (7,291) | |||||||||
| Other income, net |
5 | 21 | 7 | |||||||||
|
|
|
|
|
|
|
|||||||
| (4,351) | (2,066) | (8,032) | ||||||||||
|
|
|
|
|
|
|
|||||||
| Loss before income taxes |
(10,381) | (7,567) | (15,090) | |||||||||
| Income tax benefit |
(5,024) | (4,605) | (6,784) | |||||||||
|
|
|
|
|
|
|
|||||||
| Net loss attributable to stockholders |
(5,357) | (2,962) | (8,306) | |||||||||
| Preferred stock dividends |
3,668 | 3,658 | 3,658 | |||||||||
|
|
|
|
|
|
|
|||||||
| Net loss attributable to common stockholders |
$ | (9,025) | $ | (6,620) | $ | (11,964) | ||||||
|
|
|
|
|
|
|
|||||||
S-2
Table of Contents
SCHEDULE I — CONDENSED FINANCIAL INFORMATION OF REGISTRANT
GENERAL FINANCE CORPORATION
(PARENT COMPANY INFORMATION)
CONDENSED STATEMENTS OF CASH FLOWS
| Year Ended June 30, | ||||||||||||
| 2016 | 2017 | 2018 | ||||||||||
| (in thousands) | ||||||||||||
| Cash flows from operating activities: |
||||||||||||
| Net loss attributable to stockholders |
$ | (5,357) | $ | (2,962) | $ | (8,306) | ||||||
| Equity in (earnings) losses of subsidiaries |
11,842 | 8,568 | 16,886 | |||||||||
| Depreciation and amortization |
687 | 593 | 623 | |||||||||
| Share-based compensation expense |
933 | 1,012 | 1,749 | |||||||||
| Deferred income taxes |
(5,024) | (4,605) | (6,784) | |||||||||
| Changes in operating assets and liabilities |
(1,487) | 418 | 1,950 | |||||||||
|
|
|
|
|
|
|
|||||||
| Net cash provided by operating activities |
1,594 | 3,024 | 6,118 | |||||||||
|
|
|
|
|
|
|
|||||||
| Cash flows from investing activities: |
||||||||||||
| Purchases of property and equipment |
(9) | (21) | (5) | |||||||||
| Other intangible assets |
— | (50) | — | |||||||||
|
|
|
|
|
|
|
|||||||
| Net cash used in investing activities |
(9) | (71) | (5) | |||||||||
|
|
|
|
|
|
|
|||||||
| Cash flows from financing activities: |
||||||||||||
| Repayments of senior and other debt borrowings |
(5,000) | — | (10,000) | |||||||||
| Proceeds from issuances of senior notes |
— | 5,390 | — | |||||||||
| Deferred financing costs |
(134) | (477) | (31) | |||||||||
| Proceeds from issuances of common stock |
40 | 54 | 1,150 | |||||||||
| Preferred stock dividends |
(3,668) | (3,658) | (3,658) | |||||||||
| Intercompany transfers |
10,305 | (3,760) | 2,571 | |||||||||
|
|
|
|
|
|
|
|||||||
| Net cash provided by (used in) financing activities |
1,543 | (2,451) | (9,968) | |||||||||
|
|
|
|
|
|
|
|||||||
| Net increase (decrease) in cash |
3,128 | 502 | (3,855) | |||||||||
| Cash at beginning of period |
314 | 3,442 | 3,944 | |||||||||
|
|
|
|
|
|
|
|||||||
| Cash at end of period |
$ | 3,442 | $ | 3,944 | $ | 89 | ||||||
|
|
|
|
|
|
|
|||||||
S-3