Attached files
| file | filename |
|---|---|
| EX-32.1 - EXHIBIT 32.1 - PRA GROUP INC | exhibit321-20180331.htm |
| EX-31.2 - EXHIBIT 31.2 - PRA GROUP INC | exhibit312-20180331.htm |
| EX-31.1 - EXHIBIT 31.1 - PRA GROUP INC | exhibit311-20180331.htm |
| EX-10.2 - EXHIBIT 10.2 - PRA GROUP INC | exhibit102-20180331.htm |
| EX-10.1 - EXHIBIT 10.1 - PRA GROUP INC | exhibit101-20180331.htm |
UNITED STATES SECURITIES AND EXCHANGE COMMISSION
Washington, D.C. 20549
FORM 10-Q
ý Quarterly Report Pursuant to Section 13 or 15(d) of the Securities Exchange Act of 1934
For the quarterly period ended March 31, 2018
¨ Transition Report pursuant to Section 13 or 15(d) of the Securities Exchange Act of 1934
For the transition period from ________ to ________
Commission File Number: 000-50058
PRA Group, Inc.
(Exact name of registrant as specified in its charter)
Delaware | 75-3078675 | |||
(State or other jurisdiction of incorporation or organization) | (I.R.S. Employer Identification No.) | |||
120 Corporate Boulevard, Norfolk, Virginia | 23502 | (888) 772-7326 | ||
(Address of principal executive offices) | (Zip Code) | (Registrant's Telephone No., including area code) | ||
Not Applicable | ||||
(Former name, former address and former fiscal year, if changed since last report) | ||||
Indicate by check mark whether the registrant (1) has filed all reports required to be filed by Section 13 or 15(d) of the Securities Exchange Act of 1934 during the preceding 12 months (or for such shorter period that the registrant was required to file such reports), and (2) has been subject to such filing requirements for the past 90 days. YES þ NO ¨
Indicate by check mark whether the registrant has submitted electronically and posted on its corporate Web site, if any, every Interactive Data File required to be submitted and posted pursuant to Rule 405 of Regulation S-T during the preceding 12 months (or for such shorter period that the registrant was required to submit and post such files). YES þ NO ¨
Indicate by check mark whether the registrant is a large accelerated filer, an accelerated filer, a non-accelerated filer, a smaller reporting company, or an emerging growth company. See the definitions of "large accelerated filer," "accelerated filer," "smaller reporting company," and "emerging growth company" in Rule 12b-2 of the Exchange Act. (Check one):
Large accelerated filer þ Accelerated filer ¨ Non-accelerated filer ¨ Smaller reporting company ¨ Emerging growth company ¨
If an emerging growth company, indicate by check mark if the registrant has elected not to use the extended transition period for complying with any new or revised financial accounting standards provided pursuant to h Section 13(a) of the Exchange Act. ¨
Indicate by check mark whether the registrant is a shell company (as defined in Rule 12b-2 of the Exchange Act). YES ¨ NO þ
The number of shares of the registrant's common stock outstanding as of May 4, 2018 was 45,275,197.
Table of Contents
Item 1. | ||
Item 2. | ||
Item 3. | ||
Item 4. | ||
Item 1. | ||
Item 1A. | ||
Item 2. | ||
Item 3. | ||
Item 4. | ||
Item 5. | ||
Item 6. | ||
Signatures | ||
2
Part I. Financial Information
Item 1. Financial Statements
PRA Group, Inc.
Consolidated Balance Sheets
March 31, 2018 and December 31, 2017
(Amounts in thousands)
(unaudited) | |||||||
March 31, 2018 | December 31, 2017 | ||||||
Assets | |||||||
Cash and cash equivalents | $ | 101,418 | $ | 120,516 | |||
Investments | 87,764 | 78,290 | |||||
Finance receivables, net | 2,767,131 | 2,771,921 | |||||
Other receivables, net | 14,308 | 15,770 | |||||
Income taxes receivable | 10,271 | 21,686 | |||||
Net deferred tax asset | 60,446 | 57,529 | |||||
Property and equipment, net | 53,788 | 49,311 | |||||
Goodwill | 544,293 | 526,513 | |||||
Intangible assets, net | 22,523 | 23,572 | |||||
Other assets | 37,639 | 32,656 | |||||
Total assets | $ | 3,699,581 | $ | 3,697,764 | |||
Liabilities and Equity | |||||||
Liabilities: | |||||||
Accounts payable | $ | 2,330 | $ | 4,992 | |||
Accrued expenses | 85,137 | 85,993 | |||||
Income taxes payable | 23,872 | 10,771 | |||||
Net deferred tax liability | 146,410 | 171,185 | |||||
Interest-bearing deposits | 90,769 | 98,580 | |||||
Borrowings | 2,150,873 | 2,170,182 | |||||
Other liabilities | 15,146 | 9,018 | |||||
Total liabilities | 2,514,537 | 2,550,721 | |||||
Redeemable noncontrolling interest | 9,697 | 9,534 | |||||
Equity: | |||||||
Preferred stock, $0.01 par value, 2,000 shares authorized, no shares issued and outstanding | — | — | |||||
Common stock, $0.01 par value, 100,000 shares authorized, 45,275 shares issued and outstanding at March 31, 2018; 100,000 shares authorized, 45,189 shares issued and outstanding at December 31, 2017 | 453 | 452 | |||||
Additional paid-in capital | 54,271 | 53,870 | |||||
Retained earnings | 1,228,808 | 1,211,632 | |||||
Accumulated other comprehensive loss | (155,687 | ) | (178,607 | ) | |||
Total stockholders' equity - PRA Group, Inc. | 1,127,845 | 1,087,347 | |||||
Noncontrolling interest | 47,502 | 50,162 | |||||
Total equity | 1,175,347 | 1,137,509 | |||||
Total liabilities and equity | $ | 3,699,581 | $ | 3,697,764 | |||
The accompanying notes are an integral part of these consolidated financial statements.
3
PRA Group, Inc.
Consolidated Income Statements
For the three months ended March 31, 2018 and 2017
(unaudited)
(Amounts in thousands, except per share amounts)
Three Months Ended March 31, | |||||||
2018 | 2017 | ||||||
Revenues: | |||||||
Income recognized on finance receivables, net | $ | 217,699 | $ | 194,535 | |||
Fee income | 5,327 | 9,858 | |||||
Other revenue | 157 | 2,165 | |||||
Total revenues | 223,183 | 206,558 | |||||
Operating expenses: | |||||||
Compensation and employee services | 81,237 | 68,468 | |||||
Legal collection expenses | 32,912 | 31,728 | |||||
Agency fees | 8,278 | 10,800 | |||||
Outside fees and services | 14,158 | 13,285 | |||||
Communication | 11,557 | 9,137 | |||||
Rent and occupancy | 4,314 | 3,783 | |||||
Depreciation and amortization | 4,929 | 5,215 | |||||
Other operating expenses | 12,184 | 10,885 | |||||
Total operating expenses | 169,569 | 153,301 | |||||
Income from operations | 53,614 | 53,257 | |||||
Other income and (expense): | |||||||
Gain on sale of subsidiaries | — | 46,845 | |||||
Interest expense, net | (25,781 | ) | (21,257 | ) | |||
Foreign exchange gain | 1,293 | 2,179 | |||||
Other | 243 | — | |||||
Income before income taxes | 29,369 | 81,024 | |||||
Provision for income taxes | 6,137 | 31,409 | |||||
Net income | 23,232 | 49,615 | |||||
Adjustment for net income attributable to noncontrolling interests | 2,126 | 1,448 | |||||
Net income attributable to PRA Group, Inc. | $ | 21,106 | $ | 48,167 | |||
Net income per common share attributable to PRA Group, Inc.: | |||||||
Basic | $ | 0.47 | $ | 1.04 | |||
Diluted | $ | 0.47 | $ | 1.03 | |||
Weighted average number of shares outstanding: | |||||||
Basic | 45,231 | 46,406 | |||||
Diluted | 45,370 | 46,627 | |||||
The accompanying notes are an integral part of these consolidated financial statements.
4
PRA Group, Inc.
Consolidated Statements of Comprehensive Income/(Loss)
For the three months ended March 31, 2018 and 2017
(unaudited)
(Amounts in thousands)
Three Months Ended March 31, | |||||||
2018 | 2017 | ||||||
Net income | $ | 23,232 | $ | 49,615 | |||
Other comprehensive income: | |||||||
Change in foreign currency translation | 29,941 | 14,823 | |||||
Total comprehensive income | 53,173 | 64,438 | |||||
Comprehensive income/(loss) attributable to noncontrolling interest: | |||||||
Net income attributable to noncontrolling interest | 2,126 | 1,448 | |||||
Change in foreign currency translation | 7,021 | (3,645 | ) | ||||
Comprehensive income/(loss) attributable to noncontrolling interest | 9,147 | (2,197 | ) | ||||
Comprehensive income attributable to PRA Group, Inc. | $ | 44,026 | $ | 66,635 | |||
The accompanying notes are an integral part of these consolidated financial statements.
5
PRA Group, Inc.
Consolidated Statement of Changes in Equity
For the three months ended March 31, 2018
(unaudited)
(Amounts in thousands)
Common Stock | Additional Paid-in Capital | Retained Earnings | Accumulated Other Comprehensive Income/(Loss) | Noncontrolling Interest | Total Equity | |||||||||||||||||||||
Shares | Amount | |||||||||||||||||||||||||
Balance at December 31, 2017 | 45,189 | $ | 452 | $ | 53,870 | $ | 1,211,632 | $ | (178,607 | ) | $ | 50,162 | $ | 1,137,509 | ||||||||||||
Cumulative effect of change in accounting principle - equity securities (1) | — | — | — | (3,930 | ) | — | — | (3,930 | ) | |||||||||||||||||
Balance at January 1, 2018 | 45,189 | 452 | 53,870 | 1,207,702 | (178,607 | ) | 50,162 | 1,133,579 | ||||||||||||||||||
Components of comprehensive income: | ||||||||||||||||||||||||||
Net income | — | — | — | 21,106 | — | 2,126 | 23,232 | |||||||||||||||||||
Foreign currency translation adjustment | — | — | — | — | 22,920 | 7,021 | 29,941 | |||||||||||||||||||
Distributions paid to noncontrolling interest | — | — | — | — | — | (11,807 | ) | (11,807 | ) | |||||||||||||||||
Vesting of restricted stock | 86 | 1 | (1 | ) | — | — | — | — | ||||||||||||||||||
Share-based compensation expense | — | — | 2,415 | — | — | — | 2,415 | |||||||||||||||||||
Employee stock relinquished for payment of taxes | — | — | (2,013 | ) | — | — | — | (2,013 | ) | |||||||||||||||||
Balance at March 31, 2018 | 45,275 | $ | 453 | $ | 54,271 | $ | 1,228,808 | $ | (155,687 | ) | $ | 47,502 | $ | 1,175,347 | ||||||||||||
(1) Relates to the adoption of FASB ASU 2016-01, "Financial Instruments - Overall: Recognition and Measurement of Financial Assets and Financial Liabilities" ("ASU 2016-01"). Refer to Note 3 for further detail.
The accompanying notes are an integral part of these consolidated financial statements.
6
PRA Group, Inc.
Consolidated Statements of Cash Flows
For the three months ended March 31, 2018 and 2017
(unaudited)
(Amounts in thousands)
Three Months Ended March 31, | |||||||
2018 | 2017 | ||||||
Cash flows from operating activities: | |||||||
Net income | $ | 23,232 | $ | 49,615 | |||
Adjustments to reconcile net income to net cash provided by operating activities: | |||||||
Share-based compensation expense | 2,415 | 2,199 | |||||
Depreciation and amortization | 4,929 | 5,215 | |||||
Gain on sale of subsidiaries | — | (46,845 | ) | ||||
Amortization of debt discount and issuance costs | 5,430 | 3,083 | |||||
Deferred tax (benefit)/expense | (10,138 | ) | 25 | ||||
Net unrealized foreign currency transaction gain | (467 | ) | (1,723 | ) | |||
Fair value in earnings for equity securities | (409 | ) | — | ||||
Other | — | (1,359 | ) | ||||
Changes in operating assets and liabilities: | |||||||
Other assets | (5,787 | ) | 1,837 | ||||
Other receivables, net | 1,536 | (4,744 | ) | ||||
Accounts payable | (2,749 | ) | 648 | ||||
Income taxes payable, net | 9,984 | 27,708 | |||||
Accrued expenses | (1,058 | ) | (5,526 | ) | |||
Other liabilities | 6,799 | 2,518 | |||||
Net cash provided by operating activities | 33,717 | 32,651 | |||||
Cash flows from investing activities: | |||||||
Purchases of property and equipment | (7,917 | ) | (2,938 | ) | |||
Acquisition of finance receivables, net of buybacks | (165,913 | ) | (226,092 | ) | |||
Collections applied to principal on finance receivables | 208,881 | 185,295 | |||||
Proceeds from sale of subsidiaries, net | — | 89,077 | |||||
Purchase of investments | (13,924 | ) | (3,569 | ) | |||
Proceeds from sales and maturities of investments | 96 | 2,907 | |||||
Net cash provided by investing activities | 21,223 | 44,680 | |||||
Cash flows from financing activities: | |||||||
Proceeds from lines of credit | 101,015 | 153,353 | |||||
Principal payments on lines of credit | (147,980 | ) | (232,108 | ) | |||
Tax withholdings related to share-based payments | (2,013 | ) | (2,320 | ) | |||
Distributions paid to noncontrolling interest | (12,464 | ) | (710 | ) | |||
Principal payments on notes payable and long-term debt | (2,502 | ) | (10,012 | ) | |||
Payments of origination costs and fees | (380 | ) | — | ||||
Net (decrease)/increase in interest-bearing deposits | (6,314 | ) | 1,473 | ||||
Net cash used in financing activities | (70,638 | ) | (90,324 | ) | |||
Effect of exchange rate on cash | (3,400 | ) | 816 | ||||
Net decrease in cash and cash equivalents | (19,098 | ) | (12,177 | ) | |||
Cash and cash equivalents, beginning of period | 120,516 | 94,287 | |||||
Cash and cash equivalents, end of period | $ | 101,418 | $ | 82,110 | |||
Supplemental disclosure of cash flow information: | |||||||
Cash paid for interest | $ | 22,833 | $ | 20,257 | |||
Cash paid for income taxes | 12,175 | 4,858 | |||||
The accompanying notes are an integral part of these consolidated financial statements.
7
PRA Group, Inc.
Notes to Consolidated Financial Statements
1. Organization and Business:
As used herein, the terms "PRA Group," "the Company," or similar terms refer to PRA Group, Inc. and its subsidiaries.
PRA Group, Inc., a Delaware corporation, and its subsidiaries, is a global financial and business services company with operations in the Americas and Europe. The Company's primary business is the purchase, collection and management of portfolios of nonperforming loans. The Company also provides the following fee-based services: class action claims recovery services and purchases; servicing of consumer bankruptcy accounts in the United States ("U.S."); and, to a lesser extent, contingent collections of nonperforming loans in Europe and South America.
The consolidated financial statements of the Company are prepared in accordance with U.S. generally accepted accounting principles ("GAAP") and include the accounts of all of its subsidiaries. All significant intercompany accounts and transactions have been eliminated. Under the guidance of the Financial Accounting Standards Board ("FASB") Accounting Standards Codification ("ASC") Topic 280 "Segment Reporting" ("ASC 280"), the Company has determined that it has several operating segments that meet the aggregation criteria of ASC 280, and, therefore, it has one reportable segment, accounts receivable management, based on similarities among the operating units, including economic characteristics, the nature of the products and services, the nature of the production processes, the types or class of customer for their products and services, the methods used to distribute their products and services and the nature of the regulatory environment.
The following table shows the amount of revenue generated for the three months ended March 31, 2018 and 2017, respectively, and long-lived assets held at March 31, 2018 and 2017, respectively, both for the U.S., the Company's country of domicile, and outside of the U.S. (amounts in thousands):
As of and for the | As of and for the | ||||||||||||||
Three Months Ended March 31, 2018 | Three Months Ended March 31, 2017 | ||||||||||||||
Revenues | Long-Lived Assets | Revenues | Long-Lived Assets | ||||||||||||
United States | $ | 154,627 | $ | 46,439 | $ | 143,928 | $ | 29,166 | |||||||
United Kingdom | 24,919 | 2,225 | 18,428 | 3,083 | |||||||||||
Other (1) | 43,637 | 5,124 | 44,202 | 5,775 | |||||||||||
Total | $ | 223,183 | $ | 53,788 | $ | 206,558 | $ | 38,024 | |||||||
Revenues are attributed to countries based on the location of the related operations. Long-lived assets consist of net property and equipment. The Company reports revenues earned from debt purchasing and collection activities, fee-based services and its investments. It is impracticable for the Company to report further breakdowns of revenues from external customers by product or service.
The accompanying interim financial statements have been prepared in accordance with the instructions for Form 10-Q and, therefore, do not include all information and notes to the consolidated financial statements necessary for a complete presentation of financial position, results of operations, comprehensive income and cash flows in conformity with GAAP. In the opinion of management, all adjustments, consisting of normal and recurring items, necessary for the fair presentation of the Company's consolidated balance sheet as of March 31, 2018, its consolidated income statements and statements of comprehensive income/(loss) for the three months ended March 31, 2018 and 2017, its consolidated statement of changes in equity for the three months ended March 31, 2018, and its consolidated statements of cash flows for the three months ended March 31, 2018 and 2017, have been included. The consolidated income statements of the Company for the three months ended March 31, 2018 may not be indicative of future results. Certain prior period amounts have been reclassified for consistency with the current period presentation. These unaudited consolidated financial statements should be read in conjunction with the audited consolidated financial statements and notes thereto included in the Company's 2017 Annual Report on Form 10-K for the year ended December 31, 2017, filed with the Securities and Exchange Commission on February 28, 2018.
8
PRA Group, Inc.
Notes to Consolidated Financial Statements
2. Finance Receivables, net:
Changes in finance receivables, net for the three months ended March 31, 2018 and 2017 were as follows (amounts in thousands):
Three Months Ended March 31, | |||||||
2018 | 2017 | ||||||
Balance at beginning of period | $ | 2,771,921 | $ | 2,307,969 | |||
Acquisitions of finance receivables (1) | 165,020 | 226,397 | |||||
Foreign currency translation adjustment | 39,071 | 17,809 | |||||
Cash collections applied to principal and net allowance charges | (208,881 | ) | (185,295 | ) | |||
Balance at end of period | $ | 2,767,131 | $ | 2,366,880 | |||
(1) | Acquisitions of finance receivables are net of buybacks and include certain capitalized acquisition related costs. |
During the three months ended March 31, 2018, the Company purchased finance receivables portfolios with a face value of $1.5 billion for $168.3 million. During the three months ended March 31, 2017, the Company purchased finance receivables portfolios with a face value of $1.7 billion for $227.8 million. At March 31, 2018, the estimated remaining collections ("ERC") on the receivables purchased during the three months ended March 31, 2018 and 2017 were $309.3 million and $304.4 million, respectively. At March 31, 2018 and 2017, total ERC were $5.8 billion and $5.1 billion, respectively.
At the time of acquisition and each quarter thereafter, the life of each pool is estimated based on projected amounts and timing of future cash collections using the proprietary models of the Company. Based upon current projections, cash collections expected to be applied to principal are estimated to be as follows for the years ending March 31, (amounts in thousands):
2019 | $ | 800,078 | |
2020 | 639,673 | ||
2021 | 493,857 | ||
2022 | 361,017 | ||
2023 | 208,769 | ||
2024 | 118,724 | ||
2025 | 52,008 | ||
2026 | 33,981 | ||
2027 | 16,914 | ||
2028 | 12,037 | ||
Thereafter | 30,073 | ||
Total ERC expected to be applied to principal | $ | 2,767,131 | |
At March 31, 2018, the Company had aggregate net finance receivables balances in pools accounted for under the cost recovery method of $149.2 million; at December 31, 2017, the amount was $166.6 million.
Accretable yield represents the amount of income on finance receivables the Company can expect to recognize over the remaining life of its existing portfolios based on estimated future cash flows as of the balance sheet date. Additions represent the original expected accretable yield, on portfolios purchased during the period, to be earned by the Company based on its proprietary analytical models. Net reclassifications from nonaccretable difference to accretable yield primarily result from the increase in the Company's estimate of future cash flows. When applicable, net reclassifications to nonaccretable difference from accretable yield result from the decrease in the Company's estimates of future cash flows and allowance charges that together exceed the increase in the Company's estimate of future cash flows.
9
PRA Group, Inc.
Notes to Consolidated Financial Statements
Changes in accretable yield for the three months ended March 31, 2018 and 2017 were as follows (amounts in thousands):
Three Months Ended March 31, | |||||||
2018 | 2017 | ||||||
Balance at beginning of period | $ | 2,932,144 | $ | 2,740,006 | |||
Income recognized on finance receivables, net | (217,699 | ) | (194,535 | ) | |||
Additions from portfolio purchases | 146,832 | 163,395 | |||||
Reclassifications from nonaccretable difference | 112,028 | 47,078 | |||||
Foreign currency translation adjustment | 37,241 | 20,502 | |||||
Balance at end of period | $ | 3,010,546 | $ | 2,776,446 | |||
The following is a summary of activity within the Company's valuation allowance account, all of which relates to loans acquired with deteriorated credit quality, for the three months ended March 31, 2018 and 2017 (amounts in thousands):
Three Months Ended March 31, | |||||||
2018 | 2017 | ||||||
Beginning balance | $ | 225,555 | $ | 211,465 | |||
Allowance charges | 6,833 | 2,708 | |||||
Reversal of previously recorded allowance charges | (5,908 | ) | (29 | ) | |||
Net allowance charges | 925 | 2,679 | |||||
Foreign currency translation adjustment | 495 | 269 | |||||
Ending balance | $ | 226,975 | $ | 214,413 | |||
3. Investments:
Investments consisted of the following at March 31, 2018 and December 31, 2017 (amounts in thousands):
March 31, 2018 | December 31, 2017 | ||||||
Debt securities | |||||||
Available-for-sale | $ | 5,464 | $ | 5,429 | |||
Held-to-maturity | 58,181 | 57,204 | |||||
Equity securities | |||||||
Private equity funds | 8,824 | 14,248 | |||||
Mutual funds | 15,295 | 1,409 | |||||
Total investments | $ | 87,764 | $ | 78,290 | |||
Debt Securities
Available-for-Sale
Government bonds: The Company's investments in government bonds are classified as available-for-sale and are stated at fair value. Fair value is determined using quoted market prices. Unrealized gains and losses are included in comprehensive income and reported in equity.
Held-to-Maturity
Investments in securitized assets: The Company holds a majority interest in a closed-end Polish investment fund. The investment, which provides a preferred return based on the expected net income of the portfolios, is accounted for as a beneficial interest in securitized financial assets and stated at amortized cost. The Company has determined it has the ability and intent to hold these certificates until maturity, which occurs when the fund terminates or liquidates its assets. The preferred return is not a guaranteed return. Income is recognized under FASB ASC Topic 325-40, "Beneficial Interest in Securitized Financial Assets" ("ASC 325-40"). Prior to April 1, 2017, income was recognized using the effective yield method. The underlying securities have both known principal repayment terms as well as unknown principal repayments due to potential borrower pre-payments. Accordingly, it is difficult to accurately predict the final maturity date of this investment. Revenues recognized on this investment are recorded in the Other Revenue line item in the consolidated income statements. Effective April 1, 2017, the Company determined
10
PRA Group, Inc.
Notes to Consolidated Financial Statements
that it could not reasonably forecast the timing of future cash flows and accordingly began using the cost recovery method to recognize income. During the three months ended March 31, 2018 and 2017, revenues recognized on this investment were $0 and $1.4 million, respectively.
The unrealized loss on this investment was caused by a change in the timing of the estimated cash flows. Total expected cash flows on this investment exceed the carrying amount. Therefore, the Company does not consider this investment to be other-than-temporarily impaired at March 31, 2018.
The amortized cost and estimated fair value of investments in debt securities at March 31, 2018 and December 31, 2017 were as follows (amounts in thousands):
March 31, 2018 | |||||||||||||||
Amortized Cost | Gross Unrealized Gains | Gross Unrealized Losses | Aggregate Fair Value | ||||||||||||
Available-for-sale | |||||||||||||||
Government bonds | $ | 5,624 | $ | — | $ | 160 | $ | 5,464 | |||||||
Held-to-maturity | |||||||||||||||
Securitized assets | 58,181 | — | 13,004 | 45,177 | |||||||||||
December 31, 2017 | |||||||||||||||
Amortized Cost | Gross Unrealized Gains | Gross Unrealized Losses | Aggregate Fair Value | ||||||||||||
Available-for-sale | |||||||||||||||
Government bonds | $ | 5,452 | $ | — | $ | 23 | $ | 5,429 | |||||||
Held-to-maturity | |||||||||||||||
Securitized assets | 57,204 | — | 14,249 | 42,955 | |||||||||||
Equity Securities
Investments in private equity funds: Investments in private equity funds represent limited partnerships in which the Company has less than a 3% interest. In the first quarter of 2018, the Company adopted ASU 2016-01, which requires that investments in equity securities be measured at fair value with changes in unrealized gains and losses reported in earnings. Upon adoption of ASU 2016-01, the investments are carried at the fair value reported by the Fund manager. The Company recorded a cumulative effect adjustment of $3.9 million, net of tax, to beginning retained earnings for the unrealized loss on the investment. Prior to 2018, the investments were carried at cost with income recognized in Other Revenue in the consolidated income statements when distributions, up to reported income, were received from the partnerships. The aggregate carrying amount of cost-method investments for which cost exceeded fair value but for which an impairment loss was not recognized was $14.2 million at December 31, 2017.
Mutual funds: The Company invests certain excess funds held in Brazil in a U.S. dollar denominated mutual fund that invests in foreign currency contracts that hedge the risk in variation of the Brazilian real to the U.S. dollar. The investments are carried at fair value based on quoted market prices.
Unrealized gains and losses: The Company recognized an unrealized gain of $0.4 million for the period ended March 31, 2018 on its equity securities. No securities were sold during the period.
4. Goodwill and Intangible Assets, net:
In connection with the Company's business acquisitions, the Company acquired certain tangible and intangible assets. Intangible assets resulting from these acquisitions include client and customer relationships, non-compete agreements, trademarks and technology. The Company performs an annual review of goodwill as of October 1 of each year or more frequently if indicators of impairment exist.
11
PRA Group, Inc.
Notes to Consolidated Financial Statements
The following table represents the changes in goodwill for the three months ended March 31, 2018 and 2017 (amounts in thousands):
Three Months Ended March 31, | |||||||
2018 | 2017 | ||||||
Balance at beginning of period: | |||||||
Goodwill | $ | 526,513 | $ | 506,308 | |||
Accumulated impairment loss | — | (6,397 | ) | ||||
526,513 | 499,911 | ||||||
Changes: | |||||||
Foreign currency translation adjustment | 17,780 | 6,329 | |||||
Net change in goodwill | 17,780 | 6,329 | |||||
Goodwill | 544,293 | 512,637 | |||||
Accumulated impairment loss | — | (6,397 | ) | ||||
Balance at end of period: | $ | 544,293 | $ | 506,240 | |||
The change in the accumulated impairment loss at March 31, 2018 as compared to March 31 2017 was related to the June 2017 sale of PRA Location Services, LLC.
5. Borrowings:
The Company's borrowings consisted of the following as of the dates indicated (amounts in thousands):
March 31, 2018 | December 31, 2017 | ||||||
Revolving credit | $ | 820,022 | $ | 849,815 | |||
Term loans | 771,463 | 764,830 | |||||
Convertible senior notes | 632,500 | 632,500 | |||||
2,223,985 | 2,247,145 | ||||||
Less: Debt discount and issuance costs | (73,112 | ) | (76,963 | ) | |||
Total | $ | 2,150,873 | $ | 2,170,182 | |||
The following principal payments are due on the Company's borrowings as of March 31, 2018 for the 12 month periods ending March 31, (amounts in thousands):
2019 | $ | 10,000 | |
2020 | 10,000 | ||
2021 | 1,087,986 | ||
2022 | 10,000 | ||
2023 | 760,999 | ||
Thereafter | 345,000 | ||
Total | $ | 2,223,985 | |
The Company believes it was in compliance with the covenants of its financing arrangements as of March 31, 2018.
North American Revolving Credit and Term Loan
On May 5, 2017, the Company amended and restated its existing credit agreement (as amended, and modified from time to time, the “North American Credit Agreement”) with Bank of America, N.A., as administrative agent, Bank of America, National Association, acting through its Canada branch, as the Canadian administrative agent, and a syndicate of lenders named therein. The total credit facility under the North American Credit Agreement includes an aggregate principal amount of $1.2 billion (subject to compliance with a borrowing base and applicable debt covenants), which consists of (i) a fully-funded $442.5 million term loan, (ii) a $705.0 million domestic revolving credit facility, and (iii) a $50.0 million Canadian revolving credit facility. The facility includes an accordion feature for up to $45.0 million in additional commitments (at the option of the lenders) and also provides
12
PRA Group, Inc.
Notes to Consolidated Financial Statements
for up to $25.0 million of letters of credit and a $25.0 million swingline loan sublimit that would reduce amounts available for borrowing. The term and revolving loans accrue interest, at the option of the Company, at either the base rate or the Eurodollar rate (as defined in the North American Credit Agreement) for the applicable term plus 2.50% per annum in the case of the Eurodollar rate loans and 1.50% in the case of the base rate loans. The base rate is the highest of (a) the Federal Funds Rate (as defined in the North American Credit Agreement) plus 0.50%, (b) Bank of America's prime rate, or (c) the one month Eurodollar rate plus 1.00%. Canadian Prime Rate Loans will bear interest at a rate per annum equal to the Canadian Prime Rate plus 1.50%. The revolving credit facilities also bear an unused line fee of 0.375% per annum, payable quarterly in arrears. The loans under the North American Credit Agreement mature May 5, 2022. As of March 31, 2018, the unused portion of the North American Credit Agreement was $396.5 million. Considering borrowing base restrictions, as of March 31, 2018, the amount available to be drawn was $365.4 million.
The North American Credit Agreement is secured by a first priority lien on substantially all of the Company's assets. The North American Credit Agreement contains restrictive covenants and events of default, which are defined in the North American Credit Agreement, including the following:
• | borrowings under each of the domestic revolving loan facility and the Canadian revolving loan facility are subject to separate borrowing base calculations and may not exceed 35% of the ERC of all domestic or Canadian, as applicable, core eligible asset pools, plus 55% of ERC of domestic or Canadian, as applicable, insolvency eligible asset pools, plus 75% of domestic or Canadian, as applicable, eligible accounts receivable; |
• | the consolidated total leverage ratio cannot exceed 2.75 to 1.0 as of the end of any fiscal quarter; |
• | the consolidated senior secured leverage ratio cannot exceed 2.25 to 1.0 as of the end of any fiscal quarter; |
• | subject to no default or event of default, cash dividends and distributions during any fiscal year cannot exceed $20.0 million; |
• | subject to no default or event of default, stock repurchases during any fiscal year cannot exceed $100.0 million plus 50% of the prior year's net income; |
• | permitted acquisitions during any fiscal year cannot exceed $250.0 million (with a $50.0 million per year sublimit for permitted acquisitions by non-loan parties); |
• | indebtedness in the form of senior, unsecured convertible notes or other unsecured financings cannot exceed $750.0 million in the aggregate (without respect to the 2020 Notes (as defined below)); |
• | the Company must maintain positive consolidated income from operations during any fiscal quarter; and |
• | restrictions on changes in control. |
European Revolving Credit Facility and Term Loan
On October 23, 2014, European subsidiaries of the Company ("PRA Europe") entered into a credit agreement with DNB Bank ASA for a Multicurrency Revolving Credit Facility (such agreement as later amended or modified, the "European Credit Agreement"). In the first quarter of 2018, the Company entered into the Fourth Amendment and Restatement Agreement (the "Fourth Amendment") to its European Credit Agreement which, among other things, expanded the scope of loan portfolios that constitute Approved Loan Portfolios (as defined in the Fourth Amendment). Additionally, other changes to the European Credit Agreement resulting from the Fourth Amendment include: reduced all applicable margins for the interest payable under the multicurrency revolving credit facility by 15 basis points; reduced all applicable margins for the interest payable under the term loan facility by 50 basis points, subject to the lenders’ right to increase the applicable margin by up to 50 basis points if one or more of the lenders elects to syndicate and/or transfer its commitment under the term loan in accordance with the terms of the Fourth Amendment; reduced the maximum permitted amount of interest bearing deposits in AK Nordic AB from SEK 1.5 billion to SEK 1.2 billion; and revised the definitions of ERC and LTV Ratio. Under the terms of the European Credit Agreement, the credit facility includes an aggregate amount of approximately $1.2 billion (subject to the borrowing base), of which 267.0 million EUR (approximately $329.0 million) is a term loan, accrues interest at the Interbank Offered Rate ("IBOR") plus 2.65% - 3.75% under the revolving facility and 3.75% - 4.00% under the term loan facility (as determined by the loan-to-value ratio ("LTV Ratio") as defined in the European Credit Agreement), bears an unused line fee, currently 1.21% per annum, of 35% of the margin, is payable monthly in arrears, and matures February 19, 2021. The European Credit Agreement also includes an overdraft facility in the aggregate amount of $40.0 million (subject to the borrowing base), which accrues interest (per currency) at the daily rates as published by the facility agent, bears a facility line fee of 0.125% per quarter, payable quarterly in arrears, and also matures February 19, 2021. As of March 31, 2018, the unused portion of the European Credit Agreement (including the overdraft facility) was $478.5 million. Considering borrowing base restrictions and other covenants, as of March 31, 2018, the amount available to be drawn under the European Credit Agreement (including the overdraft facility) was $184.6 million.
13
PRA Group, Inc.
Notes to Consolidated Financial Statements
The European Credit Agreement is secured by the shares of most of the Company's European subsidiaries and all intercompany loan receivables in Europe. The European Credit Agreement also contains restrictive covenants and events of default, which are defined in the European Credit Agreement, including the following:
• | the LTV Ratio cannot exceed 75%; |
• | the gross interest-bearing debt ratio in Europe cannot exceed 3.25 to 1.0 as of the end of any fiscal quarter; |
• | interest bearing deposits in AK Nordic AB cannot exceed SEK 1.2 billion; and |
• | PRA Europe's cash collections must exceed 95% of PRA Europe's IFRS ERC for the same set of portfolios, measured on a quarterly basis. |
Convertible Senior Notes due 2020
On August 13, 2013, the Company completed the private offering of $287.5 million in aggregate principal amount of its 3.00% Convertible Senior Notes due 2020 (the "2020 Notes"). The 2020 Notes were issued pursuant to an Indenture, dated August 13, 2013 (the "2013 Indenture"), between the Company and Regions Bank, as successor trustee. The 2013 Indenture contains customary terms and covenants, including certain events of default after which the 2020 Notes may be due and payable immediately. The 2020 Notes are senior unsecured obligations of the Company. Interest on the 2020 Notes is payable semi-annually, in arrears, on February 1 and August 1 of each year, beginning on February 1, 2014. Prior to February 1, 2020, the 2020 Notes will be convertible only upon the occurrence of specified events. On or after February 1, 2020, the 2020 Notes will be convertible at any time. The Company does not have the right to redeem the 2020 Notes prior to maturity. As of March 31, 2018, the Company does not believe that any of the conditions allowing holders of the 2020 Notes to convert their notes have occurred.
The conversion rate for the 2020 Notes is initially 15.2172 shares per $1,000 principal amount of 2020 Notes, which is equivalent to an initial conversion price of approximately $65.72 per share of the Company's common stock, and is subject to adjustment in certain circumstances pursuant to the 2013 Indenture. Upon conversion, holders of the 2020 Notes will receive cash, shares of the Company's common stock or a combination of cash and shares of the Company's common stock, at the Company's election. The Company's current intent is to settle conversions through combination settlement (i.e., the 2020 Notes would be converted into cash up to the aggregate principal amount, and shares of the Company's common stock or a combination of cash and shares of the Company's common stock, at the Company's election, for the remainder). As a result and in accordance with authoritative guidance related to derivatives and hedging and earnings per share, only the conversion spread is included in the diluted earnings per share calculation, if dilutive. Under such method, the settlement of the conversion spread has a dilutive effect when the average share price of the Company's common stock during any quarter exceeds $65.72.
The Company determined that the fair value of the 2020 Notes at the date of issuance was approximately $255.3 million, and designated the residual value of approximately $32.2 million as the equity component. Additionally, the Company allocated approximately $7.3 million of the $8.2 million 2020 Notes issuance cost as debt issuance cost and the remaining $0.9 million as equity issuance cost.
Convertible Senior Notes due 2023
On May 26, 2017, the Company completed the private offering of $345.0 million in aggregate principal amount of its 3.50% Convertible Senior Notes due 2023 (the "2023 Notes" and, together with the 2020 Notes, the "Notes"). The 2023 Notes were issued pursuant to an Indenture, dated May 26, 2017 (the "2017 Indenture"), between the Company and Regions Bank, as trustee. The 2017 Indenture contains customary terms and covenants, including certain events of default after which the 2023 Notes may be due and payable immediately. The 2023 Notes are senior unsecured obligations of the Company. Interest on the 2023 Notes is payable semi-annually, in arrears, on June 1 and December 1 of each year, beginning on December 1, 2017. Prior to March 1, 2023, the 2023 Notes will be convertible only upon the occurrence of specified events. On or after March 1, 2023, the 2023 Notes will be convertible at any time. The Company has the right, at its election, to redeem all or any part of the outstanding 2023 Notes at any time on or after June 1, 2021 for cash, but only if the last reported sale price (as defined in the 2017 Indenture) exceeds 130% of the conversion price on each of at least 20 trading days during the 30 consecutive trading days ending on and including the trading day immediately before the date the Company sends the related redemption notice. As of March 31, 2018, the Company does not believe that any of the conditions allowing holders of the 2023 Notes to convert their notes have occurred.
The conversion rate for the 2023 Notes is initially 21.6275 shares per $1,000 principal amount of 2023 Notes, which is equivalent to an initial conversion price of approximately $46.24 per share of the Company's common stock, and is subject to adjustment in certain circumstances pursuant to the 2017 Indenture. Upon conversion, holders of the 2023 Notes will receive cash, shares of the Company's common stock or a combination of cash and shares of the Company's common stock, at the Company's election. The Company's current intent is to settle conversions through combination settlement (i.e., the 2023 Notes would be converted into cash up to the aggregate principal amount, and shares of the Company's common stock or a combination of cash and shares of the Company's common stock, at the Company's election, for the remainder). As a result and in accordance with
14
PRA Group, Inc.
Notes to Consolidated Financial Statements
authoritative guidance related to derivatives and hedging and earnings per share, only the conversion spread is included in the diluted earnings per share calculation, if dilutive. Under such method, the settlement of the conversion spread has a dilutive effect when the average share price of the Company's common stock during any quarter exceeds $46.24.
The Company determined that the fair value of the 2023 Notes at the date of issuance was approximately $298.8 million, and designated the residual value of approximately $46.2 million as the equity component. Additionally, the Company allocated approximately $8.3 million of the $9.6 million 2023 Notes issuance cost as debt issuance cost and the remaining $1.3 million as equity issuance cost.
The balances of the liability and equity components of the Notes outstanding were as follows as of the dates indicated (amounts in thousands):
March 31, 2018 | December 31, 2017 | ||||||
Liability component - principal amount | $ | 632,500 | $ | 632,500 | |||
Unamortized debt discount | (52,660 | ) | (55,537 | ) | |||
Liability component - net carrying amount | $ | 579,840 | $ | 576,963 | |||
Equity component | $ | 76,216 | $ | 76,216 | |||
The debt discount is being amortized into interest expense over the remaining life of the 2020 Notes and the 2023 Notes using the effective interest rate, which is 4.92% and 6.20%, respectively.
Interest expense related to the Notes was as follows for the periods indicated (amounts in thousands):
Three Months Ended March 31, | |||||||
2018 | 2017 | ||||||
Interest expense - stated coupon rate | $ | 5,175 | $ | 2,156 | |||
Interest expense - amortization of debt discount | 2,877 | 1,155 | |||||
Total interest expense - convertible senior notes | $ | 8,052 | $ | 3,311 | |||
6. Fair Value:
As defined by ASC Topic 820, "Fair Value Measurements and Disclosures" ("ASC 820"), fair value is the price that would be received to sell an asset or paid to transfer a liability in an orderly transaction between market participants at the measurement date. ASC 820 also requires the consideration of differing levels of inputs in the determination of fair values.
Those levels of input are summarized as follows:
• | Level 1: Quoted prices in active markets for identical assets and liabilities. |
• | Level 2: Observable inputs other than Level 1 quoted prices, such as quoted prices for similar instruments in active markets, quoted prices for identical or similar instruments in markets that are not active, and model-based valuation techniques for which all significant assumptions are observable in the market. |
• | Level 3: Unobservable inputs that are supported by little or no market activity. Level 3 assets and liabilities include financial instruments whose value is determined using pricing models, discounted cash flow methodologies, or similar techniques as well as instruments for which the determination of fair value requires significant management judgment or estimation. |
The level in the fair value hierarchy within which a fair value measurement in its entirety falls is based on the lowest level input that is significant to the fair value measurement in its entirety.
Financial Instruments Not Required To Be Carried at Fair Value
In accordance with the disclosure requirements of ASC Topic 825, "Financial Instruments" ("ASC 825"), the table below summarizes fair value estimates for the Company's financial instruments that are not required to be carried at fair value. The total of the fair value calculations presented does not represent, and should not be construed to represent, the underlying value of the Company.
15
PRA Group, Inc.
Notes to Consolidated Financial Statements
The carrying amounts of the financial instruments in the following table are recorded in the consolidated balance sheets at March 31, 2018 and December 31, 2017 (amounts in thousands):
March 31, 2018 | December 31, 2017 | ||||||||||||||
Carrying Amount | Estimated Fair Value | Carrying Amount | Estimated Fair Value | ||||||||||||
Financial assets: | |||||||||||||||
Cash and cash equivalents | $ | 101,418 | $ | 101,418 | $ | 120,516 | $ | 120,516 | |||||||
Held-to-maturity investments | 58,181 | 45,177 | 57,204 | 42,955 | |||||||||||
Finance receivables, net | 2,767,131 | 3,082,652 | 2,771,921 | 3,060,907 | |||||||||||
Financial liabilities: | |||||||||||||||
Interest-bearing deposits | 90,769 | 90,769 | 98,580 | 98,580 | |||||||||||
Revolving lines of credit | 820,022 | 820,022 | 849,815 | 849,815 | |||||||||||
Term loans | 771,463 | 771,463 | 764,830 | 764,830 | |||||||||||
Convertible senior notes | 579,840 | 649,790 | 576,963 | 620,079 | |||||||||||
Disclosure of the estimated fair values of financial instruments often requires the use of estimates. The carrying amount and estimates of the fair value of the Company's debt obligations outlined above do not include any related debt issuance costs associated with the debt obligations. The Company uses the following methods and assumptions to estimate the fair value of financial instruments:
Cash and cash equivalents: The carrying amount approximates fair value and quoted prices for identical assets can be found in active markets. Accordingly, the Company estimates the fair value of cash and cash equivalents using Level 1 inputs.
Held-to-maturity investments: Fair value of the Company's investment in the certificates of a closed-end Polish investment fund is estimated using proprietary pricing models that the Company utilizes to make portfolio purchase decisions. Accordingly, the Company estimates the fair value of its held-to-maturity investments using Level 3 inputs as there is little observable market data available and management is required to use significant judgment in its estimates.
Finance receivables, net: The Company computed the estimated fair value of these receivables using proprietary pricing models that the Company utilizes to make portfolio purchase decisions. Accordingly, the Company's fair value estimates use Level 3 inputs as there is limited observable market data available and management is required to use significant judgment in its estimates.
Interest-bearing deposits: The carrying amount approximates fair value due to the short-term nature of the deposits and the observable quoted prices for similar instruments in active markets. Accordingly, the Company uses Level 2 inputs for its fair value estimates.
Revolving lines of credit: The carrying amount approximates fair value due to the short-term nature of the interest rate periods and the observable quoted prices for similar instruments in active markets. Accordingly, the Company uses Level 2 inputs for its fair value estimates.
Term loans: The carrying amount approximates fair value due to the short-term nature of the interest rate periods and the observable quoted prices for similar instruments in active markets. Accordingly, the Company uses Level 2 inputs for its fair value estimates.
Convertible senior notes: The fair value estimates for the Notes incorporate quoted market prices which were obtained from secondary market broker quotes which were derived from a variety of inputs including client orders, information from their pricing vendors, modeling software, and actual trading prices when they occur. Accordingly, the Company uses Level 2 inputs for its fair value estimates. Furthermore, in the table above, carrying amount represents the portion of the Notes classified as debt, while estimated fair value pertains to the face amount of the Notes.
16
PRA Group, Inc.
Notes to Consolidated Financial Statements
Financial Instruments Required To Be Carried At Fair Value
The carrying amounts in the following table are measured at fair value on a recurring basis in the accompanying consolidated balance sheets at March 31, 2018 and December 31, 2017 (amounts in thousands):
Fair Value Measurements as of March 31, 2018 | |||||||||||||||
Level 1 | Level 2 | Level 3 | Total | ||||||||||||
Assets: | |||||||||||||||
Available-for-sale investments | |||||||||||||||
Government bonds | $ | 5,464 | $ | — | $ | — | $ | 5,464 | |||||||
Fair value through net income | |||||||||||||||
Mutual funds | 15,295 | — | — | 15,295 | |||||||||||
Interest rate swap contracts (recorded in other assets) | — | 2,550 | — | 2,550 | |||||||||||
Fair Value Measurements as of December 31, 2017 | |||||||||||||||
Level 1 | Level 2 | Level 3 | Total | ||||||||||||
Assets: | |||||||||||||||
Available-for-sale investments | |||||||||||||||
Government bonds | $ | 5,429 | $ | — | $ | — | $ | 5,429 | |||||||
Liabilities: | |||||||||||||||
Interest rate swap contracts (recorded in accrued expenses) | — | 1,108 | — | 1,108 | |||||||||||
Available-for-sale
Government bonds: Fair value of the Company's investment in government bonds is estimated using quoted market prices. Accordingly, the Company uses Level 1 inputs.
Fair value through net income
Mutual funds: Fair value of the Company's investment in mutual funds is estimated using quoted market prices. Accordingly, the Company uses Level 1 inputs.
Interest rate swap contracts: The estimated fair value of the interest rate swap contracts is determined by using industry standard valuation models. These models project future cash flows and discount the future amounts to a present value using market-based observable inputs, including interest rate curves and other factors. Accordingly, the Company uses Level 2 inputs for its fair value estimates.
Investments measured using net asset value
Private equity funds: This class of investments consists of private equity funds that invest primarily in loans and securities including single-family residential debt; corporate debt products; and financially-oriented, real-estate-rich and other operating companies in the Americas, Western Europe, and Japan. These investments are subject to certain restrictions regarding transfers and withdrawals. The investments cannot be redeemed with the funds. Instead, the nature of the investments in this class is that distributions are received through the liquidation of the underlying assets of the fund. The investments are expected to be returned through distributions as a result of liquidations of the funds' underlying assets over 1 to 6 years. The fair value of these private equity funds following the Net Asset Value ("NAV") practical expedient was $8.8 million as of March 31, 2018 and December 31, 2017.
7. Earnings per Share:
Basic earnings per share ("EPS") are computed by dividing net income available to common stockholders of PRA Group, Inc. by weighted average common shares outstanding. Diluted EPS are computed using the same components as basic EPS with the denominator adjusted for the dilutive effect of the Notes and nonvested share awards, if dilutive. For the Notes, only the conversion spread is included in the diluted EPS calculation, if dilutive. Under such method, the settlement of the conversion spread has a dilutive effect when the average share price of the Company's common stock during any quarter exceeds $65.72 for the 2020 Notes or $46.24 for the 2023 Notes, neither of which occurred during the respective periods from which the Notes were
17
PRA Group, Inc.
Notes to Consolidated Financial Statements
issued through March 31, 2018. Share-based awards that are contingent upon the attainment of performance goals are included in the computation of diluted EPS if the effect is dilutive. The dilutive effect of nonvested shares is computed using the treasury stock method, which assumes any proceeds that could be obtained upon the vesting of nonvested shares would be used to purchase common shares at the average market price for the period.
The following table provides a reconciliation between the computation of basic EPS and diluted EPS for the three months ended March 31, 2018 and 2017 (amounts in thousands, except per share amounts):
For the Three Months Ended March 31, | |||||||||||||||||||||
2018 | 2017 | ||||||||||||||||||||
Net income attributable to PRA Group, Inc. | Weighted Average Common Shares | EPS | Net income attributable to PRA Group, Inc. | Weighted Average Common Shares | EPS | ||||||||||||||||
Basic EPS | $ | 21,106 | 45,231 | $ | 0.47 | $ | 48,167 | 46,406 | $ | 1.04 | |||||||||||
Dilutive effect of nonvested share awards | 139 | — | 221 | (0.01 | ) | ||||||||||||||||
Diluted EPS | $ | 21,106 | 45,370 | $ | 0.47 | $ | 48,167 | 46,627 | $ | 1.03 | |||||||||||
There were no antidilutive options outstanding for the three months ended March 31, 2018 and 2017.
8. Income Taxes:
The Company follows the guidance of FASB ASC Topic 740 "Income Taxes" ("ASC 740") as it relates to the provision for income taxes and uncertainty in income taxes. The guidance prescribes a recognition threshold and measurement attribute for the financial statement recognition and measurement of a tax position taken or expected to be taken in a tax return.
On May 10, 2017, the Company reached a settlement with the Internal Revenue Service ("IRS") in regards to the assertion that tax revenue recognition using the cost recovery method did not clearly reflect taxable income. Under the settlement, the Company will utilize a new tax accounting method to recognize net finance receivables revenue effective with tax year 2017. Under the new method, a portion of the annual collections amortizes principal and the remaining portion is taxable income. The deferred tax liability related to the difference in timing between the new method and the cost recovery method will be incorporated evenly into the Company’s tax filings over four years effective with tax year 2017.
On December 22, 2017, the United States government enacted comprehensive tax legislation commonly referred to as the Tax Cuts and Jobs Act (the “Tax Act”). The Tax Act makes broad and complex changes to the U.S. tax code, including, but not limited to the following provisions which are the most relevant to the Company: (1) reducing the U.S. federal corporate tax rate from 35% to 21%; (2) requiring companies to pay a one-time transition tax on certain unrepatriated earnings of foreign subsidiaries; (3) generally eliminating U.S. federal income taxes on dividends from foreign subsidiaries; (4) requiring a current inclusion in U.S. federal taxable income of certain earnings of controlled foreign corporations referred to as Global Intangible Low-Taxed Income (“GILTI”); (5) creating the base erosion anti-abuse tax, a new minimum tax; (6) creating a new limitation on deductible interest expense; and (7) increasing limitations on the deductibility of executive compensation.
The Company had not completed its accounting for the income tax effects of the Tax Act for the tax year ended December 31, 2017, since formal application guidance has not yet been finalized or issued to date. Where the Company has been able to make reasonable estimates of the effects for which its analysis is not yet complete, the Company has recorded provisional amounts in accordance with SEC Staff Accounting Bulletin No. 118. Where the Company has not yet been able to make reasonable estimates of the impact of certain elements, the Company has not recorded any amounts related to those elements and has continued accounting for them in accordance with ASC 740 on the basis of the tax laws in effect immediately prior to the enactment of the Tax Act.
The Company was able to make reasonable estimates of certain effects and, therefore recorded provisional amounts in 2017 as follows:
• | Revaluation of deferred tax assets and liabilities: The Tax Act reduces the U.S. federal corporate tax rate from 35% to 21% for tax years beginning after December 31, 2017. The Company has evaluated the financial impact and recorded a provisional deferred tax benefit of $73.8 million during the year ended December 31, 2017. The Company is still completing its calculation of the impact in its deferred tax balances. |
• | Transition Tax on unrepatriated foreign earnings: The Transition Tax on unrepatriated foreign earnings is a tax on previously untaxed accumulated and current earnings and profits (“E&P”) of the Company’s foreign subsidiaries. The |
18
PRA Group, Inc.
Notes to Consolidated Financial Statements
Company was able to make a reasonable estimate of the Transition Tax and has provisionally recorded no Transition Tax expense.
• | GILTI: The Tax Act creates a new requirement that certain income (i.e., GILTI) earned by foreign subsidiaries must be included currently in the gross income of the U.S. shareholder. Due to the complexity of the new GILTI tax rules, the Company is continuing to evaluate the provision of the Tax Act and the application of ASC 740. The Company’s accounting for this element of the Tax Act is subject to change since formal application guidance has not yet been finalized or issued to date. As a result, the Company has not recorded any amounts related to potential GILTI tax in its financial statements and has not yet made a policy decision regarding whether to record deferred taxes on GILTI. |
• | The Company has evaluated the impact of the other most relevant Tax Act provisions and determined the impact to be insignificant. |
At March 31, 2018, the tax years subject to examination by the major federal, state and international taxing jurisdictions are 2013 and subsequent years.
The Company intends for predominantly all foreign earnings to be indefinitely reinvested in its foreign operations. If foreign earnings were repatriated, the Company may need to accrue and pay taxes, although foreign tax credits may be available to partially reduce U.S. income taxes. The amount of cash on hand related to foreign operations with indefinitely reinvested earnings was $80.7 million and $106.0 million as of March 31, 2018 and December 31, 2017, respectively.
9. Commitments and Contingencies:
Employment Agreements:
The Company has entered into employment agreements with all of its U.S. executive officers and with several members of its U.S. senior management group. Such agreements provide for base salary payments as well as potential discretionary bonuses that are based on the attainment of a combination of financial and management goals. At March 31, 2018, estimated future compensation under these agreements was approximately $21.8 million. The agreements also contain confidentiality and non-compete provisions. Outside the U.S., employment agreements are in place with employees pursuant to local country regulations. Generally, these agreements do not have expiration dates and therefore it is impractical to estimate the amount of future compensation under these agreements. Accordingly, the future compensation under these agreements is not included in the $21.8 million total above.
Leases:
The Company is party to various operating leases with respect to its facilities and equipment. Future minimum lease payments at March 31, 2018 totaled approximately $49.2 million.
Forward Flow Agreements:
The Company is party to several forward flow agreements that allow for the purchase of nonperforming loans at pre-established prices. The maximum remaining amount to be purchased under forward flow agreements at March 31, 2018 was approximately $351.3 million.
Finance Receivables:
Certain agreements for the purchase of finance receivables portfolios contain provisions that may, in limited circumstances, require the Company to refund a portion or all of the collections subsequently received by the Company on particular accounts. The potential refunds as of the balance sheet date are not considered to be significant.
Litigation and Regulatory Matters:
The Company is from time to time subject to routine legal claims, proceedings and regulatory matters, most of which are incidental to the ordinary course of its business. The Company initiates lawsuits against customers and is occasionally countersued by them in such actions. Also, customers, either individually, as members of a class action, or through a governmental entity on behalf of customers, may initiate litigation against the Company in which they allege that the Company has violated a state or federal law in the process of collecting on an account. From time to time, other types of lawsuits are brought against the Company. Additionally, the Company receives subpoenas and other requests or demands for information from regulators or governmental authorities who are investigating the Company's debt collection activities.
19
PRA Group, Inc.
Notes to Consolidated Financial Statements
The Company accrues for potential liability arising from legal proceedings and regulatory matters when it is probable that such liability has been incurred and the amount of the loss can be reasonably estimated. This determination is based upon currently available information for those proceedings in which the Company is involved, taking into account the Company's best estimate of such losses for those cases for which such estimates can be made. The Company's estimate involves significant judgment, given the varying stages of the proceedings (including the fact that many of them are currently in preliminary stages), the number of unresolved issues in many of the proceedings (including issues regarding class certification and the scope of many of the claims), and the related uncertainty of the potential outcomes of these proceedings. In making determinations of the likely outcome of pending litigation, the Company considers many factors, including, but not limited to, the nature of the claims, the Company's experience with similar types of claims, the jurisdiction in which the matter is filed, input from outside legal counsel, the likelihood of resolving the matter through alternative mechanisms, the matter's current status and the damages sought or demands made. Accordingly, the Company's estimate will change from time to time, and actual losses could be more than the current estimate.
The Company believes that the estimate of the aggregate range of reasonably possible losses in excess of the amount accrued for its legal proceedings outstanding at March 31, 2018, where the range of loss can be estimated, was not material.
In certain legal proceedings, the Company may have recourse to insurance or third-party contractual indemnities to cover all or portions of its litigation expenses, judgments, or settlements. Loss estimates and accruals for potential liability related to legal proceedings are typically exclusive of potential recoveries, if any, under the Company's insurance policies or third-party indemnities. During the year ended December 31, 2017, the Company recorded $4.0 million in potential recoveries under the Company's insurance policies or third-party indemnities which is included in other receivables, net at March 31, 2018 and December 31, 2017.
The matters described below fall outside of the normal parameters of the Company's routine legal proceedings.
Multi-State Investigation
The Company previously received Civil Investigative Demands from multiple state Attorneys General offices broadly relating to its debt collection practices in the U.S. The Company, which has fully cooperated with the investigation, has discussed potential resolution of the investigation with this coalition of Attorneys General, which could include penalties, restitution and/or the adoption of new practices and controls in the conduct of the Company's business. In these discussions, the state Attorneys General offices have taken positions with which the Company disagrees. If the Company is unable to resolve its differences with this multi-state coalition, it is possible that individual state Attorneys General offices may file claims against the Company. The range of loss, if any, cannot be estimated at this time.
Iris Pounds v. Portfolio Recovery Associates, LLC
On November 21, 2016, Iris Pounds filed suit against the Company in Durham County, North Carolina alleging violations of the North Carolina Prohibited Practices by Collection Agencies Act. The purported class consists of all individuals against whom the Company had obtained a judgment by default in North Carolina on or after October 1, 2009. The Company removed the matter to the United States District Court for the Middle District of North Carolina (the "District Court"), and has filed a motion to dismiss. The District Court has entered an order remanding the matter to the North Carolina state court, which order the Company has appealed to the Fourth Circuit Court of Appeals. The range of loss, if any, cannot be estimated at this time due to the uncertainty surrounding liability, class certification and the interpretation of statutory damages.
10. Sale of Subsidiaries:
As part of the Company’s strategy to focus on its primary business, the purchase, collection and management of portfolios of nonperforming loans, the Company sold its government services businesses: PRA Government Services, LLC; MuniServices, LLC; and PRA Professional Services, LLC on January 24, 2017, for $91.5 million in cash plus additional consideration for certain balance sheet items. The pre-tax gain on sale was $46.8 million, and was recorded in the first quarter of 2017.
11. Recent Accounting Pronouncements:
In May 2014, FASB issued Accounting Standards Update ("ASU") 2014-09, "Revenue from Contracts with Customers" ("ASU 2014-09") that updates the principles for recognizing revenue. The core principle of the guidance is that an entity should recognize revenue to depict the transfer of promised goods or services to customers in an amount that reflects the consideration to which the entity expects to be entitled in exchange for those goods or services. The guidance specifically excludes revenue received for servicing finance receivables. ASU 2014-09 also amends the required disclosures of the nature, amount, timing and uncertainty of revenue and cash flows arising from contracts with customers. ASU 2014-09 is effective for fiscal years, and interim periods within those years, beginning after December 15, 2017, and can be adopted either retrospectively to each prior
20
PRA Group, Inc.
Notes to Consolidated Financial Statements
reporting period presented or as a cumulative-effect adjustment as of the date of adoption, with early application not permitted. The Company determined that the revenue generated by its subsidiary Claims Compensation Bureau, LLC ("CCB") is within the scope of this standard. The Company adopted ASU 2014-09 in the first quarter of 2018 which had no material impact on its consolidated financial statements.
In January 2016, FASB issued ASU 2016-01, as amended by ASU 2018-03, "Financial Instruments-Overall: Technical Corrections and Improvements", issued in February 2018, which revises the classification and measurement of investments in equity securities. ASU 2016-01 requires that equity investments, except those accounted for under the equity method of accounting, be measured at fair value and changes in fair value are recognized in net income. However, for equity investments that do not have readily determinable fair values and don’t qualify for the existing practical expedient to estimate fair value using the NAV per share (or its equivalent) of the investment, the guidance provides a new measurement alternative. Entities may choose to measure those investments at cost, less any impairment, plus or minus changes resulting from observable price changes in orderly transactions for the identical or a similar investment of the same issuer. The Company adopted ASU 2016-01 in the first quarter of 2018, which resulted in a cumulative effect adjustment of $3.9 million, net of tax, to retained earnings for the unrealized loss on its equity investments.
In February 2016, FASB issued ASU 2016-02, "Leases (Topic 842) Section A - Leases: Amendments to the FASB Account Standards Codification" ("ASU 2016-02"). ASU 2016-02 requires that a lessee should recognize a liability to make lease payments and a right-of-use asset representing its right to use the underlying asset for the lease term on the balance sheet. It is effective for fiscal years beginning after December 15, 2018, and interim periods within those fiscal years, using a modified retrospective approach and early adoption is permitted. The Company is currently in the process of evaluating the impact of adoption of ASU 2016-02 on its consolidated financial statements. The Company has approximately $49.2 million in operating lease obligations as disclosed in its contractual obligations table in Part I, Item 2 of this Quarterly Report on Form 10-Q and is in the process of evaluating those contracts as well as other existing arrangements to determine if they qualify for lease accounting under the new standard. The Company does not plan to adopt the standard early.
In June 2016, FASB issued ASU 2016-13, "Financial Instruments - Credit Losses (Topic 326)" ("ASU 2016-13"). ASU 2016-13 requires the measurement of expected credit losses for financial instruments held at the reporting date based on historical experience, current conditions and reasonable forecasts. The main objective of ASU 2016-13 is to provide financial statement users with more decision-useful information about the expected credit losses on financial instruments and other commitments to extend credit held by a reporting entity at each reporting date. ASU 2016-13 is effective for fiscal years beginning after December 15, 2019, including interim periods within those fiscal years and allows for early adoption as of the beginning of an interim or annual reporting period beginning after December 15, 2018. ASU 2016-13 supersedes ASC Topic 310-30, which the Company currently follows to account for revenue on its finance receivables. ASU 2016-13 could have a significant impact on how the Company measures and records net revenue on its finance receivables. The Company is currently in the process of evaluating the impact of adoption of ASU 2016-13 on its consolidated financial statements.
In August 2016, FASB issued ASU 2016-15, "Statement of Cash Flows - Classification of Certain Cash Receipts and Cash Payments (Topic 230)" ("ASU 2016-15"). ASU 2016-15 reduces diversity in practice of how certain transactions are classified in the statement of cash flows. The new guidance clarifies the classification of cash activity related to debt prepayment or debt extinguishment costs, settlement of zero-coupon debt instruments, contingent consideration payments made after a business combination, proceeds from the settlement of insurance claims, proceeds from the settlement of corporate and bank-owned life insurance policies, distributions received from equity-method investments, and beneficial interests in securitization transactions. The guidance also describes a predominance principle in which cash flows with aspects of more than one class that cannot be separated should be classified based on the activity that is likely to be the predominant source or use of cash flow. ASU 2016-15 is effective for the Company for fiscal years beginning after December 15, 2018. Early adoption is permitted, including adoption in an interim period, but requires all elements of the amendments to be adopted at once rather than individually. The new standard must be adopted using a retrospective transition method. The Company is currently in the process of evaluating the impact of adoption of ASU 2016-15 on its consolidated financial statements.
In October 2016, FASB issued ASU 2016-16, "Income Taxes - Intra-Entity Transfers of Assets Other Than Inventory" ("ASU 2016-16"), which requires entities to recognize the income tax consequences of an intra-entity transfer of an asset other than inventory when the transfer occurs. The standard is effective for fiscal years beginning after December 15, 2017, including interim periods within those fiscal years. The new standard must be adopted using a modified retrospective transition method which is a cumulative-effect adjustment to retained earnings as of the beginning of the first effective reporting period. The Company adopted ASU 2016-16 in the first quarter of 2018 which had no material impact on its consolidated financial statements.
In January 2017, FASB issued ASU-2017-01, "Business Combinations - Clarifying the Definition of a Business (Topic 805)" ("ASU 2017-01"). ASU 2017-01 clarifies the definition of a business with the objective of adding guidance to assist companies
21
PRA Group, Inc.
Notes to Consolidated Financial Statements
with evaluating whether transactions should be accounted for as acquisitions (or disposals) of assets or businesses. The new guidance is expected to reduce the number of transactions that need to be further evaluated as businesses. The guidance applies to transactions that occur on or after an entity’s adoption date, the earliest of which is January 1, 2017.
In January 2017, FASB issued ASU No. 2017-04, "Intangibles - Goodwill and Other (Topic 350): Simplifying the Test for Goodwill Impairment" ("ASU 2017-04"). ASU 2017-04 eliminates Step 2 of the goodwill impairment test. Instead, an entity should perform its annual or interim goodwill impairment test by comparing the fair value of a reporting unit with its carrying amount. An entity should recognize an impairment charge for the amount by which the carrying amount exceeds the reporting unit’s fair value; however, the loss recognized should not exceed the total amount of goodwill allocated to that reporting unit. An entity still has the option to perform the qualitative assessment for a reporting unit to determine if the quantitative impairment test is necessary. ASU 2017-04 is effective for annual and interim periods beginning after December 15, 2019, and early adoption is permitted for interim or annual goodwill impairment tests performed after January 1, 2017. The Company is currently in the process of evaluating the impact of adoption of ASU 2017-04 on its consolidated financial statements.
In May 2017, FASB issued ASU No. 2017-09, “Compensation–Stock Compensation (Topic 718): Scope of Modification Accounting” (ASU 2017-09"). ASU 2017-09 clarifies when a change to the terms or conditions of a share-based payment award must be accounted for as a modification. The new guidance requires modification accounting if the fair value, vesting condition or the classification of the award is not the same immediately before and after a change to the terms and conditions of the award. The new guidance is effective for interim and annual periods beginning after December 15, 2017, with early adoption permitted. The Company adopted ASU 2017-09 in the first quarter of 2018 which had no material impact on its consolidated financial statements.
In August 2017, FASB issued ASU No. 2017-12, "Derivatives and Hedging - Targeted Improvements to Accounting for Hedging Activities" ("ASU 2017-12"). ASU 2017-12 modifies the presentation and disclosure of hedging results. Further, it provides partial relief on the timing of certain aspects of hedge documentation and eliminates the requirement to recognize hedge ineffectiveness separately in income. The amendments in ASU 2017-12 are effective for fiscal years beginning after December 15, 2018 and for interim periods therein. The Company is currently in the process of evaluating the impact of adoption of ASU 2017-12 on its consolidated financial statements.
In February 2018, the FASB issued ASU No. 2018-02, “Reclassification of Certain Tax Effects from Accumulated Other Comprehensive Income” (ASU 2018-02”). Under existing U.S. GAAP, the effects of changes in tax rates and laws on deferred tax balances are recorded as a component of income tax expense in the period in which the law was enacted. When deferred tax balances related to items originally recorded in accumulated other comprehensive income (loss) are adjusted, certain tax effects become stranded in accumulated other comprehensive income. The amendments in ASU 2018-02 allow a reclassification from accumulated other comprehensive income (loss) to retained earnings (accumulated deficit) for stranded income tax effects resulting from the 2017 Tax Cuts and Jobs Act. The amendments in this ASU also require certain disclosures about stranded income tax effects. The guidance is effective for fiscal years beginning after December 15, 2018, and interim periods within those fiscal years. Early adoption in any period is permitted. The Company’s provisional adjustments recorded during the year ended December 31, 2017 to account for the impact of the Tax Act did not result in stranded tax effects. The Company does not anticipate the adoption of this standard will have a material impact on its consolidated financial statements.
The Company does not expect that any other recently issued accounting pronouncements will have a material effect on its consolidated financial statements.
22
Item 2. Management's Discussion and Analysis of Financial Condition and Results of Operations
Forward-Looking Statements:
This Quarterly Report on Form 10-Q (this "Quarterly Report") contains forward-looking statements within the meaning of the federal securities laws. These forward-looking statements involve risks, uncertainties and assumptions that could cause our results to differ materially from those expressed or implied by such forward-looking statements. All statements, other than statements of historical fact, are forward-looking statements, including statements regarding overall cash collection trends, gross margin trends, operating cost trends, liquidity and capital needs and other statements of expectations, beliefs, future plans and strategies, anticipated events or trends, and similar expressions concerning matters that are not historical facts. The risks, uncertainties and assumptions referred to above may include the following:
• | a prolonged economic recovery or a deterioration in the economic or inflationary environment in the Americas or Europe, including the interest rate environment; |
• | changes in the credit or capital markets, which affect our ability to borrow money or raise capital; |
• | our ability to replace our portfolios of nonperforming loans with additional portfolios; |
• | our ability to purchase nonperforming loans at appropriate prices; |
• | changes in, or interpretations of, federal, state, local, or foreign laws or the administrative practices of various bankruptcy courts, which may impact our ability to collect on our nonperforming loans; |
• | our ability to collect sufficient amounts on our nonperforming loans; |
• | the possibility that we could incur significant allowance charges on our finance receivables; |
• | changes in, or interpretations of, bankruptcy or collection laws that could negatively affect our business, including by causing an increase in certain types of bankruptcy filings involving liquidations, which may cause our collections to decrease; |
• | our ability to manage risks associated with our international operations; |
• | changes in tax laws regarding earnings of our subsidiaries located outside of the United States ("U.S."); |
• | the impact of the Tax Cuts and Jobs Act, including interpretations and determinations by tax authorities; |
• | the possibility that we could incur goodwill or other intangible asset impairment charges; |
• | adverse effects from the vote by the United Kingdom ("UK") to leave the European Union ("EU"); |
• | adverse outcomes in pending litigations or administrative proceedings; |
• | our loss contingency accruals may not be adequate to cover actual losses; |
• | the possibility that class action suits and other litigation could divert management's attention and increase our expenses; |
• | the possibility that we could incur business or technology disruptions or cyber incidents; |
• | our ability to collect and enforce our nonperforming loans may be limited under federal, state, local and foreign laws; |
• | our ability to comply with existing and new regulations of the collection industry, the failure of which could result in penalties, fines, litigation, damage to our reputation, or the suspension or termination of or required modification to our ability to conduct our business; |
• | investigations or enforcement actions by governmental authorities, including the Consumer Financial Protection Bureau ("CFPB"), which could result in changes to our business practices; negatively impact our portfolio purchasing volume; make collection of account balances more difficult or expose us to the risk of fines, penalties, restitution payments, and litigation; |
• | the possibility that compliance with foreign and U.S. laws and regulations that apply to our international operations could increase our cost of doing business in international jurisdictions; |
• | our ability to raise the funds necessary to repurchase the convertible senior notes or to settle conversions in cash; |
• | our ability to maintain, renegotiate or replace our credit facilities; |
• | changes in interest or exchange rates, which could reduce our net income, and the possibility that future hedging strategies may not be successful, which could adversely affect our results of operations and financial condition, as could our failure to comply with hedge accounting principles and interpretations; |
• | the possibility that the adoption of future accounting standards could negatively impact our business; and |
• | the risk factors discussed in our filings with the Securities and Exchange Commission (the "SEC"). |
You should assume that the information appearing in this Quarterly Report is accurate only as of the date it was issued. Our business, financial condition, results of operations and prospects may have changed since that date.
You should carefully consider the factors listed above and review the following "Management's Discussion and Analysis of Financial Condition and Results of Operations," as well as the "Risk Factors" section and "Business" section of our Annual Report on Form 10-K for the year ended December 31, 2017, filed with the SEC on February 28, 2018 ("2017 Form 10-K").
Our forward-looking statements could be wrong in light of these and other risks, uncertainties and assumptions. The future events, developments or results described in, or implied by, this Quarterly Report could turn out to be materially different. Except
23
as required by law, we assume no obligation to publicly update or revise our forward-looking statements after the date of this Quarterly Report and you should not expect us to do so.
Investors should also be aware that while we do, from time to time, communicate with securities analysts and others, we do not, by policy, selectively disclose to them any material nonpublic information or other confidential commercial information. Accordingly, investors should not assume that we agree with any statement or report issued by any analyst regardless of the content of the statement or report. We do not, by policy, confirm forecasts or projections issued by others. Thus, to the extent that reports issued by securities analysts contain any projections, forecasts or opinions, such reports are not our responsibility.
Frequently Used Terms
We use the following terminology throughout this Quarterly Report:
• | "Amortization rate" refers to cash collections applied to principal on finance receivables as a percentage of total cash collections. |
• | "Buybacks" refers to purchase price refunded by the seller due to the return of ineligible accounts. |
• | "Cash collections" refers to collections on our owned finance receivables portfolios. |
• | "Cash receipts" refers to collections on our owned finance receivables portfolios plus fee income. |
• | "Core" accounts or portfolios refer to accounts or portfolios that are nonperforming loans and are not in an insolvent status upon purchase. These accounts are aggregated separately from insolvency accounts. |
• | "Estimated remaining collections" or "ERC" refers to the sum of all future projected cash collections on our owned finance receivables portfolios. |
• | "Insolvency" accounts or portfolios refer to accounts or portfolios of receivables that are in an insolvent status when we purchase them and as such are purchased as a pool of insolvent accounts. These include Individual Voluntary Arrangements ("IVAs"), Trust Deeds in the UK, Consumer Proposals in Canada and bankruptcy accounts in the U.S., Canada, Germany and the UK. |
• | "Principal amortization" refers to cash collections applied to principal on finance receivables. |
• | "Purchase price" refers to the cash paid to a seller to acquire nonperforming loans, plus certain capitalized costs, less buybacks. |
• | "Purchase price multiple" refers to the total estimated collections (as defined below) on owned finance receivables portfolios divided by purchase price. |
• | "Total estimated collections" or "TEC" refers to actual cash collections, including cash sales, plus estimated remaining collections on our finance receivables portfolios. |
All references in this Quarterly Report to "PRA Group," "our," "we," "us," "the Company" or similar terms are to PRA Group, Inc. and its subsidiaries.
24
Overview
We are a global financial and business services company with operations in the Americas and Europe. Our primary business is the purchase, collection and management of portfolios of nonperforming loans.
We are headquartered in Norfolk, Virginia, and as of March 31, 2018 employ 5,639 full time equivalents. Our shares of common stock are traded on the NASDAQ Global Select Market under the symbol "PRAA."
Results of Operations
The results of operations include the financial results of the Company and all of its subsidiaries. The following table sets forth consolidated income statement amounts as a percentage of total revenues for the periods indicated:
For the Three Months Ended March 31, | |||||||||||
2018 | 2017 | ||||||||||
Revenues: | |||||||||||
Income recognized on finance receivables, net | $ | 217,699 | 97.5 | % | $ | 194,535 | 94.2 | % | |||
Fee income | 5,327 | 2.4 | 9,858 | 4.8 | |||||||
Other revenue | 157 | 0.1 | 2,165 | 1.0 | |||||||
Total revenues | 223,183 | 100.0 | 206,558 | 100.0 | |||||||
Operating expenses: | |||||||||||
Compensation and employee services | 81,237 | 36.4 | 68,468 | 33.1 | |||||||
Legal collection expenses | 32,912 | 14.7 | 31,728 | 15.4 | |||||||
Agency fees | 8,278 | 3.7 | 10,800 | 5.2 | |||||||
Outside fees and services | 14,158 | 6.4 | 13,285 | 6.5 | |||||||
Communication | 11,557 | 5.2 | 9,137 | 4.4 | |||||||
Rent and occupancy | 4,314 | 1.9 | 3,783 | 1.8 | |||||||
Depreciation and amortization | 4,929 | 2.2 | 5,215 | 2.5 | |||||||
Other operating expenses | 12,184 | 5.5 | 10,885 | 5.3 | |||||||
Total operating expenses | 169,569 | 76.0 | 153,301 | 74.2 | |||||||
Income from operations | 53,614 | 24.0 | 53,257 | 25.8 | |||||||
Other income and (expense): | |||||||||||
Gain on sale of subsidiaries | — | — | 46,845 | 22.7 | |||||||
Interest expense, net | (25,781 | ) | (11.6 | ) | (21,257 | ) | (10.3 | ) | |||
Foreign exchange gain | 1,293 | 0.6 | 2,179 | 1.1 | |||||||
Other | 243 | 0.1 | — | — | |||||||
Income before income taxes | 29,369 | 13.1 | 81,024 | 39.3 | |||||||
Provision for income taxes | 6,137 | 2.7 | 31,409 | 15.2 | |||||||
Net income | 23,232 | 10.4 | 49,615 | 24.1 | |||||||
Adjustment for net income attributable to noncontrolling interests | 2,126 | 1.0 | 1,448 | 0.7 | |||||||
Net income attributable to PRA Group, Inc. | $ | 21,106 | 9.4 | % | $ | 48,167 | 23.4 | % | |||
25
Three Months Ended March 31, 2018 Compared To Three Months Ended March 31, 2017
Revenues
Total revenues were $223.2 million for the three months ended March 31, 2018, an increase of $16.6 million, or 8.0%, compared to total revenues of $206.6 million for the three months ended March 31, 2017.
A summary of how our revenues were generated during the three months ended March 31, 2018 and 2017 is as follows (amounts in thousands):
For the Three Months Ended March 31, | |||||||
2018 | 2017 | ||||||
Cash collections | $ | 426,580 | $ | 379,830 | |||
Principal amortization | (207,956 | ) | (182,616 | ) | |||
Net allowance charges | (925 | ) | (2,679 | ) | |||
Income recognized on finance receivables, net | 217,699 | 194,535 | |||||
Fee income | 5,327 | 9,858 | |||||
Other revenue | 157 | 2,165 | |||||
Total revenues | $ | 223,183 | $ | 206,558 | |||
Income Recognized on Finance Receivables, net
Income recognized on finance receivables, net was $217.7 million for the three months ended March 31, 2018, an increase of $23.2 million, or 11.9%, compared to $194.5 million for the three months ended March 31, 2017. The increase was primarily the result of overperformance on select Americas Core and European Core portfolios which resulted in yield increases on certain pools, a decline in net allowance charges, and the impact of elevated buying in 2017. This was partially offset by a decline in income generated by our Americas Insolvency portfolios due primarily to lower volume of purchasing during fiscal years 2014 to 2016.
Cash collections were $426.6 million in the three months ended March 31, 2018, up $46.8 million, or 12.3%, as compared to the three months ended March 31, 2017. The increase was primarily attributable to record collections in our Americas Core and European Core portfolios, which increased $19.3 million and $20.0 million, respectively. Additionally, our Americas Insolvency and European Insolvency collections increased $5.5 million and $1.9 million, respectively. Cash collections on fully amortized pools were $15.6 million in the three months ended March 31, 2018, an increase of $2.1 million or 15.6%, compared to $13.5 million in the three months ended March 31, 2017. Cash collections on pools on cost recovery were $17.5 million in the three months ended March 31, 2018, an increase of $8.9 million or 103.5%, compared to $8.6 million in the three months ended March 31, 2017.
Income recognized on finance receivables, net, is shown net of changes in valuation allowances which are recorded for significant decreases in expected cash flows or a change in timing of cash flows which would otherwise require a reduction in the stated yield on a pool of accounts. For the three months ended March 31, 2018, we recorded net allowance charges of $0.9 million, consisting of net allowance reversals of $0.7 million on our Americas Core portfolios and net allowance charges of $0.2 million and $1.4 million on our Americas Insolvency and our European Core portfolios, respectively. For the three months ended March 31, 2017, we recorded net allowance charges of $2.7 million, consisting of $1.0 million and $0.1 million on our Americas Core and Americas Insolvency portfolios, respectively, and $1.5 million on our European Core portfolios.
During the three months ended March 31, 2018, we reclassified $112.0 million from nonaccretable difference to accretable yield primarily due to increased cash collection forecasts relating to certain Americas Core and European Core pools. During the three months ended March 31, 2017, we reclassified $47.1 million from nonaccretable difference to accretable yield primarily due to increased cash collection forecasts relating to pools acquired from 2013-2016.
Fee Income
Fee income was $5.3 million in the three months ended March 31, 2018, a decrease of $4.6 million or 46.5%, compared to $9.9 million in the three months ended March 31, 2017. This was primarily due to the sale of our government services businesses in January 2017 and the sale of PRA Location Services, LLC ("PLS") in June 2017, partially offset by an increase in fee income generated by Claims Compensation Bureau, LLC ("CCB").
26
Other Revenue
Other revenue decreased to $0.2 million in the three months ended March 31, 2018 from $2.2 million in the three months ended March 31, 2017, primarily due to a decrease in revenue generated by our investments.
Operating Expenses
Total operating expenses were $169.6 million for the three months ended March 31, 2018, an increase of $16.3 million or 10.6%, compared to operating expenses of $153.3 million for the three months ended March 31, 2017.
Compensation and Employee Services
Compensation and employee services expenses were $81.2 million for the three months ended March 31, 2018, an increase of $12.7 million, or 18.5%, compared to $68.5 million for the three months ended March 31, 2017. Compensation expense increased primarily as a result of larger average staff sizes, partially offset by a decrease resulting from the sale of our government services businesses in January 2017 and the sale of PLS in June 2017. As part of our strategy to expand our domestic collector workforce, in the U.S., we have hired approximately 1,100 new collectors, net of attrition, since March 31, 2017. Total full-time equivalents increased to 5,639 as of March 31, 2018, compared to 4,205 as of March 31, 2017.
Legal Collection Expenses
Legal collection expenses primarily consist of costs paid to courts where a lawsuit is filed and contingent fees incurred for the cash collections generated by our independent third-party attorney network. Legal collection expenses were $32.9 million for the three months ended March 31, 2018, an increase of $1.2 million or 3.8%, compared to legal collection expenses of $31.7 million for the three months ended March 31, 2017. The increase was primarily due to an increase in costs paid to courts where a lawsuit is filed, mainly due to an increase in the number of accounts brought into the legal collection process in the Americas. Our costs paid to courts were $22.0 million for the three months ended March 31, 2018, an increase of $2.0 million or 10.0% compared to $20.0 million for the three months ended March 31, 2017. This was partially offset by a decrease in legal collection expenses paid to third-party attorneys. Our costs paid to third-party attorneys were $10.7 million for the three months ended March 31, 2018, a decrease of $0.6 million or 5.3% compared to $11.3 million for the three months ended March 31, 2017.
Agency Fees
Agency fees primarily represent third-party collection fees, primarily outside the U.S. Prior to the sale of PLS in June of 2017, agency fees also included costs paid to repossession agents to repossess vehicles. Agency fees were $8.3 million for the three months ended March 31, 2018, a decrease of $2.5 million or 23.1%, compared to $10.8 million for the three months ended March 31, 2017. The decrease was primarily due to the impact of the sale of PLS in June 2017.
Outside Fees and Services
Outside fees and services expenses were $14.2 million for the three months ended March 31, 2018, an increase of $0.9 million or 6.8%, compared to outside fees and services expenses of $13.3 million for the three months ended March 31, 2017.
Communication
Communication expenses were $11.6 million for the three months ended March 31, 2018, an increase of $2.5 million or 27.5%, compared to communication expenses of $9.1 million for the three months ended March 31, 2017. This increase was primarily due to a $1.5 million increase in postage expenses and a $1.0 million increase in telephone related expenses. These increases are primarily the result of increased letter and call volume associated with record portfolio purchases in Americas Core in 2017.
Rent and Occupancy
Rent and occupancy expenses were $4.3 million for the three months ended March 31, 2018, an increase of $0.5 million or 13.2%, compared to rent and occupancy expense of $3.8 million for the three months ended March 31, 2017. The increase was primarily due to the opening of two new call centers in the U.S. in the fourth quarter of 2017.
Depreciation and Amortization
Depreciation and amortization expenses were $4.9 million for the three months ended March 31, 2018, a decrease of $0.3 million, or 5.8%, compared to depreciation and amortization expenses of $5.2 million for the three months ended March 31, 2017. The decrease was primarily due to the impact of the sale of our government services businesses in January 2017 and the sale of PLS in June 2017.
27
Other Operating Expenses
Other operating expenses were $12.2 million for the three months ended March 31, 2018, an increase of $1.3 million, or 11.9%, compared to other operating expenses of $10.9 million for the three months ended March 31, 2017. The increase was primarily due to a $0.9 million increase in repairs and maintenance and a $0.8 million increase in general office expenses. This was partially offset by a $1.0 million decrease in expense related to a prior acquisition that was incurred during the three months ended March 31, 2017. None of the remaining variance was attributable to any significant identifiable items.
Gain on Sale of Subsidiaries
Pre-tax gain on sale of subsidiaries was $46.8 million for the three months ended March 31, 2017 as the direct result of our sale of the government services businesses on January 24, 2017.
Interest Expense, Net
Interest expense, net was $25.8 million during the three months ended March 31, 2018, an increase of $4.5 million or 21.1%, compared to $21.3 million for the three months ended March 31, 2017. The increase was primarily due to higher levels of average borrowings outstanding, increases in interest rates, and increases to deferred financing costs related to our financing activities during the three months ended March 31, 2018. This was partially offset by changes in fair value on our interest rate swap agreements.
Interest expense, net consisted of the following for the three months ended March 31, 2018 and 2017 (amounts in thousands):
Three Months Ended March 31, | |||||||||||
2018 | 2017 | Change | |||||||||
Stated interest on debt obligations and unused line fees | $ | 20,043 | $ | 17,327 | $ | 2,716 | |||||
Coupon interest on convertible debt | 5,175 | 2,156 | 3,019 | ||||||||
Amortization of convertible debt discount | 2,877 | 1,155 | 1,722 | ||||||||
Amortization of loan fees and other loan costs | 2,553 | 1,928 | 625 | ||||||||
Change in fair value on interest rate swap agreements | (3,673 | ) | 158 | (3,831 | ) | ||||||
Interest income | (1,194 | ) | (1,467 | ) | 273 | ||||||
Interest expense, net | $ | 25,781 | $ | 21,257 | $ | 4,524 | |||||
Net Foreign Currency Transaction Gains
Net foreign currency transaction gains were $1.3 million and $2.2 million for the three months ended March 31, 2018 and 2017, respectively. In any given period, we may incur foreign currency transactions gains or losses from transactions in currencies other than the functional currency.
Other Income
Other Income was $0.2 million and $0 during the three months ended March 31, 2018 and March 31, 2017, respectively.
Provision for Income Taxes
Provision for income taxes was $6.1 million for the three months ended March 31, 2018, a decrease of $25.3 million, or 80.6%, compared to provision for income taxes of $31.4 million for the three months ended March 31, 2017. The decrease was primarily due to a $51.6 million decrease in income before income taxes for the three months ended March 31, 2018 as compared to the three months ended March 31, 2017, coupled with a decrease in our effective tax rate. During the three months ended March 31, 2018, our effective tax rate was 20.9%, compared to 38.8% for the three months ended March 31, 2017. The decrease was due to the effects of U.S. tax reform, primarily the reduction of the U.S. Federal income tax rate from 35% to 21%, changes in the mix of projected taxable income between tax jurisdictions and a decrease in the estimated blended rate for U.S. state deferred taxes.
28
Supplemental Performance Data
Finance Receivables Portfolio Performance
The following tables show certain data related to our Americas and European Core and Insolvency portfolios. Certain adjustments, as noted in the footnotes to these tables, have been made to reduce the impact of foreign currency fluctuations on ERC and purchase price multiples.
The accounts represented in the insolvency tables are those portfolios of accounts that were in an insolvency status at the time of purchase. This contrasts with accounts in our Core portfolios that file for bankruptcy/insolvency protection after we purchase them, which continue to be tracked in their corresponding Core portfolio. Core customers sometimes file for bankruptcy/insolvency protection subsequent to our purchase of the related Core portfolio. When this occurs, we adjust our collection practices to comply with bankruptcy/insolvency rules and procedures; however, for accounting purposes, these accounts remain in the original Core portfolio. Insolvency accounts may be dismissed voluntarily or involuntarily subsequent to our purchase of the Insolvency portfolio. Dismissal occurs when the terms of the bankruptcy are not met by the petitioner. When this occurs, we are typically free to pursue collection outside of bankruptcy procedures; however, for accounting purposes, these accounts remain in the original Insolvency pool.
Purchase price multiples can vary over time due to a variety of factors, including pricing competition, supply levels, age of the receivables purchased, and changes in our operational efficiency. For example, increased pricing competition during the 2005 to 2008 period negatively impacted purchase price multiples of our Core portfolio compared to prior years. Conversely, during the 2009 to 2011 period, pricing disruptions occurred as a result of the economic downturn. This created unique and advantageous purchasing opportunities, particularly within the Insolvency market, relative to the prior four years. Purchase price multiples can also vary among types of finance receivables. For example, we generally incur lower collection costs on our Insolvency portfolio compared with our Core portfolio. This allows us, in general, to pay more for an Insolvency portfolio and experience lower purchase price multiples, while generating similar net income margins when compared with a Core portfolio.
When competition increases and/or supply decreases, pricing often becomes negatively impacted relative to expected collections, and yields tend to trend lower. The opposite tends to occur when competition decreases and/or supply increases.
Within a given portfolio type, to the extent that lower purchase price multiples are the result of more competitive pricing and lower yields, this will generally lead to higher amortization rates and lower profitability. As portfolio pricing becomes more favorable on a relative basis, our profitability will tend to increase. Profitability within given Core portfolio types may also be impacted by the age and quality of the receivables, which impact the cost to collect those accounts. Fresher accounts, for example, typically carry lower associated collection expenses, while older accounts and lower balance accounts typically carry higher costs and as a result require higher purchase price multiples to achieve the same net profitability as fresher paper.
Revenue recognition under Financial Accounting Standards Board ("FASB") Accounting Standards Codification 310-30, "Loans and Debt Securities Acquired with Deteriorated Credit Quality" ("ASC 310-30") is driven by estimates of total collections as well as the timing of those collections. We record new portfolio purchases based on our best estimate of the cash flows expected at acquisition, which reflects the uncertainties inherent in the purchase of nonperforming loans and the results of our underwriting process. Subsequent to the initial booking, as we gain collection experience and confidence with a pool of accounts, we regularly update ERC. As a result, our estimate of total collections has often increased as pools have aged. These processes have tended to cause the ratio of ERC to purchase price for any given year of buying to gradually increase over time. Thus, all factors being equal in terms of pricing, one would typically tend to see a higher collection to purchase price ratio from a pool of accounts that was six years from purchase than a pool that was just two years from purchase.
The numbers presented in the following tables represent gross cash collections and do not reflect any costs to collect; therefore, they may not represent relative profitability. Due to all the factors described above, readers should be cautious when making comparisons of purchase price multiples among periods and between types of receivables.
We hold a majority interest in a closed-end Polish investment fund that purchases and services nonperforming loans. Our investment in this fund is classified in our Consolidated Balance Sheets as "Investments" and as such is not included in the following tables. The estimated remaining collections of the portfolios held by the closed-end Polish investment fund, expected to be received by us, was $74.9 million at March 31, 2018.
29
Purchase Price Multiples as of March 31, 2018 Amounts in thousands | |||||||||||||||||||
Purchase Period | Purchase Price (1)(2) | Net Finance Receivables (3) | ERC-Historical Period Exchange Rates (4) | Total Estimated Collections (5) | ERC-Current Period Exchange Rates (6) | Current Estimated Purchase Price Multiple | Original Estimated Purchase Price Multiple (7) | ||||||||||||
Americas-Core | |||||||||||||||||||
1996-2007 | $ | 638,460 | $ | 7,015 | $ | 30,278 | $ | 2,046,593 | $ | 30,278 | 321 | % | 240 | % | |||||
2008 | 166,434 | 3,603 | 14,173 | 374,917 | 14,173 | 225 | % | 220 | % | ||||||||||
2009 | 125,155 | 865 | 27,803 | 458,854 | 27,803 | 367 | % | 252 | % | ||||||||||
2010 | 148,204 | 4,985 | 46,845 | 536,785 | 46,845 | 362 | % | 247 | % | ||||||||||
2011 | 209,625 | 12,606 | 66,779 | 725,666 | 66,779 | 346 | % | 245 | % | ||||||||||
2012 | 254,247 | 23,753 | 97,231 | 679,874 | 97,231 | 267 | % | 226 | % | ||||||||||
2013 | 391,247 | 70,571 | 220,876 | 980,948 | 220,876 | 251 | % | 211 | % | ||||||||||
2014 | 405,653 | 117,573 | 322,221 | 985,160 | 318,909 | 243 | % | 204 | % | ||||||||||
2015 | 444,516 | 173,302 | 399,613 | 967,727 | 401,173 | 218 | % | 205 | % | ||||||||||
2016 | 455,595 | 254,573 | 560,793 | 1,007,980 | 565,577 | 221 | % | 201 | % | ||||||||||
2017 | 536,130 | 466,780 | 880,523 | 1,060,591 | 879,773 | 198 | % | 193 | % | ||||||||||
2018 | 131,849 | 130,415 | 260,311 | 266,947 | 260,311 | 202 | % | 202 | % | ||||||||||
Subtotal | 3,907,115 | 1,266,041 | 2,927,446 | 10,092,042 | 2,929,728 | ||||||||||||||
Americas-Insolvency | |||||||||||||||||||
1996-2007 | 132,917 | — | 494 | 197,106 | 494 | 148 | % | 148 | % | ||||||||||
2008 | 108,549 | — | 517 | 168,662 | 517 | 155 | % | 163 | % | ||||||||||
2009 | 155,989 | — | 1,769 | 470,653 | 1,769 | 302 | % | 214 | % | ||||||||||
2010 | 208,947 | — | 3,215 | 547,333 | 3,215 | 262 | % | 184 | % | ||||||||||
2011 | 180,447 | — | 947 | 368,231 | 947 | 204 | % | 155 | % | ||||||||||
2012 | 251,433 | — | 1,375 | 388,349 | 1,375 | 154 | % | 136 | % | ||||||||||
2013 | 227,905 | 3,920 | 18,342 | 354,844 | 18,342 | 156 | % | 133 | % | ||||||||||
2014 | 148,720 | 20,772 | 33,630 | 211,087 | 33,583 | 142 | % | 124 | % | ||||||||||
2015 | 63,199 | 28,113 | 35,834 | 82,204 | 35,834 | 130 | % | 125 | % | ||||||||||
2016 | 92,290 | 46,194 | 55,800 | 111,922 | 55,887 | 121 | % | 123 | % | ||||||||||
2017 | 276,637 | 216,719 | 268,797 | 342,254 | 268,797 | 124 | % | 125 | % | ||||||||||
2018 | 13,588 | 13,587 | 17,012 | 17,100 | 17,012 | 126 | % | 126 | % | ||||||||||
Subtotal | 1,860,621 | 329,305 | 437,732 | 3,259,745 | 437,772 | ||||||||||||||
Total Americas | 5,767,736 | 1,595,346 | 3,365,178 | 13,351,787 | 3,367,500 | ||||||||||||||
Europe-Core | |||||||||||||||||||
2012 | 20,426 | — | 2,319 | 38,398 | 1,998 | 188 | % | 187 | % | ||||||||||
2013 | 20,358 | 442 | 1,477 | 23,682 | 1,248 | 116 | % | 119 | % | ||||||||||
2014 | 797,539 | 312,494 | 1,038,365 | 2,121,937 | 966,698 | 266 | % | 208 | % | ||||||||||
2015 | 422,595 | 238,428 | 474,480 | 743,376 | 465,341 | 176 | % | 160 | % | ||||||||||
2016 | 348,857 | 282,181 | 442,083 | 578,493 | 483,364 | 166 | % | 167 | % | ||||||||||
2017 | 250,089 | 239,234 | 331,287 | 363,123 | 351,038 | 145 | % | 144 | % | ||||||||||
2018 | 17,913 | 17,562 | 25,449 | 25,935 | 25,449 | 145 | % | 145 | % | ||||||||||
Subtotal | 1,877,777 | 1,090,341 | 2,315,460 | 3,894,944 | 2,295,136 | ||||||||||||||
Europe-Insolvency | |||||||||||||||||||
2014 | 10,876 | 1,765 | 4,880 | 18,234 | 4,786 | 168 | % | 129 | % | ||||||||||
2015 | 19,408 | 7,696 | 14,038 | 28,829 | 13,261 | 149 | % | 139 | % | ||||||||||
2016 | 42,215 | 27,141 | 38,073 | 60,340 | 40,977 | 143 | % | 130 | % | ||||||||||
2017 | 38,836 | 39,405 | 46,996 | 49,742 | 49,731 | 128 | % | 128 | % | ||||||||||
2018 | 5,454 | 5,437 | 6,521 | 6,546 | 6,521 | 120 | % | 120 | % | ||||||||||
Subtotal | 116,789 | 81,444 | 110,508 | 163,691 | 115,276 | ||||||||||||||
Total Europe | 1,994,566 | 1,171,785 | 2,425,968 | 4,058,635 | 2,410,412 | ||||||||||||||
Total PRA Group | $ | 7,762,302 | $ | 2,767,131 | $ | 5,791,146 | $ | 17,410,422 | $ | 5,777,912 | |||||||||
(1) | The amount reflected in the Purchase Price also includes the acquisition date finance receivables portfolios that were acquired through our various business acquisitions. |
(2) | For our international amounts, Purchase Price is presented at the exchange rate at the end of the quarter in which the pool was purchased. In addition, any purchase price adjustments that occur throughout the life of the pool are presented at the period-end exchange rate for the respective quarter of purchase. |
(3) | For our international amounts, Net Finance Receivables are presented at the March 31, 2018 exchange rate. |
(4) | For our international amounts, ERC-Historical Period Exchange Rates is presented at the period-end exchange rate for the respective quarter of purchase. |
(5) | For our international amounts, TEC is presented at the period-end exchange rate for the respective quarter of purchase. |
(6) | For our international amounts, ERC-Current Period Exchange Rates is presented at the March 31, 2018 exchange rate. |
(7) | The Original Purchase Price Multiple represents the purchase price multiple at the end of the year of acquisition. |
30
Portfolio Financial Information Year-to-date as of March 31, 2018 Amounts in thousands | |||||||||||||||||||||
Purchase Period | Purchase Price (1)(2) | Cash Collections (3) | Gross Revenue (3) | Amortization (3) | Allowance (3) | Net Revenue (3) | Net Finance Receivables as of March 31, 2018(4) | ||||||||||||||
Americas-Core | |||||||||||||||||||||
1996-2007 | $ | 638,460 | $ | 2,922 | $ | 2,259 | $ | 663 | $ | (460 | ) | $ | 2,719 | $ | 7,015 | ||||||
2008 | 166,434 | 1,403 | 627 | 776 | — | 627 | 3,603 | ||||||||||||||
2009 | 125,155 | 2,431 | 2,361 | 70 | 125 | 2,236 | 865 | ||||||||||||||
2010 | 148,204 | 3,266 | 2,417 | 849 | (2,325 | ) | 4,742 | 4,985 | |||||||||||||
2011 | 209,625 | 6,539 | 5,388 | 1,151 | (570 | ) | 5,958 | 12,606 | |||||||||||||
2012 | 254,247 | 8,664 | 5,129 | 3,535 | (2,000 | ) | 7,129 | 23,753 | |||||||||||||
2013 | 391,247 | 16,915 | 12,005 | 4,910 | 1,945 | 10,060 | 70,571 | ||||||||||||||
2014 | 405,653 | 25,535 | 17,251 | 8,284 | 1,925 | 15,326 | 117,573 | ||||||||||||||
2015 | 444,516 | 39,516 | 20,877 | 18,639 | — | 20,877 | 173,302 | ||||||||||||||
2016 | 455,595 | 59,875 | 31,913 | 27,962 | 316 | 31,597 | 254,573 | ||||||||||||||
2017 | 536,130 | 72,534 | 41,712 | 30,822 | 380 | 41,332 | 466,780 | ||||||||||||||
2018 | 131,849 | 6,637 | 5,003 | 1,634 | — | 5,003 | 130,415 | ||||||||||||||
Subtotal | 3,907,115 | 246,237 | 146,942 | 99,295 | (664 | ) | 147,606 | 1,266,041 | |||||||||||||
Americas-Insolvency | |||||||||||||||||||||
1996-2007 | 132,917 | 48 | 48 | — | — | 48 | — | ||||||||||||||
2008 | 108,549 | 72 | 72 | — | — | 72 | — | ||||||||||||||
2009 | 155,989 | 238 | 238 | — | — | 238 | — | ||||||||||||||
2010 | 208,947 | 441 | 441 | — | — | 441 | — | ||||||||||||||
2011 | 180,447 | 482 | 482 | — | — | 482 | — | ||||||||||||||
2012 | 251,433 | 1,704 | 1,704 | — | — | 1,704 | — | ||||||||||||||
2013 | 227,905 | 8,532 | 4,833 | 3,699 | — | 4,833 | 3,920 | ||||||||||||||
2014 | 148,720 | 7,609 | 1,554 | 6,055 | — | 1,554 | 20,772 | ||||||||||||||
2015 | 63,199 | 4,941 | 830 | 4,111 | — | 830 | 28,113 | ||||||||||||||
2016 | 92,290 | 6,761 | 1,193 | 5,568 | 210 | 983 | 46,194 | ||||||||||||||
2017 | 276,637 | 24,364 | 4,335 | 20,029 | — | 4,335 | 216,719 | ||||||||||||||
2018 | 13,588 | 88 | 88 | — | — | 88 | 13,587 | ||||||||||||||
Subtotal | 1,860,621 | 55,280 | 15,818 | 39,462 | 210 | 15,608 | 329,305 | ||||||||||||||
Total Americas | 5,767,736 | 301,517 | 162,760 | 138,757 | (454 | ) | 163,214 | 1,595,346 | |||||||||||||
Europe-Core | |||||||||||||||||||||
2012 | 20,426 | 583 | 585 | (2 | ) | — | 585 | — | |||||||||||||
2013 | 20,358 | 385 | 251 | 134 | — | 251 | 442 | ||||||||||||||
2014 | 797,539 | 58,099 | 33,059 | 25,040 | (140 | ) | 33,199 | 312,494 | |||||||||||||
2015 | 422,595 | 23,130 | 9,130 | 14,000 | (224 | ) | 9,354 | 238,428 | |||||||||||||
2016 | 348,857 | 20,190 | 6,581 | 13,609 | 1,743 | 4,838 | 282,181 | ||||||||||||||
2017 | 250,089 | 15,236 | 3,550 | 11,686 | — | 3,550 | 239,234 | ||||||||||||||
2018 | 17,913 | 486 | 136 | 350 | — | 136 | 17,562 | ||||||||||||||
Subtotal | 1,877,777 | 118,109 | 53,292 | 64,817 | 1,379 | 51,913 | 1,090,341 | ||||||||||||||
Europe-Insolvency | |||||||||||||||||||||
2014 | 10,876 | 765 | 316 | 449 | — | 316 | 1,765 | ||||||||||||||
2015 | 19,408 | 1,228 | 396 | 832 | — | 396 | 7,696 | ||||||||||||||
2016 | 42,215 | 3,335 | 1,303 | 2,032 | — | 1,303 | 27,141 | ||||||||||||||
2017 | 38,836 | 1,600 | 548 | 1,052 | — | 548 | 39,405 | ||||||||||||||
2018 | 5,454 | 26 | 9 | 17 | — | 9 | 5,437 | ||||||||||||||
Subtotal | 116,789 | 6,954 | 2,572 | 4,382 | — | 2,572 | 81,444 | ||||||||||||||
Total Europe | 1,994,566 | 125,063 | 55,864 | 69,199 | 1,379 | 54,485 | 1,171,785 | ||||||||||||||
Total PRA Group | $ | 7,762,302 | $ | 426,580 | $ | 218,624 | $ | 207,956 | $ | 925 | $ | 217,699 | $ | 2,767,131 | |||||||
(1) | The amount reflected in the Purchase Price also includes the acquisition date finance receivables portfolios that were acquired through our various business acquisitions. |
(2) | For our international amounts, Purchase Price is presented at the exchange rate at the end of the quarter in which the pool was purchased. In addition, any purchase price adjustments that occur throughout the life of the pool are presented at the period-end exchange rate for the respective quarter of purchase. |
(3) | For our international amounts, amounts are presented using the average exchange rates during the current reporting period. |
(4) | For our international amounts, net finance receivables are presented at the March 31, 2018 exchange rate. |
31
The following table, which excludes any proceeds from cash sales of finance receivables, illustrate historical cash collections, by year, on our portfolios.
Cash Collections by Year, By Year of Purchase (1) as of March 31, 2018 Amounts in thousands | ||||||||||||||||||||||||||||||||||||||||||
Cash Collections | ||||||||||||||||||||||||||||||||||||||||||
Purchase Period | Purchase Price (2)(3) | 1996- 2007 | 2008 | 2009 | 2010 | 2011 | 2012 | 2013 | 2014 | 2015 | 2016 | 2017 | 2018 | Total | ||||||||||||||||||||||||||||
Americas-Core | ||||||||||||||||||||||||||||||||||||||||||
1996-2007 | $ | 638,460 | $ | 1,096,153 | $ | 222,628 | $ | 168,849 | $ | 137,689 | $ | 115,551 | $ | 89,405 | $ | 63,955 | $ | 45,247 | $ | 32,491 | $ | 20,745 | $ | 13,427 | $ | 2,922 | $ | 2,009,062 | ||||||||||||||
2008 | 166,434 | — | 47,253 | 72,080 | 62,363 | 53,654 | 42,850 | 31,307 | 21,027 | 13,786 | 8,989 | 6,031 | 1,403 | 360,743 | ||||||||||||||||||||||||||||
2009 | 125,155 | — | — | 40,703 | 95,627 | 84,339 | 69,385 | 51,121 | 35,555 | 24,896 | 16,000 | 10,994 | 2,431 | 431,051 | ||||||||||||||||||||||||||||
2010 | 148,204 | — | — | — | 47,076 | 113,554 | 109,873 | 82,014 | 55,946 | 38,110 | 24,515 | 15,587 | 3,266 | 489,941 | ||||||||||||||||||||||||||||
2011 | 209,625 | — | — | — | — | 61,971 | 174,461 | 152,908 | 108,513 | 73,793 | 48,711 | 31,991 | 6,539 | 658,887 | ||||||||||||||||||||||||||||
2012 | 254,247 | — | — | — | — | — | 56,901 | 173,589 | 146,198 | 97,267 | 59,981 | 40,042 | 8,664 | 582,642 | ||||||||||||||||||||||||||||
2013 | 391,247 | — | — | — | — | — | — | 101,614 | 247,849 | 194,026 | 120,789 | 78,880 | 16,915 | 760,073 | ||||||||||||||||||||||||||||
2014 | 405,653 | — | — | — | — | — | — | — | 92,660 | 253,448 | 170,311 | 114,219 | 25,535 | 656,173 | ||||||||||||||||||||||||||||
2015 | 444,516 | — | — | — | — | — | — | — | — | 116,951 | 228,432 | 185,898 | 39,516 | 570,797 | ||||||||||||||||||||||||||||
2016 | 455,595 | — | — | — | — | — | — | — | — | — | 138,723 | 256,531 | 59,875 | 455,129 | ||||||||||||||||||||||||||||
2017 | 536,130 | — | — | — | — | — | — | — | — | — | — | 107,327 | 72,534 | 179,861 | ||||||||||||||||||||||||||||
2018 | 131,849 | — | — | — | — | — | — | — | — | — | — | — | 6,637 | 6,637 | ||||||||||||||||||||||||||||
Subtotal | 3,907,115 | 1,096,153 | 269,881 | 281,632 | 342,755 | 429,069 | 542,875 | 656,508 | 752,995 | 844,768 | 837,196 | 860,927 | 246,237 | 7,160,996 | ||||||||||||||||||||||||||||
Americas-Insolvency | ||||||||||||||||||||||||||||||||||||||||||
1996-2007 | 132,917 | 61,154 | 42,794 | 33,842 | 27,347 | 18,234 | 8,574 | 1,884 | 1,151 | 802 | 463 | 321 | 48 | 196,614 | ||||||||||||||||||||||||||||
2008 | 108,549 | — | 14,024 | 35,894 | 37,974 | 35,690 | 28,956 | 11,650 | 1,884 | 1,034 | 635 | 332 | 72 | 168,145 | ||||||||||||||||||||||||||||
2009 | 155,989 | — | — | 16,635 | 81,780 | 102,780 | 107,888 | 95,725 | 53,945 | 5,781 | 2,531 | 1,581 | 238 | 468,884 | ||||||||||||||||||||||||||||
2010 | 208,947 | — | — | — | 39,486 | 104,499 | 125,020 | 121,717 | 101,873 | 43,649 | 5,008 | 2,425 | 441 | 544,118 | ||||||||||||||||||||||||||||
2011 | 180,447 | — | — | — | — | 15,218 | 66,379 | 82,752 | 85,816 | 76,915 | 35,996 | 3,726 | 482 | 367,284 | ||||||||||||||||||||||||||||
2012 | 251,433 | — | — | — | — | — | 17,388 | 103,610 | 94,141 | 80,079 | 60,715 | 29,337 | 1,704 | 386,974 | ||||||||||||||||||||||||||||
2013 | 227,905 | — | — | — | — | — | — | 52,528 | 82,596 | 81,679 | 63,386 | 47,781 | 8,532 | 336,502 | ||||||||||||||||||||||||||||
2014 | 148,720 | — | — | — | — | — | — | — | 37,045 | 50,880 | 44,313 | 37,350 | 7,609 | 177,197 | ||||||||||||||||||||||||||||
2015 | 63,199 | — | — | — | — | — | — | — | — | 3,395 | 17,892 | 20,143 | 4,941 | 46,371 | ||||||||||||||||||||||||||||
2016 | 92,290 | — | — | — | — | — | — | — | — | — | 18,869 | 30,426 | 6,761 | 56,056 | ||||||||||||||||||||||||||||
2017 | 276,637 | — | — | — | — | — | — | — | — | — | — | 49,093 | 24,364 | 73,457 | ||||||||||||||||||||||||||||
2018 | 13,588 | — | — | — | — | — | — | — | — | — | — | — | 88 | 88 | ||||||||||||||||||||||||||||
Subtotal | 1,860,621 | 61,154 | 56,818 | 86,371 | 186,587 | 276,421 | 354,205 | 469,866 | 458,451 | 344,214 | 249,808 | 222,515 | 55,280 | 2,821,690 | ||||||||||||||||||||||||||||
Total Americas | 5,767,736 | 1,157,307 | 326,699 | 368,003 | 529,342 | 705,490 | 897,080 | 1,126,374 | 1,211,446 | 1,188,982 | 1,087,004 | 1,083,442 | 301,517 | 9,982,686 | ||||||||||||||||||||||||||||
Europe-Core | ||||||||||||||||||||||||||||||||||||||||||
2012 | 20,426 | — | — | — | — | — | 11,604 | 8,995 | 5,641 | 3,175 | 2,198 | 2,038 | 583 | 34,234 | ||||||||||||||||||||||||||||
2013 | 20,358 | — | — | — | — | — | — | 7,068 | 8,540 | 2,347 | 1,326 | 1,239 | 385 | 20,905 | ||||||||||||||||||||||||||||
2014 | 797,539 | — | — | — | — | — | — | — | 153,180 | 291,980 | 246,365 | 220,765 | 58,099 | 970,389 | ||||||||||||||||||||||||||||
2015 | 422,595 | — | — | — | — | — | — | — | — | 45,760 | 100,263 | 86,156 | 23,130 | 255,309 | ||||||||||||||||||||||||||||
2016 | 348,857 | — | — | — | — | — | — | — | — | — | 40,368 | 78,915 | 20,190 | 139,473 | ||||||||||||||||||||||||||||
2017 | 250,089 | — | — | — | — | — | — | — | — | — | — | 17,894 | 15,236 | 33,130 | ||||||||||||||||||||||||||||
2018 | 17,913 | — | — | — | — | — | — | — | — | — | — | 486 | 486 | |||||||||||||||||||||||||||||
Subtotal | 1,877,777 | — | — | — | — | — | 11,604 | 16,063 | 167,361 | 343,262 | 390,520 | 407,007 | 118,109 | 1,453,926 | ||||||||||||||||||||||||||||
Europe-Insolvency | ||||||||||||||||||||||||||||||||||||||||||
2014 | 10,876 | — | — | — | — | — | — | — | 5 | 4,297 | 3,921 | 3,207 | 765 | 12,195 | ||||||||||||||||||||||||||||
2015 | 19,408 | — | — | — | — | — | — | — | — | 2,954 | 4,366 | 5,013 | 1,228 | 13,561 | ||||||||||||||||||||||||||||
2016 | 42,215 | — | — | — | — | — | — | — | — | — | 6,175 | 12,703 | 3,335 | 22,213 | ||||||||||||||||||||||||||||
2017 | 38,836 | — | — | — | — | — | — | — | — | — | — | 1,233 | 1,600 | 2,833 | ||||||||||||||||||||||||||||
2018 | 5,454 | — | — | — | — | — | — | — | — | — | — | 26 | 26 | |||||||||||||||||||||||||||||
Subtotal | 116,789 | — | — | — | — | — | — | — | 5 | 7,251 | 14,462 | 22,156 | 6,954 | 50,828 | ||||||||||||||||||||||||||||
Total Europe | 1,994,566 | — | — | — | — | — | 11,604 | 16,063 | 167,366 | 350,513 | 404,982 | 429,163 | 125,063 | 1,504,754 | ||||||||||||||||||||||||||||
Total PRA Group | $ | 7,762,302 | $ | 1,157,307 | $ | 326,699 | $ | 368,003 | $ | 529,342 | $ | 705,490 | $ | 908,684 | $ | 1,142,437 | $ | 1,378,812 | $ | 1,539,495 | $ | 1,491,986 | $ | 1,512,605 | $ | 426,580 | $ | 11,487,440 | ||||||||||||||
(1) | For our international amounts, cash collections are presented using the average exchange rates during the cash collection period. |
(2) | The amount reflected in the Purchase Price also includes the acquisition date finance receivables portfolios that were acquired through our various business acquisitions. |
(3) | For our international amounts, Purchase Price is presented at the exchange rate at the end of the quarter in which the portfolio was purchased. In addition, any purchase price adjustments that occur throughout the life of the pool are presented at the period end exchange rate for the respective quarter of purchase. |
32
Estimated Remaining Collections
The following chart shows our ERC by geographical region at March 31, 2018 (amounts in millions).
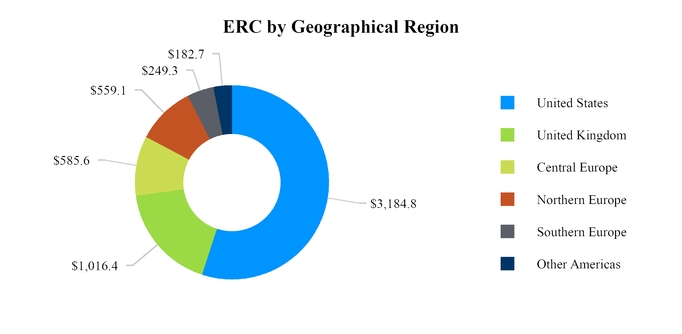
Seasonality
Cash collections in the Americas tend to be higher in the first and second quarters of the year and lower in the third and fourth quarters of the year; by contrast, cash collections in Europe tend to be higher in the third and fourth quarters of the year. Customer payment patterns are affected by seasonal employment trends, income tax refunds and holiday spending habits geographically.
The following table displays our quarterly cash collections by geography and portfolio type, for the periods indicated.
Cash Collections by Geography and Type Amounts in thousands | |||||||||||||||||||||||||||||||
2018 | 2017 | 2016 | |||||||||||||||||||||||||||||
Q1 | Q4 | Q3 | Q2 | Q1 | Q4 | Q3 | Q2 | ||||||||||||||||||||||||
Americas-Core | $ | 246,237 | $ | 204,245 | $ | 212,756 | $ | 217,020 | $ | 226,906 | $ | 193,360 | $ | 210,524 | $ | 213,741 | |||||||||||||||
Americas-Insolvency | 55,280 | 59,103 | 60,436 | 53,163 | 49,813 | 52,988 | 60,429 | 67,745 | |||||||||||||||||||||||
Europe-Core | 118,109 | 107,124 | 102,681 | 99,121 | 98,081 | 97,429 | 96,028 | 102,972 | |||||||||||||||||||||||
Europe-Insolvency | 6,954 | 5,794 | 5,961 | 5,371 | 5,030 | 4,974 | 4,719 | 2,744 | |||||||||||||||||||||||
Total Cash Collections | $ | 426,580 | $ | 376,266 | $ | 381,834 | $ | 374,675 | $ | 379,830 | $ | 348,751 | $ | 371,700 | $ | 387,202 | |||||||||||||||
The following table provides additional details on the composition of our U.S. Core cash collections for the periods indicated.
Domestic Portfolio Core Cash Collections by Source Amounts in thousands | |||||||||||||||||||||||||||||||
2018 | 2017 | 2016 | |||||||||||||||||||||||||||||
Q1 | Q4 | Q3 | Q2 | Q1 | Q4 | Q3 | Q2 | ||||||||||||||||||||||||
Call Center and Other Collections | $ | 155,448 | $ | 120,349 | $ | 123,009 | $ | 122,780 | $ | 127,368 | $ | 103,595 | $ | 115,454 | $ | 119,568 | |||||||||||||||
External Legal Collections | 38,891 | 31,960 | 35,042 | 37,863 | 40,267 | 35,231 | 36,415 | 40,369 | |||||||||||||||||||||||
Internal Legal Collections | 33,423 | 31,154 | 31,761 | 32,511 | 34,937 | 31,458 | 33,206 | 34,505 | |||||||||||||||||||||||
Total Domestic Core Cash Collections | $ | 227,762 | $ | 183,463 | $ | 189,812 | $ | 193,154 | $ | 202,572 | $ | 170,284 | $ | 185,075 | $ | 194,442 | |||||||||||||||
33
Collections Productivity (Domestic Portfolio)
The following tables display certain collections productivity measures.
Cash Collections per Collector Hour Paid Domestic Portfolio | |||||||||||||||||||
Total domestic core cash collections (1) | |||||||||||||||||||
2018 | 2017 | 2016 | 2015 | 2014 | |||||||||||||||
First Quarter | $ | 176 | $ | 254 | $ | 274 | $ | 247 | $ | 223 | |||||||||
Second Quarter | — | 202 | 269 | 245 | 220 | ||||||||||||||
Third Quarter | — | 191 | 281 | 250 | 217 | ||||||||||||||
Fourth Quarter | — | 170 | 248 | 239 | 203 | ||||||||||||||
Call center and other cash collections (2) | |||||||||||||||||||
2018 | 2017 | 2016 | 2015 | 2014 | |||||||||||||||
First Quarter | $ | 121 | $ | 161 | $ | 168 | $ | 143 | $ | 119 | |||||||||
Second Quarter | — | 129 | 167 | 141 | 107 | ||||||||||||||
Third Quarter | — | 125 | 177 | 145 | 112 | ||||||||||||||
Fourth Quarter | — | 112 | 153 | 139 | 110 | ||||||||||||||
(1) | Represents total cash collections less Insolvency cash collections from trustee-administered accounts. This metric includes cash collections from Insolvency accounts administered by the Core call centers as well as cash collections generated by our internal staff of legal collectors. This calculation does not include hours paid to our internal staff of legal collectors or to employees processing the required notifications to trustees on Insolvency accounts. |
(2) | Represents total cash collections less internal legal cash collections, external legal cash collections, and Insolvency cash collections from trustee-administered accounts. |
Portfolio Purchasing
The following graph shows the purchase price of our portfolios by year since 2008. It also includes the acquisition date finance receivable portfolios that were acquired through our various business acquisitions.
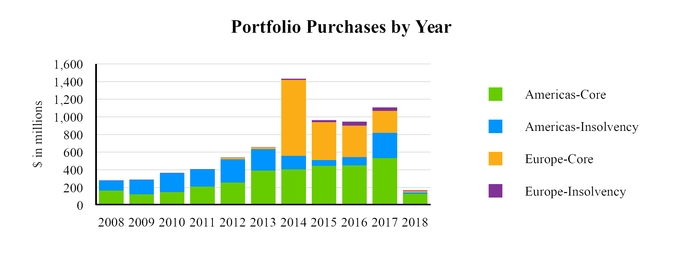
34
The following table displays our quarterly portfolio purchases for the periods indicated.
Portfolio Purchases by Geography and Type Amounts in thousands | |||||||||||||||||||||||||||||||
2018 | 2017 | 2016 | |||||||||||||||||||||||||||||
Q1 | Q4 | Q3 | Q2 | Q1 | Q4 | Q3 | Q2 | ||||||||||||||||||||||||
Americas-Core | $ | 131,427 | $ | 160,278 | $ | 115,572 | $ | 144,871 | $ | 115,166 | $ | 91,800 | $ | 95,452 | $ | 130,529 | |||||||||||||||
Americas-Insolvency | 13,436 | 44,195 | 73,497 | 100,040 | 67,123 | 20,929 | 16,760 | 33,723 | |||||||||||||||||||||||
Europe-Core | 18,000 | 152,417 | 14,695 | 42,876 | 39,505 | 80,129 | 34,240 | 68,835 | |||||||||||||||||||||||
Europe-Insolvency | 5,392 | 17,698 | 7,146 | 7,860 | 6,020 | 6,943 | 14,803 | 16,410 | |||||||||||||||||||||||
Total Portfolio Purchasing | $ | 168,255 | $ | 374,588 | $ | 210,910 | $ | 295,647 | $ | 227,814 | $ | 199,801 | $ | 161,255 | $ | 249,497 | |||||||||||||||
Portfolio Purchases by Stratifications (Domestic Only)
The following table categorizes our quarterly domestic portfolio purchases for the periods indicated into major asset type and delinquency category. Over the past 20 years, we have acquired more than 48 million customer accounts in the U.S. alone.
Domestic Portfolio Purchases by Major Asset Type Amounts in thousand | |||||||||||||||||||||||||||||||
2018 | 2017 | 2016 | |||||||||||||||||||||||||||||
Q1 | Q4 | Q3 | Q2 | Q1 | Q4 | Q3 | Q2 | ||||||||||||||||||||||||
Major Credit Cards | $ | 84,858 | $ | 87,895 | $ | 54,892 | $ | 65,177 | $ | 57,615 | $ | 35,306 | $ | 38,858 | $ | 48,471 | |||||||||||||||
Consumer Finance | 3,558 | 2,360 | 3,308 | 7,354 | 7,987 | 5,678 | 1,309 | 1,616 | |||||||||||||||||||||||
Private Label Credit Cards | 47,962 | 90,332 | 78,609 | 101,162 | 73,473 | 56,681 | 54,969 | 86,331 | |||||||||||||||||||||||
Auto Related | 613 | 21,219 | 49,741 | 67,701 | 30,191 | 6,104 | — | 831 | |||||||||||||||||||||||
Total | $ | 136,991 | $ | 201,806 | $ | 186,550 | $ | 241,394 | $ | 169,266 | $ | 103,769 | $ | 95,136 | $ | 137,249 | |||||||||||||||
Domestic Portfolio Purchases by Delinquency Category Amounts in thousand | |||||||||||||||||||||||||||||||
2018 | 2017 | 2016 | |||||||||||||||||||||||||||||
Q1 | Q4 | Q3 | Q2 | Q1 | Q4 | Q3 | Q2 | ||||||||||||||||||||||||
Fresh (1) | $ | 71,067 | $ | 76,910 | $ | 67,540 | $ | 73,813 | $ | 43,786 | $ | 30,919 | $ | 30,114 | $ | 42,048 | |||||||||||||||
Primary (2) | 3,290 | 23,100 | 1,623 | 4,314 | 726 | 2,672 | 1,568 | 29,990 | |||||||||||||||||||||||
Secondary (3) | 49,198 | 48,865 | 43,366 | 52,217 | 49,794 | 48,005 | 51,630 | 51,019 | |||||||||||||||||||||||
Tertiary (3) | — | 8,736 | 524 | — | 1,111 | 557 | — | — | |||||||||||||||||||||||
Insolvency | 13,436 | 44,195 | 73,497 | 100,040 | 67,123 | 20,930 | 11,145 | 13,702 | |||||||||||||||||||||||
Other (4) | — | — | — | 11,010 | 6,726 | 686 | 679 | 490 | |||||||||||||||||||||||
Total | $ | 136,991 | $ | 201,806 | $ | 186,550 | $ | 241,394 | $ | 169,266 | $ | 103,769 | $ | 95,136 | $ | 137,249 | |||||||||||||||
(1) | Fresh accounts are typically past due 120 to 270 days, charged-off by the credit originator and are either being sold prior to any post-charge-off collection activity or placement with a third-party for the first time. |
(2) | Primary accounts are typically 360 to 450 days past due and charged-off and have been previously placed with one contingent fee servicer. |
(3) | Secondary and tertiary accounts are typically more than 660 days past due and charged-off and have been placed with two or three contingent fee servicers. |
(4) | Other accounts are typically two to three years or more past due and charged-off and have previously been worked by four or more contingent fee servicers. |
35
Liquidity and Capital Resources
We manage our liquidity to help provide access to sufficient funding to meet our business needs and financial obligations. As of March 31, 2018, cash and cash equivalents totaled $101.4 million. Of the cash and cash equivalent balance as of March 31, 2018, $80.7 million consisted of cash on hand related to foreign operations with indefinitely reinvested earnings. See the "Undistributed Earnings of Foreign Subsidiaries" section below for more information.
At March 31, 2018, we had approximately $2.2 billion in borrowings outstanding with $875.0 million of availability under all our credit facilities (subject to the borrowing base and applicable debt covenants). Considering borrowing base restrictions, as of March 31, 2018, the amount available to be drawn was $550.0 million. Of the $875.0 million of borrowing availability, $478.5 million was available under our European credit facility and $396.5 million was available under our North American credit facility. Of the $550.0 million available considering borrowing base restrictions, $184.6 million was available under our European credit facility and $365.4 million was available under our North American credit facility. The primary borrowing base under both credit facilities is ERC of the respective finance receivables portfolios. For more information, see Note 5.
An additional funding source is interest-bearing deposits generated in Europe. Per the terms of our European credit facility, we are permitted to obtain interest-bearing deposit funding of up to SEK 1.2 billion (approximately $143.5 million as of March 31, 2018). Interest-bearing deposits as of March 31, 2018 were $90.8 million.
We believe we were in compliance with the covenants of our financing arrangements as of March 31, 2018.
We have the ability to slow the purchasing of finance receivables if necessary, with low impact to current year cash collections. For example, we invested $1.1 billion in portfolio purchases in 2017. The portfolios purchased in 2017 generated $175.5 million of cash collections, representing only 11.6% of 2017 cash collections.
Contractual obligations over the next year are primarily related to debt maturities and purchase commitments. Our North American credit facility expires in May 2022. Our European credit facility expires in February 2021. Of our $771.5 million in term loans outstanding at March 31, 2018, $10.0 million is due within one year.
We have in place forward flow commitments for the purchase of nonperforming loans with a maximum purchase price of $351.3 million as of March 31, 2018, of which $348.5 million is over the next 12 months. We may also enter into new or renewed flow commitments and close on spot transactions in addition to the aforementioned flow agreements.
On May 10, 2017, we reached a settlement with the Internal Revenue Service in regards to the assertion that tax revenue recognition using the cost recovery method did not clearly reflect taxable income. Under the settlement, we will utilize a new tax accounting method to recognize net finance receivables revenue effective with tax year 2017. Under the new method, a portion of the annual collections amortizes principal and the remaining portion is taxable income. The deferred tax liability related to the difference in timing between the new method and the cost recovery method will be incorporated evenly into our tax filings over four years effective with tax year 2017. We estimate the related tax payments for future years to be approximately $9.8 million per quarter.
We believe that funds generated from operations and from cash collections on finance receivables, together with existing cash and available borrowings under our revolving credit facilities will be sufficient to finance our operations, planned capital expenditures, forward flow purchase commitments, and additional portfolio purchasing during the next 12 months. Business acquisitions, adverse outcomes in pending litigation or higher than expected levels of portfolio purchasing could require additional financing from other sources.
Cash Flows Analysis
Our operating activities provided cash of $33.7 million and $32.7 million for the three months ended March 31, 2018 and 2017, respectively. Key drivers of the change included cash collections recognized as revenue, income tax payments and other changes to our income tax payable and receivable accounts. Cash collections recognized as revenue increased $23.2 million, as previously described in the revenues discussion and analysis, and cash paid for income taxes increased $7.3 million. We also had a gain on the sale of subsidiaries of $46.8 million during the three months ended March 31, 2017, which impacted our operating cash flows.
Our investing activities provided cash of $21.2 million and $44.7 million for the three months ended March 31, 2018 and 2017, respectively. Cash provided by investing activities is primarily driven by cash collections applied to principal on finance receivables. Cash used in investing activities is primarily driven by acquisitions of nonperforming loans. The change in net cash provided by investing activities is primarily due to the sale of subsidiaries during the three months ended March 31, 2017, which provided us with net proceeds of $89.1 million; an increase in collections applied to principal on finance receivables, which totaled $208.9 million during the three months ended March 31, 2018, compared to $185.3 million during three months ended March 31,
36
2017. This was partially offset by a decrease in the amounts of acquisitions of finance receivables, which totaled $165.9 million during the three months ended March 31, 2018, compared to $226.1 million during three months ended March 31, 2017.
Our financing activities used cash of $70.6 million and $90.3 million for the three months ended March 31, 2018 and 2017, respectively. Cash for financing activities is normally provided by draws on our lines of credit. Cash used in financing activities is primarily driven by principal payments on our lines of credit and long-term debt. The change in cash used in financing activities for the three months ended March 31, 2018 compared to three months ended March 31, 2017 was primarily due to a decrease in net payments on our lines of credit and long-term debt. During the three months ended March 31, 2018, net payments on our borrowing activities totaled $49.5 million compared to $88.8 million during the three months ended March 31, 2017. Cash used in financing activities was also impacted by distributions paid to noncontrolling interests which totaled $12.5 million and $0.7 million for the three months ended March 31, 2018 and 2017, respectively. Additionally, during the the three months ended March 31, 2018 we had a decrease in interest bearing deposits of $6.3 million, compared to an increase of $1.5 million during the three months ended March 31, 2017.
Undistributed Earnings of Foreign Subsidiaries
We intend to use predominantly all of our accumulated and future undistributed earnings of foreign subsidiaries to expand operations outside the U.S.; therefore, such undistributed earnings of foreign subsidiaries are considered to be indefinitely reinvested outside the U.S. Accordingly, no provision for income tax and withholding tax has been provided thereon. If management's intentions change and eligible undistributed earnings of foreign subsidiaries are repatriated, we could be subject to additional income taxes and withholding taxes. This could result in a higher effective tax rate in the period in which such a decision is made to repatriate accumulated or future undistributed foreign earnings. The amount of cash on hand related to foreign operations with indefinitely reinvested earnings was $80.7 million and $106.0 million as of March 31, 2018 and December 31, 2017, respectively. Refer to Note 8 for further information related to our income taxes and undistributed foreign earnings.
Contractual Obligations
Our contractual obligations as of March 31, 2018 were as follows (amounts in thousands):
Payments due by period | ||||||||||||||||||||
Contractual Obligations | Total | Less than 1 year | 1 - 3 years | 3 - 5 years | More than 5 years | |||||||||||||||
Operating leases | $ | 49,170 | $ | 11,975 | $ | 16,873 | $ | 11,720 | $ | 8,602 | ||||||||||
Revolving credit (1) | 983,756 | 48,316 | 555,031 | 379,910 | 499 | |||||||||||||||
Long-term debt (2) | 1,699,132 | 62,875 | 826,275 | 458,945 | 351,037 | |||||||||||||||
Purchase commitments (3) | 351,341 | 351,341 | — | — | — | |||||||||||||||
Employment agreements | 21,802 | 7,864 | 13,938 | — | — | |||||||||||||||
Total | $ | 3,105,201 | $ | 482,371 | $ | 1,412,117 | $ | 850,575 | $ | 360,138 | ||||||||||
(1) | This amount includes estimated interest and unused line fees due on our revolving credit and assumes that the outstanding balances on the revolving credit remain constant from the March 31, 2018 balances to maturity. |
(2) | This amount includes scheduled interest and principal payments on our term loans and convertible senior notes. |
(3) | This amount includes the maximum remaining amount to be purchased under forward flow and other contracts for the purchase of nonperforming loans in the amount of approximately $351.3 million. |
Off-Balance Sheet Arrangements
We do not have any off-balance sheet arrangements as defined by Item 303(a)(4) of Regulation S-K promulgated under the Securities Exchange Act of 1934, as amended (the "Exchange Act").
Recent Accounting Pronouncements
For a summary of recent accounting pronouncements and the anticipated effects on our consolidated financial statements see Note 11.
Critical Accounting Policies and Estimates
Our consolidated financial statements have been prepared in accordance with U.S. generally accepted accounting principles. Our significant accounting policies are discussed in Note 1 to our Consolidated Financial Statements included in Part II, Item 8 of our 2017 Form 10-K. Our significant accounting policies are fundamental to understanding our results of operations and financial
37
condition because they require that we use estimates, assumptions and judgments that affect the reported amounts of revenues, expenses, assets, and liabilities.
Three of these policies are considered to be critical because they are important to the portrayal of our financial condition and results, and because they require management to make judgments and estimates that are difficult, subjective, and complex regarding matters that are inherently uncertain.
We base our estimates on historical experience, current trends and on various other assumptions that we believe are reasonable under the circumstances, the results of which form the basis for making judgments about the carrying values of assets and liabilities that are not readily apparent from other sources. If these estimates differ significantly from actual results, the impact on our consolidated financial statements may be material.
Management has reviewed these critical accounting policies with the Audit Committee of our board of directors.
Revenue Recognition - Finance Receivables
We account for our investment in finance receivables under the guidance of ASC 310-30. Revenue recognition for finance receivables accounted for under ASC 310-30 involves the use of estimates and the exercise of judgment on the part of management. These estimates include projections of the quantity and timing of future cash flows and economic lives of our pools of finance receivables. Significant changes in such estimates could result in increased revenue via yield increases which are recognized prospectively or decreased revenue through the incurrence of allowance charges which are recognized immediately.
We implement the accounting for income recognized on finance receivables under ASC 310-30 as follows:
We create each accounting pool using our projections of estimated cash flows and expected economic life. We then compute the effective yield that fully amortizes the pool over a reasonable expectation of its economic life based on the current projections of estimated cash flows. As actual cash flow results are recorded, we review each pool watching for trends, actual performance versus projections and curve shape (a graphical depiction of the timing of cash flows). We then re-forecast future cash flows utilizing our proprietary analytical models.
Significant judgment is used in evaluating whether variances in actual performance are due to changes in the total amount or changes in the timing of expected cash flows. Significant changes in either may result in yield increases or allowance charges if necessary for the pool's amortization period to fall within a reasonable expectation of its economic life.
Valuation of Acquired Intangibles and Goodwill
In accordance with FASB ASC Topic 350, "Intangibles-Goodwill and Other" ("ASC 350"), we amortize intangible assets over their estimated useful lives. Goodwill, pursuant to ASC 350, is not amortized but rather evaluated for impairment annually and more frequently if indicators of potential impairment exist. Goodwill is reviewed for potential impairment at the reporting unit level. A reporting unit is an operating segment or one level below an operating segment.
Goodwill is evaluated for impairment either under the qualitative assessment option or the two-step test approach depending on facts and circumstances of a reporting unit, including the excess of fair value over carrying amount in the last valuation or changes in business environment. If we qualitatively determine it is more likely than not that the fair value of a reporting unit is greater than its carrying amount, the two-step impairment test is unnecessary. Otherwise, goodwill is evaluated for impairment using the two-step test, where the carrying amount of a reporting unit is compared to its fair value in Step 1; if the fair value exceeds the carrying amount, Step 2 is unnecessary. If the carrying amount exceeds the reporting unit’s fair value, this could indicate potential impairment and Step 2 of the goodwill evaluation process is required to determine if goodwill is impaired and to measure the amount of impairment loss to recognize, if any. When Step 2 is necessary, the fair value of individual assets and liabilities is determined using valuations (which in some cases may be based in part on third-party valuation reports), or other observable sources of fair value, as appropriate. If the carrying amount of goodwill exceeds its implied fair value, the excess is recognized as an impairment loss.
We determine the fair value of a reporting unit by applying the approaches prescribed under the fair value measurement accounting framework: the income approach and the market approach. Depending on the availability of public data and suitable comparables, we may or may not use the market approach or we may emphasize the results from the approach differently. Under the income approach, we estimate the fair value of a reporting unit based on the present value of estimated future cash flows and a residual terminal value. Cash flow projections are based on management's estimates of revenue growth rates, operating margins, necessary working capital, and capital expenditure requirements, taking into consideration industry and market conditions. The discount rate used is based on the weighted-average cost of capital adjusted for the relevant risk associated with business-specific characteristics and the uncertainty related to the reporting unit's ability to execute on the projected cash flows. Under the market
38
approach, we estimate fair value based on prices and other relevant market transactions involving comparable publicly-traded companies with operating and investment characteristics similar to the reporting unit.
Income Taxes
We are subject to the income tax laws of the various jurisdictions in which we operate, including U.S. federal, state, local, and international jurisdictions. These tax laws are complex and are subject to different interpretations by the taxpayer and the relevant government taxing authorities. When determining our domestic and foreign income tax expense, we must make judgments about the application of these inherently complex laws.
We follow the guidance of FASB ASC Topic 740 "Income Taxes" ("ASC 740") as it relates to the provision for income taxes and uncertainty in income taxes. Accordingly, we record a tax provision for the anticipated tax consequences of the reported results of operations. In accordance with ASC 740, the provision for income taxes is computed using the asset and liability method, under which deferred tax assets and liabilities are recognized for the expected future tax consequences of temporary differences between the financial reporting and tax basis of assets and liabilities, and for operating losses and tax credit carry-forwards. Deferred tax assets and liabilities are measured using the currently enacted tax rates that apply to taxable income in effect for the years in which those tax assets are expected to be realized or settled. The evaluation of a tax position in accordance with the guidance is a two-step process. The first step is recognition: the enterprise determines whether it is more-likely-than-not that a tax position will be sustained upon examination, including resolution of any related appeals or litigation processes, based on the technical merits of the position. In evaluating whether a tax position has met the more-likely-than-not recognition threshold, the enterprise should presume that the position will be examined by the appropriate taxing authority that would have full knowledge of all relevant information. The second step is measurement: a tax position that meets the more-likely-than-not recognition threshold is measured to determine the amount of benefit to recognize in the financial statements. The tax position is measured as the largest amount of benefit that is greater than fifty percent likely of being realized upon ultimate settlement. Tax positions that previously failed to meet the more-likely-than-not recognition threshold should be recognized in the first subsequent financial reporting period in which that threshold is met. Previously recognized tax positions that no longer meet the more-likely-than-not recognition threshold should be derecognized in the first subsequent financial reporting period in which that threshold is no longer met. We record interest and penalties related to unrecognized tax benefits as a component of income tax expense.
In the event that all or part of the deferred tax assets are determined not to be realizable in the future, a valuation allowance would be established and charged to earnings in the period such determination is made. If we subsequently realize deferred tax assets that were previously determined to be unrealizable, the respective valuation allowance would be reversed, resulting in a positive adjustment to earnings in the period such determination is made. The establishment or release of a valuation allowance does not have an impact on cash, nor does such an allowance preclude the use of loss carry-forwards or other deferred tax assets in future periods. The calculation of tax liabilities involves significant judgment in estimating the impact of uncertainties in the application of complex tax laws. Resolution of these uncertainties in a manner inconsistent with our expectations could have a material impact on our results of operations and financial position.
Our international operations require the use of material estimates and interpretations of complex tax laws in multiple jurisdictions, and increases the complexity of our accounting for income taxes.
39
Item 3. Quantitative and Qualitative Disclosures about Market Risk
Our activities are subject to various financial risks including market risk, currency and interest rate risk, credit risk, liquidity risk and cash flow risk. Our overall financial risk management program focuses on the unpredictability of financial markets and seeks to minimize potential adverse effects on our financial performance. We may periodically enter into derivative financial instruments, typically interest rate swap agreements, to reduce our exposure to fluctuations in interest rates on variable-rate debt and their impact on earnings and cash flows. We do not utilize derivative financial instruments with a level of complexity or with a risk greater than the exposure to be managed nor do we enter into or hold derivatives for trading or speculative purposes. Derivative instruments involve, to varying degrees, elements of non-performance, or credit risk. We do not believe that we currently face a significant risk of loss in the event of non-performance by the counterparties associated with these instruments, as these transactions were executed with a diversified group of major financial institutions with a minimum investment-grade or better credit rating. Our credit risk exposure is managed through the periodic monitoring of our exposures to such counterparties.
Interest Rate Risk
We are subject to interest rate risk from outstanding borrowings on our variable rate credit facilities. As such, our consolidated financial results are subject to fluctuations due to changes in the market rate of interest. We assess this interest rate risk by estimating the increase or decrease in interest expense that would occur due to a change in short-term interest rates. The borrowings on our variable rate credit facilities were approximately $1.6 billion as of March 31, 2018. Based on our current debt structure, assuming a 50 basis point decrease in interest rates, for example, interest expense over the following 12 months would decrease by an estimated $4.6 million. Assuming a 50 basis point increase in interest rates, interest expense over the following 12 months would increase by an estimated $6.2 million.
To reduce the exposure to changes in the market rate of interest and to be in compliance with the terms of our European credit facility, we have entered into interest rate swap agreements for a portion of our borrowings under our floating rate financing arrangements. Terms of the interest rate swap agreements require us to receive a variable interest rate and pay a fixed interest rate. The sensitivity calculations above consider the impact of our interest rate swap agreements.
The fair value of our interest rate swap agreements was a net asset of $2.6 million at March 31, 2018. A hypothetical 50 basis point decrease in interest rates would cause a decrease in the estimated fair value of our interest rate swap agreements and the resulting estimated fair value would be a liability of $1.5 million at March 31, 2018. Conversely, a hypothetical 50 basis point increase in interest rates would cause an increase in the estimated fair value of our interest rate swap agreements and the resulting estimated fair value would be an asset of $8.0 million at March 31, 2018.
Currency Exchange Risk
We operate internationally and enter into transactions denominated in various foreign currencies. During the three months ended March 31, 2018, we generated $68.6 million of revenues from operations outside the U.S. and used 11 functional currencies. Weakness in one particular currency might be offset by strength in other currencies over time.
As a result of our international operations, fluctuations in foreign currencies could cause us to incur foreign currency exchange gains and losses, and could adversely affect our comprehensive income and stockholders' equity. Additionally, our reported financial results could change from period to period due solely to fluctuations between currencies.
Foreign currency gains and losses are primarily the result of the re-measurement of transactions in certain other currencies into an entity's functional currency. Foreign currency gains and losses are included as a component of other income and (expense) in our consolidated income statements.
When an entity's functional currency is different than the reporting currency of its parent, foreign currency translation adjustments may occur. Foreign currency translation adjustments are included as a component of other comprehensive income/(loss) in our consolidated statements of comprehensive income and as a component of equity in our consolidated balance sheets.
We have taken measures to mitigate the impact of foreign currency fluctuations. We have restructured our European operations so that portfolio ownership and collections generally occur within the same entity. Our European credit facility is a multi-currency facility, allowing us to better match funding and portfolio investments by currency. We strive to maintain the distribution of our European borrowings within defined thresholds based on the currency composition of our finance receivables portfolios. When those thresholds are exceeded, we engage in foreign exchange spot transactions to mitigate our risk.
40
Item 4. Controls and Procedures
Evaluation of Disclosure Controls and Procedures. We maintain disclosure controls and procedures (as defined in Exchange Act Rules 13a-15(e) and 15d-15(e)) that are designed to ensure that information required to be disclosed in our Exchange Act reports is recorded, processed, summarized and reported within the time periods specified in the SEC’s rules and forms, and that such information is accumulated and communicated to our management, including our Chief Executive Officer and Chief Financial Officer, as appropriate, to allow timely decisions regarding required disclosure. In designing and evaluating the disclosure controls and procedures, management recognized that any controls and procedures, no matter how well designed and operated, can provide only reasonable assurance of achieving the desired control objectives, and management necessarily was required to apply its judgment in evaluating the cost-benefit relationship of possible controls and procedures. Also, projections of any evaluation of effectiveness to future periods are subject to the risk that controls may become inadequate because of changes in conditions or that the degree of compliance with the policies or procedures may deteriorate. We conducted an evaluation, under the supervision and with the participation of our principal executive officer and principal financial officer, of the effectiveness of our disclosure controls and procedures as of the end of the period covered by this Quarterly Report. Based on this evaluation, the principal executive officer and principal financial officer have concluded that, as of March 31, 2018, our disclosure controls and procedures were effective.
Changes in Internal Control over Financial Reporting. There was no change in our internal control over financial reporting that occurred during the quarter ended March 31, 2018 that has materially affected, or is reasonably likely to materially affect, our internal control over financial reporting.
41
Part II. Other Information
Item 1. Legal Proceedings
For information regarding legal proceedings as of March 31, 2018, refer to Note 9.
Item 1A. Risk Factors
There have been no material changes to the risk factors disclosed in our 2017 Form 10-K.
Item 2. Unregistered Sales of Equity Securities and Use of Proceeds
None.
Item 3. Defaults Upon Senior Securities
None.
Item 4. Mine Safety Disclosures
Not applicable.
Item 5. Other Information
None.
Item 6. Exhibits
101.INS | XBRL Instance Document |
101.SCH | XBRL Taxonomy Extension Schema Document |
101.CAL | XBRL Taxonomy Extension Calculation Linkable Document |
101.LAB | XBRL Taxonomy Extension Label Linkable Document |
101.PRE | XBRL Taxonomy Extension Presentation Linkable Document |
101.DEF | XBRL Taxonomy Extension Definition Linkbase Document |
* Denotes management contract or compensatory plan or arrangement in which directors or executive officers are eligible to participate.
42
SIGNATURES
Pursuant to the requirements of the Securities Exchange Act of 1934, the registrant has duly caused this report to be signed on its behalf by the undersigned, thereunto duly authorized.
PRA Group, Inc. | |||
(Registrant) | |||
May 9, 2018 | By: | /s/ Kevin P. Stevenson | |
Kevin P. Stevenson | |||
President and Chief Executive Officer | |||
(Principal Executive Officer) | |||
May 9, 2018 | By: | /s/ Peter M. Graham | |
Peter M. Graham | |||
Executive Vice President and Chief Financial Officer | |||
(Principal Financial and Accounting Officer) | |||
43