Attached files
| file | filename |
|---|---|
| EX-3.1 - EXHIBIT - PRA GROUP INC | exhibit31-20140630.htm |
| EX-31.1 - EXHIBIT - PRA GROUP INC | exhibit311-20140630.htm |
| EX-32.1 - EXHIBIT - PRA GROUP INC | exhibit321-20140630.htm |
| EX-31.2 - EXHIBIT - PRA GROUP INC | exhibit312-20140630.htm |
| EXCEL - IDEA: XBRL DOCUMENT - PRA GROUP INC | Financial_Report.xls |
UNITED STATES
SECURITIES AND EXCHANGE COMMISSION
WASHINGTON, D.C. 20549
FORM 10-Q
ý | QUARTERLY REPORT PURSUANT TO SECTION 13 OR 15(d) OF THE SECURITIES EXCHANGE ACT OF 1934 |
For the quarterly period ended June 30, 2014.
¨ | TRANSITION REPORT PURSUANT TO SECTION 13 OR 15(d) OF THE SECURITIES EXCHANGE ACT OF 1934 |
For the transition period from to
Commission File Number: 000-50058
(Exact name of registrant as specified in its charter)
Delaware | 75-3078675 | |
(State or other jurisdiction of incorporation or organization) | (I.R.S. Employer Identification No.) | |
120 Corporate Boulevard, Norfolk, Virginia | 23502 | |
(Address of principal executive offices) | (zip code) | |
(888) 772-7326
(Registrant’s telephone number, including area code)
Indicate by check mark whether the registrant (1) has filed all reports required to be filed by Section 13 or 15(d) of the Securities Exchange Act of 1934 during the preceding 12 months (or for such shorter period that the registrant was required to file such reports), and (2) has been subject to such filing requirements for the past 90 days. YES ý NO ¨
Indicate by check mark whether the registrant has submitted electronically and posted on its corporate Web site, if any, every Interactive Data File required to be submitted and posted pursuant to Rule 405 of Regulation S-T during the preceding 12 months (or for such shorter period that the registrant was required to submit and post such files). YES ý NO ¨
Indicate by check mark whether the registrant is a large accelerated filer, an accelerated filer, a non-accelerated filer or a smaller reporting company. See the definitions of “large accelerated filer,” “accelerated filer,” “non-accelerated filer” and “smaller reporting company” in Rule 12b-2 of the Exchange Act.
Large accelerated filer | ý | Accelerated filer | ¨ | |||
Non-accelerated filer | ¨ | Smaller reporting company | ¨ | |||
Indicate by check mark whether the registrant is a shell company (as defined in Rule 12b-2 of the Exchange Act). YES ¨ NO ý
The number of shares outstanding of each of the issuer’s classes of common stock, as of the latest practicable date.
Class | Outstanding as of July 31, 2014 | |
Common Stock, $0.01 par value | 50,075,049 | |
PORTFOLIO RECOVERY ASSOCIATES, INC.
INDEX
Page(s) | ||
2
Part I. FINANCIAL INFORMATION
Item 1. Financial Statements
PORTFOLIO RECOVERY ASSOCIATES, INC.
CONSOLIDATED BALANCE SHEETS
June 30, 2014 and December 31, 2013
(unaudited)
(Amounts in thousands, except per share amounts)
June 30, 2014 | December 31, 2013 | ||||||
Assets | |||||||
Cash and cash equivalents | $ | 270,526 | $ | 162,004 | |||
Finance receivables, net | 1,219,595 | 1,239,191 | |||||
Accounts receivable, net | 12,458 | 12,359 | |||||
Income taxes receivable | 6,072 | 11,710 | |||||
Net deferred tax asset | 1,404 | 1,361 | |||||
Property and equipment, net | 38,902 | 31,541 | |||||
Goodwill | 105,122 | 103,843 | |||||
Intangible assets, net | 13,805 | 15,767 | |||||
Other assets | 27,478 | 23,456 | |||||
Total assets | $ | 1,695,362 | $ | 1,601,232 | |||
Liabilities and Equity | |||||||
Liabilities: | |||||||
Accounts payable | $ | 20,396 | $ | 14,819 | |||
Accrued expenses and other liabilities | 33,594 | 27,655 | |||||
Accrued compensation | 14,320 | 27,431 | |||||
Net deferred tax liability | 226,011 | 210,071 | |||||
Borrowings | 448,785 | 451,780 | |||||
Total liabilities | 743,106 | 731,756 | |||||
Commitments and contingencies (Note 9) | |||||||
Stockholders’ equity: | |||||||
Preferred stock, par value $0.01, authorized shares, 2,000, issued and outstanding shares - 0 | — | — | |||||
Common stock, par value $0.01, 100,000 authorized shares, 50,073 issued and outstanding shares at June 30, 2014, and 49,840 issued and outstanding shares at December 31, 2013 | 501 | 498 | |||||
Additional paid-in capital | 137,512 | 135,441 | |||||
Retained earnings | 807,852 | 729,505 | |||||
Accumulated other comprehensive income | 6,391 | 4,032 | |||||
Total stockholders’ equity | 952,256 | 869,476 | |||||
Total liabilities and equity | $ | 1,695,362 | $ | 1,601,232 | |||
The accompanying notes are an integral part of these consolidated financial statements.
3
PORTFOLIO RECOVERY ASSOCIATES, INC.
CONSOLIDATED INCOME STATEMENTS
For the three and six months ended June 30, 2014 and 2013
(unaudited)
(Amounts in thousands, except per share amounts)
Three Months Ended June 30, | Six Months Ended June 30, | ||||||||||||||
2014 | 2013 | 2014 | 2013 | ||||||||||||
Revenues: | |||||||||||||||
Income recognized on finance receivables, net | $ | 182,518 | $ | 168,570 | $ | 360,488 | $ | 323,362 | |||||||
Fee income | 14,825 | 14,391 | 30,777 | 29,158 | |||||||||||
Total revenues | 197,343 | 182,961 | 391,265 | 352,520 | |||||||||||
Operating expenses: | |||||||||||||||
Compensation and employee services | 52,461 | 48,202 | 103,846 | 93,199 | |||||||||||
Legal collection fees | 11,371 | 10,609 | 22,204 | 21,138 | |||||||||||
Legal collection costs | 25,429 | 22,717 | 51,962 | 43,218 | |||||||||||
Agent fees | 1,464 | 1,280 | 2,914 | 2,889 | |||||||||||
Outside fees and services | 12,113 | 8,634 | 22,904 | 16,081 | |||||||||||
Communications | 7,958 | 6,675 | 17,112 | 14,754 | |||||||||||
Rent and occupancy | 2,219 | 1,824 | 4,366 | 3,511 | |||||||||||
Depreciation and amortization | 4,211 | 3,534 | 8,158 | 6,900 | |||||||||||
Other operating expenses | 7,653 | 5,660 | 13,745 | 11,117 | |||||||||||
Total operating expenses | 124,879 | 109,135 | 247,211 | 212,807 | |||||||||||
Income from operations | 72,464 | 73,826 | 144,054 | 139,713 | |||||||||||
Other income and (expense): | |||||||||||||||
Interest income | 1 | — | 2 | — | |||||||||||
Interest expense | (5,068 | ) | (2,923 | ) | (9,928 | ) | (5,612 | ) | |||||||
Other expense | (6,224 | ) | — | (6,224 | ) | — | |||||||||
Income before income taxes | 61,173 | 70,903 | 127,904 | 134,101 | |||||||||||
Provision for income taxes | 23,666 | 27,489 | 49,557 | 52,170 | |||||||||||
Net income | $ | 37,507 | $ | 43,414 | $ | 78,347 | $ | 81,931 | |||||||
Adjustment for loss attributable to redeemable noncontrolling interest | — | 185 | — | 268 | |||||||||||
Net income attributable to Portfolio Recovery Associates, Inc. | $ | 37,507 | $ | 43,599 | $ | 78,347 | $ | 82,199 | |||||||
Net income per common share attributable to Portfolio Recovery Associates, Inc: | |||||||||||||||
Basic | $ | 0.75 | $ | 0.86 | $ | 1.57 | $ | 1.62 | |||||||
Diluted | $ | 0.74 | $ | 0.85 | $ | 1.55 | $ | 1.60 | |||||||
Weighted average number of shares outstanding: | |||||||||||||||
Basic | 50,065 | 50,751 | 49,997 | 50,781 | |||||||||||
Diluted | 50,437 | 51,183 | 50,400 | 51,228 | |||||||||||
The accompanying notes are an integral part of these consolidated financial statements.
4
PORTFOLIO RECOVERY ASSOCIATES, INC.
CONSOLIDATED STATEMENTS OF COMPREHENSIVE INCOME
For the three and six months ended June 30, 2014 and 2013
(unaudited)
(Amounts in thousands)
Three Months Ended June 30, | Six Months Ended June 30, | ||||||||||||||
2014 | 2013 | 2014 | 2013 | ||||||||||||
Net income | $ | 37,507 | $ | 43,414 | $ | 78,347 | $ | 81,931 | |||||||
Other comprehensive income/(loss): | |||||||||||||||
Foreign currency translation adjustments | 1,911 | (6 | ) | 2,359 | (4,424 | ) | |||||||||
Total other comprehensive income/(loss) | 1,911 | (6 | ) | 2,359 | (4,424 | ) | |||||||||
Comprehensive income | 39,418 | 43,408 | 80,706 | 77,507 | |||||||||||
Comprehensive loss attributable to noncontrolling interest | — | 185 | — | 268 | |||||||||||
Comprehensive income attributable to Portfolio Recovery Associates, Inc. | $ | 39,418 | $ | 43,593 | $ | 80,706 | $ | 77,775 | |||||||
The accompanying notes are an integral part of these consolidated financial statements.
5
PORTFOLIO RECOVERY ASSOCIATES, INC.
CONSOLIDATED STATEMENT OF CHANGES IN STOCKHOLDERS’ EQUITY
For the six months ended June 30, 2014
(unaudited)
(Amounts in thousands)
Accumulated | ||||||||||||||||||||||
Additional | Other | Total | ||||||||||||||||||||
Common Stock | Paid-in | Retained | Comprehensive | Stockholders’ | ||||||||||||||||||
Shares | Amount | Capital | Earnings | Income | Equity | |||||||||||||||||
Balance at December 31, 2013 | 49,840 | $ | 498 | $ | 135,441 | $ | 729,505 | $ | 4,032 | $ | 869,476 | |||||||||||
Components of comprehensive income: | ||||||||||||||||||||||
Net income attributable to Portfolio Recovery Associates, Inc. | — | — | — | 78,347 | — | 78,347 | ||||||||||||||||
Foreign currency translation adjustment | — | — | — | — | 2,359 | 2,359 | ||||||||||||||||
Vesting of nonvested shares | 233 | 3 | (3 | ) | — | — | — | |||||||||||||||
Amortization of share-based compensation | — | — | 5,437 | — | — | 5,437 | ||||||||||||||||
Income tax benefit from share-based compensation | — | — | 4,152 | — | — | 4,152 | ||||||||||||||||
Employee stock relinquished for payment of taxes | — | — | (7,515 | ) | — | — | (7,515 | ) | ||||||||||||||
Balance at June 30, 2014 | 50,073 | $ | 501 | $ | 137,512 | $ | 807,852 | $ | 6,391 | $ | 952,256 | |||||||||||
The accompanying notes are an integral part of these consolidated financial statements.
6
PORTFOLIO RECOVERY ASSOCIATES, INC.
CONSOLIDATED STATEMENTS OF CASH FLOWS
For the six months ended June 30, 2014 and 2013
(unaudited)
(Amounts in thousands)
Six Months Ended June 30, | |||||||
2014 | 2013 | ||||||
Cash flows from operating activities: | |||||||
Net income | $ | 78,347 | $ | 81,931 | |||
Adjustments to reconcile net income to net cash provided by operating activities: | |||||||
Amortization of share-based compensation | 5,437 | 6,651 | |||||
Depreciation and amortization | 8,158 | 6,900 | |||||
Amortization of debt discount | 2,005 | — | |||||
Deferred tax expense | 15,940 | 2,488 | |||||
Changes in operating assets and liabilities: | |||||||
Other assets | (3,874 | ) | (1,284 | ) | |||
Accounts receivable | (34 | ) | (46 | ) | |||
Accounts payable | 5,480 | (2,633 | ) | ||||
Income taxes receivable/payable, net | 5,665 | (5,748 | ) | ||||
Accrued expenses | 5,886 | 7,313 | |||||
Accrued compensation | (20,635 | ) | 1,757 | ||||
Net cash provided by operating activities | 102,375 | 97,329 | |||||
Cash flows from investing activities: | |||||||
Purchases of property and equipment | (13,224 | ) | (6,639 | ) | |||
Acquisition of finance receivables, net of buybacks | (252,168 | ) | (407,347 | ) | |||
Collections applied to principal on finance receivables | 272,153 | 248,498 | |||||
Net cash provided by/(used in) investing activities | 6,761 | (165,488 | ) | ||||
Cash flows from financing activities: | |||||||
Income tax benefit from share-based compensation | 4,152 | 2,659 | |||||
Proceeds from line of credit | — | 217,000 | |||||
Principal payments on line of credit | — | (128,000 | ) | ||||
Repurchases of common stock | — | (8,506 | ) | ||||
Cash paid for purchase of portion of noncontrolling interest | — | (1,150 | ) | ||||
Distributions paid to noncontrolling interest | — | (51 | ) | ||||
Principal payments on long-term debt | (5,000 | ) | (2,768 | ) | |||
Net cash (used in)/provided by financing activities | (848 | ) | 79,184 | ||||
Effect of exchange rate on cash | 234 | (253 | ) | ||||
Net increase in cash and cash equivalents | 108,522 | 10,772 | |||||
Cash and cash equivalents, beginning of period | 162,004 | 32,687 | |||||
Cash and cash equivalents, end of period | $ | 270,526 | $ | 43,459 | |||
Supplemental disclosure of cash flow information: | |||||||
Cash paid for interest | $ | 7,634 | $ | 5,581 | |||
Cash paid for income taxes | 25,414 | 52,809 | |||||
Supplemental disclosure of non-cash information: | |||||||
Adjustment of the noncontrolling interest measurement amount | $ | — | $ | (245 | ) | ||
Distributions payable relating to noncontrolling interest | — | 2 | |||||
Purchase of noncontrolling interest | — | 9,162 | |||||
Employee stock relinquished for payment of taxes | (7,515 | ) | (4,025 | ) | |||
The accompanying notes are an integral part of these consolidated financial statements.
7
PORTFOLIO RECOVERY ASSOCIATES, INC.
NOTES TO CONSOLIDATED FINANCIAL STATEMENTS
(unaudited)
1. | Organization and Business: |
Portfolio Recovery Associates, Inc., a Delaware corporation, and its subsidiaries (collectively, the “Company”) is a financial and business service company operating principally in the United States and the United Kingdom. The Company’s primary business is the purchase, collection and management of portfolios of defaulted consumer receivables. The Company also services receivables on behalf of clients and provides class action claims settlement recovery services and related payment processing to corporate clients.
On July 16, 2014, the Company, through a wholly owned subsidiary, completed the purchase of the outstanding equity of Aktiv Kapital AS (“Aktiv”), a Norway-based company specializing in the acquisition and servicing of non-performing consumer loans throughout Europe and in Canada, for a purchase price of approximately $872.6 million, and assumed approximately $431.3 million of Aktiv’s corporate debt, resulting in an acquisition of estimated total enterprise value of $1.3 billion.
A publicly traded company from 1997 until early 2012 (traded on the Oslo Stock Exchange under the symbol "AIK"), Aktiv has developed a mixed in-house and outsourced collection strategy. This acquisition will provide the Company entry into thirteen new markets, providing additional geographical diversity in portfolio purchasing and collection. Aktiv maintains in-house servicing platforms in eight markets, and owns portfolios in fifteen markets. Aktiv has more than 20 years of experience and data in a wide variety of consumer asset classes, across an extensive geographic background. Refer to Note 12 "Subsequent Events" for more information.
The consolidated financial statements of the Company are prepared in accordance with U.S. generally accepted accounting principles ("GAAP") and include the accounts of all of its subsidiaries. All significant intercompany accounts and transactions have been eliminated. Under the guidance of the Financial Accounting Standards Board (“FASB”) Accounting Standards Codification (“ASC”) Topic 280 “Segment Reporting” (“ASC 280”), the Company has determined that it has several operating segments that meet the aggregation criteria of ASC 280, and therefore, it has one reportable segment, accounts receivable management, based on similarities among the operating units including homogeneity of services, service delivery methods and use of technology.
The following table shows the amount of revenue generated for the three and six months ended June 30, 2014 and 2013 and long-lived assets held at June 30, 2014 and 2013 by geographical location (amounts in thousands):
As Of And For The | As Of And For The | ||||||||||||||
Three Months Ended June 30, 2014 | Three Months Ended June 30, 2013 | ||||||||||||||
Revenues | Long-Lived Assets | Revenues | Long-Lived Assets | ||||||||||||
United States | $ | 193,726 | $ | 36,537 | $ | 180,350 | $ | 25,685 | |||||||
United Kingdom | 3,617 | 2,365 | 2,611 | 1,593 | |||||||||||
Total | $ | 197,343 | $ | 38,902 | $ | 182,961 | $ | 27,278 | |||||||
As Of And For The | As Of And For The | ||||||||||||||
Six Months Ended June 30, 2014 | Six Months Ended June 30, 2013 | ||||||||||||||
Revenues | Long-Lived Assets | Revenues | Long-Lived Assets | ||||||||||||
United States | $ | 384,914 | $ | 36,537 | $ | 347,279 | $ | 25,685 | |||||||
United Kingdom | 6,351 | 2,365 | 5,241 | 1,593 | |||||||||||
Total | $ | 391,265 | $ | 38,902 | $ | 352,520 | $ | 27,278 | |||||||
Revenues are attributed to countries based on the location of the related operations. Long-lived assets consist of net property and equipment.
The accompanying unaudited consolidated financial statements of the Company have been prepared in accordance with Rule 10-01 of Regulation S-X promulgated by the Securities and Exchange Commission (“SEC”) and, therefore, do not include all information and disclosures required by U.S. GAAP for complete financial statements. In the opinion of the Company, however, the accompanying unaudited consolidated financial statements contain all adjustments, consisting only of normal recurring adjustments, necessary for a fair presentation of the Company’s consolidated balance sheet as of June 30, 2014, its consolidated income statements and statements of comprehensive income for the three and six months ended June 30, 2014 and 2013, its consolidated statement of changes in stockholders’ equity for the six months ended June 30, 2014, and its consolidated statements
8
PORTFOLIO RECOVERY ASSOCIATES, INC.
NOTES TO CONSOLIDATED FINANCIAL STATEMENTS
(unaudited)
of cash flows for the six months ended June 30, 2014 and 2013. The consolidated income statements of the Company for the three and six months ended June 30, 2014 may not be indicative of future results. Certain reclassifications have been made to prior year amounts to conform to the current year presentation. These unaudited consolidated financial statements should be read in conjunction with the audited consolidated financial statements and notes thereto included in the Company’s 2013 Annual Report on Form 10-K, filed on February 28, 2014.
2. | Finance Receivables, net: |
Changes in finance receivables, net for the three and six months ended June 30, 2014 and 2013 were as follows (amounts in thousands):
Three Months Ended June 30, | Six Months Ended June 30, | ||||||||||||||
2014 | 2013 | 2014 | 2013 | ||||||||||||
Balance at beginning of period | $ | 1,253,961 | $ | 1,169,747 | $ | 1,239,191 | $ | 1,078,951 | |||||||
Acquisitions of finance receivables, net of buybacks | 102,081 | 194,958 | 252,168 | 407,347 | |||||||||||
Foreign currency translation adjustment | 309 | (19 | ) | 389 | (941 | ) | |||||||||
Cash collections | (319,274 | ) | (296,397 | ) | (632,641 | ) | (571,860 | ) | |||||||
Income recognized on finance receivables, net | 182,518 | 168,570 | 360,488 | 323,362 | |||||||||||
Cash collections applied to principal | (136,756 | ) | (127,827 | ) | (272,153 | ) | (248,498 | ) | |||||||
Balance at end of period | $ | 1,219,595 | $ | 1,236,859 | $ | 1,219,595 | $ | 1,236,859 | |||||||
At the time of acquisition, the life of each pool is generally estimated to be between 60 and 96 months based on projected amounts and timing of future cash collections using the proprietary models of the Company. At June 30, 2014, the weighted average remaining life of the Company's pools is estimated to be approximately 78 months. Based upon current projections, cash collections applied to principal on finance receivables as of June 30, 2014 are estimated to be as follows for the twelve months in the periods ending (amounts in thousands):
June 30, 2015 | $ | 431,771 | |
June 30, 2016 | 344,914 | ||
June 30, 2017 | 246,198 | ||
June 30, 2018 | 150,081 | ||
June 30, 2019 | 42,713 | ||
June 30, 2020 | 3,918 | ||
$ | 1,219,595 | ||
During the three and six months ended June 30, 2014, the Company purchased approximately $0.97 billion and $2.88 billion, respectively, in face value of charged-off consumer receivables. During the three and six months ended June 30, 2013, the Company purchased approximately $3.19 billion and $5.04 billion, respectively, in face value of charged-off consumer receivables. At June 30, 2014, the estimated remaining collections (“ERC”) on the receivables purchased in the three and six months ended June 30, 2014, were $196.4 million and $409.9 million, respectively. At June 30, 2014, the ERC on the receivables purchased in the three and six months ended June 30, 2013, were $250.4 million and $502.9 million, respectively. At June 30, 2014, the Company had unamortized purchased principal (purchase price) in pools accounted for under the cost recovery method of $24.5 million; at December 31, 2013, the amount was $26.1 million.
Accretable yield represents the amount of income recognized on finance receivables the Company can expect to generate over the remaining life of its existing portfolios based on estimated future cash flows as of the balance sheet date. Additions represent the original expected accretable yield, on portfolios purchased during the period, to be earned by the Company based on its proprietary buying models. Net reclassifications from nonaccretable difference to accretable yield primarily result from the Company’s increase in its estimate of future cash flows. When applicable, net reclassifications to nonaccretable difference from accretable yield result from the Company’s decrease in its estimates of future cash flows and allowance charges that exceed the Company’s increase in its estimate of future cash flows. Changes in accretable yield for the three and six months ended June 30, 2014 and 2013 were as follows (amounts in thousands):
9
PORTFOLIO RECOVERY ASSOCIATES, INC.
NOTES TO CONSOLIDATED FINANCIAL STATEMENTS
(unaudited)
Three Months Ended June 30, | Six Months Ended June 30, | ||||||||||||||
2014 | 2013 | 2014 | 2013 | ||||||||||||
Balance at beginning of period | $ | 1,451,001 | $ | 1,317,144 | $ | 1,430,067 | $ | 1,239,674 | |||||||
Income recognized on finance receivables, net | (182,518 | ) | (168,570 | ) | (360,488 | ) | (323,362 | ) | |||||||
Additions | 98,423 | 167,185 | 204,620 | 349,690 | |||||||||||
Net reclassifications from nonaccretable difference | 114,721 | 85,028 | 206,357 | 138,792 | |||||||||||
Foreign currency translation adjustment | 199 | 119 | 1,270 | (3,888 | ) | ||||||||||
Balance at end of period | $ | 1,481,826 | $ | 1,400,906 | $ | 1,481,826 | $ | 1,400,906 | |||||||
A valuation allowance is recorded for significant decreases in expected cash flows or a change in the expected timing of cash flows which would otherwise require a reduction in the stated yield on a pool of accounts. In any given period, the Company may be required to record valuation allowances due to pools of receivables underperforming previous expectations. Factors that may contribute to the recording of valuation allowances include both internal as well as external factors. External factors that may have an impact on the collectability, and subsequently on the overall profitability of purchased pools of defaulted consumer receivables would include: new laws or regulations relating to collections, new interpretations of existing laws or regulations, and the overall condition of the economy. Internal factors that may have an impact on the collectability, and subsequently the overall profitability of purchased pools of defaulted consumer receivables, would include: necessary revisions to initial and post-acquisition scoring and modeling estimates, non-optimal operational activities (which relate to the collection and movement of accounts on both the collection floor of the Company and external channels), as well as decreases in productivity related to turnover and tenure of the Company’s collection staff. The following is a summary of activity within the Company’s valuation allowance account, all of which relates to loans acquired with deteriorated credit quality, for the three and six months ended June 30, 2014 and 2013 (amounts in thousands):
Three Months Ended June 30, 2014 | Three Months Ended June 30, 2013 | ||||||||||||||||||||||
Core Portfolio (1) | Purchased Bankruptcy Portfolio (2) | Total | Core Portfolio (1) | Purchased Bankruptcy Portfolio (2) | Total | ||||||||||||||||||
Valuation allowance - finance receivables: | |||||||||||||||||||||||
Beginning balance | $ | 63,923 | $ | 25,225 | $ | 89,148 | $ | 72,100 | $ | 23,196 | $ | 95,296 | |||||||||||
Allowance charges | 925 | 461 | 1,386 | — | 600 | 600 | |||||||||||||||||
Reversal of previous recorded allowance charges | (3,315 | ) | (370 | ) | (3,685 | ) | (1,750 | ) | (35 | ) | (1,785 | ) | |||||||||||
Net allowance (reversals)/charges | (2,390 | ) | 91 | (2,299 | ) | (1,750 | ) | 565 | (1,185 | ) | |||||||||||||
Ending balance | $ | 61,533 | $ | 25,316 | $ | 86,849 | $ | 70,350 | $ | 23,761 | $ | 94,111 | |||||||||||
Finance Receivables, net: | $ | 747,249 | $ | 472,346 | $ | 1,219,595 | $ | 655,010 | $ | 581,849 | $ | 1,236,859 | |||||||||||
Six Months Ended June 30, 2014 | Six Months Ended June 30, 2013 | ||||||||||||||||||||||
Core Portfolio (1) | Purchased Bankruptcy Portfolio (2) | Total | Core Portfolio (1) | Purchased Bankruptcy Portfolio (2) | Total | ||||||||||||||||||
Valuation allowance - finance receivables: | |||||||||||||||||||||||
Beginning balance | $ | 65,626 | $ | 25,475 | $ | 91,101 | $ | 74,500 | $ | 18,623 | $ | 93,123 | |||||||||||
Allowance charges | $ | 2,312 | $ | 461 | $ | 2,773 | $ | 300 | $ | 5,260 | $ | 5,560 | |||||||||||
Reversal of previous recorded allowance charges | $ | (6,405 | ) | $ | (620 | ) | $ | (7,025 | ) | $ | (4,450 | ) | $ | (122 | ) | $ | (4,572 | ) | |||||
Net allowance (reversals)/charges | $ | (4,093 | ) | $ | (159 | ) | $ | (4,252 | ) | $ | (4,150 | ) | $ | 5,138 | $ | 988 | |||||||
Ending balance | $ | 61,533 | $ | 25,316 | $ | 86,849 | $ | 70,350 | $ | 23,761 | $ | 94,111 | |||||||||||
Finance Receivables, net: | $ | 747,249 | $ | 472,346 | $ | 1,219,595 | $ | 655,010 | $ | 581,849 | $ | 1,236,859 | |||||||||||
10
PORTFOLIO RECOVERY ASSOCIATES, INC.
NOTES TO CONSOLIDATED FINANCIAL STATEMENTS
(unaudited)
(1) | “Core” accounts or portfolios refer to accounts or portfolios that are defaulted consumer receivables and are not in a bankrupt status upon purchase. For this table, the Core Portfolio also includes accounts purchased in the United Kingdom. These accounts are aggregated separately from purchased bankruptcy accounts. |
(2) | “Purchased bankruptcy” accounts or portfolios refer to accounts or portfolios that are in bankruptcy status when purchased, and as such, are purchased as a pool of bankrupt accounts. |
3. | Borrowings: |
The Company's borrowings consisted of the following as of the dates indicated (in thousands):
June 30, 2014 | December 31, 2013 | ||||||
Line of credit, term loan | $ | 190,000 | $ | 195,000 | |||
Convertible notes | 287,500 | 287,500 | |||||
Less: Debt discount | (28,715 | ) | (30,720 | ) | |||
Total | $ | 448,785 | $ | 451,780 | |||
Domestic Revolving Credit and Term Loan Facility
On December 19, 2012, the Company entered into a credit agreement with Bank of America, N.A., as administrative agent, and a syndicate of lenders named therein (the “Credit Agreement”). The credit facility contained an accordion loan feature that allowed the Company to request an increase of up to $214.5 million in the amount available for borrowing under the facility, whether from existing or new lenders, subject to terms of the Credit Agreement. The Credit Agreement was amended and modified during 2013 and on April 1, 2014. On April 1, 2014, the Company entered into a Lender Joinder Agreement and Lender Commitment Agreement (collectively, the “Commitment Increase Agreements”) to exercise the accordion feature. The Commitment Increase Agreements expanded the maximum amount of revolving credit availability under the Credit Agreement by $214.5 million, elevated the revolving credit commitments of certain lenders and added three new lenders to the Credit Agreement. Giving effect to the $214.5 million increase in the amount of revolving credit availability pursuant to the Commitment Increase Agreements, the total credit facility under the Credit Agreement now includes an aggregate principal amount of $840.0 million (subject to compliance with a borrowing base), which consists of (i) a fully-funded $190.0 million term loan, (ii) a $630 million domestic revolving credit facility, of which $630 million is available to be drawn, and (iii) a $20 million multi-currency revolving credit facility, of which $20 million is available to be drawn, all of which mature on December 19, 2017. The term and revolving loans accrue interest, at the option of the Company, at either the base rate or the Eurodollar rate (as defined in the Credit Agreement) for the applicable term plus 2.50% per annum in the case of the Eurodollar rate loans and 1.50% in the case of the base rate loans. The base rate is the highest of (a) the Federal Funds Rate (as defined in the Credit Agreement) plus 0.50%, (b) Bank of America’s prime rate, and (c) the Eurodollar rate plus 1.00%. The Company’s revolving credit facility includes a $20 million swingline loan sublimit, a $20 million letter of credit sublimit and a $20 million alternative currency equivalent sublimit.
Effective as of June 5, 2014, the Company entered into a Third Amendment to the Credit Agreement to amend a provision of the Credit Agreement to increase a basket for permitted indebtedness for the issuance of senior, unsecured convertible notes or other unsecured financings from an aggregate amount not to exceed $300 million to an aggregate amount not to exceed $500 million.
The Credit Agreement is secured by a first priority lien on substantially all of the Company’s assets. The Credit Agreement, as amended and modified, contains restrictive covenants and events of default including the following:
• | borrowings may not exceed 33% of the ERC of all eligible asset pools plus 75% of eligible accounts receivable; |
• | the consolidated leverage ratio (as defined in the Credit Agreement) cannot exceed 2.0 to 1.0 as of the end of any fiscal quarter; |
• | consolidated tangible net worth (as defined in the Credit Agreement) must equal or exceed $455.1 million plus 50% of positive cumulative consolidated net income for each fiscal quarter beginning with the quarter ended December 31, 2012, plus 50% of the cumulative net proceeds of any equity offering; |
• | capital expenditures during any fiscal year cannot exceed $40 million; |
• | cash dividends and distributions during any fiscal year cannot exceed $20 million; |
• | stock repurchases during the term of the agreement cannot exceed $250 million and cannot exceed $100 million in a single fiscal year; |
11
PORTFOLIO RECOVERY ASSOCIATES, INC.
NOTES TO CONSOLIDATED FINANCIAL STATEMENTS
(unaudited)
• | investments in loans and/or capital contributions cannot exceed $950 million to consummate the acquisition of the equity of Aktiv; |
• | permitted acquisitions (as defined in the Credit Agreement) during any fiscal year cannot exceed $250 million except for the fiscal year ending December 31, 2014, during which fiscal year permitted acquisitions (excluding the Aktiv acquisition) cannot exceed $25 million; |
• | indebtedness in the form of senior, unsecured convertible notes or other unsecured financings cannot exceed $500 million in the aggregate (without respect to the Company’s 3.00% Convertible Senior Notes due 2020); |
• | the Company must maintain positive consolidated income from operations (as defined in the Credit Agreement) during any fiscal quarter; and |
• | restrictions on changes in control. |
The revolving credit facility also bears an unused line fee of 0.375% per annum, payable quarterly in arrears.
The Company's borrowings on its credit facility at June 30, 2014 consisted of $190.0 million outstanding on the term loan with an annual interest rate as of June 30, 2014 of 2.65%. At December 31, 2013, the Company's borrowings on its credit facility consisted of $195.0 million outstanding on the term loan with an annual interest rate as of December 31, 2013 of 2.67%.
Convertible Senior Notes
On August 13, 2013, the Company completed the private offering of $287.5 million in aggregate principal amount of the Company’s 3.00% Convertible Senior Notes due 2020 (the “Notes”). The Notes were issued pursuant to an Indenture, dated August 13, 2013 (the "Indenture") between the Company and Wells Fargo Bank, National Association, as trustee. The Indenture contains customary terms and covenants, including certain events of default after which the Notes may be due and payable immediately. The Notes are senior unsecured obligations of the Company. Interest on the Notes is payable semi-annually, in arrears, on February 1 and August 1 of each year, beginning on February 1, 2014. Prior to February 1, 2020, the Notes will be convertible only upon the occurrence of specified events. On or after February 1, 2020, the Notes will be convertible at any time. Upon conversion, the Notes may be settled, at the Company’s option, in cash, shares of the Company’s common stock, or any combination thereof. Holders of the Notes have the right to require the Company to repurchase all or some of their Notes at 100% of their principal amount, plus any accrued and unpaid interest, upon the occurrence of a fundamental change (as defined in the Indenture). In addition, upon the occurrence of a make-whole fundamental change (as defined in the Indenture), the Company may, under certain circumstances, be required to increase the conversion rate for the Notes converted in connection with such a make-whole fundamental change. The conversion rate for the Notes is initially 15.2172 shares per $1,000 principal amount of Notes, which is equivalent to an initial conversion price of approximately $65.72 per share of the Company’s common stock, and is subject to adjustment in certain circumstances pursuant to the Indenture. The Company does not have the right to redeem the Notes prior to maturity. As of June 30, 2014, none of the conditions allowing holders of the Notes to convert their Notes had occurred.
As noted above, upon conversion, holders of the Notes will receive cash, shares of the Company’s common stock or a combination of cash and shares of the Company’s common stock, at the Company’s election. However, the Company’s current intent is to settle conversions through combination settlement (i.e., the Notes will be converted into cash up to the aggregate principal amount, and shares of the Company’s common stock or a combination of cash and shares of the Company’s common stock, at the Company’s election, for the remainder). As a result, and in accordance with authoritative guidance related to derivatives and hedging and earnings per share, only the conversion spread is included in the diluted earnings per share calculation, if dilutive. Under such method, the settlement of the conversion spread has a dilutive effect when the average share price of the Company’s common stock during any quarter exceeds $65.72.
The net proceeds from the sale of the Notes were approximately $279.3 million, after deducting the initial purchasers’ discounts and commissions and the estimated offering expenses payable by the Company. The Company used $174.0 million of the net proceeds from this offering to repay the outstanding balance on its revolving credit facility and used $50.0 million to repurchase shares of its common stock.
The Company determined that the fair value of the Notes at the date of issuance was approximately $255.3 million, and designated the residual value of approximately $32.2 million as the equity component. Additionally, the Company allocated approximately $7.3 million of the $8.2 million original Notes issuance cost as debt issuance cost and the remaining $0.9 million as equity issuance cost.
ASC 470-20, "Debt with Conversion and Other Options" (“ASC 470-20”), requires that, for convertible debt instruments that may be settled fully or partially in cash upon conversion, issuers must separately account for the liability and equity components
12
PORTFOLIO RECOVERY ASSOCIATES, INC.
NOTES TO CONSOLIDATED FINANCIAL STATEMENTS
(unaudited)
in a manner that will reflect the entity’s nonconvertible debt borrowing rate when interest cost is recognized in subsequent periods. Additionally, debt issuance costs are required to be allocated in proportion to the allocation of the liability and equity components and accounted for as debt issuance costs and equity issuance costs, respectively.
The balances of the liability and equity components of all of the Notes outstanding were as follows as of the dates indicated (in thousands):
June 30, 2014 | December 31, 2013 | |||||||
Liability component - principal amount | $ | 287,500 | $ | 287,500 | ||||
Unamortized debt discount | (28,715 | ) | (30,720 | ) | ||||
Liability component - net carrying amount | 258,785 | 256,780 | ||||||
Equity component | $ | 31,306 | $ | 31,306 | ||||
The debt discount is being amortized into interest expense over the remaining life of the Notes using the effective interest rate, which is 4.92%.
Interest expense related to the Notes was as follows for the periods indicated (in thousands):
Three Months Ended June 30, 2014 | Three Months Ended June 30, 2013 | Six Months Ended June 30, 2014 | Six Months Ended June 30, 2013 | |||||||||||||
Interest expense - stated coupon rate | $ | 2,156 | $ | — | $ | 4,312 | $ | — | ||||||||
Interest expense - amortization of debt discount | 1,007 | — | 2,005 | — | ||||||||||||
Total interest expense - convertible notes | $ | 3,163 | $ | — | $ | 6,317 | $ | — | ||||||||
The Company was in compliance with all covenants under its financing arrangements as of June 30, 2014 and December 31, 2013.
The following principal payments are due on the Company's borrowings as of June 30, 2014 for the twelve month periods ending (amounts in thousands):
June 30, 2015 | $ | 12,500 | |
June 30, 2016 | 17,500 | ||
June 30, 2017 | 30,000 | ||
June 30, 2018 | 130,000 | ||
June 30, 2019 | — | ||
Thereafter | 287,500 | ||
Total | $ | 477,500 | |
13
PORTFOLIO RECOVERY ASSOCIATES, INC.
NOTES TO CONSOLIDATED FINANCIAL STATEMENTS
(unaudited)
4. | Property and Equipment, net: |
Property and equipment, at cost, consisted of the following as of the dates indicated (amounts in thousands):
June 30, 2014 | December 31, 2013 | ||||||
Software | $ | 37,523 | $ | 34,108 | |||
Computer equipment | 19,280 | 17,072 | |||||
Furniture and fixtures | 9,961 | 8,616 | |||||
Equipment | 12,279 | 10,351 | |||||
Leasehold improvements | 13,131 | 11,147 | |||||
Building and improvements | 7,046 | 7,026 | |||||
Land | 1,269 | 1,269 | |||||
Accumulated depreciation and amortization | (61,587 | ) | (58,048 | ) | |||
Property and equipment, net | $ | 38,902 | $ | 31,541 | |||
Depreciation and amortization expense relating to property and equipment for the three and six months ended June 30, 2014, was $3.1 million and $5.9 million, respectively. Depreciation and amortization expense relating to property and equipment for the three and six months ended June 30, 2013, was $2.4 million and $4.6 million, respectively.
The Company, in accordance with the guidance of FASB ASC Topic 350-40 “Internal-Use Software” (“ASC 350-40”), capitalizes qualifying computer software costs incurred during the application development stage and amortizes them over their estimated useful life of three to seven years on a straight-line basis beginning when the project is completed. Costs associated with preliminary project stage activities, training, maintenance and all other post implementation stage activities are expensed as incurred. The Company’s policy provides for the capitalization of certain direct payroll costs for employees who are directly associated with internal use computer software projects, as well as external direct costs of services associated with developing or obtaining internal use software. Capitalizable personnel costs are limited to the time directly spent on such projects. As of June 30, 2014 and December 31, 2013, the Company incurred and capitalized approximately $11.9 million and $10.3 million, respectively, of these direct payroll costs and external direct costs related to software developed for internal use. Of these costs, at June 30, 2014 and December 31, 2013, approximately $2.2 million and $1.7 million, respectively, were for projects that were in the development stage and, therefore are a component of “Other Assets.” Once the projects are completed, the costs are transferred to Software and amortized over their estimated useful life. Amortization expense for the three and six months ended June 30, 2014, was approximately $0.5 million and $0.9 million, respectively. Amortization expense for the three and six months ended June 30, 2013, was approximately $0.3 million and $0.7 million, respectively. The remaining unamortized costs relating to internally developed software at June 30, 2014 and December 31, 2013 were approximately $4.6 million and $4.4 million, respectively.
5. | Goodwill and Intangible Assets, net: |
In connection with the Company’s previous business acquisitions, the Company acquired certain tangible and intangible assets. Intangible assets purchased included client and customer relationships, non-compete agreements, trademarks and goodwill. Pursuant to ASC 350, goodwill is not amortized but rather is reviewed at least annually for impairment. During the fourth quarter of 2013, the Company underwent its annual review of goodwill. Based upon the results of this review, which was conducted as of October 1, 2013, no impairment charges to goodwill or the other intangible assets were necessary as of the date of this review. The Company believes that no events have occurred or circumstances have changed that would more likely than not reduce the fair value of a reporting unit below its carrying amount since the review was performed through June 30, 2014, and thereby necessitate further evaluation of goodwill or other intangible assets. The Company expects to perform its next annual goodwill review during the fourth quarter of 2014.
14
PORTFOLIO RECOVERY ASSOCIATES, INC.
NOTES TO CONSOLIDATED FINANCIAL STATEMENTS
(unaudited)
At June 30, 2014 and December 31, 2013, the carrying value of goodwill was $105.1 million and $103.8 million, respectively. The following table represents the changes in goodwill for the three and six months ended June 30, 2014 and 2013 (amounts in thousands):
Three Months Ended June 30, | Six Months Ended June 30, | ||||||||||||||
2014 | 2013 | 2014 | 2013 | ||||||||||||
Balance at beginning of period | $ | 104,086 | $ | 106,912 | $ | 103,843 | $ | 109,488 | |||||||
Foreign currency translation adjustment | 1,036 | 41 | 1,279 | (2,535 | ) | ||||||||||
Balance at end of period | $ | 105,122 | $ | 106,953 | $ | 105,122 | $ | 106,953 | |||||||
Intangible assets, excluding goodwill, consist of the following at June 30, 2014 and December 31, 2013 (amounts in thousands):
June 30, 2014 | December 31, 2013 | ||||||||||||||
Gross Amount | Accumulated Amortization | Gross Amount | Accumulated Amortization | ||||||||||||
Client and customer relationships | $ | 41,212 | $ | 28,558 | $ | 40,870 | $ | 26,581 | |||||||
Non-compete agreements | 3,913 | 3,807 | 3,880 | 3,723 | |||||||||||
Trademarks | 3,526 | 2,481 | 3,491 | 2,170 | |||||||||||
Total | $ | 48,651 | $ | 34,846 | $ | 48,241 | $ | 32,474 | |||||||
Total intangible asset amortization expense for the three and six months ended June 30, 2014 was $1.1 million and $2.2 million, respectively. Total intangible asset amortization expense for the three and six months ended June 30, 2013 was $1.2 million and $2.4 million, respectively. The Company reviews these intangible assets for possible impairment if an event occurs or circumstances change that would more likely than not reduce the fair value of a reporting unit below its carrying amount and thereby necessitate further evaluation of these intangible assets.
6. | Share-Based Compensation: |
The Company has an Omnibus Incentive Plan to assist the Company in attracting and retaining selected individuals to serve as employees and directors, who are expected to contribute to the Company's success and to achieve long-term objectives that will benefit stockholders of the Company. The 2013 Omnibus Incentive Plan (the “Plan”) was approved by the Company's stockholders at the 2013 Annual Meeting of Stockholders. The Plan enables the Company to award shares of the Company's common stock to select employees and directors, as described in the Plan, not to exceed 5,400,000 shares as authorized by the Plan. The Plan replaced the 2010 Stock Plan.
As of June 30, 2014, total future compensation costs related to nonvested awards of nonvested shares (not including nonvested shares granted under the Long-Term Incentive ("LTI") Program) is estimated to be $6.0 million with a weighted average remaining life for all nonvested shares of 1.7 years (not including nonvested shares granted under the LTI program). As of June 30, 2014, there are no future compensation costs related to stock options and there are no remaining vested stock options to be exercised.
Total share-based compensation expense was $2.6 million and $5.4 million for the three and six months ended June 30, 2014, respectively. Total share-based compensation expense was $3.6 million and $6.7 million for the three and six months ended June 30, 2013, respectively. Tax benefits resulting from tax deductions in excess of share-based compensation expense (windfall tax benefits) recognized under the provisions of ASC Topic 718 "Compensation-Stock Compensation" ("ASC 718") are credited to additional paid-in capital in the Company's Consolidated Balance Sheets. Realized tax shortfalls, if any, are first offset against the cumulative balance of windfall tax benefits, if any, and then charged directly to income tax expense. The total tax benefit realized from share-based compensation was approximately $0.3 million and $7.8 million for the three and six months ended June 30, 2014, respectively. The total tax benefit realized from share-based compensation was approximately $0.9 million and $4.9 million for the three and six months ended June 30, 2013, respectively.
All share amounts presented in this Note 6 have been adjusted to reflect the three-for-one stock split by means of a stock dividend declared by the Company's board of directors on June 10, 2013.
15
PORTFOLIO RECOVERY ASSOCIATES, INC.
NOTES TO CONSOLIDATED FINANCIAL STATEMENTS
(unaudited)
Nonvested Shares
With the exception of the awards made pursuant to the LTI program and a few employee and director grants, the nonvested shares vest ratably over three to five years and are expensed over their vesting period.
The following summarizes all nonvested share transactions, excluding those related to the LTI program, from December 31, 2012 through June 30, 2014 (share amounts in thousands):
Nonvested Shares Outstanding | Weighted-Average Price at Grant Date | |||||
December 31, 2012 | 288 | $ | 20.84 | |||
Granted | 110 | 37.31 | ||||
Vested | (143 | ) | 19.75 | |||
Cancelled | (29 | ) | 20.57 | |||
December 31, 2013 | 226 | 29.58 | ||||
Granted | 80 | 49.57 | ||||
Vested | (107 | ) | 28.83 | |||
Cancelled | (2 | ) | 21.90 | |||
June 30, 2014 | 197 | $ | 38.18 | |||
The total grant date fair value of shares vested during the three and six months ended June 30, 2014, was $0.7 million and $3.1 million, respectively. The total grant date fair value of shares vested during the three and six months ended June 30, 2013, was $0.4 million and $2.5 million, respectively.
Pursuant to the Plan, the Compensation Committee may grant time-vested and performance based nonvested shares. All shares granted under the LTI program were granted to key employees of the Company. The following summarizes all LTI program share transactions from December 31, 2012 through June 30, 2014 (share amounts in thousands):
Nonvested LTI Shares Outstanding | Weighted-Average Price at Grant Date | |||||
December 31, 2012 | 497 | $ | 21.71 | |||
Granted at target level | 124 | 34.59 | ||||
Adjustments for actual performance | 108 | 17.91 | ||||
Vested | (279 | ) | 19.10 | |||
Cancelled | (16 | ) | 25.01 | |||
December 31, 2013 | 434 | 25.79 | ||||
Granted at target level | 97 | 48.09 | ||||
Adjustments for actual performance | 95 | 25.17 | ||||
Vested | (225 | ) | 25.17 | |||
June 30, 2014 | 401 | $ | 31.39 | |||
The total grant date fair value of shares vested during the three and six months ended June 30, 2014, was $0.0 million and $5.7 million, respectively. The total grant date fair value of shares vested during the three and six months ended June 30, 2013, was $0.0 million and $2.6 million, respectively.
At June 30, 2014, total future compensation costs, assuming the current estimated performance levels are achieved, related to nonvested share awards granted under the LTI program are estimated to be approximately $7.6 million. The Company assumed a 7.5% forfeiture rate for these grants and the remaining shares have a weighted average life of 1.1 years at June 30, 2014.
7. | Income Taxes: |
The Company follows the guidance of FASB ASC Topic 740 “Income Taxes” (“ASC 740”) as it relates to the provision for income taxes and uncertainty in income taxes. The guidance prescribes a recognition threshold and measurement attribute for the financial statement recognition and measurement of a tax position taken or expected to be taken in a tax return. There were no unrecognized tax benefits at June 30, 2014 and 2013.
16
PORTFOLIO RECOVERY ASSOCIATES, INC.
NOTES TO CONSOLIDATED FINANCIAL STATEMENTS
(unaudited)
The Internal Revenue Service ("IRS") examined the Company's tax returns for the 2005 calendar year. The IRS concluded the audit and on March 19, 2009 issued Form 4549-A, Income Tax Examination Changes, for tax years ended December 31, 2007, 2006 and 2005. The IRS has asserted that tax revenue recognition using the cost recovery method does not clearly reflect taxable income. The Company believes it has sufficient support for the technical merits of its positions and that it is more likely than not these positions will ultimately be sustained; therefore, a reserve for uncertain tax positions is not required. The Company believes cost recovery to be an acceptable tax revenue recognition method for companies in the bad debt purchasing industry. For tax purposes, collections on finance receivables are applied first to principal to reduce the finance receivables to zero before any taxable income is recognized. On April 22, 2009, the Company filed a formal protest of the findings contained in the examination report prepared by the IRS. On August 26, 2011, the IRS issued a Notice of Deficiency for the tax years ended December 31, 2007, 2006, and 2005. The Company subsequently filed a petition in the United States Tax Court to which the IRS responded on January 12, 2012. If the Company is unsuccessful in the United States Tax Court, it can appeal to the federal Circuit Court of Appeals. Payment of the assessed taxes and interest could have an adverse effect on the Company’s financial condition, be material to the Company’s results of operations, and possibly require additional financing from other sources. In accordance with the Internal Revenue Code, underpayments of federal tax accrue interest, compounded daily, at the applicable federal short term rate plus three percentage points. An additional two percentage points applies to large corporate underpayments of $100,000 or more to periods after the applicable date as defined in the Internal Revenue Code. The Company files taxes in multiple state jurisdictions; therefore, any underpayment of state tax will accrue interest in accordance with the respective state statute. On June 30, 2011, the Company was notified by the IRS that the audit period will be expanded to include the tax years ended December 31, 2009 and 2008. On July 7, 2014, the Company received a Notice of Deficiency for tax years ended December 31, 2012, 2011, 2010, 2009 and 2008. The deficiencies relate to cost recovery.
At June 30, 2014, the tax years subject to examination by the major taxing jurisdictions, including the IRS, are 2003, 2005 and subsequent years. The 2003 tax year remains open to examination because of a net operating loss that originated in that year but was not fully utilized until the 2005 tax year. The examination periods for the 2007, 2006 and 2005 tax years were extended through December 31, 2011; however, because the IRS issued the Notice of Deficiency prior to December 31, 2011, the period for assessment is suspended until a decision of the Tax Court becomes final. The statute of limitations for the 2010, 2009 and 2008 tax years has been extended to September 26, 2014.
ASC 740 requires the recognition of interest if the tax law would require interest to be paid on the underpayment of taxes, and recognition of penalties if a tax position does not meet the minimum statutory threshold to avoid payment of penalties. No interest or penalties were accrued or reversed in the three or six months ended June 30, 2014 or 2013.
8. | Earnings per Share: |
Basic earnings per share (“EPS”) are computed by dividing net income available to common stockholders of Portfolio Recovery Associates, Inc. by weighted average common shares outstanding. Diluted EPS are computed using the same components as basic EPS with the denominator adjusted for the dilutive effect of the Notes and nonvested share awards, if dilutive. For the Notes, only the conversion spread is included in the diluted earnings per share calculation, if dilutive. Under such method, the settlement of the conversion spread has a dilutive effect when the average share price of the Company’s common stock during any quarter exceeds $65.72, which did not occur during the period from which the Notes were issued on August 13, 2013 through June 30, 2014. The Notes were not outstanding during the three or six months ended June 30, 2013. Share-based awards that are contingent upon the attainment of performance goals are not included in the computation of diluted EPS until the performance goals have been attained. The dilutive effect of nonvested shares is computed using the treasury stock method, which assumes any proceeds that could be obtained upon the vesting of nonvested shares would be used to purchase common shares at the average market price for the period. The assumed proceeds include the windfall tax benefit that would be realized upon assumed exercise.
17
PORTFOLIO RECOVERY ASSOCIATES, INC.
NOTES TO CONSOLIDATED FINANCIAL STATEMENTS
(unaudited)
The following tables reconcile the computation of basic EPS and diluted EPS for the three and six months ended June 30, 2014 and 2013 (amounts in thousands, except per share amounts):
For the Three Months Ended June 30, | |||||||||||||||||||||
2014 | 2013 | ||||||||||||||||||||
Net Income attributable to Portfolio Recovery Associates, Inc. | Weighted Average Common Shares | EPS | Net Income attributable to Portfolio Recovery Associates, Inc. | Weighted Average Common Shares | EPS | ||||||||||||||||
Basic EPS | $ | 37,507 | 50,065 | $ | 0.75 | $ | 43,599 | 50,751 | $ | 0.86 | |||||||||||
Dilutive effect of nonvested share awards | 372 | 432 | |||||||||||||||||||
Diluted EPS | $ | 37,507 | 50,437 | $ | 0.74 | $ | 43,599 | 51,183 | $ | 0.85 | |||||||||||
For the Six Months Ended June 30, | |||||||||||||||||||||
2014 | 2013 | ||||||||||||||||||||
Net Income attributable to Portfolio Recovery Associates, Inc. | Weighted Average Common Shares | EPS | Net Income attributable to Portfolio Recovery Associates, Inc. | Weighted Average Common Shares | EPS | ||||||||||||||||
Basic EPS | $ | 78,347 | 49,997 | $ | 1.57 | $ | 82,199 | 50,781 | $ | 1.62 | |||||||||||
Dilutive effect of nonvested share awards | 403 | 447 | |||||||||||||||||||
Diluted EPS | $ | 78,347 | 50,400 | $ | 1.55 | $ | 82,199 | 51,228 | $ | 1.60 | |||||||||||
There were no antidilutive options outstanding for the three or six months ended June 30, 2014 and 2013.
9. | Commitments and Contingencies: |
Business Acquisitions:
Aktiv Kapital, A.S.
On July 16, 2014, the Company, through a wholly owned subsidiary, completed the purchase of the outstanding equity of Aktiv, for a purchase price of approximately $872.6 million, and assumed approximately $431.3 million of Aktiv’s corporate debt, resulting in an acquisition of estimated total enterprise value of $1.3 billion. The Company financed the transaction with cash of $217.7 million, $169.9 million in financing from an affiliate of the seller (which bears interest at a variable rate equal to LIBOR plus 3.75% per annum and matures on July 16, 2015), and $485.0 million from the Company’s domestic, revolving credit facility. The Company anticipates total transaction costs of approximately $15 million of which $4.1 million and $8.5 million were incurred during the three and six months ended June 30, 2014, respectively. Additionally, the Company recorded an unrealized foreign currency transaction loss as a result of entering into foreign currency exchange rate forward contracts during the second quarter of 2014 to acquire 518 million Euros in anticipation of closing the acquisition of Aktiv. As a result of the strengthening U.S. dollar relative to the Euro as of June 30, 2014 relative to the period during which the contracts were entered into, an unrealized loss of $6.2 million on the forward contracts was recognized during the quarter. A corresponding liability was recorded and included in Accrued Expenses and Other Liabilities as of June 30, 2014. In the third quarter of 2014, the Company recorded an additional $2.0 million foreign currency transaction loss upon the settlement of these foreign currency exchange rate forward contracts.
Pamplona Capital Management, LLP
On July 1, 2014, the Company acquired certain operating assets from Pamplona Capital Management, LLP ("PCM"). These assets include PCM’s IVA Master Servicing Platform as well as other operating assets associated with PCM’s IVA business. The purchase price of these assets was approximately $5 million and was paid from the Company’s existing cash balances.
Employment Agreements:
The Company has employment agreements, most of which expire on December 31, 2014, with all of its executive officers and with several members of its senior management group. Such agreements provide for base salary payments as well as bonuses
18
PORTFOLIO RECOVERY ASSOCIATES, INC.
NOTES TO CONSOLIDATED FINANCIAL STATEMENTS
(unaudited)
which are based on the attainment of specific management goals. At June 30, 2014, the estimated future compensation under these agreements is approximately $6.4 million. The agreements also contain confidentiality and non-compete provisions.
Leases:
The Company is party to various operating leases with respect to its facilities and equipment. The future minimum lease payments at June 30, 2014 total approximately $31.5 million.
Forward Flow Agreements:
The Company is party to several forward flow agreements that allow for the purchase of defaulted consumer receivables at pre-established prices. The maximum remaining amount to be purchased under forward flow agreements at June 30, 2014 is approximately $159.6 million.
Contingent Purchase Price:
The asset purchase agreement entered into in connection with the acquisition of certain finance receivables and certain operating assets of National Capital Management, LLC ("NCM") in 2012, includes an earn-out provision whereby the sellers are able to earn additional cash consideration for achieving certain cash collection thresholds over a five year period. The maximum amount of earn-out during the period is $15.0 million. The Company paid the year one earn-out during December 2013 in the amount of $6.2 million. As of June 30, 2014, the Company has recorded a present value amount for the expected remaining liability of $4.3 million.
Finance Receivables:
Certain agreements for the purchase of finance receivables portfolios contain provisions that may, in limited circumstances, require the Company to refund a portion or all of the collections subsequently received by the Company on particular accounts. The potential refunds as of the balance sheet date are not considered to be significant.
Litigation:
The Company is from time to time subject to routine legal claims and proceedings, most of which are incidental to the ordinary course of its business. The Company initiates lawsuits against customers and is occasionally countersued by them in such actions. Also, customers, either individually, as members of a class action, or through a governmental entity on behalf of customers, may initiate litigation against the Company in which they allege that the Company has violated a state or federal law in the process of collecting on an account. From time to time, other types of lawsuits are brought against the Company. Additionally, the Company receives subpoenas and other requests or demands for information from regulators or governmental authorities who are investigating the Company's debt collection activities. The Company makes every effort to respond appropriately to such requests.
The Company accrues for potential liability arising from legal proceedings when it is probable that such liability has been incurred and the amount of the loss can be reasonably estimated. This determination is based upon currently available information for those proceedings in which the Company is involved, taking into account the Company's best estimate of such losses for those cases for which such estimates can be made. The Company's estimate involves significant judgment, given the varying stages of the proceedings (including the fact that many of them are currently in preliminary stages), the number of unresolved issues in many of the proceedings (including issues regarding class certification and the scope of many of the claims), and the related uncertainty of the potential outcomes of these proceedings. In making determinations of the likely outcome of pending litigation, the Company considers many factors, including, but not limited to, the nature of the claims, the Company's experience with similar types of claims, the jurisdiction in which the matter is filed, input from outside legal counsel, the likelihood of resolving the matter through alternative mechanisms, the matter's current status and the damages sought or demands made. Accordingly, the Company's estimate will change from time to time, and actual losses could be more than the current estimate.
Subject to the inherent uncertainties involved in such proceedings, the Company believes, based upon its current knowledge and after consultation with counsel, that the legal proceedings currently pending against it, including those that fall outside of the Company's routine legal proceedings, should not, either individually or in the aggregate, have a material adverse impact on the Company's financial condition. However, it is possible in light of the uncertainties involved in such proceedings or due to unexpected future developments, that an unfavorable resolution of a legal proceeding or claim could occur which may be material to the Company's financial condition, results of operations, or cash flows for a particular period.
19
PORTFOLIO RECOVERY ASSOCIATES, INC.
NOTES TO CONSOLIDATED FINANCIAL STATEMENTS
(unaudited)
Excluding the matters described below and other putative class action suits which the Company believes are not material, the high end of the range of potential litigation losses in excess of the amount accrued is estimated by management to be less than $1,000,000 as of June 30, 2014. Notwithstanding our attempt to estimate a range of possible losses in excess of the amount accrued based on current information, actual future losses may exceed both the Company's accrual and the range of potential litigation losses disclosed above.
In certain legal proceedings, the Company may have recourse to insurance or third party contractual indemnities to cover all or portions of its litigation expenses, judgments, or settlements. Loss estimates and accruals for potential liability related to legal proceedings are exclusive of potential recoveries, if any, under the Company's insurance policies or third party indemnities. The Company has not recorded any potential recoveries under the Company's insurance policies or third party indemnities.
The matters described below fall outside of the normal parameters of the Company’s routine legal proceedings.
Telephone Consumer Protection Act Litigation
The Company has been named as defendant in a number of putative class action cases, each alleging that the Company violated the Telephone Consumer Protection Act ("TCPA") by calling consumers' cellular telephones without their prior express consent. On December 21, 2011, the United States Judicial Panel on Multi-District Litigation entered an order transferring these matters into one consolidated proceeding in the United States District Court for the Southern District of California (the "Court"). On November 14, 2012, the putative class plaintiffs filed their amended consolidated complaint in the matter, now styled as In re Portfolio Recovery Associates, LLC Telephone Consumer Protection Act Litigation, case No. 11-md-02295 (the “MDL action”). On May 20, 2014, the Court stayed this litigation until such time as the FCC has ruled on various petitions concerning the TCPA.
Internal Revenue Service Audit
The IRS examined the Company's tax returns for the 2005 calendar year. The IRS concluded the audit and on March 19, 2009 issued Form 4549-A, Income Tax Examination Changes, for tax years ended December 31, 2007, 2006 and 2005. The IRS has asserted that tax revenue recognition using the cost recovery method does not clearly reflect taxable income. The Company believes it has sufficient support for the technical merits of its positions and that it is more likely than not these positions will ultimately be sustained; therefore, a reserve for uncertain tax positions is not required. On April 22, 2009, the Company filed a formal protest of the findings contained in the examination report prepared by the IRS. On August 26, 2011, the IRS issued a Notice of Deficiency for the tax years ended December 31, 2007, 2006, and 2005. The Company subsequently filed a petition in the United States Tax Court to which the IRS responded on January 12, 2012. If the Company is unsuccessful in the United States Tax Court, it can appeal to the federal Circuit Court of Appeals. On July 7, 2014, the IRS issued a Notice of Deficiency for the tax years ended December 31, 2012, 2011, 2010, 2009 and 2008. Refer to Note 7 “Income Taxes” for additional information.
10. | Fair Value Measurements and Disclosures: |
In accordance with the disclosure requirements of FASB ASC Topic 825, “Financial Instruments” (“ASC 825”), the table below summarizes fair value estimates for the Company’s financial instruments. The total of the fair value calculations presented does not represent, and should not be construed to represent, the underlying value of the Company. The carrying amounts in the table are recorded in the Consolidated Balance Sheets at June 30, 2014 and December 31, 2013, under the indicated captions (amounts in thousands):
June 30, 2014 | December 31, 2013 | ||||||||||||||
Carrying Amount | Estimated Fair Value | Carrying Amount | Estimated Fair Value | ||||||||||||
Financial assets: | |||||||||||||||
Cash and cash equivalents | $ | 270,526 | $ | 270,526 | $ | 162,004 | $ | 162,004 | |||||||
Finance receivables, net | 1,219,595 | 1,740,864 | 1,239,191 | 1,722,100 | |||||||||||
Financial liabilities: | |||||||||||||||
Term loans | 190,000 | 190,000 | 195,000 | 195,000 | |||||||||||
Convertible debt | 258,785 | 344,100 | 256,780 | 316,857 | |||||||||||
20
PORTFOLIO RECOVERY ASSOCIATES, INC.
NOTES TO CONSOLIDATED FINANCIAL STATEMENTS
(unaudited)
As of June 30, 2014, and December 31, 2013, the Company did not account for any financial assets or financial liabilities at fair value. As defined by FASB ASC Topic 820, “Fair Value Measurements and Disclosures” (“ASC 820”), fair value is the price that would be received to sell an asset or paid to transfer a liability in an orderly transaction between market participants at the measurement date. ASC 820 also requires the consideration of differing levels of inputs in the determination of fair values. Those levels of input are summarized as follows:
•Level 1 - Quoted prices in active markets for identical assets and liabilities.
• | Level 2 - Observable inputs other than level 1 quoted prices, such as quoted prices for similar instruments in active markets, quoted prices for identical or similar instruments in markets that are not active, and model-based valuation techniques for which all significant assumptions are observable in the market. |
• | Level 3 - Unobservable inputs that are supported by little or no market activity. Level 3 assets and liabilities include financial instruments whose value is determined using pricing models, discounted cash flow methodologies, or similar techniques as well as instruments for which the determination of fair value requires significant management judgment or estimation. |
The level in the fair value hierarchy within which a fair value measurement in its entirety falls is based on the lowest level input that is significant to the fair value measurement in its entirety.
Disclosure of the estimated fair values of financial instruments often requires the use of estimates. The Company uses the following methods and assumptions to estimate the fair value of financial instruments:
Cash and cash equivalents: The carrying amount approximates fair value and quoted prices for identical assets can be found in active markets. Accordingly, the Company estimates the fair value of cash and cash equivalents using level 1 inputs.
Finance receivables, net: The Company records purchased receivables at cost, which represents a significant discount from the contractual receivable balances due. The Company computed the estimated fair value of these receivables using proprietary pricing models that the Company utilizes to make portfolio purchase decisions. Accordingly, the Company's fair value estimates use level 3 inputs as there is little observable market data available and management is required to use significant judgment in its estimates.
Term loans: The carrying amount approximates fair value due to the short-term nature of the interest rate periods and the observable quoted prices for similar instruments in active markets. Accordingly, the Company uses level 2 inputs for its fair value estimates.
Convertible debt: The Notes are carried at historical cost, adjusted for the debt discount. The fair value estimates for these Notes incorporates quoted market prices which were obtained from secondary market broker quotes which were derived from a variety of inputs including client orders, information from their pricing vendors, modeling software, and actual trading prices when they occur. Accordingly, the Company uses level 2 inputs for its fair value estimates.
11. | Recent Accounting Pronouncements: |
In March 2013, the FASB issued ASU 2013-05, "Foreign Currency Matters (Topic 830): Parent's Accounting for the Cumulative Translation Adjustment upon Derecognition of Certain Subsidiaries or Groups of Assets within a Foreign Entity or of an Investment in a Foreign Entity," ("ASU 2013-05") which defines the treatment of the release of cumulative translation adjustments upon derecognition of certain subsidiaries or groups of assets within a foreign entity or of an investment in a foreign entity. ASU 2013-05 is effective for fiscal years, and interim periods within those years, beginning after December 15, 2013. Early adoption is permitted and prior periods should not be adjusted. The Company adopted ASU 2013-05 in the first quarter of 2014 which had no material impact on its Consolidated Financial Statements.
In April 2014, FASB issued ASU 2014-08, "Reporting Discontinued Operations and Disclosures of Disposals of Components of an Entity" (“ASU 2014-08”) that amends the requirements for reporting discontinued operations. ASU 2014-08 requires the disposal of a component of an entity or a group of components of an entity to be reported in discontinued operations if the disposal represents a strategic shift that will have a major effect on the entity’s operations and financial results. ASU 2014-08 also requires additional disclosures about discontinued operations and disclosures about the disposal of a significant component of an entity that does not qualify as a discontinued operation. ASU 2014-08 is effective prospectively for reporting periods beginning after December 15, 2014, with early adoption permitted. The Company is evaluating the potential impacts of the new standard.
21
PORTFOLIO RECOVERY ASSOCIATES, INC.
NOTES TO CONSOLIDATED FINANCIAL STATEMENTS
(unaudited)
In May 2014, FASB issued ASU 2014-09, "Revenue from Contracts with Customers" (“ASU 2014-09”) that updates the principles for recognizing revenue. The core principle of the guidance is that an entity should recognize revenue to depict the transfer of promised goods or services to customers in an amount that reflects the consideration to which the entity expects to be entitled in exchange for those goods or services. ASU 2014-09 also amends the required disclosures of the nature, amount, timing and uncertainty of revenue and cash flows arising from contracts with customers. ASU 2014-09 is effective for fiscal years, and interim periods within those years, beginning after December 15, 2016, and can be adopted either retrospectively to each prior reporting period presented or as a cumulative-effect adjustment as of the date of adoption, with early application not permitted. The Company is evaluating its implementation approach and the potential impacts of the new standard on its existing revenue recognition policies and procedures.
In June 2014, FASB issued ASU 2014-12, "Accounting for Share-Based Payments When the Terms of an Award Provide That a Performance Target Could Be Achieved after the Requisite Service Period" (“ASU 2014-12”). ASU 2014-12 requires that a performance target that affects vesting and that could be achieved after the requisite service period be treated as a performance condition. As such, the performance target should not be reflected in estimating the grant-date fair value of the award. ASU 2014-12 is effective for annual reporting periods beginning after December 15, 2015, with early adoption permitted. The Company is evaluating the potential impacts of the new standard on its existing stock-based compensation awards.
12. | Subsequent Events: |
Aktiv Kapital, A.S. Acquisition
On July 16, 2014, the Company, through a wholly owned subsidiary, completed the purchase of the outstanding equity of Aktiv, for a purchase price of approximately $872.6 million, and assumed approximately $431.3 million of Aktiv’s corporate debt, resulting in an acquisition of estimated total enterprise value of $1.3 billion. The Company financed the transaction with cash of $217.7 million, $169.9 million in financing from an affiliate of the seller, and $485.0 million from the Company’s domestic, revolving credit facility.
The Company incurred transaction costs of approximately $4.1 million and $8.5 million during the three and six months ended June 30, 2014, respectively. The Company anticipates that approximately $6.0 million of additional transaction costs will be incurred, primarily during the third and fourth quarters of 2014. Additionally, the Company recorded an unrealized foreign currency transaction loss as a result of entering into foreign currency exchange rate forward contracts during the second quarter of 2014 to acquire 518 million Euros in anticipation of closing the acquisition of Aktiv. As a result of the strengthening U.S. dollar relative to the Euro as of June 30, 2014 relative to the period during which the contracts were entered into, an unrealized loss of $6.2 million on the forward contracts was recognized during the quarter. A corresponding liability was recorded and included in Accrued Expenses and Other Liabilities as of June 30, 2014. In the third quarter of 2014, the Company recorded an additional $2.0 million foreign currency transaction loss upon the settlement of these foreign currency exchange rate forward contracts.
The Company accounted for this purchase in accordance with ASC Topic 805, “Business Combinations.” Under this guidance, an entity is required to recognize the assets acquired, liabilities assumed and the consideration given at their fair value on the acquisition date. Due to the recency and nature of the transaction, the Company is still in the process of evaluating the purchase price allocations and at the time of the filing of this Form 10-Q, the initial valuation has not been completed. Therefore, it is impractical to estimate and disclose the provisional allocation amounts and the pro forma impact of the acquisition at this time.
Pamplona Capital Management, LLP Acquisition
On July 1, 2014, the Company acquired certain operating assets from PCM. These assets include PCM’s IVA Master Servicing Platform as well as other operating assets associated with PCM’s IVA business. The purchase price of these assets was approximately $5 million and was paid from the Company’s existing cash balances.
22
Item 2. | Management’s Discussion and Analysis of Financial Condition and Results of Operations |
Cautionary Statements Pursuant to Safe Harbor Provisions of the Private Securities Litigation Reform Act of 1995:
This report contains forward-looking statements within the meaning of the federal securities laws. These forward-looking statements involve risks, uncertainties and assumptions that, if they never materialize or prove incorrect, could cause our results to differ materially from those expressed or implied by such forward-looking statements. All statements, other than statements of historical fact, are forward-looking statements, including statements regarding overall trends, gross margin trends, operating cost trends, liquidity and capital needs and other statements of expectations, beliefs, future plans and strategies, anticipated events or trends, and similar expressions concerning matters that are not historical facts. The risks, uncertainties and assumptions referred to above may include the following:
• | a prolonged economic recovery or a deterioration in the economic or inflationary environment in the United States or Europe, including the interest rate environment, may have an adverse effect on our collections, results of operations, revenue and stock price or on the stability of the financial system as a whole; |
• | changes in the credit or capital markets, which affect our ability to borrow money or raise capital; |
• | our ability to integrate the Aktiv business; |
• | our ability to manage risks associated with our international operations, which risks will increase as a result of the Aktiv acquisition; |
• | our ability to recognize the anticipated synergies and benefits of the Aktiv acquisition; |
• | our ability to purchase defaulted consumer receivables at appropriate prices; |
• | our ability to replace our defaulted consumer receivables with additional receivables portfolios; |
• | our ability to obtain accurate and authentic account documents relating to accounts that we acquire and the possibility that documents that we provide could contain errors; |
• | our ability to successfully acquire receivables of new asset types; |
• | our ability to collect sufficient amounts on our defaulted consumer receivables; |
• | changes in tax laws regarding earnings of our subsidiaries located outside of the United States; |
• | changes in bankruptcy or collection laws that could negatively affect our business, including by causing an increase in certain types of bankruptcy filings involving liquidations, which may cause our collections to decrease; |
• | changes in state or federal laws or the administrative practices of various bankruptcy courts, which may impact our ability to collect on our defaulted receivables; |
• | our ability to collect and enforce our finance receivables may be limited under federal and state laws; |
• | our ability to employ and retain qualified employees, especially collection personnel, and our senior management team; |
• | our work force could become unionized in the future, which could adversely affect the stability of our production and increase our costs; |
• | the degree, nature, and resources of our competition; |
• | the possibility that we could incur goodwill or other intangible asset impairment charges; |
• | our ability to retain existing clients and obtain new clients for our fee-for-service businesses; |
• | our ability to comply with existing and new regulations of the collection industry, the failure of which could result in penalties, fines, litigation, damage to our reputation or the suspension or termination of our ability to conduct our business; |
• | changes in governmental laws and regulations which could increase our costs and liabilities or impact our operations; |
• | our ability to adjust to debt collection and debt buying regulations that may be promulgated by the Consumer Financial Protection Bureau ("CFPB") and the regulatory and enforcement activities of the CFPB; |
• | the possibility that new business acquisitions prove unsuccessful or strain or divert our resources; |
• | our ability to maintain, renegotiate or replace our credit facility; |
• | our ability to satisfy the restrictive covenants in our debt agreements; |
• | our ability to manage risks associated with our international operations; |
• | the possibility that compliance with foreign and U.S. laws and regulations that apply to our international operations could increase our cost of doing business in international jurisdictions; |
• | the imposition of additional taxes on us; |
• | changes in interest or exchange rates, which could reduce our net income, and the possibility that future hedging strategies may not be successful, which could adversely affect our results of operations and financial condition, as could our failure to comply with hedge accounting principles and interpretations; |
• | the possibility that we could incur significant allowance charges on our finance receivables; |
• | our loss contingency accruals may not be adequate to cover actual losses; |
• | our ability to manage growth successfully; |
• | the possibility that we could incur business or technology disruptions or cyber incidents, or not adapt to technological advances; |
• | the possibility that we or our industry could experience negative publicity or reputational attacks; and |
• | the risk factors listed from time to time in our filings with the Securities and Exchange Commission (the “SEC”). |
23
You should assume that the information appearing in this quarterly report is accurate only as of the date it was issued. Our business, financial condition, results of operations and prospects may have changed since that date.
For a discussion of the risks, uncertainties and assumptions that could affect our future events, developments or results, you should carefully review the following “Management’s Discussion and Analysis of Financial Condition and Results of Operations,” as well as the discussion of “Business” and “Risk Factors” described in our 2013 Annual Report on Form 10-K, filed on February 28, 2014.
Our forward-looking statements could be wrong in light of these and other risks, uncertainties and assumptions. The future events, developments or results described in this report could turn out to be materially different. Except as required by law, we assume no obligation to publicly update or revise our forward-looking statements after the date of this report and you should not expect us to do so.
Investors should also be aware that while we do, from time to time, communicate with securities analysts and others, we do not, by policy, selectively disclose to them any material nonpublic information or other confidential commercial information. Accordingly, stockholders should not assume that we agree with any statement or report issued by any analyst regardless of the content of the statement or report. We do not, by policy, confirm forecasts or projections issued by others. Thus, to the extent that reports issued by securities analysts contain any projections, forecasts or opinions, such reports are not our responsibility.
Definitions
We use the following terminology throughout this document:
• | “Allowance charges” refers to a reduction in income recognized on finance receivables on pools of finance receivables whose cash collection estimates are not received or projected to not be received. |
• | “Amortization rate” refers to cash collections applied to principal on finance receivables as a percentage of total cash collections. |
• | “Buybacks” refers to purchase price refunded by the seller due to the return of non-compliant accounts. |
• | “Cash collections” refers to collections on our owned portfolios. |
• | “Cash receipts” refers to collections on our owned portfolios plus fee income. |
• | “Core” accounts or portfolios refer to accounts or portfolios that are defaulted consumer receivables and are not in a bankrupt status upon purchase. These accounts are aggregated separately from purchased bankruptcy accounts. Unless otherwise noted, Core accounts do not include the accounts we purchase in the United Kingdom. |
• | “Estimated remaining collections” or "ERC" refers to the sum of all future projected cash collections on our owned portfolios. |
• | “Fee income” refers to revenues generated from our fee-for-service businesses. |
• | “Income recognized on finance receivables” refers to income derived from our owned debt portfolios. |
• | “Income recognized on finance receivables, net” refers to income derived from our owned debt portfolios and is shown net of allowance charges/reversals. |
• | “Net finance receivable balance” is recorded on our balance sheet and refers to the purchase price less principal amortization and net allowance charges/reversals. |
• | “Principal amortization” refers to cash collections applied to principal on finance receivables. |
• | “Purchase price” refers to the cash paid to a seller to acquire defaulted consumer receivables, plus certain capitalized costs, less buybacks. |
• | “Purchase price multiple” refers to the total estimated collections on owned debt portfolios divided by purchase price. |
• | “Purchased bankruptcy” accounts or portfolios refer to accounts or portfolios that are in bankruptcy when we purchase them and as such are purchased as a pool of bankrupt accounts. |
• | “Total estimated collections” refers to the actual cash collections, including cash sales, plus estimated remaining collections. |
Overview
The Company is a financial and business services company. Our primary business is the purchase, collection and management of portfolios of defaulted consumer receivables. We also service receivables on behalf of clients on either a commission or transaction-fee basis and provide class action claims settlement recovery services and related payment processing to corporate clients.
Our industry is highly regulated under various federal laws, including the Fair Debt Collection Practices Act, Fair Credit Reporting Act, Dodd-Frank Wall Street Reform and Consumer Protection Act, Telephone Consumer Protection Act and other federal and state laws. We are subject to inspections, examinations, supervision by regulators in each state in which we are licensed, and also by the CFPB. The CFPB is expected to adopt additional rules that will affect our industry, and has sought feedback on a wide range of debt collection issues. The Company has provided its input and feedback with written comments and through a number of meetings with CFPB staff. The Company is currently engaged in discussions with the CFPB with a view toward
24
adopting certain practices or controls in the conduct of its business. There can be no assurance that new industry regulations or the outcome of these discussions would not have an adverse effect on our business.
On August 4, 2014, the Office of the Comptroller of the Currency (“OCC”) issued risk guidance detailing the principles they expect financial institutions to follow in connection with the sale of consumer debt. The Company is currently in the process of evaluating the impact that this guidance may have on its business, if any.
The Company is headquartered in Norfolk, Virginia, and employs approximately 3,567 team members. The Company's shares of common stock are traded on the NASDAQ Global Select Market under the symbol “PRAA.”
On July 16, 2014, the Company, through a wholly owned subsidiary, completed the purchase of the outstanding equity of Aktiv, a Norway-based company specializing in the acquisition and servicing of non-performing consumer loans throughout Europe and in Canada, for a purchase price of approximately $872.6 million, and assumed approximately $431.3 million of Aktiv’s corporate debt, resulting in an acquisition of estimated total enterprise value of $1.3 billion. The Company financed the acquisition with cash of $217.7 million, $169.9 million in financing from an affiliate of the seller, and $485.0 million from the Company’s domestic, revolving credit facility.
A publicly traded company from 1997 until early 2012 (traded on the Oslo Stock Exchange under the symbol "AIK"), Aktiv has developed a mixed in-house and outsourced collection strategy. It maintains in-house servicing platforms in eight markets, and owns portfolios in fifteen markets. Aktiv has more than 20 years of experience and data in a wide variety of consumer asset classes, across an extensive geographic background. Aktiv has acquired more than 2,000 portfolios, with a face value of more than $38 billion. In 2013, Aktiv collected $318 million on its portfolios and purchased $248 million in new portfolios, up from $222 million in 2012. Aktiv’s total assets were approximately $900 million at December 31, 2013.
This acquisition provided us entry into thirteen new markets, providing us additional geographical diversity in portfolio purchasing and collection. Aktiv's Chief Executive Officer and his executive team and the more than 400 Aktiv employees joined our workforce upon the closing of the transaction.
We anticipate total transaction costs of approximately $15 million. During the first and second quarters of 2014, we incurred approximately $4.4 million and $4.1 million, respectively, of the total estimated transaction costs of $15 million. Additionally, we recorded an unrealized foreign currency transaction loss as a result of us entering into foreign currency exchange rate forward contracts during the second quarter of 2014 to acquire 518 million Euros in anticipation of closing the acquisition of Aktiv. As a result of the strengthening U.S. dollar relative to the Euro as of June 30, 2014 relative to the period during which the contracts were entered into, an unrealized loss of $6.2 million on the forward contracts was recognized during the quarter. A corresponding liability was recorded and included in Accrued Expenses and Other Liabilities as of June 30, 2014. In the third quarter of 2014, we recorded an additional $2.0 million foreign currency transaction loss upon the settlement of these foreign currency exchange rate forward contracts.
Our total borrowings are approximately $1.5 billion after closing the Aktiv acquisition, compared to the Company’s total borrowings of $448.8 million at June 30, 2014.
Earnings Summary
During the second quarter of 2014, net income attributable to the Company was $37.5 million, or $0.74 per diluted share, compared with $43.6 million, or $0.85 per diluted share, in the second quarter of 2013. Total revenue was $197.3 million in the second quarter of 2014, up 7.9% from the second quarter of 2013. Revenues in the second quarter of 2014 consisted of $182.5 million in income recognized on finance receivables, net, and $14.8 million in fee income. Income recognized on finance receivables, net, in the second quarter of 2014 increased $13.9 million, or 8.3%, over the second quarter of 2013, primarily as a result of an increase in cash collections. Cash collections, which drives our finance receivable income, were $319.3 million in the second quarter of 2014, up 7.7%, or $22.9 million, as compared to the second quarter of 2013. During the second quarter of 2014, we incurred $2.3 million in net allowance reversals, compared with $1.2 million of net allowance reversals in the second quarter of 2013. Our performance has been positively impacted by operational efficiencies surrounding the cash collections process, including the continued refinement of account scoring analytics as it relates to both legal and non-legal collection channels. Additionally, we have continued to develop our internal legal collection staff resources, which enables us to place accounts into that channel that otherwise would have been prohibitively expensive for legal action and to collect these accounts more efficiently and profitably.
25
Fee income increased to $14.8 million in the second quarter of 2014 from $14.4 million in the second quarter of 2013, primarily due to higher fee income generated by Claims Compensation Bureau, LLC ("CCB") and PRA Government Services, LLC ("PGS"). This was partially offset by lower fee income generated in the second quarter of 2014 by Mackenzie Hall Holdings, Limited ("PRA UK"), PRA Location Services (“PLS”) and Bankruptcy Services when compared to the second quarter of 2013.
A summary of how our income was generated during the three months ended June 30, 2014 and 2013 is as follows:
For the Three Months Ended June 30, | |||||||
($ in thousands) | 2014 | 2013 | |||||
Cash collections | $ | 319,274 | $ | 296,397 | |||
Amortization of finance receivables | (139,055 | ) | (129,012 | ) | |||
Net allowance reversals | 2,299 | 1,185 | |||||
Finance receivable income | 182,518 | 168,570 | |||||
Fee income | 14,825 | 14,391 | |||||
Total revenue | $ | 197,343 | $ | 182,961 | |||
Operating expenses were $124.9 million in the second quarter of 2014, up 14.4% over the second quarter of 2013, due primarily to increases in compensation expense, legal collection costs, outside fees and services and other operating expenses. Compensation expense increased primarily as a result of larger staff sizes, increases in incentive compensation paid as a result of collector performance and normal pay increases. Compensation and employee services expenses increased as total employees grew 6.1% to 3,567 as of June 30, 2014, from 3,362 as of June 30, 2013. Legal collection costs increased from $22.7 million in the second quarter of 2013 to $25.4 million in the second quarter of 2014, an increase of $2.7 million, or 11.9%. This increase was the result of our continued expansion of the accounts brought into the legal collection process. Outside fees and services expenses increased $3.5 million, or 40.7%, which was mainly attributable to the $4.1 million of transaction costs incurred in the second quarter of 2014 related to the Aktiv acquisition. Other operating expenses increased from $5.7 million in the second quarter of 2013 to $7.7 million in the second quarter of 2014, an increase of $2.0 million, or 35.1%. Of the $2.0 million increase, $0.6 million was due to an increase in provision for doubtful accounts, $0.6 million was due to an increase in taxes, fees and licenses, $0.3 million was due to an increase in general office expenses and $0.3 million was due to an increase in accrued estimated contingent payments related to a previous acquisition. None of the remaining $0.2 million increase was attributable to any significant identifiable items.
During the three months ended June 30, 2014, we acquired defaulted consumer receivables portfolios with an aggregate face value amount of $966.9 million at a cost of $109.2 million. During the three months ended June 30, 2013, we acquired defaulted consumer receivable portfolios with an aggregate face value of $3.19 billion at a cost of $200.5 million. In any period, we acquire defaulted consumer receivables that can vary dramatically in their age, type and ultimate collectability. We may pay significantly different purchase rates for purchased receivables within any period as a result of this quality fluctuation. In addition, market forces can drive pricing rates up or down in any period, irrespective of other quality fluctuations. As a result, the average purchase rate paid for any given period can fluctuate dramatically based on our particular buying activity in that period. However, regardless of the average purchase price and for similar time frames, we intend to target a similar internal rate of return, after direct expenses, in pricing our portfolio acquisitions; therefore, the absolute rate paid is not necessarily relevant to the estimated profitability of a period's buying.
26
Results of Operations
The results of operations include the financial results of the Company and all of our subsidiaries. The following table sets forth certain operating data as a percentage of total revenues for the periods indicated:
For the Three Months Ended June 30, | For the Six Months Ended June 30, | ||||||||||
2014 | 2013 | 2014 | 2013 | ||||||||
Revenues: | |||||||||||
Income recognized on finance receivables, net | 92.5 | % | 92.1 | % | 92.1 | % | 91.7 | % | |||
Fee income | 7.5 | % | 7.9 | % | 7.9 | % | 8.3 | % | |||
Total revenues | 100.0 | % | 100.0 | % | 100.0 | % | 100.0 | % | |||
Operating expenses: | |||||||||||
Compensation and employee services | 26.6 | % | 26.3 | % | 26.5 | % | 26.4 | % | |||
Legal collection fees | 5.8 | % | 5.8 | % | 5.7 | % | 6.0 | % | |||
Legal collection costs | 12.9 | % | 12.4 | % | 13.3 | % | 12.3 | % | |||
Agent fees | 0.7 | % | 0.7 | % | 0.7 | % | 0.8 | % | |||
Outside fees and services | 6.1 | % | 4.7 | % | 5.9 | % | 4.6 | % | |||
Communication expenses | 4.0 | % | 3.6 | % | 4.4 | % | 4.2 | % | |||
Rent and occupancy | 1.1 | % | 1.0 | % | 1.1 | % | 1.0 | % | |||
Depreciation and amortization | 2.1 | % | 1.9 | % | 2.1 | % | 2.0 | % | |||
Other operating expenses | 3.9 | % | 3.1 | % | 3.5 | % | 3.2 | % | |||
Total operating expenses | 63.2 | % | 59.5 | % | 63.2 | % | 60.5 | % | |||
Income from operations | 36.8 | % | 40.4 | % | 36.8 | % | 39.5 | % | |||
Other expense: | |||||||||||
Interest expense | 2.6 | % | 1.6 | % | 2.5 | % | 1.6 | % | |||
Other expense | 3.2 | % | — | % | 1.6 | % | — | % | |||
Income before income taxes | 31.1 | % | 38.8 | % | 32.7 | % | 38.0 | % | |||
Provision for income taxes | 12.0 | % | 15.0 | % | 12.7 | % | 14.8 | % | |||
Net income | 19.0 | % | 23.7 | % | 20.0 | % | 23.2 | % | |||
Adjustment for loss attributable to redeemable noncontrolling interest | — | % | 0.1 | % | — | % | 0.1 | % | |||
Net income attributable to Portfolio Recovery Associates, Inc. | 19.0 | % | 23.8 | % | 20.0 | % | 23.3 | % | |||
Three Months Ended June 30, 2014 Compared To Three Months Ended June 30, 2013
Revenues
Total revenues were $197.3 million for the three months ended June 30, 2014, an increase of $14.3 million, or 7.8%, compared to total revenues of $183.0 million for the three months ended June 30, 2013.
Income Recognized on Finance Receivables, net
Income recognized on finance receivables, net was $182.5 million for the three months ended June 30, 2014, an increase of $13.9 million, or 8.2%, compared to income recognized on finance receivables, net of $168.6 million for the three months ended June 30, 2013. The increase was primarily due to an increase in cash collections on our finance receivables to $319.3 million for the three months ended June 30, 2014, from $296.4 million for the three months ended June 30, 2013, an increase of $22.9 million, or 7.7%. Our finance receivables amortization rate, including net allowance charges, was 42.8% for the three months ended June 30, 2014 compared to 43.1% for the three months ended June 30, 2013.
Accretable yield represents the amount of income recognized on finance receivables the Company can expect to generate over the remaining life of its existing portfolios based on estimated future cash flows as of the balance sheet date. Additions represent the original expected accretable yield, on portfolios purchased during the period, to be earned by the Company based on its proprietary buying models. Net reclassifications from nonaccretable difference to accretable yield primarily result from the Company’s increase in its estimate of future cash flows. Increases in future cash flows may occur as portfolios age and actual cash collections exceed those originally expected. If those cash flows are determined to be incremental to the portfolio’s original forecast, future projections of cash flows are generally increased resulting in higher expected revenue and hence increases in accretable yield. During the three months ended June 30, 2014 and 2013, the Company reclassified amounts from nonaccretable difference to accretable yield due primarily to increased cash collection forecasts relating to pools acquired from 2009-2013. When
27
applicable, net reclassifications to nonaccretable difference from accretable yield result from the Company’s decrease in its estimates of future cash flows and allowance charges that exceed the Company’s increase in its estimate of future cash flows.
Income recognized on finance receivables, net, is shown net of changes in valuation allowances recognized under FASB ASC Topic 310-30 “Loans and Debt Securities Acquired with Deteriorated Credit Quality” (“ASC 310-30”), which requires that a valuation allowance be recorded for significant decreases in expected cash flows or a change in timing of cash flows which would otherwise require a reduction in the stated yield on a pool of accounts. For the three months ended June 30, 2014, we recorded net allowance reversals of $2.3 million. On our Core portfolios, we recorded net allowance reversals of $3.3 million on portfolios purchased between 2005 and 2008, offset by net allowance charges of $0.9 million on portfolios purchased in 2010 and 2011. On our purchased bankruptcy portfolios, we recorded net allowance reversals of $0.4 million on portfolios primarily purchased in 2007 and 2008 offset by a net allowance charge of $0.5 million on Canadian portfolios purchased in 2014. For the three months ended June 30, 2013, we recorded net allowance reversals of $1.2 million, of which a charge of $0.6 million related to purchased bankruptcy portfolios primarily purchased in 2008, offset by reversals of $1.8 million related to Core portfolios purchased between 2005 and 2008.
In any given period, we may be required to record valuation allowances due to pools of receivables underperforming our previous expectations. Factors that may contribute to the recording of valuation allowances may include both internal as well as external factors. External factors which may have an impact on the collectability, and subsequently to the overall profitability, of purchased pools of defaulted consumer receivables include: new laws or regulations relating to collections, new interpretations of existing laws or regulations, and the overall condition of the economy. Internal factors which may have an impact on the collectability, and subsequently the overall profitability, of purchased pools of defaulted consumer receivables would include: necessary revisions to initial and post-acquisition scoring and modeling estimates, non-optimal operational activities (relating to the collection and movement of accounts on both our collection floor and external channels), and decreases in productivity related to turnover of our collection staff.
Fee Income
Fee income increased to $14.8 million for the three months ended June 30, 2014, from $14.4 million for the three months ended June 30, 2013, primarily due to higher fee income generated by CCB and PGS. This was partially offset by lower fee income generated in the second quarter of 2014 by PRA UK, PLS and Bankruptcy Services when compared to the second quarter of 2013.
Income from Operations
Income from operations was $72.5 million for the three months ended June 30, 2014, a decrease of $1.3 million or 1.8% compared to income from operations of $73.8 million for the three months ended June 30, 2013. Income from operations was 36.7% of total revenue for the three months ended June 30, 2014 compared to 40.4% for the three months ended June 30, 2013.
Operating Expenses
Operating expenses were $124.9 million for the three months ended June 30, 2014, an increase of $15.8 million or 14.5% compared to operating expenses of $109.1 million for the three months ended June 30, 2013. Operating expenses were 37.4% of cash receipts for the three months ended June 30, 2014 compared to 35.1% for the three months ended June 30, 2013.
Compensation and Employee Services
Compensation and employee services expenses were $52.5 million for the three months ended June 30, 2014, an increase of $4.3 million, or 8.9%, compared to compensation and employee services expenses of $48.2 million for the three months ended June 30, 2013. Compensation expense increased primarily as a result of larger staff sizes in addition to increases in incentive compensation and normal pay increases. Compensation and employee services expenses increased as total employees grew 6.1% to 3,567 as of June 30, 2014, from 3,362 as of June 30, 2013. Compensation and employee services expenses as a percentage of cash receipts increased to 15.7% for the three months ended June 30, 2014, from 15.5% of cash receipts for the three months ended June 30, 2013.
Legal Collection Fees
Legal collection fees represent contingent fees incurred for the cash collections generated by our independent third party attorney network. Legal collection fees were $11.4 million for the three months ended June 30, 2014, an increase of $0.8 million, or 7.5%, compared to legal collection fees of $10.6 million for the three months ended June 30, 2013. This increase was the result of an increase in cash collections from outside attorneys from $50.1 million in the three months ended June 30, 2013 to $55.0
28
million for the three months ended June 30, 2014, an increase of $4.9 million, or 9.8%. Legal collection fees for both the three months ended June 30, 2014 and 2013 were 3.4% of cash receipts.
Legal Collection Costs
Legal collection costs consist of costs paid to courts where a lawsuit is filed and the cost of documents received from sellers of defaulted consumer receivables. Legal collection costs were $25.4 million for the three months ended June 30, 2014, an increase of $2.7 million, or 11.9%, compared to legal collection costs of $22.7 million for the three months ended June 30, 2013. Since the beginning of 2012, as a result of the refinement of our internal scoring methodology that expanded our account selections for legal action, we expanded the accounts brought into the legal collection process which resulted in significant initial expenses, which we expect to drive additional future cash collections and revenue. Legal collection costs for the three months ended June 30, 2014 were 7.6% of cash receipts, compared to 7.3% for the three months ended June 30, 2013.
Agent Fees
Agent fees primarily represent costs paid to repossession agents to repossess vehicles. Agent fees were $1.5 million and $1.3 million for the three months ended June 30, 2014 and 2013, respectively.
Outside Fees and Services
Outside fees and services expenses were $12.1 million for the three months ended June 30, 2014, an increase of $3.5 million, or 40.7%, compared to outside fees and services expenses of $8.6 million for the three months ended June 30, 2013. The increase was mainly attributable to the $4.1 million of transaction costs incurred in the second quarter of 2014 related to the Aktiv acquisition.
Communication Expenses
Communication expenses were $8.0 million for the three months ended June 30, 2014, an increase of $1.3 million, or 19.4%, compared to communications expenses of $6.7 million for the three months ended June 30, 2013. The increase was primarily due to additional postage expense resulting from an increase in special collection letter campaigns as well as a larger customer base. The remaining increase was attributable to higher telephone expenses. Expenses related to customer mailings were responsible for 69.2%, or $0.9 million, of this increase, and the remaining 30.8%, or $0.4 million, was attributable to increases in telephone related charges.
Rent and Occupancy
Rent and occupancy expenses were $2.2 million for the three months ended June 30, 2014, an increase of $0.4 million, or 22.2%, compared to rent and occupancy expenses of $1.8 million for the three months ended June 30, 2013. The increase was primarily due to the additional space leased at our Norfolk headquarters during the second half of 2013 and the additional space leased as a result of the opening of our Texas call center in December of 2013.
Depreciation and Amortization
Depreciation and amortization expenses were $4.2 million for the three months ended June 30, 2014, an increase of $0.7 million, or 20.0%, compared to depreciation and amortization expenses of $3.5 million for the three months ended June 30, 2013. The increase was primarily due to a large investment in capital expenditures resulting from the additional space leased at our Norfolk headquarters during the second half of 2013, additional space leased as a result of the opening of our Texas call center in December of 2013, and the relocation of our PGS Birmingham operations in March of 2014.
Other Operating Expenses
Other operating expenses were $7.7 million for the three months ended June 30, 2014, an increase of $2.0 million, or 35.1%, compared to other operating expenses of $5.7 million for the three months ended June 30, 2013. Of the $2.0 million increase, $0.6 million was due to an increase in provision for doubtful accounts, $0.6 million was due to an increase in taxes, fees and licenses, $0.3 million was due to an increase in general office expenses and $0.3 million was due to an increase in accrued estimated contingent payments related to a previous acquisition. None of the remaining $0.2 million increase was attributable to any significant identifiable items.
Interest Expense
Interest expense was $5.1 million and $2.9 million for the three months ended June 30, 2014 and 2013, respectively. The increase was primarily due to the completion on August 13, 2013, through a private offering of $287.5 million in aggregate principal amount of the Company’s 3.00% Convertible Senior Notes due 2020, offset by a decrease in average borrowings under our variable
29
rate credit facility for the three months ended June 30, 2014 compared to the same prior year period. The average borrowings on our variable rate credit facility were $192.5 million and $398.7 million for the three months ended June 30, 2014 and 2013, respectively.
Other Expense
Other expense was $6.2 million and $0.0 million for the three months ended June 30, 2014 and 2013, respectively. This increase was the result of a $6.2 million foreign currency transaction loss incurred as a result of us entering into foreign currency exchange rate forward contracts to acquire 518 million Euros in anticipation of closing the acquisition of Aktiv. As a result of the strengthening U.S. dollar relative to the Euro, an unrealized loss on the forward contracts was recognized in the second quarter of 2014.
Provision for Income Taxes
Provision for income taxes was $23.7 million for the three months ended June 30, 2014, a decrease of $3.8 million, or 13.8%, compared to provision for income taxes of $27.5 million for the three months ended June 30, 2013. The decrease is primarily due to a decrease of 13.7% in income before taxes for the three months ended June 30, 2014, compared to the three months ended June 30, 2013. During the three months ended June 30, 2014 and 2013, our effective tax rate remained relatively consistent at 38.7% and 38.8%, respectively.
Six Months Ended June 30, 2014 Compared To Six Months Ended June 30, 2013
Revenues
Total revenues were $391.3 million for the six months ended June 30, 2014, an increase of $38.8 million, or 11.0%, compared to total revenues of $352.5 million for the six months ended June 30, 2013.
Income Recognized on Finance Receivables, net
Income recognized on finance receivables, net was $360.5 million for the six months ended June 30, 2014, an increase of $37.1 million, or 11.5%, compared to income recognized on finance receivables, net of $323.4 million for the six months ended June 30, 2013. The increase was primarily due to an increase in cash collections on our finance receivables to $632.6 million for the six months ended June 30, 2014, from $571.9 million for the six months ended June 30, 2013, an increase of $60.7 million, or 10.6%. Our finance receivables amortization rate, including net allowance charges, was 43.0% for the six months ended June 30, 2014 compared to 43.5% for the six months ended June 30, 2013.
Accretable yield represents the amount of income recognized on finance receivables the Company can expect to generate over the remaining life of its existing portfolios based on estimated future cash flows as of the balance sheet date. Additions represent the original expected accretable yield, on portfolios purchased during the period, to be earned by the Company based on its proprietary buying models. Net reclassifications from nonaccretable difference to accretable yield primarily result from the Company’s increase in its estimate of future cash flows. Increases in future cash flows may occur as portfolios age and actual cash collections exceed those originally expected. If those cash flows are determined to be incremental to the portfolio’s original forecast, future projections of cash flows are generally increased resulting in higher expected revenue and hence increases in accretable yield. During the six months ended June 30, 2014 and 2013, the Company reclassified amounts from nonaccretable difference to accretable yield due primarily to increased cash collection forecasts relating to pools acquired from 2009-2013. When applicable, net reclassifications to nonaccretable difference from accretable yield result from the Company’s decrease in its estimates of future cash flows and allowance charges that exceed the Company’s increase in its estimate of future cash flows.
Income recognized on finance receivables, net, is shown net of changes in valuation allowances recognized under ASC 310-30, which requires that a valuation allowance be recorded for significant decreases in expected cash flows or a change in timing of cash flows which would otherwise require a reduction in the stated yield on a pool of accounts. For the six months ended June 30, 2014, we recorded net allowance reversals of $4.3 million. On our Core portfolios, we recorded net allowance reversals of $6.4 million on portfolios purchased between 2005 and 2008, offset by net allowance charges of $1.8 million on portfolios purchased in 2010 and 2011. On our purchased bankruptcy portfolios, we recorded net allowance reversals of $0.6 million on portfolios primarily purchased in 2007 and 2008, offset by net allowance charges of $0.5 million on Canadian portfolios purchased in 2014. We also recorded a net allowance charge of $0.5 million on our UK portfolios purchased in 2012. For the six months ended June 30, 2013, we recorded net allowance charges of $1.0 million, of which $5.1 million related to purchased bankruptcy portfolios primarily purchased in 2007 and 2008, offset by reversals of $4.1 million related to Core portfolios primarily purchased in 2005 and 2008.
30
In any given period, we may be required to record valuation allowances due to pools of receivables underperforming our previous expectations. Factors that may contribute to the recording of valuation allowances may include both internal as well as external factors. External factors which may have an impact on the collectability, and subsequently to the overall profitability, of purchased pools of defaulted consumer receivables include: new laws or regulations relating to collections, new interpretations of existing laws or regulations, and the overall condition of the economy. Internal factors which may have an impact on the collectability, and subsequently the overall profitability, of purchased pools of defaulted consumer receivables would include: necessary revisions to initial and post-acquisition scoring and modeling estimates, non-optimal operational activities (relating to the collection and movement of accounts on both our collection floor and external channels), and decreases in productivity related to turnover of our collection staff.
Fee Income
Fee income increased to $30.8 million for the six months ended June 30, 2014, from $29.2 million for the six months ended June 30, 2013, primarily due to higher fee income generated by CCB and PGS. This was partially offset by lower fee income generated in the first half of 2014 by PRA UK, PLS and Bankruptcy Services when compared to the prior year period.
Income from Operations
Income from operations was $144.1 million for the six months ended June 30, 2014, an increase of $4.4 million or 3.2% compared to income from operations of $139.7 million for the six months ended June 30, 2013. Income from operations was 36.8% of total revenue for the six months ended June 30, 2014 compared to 39.6% for the six months ended June 30, 2013.
Operating Expenses
Operating expenses were $247.2 million for the six months ended June 30, 2014, an increase of $34.4 million or 16.2% compared to operating expenses of $212.8 million for the six months ended June 30, 2013. Operating expenses were 37.3% of cash receipts for the six months ended June 30, 2014 compared to 35.4% for the six months ended June 30, 2013.
Compensation and Employee Services
Compensation and employee services expenses were $103.8 million for the six months ended June 30, 2014, an increase of $10.6 million, or 11.4%, compared to compensation and employee services expenses of $93.2 million for six months ended June 30, 2013. Compensation expense increased primarily as a result of larger staff sizes in addition to increases in incentive compensation and normal pay increases. Compensation and employee services expenses increased as total employees grew 6.1% to 3,567 as of June 30, 2014, from 3,362 as of June 30, 2013. Compensation and employee services expenses as a percentage of cash receipts increased to 15.7% for the six months ended June 30, 2014, from 15.5% of cash receipts for the six months ended June 30, 2013.
Legal Collection Fees
Legal collection fees represent contingent fees incurred for the cash collections generated by our independent third party attorney network. Legal collection fees were $22.2 million for the six months ended June 30, 2014, an increase of $1.1 million, or 5.2%, compared to legal collection fees of $21.1 million for the six months ended June 30, 2013. This increase was the result of an increase in cash collections from outside attorneys from $98.0 million in the six months ended June 30, 2013 to $106.0 million for the six months ended June 30, 2014, an increase of $8.0 million, or 8.2%. Legal collection fees for the six months ended June 30, 2014 were 3.3% of cash receipts, compared to 3.5% for the six months ended June 30, 2013.
Legal Collection Costs
Legal collection costs consist of costs paid to courts where a lawsuit is filed and the cost of documents received from sellers of defaulted consumer receivables. Legal collection costs were $52.0 million for the six months ended June 30, 2014, an increase of $8.8 million, or 20.4%, compared to legal collection costs of $43.2 million for the six months ended June 30, 2013. Since the beginning of 2012, as a result of the refinement of our internal scoring methodology that expanded our account selections for legal action, we expanded the accounts brought into the legal collection process which resulted in significant initial expenses, which we expect to drive additional future cash collections and revenue. Legal collection costs for the six months ended June 30, 2014 were 7.8% of cash receipts, compared to 7.2% for the six months ended June 30, 2013.
Agent Fees
Agent fees primarily represent costs paid to repossession agents to repossess vehicles. Agent fees were $2.9 million for both the six months ended June 30, 2014 and 2013.
31
Outside Fees and Services
Outside fees and services expenses were $22.9 million for the six months ended June 30, 2014, an increase of $6.8 million, or 42.2%, compared to outside fees and services expenses of $16.1 million for the six months ended June 30, 2013. The increase was mainly attributable to the $8.5 million of transaction costs incurred in the first half of 2014 related to the Aktiv acquisition.
Communication Expenses
Communication expenses were $17.1 million for the six months ended June 30, 2014, an increase of $2.3 million, or 15.5%, compared to communications expenses of $14.8 million for the six months ended June 30, 2013. The increase was primarily due to additional postage expense resulting from an increase in special collection letter campaigns as well as a larger customer base. The remaining increase was attributable to higher telephone expenses. Expenses related to customer mailings were responsible for 60.9%, or $1.4 million, of this increase, and the remaining 39.1%, or $0.9 million, was attributable to increases in telephone related charges.
Rent and Occupancy
Rent and occupancy expenses were $4.4 million for the six months ended June 30, 2014, an increase of $0.9 million, or 25.7%, compared to rent and occupancy expenses of $3.5 million for the six months ended June 30, 2013. The increase was primarily due to the additional space leased at our Norfolk headquarters during the second half of 2013 and the additional space leased as a result of the opening of our Texas call center in December of 2013.
Depreciation and Amortization
Depreciation and amortization expenses were $8.2 million for the six months ended June 30, 2014, an increase of $1.3 million, or 18.8%, compared to depreciation and amortization expenses of $6.9 million for the six months ended June 30, 2013. The increase was primarily due to a large investment in capital expenditures resulting from the additional space leased at our Norfolk headquarters during the second half of 2013 and the additional space leased as a result of the opening of our Texas call center in December of 2013.
Other Operating Expenses
Other operating expenses were $13.7 million for the six months ended June 30, 2014, an increase of $2.6 million, or 23.4%, compared to other operating expenses of $11.1 million for the six months ended June 30, 2013. Of the $2.6 million increase, $0.7 million was due to an increase in taxes, fees and licenses; $0.7 million was due to an increase in general office expenses; $0.7 million was due to an increase in repairs and maintenance; $0.5 million was due to an increase in provision for doubtful accounts; and $0.5 million was due to an increase in insurance expenses. This was offset by a decrease of $0.6 million in accrued estimated contingent payments related to a previous acquisition. None of the remaining $0.1 million increase was attributable to any significant identifiable items.
Interest Expense
Interest expense was $9.9 million and $5.6 million for the six months ended June 30, 2014 and 2013, respectively. The increase was primarily due to the completion on August 13, 2013, through a private offering of $287.5 million in aggregate principal amount of the Company’s 3.00% Convertible Senior Notes due 2020, offset by a decrease in average borrowings under our variable rate credit facility for the six months ended June 30, 2014 compared to the same prior year period. The average borrowings on our variable rate credit facility were $193.7 million and $379.3 million for the six months ended June 30, 2014 and 2013, respectively.
Other Expense
Other expense was $6.2 million and $0.0 million for the six months ended June 30, 2014 and 2013, respectively. This increase was the result of a $6.2 million foreign currency transaction loss incurred as a result of us entering into foreign currency exchange rate forward contracts to acquire 518 million Euros in anticipation of closing the acquisition of Aktiv. As a result of the strengthening U.S. dollar relative to the Euro, an unrealized loss on the forward contracts was recognized in the second quarter of 2014.
Provision for Income Taxes
Provision for income taxes was $49.6 million for the six months ended June 30, 2014, a decrease of $2.6 million, or 5.0%, compared to provision for income taxes of $52.2 million for the six months ended June 30, 2013. The decrease is primarily due to a decrease of 4.6% in income before taxes for the six months ended June 30, 2014, compared to the six months ended June 30, 2013. During the six months ended June 30, 2014 and 2013, our effective tax rate remained relatively consistent at 38.8% and 38.9%, respectively.
32
Supplemental Performance Data
Domestic Finance Receivables Portfolio Performance:
The following tables show certain data related to our domestic finance receivables portfolio. These tables describe the purchase price, actual cash collections and future estimates of cash collections, income recognized on finance receivables (gross and net of allowance charges/(reversals)), principal amortization, allowance charges/(reversals), net finance receivable balances, and the ratio of total estimated collections to purchase price (which we refer to as purchase price multiple).
Further, these tables disclose our entire domestic portfolio, as well as its subsets: the portfolio of purchased bankrupt accounts and our Core portfolio. The accounts represented in the purchased bankruptcy tables are those portfolios of accounts that were bankrupt at the time of purchase. This contrasts with accounts that file for bankruptcy after we purchase them, which continue to be tracked in their corresponding Core portfolio. Core customers sometimes file for bankruptcy protection subsequent to our purchase of the related Core portfolio. When this occurs, we adjust our collection practices accordingly to comply with bankruptcy procedures; however, for accounting purposes, these accounts remain in the related Core portfolio. Conversely, bankrupt accounts may be dismissed voluntarily or involuntarily subsequent to our purchase of the related bankrupt portfolio. Dismissal occurs when the terms of the bankruptcy are not met by the petitioner. When this occurs, we are typically free to pursue collection outside of bankruptcy procedures; however, for accounting purposes, these accounts remain in the related bankruptcy pool.
Our United Kingdom and Canadian portfolios are not included in these tables.
Purchase price multiples can vary over time due to a variety of factors including pricing competition, supply levels, age of the receivables purchased, and changes in our operational efficiency. For example, increased pricing competition during the 2005 to 2008 period negatively impacted purchase price multiples of our Core portfolio compared to prior years. During the 2009 to 2010 period, for example, pricing disruptions occurred as a result of the economic downturn. This created unique and advantageous purchasing opportunities, particularly within the bankruptcy receivables market, relative to the prior four years.
When competition increases and/or supply decreases, pricing often becomes negatively impacted relative to expected collections, and yields tend to trend lower. The opposite tends to occur when competition decreases and/or supply increases.
Purchase price multiples can also vary among types of finance receivables. For example, we incur lower collection costs on our bankruptcy portfolio compared with our Core portfolio. This allows us in general to pay more for a bankruptcy portfolio, experience lower purchase price multiples, and yet generate similar internal rates of return when compared with a Core portfolio.
Within a given portfolio type, to the extent that lower purchase price multiples are the result of more competitive pricing and lower yields, this will generally lead to higher amortization rates (payments applied to principal as a percentage of cash collections) and lower profitability. As portfolio pricing becomes more favorable on a relative basis, our profitability will tend to increase. Profitability within given Core portfolio types may also be impacted by the age and quality of the receivables, which impact the cost to collect those accounts.
The numbers presented in the following tables represent gross cash collections and do not reflect any costs to collect; therefore, they may not represent relative profitability. We continue to make enhancements to our analytical abilities, with the intent to collect more cash at a lower cost. To the extent we can improve our collection operations by collecting additional cash from a discrete quantity and quality of accounts, and/or by collecting cash at a lower cost structure, we can positively impact profitability.
Additionally, purchase price multiples can vary among periods due to our implementation of required accounting standards. Revenue recognition under ASC 310-30 is driven by estimates of total collections as well as the timing of those collections. We record new portfolio purchases using a higher confidence level for both estimated collection amounts and timing. Subsequent to the initial booking, as we gain collection experience and confidence with a pool of accounts, we continuously update ERC. These processes, along with the aforementioned operational enhancements, have tended to cause the ratio of ERC to purchase price for any given year of buying to gradually increase over time. As a result, our estimate of total collections to purchase price has generally, but not always, increased as pools have aged. Thus, all factors being equal in terms of pricing, one would typically tend to see a higher collection to purchase price ratio from a pool of accounts that was six years from purchase than say a pool that was just two years from purchase.
Due to all the factors described above, readers should be cautious when making comparisons of purchase price multiples among periods and between types of receivables.
33
Domestic Portfolio Data – Life-to-Date
Entire Domestic Portfolio
Inception through June 30, 2014 | As of June 30, 2014 | ||||||||||||||||||||||||||||
($ in thousands) | Actual Cash Collections Including Cash Sales | Income Recognized on Finance Receivables (1) | Principal Amortization | Allowance Charges | Income Recognized on Finance Receivables, Net (1) | Net Finance Receivables Balance | Estimated Remaining Collections | Total Estimated Collections | Total Estimated Collections to Purchase Price | ||||||||||||||||||||
Purchase Period | Purchase Price | ||||||||||||||||||||||||||||
1996 | $ | 3,080 | $ | 10,214 | $ | 7,134 | $ | 3,080 | $ | — | $ | 7,134 | $ | — | $ | 13 | $ | 10,227 | 332% | ||||||||||
1997 | 7,685 | 25,534 | 17,849 | 7,685 | — | 17,849 | — | 58 | 25,592 | 333% | |||||||||||||||||||
1998 | 11,089 | 37,426 | 26,337 | 11,089 | — | 26,337 | — | 208 | 37,634 | 339% | |||||||||||||||||||
1999 | 18,898 | 69,495 | 50,597 | 18,898 | — | 50,597 | — | 271 | 69,766 | 369% | |||||||||||||||||||
2000 | 25,020 | 117,130 | 92,110 | 25,020 | — | 92,110 | — | 1,419 | 118,549 | 474% | |||||||||||||||||||
2001 | 33,481 | 176,789 | 143,308 | 33,481 | — | 143,308 | — | 2,132 | 178,921 | 534% | |||||||||||||||||||
2002 | 42,325 | 199,971 | 157,646 | 42,325 | — | 157,646 | — | 4,245 | 204,216 | 482% | |||||||||||||||||||
2003 | 61,447 | 267,451 | 206,004 | 61,447 | — | 206,004 | — | 6,283 | 273,734 | 445% | |||||||||||||||||||
2004 | 59,176 | 200,122 | 142,146 | 57,976 | 1,200 | 140,946 | — | 6,421 | 206,543 | 349% | |||||||||||||||||||
2005 | 143,167 | 314,819 | 186,524 | 128,295 | 9,045 | 177,479 | 5,826 | 16,732 | 331,551 | 232% | |||||||||||||||||||
2006 | 107,666 | 211,770 | 129,083 | 82,687 | 18,965 | 110,118 | 6,013 | 16,410 | 228,180 | 212% | |||||||||||||||||||
2007 | 258,364 | 489,963 | 269,010 | 220,953 | 19,215 | 249,795 | 18,192 | 51,776 | 541,739 | 210% | |||||||||||||||||||
2008 | 275,114 | 486,888 | 267,547 | 219,341 | 33,545 | 234,002 | 22,193 | 50,474 | 537,362 | 195% | |||||||||||||||||||
2009 | 281,313 | 803,271 | 537,898 | 265,373 | — | 537,898 | 15,940 | 118,618 | 921,889 | 328% | |||||||||||||||||||
2010 | 357,767 | 829,401 | 529,805 | 299,596 | 1,690 | 528,115 | 56,506 | 232,404 | 1,061,805 | 297% | |||||||||||||||||||
2011 | 392,778 | 658,407 | 390,315 | 268,092 | 450 | 389,865 | 124,237 | 381,165 | 1,039,572 | 265% | |||||||||||||||||||
2012 | 508,426 | 483,553 | 243,199 | 240,354 | — | 243,199 | 268,072 | 552,456 | 1,036,009 | 204% | |||||||||||||||||||
2013 | 621,545 | 324,169 | 155,109 | 169,060 | — | 155,109 | 453,419 | 834,852 | 1,159,021 | 186% | |||||||||||||||||||
YTD 2014 | 253,011 | 32,552 | 13,719 | 18,833 | — | 13,719 | 234,218 | 401,885 | 434,437 | 172% | |||||||||||||||||||
Total | $ | 3,461,352 | $ | 5,738,925 | $ | 3,565,340 | $ | 2,173,585 | $ | 84,110 | $ | 3,481,230 | $ | 1,204,616 | $ | 2,677,822 | $ | 8,416,747 | 243% | ||||||||||
(1) | For purposes of the this table, income recognized on finance receivables also includes approximately $1.7 million in gains on sales of finance receivables acquired between 1996 and 2001 and sold between 1999 and 2002. |
Purchased Bankruptcy Portfolio
Inception through June 30, 2014 | As of June 30, 2014 | ||||||||||||||||||||||||||||
($ in thousands) | Actual Cash Collections Including Cash Sales | Income Recognized on Finance Receivables | Principal Amortization | Allowance Charges | Income Recognized on Finance Receivables, Net | Net Finance Receivables Balance | Estimated Remaining Collections | Total Estimated Collections | Total Estimated Collections to Purchase Price | ||||||||||||||||||||
Purchase Period | Purchase Price | ||||||||||||||||||||||||||||
1996- 2003 | $ | — | $ | — | $ | — | $ | — | $ | — | $ | — | $ | — | $ | — | $ | — | —% | ||||||||||
2004 | 7,468 | 14,538 | 8,269 | 6,269 | 1,200 | 7,069 | — | 60 | 14,598 | 195% | |||||||||||||||||||
2005 | 29,301 | 43,699 | 14,793 | 28,906 | 370 | 14,423 | 26 | 95 | 43,794 | 149% | |||||||||||||||||||
2006 | 17,627 | 31,716 | 14,892 | 16,824 | 750 | 14,142 | 52 | 197 | 31,913 | 181% | |||||||||||||||||||
2007 | 78,526 | 104,523 | 35,701 | 68,822 | 9,385 | 26,316 | 319 | 1,585 | 106,108 | 135% | |||||||||||||||||||
2008 | 108,584 | 165,351 | 71,443 | 93,908 | 13,150 | 58,293 | 1,525 | 3,747 | 169,098 | 156% | |||||||||||||||||||
2009 | 156,027 | 442,339 | 288,084 | 154,255 | — | 288,084 | 1,771 | 38,516 | 480,855 | 308% | |||||||||||||||||||
2010 | 209,160 | 445,475 | 265,757 | 179,718 | — | 265,757 | 29,442 | 90,572 | 536,047 | 256% | |||||||||||||||||||
2011 | 181,784 | 208,701 | 91,630 | 117,071 | — | 91,630 | 64,713 | 117,697 | 326,398 | 180% | |||||||||||||||||||
2012 | 252,363 | 170,889 | 56,324 | 114,565 | — | 56,324 | 137,798 | 177,121 | 348,010 | 138% | |||||||||||||||||||
2013 | 229,189 | 93,104 | 28,618 | 64,486 | — | 28,618 | 164,703 | 210,702 | 303,806 | 133% | |||||||||||||||||||
YTD 2014 | 81,587 | 14,412 | 2,763 | 11,649 | — | 2,763 | 69,938 | 89,114 | 103,526 | 127% | |||||||||||||||||||
Total | $ | 1,351,616 | $ | 1,734,747 | $ | 878,274 | $ | 856,473 | $ | 24,855 | $ | 853,419 | $ | 470,287 | $ | 729,406 | $ | 2,464,153 | 182% | ||||||||||
34
Core Portfolio
Inception through June 30, 2014 | As of June 30, 2014 | ||||||||||||||||||||||||||||
($ in thousands) | Actual Cash Collections Including Cash Sales | Income Recognized on Finance Receivables (1) | Principal Amortization | Allowance Charges | Income Recognized on Finance Receivables, Net (1) | Net Finance Receivables Balance | Estimated Remaining Collections | Total Estimated Collections | Total Estimated Collections to Purchase Price | ||||||||||||||||||||
Purchase Period | Purchase Price | ||||||||||||||||||||||||||||
1996 | $ | 3,080 | $ | 10,214 | $ | 7,134 | $ | 3,080 | $ | — | $ | 7,134 | $ | — | $ | 13 | $ | 10,227 | 332% | ||||||||||
1997 | 7,685 | 25,534 | 17,849 | 7,685 | — | 17,849 | — | 58 | 25,592 | 333% | |||||||||||||||||||
1998 | 11,089 | 37,426 | 26,337 | 11,089 | — | 26,337 | — | 208 | 37,634 | 339% | |||||||||||||||||||
1999 | 18,898 | 69,495 | 50,597 | 18,898 | — | 50,597 | — | 271 | 69,766 | 369% | |||||||||||||||||||
2000 | 25,020 | 117,130 | 92,110 | 25,020 | — | 92,110 | — | 1,419 | 118,549 | 474% | |||||||||||||||||||
2001 | 33,481 | 176,789 | 143,308 | 33,481 | — | 143,308 | — | 2,132 | 178,921 | 534% | |||||||||||||||||||
2002 | 42,325 | 199,971 | 157,646 | 42,325 | — | 157,646 | — | 4,245 | 204,216 | 482% | |||||||||||||||||||
2003 | 61,447 | 267,451 | 206,004 | 61,447 | — | 206,004 | — | 6,283 | 273,734 | 445% | |||||||||||||||||||
2004 | 51,708 | 185,584 | 133,876 | 51,708 | — | 133,876 | — | 6,361 | 191,945 | 371% | |||||||||||||||||||
2005 | 113,866 | 271,120 | 171,731 | 99,389 | 8,675 | 163,056 | 5,800 | 16,637 | 287,757 | 253% | |||||||||||||||||||
2006 | 90,039 | 180,054 | 114,191 | 65,863 | 18,215 | 95,976 | 5,961 | 16,213 | 196,267 | 218% | |||||||||||||||||||
2007 | 179,838 | 385,440 | 233,309 | 152,131 | 9,830 | 223,479 | 17,873 | 50,191 | 435,631 | 242% | |||||||||||||||||||
2008 | 166,530 | 321,537 | 196,104 | 125,433 | 20,395 | 175,709 | 20,668 | 46,727 | 368,264 | 221% | |||||||||||||||||||
2009 | 125,286 | 360,932 | 249,814 | 111,118 | — | 249,814 | 14,169 | 80,102 | 441,034 | 352% | |||||||||||||||||||
2010 | 148,607 | 383,926 | 264,048 | 119,878 | 1,690 | 262,358 | 27,064 | 141,832 | 525,758 | 354% | |||||||||||||||||||
2011 | 210,994 | 449,706 | 298,685 | 151,021 | 450 | 298,235 | 59,524 | 263,468 | 713,174 | 338% | |||||||||||||||||||
2012 | 256,063 | 312,664 | 186,875 | 125,789 | — | 186,875 | 130,274 | 375,335 | 687,999 | 269% | |||||||||||||||||||
2013 | 392,356 | 231,065 | 126,491 | 104,574 | — | 126,491 | 288,716 | 624,150 | 855,215 | 218% | |||||||||||||||||||
YTD 2014 | 171,424 | 18,140 | 10,956 | 7,184 | — | 10,956 | 164,280 | 312,771 | 330,911 | 193% | |||||||||||||||||||
Total | $ | 2,109,736 | $ | 4,004,178 | $ | 2,687,065 | $ | 1,317,113 | $ | 59,255 | $ | 2,627,810 | $ | 734,329 | $ | 1,948,416 | $ | 5,952,594 | 282% | ||||||||||
(1) | For purposes of the this table, income recognized on finance receivables also includes approximately $1.7 million in gains on sales of finance receivables acquired between 1996 and 2001 and sold between 1999 and 2002. |
Domestic Portfolio Data – Year to Date
Entire Domestic Portfolio
Year to Date June 30, 2014 | As of June 30, 2014 | ||||||||||||||||||||||||||||
($ in thousands) | Actual Cash Collections Including Cash Sales | Income Recognized on Finance Receivables | Principal Amortization | Allowance Charges | Income Recognized on Finance Receivables, Net | Net Finance Receivables Balance | Estimated Remaining Collections | Total Estimated Collections | Total Estimated Collections to Purchase Price | ||||||||||||||||||||
Purchase Period | Purchase Price | ||||||||||||||||||||||||||||
1996 | $ | 3,080 | $ | 6 | $ | 6 | $ | — | $ | — | $ | 6 | $ | — | $ | 13 | $ | 10,227 | 332% | ||||||||||
1997 | 7,685 | 28 | 28 | — | — | 28 | — | 58 | 25,592 | 333% | |||||||||||||||||||
1998 | 11,089 | 75 | 75 | — | — | 75 | — | 208 | 37,634 | 339% | |||||||||||||||||||
1999 | 18,898 | 140 | 140 | — | — | 140 | — | 271 | 69,766 | 369% | |||||||||||||||||||
2000 | 25,020 | 465 | 465 | — | — | 465 | — | 1,419 | 118,549 | 474% | |||||||||||||||||||
2001 | 33,481 | 882 | 882 | — | — | 882 | — | 2,132 | 178,921 | 534% | |||||||||||||||||||
2002 | 42,325 | 1,494 | 1,494 | — | — | 1,494 | — | 4,245 | 204,216 | 482% | |||||||||||||||||||
2003 | 61,447 | 2,246 | 2,246 | — | — | 2,246 | — | 6,283 | 273,734 | 445% | |||||||||||||||||||
2004 | 59,176 | 1,846 | 1,846 | — | — | 1,846 | — | 6,421 | 206,543 | 349% | |||||||||||||||||||
2005 | 143,167 | 3,717 | 1,947 | 1,770 | (1,710 | ) | 3,657 | 5,826 | 16,732 | 331,551 | 232% | ||||||||||||||||||
2006 | 107,666 | 3,319 | 1,605 | 1,714 | (1,750 | ) | 3,355 | 6,013 | 16,410 | 228,180 | 212% | ||||||||||||||||||
2007 | 258,364 | 11,151 | 6,464 | 4,687 | (1,465 | ) | 7,929 | 18,192 | 51,776 | 541,739 | 210% | ||||||||||||||||||
2008 | 275,114 | 13,193 | 6,537 | 6,656 | (2,100 | ) | 8,637 | 22,193 | 50,474 | 537,362 | 195% | ||||||||||||||||||
2009 | 281,313 | 57,288 | 43,104 | 14,184 | — | 43,104 | 15,940 | 118,618 | 921,889 | 328% | |||||||||||||||||||
2010 | 357,767 | 86,162 | 64,247 | 21,915 | 1,365 | 62,882 | 56,506 | 232,404 | 1,061,805 | 297% | |||||||||||||||||||
2011 | 392,778 | 104,717 | 69,307 | 35,410 | 450 | 68,857 | 124,237 | 381,165 | 1,039,572 | 265% | |||||||||||||||||||
2012 | 508,426 | 132,065 | 67,109 | 64,956 | — | 67,109 | 268,072 | 552,456 | 1,036,009 | 204% | |||||||||||||||||||
2013 | 621,545 | 170,027 | 72,816 | 97,211 | — | 72,816 | 453,419 | 834,852 | 1,159,021 | 186% | |||||||||||||||||||
YTD 2014 | 253,011 | 32,552 | 13,719 | 18,833 | 13,719 | 234,218 | 401,885 | 434,437 | 172% | ||||||||||||||||||||
Total | $ | 3,461,352 | $ | 621,373 | $ | 354,037 | $ | 267,336 | $ | (5,210 | ) | $ | 359,247 | $ | 1,204,616 | $ | 2,677,822 | $ | 8,416,747 | 243% | |||||||||
35
Purchased Bankruptcy Portfolio
Year to Date June 30, 2014 | As of June 30, 2014 | ||||||||||||||||||||||||||||
($ in thousands) | Actual Cash Collections Including Cash Sales | Income Recognized on Finance Receivables | Principal Amortization | Allowance Charges | Income Recognized on Finance Receivables, Net | Net Finance Receivables Balance | Estimated Remaining Collections | Total Estimated Collections | Total Estimated Collections to Purchase Price | ||||||||||||||||||||
Purchase Period | Purchase Price | ||||||||||||||||||||||||||||
1996-2003 | |||||||||||||||||||||||||||||
2004 | 7,468 | 46 | 46 | — | — | 46 | — | 60 | 14,598 | 195% | |||||||||||||||||||
2005 | 29,301 | 58 | 26 | 32 | (40 | ) | 66 | 26 | 95 | 43,794 | 149% | ||||||||||||||||||
2006 | 17,627 | 151 | 101 | 50 | (50 | ) | 151 | 52 | 197 | 31,913 | 181% | ||||||||||||||||||
2007 | 78,526 | 392 | 144 | 248 | (430 | ) | 574 | 319 | 1,585 | 106,108 | 135% | ||||||||||||||||||
2008 | 108,584 | 1,163 | 260 | 903 | (100 | ) | 360 | 1,525 | 3,747 | 169,098 | 156% | ||||||||||||||||||
2009 | 156,027 | 37,531 | 27,404 | 10,127 | — | 27,404 | 1,771 | 38,516 | 480,855 | 308% | |||||||||||||||||||
2010 | 209,160 | 54,753 | 38,172 | 16,581 | — | 38,172 | 29,442 | 90,572 | 536,047 | 256% | |||||||||||||||||||
2011 | 181,784 | 44,352 | 19,732 | 24,620 | — | 19,732 | 64,713 | 117,697 | 326,398 | 180% | |||||||||||||||||||
2012 | 252,363 | 49,891 | 13,470 | 36,421 | — | 13,470 | 137,798 | 177,121 | 348,010 | 138% | |||||||||||||||||||
2013 | 229,189 | 40,576 | 11,856 | 28,720 | — | 11,856 | 164,703 | 210,702 | 303,806 | 133% | |||||||||||||||||||
YTD 2014 | 81,587 | 14,412 | 2,763 | 11,649 | 2,763 | 69,938 | 89,114 | 103,526 | 127% | ||||||||||||||||||||
Total | $ | 1,351,616 | $ | 243,325 | $ | 113,974 | $ | 129,351 | $ | (620 | ) | $ | 114,594 | $ | 470,287 | $ | 729,406 | $ | 2,464,153 | 182% | |||||||||
Core Portfolio
Year to Date June 30, 2014 | As of June 30, 2014 | ||||||||||||||||||||||||||||
($ in thousands) | Actual Cash Collections Including Cash Sales | Income Recognized on Finance Receivables | Principal Amortization | Allowance Charges | Income Recognized on Finance Receivables, Net | Net Finance Receivables Balance | Estimated Remaining Collections | Total Estimated Collections | Total Estimated Collections to Purchase Price | ||||||||||||||||||||
Purchase Period | Purchase Price | ||||||||||||||||||||||||||||
1996 | $ | 3,080 | $ | 6 | $ | 6 | $ | — | $ | — | $ | 6 | $ | — | $ | 13 | $ | 10,227 | 332% | ||||||||||
1997 | 7,685 | 28 | 28 | — | — | 28 | — | 58 | 25,592 | 333% | |||||||||||||||||||
1998 | 11,089 | 75 | 75 | — | — | 75 | — | 208 | 37,634 | 339% | |||||||||||||||||||
1999 | 18,898 | 140 | 140 | — | — | 140 | — | 271 | 69,766 | 369% | |||||||||||||||||||
2000 | 25,020 | 465 | 465 | — | — | 465 | — | 1,419 | 118,549 | 474% | |||||||||||||||||||
2001 | 33,481 | 882 | 882 | — | — | 882 | — | 2,132 | 178,921 | 534% | |||||||||||||||||||
2002 | 42,325 | 1,494 | 1,494 | — | — | 1,494 | — | 4,245 | 204,216 | 482% | |||||||||||||||||||
2003 | 61,447 | 2,246 | 2,246 | — | — | 2,246 | — | 6,283 | 273,734 | 445% | |||||||||||||||||||
2004 | 51,708 | 1,800 | 1,800 | — | — | 1,800 | — | 6,361 | 191,945 | 371% | |||||||||||||||||||
2005 | 113,866 | 3,659 | 1,921 | 1,738 | (1,670 | ) | 3,591 | 5,800 | 16,637 | 287,757 | 253% | ||||||||||||||||||
2006 | 90,039 | 3,168 | 1,504 | 1,664 | (1,700 | ) | 3,204 | 5,961 | 16,213 | 196,267 | 218% | ||||||||||||||||||
2007 | 179,838 | 10,759 | 6,320 | 4,439 | (1,035 | ) | 7,355 | 17,873 | 50,191 | 435,631 | 242% | ||||||||||||||||||
2008 | 166,530 | 12,030 | 6,277 | 5,753 | (2,000 | ) | 8,277 | 20,668 | 46,727 | 368,264 | 221% | ||||||||||||||||||
2009 | 125,286 | 19,757 | 15,700 | 4,057 | — | 15,700 | 14,169 | 80,102 | 441,034 | 352% | |||||||||||||||||||
2010 | 148,607 | 31,409 | 26,075 | 5,334 | 1,365 | 24,710 | 27,064 | 141,832 | 525,758 | 354% | |||||||||||||||||||
2011 | 210,994 | 60,365 | 49,575 | 10,790 | 450 | 49,125 | 59,524 | 263,468 | 713,174 | 338% | |||||||||||||||||||
2012 | 256,063 | 82,174 | 53,639 | 28,535 | — | 53,639 | 130,274 | 375,335 | 687,999 | 269% | |||||||||||||||||||
2013 | 392,356 | 129,451 | 60,960 | 68,491 | — | 60,960 | 288,716 | 624,150 | 855,215 | 218% | |||||||||||||||||||
YTD 2014 | 171,424 | 18,140 | 10,956 | 7,184 | — | 10,956 | 164,280 | 312,771 | 330,911 | 193% | |||||||||||||||||||
Total | $ | 2,109,736 | $ | 378,048 | $ | 240,063 | $ | 137,985 | $ | (4,590 | ) | $ | 244,653 | $ | 734,329 | $ | 1,948,416 | $ | 5,952,594 | 282% | |||||||||
36
Domestic Portfolio Data – Current Quarter
Entire Domestic Portfolio
Quarter Ended June 30, 2014 | As of June 30, 2014 | ||||||||||||||||||||||||||||
($ in thousands) | Actual Cash Collections Including Cash Sales | Income Recognized on Finance Receivables | Principal Amortization | Allowance Charges | Income Recognized on Finance Receivables, Net | Net Finance Receivables Balance | Estimated Remaining Collections | Total Estimated Collections | Total Estimated Collections to Purchase Price | ||||||||||||||||||||
Purchase Period | Purchase Price | ||||||||||||||||||||||||||||
1996 | $ | 3,080 | $ | 3 | $ | 3 | $ | — | $ | — | $ | 3 | $ | — | $ | 13 | $ | 10,227 | 332% | ||||||||||
1997 | 7,685 | 13 | 13 | — | — | 13 | — | 58 | 25,592 | 333% | |||||||||||||||||||
1998 | 11,089 | 42 | 42 | — | — | 42 | — | 208 | 37,634 | 339% | |||||||||||||||||||
1999 | 18,898 | 62 | 62 | — | — | 62 | — | 271 | 69,766 | 369% | |||||||||||||||||||
2000 | 25,020 | 213 | 213 | — | — | 213 | — | 1,419 | 118,549 | 474% | |||||||||||||||||||
2001 | 33,481 | 425 | 425 | — | — | 425 | — | 2,132 | 178,921 | 534% | |||||||||||||||||||
2002 | 42,325 | 743 | 743 | — | — | 743 | — | 4,245 | 204,216 | 482% | |||||||||||||||||||
2003 | 61,447 | 1,103 | 1,103 | — | — | 1,103 | — | 6,283 | 273,734 | 445% | |||||||||||||||||||
2004 | 59,176 | 907 | 907 | — | — | 907 | — | 6,421 | 206,543 | 349% | |||||||||||||||||||
2005 | 143,167 | 1,790 | 967 | 823 | (925 | ) | 1,892 | 5,826 | 16,732 | 331,551 | 232% | ||||||||||||||||||
2006 | 107,666 | 1,566 | 772 | 794 | (930 | ) | 1,702 | 6,013 | 16,410 | 228,180 | 212% | ||||||||||||||||||
2007 | 258,364 | 5,340 | 3,214 | 2,126 | (1,230 | ) | 4,444 | 18,192 | 51,776 | 541,739 | 210% | ||||||||||||||||||
2008 | 275,114 | 6,024 | 3,061 | 2,963 | (600 | ) | 3,661 | 22,193 | 50,474 | 537,362 | 195% | ||||||||||||||||||
2009 | 281,313 | 26,654 | 19,872 | 6,782 | — | 19,872 | 15,940 | 118,618 | 921,889 | 328% | |||||||||||||||||||
2010 | 357,767 | 42,526 | 31,434 | 11,092 | 475 | 30,959 | 56,506 | 232,404 | 1,061,805 | 297% | |||||||||||||||||||
2011 | 392,778 | 51,730 | 34,136 | 17,594 | 450 | 33,686 | 124,237 | 381,165 | 1,039,572 | 265% | |||||||||||||||||||
2012 | 508,426 | 64,255 | 33,155 | 31,100 | — | 33,155 | 268,072 | 552,456 | 1,036,009 | 204% | |||||||||||||||||||
2013 | 621,545 | 88,247 | 38,540 | 49,707 | — | 38,540 | 453,419 | 834,852 | 1,159,021 | 186% | |||||||||||||||||||
YTD 2014 | 253,011 | 22,385 | 10,102 | 12,283 | — | 10,102 | 234,218 | 401,885 | 434,437 | 172% | |||||||||||||||||||
Total | $ | 3,461,352 | $ | 314,028 | $ | 178,764 | $ | 135,264 | $ | (2,760 | ) | $ | 181,524 | $ | 1,204,616 | $ | 2,677,822 | $ | 8,416,747 | 243% | |||||||||
Purchased Bankruptcy Portfolio
Quarter Ended June 30, 2014 | As of June 30, 2014 | ||||||||||||||||||||||||||||
($ in thousands) | Actual Cash Collections Including Cash Sales | Income Recognized on Finance Receivables | Principal Amortization | Allowance Charges | Income Recognized on Finance Receivables, Net | Net Finance Receivables Balance | Estimated Remaining Collections | Total Estimated Collections | Total Estimated Collections to Purchase Price | ||||||||||||||||||||
Purchase Period | Purchase Price | ||||||||||||||||||||||||||||
1996-2003 | $ | — | $ | — | $ | — | $ | — | $ | — | $ | — | $ | — | $ | — | $ | — | —% | ||||||||||
2004 | 7,468 | 18 | 18 | — | — | 18 | — | 60 | 14,598 | 195% | |||||||||||||||||||
2005 | 29,301 | 26 | 11 | 15 | (25 | ) | 36 | 26 | 95 | 43,794 | 149% | ||||||||||||||||||
2006 | 17,627 | 57 | 32 | 25 | (30 | ) | 62 | 52 | 197 | 31,913 | 181% | ||||||||||||||||||
2007 | 78,526 | 185 | 69 | 116 | (215 | ) | 284 | 319 | 1,585 | 106,108 | 135% | ||||||||||||||||||
2008 | 108,584 | 506 | 119 | 387 | (100 | ) | 219 | 1,525 | 3,747 | 169,098 | 156% | ||||||||||||||||||
2009 | 156,027 | 17,150 | 12,471 | 4,679 | — | 12,471 | 1,771 | 38,516 | 480,855 | 308% | |||||||||||||||||||
2010 | 209,160 | 27,622 | 19,150 | 8,472 | — | 19,150 | 29,442 | 90,572 | 536,047 | 256% | |||||||||||||||||||
2011 | 181,784 | 23,059 | 10,572 | 12,487 | — | 10,572 | 64,713 | 117,697 | 326,398 | 180% | |||||||||||||||||||
2012 | 252,363 | 25,506 | 6,553 | 18,953 | — | 6,553 | 137,798 | 177,121 | 348,010 | 138% | |||||||||||||||||||
2013 | 229,189 | 21,281 | 6,089 | 15,192 | — | 6,089 | 164,703 | 210,702 | 303,806 | 133% | |||||||||||||||||||
YTD 2014 | 81,587 | 8,389 | 2,050 | 6,339 | — | 2,050 | 69,938 | 89,114 | 103,526 | 127% | |||||||||||||||||||
Total | $ | 1,351,616 | $ | 123,799 | $ | 57,134 | $ | 66,665 | $ | (370 | ) | $ | 57,504 | $ | 470,287 | $ | 729,406 | $ | 2,464,153 | 182% | |||||||||
37
Core Portfolio
Quarter Ended June 30, 2014 | As of June 30, 2014 | ||||||||||||||||||||||||||||
($ in thousands) | Actual Cash Collections Including Cash Sales | Income Recognized on Finance Receivables | Principal Amortization | Allowance Charges | Income Recognized on Finance Receivables, Net | Net Finance Receivables Balance | Estimated Remaining Collections | Total Estimated Collections | Total Estimated Collections to Purchase Price | ||||||||||||||||||||
Purchase Period | Purchase Price | ||||||||||||||||||||||||||||
1996 | $ | 3,080 | $ | 3 | $ | 3 | $ | — | $ | — | $ | 3 | $ | — | $ | 13 | $ | 10,227 | 332% | ||||||||||
1997 | 7,685 | 13 | 13 | — | — | 13 | — | 58 | 25,592 | 333% | |||||||||||||||||||
1998 | 11,089 | 42 | 42 | — | — | 42 | — | 208 | 37,634 | 339% | |||||||||||||||||||
1999 | 18,898 | 62 | 62 | — | — | 62 | — | 271 | 69,766 | 369% | |||||||||||||||||||
2000 | 25,020 | 213 | 213 | — | — | 213 | — | 1,419 | 118,549 | 474% | |||||||||||||||||||
2001 | 33,481 | 425 | 425 | — | — | 425 | — | 2,132 | 178,921 | 534% | |||||||||||||||||||
2002 | 42,325 | 743 | 743 | — | — | 743 | — | 4,245 | 204,216 | 482% | |||||||||||||||||||
2003 | 61,447 | 1,103 | 1,103 | — | — | 1,103 | — | 6,283 | 273,734 | 445% | |||||||||||||||||||
2004 | 51,708 | 889 | 889 | — | — | 889 | — | 6,361 | 191,945 | 371% | |||||||||||||||||||
2005 | 113,866 | 1,764 | 956 | 808 | (900 | ) | 1,856 | 5,800 | 16,637 | 287,757 | 253% | ||||||||||||||||||
2006 | 90,039 | 1,509 | 740 | 769 | (900 | ) | 1,640 | 5,961 | 16,213 | 196,267 | 218% | ||||||||||||||||||
2007 | 179,838 | 5,155 | 3,145 | 2,010 | (1,015 | ) | 4,160 | 17,873 | 50,191 | 435,631 | 242% | ||||||||||||||||||
2008 | 166,530 | 5,518 | 2,942 | 2,576 | (500 | ) | 3,442 | 20,668 | 46,727 | 368,264 | 221% | ||||||||||||||||||
2009 | 125,286 | 9,504 | 7,401 | 2,103 | — | 7,401 | 14,169 | 80,102 | 441,034 | 352% | |||||||||||||||||||
2010 | 148,607 | 14,904 | 12,284 | 2,620 | 475 | 11,809 | 27,064 | 141,832 | 525,758 | 354% | |||||||||||||||||||
2011 | 210,994 | 28,671 | 23,564 | 5,107 | 450 | 23,114 | 59,524 | 263,468 | 713,174 | 338% | |||||||||||||||||||
2012 | 256,063 | 38,749 | 26,602 | 12,147 | — | 26,602 | 130,274 | 375,335 | 687,999 | 269% | |||||||||||||||||||
2013 | 392,356 | 66,966 | 32,451 | 34,515 | — | 32,451 | 288,716 | 624,150 | 855,215 | 218% | |||||||||||||||||||
YTD 2014 | 171,424 | 13,996 | 8,052 | 5,944 | — | 8,052 | 164,280 | 312,771 | 330,911 | 193% | |||||||||||||||||||
Total | $ | 2,109,736 | $ | 190,229 | $ | 121,630 | $ | 68,599 | $ | (2,390 | ) | $ | 124,020 | $ | 734,329 | $ | 1,948,416 | $ | 5,952,594 | 282% | |||||||||
The following graph shows the purchase price of our domestic portfolios by year for the last ten years. The purchase price number represents the cash paid to the seller, plus certain capitalized costs, less buybacks.
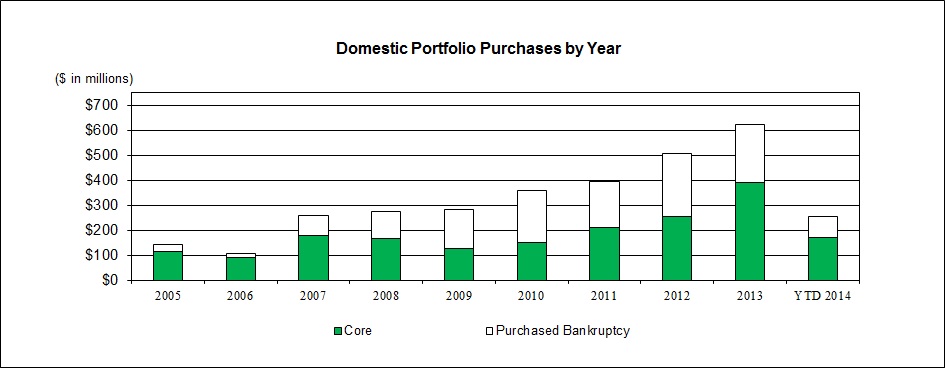
As shown in the above chart, the composition of our domestic purchased portfolios shifted in favor of bankrupt accounts in 2009 and 2010, before returning to equilibrium with Core in 2011 and 2012. In 2013 and the first half of 2014, Core purchases exceeded those of bankrupt accounts. We began buying bankrupt accounts during 2004 and slowly increased the volume of accounts we acquired through 2006 as we tested our models, refined our processes and validated our operating assumptions. After observing a high level of modeling confidence in our early purchases, we began increasing our level of purchases more dramatically commencing in 2007.
Our ability to profitably purchase and liquidate pools of bankrupt accounts provides diversity to our distressed asset acquisition business. Although we generally buy bankrupt portfolios from many of the same consumer lenders from whom we acquire Core customer portfolios, the volumes and pricing characteristics as well as the competitors are different. Based upon market dynamics, the profitability of portfolios purchased in the bankrupt and Core markets may differ over time. We have found periods when
38
bankrupt accounts were more profitable and other times when Core accounts were more profitable. From 2004 through 2008, our bankruptcy buying fluctuated between 13% and 39% of our total portfolio purchasing. In 2009, for the first time in our history, bankruptcy purchasing exceeded that of our Core buying, at 55% of total portfolio purchasing and during 2010 this percentage increased to 59%. This occurred as severe dislocations in the financial markets, coupled with legislative uncertainty, caused pricing in the bankruptcy market to decline substantially, thereby driving our strategy to make advantageous bankruptcy portfolio acquisitions during this period. For 2011 and 2012, our bankruptcy buying leveled off and represented 48% and 50% of our total domestic portfolio purchasing and in 2013 and the first half of 2014, it declined to 38% and 32%, respectively, of our total domestic portfolio purchasing.
In order to collect our Core portfolios, we generally need to employ relatively higher amounts of labor and incur additional collection costs to generate each dollar of cash collections as compared with bankruptcy portfolios. In order to achieve acceptable levels of net return on investment (after direct expenses), we are generally targeting a total cash collections to purchase price multiple in the 1.75-3.0x range. On the other hand, bankrupt accounts generate the majority of cash collections through the efforts of the U.S. bankruptcy courts and trustees. In this process, cash is remitted to our Company with no corresponding cost other than the cost of filing claims at the time of purchase, court fees associated with the filing of ownership claim transfers and general administrative costs for monitoring the progress of each account through the bankruptcy process. As a result, overall collection costs are much lower for us when liquidating a pool of bankrupt accounts as compared to a pool of Core accounts, but conversely the price we pay for bankrupt accounts is generally higher than Core accounts. We generally target similar returns on investment (measured after direct expenses) for bankrupt and Core portfolios at any given point in the market cycles. However, because of the lower related collection costs, we can pay more for bankrupt portfolios, which causes the estimated total cash collections to purchase price multiples of bankrupt pools generally to be in the 1.2-2.0x range. In summary, compared to a similar investment in a pool of Core accounts, to the extent both pools had identical targeted returns on investment (measured after direct expenses), the bankrupt pool would be expected to generate less revenue, less direct expenses, similar operating income, and a higher operating margin.
In addition, collections on younger, newly filed bankrupt accounts tend to be of a lower magnitude in the earlier months when compared to Core charge-off accounts. This lower level of early period collections is due to the fact that we primarily purchase portfolios of accounts that represent unsecured claims in bankruptcy, and these unsecured claims are scheduled to begin paying out after payment of the secured and priority claims. As a result of the administrative processes regarding payout priorities within the court-administered bankruptcy plans, unsecured creditors do not generally begin receiving meaningful collections on unsecured claims until 12 to 18 months after the bankruptcy filing date. Therefore, to the extent that we purchase portfolios with more recent bankruptcy filing dates, as we did to a significant extent commencing in 2009, we would expect to experience a delay in cash collections compared with Core charged-off portfolios.
We utilize a long-term approach to collecting our owned portfolios of receivables. This approach has historically caused us to realize significant cash collections and revenues from purchased portfolios of finance receivables years after they are originally acquired. As a result, we have in the past been able to temporarily reduce our level of current period acquisitions without a corresponding negative current period impact on cash collections and revenue.
39
The following tables, which exclude any proceeds from cash sales of finance receivables, demonstrate our ability to realize significant multi-year cash collection streams on our domestic portfolios.
Cash Collections By Year, By Year of Purchase – Entire Domestic Portfolio
(in thousands) | ||||||||||||||||||||||||||||||||||||
Purchase Period | Purchase Price | Cash Collection Period | ||||||||||||||||||||||||||||||||||
1996-2005 | 2006 | 2007 | 2008 | 2009 | 2010 | 2011 | 2012 | 2013 | YTD 2014 | Total | ||||||||||||||||||||||||||
1996 | $ | 3,080 | $ | 9,414 | $ | 237 | $ | 102 | $ | 83 | $ | 78 | $ | 68 | $ | 100 | $ | 39 | $ | 24 | $ | 6 | $ | 10,151 | ||||||||||||
1997 | 7,685 | 22,803 | 597 | 437 | 346 | 215 | 216 | 187 | 112 | 84 | 28 | 25,025 | ||||||||||||||||||||||||
1998 | 11,089 | 32,889 | 1,415 | 882 | 616 | 397 | 382 | 332 | 241 | 173 | 75 | 37,402 | ||||||||||||||||||||||||
1999 | 18,898 | 57,198 | 3,032 | 2,243 | 1,533 | 1,328 | 1,139 | 997 | 709 | 483 | 140 | 68,802 | ||||||||||||||||||||||||
2000 | 25,020 | 87,520 | 8,067 | 5,202 | 3,604 | 3,198 | 2,782 | 2,554 | 1,927 | 1,349 | 465 | 116,668 | ||||||||||||||||||||||||
2001 | 33,481 | 119,238 | 16,048 | 10,011 | 6,164 | 5,299 | 4,422 | 3,791 | 3,104 | 2,339 | 882 | 171,298 | ||||||||||||||||||||||||
2002 | 42,325 | 119,570 | 24,729 | 16,527 | 9,772 | 7,444 | 6,375 | 5,844 | 4,768 | 3,433 | 1,494 | 199,956 | ||||||||||||||||||||||||
2003 | 61,447 | 126,654 | 43,728 | 30,695 | 18,818 | 13,135 | 10,422 | 8,945 | 7,477 | 5,331 | 2,246 | 267,451 | ||||||||||||||||||||||||
2004 | 59,176 | 64,494 | 40,424 | 30,750 | 19,339 | 13,677 | 9,944 | 8,522 | 6,604 | 4,522 | 1,846 | 200,122 | ||||||||||||||||||||||||
2005 | 143,167 | 18,968 | 75,145 | 69,862 | 49,576 | 33,366 | 23,733 | 17,234 | 13,302 | 9,916 | 3,717 | 314,819 | ||||||||||||||||||||||||
2006 | 107,666 | — | 22,971 | 53,192 | 40,560 | 29,749 | 22,494 | 18,190 | 12,560 | 8,735 | 3,319 | 211,770 | ||||||||||||||||||||||||
2007 | 258,364 | — | — | 42,263 | 115,011 | 94,805 | 83,059 | 67,088 | 47,136 | 29,450 | 11,151 | 489,963 | ||||||||||||||||||||||||
2008 | 275,114 | — | — | — | 61,277 | 107,974 | 100,337 | 89,344 | 71,806 | 42,957 | 13,193 | 486,888 | ||||||||||||||||||||||||
2009 | 281,313 | — | — | — | — | 57,338 | 177,407 | 187,119 | 177,273 | 146,846 | 57,288 | 803,271 | ||||||||||||||||||||||||
2010 | 357,767 | — | — | — | — | — | 86,562 | 218,053 | 234,893 | 203,731 | 86,162 | 829,401 | ||||||||||||||||||||||||
2011 | 392,778 | — | — | — | — | — | — | 77,190 | 240,840 | 235,660 | 104,717 | 658,407 | ||||||||||||||||||||||||
2012 | 508,426 | — | — | — | — | — | — | — | 74,289 | 277,199 | 132,065 | 483,553 | ||||||||||||||||||||||||
2013 | 621,545 | — | — | — | — | — | — | — | — | 154,142 | 170,027 | 324,169 | ||||||||||||||||||||||||
YTD 2014 | 253,011 | — | — | — | — | — | — | — | — | — | 32,552 | 32,552 | ||||||||||||||||||||||||
Total | $ | 3,461,352 | $ | 658,748 | $ | 236,393 | $ | 262,166 | $ | 326,699 | $ | 368,003 | $ | 529,342 | $ | 705,490 | $ | 897,080 | $ | 1,126,374 | $ | 621,373 | $ | 5,731,668 | ||||||||||||
Cash Collections By Year, By Year of Purchase – Purchased Bankruptcy Portfolio
(in thousands) | ||||||||||||||||||||||||||||||||||||
Purchase Period | Purchase Price | Cash Collection Period | ||||||||||||||||||||||||||||||||||
1996-2005 | 2006 | 2007 | 2008 | 2009 | 2010 | 2011 | 2012 | 2013 | YTD 2014 | Total | ||||||||||||||||||||||||||
2004 | $ | 7,468 | 5,297 | 3,956 | 2,777 | 1,455 | 496 | 164 | 149 | 108 | 90 | 46 | $ | 14,538 | ||||||||||||||||||||||
2005 | 29,301 | 3,777 | 15,500 | 11,934 | 6,845 | 3,318 | 1,382 | 466 | 250 | 169 | 58 | 43,699 | ||||||||||||||||||||||||
2006 | 17,627 | — | 5,608 | 9,455 | 6,522 | 4,398 | 2,972 | 1,526 | 665 | 419 | 151 | 31,716 | ||||||||||||||||||||||||
2007 | 78,526 | — | — | 2,850 | 27,972 | 25,630 | 22,829 | 16,093 | 7,551 | 1,206 | 392 | 104,523 | ||||||||||||||||||||||||
2008 | 108,584 | — | — | — | 14,024 | 35,894 | 37,974 | 35,690 | 28,956 | 11,650 | 1,163 | 165,351 | ||||||||||||||||||||||||
2009 | 156,027 | — | — | — | — | 16,635 | 81,780 | 102,780 | 107,888 | 95,725 | 37,531 | 442,339 | ||||||||||||||||||||||||
2010 | 209,160 | — | — | — | — | — | 39,486 | 104,499 | 125,020 | 121,717 | 54,753 | 445,475 | ||||||||||||||||||||||||
2011 | 181,784 | — | — | — | — | — | — | 15,218 | 66,379 | 82,752 | 44,352 | 208,701 | ||||||||||||||||||||||||
2012 | 252,363 | — | — | — | — | — | — | 17,388 | 103,610 | 49,891 | 170,889 | |||||||||||||||||||||||||
2013 | 229,189 | — | — | — | — | — | — | — | — | 52,528 | 40,576 | 93,104 | ||||||||||||||||||||||||
YTD 2014 | 81,587 | 14,412 | 14,412 | |||||||||||||||||||||||||||||||||
Total | $ | 1,351,616 | $ | 9,074 | $ | 25,064 | $ | 27,016 | $ | 56,818 | $ | 86,371 | $ | 186,587 | $ | 276,421 | $ | 354,205 | $ | 469,866 | $ | 243,325 | $ | 1,734,747 | ||||||||||||
40
Cash Collections By Year, By Year of Purchase – Core Portfolio
(in thousands) | ||||||||||||||||||||||||||||||||||||
Purchase Period | Purchase Price | Cash Collection Period | ||||||||||||||||||||||||||||||||||
1996-2005 | 2006 | 2007 | 2008 | 2009 | 2010 | 2011 | 2012 | 2013 | YTD 2014 | Total | ||||||||||||||||||||||||||
1996 | $ | 3,080 | $ | 9,414 | $ | 237 | $ | 102 | $ | 83 | $ | 78 | $ | 68 | $ | 100 | $ | 39 | $ | 24 | $ | 6 | $ | 10,151 | ||||||||||||
1997 | 7,685 | 22,803 | 597 | 437 | 346 | 215 | 216 | 187 | 112 | 84 | 28 | 25,025 | ||||||||||||||||||||||||
1998 | 11,089 | 32,889 | 1,415 | 882 | 616 | 397 | 382 | 332 | 241 | 173 | 75 | 37,402 | ||||||||||||||||||||||||
1999 | 18,898 | 57,198 | 3,032 | 2,243 | 1,533 | 1,328 | 1,139 | 997 | 709 | 483 | 140 | 68,802 | ||||||||||||||||||||||||
2000 | 25,020 | 87,520 | 8,067 | 5,202 | 3,604 | 3,198 | 2,782 | 2,554 | 1,927 | 1,349 | 465 | 116,668 | ||||||||||||||||||||||||
2001 | 33,481 | 119,238 | 16,048 | 10,011 | 6,164 | 5,299 | 4,422 | 3,791 | 3,104 | 2,339 | 882 | 171,298 | ||||||||||||||||||||||||
2002 | 42,325 | 119,570 | 24,729 | 16,527 | 9,772 | 7,444 | 6,375 | 5,844 | 4,768 | 3,433 | 1,494 | 199,956 | ||||||||||||||||||||||||
2003 | 61,447 | 126,654 | 43,728 | 30,695 | 18,818 | 13,135 | 10,422 | 8,945 | 7,477 | 5,331 | 2,246 | 267,451 | ||||||||||||||||||||||||
2004 | 51,708 | 59,197 | 36,468 | 27,973 | 17,884 | 13,181 | 9,780 | 8,373 | 6,496 | 4,432 | 1,800 | 185,584 | ||||||||||||||||||||||||
2005 | 113,866 | 15,191 | 59,645 | 57,928 | 42,731 | 30,048 | 22,351 | 16,768 | 13,052 | 9,747 | 3,659 | 271,120 | ||||||||||||||||||||||||
2006 | 90,039 | — | 17,363 | 43,737 | 34,038 | 25,351 | 19,522 | 16,664 | 11,895 | 8,316 | 3,168 | 180,054 | ||||||||||||||||||||||||
2007 | 179,838 | — | — | 39,413 | 87,039 | 69,175 | 60,230 | 50,995 | 39,585 | 28,244 | 10,759 | 385,440 | ||||||||||||||||||||||||
2008 | 166,530 | — | — | — | 47,253 | 72,080 | 62,363 | 53,654 | 42,850 | 31,307 | 12,030 | 321,537 | ||||||||||||||||||||||||
2009 | 125,286 | — | — | — | — | 40,703 | 95,627 | 84,339 | 69,385 | 51,121 | 19,757 | 360,932 | ||||||||||||||||||||||||
2010 | 148,607 | — | — | — | — | — | 47,076 | 113,554 | 109,873 | 82,014 | 31,409 | 383,926 | ||||||||||||||||||||||||
2011 | 210,994 | — | — | — | — | — | — | 61,972 | 174,461 | 152,908 | 60,365 | 449,706 | ||||||||||||||||||||||||
2012 | 256,063 | — | — | — | — | — | — | — | 56,901 | 173,589 | 82,174 | 312,664 | ||||||||||||||||||||||||
2013 | 392,356 | — | — | — | — | — | — | — | — | 101,614 | 129,451 | 231,065 | ||||||||||||||||||||||||
YTD 2014 | 171,424 | — | — | — | — | — | — | — | — | — | 18,140 | 18,140 | ||||||||||||||||||||||||
Total | $ | 2,109,736 | $ | 649,674 | $ | 211,329 | $ | 235,150 | $ | 269,881 | $ | 281,632 | $ | 342,755 | $ | 429,069 | $ | 542,875 | $ | 656,508 | $ | 378,048 | $ | 3,996,921 | ||||||||||||
When we acquire a new pool of finance receivables, our estimates typically result in a 60-96 month projection of cash collections, depending on the type of finance receivables acquired. The following chart shows our historical cash collections (including cash sales of finance receivables) in relation to the aggregate of the total estimated collection projections made at the time of each respective pool purchase, adjusted for buybacks, for the last ten years.
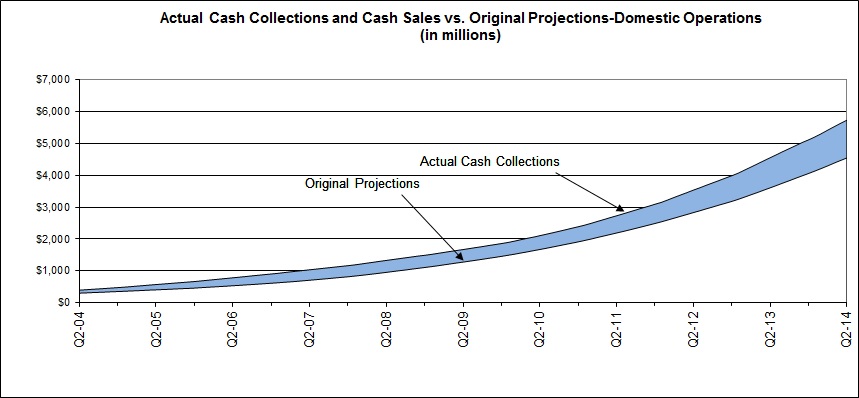
41
Primarily as a result of the downturn in the economy, the decline in the availability of consumer credit, our efforts to help customers establish reasonable payment plans, and improvements in our collections capabilities which have allowed us to profitably collect on accounts with lower balances or lower quality, the average payment size has decreased over the past several years. However, due to improved scoring and segmentation, together with enhanced productivity, we have been able to realize increased amounts of cash collections by generating enough incremental payments to overcome the decrease in payment size. The decreasing average payment size trend moderated during 2012, and the average payment size was stable during 2013 and the first half of 2014.
Portfolios by Type and Geography (Domestic Portfolio Only)
The following table categorizes our life to date domestic portfolio purchases as of June 30, 2014, into the major asset types represented (amounts in thousands):
Account Type | No. of Accounts | % | Face Value (1) | % | Original Purchase Price (2) | % | ||||||||||||||
Major Credit Cards | 19,463 | 55 | % | $ | 54,860,685 | 68 | % | $ | 2,345,266 | 66 | % | |||||||||
Consumer Finance | 6,705 | 18 | 8,666,806 | 11 | 149,744 | 4 | ||||||||||||||
Private Label Credit Cards | 8,750 | 25 | 11,860,970 | 15 | 912,268 | 26 | ||||||||||||||
Auto Deficiency | 672 | 2 | 4,789,915 | 6 | 142,243 | 4 | ||||||||||||||
Total | 35,590 | 100 | % | $ | 80,178,376 | 100 | % | $ | 3,549,521 | 100 | % | |||||||||
(1) | "Face Value" represents the original face amount purchased from sellers and has not been reduced by any adjustments including payments and buybacks. |
(2) | "Original Purchase Price" represents the cash paid to sellers to acquire portfolios of defaulted consumer receivables and has not been reduced by any adjustments, including payments and buybacks. |
The following table summarizes our life to date domestic portfolio purchases as of June 30, 2014, into the delinquency categories represented (amounts in thousands).
Account Type | No. of Accounts | % | Face Value (1) | % | Original Purchase Price (2) | % | ||||||||||||||
Fresh | 3,531 | 10 | % | $ | 8,265,667 | 10 | % | $ | 916,529 | 26 | % | |||||||||
Primary | 4,865 | 14 | 9,348,255 | 12 | 525,325 | 15 | ||||||||||||||
Secondary | 6,582 | 18 | 9,623,594 | 12 | 413,967 | 12 | ||||||||||||||
Tertiary | 4,336 | 12 | 6,332,022 | 8 | 106,421 | 3 | ||||||||||||||
Bankruptcy Trustees | 5,643 | 16 | 23,234,316 | 29 | 1,419,822 | 40 | ||||||||||||||
Other | 10,633 | 30 | 23,374,522 | 29 | 167,457 | 4 | ||||||||||||||
Total | 35,590 | 100 | % | $ | 80,178,376 | 100 | % | $ | 3,549,521 | 100 | % | |||||||||
(1) | "Face Value" represents the original face amount purchased from sellers and has not been reduced by any adjustments including payments and buybacks. |
(2) | "Original Purchase Price" represents the cash paid to sellers to acquire portfolios of defaulted consumer receivables and has not been reduced by any adjustments, including payments and buybacks. |
We review the geographic distribution of accounts within a portfolio because we have found that state specific laws and rules can have an effect on the collectability of accounts located there. In addition, economic factors and bankruptcy trends vary regionally and are factored into our maximum purchase price equation.
42
The following table summarizes our life to date domestic portfolio purchases as of June 30, 2014, by geographic location (amounts in thousands):
Geographic Distribution | No. of Accounts | % | Face Value (1) | % | Original Purchase Price (2) | % | ||||||||||||||
California | 3,834 | 11 | % | $ | 10,577,857 | 13 | % | $ | 444,497 | 13 | % | |||||||||
Texas | 4,917 | 14 | 8,636,354 | 11 | 306,890 | 9 | ||||||||||||||
Florida | 2,836 | 8 | 7,535,141 | 9 | 314,639 | 9 | ||||||||||||||
New York | 2,017 | 6 | 4,682,272 | 6 | 183,926 | 5 | ||||||||||||||
Ohio | 1,656 | 5 | 3,011,723 | 4 | 146,789 | 4 | ||||||||||||||
Pennsylvania | 1,278 | 4 | 2,914,763 | 4 | 127,309 | 4 | ||||||||||||||
Illinois | 1,348 | 4 | 2,873,523 | 4 | 139,617 | 4 | ||||||||||||||
North Carolina | 1,282 | 4 | 2,818,113 | 4 | 123,650 | 3 | ||||||||||||||
Georgia | 1,170 | 3 | 2,654,644 | 3 | 139,207 | 4 | ||||||||||||||
Other(3) | 15,252 | 41 | 34,473,986 | 42 | 1,622,997 | 45 | ||||||||||||||
Total | 35,590 | 100 | % | $ | 80,178,376 | 100 | % | $ | 3,549,521 | 100 | % | |||||||||
(1) | "Face Value" represents the original face amount purchased from sellers and has not been reduced by any adjustments, including payments and buybacks. |
(2) | "Original Purchase Price" represents the cash paid to sellers to acquire portfolios of defaulted consumer receivables and has not been reduced by any adjustments, including payments and buybacks. |
(3) | Each state included in “Other” represents less than 3% of the face value of total defaulted consumer receivables. |
Collections Productivity (Domestic Portfolio Only)
The following tables display various collections productivity measures that we track. The tables below contain our collector productivity metrics as defined by calendar quarter.
Cash Collections per Collector Hour Paid (Domestic Portfolio Only)
Core cash collections (1) | |||||||||||||||||||
2014 | 2013 (5) | 2012 | 2011 | 2010 | |||||||||||||||
Q1 | $ | 223 | $ | 193 | $ | 166 | $ | 162 | $ | 135 | |||||||||
Q2 | 220 | 190 | 169 | 154 | 127 | ||||||||||||||
Q3 | — | 191 | 171 | 152 | 127 | ||||||||||||||
Q4 | — | 190 | 150 | 137 | 129 | ||||||||||||||
Total cash collections (2) | |||||||||||||||||||
2014 | 2013 (5) | 2012 | 2011 | 2010 | |||||||||||||||
Q1 | $ | 337 | $ | 304 | $ | 258 | $ | 241 | $ | 182 | |||||||||
Q2 | 354 | 315 | 275 | 243 | 188 | ||||||||||||||
Q3 | — | 310 | 279 | 249 | 200 | ||||||||||||||
Q4 | — | 308 | 245 | 228 | 204 | ||||||||||||||
Non-legal cash collections (3) | |||||||||||||||||||
2014 | 2013 (5) | 2012 | 2011 | 2010 | |||||||||||||||
Q1 | $ | 282 | $ | 251 | $ | 216 | $ | 204 | $ | 154 | |||||||||
Q2 | 293 | 261 | 225 | 205 | 160 | ||||||||||||||
Q3 | — | 259 | 230 | 212 | 170 | ||||||||||||||
Q4 | — | 256 | 200 | 194 | 174 | ||||||||||||||
43
Non-legal/non-bankruptcy cash collections (4) | |||||||||||||||||||
2014 | 2013 (5) | 2012 | 2011 | 2010 | |||||||||||||||
Q1 | $ | 167 | $ | 140 | $ | 125 | $ | 125 | $ | 106 | |||||||||
Q2 | 158 | 137 | 120 | 116 | 100 | ||||||||||||||
Q3 | — | 140 | 122 | 115 | 97 | ||||||||||||||
Q4 | — | 138 | 105 | 103 | 98 | ||||||||||||||
(1) | Represents total cash collections less purchased bankruptcy cash collections from trustee-administered accounts. This metric includes cash collections from purchased bankruptcy accounts administered by the Core call center collection floor as well as cash collections generated by our internal staff of legal collectors. This calculation does not include hours paid to our internal staff of legal collectors or to employees processing the bankruptcy-required notifications to trustees. |
(2) | Represents total cash collections (assigned and unassigned) divided by total hours paid (including holiday, vacation and sick time) to collectors (including those in training). |
(3) | Represents total cash collections less external legal cash collections. This metric includes internal legal collections and all bankruptcy collections and excludes any hours associated with either of those functions. |
(4) | Represents total cash collections less external legal cash collections and less purchased bankruptcy cash collections from trustee-administered accounts. This metric does not include any labor hours associated with the bankruptcy or legal (internal or external) functions but does include internally-driven cash collections from the internal legal channel. |
(5) | Due to a change in our calculation methodology, figures for the first and second quarter of 2013 have been revised to conform to current period presentation. |
Consolidated Finance Receivables Portfolio Performance:
The following chart illustrates the excess of our cash collections on our owned portfolios over income recognized on finance receivables on a quarterly basis. The difference between cash collections and income recognized on finance receivables is referred to as payments applied to principal. It is also referred to as amortization of purchase price. This amortization is the portion of cash collections that is used to recover the cost of the portfolio investment represented on the balance sheet.
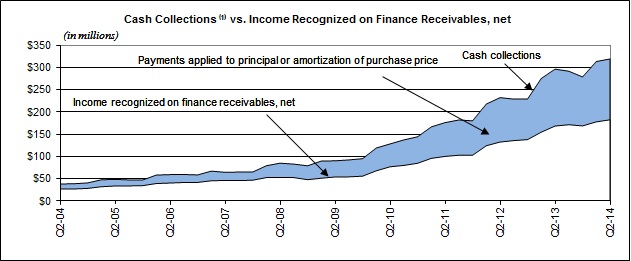
(1) | Includes cash collections on finance receivables only and excludes cash proceeds from sales of defaulted consumer receivables. |
Seasonality
Cash collections tend to be higher in the first and second quarters of the year and lower in the third and fourth quarters of the year, due to customer payment patterns in connection with seasonal employment trends, income tax refunds and holiday spending habits. Historically, our growth has partially offset the impact of this seasonality.
44
The following table displays our quarterly cash collections by source, for the periods indicated.
Cash Collection Source ($ in thousands) | Q2-2014 | Q1-2014 | Q4-2013 | Q3-2013 | Q2-2013 | Q1-2013 | Q4-2012 | Q3-2012 | ||||||||||||||||||||||||
Call Center and Other Collections | $ | 95,072 | $ | 97,736 | $ | 84,375 | $ | 89,512 | $ | 90,229 | $ | 89,037 | $ | 72,624 | $ | 72,394 | ||||||||||||||||
External Legal Collections | 55,011 | 50,990 | 46,066 | 48,274 | 50,131 | 47,910 | 41,521 | 39,913 | ||||||||||||||||||||||||
Internal Legal Collections | 45,090 | 43,939 | 34,101 | 33,288 | 30,365 | 29,283 | 23,968 | 25,650 | ||||||||||||||||||||||||
Bankruptcy Court Trustee Payments | 124,101 | 120,702 | 114,384 | 120,577 | 125,672 | 109,233 | 91,098 | 91,095 | ||||||||||||||||||||||||
Total Cash Collections | $ | 319,274 | $ | 313,367 | $ | 278,926 | $ | 291,651 | $ | 296,397 | $ | 275,463 | $ | 229,211 | $ | 229,052 | ||||||||||||||||
Rollforward of Net Finance Receivables
The following table shows the changes in finance receivables, net, including the amounts paid to acquire new portfolios (amounts in thousands).
Three Months Ended June 30, | Six Months Ended June 30, | ||||||||||||||
2014 | 2013 | 2014 | 2013 | ||||||||||||
Balance at beginning of year | $ | 1,253,961 | $ | 1,169,747 | $ | 1,239,191 | $ | 1,078,951 | |||||||
Acquisitions of finance receivables (1) | 102,081 | 194,958 | 252,168 | 407,347 | |||||||||||
Foreign currency translation adjustment | 309 | (19 | ) | 389 | (941 | ) | |||||||||
Cash collections applied to principal on finance receivables (2) | (136,756 | ) | (127,827 | ) | (272,153 | ) | (248,498 | ) | |||||||
Balance at end of period | $ | 1,219,595 | $ | 1,236,859 | $ | 1,219,595 | $ | 1,236,859 | |||||||
Estimated Remaining Collections | $ | 2,701,939 | $ | 2,636,229 | $ | 2,701,939 | $ | 2,636,229 | |||||||
Liquidity and Capital Resources
Historically, our primary sources of cash have been cash flows from operations, bank borrowings, and convertible debt and equity offerings. Cash has been used for acquisitions of finance receivables, corporate acquisitions, repurchase of our common stock, repayments of bank borrowings, operating expenses, purchases of property and equipment, and working capital to support our growth.
As of June 30, 2014, cash and cash equivalents totaled $270.5 million, compared to $162.0 million at December 31, 2013. We had no debt outstanding on the revolving portion of our credit facility which represents availability of $650.0 million (subject to the borrowing base and applicable debt covenants). In addition, at June 30, 2014 we had $190.0 million outstanding on the floating rate term loan portion of our credit facility.
We have in place forward flow commitments for the purchase of defaulted consumer receivables over the next twelve months of approximately $159.6 million as of June 30, 2014. Additionally we may enter into new or renewed flow commitments in the next twelve months and close on spot transactions in addition to the aforementioned flow agreements. We believe that funds generated from operations and from cash collections on finance receivables, together with existing cash and available borrowings under our credit facility will be sufficient to finance our operations, planned capital expenditures, the aforementioned forward flow commitments, and additional, normal-course portfolio purchasing during the next twelve months. Business acquisitions or higher than normal levels of portfolio purchasing could require additional financing from other sources. On July 16, 2014, we completed the purchase of the outstanding equity of Aktiv, for a purchase price of approximately $872.6 million, and assumed approximately $431.3 million of Aktiv’s corporate debt, resulting in an acquisition of estimated total enterprise value of $1.3 billion. We financed the transaction with cash of $217.7 million, $169.9 million in financing from an affiliate of the seller, and $485.0 million from our domestic, revolving credit facility.
For domestic income tax purposes, we recognize revenue using the cost recovery method with respect to our debt purchasing business. The IRS has audited and issued a Notice of Deficiency for the tax years ended December 31, 2007, 2006 and 2005. It has asserted that tax revenue recognition using the cost recovery method does not clearly reflect taxable income. We have filed a petition in the United States Tax Court and believe we have sufficient support for the technical merits of our positions. If we are unsuccessful in the United States Tax Court, we can appeal to the federal Circuit Court of Appeals. On July 7, 2014, the IRS issued a Notice of Deficiency for the tax years ended December 31, 2012, 2011, 2010, 2009 and 2008 related to cost recovery. If judicial
45
appeals prove unsuccessful, we may ultimately be required to pay the related deferred taxes, and possibly interest and penalties, which may require additional financing from other sources. In accordance with the Internal Revenue Code, underpayments of federal tax accrue interest, compounded daily, at the applicable federal short term rate plus three percentage points. An additional two percentage points applies to large corporate underpayments of $100,000 or more to periods after the applicable date as defined in the Internal Revenue Code. Deferred tax liabilities related to this item were $228.8 million at June 30, 2014.
Cash generated from operations is dependent upon our ability to collect on our finance receivables. Many factors, including the economy and our ability to hire and retain qualified collectors and managers, are essential to our ability to generate cash flows. Fluctuations in these factors that cause a negative impact on our business could have a material impact on our future cash flows.
Our operating activities provided cash of $102.4 million and $97.3 million for the six months ended June 30, 2014 and 2013, respectively. In these periods, cash from operations was generated primarily from net income earned through cash collections and fee income received for the period. The increase was due in part to a decrease in income tax payments, partially offset by a decrease in cash compensation payments.
Our investing activities provided cash of $6.8 million and used cash of $165.5 million during the six months ended June 30, 2014 and 2013, respectively. Cash provided by investing activities is primarily driven by cash collections applied to principal on finance receivables. Cash used in investing activities is primarily driven by acquisitions of defaulted consumer receivables and purchases of property and equipment. The majority of the decrease in cash used in investing activities was due to a decrease in acquisitions of finance receivables, from $407.3 million for the six months ended June 30, 2013 to $252.2 million for the six months ended June 30, 2014, partially offset by an increase in collections applied to principal on finance receivables from $248.5 million for the six months ended June 30, 2013 to $272.2 million for the six months ended June 30, 2014.
Our financing activities used cash of $0.8 million and provided cash of $79.2 million during the six months ended June 30, 2014 and 2013, respectively. Cash is normally provided by draws on our line of credit. Cash used in financing activities is primarily driven by principal payments on our line of credit, principal payments on long-term debt and repurchases of our common stock. The decrease in cash provided by financing activities was due primarily due to changes in the net borrowings on our credit facility. We had no borrowings on our credit facility during the six months ended June 30, 2014, compared to net borrowings of $89.0 million during the six months ended June 30, 2013.
Cash paid for interest was $7.6 million and $5.6 million for the six months ended June 30, 2014 and 2013, respectively. Interest was paid on our revolving credit facility, long-term debt and convertible debt. Cash paid for income taxes was $25.4 million and $52.8 million for the six months ended June 30, 2014 and 2013, respectively.
Borrowings
On December 19, 2012, we entered into the Credit Agreement. The Credit Agreement contained an accordion loan feature that allowed us to request an increase of up to $214.5 million in the amount available for borrowing under the revolving credit facility, whether from existing or new lenders, subject to terms of the Credit Agreement. The Credit Agreement was amended and modified during 2013 and again on April 1, 2014. On April 1, 2014, we entered into the Commitment Increase Agreements to exercise the accordion feature. The Commitment Increase Agreements expanded the maximum amount of revolving credit availability under the Credit Agreement by $214.5 million, elevated the revolving credit commitments of certain lenders and added three new lenders to the Credit Agreement. Given effect to the $214.5 million increase in the amount of revolving credit availability pursuant to the Commitment Increase Agreements, the total credit facility under the Credit Agreement now includes an aggregate principal amount of $840.0 million (subject to compliance with a borrowing base and applicable debt covenants), which consists of (i) a $190.0 million term loan, (ii) a $630 million domestic revolving credit facility, and (iii) a $20 million multi-currency revolving credit facility. The facilities all mature on December 19, 2017. Our revolving credit facility includes a $20.0 million swingline loan sublimit and a $20.0 million letter of credit sublimit. The Credit Agreement is secured by a first priority lien on substantially all of our assets.
Borrowings outstanding on our credit facility at June 30, 2014 consisted of $190.0 million outstanding on the term loan with an annual interest rate as of June 30, 2014 of 2.65%. The revolving credit facility also bears an unused line fee of 0.375% per annum, payable quarterly in arrears.
On August 13, 2013, we completed the private offering of $287.5 million in aggregate principal amount of the Notes. The Notes were issued pursuant to the Indenture. The Indenture contains customary terms and covenants, including certain events of default after which the Notes may be due and payable immediately. The Notes are senior unsecured obligations of the Company. Interest on the Notes is payable semi-annually, in arrears, on February 1 and August 1 of each year, beginning as of February 1, 2014.
46
We were in compliance with all covenants of our credit facilities and the Indenture as of June 30, 2014 and December 31, 2013.
Undistributed Earnings of Foreign Subsidiaries
We intend to use remaining accumulated and future undistributed earnings of foreign subsidiaries to expand operations outside the United States; therefore, such undistributed earnings of foreign subsidiaries are considered to be indefinitely reinvested outside the United States. Accordingly, no provision for U.S. federal and state income tax has been provided thereon. If management intentions change and eligible undistributed earnings of foreign subsidiaries are repatriated, taxes would be accrued and paid on such earnings.
Stockholders’ Equity
Stockholders’ equity was $952.3 million at June 30, 2014 and $869.5 million at December 31, 2013. The increase was primarily attributable to $78.3 million in net income attributable to the Company during the six months ended June 30, 2014.
Contractual Obligations
Our contractual obligations as of June 30, 2014 were as follows (amounts in thousands):
Payments due by period | ||||||||||||||||||||
Contractual Obligations | Total | Less than 1 year | 1 - 3 years | 3 - 5 years | More than 5 years | |||||||||||||||
Operating leases | $ | 31,488 | $ | 7,137 | $ | 12,041 | $ | 8,407 | $ | 3,903 | ||||||||||
Line of credit (1) | 8,552 | 2,458 | 4,875 | 1,219 | — | |||||||||||||||
Long-term debt (2) | 548,228 | 26,495 | 75,695 | 149,913 | 296,125 | |||||||||||||||
Purchase commitments (3) | 182,164 | 179,773 | 2,178 | 213 | — | |||||||||||||||
Employment agreements | 6,376 | 6,376 | — | — | — | |||||||||||||||
Total | $ | 776,808 | $ | 222,239 | $ | 94,789 | $ | 159,752 | $ | 300,028 | ||||||||||
(1) | This amount includes estimated unused line fees due on the line of credit and assumes that the balance on the line of credit remains constant from the June 30, 2014 balance of $0.0 million. |
(2) | This amount includes scheduled interest and principal payments on our term loan and our convertible debt. |
(3) | This amount includes the maximum remaining amount to be purchased under forward flow contracts for the purchase of charged-off consumer debt in the amount of approximately $159.6 million. |
Off-Balance Sheet Arrangements
We do not have any off balance sheet arrangements as defined by Item 303(a)(4) of Regulation S-K promulgated under the Securities Exchange Act of 1934, as amended (the “Exchange Act”).
Recent Accounting Pronouncements
In March 2013, the FASB issued ASU 2013-05, which defines the treatment of the release of cumulative translation adjustments upon derecognition of certain subsidiaries or groups of assets within a foreign entity or of an investment in a foreign entity. ASU 2013-05 is effective for fiscal years, and interim periods within those years, beginning after December 15, 2013. Early adoption is permitted and prior periods should not be adjusted. We adopted ASU 2013-05 in the first quarter of 2014 which had no material impact on our consolidated financial statements.
In April 2014, FASB issued ASU 2014-08, that amends the requirements for reporting discontinued operations. ASU 2014-08 requires the disposal of a component of an entity or a group of components of an entity to be reported in discontinued operations if the disposal represents a strategic shift that will have a major effect on the entity’s operations and financial results. ASU 2014-08 also requires additional disclosures about discontinued operations and disclosures about the disposal of a significant component of an entity that does not qualify as a discontinued operation. ASU 2014-08 is effective prospectively for reporting periods beginning after December 15, 2014, with early adoption permitted. We are evaluating the potential impacts of the new standard.
In May 2014, FASB issued ASU 2014-09, that updates the principles for recognizing revenue. The core principle of the guidance is that an entity should recognize revenue to depict the transfer of promised goods or services to customers in an amount that reflects the consideration to which the entity expects to be entitled in exchange for those goods or services. ASU 2014-09 also amends the required disclosures of the nature, amount, timing and uncertainty of revenue and cash flows arising from contracts
47
with customers. ASU 2014-09 is effective for fiscal years, and interim periods within those years, beginning after December 15, 2016, and can be adopted either retrospectively to each prior reporting period presented or as a cumulative-effect adjustment as of the date of adoption, with early application not permitted. We are evaluating our implementation approach and the potential impacts of the new standard on our existing revenue recognition policies and procedures.
In June 2014, FASB issued ASU 2014-12, which requires that a performance target that affects vesting and that could be achieved after the requisite service period be treated as a performance condition. As such, the performance target should not be reflected in estimating the grant-date fair value of the award. ASU 2014-12 is effective for annual reporting periods beginning after December 15, 2015, with early adoption permitted. We are evaluating the potential impacts of the new standard on our existing stock-based compensation awards.
Critical Accounting Policies
Our consolidated financial statements have been prepared in accordance with U.S. GAAP. Our significant accounting policies are discussed in Note 1 of the Notes to the Consolidated Financial Statements of our 2013 Annual Report on Form 10-K filed on February 28, 2014. Our significant accounting policies are fundamental to understanding our results of operations and financial condition because they require that we use estimates, assumptions and judgments that affect the reported amounts of revenues, expenses, assets, and liabilities.
Three of these policies are considered to be critical because they are important to the portrayal of our financial condition and results, and because they require management to make judgments and estimates that are difficult, subjective, and complex regarding matters that are inherently uncertain.
We base our estimates on historical experience, current trends and on various other assumptions that we believe are reasonable under the circumstances, the results of which form the basis for making judgments about the carrying values of assets and liabilities that are not readily apparent from other sources. If these estimates differ significantly from actual results, the impact on our consolidated financial statements may be material.
Management has reviewed these critical accounting policies with the Company's Audit Committee.
Revenue Recognition - Finance Receivables
We account for our investment in finance receivables under the guidance of ASC 310-30. We acquire portfolios of accounts that have experienced deterioration of credit quality between origination and our acquisition of the accounts. The amount paid for a portfolio reflects our determination that it is probable we will be unable to collect all amounts due according to an account's contractual terms. At acquisition, we review the accounts to determine whether there is evidence of deterioration of credit quality since origination, and if it is probable that we will be unable to collect all amounts due according to the loan's contractual terms. If both conditions exist, we then determine whether each such account is to be accounted for individually or whether such accounts will be assembled into pools based on common risk characteristics. We consider expected prepayments and estimate the amount and timing of undiscounted expected principal, interest and other cash flows (expected at acquisition) for each acquired portfolio based on our proprietary models, and then subsequently aggregate portfolios of accounts into pools. We determine the excess of the pool's scheduled contractual principal and contractual interest payments over all cash flows expected at acquisition as an amount that should not be accreted (nonaccretable difference). The remaining amount, representing the excess of the pool's cash flows expected to be collected over the amount paid, is accreted into income recognized on finance receivables over the remaining estimated life of the pool (accretable yield). ASC 310-30 requires that the excess of the contractual cash flows over expected cash flows, based on our estimates derived from our proprietary collection models, not be recognized as an adjustment of revenue or expense or on the balance sheet.
Each accounting pool is recorded at cost, which may include certain direct costs of acquisition paid to third parties, and is accounted for as a single unit for the recognition of income, payments applied to principal and loss provision. Once an accounting pool is established for a calendar quarter, individual receivable accounts are not added to the pool (unless replaced by the seller) or removed from the pool (unless sold or returned to the seller). ASC 310-30, utilizing the interest method, initially freezes the yield, estimated when the accounts are purchased, as the basis for subsequent impairment testing. The yield is estimated and periodically recalculated based on the timing and amount of anticipated cash flows using our proprietary collection models. Income on finance receivables is accrued quarterly based on each accounting pool's effective yield. Significant increases in expected future cash flows may be recognized prospectively, through an upward adjustment of the yield, over a pool's remaining life. Any increase to the yield then becomes the new benchmark for impairment testing. Under ASC 310-30, rather than lowering the estimated yield if the collection estimates are not received or projected to be received, the carrying value of a pool would be written down to maintain the then current yield and is shown as a reduction in revenue in the consolidated income statements with a corresponding
48
valuation allowance offsetting finance receivables, net, on the consolidated balance sheets. Cash flows greater than the interest accrual will reduce the carrying value of the accounting pool. This reduction in carrying value is defined as payments applied to principal (also referred to as principal amortization). Likewise, cash flows that are less than the interest accrual will accrete the carrying balance. Generally, we do not record accretion in the first six to twelve months of the estimated life of the pool; accordingly, we utilize either the cost recovery method or cash method when necessary to prevent accretion as permitted by ASC 310-30. Under the cash method, revenue is recognized as it would be under the interest method up to the amount of cash collections. Under the cost recovery method, no revenue is recognized until we have fully collected the cost of the pool, or until such time that we consider the collections to be probable and estimable and begin to recognize income based on the interest method as described above. We also use the cost recovery method when collections on a particular pool of accounts cannot be reasonably estimated.
A pool can become fully amortized (zero carrying balance on the balance sheet) while still generating cash collections. In this case, all cash collections are recognized as revenue when received.
We establish valuation allowances, if necessary, for acquired accounts subject to ASC 310-10. Valuation allowances are established only subsequent to acquisition of the accounts.
We implement the accounting for income recognized on finance receivables under ASC 310-30 as follows. We create each accounting pool using our projections of estimated cash flows and expected economic life. We then compute the effective yield that fully amortizes the pool over a reasonable expectation of its economic life based on the current projections of estimated cash flows. As actual cash flow results are recorded, we balance those results to the data contained in our proprietary models to ensure accuracy, then review each pool watching for trends, actual performance versus projections and curve shape (a graphical depiction of the timing of cash flows), regularly re-forecasting future cash flows utilizing our statistical models. The review process is primarily performed by our finance staff; however, our operational and statistical staff is also involved, providing updated statistical input and cash projections to the finance staff. If there is a significant increase in expected cash flows, we will recognize the effect of the increase prospectively through an increase in yield. If a valuation allowance had been previously recognized for that pool, the allowance is reversed before recording any prospective yield adjustments. If the over performance is considered more of an acceleration of cash flows (a timing difference), we will: a) adjust estimated future cash flows downward which effectively extends the amortization period to fall within a reasonable expectation of the pool's economic life, b) adjust future cash flow projections as noted previously coupled with an increase in yield in order for the amortization period to fall within a reasonable expectation of the pool's economic life, or c) take no action at all if the amortization period falls within a reasonable expectation of the pool's expected economic life. To the extent there is underperformance, we will record an allowance if the underperformance is significant and will also consider revising estimated future cash flows based on current period information, or take no action if the pool's amortization period is reasonable and falls within the currently projected economic life.
Valuation of Acquired Intangibles and Goodwill
In accordance with ASC Topic 350, “Intangibles-Goodwill and Other” (“ASC 350”), we amortize intangible assets over their estimated useful lives. Goodwill, pursuant to ASC 350, is not amortized but rather is reviewed for impairment annually or earlier if indicators of potential impairment exist. The review of goodwill for potential impairment is highly subjective and requires that: (1) goodwill is allocated to various reporting units of our business to which it relates; and (2) we estimate the fair value of those reporting units to which the goodwill relates and then determine the book value of those reporting units. During the review, we also consider qualitative factors that may have an impact on the final assessment regarding potential impairment. If the estimated fair value of reporting units with allocated goodwill is determined to be less than their book value, we are required to estimate the fair value of all identifiable assets and liabilities of those reporting units in a manner similar to a purchase price allocation for an acquired business.
This may require independent valuation of certain unrecognized assets. Once this process is complete, the amount of goodwill impairment, if any, can be determined.
Income Taxes
We follow the guidance of ASC 740 as it relates to the provision for income taxes and uncertainty in income taxes. Accordingly, we record a tax provision for the anticipated tax consequences of the reported results of operations. In accordance with ASC 740, the provision for income taxes is computed using the asset and liability method, under which deferred tax assets and liabilities are recognized for the expected future tax consequences of temporary differences between the financial reporting and tax basis of assets and liabilities, and for operating losses and tax credit carry-forwards. Deferred tax assets and liabilities are measured using the currently enacted tax rates that apply to taxable income in effect for the years in which those tax assets are expected to be realized or settled. The evaluation of a tax position in accordance with the guidance is a two-step process. The first step is recognition: the enterprise determines whether it is more-likely-than-not that a tax position will be sustained upon examination, including
49
resolution of any related appeals or litigation processes, based on the technical merits of the position. In evaluating whether a tax position has met the more-likely-than-not recognition threshold, the enterprise should presume that the position will be examined by the appropriate taxing authority that would have full knowledge of all relevant information. The second step is measurement: a tax position that meets the more-likely-than-not recognition threshold is measured to determine the amount of benefit to recognize in the financial statements. The tax position is measured as the largest amount of benefit that is greater than fifty percent likely of being realized upon ultimate settlement. Tax positions that previously failed to meet the more-likely-than-not recognition threshold should be recognized in the first subsequent financial reporting period in which that threshold is met. Previously recognized tax positions that no longer meet the more-likely-than-not recognition threshold should be derecognized in the first subsequent financial reporting period in which that threshold is no longer met. We record interest and penalties related to unrecognized tax benefits as a component of income tax expense.
In the event that all or part of the deferred tax assets are determined not to be realizable in the future, a valuation allowance would be established and charged to earnings in the period such determination is made. If we subsequently realize deferred tax assets that were previously determined to be unrealizable, the respective valuation allowance would be reversed, resulting in a positive adjustment to earnings or a decrease in goodwill in the period such determination is made. The calculation of tax liabilities involves significant judgment in estimating the impact of uncertainties in the application of complex tax laws. Resolution of these uncertainties in a manner inconsistent with our expectations could have a material impact on our results of operations and financial position.
For domestic income tax purposes, we recognize revenue using the cost recovery method with respect to our debt purchasing business. We believe cost recovery to be an acceptable method for companies in the bad debt purchasing industry. Under the cost recovery method, collections on finance receivables are applied first to principal to reduce the finance receivables to zero before any income is recognized.
Item 3. | Quantitative and Qualitative Disclosure About Market Risk |
Interest Rate Risk
We are subject to interest rate risk from outstanding borrowings on our variable rate credit facility. We assess this interest rate risk by estimating the increase in interest expense that would occur due to an increase in short-term interest rates. The average borrowings on our variable rate credit facility were $192.5 million and $398.7 million for the three months ended June 30, 2014 and 2013, respectively. Assuming a 200 basis point increase in interest rates, for example, interest expense would have increased by $1.0 million and $2.0 million for the three months ended June 30, 2014 and 2013, respectively, resulting in a decrease in income before income taxes of 1.6% and 2.8%, respectively. As of June 30, 2014 and December 31, 2013, we had $190.0 million and $195.0 million, respectively, of variable rate debt outstanding on our credit facility. We did not have any other variable rate debt outstanding as of June 30, 2014. We had no interest rate hedging programs in place for the three or six months ended June 30, 2014 and 2013. Significant increases in future interest rates on our variable rate credit facility could lead to a material decrease in future earnings assuming all other factors remained constant.
Currency Exchange Risk
We are subject to currency exchange risk from our UK subsidiary, PRA UK. It conducts business in the Pound Sterling, but we report our financial results in U.S. dollars. Significant fluctuations in exchange rates between the U.S. dollar and the Pound Sterling may adversely affect our net income. In the three months ended June 30, 2014 and 2013, PRA UK revenues were 1.8% and 1.4% of consolidated revenues, respectively. We had no currency exchange risk hedging programs in place for the three or six months ended June 30, 2014 or 2013.
50
Item 4. | Controls and Procedures |
Evaluation of Disclosure Controls and Procedures. We maintain disclosure controls and procedures (as defined in Exchange Act Rules 13a-15(e) and 15d-15(e)) that are designed to ensure that information required to be disclosed in our Exchange Act reports is recorded, processed, summarized and reported within the time periods specified in the SEC’s rules and forms, and that such information is accumulated and communicated to our management, including our Chief Executive Officer and Chief Financial and Administrative Officer, as appropriate, to allow timely decisions regarding required disclosure. In designing and evaluating the disclosure controls and procedures, management recognized that any controls and procedures, no matter how well designed and operated, can provide only reasonable assurance of achieving the desired control objectives, and management necessarily was required to apply its judgment in evaluating the cost-benefit relationship of possible controls and procedures. Also, controls may become inadequate because of changes in conditions and the degree of compliance with the policies or procedures may deteriorate. We conducted an evaluation, under the supervision and with the participation of our Chief Executive Officer and Chief Financial and Administrative Officer, of the effectiveness of our disclosure controls and procedures as of the end of the period covered by this report. Based on this evaluation, the Chief Executive Officer and Chief Financial and Administrative Officer have concluded that, as of June 30, 2014, our disclosure controls and procedures were effective.
Changes in Internal Control Over Financial Reporting. There was no change in our internal control over financial reporting that occurred during the quarter ended June 30, 2014 that has materially affected, or is reasonably likely to materially affect, our internal control over financial reporting.
PART II. OTHER INFORMATION
Item 1. Legal Proceedings
We are from time to time subject to routine legal claims and proceedings, most of which are incidental to the ordinary course of our business. We initiate lawsuits against customers and are occasionally countersued by them in such actions. Also, customers, either individually, as members of a class action, or through a governmental entity on behalf of customers, may initiate litigation against us in which they allege that we have violated a state or federal law in the process of collecting on an account. From time to time, other types of lawsuits are brought against us.
No litigation was commenced during the period covered by this report that the Company believes could reasonably be expected to have a material adverse effect on its financial condition, results of operations and cash flows. Refer to Note 9 “Commitments and Contingencies” of our Consolidated Financial Statements for material developments with respect to legal proceedings previously disclosed with respect to prior periods.
Item 1A. Risk Factors
An investment in our common stock involves a high degree of risk. You should carefully consider the specific risk factors listed under Part I, Item 1A of our 2013 Annual Report on Form 10-K filed on February 28, 2014, together with all other information included herein or incorporated in our reports filed with the SEC. Any such risks may materialize, and additional risks not known to us, or that we now deem immaterial, may arise. In such event, our business, financial condition, results of operations or prospects could be materially adversely affected. If that occurs, the market price of our common stock could fall, and you could lose all or part of your investment.
Our acquisition of Aktiv exposes us to risks which could harm our business, operating results, and financial condition.
On July 16, 2014, we completed the purchase of the outstanding equity of Aktiv. We have incurred, and will continue to incur, significant costs in connection with the Aktiv acquisition and we have diverted, and will continue to divert, significant management resources in an effort to integrate the operations of Aktiv with that of our own. This could have a negative impact on our ability to manage our existing operations or pursue alternative strategic transactions, which could have a negative effect on our business, results of operations and financial condition.
We financed the Aktiv acquisition with a combination of cash, seller financing and funding from our domestic revolving credit facility. Additionally, we assumed Aktiv’s current corporate debt.
As a result of the financing of the Aktiv acquisition, our debt has increased significantly, both in terms of the total amount of our borrowings and as a percentage of the equity of the combined company. This increase in our indebtedness could increase our vulnerability to general adverse economic and industry conditions, make it more difficult for us to satisfy obligations with respect to our indebtedness, require us to dedicate a substantial portion of our cash flow from operations to service payments on
51
our debt, limit our flexibility to react to changes in our business and the industry in which we operate, place us at a competitive disadvantage with our competitors that have less debt and limit our ability to borrow additional funds.
Other than our existing UK business, PRA UK, which we acquired in 2012, we have limited operating experience in international markets. The international nature of the Aktiv acquisition expands the risks and uncertainties described elsewhere in this section, including the following:
• | changes in local political, economic, social and labor conditions in Europe and Canada; |
• | foreign exchange controls that might prevent us from repatriating cash earned in countries outside the United States; |
• | currency exchange rate fluctuations and our ability to manage these fluctuations through a foreign exchange risk management program; |
• | different employee/employer relationships, laws and regulations and existence of employment tribunals; |
• | laws and regulations imposed by foreign governments, including those relating to governing data security, sharing and transfer; |
• | potentially adverse tax consequences resulting from changes in tax laws in the foreign jurisdictions in which we operate; |
• | logistical, communications and other challenges caused by distance and cultural and language differences, making it harder to do business in certain jurisdictions; and |
• | risks related to crimes, strikes, riots, civil disturbances, terrorist attacks and wars in a variety of new geographical locations. |
Any one of these factors could have an adverse effect on our business, results of operations and financial condition.
If we do not successfully integrate Aktiv into our business operations, our business could be adversely affected.
As a result of the Aktiv acquisition, we will need to successfully integrate the operations of Aktiv with our business operations. Integrating the operations of Aktiv with that of our own will be a complex and time-consuming process. Prior to the Aktiv acquisition, Aktiv operated independently, with its own business, corporate culture, locations, employees and systems. There may be substantial difficulties, costs and delays involved in any integration of the business of Aktiv with that of our own. These may include:
• | distracting management from day-to-day operations; |
• | potential incompatibility of corporate cultures; |
• | an inability to achieve synergies as planned; |
• | changes in the combined business due to potential divestitures or other requirements imposed by antitrust regulators; |
• | costs and delays in implementing common systems and procedures; and |
• | increased difficulties in managing our business due to the addition of international locations. |
Many of these risks may be accentuated because the vast majority of Aktiv’s operations, employees and customers are located outside of the United States. Any one or all of these factors may increase operating costs or lower anticipated financial performance. Many of these factors are also outside of our control. Achieving anticipated synergies and the potential benefits underlying our reasons for the Aktiv acquisition will depend on successful integration of the businesses. The failure to integrate the business operations of Aktiv successfully could have a material adverse effect on our business, financial condition and results of operations.
Compliance with complex foreign and U.S. laws and regulations that apply to our international operations, which will be expanded as a result of the Aktiv acquisition, could increase our cost of doing business in international jurisdictions.
Although we currently have international operations, as a result of the Aktiv acquisition, we will operate on an expanded international basis with additional offices or activities in a number of new jurisdictions throughout Europe. We will face increased exposure to risks inherent in conducting business internationally, including compliance with complex foreign and U.S. laws and regulations that apply to our international operations, which could increase our cost of doing business in international jurisdictions. These laws and regulations include anti-corruption laws such as the Foreign Corrupt Practices Act (“FCPA”), the UK Bribery Act of 2010 and other local laws prohibiting corrupt payments to governmental officials, and those related to taxation. The FCPA and similar antibribery laws in other jurisdictions generally prohibit U.S.-based companies and their intermediaries from making improper payments to non-U.S. officials for the purpose of obtaining or retaining business. The U.K. Bribery Act of 2010 prohibits certain entities from making improper payments to governmental officials and to commercial entities. Given the high level of complexity of these laws, there is a risk that we may inadvertently breach certain provisions of these laws, for example through fraudulent or negligent behavior of individual employees, our failure to comply with certain formal documentation requirements, or otherwise. Violations of these laws and regulations could result in fines and penalties; criminal sanctions against us, our officers, or our employees; prohibitions on the conduct of our business and on our ability to offer our products and services in one or more countries, and could also adversely affect our brand, our international expansion efforts, our ability to attract and retain employees, our business and our operating results. Although we have implemented, and, with respect to new jurisdictions we will enter as a result of the Aktiv acquisition, will implement, policies and procedures designed to ensure compliance with these laws and
52
regulations, there can be no assurance that our employees, contractors or agents will not violate our policies. Additionally, in accordance with the European Union Capital Requirements Directive (“CRD IV”), the Swedish Banking and Financing Business Act and the Supervision of Credit and Investment Institutions Act, certain of our European Union ("EU") subsidiaries are subject to capital adequacy requirements as prescribed by the Swedish Financial Supervisory Authority (“SFSA”), because they are included in a group that includes an entity which has been determined to be an EU authorized credit institution (AK Nordic AB), thereby resulting in their supervision by the SFSA and regulatory capital requirements.
Exchange rate fluctuations could adversely affect our results of operations and financial position.
Because we conduct business in currencies other than U.S. dollars but report our financial results in U.S. dollars, we face exposure to fluctuations in currency exchange rates. This exposure is likely to increase as a result of the Aktiv acquisition, as a larger portion of our operating expenses will likely be incurred in non-U.S. dollar currencies. As a result, significant fluctuations in exchange rates between the U.S. dollar and foreign currencies may adversely affect our net income. We may or may not implement a hedging program related to currency exchange rate fluctuations. Additionally, if implemented, such hedging programs could expose us to additional risks that could adversely affect our financial condition and results of operations.
Net capital requirements pursuant to the CRD IV may impede the business operations of our subsidiaries.
A sub-group of the company’s EU subsidiaries has been determined by the SFSA to be financial institutions subject to consolidated capital requirements under EU Directives and regulatory oversight, supervision and reporting requirements by the SFSA. These and other similar provisions of applicable law may limit our ability to withdrawal capital from our subsidiaries. Additionally, we have limited experience with the regulatory oversight, supervision, and reporting requirements of the SFSA.
We will incur significant transaction, integration and restructuring costs in connection with the Aktiv acquisition.
We will incur significant transaction costs related to the Aktiv acquisition. In addition, the combined business will incur integration and restructuring costs as we integrate the Aktiv businesses with our businesses. Although we expect that the realization of benefits related to the integration of the businesses may offset these costs over time, no assurances can be made that this net benefit will be achieved in the near term, or at all, which could adversely affect our financial condition and results of operations.
A write-off of a significant portion of the goodwill recorded in connection with the Aktiv acquisition would negatively affect the combined company’s financial results.
We expect to record a significant amount of goodwill as a result of the Aktiv acquisition. On at least an annual basis, we assess whether there has been an impairment in the value of goodwill. If the carrying value of goodwill exceeds its estimated fair value, impairment is deemed to have occurred, and the carrying value of goodwill is written down to fair value. Under current accounting rules, this would result in a charge to the combined company’s operating earnings. Accordingly, any determination requiring the write-off of a significant portion of goodwill recorded in connection with the Aktiv acquisition would negatively affect our results of operations.
We may have exposure to additional tax liabilities as a result of the Aktiv acquisition.
As a multinational corporation, we are subject to income taxes as well as non-income based taxes, in both the United States and various foreign jurisdictions. Significant judgment is required in determining our worldwide provision for income taxes and other tax liabilities. Changes in tax laws or tax rulings may have a significant adverse impact on our effective tax rate. Recent proposals by the current U.S. administration for fundamental U.S. international tax reform, including without limitation provisions that would limit the ability of U.S. multinationals to defer U.S. taxes on foreign income, if enacted, could have a significant adverse impact on our effective tax rate following the Aktiv acquisition.
Prior to the Aktiv acquisition, Aktiv has been a privately-held company and its new obligations of being a part of a public company may require significant resources and management attention.
Upon consummation of the Aktiv acquisition, Aktiv and its subsidiaries became subsidiaries of our consolidated company and will need to comply with the Sarbanes-Oxley Act of 2002 and the rules and regulations subsequently implemented by the SEC and the Public Company Accounting Oversight Board. We will need to ensure that Aktiv establishes and maintains effective disclosure controls as well as internal controls and procedures for financial reporting, and such compliance efforts may be costly and may divert the attention of management.
53
Item 2. Unregistered Sales of Equity Securities and Use of Proceeds
None.
Item 3. Defaults Upon Senior Securities
None.
Item 4. Mine Safety Disclosures
Not applicable.
Item 5. Other Information
None.
Item 6. Exhibits
3.1 | Third Amended and Restated Certificate of Incorporation of Portfolio Recovery Associates, Inc. |
10.1 | Third Amendment, entered into as of June 5, 2014, to Credit Agreement dated as of December 19, 2012 by and among Portfolio Recovery Associates, Inc., the domestic wholly-owned subsidiaries of Portfolio Recovery Associates, Inc. as guarantors (Portfolio Recovery Associates, LLC, PRA Holding I, LLC, PRA Location Services, a Virginia general partnership, PRA Government Services, LLC, PRA Receivables Management, LLC, PRA Holding II, LLC, PRA Holding III, LLC, Miniseries, LLC, PRA Professional Services, LLC, PRA Financial Services, LLC, Claims Compensation Bureau, LLC, PRA Auto Funding, LLC, PRA Holding IV, LLC, PLS Holding I, LLC, and PLS Holding II, LLC), Bank of America, N.A. as administrative agent, swing line lender, and l/c issuer, Wells Fargo Bank, N.A. and Suntrust Bank as co-syndication agents, Embank, National Association, as documentation agent, Merrill Lynch, Pierce, Jenner & Smith Incorporated, Wells Fargo Securities, LLC, and Suntrust Robinson Humphrey, Inc. as joint lead arrangers and joint book managers, and the lenders named therein (Incorporated by reference to Exhibit 10.1 of the Current Report on Form 8-K filed on June 6, 2014). |
31.1 | Section 302 Certifications of Chief Executive Officer. |
31.2 | Section 302 Certifications of Chief Financial and Administrative Officer. |
32.1 | Section 906 Certifications of Chief Executive Officer and Chief Financial and Administrative Officer. |
101.INS | XBRL Instance Document |
101.SCH | XBRL Taxonomy Extension Schema Document |
101.CAL | XBRL Taxonomy Extension Calculation Linkable Document |
101.LAB | XBRL Taxonomy Extension Label Linkable Document |
101.PRE | XBRL Taxonomy Extension Presentation Linkable Document |
101.DEF | XBRL Taxonomy Extension Definition Linkbase Document |
54
SIGNATURES
Pursuant to the requirements of the Exchange Act, the registrant has duly caused this report to be signed on its behalf by the undersigned, thereunto duly authorized.
PORTFOLIO RECOVERY ASSOCIATES, INC. | ||||||
(Registrant) | ||||||
Date: August 5, 2014 | By: | /s/ Steven D. Fredrickson | ||||
Steven D. Fredrickson Chief Executive Officer, President and Chairman of the Board of Directors (Principal Executive Officer) | ||||||
Date: August 5, 2014 | By: | /s/ Kevin P. Stevenson | ||||
Kevin P. Stevenson Chief Financial and Administrative Officer, Executive Vice President, Treasurer and Assistant Secretary (Principal Financial and Accounting Officer) | ||||||
55