Attached files
| file | filename |
|---|---|
| 8-K - FORM 8-K - HOME BANCORP, INC. | tv492146_8k.htm |
Exhibit 99.1

Burkenroad Investment Conference April 27, 2018
Certain comments in this presentation contain certain forward looking statements (as defined in the Securities Exchange Act of 1934 and the regulations thereunder) . Forward looking statements are not historical facts but instead represent only the beliefs, expectations or opinions of Home Bancorp, Inc . and its management regarding future events, many of which, by their nature, are inherently uncertain . Forward looking statements may be identified by the use of such words as : “believe”, “expect”, “anticipate”, “intend”, “plan”, “estimate”, or words of similar meaning, or future or conditional terms such as “will”, “would”, “should”, “could”, “may”, “likely”, “probably”, or “possibly . ” Forward looking statements include, but are not limited to, financial projections and estimates and their underlying assumptions ; statements regarding plans, objectives and expectations with respect to future operations, products and services ; and statements regarding future performance . Such statements are subject to certain risks, uncertainties and assumption, many of which are difficult to predict and generally are beyond the control of Home Bancorp, Inc . and its management, that could cause actual results to differ materially from those expressed in, or implied or projected by, forward looking statements . The following factors, among others, could cause actual results to differ materially from the anticipated results or other expectations expressed in the forward looking statements : ( 1 ) economic and competitive conditions which could affect the volume of loan originations, deposit flows and real estate values ; ( 2 ) the levels of noninterest income and expense and the amount of loan losses ; ( 3 ) competitive pressure among depository institutions increasing significantly ; ( 4 ) changes in the interest rate environment causing reduced interest margins ; ( 5 ) general economic conditions, either nationally or in the markets in which Home Bancorp, Inc . is or will be doing business, being less favorable than expected ; ( 6 ) political and social unrest, including acts of war or terrorism ; ( 7 ) we may not fully realize all the benefits we anticipated in connection with our acquisitions of other institutions or our assumptions made in connection therewith may prove to be inaccurate ; or ( 8 ) legislation or changes in regulatory requirements adversely affecting the business of Home Bancorp, Inc . Home Bancorp, Inc . undertakes no obligation to update these forward looking statements to reflect events or circumstances that occur after the date on which such statements were made . As used in this report, unless the context otherwise requires, the terms “we,” “our,” “us,” or the “Company” refer to Home Bancorp, Inc . and the term the “Bank” refers to Home Bank, N . A . , a national bank and wholly owned subsidiary of the Company . In addition, unless the context otherwise requires, references to the operations of the Company include the operations of the Bank . For a more detailed description of the factors that may affect Home Bancorp’s operating results or the outcomes described in these forward - looking statements, we refer you to our filings with the Securities and Exchange Commission, including our annual report on Form 10 - K for the year ended December 31 , 2017 . Home Bancorp assumes no obligation to update the forward - looking statements made during this presentation . For more information, please visit our website www . home 24 bank . com . Non - GAAP Information This presentation contains financial information determined by methods other than in accordance with generally accepted accounting principles (“GAAP”) . The Company's management uses this non - GAAP financial information in its analysis of the Company's performance . In this presentation, information is included which excludes acquired loans, intangible assets, impact of the gain on the sale of a banking center and the impact of merger - related expenses . Management believes the presentation of this non - GAAP financial information provides useful information that is helpful to a full understanding of the Company’s financial position and core operating results . This non - GAAP financial information should not be viewed as a substitute for financial information determined in accordance with GAAP, nor are they necessarily comparable to non - GAAP financial information presented by other companies .
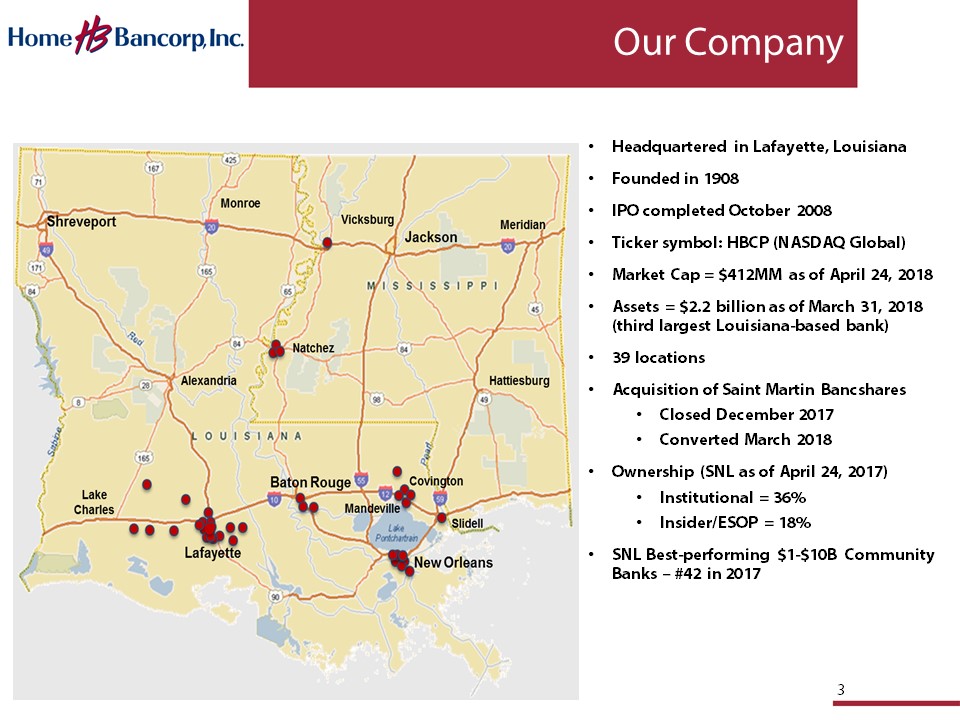
3 • Headquartered in Lafayette, Louisiana • Founded in 1908 • IPO completed October 2008 • Ticker symbol: HBCP (NASDAQ Global) • Market Cap = $ 412MM as of April 24, 2018 • Assets = $2.2 billion as of March 31, 2018 (third largest Louisiana - based bank) • 39 locations • Acquisition of Saint Martin Bancshares • Closed December 2017 • Converted March 2018 • Ownership (SNL as of April 24, 2017) • Institutional = 36% • Insider/ESOP = 18% • SNL Best - performing $1 - $10B Community Banks – #42 in 2017 Our Company
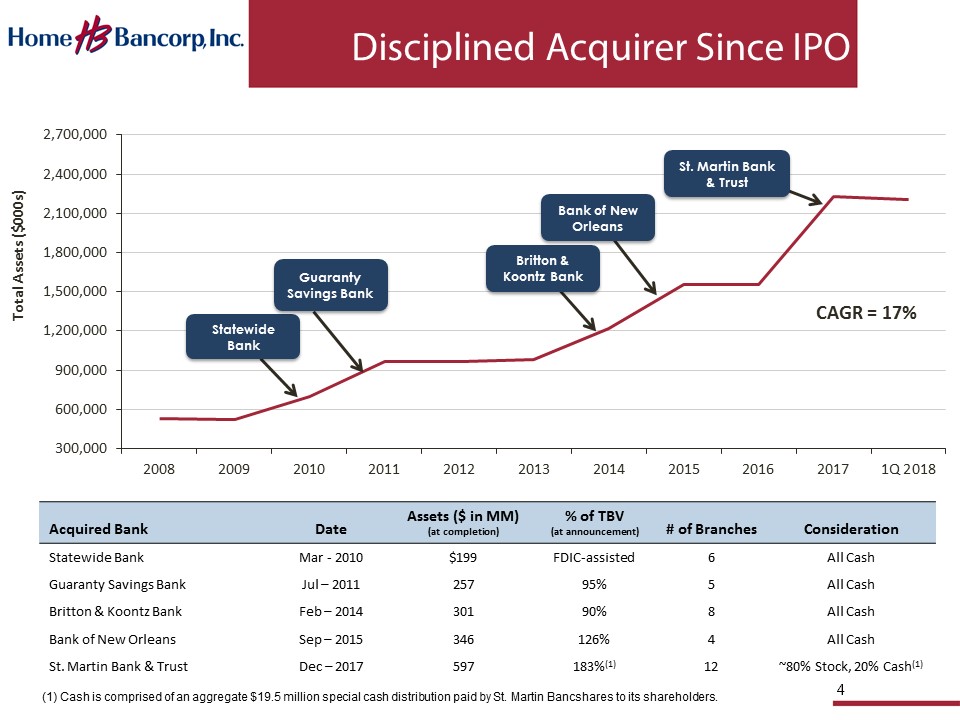
4 Disciplined Acquirer Since IPO 300,000 600,000 900,000 1,200,000 1,500,000 1,800,000 2,100,000 2,400,000 2,700,000 2008 2009 2010 2011 2012 2013 2014 2015 2016 2017 1Q 2018 Total Assets ($000s) St. Martin Bank & Trust Statewide Bank Britton & Koontz Bank Bank of New Orleans CAGR = 17% Guaranty Savings Bank Acquired Bank Date Assets ($ in MM) (at completion) % of TBV (at announcement) # of Branches Consideration Statewide Bank Mar - 2010 $199 FDIC - assisted 6 All Cash Guaranty Savings Bank Jul – 2011 257 95% 5 All Cash Britton & Koontz Bank Feb – 2014 301 90% 8 All Cash Bank of New Orleans Sep – 2015 346 126% 4 All Cash St. Martin Bank & Trust Dec – 2017 597 183% (1) 12 ~80% Stock, 20% Cash (1) (1) Cash is comprised of an aggregate $19.5 million special cash distribution paid by St. Martin Bancshares to its shareholders.
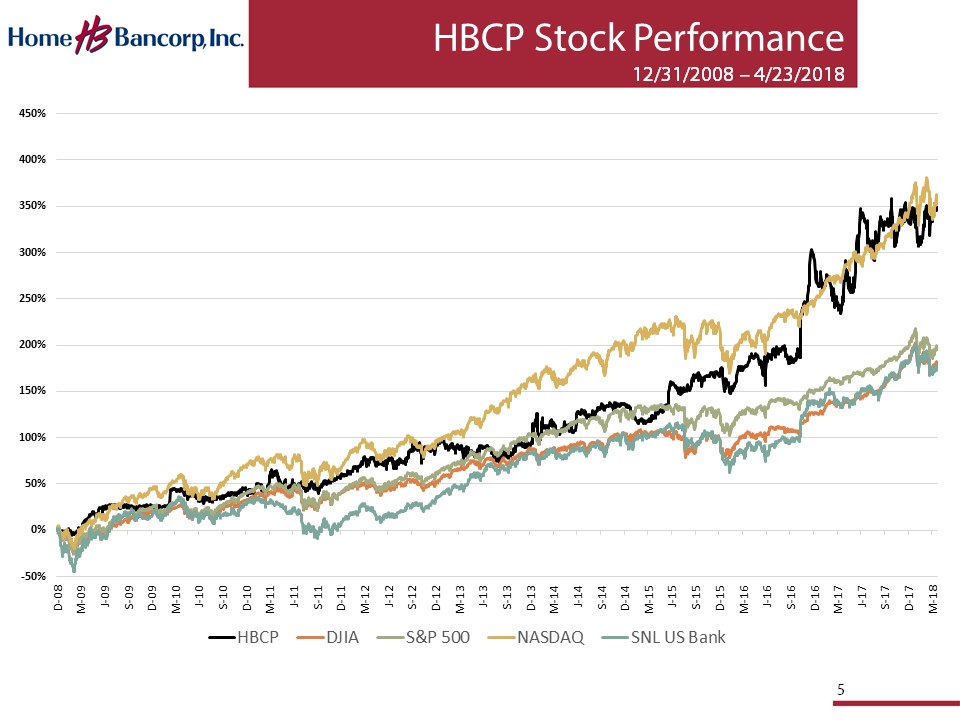
HBCP Stock Performance 12/31/2008 – 4/23/2018 5 -50% 0% 50% 100% 150% 200% 250% 300% 350% 400% 450% D-08 M-09 J-09 S-09 D-09 M-10 J-10 S-10 D-10 M-11 J-11 S-11 D-11 M-12 J-12 S-12 D-12 M-13 J-13 S-13 D-13 M-14 J-14 S-14 D-14 M-15 J-15 S-15 D-15 M-16 J-16 S-16 D-16 M-17 J-17 S-17 D-17 M-18 HBCP DJIA S&P 500 NASDAQ SNL US Bank
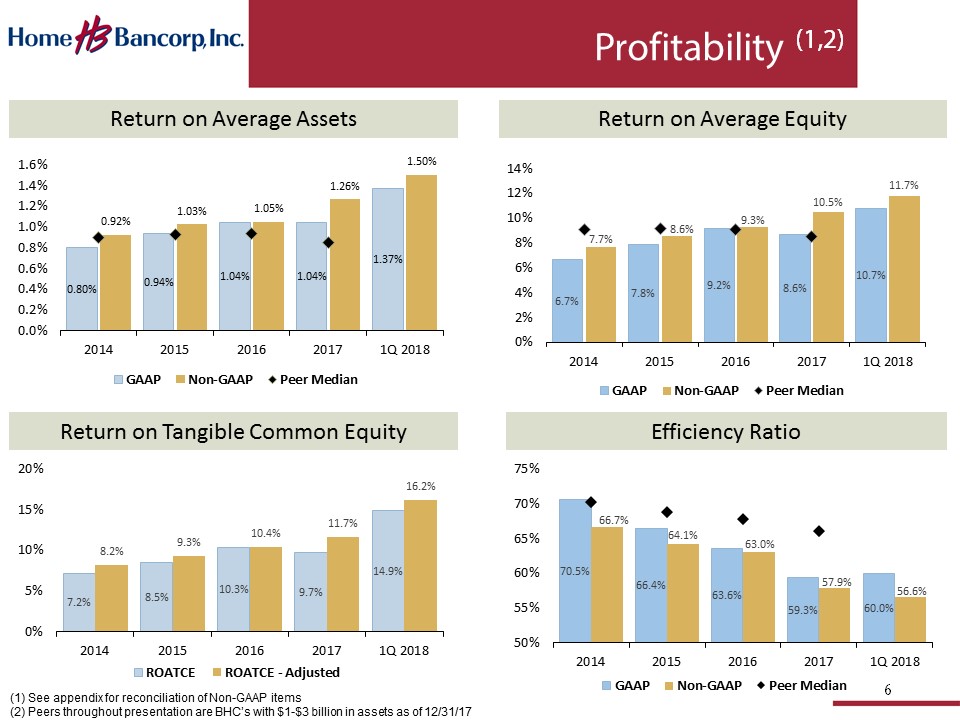
70.5% 66.4% 63.6% 59.3% 60.0% 66.7% 64.1% 63.0% 57.9% 56.6% 50% 55% 60% 65% 70% 75% 2014 2015 2016 2017 1Q 2018 GAAP Non-GAAP Peer Median 6 Profitability (1,2) Return on Tangible Common Equity Efficiency Ratio Return on Average Assets Return on Average Equity 6.7% 7.8% 9.2% 8.6% 10.7% 7.7% 8.6% 9.3% 10.5% 11.7% 0% 2% 4% 6% 8% 10% 12% 14% 2014 2015 2016 2017 1Q 2018 GAAP Non-GAAP Peer Median (1) See appendix for reconciliation of Non - GAAP items (2) Peers throughout presentation are BHC’s with $1 - $3 billion in assets as of 12/31/17 0.80% 0.94% 1.04% 1.04% 1.37% 0.92% 1.03% 1.05% 1.26% 1.50% 0.0% 0.2% 0.4% 0.6% 0.8% 1.0% 1.2% 1.4% 1.6% 2014 2015 2016 2017 1Q 2018 GAAP Non-GAAP Peer Median 7.2% 8.5% 10.3% 9.7% 14.9% 8.2% 9.3% 10.4% 11.7% 16.2% 0% 5% 10% 15% 20% 2014 2015 2016 2017 1Q 2018 ROATCE ROATCE - Adjusted

7 Quarterly Financial Highlights 1Q 2017 2Q 2017 3Q 2017 4Q 2017 1Q 2018 GAAP Net Income Basis: Reported Net Income ($000’s) $5,006 $4,486 $4,090 $3,242 $7,464 Diluted EPS $0.69 $0.62 $0.56 $ 0.41 $0.81 ROA 1.28% 1.15% 1.04% 0.73% 1.37% ROE 11.0% 9.6% 8.5% 5.9% 10.7% ROATCE (1) 12.0% 10.5% 9.4% 7.0% 14.9% Efficiency Ratio 58.7% 61.2% 62.1% 56.2% 60.0% Ending Per Share Stock Price $33.75 $42.52 $41.82 $43.22 $43.17 Non - GAAP Net Income Basis: (2) Adjusted Net Income ($000’s) $4,759 $4,778 $4,315 $6,573 $ 8,158 Adjusted Diluted EPS $0.66 $0.66 $0.59 $0.84 $0.88 Adjusted ROA 1.22% 1.22% 1.10% 1.48% 1.50% Adjusted ROE 10.4% 10.2% 9.0% 12.0% 11.7% Adjusted ROATCE (3) 11.5% 11.2% 9.9% 13.8% 16.2% Adjusted Efficiency Ratio 59.9% 59.7% 60.8% 52.5% 56.6% (1) ROATCE is a Non - GAAP ratio. Ratio reflects GAAP net income to tangible common equity. See appendix. (2) Income and ratios are Non - GAAP and have been adjusted to remove certain income and expense items. See appendix. (3) Ratio reflects Non - GAAP net income to tangible common equity.
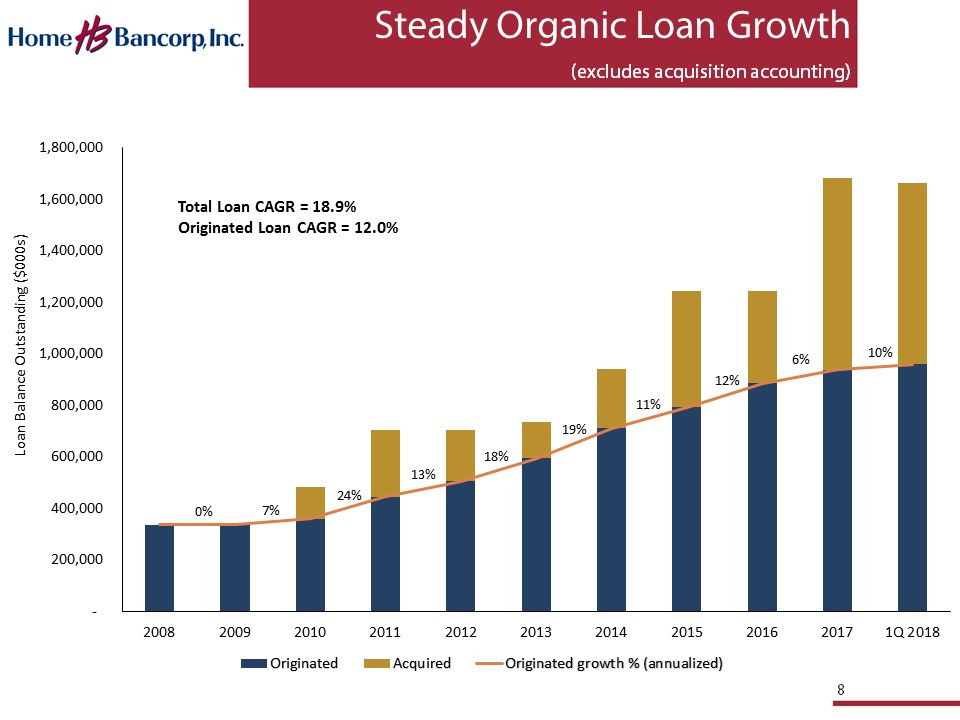
0% 7% 24% 13% 18% 19% 11% 12% 6% 10% - 200,000 400,000 600,000 800,000 1,000,000 1,200,000 1,400,000 1,600,000 1,800,000 2008 2009 2010 2011 2012 2013 2014 2015 2016 2017 1Q 2018 Loan Balance Outstanding ($000s) Originated Acquired Originated growth % (annualized) 8 Steady Organic Loan Growth (excludes acquisition accounting) Total Loan CAGR = 18.9% Originated Loan CAGR = 12.0%
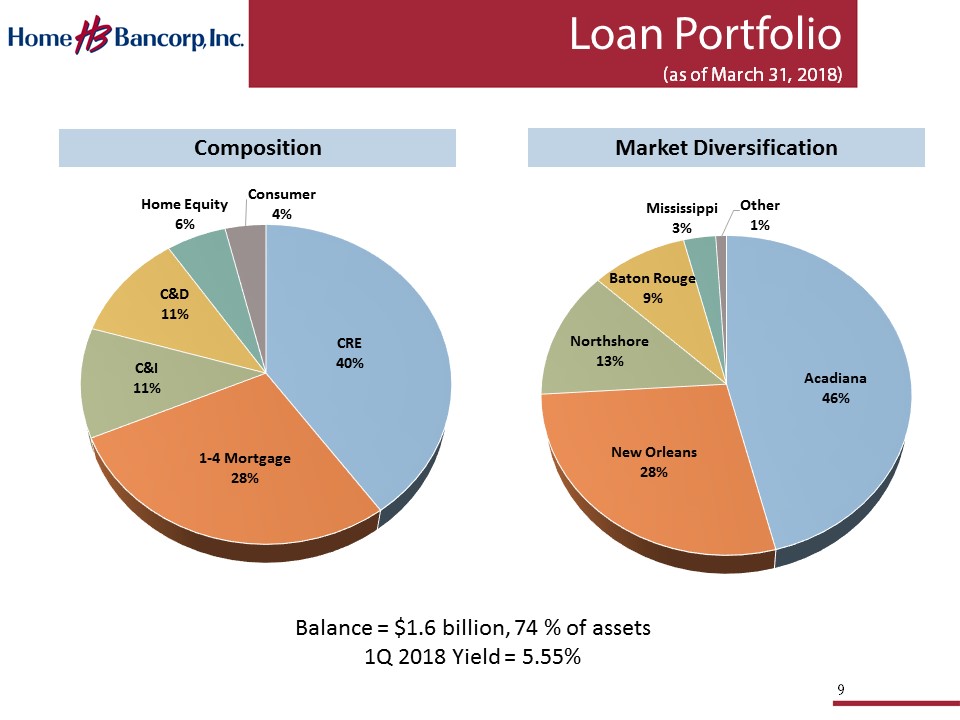
9 Loan Portfolio (as of March 31, 2018) CRE 40% 1 - 4 Mortgage 28% C&I 11% C&D 11% Home Equity 6% Consumer 4% Balance = $1.6 billion, 74 % of assets 1Q 2018 Yield = 5.55% Composition Acadiana 46% New Orleans 28% Northshore 13% Baton Rouge 9% Mississippi 3% Other 1% Market Diversification
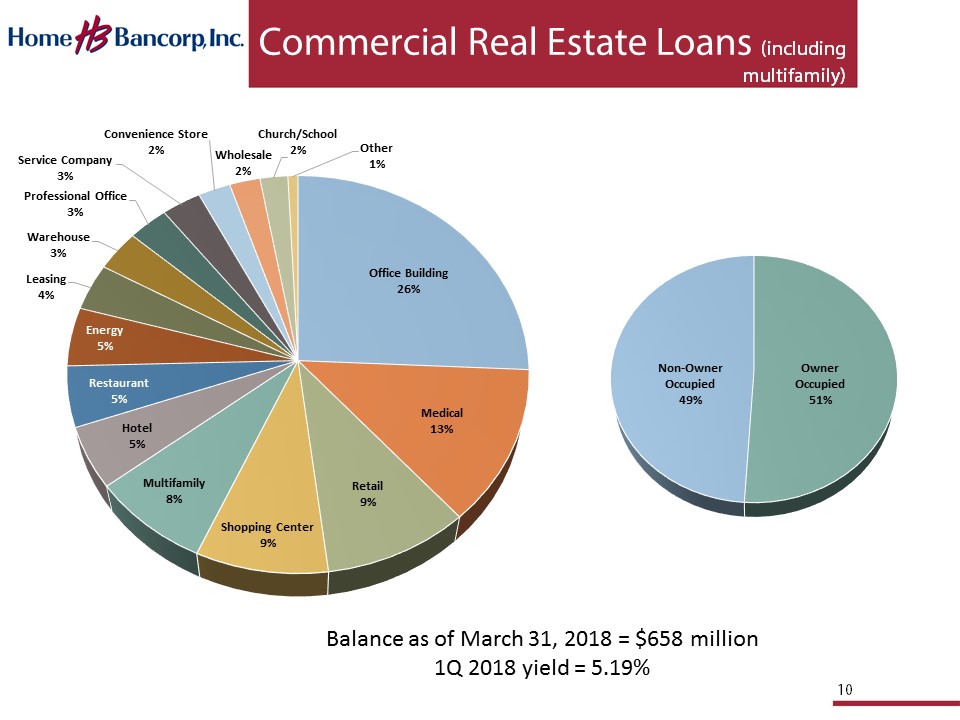
10 Commercial Real Estate Loans (including multifamily) Office Building 26% Medical 13% Retail 9% Shopping Center 9% Multifamily 8% Hotel 5% Restaurant 5% Energy 5% Leasing 4% Warehouse 3% Professional Office 3% Service Company 3% Convenience Store 2% Wholesale 2% Church/School 2% Other 1% Balance as of March 31, 2018 = $658 million 1Q 2018 yield = 5.19% Owner Occupied 51% Non - Owner Occupied 49%
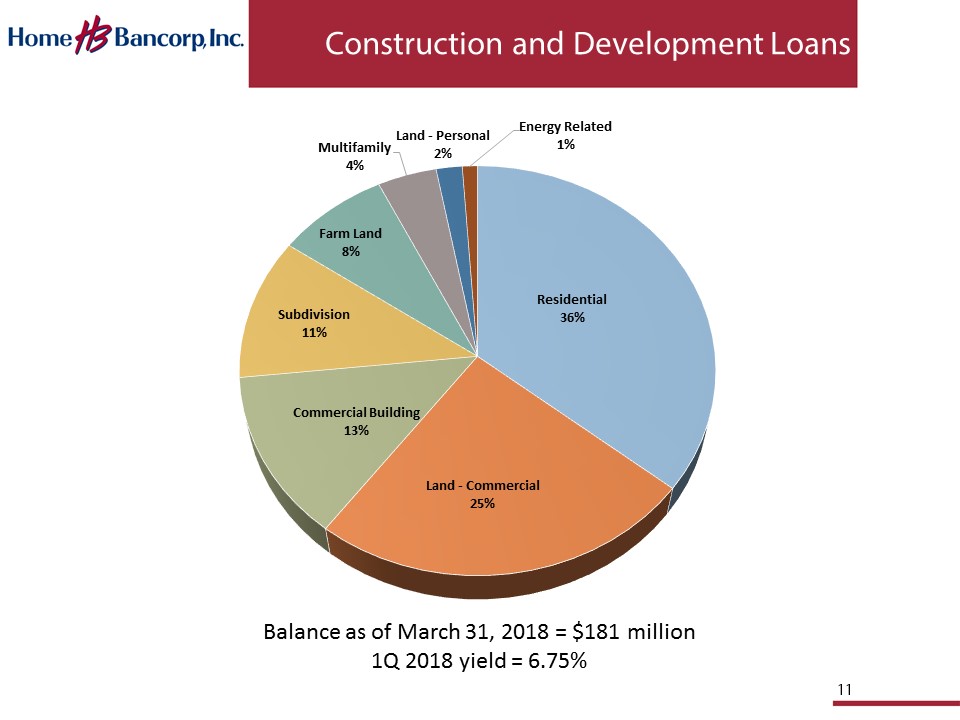
11 Construction and Development Loans Residential 36% Land - Commercial 25% Commercial Building 13% Subdivision 11% Farm Land 8% Multifamily 4% Land - Personal 2% Energy Related 1% Balance as of March 31, 2018 = $181 million 1Q 2018 yield = 6.75%
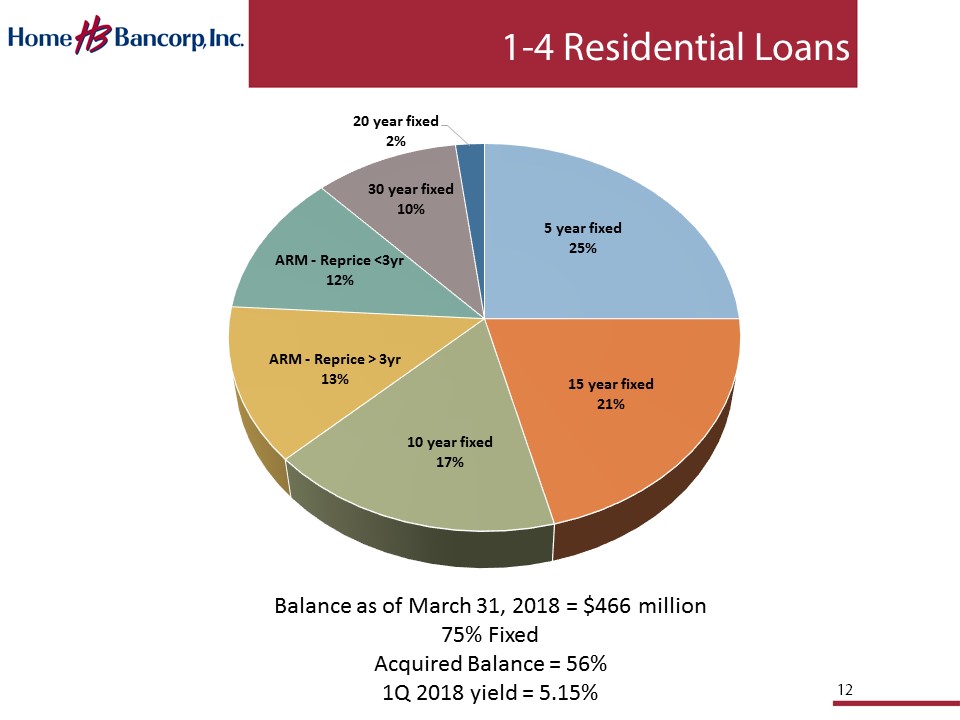
12 1 - 4 Residential Loans 5 year fixed 25% 15 year fixed 21% 10 year fixed 17% ARM - Reprice > 3yr 13% ARM - Reprice <3yr 12% 30 year fixed 10% 20 year fixed 2% Balance as of March 31, 2018 = $466 million 75% Fixed Acquired Balance = 56% 1Q 2018 yield = 5.15%
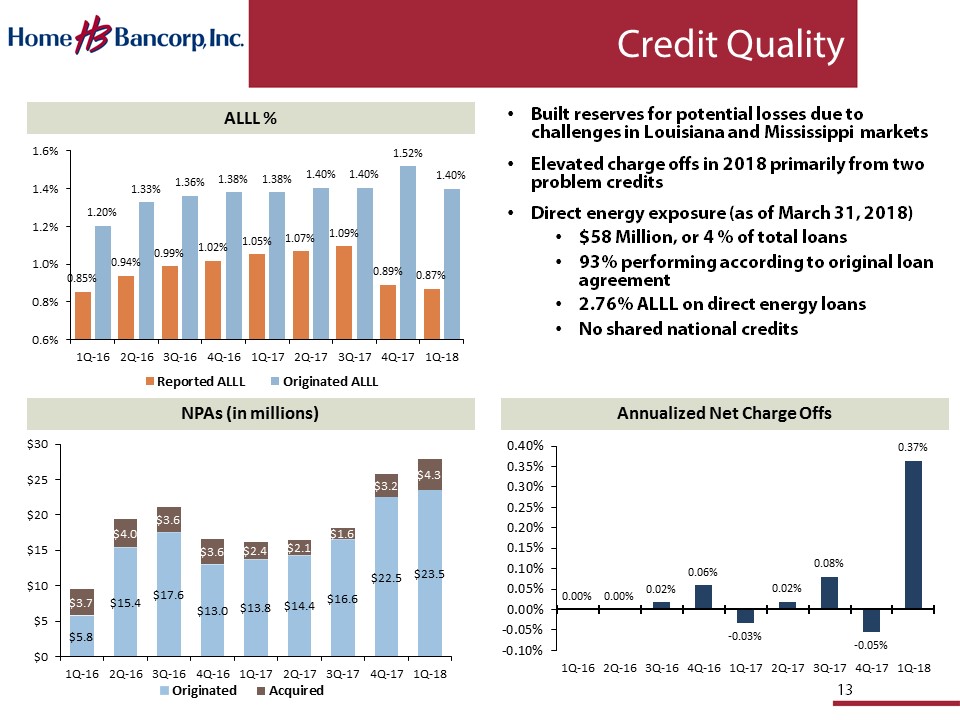
• Built reserves for potential losses due to challenges in Louisiana and Mississippi markets • Elevated charge offs in 2018 primarily from two problem credits • Direct energy e xposure (as of March 31, 2018) • $58 Million, or 4 % of total loans • 93% performing according to original loan agreement • 2.76% ALLL on d irect energy loans • No shared national credits Credit Quality 0.85% 0.94% 0.99% 1.02% 1.05% 1.07% 1.09% 0.89% 0.87% 1.20% 1.33% 1.36% 1.38% 1.38% 1.40% 1.40% 1.52% 1.40% 0.6% 0.8% 1.0% 1.2% 1.4% 1.6% 1Q-16 2Q-16 3Q-16 4Q-16 1Q-17 2Q-17 3Q-17 4Q-17 1Q-18 Reported ALLL Originated ALLL $5.8 $15.4 $17.6 $13.0 $13.8 $14.4 $16.6 $22.5 $23.5 $3.7 $4.0 $3.6 $3.6 $2.4 $2.1 $1.6 $3.2 $4.3 $0 $5 $10 $15 $20 $25 $30 1Q-16 2Q-16 3Q-16 4Q-16 1Q-17 2Q-17 3Q-17 4Q-17 1Q-18 Originated Acquired 0.00% 0.00% 0.02% 0.06% - 0.03% 0.02% 0.08% - 0.05% 0.37% -0.10% -0.05% 0.00% 0.05% 0.10% 0.15% 0.20% 0.25% 0.30% 0.35% 0.40% 1Q-16 2Q-16 3Q-16 4Q-16 1Q-17 2Q-17 3Q-17 4Q-17 1Q-18 Annualized Net Charge Offs NPAs (in millions) ALLL % 13
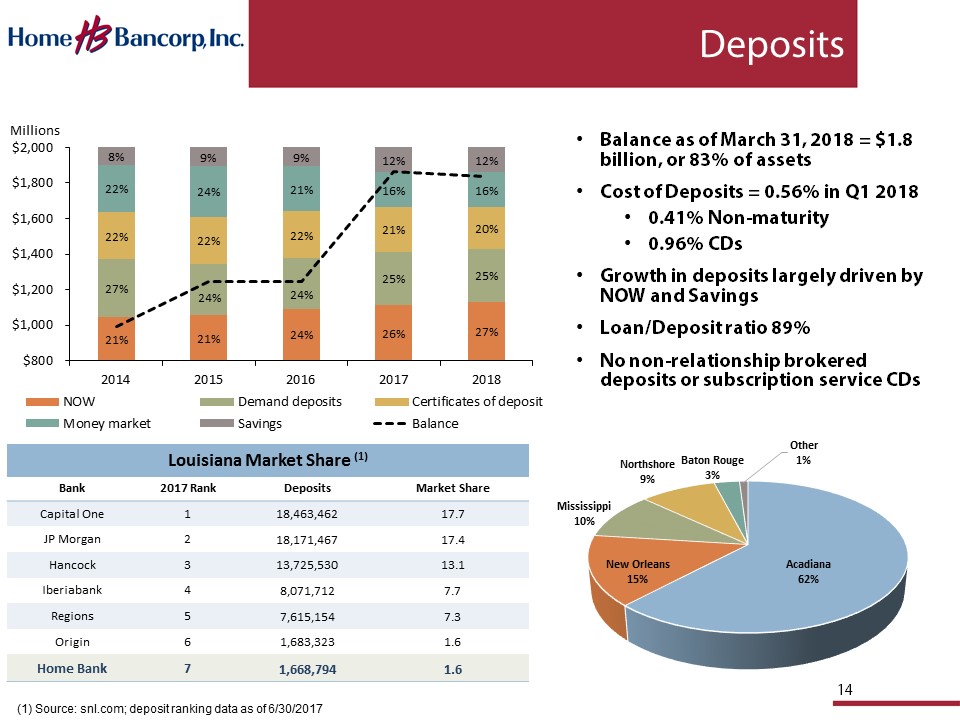
14 • Balance as of March 31, 2018 = $1.8 billion, or 83 % of assets • Cost of Deposits = 0.56% in Q1 2018 • 0.41% Non - maturity • 0.96% CDs • Growth in deposits largely driven by NOW and Savings • Loan/Deposit ratio 89% • No non - relationship brokered deposits or subscription service CDs Deposits Bank 2017 Rank Deposits Market Share Capital One 1 18,463,462 17.7 JP Morgan 2 18,171,467 17.4 Hancock 3 13,725,530 13.1 Iberiabank 4 8,071,712 7.7 Regions 5 7,615,154 7.3 Origin 6 1,683,323 1.6 Home Bank 7 1,668,794 1.6 Louisiana Market Share (1) 21% 21% 24% 26% 27% 27% 24% 24% 25% 25% 22% 22% 22% 21% 20% 22% 24% 21% 16% 16% 8% 9% 9% 12% 12% $800 $1,000 $1,200 $1,400 $1,600 $1,800 $2,000 2014 2015 2016 2017 2018 Millions NOW Demand deposits Certificates of deposit Money market Savings Balance Acadiana 62% New Orleans 15% Mississippi 10% Northshore 9% Baton Rouge 3% Other 1% (1) Source: snl.com; deposit ranking data as of 6/30/2017
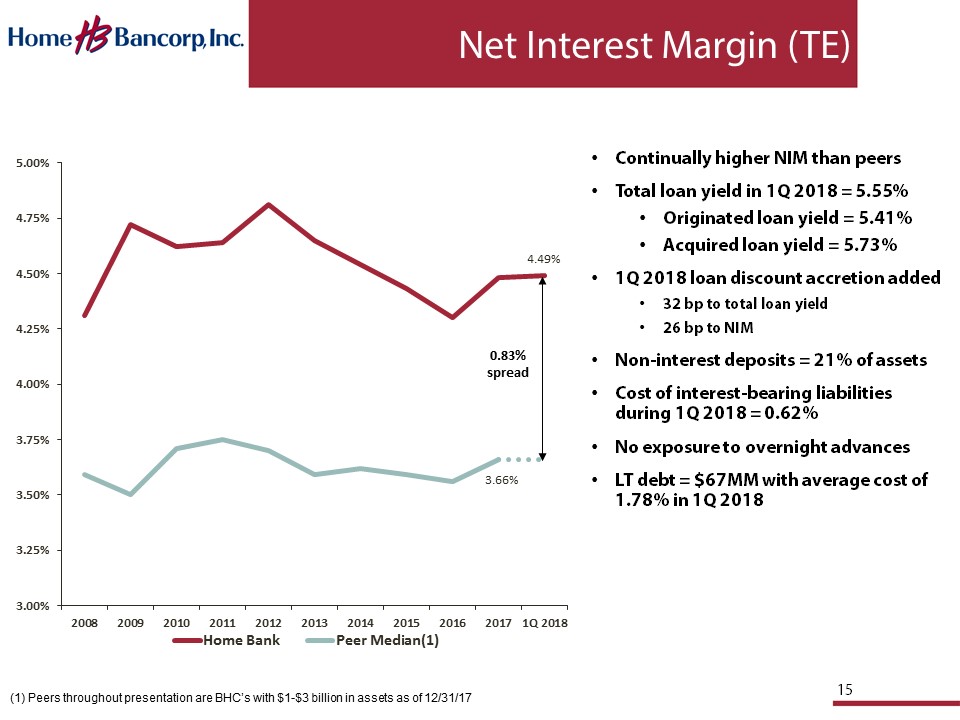
4.49% 3.66% 3.00% 3.25% 3.50% 3.75% 4.00% 4.25% 4.50% 4.75% 5.00% 2008 2009 2010 2011 2012 2013 2014 2015 2016 2017 1Q 2018 Home Bank Peer Median(1) 15 Net Interest Margin (TE) • Continually higher NIM than peers • Total loan yield in 1Q 2018 = 5.55% • Originated loan yield = 5.41% • Acquired loan yield = 5.73% • 1Q 2018 loan discount accretion added • 32 bp to total loan yield • 26 bp to NIM • Non - interest deposits = 21% of assets • Cost of interest - bearing liabilities during 1Q 2018 = 0.62% • No exposure to overnight advances • LT debt = $67MM with average cost of 1.78% in 1Q 2018 0.83% spread (1) Peers throughout presentation are BHC’s with $1 - $3 billion in assets as of 12/31/17
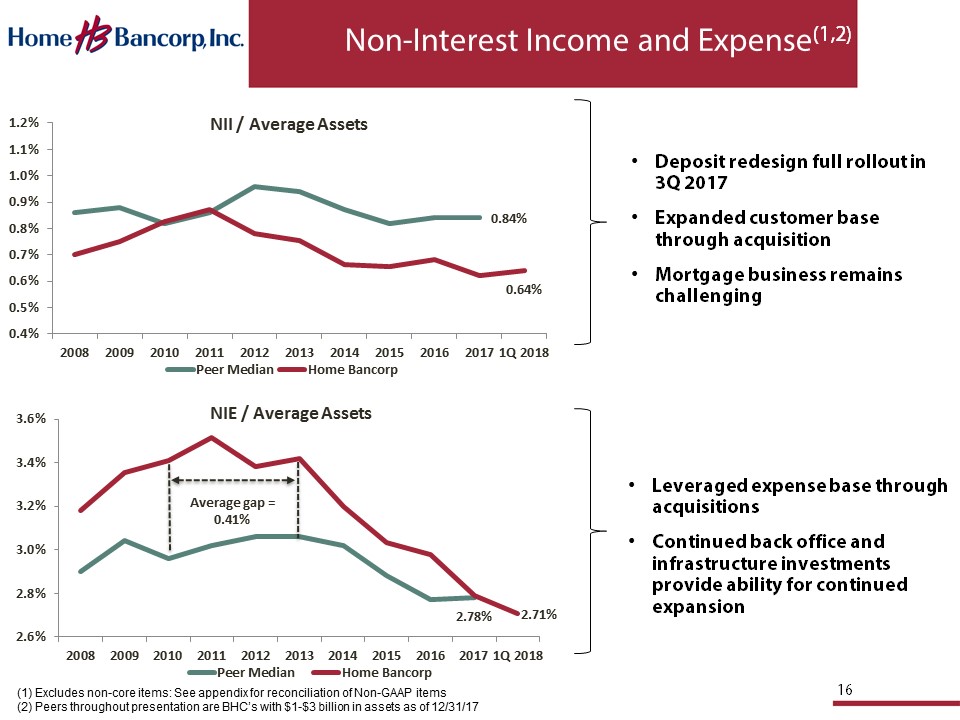
16 • Deposit redesign full rollout in 3Q 2017 • Expanded customer base through acquisition • Mortgage business remains challenging Non - Interest Income and Expense (1,2) 2.78% 2.71% 2.6% 2.8% 3.0% 3.2% 3.4% 3.6% 2008 2009 2010 2011 2012 2013 2014 2015 2016 2017 1Q 2018 NIE / Average Assets Peer Median Home Bancorp Average gap = 0.41% 0.84% 0.64% 0.4% 0.5% 0.6% 0.7% 0.8% 0.9% 1.0% 1.1% 1.2% 2008 2009 2010 2011 2012 2013 2014 2015 2016 2017 1Q 2018 NII / Average Assets Peer Median Home Bancorp • Leveraged expense base through acquisitions • Continued back office and infrastructure investments provide ability for continued expansion (1) Excludes non - core items: See appendix for reconciliation of Non - GAAP items (2) Peers throughout presentation are BHC’s with $1 - $3 billion in assets as of 12/31/17

17 • Balance = $276MM, or 13% of assets • Q1 2018 TE Yield = 2.38%, up 4 basis points from previous quarter • Unrealized loss at period end was $3.5MM, or 1.2% of book value • 95% of investments are held as AFS • Effective duration = 2.6 years • Tax Cuts and Jobs Act of 2017 reduced the corporate tax rate from 35% to 21% • Lowered TE investment y ield in 1st quarter by 8 basis points • Decreased TE NIM by only 1 basis point Investment Portfolio (as of March 31, 2018) CMO 50% MBS 33% Municipal 13% Agency 4%
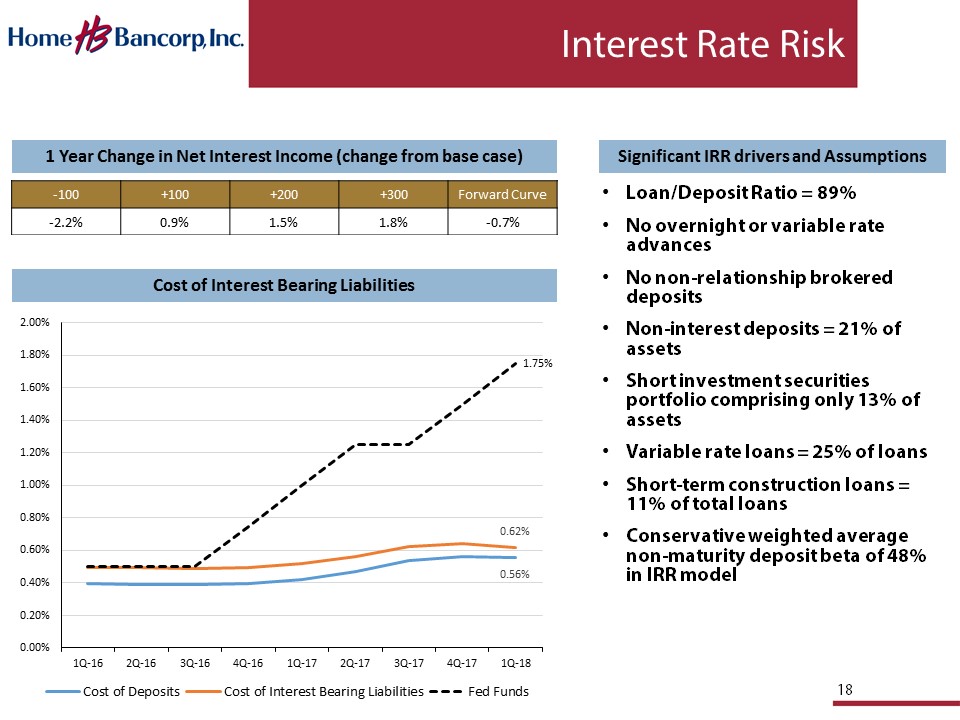
18 • Loan/Deposit Ratio = 89% • No overnight or variable rate advances • No non - relationship brokered deposits • Non - interest deposits = 21% of assets • Short investment securities portfolio comprising only 13% of assets • Variable rate loans = 25% of loans • Short - term construction loans = 11% of total loans • Conservative weighted average non - maturity deposit beta of 48% in IRR model Interest Rate Risk - 100 +100 +200 +300 Forward Curve - 2.2% 0.9% 1.5% 1.8% - 0.7% 1 Year Change in Net Interest Income (change from base case) Cost of Interest Bearing Liabilities Significant IRR drivers and Assumptions 0.56% 0.62% 1.75% 0.00% 0.20% 0.40% 0.60% 0.80% 1.00% 1.20% 1.40% 1.60% 1.80% 2.00% 1Q-16 2Q-16 3Q-16 4Q-16 1Q-17 2Q-17 3Q-17 4Q-17 1Q-18 Cost of Deposits Cost of Interest Bearing Liabilities Fed Funds

19 Share Information 2Q 2017 3Q 2017 4Q 2017 1Q 2018 12 Months Diluted EPS (GAAP) $0.62 $0.56 $0.41 $0.81 $2.40 Adjusted Diluted EPS (Non - GAAP) (1) $0.66 $0.59 $0.84 $0.88 $2.97 Ending Share Price $42.52 $41.82 $43.22 $43.17 Dividend Yield 1.3% 1.3% 1.3% 1.4% P/ BV 167% 161% 146% 143% P/TBV (2) 178% 172% 194% 188% Home Bancorp Price / Earnings Share price as of 4/24/2018 $43.88 Next 4 quarters average analyst earnings estimate (adjusted) $3.56 Forward P/E based on median estimate (next 4 quarters) 12.3x (1) Excludes non - core income and expense (see appendix) (2) Non - GAAP ratio (see appendix)
20 • Strong earnings and shareholder returns • Conservative, well - managed credit culture • Solid track record since IPO • Well capitalized with capacity for continued growth • Home Bancorp capital ratios as of March 31, 2018 • Tier 1 leverage capital = 10.2% • Total risk based capital = 14.7 % • Patient and disciplined acquirer • Insider owners committed to continual improvement Investment Perspective

21

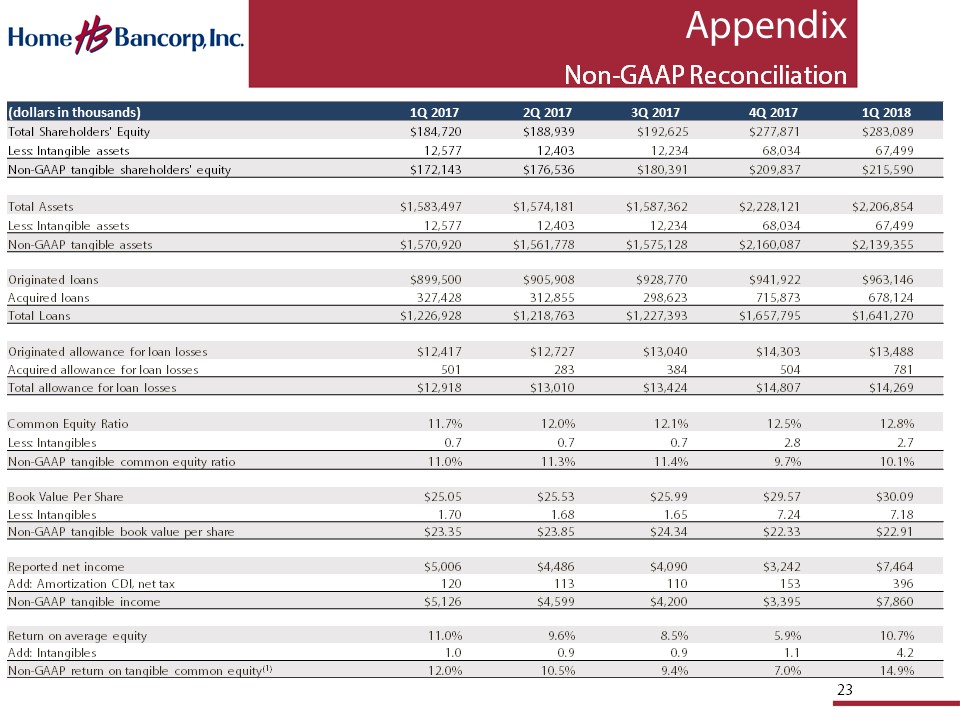
23 Appendix Non - GAAP Reconciliation (dollars in thousands) 1Q 2017 2Q 2017 3Q 2017 4Q 2017 1Q 2018 Total Shareholders' Equity $184,720 $188,939 $192,625 $277,871 $283,089 Less: Intangible assets 12,577 12,403 12,234 68,034 67,499 Non - GAAP tangible shareholders' equity $172,143 $176,536 $180,391 $209,837 $215,590 Total Assets $1,583,497 $1,574,181 $1,587,362 $2,228,121 $2,206,854 Less: Intangible assets 12,577 12,403 12,234 68,034 67,499 Non - GAAP tangible assets $1,570,920 $1,561,778 $1,575,128 $2,160,087 $2,139,355 Originated loans $899,500 $905,908 $928,770 $941,922 $963,146 Acquired loans 327,428 312,855 298,623 715,873 678,124 Total Loans $1,226,928 $1,218,763 $1,227,393 $ 1,657,795 $1,641,270 Originated allowance for loan losses $12,417 $ 12,727 $13,040 $14,303 $13,488 Acquired allowance for loan losses 501 283 384 504 781 Total allowance for loan losses $12,918 $ 13,010 $13,424 $14,807 $14,269 Common Equity Ratio 11.7% 12.0% 12.1% 12.5% 12.8% Less: Intangibles 0.7 0.7 0.7 2.8 2.7 Non - GAAP tangible common equity ratio 11.0% 11.3% 11.4% 9.7% 10.1% Book Value Per Share $25.05 $25.53 $25.99 $29.57 $30.09 Less: Intangibles 1.70 1.68 1.65 7.24 7.18 Non - GAAP tangible book value per share $23.35 $23.85 $24.34 $22.33 $22.91 Reported net income $5,006 $4,486 $4,090 $3,242 $7,464 Add: Amortization CDI, net tax 120 113 110 153 396 Non - GAAP tangible income $ 5,126 $4,599 $4,200 $3,395 $7,860 Return on average equity 11.0% 9.6% 8.5% 5.9% 10.7% Add: Intangibles 1.0 0.9 0.9 1.1 4.2 Non - GAAP return on tangible common equity (1) 12.0% 10.5% 9.4% 7 .0 % 14.9%
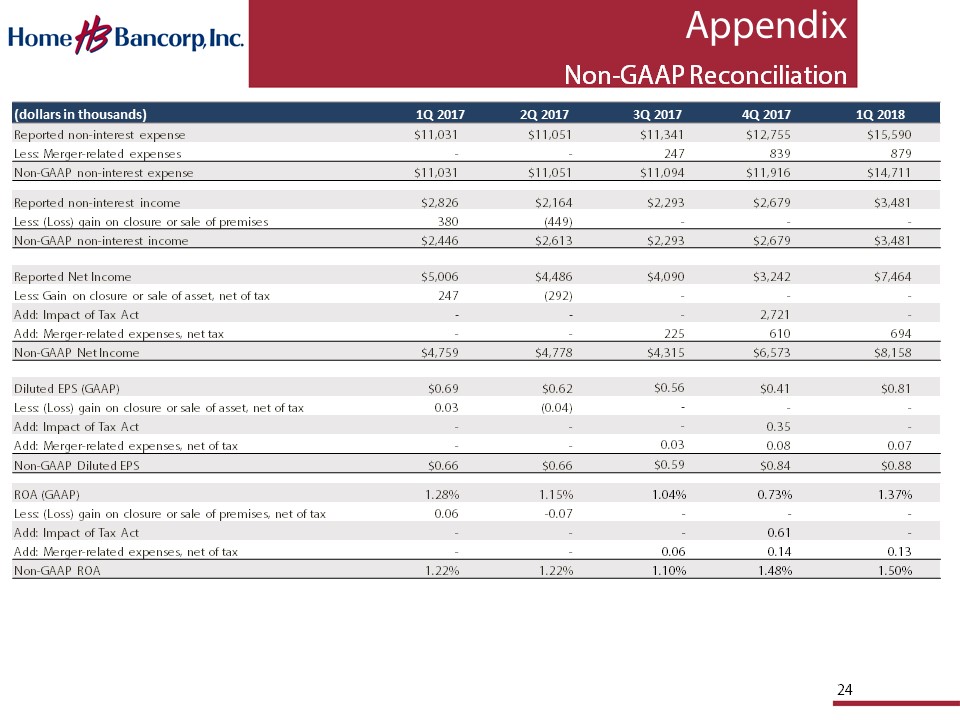
24 Appendix Non - GAAP Reconciliation (dollars in thousands) 1Q 2017 2Q 2017 3Q 2017 4Q 2017 1Q 2018 Reported non - interest expense $11,031 $11,051 $11,341 $12,755 $15,590 Less: Merger - related expenses - - 247 839 879 Non - GAAP non - interest expense $11,031 $11,051 $11,094 $11,916 $ 14,711 Reported non - interest income $2,826 $2,164 $2,293 $2,679 $3,481 Less: (Loss) gain on closure or sale of premises 380 (449) - - - Non - GAAP non - interest income $2,446 $2,613 $2,293 $2,679 $3,481 Reported Net Income $5,006 $4,486 $4,090 $3,242 $7,464 Less: Gain on closure or sale of asset, net of tax 247 (292) - - - Add: Impact of Tax Act - - - 2,721 - Add: Merger - related expenses, net tax - - 225 610 694 Non - GAAP Net Income $4,759 $4,778 $4,315 $6,573 $8,158 Diluted EPS (GAAP) $0.69 $0.62 $0.56 $ 0.41 $ 0.81 Less: (Loss) gain on closure or sale of asset, net of tax 0.03 (0.04 ) - - - Add: Impact of Tax Act - - - 0.35 - Add: Merger - related expenses, net of tax - - 0.03 0.08 0.07 Non - GAAP Diluted EPS $0.66 $0.66 $0.59 $ 0.84 $ 0.88 ROA (GAAP) 1.28% 1.15% 1.04% 0.73% 1.37% Less: (Loss) gain on closure or sale of premises, net of tax 0.06 - 0.07 - - - Add: Impact of Tax Act - - - 0.61 - Add: Merger - related expenses, net of tax - - 0.06 0.14 0.13 Non - GAAP ROA 1.22% 1.22% 1.10% 1.48% 1.50%
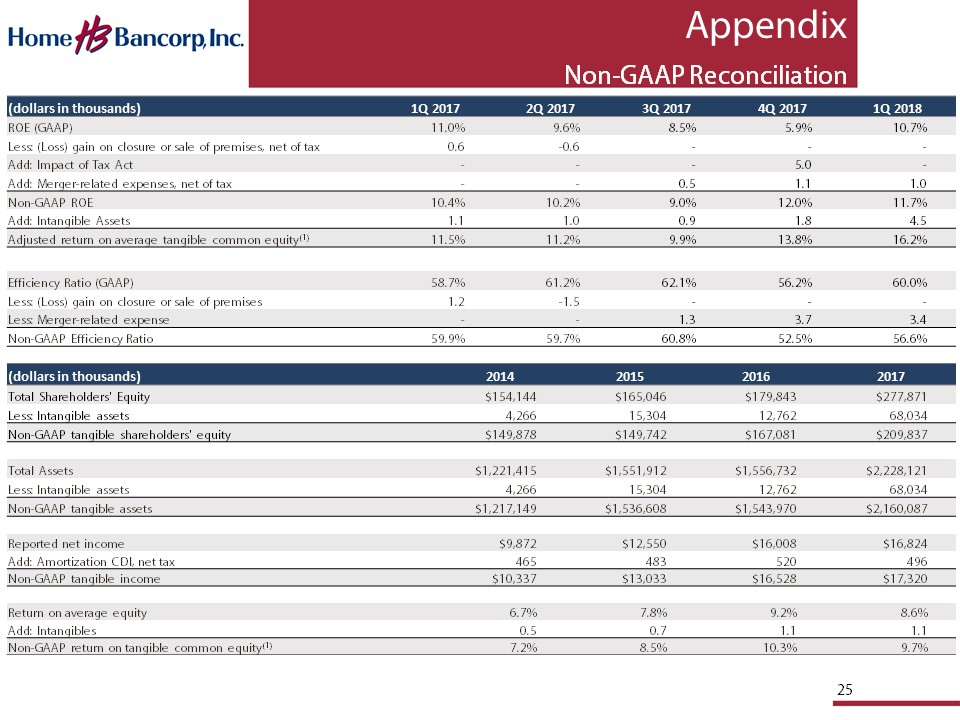
25 Appendix Non - GAAP Reconciliation (dollars in thousands) 1Q 2017 2Q 2017 3Q 2017 4Q 2017 1Q 2018 ROE (GAAP) 11.0% 9.6% 8.5% 5.9% 10.7% Less: (Loss) gain on closure or sale of premises, net of tax 0.6 - 0.6 - - - Add: Impact of Tax Act - - - 5.0 - Add: Merger - related expenses, net of tax - - 0.5 1.1 1.0 Non - GAAP ROE 10.4% 10.2% 9.0% 12.0% 11.7% Add: Intangible Assets 1.1 1.0 0.9 1.8 4.5 Adjusted return on average tangible common equity (1) 11.5% 11.2% 9.9% 13.8% 16.2% Efficiency Ratio (GAAP) 58.7% 61.2% 62.1% 56.2% 60.0% Less: (Loss) gain on closure or sale of premises 1.2 - 1.5 - - - Less: Merger - related expense - - 1.3 3.7 3.4 Non - GAAP Efficiency Ratio 59.9% 59.7% 60.8% 52.5% 56.6% (dollars in thousands) 2014 2015 2016 2017 Total Shareholders' Equity $154,144 $165,046 $179,843 $277,871 Less: Intangible assets 4,266 15,304 12,762 68,034 Non - GAAP tangible shareholders' equity $149,878 $149,742 $167,081 $209,837 Total Assets $1,221,415 $1,551,912 $1,556,732 $2,228,121 Less: Intangible assets 4,266 15,304 12,762 68,034 Non - GAAP tangible assets $1,217,149 $1,536,608 $1,543,970 $2,160,087 Reported net income $9,872 $12,550 $16,008 $16,824 Add: Amortization CDI, net tax 465 483 520 496 Non - GAAP tangible income $10,337 $13,033 $16,528 $17,320 Return on average equity 6.7% 7.8% 9.2% 8.6% Add: Intangibles 0.5 0.7 1.1 1.1 Non - GAAP return on tangible common equity (1) 7.2% 8.5% 10.3% 9.7%
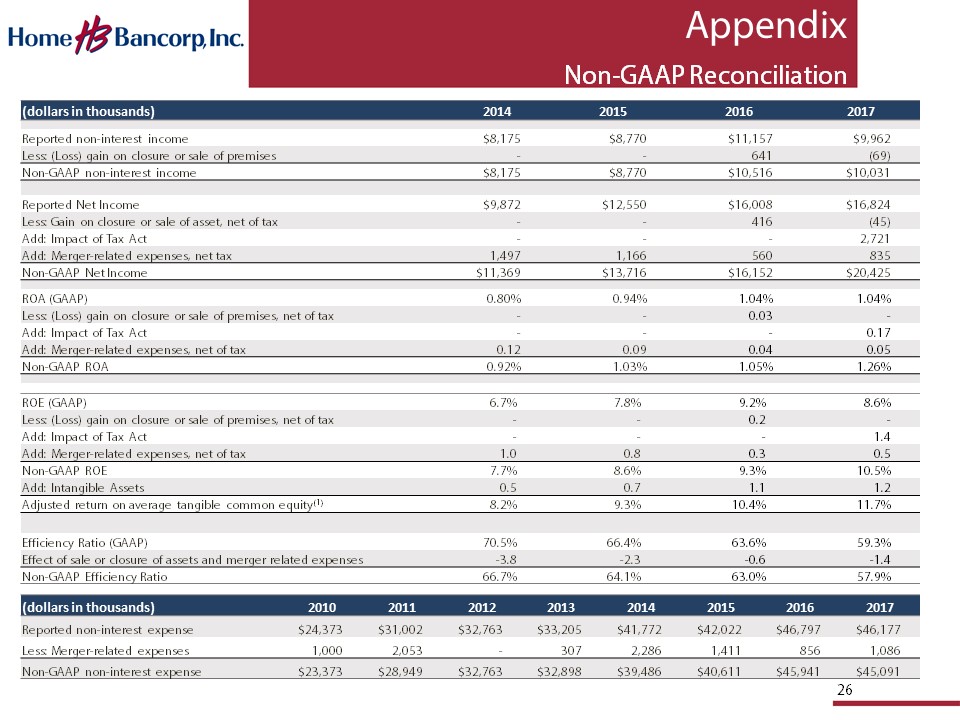
26 Appendix Non - GAAP Reconciliation (dollars in thousands) 2014 2015 2016 2017 Reported non - interest income $8,175 $8,770 $11,157 $9,962 Less: (Loss) gain on closure or sale of premises - - 641 (69) Non - GAAP non - interest income $8,175 $8,770 $10,516 $10,031 Reported Net Income $9,872 $12,550 $16,008 $16,824 Less: Gain on closure or sale of asset, net of tax - - 416 (45) Add: Impact of Tax Act - - - 2,721 Add: Merger - related expenses, net tax 1,497 1,166 560 835 Non - GAAP Net Income $11,369 $13,716 $16,152 $20,425 ROA (GAAP) 0.80% 0.94% 1.04% 1.04% Less: (Loss) gain on closure or sale of premises, net of tax - - 0.03 - Add: Impact of Tax Act - - - 0.17 Add: Merger - related expenses, net of tax 0.12 0.09 0.04 0.05 Non - GAAP ROA 0.92% 1.03% 1.05% 1.26% ROE (GAAP) 6.7% 7.8% 9.2% 8.6% Less: (Loss) gain on closure or sale of premises, net of tax - - 0.2 - Add: Impact of Tax Act - - - 1.4 Add: Merger - related expenses, net of tax 1.0 0.8 0.3 0.5 Non - GAAP ROE 7.7% 8.6% 9.3% 10.5% Add: Intangible Assets 0.5 0.7 1.1 1.2 Adjusted return on average tangible common equity (1) 8.2% 9.3% 10.4% 11.7% Efficiency Ratio (GAAP) 70.5% 66.4% 63.6% 59.3% Effect of sale or closure of assets and merger related expenses - 3.8 - 2.3 - 0.6 - 1.4 Non - GAAP Efficiency Ratio 66.7% 64.1% 63.0% 57.9% (dollars in thousands) 2010 2011 2012 2013 2014 2015 2016 2017 Reported non - interest expense $24,373 $31,002 $32,763 $33,205 $41,772 $42,022 $46,797 $46,177 Less: Merger - related expenses 1,000 2,053 - 307 2,286 1,411 856 1,086 Non - GAAP non - interest expense $23,373 $28,949 $32,763 $32,898 $39,486 $40,611 $45,941 $45,091