Attached files
| file | filename |
|---|---|
| EX-32 - EXHIBIT 32 - HOME BANCORP, INC. | dex32.htm |
| EX-23.2 - EXHIBIT 23.2 - HOME BANCORP, INC. | dex232.htm |
| EX-31.2 - EXHIBIT 31.2 - HOME BANCORP, INC. | dex312.htm |
| EX-23.1 - EXHIBIT 23.1 - HOME BANCORP, INC. | dex231.htm |
| EX-31.1 - EXHIBIT 31.1 - HOME BANCORP, INC. | dex311.htm |
Table of Contents
UNITED STATES
SECURITIES AND EXCHANGE COMMISSION
Washington, D.C. 20549
FORM 10-K
(Mark One)
| x | Annual report pursuant to Section 13 or 15(d) of the Securities Exchange Act of 1934 |
For the fiscal year ended: December 31, 2010
or
| ¨ | Transition report pursuant to Section 13 or 15(d) of the Securities Exchange Act of 1934 |
For the transition period from to
Commission File Number: 001-34190
HOME BANCORP, INC.
(Exact name of Registrant as specified in its charter)
| Louisiana | 71-1051785 | |
| (State or Other Jurisdiction of Incorporation or Organization) |
(I.R.S. Employer Identification Number) | |
| 503 Kaliste Saloom Road, Lafayette, Louisiana | 70508 | |
| (Address of Principal Executive Offices) | (Zip Code) | |
Registrant’s telephone number, including area code: (337) 237-1960
Securities registered pursuant to Section 12(b) of the Act:
| Title of each class |
Name of each exchange on which registered | |
| Common Stock, $0.01 par value per share | The Nasdaq Stock Market, LLC |
Securities registered pursuant to Section 12(g) of the Act: none
Indicate by check mark if the registrant is a well-known seasoned issuer, as defined in Rule 405 of the Securities Act. YES ¨ NO x
Indicate by check mark if the registrant is not required to file reports pursuant to Section 13 or Section 15(d) of the Act. YES ¨ NO x
Indicate by check mark whether the Registrant (1) has filed all reports required to be filed by Section 13 or 15(d) of the Securities Exchange Act of 1934 during the preceding 12 months and (2) has been subject to such filing requirements for the past 90 days. YES x NO ¨
Indicate by check mark if disclosure of delinquent filers pursuant to Item 405 of Regulation S-K is not contained herein, and will not be contained, to the best of the Registrant’s knowledge in definitive proxy or information statements incorporated by reference in Part III of this Form 10-K or any amendment to this Form 10-K. x
Indicate by check mark whether the registrant has submitted electronically and posted on its corporate Web site, if any, every Interactive Date File required to be submitted and posted pursuant to Rule 405 of Regulation S-T (§232.405 of this chapter) during the preceding 12 months (or for such shorter period that the registrant was require to submit and post such files). YES ¨ NO ¨
Indicate by check mark whether the registrant is a large accelerated filer, an accelerated filer, a non-accelerated filer, or a smaller reporting company. See the definitions of “large accelerated filer,” “accelerated filer” and “smaller reporting company” in Rule 12b-2 of the Exchange Act. (Check one):
| Large accelerated filer | ¨ | Accelerated filer | x | |||
| Non-accelerated filer | ¨ (Do not check if a smaller reporting company) | Smaller reporting company | ¨ | |||
Indicate by check mark whether the registrant is a shell company (as defined in Rule 12b-2 of the Act). YES ¨ NO x
The aggregate market value of the 6,578,582 shares of the Registrant’s common stock held by non-affiliates, based upon the closing price of $12.91 for the common stock on June 30, 2010, as reported by the Nasdaq Stock Market, was approximately $84.9 million. Shares of common stock held by the registrant’s executive officers, directors and certain benefit plans have been excluded since such persons may be deemed to be affiliates. This determination of affiliate status is not necessarily a conclusive determination for other purposes.
Number of shares of common stock outstanding as of March 9, 2011: 8,087,159
DOCUMENTS INCORPORATED BY REFERENCE
Set forth below are the documents incorporated by reference and the part of the Form 10-K into which the document is incorporated:
Portions of the definitive Proxy Statement for the 2011 Annual Meeting of Stockholders are incorporated by reference into Part III, Items 10-14 of this Form 10-K.
Table of Contents
2010 ANNUAL REPORT ON FORM 10-K
TABLE OF CONTENTS
| Page | ||||||
| PART I | ||||||
| Item 1. | 1 | |||||
| Item 1A. | 11 | |||||
| Item 1B. | 15 | |||||
| Item 2. | 16 | |||||
| Item 3. | 16 | |||||
| Item 4. | 16 | |||||
| PART II | ||||||
| Item 5. | 17 | |||||
| Item 6. | 20 | |||||
| Item 7. | Management’s Discussion and Analysis of Financial Condition and Results of Operations |
22 | ||||
| Item 7A. | 44 | |||||
| Item 8. | 45 | |||||
| Item 9. | Changes in and Disagreements with Accountants on Accounting and Financial Disclosure |
84 | ||||
| Item 9A(T). | 84 | |||||
| Item 9B. | 84 | |||||
| PART III | ||||||
| Item 10. | 85 | |||||
| Item 11. | 85 | |||||
| Item 12. | Security Ownership of Certain Beneficial Owners and Management and Related Stockholder Matters |
86 | ||||
| Item 13. | Certain Relationships and Related Transactions, and Director Independence |
86 | ||||
| Item 14. | 86 | |||||
| PART IV | ||||||
| Item 15. | 86 | |||||
| 88 | ||||||
Table of Contents
Forward-Looking Statements
This Annual Report on Form 10-K contains certain forward looking statements (as defined in the Securities Exchange Act of 1934 and the regulations hereunder). Forward looking statements are not historical facts but instead represent only the beliefs, expectations or opinions of Home Bancorp, Inc. and its management regarding future events, many of which, by their nature, are inherently uncertain. Forward looking statements may be identified by the use of such words as: “believe”, “expect”, “anticipate”, “intend”, “plan”, “estimate”, or words of similar meaning, or future or conditional terms such as “will”, “would”, “should”, “could”, “may”, “likely”, “probably”, or “possibly.” Forward looking statements include, but are not limited to, financial projections and estimates and their underlying assumptions; statements regarding plans, objectives and expectations with respect to future operations, products and services; and statements regarding future performance. Such statements are subject to certain risks, uncertainties and assumption, many of which are difficult to predict and generally are beyond the control of Home Bancorp, Inc. and its management, that could cause actual results to differ materially from those expressed in, or implied or projected by, forward looking statements. The following factors, among others, could cause actual results to differ materially from the anticipated results or other expectations expressed in the forward looking statements: (1) economic and competitive conditions which could affect the volume of loan originations, deposit flows and real estate values; (2) the levels of noninterest income and expense and the amount of loan losses; (3) competitive pressure among depository institutions increasing significantly; (4) changes in the interest rate environment causing reduced interest margins; (5) general economic conditions, either nationally or in the markets in which Home Bancorp, Inc. is or will be doing business, being less favorable than expected;(6) political and social unrest, including acts of war or terrorism; (7) we may not fully realize all the benefits we anticipated in connection with our Federal Deposit Insurance Corporation (“FDIC”) assisted acquisition or our assumptions may prove to be inaccurate; or (8) legislation or changes in regulatory requirements adversely affecting the business of Home Bancorp, Inc. Home Bancorp, Inc. undertakes no obligation to update these forward looking statements to reflect events or circumstances that occur after the date on which such statements were made.
As used in this report, unless the context otherwise requires, the terms “we,” “our,” “us,” or the “Company” refer to Home Bancorp, Inc., a Louisiana corporation, and the term the “Bank” refers to Home Bank, a federally chartered savings bank and wholly owned subsidiary of the Company. In addition, unless the context otherwise requires, references to the operations of the Company include the operations of the Bank.
General. Home Bancorp, Inc. is a Louisiana corporation that became the holding company for Home Bank in October 2008 upon the Bank’s mutual to stock conversion. Home Bank is a federally chartered community-oriented savings bank which was originally organized in 1908 and is headquartered in Lafayette, Louisiana. The Bank currently conducts business from 18 full-service banking locations and one loan production office in the Greater Lafayette, Baton Rouge and Northshore (of Lake Ponchartrain) regions of south Louisiana.
The Bank is primarily engaged in attracting deposits from the general public and using those funds to invest in loans and securities. Our principal sources of funds are customer deposits, repayments of loans, repayments of investments and funds borrowed from outside sources such as the Federal Home Loan Bank (“FHLB”) of Dallas. These funds are primarily used for the origination of loans, including single-family residential first mortgage loans, commercial real estate mortgage loans, other commercial loans, home equity loans and lines of credit, construction and land loans and other loans. The Bank derives its income principally from interest earned on loans and investment securities and, to a lesser extent, from fees received in connection with the origination of loans, service charges on deposit accounts and for other services. The Bank’s primary expenses are interest expense on deposits and borrowings and general operating expenses.
We are an active originator of residential home mortgage loans in our market area. Historically, Home Bank was a traditional thrift institution with an emphasis on fixed-rate long-term single-family residential first mortgage loans. Approximately nine years ago, we shifted our emphasis on the loan products we offer and increased our efforts to originate commercial real estate loans and other commercial loans. Commercial real estate loans and other commercial loans were deemed attractive due to their generally higher yields and shorter anticipated lives
1
Table of Contents
compared to single-family residential mortgage loans. In addition, the Bank views commercial real estate and other commercial loans as attractive lending products because the Bank’s commercial borrowers typically are required to maintain deposit accounts at the Bank, increasing the Bank’s core deposits.
The Company’s headquarters office is located at 503 Kaliste Saloom Road, Lafayette, Louisiana, and our telephone number is (337) 237-1960. We maintain a website at www.home24bank.com, and we provide our customers with online banking services. Information on our website should not be considered a part of this Annual Report on Form 10-K.
Market Area and Competition
The Bank has three primary market areas across south Louisiana: Greater Lafayette, Baton Rouge and the Northshore (of Lake Ponchartrain) regions. In 2006, the Bank expanded its operations into Crowley, Louisiana, which is approximately 20 miles west of Lafayette through the acquisition of Crowley Building and Loan Association. In 2007, the Company expanded its operations into Baton Rouge, Louisiana, which is approximately 55 miles northeast of Lafayette. The Bank currently operates three full-service branch locations in Baton Rouge. In 2010, the Company expanded into the Northshore (of Lake Ponchartrain) through a Federal Deposit Insurance Corporation (“FDIC”) assisted transaction of the former Statewide Bank (“Statewide”). The Bank currently operates six full-service branch locations and a loan production office in the Northshore region.
We face significant competition in originating loans and attracting deposits. This competition stems primarily from commercial banks, other savings banks and savings associations and mortgage-banking companies. Many of the financial service providers operating in our market areas are significantly larger, and have greater financial resources, than us. We face additional competition for deposits from short-term money market funds and other corporate and government securities funds, mutual funds and from other non-depository financial institutions such as brokerage firms and insurance companies.
Supervision and Regulation
Set forth below is a brief description of certain laws relating to the regulation of Home Bancorp, Inc. and Home Bank. This description does not purport to be complete and is qualified in its entirety by reference to applicable laws and regulations.
General. Home Bank, as a federally chartered savings bank, is subject to federal regulation and oversight by the Office of Thrift Supervision (“OTS”) extending to all aspects of its operations. The Bank is also subject to regulation and examination by the FDIC, which insures the deposits of the Bank to the maximum extent permitted by law, and requirements established by the Federal Reserve Board. Federally chartered savings institutions are required to file periodic reports with the OTS and are subject to periodic examinations by the OTS and the FDIC. The investment and lending authority of savings institutions are prescribed by federal laws and regulations, and such institutions are prohibited from engaging in any activities not permitted by such laws and regulations. Such regulation and supervision primarily is intended for the protection of depositors and not for the purpose of protecting shareholders. Under the recently enacted Dodd-Frank Wall Street Reform and Consumer Protection Act, the powers of the OTS will be transferred to other financial institution regulatory agencies on July 21, 2011, unless extended by up to an additional six months. See “Recently Enacted Regulatory Reform” below.
Federal law provides the federal banking regulators, including the OTS and FDIC, with substantial enforcement powers. The OTS’s enforcement authority over all savings institutions and their holding companies includes, among other things, the ability to assess civil money penalties, to issue cease and desist or removal orders and to initiate injunctive actions. In general, these enforcement actions may be initiated for violations of laws and regulations and unsafe or unsound practices. Other actions or inactions may provide the basis for enforcement action, including misleading or untimely reports filed with the OTS. Any change in such regulations, whether by the FDIC, OTS or Congress, could have a material adverse impact on the Company and the Bank and their operations.
2
Table of Contents
Recently Enacted Regulatory Reform
On July 21, 2010, the President signed into law the Dodd-Frank Wall Street Reform and Consumer Protection Act. The financial reform and consumer protection act imposes new restrictions and an expanded framework of regulatory oversight for financial institutions, including depository institutions. In addition, the new law changes the jurisdictions of existing bank regulatory agencies and in particular transfers the regulation of federal savings associations, such as the Bank, from the OTS to the Office of the Comptroller of the Currency (“OCC”), effective one year from the effective date of the legislation, with a potential extension up to six months. Savings and loan holding companies, such as the Company, will be regulated by the Federal Reserve Board. The new law also establishes an independent federal consumer protection bureau within the Federal Reserve Board. The following discussion summarizes significant aspects of the new law that may affect the Company and the Bank. Regulations implementing these changes have not been promulgated, so we cannot determine the full impact on our business and operations at this time.
The following aspects of the financial reform and consumer protection act are related to the operations of the Bank:
| • | A new independent consumer financial protection bureau will be established within the Federal Reserve Board, empowered to exercise broad regulatory, supervisory and enforcement authority with respect to both new and existing consumer financial protection laws. Smaller financial institutions, like the Bank, will be subject to the supervision and enforcement of their primary federal banking regulator with respect to the federal consumer financial protection laws. |
| • | Tier 1 capital treatment for “hybrid” capital items like trust preferred securities is eliminated subject to various grandfathering and transition rules. |
| • | The current prohibition on payment of interest on demand deposits was repealed, effective July 21, 2011. |
| • | Deposit insurance is permanently increased to $250,000 and unlimited deposit insurance for noninterest-bearing transaction accounts is provided through the end of 2012. |
| • | The deposit insurance assessment base calculation will equal the depository institution’s total assets minus the sum of its average tangible equity during the assessment period. |
| • | The minimum reserve ratio of the Deposit Insurance Fund increased to 1.35% of estimated annual insured deposits or assessment base; however, the Federal Deposit Insurance Corporation is directed to “offset the effect” of the increased reserve ratio for insured depository institutions with total consolidated assets of less than $10 billion. |
The following aspects of the financial reform and consumer protection act are related to the operations of the Company:
| • | Authority over savings and loan holding companies will transfer to the Federal Reserve Board. |
| • | Leverage capital requirements and risk based capital requirements applicable to depository institutions and bank holding companies will be extended to thrift holding companies. |
| • | The Federal Deposit Insurance Act was amended to direct federal regulators to require depository institution holding companies to serve as a source of strength for their depository institution subsidiaries. |
| • | The Securities and Exchange Commission (“SEC”) is authorized to adopt rules requiring public companies to make their proxy materials available to shareholders for nomination of their own candidates for election to the board of directors. |
| • | Public companies will be required to provide their shareholders with a non-binding vote: (i) at least once every three years on the compensation paid to executive officers, and (ii) at least once every six years on whether they should have a “say on pay” vote every one, two or three years. |
| • | A separate, non-binding shareholder vote will be required regarding golden parachutes for named executive officers when a shareholder vote takes place on mergers, acquisitions, dispositions or other transactions that would trigger the parachute payments. |
| • | Securities exchanges will be required to prohibit brokers from using their own discretion to vote shares not beneficially owned by them for certain “significant” matters, which include votes on the election of directors, executive compensation matters, and any other matter determined to be significant. |
3
Table of Contents
| • | Stock exchanges will be prohibited from listing the securities of any issuer that does not have a policy providing for (i) disclosure of its policy on incentive compensation payable on the basis of financial information reportable under the securities laws, and (ii) the recovery from current or former executive officers, following an accounting restatement triggered by material noncompliance with securities law reporting requirements, of any incentive compensation paid erroneously during the three-year period preceding the date on which the restatement was required that exceeds the amount that would have been paid on the basis of the restated financial information. |
| • | Disclosure in annual proxy materials will be required concerning the relationship between the executive compensation paid and the financial performance of the issuer. |
| • | Item 402 of Regulation S-K will be amended to require companies to disclose the ratio of the Chief Executive Officer’s annual total compensation to the median annual total compensation of all other employees. |
| • | Smaller reporting companies are exempt from complying with the internal control auditor attestation requirements of Section 404(b) of the Sarbanes-Oxley Act. |
Regulation of Home Bancorp, Inc.
Holding Company Acquisitions. Upon completion of the conversion, the Company became a savings and loan holding company under the Home Owners’ Loan Act, as amended, and was required to register with the OTS. Federal law generally prohibits a savings and loan holding company, without prior OTS approval, from acquiring the ownership or control of any other savings institution or savings and loan holding company, or all, or substantially all, of the assets or more than 5% of the voting shares of the savings institution or savings and loan holding company. These provisions also prohibit, among other things, any director or officer of a savings and loan holding company, or any individual who owns or controls more than 25% of the voting shares of such holding company, from acquiring control of any savings institution not a subsidiary of such savings and loan holding company, unless the acquisition is approved by the OTS.
The OTS may not approve any acquisition that would result in a multiple savings and loan holding company controlling savings institutions in more than one state, subject to two exceptions: (1) the approval of interstate supervisory acquisitions by savings and loan holding companies; and (2) the acquisition of a savings institution in another state if the laws of the state of the target savings institution specifically permit such acquisitions. The states vary in the extent to which they permit interstate savings and loan holding company acquisitions.
Holding Company Activities. The Company is a unitary savings and loan holding company and is permitted to engage only in the activities permitted for financial holding companies under Federal Reserve Board regulations or for multiple savings and loan holding companies. Multiple savings and loan holding companies are permitted to engage in the following activities: (i) activities permitted for a bank holding company under section 4(c) of the Bank Holding Company Act (unless the Director of the OTS prohibits or limits such 4(c) activities); (ii) furnishing or performing management services for a subsidiary savings association; (iii) conducting any insurance agency or escrow business; (iv) holding, managing, or liquidating assets owned by or acquired from a subsidiary savings association; (v) holding or managing properties used or occupied by a subsidiary savings association; (vi) acting as trustee under deeds of trust; or (vii) activities authorized by regulation as of March 5, 1987, to be engaged in by multiple savings and loan holding companies. Although savings and loan holding companies are not subject to specific capital requirements or specific restrictions on the payment of dividends or other capital distributions, federal regulations do prescribe such restrictions on subsidiary savings institutions, as described below. The Bank is required to notify the OTS 30 days before declaring any dividend. In addition, the financial impact of a holding company on its subsidiary institution is a matter that is evaluated by the OTS and the agency has authority to order cessation of activities or divestiture of subsidiaries deemed to pose a threat to the safety and soundness of the institution.
Federal Securities Laws. We have registered our common stock with the SEC under Section 12(b) of the Securities Exchange Act of 1934. Accordingly, the Company is subject to the proxy and tender offer rules, insider trading reporting requirements and restrictions and certain other requirements under the Securities Exchange Act of 1934. Pursuant to OTS regulations and the plan of conversion, we agreed to maintain such registration for a minimum of three years following the Bank’s mutual-to-stock conversion.
4
Table of Contents
The Sarbanes-Oxley Act. As a public company, Home Bancorp is subject to the Sarbanes-Oxley Act of 2002 which addresses, among other issues, corporate governance, auditing and accounting, executive compensation, and enhanced and timely disclosure of corporate information. As directed by the Sarbanes-Oxley Act, our principal executive officer and principal financial officer are required to certify that our quarterly and annual reports do not contain any untrue statement of a material fact. The rules adopted by the SEC under the Sarbanes-Oxley Act have several requirements, including having these officers certify that: they are responsible for establishing, maintaining and regularly evaluating the effectiveness of our internal control over financial reporting; they have made certain disclosures to our auditors and the audit committee of the Board of Directors about our internal control over financial reporting; and they have included information in our quarterly and annual reports about their evaluation and whether there have been changes in our internal control over financial reporting or in other factors that could materially affect internal control over financial reporting.
Regulation of Home Bank
General. As the primary federal regulator of Home Bank, the OTS has extensive authority over the operations of federally-chartered savings institutions. As part of this authority, Home Bank is required to file periodic reports with the OTS and is subject to periodic examinations by the OTS and the FDIC. The investment and lending authorities of savings institutions are prescribed by federal laws and regulations, and such institutions are prohibited from engaging in any activities not permitted by such laws and regulations. Such regulation and supervision is primarily intended for the protection of depositors and the Deposit Insurance Fund, administered by the FDIC.
The OTS’s enforcement authority over all savings institutions and their holding companies includes, among other things, the ability to assess civil money penalties, to issue cease and desist or removal orders and to initiate injunctive actions. In general, these enforcement actions may be initiated for violations of laws and regulations and unsafe or unsound practices. Other actions or inactions may provide the basis for enforcement action, including misleading or untimely reports filed with the OTS.
As previously indicated, the jurisdiction of the OTS with respect to the Bank currently is scheduled to transfer to the OCC on July 21, 2011.
Insurance of Accounts. The deposits of Home Bank are insured to the maximum extent permitted by the Deposit Insurance Fund and are backed by the full faith and credit of the U.S. Government. As insurer, the FDIC is authorized to conduct examinations of, and to require reporting by, insured institutions. It also may prohibit any insured institution from engaging in any activity determined by regulation or order to pose a serious threat to the FDIC. The FDIC also has the authority to initiate enforcement actions against savings institutions, after giving the OTS an opportunity to take such action.
The recently enacted financial institution reform legislation permanently increased deposit insurance on most accounts to $250,000. In addition, pursuant to Section 13(c)(4)(G) of the Federal Deposit Insurance Act, the FDIC has implemented two temporary programs to provide deposit insurance for the full amount of most non-interest bearing transaction deposit accounts and to guarantee certain unsecured debt of financial institutions and their holding companies. Under the unsecured debt program, the FDIC’s guarantee expires on the earlier of the maturity date of the debt or December 31, 2012. The unlimited deposit insurance for noninterest-bearing transaction accounts was extended by the Dodd-Frank Act through the end of 2012 for all insured institutions without a separate insurance assessment (but the cost of the additional insurance coverage will be considered under the risk-based assessment system).
The FDIC’s risk-based premium system provides for quarterly assessments. Each insured institution is placed in one of four risk categories depending on supervisory and capital considerations. Within its risk category, an institution is assigned to an initial base assessment rate which is then adjusted to determine its final assessment rate based on its brokered deposits, secured liabilities and unsecured debt. Assessment rates range from seven to 77.5 basis points, with less risky institutions paying lower assessments. The FDIC recently amended its deposit insurance regulations (1) to change the assessment base for insurance from domestic deposits to average assets minus average tangible equity and (2) to lower overall assessment rates. The revised assessments rates are between 2.5 to 9 basis points for banks in the lowest risk category and between 30 to 45 basis points for banks in the highest risk category. The amendments will become effective for the quarter beginning April 1, 2011 with the new assessment methodology being reflected in the premium invoices due September 30, 2011.
5
Table of Contents
In addition, all institutions with deposits insured by the FDIC are required to pay assessments to fund interest payments on bonds issued by the Financing Corporation, a mixed-ownership government corporation established to recapitalize the predecessor to the Deposit Insurance Fund. The annual assessment rate set for the fourth quarter of 2010 was 0.0026% of insured deposits and is adjusted quarterly. These assessments will continue until the Financing Corporation bonds mature in 2019.
The FDIC may terminate the deposit insurance of any insured depository institution, including Home Bank, if it determines after a hearing that the institution has engaged or is engaging in unsafe or unsound practices, is in an unsafe or unsound condition to continue operations, or has violated any applicable law, regulation, order or any condition imposed by an agreement with the FDIC. It also may suspend deposit insurance temporarily during the hearing process for the permanent termination of insurance, if the institution has no tangible capital. If insurance of accounts is terminated, the accounts at the institution at the time of the termination, less subsequent withdrawals, shall continue to be insured for a period of six months to two years, as determined by the FDIC. Management is aware of no existing circumstances which would result in termination of Home Bank’s deposit insurance.
On May 22, 2009, the FDIC also adopted a final rule imposing a five basis point special assessment on assets less Tier 1 capital of insured institutions as of June 30, 2009. The special assessment, which amounted to $200,000 in the case of the Bank, was paid in the quarter ended September 30, 2009. The final rule also permits the FDIC to impose an additional special assessment after June 30, 2009, of up to five basis points if necessary to maintain public confidence in federal deposit insurance.
On November 12, 2009, the FDIC adopted a final rule to require insured institutions to prepay their estimated quarterly risk-based assessments for the fourth quarter of 2009, and for all of 2010, 2011 and 2012. The prepaid assessment was collected on December 30, 2009 along with each institution’s regular quarterly risk-based deposit insurance assessment for the third quarter of 2009. For purposes of calculating the prepaid assessment, each institution’s assessment rate was its total base assessment rate in effect on September 30, 2009. On December 30, 2009, the Bank paid $1.2 million for the total prepaid assessment.
Regulatory Capital Requirements. Federally insured savings institutions are required to maintain minimum levels of regulatory capital. The OTS has established capital standards consisting of a “tangible capital requirement,” a “leverage capital requirement” and “a risk-based capital requirement.” The OTS also is authorized to impose capital requirements in excess of these standards on individual institutions on a case-by-case basis.
Current OTS capital standards require savings institutions to satisfy the following capital requirements:
| • | tangible capital requirement – “tangible” capital equal to at least 1.5% of adjusted total assets; |
| • | leverage capital requirement – “core” capital equal to at least 4.0% of adjusted total assets; and |
| • | risk-based capital requirement – “total” capital (a combination of core and “supplementary” capital) equal to at least 8.0% of “risk-weighted” assets. |
Core capital generally consists of common stockholders’ equity (including retained earnings). Tangible capital generally equals core capital minus intangible assets, with only a limited exception for purchased mortgage servicing rights. Both core and tangible capital are further reduced by an amount equal to a savings institution’s debt and equity investments in subsidiaries engaged in activities not permissible to national banks (other than subsidiaries engaged in activities undertaken as agent for customers or in mortgage banking activities and subsidiary depository institutions or their holding companies). These adjustments do not affect Home Bank’s regulatory capital.
In determining compliance with the risk-based capital requirement, a savings institution is allowed to include both core capital and supplementary capital in its total capital, provided that the amount of supplementary capital included does not exceed the savings institution’s core capital. Supplementary capital generally consists of general allowances for loan losses up to a maximum of 1.25% of risk-weighted assets, together with certain other items. In determining the required amount of risk-based capital, total assets, including certain off-balance sheet
6
Table of Contents
items, are multiplied by a risk weight based on the risks inherent in the type of assets. The risk weights range from 0% for cash and securities issued by the U.S. Government or unconditionally backed by the full faith and credit of the U.S. Government to 100% for loans (other than qualifying residential loans weighted at 80%) and repossessed assets.
Savings institutions must value securities available for sale at amortized cost for regulatory capital purposes. This means that in computing regulatory capital, savings institutions should add back any unrealized losses and deduct any unrealized gains, net of income taxes, on debt securities reported as a separate component of capital as defined by the generally accepted accounting principles in the United States of America (“GAAP”).
As of December 31, 2010, Home Bank exceeded all of its regulatory capital requirements, with tangible, core and risk-based capital ratios of 15.46%, 15.46% and 23.65%, respectively.
Any savings institution that fails any of the capital requirements is subject to possible enforcement actions by the OTS or the FDIC. Such actions could include a capital directive, a cease and desist order, civil money penalties, the establishment of restrictions on the institution’s operations, termination of federal deposit insurance and the appointment of a conservator or receiver. The OTS’s capital regulation provides that such actions, through enforcement proceedings or otherwise, could require one or more of a variety of corrective actions.
Prompt Corrective Action. The following table shows the amount of capital associated with the different capital categories set forth in the prompt corrective action regulations.
| Capital Category |
Total Risk-based Capital |
Tier 1 Risk-based Capital |
Tier 1 Leverage Capital | |||
| Well capitalized | 10% or more | 6% or more | 5% or more | |||
| Adequately capitalized | 8% or more | 4% or more | 4% or more | |||
| Undercapitalized | Less than 8% | Less than 4% | Less than 4% | |||
| Significantly undercapitalized | Less than 6% | Less than 3% | Less than 3% |
In addition, an institution is “critically undercapitalized” if it has a ratio of tangible equity to total assets that is equal to or less than 2.0%. Under specified circumstances, a federal banking agency may reclassify a well capitalized institution as adequately capitalized and may require an adequately capitalized institution or an undercapitalized institution to comply with supervisory actions as if it were in the next lower category (except that the FDIC may not reclassify a significantly undercapitalized institution as critically undercapitalized).
An institution generally must file a written capital restoration plan which meets specified requirements within 45 days of the date that the institution receives notice or is deemed to have notice that it is undercapitalized, significantly undercapitalized or critically undercapitalized. A federal banking agency must provide the institution with written notice of approval or disapproval within 60 days after receiving a capital restoration plan, subject to extensions by the agency. An institution which is required to submit a capital restoration plan must concurrently submit a performance guaranty by each company that controls the institution. In addition, undercapitalized institutions are subject to various regulatory restrictions, and the appropriate federal banking agency also may take any number of discretionary supervisory actions.
As of December 31, 2010, Home Bank was deemed a well capitalized institution for purposes of the above regulations and as such is not subject to the above mentioned restrictions.
Capital Distributions. OTS regulations govern capital distributions by savings institutions, which include cash dividends, stock repurchases and other transactions charged to the capital account of a savings institution to make capital distributions. A savings institution must file an application for OTS approval of the capital distribution if either (1) the total capital distributions for the applicable calendar year exceed the sum of the institution’s net income for that year to date plus the institution’s retained net income for the preceding two years, (2) the institution would not be at least adequately capitalized following the distribution, (3) the distribution would violate any applicable statute, regulation, agreement or OTS-imposed condition, or (4) the institution is not eligible for expedited treatment of its filings. If an application is not required to be filed, savings institutions which are a subsidiary of a savings and loan holding company (as well as certain other institutions) must still file a notice with the OTS at least 30 days before the board of directors declares a dividend or approves a capital distribution.
7
Table of Contents
Qualified Thrift Lender Test. All savings institutions are required to meet a qualified thrift lender (“QTL”) test to avoid certain restrictions on their operations. A savings institution can comply with the QTL test by either qualifying as a domestic building and loan association as defined in the Internal Revenue Code or meeting the OTS QTL test.
Currently, the OTS QTL test requires that 65% of an institution’s “portfolio assets” (as defined) consist of certain housing and consumer-related assets on a monthly average basis in nine out of every 12 months. To be a QTL under the IRS test, the savings institution must meet a “business operations test” and a “60 percent assets test,” each defined in the Internal Revenue Code.
If the savings institution fails to maintain its QTL status, the holding company’s activities are restricted. In addition, it must discontinue any non-permissible business, although the OTS may grant a grace period up to two years for good cause. Nonetheless, any company that controls a savings institution that is not a qualified thrift lender must register as a bank holding company within one year of the savings institution’s failure to meet the QTL test.
Statutory penalty provisions require an institution that fails to remain a QTL to either become a national bank or be prohibited from the following:
| • | making any new investments or engaging in any new activity not allowed for both a national bank and a savings association; |
| • | establishing any new branch office unless allowable for a national bank; and |
| • | paying dividends unless allowable for a national bank. |
Three years from the date a savings association should have become or ceases to be a QTL, by failing to meet either QTL test, the institution must dispose of any investment or not engage in any activity unless the investment or activity is allowed for both a national bank and a savings association.
Under the Dodd-Frank Wall Street Reform and Consumer Protection Act, a savings institution not in compliance with the QTL test also is prohibited from paying dividends and is subject to an enforcement action for violation of the Home Owners’ Loan Act, as amended.
As of December 31, 2010, Home Bank met the requirements to be deemed a QTL.
Limitations on Transactions with Affiliates. Transactions between savings associations and any affiliate are governed by Sections 23A and 23B of the Federal Reserve Act as made applicable to savings associations by Section 11 of the Home Owners’ Loan Act. An affiliate of a savings association is any company or entity which controls, is controlled by or is under common control with the savings association. In a holding company context, the holding company of a savings association (such as Home Bancorp, Inc.) and any companies which are controlled by such holding company are affiliates of the savings association. Generally, Section 23A limits the extent to which the savings association or its subsidiaries may engage in “covered transactions” with any one affiliate to an amount equal to 10% of such association’s capital stock and surplus, and contain an aggregate limit on all such transactions with all affiliates to an amount equal to 20% of such capital stock and surplus. Section 23B applies to “covered transactions” as well as certain other transactions and requires that all transactions be on terms substantially the same, or at least as favorable, to the savings association as those provided to a non-affiliate. The term “covered transaction” includes the making of loans to, purchase of assets from and issuance of a guarantee to an affiliate and similar transactions. Section 23B transactions also include the provision of services and the sale of assets by a savings association to an affiliate. In addition to the restrictions imposed by Sections 23A and 23B, Section 11 of the Home Owners’ Loan Act prohibits a savings association from (i) making a loan or other extension of credit to an affiliate, except for any affiliate which engages only in certain activities which are permissible for bank holding companies, or (ii) purchasing or investing in any stocks, bonds, debentures, notes or similar obligations of any affiliate, except for affiliates which are subsidiaries of the savings association.
8
Table of Contents
In addition, Sections 22(g) and (h) of the Federal Reserve Act as made applicable to savings associations by Section 11 of the Home Owners’ Loan Act, place restrictions on loans to executive officers, directors and principal shareholders of the savings association and its affiliates. Under Section 22(h), loans to a director, an executive officer and to a greater than 10% shareholder of a savings association, and certain affiliated interests of either, may not exceed, together with all other outstanding loans to such person and affiliated interests, the savings association’s loans to one borrower limit (generally equal to 15% of the association’s unimpaired capital and surplus). Section 22(h) also requires that loans to directors, executive officers and principal shareholders be made on terms substantially the same as offered in comparable transactions to other persons unless the loans are made pursuant to a benefit or compensation program that (i) is widely available to employees of the association and (ii) does not give preference to any director, executive officer or principal shareholder, or certain affiliated interests of either, over other employees of the savings association. Section 22(h) also requires prior board approval for certain loans. In addition, the aggregate amount of extensions of credit by a savings association to all insiders cannot exceed the association’s unimpaired capital and surplus. Furthermore, Section 22(g) places additional restrictions on loans to executive officers. Home Bank currently is subject to Sections 22(g) and (h) of the Federal Reserve Act, and as of December 31, 2010 was in compliance with the above restrictions.
Anti-Money Laundering. All financial institutions, including savings and loan associations, are subject to federal laws that are designed to prevent the use of the U.S. financial system to fund terrorist activities. Financial institutions operating in the United States must develop anti-money laundering compliance programs, due diligence policies and controls to ensure the detection and reporting of money laundering. Such compliance programs are intended to supplement compliance requirements, also applicable to financial institutions, under the Bank Secrecy Act and the Office of Foreign Assets Control Regulations. Home Bank has established policies and procedures to ensure compliance with these provisions.
Federal Home Loan Bank System. Home Bank is a member of the FHLB of Dallas, which is one of 12 regional FHLBs that administer the home financing credit function of savings institutions. Each FHLB serves as a reserve or central bank for its members within its assigned region. It is funded primarily from proceeds derived from the sale of consolidated obligations of the FHLB System. It makes loans to members (i.e., advances) in accordance with policies and procedures established by the board of directors of the FHLB. As of December 31, 2010, Home Bank had $13.0 million of FHLB advances and $253.5 million available on its line of credit with the FHLB.
As a member, Home Bank is required to purchase and maintain stock in the FHLB of Dallas in an amount equal to at least 1.0% of its aggregate unpaid residential mortgage loans or similar obligations at the beginning of each year. As of December 31, 2010, Home Bank had $1.1 million in FHLB stock, which was in compliance with this requirement.
The FHLBs are required to provide funds for the resolution of troubled savings institutions and to contribute to affordable housing programs through direct loans or interest subsidies on advances targeted for community investment and low- and moderate-income housing projects. These contributions have adversely affected the level of FHLB dividends paid in the past and could do so in the future. These contributions also could have an adverse effect on the value of FHLB stock in the future.
Federal Reserve System. The Federal Reserve Board requires all depository institutions to maintain reserves against their transaction accounts and non-personal time deposits. The required reserves must be maintained in the form of vault cash or an account at a Federal Reserve Bank. As of December 31, 2010, Home Bank had met its reserve requirement.
USA Patriot Act of 2001. In October 2001, the USA Patriot Act of 2001 (the “Patriot Act”) was enacted in response to the terrorist attacks in New York, Pennsylvania, and Washington, D.C. that occurred on September 11, 2001. The Patriot Act impacts financial institutions in particular through its anti-money laundering and financial transparency laws. The Patriot Act amended the Bank Secrecy Act and the rules and regulations of the Office of Foreign Assets Control to establish regulations which, among others, set standards for identifying customers who open an account and promoting cooperation with law enforcement agencies and regulators in order to effectively identify parties that may be associated with, or involved in, terrorist activities or money laundering.
9
Table of Contents
Privacy. Financial institutions are required to disclose their policies for collecting and protecting confidential information. Customers generally may prevent financial institutions from sharing personal financial information with nonaffiliated third parties except for third parties that market the institutions’ own products and services.
Additionally, financial institutions generally may not disclose consumer account numbers to any nonaffiliated third party for use in telemarketing, direct mail marketing or other marketing through electronic mail to consumers. The Bank has established policies and procedures designed to safeguard its customers’ personal financial information and to ensure compliance with applicable privacy laws.
Federal Taxation
General. Home Bancorp, Inc. and Home Bank are subject to federal income taxation in the same general manner as other corporations with some exceptions listed below. The following discussion of federal, state and local income taxation is only intended to summarize certain pertinent income tax matters and is not a comprehensive description of the applicable tax rules. Home Bank’s federal and state income tax returns for taxable years through December 31, 2006 have been closed for purposes of examination by the Internal Revenue Service.
Home Bancorp will file a consolidated federal income tax return with Home Bank. Accordingly, it is anticipated that any cash distributions made by Home Bancorp to its shareholders would be treated as cash dividends and not as a non-taxable return of capital to shareholders for federal and state tax purposes.
Method of Accounting. For federal income tax purposes, we report income and expenses on the accrual method of accounting and file our federal income tax return on a fiscal year basis.
Bad Debt Reserves. The Small Business Job Protection Act of 1996 eliminated the use of the reserve method of accounting for bad debt reserves by savings institutions, effective for taxable years beginning after 1995. Prior to that time, Home Bank was permitted to establish a reserve for bad debts and to make additions to the reserve. These additions could, within specified formula limits, be deducted in arriving at taxable income. As a result of the Small Business Job Protection Act of 1996, savings associations must use the specific charge-off method in computing their bad debt deduction beginning with their 1996 federal tax return. In addition, federal legislation required the recapture over a six year period of the excess of tax bad debt reserves as of December 31, 1995 over those established as of December 31, 1987.
Taxable Distributions and Recapture. Prior to the Small Business Job Protection Act of 1996, bad debt reserves created prior to January 1, 1988 were subject to recapture into taxable income if Home Bank failed to meet certain thrift asset and definitional tests. New federal legislation eliminated these savings association related recapture rules. However, under current law, pre-1988 reserves remain subject to recapture should Home Bank make certain non-dividend distributions or cease to maintain a bank charter.
As of December 31, 2010, the total federal pre-1988 reserve was approximately $1.2 million. The reserve reflects the cumulative effects of federal tax deductions by Home Bank for which no federal income tax provisions have been made.
Alternative Minimum Tax. The Internal Revenue Code imposes an alternative minimum tax at a rate of 20% on a base of regular taxable income plus certain tax preferences. The alternative minimum tax is payable to the extent such alternative minimum tax income is in excess of the regular income tax. Net operating losses, of which the Company has none, can offset no more than 90% of alternative minimum taxable income. Certain payments of alternative minimum tax may be used as credits against regular tax liabilities in future years. The Company has not been subject to the alternative minimum tax or any such amounts available as credits for carryover.
Net Operating Loss Carryovers. For net operating losses in tax years beginning before August 6, 1997, the Company may carry back net operating losses to the three years preceding the loss year and then forward to fifteen years following the loss years. For net operating losses in years beginning after August 5, 1997, net operating losses can be carried back to the two years preceding the loss year and forward to the 20 years following the loss year. As of December 31, 2010, the Company had no net operating loss carry forwards for federal income tax purposes.
10
Table of Contents
Corporate Dividends-Received Deduction. Home Bancorp may exclude from its income 100% of dividends received from Home Bank as a member of the same affiliated group of corporations. The corporate dividends received deduction is 80% in the case of dividends received from corporations which a corporate recipient owns less than 80%, but at least 20% of the distribution corporation. Corporations which own less than 20% of the stock of a corporation distributing a dividend may deduct only 70% of dividends received.
State and Local Taxation
State Taxation. Beginning in 2008, the Company is subject to the Louisiana Corporation Income Tax based on our Louisiana taxable income. The Corporation Income Tax applies at graduated rates from 4% upon the first $25,000 of Louisiana taxable income to 8% on all Louisiana taxable income in excess of $200,000. For these purposes, “Louisiana taxable income” means net income which is earned by us within or derived from sources within the State of Louisiana, after adjustments permitted under Louisiana law, including a federal income tax deduction. In addition, beginning in 2009, the Bank is subject to the Louisiana Shares Tax which is imposed on the assessed value of the Bank’s capital. The formula for deriving the assessed value is to apply the applicable rate to the sum of:
(a) 20% of our capitalized earnings, plus
(b) 80% of our taxable stockholders’ equity, minus
(c) 50% of our real and personal property assessment.
Various items may also be subtracted in calculating a company’s capitalized earnings.
In analyzing whether to make or to continue an investment in our securities, investors should consider, among other factors, the following risk factors.
Risks Related to Our Business
There are increased risks involved with commercial real estate, including multi-family residential, other commercial and construction and land lending activities.
Our lending activities include loans secured by commercial real estate and other commercial loans. We have increased our emphasis on originating commercial real estate loans, including multi-family residential, and other commercial loans in recent years. Commercial real estate lending, multi-family residential lending and other commercial lending generally are considered to involve a higher degree of risk than single-family residential lending due to a variety of factors. As a result of the larger loan balances typically involved in these loans, an adverse development with respect to one loan or one credit relationship can expose us to greater risk of loss compared to an adverse development with respect to a one- to four-family residential mortgage loan. As of December 31, 2010, the largest outstanding balances of our commercial real estate loans and other commercial loans were $7.6 million and $2.6 million, respectively. While we have had relatively nominal charge-offs of commercial real estate loans and other commercial loans in recent years, if one of these large loans were to become non-performing, it could have a significant impact on our results of operations. In addition, our relatively recent emphasis on increasing our originations of commercial real estate and other commercial loans means that our portfolio of these loans is significantly weighted with loans which are not well seasoned and are generally perceived to be more susceptible to adverse economic conditions than older loans.
In addition to commercial real estate and other commercial loans, Home Bank holds a significant portfolio of construction and land loans. As of December 31, 2010, Home Bank’s construction and land loans amounted to $57.5 million, or 13.1% of our loan portfolio. Construction and land loans generally have a higher risk of loss than single-family residential mortgage loans due primarily to the critical nature of the initial estimates of a property’s value upon completion of construction compared to the estimated costs, including interest, of construction as well as other assumptions. If the estimates upon which construction loans are made prove to be inaccurate, we may be confronted with projects that, upon completion, have values which are below the loan amounts. While we are not aware of any specific, material impediments impacting any of our builder/developer borrowers at this time, there continues to be nationwide reports of significant problems which have adversely
11
Table of Contents
affected many property developers and builders as well as the institutions that have provided them with loans. If any of the builder/developers to which we have extended construction and land loans experience the type of difficulties that are being reported, it could have adverse consequences upon our future results of operations.
Our allowance for loans losses may not be adequate to cover probable losses.
We have established an allowance for loan losses based upon various assumptions and judgments about the collectability of our loan portfolio which we believe is adequate to offset probable losses on our existing loans. While we are not aware of any specific factors indicating a deficiency in the amount of our allowance for loan losses, in light of the current economic slowdown, the increased number of foreclosures and lower real estate values, one of the most pressing current issues faced by financial institutions is the adequacy of their allowance for loan losses. Federal bank regulators have increased their scrutiny of the level of the allowance for losses maintained by regulated institutions. Many banks and other lenders are reporting significantly higher provisions to their allowance for loan losses, which are materially impacting their earnings. In the event that we have to increase our allowance for loan losses beyond current levels, it would have an adverse effect on our results in future periods. As of December 31, 2010, our allowance for loan losses amounted to $3.9 million, which was allocated to our loans not covered under the FDIC loss sharing agreements (“Noncovered Loans”) totaling $359.5 million as of such date.
Our decisions regarding the fair value of assets acquired could be inaccurate and our estimated loss sharing receivable in our FDIC-assisted acquisition may be inadequate, which could materially and adversely affect our business, financial condition, results of operations and future prospects.
Management makes various assumptions and judgments about the collectability of the loan portfolio acquired from Statewide, including the creditworthiness of borrowers and the value of the real estate and other assets serving as collateral for the repayment of secured loans. In our FDIC-assisted acquisition of Statewide, which included loss sharing agreements, we recorded a loss sharing receivable that we consider adequate to absorb future losses which may occur in the acquired loan portfolio. In determining the size of the loss sharing receivable, we analyzed the loan portfolio based on historical loss experience, volume and classification of loans, volume and trends in delinquencies and nonaccruals, economic conditions and other pertinent information.
If our assumptions are incorrect, our current receivable may be insufficient to cover future loan losses, and increased loss reserves may be needed to respond to different economic conditions or adverse developments in the acquired loan portfolio. Any increase in future loan losses could have a negative effect on our operating results.
Our ability to obtain reimbursement under the loss sharing agreements for loans (“Covered Loans”) and repossessed assets (collectively “Covered Assets”) acquired in our FDIC-assisted acquisition depends on our compliance with the terms of the loss sharing agreements.
Management must certify to the FDIC on a quarterly basis our compliance with the terms of the FDIC loss sharing agreements as a prerequisite to obtaining reimbursement from the FDIC for realized losses on Covered Assets. The required terms of the agreements are extensive and failure to comply with any of the guidelines could result in a specific asset or group of assets permanently losing their loss sharing coverage. Additionally, management may decide to forgo loss sharing coverage on certain assets to allow greater flexibility over the management of certain assets. As of December 31, 2010, $86.0 million, or 12.3%, of the Company’s assets were covered by FDIC loss sharing agreements.
Under the terms of the FDIC loss sharing agreements, the assignment or transfer of the loss sharing agreements to another entity generally requires the written consent of the FDIC. In addition, the Bank may not assign or otherwise transfer the loss sharing agreements during their terms without the prior written consent of the FDIC in all of the following circumstances:
| 1. | a merger or consolidation of the Bank with and into another financial institution; |
| 2. | a sale of all or substantially all of the Bank’s assets to another financial institution; and |
12
Table of Contents
| 3. | for a period of 36 months after the March 12, 2010 Statewide acquisition date, |
a. the sale by any individual shareholder, or shareholders acting in concert, of more than 9% of the outstanding shares of either the Bank or the Company;
b. the sale of shares by the Bank or the Company in a public or private offering that increases the number of shares outstanding of either the Bank or the Company by more than 9%.
No assurances can be given that we will manage the Covered Assets in such a way as to always maintain loss sharing coverage on all such assets.
Other than temporary declines in the value of our investment securities may require us to take additional charges to earnings.
We evaluate our securities portfolio for other-than-temporary impairment throughout the year. Each investment with a fair value less than book value is reviewed quarterly. An impairment charge is recorded against individual securities if management’s review concludes that the decline in value is other than temporary. During the years ended December 31, 2010, 2009 and 2008, the Company recorded charges of $1.2 million, $1.9 million and $2.8 million, respectively, for the other-than-temporary impairment of certain non-agency mortgage-backed securities. As of December 31, 2010, our investment securities portfolio included 20 non-agency mortgage-backed securities with an aggregate amortized cost of $21.3 million, an aggregate fair value of $20.5 million and gross unrealized losses of $854,000 as of such date. The unrealized losses on such securities primarily relate to increasing levels of delinquencies and defaults in the mortgage loans underlying such securities. Eight of the 20 securities in this portfolio had been in a continuous loss position for over 12 months as of December 31, 2010. Additional delinquencies and defaults in the mortgage loans underlying these securities may adversely affect the cash flows received by us and may result in a conclusion in future periods that the securities are other-than-temporarily impaired. Such a conclusion of other-than-temporary impairment would require us to take additional charges to earnings to write down the value of these securities.
We may not succeed in our plan to grow which could reduce future profitability.
We have grown our branch system by opening additional offices. In Baton Rouge, Louisiana, we opened two new full-service banking offices in 2008 and an additional full-service banking office in March 2010. Typically, it takes several years for a new banking office to become profitable, and this could adversely affect our earnings in future periods. There also is a risk that, as we geographically expand our lending area, we may not be as successful in assessing the credit risks which are inherent in different markets.
In addition, we have acquired and may continue to seek to either acquire other financial institutions and/or branch offices. Our ability to successfully acquire other institutions depends on our ability to identify, acquire and integrate such institutions into our franchise. Our experience in mergers and acquisitions consists of an acquisition in 2006 of a one branch building and loan association located in Crowley, Louisiana, and an FDIC-assisted acquisition in 2010 of a bank with six branches located in the Northshore region of Louisiana. If we were to acquire another institution in the future, our results of operations could be adversely affected if our analysis of the acquisition of such institution was not complete and correct or our integration efforts were not successful. Currently, we have no agreements or understandings with anyone regarding an acquisition.
Our business is geographically concentrated in south Louisiana, which makes us vulnerable to downturns in the local economy.
Most of our loans are to individuals and businesses located in south Louisiana. Regional economic conditions affect the demand for our products and services as well as the ability of our customers to repay loans. While economic conditions in south Louisiana have been stronger than many areas of the U.S. in recent periods, the concentration of our business operations in south Louisiana makes us vulnerable to downturns in the economies in which we operate. Declines in local real estate values could adversely affect the value of property used as collateral for the loans we make. Historically, the oil and gas industry has constituted a significant component of the economy in south Louisiana. The oil and gas industry remains an important factor in the local economy in the markets that Home Bank operates in and downturns in the local oil and gas industry could adversely affect Home Bank.
13
Table of Contents
A natural disaster, especially one affecting our market area, could adversely affect the Company’s financial condition and results of operations.
Since most of our business is conducted in south Louisiana, most of our credit exposure is in that area. Historically, Louisiana has been vulnerable to natural disasters. Therefore, we are susceptible to the risks of natural disasters, such as hurricanes, floods and tornados. Natural disasters could harm our operations directly through interference with communications, including the interruption or loss of our websites, which would prevent us from gathering deposits, originating loans and processing and controlling our flow of business, as well as through the destruction of facilities and our operational, financial and management information systems. A natural disaster or recurring power outages may also impair the value of our loan portfolio, as uninsured or underinsured losses, including losses from business disruption, may reduce borrowers’ ability to repay their loans. Disasters may also reduce the value of the real estate securing our loans, impairing our ability to recover on defaulted loans through foreclosure and making it more likely that we would suffer losses on defaulted loans. Although we have implemented several back-up systems and protections (and maintain business interruption insurance), these measures may not protect us fully from the effects of a natural disaster. The occurrence of natural disasters in our market areas could have a material adverse effect on our business, prospects, financial condition and results of operations.
The current economic environment poses significant challenges and could adversely affect the Company’s financial condition and results of operations.
Although the economy in south Louisiana continues to be stronger in comparison to many other areas of the country and the United States as a whole, there has been some recent softening of certain economic indicators in our markets. In addition, recessionary conditions in the broader economy could adversely affect the financial capacity of businesses and individuals in the Company’s market areas. In particular, adverse developments in the national or international markets in the oil and gas industries could have an adverse impact on economic conditions in the Company’s market areas. The impact of current economic conditions on the Company’s financial results could also include increased levels of nonperforming loans, provisions for loan losses and expense associated with loan collection efforts. Additions to the allowance for loan losses will result in a decrease in net earnings and capital and could hinder the Company’s ability to grow.
Changes in interest rates could have a material adverse effect on our operations.
The operations of financial institutions are dependent to a large extent on net interest income, which is the difference between the interest income earned on interest-earning assets, such as loans and investment securities, and the interest expense paid on interest-bearing liabilities, such as deposits and borrowings. Changes in the general level of interest rates can affect our net interest income by affecting the difference between the weighted average yield earned on our interest-earning assets and the weighted average rate paid on our interest-bearing liabilities, or interest rate spread, and the average life of our interest-earning assets and interest-bearing liabilities. If general market rates of interest increase, our interest expense on deposits and borrowings would likely increase which would adversely affect our interest rate spread and net interest income. Changes in interest rates also can affect our ability to originate loans; the value of our interest-earning assets and our ability to realize gains from the sale of such assets; our ability to obtain and retain deposits in competition with other available investment alternatives; and the ability of our borrowers to repay adjustable or variable rate loans. Interest rates are highly sensitive to many factors, including governmental monetary policies, domestic and international economic and political conditions and other factors beyond our control.
We face strong competition which may adversely affect our profitability.
We are subject to vigorous competition in all aspects and areas of our business from banks and other financial institutions, including savings and loan associations, savings banks, finance companies, credit unions and other providers of financial services, such as money market mutual funds, brokerage firms, consumer finance companies and insurance companies. We are significantly smaller than the larger depository institutions operating in our market areas. The financial resources of these larger competitors may permit them to pay higher interest
14
Table of Contents
rates on their deposits and to be more aggressive in new loan originations. We also compete with non-financial institutions, including retail stores that maintain their own credit programs and governmental agencies that make available low cost or guaranteed loans to certain borrowers. Some of our competitors are larger financial institutions with substantially greater resources, more advanced technological capabilities, lending limits, larger branch systems and a wider array of commercial banking services. Vigorous competition from both bank and non-bank organizations is expected to continue.
Increased and/or special FDIC assessments will hurt our earnings.
The recent economic recession has caused a high level of bank failures, which has dramatically increased FDIC resolution costs and led to a significant reduction in the balance of the Deposit Insurance Fund. As a result, the FDIC has significantly increased the initial base assessment rates paid by financial institutions for deposit insurance. Increases in the base assessment rate have increased our deposit insurance costs and negatively impacted our earnings. In addition, in May 2009, the FDIC imposed a special assessment on all insured institutions. Our special assessment, which was reflected in earnings for the year ended December 31, 2009, was $200,000. In lieu of imposing an additional special assessment, the FDIC required all institutions to prepay their assessments for the fourth quarter of 2009 and all of 2010, 2011 and 2012. Additional increases in the base assessment rate or special assessments would negatively impact our earnings.
We operate in a highly regulated environment, and we may be adversely affected by changes in laws and regulations.
We are subject to extensive regulation, supervision and examination by the OTS, our primary federal regulator, and by the FDIC, as insurer of our deposits. Such regulation and supervision governs the activities in which an institution and its holding company may engage and are intended primarily for the protection of the insurance fund and the depositors and borrowers of the Bank rather than for holders of our common stock. Regulatory authorities have extensive discretion in their supervisory and enforcement activities, including the imposition of restrictions on our operations, the classification of our assets and determination of the level of our allowance for loan losses. Any change in such regulation and oversight, whether in the form of regulatory policy, regulations, legislation or supervisory action, may have a material impact on our operations.
Recently enacted regulatory reform may have a material impact on our operations.
On July 21, 2010, the President signed into law the Dodd-Frank Wall Street Reform and Consumer Protection Act that, among other things, imposes new restrictions and an expanded framework of regulatory oversight for financial institutions and their holding companies, including the Bank and the Company. Under the new law, the Company’s and the Bank’s primary regulator, the OTS, will be eliminated and existing federal thrifts will be subject to regulation and supervision by the OCC, which currently supervises and regulates all national banks. Savings and loan holding companies will be regulated by the Federal Reserve Board, which will have the authority to promulgate new regulations governing the Company that will impose additional capital requirements and may result in additional restrictions on investments and other holding company activities. The law also creates a new consumer financial protection bureau that will have the authority to promulgate rules intended to protect consumers in the financial products and services market. The creation of this independent bureau could result in new regulatory requirements and raise the cost of regulatory compliance. The federal preemption of state laws currently accorded federally chartered financial institutions will be reduced. In addition, regulation mandated by the new law could require changes in regulatory capital requirements, loan loss provisioning practices and compensation practices which may have a material impact on our operations. Because the regulations under the new law have not been promulgated, we cannot determine the full impact on our business and operations at this time. See “Regulation – Recently Enacted Regulatory Reform.”
Item 1B. Unresolved Staff Comments.
Not applicable.
15
Table of Contents
We currently conduct business from eight additional full-service banking offices in the Greater Lafayette region, three full-service banking offices in Baton Rouge, Louisiana and six full-service banking offices in the Northshore (of Lake Ponchartrain) region of Louisiana. The Bank also maintains a loan production office in Covington, Louisiana. The Bank owns 17 of its 19 office locations and leases the remaining two.
The Bank has been named as a defendant in various legal actions arising from normal business activities in which damages of various amounts are claimed. While the amount, if any, of ultimate liability with respect to such matters cannot be currently determined, management believes, after consulting with legal counsel, that any such liability will not have a material adverse effect on the Company’s consolidated financial position, results of operations, or cash flows.
Not applicable.
16
Table of Contents
| Item 5. | Market for the Registrant’s Common Equity, Related Stockholder Matters and Issuer Purchases of Equity Securities. |
(a) Home Bancorp, Inc.’s common stock is listed on the Nasdaq Global Market under the symbol “HBCP”. The common stock commenced trading on the Nasdaq Stock Market on October 3, 2008. As of the close of business on December 31, 2010, there were 8,131,002 shares of common stock outstanding, held by approximately 900 stockholders of record, not including the number of persons or entities whose stock is held in nominee or “street” name through various brokerage firms and banks.
The following table sets forth the high and low prices of the Company’s common stock as reported by the Nasdaq Stock Market and cash dividends declared per share for the periods indicated.
| For The Quarter Ended |
High | Low | Cash
Dividends Declared |
|||||||||
| March 31, 2009 |
$ | 10.00 | $ | 9.00 | $ | — | ||||||
| June 30, 2009 |
$ | 12.56 | $ | 9.71 | $ | — | ||||||
| September 30, 2009 |
$ | 12.65 | $ | 11.80 | $ | — | ||||||
| December 31, 2009 |
$ | 12.50 | $ | 11.91 | $ | — | ||||||
| March 31, 2010 |
$ | 14.49 | $ | 12.05 | $ | — | ||||||
| June 30, 2010 |
$ | 14.19 | $ | 12.75 | $ | — | ||||||
| September 30, 2010 |
$ | 13.48 | $ | 12.34 | $ | — | ||||||
| December 31, 2010 |
$ | 14.24 | $ | 13.00 | $ | — | ||||||
17
Table of Contents
The following graph demonstrates comparison of the cumulative total returns for the common stock of Home Bancorp, the NASDAQ Composite Index and the SNL Securities Bank and Thrift Index for the periods indicated. The graph assumes that an investor originally purchased shares on October 3, 2008, the first day that our shares were traded. The graph below represents $100 invested in our common stock at its closing price on October 3, 2008.
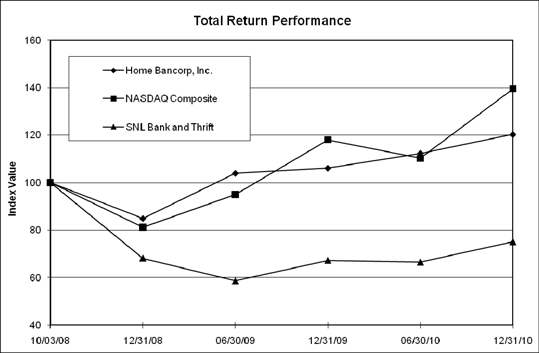
| Period Ending | ||||||||||||||||||||||||
| Index |
10/03/08 | 12/31/08 | 6/30/09 | 12/31/09 | 6/30/10 | 12/31/10 | ||||||||||||||||||
| Home Bancorp, Inc. |
100.00 | 84.86 | 103.92 | 106.09 | 112.36 | 120.28 | ||||||||||||||||||
| NASDAQ Composite |
100.00 | 81.23 | 95.02 | 118.08 | 110.26 | 139.50 | ||||||||||||||||||
| SNL Bank and Thrift |
100.00 | 68.16 | 58.59 | 67.25 | 66.49 | 75.07 | ||||||||||||||||||
The stock price information shown above is not necessarily indicative of future price performance. Information used was obtained from SNL Financial LC, Charlottesville, Virginia. The Company assumes no responsibility for any errors or omissions in such information.
The Company did not sell any of its equity securities during 2010 that were not registered under the Securities Act of 1933.
For information regarding the Company’s equity compensation plans, see Item 12.
(b) Not applicable.
18
Table of Contents
(c) The Company’s purchases of its common stock made during the fourth quarter of 2010 consisted of stock repurchases under the Company’s approved plan and are set forth in the following table.
| Period |
Total Number of Shares Purchased |
Average Price Paid per Share |
Total Number of Shares Purchased as Part of Publicly Announced Plans or Programs |
Maximum Number of Shares that May Yet be Purchased Under the Plan or Programs(1) |
||||||||||||
| October 1 - October 31, 2010 |
24,200 | $ | 13.45 | 24,200 | 230,998 | |||||||||||
| November 1 - November 30, 2010 |
156,500 | 13.70 | 156,500 | 74,498 | ||||||||||||
| December 1 - December 31, 2010 |
— | — | — | 74,498 | ||||||||||||
| Total |
180,700 | $ | 13.67 | 180,700 | 74,498 | |||||||||||
| (1) | On July 26, 2010, the Company’s Board of Directors approved a share repurchase program authorizing management to repurchase up to 424,027 shares, or 5%, of its common stock outstanding through open market or privately negotiated transactions. |
19
Table of Contents
Item 6. Selected Financial Data.
Set forth below is selected summary historical financial and other data of the Company. When you read this summary historical financial data, it is important that you also read the historical financial statements and related notes contained in Item 8 of this Form 10-K, as well as “Management’s Discussion and Analysis of Financial Condition and Results of Operations.”
| As of December 31, | ||||||||||||||||||||
| (dollars in thousands) |
2010 | 2009 | 2008 | 2007 | 2006 | |||||||||||||||
| Selected Financial Condition Data: |
||||||||||||||||||||
| Total assets |
$ | 700,423 | $ | 524,636 | $ | 528,397 | $ | 422,351 | $ | 400,484 | ||||||||||
| Cash and cash equivalents |
36,971 | 25,710 | 20,150 | 11,746 | 27,399 | |||||||||||||||
| Interest-bearing deposits in banks |
7,867 | 3,529 | 1,685 | 3,267 | 3,169 | |||||||||||||||
| Cash invested at other ATM locations |
— | — | 24,244 | 17,143 | 13,714 | |||||||||||||||
| Investment securities: |
||||||||||||||||||||
| Available for sale |
111,962 | 106,752 | 114,235 | 56,995 | 53,800 | |||||||||||||||
| Held to maturity |
15,220 | 13,099 | 4,089 | 4,693 | 5,541 | |||||||||||||||
| Loans receivable, net |
435,992 | 333,296 | 332,962 | 306,268 | 281,258 | |||||||||||||||
| Deposits |
553,218 | 371,593 | 354,145 | 353,536 | 346,250 | |||||||||||||||
| FHLB advances |
13,000 | 16,774 | 44,421 | 16,883 | 5,435 | |||||||||||||||
| Shareholders’ equity |
131,530 | 132,749 | 126,963 | 49,383 | 45,856 | |||||||||||||||
| For the Years Ended December 31, | ||||||||||||||||||||
| (dollars in thousands, except per share data) |
2010 | 2009 | 2008 | 2007 | 2006 | |||||||||||||||
| Selected Operating Data: |
||||||||||||||||||||
| Interest income |
$ | 33,659 | $ | 29,897 | $ | 27,429 | $ | 25,425 | $ | 23,200 | ||||||||||
| Interest expense |
5,881 | 6,337 | 8,747 | 9,908 | 8,215 | |||||||||||||||
| Net interest income |
27,778 | 23,560 | 18,682 | 15,517 | 14,985 | |||||||||||||||
| Provision for loan losses |
865 | 865 | 459 | 420 | 260 | |||||||||||||||
| Net interest income after provision for loan losses |
26,913 | 22,695 | 18,223 | 15,097 | 14,725 | |||||||||||||||
| Noninterest income |
4,481 | 2,122 | 406 | 2,515 | 1,911 | |||||||||||||||
| Noninterest expense |
24,362 | 17,828 | 14,743 | 12,902 | 10,540 | |||||||||||||||
| Income before income taxes |
7,032 | 6,989 | 3,886 | 4,710 | 6,096 | |||||||||||||||
| Income taxes |
2,344 | 2,309 | 1,170 | 1,387 | 2,073 | |||||||||||||||
| Net income |
$ | 4,688 | $ | 4,680 | $ | 2,716 | $ | 3,323 | $ | 4,023 | ||||||||||
| Earnings per share - basic |
$ | 0.62 | $ | 0.58 | $ | 1.32 | N/A | N/A | ||||||||||||
| Earnings per share - diluted |
$ | 0.62 | $ | 0.58 | $ | 1.32 | N/A | N/A | ||||||||||||
20
Table of Contents
| As of or For the Years Ended December 31, | ||||||||||||||||||||
| 2010 | 2009 | 2008 | 2007 | 2006 | ||||||||||||||||
| Selected Operating Ratios: (1) |
||||||||||||||||||||
| Average yield on interest-earnings assets |
5.60 | % | 5.99 | % | 6.35 | % | 6.73 | % | 6.31 | % | ||||||||||
| Average rate on interest-bearing liabilities |
1.29 | 1.93 | 2.69 | 3.30 | 2.80 | |||||||||||||||
| Average interest rate spread (2) |
4.31 | 4.06 | 3.66 | 3.43 | 3.51 | |||||||||||||||
| Net interest margin (3) |
4.62 | 4.72 | 4.31 | 4.09 | 4.08 | |||||||||||||||
| Average interest-earning assets to average interest-bearing liabilities |
131.52 | 152.02 | 133.63 | 126.29 | 125.23 | |||||||||||||||
| Noninterest expense to average assets |
3.52 | 3.36 | 3.18 | 3.19 | 2.83 | |||||||||||||||
| Efficiency ratio (4) |
75.34 | 69.39 | 77.23 | 71.55 | 63.46 | |||||||||||||||
| Return on average assets |
0.68 | 0.88 | 0.59 | 0.82 | 1.03 | |||||||||||||||
| Return on average equity |
3.52 | 3.58 | 4.12 | 6.90 | 9.18 | |||||||||||||||
| Average equity to average assets |
19.44 | 24.68 | 14.20 | 11.90 | 11.25 | |||||||||||||||
| Asset Quality Ratios: (5) (6) |
||||||||||||||||||||
| Non-performing loans as a percent of total loans receivable (7) |
0.29 | % | 0.38 | % | 0.43 | % | 0.42 | % | 0.33 | % | ||||||||||
| Non-performing assets as a percent of total assets (7) |
0.19 | 0.32 | 0.28 | 0.32 | 0.24 | |||||||||||||||
| Allowance for loan losses to as a percent of non-performing loans as of end of period |
371.2 | 262.2 | 182.6 | 178.7 | 213.2 | |||||||||||||||
| Allowance for loan losses as a percent of net loans as of end of period |
1.09 | 1.00 | 0.78 | 0.76 | 0.71 | |||||||||||||||
| Capital Ratios: (5) (8) |
||||||||||||||||||||
| Tangible capital ratio |
15.46 | % | 20.24 | % | 19.10 | % | 11.68 | % | 11.48 | % | ||||||||||
| Core capital ratio |
15.46 | 20.24 | 19.10 | 11.68 | 11.48 | |||||||||||||||
| Total risk-based capital ratio |
23.65 | 30.74 | 33.35 | 19.36 | 19.05 | |||||||||||||||
| (1) | With the exception of end-of-period ratios, all ratios are based on average monthly balances during the respective periods. |
| (2) | Average interest rate spread represents the difference between the average yield on interest-earning assets and the average rate paid on interest-bearing liabilities. |
| (3) | Net interest margin represents net interest income as a percentage of average interest-earning assets. |
| (4) | The efficiency ratio represents noninterest expense as a percentage of total revenues. Total revenues is the sum of net interest income and noninterest income. |
| (5) | Asset quality and capital ratios are end of period ratios. |
| (6) | Asset quality ratios exclude assets covered under FDIC loss sharing agreements. At December 31, 2010, Covered Loans and Assets totaled $80.4 million and $86.0 million, respectively. At December 31, 2010, $16.0 million of Covered Loans were contractually not performing. |
| (7) | Nonperforming loans consist of nonaccruing loans and loans 90 days or more past due. Nonperforming assets consist of nonperforming loans and repossessed assets. It is our policy to cease accruing interest on all loans 90 days or more past due. Repossessed assets consist of assets acquired through foreclosure or acceptance of title in-lieu of foreclosure. |
| (8) | Capital ratios are for Home Bank only. |
21
Table of Contents
Item 7. Management’s Discussion and Analysis of Financial Condition and Results of Operations.
MANAGEMENT’S DISCUSSION AND ANALYSIS OF FINANCIAL CONDITION AND RESULTS OF OPERATIONS
The purpose of this discussion and analysis is to focus on significant changes and events in the financial condition and results of operations of Home Bancorp (the “Company”) and its subsidiary, Home Bank (the “Bank”). Home Bancorp, Inc. was newly organized and owned no assets during any period prior to October 2, 2008. Therefore, the financial information for any period prior to October 2, 2008 presented in this report is that of Home Bank only. This discussion and analysis is intended to highlight and supplement data and information presented elsewhere in this report, including the consolidated financial statements and related notes.
EXECUTIVE OVERVIEW
The Company completed its initial public stock offering (“IPO”) on October 2, 2008 and began trading on the Nasdaq Global Market on October 3, 2008. The Company issued 8,926,875 shares of its common stock in the IPO for an aggregate of $89,268,750 in total offering proceeds.
The Company’s financial condition and liquidity as of December 31, 2010 were significantly impacted by the Bank’s acquisition of certain assets and liabilities of Statewide Bank (“Statewide”), a full-service community bank headquartered in Covington, Louisiana, from the Federal Deposit Insurance Corporation (“FDIC”) on March 12, 2010. As a result of the acquisition, the Bank now operates six former Statewide branches in the Northshore (of Lake Pontchartrain) region of Louisiana. The Bank acquired assets of $188.0 million, which included loans of $110.4 million, investment securities of $24.8 million and cash of $11.6 million. In addition, the Company recorded an FDIC loss sharing receivable, representing the portion of estimated losses covered by loss sharing agreements between the Bank and the FDIC, of $34.4 million. The loss sharing agreements between the Bank and the FDIC afford the Bank significant protection against future losses in the acquired loan portfolio (“Covered Loans”) and repossessed assets (collectively referred to as “Covered Assets”). The Bank also recorded a core deposit intangible asset of $1.4 million and goodwill of $560,000 relating to the acquisition. In the Statewide acquisition, the Bank assumed liabilities of $223.9 million, which included $206.9 million in deposits and $16.8 million in FHLB advances.
Net income for 2010 totaled $4.7 million, an increase of 0.2% from the $4.7 million earned in 2009. Diluted earnings per share for 2010 were $0.62, an increase of 6.9% from the $0.58 earned for 2009. Key components of the Company’s performance in 2010 are summarized below.
| • | Total assets as of December 31, 2010 were $700.4 million, an increase of $175.8 million, or 33.5%, from December 31, 2009. The increase was primarily the result of the acquisition of the assets of Statewide, which were recorded at their fair value of $188.0 million as of the date of acquisition. |
| • | Net loans as of December 31, 2010 were $436.0 million, an increase of $102.7 million, or 30.8%, from December 31, 2009. The increase in loans was driven by $110.4 million in loans acquired from Statewide as of the date of acquisition. Loans excluding Covered Loans (“Noncovered Loans”) as of December 31, 2010 were $359.5 million, an increase of $22.8 million, or 6.8%, from December 31, 2009. Covered Loans as of December 31, 2010 were $80.4 million, a decrease of $30.0 million, or 27.1%, from the date of acquisition. |
| • | Net office properties and equipment as of December 31, 2010 were $23.4 million, an increase of $7.2 million, or 44.4%, from December 31, 2009. The Company began 2010 with 11 full-service banking offices. The acquisition of six Statewide locations and the opening of our Baton Rouge headquarters have increased our total number of full-service banking offices to 18. |
| • | Total customer deposits as of December 31, 2010 were $553.2 million, an increase of $181.6 million, or 48.9%, from December 31, 2009. The increase in deposits was driven by the $206.9 million in deposits assumed in the Statewide acquisition. Approximately $46.2 million of higher-cost, out-of-state brokered deposits assumed from Statewide were re-priced by the Company. Consistent with management’s |
22
Table of Contents
| expectations, the vast majority of out-of-state depositors elected to withdraw their deposits. The Company experienced strong core deposit (i.e., checking, savings and money market) growth during 2010. Core deposits totaled $331.5 million as of December 31, 2010, an increase of $114.3 million, or 52.6%, compared to December 31, 2009. |
| • | Shareholders’ equity as of December 31, 2010 was $131.5 million, a decrease $1.2 million, or 0.9%, from December 31, 2009. The decrease was the result of 643,973 shares repurchased during the year, which more than offset the increase in retained earnings. |
| • | Interest income increased $3.8 million, or 12.6%, in 2010 compared to 2009. The increase was primarily due to a higher average volume of loans receivable as the result of the Statewide acquisition, which more than offset decreases in the average yield on investment securities and other interest-earning assets. |
| • | Interest expense decreased $456,000, or 7.2%, in 2010 compared to 2009. The decrease was primarily due to a decrease in the average rate paid on interest-bearing liabilities as the result of reduced market rates and an improved mix of interest-bearing liabilities. |
| • | The provision for loan losses totaled $865,000 in 2010, which was virtually unchanged compared to 2009. The Company increased its ratio of allowance for loan losses to total loans due to, among other factors, consideration of the increasing unemployment rate in the Company’s markets and general economic conditions. As of December 31, 2010, the allowance for loan losses as a percentage of total loans, excluding Covered Loans, was 1.09%, compared to 1.00% as of December 31, 2009. Net charge-offs for 2010 were $297,000, or 0.07% of average total loans, compared to $119,000, or 0.04%, in 2009. |
| • | Noninterest income increased $2.4 million, or 111.2%, in 2010 compared to 2009 driven by higher service fees and charges on deposit accounts and bank card fees due to the Statewide acquisition. The Company also experienced increased gains on the sale of mortgage loans and a higher level of income from bank-owned life insurance as the result of additional policies purchased in the fourth quarter of 2009. Additionally, the Company experienced lower other-than-temporary impairment (“OTTI”) charges with respect to investment securities in 2010 compared to 2009. |
| • | Noninterest expense increased $6.5 million, or 36.7%, in 2010 compared to 2009. The primary reasons for the increase in noninterest expense were higher compensation and benefits, occupancy and data processing and communications expenses related to the Statewide acquisition and the addition of our Baton Rouge headquarters location. Additionally, other expenses increased due to increased expenses on repossessed assets and the amortization of the core deposit intangible resulting from the Statewide acquisition. |
CRITICAL ACCOUNTING POLICIES
The accounting and financial reporting policies of the Company conform to accounting principles generally accepted in the United States of America and to general practices within the banking industry. Accordingly, the financial statements require certain estimates, judgments and assumptions, which are believed to be reasonable, based upon the information available. These estimates and assumptions affect the reported amounts of assets and liabilities as of the date of the financial statements and the reported amounts of income and expenses during the periods presented. The following accounting policies comprise those that management believes are the most critical to aid in fully understanding and evaluating our reported financial results. These policies require numerous estimates or economic assumptions that may prove inaccurate or may be subject to variations which may significantly affect our reported results and financial condition for the period or in future periods.
Allowance for Loan Losses. The allowance for loan losses is established through a provision for loan losses charged to expense. Loans are charged against the allowance for loan losses when management believes that the collectability of the principal is unlikely. Subsequent recoveries are added to the allowance. The allowance is an amount that represents the amount of probable and reasonably estimable known and inherent losses in the loan portfolio, based on evaluations of the collectability of loans. The evaluations take into consideration such factors as changes in the types and amount of loans in the loan portfolio, historical loss experience, adverse situations that may affect the borrower’s ability to repay, estimated value of any underlying collateral, estimated losses
23
Table of Contents
relating to specifically identified loans and current economic conditions. This evaluation is inherently subjective as it requires material estimates including, among others, exposure at default, the amount and timing of expected future cash flows on impacted loans, value of collateral, estimated losses on our commercial and residential loan portfolios as well as consideration of general loss experience. All of these estimates may be susceptible to significant change.
While management uses the best information available to make loan loss allowance evaluations, adjustments to the allowance may be necessary based on changes in economic and other conditions or changes in accounting guidance. The Office of Thrift Supervision (“OTS”), as an integral part of its examination processes, periodically reviews our allowance for loan losses. The OTS may require the recognition of adjustments to the allowance for loan losses based on their judgment of information available to them at the time of their examinations. To the extent that actual outcomes differ from management’s estimates, additional provisions to the allowance for loan losses may be required that would adversely impact earnings in future periods. As part of the risk management program, an independent review is performed on the loan portfolio, which supplements management’s assessment of the loan portfolio and the allowance for loan losses. The result of the independent review is reported directly to the Audit Committee of the Board of Directors.
Income Taxes. We make estimates and judgments to calculate some of our tax liabilities and determine the recoverability of some of our deferred tax assets, which arise from temporary differences between the tax and financial statement recognition of revenues and expenses. We also estimate a valuation allowance for deferred tax assets if, based on the available evidence, it is more likely than not that some portion or all of the recorded deferred tax assets will not be realized in future periods. These estimates and judgments are inherently subjective. Historically, our estimates and judgments to calculate our deferred tax accounts have not required significant revision to our initial estimates.
In evaluating our ability to recover deferred tax assets, we consider all available positive and negative evidence, including our past operating results, recent cumulative losses and our forecast of future taxable income. In determining future taxable income, we make assumptions for the amount of taxable income, the reversal of temporary differences and the implementation of feasible and prudent tax planning strategies. These assumptions require us to make judgments about our future taxable income and are consistent with the plans and estimates we use to manage our business. Any reduction in estimated future taxable income may require us to record a valuation allowance against our deferred tax assets. An increase in the valuation allowance would result in additional income tax expense in the period and could have a significant impact on our future earnings.
Other-than-temporary Impairment of Investment Securities. Securities are evaluated periodically to determine whether a decline in their value is other-than-temporary. The term “other-than-temporary” is not intended to indicate a permanent decline in value. Rather, it means that the prospects for near term recovery of value are not necessarily favorable, or that there is a lack of evidence to support fair values equal to, or greater than, the carrying value of the investment. Management reviews criteria such as the magnitude and duration of the decline, the reasons for the decline and the performance and valuation of the underlying collateral, when applicable, to predict whether the loss in value is other-than-temporary and the intent and ability of the Company to retain the investment for a period of time sufficient to allow for any anticipated recovery in fair value. Once a decline in value is determined to be other-than-temporary, the carrying value of the security is reduced to its fair value and a corresponding charge to earnings is recognized for the decline in value determined to be credit related. The decline in value attributable to noncredit factors is recognized in other comprehensive income.
Stock-based Compensation. The Company accounts for its stock options in accordance with Accounting Standards Codification (“ASC”) Topic 718, Compensation – Stock Compensation. ASC 718 requires companies to expense the fair value of employee stock options and other forms of stock-based compensation. Management utilizes the Black-Scholes option valuation model to estimate the fair value of stock options. The option valuation model requires the input of highly subjective assumptions, including expected stock price volatility and option life. These subjective input assumptions materially affect the fair value estimate.
Acquisition Accounting for Loans. The Company accounted for the Statewide acquisition in accordance with ASC Topic 805, Business Combinations, which requires the use of the purchase method of accounting. All identifiable assets acquired, including loans, are recorded at fair value. The fair value of acquired loans is represented by the
24
Table of Contents
expected cash flows from the portfolio discounted at current market rates. In estimating the cash flows, the Company uses a model based on assumptions about the amount and timing of principal and interest payments, estimated prepayments, estimated default rates, estimated loss severities in the event of defaults and current market rates.
The Company accounts for acquired loans under ASC Topic 310-30, Loans and Debt Securities Acquired with Deteriorated Credit Quality. In accordance with ASC 310-30 and in estimating the fair value of the acquired loans as of the acquisition date, we (a) calculate the contractual amount and timing of undiscounted principal and interest payments (the “undiscounted contractual cash flows”) and (b) estimate the amount and timing of undiscounted expected principal and interest payments (the “undiscounted expected cash flows”). The difference between the undiscounted contractual cash flows and the undiscounted expected cash flows is the nonaccretable difference.
On the acquisition date, the amount by which the undiscounted expected cash flows exceeded the estimated fair value of the acquired loans is the “accretable yield”. The accretable yield is taken into interest income over the life of the loans using the effective yield method. The accretable yield changes over time due to both accretion and as actual and expected cash flows vary from the acquisition date estimated cash flows. The accretable yield is then measured as of each financial reporting date and represents the difference between the remaining undiscounted expected cash flows and the current carrying value of the loans. The remaining undiscounted expected cash flows are calculated as of each financial reporting date based on information then currently available. Increases in expected cash flows over those originally estimated increase the accretable yield and are recognized as interest income prospectively. Increases in expected cash flows also lead to the reduction of any allowance for loan losses recorded after the acquisition. Decreases in expected cash flows, compared to those originally estimated, decrease the accretable yield and are recognized by recording an allowance for loan losses. As the accretable yield increases or decreases from changes in cash flow expectations, the offset is a decrease or increase to the nonaccretable difference.
FINANCIAL CONDITION
Loans, Loan Quality and Allowance for Loan Losses
Loans – The types of loans originated by the Company are subject to federal and state law and regulations. Interest rates charged on loans are affected principally by the demand for such loans and the supply of money available for lending purposes and the rates offered by our competitors. These factors are, in turn, affected by general and economic conditions, the monetary policy of the federal government, including the Federal Reserve Board, legislative tax policies and governmental budgetary matters.
The Company’s lending activities are subject to underwriting standards and loan origination procedures established by our board of directors and management. Loan originations are obtained through a variety of sources, primarily existing customers as well as new customers obtained from referrals and local advertising and promotional efforts. Single-family residential mortgage loan applications and consumer loan applications are taken at any of the Bank’s branch offices. Applications for other loans typically are taken personally by one of our loan officers, although they may be received by a branch office initially and then referred to a loan officer. All loan applications are processed and underwritten centrally at the Bank’s main office.
The loans and repossessed assets that were acquired in the Statewide acquisition are covered by loss sharing agreements between the FDIC and the Bank, which affords the Bank significant loss coverage. As a result of the loss coverage provided by the FDIC, the risk of loss on the Covered Assets is significantly different from those assets not covered under the loss share agreements. As of their acquisition date, Covered Assets were recorded at their fair value, which included an estimate of credit losses. Asset quality information on Covered Assets is reported before consideration of applied loan discounts, as these discounts were recorded based on the estimated cash flow of the total loan pool and not on a specific loan basis. Because of the loss share agreements, balances disclosed below are for general comparative purposes only and do not represent the Company’s risk of loss on Covered Assets. Because these assets are covered by the loss share agreements with the FDIC, the FDIC will absorb 80% of the first $41,000,000 of losses incurred on Covered Assets and 95% of losses on Covered Assets exceeding $41,000,000.
25
Table of Contents
The following tables show the composition of the Company’s loan portfolio as of the dates indicated.
| December 31, | ||||||||||||||||||||
| (dollars in thousands) |
2010 | 2009 | 2008 | 2007 | 2006 | |||||||||||||||
| Real estate loans: |
||||||||||||||||||||
| One- to four-family first mortgage |
$ | 122,614 | $ | 120,044 | $ | 138,173 | $ | 134,264 | $ | 119,369 | ||||||||||
| Home equity loans and lines |
30,915 | 24,678 | 23,127 | 23,065 | 19,604 | |||||||||||||||
| Commercial real estate |
150,824 | 97,513 | 84,096 | 71,964 | 66,125 | |||||||||||||||
| Construction and land |
57,538 | 35,364 | 35,399 | 25,769 | 32,390 | |||||||||||||||
| Multi-family residential |
5,718 | 4,089 | 7,142 | 7,242 | 7,694 | |||||||||||||||
| Total real estate loans |
367,609 | 281,688 | 287,937 | 262,304 | 245,182 | |||||||||||||||
| Other loans: |
||||||||||||||||||||
| Commercial |
48,410 | 38,340 | 34,434 | 32,968 | 25,885 | |||||||||||||||
| Consumer |
23,892 | 16,619 | 13,197 | 13,310 | 12,199 | |||||||||||||||
| Total other loans |
72,302 | 54,959 | 47,631 | 46,278 | 38,084 | |||||||||||||||
| Total loans |
$ | 439,911 | $ | 336,647 | $ | 335,568 | $ | 308,582 | $ | 283,266 | ||||||||||
| December 31, 2010 | ||||||||||||
| (dollars in thousands) |
Noncovered Loans |
Covered Loans |
Total | |||||||||
| Real estate loans: |
||||||||||||
| One- to four-family first mortgage |
$ | 105,157 | $ | 17,457 | $ | 122,614 | ||||||
| Home equity loans and lines |
24,898 | 6,017 | 30,915 | |||||||||
| Commercial real estate |
115,946 | 34,878 | 150,824 | |||||||||
| Construction and land |
45,177 | 12,361 | 57,538 | |||||||||
| Multi-family residential |
4,493 | 1,225 | 5,718 | |||||||||
| Total real estate loans |
295,671 | 71,938 | 367,609 | |||||||||
| Other loans: |
||||||||||||
| Commercial |
42,247 | 6,163 | 48,410 | |||||||||
| Consumer |
21,546 | 2,346 | 23,892 | |||||||||
| Total other loans |
63,793 | 8,509 | 72,302 | |||||||||
| Total loans |
$ | 359,464 | $ | 80,447 | $ | 439,911 | ||||||
The loan portfolio increased $103.3 million, or 30.7%, during 2010. The increase includes loans acquired from Statewide, which were recorded at fair value of $110.4 million on the date of acquisition. Covered Loans totaled $80.4 million as of December 31, 2010, a decrease of $30.0 million, or 27.1%, from the date of acquisition. The decrease was primarily the result of principal repayments and foreclosures. Noncovered Loans totaled $359.5 million as of December 31, 2010, an increase of $22.8 million, or 6.8%, from December 31, 2009. Noncovered Loan growth in 2010 was concentrated in the commercial real estate and other commercial portfolios.
26
Table of Contents
The following table reflects contractual loan maturities as of December 31, 2010, unadjusted for scheduled principal reductions, prepayments or repricing opportunities. Of the $331.0 million in loans which have contractual maturity dates subsequent to December 31, 2011, $295.5 million have fixed interest rates and $35.5 million have floating or adjustable interest rates.
| Due In | ||||||||||||||||
| (dollars in thousands) |
One year or less |
One through five years |
More than five years |
Total | ||||||||||||
| One- to four-family first mortgage |
$ | 13,732 | $ | 24,222 | $ | 84,660 | $ | 122,614 | ||||||||
| Home equity loans and lines |
5,334 | 19,330 | 6,251 | 30,915 | ||||||||||||
| Commercial real estate |
24,323 | 109,658 | 16,843 | 150,824 | ||||||||||||
| Construction and land |
41,575 | 15,148 | 815 | 57,538 | ||||||||||||
| Multi-family residential |
605 | 5,113 | — | 5,718 | ||||||||||||
| Commercial |
19,782 | 25,408 | 3,220 | 48,410 | ||||||||||||
| Consumer |
3,584 | 6,975 | 13,333 | 23,892 | ||||||||||||
| Total |
$ | 108,935 | $ | 205,854 | $ | 125,122 | $ | 439,911 | ||||||||
Loan Quality – One of management’s key objectives has been, and continues to be, maintaining a high level of asset quality. In addition to maintaining credit standards for new loan originations, we proactively monitor loans and collection and workout processes of delinquent or problem loans. When a borrower fails to make a scheduled payment, we attempt to cure the deficiency by making personal contact with the borrower. Initial contacts are generally made within 10 days after the date the payment is due. In most cases, deficiencies are promptly resolved. If the delinquency continues, late charges are assessed and additional efforts are made to collect the deficiency. All loans which are designated as “special mention,” classified or which are delinquent 90 days or more are reported to the Board of Directors of the Bank monthly. For loans where the collection of principal or interest payments is doubtful, the accrual of interest income ceases. It is our policy, with certain limited exceptions, to discontinue accruing interest and reverse any interest accrued on any loan which is 90 days or more past due. On occasion, this action may be taken earlier if the financial condition of the borrower raises significant concern with regard to his/her ability to service the debt in accordance with the terms of the loan agreement. Interest income is not accrued on these loans until the borrower’s financial condition and payment record demonstrate an ability to service the debt.
Repossessed assets which are acquired as a result of foreclosure are classified as repossessed assets until sold. Repossessed assets are recorded at the fair value less estimated selling costs. Costs associated with acquiring and improving a foreclosed property are usually capitalized to the extent that the carrying value does not exceed fair value less estimated selling costs. Holding costs are charged to expense. Gains and losses on the sale of repossessed assets are charged to operations, as incurred.
An impaired loan generally is one for which it is probable, based on current information, that the lender will not collect all the amounts due under the contractual terms of the loan. Large groups of smaller balance, homogeneous loans are collectively evaluated for impairment. Loans collectively evaluated for impairment include smaller balance commercial real estate loans, residential real estate loans and consumer loans. These loans are evaluated as a group because they have similar characteristics and performance experience. Larger commercial real estate, multi-family residential, construction and land loans and other commercial loans are individually evaluated for impairment. As of December 31, 2010 and 2009, impaired loans, excluding Covered Loans, amounted to $1.7 million and $2.8 million, respectively. The amount of the allowance for loan losses allocated to impaired loans, excluding Covered Loans, totaled $394,000 and $472,000 as of December 31, 2010 and 2009, respectively.
Federal regulations and our policies require that we utilize an internal asset classification system as a means of reporting problem and potential problem assets. We have incorporated an internal asset classification system, substantially consistent with Federal banking regulations, as a part of our credit monitoring system. Federal banking regulations set forth a classification scheme for problem and potential problem assets as “substandard,” “doubtful” or “loss” assets. An asset is considered “substandard” if it is inadequately protected by the current net worth and paying capacity of the obligor or of the collateral pledged, if any. “Substandard” assets include those
27
Table of Contents
characterized by the “distinct possibility” that the insured institution will sustain “some loss” if the deficiencies are not corrected. Assets classified as “doubtful” have all of the weaknesses inherent in those classified “substandard” with the added characteristic that the weaknesses present make “collection or liquidation in full,” on the basis of currently existing facts, conditions and values, “highly questionable and improbable.” Assets classified as “loss” are those considered “uncollectible” and of such little value that their continuance as assets without the establishment of a specific loss reserve is not warranted.
A savings institution’s determination as to the classification of its assets and the amount of its valuation allowances is subject to review by Federal bank regulators which can order the establishment of additional general or specific loss allowances. The Federal banking agencies have adopted an interagency policy statement on the allowance for loan and lease losses. The policy statement provides guidance for financial institutions on both the responsibilities of management for the assessment and establishment of allowances and guidance for banking agency examiners to use in determining the adequacy of general valuation guidelines. Generally, the policy statement recommends that institutions have effective systems and controls to identify, monitor and address asset quality problems; that management analyze all significant factors that affect the collectability of the portfolio in a reasonable manner; and that management establish acceptable allowance evaluation processes that meet the objectives set forth in the policy statement. Our management believes that, based on information currently available, our allowance for loan losses is maintained at a level which covers all known and inherent losses that are both probable and reasonably estimable as of each reporting date. However, actual losses are dependent upon future events and, as such, further additions to the level of allowances for loan losses may become necessary.
The loans and repossessed assets that were acquired in the Statewide acquisition are covered by loss sharing agreements between the FDIC and the Bank, which affords the Bank significant loss coverage. As a result of the loss coverage provided by the FDIC, the risk of loss on the Covered Assets is significantly different from those assets not covered under the loss share agreements. At their acquisition date, Covered Assets were recorded at their fair value, which included an estimate of credit losses. Asset quality information on Covered Assets is reported before consideration of applied loan discounts, as these discounts were recorded based on the estimated cash flow of the total loan pool and not on a specific loan basis. Because of the loss share agreements, balances disclosed below are for general comparative purposes only and do not represent the Company’s risk of loss on Covered Assets. Because these assets are covered by the loss share agreements with the FDIC, the FDIC will absorb 80% of the first $41,000,000 of losses incurred on Covered Assets and 95% of losses on Covered Assets exceeding $41,000,000.
We review and classify assets monthly. The Board of Directors is provided with monthly reports on our classified assets. We classify assets in accordance with the management guidelines described above. As of December 31, 2010 and 2009, substandard loans, excluding Covered Loans, amounted to $2.1 million and $2.8 million, respectively. The amount of the allowance for loan losses allocated to substandard loans totaled $394,000 as of December 31, 2010 and $472,000 as of December 31, 2009. There were no assets classified as doubtful or loss as of December 31, 2010 or December 31, 2009.
28
Table of Contents
Nonperforming assets, defined as nonaccrual loans, accruing loans past due 90 days or more and foreclosed property, excluding Covered Assets, amounted to $1.1 million, or 0.19% of total assets, as of December 31, 2010, compared to $1.7 million, or 0.32% of total assets, as of December 31, 2009. The following table sets forth the composition of the Company’s nonperforming assets and troubled debt restructurings as of the dates indicated.
| December 31, | ||||||||||||||||||||
| (dollars in thousands) |
2010(1) | 2009 | 2008 | 2007 | 2006 | |||||||||||||||
| Nonaccrual loans: |
||||||||||||||||||||
| Real estate loans: |
||||||||||||||||||||
| One- to four-family first mortgage |
$ | 277 | $ | 864 | $ | 871 | $ | 775 | $ | 238 | ||||||||||
| Home equity loans and lines |
— | 362 | 156 | 12 | — | |||||||||||||||
| Commercial real estate and multi-family |
408 | — | 362 | 318 | 476 | |||||||||||||||
| Construction and land |
12 | — | — | — | — | |||||||||||||||
| Other loans: |
||||||||||||||||||||
| Commercial |
351 | 38 | 9 | 173 | 199 | |||||||||||||||
| Consumer |
8 | 15 | 29 | 17 | 29 | |||||||||||||||
| Total nonaccrual loans |
1,056 | 1,279 | 1,427 | 1,295 | 942 | |||||||||||||||
| Accruing loans 90 days or more past due |
— | — | — | — | — | |||||||||||||||
| Total nonperforming loans |
1,056 | 1,279 | 1,427 | 1,295 | 942 | |||||||||||||||
| Foreclosed property |
92 | 417 | 37 | 47 | 25 | |||||||||||||||
| Total nonperforming assets |
1,148 | 1,696 | 1,464 | 1,342 | 967 | |||||||||||||||
| Performing troubled debt restructurings |
721 | 556 | 449 | — | — | |||||||||||||||
| Total nonperforming assets and troubled debt restructurings |
$ | 1,869 | $ | 2,252 | $ | 1,913 | $ | 1,342 | $ | 967 | ||||||||||
| Nonperforming loans to total loans |
0.29 | % | 0.38 | % | 0.43 | % | 0.42 | % | 0.34 | % | ||||||||||
| Nonperforming loans to total assets |
0.17 | % | 0.24 | % | 0.27 | % | 0.31 | % | 0.24 | % | ||||||||||
| Nonperforming assets to total assets |
0.19 | % | 0.32 | % | 0.28 | % | 0.32 | % | 0.24 | % | ||||||||||
| (1) | Asset quality information excludes assets covered under FDIC loss sharing agreements. At December 31, 2010, Covered Loans and Assets totaled $80.4 million and $86.0 million, respectively. |
| December 31, 2010 | ||||||||||||
| (dollars in thousands) |
Covered Assets |
Noncovered Assets |
Total | |||||||||
| Nonaccrual loans: |
||||||||||||
| Real estate loans: |
||||||||||||
| One- to four-family first mortgage |
$ | 5,458 | $ | 277 | $ | 5,735 | ||||||
| Home equity loans and lines |
271 | — | 271 | |||||||||
| Commercial real estate and multi-family |
2,879 | 408 | 3,287 | |||||||||
| Construction and land |
4,221 | 12 | 4,233 | |||||||||
| Other loans: |
||||||||||||
| Commercial |
3,008 | 351 | 3,359 | |||||||||
| Consumer |
151 | 8 | 159 | |||||||||
| Total nonaccrual loans |
15,988 | 1,056 | 17,044 | |||||||||
| Accruing loans 90 days or more past due |
— | — | — | |||||||||
| Total nonperforming loans |
15,988 | 1,056 | 17,044 | |||||||||
| Foreclosed property |
5,661 | 92 | 5,753 | |||||||||
| Total nonperforming assets |
21,649 | 1,148 | 22,797 | |||||||||
| Performing troubled debt restructurings |
— | 721 | 721 | |||||||||
| Total nonperforming assets and troubled debt restructurings |
$ | 21,649 | $ | 1,869 | $ | 23,518 | ||||||
29
Table of Contents
Net charge-offs for 2010 were $297,000, or 0.07%, of total loans, compared to $119,000, or 0.04%, in 2009.
Real estate, or other collateral, which is acquired as a result of foreclosure is classified as repossessed assets until sold. Repossessed assets are recorded at fair value less estimated costs to sell. Holding costs are charged to expense. Gains and losses on the sale of repossessed assets are charged to operations, as incurred.
Allowance for Loan Losses – The allowance for loan losses is established through provisions for loan losses. The Company maintains the allowance at a level believed, to the best of management’s knowledge, to cover all known and inherent losses in the portfolio that are both probable and reasonable to estimate at each reporting date. Management reviews the allowance for loan losses at least quarterly in order to identify those inherent losses and to assess the overall collection probability for the loan portfolio. Our evaluation process includes, among other things, an analysis of delinquency trends, nonperforming loan trends, the level of charge-offs and recoveries, prior loss experience, total loans outstanding, the volume of loan originations, the type, size and geographic concentration of our loans, the value of collateral securing loans, the borrower’s ability to repay and repayment performance, the number of loans requiring heightened management oversight, local economic conditions and industry experience. Based on this evaluation, management assigns risk rankings to segments of the loan portfolio. Such risk ratings are periodically reviewed by management and revised as deemed appropriate. These efforts are supplemented by independent reviews and validations performed by an outsourced independent loan reviewer. The results of the reviews are reported directly to the Audit Committee of the Board of Directors. The establishment of the allowance for loan losses is significantly affected by management judgment and uncertainties and there is likelihood that different amounts would be reported under different conditions or assumptions. Various regulatory agencies, as an integral part of their examination process, periodically review our allowance for loan losses. Such agencies may require management to make additional provisions for estimated loan losses based upon judgments different from those of management.
With respect to Covered Loans, the Company follows the reserve standard set forth in ASC 310, Receivables. At acquisition, the Company reviews each loan to determine whether there is evidence of deterioration in credit quality since origination and if it is probable that the Company will be unable to collect all amounts due according to the loan’s contractual terms. The Company considers expected prepayments and estimates the amount and timing of undiscounted expected principal, interest and other cash flows for each loan pool meeting the criteria above, and determines the excess of the loan pool’s scheduled contractual principal and interest payments in excess of cash flows expected at acquisition as an amount that should not be accreted (nonaccretable difference). The remaining amount, representing the excess of the pool’s cash flows expected to be collected over the fair value, is accreted into interest income over the remaining life of the pool (accretable yield). The Company records a discount on these loans at acquisition to record them at their realizable cash flow. As a result, acquired loans subject to ASC 310 are excluded from the calculation of the allowance for loan losses as of the acquisition date.
Loans acquired in the Statewide acquisition were recorded as of their acquisition date fair value, which was based on expected cash flows and included an estimation of expected future loan losses. Under current accounting principles, if the Company determines that losses arose after the acquisition date, the additional losses will be reflected as a provision for loan losses. Additionally, the acquired loans will be included in the calculation of the Company’s allowance for loan losses to the extent the losses are not covered by the FDIC loss sharing agreements.
We will continue to monitor and modify our allowance for loan losses as conditions dictate. No assurance can be given that our level of allowance for loan losses will cover all of the inherent losses on our loans or that future adjustments to the allowance for loan losses will not be necessary if economic and other conditions differ substantially from the conditions used by management to determine the current level of the allowance for loan losses.
30
Table of Contents
The following table presents the activity in the allowance for loan losses for the years indicated.
| For the Years Ended December 31, | ||||||||||||||||||||
| (dollars in thousands) |
2010 | 2009 | 2008 | 2007 | 2006 | |||||||||||||||
| Balance, beginning of year |
$ | 3,352 | $ | 2,606 | $ | 2,314 | $ | 2,008 | $ | 1,821 | ||||||||||
| Provision charged to operations |
865 | 865 | 459 | 420 | 260 | |||||||||||||||
| Loans charged off: |
||||||||||||||||||||
| One- to four-family first mortgage |
— | — | — | 17 | 20 | |||||||||||||||
| Home equity loans and lines |
174 | 66 | 30 | 52 | 16 | |||||||||||||||
| Commercial real estate and multi-family |
65 | — | — | — | — | |||||||||||||||
| Construction and land |
— | — | — | — | — | |||||||||||||||
| Commercial |
106 | 21 | 88 | 16 | — | |||||||||||||||
| Consumer |
24 | 54 | 94 | 40 | 54 | |||||||||||||||
| Recoveries on charged off loans |
72 | 22 | 45 | 11 | 17 | |||||||||||||||
| Balance, end of year |
$ | 3,920 | $ | 3,352 | $ | 2,606 | $ | 2,314 | $ | 2,008 | ||||||||||
Excluding Covered Loans, the allowance for loan losses amounted to 1.09% of total loans and 371.2% of total nonperforming loans as of December 31, 2010, compared to 1.00% and 262.2%, respectively, as of December 31, 2009. The increase in the allowance for loan losses during 2010 was the result of the Company’s consideration of, among other factors, unemployment rates in its markets and general economic conditions.
The following table presents the allocation of the allowance for loan losses as of December 31 of the years indicated.
| December 31, | ||||||||||||||||||||||||||||||||||||||||
| 2010 | 2009 | 2008 | 2007 | 2006 | ||||||||||||||||||||||||||||||||||||
| (dollars in thousands) |
Amount | % Loans | Amount | % Loans | Amount | % Loans | Amount | % Loans | Amount | % Loans | ||||||||||||||||||||||||||||||
| One- to four-family first mortgage |
$ | 641 | 27.87 | % | $ | 383 | 35.66 | % | $ | 399 | 41.18 | % | $ | 387 | 43.51 | % | $ | 344 | 42.14 | % | ||||||||||||||||||||
| Home equity loans and lines |
296 | 7.03 | 351 | 7.33 | 345 | 6.89 | 302 | 7.48 | 209 | 6.92 | ||||||||||||||||||||||||||||||
| Commercial real estate and multi-family |
1,304 | 35.59 | 999 | 30.18 | 1,175 | 27.19 | 925 | 25.67 | 541 | 26.06 | ||||||||||||||||||||||||||||||
| Construction and land |
666 | 13.08 | 670 | 10.50 | 212 | 10.55 | 201 | 8.35 | 125 | 11.43 | ||||||||||||||||||||||||||||||
| Commercial |
746 | 11.00 | 738 | 11.39 | 327 | 10.26 | 316 | 10.68 | 621 | 9.14 | ||||||||||||||||||||||||||||||
| Consumer |
267 | 5.43 | 211 | 4.94 | 148 | 3.93 | 183 | 4.31 | 168 | 4.31 | ||||||||||||||||||||||||||||||
| Total |
$ | 3,920 | 100.00 | % | $ | 3,352 | 100.00 | % | $ | 2,606 | 100.00 | % | $ | 2,314 | 100.00 | % | $ | 2,008 | 100.00 | % | ||||||||||||||||||||
Investment Securities
The Company invests in securities pursuant to our Investment Policy, which has been approved by our Board of Directors. The Investment Policy is designed primarily to manage the interest rate sensitivity of our assets and liabilities, to generate a favorable return without incurring undue interest rate or credit risk, to complement our lending activities and to provide and maintain liquidity. The Asset-Liability Committee (“ALCO”), comprised of the Chief Executive Officer, Chief Financial Officer, Chief Lending Officer, Chief Operations Officer and Controller, monitors investment activity and ensures that investments are consistent with the Investment Policy. The Board of Directors of the Company reviews investment activity monthly.
31
Table of Contents
The investment securities portfolio increased by an aggregate of $7.3 million, or 6.1%, during 2010. The increase was the result of purchases as well as the acquisition from Statewide of $24.8 million of U.S. agency mortgage-backed securities, which were partially offset by principal paydowns and sales. Securities available for sale made up 88.0% of the investment securities portfolio as of December 31, 2010. The following table sets forth the amortized cost and market value of our investment securities portfolio as of the dates indicated.
| December 31, | ||||||||||||||||||||||||
| 2010 | 2009 | 2008 | ||||||||||||||||||||||
| (dollars in thousands) |
Amortized Cost |
Market Value |
Amortized Cost |
Market Value |
Amortized Cost |
Market Value |
||||||||||||||||||
| Available for sale: |
||||||||||||||||||||||||
| U.S. agency mortgage-backed |
$ | 83,514 | $ | 85,335 | $ | 60,338 | $ | 62,092 | $ | 71,175 | $ | 71,480 | ||||||||||||
| Non-U.S. agency mortgage-backed |
21,305 | 20,451 | 39,707 | 37,853 | 51,108 | 42,755 | ||||||||||||||||||
| U.S. government agency |
6,094 | 6,176 | 6,840 | 6,807 | — | — | ||||||||||||||||||
| Total available for sale |
110,913 | 111,962 | 106,885 | 106,752 | 122,283 | 114,235 | ||||||||||||||||||
| Held to maturity: |
||||||||||||||||||||||||
| U.S. agency mortgage-backed |
3,857 | 3,943 | 5,736 | 5,781 | 2,545 | 2,570 | ||||||||||||||||||
| Municipal bonds |
1,363 | 1,441 | 1,363 | 1,439 | 1,544 | 1,564 | ||||||||||||||||||
| U.S. government agency |
10,000 | 10,016 | 6,000 | 5,957 | — | — | ||||||||||||||||||
| Total held to maturity |
15,220 | 15,400 | 13,099 | 13,177 | 4,089 | 4,134 | ||||||||||||||||||
| Total investment securities |
$ | 126,133 | $ | 127,362 | $ | 119,984 | $ | 119,929 | $ | 126,372 | $ | 118,369 | ||||||||||||
The following table sets forth the fixed versus adjustable rate profile of the investment securities portfolio as of the dates indicated. All amounts are shown at amortized cost.
| December 31, | ||||||||||||
| (dollars in thousands) |
2010 | 2009 | 2008 | |||||||||
| Fixed rate: |
||||||||||||
| Available for sale |
$ | 32,391 | $ | 30,023 | $ | 36,307 | ||||||
| Held to maturity |
5,220 | 7,099 | 4,089 | |||||||||
| Total fixed rate |
37,611 | 37,122 | 40,396 | |||||||||
| Adjustable rate: |
||||||||||||
| Available for sale |
78,522 | 76,862 | 85,976 | |||||||||
| Held to maturity |
10,000 | 6,000 | — | |||||||||
| Total adjustable rate |
88,522 | 82,862 | 85,976 | |||||||||
| Total investment securities |
$ | 126,133 | $ | 119,984 | $ | 126,372 | ||||||
32
Table of Contents
The following table sets forth the amount of investment securities which mature during each of the periods indicated and the weighted average yields for each range of maturities as of December 31, 2010. No tax-exempt yields have been adjusted to a tax-equivalent basis. All amounts are shown at amortized cost.
| Amounts as of December 31, 2010 which mature in: | ||||||||||||||||||||
| (dollars in thousands) |
One Year or Less |
One Year to Five Years |
Five to Ten Years |
Over Ten Years |
Total | |||||||||||||||
| Available for sale: |
||||||||||||||||||||
| U.S. agency mortgage-backed |
$ | — | $ | 2,924 | $ | 15,189 | $ | 65,401 | $ | 83,514 | ||||||||||
| Non-U.S. agency mortgage-backed |
— | — | 479 | 20,826 | 21,305 | |||||||||||||||
| U.S. government agency |
— | — | — | 6,094 | 6,094 | |||||||||||||||
| Total available for sale |
— | 2,924 | 15,668 | 92,321 | 110,913 | |||||||||||||||
| Weighted average yield |
— | % | 4.11 | % | 2.06 | % | 3.02 | % | 2.91 | % | ||||||||||
| Held to maturity: |
||||||||||||||||||||
| U.S. agency mortgage-backed |
— | 2,424 | 1,433 | — | 3,857 | |||||||||||||||
| Municipal bonds |
190 | 938 | 235 | — | 1,363 | |||||||||||||||
| U.S. government agency |
— | 5,000 | 5,000 | — | 10,000 | |||||||||||||||
| Total held to maturity |
190 | 8,362 | 6,668 | — | 15,220 | |||||||||||||||
| Weighted average yield |
4.00 | % | 1.71 | % | 2.31 | % | — | % | 2.00 | % | ||||||||||
| Total investment securities |
$ | 190 | $ | 11,286 | $ | 22,336 | $ | 92,321 | $ | 126,133 | ||||||||||
The following table summarizes activity in the Company’s investment securities portfolio during 2010.
| (dollars in thousands) |
Available for Sale | Held to Maturity | ||||||
| Balance, December 31, 2009 |
$ | 106,752 | $ | 13,099 | ||||
| Purchases |
42,808 | 15,000 | ||||||
| Sales |
(24,224 | ) | — | |||||
| Principal maturities, prepayments and calls |
(39,645 | ) | (12,876 | ) | ||||
| Amortization of premiums and accretion of discounts |
1,477 | (3 | ) | |||||
| Acquired from Statewide, at fair value |
24,841 | — | ||||||
| Increase in market value |
1,182 | — | ||||||
| Other-than-temporary impairment |
(1,229 | ) | — | |||||
| Balance, December 31, 2010 |
$ | 111,962 | $ | 15,220 | ||||
As of December 31, 2010, the Company had a net unrealized gain on its available for sale investment securities portfolio of $1.1 million, compared to a net unrealized loss of $133,000 as of December 31, 2009. Due to increasing delinquencies and defaults in the mortgage loans underlying certain non-agency mortgage-backed securities we own, the Company recorded OTTI charges of $1.2 million, $1.9 million and $2.8 million during 2010, 2009 and 2008, respectively. The amortized cost of this portfolio decreased from $39.7 million as of December 31, 2009 to $21.3 million as of December 31, 2010 primarily as a result of principal paydowns and security sales. Based on management’s review of the remaining investment portfolio, no other declines in the market value of the Company’s investment securities are deemed to be other-than-temporary as of December 31, 2010.
33
Table of Contents
The following table summarizes the Company’s non-agency mortgage-backed securities portfolio as of the dates indicated (dollars in thousands).
| December 31, 2010 | December 31, 2009 | |||||||||||||||||||
| Collateral |
Tranche |
S&P Rating |
Amortized Cost |
Unrealized Gain/(Loss) |
Amortized Cost |
Unrealized Gain/(Loss) |
||||||||||||||
| Prime |
Super Senior | AAA | $ | 2,249 | $ | (24 | ) | $ | 10,189 | $ | 130 | |||||||||
| Prime |
Senior | AAA (1) | 14,645 | (406 | ) | 18,743 | (1,462 | ) | ||||||||||||
| Prime |
Senior | Below investment grade | — | — | 3,113 | — | ||||||||||||||
| Prime |
Senior support | Below investment grade | 1,104 | (309 | ) | 2,719 | (545 | ) | ||||||||||||
| Alt-A |
Super senior | Below investment grade | 1,360 | (123 | ) | 2,202 | — | |||||||||||||
| Alt-A |
Senior | AAA | 479 | 20 | 771 | 23 | ||||||||||||||
| Alt-A |
Senior | Below investment grade (2) | 1,468 | (12 | ) | 1,774 | — | |||||||||||||
| Alt-A |
Senior support | Below investment grade | — | — | 196 | — | ||||||||||||||
| Total non-agency mortgage-backed securities |
$ | 21,305 | $ | (854 | ) | $ | 39,707 | $ | (1,854 | ) | ||||||||||
| (1) | As of December 31, 2010 and 2009, includes one security with an amortized cost of $1.6 million and $1.9 million, respectively, and an unrealized gain of $14,000 and $56,000, respectively, not rated by S&P. This security was rated “Aaa” by Moody’s as of the dates indicated. |
| (2) | As of the dates indicated, this security was not rated by S&P and rated “Caa2” by Moody’s. |
The Company holds no Federal National Mortgage Association (“Fannie Mae”) or Federal Home Loan Mortgage Corporation (“Freddie Mac”) preferred stock, equity securities, corporate bonds, trust preferred securities, hedge fund investments, collateralized debt obligations or structured investment vehicles.
Funding Sources
General – Deposits, loan repayments and prepayments, proceeds from investment securities sales, calls, maturities and paydowns, cash flows generated from operations and Federal Home Loan Bank (“FHLB”) advances are our primary, ongoing sources of funds for use in lending, investing and for other general purposes. In 2008, our IPO provided approximately $87.2 million in net proceeds to the Company.
Deposits – The Company offers a variety of deposit accounts with a range of interest rates and terms. Our deposits consist of checking, both interest-bearing and noninterest-bearing, money market, savings and certificate of deposit accounts.
The flow of deposits is influenced significantly by general economic conditions, changes in market interest rates and competition. Our deposits are obtained predominantly from the areas where our branch offices are located. We have historically relied primarily on a high level of customer service and long-standing relationships with customers to attract and retain deposits; however, market interest rates and rates offered by competitors significantly affect our ability to attract and retain deposits.
The Company uses traditional means of advertising its deposit products, including broadcast and print media. The Company generally does not solicit deposits from outside our market area.
Total deposits were $553.2 million as of December 31, 2010, an increase of $181.6 million, or 48.9%, compared to $371.6 million as of December 31, 2009. The acquisition of Statewide added $206.9 million in deposits during the first quarter of 2010, including approximately $46.2 million of higher-cost, out-of-state brokered deposits which the Company elected to re-price. Consistent with management’s expectations, the vast majority of out-of-state depositors elected to withdraw their deposits.
34
Table of Contents
The Company experienced strong core deposit growth during 2010. Core deposits totaled $331.5 million as of December 31, 2010, an increase of $114.3 million, or 52.6%, compared to December 31, 2009. Excluding core deposits acquired from Statewide, core deposits increased $67.7 million, or 31.2%, during 2010. The following table sets forth the composition of the Company’s deposits as of the dates indicated.
| December 31, | Increase (Decrease) | |||||||||||||||
| (dollars in thousands) |
2010 | 2009 | Amount | Percent | ||||||||||||
| Demand deposit |
$ | 100,579 | $ | 66,956 | $ | 33,623 | 50.2 | % | ||||||||
| Savings |
29,258 | 21,009 | 8,249 | 39.3 | ||||||||||||
| Money market |
133,245 | 80,810 | 52,435 | 64.9 | ||||||||||||
| NOW |
68,398 | 48,384 | 20,014 | 41.4 | ||||||||||||
| Certificates of deposit |
221,738 | 154,434 | 67,304 | 43.6 | ||||||||||||
| Total deposits |
$ | 553,218 | $ | 371,593 | $ | 181,625 | 48.9 | % | ||||||||
The following table shows the average balance and average rate paid for each type of deposit for the periods indicated.
| For the Years Ended December 31, | ||||||||||||||||||||||||||||||||||||
| (dollars in thousands) |
2010 | 2009 | 2008 | |||||||||||||||||||||||||||||||||
| Average Balance |
Interest Expense |
Average Rate Paid |
Average Balance |
Interest Expense |
Average Rate Paid |
Average Balance |
Interest Expense |
Average Rate Paid |
||||||||||||||||||||||||||||
| Savings, checking and money market |
$ | 196,561 | $ | 1,278 | 0.65 | % | $ | 143,231 | $ | 1,056 | 0.74 | % | $ | 129,377 | $ | 1,657 | 1.28 | % | ||||||||||||||||||
| Certificates of deposit |
239,872 | 4,038 | 1.68 | 159,928 | 4,473 | 2.80 | 167,254 | 6,246 | 3.73 | |||||||||||||||||||||||||||
| Total interest - bearing deposits |
$ | 436,433 | $ | 5,316 | 1.22 | % | $ | 303,159 | $ | 5,529 | 1.82 | % | $ | 296,631 | $ | 7,903 | 2.66 | % | ||||||||||||||||||
Certificates of deposit $100,000 and over increased $28.1 million, or 44.0%, from $64.0 million as of December 31, 2009 to $92.2 million as of December 31, 2010. The following table details the remaining maturity of large-denomination certificates of deposit of $100,000 and over.
| December 31, | ||||||||||||
| (dollars in thousands) |
2010 | 2009 | 2008 | |||||||||
| 3 months or less |
$ | 21,764 | $ | 15,112 | $ | 9,951 | ||||||
| 3 - 6 months |
17,690 | 14,828 | 8,328 | |||||||||
| 6 - 12 months |
24,457 | 13,520 | 17,277 | |||||||||
| 12 - 36 months |
24,574 | 18,973 | 22,937 | |||||||||
| More than 36 months |
3,685 | 1,589 | 1,928 | |||||||||
| Total certificates of deposit |
$ | 92,170 | $ | 64,022 | $ | 60,421 | ||||||
Federal Home Loan Bank Advances – Advances from the FHLB of Dallas (“FHLB”) may be obtained by the Company upon the security of the common stock it owns in the FHLB and certain of its real estate loans and investment securities, provided certain standards related to creditworthiness have been met. Such advances are made pursuant to several credit programs, each of which has its own interest rate and range of maturities. Advances from the FHLB may be either short-term, maturities of one year or less, or long-term, maturities in excess of one year.
The Company had no short-term FHLB advances outstanding as of December 31, 2010 or December 31, 2009. The average rates paid on short-term FHLB advances were 0.2% and 1.0% for 2010 and 2009, respectively.
Long-term FHLB advances totaled $13.0 million as of December 31, 2010, a decrease of $3.8 million, or 22.5%, compared to December 31, 2009. The average rates paid on long-term FHLB advances were 3.3% and 3.6% for 2010 and 2009, respectively.
35
Table of Contents
Shareholders’ Equity – Shareholders’ equity provides a source of permanent funding, allows for future growth and provides the Company with a cushion to withstand unforeseen adverse developments. As of December 31, 2010, shareholders’ equity totaled $131.5 million, a decrease of $1.2 million, or 0.9%, compared to $132.7 million as of December 31, 2009. The decrease was primarily the result of treasury stock purchases of $8.6 million in 2010, which was partially offset by a $4.7 million increase in retained earnings, a $780,000 increase in other comprehensive income and an aggregate $1.1 million increase in unearned common stock held employee stock ownership plan (“ESOP”) and 2009 Recognition and Retention Plan (“RRP”) as a result of shares vesting in the plans.
RESULTS OF OPERATIONS
The Company reported net income of $4.7 million, $4.7 million and $2.7 million for the years ended December 31, 2010, 2009 and 2008, respectively. Diluted earnings per share were $0.62, $0.58 and $1.32 in 2010, 2009 and 2008, respectively. The Company completed its initial public offering of common stock in October 2008. Hence, the weighted average number of common shares outstanding during 2008 was lower than it would have been had the shares been outstanding for a full year.
Net Interest Income – Net interest income is the difference between the interest income earned on interest-earning assets, such as loans and investment securities, and the interest expense paid on interest-bearing liabilities, such as deposits and borrowings. Our net interest income is largely determined by our net interest spread, which is the difference between the average yield earned on interest-earning assets and the average rate paid on interest bearing liabilities, and the relative amounts of interest-earning assets and interest-bearing liabilities. The Company’s net interest spread was 4.31%, 4.06% and 3.66% during the years ended December 31, 2010, 2009 and 2008, respectively. The Company’s net interest margin, which is net interest income as a percentage of average interest-earning assets, was 4.62%, 4.72% and 4.31% during the years ended December 31, 2010, 2009 and 2008, respectively. The increase in net interest spread in 2010 compared to 2009 was primarily due to a lower cost of interest-bearing liabilities driven by the current low rate environment. The net interest margin ratio decreased in 2010 compared to 2009 primarily due to decreased yields on interest-earning assets.
Net interest income increased $4.2 million, or 17.9%, in 2010 to $27.8 million, compared to $23.6 million in 2009. This increase was due to a $3.8 million, or 12.6%, increase in interest income and a $456,000, or 7.2%, decrease in interest expense. The improvement in net interest income in 2010 compared to 2009 was the result of increased volumes of interest-earning assets primarily as the result of the Statewide acquisition, lower average rates paid on interest-bearing deposits and an improved mix of interest-bearing deposits. This improvement was partially offset by lower average yields on interest-earning assets as loan and investment yields declined due to the low interest rate environment. The yield on other interest-earning assets decreased due to the Company’s decision in 2009 not to renew its contracts with third parties for cash invested at other ATM locations.
In 2009, net interest income increased $4.9 million, or 26.1%, to $23.6 million compared to $18.7 million in 2008. This increase was due to a $2.5 million, or 9.0%, increase in interest income and a $2.4 million, or 27.6%, decrease in interest expense. The improvement in net interest income in 2009 compared to 2008 was the result of increased volumes of interest-earning assets, lower average rates paid on interest-bearing deposits and an improved mix of interest-earning assets and interest-bearing deposits.
36
Table of Contents
The following table sets forth, for the periods indicated, information regarding (i) the total dollar amount of interest income to the Company from interest-earning assets and the resultant average yields; (ii) the total dollar amount of interest expense on interest-bearing liabilities and the resultant average rate; (iii) net interest income; (iv) net interest spread; and (v) net interest margin. Information is based on average monthly balances during the indicated periods.
| For the Years Ended December 31, | ||||||||||||||||||||||||||||||||||||
| (dollars in thousands) |
2010 | 2009 | 2008 | |||||||||||||||||||||||||||||||||
| Average Balance |
Interest | Average Yield/ Rate (1) |
Average Balance |
Interest | Average Yield/ Rate |
Average Balance |
Interest | Average Yield/ Rate |
||||||||||||||||||||||||||||
| Earning assets: |
||||||||||||||||||||||||||||||||||||
| Loans receivable(1) |
$ | 447,606 | $ | 28,557 | 6.38 | % | $ | 341,986 | $ | 22,321 | 6.53 | % | $ | 317,362 | $ | 21,790 | 6.90 | % | ||||||||||||||||||
| Investment securities |
129,523 | 4,970 | 3.84 | 121,612 | 6,570 | 5.40 | 80,747 | 4,284 | 5.31 | |||||||||||||||||||||||||||
| Other interest-earning assets |
23,926 | 132 | 0.55 | 35,434 | 1,005 | 2.84 | 35,730 | 1,355 | 3.79 | |||||||||||||||||||||||||||
| Total earning assets |
601,055 | 33,659 | 5.60 | 499,032 | 29,896 | 5.99 | 433,839 | 27,429 | 6.35 | |||||||||||||||||||||||||||
| Noninterest-earning assets |
84,036 | 30,957 | 30,080 | |||||||||||||||||||||||||||||||||
| Total assets |
$ | 685,091 | $ | 529,989 | $ | 463,919 | ||||||||||||||||||||||||||||||
| Interest-bearing liabilities: |
||||||||||||||||||||||||||||||||||||
| Deposits: |
||||||||||||||||||||||||||||||||||||
| Savings, checking and money market |
$ | 196,561 | $ | 1,278 | 0.65 | % | $ | 143,231 | $ | 1,056 | 0.74 | % | $ | 129,377 | $ | 1,657 | 1.28 | % | ||||||||||||||||||
| Certificates of deposit |
239,872 | 4,038 | 1.68 | 159,928 | 4,473 | 2.80 | 167,254 | 6,246 | 3.73 | |||||||||||||||||||||||||||
| Total interest-bearing deposits |
436,433 | 5,316 | 1.22 | 303,159 | 5,529 | 1.82 | 296,631 | 7,903 | 2.66 | |||||||||||||||||||||||||||
| FHLB advances |
20,587 | 565 | 2.75 | 25,117 | 807 | 3.21 | 28,014 | 844 | 3.01 | |||||||||||||||||||||||||||
| Total interest-bearing liabilities |
457,020 | 5,881 | 1.29 | 328,276 | 6,336 | 1.93 | 324,645 | 8,747 | 2.69 | |||||||||||||||||||||||||||
| Noninterest-bearing liabilities |
94,880 | 70,913 | 73,384 | |||||||||||||||||||||||||||||||||
| Total liabilities |
551,900 | 399,189 | 398,029 | |||||||||||||||||||||||||||||||||
| Shareholders’ equity |
133,191 | 130,800 | 65,890 | |||||||||||||||||||||||||||||||||
| Total liabilities and shareholders’ equity |
$ | 685,091 | $ | 529,989 | $ | 463,919 | ||||||||||||||||||||||||||||||
| Net interest-earning assets |
$ | 144,035 | $ | 170,756 | $ | 109,194 | ||||||||||||||||||||||||||||||
| Net interest income; net interest spread |
$ | 27,778 | 4.31 | % | $ | 23,560 | 4.06 | % | $ | 18,682 | 3.66 | % | ||||||||||||||||||||||||
| Net interest margin |
4.62 | % | 4.72 | % | 4.31 | % | ||||||||||||||||||||||||||||||
| (1) | Includes nonaccrual loans during the respective periods. Calculated net of deferred fees and discounts and loans in process. |
37
Table of Contents
The following table displays the dollar amount of changes in interest income and interest expense for major components of earning assets and interest-bearing liabilities. The table distinguishes between (i) changes attributable to volume (changes in average volume between periods times prior year rate), (ii) changes attributable to rate (changes in average rate between periods times prior year volume) and (iii) total increase (decrease).
| 2010 / 2009 | 2009 / 2008 | |||||||||||||||||||||||
| Change Attributable To | Change Attributable To | |||||||||||||||||||||||
| (dollars in thousands) |
Rate | Volume | Total Increase (Decrease) |
Rate | Volume | Total Increase (Decrease) |
||||||||||||||||||
| Interest income: |
||||||||||||||||||||||||
| Loans receivable |
$ | (523 | ) | $ | 6,759 | $ | 6,236 | $ | (1,171 | ) | $ | 1,702 | $ | 531 | ||||||||||
| Investment securities |
(2,004 | ) | 404 | (1,600 | ) | 98 | 2,188 | 2,286 | ||||||||||||||||
| Other interest-earning assets |
(623 | ) | (250 | ) | (873 | ) | (340 | ) | (10 | ) | (350 | ) | ||||||||||||
| Total interest income |
(3,150 | ) | 6,913 | 3,763 | (1,413 | ) | 3,880 | 2,467 | ||||||||||||||||
| Interest expense: |
||||||||||||||||||||||||
| Savings, checking and money market accounts |
(140 | ) | 362 | 222 | (741 | ) | 140 | (601 | ) | |||||||||||||||
| Certificates of deposit |
(2,176 | ) | 1,741 | (435 | ) | (1,533 | ) | (240 | ) | (1,773 | ) | |||||||||||||
| FHLB advances |
(56 | ) | (186 | ) | (242 | ) | 53 | (90 | ) | (37 | ) | |||||||||||||
| Total interest expense |
(2,372 | ) | 1,917 | (455 | ) | (2,221 | ) | (190 | ) | (2,411 | ) | |||||||||||||
| Increase (decrease) in net interest income |
$ | (778 | ) | $ | 4,996 | $ | 4,218 | $ | 808 | $ | 4,070 | $ | 4,878 | |||||||||||
Interest income includes interest income earned on earning assets as well as applicable loan fees earned. Interest income that would have been earned on nonaccrual loans had they been on accrual status is not included in the data reported above.
Provision for Loan Losses - We have identified the evaluation of the allowance for loan losses as a critical accounting policy where amounts are sensitive to material variation. This policy is significantly affected by our judgment and uncertainties. There is likelihood that materially different amounts would be reported under different, but reasonably plausible, conditions or assumptions. Our activity in the provision for loan losses, which are charges or recoveries to operating results, is undertaken in order to maintain a level of total allowance for loan losses that management believes covers all known and inherent losses that are both probable and reasonably estimable as of each reporting date. Our evaluation process typically includes, among other things, an analysis of delinquency trends, non-performing loan trends, the level of charge-offs and recoveries, prior loss experience, total loans outstanding, the volume of loan originations, the type, size and geographic concentration of our loans, the value of collateral securing the loan, the borrower’s ability to repay and repayment performance, the number of loans requiring heightened management oversight, general economic conditions and industry experience. The OTS, as an integral part of its examination process, periodically reviews our allowance for loan losses. The OTS may require the Bank to make additional provisions for estimated loan losses based upon judgments different from those of management. As part of the risk management program, an independent review is performed on the loan portfolio, which supplements management’s assessment of the loan portfolio and the allowance for loan losses. The result of the independent review is reported directly to the Audit Committee of the Board of Directors.
For the year ended December 31, 2010, the Company recorded a provision for loan losses of $865,000, compared to provisions of $865,000 and $459,000 for 2009 and 2008, respectively. The amount of provision for loan losses for 2010 was the result of increasing levels of commercial loans in our portfolio, which generally are considered to have a higher degree of risk than single-family residential mortgage loans, as well as the Company’s consideration of, among other factors, economic conditions in our markets.
38
Table of Contents
Net charge-offs were $297,000 for 2010, compared to $119,000 and $167,000 for 2009 and 2008, respectively. Excluding Covered Loans, the allowance for loan losses as a percentage of outstanding loans, net of unearned income, was 1.09% as of December 31, 2010, compared to 1.00% as of December 31, 2009.
Noninterest Income –The following table illustrates the primary components of noninterest income for the years indicated.
| Percent Increase |
Percent Increase |
|||||||||||||||||||
| (dollars in thousands) |
2010 | 2009 | (Decrease) | 2008 | (Decrease) | |||||||||||||||
| Noninterest income: |
||||||||||||||||||||
| Service fees and charges |
$ | 2,012 | $ | 1,850 | 8.8 | % | $ | 1,669 | 10.8 | % | ||||||||||
| Bank card fees |
1,419 | 1,090 | 30.2 | 934 | 16.7 | |||||||||||||||
| Gain on sale of loans, net |
716 | 611 | 17.2 | 254 | 140.1 | |||||||||||||||
| Income from bank-owned life insurance |
632 | 292 | 116.2 | 262 | 11.4 | |||||||||||||||
| Other-than-temporary impairment of securities |
(1,229 | ) | (1,888 | ) | 34.9 | (2,833 | ) | 33.3 | ||||||||||||
| Gain (loss) on sale of securities, net |
59 | — | — | — | — | |||||||||||||||
| Accretion of FDIC loss sharing receivable |
738 | — | — | — | — | |||||||||||||||
| Other income |
134 | 167 | (20.3 | ) | 120 | 39.4 | ||||||||||||||
| Total noninterest income |
$ | 4,481 | $ | 2,122 | 111.2 | % | $ | 406 | 422.2 | % | ||||||||||
2010 compared to 2009
The Company’s noninterest income totaled $4.5 million for the year ended December 31, 2010, an increase of $2.4 million, or 111.2%, compared to the year ended December 31, 2009.
Service fees and charges and bank card fees increased $164,000 and $329,000, respectively, from 2009 to 2010 due to the addition of accounts through the Statewide acquisition. Gain on sale of mortgage loans increased $105,000 due to increased mortgage loan originations and refinancing due to the current low interest rate environment. Income from bank owned life insurance increased $340,000 as the result of $9.7 million of additional policies purchased by the Company in the fourth quarter of 2009. Accretion of the FDIC loss sharing receivable related to the Statewide acquisition in 2010 totaled $738,000 during 2010. The FDIC loss sharing receivable originated with the Statewide acquisition in 2010; therefore, no accretion was included in 2009.
Due to the deteriorating credit performance of the mortgage loans underlying the Company’s non-agency mortgage-backed securities, the Company recorded OTTI charges of $1.2 million and $1.9 million during 2010 and 2009, respectively. This charge is reflected in noninterest income as an “Other-than-temporary impairment of securities”.
2009 compared to 2008
The Company’s noninterest income was $2.1 million for the year ended December 31, 2009, $1.7 million, or 422.2%, higher than the $406,000 in noninterest income earned in 2008.
Service fees and charges on deposits and bank card fees increased $181,000 and $156,000, respectively, from 2008 to 2009 due to a higher volume of transactions processed. Income from bank-owned life insurance increased $30,000 due to the purchase of additional policies in the fourth quarter of 2009. Gain on sale of mortgage loans increased $356,000 due to increased mortgage refinancing prompted by the favorable interest rate environment.
The Company recorded non-cash OTTI charges of $1.9 million and $2.8 million during 2009 and 2008, respectively.
39
Table of Contents
Noninterest Expense –The following table illustrates the primary components of noninterest expense for the years indicated.
| Percent Increase |
Percent Increase |
|||||||||||||||||||
| (dollars in thousands) |
2010 | 2009 | (Decrease) | 2008 | (Decrease) | |||||||||||||||
| Noninterest expense: |
||||||||||||||||||||
| Compensation and benefits |
$ | 14,504 | $ | 10,827 | 34.0 | % | $ | 8,834 | 22.6 | % | ||||||||||
| Occupancy |
2,218 | 1,297 | 71.0 | 1,208 | 7.4 | |||||||||||||||
| Marketing and advertising |
827 | 634 | 30.5 | 608 | 4.3 | |||||||||||||||
| Data processing and communication |
2,142 | 1,402 | 52.7 | 1,370 | 2.3 | |||||||||||||||
| Professional services |
1,084 | 897 | 20.9 | 410 | 118.5 | |||||||||||||||
| Forms, printing and supplies |
513 | 378 | 35.6 | 358 | 5.5 | |||||||||||||||
| Franchise and shares tax |
401 | 610 | (34.3 | ) | — | — | ||||||||||||||
| Regulatory fees |
621 | 596 | 4.1 | 154 | 286.2 | |||||||||||||||
| ATM losses |
— | — | — | 867 | (100.0 | ) | ||||||||||||||
| Other expenses |
2,052 | 1,186 | 73.0 | 934 | 27.2 | |||||||||||||||
| Total noninterest expense |
$ | 24,362 | $ | 17,827 | 36.7 | % | $ | 14,743 | 20.9 | % | ||||||||||
2010 compared to 2009
The Company’s noninterest expense totaled $24.4 million for the year ended December 31, 2010, an increase of $6.5 million or 36.7%, compared to December 31, 2009.
Compensation and benefits, occupancy and data processing communications expense increased $3.7 million, $921,000 and $740,000, respectively, primarily due to the Statewide acquisition and the addition of the Baton Rouge headquarters location in March 2010. The Company began 2010 with 11 full-service banking offices. The acquisition of six Statewide locations and the opening of our Baton Rouge headquarters increased our total number of full-service banking offices to 18. Compensation and benefits expense also included a full year of vesting expense related to award grants under the stock option and recognition and retention plans approved by the Company’s shareholders in May 2009. Other expenses increased due to the amortization of the core deposit intangible resulting from the Statewide acquisition, which totaled $208,000 for the year ended December 31, 2010. Also within other expenses, expenses on repossessed assets increased $211,000 due to increased volume of foreclosed property resulting primarily from the Statewide acquisition.
2009 compared to 2008
The Company’s noninterest expense was $17.8 million for the year ended December 31, 2009, $3.1 million, or 20.9%, higher than the $14.7 million incurred for the same period in 2008.
Compensation and benefits expense increased $2.0 million primarily due to three factors: 1) the Bank’s expansion into Baton Rouge, where two full-service banking offices were opened during the second half of 2008; 2) the employee stock ownership plan (“ESOP”), which commenced during the fourth quarter of 2008; and 3) award grants under the stock option and recognition and retention plans approved by the Company’s shareholders in May 2009. Occupancy expense increased $89,000 primarily due to a full year of depreciation recorded on the two branches opened in the second half of 2008. Professional services increased $486,000 due to the increased cost of operating as a public company after the Company’s completion of its IPO in October 2008. Franchise and shares tax increased $610,000 due to the Company owing Louisiana bank shares taxes and franchise taxes as a public company. Regulatory fees increased $442,000 primarily as the result of the FDIC increasing the base insurance premium assessment on deposits and its special assessment of $200,000 in 2009. In 2008, the Company incurred a shortfall in cash at other ATM locations.
Income Taxes – For the years ended December 31, 2010, 2009 and 2008, the Company incurred income tax expense of $2.3 million, $2.3 million and $1.2 million, respectively. The Company’s effective tax rate amounted to 33.3%, 33.0% and 30.1% during 2010, 2009 and 2008, respectively. The difference between the effective tax rate and the statutory tax rate primarily related to variances in items that are non-taxable or non-deductible, primarily the effect of tax-exempt income and various tax credits taken.
40
Table of Contents
LIQUIDITY AND CAPITAL RESOURCES
Our primary sources of funds are from deposits, amortization of loans, loan prepayments and the maturity of loans, investment securities and other investments and other funds provided from operations. While scheduled payments from the amortization of loans and investment securities and maturing investment securities are relatively predictable sources of funds, deposit flows and loan prepayments can be greatly influenced by general interest rates, economic conditions and competition. We also maintain excess funds in short-term, interest-bearing assets that provide additional liquidity. As of December 31, 2010, our cash and cash equivalents totaled $37.0 million. In addition, as of such date, our available for sale investment securities totaled $112.0 million.
We use our liquidity to fund existing and future loan commitments, to fund maturing certificates of deposit and demand deposit withdrawals, to invest in other interest-earning assets, and to meet operating expenses. As of December 31, 2010, we had certificates of deposit maturing within the next 12 months totaling $157.0 million. Based upon historical experience, we anticipate that the majority of the maturing certificates of deposit will be redeposited with us.
In addition to cash flow from loan and securities payments and prepayments as well as from sales of available for sale securities, we have significant borrowing capacity available to fund liquidity needs. In recent years we have utilized borrowings as a cost efficient addition to deposits as a source of funds. Our borrowings consist of advances from the FHLB, of which we are a member. Under terms of the collateral agreement with the FHLB, we may pledge residential mortgage loans and mortgage-backed securities as well as our stock in the FHLB as collateral for such advances. For the year ended December 31, 2010, the average balance of our outstanding FHLB advances was $20.6 million. As of December 31, 2010, we had $13.0 million in outstanding FHLB advances and $253.5 million in additional FHLB advances available to us.
Liquidity management is both a daily and long-term function of business management. Excess liquidity is generally invested in short-term investments such as overnight deposits. On a longer-term basis, the Company maintains a strategy of investing in various lending and investment security products. The Company uses its sources of funds primarily to meet its ongoing commitments and fund loan commitments. The Company has been able to generate sufficient cash through its deposits, as well as borrowings, and anticipates it will continue to have sufficient funds to meet its liquidity requirements.
ASSET/ LIABILITY MANAGEMENT AND MARKET RISK
The objective of asset/liability management is to implement strategies for the funding and deployment of the Company’s financial resources that are expected to maximize soundness and profitability over time at acceptable levels of risk. Interest rate sensitivity is the potential impact of changing rate environments on both net interest income and cash flows. The Company measures its interest rate sensitivity over the near term primarily by running net interest income simulations.
41
Table of Contents
Our interest rate sensitivity also is monitored by management through the use of models which generate estimates of the change in its net interest income over a range of interest rate scenarios. Based on the Company’s interest rate risk model, the table below sets forth the results of immediate and sustained changes in interest rate as of December 31, 2010.
| Shift in Interest Rates (in bps) |
% Change in Projected Net Interest Income | |
| +300 |
9.9% | |
| +200 |
7.3 | |
| +100 |
3.9 |
The actual impact of changes in interest rates will depend on many factors. These factors include the Company’s ability to achieve expected growth in interest-earning assets and maintain a desired mix of interest-earning assets and interest-bearing liabilities, the actual timing of asset and liability repricings, the magnitude of interest rate changes and corresponding movement in interest rate spreads, and the level of success of asset/liability management strategies.
Market risk is the risk of loss from adverse changes in market prices and rates. Our market risk arises primarily from the interest rate risk which is inherent in our lending and deposit taking activities. To that end, management actively monitors and manages interest rate risk exposure. In addition to market risk, our primary risk is credit risk on our loan portfolio. We attempt to manage credit risk through our loan underwriting and oversight policies.
The principal objective of our interest rate risk management function is to evaluate the interest rate risk embedded in certain balance sheet accounts, determine the level of risk appropriate given our business strategy, operating environment, capital and liquidity requirements, performance objectives and interest rate environment and manage the risk consistent with approved guidelines. We seek to manage our exposure to risks from changes in interest rates while at the same time trying to improve our net interest spread. We monitor interest rate risk as such risk relates to our operating strategies. We have established an Asset/Liability Committee (“ALCO”), which is comprised of our Chief Executive Officer, Chief Financial Officer, Chief Lending Officer, Chief Operations Officer and Controller. The ALCO is responsible for reviewing our asset/liability and investment policies and interest rate risk position. The ALCO meets at least monthly. The extent of the movement of interest rates is an uncertainty that could have a negative impact on future earnings.
In recent years, we primarily have utilized the following strategies in our efforts to manage interest rate risk:
| • | we have increased our originations of shorter term loans, particularly commercial real estate and other commercial loans; |
| • | we generally sell our conforming long-term (30-year) fixed-rate single-family residential mortgage loans into the secondary market; and |
| • | we have invested in securities, consisting primarily of mortgage-backed securities, with relatively short average lives, generally three to five years, and we maintain adequate amounts of liquid assets. |
OFF-BALANCE SHEET ACTIVITIES
To meet the financing needs of its customers, the Company issues financial instruments which represent conditional obligations that are not recognized, wholly or in part, in the statements of financial condition. These financial instruments include commitments to extend credit and standby letters of credit. Such instruments expose the Company to varying degrees of credit and interest rate risk in much the same way as funded loans. The same credit policies are used in these commitments as for on-balance sheet instruments. The Company’s exposure to credit losses from these financial instruments is represented by their contractual amounts.
42
Table of Contents
The following table summarizes our outstanding commitments to originate loans and to advance additional amounts pursuant to outstanding letters of credit, lines of credit and the undisbursed portion of construction loans as of December 31 of the years indicated.
| Contract Amount | ||||||||
| (dollars in thousands) |
2010 | 2009 | ||||||
| Standby letters of credit |
$ | 1,190 | $ | 730 | ||||
| Lines of credit |
39,225 | 28,161 | ||||||
| Undisbursed portion of loans in process |
37,170 | 29,598 | ||||||
| Commitments to originate loans |
47,906 | 15,468 | ||||||
Commitments to extend credit are agreements to lend to a customer as long as there is no violation of any condition established in the contract. Commitments generally have fixed expiration dates or other termination clauses and may require payment of a fee. Since many of the commitments are expected to be drawn upon, the total commitment amounts generally represent future cash requirements.
Unfunded commitments under commercial lines-of-credit, revolving credit lines and overdraft protection agreements are commitments for possible future extensions of credit to existing customers. These lines-of-credit usually do not contain a specified maturity date and may not be drawn upon to the total extent to which the Company is committed.
The Company is subject to certain claims and litigation arising in the ordinary course of business. In the opinion of management, after consultation with legal counsel, the ultimate disposition of these matters is not expected to have a material effect on the financial position or results of operations of the Company.
The following table summarizes our outstanding commitments to originate loans and to advance additional amounts pursuant to outstanding letters of credit, lines of credit and the undisbursed portion of construction loans as of December 31, 2010.
| (dollars in thousands) |
Less Than One Year |
One to Three Years |
Three to Five Years |
Over Five Years |
Total | |||||||||||||||
| Unused commercial lines of credit |
$ | 22,798 | $ | 22 | $ | 1 | $ | 21 | $ | 22,842 | ||||||||||
| Unused personal lines of credit |
4,611 | 11,240 | 103 | 429 | 16,383 | |||||||||||||||
| Undisbursed portion of loans in process |
37,170 | — | — | — | 37,170 | |||||||||||||||
| Standby letters of credit |
1,190 | — | — | — | 1,190 | |||||||||||||||
| Total |
$ | 65,769 | $ | 11,262 | $ | 104 | $ | 450 | $ | 77,585 | ||||||||||
The Company was engaged in leasing arrangements to support the ongoing activities of the Company. The required payments under such commitments and other contractual cash commitments as of December 31, 2010 are shown in the following table.
| (dollars in thousands) |
2011 | 2012 | 2013 | 2014 | 2015 | Thereafter | Total | |||||||||||||||||||||
| Operating leases |
$ | 199 | $ | 166 | $ | 166 | $ | 166 | $ | 166 | $ | 138 | $ | 1,001 | ||||||||||||||
| Certificates of deposit |
156,975 | 47,960 | 8,435 | 1,924 | 2,149 | 4,295 | 221,738 | |||||||||||||||||||||
| Long-term FHLB advances |
— | 1,000 | — | 2,000 | — | 10,000 | 13,000 | |||||||||||||||||||||
| Total |
$ | 157,174 | $ | 49,126 | $ | 8,601 | $ | 4,090 | $ | 2,315 | $ | 14,433 | $ | 235,739 | ||||||||||||||
43
Table of Contents
IMPACT OF INFLATION AND CHANGING PRICES
The financial statements, accompanying notes and related financial data of the Company presented herein have been prepared in accordance with generally accepted accounting principles, which require the measurement of financial position and operating results in terms of historical dollars without considering the changes in purchasing power of money over time due to inflation. The impact of inflation is reflected in the increased cost of operations. Most of our assets and liabilities are monetary in nature; therefore, the impact of interest rates has a greater impact on its performance than the effects of general levels of inflation. Interest rates do not necessarily move in the same direction or to the same extent as the prices of goods and services.
Item 7A. Quantitative and Qualitative Disclosures about Market Risk.
The information contained in the section captioned “Management’s Discussion and Analysis of Financial Condition and Results of Operations – Asset/Liability Management and Market Risk” in Item 7 hereof is incorporated herein by reference.
44
Table of Contents
Item 8. Financial Statements and Supplementary Data.
REPORT OF INDEPENDENT REGISTERED PUBLIC ACCOUNTING FIRM
To the Board of Directors
Home Bancorp, Inc.
Lafayette, Louisiana
We have audited the accompanying consolidated statements of financial condition of Home Bancorp, Inc. and subsidiary (“the Company”) as of December 31, 2010 and 2009, and the related consolidated statements of income, shareholders’ equity and cash flows for the years then ended. These financial statements are the responsibility of the Company’s management. Our responsibility is to express an opinion on these financial statements based on our audits.
We conducted our audits in accordance with the standards of the Public Company Accounting Oversight Board (United States). Those standards require that we plan and perform the audit to obtain reasonable assurance about whether the financial statements are free of material misstatement. An audit includes examining, on a test basis, evidence supporting the amounts and disclosures in the financial statements. An audit also includes assessing the accounting principles used and significant estimates made by management, as well as evaluating the overall financial statement presentation. We believe that our audits provide a reasonable basis for our opinion.
In our opinion, the 2010 and 2009 consolidated financial statements referred to above present fairly, in all material respects, the financial position of Home Bancorp, Inc. and subsidiary as of December 31, 2010 and 2009, and the results of their operations and their cash flows for the years then ended in conformity with accounting principles generally accepted in the United States of America.
We have also audited, in accordance with the standards of the Public Company Accounting Oversight Board (United States), Home Bancorp, Inc. and subsidiary’s internal control over financial reporting as of December 31, 2010, based on criteria established in Internal Control—Integrated Framework issued by the Committee of Sponsoring Organizations of the Treadway Commission and our report dated March 14, 2011, expressed an unqualified opinion on the effectiveness of the Company’s internal control over financial reporting.
| /s/ Porter Keadle Moore LLP |
Atlanta, Georgia
March 14, 2011
45
Table of Contents
REPORT OF INDEPENDENT REGISTERED PUBLIC ACCOUNTING FIRM
To the Board of Directors
Home Bancorp, Inc.
Lafayette, Louisiana
We have audited Home Bancorp, Inc. and subsidiary’s (the “Company”) internal control over financial reporting as of December 31, 2010, based on criteria established in Internal Control - Integrated Framework issued by the Committee of Sponsoring Organizations of the Treadway Commission (“COSO”). The Company’s management is responsible for maintaining effective internal control over financial reporting and for its assessment of the effectiveness of internal control over financial reporting included in the accompanying Management’s Report on Internal Control over Financial Reporting. Our responsibility is to express an opinion on the Company’s internal control over financial reporting based on our audit.
We conducted our audit in accordance with the standards of the Public Company Accounting Oversight Board (United States). Those standards require that we plan and perform the audit to obtain reasonable assurance about whether effective internal control over financial reporting was maintained in all material respects. Our audit included obtaining an understanding of internal control over financial reporting, assessing the risk that a material weakness exists, and testing and evaluating the design and operating effectiveness of internal control based on the assessed risk. Our audit also included performing such other procedures as we considered necessary in the circumstances. We believe that our audit provides a reasonable basis for our opinion.
A company’s internal control over financial reporting is a process designed to provide reasonable assurance regarding the reliability of financial reporting and the preparation of financial statements for external purposes in accordance with generally accepted accounting principles. A company’s internal control over financial reporting includes those policies and procedures that (1) pertain to the maintenance of records that, in reasonable detail, accurately and fairly reflect the transactions and dispositions of the assets of the Company; (2) provide reasonable assurance that transactions are recorded as necessary to permit preparation of financial statements in accordance with generally accepted accounting principles, and that receipts and expenditures of the Company are being made only in accordance with authorizations of management and directors of the Company; and (3) provide reasonable assurance regarding prevention or timely detection of unauthorized acquisition, use, or disposition of the Company’s assets that could have a material effect on the financial statements.
Because of its inherent limitations, internal control over financial reporting may not prevent or detect misstatements. Also, projections of any evaluation of effectiveness to future periods are subject to the risk that controls may become inadequate because of changes in conditions, or that the degree of compliance with the policies or procedures may deteriorate.
In our opinion, Home Bancorp, Inc. and subsidiary maintained effective internal control over financial reporting as of December 31, 2010, based on criteria established in Internal Control - Integrated Framework issued by COSO.
We have also audited, in accordance with the standards of the Public Company Accounting Oversight Board (United States), the consolidated statements of financial condition of Home Bancorp, Inc. and subsidiary as of December 31, 2010 and 2009, and the related statements of income, shareholders’ equity and cash flows for the years then ended, and our report dated March 14, 2011, expressed an unqualified opinion on those consolidated financial statements.
| /s/ Porter Keadle Moore LLP |
Atlanta, Georgia
March 14, 2011
46
Table of Contents
REPORT OF INDEPENDENT REGISTERED PUBLIC ACCOUNTING FIRM
The Board of Directors and Shareholders
Home Bancorp, Inc.
We have audited the accompanying consolidated statements of income, shareholders’ equity and cash flows of Home Bancorp, Inc. for the year ended December 31, 2008. These financial statements are the responsibility of the Company’s management. Our responsibility is to express an opinion on these financial statements based on our audit.
We conducted our audit in accordance with the standards of the Public Company Accounting Oversight Board (United States). Those standards require that we plan and perform the audit to obtain reasonable assurance about whether the financial statements are free of material misstatement. We were not engaged to perform an audit of the Company’s internal control over financial reporting. Our audit included consideration of internal control over financial reporting as a basis for designing audit procedures that are appropriate in the circumstances, but not for the purpose of expressing an opinion on the effectiveness of the Company’s internal control over financial reporting. Accordingly, we express no such opinion. An audit also includes examining, on a test basis, evidence supporting the amounts and disclosures in the financial statements, assessing the accounting principles used and significant estimates made by management and evaluating the overall financial statement presentation. We believe that our audit provides a reasonable basis for our opinion.
In our opinion, the financial statements referred to above present fairly, in all material respects, the consolidated results of operations and cash flows of Home Bancorp, Inc. for the year ended December 31, 2008, in conformity with U.S. generally accepted accounting principles.
| /s/ Ernst & Young LLP |
New Orleans, Louisiana
March 27, 2009
47
Table of Contents
HOME BANCORP, INC. AND SUBSIDIARY
CONSOLIDATED STATEMENTS OF FINANCIAL CONDITION
| December 31, | ||||||||
| 2010 | 2009 | |||||||
| Assets |
||||||||
| Cash and cash equivalents |
$ | 36,970,638 | $ | 25,709,597 | ||||
| Interest-bearing deposits in banks |
7,867,000 | 3,529,000 | ||||||
| Investment securities available for sale, at fair value |
111,962,331 | 106,752,131 | ||||||
| Investment securities held to maturity (fair values of $15,400,468 and $13,176,934, respectively) |
15,220,474 | 13,098,847 | ||||||
| Mortgage loans held for sale |
2,436,986 | 719,350 | ||||||
| Loans covered by loss sharing agreements |
80,446,859 | — | ||||||
| Noncovered loans, net of unearned income |
359,464,400 | 336,647,292 | ||||||
| Total loans, net of unearned income |
439,911,259 | 336,647,292 | ||||||
| Allowance for loan losses |
(3,919,745 | ) | (3,351,688 | ) | ||||
| Total loans, net of unearned income and allowance for loan losses |
435,991,514 | 333,295,604 | ||||||
| Office properties and equipment, net |
23,371,915 | 16,186,690 | ||||||
| Cash surrender value of bank-owned life insurance |
16,192,645 | 15,262,645 | ||||||
| FDIC loss sharing receivable |
32,012,783 | — | ||||||
| Accrued interest receivable and other assets |
18,396,806 | 10,081,885 | ||||||
| Total Assets |
$ | 700,423,092 | $ | 524,635,749 | ||||
| Liabilities |
||||||||
| Deposits: |
||||||||
| Noninterest-bearing |
$ | 100,578,700 | $ | 66,955,475 | ||||
| Interest-bearing |
452,639,153 | 304,637,272 | ||||||
| Total deposits |
553,217,853 | 371,592,747 | ||||||
| Long-term Federal Home Loan Bank advances |
13,000,000 | 16,773,802 | ||||||
| Accrued interest payable and other liabilities |
2,675,297 | 3,519,896 | ||||||
| Total Liabilities |
568,893,150 | 391,886,445 | ||||||
| Shareholders’ Equity |
||||||||
| Preferred stock, $0.01 par value - 10,000,000 shares authorized; none issued |
— | — | ||||||
| Common stock, $0.01 par value - 40,000,000 shares authorized; 8,926,875 shares issued; 8,131,002 and 8,774,975 shares outstanding, respectively |
89,270 | 89,270 | ||||||
| Additional paid-in capital |
88,818,862 | 88,072,884 | ||||||
| Treasury stock at cost - 795,873 and 151,900 shares, respectively |
(10,425,725 | ) | (1,848,862 | ) | ||||
| Unallocated common stock held by: |
||||||||
| Employee Stock Ownership Plan (ESOP) |
(6,338,070 | ) | (6,695,150 | ) | ||||
| Recognition and Retention Plan (RRP) |
(3,432,486 | ) | (4,218,320 | ) | ||||
| Retained earnings |
62,125,568 | 57,437,444 | ||||||
| Accumulated other comprehensive income (loss) |
692,523 | (87,962 | ) | |||||
| Total Shareholders’ Equity |
131,529,942 | 132,749,304 | ||||||
| Total Liabilities and Shareholders’ Equity |
$ | 700,423,092 | $ | 524,635,749 | ||||
The accompanying Notes are an integral part of these Financial Statements.
48
Table of Contents
HOME BANCORP, INC. AND SUBSIDIARY
CONSOLIDATED STATEMENTS OF INCOME
| Years Ended December 31, | ||||||||||||
| 2010 | 2009 | 2008 | ||||||||||
| Interest Income |
||||||||||||
| Loans, including fees |
$ | 28,556,905 | $ | 22,321,209 | $ | 21,790,163 | ||||||
| Investment securities |
4,969,876 | 6,569,756 | 4,283,960 | |||||||||
| Other investments and deposits |
132,121 | 1,005,353 | 1,354,627 | |||||||||
| Total interest income |
33,658,902 | 29,896,318 | 27,428,750 | |||||||||
| Interest Expense |
||||||||||||
| Deposits |
5,316,147 | 5,529,181 | 7,903,313 | |||||||||
| Short-term FHLB advances |
7,382 | 37,799 | 331,387 | |||||||||
| Long-term FHLB advances |
557,629 | 769,700 | 512,550 | |||||||||
| Total interest expense |
5,881,158 | 6,336,680 | 8,747,250 | |||||||||
| Net interest income |
27,777,744 | 23,559,638 | 18,681,500 | |||||||||
| Provision for loan losses |
864,659 | 864,880 | 459,212 | |||||||||
| Net interest income after provision for loan losses |
26,913,085 | 22,694,758 | 18,222,288 | |||||||||
| Noninterest Income |
||||||||||||
| Service fees and charges |
2,013,358 | 1,849,746 | 1,668,757 | |||||||||
| Bank card fees |
1,418,620 | 1,089,811 | 933,788 | |||||||||
| Gain on sale of loans, net |
716,252 | 610,952 | 254,456 | |||||||||
| Income from bank-owned life insurance |
631,702 | 292,125 | 262,202 | |||||||||
| Other-than-temporary impairment of securities |
(1,229,037 | ) | (1,888,381 | ) | (2,832,920 | ) | ||||||
| Gain on sale of securities, net |
58,704 | — | — | |||||||||
| Accretion of FDIC loss sharing receivable |
738,431 | — | — | |||||||||
| Other income |
133,386 | 167,272 | 119,982 | |||||||||
| Total noninterest income |
4,481,416 | 2,121,525 | 406,265 | |||||||||
| Noninterest Expense |
||||||||||||
| Compensation and benefits |
14,505,004 | 10,827,537 | 8,834,026 | |||||||||
| Occupancy |
2,217,788 | 1,296,592 | 1,207,675 | |||||||||
| Marketing and advertising |
826,616 | 633,530 | 607,550 | |||||||||
| Data processing and communication |
2,141,975 | 1,402,290 | 1,370,101 | |||||||||
| Professional services |
1,084,170 | 896,552 | 410,377 | |||||||||
| Forms, printing and supplies |
512,777 | 378,097 | 358,236 | |||||||||
| Franchise and shares tax |
400,589 | 609,689 | — | |||||||||
| Regulatory fees |
620,526 | 596,305 | 154,407 | |||||||||
| ATM losses |
— | — | 867,389 | |||||||||
| Other expenses |
2,053,042 | 1,186,822 | 933,348 | |||||||||
| Total noninterest expense |
24,362,487 | 17,827,414 | 14,743,109 | |||||||||
| Income before income tax expense |
7,032,014 | 6,988,869 | 3,885,444 | |||||||||
| Income tax expense |
2,343,890 | 2,309,268 | 1,169,852 | |||||||||
| Net Income |
$ | 4,688,124 | $ | 4,679,601 | $ | 2,715,592 | ||||||
| Earnings per share: |
||||||||||||
| Basic |
$ | 0.62 | $ | 0.58 | $ | 1.32 | ||||||
| Diluted |
$ | 0.62 | $ | 0.58 | $ | 1.32 | ||||||
The accompanying Notes are an integral part of these Financial Statements.
49
Table of Contents
HOME BANCORP, INC. AND SUBSIDIARY
CONSOLIDATED STATEMENTS OF CHANGES IN SHAREHOLDERS’ EQUITY
| Common Stock |
Additional Paid-in Capital |
Treasury Stock |
Unallocated Common Stock Held by ESOP |
Unallocated Common Stock Held by RRP |
Retained Earnings |
Accumulated Other Comprehensive Income (Loss) |
Total | |||||||||||||||||||||||||
| Balance, December 31, 2007 |
$ | — | $ | — | $ | — | $ | — | $ | — | $ | 49,339,479 | $ | 43,641 | $ | 49,383,120 | ||||||||||||||||
| Comprehensive income: |
||||||||||||||||||||||||||||||||
| Net income |
2,715,592 | 2,715,592 | ||||||||||||||||||||||||||||||
| Change in unrealized gain (loss) on securities available for sale, net of taxes |
(5,355,307 | ) | (5,355,307 | ) | ||||||||||||||||||||||||||||
| Total comprehensive income |
(2,639,715 | ) | ||||||||||||||||||||||||||||||
| Issuance of common stock for initial public offering, net |
89,270 | 87,181,799 | 87,271,069 | |||||||||||||||||||||||||||||
| Shares purchased for ESOP |
(7,141,500 | ) | (7,141,500 | ) | ||||||||||||||||||||||||||||
| ESOP shares released for allocation |
482 | 89,270 | 89,752 | |||||||||||||||||||||||||||||
| Balance, December 31, 2008 |
$ | 89,270 | $ | 87,182,281 | $ | — | $ | (7,052,230 | ) | $ | — | $ | 52,055,071 | $ | (5,311,666 | ) | $ | 126,962,726 | ||||||||||||||
| Comprehensive income: |
||||||||||||||||||||||||||||||||
| Net income |
4,679,601 | 4,679,601 | ||||||||||||||||||||||||||||||
| Change in unrealized gain (loss) on securities available for sale, net of taxes |
5,223,704 | 5,223,704 | ||||||||||||||||||||||||||||||
| Total comprehensive income |
9,903,305 | |||||||||||||||||||||||||||||||
| Cumulative effect adjustment (see Note 5) |
702,772 | 702,772 | ||||||||||||||||||||||||||||||
| Cost of issuance of common stock |
(13,895 | ) | (13,895 | ) | ||||||||||||||||||||||||||||
| Common stock purchased for RRP |
(4,218,320 | ) | (4,218,320 | ) | ||||||||||||||||||||||||||||
| Treasury stock acquired at cost, 151,900 shares |
(1,848,862 | ) | (1,848,862 | ) | ||||||||||||||||||||||||||||
| ESOP shares released for allocation |
47,917 | 357,080 | 404,997 | |||||||||||||||||||||||||||||
| Share-based compensation cost |
856,581 | 856,581 | ||||||||||||||||||||||||||||||
| Balance, December 31, 2009 |
$ | 89,270 | $ | 88,072,884 | $ | (1,848,862 | ) | $ | (6,695,150 | ) | $ | (4,218,320 | ) | $ | 57,437,444 | $ | (87,962 | ) | $ | 132,749,304 | ||||||||||||
| Comprehensive income: |
||||||||||||||||||||||||||||||||
| Net income |
4,688,124 | 4,688,124 | ||||||||||||||||||||||||||||||
| Change in unrealized gain (loss) on securities available for sale, net of taxes |
780,485 | 780,485 | ||||||||||||||||||||||||||||||
| Total comprehensive income |
5,468,609 | |||||||||||||||||||||||||||||||
| Treasury stock acquired at cost, 643,973 shares |
(8,576,863 | ) | (8,576,863 | ) | ||||||||||||||||||||||||||||
| RRP shares released for allocation |
(730,874 | ) | 785,834 | 54,960 | ||||||||||||||||||||||||||||
| ESOP shares released for allocation |
116,595 | 357,080 | 473,675 | |||||||||||||||||||||||||||||
| Share-based compensation cost |
1,360,257 | 1,360,257 | ||||||||||||||||||||||||||||||
| Balance, December 31, 2010 |
$ | 89,270 | $ | 88,818,862 | $ | (10,425,725 | ) | $ | (6,338,070 | ) | $ | (3,432,486 | ) | $ | 62,125,568 | $ | 692,523 | $ | 131,529,942 | |||||||||||||
The accompanying Notes are an integral part of these Financial Statements.
50
Table of Contents
HOME BANCORP, INC. AND SUBSIDIARY
CONSOLIDATED STATEMENTS OF CASH FLOWS
| Years Ended December 31, | ||||||||||||
| 2010 | 2009 | 2008 | ||||||||||
| Cash flows from operating activities, net of effects of acquisition: |
||||||||||||
| Net income |
$ | 4,688,124 | $ | 4,679,601 | $ | 2,715,592 | ||||||
| Adjustments to reconcile net income to net cash provided by operating activities: |
||||||||||||
| Provision for loan losses |
864,659 | 864,880 | 459,212 | |||||||||
| Depreciation |
1,098,506 | 885,967 | 813,916 | |||||||||
| Amortization of purchase accounting valuations and intangibles |
(4,567,580 | ) | — | — | ||||||||
| Net amortization of mortgage servicing asset |
45,067 | 30,971 | 23,531 | |||||||||
| Federal Home Loan Bank stock dividends |
(8,600 | ) | (4,500 | ) | (36,000 | ) | ||||||
| Net amortization of premium (discount) on investments |
(1,474,136 | ) | (934,484 | ) | 1,981,079 | |||||||
| Gain on sale of investment securities, net |
(58,704 | ) | — | — | ||||||||
| Impairment of investment securities |
1,229,037 | 1,888,381 | 2,832,920 | |||||||||
| Gain on loans sold, net |
(716,252 | ) | (610,952 | ) | (254,456 | ) | ||||||
| Proceeds, including principal payments, from loans held for sale |
81,608,067 | 74,114,660 | 36,055,638 | |||||||||
| Originations of loans held for sale |
(81,589,832 | ) | (73,226,458 | ) | (35,623,132 | ) | ||||||
| Non-cash compensation |
1,833,932 | 1,261,578 | 89,752 | |||||||||
| Deferred income tax provision (benefit) |
(706,554 | ) | (1,553,290 | ) | (1,161,779 | ) | ||||||
| (Increase) decrease in interest receivable and other assets |
2,697,421 | (3,138,279 | ) | (31,158 | ) | |||||||
| Increase in cash surrender value of bank-owned life insurance |
(930,000 | ) | (292,125 | ) | (262,202 | ) | ||||||
| (Increase) decrease in accrued interest payable and other liabilities |
(945,939 | ) | 477,655 | 320,510 | ||||||||
| Net cash provided by operating activities |
3,067,216 | 4,443,605 | 7,923,423 | |||||||||
| Cash flows from investing activities, net of effects of acquisition: |
||||||||||||
| Purchases of securities available for sale |
(42,808,128 | ) | (20,560,805 | ) | (88,859,623 | ) | ||||||
| Purchases of securities held to maturity |
(15,000,000 | ) | (13,150,000 | ) | (400,000 | ) | ||||||
| Proceeds from maturities, prepayments and calls on securities available for sale |
39,645,376 | 36,074,241 | 18,694,391 | |||||||||
| Proceeds from maturities, prepayments and calls on securities held to maturity |
12,875,733 | 4,135,927 | 1,000,978 | |||||||||
| Proceeds from sales on securities available for sale |
24,282,947 | — | — | |||||||||
| (Increase) decrease in cash invested at other ATM locations |
— | 24,243,780 | (7,101,029 | ) | ||||||||
| Net increase (decrease) in loans |
5,980,402 | (1,198,302 | ) | (27,153,375 | ) | |||||||
| (Increase) decrease in certificates of deposit in other institutions |
(4,338,000 | ) | (1,844,000 | ) | 1,582,000 | |||||||
| Proceeds from sale of real estate owned |
1,740,912 | 695,908 | — | |||||||||
| Purchases of office properties and equipment |
(8,278,431 | ) | (1,748,074 | ) | (4,452,333 | ) | ||||||
| Net cash acquired in FDIC-assisted acquisition |
46,892,158 | — | — | |||||||||
| Purchases of bank-owned life insurance |
— | (9,701,703 | ) | — | ||||||||
| Purchases of Federal Home Loan Bank stock |
(871,500 | ) | (206,700 | ) | (2,624,100 | ) | ||||||
| Proceeds from redemption of Federal Home Loan Bank stock |
3,356,300 | 655,900 | 1,518,200 | |||||||||
| Net cash provided by (used in) investing activities |
63,477,769 | 17,396,172 | (107,794,891 | ) | ||||||||
| Cash flows from financing activities, net of effects of acquisition: |
||||||||||||
| Increase (decrease) in deposits |
(26,128,685 | ) | 17,447,642 | 608,706 | ||||||||
| Proceeds from Federal Home Loan Bank advances |
937,800,000 | 576,600,000 | 726,688,000 | |||||||||
| Payments on Federal Home Loan Bank advances |
(958,378,396 | ) | (604,246,993 | ) | (699,150,641 | ) | ||||||
| Proceeds from issuance of common stock |
— | — | 89,268,751 | |||||||||
| Cost of issuance of common stock |
— | (13,895 | ) | (1,997,682 | ) | |||||||
| Repurchase of common stock for RRP |
— | (4,218,320 | ) | — | ||||||||
| Purchase of treasury stock |
(8,576,863 | ) | (1,848,862 | ) | — | |||||||
| Stock purchased for employee stock ownership plan |
— | — | (7,141,500 | ) | ||||||||
| Net cash provided by (used in) financing activities |
(55,283,944 | ) | (16,280,428 | ) | 108,275,634 | |||||||
| Net change in cash and cash equivalents |
11,261,041 | 5,559,349 | 8,404,166 | |||||||||
| Cash and cash equivalents at beginning of year |
25,709,597 | 20,150,248 | 11,746,082 | |||||||||
| Cash and cash equivalents at end of year |
$ | 36,970,638 | $ | 25,709,597 | $ | 20,150,248 | ||||||
| Supplementary cash flow information: |
||||||||||||
| Interest paid on deposits and borrowed funds |
$ | 5,875,911 | $ | 6,359,280 | $ | 8,757,929 | ||||||
| Income taxes paid |
3,495,316 | 3,770,158 | 2,449,279 | |||||||||
| Noncash investing and financing activities: |
||||||||||||
| Transfer of loans to repossessed assets |
$ | 5,517,120 | $ | 1,045,540 | $ | 798,957 | ||||||
The accompanying Notes are an integral part of these Financial Statements.
51
Table of Contents
HOME BANCORP, INC. AND SUBSIDIARY
NOTES TO CONSOLIDATED FINANCIAL STATEMENTS
1. Description of Business
Home Bancorp, Inc., a Louisiana Corporation (“Company”), was organized by Home Bank (“Bank”) in May 2008 to facilitate the conversion of the Bank from the mutual to the stock form (“Conversion”) of ownership. The Conversion was completed on October 2, 2008, at which time the Company became the holding company for the Bank, with the Company owning all of the issued and outstanding shares of the Bank’s common stock. Shares of the Company’s common stock were issued and sold in an offering to certain depositors of the Bank. As a result of the offering, the Company issued 8,926,875 shares of its common stock and raised $87,168,000 in net proceeds. The Company was newly organized and owned no assets during any period prior to October 2, 2008. Therefore, the financial information for any period prior to October 2, 2008 presented in this report is that of the Bank only.
Home Bank is a federally chartered stock savings bank. The Bank was officially chartered in 1908 as a Louisiana state chartered savings association. The Bank converted to a federal mutual savings bank charter in 1993. In 2010, the Bank expanded into the Northshore (of Lake Ponchartrain) through a Federal Deposit Insurance Corporation (“FDIC”) assisted transaction of the former Statewide Bank (“Statewide”). The Bank currently conducts business from eighteen full-service banking offices and one loan production office in the Greater Lafayette, Northshore and Baton Rouge regions of south Louisiana.
The Bank is primarily engaged in attracting deposits from the general public and using those funds to invest in loans and investment securities. The Bank’s principal sources of funds are customer deposits, repayments of loans, repayments of investments and funds borrowed from outside sources such as the Federal Home Loan Bank (“FHLB”) of Dallas. The Bank derives its income principally from interest earned on loans and investment securities and, to a lesser extent, from fees received in connection with the origination of loans, service charges on deposit accounts and for other services. The Bank’s primary expenses are interest expense on deposits and borrowings and general operating expenses.
The Bank is regulated by the Office of Thrift Supervision (“OTS”) and its deposits are insured to the maximum amount permissible under federal law by the FDIC. In July 2010, the Dodd-Frank Wall Street Reform and Consumer Protection Act (“the Act”) was passed by Congress. The Act, among other things, imposes new restrictions and an expanded framework of regulatory oversight for financial institutions and their holding companies, including the Bank and the Company. Under the new law, the Company’s and the Bank’s primary regulator, the OTS, will be eliminated and existing federal thrifts will be subject to regulation and supervision by the Office of the Comptroller of the Currency (“OCC”), which currently supervises and regulates all national banks. Savings and loan holding companies will be regulated by the Federal Reserve Board, which will have the authority to promulgate new regulations governing the Company that will impose additional capital requirements and may result in additional restrictions on investments and other holding company activities. The law also creates a new consumer financial protection bureau that will have the authority to promulgate rules intended to protect consumers in the financial products and services market. The creation of this independent bureau could result in new regulatory requirements and raise the cost of regulatory compliance. The federal preemption of state laws currently accorded federally chartered financial institutions will be reduced. In addition, regulation mandated by the new law could require changes in regulatory capital requirements, loan loss provisioning practices, and compensation practices which may have a material impact on our operations. Because the regulations under the new law have not been promulgated, we cannot determine the full impact on our business and operations at this time.
52
Table of Contents
2. Summary of Significant Accounting Policies
Principles of Consolidation
The consolidated financial statements include the accounts of the Company and the Bank. All significant intercompany balances and transactions have been eliminated in consolidation.
Use of Estimates
The preparation of financial statements in conformity with accounting principles generally accepted in the United States (“GAAP”) requires management to make estimates and assumptions that affect the reported amounts of assets and liabilities and disclosure of contingent assets and liabilities as of the date of the financial statements and the reported amounts of revenues and expenses during the reporting period. Actual results could differ from those estimates. Material estimates that are particularly susceptible to significant change in the near term include, but are not limited to, the determination of the allowance for loan losses, income taxes, valuation of investments with other-than-temporary impairment and valuation of share-based compensation.
Cash and Cash Equivalents
For purposes of reporting cash flows, cash and cash equivalents include cash on hand, due from banks and interest-bearing deposits with the FHLB. The Company considers all highly liquid debt instruments with original maturities of three months or less (excluding interest-bearing deposits in banks) to be cash equivalents.
The Bank is required to maintain reserve requirements with the Federal Reserve Bank. The requirement is dependent upon the Bank’s cash on hand or noninterest-bearing balances. The reserve requirements as of December 31, 2010 and 2009 were $7,890,000 and $3,711,000, respectively.
Investment Securities
The Company follows the guidance under the Financial Accounting Standards Board Accounting Standards Codification (“ASC”) 320, Investments – Debt and Equity Securities. This standard addresses the accounting and reporting for investments in equity securities that have readily determinable fair values and for all investments in debt securities. Under the topic, investment securities, which the Company both positively intends and has the ability to hold to maturity, are classified as held to maturity and carried at amortized cost.
Investment securities that are acquired with the intention of being resold in the near term are classified as trading securities under ASC 320 and are carried at fair value, with unrealized holding gains and losses recognized in current earnings. The Company does not currently hold any securities for trading purposes.
Securities not meeting the criteria of either trading securities or held to maturity are classified as available for sale and are carried at fair value. Unrealized holding gains and losses for these securities are recognized, net of related income tax effects, as a separate component of the Company’s shareholders’ equity under “Other Comprehensive Income”.
Interest income earned on securities either held to maturity or available for sale is included in current earnings, including the amortization of premiums and the accretion of discounts using the interest method. Premiums and discounts are amortized or accreted over the life of the related security as an adjustment to the yield. The gain or loss realized on the sale of securities classified as available for sale and held to maturity, as determined using the specific identification method for determining the cost of the securities sold, is computed with reference to its amortized cost and is also included in current earnings.
The Company reviews investment securities for other-than-temporary impairment on a quarterly basis. Impairment is considered to be other-than-temporary if it is likely that all amounts contractually due will not be received for debt securities and when there is no positive evidence indicating that an investment’s carrying amount is recoverable in the near term for equity securities. When a decline in the fair value of available for sale and held to maturity securities below cost is deemed to be credit related, a charge for other-than-temporary impairment is included in earnings as “Other-than-temporary impairment of securities”. The decline in value attributed to non-credit related factors is recognized in other comprehensive income and a new cost basis for the security is established. The new cost basis is not changed for subsequent recoveries in fair value. Increases and decreases between fair value and cost on available for sale securities are reflected net of tax in shareholders’ equity and are included in other comprehensive income. In evaluating whether impairment is temporary or other-
53
Table of Contents
than-temporary, the Company considers, among other things, the time period the security has been in an unrealized loss position; the financial condition of the issuer and its industry; recommendations of investment advisors; economic forecasts; market or industry trends; changes in tax laws, regulations, or other governmental policies significantly affecting the issuer; any downgrades from rating agencies; and any reduction or elimination of dividends. The Company’s intent and ability to hold a security for a period of time sufficient to allow for any anticipated recovery in fair value is also considered.
Loans Held for Sale
The Company sells mortgage loans and loan participations for an amount equal to the principal amount of loans or participations with yields to investors based upon the current market rate. Realized gains and losses related to loan sales are included in noninterest income.
For financial reporting purposes, the Company classifies a portion of its loan portfolio as “Mortgage loans held for sale.” Included in this category are loans which the Company has the current intent to sell and loans which are available to be sold in the event that the Company determines that loans should be sold to support the Company’s investment and liquidity objectives, as well as to support its overall asset and liability management strategies. Loans included in this category for which the Company has the current intention to sell are recorded at the lower of aggregate cost or fair value. As of December 31, 2010 and 2009, the Company had $2,437,000 and $719,000, respectively, in loans classified as “Mortgage loans held for sale.”
As of December 31, 2010 and 2009, the Company had $31,159,000 and $24,047,000, respectively, outstanding in loans sold to government agencies that it was servicing.
Loans
Discounts on loan originations and purchased loans are amortized using the level yield interest method over the remaining contractual life of the loan.
Nonrefundable loan origination fees, net of direct loan origination costs, are deferred and recognized over the life of the loan as an adjustment of yield using the interest method.
The Company allocates the cost to acquire or originate a mortgage loan between the loan and the right to service the loan if it intends to sell or securitize the loan and retain the servicing rights. In addition, the Company periodically assesses capitalized mortgage servicing rights for impairment based on the fair value of such rights. To the extent that temporary impairment exists, write-downs are recognized in current earnings as an adjustment to the corresponding valuation allowance. Permanent impairment is recognized through a write-down of the asset with a corresponding reduction in the valuation allowance. For purposes of performing its impairment evaluation, the portfolio is stratified on the basis of certain risk characteristics, including loan type and interest rates. Capitalized servicing rights are amortized over the period of, and in proportion to, estimated net servicing income, which considers appropriate prepayment assumptions.
Interest on loans receivable is accrued as earned using the interest method over the life of the loan. Interest on loans deemed uncollectible is excluded from income. The accrual of interest is discontinued and reversed against current income once loans become more than 90 days past due. The past due status of loans is determined based on the contractual terms. When a loan is placed on nonaccrual status, previously accrued and uncollected interest is charged against interest revenue on loans. Interest payments are applied to reduce the principal balance on nonaccrual loans. Loans are returned to accrual status when all past due payments are received in full and future payments are probable.
Loans, or portions of loans, are charged off in the period that such loans, or portions thereof, are deemed uncollectible. The collectability of individual loans is determined through an estimate of the fair value of the underlying collateral and/or assessment of the financial condition and repayment capacity of the borrower.
Acquisition Accounting for Loans and Related FDIC Loss Sharing Receivable
The Company accounted for the Statewide acquisition in accordance with ASC Topic 805, Business Combinations, which requires the use of the purchase method of accounting. All identifiable assets acquired, including loans, are recorded at fair value. The fair value of acquired loans is represented by the expected cash flows from the portfolio discounted at current market rates. In estimating the cash flows, the Company uses a model based on assumptions about the amount and timing of principal and interest payments, estimated prepayments, estimated default rates, estimated loss severities in the event of defaults and current market rates.
54
Table of Contents
Because the FDIC will reimburse the Company for certain acquired loans should the Company experience a loss, a FDIC loss sharing receivable was recorded at discounted fair value at the acquisition date. The receivable was recognized at the same time as the acquired loans, and measured on the same basis, subject to collectability or contractual limitations. The loss sharing agreements on the acquisition date reflect the reimbursements expected to be received from the FDIC, using an appropriate discount rate, which reflects counterparty credit risk and other uncertainties.
The Company accounts for acquired loans under ASC 310-30, Loans and Debt Securities Acquired with Deteriorated Credit Quality. In accordance with ASC 310-30 and in estimating the fair value of the acquired loans as of the acquisition date, we (a) calculate the contractual amount and timing of undiscounted principal and interest payments (the “undiscounted contractual cash flows”) and (b) estimate the amount and timing of undiscounted expected principal and interest payments (the “undiscounted expected cash flows”). The difference between the undiscounted contractual cash flows and the undiscounted expected cash flows is the nonaccretable difference.
On the acquisition date, the amount by which the undiscounted expected cash flows exceed the estimated fair value of the acquired loans is the “accretable yield”. The accretable yield is taken into interest income over the life of the loans using the effective yield method. The accretable yield changes over time due to both accretion and as actual and expected cash flows vary from the acquisition date estimated cash flows. The accretable yield is then measured at each financial reporting date and represents the difference between the remaining undiscounted expected cash flows and the current carrying value of the loans. The remaining undiscounted expected cash flows are calculated at each financial reporting date based on information then currently available. Increases in expected cash flows over those originally estimated increase the accretable yield and are recognized as interest income prospectively. Increases in expected cash flows may also lead to the reduction of any allowance for loan losses recorded after the acquisition. Decreases in expected cash flows compared to those originally estimated decrease the accretable yield and are recognized by recording an allowance for loan losses. As the accretable yield increases or decreases from changes in cash flow expectations, the offset is a decrease or increase to the nonaccretable difference.
Allowance for Loan Losses
The allowance for loan losses is maintained at an amount which management deems adequate to cover estimated probable losses on loans receivable. The allowance for loan losses is comprised of specific and general reserves. The Company determines specific reserves based on the provisions of ASC 310, Receivables. The Company’s allowance for loan losses includes a measure of impairment related to those loans identified for evaluation under the topic. This measurement is based on a comparison of the recorded investment in the loan with either the expected cash flows discounted using the loan’s original effective interest rate, observable market price for the loan or the fair value of the collateral underlying certain collateral-dependent loans. General reserves are based on management’s evaluation of many factors, including current economic trends, industry experience, historical loss experience, industry loan concentrations, the borrowers’ abilities to repay and repayment performance, probability of foreclosure and estimated collateral values. As these factors change, adjustments to the loan loss reserve are charged to current operations. The Company uses a five year time period for historical loss experience. Loans that are determined to be uncollectible are charged-off against the allowance for loan losses once that determination is made.
While management uses available information to make loan loss allowance evaluations, adjustments to the allowance maybe necessary based on changes in economic and other conditions or changes in accounting guidance. The OTS, as an integral part of its examination processes, periodically reviews the allowance for loan losses. The OTS may require the recognition of adjustments to the allowance for loan losses based on their judgment of information available to them as of the time of their examinations. To the extent that actual outcomes differ from management’s estimates, additional provisions to the allowance for loan losses may be required as of the time of their examination. As part of the risk management program, an independent review is performed on the loan portfolio, which supplements management’s assessment of the loan portfolio and the allowance for loan losses. The result of the independent review is reported directly to the Audit Committee of the Board of Directors.
55
Table of Contents
Repossessed Assets
Repossessed assets are recorded at fair value less estimated selling costs. Costs relating to the development and improvement of foreclosed property are capitalized, and costs relating to holding and maintaining the property are expensed. Write-downs from cost to fair value as of the dates of foreclosure are charged against the allowance for loan losses. Valuations are performed periodically and an allowance for loss is established by a charge to operations if the carrying value of a property exceeds its fair value less selling costs. The Company appraises the property at the time of foreclosure and at least every 12 months following the foreclosure. Excluding Covered assets, the Company had $92,000 and $417,000 of OREO as of December 31, 2010, and 2009, respectively. Including Covered Assets, the Company had $5,683,000 of OREO as of December 31, 2010.
Federal Home Loan Bank Stock
As a member of the Federal Home Loan Bank of Dallas (“FHLB”), the Bank is required to maintain a minimum investment in its stock that varies with the level of FHLB advances outstanding. The stock is bought from and sold to the FHLB based upon its $100 par value. The stock does not have a readily determinable fair value and as such is classified as restricted stock, carried at cost and evaluated for impairment in accordance with GAAP. The stock’s value is determined by the ultimate recoverability of the par value rather than by recognizing temporary declines. The determination of whether the par value will ultimately be recovered is influenced by criteria such as the following: (a) the significance of the decline in net assets of the FHLB as compared to the capital stock amount and the length of time this situation has persisted, (b) commitments by the FHLB to make payments required by law or regulation and the level of such payments in relation to the operating performance, (c) the impact of legislative and regulatory changes on the customer base of the FHLB and (d) the liquidity position of the FHLB.
While the Federal Home Loan Banks have been negatively impacted by the current economic conditions, the FHLB of Dallas remains in compliance with regulatory capital and liquidity requirements and continues to pay dividends on the stock and make redemptions at the par value. With consideration given to these factors, management concluded that the stock was not impaired at December 31, 2010. As of December 31, 2010 and 2009, the Company had $1,116,000 and $1,641,000 of FHLB stock, respectively.
Office Properties and Equipment
Office properties and equipment are stated at cost less accumulated depreciation. Depreciation is computed using the straight-line method with rates based on the estimated useful lives of the individual assets, which range from 3 to 40 years. Expenditures which substantially increase the useful lives of existing property and equipment are capitalized while routine expenditures for repairs and maintenance are expensed as incurred.
Cash Surrender Value of Bank-owned Life Insurance
Life insurance contracts represent single premium life insurance contracts on the lives of certain officers of the Bank. The Bank is the beneficiary of these policies. These contracts are reported at their cash surrender value and changes in the cash surrender value are included in other noninterest income.
Intangible Assets
Intangible assets consist of goodwill and core deposit intangibles. Goodwill represents the excess purchase price over the fair value of net assets acquired in business acquisitions. Core deposit intangibles represent the estimated value related to customer deposit relationships in the Company’s acquisition. The core deposit intangibles are being amortized over 10 years using the sum-of-the-years-digits approach. Goodwill is not amortized but rather is evaluated for impairment on at least an annual basis.
Salary Continuation Agreements
The Company records the expense associated with its salary continuation agreements over the service periods of the persons covered under these agreements.
Income Taxes
The Company accounts for income taxes under the liability method. Deferred tax assets and liabilities are recorded for the future tax consequences attributable to differences between the financial statement carrying amounts of existing assets and liabilities and their respective tax bases. Future tax benefits are recognized to the extent that realization of such benefits is more likely than not. Deferred tax assets and liabilities are measured
56
Table of Contents
using enacted tax rates expected to apply to taxable income in the years in which the assets and liabilities are expected to be recovered or settled. The effect of a change in tax rates on deferred tax assets and liabilities is recognized in income taxes during the period that includes the enactment date.
In the event the future tax consequences of differences between the financial reporting bases and the tax bases of the Company’s assets and liabilities results in deferred tax assets, an evaluation of the probability of being able to realize the future benefits indicated by such asset is required. A valuation allowance is provided for the portion of the deferred tax asset when it is more likely than not that some or all of the deferred tax asset will not be realized. In assessing the realizability of the deferred tax assets, management considers the scheduled reversals of deferred tax liabilities, projected future taxable earnings and tax planning strategies.
The income tax benefit or expense is the total of the current year income tax due or refundable and the change in deferred tax assets and liabilities.
A tax position is recognized as a benefit only if it is “more likely than not” that the tax position would be sustained in a tax examination, with a tax examination presumed to occur. The amount recognized is the largest amount of tax benefit that is greater than 50 percent likely of being realized on examination. For tax positions not meeting the “more likely than not” test, no tax benefit is recorded.
The Company recognizes interest and penalties accrued related to unrecognized tax benefits, if applicable, in noninterest expense. During the years ended December 31, 2010, December 31, 2009, and December 31, 2008, the Company did not recognize any interest or penalties in its financial statements, nor has it recorded an accrued liability for interest or penalty payments.
Stock-based Compensation Plans
The Company issues stock options under the 2009 Stock Option Plan to directors, officers and other key employees. In accordance with the requirements of ASC 718, Compensation – Stock Compensation, the Company has adopted a fair value based method of accounting for employee stock compensation plans, whereby compensation cost is measured as of the grant date based on the fair value of the award and is recognized over the service period, which is usually the vesting period.
The Company issues restricted stock under the 2009 Recognition and Retention Plan (“RRP”) for directors, officers and other key employees. The RRP allows for the issuance of restricted stock awards that may not be sold or otherwise transferred until certain restrictions have lapsed. The holders of the restricted stock have the right to vote the shares as awards are earned. The unearned compensation related to these awards is amortized to compensation expense over the service period, which is usually the vesting period. The total share-based compensation expense for these awards is determined based on the market price of the Company’s common stock as of the date of grant applied to the total number of shares granted and is amortized over the vesting period.
Earnings Per Share
Earnings per share represent income available to common shareholders divided by the weighted-average number of common shares outstanding during the period. Diluted earnings per share reflect additional common shares that would have been outstanding if dilutive potential common shares had been issued, as well as any adjustment to income that would result from the assumed issuance.
Comprehensive Income (Loss)
Generally accepted accounting principles in the United States of America generally require that recognized revenues, expenses, gains and losses be included in net earnings. Although certain changes in assets and liabilities, such as unrealized gains and losses on available for sale securities, are reported as a separate component of the equity section of the balance sheets, such items, along with net earnings, are components of comprehensive income. The Company presents comprehensive income in its statements of shareholders’ equity.
Reclassifications
Certain reclassifications have been made to prior period balances to conform to the current period presentation.
57
Table of Contents
Recent Accounting Pronouncements
In January 2010, the Financial Accounting Standards Board (“FASB”) issued Accounting Standards Update (“ASU”) No. 2010-06, Improving Disclosures About Fair Value Measurements, which added disclosure requirements about transfers in and out of Levels 1 and 2 of the fair value hierarchy, clarified existing fair value disclosure requirements about the appropriate level of disaggregation and clarified that a description of valuation techniques and inputs used to measure fair value was required for recurring and nonrecurring Level 2 and 3 fair value measurements. The Company adopted the provisions of the ASU in preparing its consolidated financial statements as of and for the period ended March 31, 2010. The adoption of the provisions of this ASU, which was subsequently codified into ASC 820, Fair Value Measurements and Disclosures, only affected the disclosure requirements for fair value measurements and as a result had no impact on the Company’s results of operations or financial position. See Note 20 to the Consolidated Financial Statements for the disclosures required by this ASU.
This ASU also requires that Level 3 activity about purchases, sales, issuances and settlements be presented on a gross basis rather than as a net number as currently permitted. This provision of the ASU will be effective for the Company’s reporting period ending March 31, 2011. As this provision amends only the disclosure requirements for fair value measurements, the adoption will have no impact on the Company’s results of operations or financial position.
In February 2010, the FASB issued ASU 2010-09, Subsequent Events: Amendments to Certain Recognition and Disclosure Requirements. ASU 2010-09 removes some contradictions between the requirements of U.S. GAAP and the filing rules of the SEC. SEC filers are required to evaluate subsequent events through the date the financial statements are issued, and they are no longer required to disclose the date through which subsequent events have been evaluated. This guidance was effective upon issuance except for the use of the issued date for conduit debt obligors. The adoption of ASU 2010-09 did not have a material impact on the Company’s results of operations, financial position or disclosures.
In March 2010, the FASB issued ASU 2010-11, Derivatives and Hedging: Scope Exception Related to Embedded Credit Derivatives. ASU 2010-11 clarifies the type of embedded credit derivative that is exempt from embedded derivative bifurcation requirements, by resolving a potential ambiguity about the breadth of the embedded credit derivative scope exception with regard to some types of contracts, such as collateralized debt obligations. The scope exception will no longer apply to some contracts that contain an embedded credit derivative feature that transfers credit risk. The ASU was effective for fiscal quarters beginning after June 15, 2010. The adoption of ASU 2010-11 did not have an impact on the Company’s results of operations, financial position or disclosures.
In April 2010, the FASB issued ASU 2010-18, Effect of a Loan Modification When the Loan is Part of a Pool That is Accounted for as a Single Asset. ASU 2010-18 allows for the one-time election to terminate accounting for loans as a pool under ASC 310-30, Loans and Debt Securities Acquired with Deteriorated Credit Quality. This election may be applied on a pool-by-pool basis and does not preclude an entity from applying pool accounting to subsequent acquisitions of loans with credit deterioration. ASU 2010-18 was effective for modifications of loans accounted for within pools under ASC 310-30 occurring in the first interim or annual period ending on or after July 15, 2010. The adoption of ASU 2010-18 did not have an impact on the Company’s results of operations, financial position or disclosures.
In July 2010, the FASB issued ASU 2010-20, Disclosures about the Credit Quality of Financing Receivable and the Allowance for Credit Losses. ASU 2010-20 requires significant new disclosures about the allowance for credit losses and the credit quality of financing receivables. The requirements are intended to enhance transparency regarding credit losses and the credit quality of loan and lease receivables. Under this statement, allowance for credit losses and fair value are to be disclosed by portfolio segment, while credit quality information, impaired financing receivables and nonaccrual status are to be presented by class of financing receivable. Disclosure of the nature and extent, the financial impact and segment information of troubled debt restructurings will also be required. The disclosures are to be presented at the level of disaggregation that management uses when assessing and monitoring the portfolio’s risk and performance. The ASU was effective for interim and reporting periods ending on or after December 15, 2010. As the adoption of ASU 2010-20 amends only the disclosure requirements for loans and leases and the allowance for credit losses, the adoption will have no impact on the Company’s results of operations or financial position. See Note 5 to the Consolidated Financial Statements for the disclosures required by this ASU.
58
Table of Contents
In January 2011, the FASB issued ASU 2011-01, Deferral of the Effective Date of Disclosures about Troubled Debt Restructurings in Update No. 2010-20. ASU 2011-01 temporarily delays the effective date of the disclosures surrounding troubled debt restructurings in ASU 2010-20 for public companies. The FASB is deliberating on what constitutes a troubled debt restructuring and will coordinate that guidance with the effective date of the new disclosures, which is anticipated to be effective for interim and annual periods ending after June 15, 2011. The adoption of ASU 2011-01 is not expected to have a material impact on the Company’s results of operations, financial position, or disclosures.
3. Acquisition Activity
On March 12, 2010, the Company’s subsidiary, the Bank, entered into a purchase and assumption agreement (the “Agreement”) with the FDIC to purchase certain assets and to assume deposits and certain other liabilities of Statewide, a full service community bank headquartered in Covington, Louisiana. As a result of the acquisition, the Bank now operates six former Statewide branches in the Northshore (of Lake Pontchartrain) region of Louisiana.
In connection with the Agreement, the Bank entered into loss sharing agreements with the FDIC which cover the acquired loan portfolio (“Covered Loans”) and repossessed assets (collectively referred to as “Covered Assets”). Under the terms of the loss sharing agreements, the FDIC will absorb 80% of the first $41,000,000 of losses incurred on Covered Assets and 95% of losses on Covered Assets exceeding $41,000,000. The loss sharing agreements for non-residential and residential loans are in effect for five years and 10 years, respectively, from the March 12, 2010 acquisition date and the loss recovery provisions are in effect for eight years and 10 years, respectively, from the acquisition date. The reimbursable losses expected to be received from the FDIC are based on the book value of the Covered Assets as determined by the FDIC as of the date of the transaction. Loans made by the Company prior to the acquisition and new loans made after that date are not covered by the provisions of the loss sharing agreements (“Noncovered Loans”). The Bank recorded a receivable from the FDIC that represents the estimated fair value of the FDIC’s portion of the losses that are expected to be incurred and reimbursed to the Company. The ultimate collectability of this asset is dependent upon the performance of the underlying Covered Assets, the passage of time and claims paid by the FDIC. As of December 31, 2010, the FDIC loss sharing receivable was $32,013,000.
The FDIC granted the Bank an option to purchase the premises, furniture, fixtures and equipment of Statewide and assume the leases associated with leased offices. During the third quarter of 2010, the Company finalized its acquisition of six former Statewide branch locations.
The acquisition was accounted for under the purchase method of accounting in accordance with ASC 805, Business Combinations. In accordance with ASC 805, the Company recorded goodwill totaling $560,000 from the acquisition as a result of an excess of liabilities assumed over assets acquired. Both the assets acquired and liabilities assumed were recorded as of their respective acquisition date fair values. Identifiable intangible assets, including core deposit intangible assets, were recorded at fair value.
The Company’s operating results for the year ended December 31, 2010 include the operating results of Statewide from the date of acquisition to December 31, 2010. Due to the significance of the amounts of the fair value adjustments, as well as the nature of the FDIC loss sharing agreements, Statewide’s historical results are not believed to be relevant to the Company’s results; thus, no pro forma information is presented.
59
Table of Contents
The assets acquired and liabilities assumed, as well as the adjustments to record the assets and liabilities at fair value, are presented in the following table as of March 12, 2010.
| (dollars in thousands) |
Acquired from the FDIC |
Fair Value Adjustments |
As recorded by Home Bank |
|||||||||
| Assets |
||||||||||||
| Cash and cash equivalents |
$ | 11,569 | $ | — | $ | 11,569 | ||||||
| Investment securities |
24,974 | (133 | )(a) | 24,841 | ||||||||
| Loans |
157,016 | (46,601 | )(b) | 110,415 | ||||||||
| Repossessed assets |
2,545 | (207 | )(c) | 2,338 | ||||||||
| Core deposit intangible |
— | 1,429 | (d) | 1,429 | ||||||||
| FDIC loss sharing receivable |
— | 34,422 | (e) | 34,422 | ||||||||
| Other assets |
3,076 | (64 | ) | 3,012 | ||||||||
| Total assets acquired |
$ | 199,180 | $ | (11,154 | ) | $ | 188,026 | |||||
| Liabilities |
||||||||||||
| Interest-bearing deposits |
$ | 191,014 | $ | 1,049 | (f) | $ | 192,063 | |||||
| Noninterest-bearing deposits |
14,862 | — | 14,862 | |||||||||
| FHLB Advances |
16,519 | 305 | (g) | 16,824 | ||||||||
| Other liabilities |
161 | — | 161 | |||||||||
| Total liabilities assumed |
$ | 222,556 | $ | 1,354 | $ | 223,910 | ||||||
| Excess of liabilities assumed over assets acquired |
35,884 | |||||||||||
| Cash payment received from the FDIC |
(35,324 | ) | ||||||||||
| Total goodwill recorded |
$ | 560 | ||||||||||
| (a) | The adjustment is to record the fair value of Statewide’s investments based on market values. |
| (b) | The adjustment represents the write down of the book value of Statewide’s loans to their estimated fair value based on expected cash flows and includes an estimation of expected future loan losses. |
| (c) | The adjustment represents the write down of the book value of Statewide’s repossessed assets to their estimated fair value based on their estimated fair value, as adjusted for estimated costs to sell. |
| (d) | The adjustment represents the value of the core deposit base assumed in the acquisition. The core deposit asset was recorded as an identifiable intangible asset and will be amortized on an accelerated basis over the average life of the deposit base, estimated to be ten years. |
| (e) | The adjustment is to record the fair value of the amount the Company estimates it will receive from the FDIC under its loss sharing agreements. The value of the receivable represents the fair value of expected cash flows as a result of anticipated future losses on Covered Assets. |
| (f) | The adjustment is to record the fair value of Statewide’s certificates of deposit based on market rates as of the acquisition date. The fair value adjustment will be amortized as a reduction of interest expense over the expected life of the portfolio, which is estimated at 34 months. |
| (g) | The adjustment is to record the fair value of FHLB advances based on market rates as of the acquisition date. The adjustment represents the Company’s costs incurred to extinguish the advances prior to their stated maturity. |
As of the March 12, 2010 acquisition date, we estimated the fair value of the Statewide loan portfolio at $110,415,000, which represented the expected cash flows from the portfolio discounted at current market rates. In estimating the cash flows, we used a model based on assumptions about the amount and timing of principal and interest payments, estimated prepayments, estimated default rates, estimated loss severities in the event of defaults and current market rates.
We evaluated the acquired Covered Loans and have elected to account for such loans under ASC 310-30, Loans and Debt Securities Acquired with Deteriorated Credit Quality. In accordance with ASC 310-30 and in estimating the fair value of the Covered Loans as of the acquisition date, we (a) calculated the contractual amount and timing of undiscounted principal and interest payments (the “undiscounted contractual cash flows”) and (b) estimated the amount and timing of undiscounted expected principal and interest payments (the “undiscounted expected cash flows”). The difference between the undiscounted contractual cash flows and the undiscounted expected cash flows is the nonaccretable difference. The nonaccretable difference totaled $61,478,000 as of March 12, 2010 and represented an estimate of the undiscounted loss exposure in the Covered Loans as of the acquisition date.
On the acquisition date, the amount by which the undiscounted expected cash flows exceed the estimated fair value of the acquired loans is the “accretable yield”. The accretable yield is taken into interest income over the life of the loans using the effective yield method. The accretable yield changes over time due to both accretion
60
Table of Contents
and as actual and expected cash flows vary from the acquisition date estimated cash flows. The accretable yield is then measured as of each financial reporting date and represents the difference between the remaining undiscounted expected cash flows and the current carrying value of the loans. The remaining undiscounted expected cash flows are calculated as of each financial reporting date based on information then currently available. Increases in expected cash flows over those originally estimated increase the accretable yield and are recognized as interest income prospectively. Increases in expected cash flows may also lead to the reduction of any allowance for loan losses recorded after the acquisition. Decreases in expected cash flows compared to those originally estimated decrease the accretable yield and are recognized by recording an allowance for loan losses. As the accretable yield increases or decreases from changes in cash flow expectations, the offset is a decrease or increase to the nonaccretable difference.
The following table summarizes the accretable yield on the Covered Loans as of March 12, 2010 and the changes therein through December 31, 2010.
| (dollars in thousands) |
Accretable Yield |
|||
| Estimated fair value of loans acquired |
$ | 110,415 | ||
| Less: undiscounted cash flows expected to be collected |
||||
| Undiscounted contractual cash flows |
183,003 | |||
| Undiscounted cash flows not expected to be collected (nonaccretable difference) |
(61,478 | ) | ||
| Undiscounted cash flows expected to be collected |
121,525 | |||
| Accretable yield as of March 12, 2010 |
(11,110 | ) | ||
| Accretion |
5,605 | |||
| Accretable yield as of December 31, 2010 |
$ | (5,505 | ) | |
As of March 12, 2010, the weighted average remaining contractual life of the Covered Loan portfolio was 3.3 years.
Over the life of the Covered Loans, the Company will continue to estimate cash flows expected to be collected on pools of loans sharing common risk characteristics. The Company will evaluate whether the present value of Covered Loans has decreased and if so, a provision for loan loss will be recognized. For any increases in cash flows expected to be collected, the Company will adjust the amount of accretable yield recognized on a prospective basis over the remaining life of the applicable loan or pool of loans.
The FDIC loss sharing receivable will continue to be measured on the same basis as the related Covered Loans. Because the Covered Loans are subject to the accounting prescribed by ASC 310, subsequent changes to the basis of the FDIC loss sharing receivable will also follow that model. Deterioration in the credit quality of the loans (immediately recorded as an adjustment to the allowance for loan losses) would immediately increase the basis of the FDIC loss sharing receivable, with the offset recorded through the consolidated statement of income. Increases in the credit quality or cash flows of loans (reflected as an adjustment to yield and accreted into income over the remaining life of the loans) decrease the basis of the FDIC loss sharing receivable, with such decrease being accreted into income over 1) the same period or 2) the life of the loss sharing agreements, whichever is shorter. Loss assumptions used in the basis of the Covered Loans are consistent with the loss assumptions used to measure the FDIC loss sharing receivable.
61
Table of Contents
4. Investment Securities
Summary information regarding investment securities classified as available for sale and held to maturity as of December 31, 2010 and 2009 follows.
| (dollars in thousands) |
Amortized Cost |
Gross Unrealized Gains |
Gross Unrealized Losses |
Fair Value | ||||||||||||||||
| December 31, 2010 | Less Than 1 Year |
Over 1 Year |
||||||||||||||||||
| Available for sale: |
||||||||||||||||||||
| U.S. agency mortgage-backed |
$ | 83,514 | $ | 1,858 | $ | 37 | $ | — | $ | 85,335 | ||||||||||
| Non-U.S. agency mortgage-backed |
21,305 | 160 | 107 | 907 | 20,451 | |||||||||||||||
| U.S. government agency |
6,094 | 82 | — | — | 6,176 | |||||||||||||||
| Total available for sale |
$ | 110,913 | $ | 2,100 | $ | 144 | $ | 907 | $ | 111,962 | ||||||||||
| Held to maturity: |
||||||||||||||||||||
| U.S. agency mortgage-backed |
$ | 3,857 | $ | 86 | $ | — | $ | — | $ | 3,943 | ||||||||||
| Municipal bonds |
1,363 | 78 | — | — | 1,441 | |||||||||||||||
| U.S. government agency |
10,000 | 16 | — | — | 10,016 | |||||||||||||||
| Total held to maturity |
$ | 15,220 | $ | 180 | $ | — | $ | — | $ | 15,400 | ||||||||||
| (dollars in thousands) |
Amortized Cost |
Gross Unrealized Gains |
Gross Unrealized Losses |
Fair Value | ||||||||||||||||
| December 31, 2009 | Less Than 1 Year |
Over 1 Year |
||||||||||||||||||
| Available for sale: |
||||||||||||||||||||
| U.S. agency mortgage-backed |
$ | 60,338 | $ | 1,786 | $ | 31 | $ | 1 | $ | 62,092 | ||||||||||
| Non-U.S. agency mortgage-backed |
39,707 | 262 | — | 2,116 | 37,853 | |||||||||||||||
| U.S. government agency |
6,840 | — | — | 33 | 6,807 | |||||||||||||||
| Total available for sale |
$ | 106,885 | $ | 2,048 | $ | 31 | $ | 2,150 | $ | 106,752 | ||||||||||
| Held to maturity: |
||||||||||||||||||||
| U.S. agency mortgage-backed |
$ | 5,735 | $ | 46 | $ | — | $ | — | $ | 5,781 | ||||||||||
| Municipal bonds |
1,364 | 75 | — | — | 1,439 | |||||||||||||||
| U.S. government agency |
6,000 | — | 43 | — | 5,957 | |||||||||||||||
| Total held to maturity |
$ | 13,099 | $ | 121 | $ | 43 | $ | — | $ | 13,177 | ||||||||||
Management evaluates securities for other-than-temporary impairment at least quarterly, and more frequently when economic and market conditions warrant such evaluations. Consideration is given to (1) the extent and length of time the fair value has been below cost; (2) the reasons for the decline in value; (3) the Company’s intent to sell a security or whether it is more likely than not we will be required to sell the security before the recovery of its amortized cost, which may extend to maturity and our ability and intent to hold the security for a period of time that allows for the recovery in value in the case of equity securities.
The Company developed a process to identify securities that could potentially have a credit impairment that is other-than-temporary. This process involves evaluating each security for impairment by monitoring credit performance, collateral type, collateral geography, bond credit support, loan-to-value ratios, credit scores, loss severity levels, pricing levels, downgrades by rating agencies, cash flow projections and other factors as indicators of potential credit issues. The Company performs a credit analysis based on different credit scenarios at least quarterly to detect impairment on its investment securities. When the Company determines that a security is deemed to be other than temporarily impaired, an impairment loss is recognized.
62
Table of Contents
During 2010, 2009, and 2008, management’s assessment of its investment securities concluded the decline in the fair values of certain non-agency (or private-label) mortgage-back securities were other-than-temporary. During 2010, 2009 and 2008, the Company recorded pre-tax impairment charges of $1,229,000, $1,888,000 and $2,833,000, respectively, associated with the credit deterioration of those securities. Additionally, management concluded that the unrealized losses of its investment securities summarized in the table above were not deemed to be other-than-temporary.
In 2009, ASC 320 was updated to provide additional guidance designed to create greater clarity and consistency in accounting for and presenting impairment losses on securities. Upon adoption of the new guidance on April 1, 2009, the Company recognized a cumulative effect adjustment in retained earnings from accumulated other comprehensive income to reclassify other-than-temporary impairments previously taken under the former authoritative accounting guidance for securities held as of April 1, 2009. In accordance with the guidance, the Company determined that of the $2,833,000 in other-than-temporary impairments recorded in 2008 on investments available for sale as of April 1, 2009, $1,065,000 of these impairments were no longer considered other-than-temporary. As a result, the Company increased the amortized cost basis of these investments available for sale by $1,065,000. The cumulative effect adjustment resulted in a decrease in accumulated other comprehensive income and an increase in retained earnings totaling $703,000 (net of tax). The cumulative effect adjustment had no net effect on the Company’s shareholders’ equity or previously reported net income.
As of December 31, 2010, 17 debt securities had unrealized losses of 3.2% of the securities’ amortized cost basis and 0.8% of the Company’s total amortized cost basis. The unrealized losses for the 17 securities primarily relate to elevated delinquencies and defaults in the mortgage loans underlying certain non-agency mortgage-backed securities. Eight of the 17 securities had been in a continuous loss position for over twelve months at such date. The eight securities have an aggregate amortized cost basis and unrealized loss of $8,247,000 and $907,000 respectively. As management has the intent and ability to hold these debt securities until maturity, or until anticipated recovery if classified as available for sale, except as noted above, no declines in these eight securities were deemed to be other-than-temporary.
As of December 31, 2009, 27 debt securities had unrealized losses of 5.6% of the securities’ amortized cost basis and 1.9% of the Company’s total amortized cost basis. The unrealized losses for the 27 securities primarily relate to increasing delinquencies and defaults in the mortgage loans underlying certain non-agency mortgage-backed securities. 18 of the 27 securities had been in a continuous loss position for over twelve months at such date. The 18 securities have an aggregate amortized cost basis and unrealized loss of $21,567,000 and $2,117,000 respectively. As management has the intent and ability to hold debt securities until maturity, or until anticipated recovery if classified as available for sale, except as noted above, no declines in these 18 securities were deemed to be other-than-temporary at December 31, 2009.
63
Table of Contents
The amortized cost and estimated fair value by maturity of investment securities as of December 31, 2010 are shown in the following table. Securities are classified according to their contractual maturities without consideration of principal amortization, potential prepayments or call options. The expected maturity of a security, in particular certain U.S. agency securities and obligations of states and political subdivisions, may differ from its contractual maturity because of the exercise of call options and potential paydowns. Accordingly, actual maturities may differ from contractual maturities.
| (dollars in thousands) |
One Year or Less |
After One Year through Five Years |
After Five Years through Ten Years |
After Ten Years |
Total | |||||||||||||||
| Fair Value |
||||||||||||||||||||
| Securities available for sale: |
||||||||||||||||||||
| U.S. agency mortgage-backed |
$ | — | $ | 3,023 | $ | 15,246 | $ | 67,066 | $ | 85,335 | ||||||||||
| Non-U.S. agency mortgage-backed |
— | — | 499 | 19,952 | 20,451 | |||||||||||||||
| U.S. government agency |
— | — | — | 6,176 | 6,176 | |||||||||||||||
| Total securities available for sale |
$ | — | $ | 3,023 | $ | 15,745 | $ | 93,194 | $ | 111,962 | ||||||||||
| Securities held to maturity: |
||||||||||||||||||||
| U.S. agency mortgage-backed |
$ | — | $ | 2,460 | $ | 1,483 | $ | — | $ | 3,943 | ||||||||||
| Municipal bonds |
192 | 995 | 254 | — | 1,441 | |||||||||||||||
| U.S. government agency |
— | 5,008 | 5,008 | — | 10,016 | |||||||||||||||
| Total securities held to maturity |
$ | 192 | $ | 8,463 | $ | 6,745 | $ | — | $ | 15,400 | ||||||||||
| (dollars in thousands) |
One Year or Less |
After One Year through Five Years |
After Five Years through Ten Years |
After Ten Years |
Total | |||||||||||||||
| Amortized Cost |
||||||||||||||||||||
| Securities available for sale: |
||||||||||||||||||||
| U.S. agency mortgage-backed |
$ | — | $ | 2,924 | $ | 15,189 | $ | 65,401 | $ | 83,514 | ||||||||||
| Non-U.S. agency mortgage-backed |
— | — | 479 | 20,826 | 21,305 | |||||||||||||||
| U.S. government agency |
— | — | — | 6,094 | 6,094 | |||||||||||||||
| Total securities available for sale |
$ | — | $ | 2,924 | $ | 15,668 | $ | 92,321 | $ | 110,913 | ||||||||||
| Securities held to maturity: |
||||||||||||||||||||
| U.S. agency mortgage-backed |
$ | — | $ | 2,424 | $ | 1,433 | $ | — | $ | 3,857 | ||||||||||
| Municipal bonds |
190 | 938 | 235 | — | 1,363 | |||||||||||||||
| U.S. government agency |
— | 5,000 | 5,000 | — | 10,000 | |||||||||||||||
| Total securities held to maturity |
$ | 190 | $ | 8,362 | $ | 6,668 | $ | — | $ | 15,220 | ||||||||||
For the year ended December 31, 2010, the Company recorded gross gains of $546,000 and gross losses of $487,000 related to the sale of investment securities. The Company did not sell investment securities during the year ended December 31, 2009.
As of December 31, 2010 and 2009, the Company had accrued interest receivable for investment securities of $370,000 and $450,000, respectively.
As of December 31, 2010 and 2009, the Company had $17,378,000 and $7,793,000, respectively, of securities pledged against public deposits.
64
Table of Contents
5. Loans
Loans, including Covered Loans and net of unearned income, consisted of the following as of December 31 of the years indicated.
| (dollars in thousands) |
2010 | 2009 | ||||||
| Real estate loans: |
||||||||
| One- to four-family first mortgage |
$ | 122,614 | $ | 120,044 | ||||
| Home equity loans and lines |
30,915 | 24,678 | ||||||
| Commercial real estate |
150,824 | 97,513 | ||||||
| Construction and land |
57,538 | 35,364 | ||||||
| Multi-family residential |
5,718 | 4,089 | ||||||
| Total real estate loans |
367,609 | 281,688 | ||||||
| Other loans: |
||||||||
| Commercial |
48,410 | 38,340 | ||||||
| Consumer |
23,892 | 16,619 | ||||||
| Total other loans |
72,302 | 54,959 | ||||||
| Total loans |
$ | 439,911 | $ | 336,647 | ||||
A summary of activity in the allowance for loan losses for the years ended December 31, 2010, 2009 and 2008 is as follows.
| (dollars in thousands) |
2010 | 2009 | 2008 | |||||||||
| Balance, beginning of period |
$ | 3,352 | $ | 2,606 | $ | 2,314 | ||||||
| Provision |
865 | 865 | 459 | |||||||||
| Loans charged-off |
(369 | ) | (141 | ) | (212 | ) | ||||||
| Recoveries |
72 | 22 | 45 | |||||||||
| Balance, end of period |
$ | 3,920 | $ | 3,352 | $ | 2,606 | ||||||
The allowance for loan losses and recorded investment in loans as of December 31, 2010 is as follows.
| For the Year Ended December 31, 2010 | ||||||||||||||||||||||||||||||||
| (dollars in thousands) |
One- to Four-Family First Mortgage |
Home Equity Loans and Lines |
Commercial Real Estate |
Construction and Land |
Multi- Family Residential |
Other Commercial |
Other Consumer |
Total | ||||||||||||||||||||||||
| Allowance for Credit Losses: |
||||||||||||||||||||||||||||||||
| Beginning Balance |
$ | 383 | $ | 351 | $ | 961 | $ | 670 | $ | 38 | $ | 738 | $ | 211 | $ | 3,352 | ||||||||||||||||
| Charge-offs |
(37 | ) | (136 | ) | (66 | ) | — | — | (106 | ) | (24 | ) | (369 | ) | ||||||||||||||||||
| Recoveries |
27 | — | 7 | — | — | — | 38 | 72 | ||||||||||||||||||||||||
| Provision |
268 | 81 | 356 | (4 | ) | 8 | 114 | 42 | 865 | |||||||||||||||||||||||
| Ending Balance |
$ | 641 | $ | 296 | $ | 1,258 | $ | 666 | $ | 46 | $ | 746 | $ | 267 | $ | 3,920 | ||||||||||||||||
| Individually evaluated for impairment |
$ | 20 | $ | — | $ | — | $ | 88 | $ | — | $ | 281 | $ | 5 | $ | 394 | ||||||||||||||||
| Collectively evaluated for impairment |
$ | 331 | $ | 586 | $ | 1,258 | $ | 578 | $ | 46 | $ | 465 | $ | 262 | $ | 3,526 | ||||||||||||||||
| Loans acquired with deteriorated credit quality |
$ | — | $ | — | $ | — | $ | — | $ | — | $ | — | $ | — | $ | — | ||||||||||||||||
| Loans: |
||||||||||||||||||||||||||||||||
| Ending Balance |
$ | 122,614 | $ | 30,915 | $ | 150,824 | $ | 57,538 | $ | 5,718 | $ | 48,410 | $ | 23,892 | $ | 439,911 | ||||||||||||||||
| Individually evaluated for impairment |
$ | 216 | $ | — | $ | 922 | $ | 207 | $ | — | $ | 340 | $ | 5 | $ | 1,690 | ||||||||||||||||
| Collectively evaluated for impairment |
$ | 104,941 | $ | 24,898 | $ | 115,024 | $ | 44,970 | $ | 4,493 | $ | 41,907 | $ | 21,541 | $ | 357,774 | ||||||||||||||||
| Loans acquired with deteriorated credit quality |
$ | 17,457 | $ | 6,017 | $ | 34,878 | $ | 12,361 | $ | 1,225 | $ | 6,163 | $ | 2,346 | $ | 80,447 | ||||||||||||||||
65
Table of Contents
Although the Company has a diversified loan portfolio, a substantial portion of the loan portfolio is collateralized by improved and unimproved real estate and is dependent on the real estate market.
Credit quality indicators on the Company’s Noncovered Loan portfolio as of December 31, 2010 are as follows:
| (dollars in thousands) |
Pass | Special Mention |
Substandard | Doubtful | Total | |||||||||||||||
| One- to four-family first mortgage |
$ | 102,872 | $ | 1,543 | $ | 742 | $ | — | $ | 105,157 | ||||||||||
| Home equity loans and lines |
24,815 | 46 | 37 | — | 24,898 | |||||||||||||||
| Commercial real estate |
111,739 | 3,286 | 921 | — | 115,946 | |||||||||||||||
| Construction and land |
43,399 | 1,559 | 219 | — | 45,177 | |||||||||||||||
| Multi-family residential |
4,493 | — | — | — | 4,493 | |||||||||||||||
| Commercial |
38,467 | 3,400 | 380 | — | 42,247 | |||||||||||||||
| Consumer |
21,470 | 40 | 36 | — | 21,546 | |||||||||||||||
| Total loans |
$ | 347,255 | $ | 9,874 | $ | 2,335 | $ | — | $ | 359,464 | ||||||||||
The above classifications follow regulatory guidelines and can generally be described as follows: pass loans are of satisfactory quality, special mention loans have a potential weakness or risk that may result in the deterioration of future repayment, substandard loans are inadequately protected by the current net worth and paying capacity of the borrower or of the collateral pledged (these loans have a well defined weakness and there is a distinct possibility that the Company will sustain some loss); doubtful loans, based on existing circumstances, have weaknesses that make collection or liquidation in full highly questionable and improbable. In addition, residential loans are classified using an inter-regulatory agency methodology that incorporates the extent of the delinquency and the loan-to-value ratios. These classifications were the most current available as of December 31, 2010 and were generally updated within the last twelve months. Covered loans are excluded from the schedule of credit quality indicators due to reduced loss exposure resulting from the FDIC loss sharing agreements.
Age analysis of past due Noncovered Loans as of December 31, 2010 is as follows.
| (dollars in thousands) |
30-59 Days Past Due |
60-89 Days Past Due |
Greater Than 90 Days Past Due |
Total Past Due |
Current Loans |
Total Loans |
||||||||||||||||||
| Real estate loans: |
||||||||||||||||||||||||
| One- to four-family first mortgage |
$ | 3,413 | $ | 234 | $ | 277 | $ | 3,924 | $ | 101,233 | $ | 105,157 | ||||||||||||
| Home equity loans and lines |
196 | 22 | — | 218 | 24,680 | 24,898 | ||||||||||||||||||
| Commercial real estate |
443 | — | 408 | 851 | 115,095 | 115,946 | ||||||||||||||||||
| Construction and land |
94 | 207 | 12 | 313 | 44,864 | 45,177 | ||||||||||||||||||
| Multi-family residential |
— | — | — | — | 4,493 | 4,493 | ||||||||||||||||||
| Total real estate loans |
4,146 | 463 | 697 | 5,306 | 290,365 | 295,671 | ||||||||||||||||||
| Other loans: |
||||||||||||||||||||||||
| Commercial |
334 | 289 | 351 | 974 | 41,273 | 42,247 | ||||||||||||||||||
| Consumer |
192 | 71 | 8 | 271 | 21,275 | 21,546 | ||||||||||||||||||
| Total other loans |
526 | 360 | 359 | 1,245 | 62,548 | 63,793 | ||||||||||||||||||
| Total loans |
$ | 4,672 | $ | 823 | $ | 1,056 | $ | 6,551 | $ | 352,913 | $ | 359,464 | ||||||||||||
As of December 31, 2010, the Company did not have any loans greater than 90 days past due and accruing.
66
Table of Contents
The following is a summary of information pertaining to impaired Noncovered Loans as of the dates indicated.
| December 31, | ||||||||||||
| (dollars in thousands) |
2010 | 2009 | 2008 | |||||||||
| Impaired loans without a valuation allowance |
$ | 1,150 | $ | 1,829 | $ | 1,050 | ||||||
| Impaired loans with a valuation allowance |
540 | 958 | 443 | |||||||||
| Total impaired loans |
1,690 | 2,787 | 1,493 | |||||||||
| Valuation allowance related to impaired loans |
394 | 472 | 122 | |||||||||
| Average investment in impaired loans |
$ | 2,008 | $ | 2,142 | $ | 1,360 | ||||||
| Interest income recognized on impaired loans |
82 | 116 | 62 | |||||||||
| Nonaccrual loans |
1,056 | 1,278 | 1,427 | |||||||||
| Accruing loans more than 90 days past due |
— | — | — | |||||||||
| For the Year Ended December 31, 2010 | ||||||||||||||||||||
| (dollars in thousands) |
Recorded Investment |
Unpaid Principal Balance |
Related Allowance |
Average Recorded Investment |
Interest Income Recognized |
|||||||||||||||
| With no related allowance recorded: |
||||||||||||||||||||
| One- to four-family first mortgage |
$ | 176 | $ | 176 | $ | — | $ | 475 | $ | — | ||||||||||
| Home equity loans and lines |
— | — | — | 47 | — | |||||||||||||||
| Commercial real estate |
922 | 922 | — | 589 | 53 | |||||||||||||||
| Construction and land |
— | — | — | 11 | — | |||||||||||||||
| Multi-family residential |
— | — | — | — | — | |||||||||||||||
| Commercial |
52 | 52 | — | 67 | 1 | |||||||||||||||
| Consumer |
— | — | — | 34 | — | |||||||||||||||
| Total |
$ | 1,150 | $ | 1,150 | $ | — | $ | 1,223 | $ | 54 | ||||||||||
| With an allowance recorded: |
||||||||||||||||||||
| One- to four-family first mortgage |
$ | 39 | $ | 39 | $ | 20 | $ | 87 | $ | 2 | ||||||||||
| Home equity loans and lines |
— | — | — | 149 | — | |||||||||||||||
| Commercial real estate |
— | — | — | — | — | |||||||||||||||
| Construction and land |
207 | 207 | 88 | 201 | 17 | |||||||||||||||
| Multi-family residential |
— | — | — | — | — | |||||||||||||||
| Commercial |
289 | 289 | 281 | 332 | 9 | |||||||||||||||
| Consumer |
5 | 5 | 5 | 16 | — | |||||||||||||||
| Total |
$ | 540 | $ | 540 | $ | 394 | $ | 785 | $ | 28 | ||||||||||
| Total impaired loans: |
||||||||||||||||||||
| One- to four-family first mortgage |
$ | 216 | $ | 216 | $ | 20 | $ | 562 | $ | 2 | ||||||||||
| Home equity loans and lines |
— | — | — | 196 | — | |||||||||||||||
| Commercial real estate |
922 | 922 | — | 589 | 53 | |||||||||||||||
| Construction and land |
207 | 207 | 88 | 212 | 17 | |||||||||||||||
| Multi-family residential |
— | — | — | — | — | |||||||||||||||
| Commercial |
340 | 340 | 281 | 399 | 10 | |||||||||||||||
| Consumer |
5 | 5 | 5 | 50 | — | |||||||||||||||
| Total |
$ | 1,690 | $ | 1,690 | $ | 394 | $ | 2,008 | $ | 82 | ||||||||||
67
Table of Contents
A summary of information pertaining to nonaccrual Noncovered Loans as of December 31, 2010 is as follows.
| (dollars in thousands) |
2010 | |||
| Nonaccrual loans: |
||||
| One- to four-family first mortgage |
$ | 277 | ||
| Home equity loans and lines |
— | |||
| Commercial real estate |
408 | |||
| Construction and land |
12 | |||
| Commercial |
351 | |||
| Consumer |
8 | |||
| Total |
$ | 1,056 | ||
As of December 31, 2010, the Company was not committed to lend additional funds to any customer whose loan was classified as impaired.
As of December 31, 2010 and 2009, the Company had accrued interest receivable for loans of $2,263,000 and $1,584,000, respectively.
6. Loan Servicing
Mortgage loans sold to and serviced for others are not included in the accompanying statements of financial condition. The unpaid principal balances of these loans as of December 31 of the years indicated are summarized as follows.
| (dollars in thousands) |
2010 | 2009 | 2008 | |||||||||
| Mortgage loans sold to Federal Home Loan Mortgage Corporation without recourse |
$ | 8,043 | $ | 10,566 | $ | 13,409 | ||||||
| Mortgage loans sold to Federal National Mortgage Association without recourse |
23,116 | 13,481 | 2,561 | |||||||||
| Balance, end of period |
$ | 31,159 | $ | 24,047 | $ | 15,970 | ||||||
The Company records servicing assets related to mortgage loans sold and serviced at fair value and will amortize these servicing assets over the period estimated net servicing income associated with each loan. Activity related to servicing assets for the years ended December 31, 2010 and 2009 is summarized as follows.
| (dollars in thousands) |
2010 | 2009 | ||||||
| Balance at the beginning of the year |
$ | 78 | $ | 19 | ||||
| Recognition of servicing assets from the transfer of financial assets |
112 | 90 | ||||||
| Amortization |
(45 | ) | (31 | ) | ||||
| Balance, end of period |
$ | 145 | $ | 78 | ||||
Custodial and escrow account balances maintained in connection with the foregoing loan servicing arrangements were $115,000 and $104,000 as of December 31, 2010 and 2009, respectively.
68
Table of Contents
7. Office Properties and Equipment
Office properties and equipment consisted of the following as of December 31 of the years indicated.
| (dollars in thousands) |
2010 | 2009 | ||||||
| Land |
$ | 6,667 | $ | 4,544 | ||||
| Buildings and improvements |
17,951 | 13,157 | ||||||
| Furniture and equipment |
7,897 | 6,568 | ||||||
| Total office properties and equipment |
32,515 | 24,269 | ||||||
| Less accumulated depreciation |
9,143 | 8,082 | ||||||
| Total office properties and equipment, net |
$ | 23,372 | $ | 16,187 | ||||
Depreciation expense for the years ended December 31, 2010, 2009 and 2008 was $1,099,000, $886,000 and $814,000, respectively.
8. Goodwill and Intangibles
The carrying amount of goodwill as of December 31, 2010 was $560,000 as the result of the Statewide acquisition on March 12, 2010. There was no goodwill or other intangibles recorded previously.
A summary of core deposit intangible assets as of December 31, 2010 is as follows.
| (dollars in thousands) |
2010 | |||
| Gross carrying amount |
$ | 1,429 | ||
| Less accumulated depreciation |
(208 | ) | ||
| Total core deposit intangible asset |
$ | 1,221 | ||
Amortization expense on the core deposit intangible assets for the year ended December 31, 2010 was $208,000.
9. Deposits
Deposits consisted of the following major classifications as of December 31 of the years indicated.
| (dollars in thousands) |
2010 | 2009 | ||||||
| Demand deposit accounts |
$ | 100,579 | $ | 66,956 | ||||
| Savings |
29,258 | 21,009 | ||||||
| Money market accounts |
133,245 | 80,810 | ||||||
| NOW accounts |
68,398 | 48,384 | ||||||
| Certificates of deposit |
221,738 | 154,434 | ||||||
| Total deposits |
$ | 553,218 | $ | 371,593 | ||||
As of December 31, 2010, the scheduled maturities of certificates of deposit are as follows.
| (dollars in thousands) |
Amount | |||
| 2011 |
$ | 156,975 | ||
| 2012 |
47,960 | |||
| 2013 |
8,435 | |||
| 2014 |
1,924 | |||
| 2015 |
2,149 | |||
| Thereafter |
4,295 | |||
| Total certificates of deposit |
$ | 221,738 | ||
69
Table of Contents
As of December 31, 2010 and 2009, the aggregate amount of certificates of deposit with balances of $100,000 or more was $92,170,000 and $64,022,000, respectively.
10. Short-term FHLB Advances
The Company did not have any short-term FHLB advances outstanding as of December 31, 2010 or December 31, 2009. These advances, which mature within one year, had a weighted average rate of 0.19% and 1.01% for the years ended December 31, 2010 and 2009, respectively. For the years ended December 31, 2010 and 2009, the average volume of short-term FHLB advances carried by the Company was $3,887,000 and $3,778,000, respectively.
Collateral for short and long-term FHLB advances is secured through a blanket lien evidenced by the Bank’s pledge of first mortgage collateral, demand deposit accounts, capital stock and certain other assets pursuant to the “Advances, Collateral Pledge and Security Agreement.” Under this collateral pledge agreement, the Bank must meet all statutory and regulatory capital standards and must meet all FHLB credit underwriting standards. Management believes that the Bank was in compliance with all such requirements as of December 31, 2010 and 2009.
As of December 31, 2010 and 2009, the Bank had $253,536,000 and $205,712,000, respectively, of additional FHLB advances available.
11. Long-term FHLB Advances
As of December 31, 2010 and 2009, long-term FHLB advances totaled $13,000,000 and $16,774,000, respectively. These advances had weighted average rates of 3.34% and 3.60% for the years ended December 31, 2010 and 2009, respectively. The following table summarizes this debt as of December 31, 2010.
| (dollars in thousands) |
Amount | Weighted Average Rate |
||||||
| Fixed rate advances maturing in: |
||||||||
| 2011 |
$ | — | — | % | ||||
| 2012 |
1,000 | 2.75 | ||||||
| 2013 |
— | — | ||||||
| 2014 |
2,000 | 2.46 | ||||||
| 2015 and thereafter |
10,000 | 3.22 | ||||||
| Total long-term FHLB advances |
$ | 13,000 | 3.07 | % | ||||
70
Table of Contents
12. Income Taxes
The Company files federal income tax returns on a calendar year basis. Income tax expense for the years indicated is summarized as follows.
| (dollars in thousands) |
2010 | 2009 | 2008 | |||||||||
| Current |
$ | 2,961 | $ | 3,405 | $ | 2,332 | ||||||
| Deferred |
(617 | ) | (1,096 | ) | (1,162 | ) | ||||||
| Total income tax expense |
$ | 2,344 | $ | 2,309 | $ | 1,170 | ||||||
The components of the Company’s net deferred tax asset as of December 31 of the years indicated are as follows.
| (dollars in thousands) |
2010 | 2009 | ||||||
| Deferred tax assets (liabilities): |
||||||||
| FHLB stock dividends |
$ | (7 | ) | $ | (26 | ) | ||
| Loan loss reserves |
1,093 | 720 | ||||||
| Accumulated depreciation |
(518 | ) | (446 | ) | ||||
| Intangible assets |
35 | — | ||||||
| Unrealized (gain) loss on securities available for sale |
(357 | ) | 45 | |||||
| Mortgage servicing rights |
(49 | ) | (26 | ) | ||||
| Deferred compensation |
214 | 184 | ||||||
| Stock-based compensation |
384 | 291 | ||||||
| Other-than-temporary impairment of securities |
1,409 | 1,414 | ||||||
| Other |
51 | 53 | ||||||
| Deferred tax asset |
$ | 2,255 | $ | 2,209 | ||||
For the years ended December 31, 2010, 2009 and 2008, the provision for federal income taxes differed from the amount computed by applying the federal income tax statutory rate of 34% on income from operations as indicated in the following analysis:
| (dollars in thousands) |
2010 | 2009 | 2008 | |||||||||
| Federal tax based on statutory rate |
$ | 2,391 | $ | 2,376 | $ | 1,321 | ||||||
| State tax based on statutory rate |
39 | 84 | — | |||||||||
| Decrease resulting from: |
||||||||||||
| Effect of tax-exempt income |
(18 | ) | (19 | ) | (48 | ) | ||||||
| Tax credits |
— | (23 | ) | (91 | ) | |||||||
| Other |
(68 | ) | (109 | ) | (12 | ) | ||||||
| Income tax expense |
$ | 2,344 | $ | 2,309 | $ | 1,170 | ||||||
| Effective tax rate |
33.3 | % | 33.0 | % | 30.1 | % | ||||||
Retained earnings as of December 31, 2010, December 31, 2009 and December 31, 2008, included $5,837,000 for which no deferred federal income tax liability has been recognized. This amount represents an allocation of income to bad debt deductions for tax purposes only. Reductions of amounts so allocated for purposes other than bad debt losses would create income for tax purposes only, which would be subject to the then-current federal statutory income tax rate. The unrecorded deferred income tax liability on the above amount was $1,985,000 as of December 31, 2010, 2009 and 2008. Current accounting standards do not require the accrual of this deferred tax amount to be recorded unless it is probable that the reserve (for tax purposes) will be significantly depleted by loan losses deductible for tax purposes in the future. Based on current estimates of losses within the Company’s loan portfolio, accrual of the deferred tax liability associated with this reserve was not required as of December 31, 2010, 2009 and 2008.
71
Table of Contents
13. Commitments and Contingencies
Standby letters of credit represent commitments by the Bank to meet the obligations of certain customers if called upon. As of December 31, 2010 and 2009, outstanding standby letters of credit were approximately $1,190,000 and $730,000, respectively.
Additionally, in the normal course of business, there were various other commitments and contingent liabilities which are not reflected in the financial statements. Loan commitments are single-purpose commitments to lend which will be funded and reduced according to specified repayment schedules. Most of these commitments have maturities of less than one year. Loan commitments outstanding were approximately $85,100,000 and $45,100,000 as of December 31, 2010 and 2009, respectively. Unused availability under outstanding lines-of-credit was approximately $39,225,000 and $28,161,000 as of December 31, 2010 and 2009, respectively. The Bank uses the same credit policies in making commitments as it does for on-balance-sheet instruments. The Bank normally secures its outstanding standby letters of credit with deposits from the customer. The Bank evaluates each customer’s creditworthiness on a case-by-case basis. The amount of collateral obtained, if deemed necessary by the Bank upon extension of credit, is based on management’s credit evaluation of the customer. Collateral held varies but may include certificates of deposit, property, plant and equipment and income-producing properties. There are no commitments which present an unusual risk to the Bank, and no material losses are anticipated as a result of these transactions.
14. Regulatory Matters
The Bank is subject to regulatory capital requirements administered by the OTS. Failure to meet minimum capital requirements can initiate certain mandatory and possibly additional discretionary actions by regulators that, if undertaken, could have a direct material effect on the Company’s financial statements. Under capital adequacy guidelines and the regulatory framework for prompt corrective action, the Bank must meet specific capital guidelines that involve quantitative measures of its assets, liabilities and certain off-balance sheet items as calculated under regulatory accounting practices. The Bank’s capital amounts and classification are also subject to qualitative judgments by the regulators about components, risk weightings and other factors.
Dividends paid by the Bank are the primary source of funds available to the Company. Banking regulations limit the amount of dividends that may be paid without prior approval of the regulatory authorities. These restrictions for the Bank are based on the level of regulatory classified assets, prior year’s earnings, and the ratio of equity capital to total assets. The Bank may not declare dividends during 2011 without prior regulatory approval.
Quantitative measures established by regulation to ensure capital adequacy require the Bank to maintain minimum amounts and ratios (set forth in the table below) of total and Tier 1 capital (as defined) to average assets and risk-weighted assets (as defined). Management believes, as of December 31, 2010, that the Bank meets all capital adequacy requirements to which it is subject.
As of December 31, 2010, the most recent notification from the OTS categorized the Bank as “well capitalized” under the OTS regulatory classification framework. To be categorized as “well capitalized,” the Bank must maintain minimum total risk-based, Tier 1 risk-based, Tier 1 leverage and tangible capital ratios as set forth in the following table. There are no conditions or events since that notification that management believes have changed the Bank’s category.
72
Table of Contents
The Bank’s actual capital amounts and ratios are also presented in the following table.
| (dollars in thousands) |
Actual | Minimum For Capital Adequacy Purposes |
To Be Well Capitalized Under Prompt Corrective Action Provisions |
|||||||||||||||||||||
| December 31, 2010 |
||||||||||||||||||||||||
| Tier 1 risk-based capital |
$ | 105,544 | 22.85 | % | $ | 17,665 | 4.0 | % | $ | 26,498 | 6.0 | % | ||||||||||||
| Total risk-based capital |
104,447 | 23.65 | % | 35,331 | 8.0 | % | 44,163 | 10.0 | % | |||||||||||||||
| Tier 1 leverage capital |
105,544 | 15.46 | % | 27,312 | 4.0 | % | 34,141 | 5.0 | % | |||||||||||||||
| Tangible capital |
105,544 | 15.46 | % | 10,242 | 1.5 | % | N/A | N/A | ||||||||||||||||
| December 31, 2009 |
||||||||||||||||||||||||
| Tier 1 risk-based capital |
$ | 101,520 | 29.86 | % | $ | 12,972 | 4.0 | % | $ | 19,457 | 6.0 | % | ||||||||||||
| Total risk-based capital |
99,697 | 30.74 | % | 25,943 | 8.0 | % | 32,429 | 10.0 | % | |||||||||||||||
| Tier 1 leverage capital |
101,520 | 20.24 | % | 20,067 | 4.0 | % | 25,084 | 5.0 | % | |||||||||||||||
| Tangible capital |
101,520 | 20.24 | % | 7,525 | 1.5 | % | N/A | N/A | ||||||||||||||||
15. Benefit Plans
401(k) Match and Profit Sharing Plan
The Company’s 401(k) defined contribution plan allows its participants to contribute up to 75% of their pretax earnings on a tax-deferred basis up to the statutory limit, and the Company contributes a matching contribution on behalf of plan participants limited to 4% of the employees’ salaries. During 2008, the Company contributed an amount equal to 5.25% of each eligible employee’s salary, on their behalf, to the profit sharing plan. No such contribution was made in 2010 or 2009 due to the establishment of the employee stock ownership plan (“ESOP”). For the years ended December 31, 2010, December 31, 2009, and December 31, 2008, the Company made contributions of $241,000 $217,000 and $469,000, respectively, in connection with the plans, which is included in compensation and benefits expense in the accompanying statements of income.
Employee Stock Ownership Plan
In 2008, the Company established an ESOP for the benefit of all eligible employees of the Company. The leveraged ESOP is accounted for in accordance with the requirements of ASC 718, Compensation – Stock Compensation.
Employees of the Bank who have been employed for a six-month period and who have attained age 21 are eligible to participate in the ESOP. It is anticipated that contributions will be made to the plan in amounts necessary to amortize the debt to the Company over a period of 20 years.
Under ASC 718, unearned ESOP shares are not considered outstanding and are shown as a reduction of shareholders’ equity as unearned compensation. Dividends on unallocated ESOP shares are considered to be compensation expense. The Company recognizes compensation cost equal to the fair value of the ESOP shares during the periods in which they are committed to be released. To the extent that the fair value of the Company’s ESOP shares differ from the cost of such shares, the differential is credited to shareholders’ equity. The Company receives a tax deduction equal to the cost of the shares released. As the loan is internally leveraged, the loan receivable from the ESOP to the Company is not reported as an asset nor is the debt of the ESOP shown as a Company liability.
73
Table of Contents
Compensation cost related to the ESOP was $474,000 and $405,000 for the years ended December 31, 2010 and 2009, respectively. The fair value of the unearned ESOP shares, using the closing quoted market price per share as of year-end, was approximately $8,759,000 and $8,161,000 as of December 31, 2010 and 2009, respectively. A summary of the ESOP share allocation as of December 31, 2010 follows.
| Shares allocated, beginning of year |
44,635 | |||
| Shares allocated during the year |
35,708 | |||
| Shares distributed during the year |
(218 | ) | ||
| Allocated shares held by ESOP trust as of year end |
80,125 | |||
| Unallocated shares |
633,807 | |||
| Total ESOP shares |
713,932 | |||
Salary Continuation Agreements
As a supplement to its 401(k) retirement plan, the Bank has entered into nonqualified salary continuation agreements with two executive officers of the Bank. Under his salary continuation agreement, the Chief Executive Officer (“CEO”) will be entitled to a stated annual benefit for a period of ten years upon retirement from the Bank after attaining age 62. Benefits under the agreement vest over ten years, with 50% of this benefit having vested in 2007. In the event of early retirement, the Bank shall pay the CEO his vested benefits in 120 equal monthly installments upon his attaining age 62. Upon death during active service, the Bank shall distribute to the executive’s beneficiary an amount equal to two times his fully vested normal retirement benefit, payable in monthly installments over five years.
In the event of a separation from service within 24 months following a change in control but prior to normal retirement age, the Bank shall distribute to the CEO his fully vested annual benefit in 12 equal monthly installments for ten years beginning the earlier of 24 months after separation from service or age 62. If separation from service occurs more than 24 months following a change in control, the annual benefit shall be distributed beginning at age 62.
The Bank’s nonqualified salary continuation agreement with its Chief Lending Officer provides that the executive will be entitled to a stated annual benefit for a period of ten years upon retirement from the Bank after attaining age 65, distributed monthly. In the event of early retirement, the Bank shall pay the executive his vested benefits in 120 equal monthly installments upon attaining age 65. Upon death during active service, the Bank shall distribute the fully vested normal retirement benefit to the executive’s beneficiary in 120 monthly installments. In the event of a separation from service within 24 months following a change in control but prior to normal retirement age, the Bank shall distribute to the executive the vested portion of the annual benefit in a lump sum on the first day of the month following the separation from service. Benefits are subject to a six-month delay to the extent required by applicable law. The Company had an outstanding liability totaling $628,000 and $542,000 as of December 31, 2010 and 2009, respectively, in connection with the agreements.
16. Stock-based Payment Arrangements
The Company’s shareholders approved the 2009 Stock Option Plan (“SOP”) and the 2009 Recognition and Retention Plan (“RRP”) on May 12, 2009 to provide incentives and awards for directors, officers and other key employees of the Company and its subsidiary. These plans are administered by a committee appointed by the Board of Directors, which selects persons eligible to receive awards and determines the number of shares and/or options subject to each award, the terms, conditions and other provisions of the awards. In accordance with the requirements of ASC 718, the Company adopted a fair value based method of accounting for employee stock compensation plans, whereby compensation cost is measured as of the grant date based on the fair value of the award and is recognized over the service period, which is usually the vesting period.
74
Table of Contents
Stock Option Plan
The Company issues stock options under the SOP to directors, officers and other key employees. The option exercise price cannot be less than the fair value of the underlying common stock as of the date of the option grant and the maximum option term cannot exceed ten years. The stock options granted were issued with vesting periods of five years. The maximum number of shares issuable under the SOP is 892,687, subject to adjustment. As of December 31, 2010, options to acquire 819,080 shares were outstanding under SOP.
The fair value of each option granted is estimated on the grant date using the Black-Scholes option pricing model. This model requires management to make certain assumptions, including the expected life of the option, the risk-free rate of interest, the expected volatility and the expected dividend yield. The following assumptions were made in estimating 2010 fair values:
| Expected dividends |
1.5 | % | ||
| Expected volatility |
35.8 | % | ||
| Risk-free interest rate |
2.5 | % | ||
| Expected term (in years) |
6.5 |
As of December 31, 2010, there was $1,981,000 of unrecognized compensation cost related to stock options which is expected to be recognized over a period of 3.4 years.
For the years ended December 31, 2010 and 2009, the Company recognized $594,000 and $364,000, respectively, in compensation cost related to stock options, which is included in compensation and benefits expense in the accompanying consolidated statements of income.
The following table represents stock option activity for the year ended December 31, 2010.
| Options |
Number of Options |
Weighted- Average Exercise Price |
Weighted- Average Grant Date Fair Value |
Weighted- Average Remaining Contractual Term (Years) |
Aggregate Intrinsic Value |
|||||||||||||||
| Outstanding as of January 1, 2010 |
815,080 | $ | 11.45 | $ | 3.74 | |||||||||||||||
| Forfeited |
(7,000 | ) | 11.45 | 3.74 | ||||||||||||||||
| Granted |
11,000 | 12.74 | 4.32 | |||||||||||||||||
| Outstanding as of December 31, 2010 |
819,080 | $ | 11.47 | $ | 3.75 | 8.4 | $ | 1,927,000 | ||||||||||||
| Exercisable as of December 31, 2010 |
161,616 | $ | 11.45 | $ | 3.74 | 8.4 | $ | 383,000 | ||||||||||||
Recognition and Retention Plan
The Company issues restricted stock under the RRP to directors, officers and other key employees. A total of 357,075 shares of the Company’s outstanding common stock, or 4% of total shares outstanding at the time the RRP was implemented, were approved for restricted stock awards under the RRP. During 2009, the Company purchased in the open market all shares required to fund the RRP at an average cost of $11.81 per share. As of December 31, 2010, the cost of such shares held by the RRP totaled $3,432,000, which is included in the Company’s unallocated common stock held by the RRP in the consolidated statements of financial condition.
The RRP allows for the issuance of restricted stock awards that may not be sold or otherwise transferred until certain restrictions have lapsed. The holders of the restricted stock have the right to vote the shares as awards are earned. The unearned compensation related to these awards is amortized to compensation expense over the five-year vesting period. The total share-based compensation expense for these awards is determined based on the market price of the Company’s common stock as of the date of grant applied to the total number of shares granted and is amortized over the vesting period. As of December 31, 2010, unearned share-based compensation associated with these awards totaled $2,627,000.
For the years ended December 31, 2010 and 2009, the Company recognized $766,000 and $493,000, respectively, in compensation cost related to restricted stock grants, which is included in compensation and benefits expense in the accompanying consolidated financial statements.
75
Table of Contents
The following table represents unvested restricted stock activity for the year ended December 31, 2010.
| Number of Shares |
Weighted- Average Grant Date Fair Value |
|||||||
| Balance, beginning of year |
335,600 | $ | 11.45 | |||||
| Granted |
6,000 | 12.89 | ||||||
| Forfeited |
(3,000 | ) | 11.45 | |||||
| Vested |
(66,520 | ) | 11.45 | |||||
| Balance, end of period |
272,080 | $ | 11.48 | |||||
17. Earnings Per Share
Earnings per common share was computed based on the following:
| Years Ended December 31, | ||||||||||||
| (in thousands, except per share data) |
2010 | 2009 | 2008 | |||||||||
| Numerator: |
||||||||||||
| Income applicable to common shares |
$ | 4,688 | $ | 4,680 | $ | 2,716 | ||||||
| Denominator: |
||||||||||||
| Weighted average common shares outstanding |
7,521 | 8,031 | 2,054 | |||||||||
| Effect of dilutive securities: |
||||||||||||
| Restricted stock |
66 | 21 | — | |||||||||
| Weighted average common shares outstanding - assuming dilution |
7,587 | 8,052 | 2,054 | |||||||||
| Earnings per common share |
$ | 0.62 | $ | 0.58 | 1.32 | |||||||
| Earnings per common share - assuming dilution |
$ | 0.62 | $ | 0.58 | 1.32 | |||||||
Options on 819,080 and 815,080 shares of common stock were not included in computing diluted earnings per share for the year ended December 31, 2010 and 2009, respectively, because the effect of these shares were anti-dilutive. The options did not have an anti-dilutive effect on diluted earnings per share for the year ended December 31, 2008. The Company completed its initial public stock offering on October 2, 2008; thus, the denominator used in the earnings per share calculations for 2008 is lower than it would have been had the shares been outstanding for a full year.
18. Other Comprehensive Income (Loss)
The following is a summary of the changes in the components of other comprehensive income (loss):
| Years Ended December 31, | ||||||||||||
| (dollars in thousands) |
2010 | 2009 | 2008 | |||||||||
| Balance as of beginning of year , net |
$ | (88 | ) | $ | (5,312 | ) | $ | 44 | ||||
| Change in unrealized gain (loss) on securities available for sale |
4 | 7,092 | (10,948 | ) | ||||||||
| Reclassification adjustment for realized gain on securities sold |
(50 | ) | — | — | ||||||||
| Reclassification adjustment for net losses realized in net income |
1,229 | 1,888 | 2,833 | |||||||||
| Reclassification adjustment for cumulative effect adjustment |
— | (1,065 | ) | — | ||||||||
| Change in net unrealized gain (loss) |
1,183 | 7,915 | (8,115 | ) | ||||||||
| Tax effect |
(402 | ) | (2,691 | ) | 2,759 | |||||||
| Net of tax change |
781 | 5,224 | (5,356 | ) | ||||||||
| Balance in other comprehensive income (loss), net of income taxes |
$ | 693 | $ | (88 | ) | $ | (5,312 | ) | ||||
76
Table of Contents
19. Related Party Transactions
Certain directors and officers of the Company have been customers of the Company for several years. Loan transactions with directors, officers and employees are made on the same terms as those prevailing at the time for comparable loans to other persons. Loans outstanding to directors, executive officers and their affiliates totaled $6,714,000 and $7,562,000 as of December 31, 2010 and 2009, respectively. A summary of these related party loans during 2010 follows.
| (dollars in thousands) |
2010 | |||
| Balance, beginning of year |
$ | 7,562 | ||
| New loans |
230 | |||
| Repayments, net |
(1,078 | ) | ||
| Balance, end of year |
$ | 6,714 | ||
None of the related party loans were identified as impaired or exceeded 5% of shareholders’ equity for the years ended 2010 or 2009.
Related party deposit accounts totaled $4,980,000 and $4,385,000 as of December 31, 2010 and 2009, respectively.
20. Fair Value Disclosures
The Company groups its financial assets and liabilities measured at fair value in three levels as required by the ASC 820, Fair Value Measurements and Disclosures. Under this guidance, fair value should be based on the assumptions market participants would use when pricing the asset or liability and establishes a fair value hierarchy that prioritizes the inputs used to develop those assumptions and measure fair value. The hierarchy requires companies to maximize the use of observable inputs and minimize the use of unobservable inputs. The three levels of inputs used to measure fair value are as follows:
| • | Level 1 – Quoted prices in active markets for identical assets or liabilities. |
| • | Level 2 – Observable inputs other than quoted prices included in Level 1, such as quoted prices for similar assets and liabilities in active markets; quoted prices for identical or similar assets and liabilities in markets that are not active; or other inputs that are observable or can be corroborated by observable market data. |
| • | Level 3 – Unobservable inputs that are supported by little or no market activity and that are significant to the fair value of the assets or liabilities. This includes certain pricing models, discounted cash flow methodologies and similar techniques that use significant unobservable inputs. |
An asset’s or liability’s categorization within the fair value hierarchy is based upon the lowest level of input that is significant to the fair value measurement. Management reviews and updates the fair value hierarchy classifications of the Company’s assets and liabilities on a quarterly basis.
Recurring Basis
Investment Securities Available for Sale
Fair values of investment securities available for sale were primarily measured using information from a third-party pricing service. This pricing service provides pricing information by utilizing evaluated pricing models supported with market data information. Standard inputs include benchmark yields, reported trades, broker/dealer quotes, issuer spreads, benchmark securities, bids, offers and reference data from market research publications. If quoted prices were available in an active market, investment securities were classified as Level 1 measurements. If quoted prices were not available in an active market, fair values were estimated primarily by the use of pricing models. Level 2 investment securities were primarily comprised of mortgage-backed securities issued by government agencies and U.S. government-sponsored enterprises. In certain cases, where there was limited or less transparent information provided by the Company’s third-party pricing service, fair value was estimated by the use of secondary pricing services or through the use of non-binding third-party broker quotes. Investment securities are classified within Level 3 when little or no market activity supports the fair value.
77
Table of Contents
Management primarily identifies investment securities which may have traded in illiquid or inactive markets by identifying instances of a significant decrease in the volume and frequency of trades, relative to historical levels, as well as instances of a significant widening of the bid-ask spread in the brokered markets. Investment securities that are deemed to have been trading in illiquid or inactive markets may require the use of significant unobservable inputs. For example, management may use quoted prices for similar investment securities in the absence of a liquid and active market for the investment securities being valued. As of December 31, 2010, management did not make adjustments to prices provided by the third-party pricing service as a result of illiquid or inactive markets.
The following tables present the balances of assets and liabilities measured on a recurring basis as of December 31, 2010 and 2009.
| Fair Value Measurements Using | ||||||||||||||||
| (dollars in thousands) |
December 31, 2010 |
Quoted Prices in Active Markets for Identical Assets (Level 1) |
Significant Other Observable Inputs (Level 2) |
Significant Unobservable Inputs (Level 3) |
||||||||||||
| Available for sale securities: |
||||||||||||||||
| U.S. agency mortgage-backed |
$ | 85,335 | $ | — | $ | 85,335 | $ | — | ||||||||
| Non-U.S. agency mortgage-backed |
20,451 | — | 17,216 | 3,235 | ||||||||||||
| U.S. government agency |
6,176 | — | 6,176 | — | ||||||||||||
| Fair Value Measurements Using | ||||||||||||||||
| (dollars in thousands) |
December 31, 2009 |
Quoted Prices in Active Markets for Identical Assets (Level 1) |
Significant Other Observable Inputs (Level 2) |
Significant Unobservable Inputs (Level 3) |
||||||||||||
| Available for sale securities: |
||||||||||||||||
| U.S. agency mortgage-backed |
$ | 62,092 | $ | — | $ | 62,092 | $ | — | ||||||||
| Non-U.S. agency mortgage-backed |
37,853 | — | 28,744 | 9,109 | ||||||||||||
| U.S. government agency |
6,807 | — | 6,807 | — | ||||||||||||
The Company did not record any liabilities at fair value for which measurement of the fair value was made on a recurring basis.
The following table reconciles assets measured at fair value on a recurring basis using significant unobservable inputs (Level 3):
| (dollars in thousands) |
Non-U.S. agency mortgage-backed securities |
|||
| Balance as of beginning of year |
$ | 9,109 | ||
| Total gains or losses (realized/unrealized) |
||||
| Included in earnings |
(1,686 | ) | ||
| Included in other comprehensive income |
(41 | ) | ||
| Purchases, sales, issuances and settlements, net |
(4,147 | ) | ||
| Transfers in and/or out of Level 3 |
— | |||
| Balance as of end of year |
$ | 3,235 | ||
| The amount of total gains or losses for the period included in earnings attributable to the change in unrealized gains or losses relating to assets still held as of December 31, 2010 |
$ | (1,229 | ) | |
78
Table of Contents
Nonrecurring Basis
The Company has segregated all financial assets and liabilities that are measured at fair value on a nonrecurring basis into the most appropriate level within the fair value hierarchy based on the inputs used to determine the fair value at the measurement date in the table below.
| Fair Value Measurements Using | ||||||||||||||||
| (dollars in thousands) |
December 31, 2010 |
Quoted Prices in Active Markets for Identical Assets (Level 1) |
Significant Other Observable Inputs (Level 2) |
Significant Unobservable Inputs (Level 3) |
||||||||||||
| Assets |
||||||||||||||||
| Loans, covered by loss sharing agreements |
$ | 80,447 | $ | — | $ | — | $ | 80,447 | ||||||||
| Impaired loans |
1,296 | — | 1,296 | — | ||||||||||||
| Repossessed assets |
5,683 | — | 5,683 | — | ||||||||||||
| FDIC loss sharing receivable |
32,013 | — | — | 32,013 | ||||||||||||
| Total |
$ | 119,439 | $ | — | $ | 6,979 | $ | 112,460 | ||||||||
| Liabilities |
||||||||||||||||
| Deposits acquired through business combination |
$ | 67,466 | $ | — | $ | — | $ | 67,466 | ||||||||
| Fair Value Measurements Using | ||||||||||||||||
| (dollars in thousands) |
December 31, 2009 |
Quoted Prices in Active Markets for Identical Assets (Level 1) |
Significant Other Observable Inputs (Level 2) |
Significant Unobservable Inputs (Level 3) |
||||||||||||
| Assets |
||||||||||||||||
| Impaired loans |
$ | 2,315 | $ | — | $ | 2,315 | $ | — | ||||||||
| Repossessed assets |
417 | — | 417 | — | ||||||||||||
| Total |
$ | 2,732 | $ | — | $ | 2,732 | $ | — | ||||||||
In accordance with the provisions of ASC 310, Receivables, the Company records loans considered impaired at their fair value. A loan is considered impaired if it is probable the Company will be unable to collect all amounts due according to the contractual terms of the loan agreement. Fair value is measured at the fair value of the collateral for collateral-dependent loans. Impaired loans are classified as Level 2 assets when measured using appraisals from external parties of the collateral less any prior liens. Impaired loans are classified as Level 3 when an appraised value is not available or management determines the fair value of the collateral is further impaired below the appraised value and there is no observable market price. Repossessed assets are initially recorded at fair value less estimated costs to sell. The fair value of repossessed assets is based on property appraisals and an analysis of similar properties available. As such, the Company classifies repossessed assets as Level 2 assets. Repossessed assets are classified as Level 3 assets when an appraised value is not available or management determines the fair value of the property is further impaired below the appraised value and there is no observable market price.
Certain assets and liabilities measured on a nonrecurring basis using significant unobservable inputs (Level 3) were acquired as part of the Statewide acquisition discussed further in Note 3 to these consolidated financial statements. Covered Loans, the FDIC loss sharing receivable, and acquired interest-bearing deposits were recorded at their fair value upon acquisition in accordance with GAAP.
79
Table of Contents
ASC 820, Fair Value Measurements and Disclosures, requires the disclosure of each class of financial instruments for which it is practicable to estimate. The fair value of a financial instrument is the current amount that would be exchanged between willing parties, other than in a forced liquidation. Fair value is best determined based upon quoted market prices. However, in many instances, there are no quoted market prices for the Company’s various financial instruments. In cases where quoted market prices are not available, fair values are based on estimates using present value or other valuation techniques. Those techniques are significantly affected by the assumptions used, including the discount rate and estimates of future cash flows. Accordingly, the fair value estimates may not be realized in an immediate settlement of the instrument. ASC 820 excludes certain financial instruments and all non-financial instruments from its disclosure requirements. Accordingly, the aggregate fair value amounts presented may not necessarily represent the underlying fair value of the Company.
Fair value estimates are made at a specific point in time, based on relevant market information and information about the financial statement element. These estimates are subjective in nature and involve uncertainties and matters of significant judgment and therefore cannot be determined with precision. Changes in assumptions could significantly affect the estimates.
Fair value estimates included herein are based on existing on- and off-balance-sheet financial instruments without attempting to estimate the value of anticipated future business and the fair value of assets and liabilities that are not required to be recorded or disclosed at fair value like premises and equipment. In addition, the tax ramifications related to the realization of the unrealized gains and losses can have a significant effect on fair value estimates and have not been considered in the estimates.
The following methods and assumptions were used to estimate the fair value of each class of financial instruments for which it is practicable to estimate that value:
The carrying value of cash and cash equivalents and interest-bearing deposits in banks approximate their fair value.
The fair value for investment securities is determined from quoted market prices when available. If a quoted market price is not available, fair value is estimated using third party pricing services or quoted market prices of securities with similar characteristics.
The fair value of mortgage loans held for sale and loans are estimated by discounting the future cash flows using the current rates at which similar loans would be made to borrowers with similar credit ratings and for the same remaining maturity.
The fair value of demand deposits, savings and interest-bearing demand deposits is the amount payable on demand. The fair value of fixed-maturity certificates of deposit is estimated by discounting the future cash flows using the rates currently offered for deposits of similar remaining maturities.
The carrying amount of the FHLB advances is estimated using the rates currently offered for advances of similar maturities.
80
Table of Contents
The fair value of off-balance sheet financial instruments as of December 31, 2010 and 2009 was immaterial.
| December 31, 2010 | December 31, 2009 | |||||||||||||||
| Carrying | Fair | Carrying | Fair | |||||||||||||
| (dollars in thousands) |
Amount | Value | Amount | Value | ||||||||||||
| Financial Assets: |
||||||||||||||||
| Cash and cash equivalents |
$ | 36,970 | $ | 36,970 | $ | 25,710 | $ | 25,710 | ||||||||
| Interest-bearing deposits in banks |
7,867 | 7,867 | 3,529 | 3,529 | ||||||||||||
| Investment securities available for sale |
111,962 | 111,962 | 106,752 | 106,752 | ||||||||||||
| Investment securities held to maturity |
15,220 | 15,400 | 13,099 | 13,177 | ||||||||||||
| Mortgage loans held for sale |
2,437 | 2,437 | 719 | 699 | ||||||||||||
| Loans, net |
435,992 | 449,061 | 333,296 | 340,795 | ||||||||||||
| Financial Liabilities: |
||||||||||||||||
| Deposits |
$ | 553,218 | $ | 555,250 | $ | 371,593 | $ | 373,624 | ||||||||
| Long-term FHLB advances |
13,000 | 13,305 | 16,774 | 17,011 | ||||||||||||
21. Condensed Parent Company Only Financial Statements
Condensed financial statements of Home Bancorp, Inc. (parent company only) are shown below. The parent company has no significant operating activities. The parent company commenced operations on October 2, 2008; thus, the statement of operations and statement of cash flows for the period October 2, 2008 to December 31, 2008 are shown.
Condensed Balance Sheets
December 31, 2010 and 2009
| (dollars in thousands) |
2010 | 2009 | ||||||
| Assets |
||||||||
| Cash in bank |
$ | 8,621 | $ | 8,397 | ||||
| Investment securities |
15,576 | 23,777 | ||||||
| Investment in subsidiary |
107,645 | 100,906 | ||||||
| Other assets |
77 | 322 | ||||||
| Total assets |
$ | 131,919 | $ | 133,402 | ||||
| Liabilities |
$ | 389 | $ | 653 | ||||
| Shareholders’ equity |
131,530 | 132,749 | ||||||
| Total liabilities and shareholders’ equity |
$ | 131,919 | $ | 133,402 | ||||
81
Table of Contents
Condensed Statements of Operations
For the Years Ended December 31, 2010 and 2009 and the Period from October 2, 2008 to December 31, 2008
| (dollars in thousands) |
2010 | 2009 | 2008 | |||||||||
| Operating income |
||||||||||||
| Interest income |
$ | 740 | $ | 1,359 | $ | 221 | ||||||
| Total operating income |
740 | 1,359 | 221 | |||||||||
| Operating expenses |
||||||||||||
| Other expenses |
250 | 315 | 8 | |||||||||
| Total operating expenses |
250 | 315 | 8 | |||||||||
| Income before income tax expense and increase in equity in undistributed earnings of subsidiary |
490 | 1,044 | 213 | |||||||||
| Income tax expense |
192 | 410 | 72 | |||||||||
| Income before increase in equity in undistributed earnings of subsidiary |
298 | 634 | 141 | |||||||||
| Increase (decrease) in equity in undistributed earnings of subsidiary |
4,390 | 4,046 | (940 | ) | ||||||||
| Net income (loss) |
$ | 4,688 | $ | 4,680 | $ | (799 | ) | |||||
Condensed Statements of Cash Flows
For the Years Ended December 31, 2010 and 2009 and the Period from October 2, 2008 to December 31, 2008
| (dollars in thousands) |
2010 | 2009 | 2008 | |||||||||
| Cash Flows from Operating Activities |
||||||||||||
| Net income (loss) |
$ | 4,688 | $ | 4,680 | $ | (799 | ) | |||||
| Adjustments to reconcile net income (loss) to net cash provided by operating activities: |
||||||||||||
| Net amortization of premium/discount on investments |
(24 | ) | (59 | ) | 138 | |||||||
| Non-cash compensation |
474 | 405 | 90 | |||||||||
| Increase (decrease) in accrued interest and other assets |
244 | (150 | ) | (172 | ) | |||||||
| Increase (decrease) in equity in net income of subsidiary |
(4,390 | ) | (4,045 | ) | 940 | |||||||
| Increase in accrued expenses and other liabilities |
(185 | ) | 258 | 124 | ||||||||
| Net Cash Provided by Operating Activities |
807 | 1,089 | 321 | |||||||||
| Cash Flows from Investing Activities |
||||||||||||
| Capital contributed to subsidiary |
— | — | (44,000 | ) | ||||||||
| Purchases of available for sale securities |
— | — | (34,878 | ) | ||||||||
| Proceeds from payment on available for sale securities |
7,994 | 11,391 | 426 | |||||||||
| Stock purchased for ESOP |
— | — | (7,142 | ) | ||||||||
| Net Cash Provided by (Used in) Investing Activities |
7,994 | 11,391 | (85,594 | ) | ||||||||
| Cash Flows from Financing Activities |
||||||||||||
| Common stock issued |
— | — | 89 | |||||||||
| Proceeds from common stock in excess of par |
— | — | 89,179 | |||||||||
| Purchase of treasury stock |
(8,577 | ) | (1,849 | ) | — | |||||||
| Repurchase shares for RRP |
— | (4,218 | ) | — | ||||||||
| Costs of issuance of common stock |
— | (14 | ) | (1,997 | ) | |||||||
| Net Cash Provided by (Used in) Financing Activities |
(8,577 | ) | (6,081 | ) | 87,271 | |||||||
| Net Increase in Cash and Cash Equivalents |
224 | 6,399 | 1,998 | |||||||||
| Cash and Cash Equivalents as of Beginning of Period |
8,397 | 1,998 | — | |||||||||
| Cash and Cash Equivalents as of End of Period |
$ | 8,621 | $ | 8,397 | $ | 1,998 | ||||||
82
Table of Contents
22. Consolidated Quarterly Results of Operations (unaudited)
| (dollars in thousands, except per share data) |
First Quarter |
Second Quarter |
Third Quarter |
Fourth Quarter |
||||||||||||
| Year Ended December 31, 2010 |
||||||||||||||||
| Total interest income |
$ | 7,258 | $ | 9,042 | $ | 8,809 | $ | 8,550 | ||||||||
| Total interest expense |
1,394 | 1,539 | 1,542 | 1,406 | ||||||||||||
| Net interest income |
5,864 | 7,503 | 7,267 | 7,144 | ||||||||||||
| Provision for loan losses |
350 | 200 | 168 | 147 | ||||||||||||
| Net interest income after provision for loan losses |
5,514 | 7,303 | 7,099 | 6,997 | ||||||||||||
| Noninterest income |
998 | 1,395 | 612 | 1,476 | ||||||||||||
| Noninterest expense |
5,247 | 6,492 | 6,353 | 6,270 | ||||||||||||
| Income before income taxes |
1,265 | 2,206 | 1,358 | 2,203 | ||||||||||||
| Income tax expense |
420 | 739 | 447 | 738 | ||||||||||||
| Net income |
$ | 845 | $ | 1,467 | $ | 911 | $ | 1,465 | ||||||||
| Earnings per share – basic |
$ | 0.11 | $ | 0.19 | $ | 0.12 | $ | 0.20 | ||||||||
| Earnings per share – diluted |
$ | 0.11 | $ | 0.19 | $ | 0.12 | $ | 0.20 | ||||||||
| (dollars in thousands, except per share data) |
First Quarter |
Second Quarter |
Third Quarter |
Fourth Quarter |
||||||||||||
| Year Ended December 31, 2009 |
||||||||||||||||
| Total interest income |
$ | 7,537 | $ | 7,734 | $ | 7,636 | $ | 6,990 | ||||||||
| Total interest expense |
1,670 | 1,631 | 1,558 | 1,478 | ||||||||||||
| Net interest income |
5,867 | 6,103 | 6,078 | 5,512 | ||||||||||||
| Provision for loan losses |
174 | 248 | 287 | 156 | ||||||||||||
| Net interest income after provision for loan losses |
5,693 | 5,855 | 5,791 | 5,356 | ||||||||||||
| Noninterest income |
961 | 1,006 | 949 | (795 | ) | |||||||||||
| Noninterest expense |
4,009 | 4,642 | 4,669 | 4,508 | ||||||||||||
| Income before income taxes |
2,645 | 2,219 | 2,071 | 53 | ||||||||||||
| Income tax expense |
921 | 782 | 574 | 31 | ||||||||||||
| Net income |
$ | 1,724 | $ | 1,437 | $ | 1,497 | $ | 22 | ||||||||
| Earnings per share – basic |
$ | 0.21 | $ | 0.18 | $ | 0.19 | $ | — | ||||||||
| Earnings per share – diluted |
$ | 0.21 | $ | 0.18 | $ | 0.19 | $ | — | ||||||||
83
Table of Contents
Item 9. Changes in and Disagreements With Accountants on Accounting and Financial Disclosure.
Not applicable.
Item 9A(T). Controls and Procedures.
Evaluation of Disclosure Controls and Procedures
Our management evaluated, with the participation of our Chief Executive Officer and Chief Financial Officer, the effectiveness of our disclosure controls and procedures (as defined in Rules 13a-15(e) and 15d-15(e) under the Securities Exchange Act of 1934) as of December 31, 2010. Based on such evaluation, our Chief Executive Officer and Chief Financial Officer have concluded that our disclosure controls and procedures are designed to ensure that information required to be disclosed by us in the reports that we file or submit under the Securities Exchange Act of 1934 is recorded, processed, summarized and reported within the time periods specified in the SEC’s rules and regulations and are operating in an effective manner.
Management’s Report on Internal Control over Financial Reporting
The management of Home Bancorp, Inc. is responsible for establishing and maintaining adequate internal control over financial reporting. The Company’s internal control over financial reporting is a process designed under the supervision of the Company’s Chief Executive Officer and the Chief Financial Officer to provide reasonable assurance regarding the reliability of financial reporting and the preparation of the Company’s financial statements for external purposes in accordance with the accounting principles generally accepted in the United States of America. Internal control over financial reporting is defined in Rules 13a-15(f) and 15d-15(f) promulgated under the Securities Exchange Act of 1934, as amended.
The Company’s internal control systems are designed to ensure that transactions are properly authorized and recorded in the financial records and to safeguard assets from material loss or misuse. Such assurance cannot be absolute because of inherent limitations in any internal control system.
Management assessed the effectiveness of the Company’s internal control over financial reporting as of December 31, 2010 based on the criteria for effective internal control established in Internal Control – Integrated Framework issued by the Committee of Sponsoring Organizations of the Treadway Commission. Based on the assessment, management determined that the Company maintained effective internal control over financial reporting as of December 31, 2010. Our independent registered public accountants have issued an audit report on the company’s internal control over financial reporting. This report appears on page 46.
Changes in Internal Control over Financial Reporting
No change in our internal control over financial reporting (as defined in Rules 13a-15(f) and 15(d)-15(f) under the Securities Exchange Act of 1934) occurred during the fourth fiscal quarter of 2010 that has materially affected, or is reasonably likely to materially affect, our internal control over financial reporting.
Not applicable.
84
Table of Contents
Item 10. Directors, Executive Officers and Corporate Governance.
The information required herein is incorporated by reference from the information contained in the sections captioned “Information with Respect to Nominees for Director, Continuing Directors and Executive Officers” and “Beneficial Ownership of Common Stock by Certain Beneficial Owners and Management – Section 16(a) Beneficial Ownership Reporting Compliance” in the Company’s definitive proxy statement for the 2011 Annual Meeting of Stockholders to be held in May 2011 (the “Proxy Statement”).
The Company has adopted a Code of Conduct and Ethics that applies to its principal executive officer and principal financial officer, as well as other officers and employees of the Company and the Bank. A copy of the Code of Ethics is available on the Company’s website at www.home24bank.com.
Item 11. Executive Compensation.
The information required herein with respect to the security ownership of certain beneficial owners and management is incorporated by reference from the information contained in the sections captioned “Management Compensation” in the Proxy Statement.
Equity Compensation Plan Information. The following table provides information as of December 31, 2010 with respect to shares of common stock that may be issued under our existing equity compensation plans, which consist of the 2009 Stock Option Plan and 2009 Recognition and Retention Plan, both of which were approved by our shareholders.
| Plan Category |
Number of securities to be issued upon exercise of outstanding options, warrants and rights (a) |
Weighted-average exercise price of outstanding options, warrants and rights (b) |
Number of securities remaining available for future issuance under equity compensation plans (excluding securities reflected in column (a)) (c) |
|||||||||
| Equity compensation plans approved by security holders |
1,091,160 | (1) | $ | 11.47 | (1) | 91,082 | ||||||
| Equity compensation plans not approved by security holders |
— | — | — | |||||||||
| Total |
1,091,160 | $ | 11.47 | 91,082 | ||||||||
| (1) | Includes 357,075 shares subject to restricted stock grants which were not vested as of December 31, 2010. The weighted-average exercise price excludes such restricted stock grants. |
85
Table of Contents
Item 12. Security Ownership of Certain Beneficial Owners and Management and Related Stockholder Matters.
The information required herein is incorporated by reference from the information contained in the section captioned “Beneficial Ownership of Common Stock by Certain Beneficial Owners and Management” in the Proxy Statement.
Item 13. Certain Relationships and Related Transactions and Director Independence.
The information required herein is incorporated by reference from the information contained in the sections captioned “Management Compensation – Related Party Transactions” and “Information with Respect to Nominees for Director, Continuing Directors and Executive Officers” in the Proxy Statement.
Item 14. Principal Accounting Fees and Services.
The information required herein is incorporated by reference from the information contained in the sections captioned “Ratification of Appointment of Independent Registered Public Accounting Firm” in the Proxy Statement.
Item 15. Exhibits and Financial Statement Schedules.
(a) (1) The following financial statements are incorporated by reference from Item 8 hereof:
Report of Independent Registered Public Accounting Firm
Consolidated Statements of Financial Condition
Consolidated Statements of Income
Consolidated Statements of Changes in Shareholders’ Equity
Consolidated Statements of Cash Flows
Notes to Consolidated Financial Statements
(2) All schedules are omitted because they are not required or applicable, or the required information is shown in the consolidated financial statements or the notes thereto.
86
Table of Contents
| (3) | Exhibits |
The following exhibits are filed as part of this Form 10-K and this list includes the Exhibit Index.
| No. |
Description |
Location | ||
| 2.1 | Purchase and Assumption Agreement, Whole Banks, All Deposits, Among the Federal Deposit Insurance Corporation, Receiver of Statewide Bank, Covington, Louisiana, the Federal Deposit Insurance Corporation and Home Bank, dated as of March 12, 2010 | (1) | ||
| 3.1 | Articles of Incorporation of Home Bancorp, Inc. | (2) | ||
| 3.2 | Amended and Restated Bylaws of Home Bancorp, Inc. | (3) | ||
| 4.0 | Form of Stock Certificate of Home Bancorp, Inc. | (2) | ||
| 10.1 | Salary Continuation Agreement by and between Home Bank and John W. Bordelon* | (2) | ||
| 10.2 | Salary Continuation Agreement by and between Home Bank and Darren E. Guidry* | (2) | ||
| 10.3 | Amendment No. 1 to the Salary Continuation Agreement by and between Home Bank and John W. Bordelon* |
(4) | ||
| 10.4 | Amendment No. 1 to the Salary Continuation Agreement by and between Home Bank and Darren E. Guidry* |
(4) | ||
| 10.5 | Amended and Restated Employment Agreement between Home Bank and L.J. Dailey* | (5) | ||
| 10.6 | 2005 Directors’ Deferral Plan* | (4) | ||
| 10.7 | Employment agreement by and between Home Bank and John W. Bordelon* | (6) | ||
| 10.8 | Employment agreement by and between Home Bancorp, Inc. and John W. Bordelon* | (6) | ||
| 10.9 | Employment Agreement by and between Home Bank and Darren E. Guidry* | (6) | ||
| 10.10 | Employment Agreement by and between Home Bank and Scott T. Sutton* | (6) | ||
| 10.11 | Employment Agreement by and between Home Bank and Joseph B. Zanco* | (6) | ||
| 10.12 | Home Bancorp, Inc. 2009 Stock Option Plan* | (7) | ||
| 10.13 | Home Bancorp, Inc. 2009 Recognition and Retention Plan and Trust Agreement* | (8) | ||
| 23.1 | Consent of Ernst & Young LLP | Filed herewith | ||
| 23.2 | Consent of Porter Keadle Moore LLP | Filed herewith | ||
| 31.1 | Rule 13(a)-14(a) Certification of the Chief Executive Officer | Filed herewith | ||
| 31.2 | Rule 13(a)-14(a) Certification of the Chief Financial Officer | Filed herewith | ||
| 32.0 | Section 1350 Certification | Filed herewith |
| * | Denotes a management contract or compensatory plan or arrangement. |
| (1) | Incorporated by reference from the like-numbered exhibit included in the Company’s Current Report on Form 8-K, dated as of March 12, 2010, filed March 18, 2010 (SEC File No. 001-34190). |
| (2) | Incorporated by reference from the like-numbered exhibit included in Home Bancorp’s registration statement on Form S-1, filed June 6, 2008 (SEC File No. 333-151492). |
| (3) | Incorporated by reference from the exhibit included in the Company’s Current Report on Form 8-K, dated as of March 23, 2009 and filed March 27, 2009 (SEC File No. 001-34190). |
| (4) | Incorporated by reference from the exhibit included in the Company’s Current Report on Form 8-K, dated as of December 22, 2008 and filed December 29, 2008 (SEC File No. 001-34190). |
| (5) | Incorporated by reference from the exhibit included in the Company’s Current Report on Form 8-K, dated as of June 30, 2009, and filed July 1, 2009 (SEC File No. 001-34190). |
| (6) | Incorporated by reference from the exhibit included in the Company’s Current Report on Form 8-K, dated as of June 22, 2009 and filed June 23, 2009 (SEC File No. 001-34190). |
| (7) | Incorporated by reference from Appendix A to Home Bancorp’s definitive proxy statement filed April 1, 2009 (SEC File No. 001-34190) and included in Form S-8, filed June 23, 2009 (SEC File No. 333-160155). |
| (8) | Incorporated by reference from Appendix B to Home Bancorp’s definitive proxy statement filed April 1, 2009 (SEC File No. 001-34190). |
| (b) | Exhibits |
The exhibits listed under (a)(3) of this Item 15 are filed herewith.
| (c) | Reference is made to (a)(2) of this Item 15. |
87
Table of Contents
Pursuant to the requirements of Section 13 or 15(d) of the Securities Exchange Act of 1934, the Registrant has duly caused this report to be signed on its behalf by the undersigned, thereunto duly authorized.
| HOME BANCORP, INC. | ||||||
| March 15, 2011 | By: | /s/ John W. Bordelon | ||||
| John W. Bordelon | ||||||
| President and Chief Executive Officer | ||||||
Pursuant to the requirements of the Securities Exchange Act of 1934, this report has been signed below by the following persons on behalf of the Registrant and in the capacities and on the date indicated.
| Name |
Title |
Date | ||
| /s/ John W. Bordelon John W. Bordelon |
President and Chief Executive Officer | March 15, 2011 | ||
| /s/ Michael P. Maraist Michael P. Maraist |
Chairman of the Board | March 15, 2011 | ||
| /s/ Paul J. Blanchet, III Paul J. Blanchet, III |
Director | March 15, 2011 | ||
| /s/ Richard J. Bourgeois Richard J. Bourgeois |
Director | March 15, 2011 | ||
| /s/ Henry W. Busch, Jr. Henry William Busch, Jr. |
Director | March 15, 2011 | ||
| /s/ Lester J. Dailey Lester James Dailey |
Director | March 15, 2011 | ||
| /s/ John A. Hendry John A. Hendry |
Director | March 15, 2011 | ||
| /s/ Marc W. Judice Marc W. Judice |
Director | March 15, 2011 | ||
| /s/ Joseph B. Zanco Joseph B. Zanco |
Executive Vice President and Chief Financial Officer |
March 15, 2011 | ||
| /s/ Mary H. Hopkins Mary H. Hopkins |
Home Bank First Vice President and Controller |
March 15, 2011 | ||
88