Attached files
| file | filename |
|---|---|
| EX-99.1 - EXHIBIT 99.1 - NN INC | d535081dex991.htm |
| EX-10.1 - EXHIBIT 10.1 - NN INC | d535081dex101.htm |
| EX-2.1 - EXHIBIT 2.1 - NN INC | d535081dex21.htm |
| 8-K - FORM 8-K - NN INC | d535081d8k.htm |
Paragon Medical Acquisition Exhibit 99.2
Forward looking statements Forward Looking Statements: With the exception of the historical information contained in this presentation, the matters described herein contain forward-looking statements that are made pursuant to the safe harbor provisions of the Private Securities Litigation Reform Act of 1995. The forward-looking statements contained herein include, but are not limited to, information regarding the ability of NN, Inc. (“NN”) and Paragon Medical, Inc. (“Paragon”) to complete the transactions contemplated by the Stock Purchase Agreement, dated April 2, 2018, including the satisfaction of conditions to the transactions set forth in the Stock Purchase Agreement, and NN’s and the combined entity’s estimated or anticipated future results of operations. These forward-looking statements involve risks and uncertainties that could cause NN’s and the combined entity’s results to differ materially from management’s current expectations. Such risks and uncertainties include, but are not limited to, general economic conditions and economic conditions in the industrial sector, competitive influences, risks that current customers of NN or Paragon will commence or increase captive production, delayed customer product launches, risks of capacity underutilization, quality issues, availability of raw materials, currency, pending and complete transactions and other risks associated with international trade, the Company's dependence on certain major customers, unforeseen changes in future revenues, earnings and profitability of NN or Paragon, the risk that NN is not able to realize the savings or benefits expected from integration and restructuring activities related to the proposed acquisition of Paragon, the risk that the required regulatory approvals for the proposed acquisition of NN are not obtained, are delayed or are subject to conditions that are not anticipated, and those risks and uncertainties discussed in NN’s Annual Report on Form 10-K filed with the Securities and Exchange Commission on April 2, 2018. This presentation contains certain forward looking non-GAAP financial measures, estimated 2018 adjusted earnings before interest, taxes and depreciation and estimated 2018 adjusted operating margin, which cannot be reconciled without unreasonable effort. The following forward looking financial measures regarding Paragon is unavailable to NN: (i) depreciation and amortization; (ii) income taxes; and (iii) net income, and this information could have a material impact on these certain forward looking non-GAAP financial measures. Disclaimer: NN disclaims any obligation to update any such factors or to publicly announce the result of any revisions to any of the forward-looking statements included herein or therein to reflect future events or developments. The information contained in this presentation is submitted on a confidential basis solely for the recipient’s use and the recipient agrees to maintain the confidentiality of the information contained herein and not to reproduce or distribute any confidential information contained herein to any third party without our express written authorization.
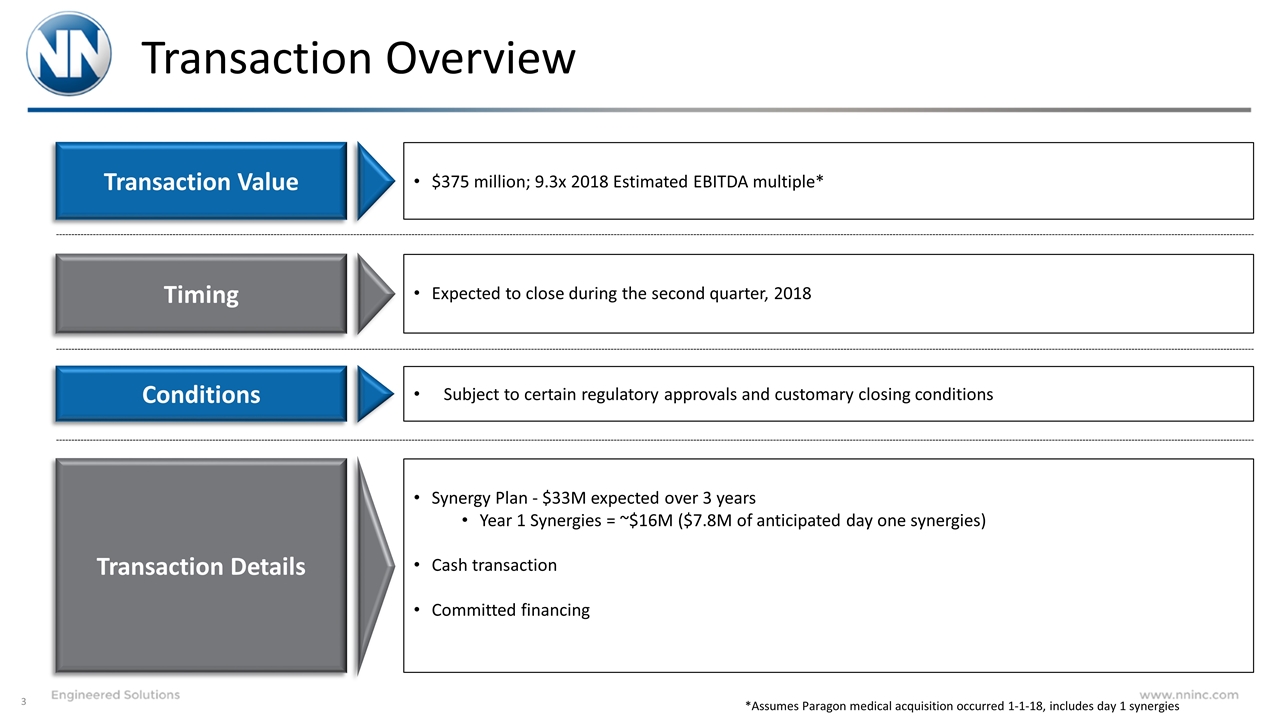
Transaction Overview Transaction Value Timing Conditions Transaction Details $375 million; 9.3x 2018 Estimated EBITDA multiple* Expected to close during the second quarter, 2018 Subject to certain regulatory approvals and customary closing conditions Synergy Plan - $33M expected over 3 years Year 1 Synergies = ~$16M ($7.8M of anticipated day one synergies) Cash transaction Committed financing *Assumes Paragon medical acquisition occurred 1-1-18, includes day 1 synergies
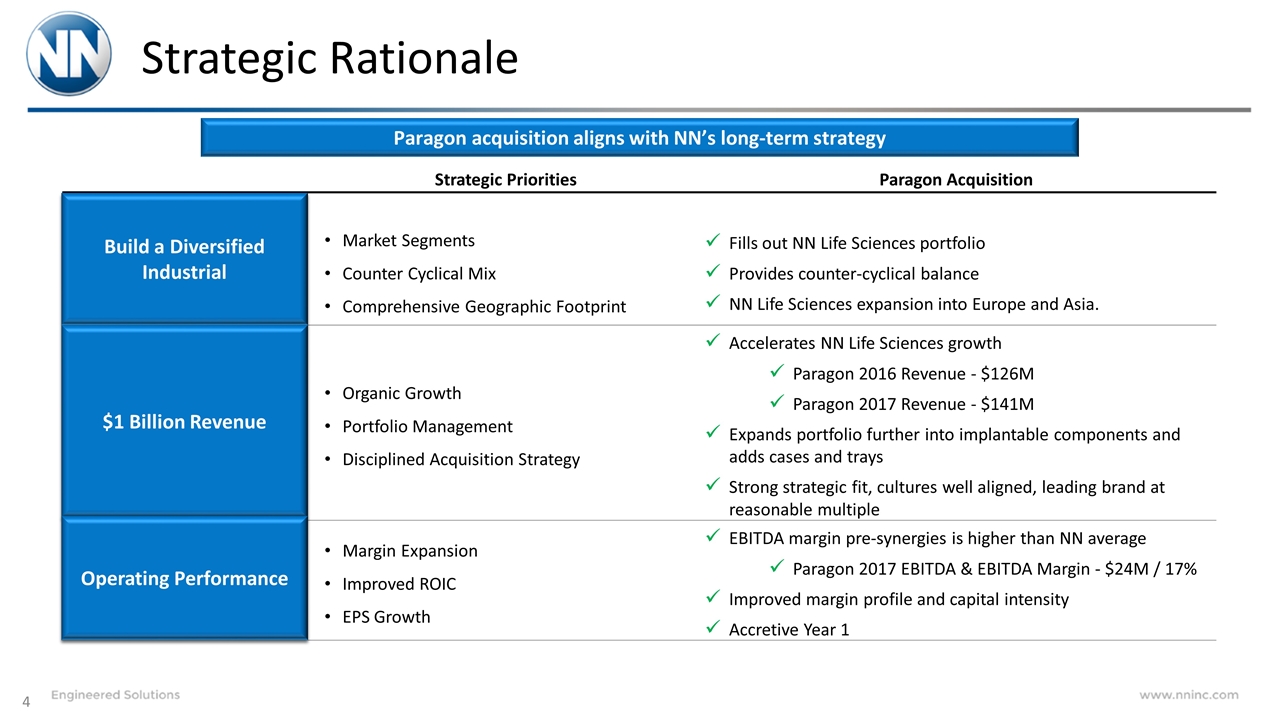
Strategic Rationale Paragon acquisition aligns with NN’s long-term strategy Strategic Priorities Paragon Acquisition Build a Diversified Business Market Segments Counter Cyclical Mix Comprehensive Geographic Footprint Fills out NN Life Sciences portfolio Provides counter-cyclical balance NN Life Sciences expansion into Europe and Asia. $1 Billion Revenue Organic Growth Portfolio Management Disciplined Acquisition Strategy Accelerates NN Life Sciences growth Paragon 2016 Revenue - $126M Paragon 2017 Revenue - $141M Expands portfolio further into implantable components and adds cases and trays Strong strategic fit, cultures well aligned, leading brand at reasonable multiple Operating Performance Margin Expansion Improved ROIC EPS Growth EBITDA margin pre-synergies is higher than NN average Paragon 2017 EBITDA & EBITDA Margin - $24M / 17% Improved margin profile and capital intensity Accretive Year 1 Build a Diversified Industrial $1 Billion Revenue Operating Performance Build a Diversified Industrial $1 Billion Revenue Operating Performance
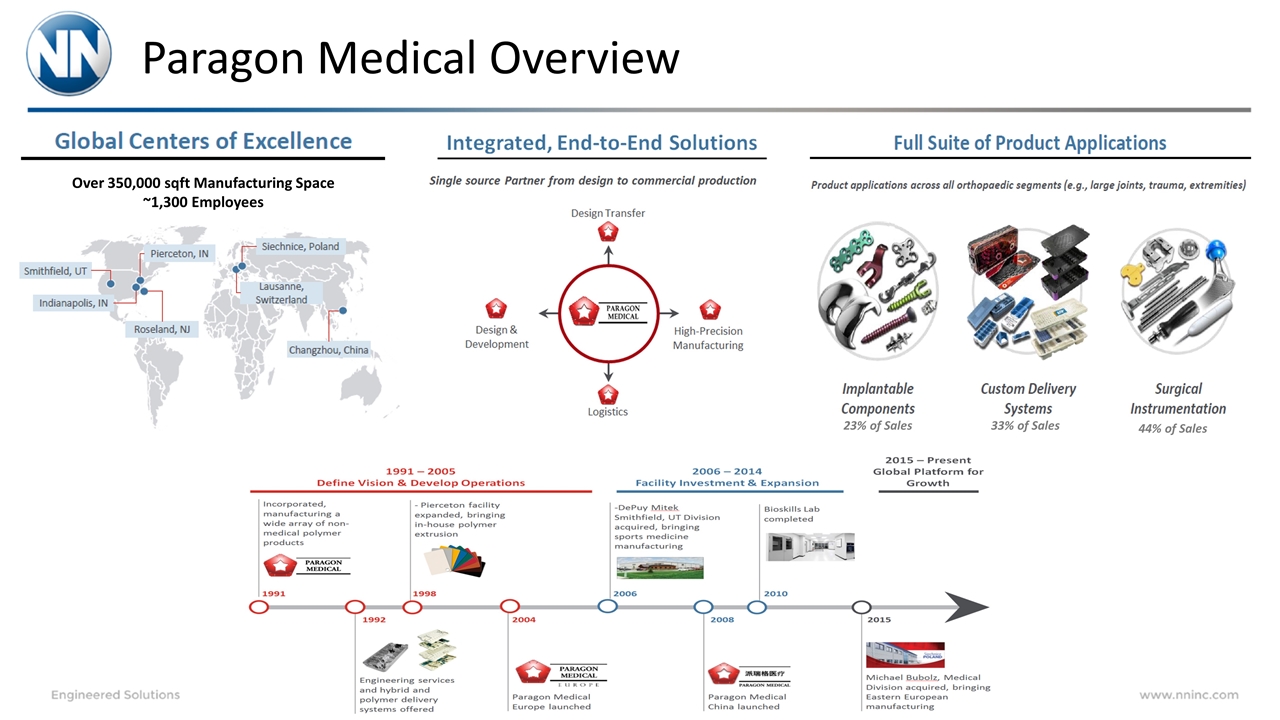
Paragon Medical Overview Over 350,000 sqft Manufacturing Space ~1,300 Employees 23% of Sales 33% of Sales 44% of Sales
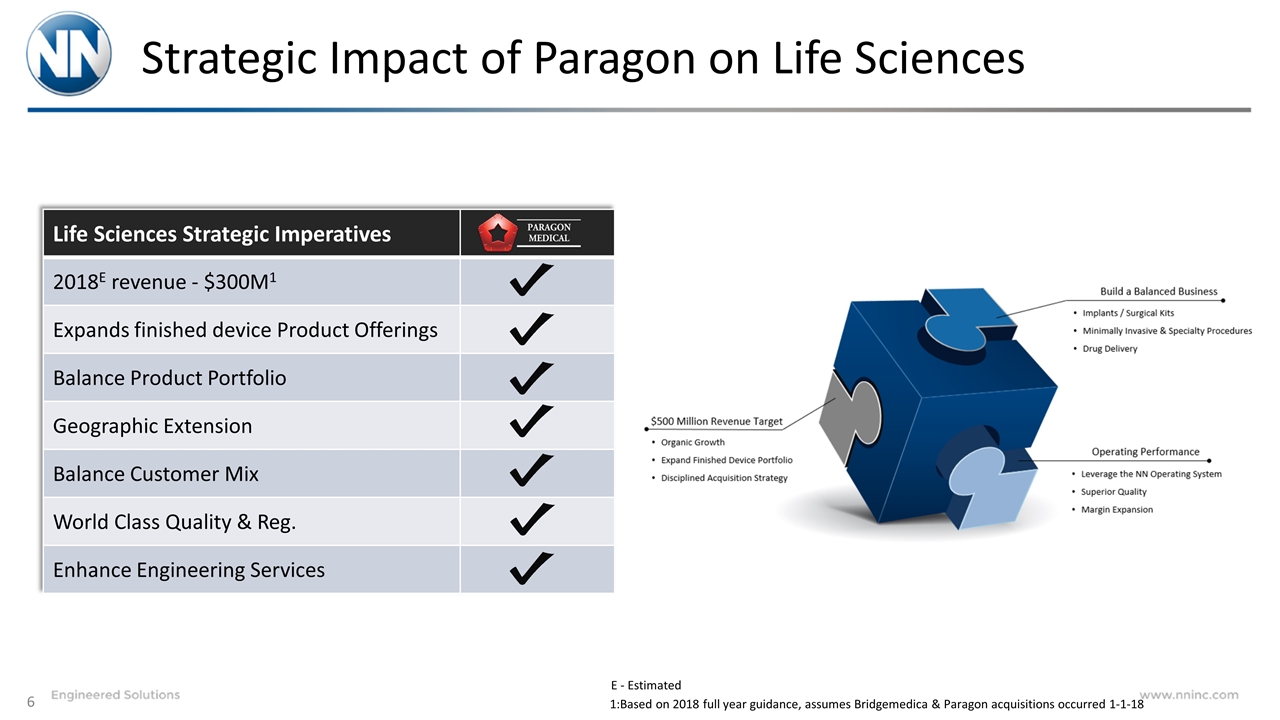
Strategic Impact of Paragon on Life Sciences Life Sciences Strategic Imperatives 2018E revenue - $300M1 Expands finished device Product Offerings Balance Product Portfolio Geographic Extension Balance Customer Mix World Class Quality & Reg. Enhance Engineering Services 1:Based on 2018 full year guidance, assumes Bridgemedica & Paragon acquisitions occurred 1-1-18 E - Estimated
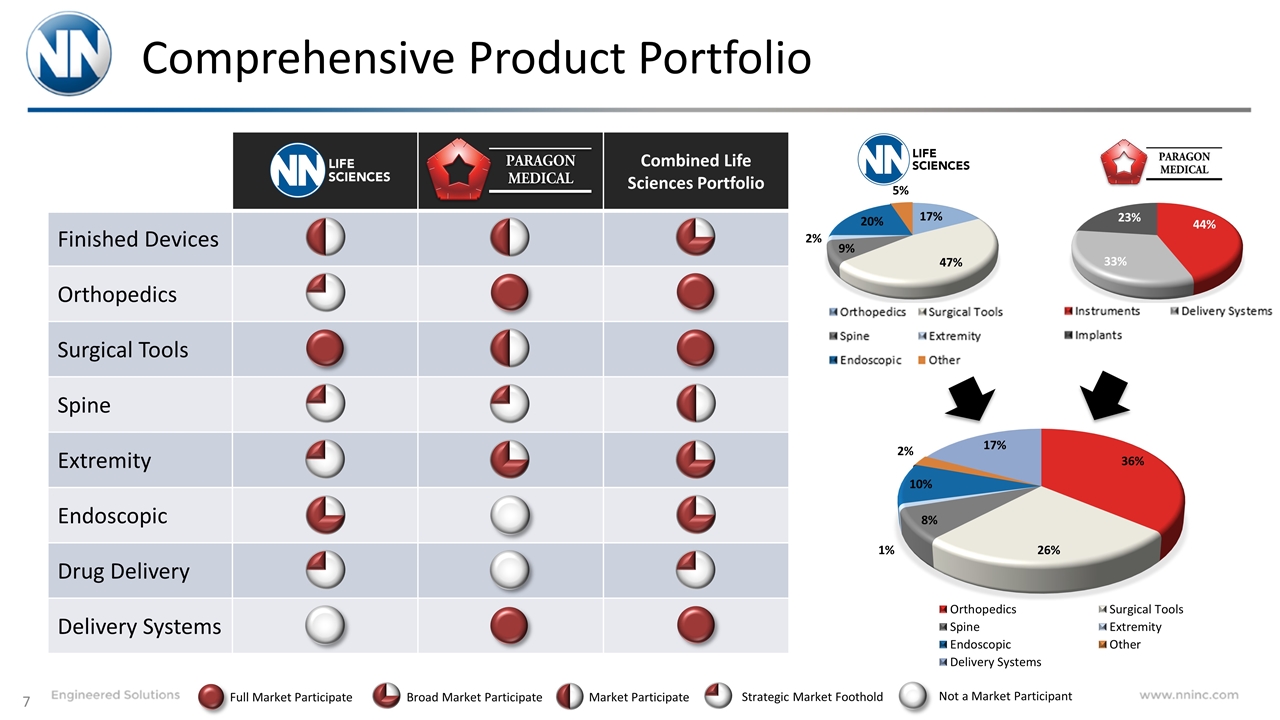
Comprehensive Product Portfolio Combined Life Sciences Portfolio Finished Devices Orthopedics Surgical Tools Spine Extremity Endoscopic Drug Delivery Delivery Systems Full Market Participate Broad Market Participate Market Participate Strategic Market Foothold Not a Market Participant
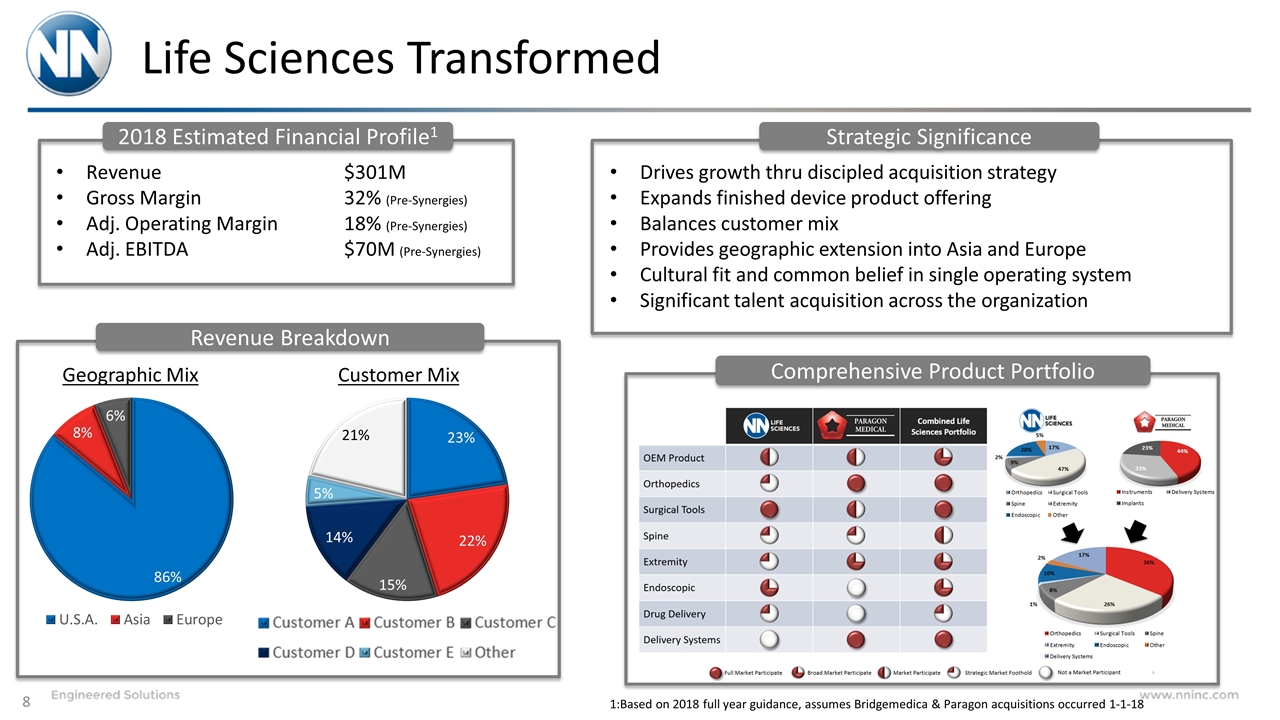
Life Sciences Transformed Geographic Mix Customer Mix Revenue $301M Gross Margin32% (Pre-Synergies) Adj. Operating Margin18% (Pre-Synergies) Adj. EBITDA$70M (Pre-Synergies) 2018 Estimated Financial Profile1 Revenue Breakdown Comprehensive Product Portfolio Strategic Significance Drives growth thru discipled acquisition strategy Expands finished device product offering Balances customer mix Provides geographic extension into Asia and Europe Cultural fit and common belief in single operating system Significant talent acquisition across the organization 1:Based on 2018 full year guidance, assumes Bridgemedica & Paragon acquisitions occurred 1-1-18
NN Inclusive of Paragon
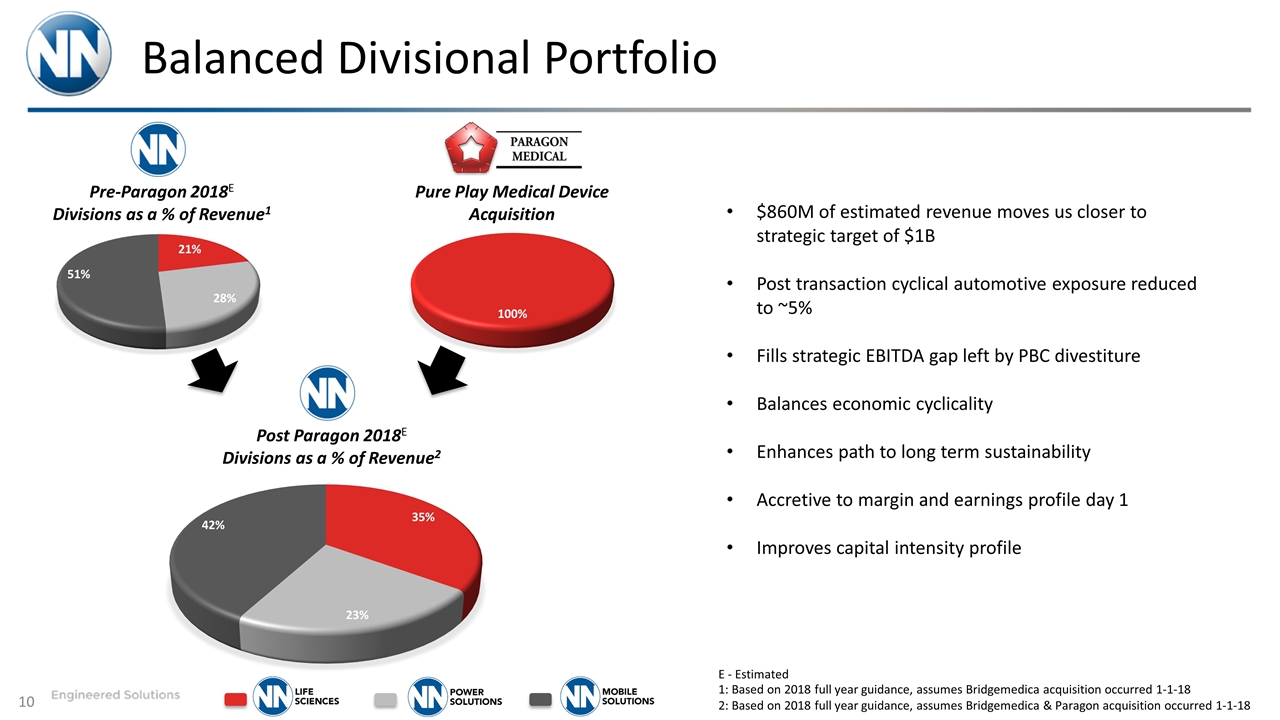
Balanced Divisional Portfolio Pre-Paragon 2018E Divisions as a % of Revenue1 Post Paragon 2018E Divisions as a % of Revenue2 Pure Play Medical Device Acquisition 1: Based on 2018 full year guidance, assumes Bridgemedica acquisition occurred 1-1-18 2: Based on 2018 full year guidance, assumes Bridgemedica & Paragon acquisition occurred 1-1-18 $860M of estimated revenue moves us closer to strategic target of $1B Post transaction cyclical automotive exposure reduced to ~5% Fills strategic EBITDA gap left by PBC divestiture Balances economic cyclicality Enhances path to long term sustainability Accretive to margin and earnings profile day 1 Improves capital intensity profile E - Estimated
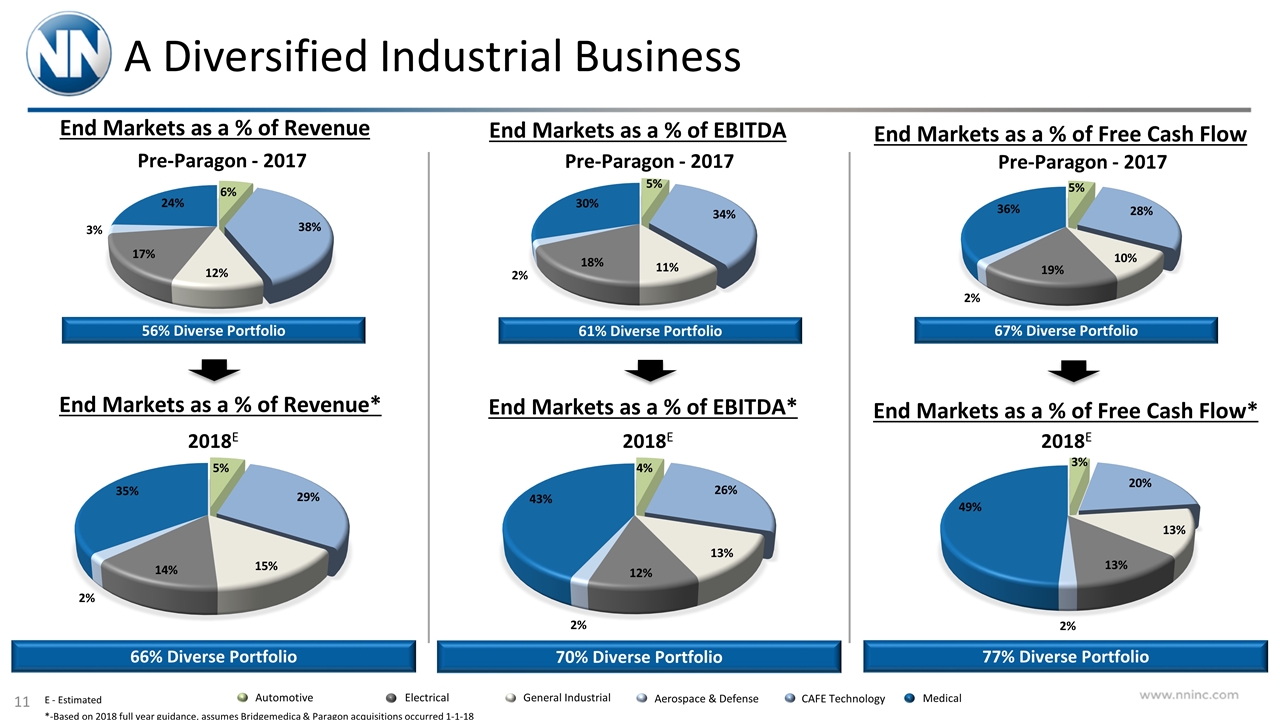
A Diversified Industrial Business 66% Diverse Portfolio 70% Diverse Portfolio 77% Diverse Portfolio 2018E End Markets as a % of Free Cash Flow* 2018E End Markets as a % of EBITDA* 2018E End Markets as a % of Revenue* Aerospace & Defense CAFE Technology Medical General Industrial Automotive Electrical *-Based on 2018 full year guidance, assumes Bridgemedica & Paragon acquisitions occurred 1-1-18 Pre-Paragon - 2017 End Markets as a % of Free Cash Flow End Markets as a % of EBITDA End Markets as a % of Revenue 56% Diverse Portfolio 61% Diverse Portfolio 67% Diverse Portfolio Pre-Paragon - 2017 Pre-Paragon - 2017 E - Estimated
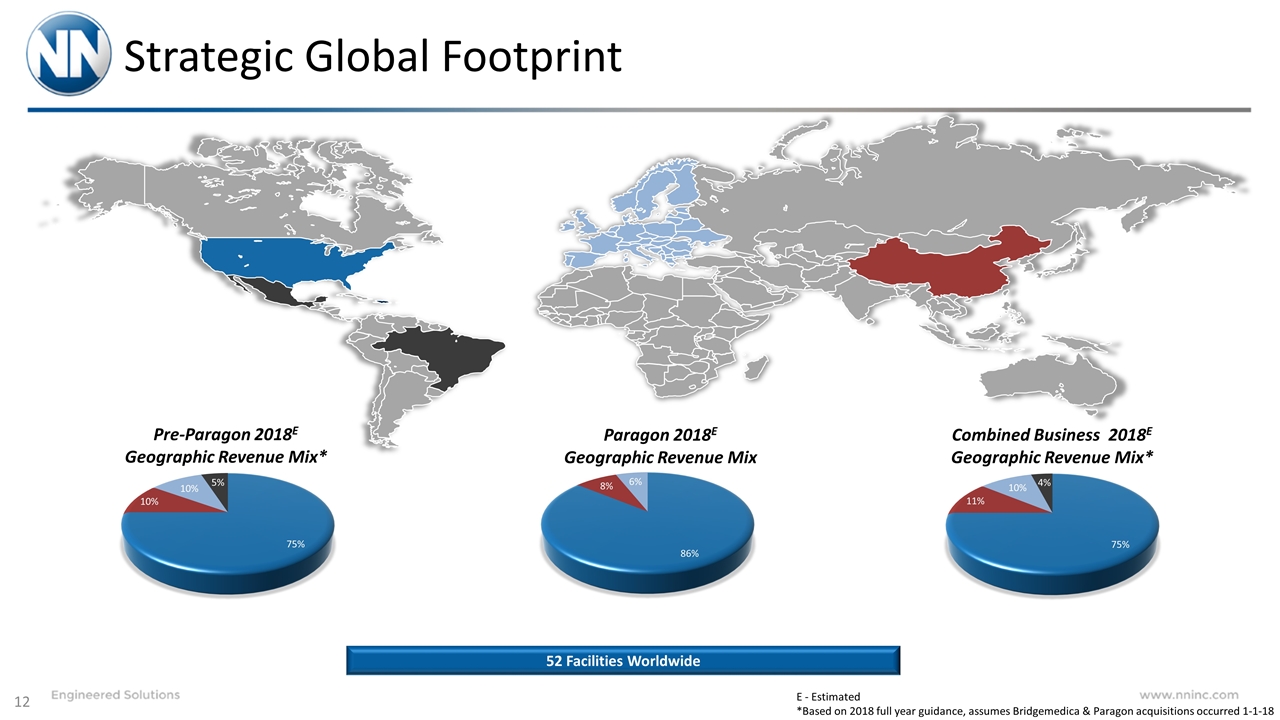
Strategic Global Footprint 52 Facilities Worldwide E - Estimated *Based on 2018 full year guidance, assumes Bridgemedica & Paragon acquisitions occurred 1-1-18 Pre-Paragon 2018E Geographic Revenue Mix* Paragon 2018E Geographic Revenue Mix Combined Business 2018E Geographic Revenue Mix*
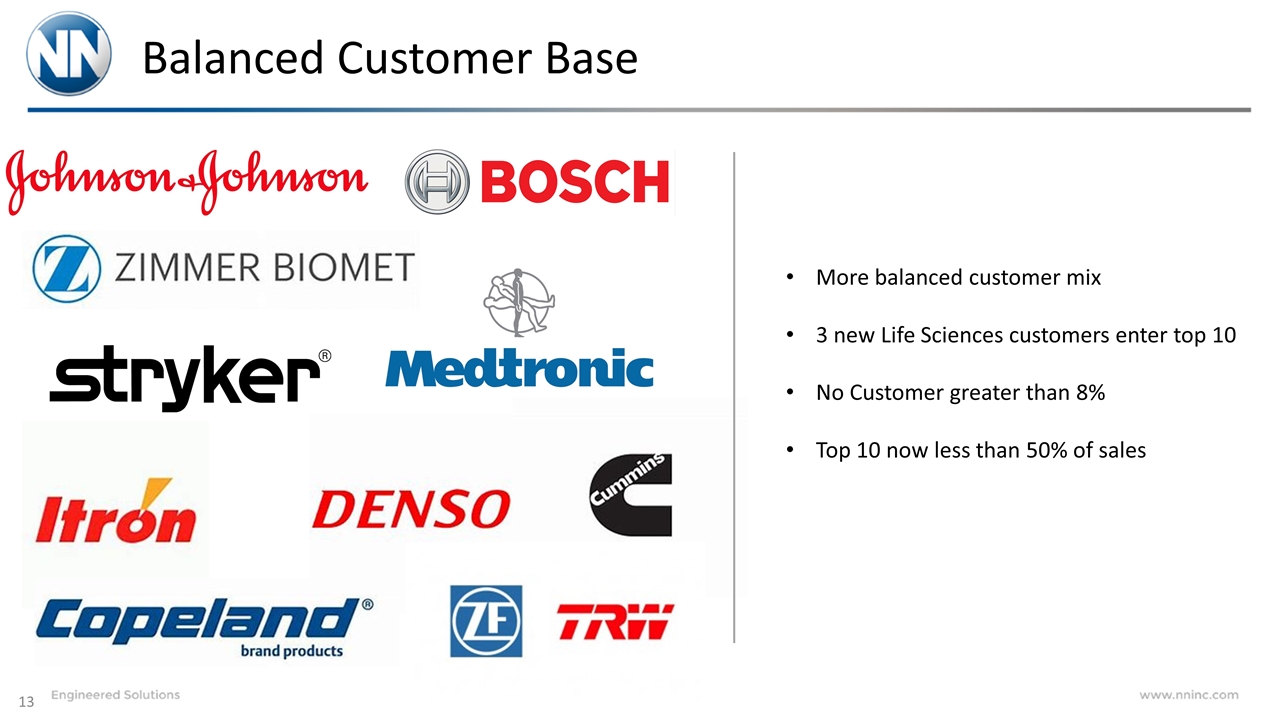
Balanced Customer Base More balanced customer mix 3 new Life Sciences customers enter top 10 No Customer greater than 8% Top 10 now less than 50% of sales
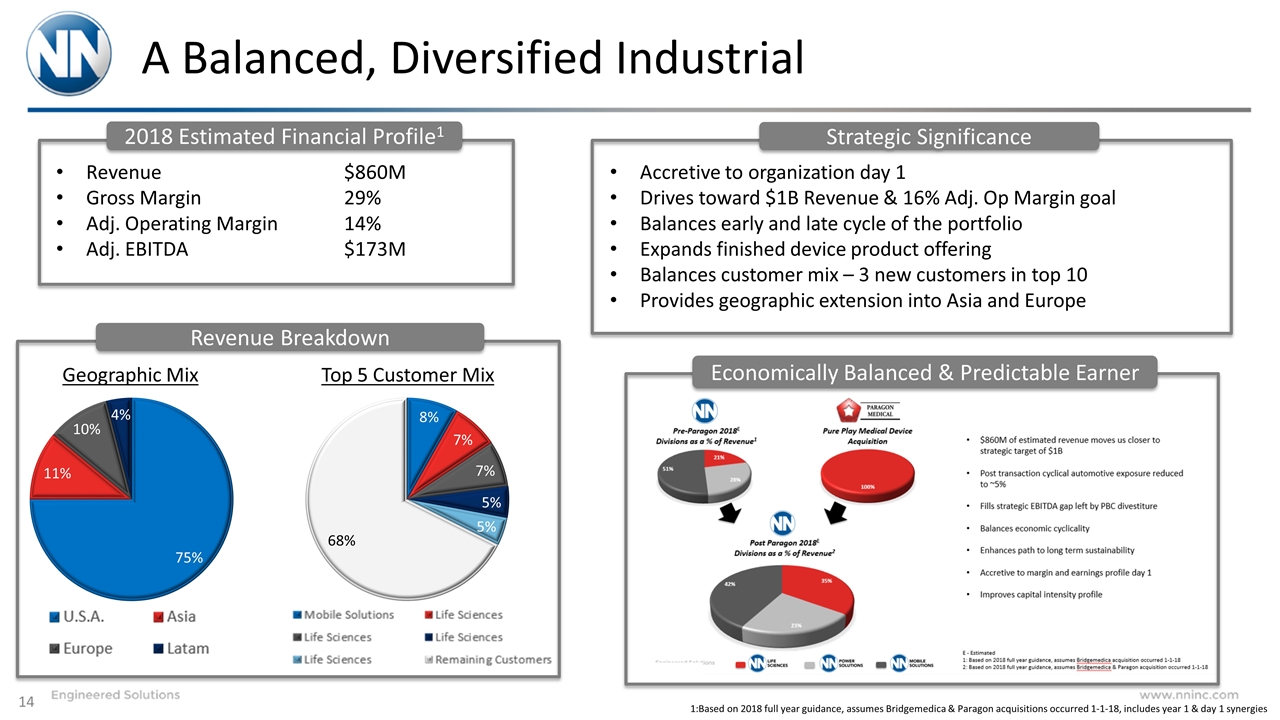
A Balanced, Diversified Industrial Geographic Mix Top 5 Customer Mix Revenue $860M Gross Margin29% Adj. Operating Margin14% Adj. EBITDA$173M 2018 Estimated Financial Profile1 Revenue Breakdown Economically Balanced & Predictable Earner Strategic Significance Accretive to organization day 1 Drives toward $1B Revenue & 16% Adj. Op Margin goal Balances early and late cycle of the portfolio Expands finished device product offering Balances customer mix – 3 new customers in top 10 Provides geographic extension into Asia and Europe 1:Based on 2018 full year guidance, assumes Bridgemedica & Paragon acquisitions occurred 1-1-18, includes year 1 & day 1 synergies
Engineered Solutions
