Attached files
| file | filename |
|---|---|
| 8-K - 8-K - EMC INSURANCE GROUP INC | cfanyinvestorslides.htm |
1
2018 Investor
Meetings
March-April
2
Cautionary Note Regarding
Forward-Looking Statements
The Private Securities Litigation Reform Act of 1995 provides issuers the opportunity to make cautionary
statements regarding forward-looking statements. Accordingly, any forward-looking statement contained in this
report is based on management’s current beliefs, assumptions and expectations of EMC Insurance Group Inc.’s
(the “Company’s”) future performance, taking all information currently available into account. These beliefs,
assumptions and expectations can change as the result of many possible events or factors, not all of which are
known to management. If a change occurs, the Company’s business, financial condition, liquidity, results of
operations, plans and objectives may vary materially from those expressed in the forward-looking statements. The
risks and uncertainties that may affect the actual results of the Company include, but are not limited to, the
following:
• catastrophic events and the occurrence of significant severe weather conditions;
• the adequacy of loss and settlement expense reserves;
• state and federal legislation and regulations;
• changes in the federal corporate tax rate and other effects of federal tax reform;
• changes in the property and casualty insurance industry, interest rates or the performance of financial markets
and the general economy;
• rating agency actions;
• “other-than-temporary” investment impairment losses; and
• other risks and uncertainties inherent to the Company’s business, including those discussed under the heading
“Risk Factors” in the Company’s Annual Report on Form 10-K.
Management intends to identify forward-looking statements when using the words “believe”, “expect”, “anticipate”,
“estimate”, “project”, “may”, “intend”, “likely” or similar expressions. Undue reliance should not be placed on these
forward-looking statements. The Company disclaims any obligation to update such statements or to announce
publicly the results of any revisions that it may make to any forward-looking statements to reflect the occurrence of
anticipated or unanticipated events or circumstances after the date of such statements.
3
Table of Contents
Page/Slide Number
Who We Are 4
Corporate Structure 5
Benefits of Pooling Agreement –
Direct Business 6
Benefits of Quota Share Agreement
with EMCC – Assumed Reinsurance 7
Intercompany Reinsurance Programs 8
Key Reasons to Invest in EMCI 9
2017 Premiums Earned 10
Diversified Book of Business 11-12
Benefits of Local Market Presence 13
2017 Direct Premiums Written by Branch (CL) 14
2017 Premium Distribution by Account Size (CL) 15
Unique and Powerful Rate Compare System 16
Page/Slide Number
Commercial Renewal Rates 17
Loss Cost Trend 18
GAAP Combined Ratios 19
Personal Lines Focused Accountability 20
Commercial Auto Trends 21
Investing in Innovation 22
Innovative Loss Control Services 23
Investment Portfolio 24
Increasing Stockholder Value 25
Appendix 26-36
4
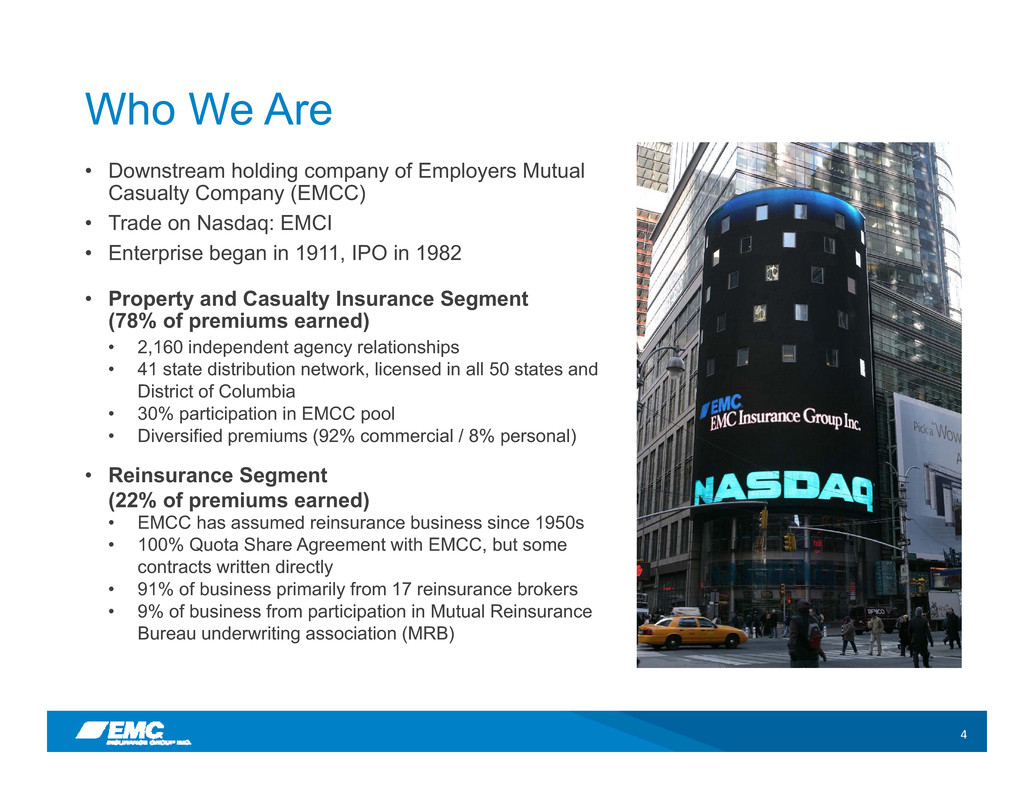
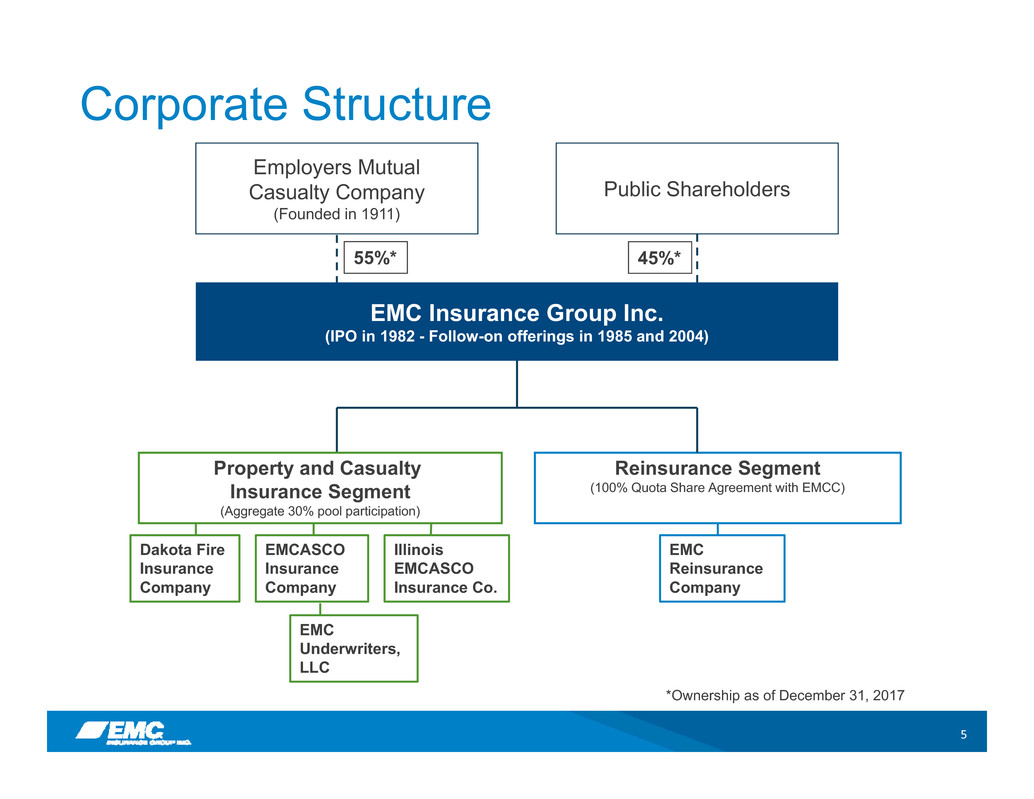
• Downstream holding company of Employers Mutual
Casualty Company (EMCC)
• Trade on Nasdaq: EMCI
• Enterprise began in 1911, IPO in 1982
• Property and Casualty Insurance Segment
(78% of premiums earned)
• 2,160 independent agency relationships
• 41 state distribution network, licensed in all 50 states and
District of Columbia
• 30% participation in EMCC pool
• Diversified premiums (92% commercial / 8% personal)
• Reinsurance Segment
(22% of premiums earned)
• EMCC has assumed reinsurance business since 1950s
• 100% Quota Share Agreement with EMCC, but some
contracts written directly
• 91% of business primarily from 17 reinsurance brokers
• 9% of business from participation in Mutual Reinsurance
Bureau underwriting association (MRB)
Who We Are
5
Corporate Structure
Reinsurance Segment
(100% Quota Share Agreement with EMCC)
Employers Mutual
Casualty Company
(Founded in 1911)
Public Shareholders
EMC Insurance Group Inc.
(IPO in 1982 - Follow-on offerings in 1985 and 2004)
55%* 45%*
*Ownership as of December 31, 2017
Dakota Fire
Insurance
Company
EMCASCO
Insurance
Company
Illinois
EMCASCO
Insurance Co.
EMC
Reinsurance
Company
EMC
Underwriters,
LLC
Property and Casualty
Insurance Segment
(Aggregate 30% pool participation)
6
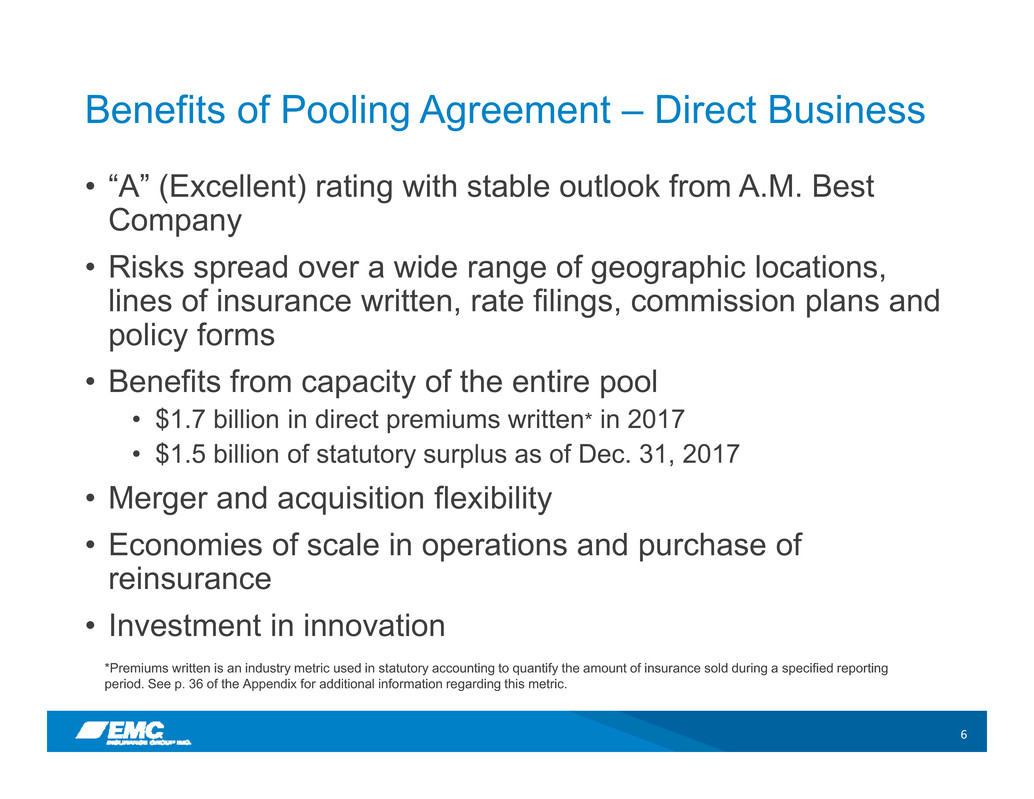
Benefits of Pooling Agreement – Direct Business
• “A” (Excellent) rating with stable outlook from A.M. Best
Company
• Risks spread over a wide range of geographic locations,
lines of insurance written, rate filings, commission plans and
policy forms
• Benefits from capacity of the entire pool
• $1.7 billion in direct premiums written* in 2017
• $1.5 billion of statutory surplus as of Dec. 31, 2017
• Merger and acquisition flexibility
• Economies of scale in operations and purchase of
reinsurance
• Investment in innovation
*Premiums written is an industry metric used in statutory accounting to quantify the amount of insurance sold during a specified reporting
period. See p. 36 of the Appendix for additional information regarding this metric.
7
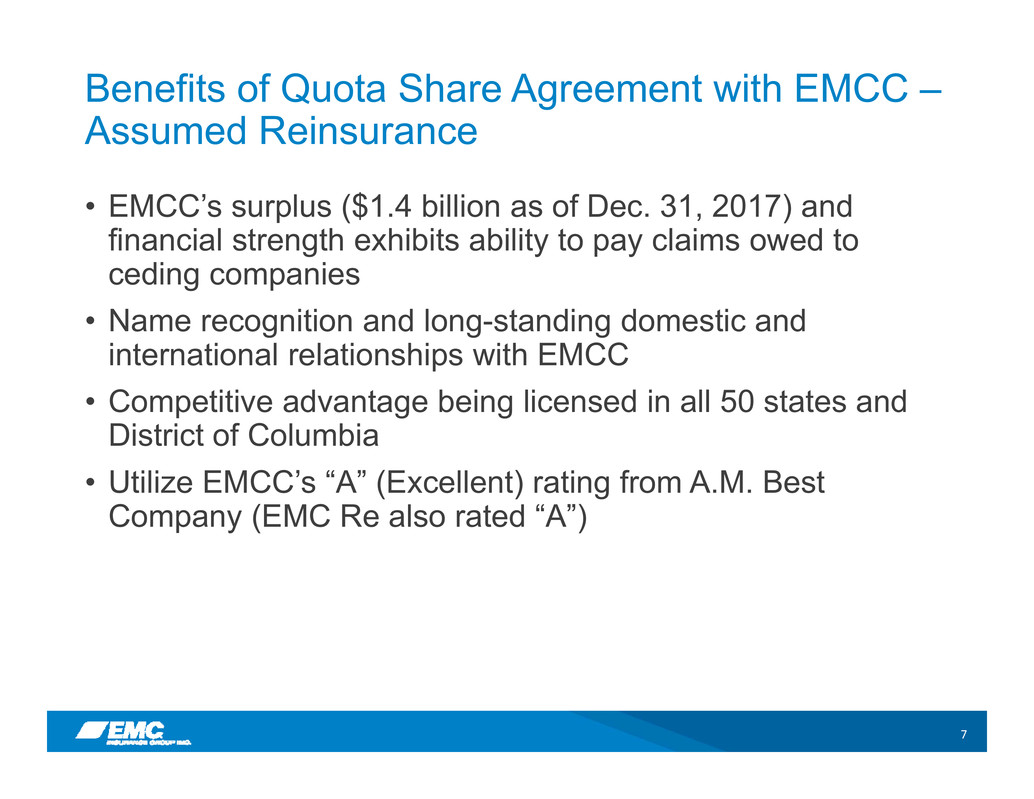
Benefits of Quota Share Agreement with EMCC –
Assumed Reinsurance
• EMCC’s surplus ($1.4 billion as of Dec. 31, 2017) and
financial strength exhibits ability to pay claims owed to
ceding companies
• Name recognition and long-standing domestic and
international relationships with EMCC
• Competitive advantage being licensed in all 50 states and
District of Columbia
• Utilize EMCC’s “A” (Excellent) rating from A.M. Best
Company (EMC Re also rated “A”)
8
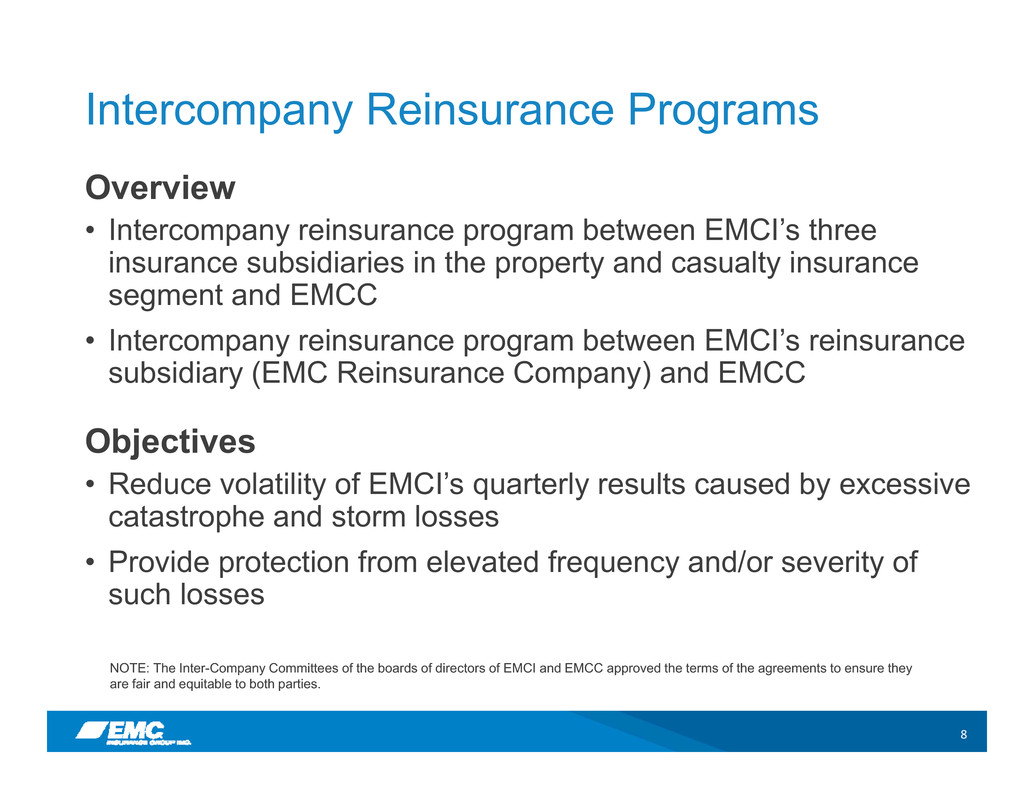
Intercompany Reinsurance Programs
Overview
• Intercompany reinsurance program between EMCI’s three
insurance subsidiaries in the property and casualty insurance
segment and EMCC
• Intercompany reinsurance program between EMCI’s reinsurance
subsidiary (EMC Reinsurance Company) and EMCC
Objectives
• Reduce volatility of EMCI’s quarterly results caused by excessive
catastrophe and storm losses
• Provide protection from elevated frequency and/or severity of
such losses
NOTE: The Inter-Company Committees of the boards of directors of EMCI and EMCC approved the terms of the agreements to ensure they
are fair and equitable to both parties.
9
Key Reasons to Invest in EMCI
• Access to large capital base
• Diversified, seasoned book
of business
• Regional, decentralized
operating structure
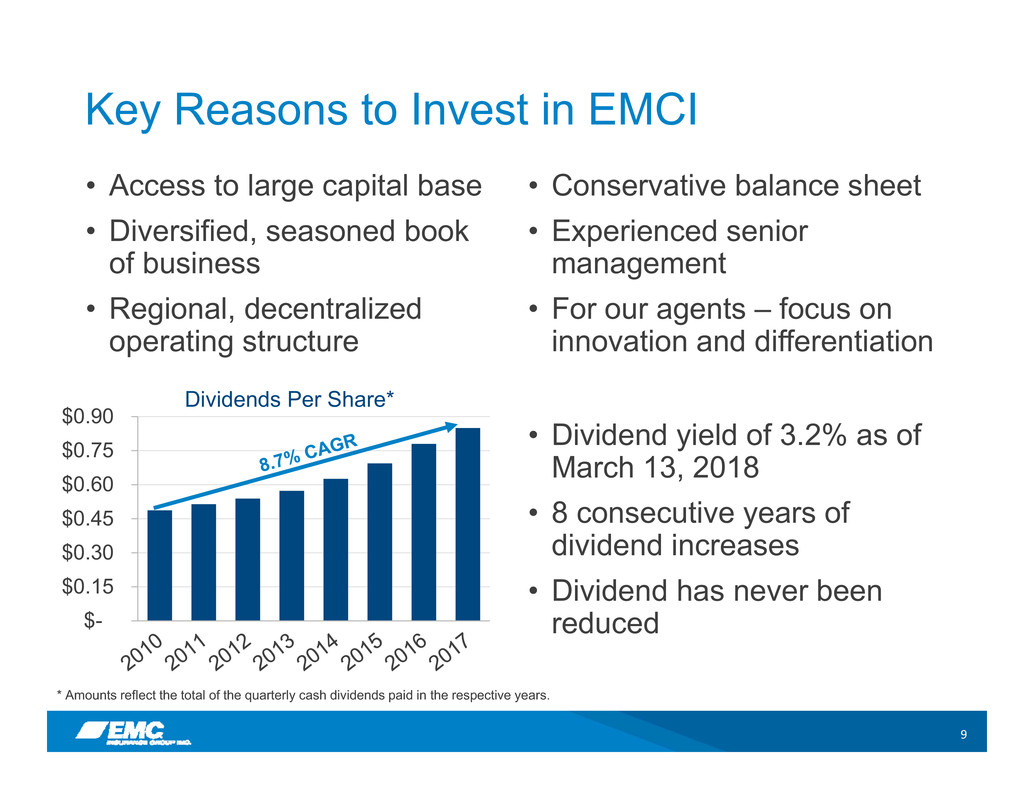
• Dividend yield of 3.2% as of
March 13, 2018
• 8 consecutive years of
dividend increases
• Dividend has never been
reduced $-
$0.15
$0.30
$0.45
$0.60
$0.75
$0.90
Dividends Per Share*
• Conservative balance sheet
• Experienced senior
management
• For our agents – focus on
innovation and differentiation
* Amounts reflect the total of the quarterly cash dividends paid in the respective years.
10
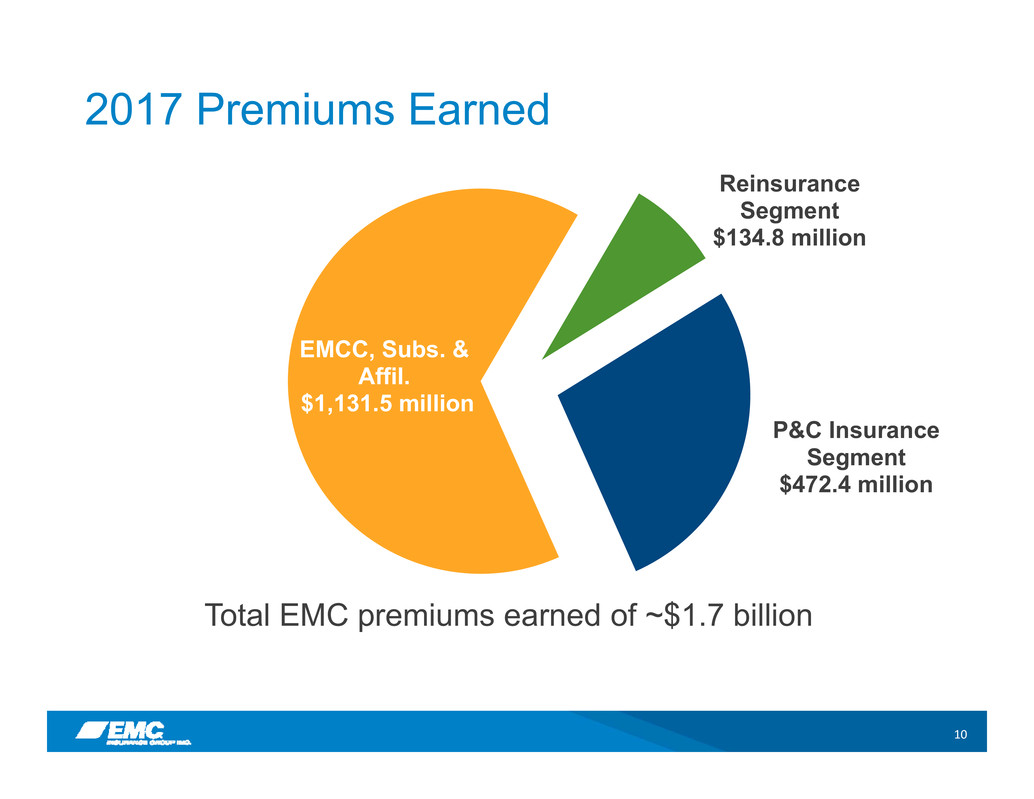
EMCC, Subs. &
Affil.
$1,131.5 million
Reinsurance
Segment
$134.8 million
P&C Insurance
Segment
$472.4 million
2017 Premiums Earned
Total EMC premiums earned of ~$1.7 billion
11
Diversified Book of Business
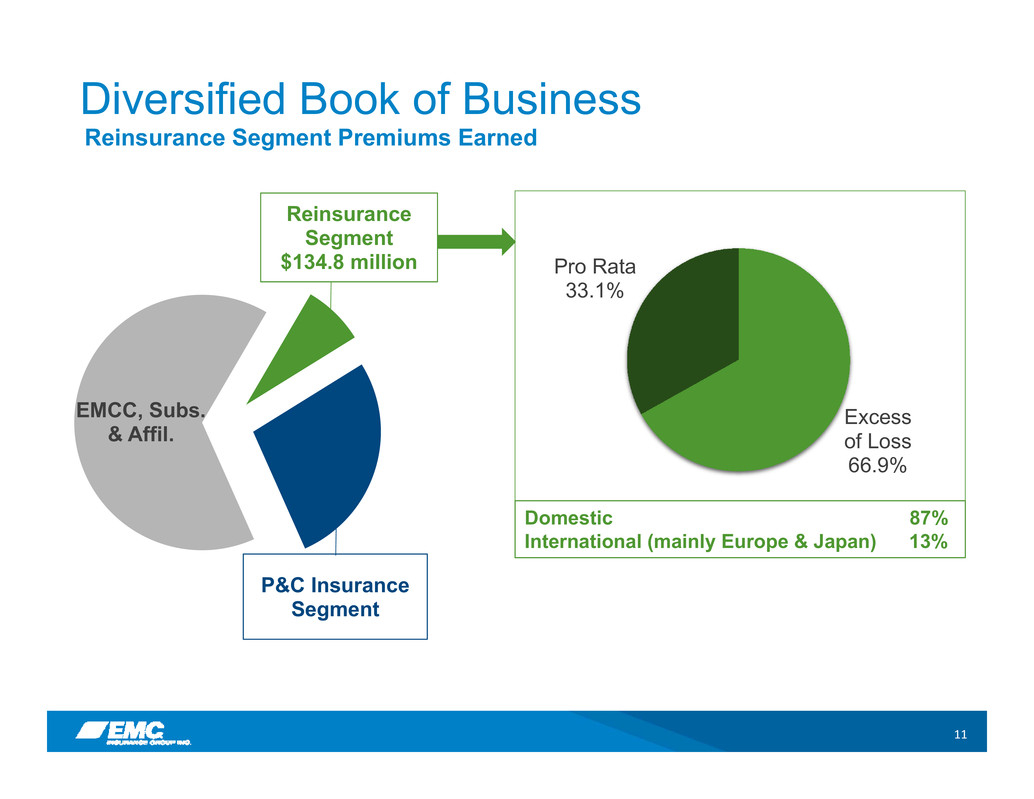
Reinsurance Segment Premiums Earned
Excess
of Loss
66.9%
Pro Rata
33.1%
EMCC, Subs.
& Affil.
Reinsurance
Segment
$134.8 million
P&C Insurance
Segment
Domestic 87%
International (mainly Europe & Japan) 13%
12
EMCC, Subs.
& Affil.
Reinsurance
Segment
P&C Insurance
Segment
$472.4 million
Diversified Book of Business
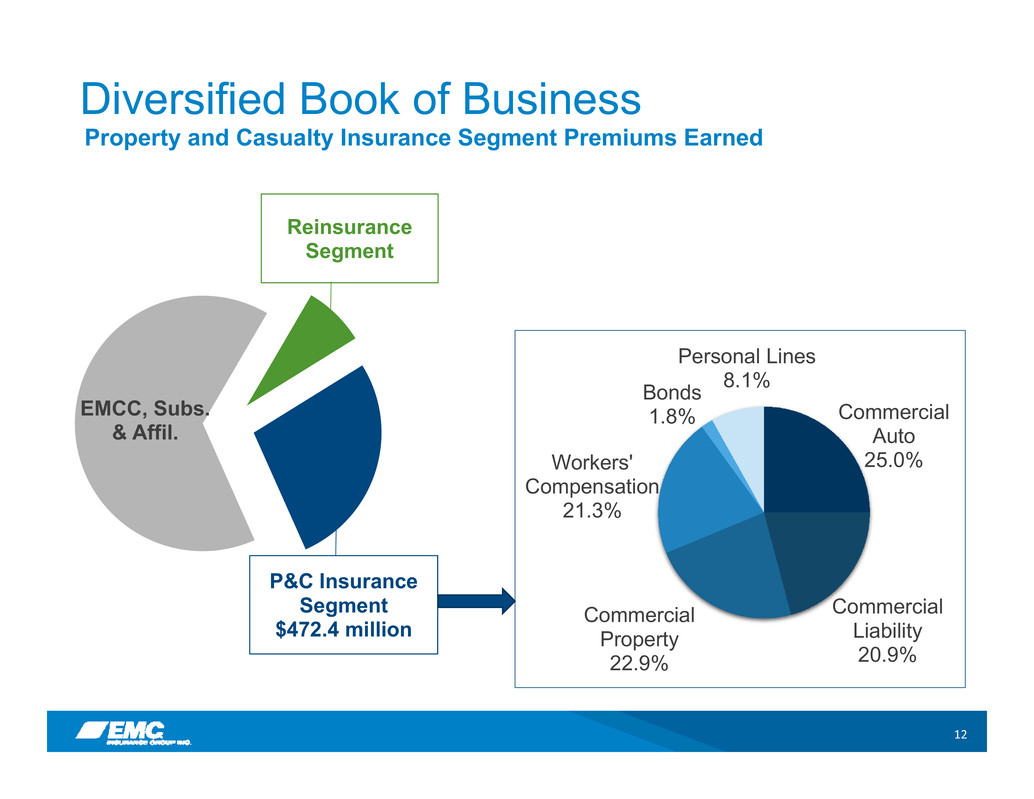
Property and Casualty Insurance Segment Premiums Earned
Commercial
Auto
25.0%
Commercial
Liability
20.9%
Commercial
Property
22.9%
Workers'
Compensation
21.3%
Bonds
1.8%
Personal Lines
8.1%
13
Benefits of Local Market Presence
• Decentralized decision making/guided autonomy:
• Marketing
• Underwriting
• Risk improvement
• Claims
• Strengthens agency relationships, which we believe
allows us to quote agent’s best business
• Develop products, marketing strategies and pricing
targeted to specific territories
• Individual approaches within EMC risk appetite and
framework
• Retention level consistently stays between 80%-90%
• 85.8% at December 31, 2017
14
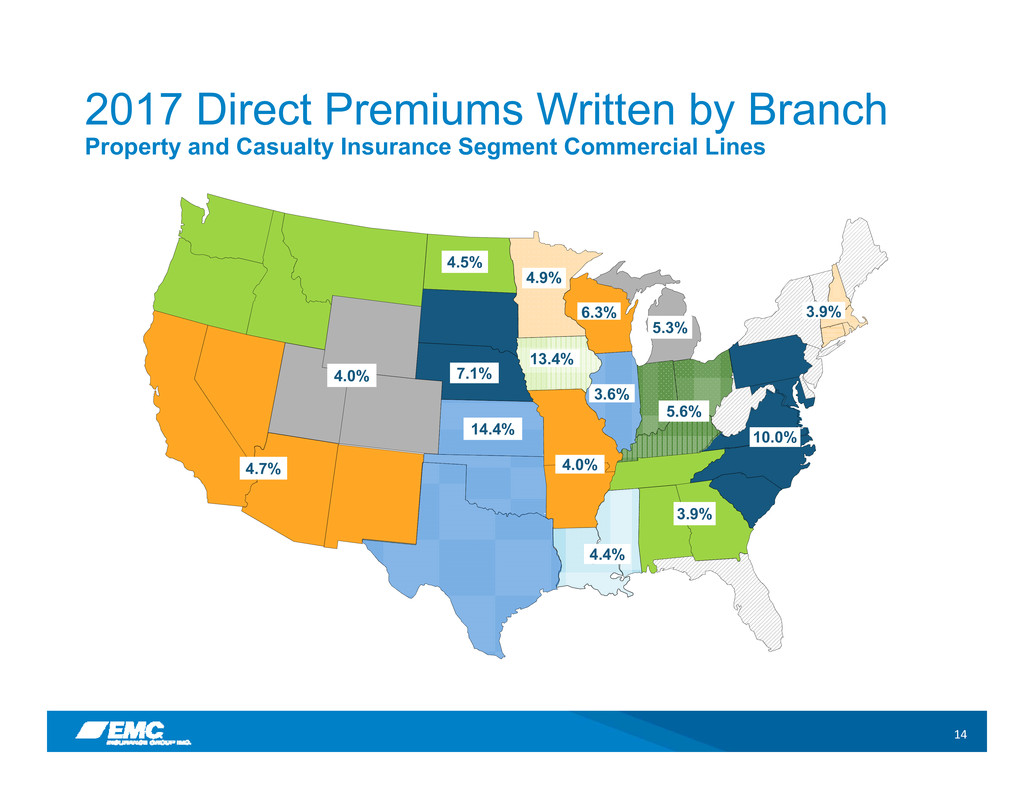
6.3%
4.9%
13.4%
7.1%
3.6%
4.5%
4.7%
4.0%
14.4%
4.0%
5.3%
4.4%
3.9%
5.6%
10.0%
3.9%
2017 Direct Premiums Written by Branch
Property and Casualty Insurance Segment Commercial Lines
15
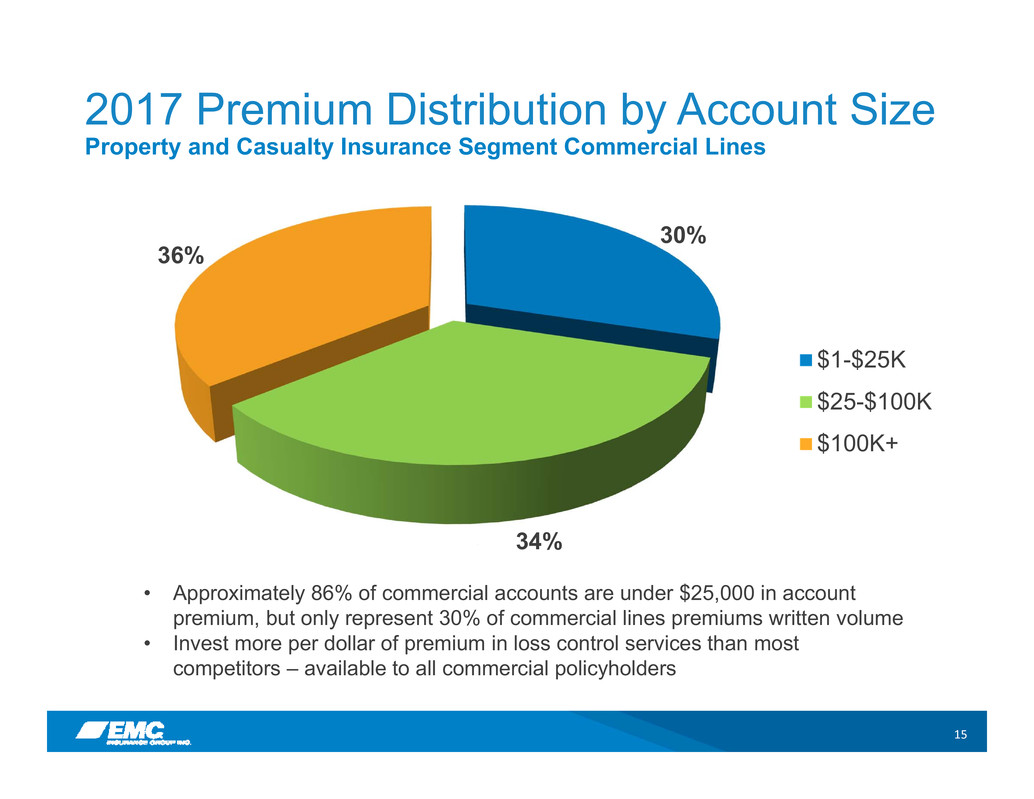
30%
34%
36%
$1-$25K
$25-$100K
$100K+
2017 Premium Distribution by Account Size
• Approximately 86% of commercial accounts are under $25,000 in account
premium, but only represent 30% of commercial lines premiums written volume
• Invest more per dollar of premium in loss control services than most
competitors – available to all commercial policyholders
Property and Casualty Insurance Segment Commercial Lines
16
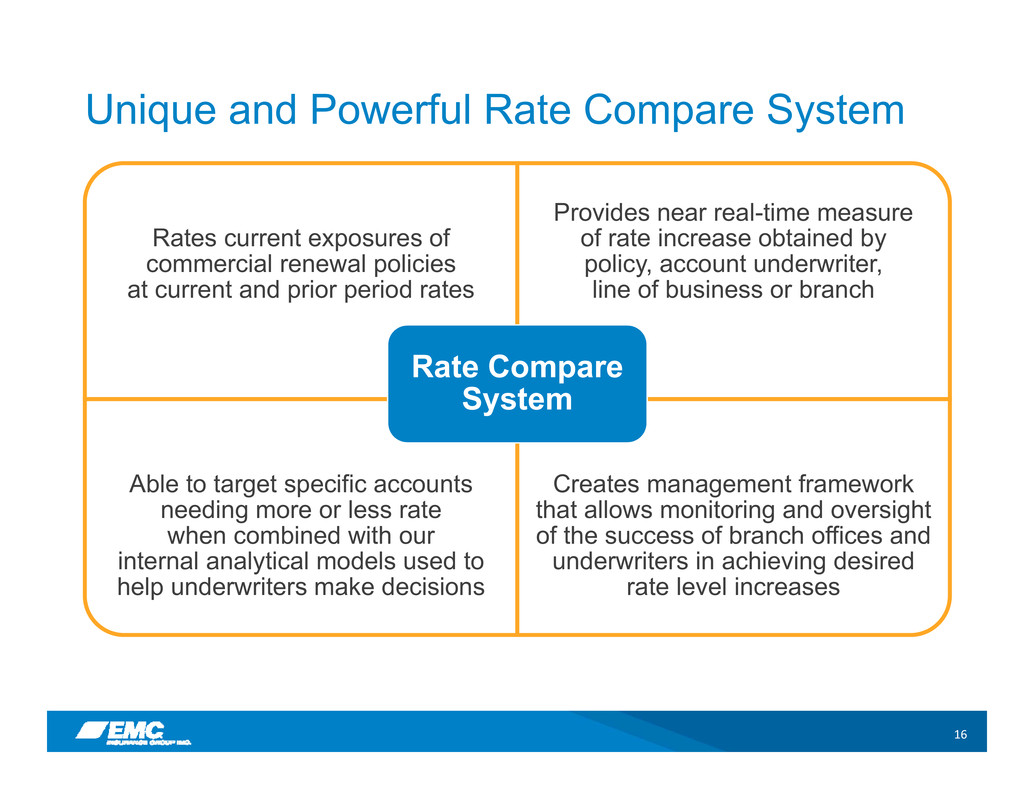
Unique and Powerful Rate Compare System
Rates current exposures of
commercial renewal policies
at current and prior period rates
Provides near real-time measure
of rate increase obtained by
policy, account underwriter,
line of business or branch
Able to target specific accounts
needing more or less rate
when combined with our
internal analytical models used to
help underwriters make decisions
Creates management framework
that allows monitoring and oversight
of the success of branch offices and
underwriters in achieving desired
rate level increases
Rate Compare
System
17
Commercial Renewal Rates
-2%
-1%
0%
1%
2%
3%
4%
5%
6%
7%
8%
2010 2011 2012 2013 2014 2015 2016 2017
P
r
i
o
r
P
e
r
i
o
d
P
e
r
c
e
n
t
a
g
e
C
h
a
n
g
e
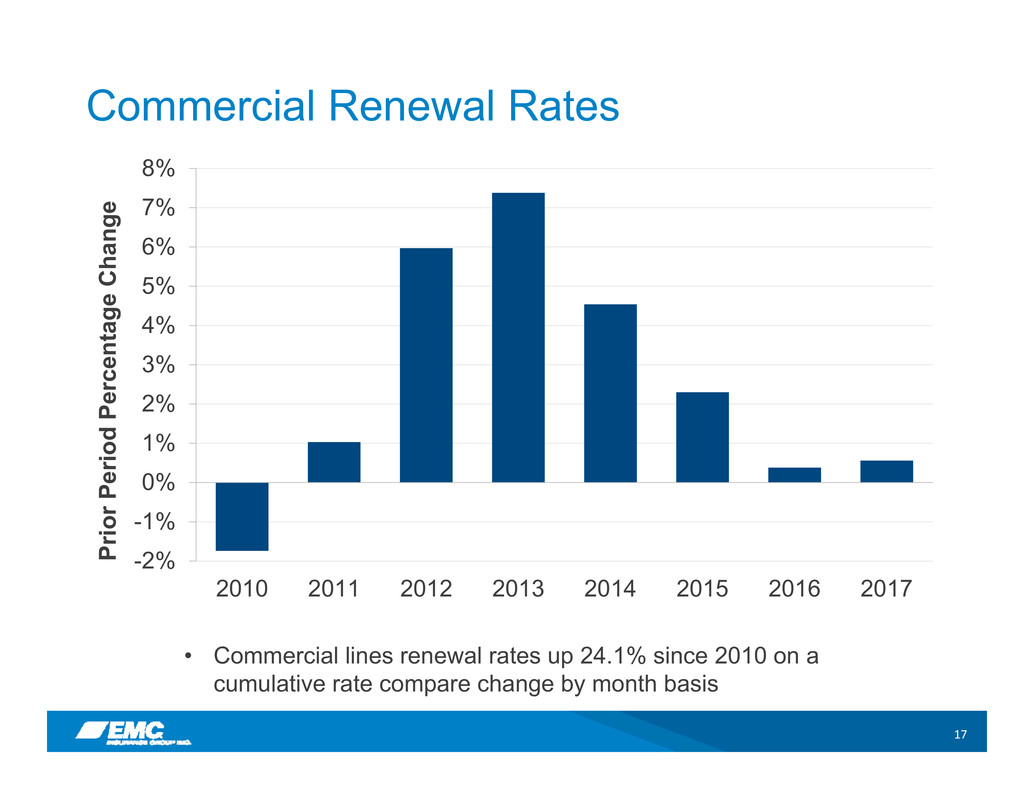
• Commercial lines renewal rates up 24.1% since 2010 on a
cumulative rate compare change by month basis
18
Loss Cost Trend
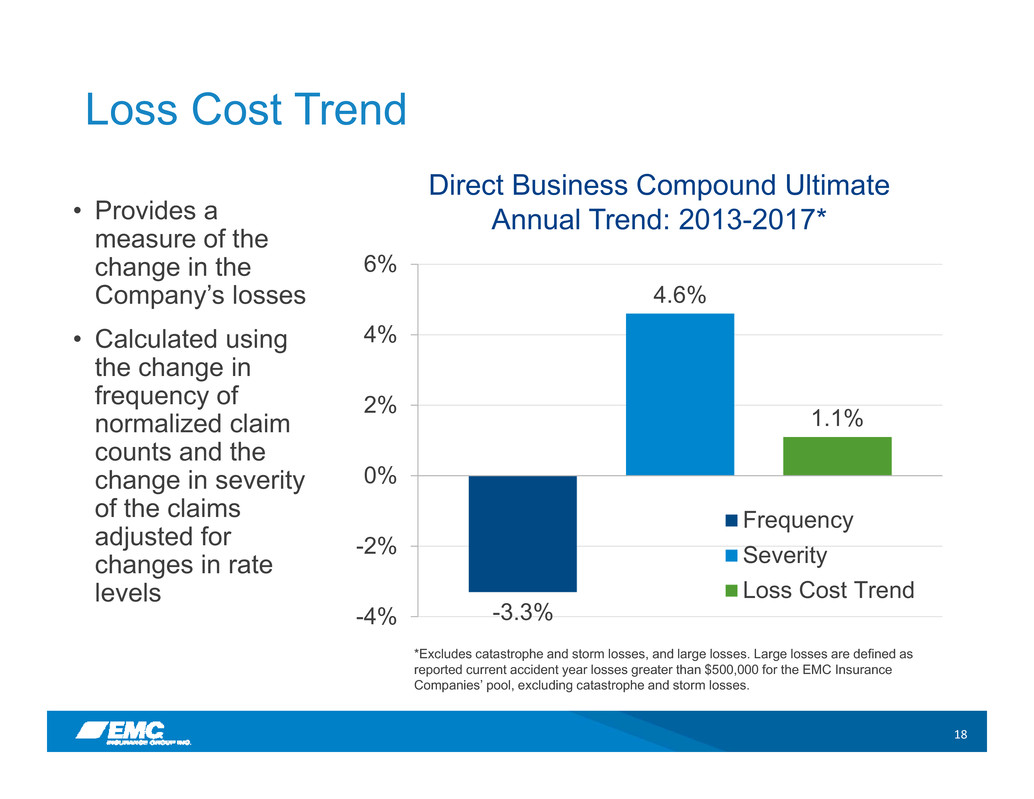
• Provides a
measure of the
change in the
Company’s losses
• Calculated using
the change in
frequency of
normalized claim
counts and the
change in severity
of the claims
adjusted for
changes in rate
levels
Direct Business Compound Ultimate
Annual Trend: 2013-2017*
*Excludes catastrophe and storm losses, and large losses. Large losses are defined as
reported current accident year losses greater than $500,000 for the EMC Insurance
Companies’ pool, excluding catastrophe and storm losses.
-3.3%
4.6%
1.1%
-4%
-2%
0%
2%
4%
6%
Frequency
Severity
Loss Cost Trend
19
88.5% 91.3% 88.5% 89.6% 91.4%
9.4% 10.6% 7.8% 8.1%
9.9%
0%
10%
20%
30%
40%
50%
60%
70%
80%
90%
100%
110%
2013 2014 2015 2016 2017
Catastrophe and Storm Losses
GAAP Combined Ratio Excluding Catastrophe and Storm Losses
101.3%97.7%
GAAP Combined Ratios
97.9% 96.3%
101.9%
20
Premiums Written
Less than $600,000
$600,001 - $1,500,000
$1,500,001 - $3,000,000
$3,000,001 - $4,500,000
Over $4,500,000
None
3.4%
6.6%
20.4%
5.9%
4.2%
5.9%
7.3%
2.8%
4.3%
2.5%
6.3%
1.0%
2.3%
7.3%
1.8%
Personal Lines Focused Accountability
2017 Direct Premiums Written by State
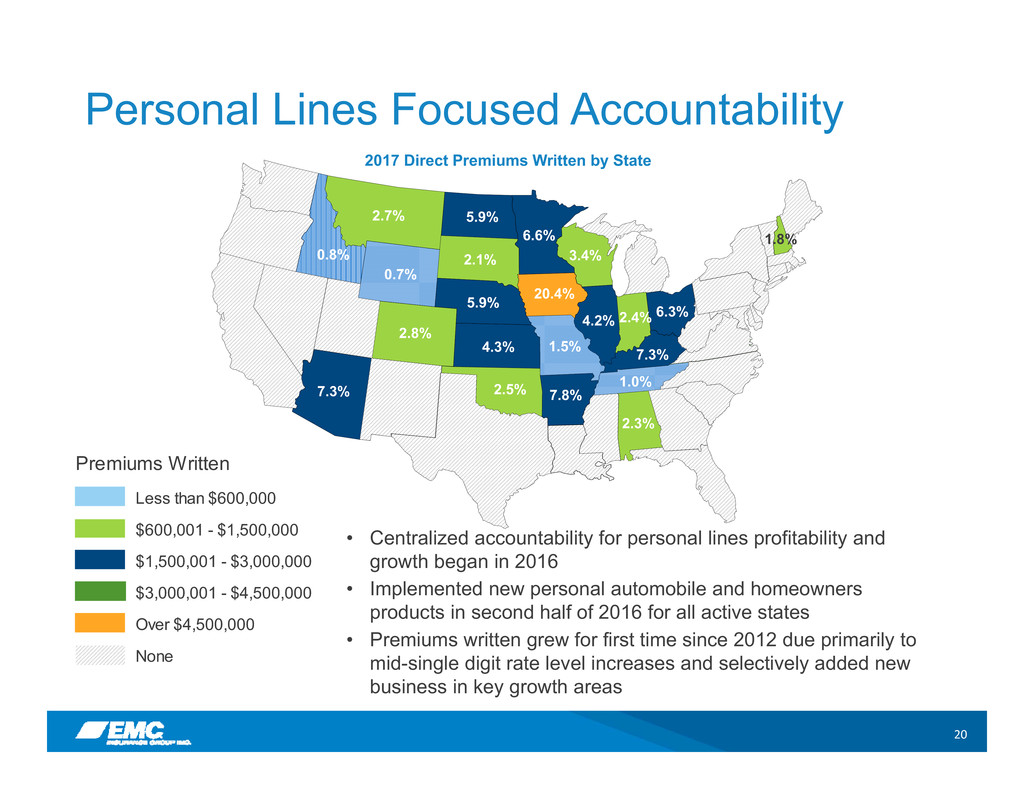
• Centralized accountability for personal lines profitability and
growth began in 2016
• Implemented new personal automobile and homeowners
products in second half of 2016 for all active states
• Premiums written grew for first time since 2012 due primarily to
mid-single digit rate level increases and selectively added new
business in key growth areas
1.5%
7.8%
2.4%
0.8%
2.7%
0.7%
2.1%
21
Commercial Auto Trends
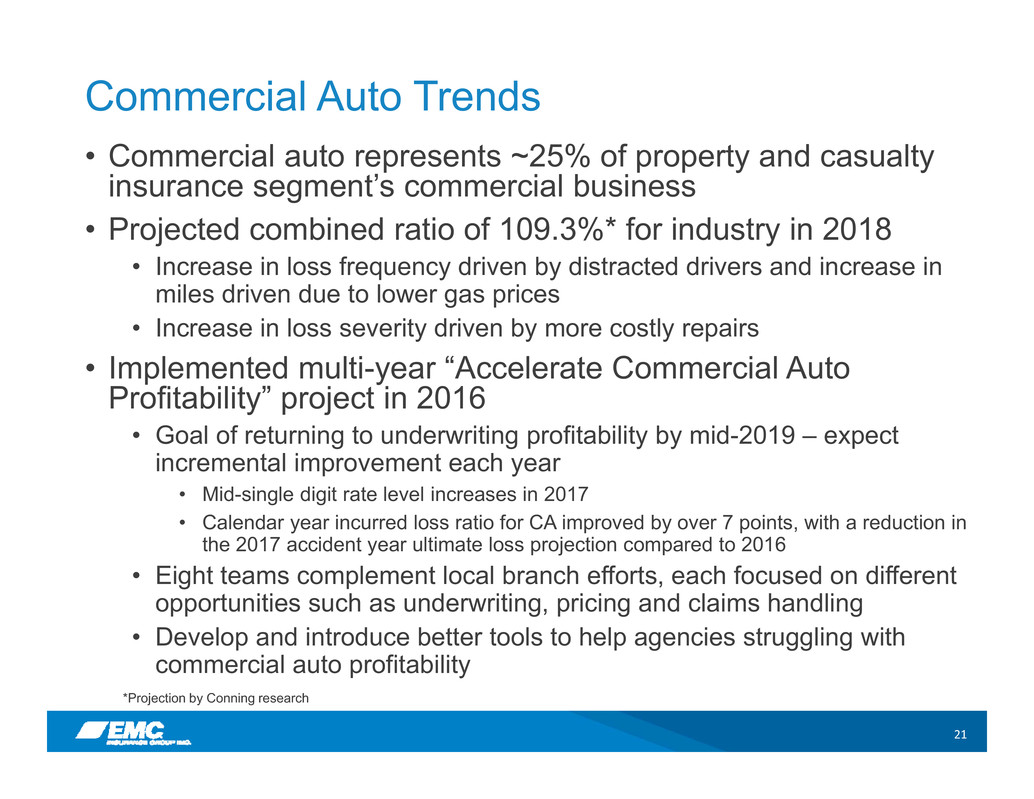
• Commercial auto represents ~25% of property and casualty
insurance segment’s commercial business
• Projected combined ratio of 109.3%* for industry in 2018
• Increase in loss frequency driven by distracted drivers and increase in
miles driven due to lower gas prices
• Increase in loss severity driven by more costly repairs
• Implemented multi-year “Accelerate Commercial Auto
Profitability” project in 2016
• Goal of returning to underwriting profitability by mid-2019 – expect
incremental improvement each year
• Mid-single digit rate level increases in 2017
• Calendar year incurred loss ratio for CA improved by over 7 points, with a reduction in
the 2017 accident year ultimate loss projection compared to 2016
• Eight teams complement local branch efforts, each focused on different
opportunities such as underwriting, pricing and claims handling
• Develop and introduce better tools to help agencies struggling with
commercial auto profitability
*Projection by Conning research
22
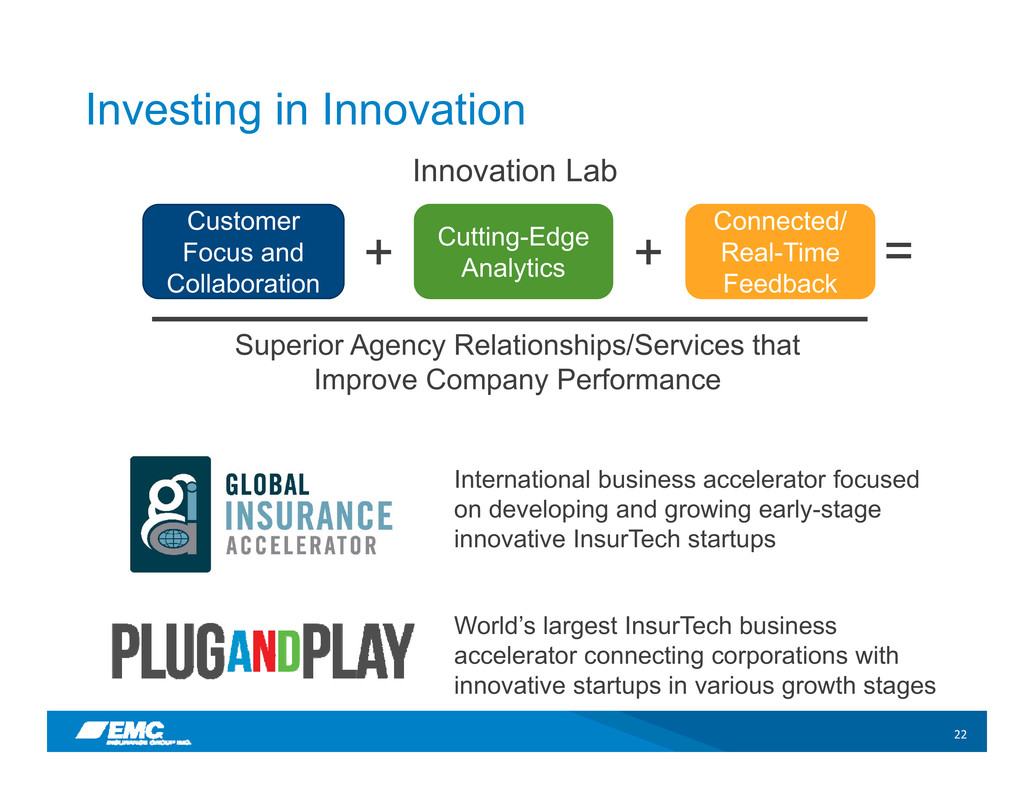
Investing in Innovation
International business accelerator focused
on developing and growing early-stage
innovative InsurTech startups
Innovation Lab
Customer
Focus and
Collaboration
Cutting-Edge
Analytics
Connected/
Real-Time
Feedback
+ +
Superior Agency Relationships/Services that
Improve Company Performance
=
World’s largest InsurTech business
accelerator connecting corporations with
innovative startups in various growth stages
23
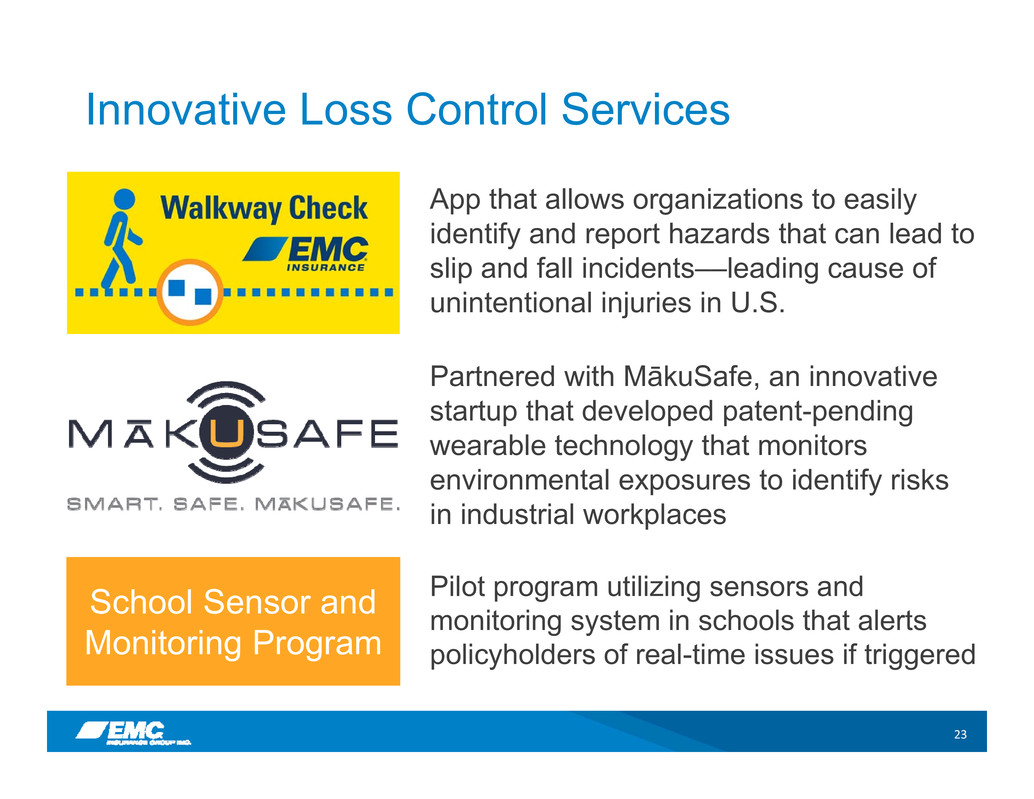
Innovative Loss Control Services
App that allows organizations to easily
identify and report hazards that can lead to
slip and fall incidents––leading cause of
unintentional injuries in U.S.
Partnered with MākuSafe, an innovative
startup that developed patent-pending
wearable technology that monitors
environmental exposures to identify risks
in industrial workplaces
Pilot program utilizing sensors and
monitoring system in schools that alerts
policyholders of real-time issues if triggered
School Sensor and
Monitoring Program
24
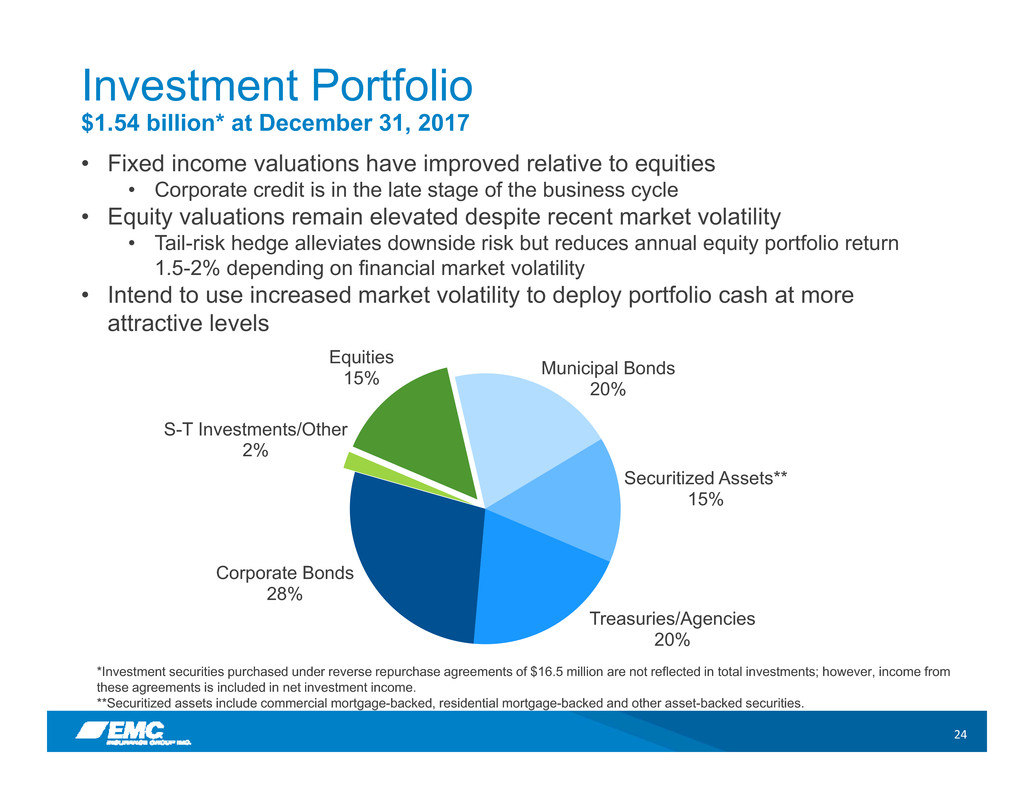
Investment Portfolio
$1.54 billion* at December 31, 2017
*Investment securities purchased under reverse repurchase agreements of $16.5 million are not reflected in total investments; however, income from
these agreements is included in net investment income.
**Securitized assets include commercial mortgage-backed, residential mortgage-backed and other asset-backed securities.
• Fixed income valuations have improved relative to equities
• Corporate credit is in the late stage of the business cycle
• Equity valuations remain elevated despite recent market volatility
• Tail-risk hedge alleviates downside risk but reduces annual equity portfolio return
1.5-2% depending on financial market volatility
• Intend to use increased market volatility to deploy portfolio cash at more
attractive levels
Treasuries/Agencies
20%
Corporate Bonds
28%
S-T Investments/Other
2%
Equities
15% Municipal Bonds20%
Securitized Assets**
15%

25
$-
$5
$10
$15
$20
$25
$30
$35
2013 2014 2015 2016 2017*
Book Value Per Share Cumulative Dividends Per Share
*Approximately $0.42 per share of the book value per share increase in 2017 it attributable to a one-time deferred income tax benefit resulting from the
enactment of the Tax Cuts and Jobs Act of 2017.
Increasing Stockholder Value
26
Appendix
27
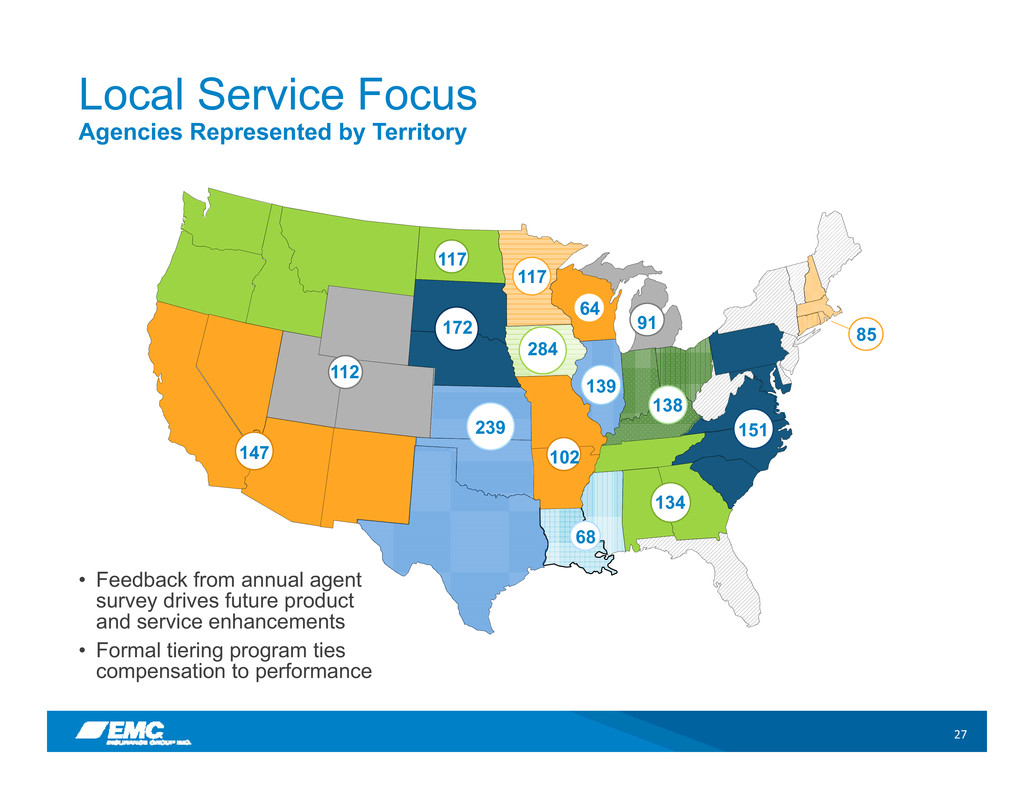
Local Service Focus
Agencies Represented by Territory
z64
117
139
117
147
112
102
91
68
134
138
151
85172
284
239
• Feedback from annual agent
survey drives future product
and service enhancements
• Formal tiering program ties
compensation to performance
28
$0
$10,000
$20,000
$30,000
$40,000
$50,000
$60,000
$70,000
2013 2014 2015 2016 2017
Target Market Safety Group
(
$
i
n
t
h
o
u
s
a
n
d
s
)
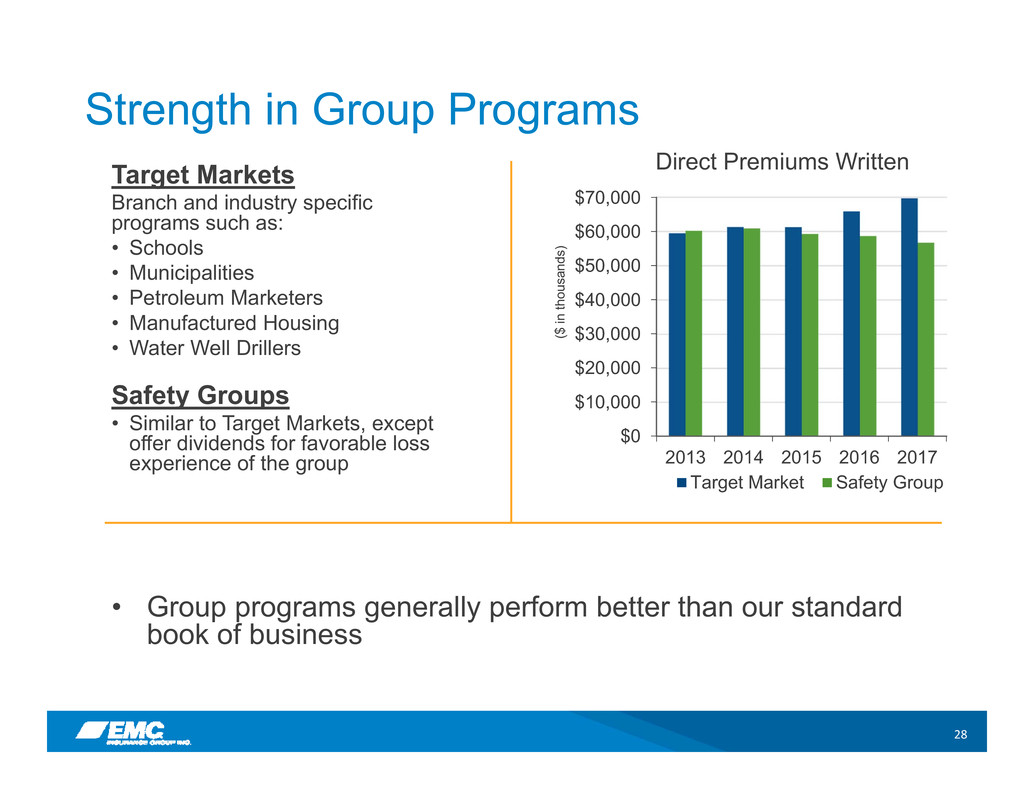
Strength in Group Programs
Direct Premiums WrittenTarget Markets
Branch and industry specific
programs such as:
• Schools
• Municipalities
• Petroleum Marketers
• Manufactured Housing
• Water Well Drillers
Safety Groups
• Similar to Target Markets, except
offer dividends for favorable loss
experience of the group
• Group programs generally perform better than our standard
book of business
29
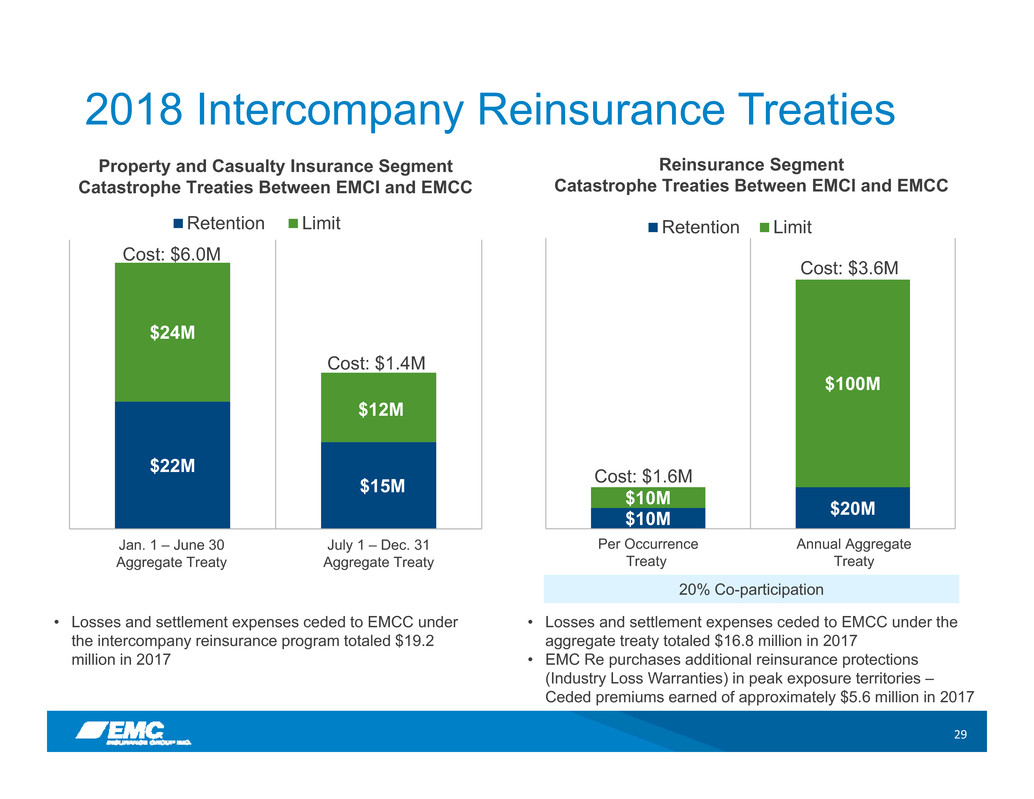
2018 Intercompany Reinsurance Treaties
$22M
$15M
$24M
$12M
JANUARY 1 - JUNE 30
AGGREGATE TREATY
JULY 1 - DECEMBER 31
AGGREGATE TREATY
Retention Limit
Cost: $6.0M
Property and Casualty Insurance Segment
Catastrophe Treaties Between EMCI and EMCC
Cost: $1.4M
$10M $20M
$10M
$100M
ONE‐T IME PER OCCURRENCE
TREATY
ANNUAL AGGREGATE TREATY
Retention Limit
Reinsurance Segment
Catastrophe Treaties Between EMCI and EMCC
Cost: $1.6M
Cost: $3.6M
Per Occurrence
Treaty
Annual Aggregate
Treaty
Jan. 1 – June 30
Aggregate Treaty
July 1 – Dec. 31
Aggregate Treaty
20% Co-participation
• Losses and settlement expenses ceded to EMCC under the
aggregate treaty totaled $16.8 million in 2017
• EMC Re purchases additional reinsurance protections
(Industry Loss Warranties) in peak exposure territories –
Ceded premiums earned of approximately $5.6 million in 2017
• Losses and settlement expenses ceded to EMCC under
the intercompany reinsurance program totaled $19.2
million in 2017
30
Award-Winning Workplace
• No. 2 Ranking on Best Companies for
Leaders (Chief Executive)
• No. 16 Top Workplaces in Iowa
(The Des Moines Register)
• Best Property/Casualty Company in
Des Moines (Business Record)
• Plan Sponsor of the Year
(PLANSPONSOR)
• American Heart Association’s Platinum
Level Fit-Friendly Worksite
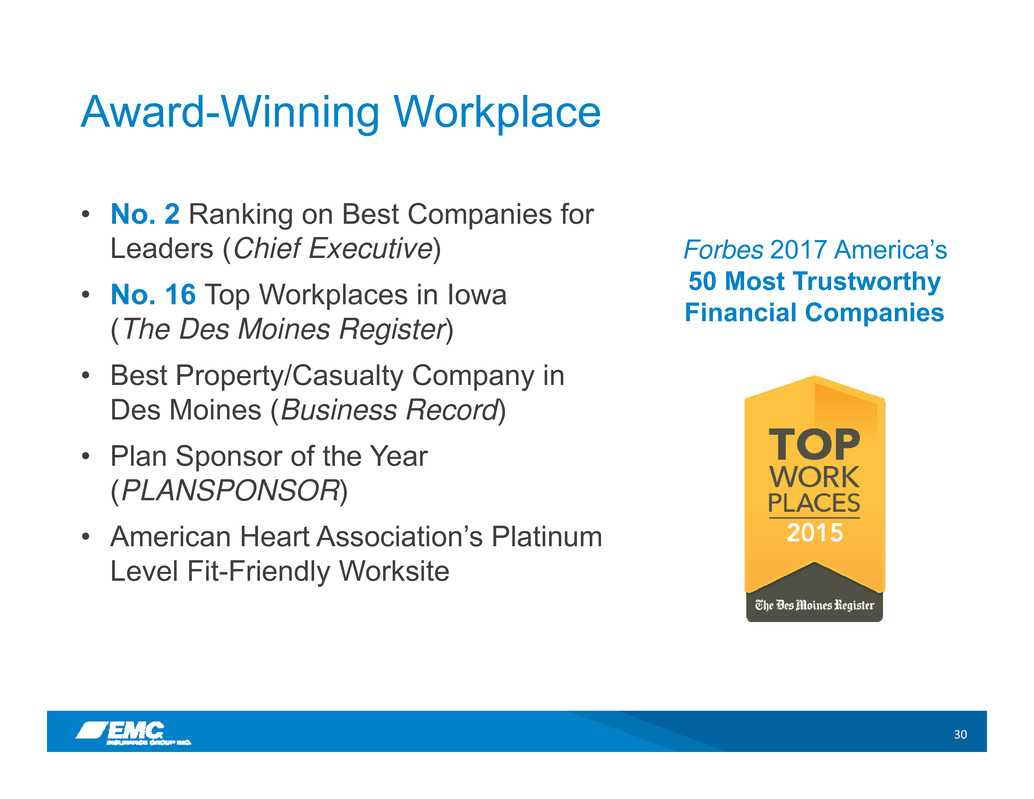
Forbes 2017 America’s
50 Most Trustworthy
Financial Companies
31
Experienced Executive Management Team
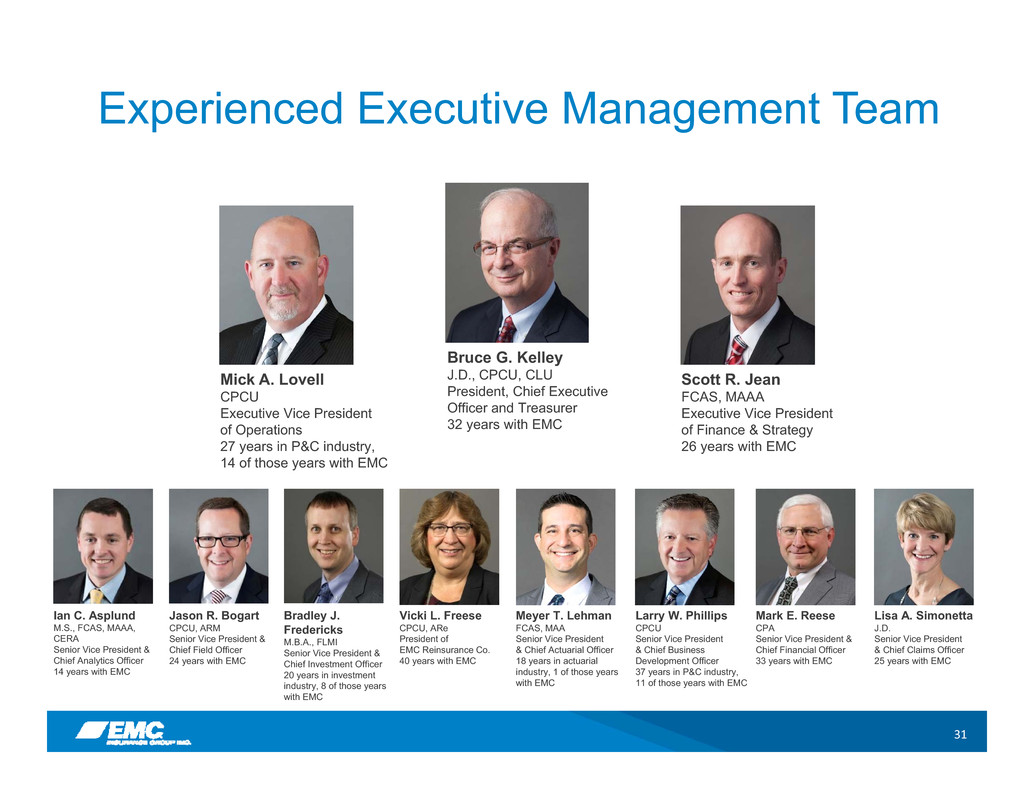
Vicki L. Freese
CPCU, ARe
President of
EMC Reinsurance Co.
40 years with EMC
Mick A. Lovell
CPCU
Executive Vice President
of Operations
27 years in P&C industry,
14 of those years with EMC
Bruce G. Kelley
J.D., CPCU, CLU
President, Chief Executive
Officer and Treasurer
32 years with EMC
Scott R. Jean
FCAS, MAAA
Executive Vice President
of Finance & Strategy
26 years with EMC
Ian C. Asplund
M.S., FCAS, MAAA,
CERA
Senior Vice President &
Chief Analytics Officer
14 years with EMC
Jason R. Bogart
CPCU, ARM
Senior Vice President &
Chief Field Officer
24 years with EMC
Bradley J.
Fredericks
M.B.A., FLMI
Senior Vice President &
Chief Investment Officer
20 years in investment
industry, 8 of those years
with EMC
Larry W. Phillips
CPCU
Senior Vice President
& Chief Business
Development Officer
37 years in P&C industry,
11 of those years with EMC
Mark E. Reese
CPA
Senior Vice President &
Chief Financial Officer
33 years with EMC
Lisa A. Simonetta
J.D.
Senior Vice President
& Chief Claims Officer
25 years with EMC
Meyer T. Lehman
FCAS, MAA
Senior Vice President
& Chief Actuarial Officer
18 years in actuarial
industry, 1 of those years
with EMC
32
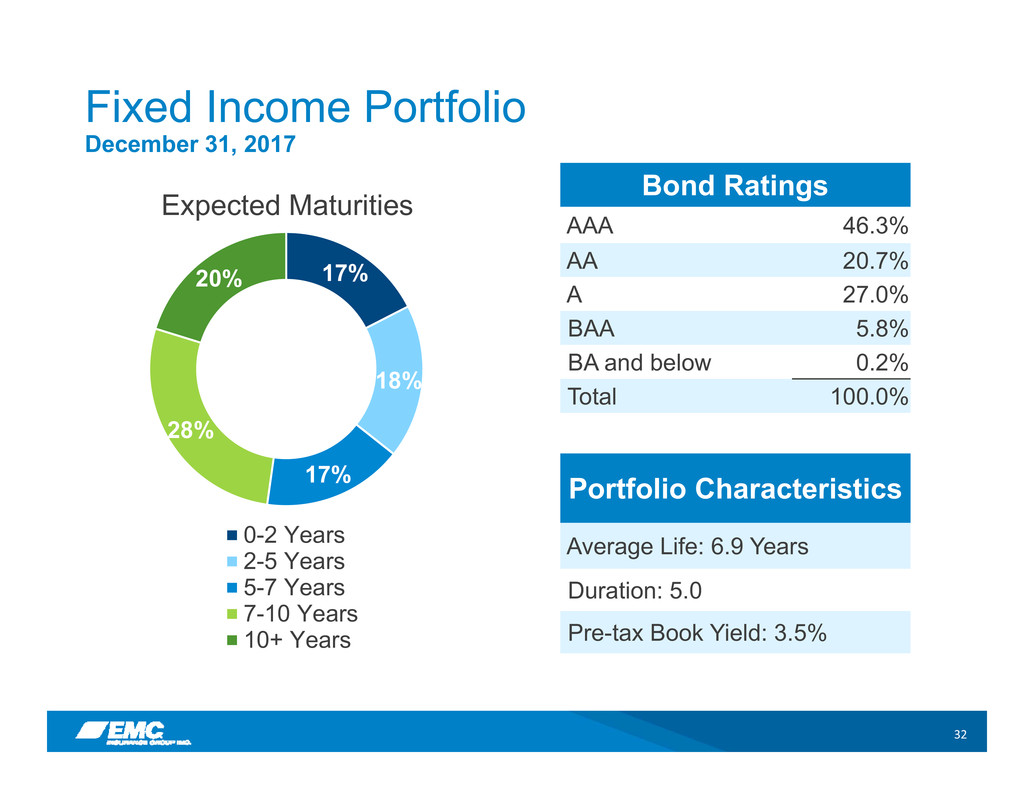
17%
18%
17%
28%
20%
Expected Maturities
0-2 Years
2-5 Years
5-7 Years
7-10 Years
10+ Years
Fixed Income Portfolio
December 31, 2017
Bond Ratings
AAA 46.3%
AA 20.7%
A 27.0%
BAA 5.8%
BA and below 0.2%
Total 100.0%
Portfolio Characteristics
Average Life: 6.9 Years
Duration: 5.0
Pre-tax Book Yield: 3.5%
33
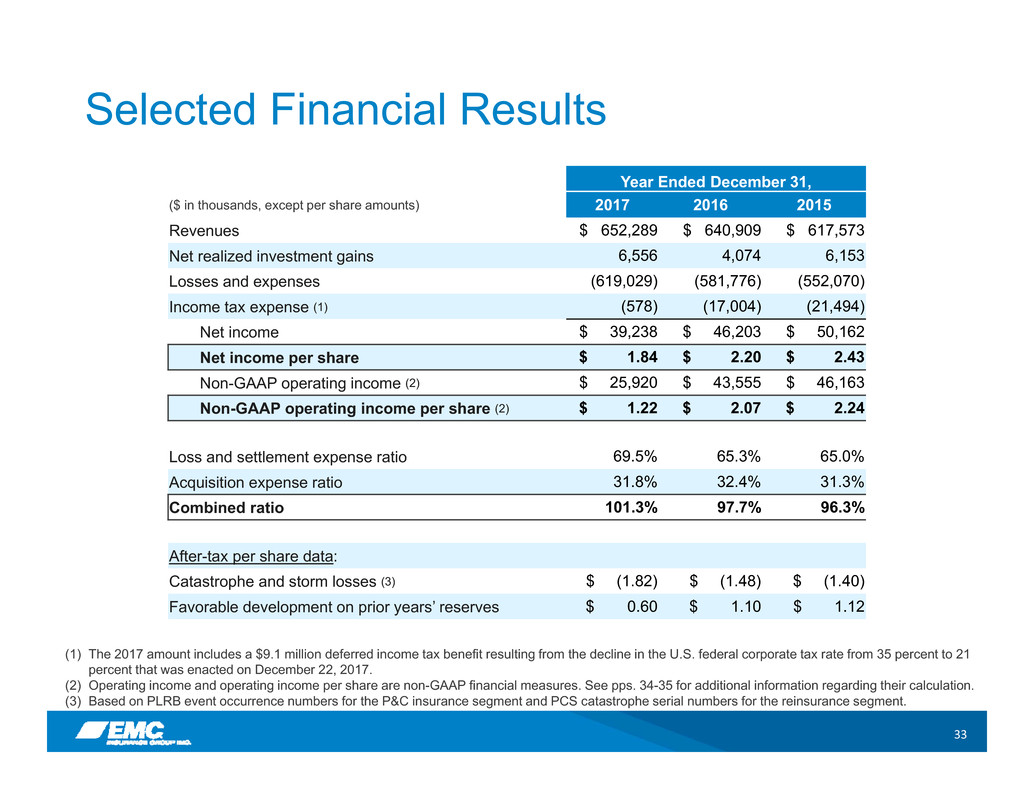
Selected Financial Results
(1) The 2017 amount includes a $9.1 million deferred income tax benefit resulting from the decline in the U.S. federal corporate tax rate from 35 percent to 21
percent that was enacted on December 22, 2017.
(2) Operating income and operating income per share are non-GAAP financial measures. See pps. 34-35 for additional information regarding their calculation.
(3) Based on PLRB event occurrence numbers for the P&C insurance segment and PCS catastrophe serial numbers for the reinsurance segment.
Year Ended December 31,
($ in thousands, except per share amounts) 2017 2016 2015
Revenues $ 652,289 $ 640,909 $ 617,573
Net realized investment gains 6,556 4,074 6,153
Losses and expenses (619,029) (581,776) (552,070)
Income tax expense (1) (578) (17,004) (21,494)
Net income $ 39,238 $ 46,203 $ 50,162
Net income per share $ 1.84 $ 2.20 $ 2.43
Non-GAAP operating income (2) $ 25,920 $ 43,555 $ 46,163
Non-GAAP operating income per share (2) $ 1.22 $ 2.07 $ 2.24
Loss and settlement expense ratio 69.5% 65.3% 65.0%
Acquisition expense ratio 31.8% 32.4% 31.3%
Combined ratio 101.3% 97.7% 96.3%
After-tax per share data:
Catastrophe and storm losses (3) $ (1.82) $ (1.48) $ (1.40)
Favorable development on prior years’ reserves $ 0.60 $ 1.10 $ 1.12
34
Non-GAAP Information
Definition of Non-GAAP Information and Reconciliation to Comparable GAAP Measures
• The Company prepares its public financial statements in conformity with accounting principles generally
accepted in the United States of America (GAAP). Management uses certain non-GAAP financial measures for
evaluating the Company’s performance. These measures are considered non-GAAP financial measures under
applicable Securities and Exchange Commission (SEC) rules because they are not displayed as separate line
items in the consolidated financial statements or are not required to be disclosed in the notes to financial
statements or, in some cases, include or exclude certain items not ordinarily included or excluded in the most
comparable GAAP financial measure. The Company’s calculation of non-GAAP financial measures may differ
from similar measures used by other companies, so investors should exercise caution when comparing the
Company’s non-GAAP financial measures to the measures used by other companies.
Non-GAAP Operating Income
• One of the primary non-GAAP financial measures utilized by management for evaluating the Company’s
performance is operating income. Non-GAAP operating income is calculated by excluding net realized
investment gains/losses (defined as realized investment gains and losses after applicable federal and state
income taxes) from net income. The deferred income tax benefit that resulted from the enactment of the Tax
Cuts and Jobs Act of 2017 (TCJA) is also excluded in the calculation of non-GAAP operating income for the
year ended December 31, 2017. While realized investment gains/losses are integral to the Company’s
insurance operations over the long term, the decision to realize investment gains or losses in any particular
period is subject to changing market conditions and management’s discretion, and is independent of the
Company’s insurance operations. While the Company’s insurance operations will benefit from the lower
corporate tax rate that became effective on January 1, 2018, the deferred income tax benefit that resulted from
the enactment of the TCJA in 2017 is a one-time event that is not expected to reoccur in the foreseeable future.
• Management believes non-GAAP operating income is useful to investors because it illustrates the performance
of the Company’s normal, ongoing insurance operations, which is important in understanding and evaluating the
Company’s financial condition and results of operations. While this measure is consistent with measures utilized
by investors and analysts to evaluate performance, it is not intended as a substitute for the GAAP financial
measure of net income.
35
Year Ended December 31,
($ in thousands) 2017 2016 2015
Net income $39,238 $ 46,203 $ 50,162
Realized investment gains (6,556) (4,074) (6,153)
Income tax expense 2,295 1,426 2,154
Net realized investment gains (4,261) (2,648) (3,999)
Impact of TCJA at enactment (9,057) - -
Non-GAAP operating income $ 25,920 $ 43,555 $ 46,163
Reconciliations of Non-GAAP Financial Measures
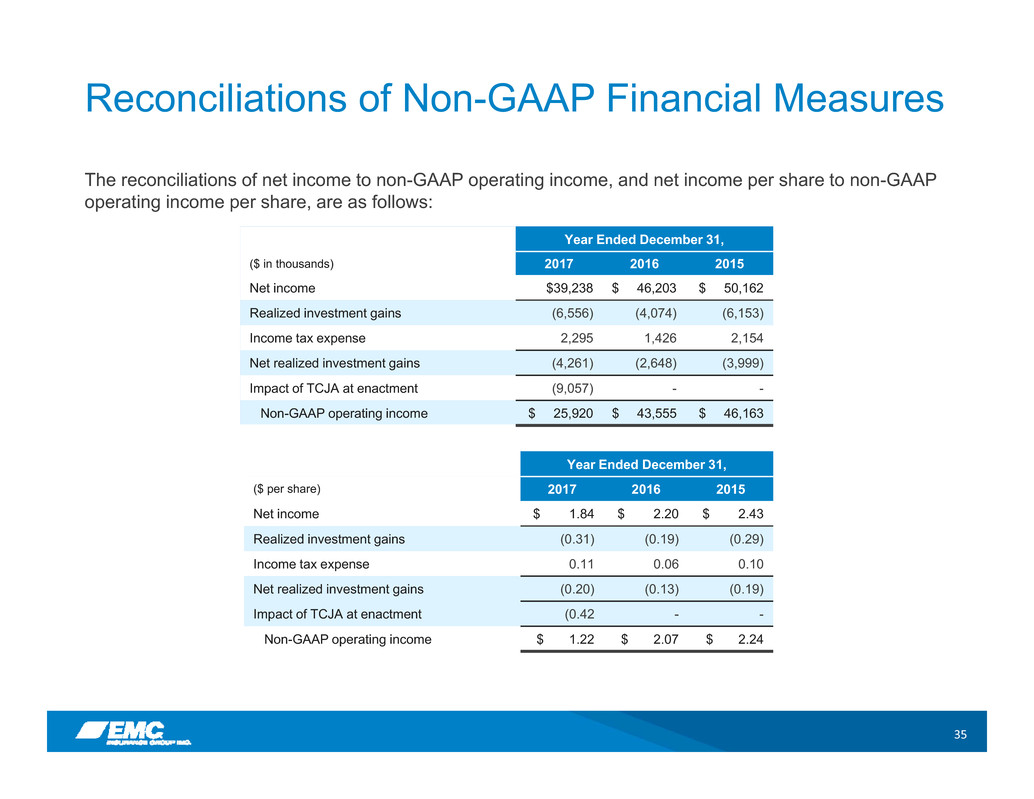
The reconciliations of net income to non-GAAP operating income, and net income per share to non-GAAP
operating income per share, are as follows:
Year Ended December 31,
($ per share) 2017 2016 2015
Net income $ 1.84 $ 2.20 $ 2.43
Realized investment gains (0.31) (0.19) (0.29)
Income tax expense 0.11 0.06 0.10
Net realized investment gains (0.20) (0.13) (0.19)
Impact of TCJA at enactment (0.42 - -
Non-GAAP operating income $ 1.22 $ 2.07 $ 2.24
36
Industry Metric – Premiums Written
• Premiums written is an industry metric used in statutory accounting to quantify the amount of insurance
sold during a specified reporting period. Management analyzes trends in premiums written to assess
business efforts, and uses it as a financial measure for goal setting and determining a portion of
employee and senior management awards and compensation. Premiums earned, used in both statutory
and GAAP accounting, is the recognition of the portion of premiums written directly related to the expired
portion of an insurance policy for a given reporting period. The unexpired portion of premiums written is
referred to as unearned premiums, and represents the portion of premiums written that would be returned
to a policyholder upon cancellation of a policy.
