Attached files
| file | filename |
|---|---|
| EX-32.2 - EX-32.2 - Cascadian Therapeutics, Inc. | d640776dex322.htm |
| EX-32.1 - EX-32.1 - Cascadian Therapeutics, Inc. | d640776dex321.htm |
| EX-31.2 - EX-31.2 - Cascadian Therapeutics, Inc. | d640776dex312.htm |
| EX-31.1 - EX-31.1 - Cascadian Therapeutics, Inc. | d640776dex311.htm |
| EX-23.1 - EX-23.1 - Cascadian Therapeutics, Inc. | d640776dex231.htm |
| EX-21.1 - EX-21.1 - Cascadian Therapeutics, Inc. | d640776dex211.htm |
| EX-10.18 - EX-10.18 - Cascadian Therapeutics, Inc. | d640776dex1018.htm |
| EX-10.16 - EX-10.16 - Cascadian Therapeutics, Inc. | d640776dex1016.htm |
Table of Contents
UNITED STATES
SECURITIES AND EXCHANGE COMMISSION
Washington, D.C. 20549
Form 10-K
(Mark One)
| ☒ | ANNUAL REPORT PURSUANT TO SECTION 13 OR 15(d) OF THE SECURITIES EXCHANGE ACT OF 1934 |
FOR THE FISCAL YEAR ENDED DECEMBER 31, 2017
OR
| ☐ | TRANSITION REPORT PURSUANT TO SECTION 13 OR 15(d) OF THE SECURITIES EXCHANGE ACT OF 1934 |
FOR THE TRANSITION PERIOD FROM TO
Commission file number: 001-33882
CASCADIAN THERAPEUTICS, INC.
(Exact name of registrant as specified in its charter)
| Delaware | 26-0868560 | |
| (State or other jurisdiction of incorporation or organization) |
(I.R.S. Employer Identification Number) | |
| 2601 Fourth Ave, Suite 500 Seattle, Washington |
98121 | |
| (Address of principal executive offices) | (Zip Code) | |
Registrant’s telephone number, including area code:
(206) 801-2100
Securities registered pursuant to Section 12(b) of the Act:
| Title of Each Class |
Name of Exchange on Which Registered | |
| Common Stock, $0.0001 par value | The Nasdaq Stock Market LLC (The Nasdaq Global Market) |
Securities registered pursuant to Section 12(g) of the Act:
None
Indicate by check mark if the registrant is a well-known seasoned issuer, as defined in Rule 405 of the Securities Act. Yes ☐ No ☒
Indicate by check mark if the registrant is not required to file reports pursuant to Section 13 or Section 15(d) of the Act. Yes ☐ No ☒
Indicate by check mark whether the registrant (1) has filed all reports required to be filed by Section 13 or 15(d) of the Securities Exchange Act of 1934 during the preceding 12 months (or for such shorter period that the registrant was required to file such reports), and (2) has been subject to such filing requirements for the past 90 days. Yes ☒ No ☐
Indicate by check mark whether the registrant has submitted electronically and posted on its corporate Web site, if any, every Interactive Data File required to be submitted and posted pursuant to Rule 405 of Regulation S-T during the preceding 12 months (or for such shorter period that the registrant was required to submit and post such files). Yes ☒ No ☐
Indicate by check mark if disclosure of delinquent filers pursuant to Item 405 of Regulation S-K is not contained herein, and will not be contained, to the best of registrant’s knowledge, in definitive proxy or information statements incorporated by reference in Part III of the Form 10-K or any amendment to this Form 10-K. ☐
Indicate by check mark whether the registrant is a large accelerated filer, an accelerated filer, a non-accelerated filer, or a smaller reporting company. See the definitions of “large accelerated filer,” “accelerated filer,” “smaller reporting company” and “emerging growth company” in Rule 12b-2 of the Exchange Act. (Check one):
| Large accelerated filer | ☐ | Accelerated filer | ☒ | |||
| Non-accelerated filer | ☐ (Do not check if a smaller reporting company) | Smaller reporting company | ☐ | |||
| Emerging growth company | ☐ | |||||
If an emerging growth company, indicate by check mark if the registrant has elected not to use the extended transition period for complying with any new or revised financial accounting standards provided pursuant to Section 13(a) of the Exchange Act. ☐
Indicate by check mark whether the registrant is a shell company (as defined in Rule 12b-2 of the Exchange Act). Yes ☐ No ☒
The aggregate market value of the voting and non-voting stock held by non-affiliates of the Registrant, based on the closing sale price of the Registrant’s common stock on the last day of its most recently completed second fiscal quarter, as reported on the Nasdaq Global Market, was approximately $118 million. Shares of common stock held by each executive officer and director and by each person who owns 10% or more of the outstanding common stock, based on filings with the Securities and Exchange Commission, have been excluded from this computation since such persons may be deemed affiliates of the Registrant. The determination of affiliate status for this purpose is not necessarily a conclusive determination for other purposes.
There were 55,317,212 shares of the Registrant’s common stock, $0.0001 par value, outstanding on March 8, 2018.
DOCUMENTS INCORPORATED BY REFERENCE
None.
Table of Contents
CASCADIAN THERAPEUTICS, INC.
ANNUAL REPORT ON FORM 10-K
FOR THE FISCAL YEAR ENDED DECEMBER 31, 2017
| Page | ||||||
| PART I | ||||||
| Item 1. |
1 | |||||
| Item 1A. |
14 | |||||
| Item 1B. |
31 | |||||
| Item 2. |
31 | |||||
| Item 3. |
31 | |||||
| Item 4. |
31 | |||||
| PART II | ||||||
| Item 5. |
32 | |||||
| Item 6. |
34 | |||||
| Item 7. |
Management’s Discussion and Analysis of Financial Condition and Results of Operations |
35 | ||||
| Item 7A. |
46 | |||||
| Item 8. |
47 | |||||
| Item 9. |
Changes in and Disagreements with Accountants on Accounting and Financial Disclosure |
47 | ||||
| Item 9A. |
47 | |||||
| Item 9B. |
48 | |||||
| Item 10. |
49 | |||||
| Item 11. |
52 | |||||
| Item 12. |
Security Ownership of Certain Beneficial Owners and Management and Related Stockholder Matters |
72 | ||||
| Item 13. |
Certain Relationships and Related Transactions, and Director Independence |
74 | ||||
| Item 14. |
75 | |||||
| PART IV | ||||||
| Item 15. |
76 | |||||
| Item 16. |
79 | |||||
| 80 | ||||||
-i-
Table of Contents
| ITEM 1. | Business |
This annual report on Form 10-K, including Part I, Item 1, “Business,” Part II, Item 7, “Management’s Discussion and Analysis of Financial Condition and Results of Operations” and other sections in this annual report on Form 10-K, contain forward-looking statements or incorporate by reference forward-looking statements. The words “believe,” “may,” “will,” “estimate,” “continue,” “anticipate,” “intend,” “expect,” and similar expressions are intended to identify forward-looking statements. You should read these statements carefully because they discuss future expectations, contain projections of future results of operations or financial condition, or state other “forward-looking” information. These statements relate to our, or in some cases our partners’ future plans, objectives, expectations, intentions and financial performance and the assumptions that underlie these statements.
All forward-looking statements are based on information available to us on the date of this annual report and we will not update any of the forward-looking statements after the date of this annual report, except as required by law. Our actual results could differ materially from those discussed in this annual report. The forward-looking statements contained in this annual report, and other written and oral forward-looking statements made by us from time to time, are subject to certain risks and uncertainties that could cause actual results to differ materially from those anticipated in the forward-looking statements. Factors that might cause such a difference include, but are not limited to, uncertainties as to the timing of the Offer and Merger; uncertainties as to how many of our stockholders will tender their stock in the Offer; the possibility that various closing conditions for the Transactions may not be satisfied or waived, including that a governmental entity may prohibit, delay or refuse to grant approval for the consummation of the Transactions; the occurrence of any event, change or other circumstance that could give rise to the termination of the Merger Agreement; the effects of the Transactions (or the announcement thereof) on relationships with employees, customers, other business partners or governmental entities; costs associated with the Transactions; the risk that the Transactions will divert management’s attention from the Company’s ongoing business operations; and those factors discussed in the following discussion and within Part I, Item 1A,“Risk Factors” of this annual report.
Throughout this discussion, unless the context specifies or implies otherwise, the terms “Company,” “Cascadian Therapeutics,” “Oncothyreon,” “Biomira,” “we,” “us,” and “our” refer to Cascadian Therapeutics, Inc., its predecessors, Oncothyreon Inc, and Biomira Inc., and its subsidiaries.
Overview
We are a clinical-stage biopharmaceutical company focused on the development of therapeutic products for the treatment of cancer. Our goal is to develop and commercialize novel targeted compounds that have the potential to improve the lives and outcomes of cancer patients. Our lead clinical-stage product candidate is tucatinib, an oral, HER2-selective small molecule tyrosine kinase inhibitor. Our pipeline also includes two preclinical-stage product candidates: CASC-578, a Chk1 kinase inhibitor, and CASC-674, an antibody program against an immuno-oncology target known as TIGIT.
2018 Merger Agreement
On January 30, 2018, we entered into an Agreement and Plan of Merger (the Merger Agreement) with Seattle Genetics, Inc., a Delaware corporation (Seattle Genetics), and Valley Acquisition Sub, Inc., a Delaware corporation and a wholly owned subsidiary of Seattle Genetics (Merger Sub). Pursuant to the Merger Agreement, and upon the terms and subject to the conditions thereof, on February 8, 2018, Merger Sub commenced a tender offer (the Offer) to acquire all of our issued and outstanding shares of common stock (the Shares) at a purchase price of $10 per Share (the Offer Price), net to the seller in cash, without interest and subject to any required withholding taxes.
Following the consummation of the Offer and subject to the terms and conditions of the Merger Agreement, Merger Sub will merge with and into Cascadian Therapeutics, with Cascadian Therapeutics surviving as a subsidiary of Seattle Genetics (the Merger, and together with the Offer, the Transactions). The Merger will be effected pursuant to Section 251(h) of the General Corporation Law of the State of Delaware, without a vote of stockholders of Cascadian Therapeutics. At the effective time of the Merger, each Share (other than Shares owned by Seattle Genetics, Merger Sub, or any other direct or indirect wholly owned subsidiary of Seattle Genetics, and Shares owned by Cascadian Therapeutics, or any direct or indirect wholly owned subsidiary of the Company, or by stockholders who have validly exercised their appraisal rights under Delaware law) will be converted into the right to receive an amount in cash equal to the Offer Price, without interest and subject to any required withholding taxes.
1
Table of Contents
Tucatinib
Our lead development candidate, tucatinib, is an investigational orally bioavailable, potent tyrosine kinase inhibitor (TKI) that is highly selective for HER2, also known as ErbB2, a growth factor receptor that is over-expressed in approximately 20% of breast cancers. In addition to breast cancer, HER2 is over-expressed in other malignancies, including subsets of bladder, cervical, colorectal, esophageal, gastric, lung and ovarian cancers. We are currently developing tucatinib for the treatment of HER2-positive (HER2+) metastatic breast cancer. Over-expression of HER2 in breast cancer has been associated historically with increased mortality in early stage disease, decreased time to relapse and increased incidence of metastases. Similarly, the overexpression of HER2 is thought to play an important role in the development and progression of other cancers.
The introduction of HER2-targeted therapies, including antibody-based therapies and small molecule TKIs, has led to improvement in the outcomes of patients with HER2+ cancer. Unlike pan-HER TKIs, tucatinib selectively inhibits HER2 and is at least 1,000-fold more selective for HER2 than the epidermal growth factor receptor (EGFR). This selectivity may improve drug tolerability by reducing the risk of severe diarrhea and skin rash commonly seen with pan-HER TKIs.
We are currently conducting a randomized (2:1), double-blind, controlled pivotal clinical trial, known as HER2CLIMB, comparing tucatinib versus placebo, each in combination with capecitabine (Xeloda®) and trastuzumab (Herceptin®), and without loperamide or budesonide prophylaxis, in patients with locally advanced or metastatic HER2+ breast cancer who have had prior treatment with a taxane, trastuzumab, pertuzumab (Perjeta®) and ado-trastuzumab emtansine or T-DM1 (Kadcyla®) and who may or may not have brain metastases. The primary endpoint is progression-free survival (PFS) based upon independent radiologic review. Patients will also be followed for overall survival, which is a secondary endpoint. Key objectives related to assessing activity in brain metastases include a secondary endpoint of PFS in a subset of patients with brain metastases. HER2CLIMB is currently enrolling patients in the United States, Canada, Western Europe and Australia and is expected to expand into Israel early in 2018. The HER2CLIMB clinical trial is intended to support a potential new drug application (NDA) submission to the United States Food and Drug Administration (FDA) and a potential Marketing Authorization Application (MAA) to the European Medicines Agency (EMA).
In addition, our two Phase 1b trials of tucatinib, one in combination with T-DM1 and another in combination with capecitabine and/or trastuzumab, are fully enrolled and active patients remain on treatment. Results to date from the Phase 1b trials indicate these drug combinations are well tolerated and may provide clinical activity in heavily pretreated patients with metastatic breast cancer, with and without brain metastases.
Updated results from the Phase 1b triplet combination study (tucatinib with capecitabine and trastuzumab) showed that the combination continued to be well tolerated. Compared to previously reported interim results, the updated PFS increased to 7.8 months and the overall response rate (ORR) increased to 61%. The median duration of response was 10 months. Patients in the Phase 1b triplet combination trial previously received a median of three HER2-targeted agents such as trastuzumab, pertuzumab, lapatinib or T-DM1. These updated results were presented at the 2016 San Antonio Breast Cancer Symposium (SABCS).
In September 2017, results from the pooled analysis of Phase 1b combination studies showed further support for the potential utility of tucatinib for patients with HER2+ metastatic breast cancer with brain metastases, including untreated or progressive brain metastases after radiation therapy. In addition, data from nonclinical models were presented that support the evaluation of tucatinib in HER2+ gastrointestinal cancers. These results were presented at the European Society for Medical Oncology 2017 Congress.
In December 2017, we reported results from a subgroup analysis from its two ongoing combination studies of tucatinib, which demonstrated prolonged progression-free survival benefit regardless of presence of brain metastases or patient characteristics. These results were presented at the 2017 SABCS.
In July 2017, we announced that the EMA confirmed that positive results from HER2CLIMB could serve as a single registrational trial for submission of a MAA to the EMA for potential marketing approval. We had received similar confirmation from the FDA in 2016.
In September 2017, we announced tucatinib was granted orphan drug designation by the FDA for the treatment of HER2+ colorectal cancer and, in June 2017, we announced that tucatinib was granted orphan drug designation by the FDA for the treatment of breast cancer patients with brain metastases.
2
Table of Contents
In June 2016, tucatinib was granted Fast Track designation by the FDA for the treatment of metastatic HER2+ breast cancer. The FDA’s Fast Track process is designed to facilitate the development and expedite the review of drugs to treat serious conditions and fill an unmet medical need.
Tucatinib is also being evaluated in investigator-initiated studies in combination with approved agents. In June 2017, a Phase 2 study called MOUNTAINEER was initiated to evaluate tucatinib in combination with trastuzumab for patients with HER2 amplified metastatic colorectal cancer and recently began enrolling participants in the U.S.
In December 2017, the first patient was enrolled in the investigator-initiated Phase 1b/2 trial that is evaluating tucatinib in combination with an aromatase inhibitor and CDK4/6 agent for patients with hormone receptor-positive and HER2-positive (HR+/HER2+) metastatic breast cancer.
We have an exclusive license agreement with Array BioPharma Inc. for the worldwide rights to develop, manufacture and commercialize tucatinib.
Other Pipeline Candidates
Although our efforts are focused primarily on developing and commercializing tucatinib, we have two preclinical programs. Our earlier stage product candidates are CASC-578, a Chk1 cell cycle inhibitor that is an orally available, small molecule kinase inhibitor, and CASC-674, an antibody against an immuno-oncology target known as TIGIT.
Chk1 is a protein kinase that regulates the cell division cycle and is activated in response to DNA damage and DNA replication stress. Cancer cells often have mutations that alter DNA damage response signaling pathways that function in parallel with Chk1 to regulate the cell cycle. These mutations may make tumor cells more reliant on the activity of Chk1 to provide cell cycle checkpoint control, which represents a potential weak point that can be exploited by drugs that target Chk1.
TIGIT (T-cell immunoreceptor with Ig and ITM domains) is an inhibitory receptor expressed on T-cells and NK cells that may negatively regulate immune response to cancers. Antibodies that inhibit TIGIT function may potentially activate anti-tumor immune responses.
The continued research and development of our product candidates will require significant additional expenditures, including preclinical studies, clinical trials, manufacturing costs and the expenses of seeking regulatory approval.
Our Strategy
Our strategy is focused on the development of therapeutic products for the treatment of cancer. The key elements of our strategy are to:
| • | Develop tucatinib in HER2+ metastatic breast cancer. We intend to develop and commercialize tucatinib for adult patients with HER2+ metastatic breast cancer, including patients with or without brain metastases. |
| • | Expand tucatinib development in other tumor types. We believe tucatinib has potential in other tumor types and intend to continue to evaluate tucatinib in other solid tumors, including HER2+ colorectal cancer, through ongoing and planned investigator-initiated studies. |
| • | Support our internal activities with strategic collaborations and out-licensing. We may enter into collaborations, acquisitions or license arrangements to advance the development or potential commercialization of programs in our pipeline. Such relationships can supplement our own internal expertise in areas such as clinical trials, and manufacturing, as well as provide us with access to licensees’ marketing, sales and distribution capabilities. |
Product Candidate Portfolio
Under the heading “Development Stage” in the table below, the designation “Pivotal” indicates clinical testing of efficacy, safety, dosage tolerance, pharmacokinetics and pharmacodynamics of the product candidate in a trial designed for registration with the FDA for marketing of the product. “Preclinical” indicates the product candidate is undergoing tumor modeling, toxicology and pharmacology studies intended to support subsequent clinical development.
3
Table of Contents
| Product Candidate |
Technology |
Most Advanced Indication |
Development Stage | |||
| Tucatinib |
Small Molecule | Breast cancer | Pivotal Study | |||
| Chk1 |
Small Molecule | To be determined | Preclinical | |||
| TIGIT |
Antibody | To be determined | Preclinical |
Oncology Market Overview and Opportunity
Breast cancer is the most common form of cancer in women worldwide, and the second leading cause of cancer-related death in women in North America. The American Cancer Society estimated that in 2017 more than 250,000 women in the U.S. would develop breast cancer and more than 40,000 would die from the disease. Approximately 15-20% of breast cancers overexpress HER2.
The treatment of breast cancer differs by stage and includes surgery and radiation for most patients with early-stage disease. The addition of HER2 targeted agents, including antibody-based therapies and a small molecule, has led to significant improvements in progression-free survival and overall survival, both in the adjuvant setting and for patients with metastatic HER2+ disease. There are currently four approved agents for the treatment of HER2+ metastatic breast cancer, trastuzumab, pertuzumab, TDM1 and lapatinib.
The prevention and treatment of metastatic disease in the central nervous system (CNS), including brain metastases, remains a significant unmet medical need for patients with HER2+ breast cancer. The incidence of first relapse occurring in the brain is increasing in patients who have progressed following trastuzumab-containing adjuvant regimens, and approximately 30-50% of patients with HER2+ metastatic disease will develop brain metastases over the course of their disease.
Development Candidates
Tucatinib
Our lead development candidate, tucatinib, is an orally bioavailable, potent TKI that is highly selective for HER2, also known as ErbB2, a growth factor receptor that is over-expressed in approximately 20% of breast cancers. In addition to breast cancer, HER2 is overexpressed in other malignancies, including subsets of bladder, cervical, colorectal, esophageal, gastric, lung and ovarian cancers. We are currently developing tucatinib for the treatment of HER2+ metastatic breast cancer. Over-expression of HER2 in breast cancer has been associated historically with increased mortality in early stage disease, decreased time to relapse and increased incidence of metastases. The introduction of HER2-targeted therapies, including antibody-based therapies and the small molecule TKI, lapatinib, has led to improvement in the outcomes of patients with HER2+ cancer. Unlike lapatinib, tucatinib selectively inhibits HER2 and is at least 1,000-fold more selective for HER2 than EGFR. This selectivity may improve drug tolerability by reducing Grade 3 (severe) diarrhea and skin rash. We acquired tucatinib in December 2014 pursuant to an agreement under which we have certain royalty and milestone payment obligations. See Part I, Item 1, “Business—License Agreements” for additional information.
Tucatinib has been studied as a single agent in a Phase 1 clinical trial, with both dose-escalation and cohort expansion components, which enrolled 50 patients, 43 of whom had HER2+ metastatic breast cancer. All HER2+ breast cancer patients had progressed on a trastuzumab-containing regimen that may have also included other chemotherapeutic agents. In addition, over 80% had been treated with lapatinib, with many patients having progressed on this therapy. In this study, tucatinib demonstrated an acceptable safety profile; treatment-related adverse events were primarily Grade 1. Because tucatinib is selective for HER2 and does not inhibit the EGFR, there was a low incidence and severity of treatment-related diarrhea, rash and fatigue which may be associated with tucatinib’s high selectively for HER2 over EGFR. Additionally, there were no treatment-related cardiac events or Grade 4 treatment-related adverse events reported. Twenty-two HER2+ breast cancer patients with measurable disease were treated with tucatinib at doses greater than or equal to 600 mg BID. In this heavily pretreated patient population, there was a clinical benefit rate of 27% (partial response [n = 3] plus stable disease for at least 6 months [n = 3]).
In February 2014, we initiated two Phase 1b trials of tucatinib. The trials are closed to enrollment although patients remain on treatment. The following is a summary of these studies:
Phase 1b Clinical Trial of tucatinib in combination with TDM-1:
This Phase 1b clinical trial studied tucatinib in combination with T-DM1 in patients with metastatic HER2+ breast cancer who had progressed following prior treatment with trastuzumab and a taxane. This trial was a dose-escalation study of tucatinib in combination with the approved dose of T-DM1, with expansion cohorts in patients with and without brain metastases. The primary objective was to determine the maximum tolerated dose/[define RP2D] (MTD/RP2D) of tucatinib in combination with the approved dose of T-DM1. Secondary objectives included an evaluation of the safety and preliminary anti-tumor activity of the combination.
4
Table of Contents
As reported at the 2016 American Society of Clinical Oncology Annual Meeting, patients treated at the MTD of tucatinib with T-DM1 had previously been treated with trastuzumab, and, in addition, 46% had been treated with prior pertuzumab, and 20% with prior lapatinib. Overall,60% of patients had a history of brain metastases and 42% had brain metastases that were either untreated or had progressed after prior local treatment. In this high-risk population, durable (> 6 months) systemic and CNS responses as well as disease stabilization were seen. The ORR was 41% (14/34) in patients with measurable disease and at least one follow-up scan, and the CNS response rate was 33% (4/12).
The combination of tucatinib and T-DM1 was clinically well tolerated. In 50 patients treated at the MTD of tucatinib, the majority of adverse events were low grade in severity, Grade 1 or 2, and included nausea, fatigue, diarrhea, vomiting, thrombocytopenia and asymptomatic elevated liver enzymes. Grade 3 diarrhea occurred in only two patients (4%), with no mandatory use of anti-diarrheal medications. While asymptomatic elevations in ALT/AST were seen in most patients, the majority were Grade 1 or 2 in severity requiring no change in dosing. Asymptomatic Grade 3 elevations were reported in 18% of patients (9/50) and Grade 4 elevation in 2% (1/50). Except in the setting of progressive liver metastases, all Grade 3 or greater elevations of ALT/AST were reversible with dose interruption and dose reduction of tucatinib and T-DM1. Two of 50 patients (4%), experienced asymptomatic decreases in left ventricular ejection fraction, reported as Grade 1 heart failure. Both of these patients had a prior history of treatment with trastuzumab and pertuzumab. Treatment with both tucatinib and T-DM1 was discontinued in one of these patients, and treatment with T-DM1 alone was discontinued in a second patient who went on to recover normal cardiac function.
Phase 1b Clinical Trial of tucatinib in combination with capecitabine and/or trastuzumab:
In December 2015, updated results from the Phase 1b clinical trial of tucatinib evaluating tucatinib in combination with capecitabine and/or trastuzumab in patients previously treated with trastuzumab and TDM-1 for HER2+ metastatic breast cancer were presented at the 2015 San Antonio Breast Cancer Symposium. Some patients had also been previously treated with pertuzumab or lapatinib. The primary objective of this study was to determine the maximum-tolerated and/or recommended Phase 2 dose (MTD/RP2D) of tucatinib in combination with the approved dose of either capecitabine or trastuzumab, or both. Secondary objectives included an evaluation of the safety and preliminary anti-tumor activity of the combinations. The trial included expansion cohorts at the MTD/RP2D of tucatinib in combination with both capecitabine and trastuzumab and with trastuzumab or capecitabine alone in patients with and without brain metastases.
In a heavily pretreated population, durable (> 6 months) systemic and CNS responses as well as disease stabilization were seen across all three treatment combinations, including patients previously treated with pertuzumab and/or lapatinib as well as trastuzumab and T-DM1. As reported at SABCS in 2015, in seven patients treated with tucatinib and capecitabine, the ORR was 83%, with a CNS response in the one patient with assessable brain metastases and at least one follow-up scan. In 16 patients treated with tucatinib and trastuzumab, the ORR was 29%, with a CNS response in one of seven patients with assessable brain metastases and at least one follow-up scan. In 18 patients treated with tucatinib and capecitabine and trastuzumab, the ORR was 39%, with CNS response in two of four patients with assessable brain metastases and at least one follow-up scan.
In June 2016, updated data from our Phase 1b clinical trial combining tucatinib with trastuzumab and capecitabine were presented at our R&D Day held in New York. In this combination trial, the majority of adverse events were Grade 1, with most patients being able to continue on the full dose of tucatinib. Grade 3 diarrhea was infrequent without a requirement for prophylactic anti-diarrheal medicine. The ORR was 58% and the interim PFS was 6.3 months, with many patients still active on study at the time of the data analysis. Outcomes in patients with brain metastases were similar to patients without brain metastases. In October 2016, data from our on-going combination trial of tucatinib with trastuzumab and capecitabine demonstrating clinical activity in HER2+ metastatic lesions to the skin was presented at the 2016 European Society of Clinical Oncology meeting.
In December 2016, updated data from the Phase 1b trial showed encouraging safety and anti-tumor activity in patients with and without brain metastases, with an updated median PFS of 7.8 months (a 24% improvement over prior median PFS), ORR of 61% and a median duration of response of 10 months. Patients with and without brain metastases had similar response rates. The combination of tucatinib with trastuzumab and capecitabine was well-tolerated. Most treatment-emergent adverse events were Grade 1, with few tucatinib dose reductions and no required prophylactic use of antidiarrheal agents. These updated data were presented at the 2016 SABCS meeting.
5
Table of Contents
In December 2016, we reported that following a meeting with the FDA and discussions with our external Steering Committee, we had amended the ongoing HER2CLIMB Phase 2 clinical trial of tucatinib by increasing the sample size so that, if successful, the trial could serve as a single pivotal study to support registration. HER2CLIMB is a randomized (2:1), double-blind, controlled pivotal clinical trial comparing tucatinib vs. placebo in combination with capecitabine and trastuzumab in patients with locally advanced or metastatic HER2-positive breast cancer who have had prior treatment with a taxane, trastuzumab, pertuzumab and T-DM1.The primary endpoint remains PFS based upon independent radiologic review, and the sample size has increased to approximately 480 patients, including patients already enrolled in the trial. Key objectives related to assessing activity in brain metastases include a key secondary endpoint of PFS in a subset of patients with brain metastases. All patients will be followed for overall survival.
Preclinical Programs
Checkpoint kinase 1 inhibitor
Checkpoint kinase 1 (Chk1) is a protein kinase that is activated in response to DNA damage and DNA replication stress. Together with other cellular factors, Chk1 provides a coordinated “checkpoint” to arrest the cell division cycle in response to damaged DNA. The induction of this cell cycle checkpoint enables cells to repair DNA lesions and ensures the fidelity of the cell division process. Cancer cells commonly have mutations that reduce or eliminate the activity of DNA damage response factors that function in parallel with Chk1. These mutations make tumor cells more reliant on the activity of Chk1 to provide cell cycle checkpoint control, which may make them more sensitive to Chk1 inhibitors and produce a synergistic tumor killing effect when combined with DNA targeted chemotherapy drugs.
We have identified a lead development candidate, CASC-578, which is an orally available, highly potent and selective Chk1 inhibitor. CASC-578 was developed in collaboration with Sentinel Oncology Ltd., Cambridge, United Kingdom. See Part I, Item 1, “Business—Collaborations” for additional information.
Immuno-oncology
We have identified novel antibodies to TIGIT, an immune receptor that may block the induction of adaptive and innate immune response to cancers. The TIGIT antibody program is in preclinical development and is part of the collaborative effort with Adimab for the discovery of novel antibodies against immunotherapy targets. See Part I, Item 1, “Business—Collaborations” for additional information.
License and Collaboration Agreements
Array BioPharma Inc. In December 2014, we entered into a license agreement with Array. Pursuant to the license agreement, Array has granted us an exclusive license to develop, manufacture and commercialize tucatinib. The license agreement replaced a development and commercialization agreement under which we and Array were previously jointly developing tucatinib. As part of the agreement, we paid Array $20 million as an upfront fee. In addition, we will pay Array a portion of any payments received from sublicensing tucatinib rights. Array is also entitled to receive up to a low double-digit royalty based on net sales of tucatinib by us and a single-digit royalty based on net sales of tucatinib by our sublicensees. The term of the license agreement expires on a country-by-country basis upon the later of the expiration of the last valid claim covering tucatinib within that country or 10 years after the first commercial sale of tucatinib within that country.
Sentinel Oncology Ltd. In 2014, we entered into a research collaboration agreement with Sentinel for the discovery of novel Chk1 inhibitors. Under the agreement, we made payments to Sentinel to support their chemistry research. We are responsible for preclinical and clinical development, manufacture and commercialization of any resulting compounds. Sentinel is eligible to receive success-based development and commercial milestone payments up to approximately $90 million based on development and commercialization events, including the initiation of toxicology studies under the FDA’s good laboratory practices (GLP) regulations, the initiation of certain clinical trials, regulatory approval and first commercial sale. Sentinel is also entitled to a single-digit royalty based on net sales.
Adimab LLC. In 2014, we initiated a collaboration with Adimab for the discovery of novel antibodies against immunotherapy targets in oncology. We have sole responsibility for the manufacture, development and commercialization of any antibody product candidates that result from the collaboration. The collaboration is currently at an early preclinical development stage. Adimab is entitled to certain research funding, success-based development milestone payments of up to $17 million and a low single-digit royalty based on net sales.
6
Table of Contents
Patents and Proprietary Information
Our objective is to obtain, maintain and enforce intellectual property protection for our pipeline candidates and other proprietary technologies; to preserve our trade secrets; and to operate without infringing on the valid proprietary rights of other parties. We believe the protection of patents, trademarks and other proprietary rights that we own or license is critical to our success and competitive position. We rely on a combination of patent, trademark, copyright, trade secret, confidentiality agreements and other measures to protect our proprietary rights.
With respect to our development candidates, as of December 31, 2017, we owned three U.S. patent and 20 patent applications in other jurisdictions. In addition, as of December 31, 2017, we had licensed approximately 182 issued patents and 81 patent applications from third parties, mostly on an exclusive basis. The patent portfolios for our leading product candidates as of December 31, 2017 are summarized below.
Tucatinib. In the United States, the composition of matter for tucatinib is covered by U.S. Patent No. 8,648,087, entitled “N4-phenyl-quinazoline-4-amine derivatives and related compounds as ErbB type I receptor tyrosine kinase inhibitors for the treatment of hyperproliferative diseases,” which will provide patent coverage for tucatinib until 2031. We have also licensed U.S. Patent No. 9,693,989, with the same title. Patent applications corresponding to U.S. Patent No. 8,648,087 have issued in Australia, Canada, China, Columbia, Europe, Hong Kong, Indonesia, Israel, Japan, South Korea, Mexico, Philippines, Russia, Singapore, Ukraine and South Africa. Corresponding patent applications are pending in Brazil, Egypt, India, Israel, Norway and Russia. These foreign patents and patent applications, if issued, are not due to expire until at least 2026. The Array patent portfolio also includes other issued patents and pending patent applications drawn to tucatinib formulations, polymorphs and methods of use in the U.S. and in many foreign jurisdictions.
The patents and patent applications covered by the Array License Agreement are prosecuted by Array and reviewed and monitored by outside legal counsel on behalf of the Company.
CASC-578. CASC-578, a Chk1 kinase inhibitor, is licensed from Sentinel. The Sentinel Chk1 kinase inhibitor patent portfolio includes two issued U.S. patents, U.S. Patent No. 8,716,287, entitled “Pharmaceutical compounds,” and U.S. Patent No. 9,630,931, entitled “Pharmaceutically active pyrazine derivatives,” and a U.S. patent application, all of which are drawn to compounds and compositions that inhibit Chk-1 kinase activity. A foreign patent application also drawn to compounds and compositions that inhibit Chk-1 kinase activity has issued in Europe. The current U.S. issued patents and patent application, if issued, are not due to expire until at least 2031. The European patent is not due to expire until at least 2032.
The CASC-578 patent portfolio includes a pending U.S. patent application covering substituted pyrazoles, many of which have Chk1 inhibitor activity. Related foreign patent applications are pending in Australia, Brazil, Canada, China, Europe, Hong Kong, Indonesia, Israel, India, Japan, South Korea, Mexico, Malaysia, New Zealand, Philippines, Russia, Singapore, Ukraine and South Africa. The currently pending U.S. and foreign patent applications, if issued, are not due to expire until at least 2035. Certain jurisdictions may provide mechanisms for restoring a period of patent term consumed by regulatory review. We will take advantage of all opportunities to extend the patent term in each jurisdiction where we are able to do so.
CASC-674. CASC-674, an antibody program against an immuno-oncology target known as TIGIT, was obtained from Adimab LLC. We are collaborating with Adimab for the discovery of novel antibodies against TIGIT. As of December 31, 2017, we have one patent application directed to TIGIT.
Certain jurisdictions, including the U.S., Japan and Europe, provide mechanisms for restoring a period of patent term consumed by regulatory review. We plan to take advantage of all opportunities to extend the patent term in each jurisdiction where we are able to do so.
Manufacturing
We use third party contractors to procure the necessary materials and manufacture, as applicable, starting materials, active pharmaceutical ingredients and finished drug product, as well as for labeling, packaging, storage and distribution of our compounds. This arrangement allows us to use contract manufacturers that have extensive Good Manufacturing Practices, or cGMP, manufacturing experience. We have a staff with experience in the management of contract manufacturing and in the development of efficient commercial manufacturing processes for our products candidates. We currently intend to outsource the manufacture of all our commercial products.
We believe that our existing supplies of tucatinib, along with our contract manufacturing relationships with our existing contract manufacturers, will be sufficient to supply tucatinib for HER2CLIMB and other clinical trials of tucatinib and to supply initial commercial quantities of tucatinib for commercial sale. As our business expands, we expect that our manufacturing, distribution and related operational requirements will increase correspondingly, and we may need to retain additional contractors to ensure adequate supplies of our products. Each third-party contractor undergoes a formal qualification process by our subject matter experts before services by that contractor commence, and each contractor is audited periodically thereafter as required by cGMP.
7
Table of Contents
Competition
The pharmaceutical and biotechnology industries are intensely competitive, and any product candidate developed by us will compete with existing drugs and therapies. There are many pharmaceutical companies, biotechnology companies, public and private universities, government agencies and research organizations that compete with us in developing various approaches to cancer therapy. Many of these organizations have substantially greater financial, technical, manufacturing and marketing resources than we have. Several of them have developed or are developing therapies that could be used for treatment of the same diseases that we are targeting. In addition, many of these competitors have significant commercial infrastructures that we do not currently have. Our ability to compete successfully will depend largely on our ability to:
| • | design and develop products that are superior to other products in the market and under development; |
| • | attract and retain qualified scientific, product development, manufacturing and commercial personnel; |
| • | obtain patent and/or other proprietary protection for our product candidates and technologies; |
| • | obtain required regulatory approvals; |
| • | successfully collaborate with pharmaceutical companies in the design, development and commercialization of new products; |
| • | compete on, among other things, product efficacy and safety profile, time to market, price, and the types of and convenience of treatment procedures; and |
| • | identify, secure the rights to and develop products and exploit these products commercially before others are able to develop competitive products. |
Our ability to compete may be affected by government policies relating to the pricing and reimbursement of proprietary drug products and the policies of insurers and other third-party payors encouraging the use of generic products, all of which may make branded products less attractive to buyers from a cost perspective.
Tucatinib. Tucatinib is an inhibitor of the receptor tyrosine kinase HER2, also known as ErbB2. Multiple marketed products target HER2, including the antibodies trastuzumab (Herceptin®) and pertuzumab (Perjeta®) and the antibody toxin conjugate ado-trastuzumab emtansine (Kadcyla®), all from Roche/Genentech. In addition, GlaxoSmithKline markets the dual HER1/HER2 oral kinase inhibitor lapatinib (Tykerb®) for the treatment of metastatic breast cancer, Puma Biotechnology is developing the HER1/HER2/HER4 inhibitor neratinib in Phase 3 clinical trials.
Government Regulation
Government authorities in the United States, at the federal, state and local level, and government authorities in other countries extensively regulate, among other things, the research, development, testing, manufacture, labeling, promotion, advertising, distribution, marketing and export and import of biopharmaceutical products such as those we are developing. In many other countries, governmental authorities also regulate reimbursement for products such as those we are developing.
U.S. Government Regulation
In the United States, the information that must be submitted to the FDA in order to obtain approval to market a new drug varies depending on whether the drug is a new product whose safety and effectiveness has not previously been demonstrated in humans or a drug whose active ingredient(s) and certain other properties are the same as those of a previously approved drug. A new drug will follow the New Drug Application (NDA) route for approval, a new biologic will follow the biologics license application (BLA) route for approval, and a drug that claims to be the same as an already approved drug may be able to follow the Abbreviated New Drug Application (ANDA) route for approval. Our tucatinib product candidate will follow the NDA route for approval.
NDA and BLA Approval Process
In the United States, the FDA regulates drugs and biologics under the Federal Food, Drug and Cosmetic Act, and, in the case of biologics, also under the Public Health Service Act, and implementing regulations. If we fail to comply with the applicable U.S. requirements at any time during the product development process, approval process or after approval, we may become subject to administrative or judicial sanctions. These sanctions could include the FDA’s refusal to approve
8
Table of Contents
pending applications, license suspension or revocation, withdrawal of an approval, a clinical hold, warning letters, product recalls, product seizures, total or partial suspension of production or distribution, injunctions, fines, civil penalties or criminal prosecution. Any agency or judicial enforcement action could have a material adverse effect on us.
The steps required before a drug or biologic may be marketed in the United States include:
| • | completion of preclinical laboratory tests, animal studies and formulation studies under the FDA’s GLP regulations; |
| • | submission to the FDA of an IND for human clinical testing, which must become effective before human clinical trials may begin; |
| • | performance of adequate and well-controlled clinical trials to establish the safety and efficacy of the product candidate for each indication; |
| • | submission to the FDA of an NDA or BLA; |
| • | satisfactory completion of an FDA inspection of the manufacturing facility or facilities at which the product is produced to assess compliance with cGMP; and |
| • | FDA review and approval of the NDA or BLA. |
Preclinical tests include laboratory evaluations of product chemistry, toxicity and formulation, as well as animal studies. An IND sponsor must submit the results of the preclinical tests, together with manufacturing information and analytical data, to the FDA as part of the IND. The IND must become effective before human clinical trials may begin. An IND will automatically become effective 30 days after receipt by the FDA, unless before that time the FDA raises concerns or questions about issues such as the conduct of the trials as outlined in the IND. In that case, the IND sponsor and the FDA must resolve any outstanding FDA concerns or questions before clinical trials can proceed. Submission of an IND may not result in the FDA allowing clinical trials to commence.
Clinical trials involve the administration of the investigational product to human subjects under the supervision of qualified investigators. Clinical trials are conducted under protocols detailing, among other things, the objectives of the trial, the parameters to be used in monitoring safety and the effectiveness criteria to be evaluated. Each clinical protocol must be submitted to the FDA as part of the IND.
Clinical trials typically are conducted in three sequential phases, but the phases may overlap or be combined. Each trial must be reviewed and approved by an independent institutional review board for each site where the trial will be conducted before it can begin at that site. Phase 1 clinical trials usually involve the initial introduction of the investigational drug into humans to evaluate the product candidate’s safety, dosage tolerance, pharmacokinetics and pharmacodynamics and, if possible, to gain an early indication of its effectiveness. Phase 2 clinical trials usually involve controlled trials in a limited patient population to evaluate dosage tolerance and appropriate dosage, identify possible adverse effects and safety risks, and evaluate preliminarily the efficacy of the drug for specific indications. Phase 3 clinical trials usually further evaluate clinical efficacy and further test for safety in an expanded patient population. Phase 1, Phase 2 and Phase 3 testing may not be completed successfully within any specified period, if at all. The FDA or we may suspend or terminate clinical trials at any time on various grounds, including a finding that the subjects or patients are being exposed to an unacceptable health risk.
Assuming successful completion of the required clinical testing, the results of the preclinical studies and of the clinical studies, together with other detailed information, including information on the chemistry, manufacture and control criteria of the product candidate, are submitted to the FDA in the form of an NDA or BLA requesting approval to market the product for one or more indications. The FDA reviews an NDA to determine, among other things, whether a product is safe and effective for its intended use. The FDA reviews a BLA to determine, among other things, whether the product is safe, pure and potent and whether the facility in which it is manufactured, processed, packed or held meets standards designed to assure the product’s continued safety, purity and potency.
Before approving an NDA or BLA application, the FDA may inspect the facility or the facilities at which the product candidate will be manufactured for commercial sale. The FDA will not approve the product unless cGMP compliance is satisfactory. The FDA will also inspect a certain number of clinical sites that participated in clinical studies of the product candidate that is the subject of the application, as well as inspect the sponsor of the clinical trial to ensure processes and procedures used during the conduct of the trial were appropriate and comply with federal regulations. Any deficiencies at these clinical sites or by the sponsor could jeopardize approval of the NDA or BLA. If the FDA determines the application, results of inspections, manufacturing process or manufacturing facilities are not acceptable, it will outline the deficiencies in the submission and often will request additional testing or information. Notwithstanding the submission of any requested additional information, the FDA ultimately may decide that the application does not satisfy the regulatory criteria for approval.
9
Table of Contents
The testing and approval process for each NDA or BLA application requires substantial time, effort and financial resources, and may take several years to complete. The FDA may not grant approval on a timely basis, or at all. We may encounter difficulties or unanticipated costs in our efforts to secure FDA approval, which could delay or preclude us from marketing our product candidates. The FDA may limit the indications for use or place other conditions on any approvals that could restrict the commercial application of our product candidates. After approval, some types of changes to the approved product, such as adding new indications, manufacturing changes and additional labeling claims, are subject to further FDA review and approval.
Fast Track Designation / Priority Review
A Fast Track product is defined as a new drug or biologic intended for the treatment of a serious or life-threatening condition that demonstrates the potential to address unmet medical needs for this condition. Under the Fast Track program, the sponsor of a new drug or biologic may request that the FDA designate the drug or biologic as a Fast Track product at any time during the development of the product prior to marketing.
The FDA can base approval of an NDA or BLA application for a Fast Track product on the effect of the product candidate on a surrogate endpoint or on another endpoint that is reasonably likely to predict clinical benefit. The FDA may condition approval of an application for a Fast Track product candidate on a commitment to do post-approval clinical trials to validate the surrogate endpoint or confirm the effect on the clinical endpoint and may require prior review of all promotional materials. In addition, the FDA may withdraw approval of a Fast Track product in an expedited manner on a number of grounds, including the sponsor’s failure to conduct any required post-approval clinical trial in a timely manner.
The FDA also has established priority and standard review classifications for original NDAs and efficacy supplements. Priority review applies to the time frame for FDA review of completed NDA applications and is separate from and independent of the Fast Track and accelerated approval mechanisms. The classification system, which does not preclude the FDA from doing work on other projects, provides a way of prioritizing NDAs upon receipt and throughout the application review process.
Priority designation applies to new drugs that have the potential for providing significant improvement compared to marketed products in the treatment or prevention of a disease. Hence, even if an NDA is initially classified as a priority application, this status can change during the FDA review process; for example, if another product is approved for the same disease for which there was no previously available therapy. In addition, priority review does not guarantee that a product candidate will receive regulatory approval or that the FDA will adhere to the shortened review time frame described in the priority review guidance.
Also, new government requirements may be established that could delay or prevent regulatory approval of our product candidates under development.
In June 2016, tucatinib was granted Fast Track designation for the treatment of advanced HER2+ metastatic breast cancer.
Post-Approval Requirements
After regulatory approval of a product candidate is obtained, we are required to comply with a number of post-approval requirements. Holders of an approved NDA or BLA are required to report certain adverse reactions and production problems to the FDA, to provide updated safety and efficacy information and to comply with requirements concerning advertising and promotional labeling for their products. Also, quality control and manufacturing procedures must continue to conform to cGMP after approval. The FDA periodically inspects manufacturing facilities to assess compliance with cGMP, which imposes certain procedural, substantive and recordkeeping requirements. Accordingly, manufacturers must continue to expend time, money and effort on production and quality control to maintain compliance with cGMP and other aspects of regulatory compliance.
We use, and anticipate that we will continue to use, third party manufacturers to produce our product candidates in clinical and commercial quantities. Future FDA inspections may identify compliance issues at the facilities of our contract manufacturers that may disrupt production or distribution, or require substantial resources to correct. In addition, discovery of problems with a product or the failure to comply with applicable requirements may result in restrictions on a product, manufacturer or holder of an approved NDA or BLA, including withdrawal or recall of the product from the market or other voluntary, FDA-initiated or judicial action that could delay or prohibit further marketing.
10
Table of Contents
In addition, as a condition of approval of an NDA or BLA, the FDA may require post-marketing testing and surveillance to monitor the product’s safety or efficacy. Also, we may be required to comply with new government requirements in the future.
Canadian and Foreign Regulation
In addition to regulations in the United States, we will be subject to a variety of foreign regulations governing clinical trials and commercial sales and distribution of our product candidates outside the United States. Whether or not we obtain FDA approval for a product candidate, we must comply with the requirements of the comparable regulatory authorities of foreign countries before we can commence clinical trials or marketing of the products in those countries. The approval process varies from country to country, and the approval process may be longer or shorter than that required for FDA approval. The requirements governing the conduct of clinical trials, product licensing, pricing and reimbursement vary greatly from country to country.
Under the Canadian regulatory system, Health Canada is the regulatory body that governs the clinical trials of investigational products and the approval of drugs for commercial sale. Accordingly, any company that wishes to conduct a clinical trial in Canada must submit a clinical trial application to Health Canada. Health Canada reviews the application and notifies the company within 30 days if the application is found to be deficient. If the application is deemed acceptable, Health Canada will issue a letter to the company within the 30-day review period which means the company may proceed with its clinical trial(s).
Under European Union regulatory systems, we must also meet applicable regulatory requirements before commencing a clinical trial in any country in the European Union. To obtain approval for commercial sale, we may submit marketing authorizations either under a centralized or decentralized procedure. The centralized procedure provides for the grant of a single marketing authorization that is valid for all European Union member states. The decentralized procedure provides for mutual recognition of national approval decisions. Under this procedure, the holder of a national marketing authorization from one member state may submit an application to the remaining member states. Within 90 days of receiving the application and assessment report, each member state must decide whether to recognize approval. There are also separate regulatory requirements that a sponsor must meet to obtain reimbursement for an approved drug under the national health systems in each country in the European Union before it may be lawfully marketed.
Reimbursement
Sales of biopharmaceutical products depend in significant part on the availability of reimbursement from health insurers, health maintenance organizations and other private third-party payers, and from government programs including Medicare. Each private and governmental third-party payer may have its own policy regarding what products it will cover, the conditions under which it will cover such products, and how much it will pay for such products. Once a product is approved for commercial sale, third party payers will determine, based upon their policies, whether to reimburse for the product and how much of the price will be reimbursed to patients. Generally, drug sponsors will work with private third-party payers in this process and it can be time consuming and expensive. Reimbursement from private third-party payers may not be available or sufficient to allow us to sell our products on a competitive and profitable basis. Generally, once a drug is approved by the FDA, it is covered by Medicare and other federal government programs. However, the amount of reimbursement to a patient for the drug may be determined by the manner in which the drug is dispensed and administered (e.g. by a pharmacy or by a physician practice or hospital). Because of the perception that the costs of new drugs are excessive, there is increasing pressure to implement price controls for drugs reimbursed by federal government programs in order to contain costs.
We anticipate that the U.S. Congress, state legislatures and the private sector will continue to consider and may adopt healthcare policies intended to curb rising healthcare costs. These cost containment measures may include:
| • | restrictions on government funded reimbursement for drugs; |
| • | restrictions on healthcare providers; |
| • | challenges to the pricing of drugs or limits or prohibitions on reimbursement for specific products through other means; |
| • | reform of drug importation laws; and |
| • | expansion of use of managed care systems in which healthcare providers contract to provide comprehensive healthcare for a fixed cost per person. |
11
Table of Contents
We are unable to predict what legislation, regulations or policies, if any, relating to the healthcare industry or third-party coverage and reimbursement may be enacted in the future or what the magnitude of the effect such legislation, regulations or policies would have on our business. Any cost containment measures, including those listed above, or other healthcare system reforms that are adopted could have a material adverse effect on our business, financial condition and profitability.
In addition, in some foreign countries, the proposed pricing for a drug must be approved before it may be lawfully marketed. The requirements governing drug pricing vary widely from country to country. For example, the European Union provides options for its member states to restrict the range of medicinal products for which their national health insurance systems provide reimbursement and to control the prices of medicinal products for human use. A member state may approve a specific price for the medicinal product or it may instead adopt a system of direct or indirect controls on the profitability of the company placing the medicinal product on the market.
Research and Development
We devote a substantial portion of our resources to developing new product candidates. During the years ended December 31, 2017, 2016 and 2015, we expended approximately $44.0 million, $27.5 million and $23.5 million, respectively, on research and development activities. Higher research and development expenses during the year ended December 31, 2017 was primarily due to greater activity related to the development of our product candidates.
Employees
As of December 31, 2017, we had 71 employees. A number of our management and professional employees have had prior experience with other pharmaceutical or medical products companies.
Our ability to develop marketable products and to establish and maintain our competitive position in light of technological developments will depend, in part, on our ability to attract and retain qualified personnel. Competition for such personnel is intense. We have also chosen to outsource activities where skills are in short supply or where it is economically prudent to do so.
None of our employees are covered by collective bargaining agreements and we believe that our relations with our employees are good.
Corporate Information
We were incorporated in Canada in 1985 under the name Biomira Inc. (Biomira). In June 2016, we changed our name to Cascadian Therapeutics, Inc. from Oncothyreon Inc. Our common stock trades on the Nasdaq Global Market under the symbol “CASC”. Our executive office is located at 3101 Western Avenue, Suite 600, Seattle, Washington 98121. Our telephone number is (206) 801-2100. Our website address is http://www.cascadianrx.com. We may post information that is important to investors on our website. However, information found on our website is not incorporated by reference into this Annual Report on Form 10-K. We make available free of charge on our website our Annual Reports on Form 10-K, Quarterly Reports on Form 10-Q, Current Reports on Form 8-K and other filings pursuant to Section 13(a) or 15(d) of the Securities Exchange Act of 1934, as amended, or the Exchange Act, as soon as reasonably practicable after each is electronically filed with, or furnished to, the SEC. These reports may also be obtained without charge by contacting Investor Relations, Cascadian Therapeutics Inc., 3101 Western Avenue, Suite 600, Seattle, Washington 98121, e-mail: IR@cascadianrx.com.
In addition, you may review a copy of this Annual Report on Form 10-K, including exhibits and any schedule filed herewith, and obtain copies of such materials at prescribed rates, at the SEC’s Public Reference Room at 100 F Street, N.E., Washington, D.C. 20549. You may obtain information on the operation of the Public Reference Room by calling the SEC at 1-800-SEC-0330. The SEC maintains a website (http://www.sec.gov) that contains reports, proxy and information statements and other information regarding registrants, including the Company, that file electronically with the SEC.
“Cascadian Therapeutics” is a proprietary mark. All other product names, trademarks and trade names referred to in this Annual Report on Form 10-K are the property of their respective owners.
12
Table of Contents
Financial Information
We manage our operations and allocate resources as a single reporting segment. Financial information regarding our operations, including net loss, for the years ended December 31, 2017, 2016 and 2015, our total assets, liabilities and stockholders’ equity as of December 31, 2017 and 2016, is included in our audited financial statements located elsewhere in this Annual Report on Form 10-K.
13
Table of Contents
| Item 1A. | Risk Factors |
Set forth below and elsewhere in this report, and in other documents we file with the SEC, are descriptions of risks and uncertainties that could cause actual results to differ materially from the results contemplated by the forward-looking statements contained in this report. Because of the following factors, as well as other variables affecting our operating results, past financial performance should not be considered a reliable indicator of future performance and investors should not use historical trends to anticipate results or trends in future periods. The risks and uncertainties described below are not the only ones facing us. Other events that we do not currently anticipate or that we currently deem immaterial may also affect our results of operations and financial condition.
Risks Relating to our Business
Product candidates that appear promising in research and development may be delayed or may fail to reach later stages of clinical development.
The successful development of pharmaceutical products is highly uncertain. Product candidates that appear promising in research and development may be delayed or fail to reach later stages of development. For example, preliminary data from our Phase 1b trial of ONT-10 in combination with the T-cell agonist antibody, varlilumab, did not demonstrate sufficient activity to move forward with the program. We, therefore, decided not to continue this trial and, in February 2016, we terminated our collaboration agreement with Celldex. The ongoing or future trials for tucatinib (ONT-380) and our other programs may fail to demonstrate that these product candidates are sufficiently safe and effective to warrant further development.
Furthermore, decisions regarding the further development of product candidates must be made with limited and incomplete data, which makes it difficult to accurately predict whether the allocation of limited resources and the expenditure of additional capital on specific product candidates will result in desired outcomes. Preclinical and clinical data can be interpreted in different ways, and negative or inconclusive results or adverse medical events during a clinical trial could delay, limit or prevent the development of a product candidate, which could harm our business, financial condition or the trading price of our securities. There can be no assurance as to whether or when we will receive regulatory approvals for any of our product candidates, including tucatinib, CASC-578 and CASC-674.
There is no assurance that tucatinib will be safe, effective or receive regulatory approval for any indication.
Tucatinib is a late-stage clinical development candidate and the risks associated with its development are significant. Promising preclinical data in animal models and early clinical data may not be predictive of later clinical trial results. Clinical data from our pivotal HER2CLIMB clinical trial may fail to establish that tucatinib is effective in treating HER2+ breast cancer or associated brain metastases or may indicate safety profile concerns not indicated by earlier clinical data.
In December 2014, we announced that interim data from our ongoing Phase 1b combination trials indicated preliminary clinical activity and tolerability in a heavily pretreated patient population. Updates to some of these data provided further preliminary evidence of clinical activity and tolerability, including in brain metastases. Based upon this data, we commenced a Phase 2 clinical trial of tucatinib in February 2016 and are continuing that trial as our pivotal HER2CLIMB trial. However, none of these trials are complete, and even if final Phase 1b data are encouraging, the results from the pivotal HER2CLIMB clinical trial and any other clinical trials may not indicate a favorable safety and efficacy profile for tucatinib or may otherwise fail to support continued development of this product candidate.
In December 2016, we announced that, following discussions with the Food and Drug Administration (FDA) and discussions with our external Steering Committee, we amended the HER2CLIMB clinical trial of tucatinib by increasing the sample size so that, if successful, the trial could serve as a single pivotal study to support a new drug application. The primary endpoint remains progression-free survival (PFS) and the sample size has been increased to approximately 480 patients from 180 patients. Patients will also be followed for overall survival which is a secondary endpoint. Key objectives related to assessing activity in brain metastases include a secondary endpoint of PFS in a subset of patients with brain metastases. There is no assurance that the clinical data will achieve these endpoints in whole or in part. For example, the clinical data may achieve the primary endpoint in the overall study population, but not achieve the secondary endpoint in patients with brain metastases. We have not received a Special Protocol Assessment for the HER2CLIMB study. Thus, even if some or all of the endpoints are achieved and we file an NDA seeking approval for the commercial sale of tucatinib in metastatic breast cancer, there is no assurance that the FDA will approve the application.
14
Table of Contents
In June 2017, an investigator-sponsored trial was initiated to evaluate tucatinib in patients with colorectal cancer. Additional investigator-sponsored clinical trials of tucatinib in other indications may also be initiated in the future. We may also initiate additional clinical trials of tucatinib. Data from clinical trials we or investigators may initiate in other indications may fail to demonstrate that tucatinib is effective in the indications studied or safety profile concerns may arise. In that event, even if the pivotal HER2CLIMB succeeds in reaching its endpoints and receives regulatory approval, we may not be able to continue development of tucatinib in other indications or to receive regulatory approval for additional indications, which may limit the commercial potential of tucatinib and harm our business.
Adverse events or safety concerns involving tucatinib could delay or prevent us from obtaining regulatory approval.
Adverse events or safety concerns involving tucatinib or the combination of tucatinib with capecitabine or trastuzumab being studied in the HER2CLIMB study or the combination of tucatinib with other drugs could interrupt, delay or halt the HER2CLIMB clinical trial and/or other clinical trials of tucatinib. Tucatinib alone and in combination with other drugs has been studied in a limited number of patients to date and the known safety information is correspondingly limited. With study in additional patients, more severe or unanticipated adverse events may be experienced by patients. Adverse events or safety concerns involving tucatinib could result in regulatory authorities denying approval of tucatinib or limiting its use. There are no assurances that patients receiving tucatinib in combination with other drugs will not experience serious adverse events in the future or that unexpected or unanticipated adverse events will not occur. Further, there are no assurances that patients receiving tucatinib with co-morbid diseases will not experience new or different serious adverse events in the future.
Adverse events may also negatively impact the sales of tucatinib, if it is approved for sale in any jurisdiction. If tucatinib is approved for sale in the United States, we could be required to implement a Risk Evaluation and Mitigation Strategy to address safety concerns, which could adversely affect tucatinib’s acceptance in the market, make competition easier or make it more difficult or expensive for us to distribute and sell tucatinib.
We rely on agreements with third parties for our product candidate technology. Failure to maintain those agreements could prevent us from continuing to develop and commercialize our product candidates.
We entered into an exclusive license agreement with Array BioPharma, Inc. for our tucatinib technology. If Array BioPharma were to terminate our license agreement or if we are unable to maintain the exclusivity of that license agreement, we may be unable to continue to develop tucatinib.
We also have an exclusive license from Sentinel Oncology for our Chk1 program. If Sentinel Oncology were to terminate our license agreement or if we are unable to maintain the exclusivity of that license agreement, we may lose our rights to CASC-578.
We also have a development and option agreement for our CASC-674 program with Adimab. If Adimab were to terminate that agreement or if we do not exercise our option to acquire a license from Adimab, we may be unable to continue our CASC-674 program.
If in the future we have disputes with our licensors or partners that yield adverse results, our ability to develop and commercialize tucatinib and our other product candidates could be negatively impacted, and we may be required to enter into additional licenses, or we may be required to incur additional costs in litigation or settlement. In addition, continued development and commercialization of tucatinib and our other product candidates may require us to secure licenses to additional technologies. We may not be able to secure these licenses on commercially reasonable terms, if at all.
Our ability to continue with our planned operations is dependent on our success at raising additional capital sufficient to meet our obligations on a timely basis. If we fail to obtain additional financing when needed, we may be unable to complete the development, regulatory approval and commercialization of our product candidates.
We have expended and will continue to expend substantial funds relating to our product development activities and clinical trials and regulatory approvals. Conducting a large pivotal trial and other clinical trials and IND-enabling studies is very costly and our funds are very limited. Accordingly, to commercialize tucatinib, if our HER2CLIMB trial is successful, to continue tucatinib’s development into other indications, and to fund the continued development of our other programs, we will need to raise additional funds from the sale of our securities, partnering arrangements or other financing transactions to finance the commercialization of tucatinib and our other product candidates. We cannot be certain that additional
15
Table of Contents
financing will be available when and as needed or, if available, that it will be available on acceptable terms. If financing is available, it may be on terms that adversely affect the interests of our existing stockholders or restrict our ability to conduct our operations. To the extent that we raise additional funds through collaboration and licensing arrangements, we may be required to relinquish some rights to our technologies or product candidates or grant licenses on terms that are not favorable to us. Our actual capital requirements will depend on numerous factors, including:
| • | the pace of enrollment in the HER2CLIMB trial and the actual costs of that trial; |
| • | whether we enter into licensing or collaboration arrangements for any of our product candidates that reduce our costs to develop those product candidates; |
| • | activities and arrangements related to the commercialization of our product candidates; |
| • | the progress of our research and development programs; |
| • | the progress of preclinical and clinical testing of our product candidates; |
| • | the time and cost involved in obtaining regulatory approvals for our product candidates; |
| • | the cost of filing, prosecuting, defending and enforcing any patent claims and other intellectual property rights with respect to our intellectual property; |
| • | the effect of competing technological and market developments; |
| • | the effect of changes and developments in our existing licensing and other relationships; and |
| • | the terms of any new collaborative, licensing and other arrangements that we may establish. |
If we require additional financing and cannot secure sufficient financing on acceptable terms, we may need to delay, reduce or eliminate some or all of our research and development programs, any of which could have a material adverse effect on our business and financial condition.
We have a history of net losses, we anticipate additional losses and we may never become profitable.
Other than the year ended December 31, 2008, we have incurred net losses in each fiscal year since we commenced our research activities, and we do not anticipate realizing net income for the foreseeable future. As of December 31, 2017, our accumulated deficit was approximately $629.3 million. Our losses have resulted primarily from expenses incurred in research and development of our product candidates. We make significant capital commitments to fund the development of our product candidates. If these development efforts are unsuccessful, the development costs would be incurred without any future revenue, which could have a material adverse effect on our financial condition. We do not know when or if we will complete our product development efforts, receive regulatory approval for any of our product candidates, or successfully commercialize any approved products. As a result, it is difficult to predict the extent of any future losses or the time required to achieve profitability, if at all. Any failure of tucatinib or our other product candidates to complete successful clinical trials and obtain regulatory approval and any failure to become and remain profitable could adversely affect the price of our common stock and our ability to raise capital and continue operations.
We may be unable to enter into licensing or collaboration relationships.
We may from time to time seek to enter into licensing or collaboration relationships. Proposing, negotiating and implementing an economically viable licensing or collaboration arrangement is a lengthy and complex process. We compete for partnering arrangements and license agreements with pharmaceutical and biotechnology companies and other institutions. Our competitors may have stronger relationships with third parties with whom we are interested in collaborating or may have more established histories of developing and commercializing products. As a result, our competitors may have a competitive advantage in entering into partnering or licensing arrangements with such third parties. In addition, even if we generate interest in a partnering or licensing arrangement, we may not be able to enter into such arrangements on terms that we find acceptable, if at all. If we do enter into such arrangements, our obligations under the arrangement may require commitments of time and resources that may additional resources.
16
Table of Contents
The failure to enroll patients in the HER2CLIMB study or in other clinical trials may cause delays in developing our product candidates.
We may encounter delays if we are unable to enroll enough patients to timely complete the pivotal HER2CLIMB clinical trial or any of our other clinical trials. Patient enrollment depends on many factors, including the size of the patient population, the ability to engage clinical sites, the nature of the protocol, the proximity of patients to clinical sites, the eligibility criteria for the trial, and competition for patients with competing trials. The HER2CLIMB clinical trial has specific criteria for enrollment that may limit the number of patients eligible to participate in the trial and only a small fraction of potentially eligible patients in a given patient population ever seek to participate in a clinical trial. We undertake feasibility studies to help us determine the number of investigative sites required to enroll the patients needed for a given clinical trial, but the results of those studies are estimates, and enrollment may be substantially slower than anticipated. Moreover, when one product candidate is evaluated in multiple clinical trials, patient enrollment in ongoing trials can be adversely affected by negative results from completed trials. Our product candidates are focused in oncology, which can be a difficult patient population to recruit. If we fail to enroll patients for HER2CLIMB or our other clinical trials, HER2CLIMB or our other clinical trials may be delayed or suspended, which could delay our ability to generate revenues or raise capital to fund our operations. To enroll patients, we may have to seek additional clinical sites which cause additional expense and time with no guarantee of recruiting patients to our trials.
There is no assurance that we will be granted regulatory approval for tucatinib for metastatic breast cancer or any other indication or be granted regulatory approval for any of our other product candidates.
We are currently conducting a pivotal clinical trial and following patients in Phase 1b trials of tucatinib. There can be no assurance that these and future studies and trials will demonstrate sufficient safety and efficacy to obtain the requisite regulatory approvals. Many companies in the biotechnology and pharmaceutical industries, including our company, have suffered significant setbacks in advanced clinical trials, even after promising results in earlier trials.
Further, we may be unable to submit applications to regulatory agencies within the time frame we currently expect. Once submitted, applications must be approved by various regulatory agencies before we can commercialize the product described in the application. Additionally, even if applications are submitted, regulatory approval may not be obtained for any of our product candidates, and regulatory agencies could require additional clinical trials to verify safety or efficacy, which could make further development of our product candidates impracticable. If our product candidates are not shown to be safe and effective in clinical trials, we may not receive regulatory approval, which would have a material adverse effect on our business, financial condition and results of operations.
We currently rely on third-party manufacturers and other third parties to manufacture, package and supply tucatinib. Any disruption in production, inability of these third parties to produce adequate, satisfactory quantities to meet our needs or other impediments with respect to, manufacturing and supply could adversely affect our ability to continue the HER2CLIMB and other clinical trials of tucatinib, delay submissions of our regulatory applications or adversely affect our ability to commercialize tucatinib in a timely manner, or at all.
We are responsible for the manufacturing, labeling, packaging and distribution of tucatinib, which we outsource to third parties. Manufacture and supply of drug products such as tucatinib is a complex process involving multiple steps and multiple manufacturers and service providers. If our third-party manufacturers cease or interrupt production, if our third-party manufacturers and other service providers fail to supply satisfactory materials, products or services for any reason or experience performance delays or quality concerns, or if materials or products are lost in transit or in the manufacturing process, such interruptions could substantially delay progress on our programs or impact clinical trial drug supply, with the potential for additional costs and a material adverse effect on our business, financial condition and results of operations.
Our product candidates have not yet been manufactured on a commercial scale. Manufacturing at commercial scale may require third-party manufacturers to increase manufacturing capacity, which may require the manufacturers to fund capital improvements to support the scale up of manufacturing and related activities. With respect to a product candidate, we may be required to provide all or a portion of these funds. Third-party manufacturers may not be able to successfully increase manufacturing capacity for a product candidate for which we obtain marketing approval in a timely or economic manner, or at all. If any manufacturer is unable to provide commercial quantities of a product candidate, we will need to successfully transfer manufacturing technology to a new manufacturer. Engaging a new manufacturer for a particular product candidate could require us to conduct comparative studies or use other means to determine equivalence between that product candidate manufactured by a new manufacturer and the product candidate manufactured by the existing manufacturer, which could delay or prevent commercialization of our product candidate. If any of these manufacturers is unable or unwilling to increase its manufacturing capacity or if alternative arrangements are not established on a timely basis or on acceptable terms, the development and commercialization of the product candidate may be delayed or there may be a shortage in supply.
Manufacturers of our product candidates and related service providers must comply with good manufacturing practices (GMP) requirements enforced by the FDA through its facilities inspection program or by foreign regulatory agencies.
17
Table of Contents
These requirements include quality control, quality assurance and the maintenance of records and documentation. Manufacturers of our products and related service providers may be unable to comply with these GMP requirements and with other FDA, state and foreign regulatory requirements. We have little control over our manufacturers’ or service providers’ compliance with these regulations and standards. A failure to comply with these requirements may result in fines and civil penalties, suspension of production, or restrictions on the use of products produced, suspension or delay in product approval, product seizure or recall, or withdrawal of product approval. If the safety of any quantities supplied is compromised due to our manufacturers’ or other service providers’ failure to adhere to GMP or other applicable laws or for other reasons, we may not be able to obtain regulatory approval for our product candidates, the development and commercialization of our product candidates may be delayed and there may be a shortage in supply, which may prevent successful commercialization of our products.
Preclinical and clinical trials are expensive and time consuming, and any failure or delay in commencing or completing clinical trials for our product candidates could severely harm our business.
We are currently conducting a pivotal Phase 2 clinical trial and following patients in ongoing Phase 1b clinical trials for tucatinib. Each of our product candidates must undergo extensive preclinical studies and clinical trials as a condition to regulatory approval. Preclinical studies and clinical trials are expensive and take many years to complete. The commencement and completion of clinical trials for our product candidates may be delayed by many factors, including:
| • | safety issues or side effects; |
| • | delays in patient enrollment and variability in the number and types of patients available for clinical trials; |
| • | our ability to engage to timely engage suitable clinical trial sites that have personnel with the expertise required to conduct our clinical trial; |
| • | poor effectiveness of product candidates during clinical trials; |
| • | governmental or regulatory delays and changes in regulatory requirements, policy and guidelines; |
| • | our ability to satisfy regulatory requirements to commence a clinical trial and conduct the clinical trial in accordance with good clinical practices; |
| • | our ability to manufacture or obtain from third parties materials sufficient for use in preclinical studies and clinical trials; and |
| • | varying interpretation of data by the FDA and similar foreign regulatory agencies. |
It is possible that none of our product candidates will complete clinical trials in any of the markets in which we intend to sell those product candidates. Accordingly, we may not receive the regulatory approvals necessary to market our product candidates. Any failure or delay in commencing or completing clinical trials or obtaining regulatory approvals for product candidates would prevent or delay their commercialization and severely harm our business and financial condition.
In addition, both prior to and after regulatory approval of a product, regulatory agencies may require us to delay, restrict or discontinue clinical trials on various grounds, including a finding that the subjects or patients are being exposed to an unacceptable health risk. In addition, all statutes and regulations governing the conduct of clinical trials are subject to change in the future, which could affect the cost of such clinical trials. Any unanticipated delays in clinical studies could delay our ability to generate revenues and harm our financial condition and results of operations.
We rely on third parties to conduct our clinical trials. If these third parties do not perform as contractually required or otherwise expected, we may not be able to obtain regulatory approval for or be able to commercialize our product candidates.
We rely on third parties, such as contract research and clinical organizations, medical institutions, clinical investigators and contract laboratories, to assist in conducting our clinical trials. We have, in the ordinary course of business, entered into agreements with these third parties. Nonetheless, we are responsible for confirming that each of our clinical trials is conducted in accordance with its general investigational plan and protocol. Moreover, the FDA and foreign regulatory agencies require us to comply with regulations and standards, commonly referred to as good clinical practices, for conducting, recording and reporting the results of clinical trials to assure that data and reported results are credible and accurate and that the trial participants are adequately protected. Our reliance on third parties does not relieve us of these responsibilities and requirements. If these third parties do not successfully carry out their contractual duties or regulatory obligations or meet expected deadlines, if the third parties need to be replaced or if the quality or accuracy of the data they obtain is compromised due to the failure to adhere to our clinical protocols or regulatory requirements or for other reasons, our clinical trials may be extended, delayed, suspended or terminated, and we may not be able to obtain regulatory approval for our product candidates.
18
Table of Contents
We may be unable to maintain the benefits associated with orphan drug designation, including the potential for market exclusivity, for tucatinib, and may be unsuccessful in obtaining orphan drug designation or transfer of designations obtained by others for future product candidates.
Regulatory authorities in some jurisdictions, including the United States and Europe, may designate drugs intended to treat relatively small patient populations as orphan drugs. Under the U.S. Orphan Drug Act, the FDA may designate a drug as an orphan drug if it is intended to treat a rare disease or condition, which is defined as a patient population of fewer than 200,000 individuals in the United States. In the United States, orphan drug designation entitles a party to financial incentives such as opportunities for grant funding towards clinical trial costs, tax credits for qualified clinical research costs, and prescription drug user fee waivers.
Generally, if a drug with an orphan drug designation subsequently receives the first marketing approval for the indication for which it has such designation, the drug is entitled to a period of marketing exclusivity, which precludes EMA or the FDA from approving another marketing application for the same drug and indication for that time period, except in limited circumstances. If our competitors obtain orphan drug exclusivity prior to us for products that constitute the same active moiety and treat the same indications as our product candidates, we may not be able to have competing products approved by the applicable regulatory authority for a significant period of time. The applicable period is seven years in the United States.
As part of our business strategy, we have sought and received orphan drug designation for tucatinib in the United States for the treatment of HER2+ colorectal cancer and the treatment of breast cancer patients with brain metastases. However, orphan drug designation does not guarantee future orphan drug marketing exclusivity.
Additionally, even though we have obtained an orphan drug designation for tucatinib, and even if we obtain orphan drug exclusivity for this product candidate and other product candidates, that exclusivity may not effectively protect tucatinib from competition because drugs with different active moieties can be approved for the same condition. Even after an orphan drug is approved, the FDA can also subsequently approve a later application for a drug with the same active moiety for the same condition if the FDA concludes that the later drug is clinically superior in that it is shown to be safer in a substantial portion of the target populations, more effective or makes a major contribution to patient care. In addition, a designated orphan drug may not receive orphan drug exclusivity if it is approved for a use that is broader than the indication for which it received orphan designation. Moreover, orphan drug exclusive marketing rights in the United States may be lost if the FDA later determines that the request for designation was materially defective or if we are unable to manufacture sufficient quantities of the product to meet the needs of patients with the rare disease or condition. Orphan drug designation does not shorten the development time or regulatory review time of a drug and does not give the drug any advantage in the regulatory review or approval process.
Our product candidates may never achieve market acceptance even if we obtain regulatory approvals.
Even if we receive regulatory approvals for the commercial sale of our product candidates, the commercial success of these product candidates will depend on, among other things, their acceptance by physicians, patients, third-party payers such as health insurance companies, and other members of the medical community as a therapeutic and cost-effective alternative to competing products and treatments. New patterns of care, alternative new treatments or different reimbursement and payer paradigms, possibly due to economic conditions or governmental policies, could negatively impact the commercial viability of our product candidates. If our product candidates fail to gain market acceptance, we may be unable to earn sufficient revenue to continue our business. Market acceptance of, and demand for, any product that we may develop and commercialize will depend on many factors, including:
| • | our ability to provide acceptable evidence of safety and efficacy; |
| • | the prevalence and severity of adverse side effects; |
| • | availability, relative cost and relative efficacy of alternative and competing treatments; |
| • | the effectiveness of our marketing and distribution strategy; |
| • | publicity concerning our products or competing products and treatments; and |
| • | our ability to obtain sufficient third-party insurance coverage or reimbursement. |
19
Table of Contents
If our product candidates do not become widely accepted by physicians, patients, third-party payers and other members of the medical community, our business, financial condition and results of operations would be materially and adversely affected.
Even if regulatory approval is received for our product candidates, we are subject to ongoing regulatory obligations that, if not met, may adversely affect our ability to commercialize an approved product.
We are subject to ongoing regulatory obligations following approval of a product including potential requirements for additional clinical trials, ongoing GMP manufacturing requirements, and other requirements. If a product is approved for commercial sale, safety concerns may arise that were not present in clinical trials or occur at higher rates than in our clinical trials of the product which may result in regulatory restrictions. In addition, reports of adverse events or safety concerns could result in the FDA or other regulatory authorities denying or withdrawing approval of the product for any or all indications. There is no assurance that patients will not experience such adverse events or safety concerns.
In addition, we will be required to comply with other limitations and restrictions imposed by U.S., state and foreign governments relating to the marketing of an approved product and reimbursement for approved products. Our failure to meet any of these requirements may have an adverse effect on our ability to commercialize an approved product and our business would suffer.
In addition, if we fail to comply with any applicable requirements, we could be subject to penalties, including:
| • | warning letters; |
| • | untitled letters; |
| • | suspension of clinical trials; |
| • | product liability litigation; |
| • | total or partial suspension of manufacturing or costly new manufacturing requirements; |
| • | fines; |
| • | product recalls; |
| • | withdrawal of regulatory approval; |
| • | operating restrictions; |
| • | disgorgement of profits; |
| • | injunctions; and |
| • | criminal prosecution. |
Any of these penalties may result in substantial costs to us and could adversely affect our ability to commercialize an approved product and our business would suffer.
Failure to obtain regulatory approval in foreign jurisdictions would prevent us from marketing our products internationally.
We intend to have our product candidates marketed outside the United States. In order to market our products in the European Union and many other non-U.S. jurisdictions, we must obtain separate regulatory approvals and comply with numerous and varying regulatory requirements. To date, we have not filed for marketing approval for any of our product candidates and may not receive the approvals necessary to commercialize our product candidates in any market.
The approval procedure varies among countries and may include all the risks associated with obtaining FDA approval. The time required to obtain foreign regulatory approval may differ from that required to obtain FDA approval, and additional clinical trials, testing and data review may be required. We may not obtain foreign regulatory approvals on a timely basis, if at all. Additionally, approval by the FDA does not ensure approval by regulatory agencies in other countries, and approval by one foreign regulatory authority does not ensure approval by regulatory agencies in other foreign countries or by the FDA. However, a failure or delay in obtaining regulatory approval in one jurisdiction may have a negative effect on the regulatory approval process in other jurisdictions, including approval by the FDA. The failure to obtain regulatory approval in foreign jurisdictions could limit commercialization of our products, reduce our ability to generate profits and harm our business.
20
Table of Contents
We may expand our business through the acquisition of companies or businesses or by entering into collaborations or in-licensing product candidates that could disrupt our business and harm our financial condition.
We have in the past and may in the future seek to expand our pipeline and capabilities by acquiring one or more companies or businesses, entering into collaborations or in-licensing one or more product candidates. For example, in December 2014, we entered into a license agreement with Array for exclusive rights to develop and commercialize tucatinib. Acquisitions, collaborations and in-licenses involve numerous risks, including:
| • | substantial cash expenditures; |
| • | potentially dilutive issuance of equity securities; |
| • | incurrence of debt and contingent liabilities, some of which may be difficult or impossible to identify at the time of acquisition; |
| • | potential adverse consequences if the acquired assets are worth less than we anticipated, or we are unable to successfully develop and commercialize the acquired assets for any reason; |
| • | difficulties in assimilating the operations and technology of the acquired companies; |
| • | potential disputes, including litigation, regarding contingent consideration for the acquired assets; |
| • | the assumption of unknown liabilities of the acquired businesses; |
| • | diverting our management’s attention away from other business concerns; |
| • | entering markets in which we have limited or no direct experience; and |
| • | potential loss of our key employees or key employees of the acquired companies or businesses. |
Our experience in making acquisitions, entering collaborations and in-licensing product candidates is limited. We cannot offer assurance that any acquisition, collaboration or in-license will result in short-term or long-term benefits to us. We may incorrectly judge the value or worth of an acquired company or business or in-licensed product candidate. In addition, our future success may depend in part on our ability to manage the growth and technology integration associated with any of these acquisitions, collaborations and in-licenses. We cannot assure that we will be able to successfully combine our business with that of acquired businesses, manage collaborations or integrate in-licensed product candidates or that such efforts would be successful. Furthermore, the development or expansion of our business or any acquired business or company or any collaboration or in-licensed product candidate may require a substantial capital investment by us. We may also seek to raise funds by selling shares of our capital stock, which could dilute our current stockholders’ ownership interest, or securities convertible into our capital stock, which could dilute current stockholders’ ownership interest upon conversion. We may also incur debt obligations, which could require us to comply with covenants which could restrict our ability to operate our business and negatively impact the value of our common stock.
Our success depends in large part on our and our licensors’ ability to obtain and maintain patent and other intellectual property protection worldwide with respect to our proprietary technology and products that are important to our business.
Our ability to successfully commercialize our technology and products and to compete effectively may be materially adversely affected if we are unable to obtain and maintain effective intellectual property rights to our technologies and product candidates throughout the world. The intellectual property position of pharmaceutical and biotechnology companies generally is highly uncertain and involves complex legal and factual questions. The process of filing patent applications in the United States and abroad is expensive and time-consuming, and we or our licensors may not be able to file and prosecute all necessary or desirable patent applications at a reasonable cost or in a timely manner.
In recent years, there have been significant changes in both the patent laws and interpretation of the patent laws in the United States and other countries. As a result, the issuance, scope, validity, enforceability and commercial value of our and our licensors’ patent rights are highly uncertain. Our owned and licensed patents may be challenged in the courts or patent offices in the United States and abroad. Such challenges may result in patent claims being narrowed, invalidated or held unenforceable, which could limit our ability to obtain and maintain patent protection for our products and could prevent us from effectively blocking others from commercializing competitive technologies and products or limit the duration of the patent protection for our technology and products.
21
Table of Contents
Our and our licensors’ pending and future patent applications may not result in patents being issued which protect our technology or products. Our competitors may be able to circumvent our owned or licensed patents by developing similar or alternative technologies or products in a non-infringing manner.
We have in-licensed or acquired a portion of our intellectual property necessary to develop certain of our product candidates. If we fail to comply with our obligations in our intellectual property licenses with third parties, we could lose such licenses or intellectual property rights that are important to our business.
We are a party to intellectual property license agreements with other parties, including with respect to tucatinib, and expect to enter into additional license agreements in the future. In some circumstances, we may not have the right to enter into additional license agreements in the future. In some circumstances, we may not have the right to control the preparation, filing and prosecution of patent applications, or to maintain the patents, covering technology or products that we license from third parties. Therefore, we cannot be certain that these patents and applications will be prosecuted and enforced in a manner consistent with the best interests of our business. In addition, if the parties who license patents to us fail to maintain such patents, or lose rights to those patents, the rights we have licensed may be reduced or eliminated. If we fail to meet our obligations in our license agreements, our licensors may have the right to terminate these agreements, in which event we may lose intellectual property rights to a product candidate that is covered by the agreement. Termination of these licenses or reduction or elimination of our licensed rights may result in our having to negotiate new or reinstated licenses with less favorable terms or our not having sufficient intellectual property rights to operate our business.
Protection of trade secrets and confidential information is difficult, and we may not be successful in protecting our rights to our unpatented proprietary know-how and trade secrets, thus harming our business and competitive position.
We rely on unpatented proprietary know-how, trade secrets and continuing technological innovations to develop and maintain our competitive position. We employ various methods, including confidentiality agreements with employees and consultants, customers, suppliers and potential collaborators to protect our know-how and trade secrets. However, these agreements may not adequately protect us or provide an adequate remedy. Our trade secrets or know-how may become known or be independently discovered by our competitors. Unpatented proprietary rights, including trade secrets and know-how, can be difficult to protect and lose their value if they are discovered or disclosed.
Further, we may not be able to deter current and former employees, contractors and other parties from breaching confidentiality agreements and misappropriating our proprietary information. It is possible that other parties may copy or otherwise obtain and use our information and proprietary technology without authorization.
We may be subject to claims that our employees have wrongfully used or disclosed intellectual property of their former employers, which may cause us to spend substantial resources and distract our personnel from their normal responsibilities.
Many of our employees were previously employed at universities or other companies, including our competitors or potential competitors. Although we try to ensure that our employees do not use the proprietary information or know-how of others, we may be subject to claims that we or our employees have used or disclosed proprietary information of a former employer. Litigation may be necessary to defend against these claims. If we fail in defending any such claims, in addition to paying monetary damages, we may lose valuable intellectual property rights or personnel. Even if we are successful in defending against such claims, legal proceedings relating to the defense may cause us to incur significant expenses and reduce our resources available for development activities.
If our trademarks are not adequately protected, we may not be able to build name recognition in our markets of interest and our business may be adversely affected.
Our trademarks, CASCADIAN THERAPEUTICS and CASCADIAN, may be challenged, infringed, circumvented or declared generic or determined to be infringing on other marks. We may not be able to protect our rights to this trademark and build name recognition in our markets of interest. Over the long term, if we are unable to establish name recognition based on our trademark, then we may not be able to compete effectively, and our business may be adversely affected.
22
Table of Contents
If we are unable to obtain intellectual property rights to develop or market our products or we infringe on a third-party patent or other intellectual property rights, we may need to alter or terminate a product development program.
If our product candidates infringe or conflict with the rights of others, we may not be able to manufacture or market our product candidates, which could have a material and adverse effect on us.
While conducting clinical trials, we are exempt from patent infringement based on the Drug Price Competition and Patent Term Restoration Act or Hatch–Waxman Act, (codified in relevant part at 35 U.S.C. §271(e)), which provides an exemption for activities conducted to obtain FDA approval of a drug product. However, issued patents held by others may limit our ability to develop commercial products. All issued patents are entitled to a presumption of validity under the laws of the United States. If we need licenses to such patents to permit us to develop or market our product candidates, we may be required to pay significant fees or royalties, and we cannot be certain that we would be able to obtain such licenses on commercially reasonable terms, if at all. Competitors or third parties may obtain patents that may cover subject matter we use in developing the technology required to bring our product candidates to market.
We know that others have filed patent applications in various jurisdictions that relate to several areas in which we are developing products. Some of these patent applications have already resulted in the issuance of patents and some are still pending. We may be required to alter our processes or product candidates, pay licensing fees or cease activities.
If use of technology incorporated into or used to produce our product candidates is challenged, or if our processes or product candidates conflict with patent rights of others, third parties could bring legal actions against us, in the United States, Europe, and elsewhere, claiming damages and seeking to enjoin manufacturing and marketing of the affected products. Additionally, it is not possible to predict with certainty what patent claims may issue from pending applications. In the United States, for example, patent prosecution can proceed in secret prior to issuance of a patent. As a result, third parties may be able to obtain patents with claims relating to our product candidates or technology, which they could attempt to assert against us. Further, as we develop our products, third parties may assert that we infringe the patents currently held or licensed by them and it is difficult to predict the outcome of any such action. Ultimately, we could be prevented from commercializing a product, or forced to cease some aspect of our business operations as a result of claims of patent infringement or violation of other intellectual property rights, which could have a material and adverse effect on our business, financial condition and results of operations.
We may incur substantial costs as a result of litigation or other proceedings relating to patent and other intellectual property rights, and we may be unable to protect our rights in, or to use, our technology.
There has been significant litigation in the biopharmaceutical industry over patents and other proprietary rights and if we become involved in any litigation, it could consume a substantial portion of our resources, regardless of the outcome of the litigation. If these legal actions are successful, in addition to any potential liability for damages, we could be required to obtain a license, grant cross-licenses and pay substantial royalties in order to continue to manufacture or market the affected products.
The cost of litigation to uphold the validity of patents to prevent infringement or to otherwise protect our proprietary rights can be substantial. If the outcome of litigation is adverse to us, third parties may be able to use the challenged technologies without payment to us. There is also the risk that, even if the validity of a patent were upheld, a court would refuse to stop the other party from using the inventions, including because its activities do not infringe that patent. There is no assurance that we would prevail in any legal action or that any license required under a third-party patent would be made available on acceptable terms or at all. If any of these events were to occur, our business, financial condition and results of operations would be materially and adversely effected.
If any products we develop become subject to unfavorable pricing regulations, third-party reimbursement practices or healthcare reform initiatives, our ability to successfully commercialize our products will be impaired.
Our future revenues, profitability and access to capital will be affected by the continuing efforts of governmental and private third-party payers to contain or reduce the costs of health care through various means. We expect a number of federal, state and foreign proposals to control the cost of drugs through government regulation. We are unsure of the impact that the potential repeal of recent health care reform legislation may have on our business or what actions federal, state, foreign and private payers may take or reforms that may be implemented in the future. Therefore, it is difficult to predict the effect of any potential reform on our business. Our ability to commercialize our products successfully will depend, in part, on the extent to which reimbursement for the cost of such products and related treatments will be
23
Table of Contents
available from government health administration authorities, such as Medicare and Medicaid in the United States, private health insurers and other organizations. Significant uncertainty exists as to the reimbursement status of newly approved health care products, particularly for indications for which there is no current effective treatment or for which medical care typically is not sought. Adequate third-party coverage may not be available to enable us to maintain price levels sufficient to realize an appropriate return on our investment in product research and development. If adequate coverage and reimbursement levels are not provided by government and third-party payers for use of our products, our products may fail to achieve market acceptance without a substantial reduction in price or at all and our results of operations will be harmed.
Governments often impose strict price controls, which may adversely affect our future profitability.
We intend to seek approval to market our future products in both the United States and foreign jurisdictions. If we obtain approval in one or more foreign jurisdictions, we will be subject to rules and regulations in those jurisdictions relating to our product. In some foreign countries, particularly in the European Union, prescription drug pricing is subject to government control. In these countries, pricing negotiations with governmental authorities can take considerable time after the receipt of marketing approval for a drug candidate. To obtain reimbursement or pricing approval in some countries, we may be required to conduct a clinical trial that compares the cost-effectiveness of our future product to other available therapies.
Domestic and foreign governments continue to propose and pass legislation designed to reduce the cost of healthcare, including drugs. In the United States, there have been, and we expect that there will continue to be, federal and state proposals to implement similar governmental control. In addition, increasing emphasis on managed care in the United States will continue to put pressure on the pricing of pharmaceutical products. While the current federal administration has indicated an intent to repeal the Patient Protection and Affordable Care Act, as amended by the Health Care and Education Affordability Reconciliation Act, or collectively, PPACA, the current administration has also indicated an intent to address prescription drug pricing and recent Congressional hearings have brought increased public attention to the costs of prescription drugs.
We anticipate that healthcare reform measures that may be adopted in the future, may result in more rigorous coverage criteria and downward pressure on the price for any approved product, and could seriously harm our prospects. Any reduction in reimbursement from Medicare or other government programs may result in a similar reduction in payments from private payers. If reimbursement of our future products is unavailable or limited in scope or amount, or if pricing is set at unsatisfactory levels, we may be unable to achieve or sustain profitability.
We face potential product liability exposure, and if successful claims are brought against us, we may incur substantial liability for a product candidate which may limit its commercial potential.
The use of tucatinib or our other product candidates in clinical trials and the sale of any products for which we obtain marketing approval expose us to the risk of product liability claims. Product liability claims might be brought against us by consumers, health care providers, pharmaceutical companies or other third parties. If we cannot successfully defend ourselves against these claims, we will incur substantial liabilities. Regardless of merit or eventual outcome, liability claims may result in:
| • | decreased demand for approved products; |
| • | delay in completing or failure to complete enrollment in any clinical trial of the affected product; |
| • | impairment of our business reputation; |
| • | withdrawal of clinical trial participants; |
| • | costs of related litigation; |
| • | substantial monetary awards to patients or other claimants; |
| • | loss of revenues; and |
| • | the inability to commercialize our product candidates. |
Although we currently have product liability insurance coverage for our clinical trials for expenses or losses up to a $10 million aggregate annual limit, our insurance coverage may not reimburse us or may not be sufficient to reimburse us for any or all expenses or losses we may suffer. Moreover, insurance coverage is becoming increasingly expensive and, in the future, we may not be able to maintain insurance coverage at a reasonable cost or in sufficient amounts to protect us
24
Table of Contents
against losses due to clinical trial or product liability. We intend to expand our insurance coverage to include the sale of commercial products if we obtain marketing approval for tucatinib or our other product candidates in development, but we may be unable to obtain commercially reasonable product liability insurance for any products approved for marketing. On occasion, large judgments have been awarded in class action lawsuits based on products that had unanticipated side effects. A successful product liability claim or series of claims brought against us could cause our stock price to fall and, if judgments exceed our insurance coverage, could decrease our cash and adversely affect our business.
We face substantial competition, which may result in others discovering, developing or commercializing products before, or more successfully, than we do.
The life sciences industry is highly competitive, and we face significant competition from many pharmaceutical, biopharmaceutical and biotechnology companies that are researching and marketing products designed to address cancer indications for which we are currently developing products or for which we may develop products in the future. Our future success depends on our ability to demonstrate and maintain a competitive advantage with respect to the design, development and commercialization of tucatinib and our other product candidates. We expect any product candidate that we commercialize on our own or with a collaboration partner will compete with existing, market-leading products and products in development. The following information provides a landscape view of known marketed products or programs in development that compete with our product candidates:
Tucatinib is an inhibitor of the receptor tyrosine kinase HER2, also known as ErbB2. There are multiple marketed products which target HER2, including the antibodies trastuzumab (Herceptin®) and pertuzumab (Perjeta®) and the antibody toxin conjugate ado-trastuzumab emtansine or T-DM1 (Kadcyla®). In addition, lapatinib (Tykerb®) is a dual EGFR/HER2 oral kinase inhibitor for the treatment of metastatic breast cancer and neratinib (Nerlynx®) is an EGFR/HER2/HER4 inhibitor indicated for extended adjuvant use that is also being studied for use in metastatic breast cancer.
With respect to CASC-578 and CASC-674, there are multiple competing product candidates in clinical trials and preclinical development.
Many of our potential competitors have substantially greater financial, technical and personnel resources than we have. In addition, many of these competitors have significantly greater commercial infrastructures than we have. Our ability to compete successfully will depend largely on our ability to:
| • | design and develop product candidates that are superior to other products in the market; |
| • | attract qualified scientific, medical, sales and marketing and commercial personnel; |
| • | obtain patent and/or other proprietary protection for our processes and product candidates; |
| • | obtain required regulatory approvals; and |
| • | successfully collaborate with others, as needed, in the design, development and commercialization of our product candidates. |
In addition, established competitors may invest significant resources to quickly discover and develop novel compounds that could make tucatinib or our other product candidates obsolete. In addition, any new product that competes with a generic market-leading product must demonstrate compelling advantages in efficacy, convenience, tolerability and safety in order to overcome severe price competition and to be commercially successful. If we are not able to compete effectively against our current and future competitors, our business will not grow, and our financial condition and operations will suffer.
If we are unable to enter into agreements with partners to perform sales and marketing functions, or build these functions ourselves, we will not be able to commercialize our product candidates.
We currently do not have any internal sales, marketing or distribution capabilities. In order to commercialize tucatinib or any of our other product candidates, we must either acquire or internally develop a selling, marketing and distribution infrastructure or enter into agreements with partners to perform these services for us. We may not be able to enter into such arrangements on commercially acceptable terms, if at all. Factors that may inhibit our efforts to commercialize our product candidates without entering into arrangements with third parties include:
25
Table of Contents
| • | our inability to recruit and retain adequate numbers of effective sales and marketing personnel; |
| • | the inability of sales personnel to obtain access to or persuade adequate numbers of physicians to prescribe our products; |
| • | the lack of complementary products to be offered by sales personnel, which may put us at a competitive disadvantage relative to companies with more extensive product lines; and |
| • | unforeseen costs and expenses associated with creating a sales and marketing organization. |
If we are not able to partner with a third party and are not successful in recruiting sales and marketing personnel or in building a sales and marketing and distribution infrastructure, we will have difficulty commercializing tucatinib or any of our other product candidates, which would adversely affect our business and financial condition. The complexity of regulations regarding the sales and marketing of pharmaceutical products may require costly and time-consuming efforts to train any sales and marketing personnel, which would negatively impact our financial condition and business operations.
We may encounter difficulties in managing our growth and expanding our operations successfully.
As we seek to commercialize our product candidates, we will need to expand our development, regulatory, manufacturing, marketing and sales capabilities or contract with third-parties to provide these capabilities for us. As our operations expand, we expect that we will need to identify, commence and manage additional relationships with various strategic partners, qualified suppliers, manufacturers and other third-parties. Future growth will impose significant added responsibilities on members of management. Our future financial performance and our ability to commercialize our product candidates and to compete effectively will depend, in part, on our ability to manage any future growth effectively. To that end, we must be able to manage our development efforts and clinical trials effectively and hire, train and integrate additional management, administrative and sales and marketing personnel. The hiring, training and integration of new employees may be more difficult, costly and/or time-consuming for us because we have fewer resources than a larger organization. We may not be able to accomplish these tasks, or to accomplish them in a timely fashion, and our failure to accomplish any of them could prevent us from successfully growing our company.
If we lose key personnel, or we are unable to attract and retain highly-qualified personnel on a cost-effective basis, it will be more difficult for us to manage our existing business operations and to identify and pursue new growth opportunities.
Our success depends in large part upon our ability to attract and retain highly qualified scientific, clinical, manufacturing, and management personnel. In addition, future growth will require us to continue to implement and improve our managerial, operational and financial systems, and continue to retain, recruit and train additional qualified personnel, which may impose a strain on our administrative and operational infrastructure. Any difficulties in hiring or retaining key personnel or managing this growth could disrupt our operations. The competition for qualified personnel in the biopharmaceutical field is strong. We are highly dependent on our continued ability to attract, retain and motivate highly-qualified management, clinical and scientific personnel. Due to our limited resources, and the strong competition for qualified personnel, we may not be able to effectively recruit, train and retain additional qualified personnel. If we are unable to retain key personnel or manage our growth effectively, we may not be able to implement our business plan.
Furthermore, we have not entered into non-competition agreements with all of our key employees and we do not maintain “key person” life insurance on any of our officers, employees or consultants. The loss of the services of existing personnel, the failure to recruit additional key scientific, technical and managerial personnel in a timely manner, and the loss of our employees to our competitors would each harm our research, development and clinical programs and our business.
Our business is subject to complex environmental legislation that increases both our costs and the risk of noncompliance.
Our business involves the use of hazardous material, which requires us to comply with environmental regulations and we will be required to adjust to new and upcoming requirements relating to the materials composition of our product candidates. If we use hazardous materials in a manner that causes contamination or injury or violates laws, we may be liable for damages. Environmental regulations could have a material adverse effect on the results of our operations and our financial position. We maintain insurance for any liability associated with our hazardous materials activities, and it is possible in the future that our coverage would be insufficient if we incurred a material environmental liability.
26
Table of Contents
If we fail to establish and maintain proper and effective internal controls, our ability to produce accurate financial statements on a timely basis could be impaired, which would adversely affect our consolidated operating results, our ability to operate our business, and our stock price, and could result in litigation or similar actions.
Ensuring that we have adequate internal financial and accounting controls and procedures in place to produce accurate financial statements on a timely basis is a costly and time-consuming effort that needs to be re-evaluated frequently. Failure on our part to have effective internal financial and accounting controls would cause our financial reporting to be unreliable, could have a material adverse effect on our business, operating results, and financial condition, and could cause the trading price of our common stock to fall dramatically. Our management is responsible for establishing and maintaining adequate internal control over financial reporting to provide reasonable assurance regarding the reliability of our financial reporting and the preparation of financial statements for external purposes in accordance with U.S. GAAP. Our management does not believe that our internal control over financial reporting will prevent or detect all errors and all fraud. A control system, no matter how well designed and operated, can provide only reasonable, not absolute, assurance that the control system’s objectives will be met. Because of the inherent limitations in all control systems, no evaluation of controls can provide absolute assurance that misstatements due to error or fraud will not occur or that all control issues and instances of fraud, if any, within the company will be detected.
We cannot be certain that the actions we have taken to ensure we have adequate internal controls over financial reporting will be sufficient. In future periods, if the process required by Section 404 of the Sarbanes-Oxley Act reveals any material weaknesses or significant deficiencies, the correction of any such material weaknesses or significant deficiencies could require remedial measures which could be costly and time-consuming. In addition, in such a case, we may be unable to produce accurate financial statements on a timely basis. Any associated accounting restatement could create a significant strain on our internal resources and cause delays in our release of quarterly or annual financial results and the filing of related reports, increase our costs and cause management distraction. Any of the foregoing could cause investors to lose confidence in the reliability of our consolidated financial statements, which could cause the market price of our common stock to decline and make it more difficult for us to finance our operations and growth.
Our internal computer systems, or those of our third-party collaborators or other contractors, may fail or suffer security breaches, which could result in a material disruption of our development programs.
Our internal computer systems and those of our current and any future collaborators and other contractors or consultants are vulnerable to damage from computer viruses, unauthorized access, natural disasters, terrorism, war and telecommunication and electrical failures. While we have not experienced any such material system failure, accident or security breach to date, if such an event were to occur and cause interruptions in our operations, it could result in a material disruption of our development programs and our business operations, whether due to a loss of our trade secrets or other proprietary information or other similar disruptions. For example, the loss of clinical trial data from completed or future clinical trials could result in delays in our regulatory approval efforts and significantly increase our costs to recover or reproduce the data. To the extent that any disruption or security breach were to result in a loss of, or damage to, our data or applications, or inappropriate disclosure of confidential or proprietary information, we could incur liability, our competitive position could be harmed, and the further development and commercialization of our product candidates could be delayed.
We may face risks related to securities litigation that could result in significant legal expenses and settlement or damage awards.
We have in the past been, and may in the future become, subject to claims and litigation alleging violations of the securities laws or other related claims, which could harm our business and require us to incur significant costs. We are generally obliged, to the extent permitted by law, to indemnify our current and former directors and officers who are named as defendants in these types of lawsuits. Any future litigation may require significant attention from management and could result in significant legal expenses, settlement costs or damage awards that could have a material impact on our financial position, results of operations, and cash flows.
Our ability to use our U.S. net operating loss carryforwards and certain other tax attributes may be limited.
Under Section 382 of the Internal Revenue Code of 1986, as amended (“the Code”), if a corporation undergoes an “ownership change,” generally defined as a greater than 50% change (by value) in its equity ownership over a three-year period, the corporation’s ability to use its pre-change U.S. net operating loss carryforwards (“NOLs”), and other pre-change U.S. tax attributes (such as research tax credits) to offset its post-change income may be limited. We may have experienced an ownership change based on past financing transactions and may experience ownership changes in the
27
Table of Contents
future as a result of subsequent shifts in our stock ownership. As a result, if we earn net taxable income, our ability to use our pre-change U.S. net operating loss carryforwards to offset U.S. federal taxable income may be subject to limitations, which could potentially result in increased future tax liability to us. In addition, at the state level, there may be periods during which the use of NOLs is suspended or otherwise limited, which could accelerate or permanently increase state taxes owed.
Risks Related to the Ownership of Our Common Stock
The trading price of our common stock may be volatile.
The market prices for and trading volumes of securities of biopharmaceutical companies, including our securities, have been historically volatile. For example, we experienced significant volatility following a press release regarding our Phase 1b studies of tucatinib in December 2015. The market has from time to time experienced significant price and volume fluctuations unrelated to the operating performance of particular companies. The market price of our common shares may fluctuate significantly due to a variety of factors, including:
| • | the results of preclinical testing and clinical trials by us, our competitors and/or companies that are developing products that are similar to ours (regardless of whether such products are potentially competitive with ours); |
| • | public concern as to the safety of products developed by us or others; |
| • | our ability to timely enroll patients and complete our pivotal HER2CLIMB clinical study; |
| • | the results of the HER2CLIMB study or other studies of tucatinib that we or clinical investigators may undertake; |
| • | our ability to execute our business strategies; |
| • | technological innovations or new therapeutic products; |
| • | governmental regulations; |
| • | developments in patent or other proprietary rights; |
| • | litigation; |
| • | general market conditions in our industry or in the economy as a whole; |
| • | comments by securities analysts; |
| • | comments made on social media platforms, including blogs, websites, message boards and other forms of Internet-based communications; |
| • | difficulty with the market interpreting and understanding complex data; |
| • | the issuance of additional shares of common stock, or securities convertible into, or exercisable or exchangeable for, shares of our common stock in connection with financings, acquisitions or otherwise; |
| • | the incurrence of debt; and |
| • | political instability, natural disasters, war and/or events of terrorism. |
We may seek to raise additional capital in the future; however, such capital may not be available to us on reasonable terms, if at all, when or as we require additional funding. If we issue additional shares of our common stock or other securities that may be convertible into, or exercisable or exchangeable for, our common stock, our existing stockholders would experience further dilution.
We expect that we will seek to raise additional capital from time to time in the future. For example, in January 2017 we sold 26,659,300 shares of our common stock and 1,818 shares of our Series E preferred stock in concurrent but separate public offerings.
Future financings may involve the issuance of debt, equity and/or securities convertible into or exercisable or exchangeable for our equity securities. These financings may not be available to us on reasonable terms or at all when and as we require funding. In addition, we may need to increase our authorized capital to ensure that we have shares of common stock available for issuance in any future equity financings. An increase in our authorized capital will require approval of a majority of our stockholders and we may not be able to obtain that approval. If we are able to consummate
28
Table of Contents
financings, the trading price of our common stock could be adversely affected, and the terms of such financings may adversely affect the interests of our existing stockholders. Any failure to obtain additional working capital when required would have a material adverse effect on our business and financial condition and would be expected to result in a decline in our stock price. Any issuances of our common stock, preferred stock, or securities such as warrants or notes that are convertible into, exercisable or exchangeable for, our capital stock, would have a dilutive effect on the voting and economic interest of our existing stockholders.
Several stockholders own a significant percentage of our outstanding capital stock and will be able to influence stockholder and management decisions, which may conflict with the interests of stockholders.
As of February 28, 2018, New Enterprise Associates and its affiliates (NEA), Baupost, Inc., and Biotechnology Value Fund and its affiliates (BVF) collectively held combined voting power over approximately 46.3% of the outstanding shares of our common stock, based on the Schedules 13D and 13G filed by them with the Securities and Exchange Commission. BVF holds shares of our preferred stock convertible into up to 2,555,546 additional shares of our common stock. As a result of their respective ownership positions, NEA, Baupost, and BVF each may have the ability to significantly influence matters requiring stockholder approval, including, without limitation, the election or removal of directors, an increase in our authorized common stock, mergers, acquisitions, changes of control of our company and sales of all or substantially all of our assets. As a result, of this concentration of ownership, these stockholders may have a significant influence in our management and affairs. This influence may delay, deter or prevent acts that may be favored by our other stockholders, as the interests of these stockholders may not always coincide with the interests of our other stockholders. In addition, this concentration of share ownership may adversely affect the trading price of our shares because it may limit the trading volume and purchase demand for outstanding shares, could adversely affect our stock price should any of these stockholders elect to sell some or all of their shares, and investors may perceive disadvantages in owning shares in a company with significant stockholders.
Provisions in our corporate charter documents could make an acquisition of us more difficult and may prevent attempts by our stockholders to replace or remove our current management.
Provisions in our corporate charter and our bylaws may discourage, delay or prevent a merger, acquisition or other change in control of us that stockholders may consider favorable, including transactions in which stockholders might otherwise receive a premium for their shares. These provisions could also limit the price that investors might be willing to pay in the future for shares of our common stock, thereby depressing the market price of our common stock. In addition, these provisions may frustrate or prevent any attempts by our stockholders to replace or remove our current management by making it more difficult for stockholders to replace members of our board of directors. Because our board of directors is responsible for appointing the members of our management team, these provisions could in turn affect any attempt by our stockholders to replace current members of our management team. Among others, these provisions include the following:
| • | our board of directors is divided into three classes with staggered three-year terms which may delay or prevent a change of our management or a change in control; |
| • | our board of directors has the right to elect directors to fill a vacancy created by the expansion of the board of directors or the resignation, death or removal of a director, which prevents stockholders from being able to fill vacancies on our board of directors; |
| • | our stockholders may not act by written consent or call special stockholders’ meetings; as a result, a holder, or holders, controlling a majority of our capital stock would not be able to take certain actions other than at annual stockholders’ meetings or special stockholders’ meetings called by the board of directors, the chairman of the board or the chief executive officer; |
| • | our certificate of incorporation does not provide for cumulative voting in the election of directors, which limits the ability of minority stockholders to elect director candidates; |
| • | stockholders must provide advance notice and additional disclosures to nominate individuals for election to the board of directors or to propose matters that can be acted upon at a stockholders’ meeting, which may discourage or deter a potential acquirer from conducting a solicitation of proxies to elect the acquirer’s own slate of directors or otherwise attempting to obtain control of our company; and |
| • | our board of directors may issue, without stockholder approval, shares of undesignated preferred stock; the ability to issue undesignated preferred stock makes it possible for our board of directors to issue preferred stock with voting or other rights or preferences that could impede the success of any attempt to acquire us. |
Provisions under Delaware law and Washington law could make an acquisition of our company more difficult, limit attempts by our stockholders to replace or remove our current management and limit the market price of our common stock.
29
Table of Contents
In addition to provisions in our corporate charter and our bylaws, because we are incorporated in Delaware, we are governed by the provisions of Section 203 of the Delaware General Corporation Law, which generally prohibits a Delaware corporation from engaging in any of a broad range of business combinations with any holder of at least 15% of our capital stock for a period of three years following the date on which the stockholder became a 15% stockholder. Likewise, because our principal executive offices are located in Washington, the anti-takeover provisions of the Washington Business Corporation Act may apply to us under certain circumstances now or in the future. These provisions prohibit a “target corporation” from engaging in any of a broad range of business combinations with any stockholder constituting an “acquiring person” for a period of five years following the date on which the stockholder became an “acquiring person.”
Because we do not expect to pay dividends on our common stock, stockholders will benefit from an investment in our common stock only if it appreciates in value.
We have never paid cash dividends on our common shares and have no present intention to pay any dividends in the future. We are not profitable and do not expect to earn any material revenues for at least several years, if at all. As a result, we intend to use all available cash and liquid assets in the development of our business. Any future determination about the payment of dividends will be made at the discretion of our board of directors and will depend upon our earnings, if any, capital requirements, operating and financial conditions and on such other factors as our board of directors deems relevant. As a result, the success of an investment in our common stock will depend upon any future appreciation in its value. There is no guarantee that our common stock will appreciate in value or even maintain the price at which stockholders have purchased their shares.
We can issue shares of preferred stock that may adversely affect the rights of a stockholder of our common stock.
Our certificate of incorporation authorizes us to issue up to 10,000,000 shares of preferred stock with designations, rights, and preferences determined from time-to-time by our board of directors. Accordingly, our board of directors is empowered, without stockholder approval, to issue preferred stock with dividend, liquidation, conversion, voting or other rights superior to those of holders of our common stock. For example, an issuance of shares of preferred stock could:
| • | adversely affect the voting power of the holders of our common stock; |
| • | make it more difficult for a third party to gain control of us; |
| • | discourage bids for our common stock at a premium; |
| • | limit or eliminate any payments that the holders of our common stock could expect to receive upon our liquidation; or |
| • | otherwise adversely affect the market price or our common stock. |
We have in the past issued, and we may at any time in the future issue, additional shares of authorized preferred stock. As of December 31, 2017, we had outstanding preferred stock convertible into 7,248,601 shares of common stock. If the holders of such shares of preferred stock convert their shares into common stock, existing holders of our common stock will experience dilution.
Our management has broad discretion over the use of proceeds from the sale of shares of our common and preferred stock and may not use such proceeds in ways that increase the value of our stock price.
In our June 2016 public offering, we sold 6,708,333 shares of common stock and 17,250 shares of Series D convertible preferred stock for net proceeds of approximately $43.3 million and in our January 2017 public offering, we sold 26,659,300 shares of our common stock and 1,818 shares of our Series E convertible preferred stock in concurrent but separate public offerings for net proceeds of approximately $88.0 million. We have broad discretion over the use of proceeds from the sale of these shares, and we could spend the proceeds in ways that do not improve our results of operations or enhance the value of our common stock. Our failure to apply these funds effectively could have a material adverse effect on our business, delay the development of tucatinib and our other product candidates and cause the price of our common stock to decline.
If securities or industry analysts do not publish research or publish inaccurate or unfavorable research about our business, our stock price and any trading volume could decline.
30
Table of Contents
The trading market for our common stock depends in part on the research and reports that securities or industry analysts publish about us or our business. If one or more of securities or industry analysts covering our business downgrade our stock or publish inaccurate or unfavorable research about our business, our stock price would likely decline. If one or more of these analysts cease coverage of our company or fail to publish reports on us regularly, demand for our stock could decrease, which might cause our stock price and trading volume to decline.
| ITEM 1B. | Unresolved Staff Comments |
None.
| ITEM 2. | Properties |
On December 4, 2017, we entered into a sublease agreement (the New Lease) for a new office location in Seattle, Washington totaling approximately 44,050 rentable square feet to house our research and development and administrative activities. The lease on the premises commenced on January 1, 2018 and expires on April 30, 2022. In January 2018, we moved our headquarters to the new office space. We believe that our Seattle facility is in good condition, adequately maintained and suitable for the conduct of our current business.
In May 2008, we entered into a lease for a facility in Seattle, Washington totaling approximately 17,000 square feet, which was amended in November 2016 to add approximately 2,600 square feet. In connection with the execution of the New Lease, on December 4, 2017, we entered into a lease termination agreement for the early termination of the lease without an early termination fee. In January 2018, we terminated the lease.
| ITEM 3. | Legal Proceedings |
From time to time, we may be involved in litigation relating to claims arising out of our operations in the normal course of business.
Between February 13, 2018 and February 16, 2018, four purported stockholders of the Company filed separate putative class action lawsuits and an individual complaint (the “Actions”) in the United States District Court for the District of Delaware and the United States District Court for the Western District of Washington against the Company and individual members of the board of directors of the Company (the “Board”), Merger Sub, and Seattle Genetics. The Actions allege violations of Sections 14(d) and 14(e) of the Exchange Act, Rule 14d-9(d) promulgated under Section 14(d) of the Exchange Act, and Section 20(a) of the Exchange Act in connection with the Schedule 14D-9 filed by the Company with the U.S. Securities and Exchange Commission on February 8, 2018 (together with the exhibits and annexes thereto and as amended and supplemented from time to time, the “Schedule 14D-9”). One complaint alleges that the Board breached its fiduciary duties of care, loyalty and good faith by entering into the proposed transaction and allegedly failing to take steps to maximize the Company’s value. The complaints filed in the Actions allege that the Schedule 14D-9 omits material information, ostensibly rendering the Schedule 14D-9 materially incomplete. Plaintiffs seek, among other things, orders (i) enjoining the defendants from closing the Offer and consummating the Merger, (ii) directing the defendants to account to the plaintiff and the class for damages sustained, and (iii) awarding plaintiffs’ costs, including attorneys’ fees.
The Company believes that the Actions are without merit and intends to vigorously defend against all claims asserted; however, their ultimate outcome cannot presently be determined.
| ITEM 4. | Mine Safety Disclosures |
Not applicable.
31
Table of Contents
| ITEM 5. | Market for Registrant’s Common Equity, Related Stockholder Matters and Issuer Purchases of Equity Securities |
Market Information for Common Stock
Our common stock is quoted on the Nasdaq Global Market under the symbol “CASC”. The following table sets forth for the indicated periods the high and low sales prices of our common stock as reported by the Nasdaq Global Market. The per share amounts are adjusted for our one-for-six reverse stock split that occurred in November 2016. Further information on the stock split can be found in “Note 2 — Significant Accounting Policies” to the consolidated financial statements included in this report.
| High | Low | |||||||
| Fiscal year ended December 31, 2017: |
||||||||
| First Quarter |
$ | 5.24 | $ | 3.49 | ||||
| Second Quarter |
4.97 | 3.18 | ||||||
| Third Quarter |
4.30 | 3.27 | ||||||
| Fourth Quarter |
4.69 | 3.52 | ||||||
| Fiscal year ended December 31, 2016: |
||||||||
| First Quarter |
$ | 13.14 | $ | 5.40 | ||||
| Second Quarter |
8.58 | 4.92 | ||||||
| Third Quarter |
10.98 | 5.58 | ||||||
| Fourth Quarter |
6.72 | 5.04 | ||||||
Dividends
We have never declared nor paid cash dividends on our common stock. We currently expect to retain future earnings, if any, to finance the operation and expansion of our business, and we do not anticipate paying any cash dividends in the foreseeable future. Any future determination related to our dividend policy will be made at the discretion of our board of directors.
Stockholders
As of February 28, 2018, there were 55,312,923 shares of our common stock outstanding held by approximately 304 stockholders of record and approximately 16,707 stockholders in nominee name.
Securities Authorized for Issuance under Equity Compensation Plans
For information concerning our equity compensation plans see the section of this Annual Report on Form 10-K captioned “Part III — Item 12 — Security Ownership of Certain Beneficial Owners and Management and Related Stockholder Matters.”
Stock Performance Graph
The following information relating to the price performance of our common stock shall not be deemed to be “filed” with the SEC or to be “soliciting material” under the Securities Exchange Act of 1934, as amended (the Exchange Act) and it shall not be deemed to be incorporated by reference into any of our filings under the Exchange Act or the Securities Act of 1933, as amended, except to the extent we specifically incorporate it by reference into such filing.
The graph below compares the cumulative total stockholder return of our common stock with that of the Nasdaq Composite Index, Nasdaq Biotechnology Index, RDG SmallCap Biotechnology Index and Russell 2000 Technology Index from December 31, 2012 through December 31, 2017. The comparisons in this graph below are based on historical data and are not intended to forecast or be indicative of future performance of our common stock. The graph assumes that $100 was invested and that all dividends were reinvested.
32
Table of Contents
COMPARISON OF 5 YEAR CUMULATIVE TOTAL RETURN*
Among Cascadian Therapeutics, Inc., the NASDAQ Composite Index,
the NASDAQ Biotechnology Index, the RDG SmallCap Biotechnology Index
and the Russell 2000 Technology Index
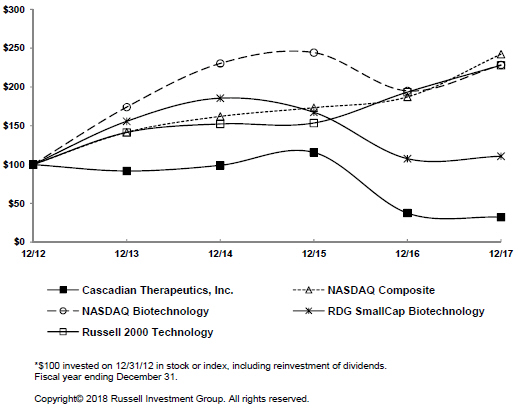
Unregistered Sale of Equity Securities
During the three months ended December 31, 2017, we did not issue or sell any shares of our common stock or other equity securities pursuant to unregistered transactions in reliance upon exemption from the registration requirements of the Securities Act of 1933, as amended.
Issuer Purchases of Equity Securities
We did not make any purchases of our outstanding common stock during the three months ended December 31, 2017.
33
Table of Contents
| ITEM 6. | Selected Financial Data |
The data set forth below is not necessarily indicative of the results of future operations and should be read in conjunction with the consolidated financial statements and notes thereto included elsewhere in this annual report on Form 10-K and also with Part II, Item 7, “Management’s Discussion and Analysis of Financial Condition and Results of Operations.”
| Year Ended December 31, | ||||||||||||||||||||
| 2017 | 2016 | 2015 | 2014 | 2013 | ||||||||||||||||
| (Amounts in thousands, except share and per share data.) | ||||||||||||||||||||
| Consolidated Statements of Operations Data: |
||||||||||||||||||||
| Total operating expenses |
$ | 58,089 | $ | 64,835 | $ | 32,789 | $ | 50,835 | $ | 41,223 | ||||||||||
| Loss from operations |
(58,089 | ) | (64,835 | ) | (32,789 | ) | (50,835 | ) | (41,223 | ) | ||||||||||
| Net loss attributable to common stockholders (1) (2) |
$ | (57,916 | ) | $ | (60,293 | ) | $ | (32,581 | ) | $ | (49,963 | ) | $ | (38,759 | ) | |||||
|
|
|
|
|
|
|
|
|
|
|
|||||||||||
| Loss per share — basic (3) |
$ | (1.21 | ) | $ | (3.13 | ) | $ | (2.02 | ) | $ | (3.86 | ) | $ | (3.73 | ) | |||||
|
|
|
|
|
|
|
|
|
|
|
|||||||||||
| Loss per share — diluted (3) |
$ | (1.21 | ) | $ | (3.13 | ) | $ | (2.02 | ) | $ | (3.86 | ) | $ | (3.73 | ) | |||||
|
|
|
|
|
|
|
|
|
|
|
|||||||||||
| Weighted average number of common shares outstanding — basic (3) |
47,966,493 | 19,264,121 | 16,102,860 | 12,936,640 | 10,397,941 | |||||||||||||||
|
|
|
|
|
|
|
|
|
|
|
|||||||||||
| Weighted average number of common shares outstanding — diluted (3) |
47,966,493 | 19,264,121 | 16,102,860 | 12,936,640 | 10,397,941 | |||||||||||||||
|
|
|
|
|
|
|
|
|
|
|
|||||||||||
| As of December 31, | ||||||||||||||||||||
| 2017 | 2016 | 2015 | 2014 | 2013 | ||||||||||||||||
| (Amounts in thousands, except share data.) | ||||||||||||||||||||
| Consolidated Balance Sheet Data: |
||||||||||||||||||||
| Cash, cash equivalents and short-term investments |
$ | 93,277 | $ | 62,805 | $ | 56,360 | $ | 57,671 | $ | 60,027 | ||||||||||
| Total assets (4) |
$ | 120,825 | $ | 83,265 | $ | 96,574 | $ | 103,103 | $ | 77,512 | ||||||||||
| Total long-term liabilities |
$ | 30 | $ | 135 | $ | 8,044 | $ | 7,430 | $ | 1,536 | ||||||||||
| Stockholders’ equity |
$ | 109,036 | $ | 74,357 | $ | 83,735 | $ | 91,266 | $ | 71,550 | ||||||||||
| Common shares outstanding (5) |
50,598,611 | 22,562,640 | 15,826,985 | 15,266,899 | 11,778,861 | |||||||||||||||
| (1) | Net loss attributable to common stockholders for the year ended December 31, 2017 includes a deemed dividend of $1.0 million related to the beneficial conversion feature on the Series E convertible preferred stock. Net loss attributable to common stockholders for the year ended December 31, 2016 includes an intangible asset impairment charge of $19.7 million in connection with our termination of the STC.UNM license agreement, a deemed dividend of $2.6 million related to the beneficial conversion feature on the Series D convertible preferred stock and an income tax benefit of $6.9 million due to the reversal of a deferred tax liability, which related solely to the impairment of the indefinite-lived intangible asset. |
| (2) | Net loss attributable to common stockholders includes income from the change in fair market value of warrant liability of $0.1 million, $0.8 million and $2.3 million for the years ended December 31, 2015, 2014 and 2013, respectively. For additional information on net loss for the years ended December 31, 2015, 2014 and 2013, please refer to our Annual Reports on Form 10-K. |
| (3) | Basic and diluted net loss per share and shares used to compute basic and diluted net loss per share for the years ended December 31, 2015, 2014 and 2013 have been adjusted retroactively to reflect the 1-for-6 reverse stock split. |
| (4) | In November 2015, the Financial Accounting Standards Board (FASB) issued Accounting Standards Update (ASU) No. 2015-17, “Income Taxes (Topic 740): Balance Sheet Classification of Deferred Taxes”. The standard requires that deferred tax assets and liabilities be classified as noncurrent on the balance sheet rather than being separated into current and noncurrent. We adopted the standard on a retrospective basis beginning with the year ended December 31, 2012, and applied it consistently through the year ended December 31, 2017. The adoption of this standard resulted in the classification of noncurrent deferred tax liabilities of $0.2 million, $0.3 million and $0.2 million, respectively, on our consolidated balance sheets as of December 31, 2015, 2014 and 2013. The netting of noncurrent liabilities with noncurrent assets resulted in the reduction of total assets for the periods presented. |
| (5) | Common shares outstanding as of December 31, 2015, 2014 and 2013 have been adjusted retroactively to reflect the 1-for-6 reverse stock split that occurred in 2016. |
34
Table of Contents
| ITEM 7. | Management’s Discussion and Analysis of Financial Condition and Results of Operations |
The following discussion and analysis of our financial condition and results of operations should be read in conjunction with our consolidated financial statements and related notes included elsewhere in this report. This discussion contains forward-looking statements that involve risks and uncertainties. Our actual results could differ materially from those discussed below. Factors that could cause or contribute to such differences include, but are not limited to, those identified below, and those discussed in the section titled “Risk Factors” included elsewhere in this report. All dollar amounts included in this discussion and analysis of our financial condition and results of operations represent U.S. dollars unless otherwise specified. Throughout this discussion, unless the context specifies or implies otherwise, the terms “Company,” “Cascadian Therapeutics,” “Oncothyreon,” “Biomira,” “we,” “us,” and “our” refer to Cascadian Therapeutics, Inc., its predecessors, Oncothyreon Inc. and Biomira Inc., and its subsidiaries.
Key Highlights
In 2017, we made significant progress in advancing our lead product candidate in clinical trials. Select key fiscal year 2017 highlights include:
Research and Development
| • | In April 2017, data highlights from presentations of preclinical data for CASC-578 and data from the first public presentation of TIGIT were presented at the American Association for Cancer Research Annual Meeting 2017. |
| • | In June 2017, tucatinib was granted orphan drug designation by the FDA for the treatment of breast cancer patients with brain metastases. |
| • | In June 2017, a Phase 2 study called MOUNTAINEER was initiated to evaluate tucatinib in combination with trastuzumab for patients with HER2 amplified metastatic colorectal cancer and recently began enrolling participants in the U.S. |
| • | In July 2017, we received confirmation from the EMA that positive results from HER2CLIMB could serve as a single registrational trial for submission of a MAA to the EMA for potential marketing approval. We had received similar confirmation from the FDA in 2016. |
| • | In September 2017, tucatinib was granted orphan drug designation by the FDA for the treatment of HER2+ colorectal cancer. |
| • | In September 2017, results from the pooled analysis of Phase 1b combination studies showed further support for the potential utility of tucatinib for patients with HER2+ metastatic breast cancer with brain metastases, including untreated or progressive brain metastases after radiation therapy. In addition, data from nonclinical models were presented that support the evaluation of tucatinib in HER2+ gastrointestinal cancers. These results were presented at the European Society for Medical Oncology 2017 Congress. |
| • | In November 2017, Health Canada validated the potential for the ongoing HER2CLIMB pivotal clinical trial and nonclinical programs to be sufficient for tucatinib registration, if data are supportive. |
| • | In November 2017, we decided to pursue partnering opportunities for CASC-578, a Chk1 kinase inhibitor, and CASC-674, a TIGIT antibody program, and to close internal laboratory operations to focus resources on tucatinib registration-enabling critical path activities. |
| • | In December 2017, EMA’s Scientific Advice Working Group provided guidance on the planned manufacturing program for tucatinib, to ensure that Cascadian’s manufacturing plans will be acceptable for filing and commercial release in the EU. |
| • | In December 2017, the first patient was enrolled in the investigator-initiated Phase 1b/2 trial known as TULiP that is evaluating tucatinib in combination with an aromatase inhibitor and CDK4/6 agent for patients with hormone receptor-positive and HER2-positive (HR+/HER2+) metastatic breast cancer. |
35
Table of Contents
| • | In December 2017, we reported results from a subgroup analysis from its two ongoing combination studies of tucatinib, which demonstrated prolonged progression-free survival benefit regardless of presence of brain metastases or patient characteristics. These results were presented at the 2017 SABCS. |
Corporate
| • | In January 2017, we closed an $88 million net public offering of common and Series E preferred stock. |
| • | In March 2017, Robert W. Azelby was appointed to the Board of Directors and Richard L. Jackson, Ph.D., retired from the Board. |
| • | In September 2017, management pursued partnering opportunities for CASC-578, a Chk1 kinase inhibitor, and CASC-674, a TIGIT antibody program, and closed internal laboratory operations to focus resources on tucatinib registration-enabling critical path activities. |
| • | In December 2017, Cascadian Therapeutics was officially added to the Nasdaq Biotechnology Index. |
2018 Merger Agreement
On January 30, 2018, we entered into an Agreement and Plan of Merger (the Merger Agreement) with Seattle Genetics, Inc., a Delaware corporation (Seattle Genetics), and Valley Acquisition Sub, Inc., a Delaware corporation and a wholly owned subsidiary of Seattle Genetics (Merger Sub). Pursuant to the Merger Agreement, and upon the terms and subject to the conditions thereof, on February 8, 2018, Merger Sub commenced a tender offer (the “Offer”) to acquire all of our issued and outstanding shares of common stock (the Shares) at a purchase price of $10 per Share (the Offer Price), net to the seller in cash, without interest and subject to any required withholding taxes.
Following the consummation of the Offer and subject to the terms and conditions of the Merger Agreement, Merger Sub will merge with and into Cascadian Therapeutics, with Cascadian Therapeutics surviving as a subsidiary of Seattle Genetics (the Merger, and together with the Offer, the Transactions). The Merger will be effected pursuant to Section 251(h) of the General Corporation Law of the State of Delaware (the DGCL), without a vote of stockholders of Cascadian Therapeutics. At the effective time of the Merger, each Share (other than Shares owned by Seattle Genetics, Merger Sub, or any other direct or indirect wholly owned subsidiary of Seattle Genetics, and Shares owned by Cascadian Therapeutics, or any direct or indirect wholly owned subsidiary of the Company, or by stockholders who have validly exercised their appraisal rights under Delaware law) will be converted into the right to receive an amount in cash equal to the Offer Price, without interest and subject to any required withholding taxes.
Financial Overview
We have incurred substantial losses since our inception. As of December 31, 2017, our accumulated deficit totaled $629.3 million. We incurred a net loss attributable to common stockholders of $57.9 million for the year ended December 31, 2017 compared to a net loss attributable to common stockholders of $60.3 million for the same period in 2016. The decrease in net loss attributable to common stockholders for the year ended December 31, 2017 was primarily due to the intangible asset impairment charge of $19.7 million in connection with our termination of the STC.UNM license agreement in 2016. As a result of the termination and our intent to no longer develop, license or commercialize the protocell technology, the $19.7 million in indefinite-lived intangible assets were considered fully impaired and written-off during the year ended December 31, 2016. For additional information, please refer to “Note 8 — Collaborative and License Agreements” of the audited financial statements included in this report. In addition, the decrease in loss was due to lower general and administrative expenses of $3.6 million primarily arising from lower ongoing compensation-related expenses in connection with management changes in the first quarter of 2016, higher net investment and other income of $0.9 million primarily due to higher interest income and lower non-cash expense from the deemed dividend related to the beneficial conversion feature on convertible preferred stock, which was $1.0 million for the year ended December 31, 2017 compared to $2.6 million for the year ended December 31, 2016. The decreases in net loss attributable to common stockholders were partially offset by higher research and development expenses of $16.5 million due to increased enrollment activity related to tucatinib HER2CLIMB clinical trials and a non-cash tax benefit of $6.9 million related to the reversal of our deferred tax liability that was solely due to the indefinite-lived intangible asset that was written off during the year ended December 31, 2016. In future periods, we expect to continue to incur substantial net losses as we continue our research and development activities with respect to our product candidates. From inception to date we have funded our operations principally through the sale of our equity securities, cash received through our strategic partners, government grants, debt financings and equipment financings.
36
Table of Contents
Key Financial Metrics
Expenses
Research and Development. Research and development expense consists of costs associated with research activities as well as costs associated with our product development efforts, conducting preclinical studies and clinical trial and manufacturing costs. These expenses primarily include external research and development expenses incurred pursuant to collaboration agreements; agreements with third-party manufacturing and contract research organizations; technology access and licensing fees related to the use of proprietary third-party technologies; and internal expenses associated with employee related costs, including salaries, share-based compensation expense, benefits and related costs; allocated facility overhead which includes depreciation and amortization; and third-party consulting and supplier expenses. We recognize research and development expenses, including those paid to third parties, as they are incurred.
General and Administrative. General and administrative expense consists principally of salaries, benefits, share-based compensation expense and related costs for personnel in our executive, business development, finance, accounting, legal, human resource functions and information technology services. Other general and administrative expenses include professional fees for legal, consulting, accounting services and allocation of our facility costs, which includes depreciation and amortization.
Intangible Asset Impairment. Intangible assets with indefinite lives represent the value assigned to in-process research and development as of the acquisition date and are tested annually for impairment. Intangible asset impairment represents the difference between the carrying value and the fair value of the impaired asset.
Investment and Other Income (Expense), Net. Net investment and other income (expense) consisted of interest and other income on our cash and short-term investments, debt, foreign exchange gains and losses and other non-operating income (expense). Our investments consist of debt securities of U.S. government agencies and corporate bonds.
Change in Fair Value of Warrants. Warrants issued in connection with our securities offerings in May 2009 and September 2010 were classified as a liability due to their potential settlement in cash and other terms, and as such, were recorded at their estimated fair value on the date of the closing of the respective transactions. The warrants issued in connection with our May 2009 securities offering expired in May 2014 and the warrants issued in connection with our September 2010 securities offering expired in October 2015. The warrants were marked to market for each financial reporting period, with changes in estimated fair value recorded as a gain or loss in our consolidated statements of operations. The fair value of the warrants was determined using the Black-Scholes option-pricing model, which requires the use of significant judgment and estimates for the inputs used in the model. For more information, see “Note 3 — Fair Value Measurements” and “Note 6 — Share Capital” of the audited financial statements included elsewhere in this Annual Report on Form 10-K.
Income Tax Benefit (Provision) for Income Tax. Due to the $19.7 million impairment of indefinite-lived intangible assets, we reversed our deferred tax liability, which solely relates to the indefinite-lived intangible assets, and recorded a $6.9 million tax benefit in our consolidated statements of operations for the year ended December 31, 2016. For more information, see “Note 5 — Intangible Asset Impairment” of the audited financial statements included in this report.
Critical Accounting Policies and Significant Judgments and Estimates
We have prepared this management’s discussion and analysis of financial condition and results of operations based on our audited consolidated financial statements, which have been included in this report beginning on page F-1 and which have been prepared in accordance with U.S. generally accepted accounting principles. These accounting principles require us to make significant estimates and judgments that can affect the reported amounts of assets and liabilities as of the dates of our consolidated financial statements as well as the reported amounts of revenue and expense during the periods presented. We believe that the estimates and judgments upon which we rely are reasonable based upon historical experience and information available to us at the time that we make these estimates and judgments. To the extent there are material differences between these estimates and actual results, our consolidated financial statements will be affected.
The SEC considers an accounting policy to be critical if it is important to a company’s financial condition and results of operations and if it requires the exercise of significant judgment and the use of estimates on the part of management in its application. We have discussed the selection and development of our critical accounting policies with the audit committee of our board of directors, and our audit committee has reviewed our related disclosures in this report. Although we believe that our judgments and estimates are appropriate, actual results may differ from these estimates.
37
Table of Contents
We believe the following to be our critical accounting policies because they are important to the portrayal of our financial condition and results of operations and because they require critical management judgment and estimates about matters that are uncertain:
| • | manufacturing accruals; |
| • | clinical trial accruals; |
| • | goodwill impairment; |
| • | indefinite-lived intangible assets — in-process research and development (IPR&D); |
| • | share-based compensation; and |
| • | business combinations. |
Manufacturing Accruals
We make estimates of our manufacturing costs based on information available to us at the end of each reporting period. Our accrual process focuses on capturing the largest manufacturing expenses that are known at the time of our estimates. We look to ensure that all material manufacturing costs are captured in our accrual estimates for the reporting period and that we have established methods and processes to support those estimates. We believe our estimates and accruals of manufacturing related costs are reasonably accurate based on our knowledge at the time of the estimate.
Clinical Trial Accruals
We make estimates of our clinical trial costs based on information available to us at the end of each reporting period.
Our accrual process focuses on capturing the largest clinical trial expenses that are known at the time of our estimates. Specifically, we look to ensure that all material patient and physician costs are captured in our accrual estimate for the reporting period, and we have established methods and processes to support those estimates. We believe our estimates and accruals of clinical trial related costs are reasonably accurate based on our knowledge at the time of the estimate.
Goodwill Impairment
Goodwill is not amortized, but is reviewed annually for impairment on October 1 of each year, or more frequently when events or changes in circumstances indicate that the asset may be impaired. As of December 31, 2017, we had one reporting unit and there was an excess of fair value compared to the carrying value. There were no impairment charges recorded for any of the periods presented.
Indefinite-lived Intangible Assets — IPR&D
Intangible assets with indefinite lives represent the value assigned to IPR&D that, as of the acquisition date, we determined that technological feasibility had not been established, and the IPR&D had no alternative future use. The IPR&D will be subject to annual impairment testing until completion or abandonment of the projects. Upon completion of the project, we will make a separate determination of useful life of the IPR&D and the related amortization will be recorded as an expense over the estimated useful life. If the IPR&D is abandoned, the carrying value of the asset will be expensed. All research and development costs incurred subsequent to the acquisition of Alpine are expensed as incurred. We perform an annual impairment assessment on October 1 of each year for the IPR&D assets, or more frequently if indicators of potential impairment exist, to determine whether it is more likely than not that the carrying value of the assets may not be recoverable. Recoverability of IPR&D is measured by comparing the carrying amount of the asset to the fair value. If we determine that an individual asset is impaired, the amount of any impairment is measured as the difference between the carrying value and the fair value of the impaired asset.
On May 5, 2016, we entered into an agreement with STC.UNM to mutually terminate the license agreement relating to protocell technology. As a result of the termination and the Company’s intent to no longer develop, license or commercialize the protocell technology, the indefinite-lived intangible assets acquired in the 2014 acquisition of Alpine were considered impaired. Accordingly, $19.7 million was fully written-off and recorded as intangible asset impairment in our consolidated statements of operations for the year ended December 31, 2016. Additionally, as a result of the impairment, the deferred tax liability, which solely relates to the indefinite-lived intangible assets was reversed, resulting in a federal tax benefit of $6.9 million during the year ended December 31, 2016. See “Note 10 — Income Tax” of the audited financial statements included in this report for additional information. The impairment charge did not result in any significant cash expenditures or otherwise impact our liquidity or cash.
38
Table of Contents
No impairment charges were recorded in our consolidated statements of operations for the years ended December 31, 2017 and 2015. For the year ended December 31, 2016, a $19.7 million impairment charge was recorded in our consolidated statements of operations.
Share-based Compensation
We maintain the 2016 Equity Incentive Plan (the 2016 EIP), which was approved by our stockholders on June 23, 2016. As of that date, we ceased granting options under our Amended and Restated Share Option Plan (the Option Plan), ceased granting restricted shares units under our Amended and Restated RSU Plan (the RSU Plan) and transferred the remaining shares available for issuance under the Option Plan and the RSU Plan to the 2016 EIP. As of the effective date of the 2016 EIP, 1,200,905 shares of common stock were reserved for issuance under the 2016 EIP, consisting of 1,050,000 shares available for awards under the 2016 EIP plus 82,884 and 68,021 shares of common stock previously reserved but unissued under the Option Plan and the RSU Plan, respectively, that were available for issuance under the 2016 EIP on the effective date of the 2016 EIP. On June 8, 2017, the Company’s stockholders approved an amendment to the 2016 EIP to increase the total shares of common stock available for issuance under the 2016 EIP from 1,200,905 shares to 7,900,905 shares. As of December 31, 2017, an aggregate of 5,723,523 shares of common stock were available for future issuance under the 2016 EIP.
We maintain an Employee Stock Purchase Plan (ESPP) under which a total of 150,000 shares of common stock were reserved for sale to employees of the Company. As of December 31, 2017, there were 4,237 shares reserved for future purchases under the ESPP.
We have granted RSUs to non-employee directors under the RSU Plan and, as of the approval on June 23, 2016, we grant RSUs to our non-employee directors under the 2016 EIP. Approximately 25% of each RSU represents a contingent right to receive cash upon vesting, and we are required to deliver an amount in cash equal to the fair market value of approximately 25% of the vesting shares on the vesting date to facilitate the satisfaction of the non-employee directors’ U.S. federal income tax obligation with respect to the vested RSUs. The outstanding RSU awards are required to be re-measured at each reporting date until settlement of the award, and changes in valuation are recorded as compensation expense for the period. To the extent that the liability recorded in the balance sheet for a modified award is less than the original award value, the difference is recognized in equity.
We use the closing share price of our shares in The Nasdaq Global Market at the reporting or settlement date to determine the fair value of RSUs. We use the Black-Scholes option pricing model for determining the estimated fair value for stock option awards under our 2016 EIP and its predecessor and for employee stock purchase plan awards, which requires the use of highly subjective and complex assumptions to determine the fair value of stock-based awards, including the option’s expected term and the price volatility of the underlying stock. We recognize the value of the portion of the awards that is ultimately expected to vest as non-cash expense over the requisite vesting periods on a straight-line basis for the entire award in our consolidated statements of operations. Forfeitures are estimated at the time of grant and revised, if necessary, in subsequent periods if actual forfeitures differ from those estimates. We base our risk free interest rate for the expected term of the option on the yield available on a U.S. Treasury security with an equivalent expected term. The expected life of options in years represents the period of time stock-based awards are expected to be outstanding and is based on historical data. The expected volatility is based on the historical volatility of our common stock for a period equal to the stock option’s expected life. For more information, see “Note 7 — Share-based Compensation” of the audited financial statements included elsewhere in this Annual Report on Form 10-K.
Business Combination
In a business combination, we determine if the acquired property and activities meet the definition of a business under current accounting guidance. If the combination meets the definition of a business, we measure the significance of the combination to determine the required reporting and disclosure requirements for the transaction. Business combinations are required to be accounted for under the acquisition method which requires that identifiable assets acquired, liabilities assumed and any noncontrolling interest in the acquiree be recognized and measured as of the acquisition date at fair value. In addition, all consideration transferred must be measured at its acquisition-date fair value.
When necessary, we use a third-party valuation expert to determine the fair value of the identifiable assets and liabilities acquired. The estimated fair values of in-process research and development (IPR&D) acquired in a business combination which have not been fully developed are capitalized as indefinite-lived intangible assets and impairment testing is conducted periodically.
39
Table of Contents
Results of Operations for the years ended December 31, 2017, 2016 and 2015
The following table sets forth selected consolidated statements of operations data for each of the periods indicated.
Overview
| Years Ended December 31, | ||||||||||||
| 2017 | 2016 | 2015 | ||||||||||
| (In millions) | ||||||||||||
| Operating expenses |
$ | (58.1 | ) | $ | (64.8 | ) | $ | (32.8 | ) | |||
| Income tax benefit |
$ | — | $ | (6.9 | ) | $ | — | |||||
| Deemed dividend on convertible preferred stock |
$ | (1.0 | ) | $ | (2.6 | ) | $ | — | ||||
| Net loss attributable to common stockholders |
$ | (57.9 | ) | $ | (60.3 | ) | $ | (32.6 | ) | |||
Operating expenses incurred in the year ended December 31, 2017 decreased by $6.7 million, or 10.3%, compared to the year ended December 31, 2016. The decrease in our operating expenses was primarily due to the intangible asset impairment charge of $19.7 million during the year ended December 31, 2016. In addition, general and administrative expenses decreased by $3.7 million primarily due to a decrease in salary and benefit expense due to management changes in the first quarter of 2016 and a decrease in professional fees related to legal and regulatory compliance activities. The decrease was offset by an increase in research and development expenses of $16.5 million primarily due to greater activity related to the development of our product candidates.
We also recognized a $6.9 million tax benefit during the year ended December 31, 2016, upon the reversal of our deferred tax liability, which was solely related to the indefinite-lived intangible assets.
Net loss attributable to common stockholders for the year ended December 31, 2017 decreased by $2.4 million. The decrease in our net loss attributable to common stockholders was primarily due to decreases in operating expenses of $6.8 million, lower non-cash deemed dividend of $1.6 million related to the beneficial conversion feature on convertible preferred stock, and higher investment and other income of $0.9 million, offset by a non-cash tax benefit of $6.9 million related to the $19.7 million impairment of our indefinite-lived intangible assets as a result of the termination of the license agreement with STC.UNM during the year ended December 31, 2016
Net loss attributable to common stockholders for the year ended December 31, 2016 increased by $27.7 million. The increase in our net loss attributable to common stockholders was primarily due to increases in operating expenses of $32.0 million and a deemed dividend of $2.6 million related to the beneficial conversion feature on the Series D convertible preferred stock, partially offset by a $6.9 million tax benefit related to the $19.7 million impairment of our indefinite-lived intangible assets as a result of the termination of the license agreement with STC.UNM during the year ended December 31, 2016.
Based on our development plans for our product candidates, we will continue to incur operating losses for the foreseeable future.
Research and Development
The following table summarizes research and development expenses:
| Years Ended December 31, | ||||||||||||
| 2017 | 2016 | 2015 | ||||||||||
| (In millions) | ||||||||||||
| Research and development |
$ | 44.0 | $ | 27.5 | $ | 23.5 | ||||||
Research and development expenses are related primarily to the development of our preclinical and clinical stage programs. We do not currently utilize a formal time allocation system to capture expenses on a project-by-project basis because we are organized and record expense by functional area.
40
Table of Contents
The following table summarizes our research and development expenses by functional area for the years ended December 31, 2017, 2016 and 2015:
| Years Ended December 31, | ||||||||||||
| 2017 | 2016 | 2015 | ||||||||||
| (In millions) | ||||||||||||
| External expenses1 |
||||||||||||
| Preclinical research expenses |
$ | 4.0 | $ | 2.1 | $ | 2.1 | ||||||
| Clinical development expenses |
15.8 | 8.1 | 6.7 | |||||||||
| Manufacturing expenses |
8.9 | 4.8 | 1.0 | |||||||||
| License Fees / Milestones |
0.1 | (0.9 | ) | 1.4 | ||||||||
|
|
|
|
|
|
|
|||||||
| Total external expenses |
28.8 | 14.1 | 11.2 | |||||||||
| All other expenses2 |
15.2 | 13.4 | 12.3 | |||||||||
|
|
|
|
|
|
|
|||||||
| Total research and development |
$ | 44.0 | $ | 27.5 | $ | 23.5 | ||||||
|
|
|
|
|
|
|
|||||||
| 1 | External expenses include costs paid to outside parties for activities associated with our preclinical, clinical and manufacturing efforts as well as costs associated with licensing agreements we have entered into with third parties. |
| 2 | All other expenses include personnel costs, stock compensation expenses, facility and equipment costs and other internal costs associated with our research and development activities. |
Research and development expenses incurred in the year ended December 31, 2017 increased by $16.5 million, or 60.0%, compared to the year ended December 31, 2016, due primarily to increases in clinical development expenses of $7.7 million and contract manufacturing expenses of $4.1 million related to contract clinical services associated with the ongoing tucatinib clinical trials, increases in other expense of $1.8 million mostly due to increases in headcount and headcount-related expenses, increases in preclinical research expenses of $1.9 million for laboratory services and license fees of $1.0 million primarily related to the reversal of the previously recorded time-based milestones for license fees in connection with our termination of the STC.UNM license agreement during year ended December 31, 2016.
Research and development expenses incurred in the year ended December 31, 2016 increased by $4.0 million, or 17.0%, compared to the year ended December 31, 2015, due primarily to increases in contract manufacturing expenses of $3.8 million and clinical development expenses of $1.4 million related to contract clinical services associated with the ongoing clinical trials and increase in other expense of $1.1 million primarily due to increases in Retention Payment Plan expenses and increases in headcount and headcount-related expenses. The increases were partially offset by decreases in license fees of $2.3 million primarily related to reversal of the previously recorded time-based milestones for license fees in connection with our termination of the STC.UNM license agreement.
General and Administrative
| Years Ended December 31, | ||||||||||||
| 2017 | 2016 | 2015 | ||||||||||
| (In millions) | ||||||||||||
| General and administrative |
$ | 14.0 | $ | 17.6 | $ | 9.3 | ||||||
General and administrative expenses for the year ended December 31, 2017 decreased by $3.6 million, or 20.5%, compared to the year ended December 31, 2016, primarily due to decreases in salary and benefit expense related to cash severance and insurance benefits of $1.6 million, non-cash compensation expense of $2.3 million due to the acceleration of share-based compensation as a result of management changes in January 2016 and lower Retention Plan expenses of $0.7 million, offset by higher headcount and headcount-related expenses of $1.1 million. In addition, the decrease in general and administrative expenses was due to lower professional fees of $0.5 million for legal and regulatory compliance activities, offset by a $0.2 million increase in facility related expenses primarily attributable to accelerated depreciation on leasehold improvements due to a change in the termination date of the May 2008 lease and a $0.2 million increase in director compensation that was primarily related to a change in fair value of RSUs on re-measurement together with the grant and conversion of the RSUs. The change in fair value of RSUs was attributable to the change in the price of our common stock.
General and administrative expenses for the year ended December 31, 2016 increased by $8.3 million, or 89.2%, compared to the year ended December 31, 2015, primarily due to increases in salaries and benefits expense related to cash severance and insurance benefits of $1.6 million, non-cash compensation expense of $2.3 million due to the acceleration of share-based compensation related to the retirement and separation agreement that we entered into with
41
Table of Contents
our former chief executive officer in January 2016, Retention Payment Plan expenses of $0.7 million and headcount and headcount related expenses of $1.6 million. In addition, general and administrative expenses increased due to higher professional fees of $1.7 million primarily related to legal, patent and regulatory compliance activities, higher recruiting and relocation of $0.4 million and higher share-based compensation expense of $0.4 million. These increases were partially offset by a $0.4 million decrease in director compensation that was primarily related to a change in fair value of RSUs on re-measurement together with the grant and conversion of the RSUs. The change in fair value of RSUs was attributable to the change in the price of our common stock.
Intangible Asset Impairment
| Years Ended December 31, | ||||||||||||
| 2017 | 2016 | 2015 | ||||||||||
| (In millions) | ||||||||||||
| Intangible asset impairment |
$ | — | $ | (19.7 | ) | $ | — | |||||
During the years ended December 31, 2017 and 2015, no intangible asset impairment charges were recorded in our consolidated statements of operations.
On May 5, 2016, we entered into an agreement with STC.UNM to mutually terminate the license agreement relating to protocell technology. As a result of the termination and our intent to no longer develop, license or commercialize the protocell technology, the indefinite-lived intangible assets, valued at $19.7 million were considered fully impaired. $19.7 million was fully written-off and recorded as intangible asset impairment in our consolidated statements of operations during the year ended December 31, 2016. The indefinite-lived intangible assets represent the value assigned to in-process research and development when we acquired the protocell technology in connection with the acquisition of Alpine in 2014. For additional information, see “Note 5 — Intangible Asset Impairment” of the audited financial statements included in this report.
Investment and other income, net
| Years Ended December 31, | ||||||||||||
| 2017 | 2016 | 2015 | ||||||||||
| (In millions) | ||||||||||||
| Investment and other income, net |
$ | 1.1 | $ | 0.2 | $ | 0.1 | ||||||
Net investment and other income increased by $0.9 million for the year ended December 31, 2017 compared to the year ended December 31, 2016, primarily due to higher interest income of $0.8 million.
Net investment and other income for the years ended December 31, 2016 and 2015 were immaterial.
Income Tax Benefit
| Years Ended December 31, | ||||||||||||
| 2017 | 2016 | 2015 | ||||||||||
| (In millions) | ||||||||||||
| Income tax benefit |
$ | — | $ | (6.9 | ) | $ | — | |||||
During the years ended December 31, 2017 and 2015, no income tax benefit or provision were recorded in our consolidated statements of operations.
Due to the $19.7 million impairment of indefinite-lived intangible assets, we reversed our deferred tax liability, which solely relates to the indefinite-lived intangible assets, and recorded a $6.9 million tax benefit in our consolidated statements of operations for the year ended December 31, 2016. For additional information, see “Note 5 — Intangible Asset Impairment” of the audited financial statements included in this report.
42
Table of Contents
Deemed Dividend on Convertible Preferred Stock
| Years Ended December 31, | ||||||||||||
| 2017 | 2016 | 2015 | ||||||||||
| (In millions) | ||||||||||||
| Deemed dividend on convertible preferred stock |
$ | (1.0 | ) | $ |
(2.6 |
) |
$ | — | ||||
During the year ended December 31, 2017, we recognized a beneficial conversion feature in the amount of $1.0 million, calculated as the number of potential conversion shares multiplied by the excess of the market price of its common stock over the price per conversion share of the Series E convertible preferred stock on the commitment date. The non-cash dividend was recorded in additional paid-in capital and as a deemed dividend on the Series E convertible preferred stock, and was used in determining the net loss applicable to common stockholders in the condensed consolidated statement of operations.
During the year ended December 31, 2016, we recognized a beneficial conversion feature in the amount of $2.6 million, calculated as the number of potential conversion shares multiplied by the excess of the market price of its common stock over the price per conversion share of the Series D convertible preferred stock on the commitment date. The non-cash dividend was recorded in additional paid-in capital and as a deemed dividend on the Series D convertible preferred stock, and was used in determining the net loss applicable to common stockholders in the consolidated statement of operations.
During the year ended December 31, 2015, no deemed dividends related to convertible preferred stock were recorded in our consolidated statements of operations.
Liquidity and Capital Resources
Cash, Cash Equivalents, Short-Term Investments, Long-Term Investments and Working Capital
As of December 31, 2017, our principal sources of liquidity consisted of cash and cash equivalents of $16.8 million, short-term investments of $76.5 million and long-term investment of $7.7 million. Our cash and cash equivalents consist of cash, money market funds and securities with an initial maturity of less than 90 days. Our short-term investments are invested in debt securities of U.S government agencies and corporate bonds with maturities not exceeding 12 months from December 31, 2017. Our long-term investments, if any, are invested in debt securities of U.S government agencies with maturities exceeding 12 months from December 31, 2017. Our primary source of cash, cash equivalents and investments has historically been proceeds from the sale of our equity securities, cash received through our strategic partners, government grants, debt financings and equipment financings. These proceeds have been used to fund our operations.
Our cash and cash equivalents were $16.8 million as of December 31, 2017 compared to $13.7 million as of December 31, 2016, an increase of $3.1 million, or 22.6%. The increase was the result of net proceeds of $88.0 million from our January 2017 financing and $0.3 million of proceeds from the settlement of a short-swing profit claim, offset by cash used to fund our operations of $50.0 million and net investment purchases of $35.2 million.
As of December 31, 2017, our working capital (defined as current assets less current liabilities) was $83.1 million compared to $55.7 million as of December 31, 2016, an increase of $27.4 million, or 49.2%. The increase in working capital was primarily attributable to an increase in short-term investments of $27.4 million and an increase in cash and cash equivalents of $3.1 million, offset by an increase in current liability of $3.0 million.
On January 27, 2017, we closed an underwritten offering of 26,659,300 shares of our common stock at a price to the public of $3.30 per share, for gross proceeds of approximately $88.0 million. The shares included 3,477,300 shares of common stock sold pursuant to the over-allotment option granted by us to the underwriters, which option was exercised in full. In addition, we closed a concurrent underwritten offering of 1,818 shares of our Series E convertible preferred stock at a price to the public of $3,300 per share, for gross proceeds of approximately $6.0 million. Each share of Series E convertible preferred stock is non-voting and convertible into 1,000 shares of our common stock, provided that conversion will be prohibited if, as a result, the holder and its affiliates would beneficially own more than 19.99% of the common stock then outstanding. Aggregate gross proceeds from the offerings were approximately $94.0 million. Aggregate net proceeds from the offerings, after underwriting discounts and commissions and other expenses of $6.0 million, were approximately $88.0 million.
On June 28, 2016, we closed an underwritten public offering of 6,708,333 shares of our common stock at a price to the public of $4.80 per share for gross proceeds of $32.2 million. The shares included 875,000 shares of common stock sold pursuant to the over-allotment option granted by us to the underwriters, which option was exercised in full. In addition, we
43
Table of Contents
closed a registered direct offering of 17,250 shares of our Series D convertible preferred stock at a price of $800.00 per share directly to affiliates of BVF for gross proceeds of $13.8 million. Each share of Series D convertible preferred stock is non-voting and convertible into 166.67 shares of our common stock, provided that conversion will be prohibited if, as a result, the holder and its affiliates would beneficially own more than 19.99% of the common stock then outstanding. Aggregate gross proceeds from the offerings were approximately $46.0 million. Aggregate net proceeds from the offerings, after underwriting discounts and commissions and other expenses of $2.7 million, were approximately $43.3 million.
We believe that our currently available cash and cash equivalents and investments as of December 31, 2017 will be sufficient to finance our operations for at least the next 12 months. Nevertheless, we expect that we will require additional capital from time to time in the future in order to continue the development of products in our pipeline and to expand our product portfolio. We would expect to seek additional financing from business development activities and the sale and issuance of equity or debt securities.
Cash Flows from Operating Activities
Cash used in operating activities is primarily driven by our net loss. However, operating cash flows differ from net loss as a result of non-cash charges or differences in the timing of cash flows and historically from changes in warrant liabilities.
Cash used by operating activities totaled $50.0 million for the years ended December 31, 2017, compared to $36.7 million for the years ended December 31, 2016. The increase was attributable primarily to an increase in research and development expenses associated with our ongoing tucatinib clinical trials.
Cash used by operating activities totaled $36.7 million for the year ended December 31, 2016, compared to $28.8 million for the year ended December 31, 2015. The increase was attributable primarily to an increase in general and administrative expenses and research and development expenses.
Cash Flows from Investing Activities
Cash used in investing activities was $35.3 million for the years ended December 31, 2017, compared to $21.0 million for the years ended December 31, 2016. This change was attributable primarily to higher purchases of investments, net of redemption, of $35.2 million for the years ended December 31, 2017 as compared to $20.8 million for the years ended December 31, 2016.
Cash used in investing activities was $21.0 million for the year ended December 31, 2016, compared to $23.7 million cash provided by investing activities for the year ended December 31, 2015. This change was attributable primarily to purchases of investments, net of redemption, of $20.8 million for the year ended December 31, 2016 as compared to redemption of investments, net of purchases, of $24.5 million for the year ended December 31, 2015, offset by a decrease in purchases of property and equipment of $0.6 million during the year ended December 31, 2016 compared to the same period in 2015.
Cash Flows from Financing Activities
Cash provided by financing activities was $88.4 million during the year ended December 31, 2017, which consisted primarily of $88.0 million of net proceeds from our January 2017 concurrent underwritten common stock and Series E convertible preferred stock offerings, $0.3 million of proceeds from the settlement of a short-swing profit claim in November 2017 and cash received of $0.2 million from ESPP purchases. Net proceeds from our common stock offering were $82.4 million and net proceeds from our Series E convertible preferred stock offering were approximately $5.6 million.
Cash provided by financing activities was $43.6 million during the year ended December 31, 2016, which consisted primarily of $43.3 million of net proceeds from our June 2016 underwritten common stock and registered direct Series D convertible preferred stock offerings, $0.2 million of proceeds from the settlement of a short-swing profit claim in August 2016 and cash received of $0.1 million from ESPP purchases. Net proceeds from our common stock offering were $29.8 million and net proceeds from our Series D convertible preferred stock offering were approximately $13.5 million.
Cash provided by financing activities was $22.5 million during the year ended December 31, 2015, which primarily consisted of net proceeds of approximately $22.4 million from our February 2015 concurrent but separate underwritten common stock and Series B convertible preferred stock offerings. Net proceeds from our common stock offering were $20.5 million and net proceeds from our Series B convertible preferred stock offering were $1.9 million.
44
Table of Contents
Contractual Obligations and Contingencies
In our continuing operations, we have entered into long-term contractual arrangements from time to time for our facilities, the provision of goods and services, and the acquisition of technology access rights, among others. The following table presents contractual obligations arising from these arrangements as of December 31, 2017:
| Payments Due by Period | ||||||||||||||||||||
| Total | Less than 1 Year |
1 — 3 Years |
3 — 5 Years |
After 5 Years |
||||||||||||||||
| (In thousands) | ||||||||||||||||||||
| Operating leases |
$ | 5,580 | $ | 849 | $ | 2,778 | $ | 1,953 | $ | — | ||||||||||
|
|
|
|
|
|
|
|
|
|
|
|||||||||||
On December 4, 2017, we entered into a New Lease for a new office location in Seattle, Washington totaling approximately 44,050 rentable square feet. The New Lease commenced on January 1, 2018 and expires on April 30, 2022. The lease provides for a monthly base rent of $110,125 in 2018, increasing to $124,808 in 2022.
In May 2008, we entered into a lease for a facility in Seattle, Washington totaling approximately 17,000 square feet, which was amended in November 2016to add approximately 2,600 square feet. The lease provided for a monthly base rent of $47,715, increasing to $57,910 in 2018. In connection with the execution of the New Lease, on December 4, 2017, we entered into a lease termination agreement for the early termination of the lease dated May 9, 2008 without an early termination fee. In January 2018, we terminated the lease.
We also have entered into operating lease obligations through November 2019 for certain office equipment.
In addition to the obligations described above, under certain licensing arrangements for technologies incorporated into our product candidates, we are contractually committed to payments for licensing fees and royalties, as well as contingent payments if certain milestones (as defined in the agreements) have been achieved. The achievement of milestones is subject to numerous factors, and we cannot predict when or if such milestones will be achieved. For additional detail concerning the financial terms of our licensing arrangements, please refer to “Note 8 - Collaborative and License Agreements” of the audited financial statements included elsewhere in this Annual Report on Form 10-K.
As of December 31, 2017, no significant milestones, as defined in the agreements, were achieved and, as such, we are not currently contractually committed to any significant quantifiable payments for licensing fees, royalties or other contingent payments.
We also enter into contracts in the ordinary course of our business such as clinical research organization service contracts and manufacturing service contracts. These contracts are fee for service contracts that are terminable at will by us, and do not provide for fixed payments to be made at specific intervals. Payments for these contracts are expensed in the period that the service is incurred.
Guarantees and Indemnification
In the ordinary course of our business, we have entered into agreements with our collaboration partners, vendors, and other persons and entities that include guarantees or indemnity provisions. For example, our agreements with clinical trial sites and third-party manufacturers contain certain customary indemnification provisions, and we have entered into indemnification agreements with our officers and directors. Based on information known to us as of the filing date of this report we believe that our exposure related to these guarantees and indemnification obligations is not material.
Off-Balance Sheet Arrangements
During the periods presented, we did not have any relationships with unconsolidated entities or financial partnerships, such as entities often referred to as structured finance or special purpose entities, which would have been established for the purpose of facilitating off-balance sheet arrangements or for another contractually narrow or limited purpose.
Recent Accounting Pronouncements
In January 2017, the Financial Accounting Standards Board (FASB) issued Accounting Standards Update (ASU) 2017-04, Intangibles – Goodwill and Other (Topic 350): Simplifying the Test for Goodwill Impairment. This standard simplifies the subsequent measurement of goodwill by eliminating Step 2 from the goodwill impairment test which previously required measurement of any goodwill impairment loss by comparing the implied fair value of a reporting unit’s goodwill with the carrying amount of that goodwill. Instead, under this update, the impairment charge will be measured based on the excess of a reporting unit’s carrying value over its fair value. The standard will be applied prospectively and is
45
Table of Contents
effective for a public business entity that is an SEC filer for its annual and interim impairment tests performed in periods beginning after December 15, 2019. Early adoption is permitted for annual and interim goodwill impairment testing dates after January 1, 2017. We are currently evaluating any impact this standard may have on our consolidated financial position and results of operations.
In August 2016, the FASB issued ASU 2016-15, Statement of Cash Flows (Topic 230), a consensus of the FASB’s Emerging Issues Task Force. The guidance is intended to reduce diversity in practice in how certain transactions are classified in the statement of cash flows. The guidance addresses the classification of cash flows related to (1) debt prepayment or extinguishment costs, (2) settlement of zero-coupon debt instruments, (3) contingent consideration payments made after a business combination, (4) proceeds from the settlement of insurance claims, (5) proceeds from the settlement of corporate-owned life insurance, including bank-owned life insurance, (6) distributions received from equity method investees and (7) beneficial interests in securitization transactions. The guidance requires application using a retrospective transition method and is effective for public business entities for fiscal years beginning after December 15, 2017, and interim periods within those years. Early adoption is permitted. We adopted this standard on January 1, 2018. The adoption of this standard did not have a material impact on our consolidated statements of cash flows.
In March 2016, the FASB issued ASU 2016-09, Improvements to Employee Share-Based Payment Accounting, which amends ASC Topic 718, Compensation – Stock Compensation. The guidance changes how companies account for certain aspects of share-based payments to employees including income tax consequences, classification of awards as either equity or liabilities, and classification on the statement of cash flows. The guidance is effective for public business entities for fiscal years beginning after December 15, 2016, and interim periods within those years. We adopted this standard as of January 1, 2017. Because we have incurred net losses since our inception and maintain a full valuation allowance on our net deferred tax assets, the adoption of this standard does not have a material impact on our financial condition, results of operations and cash flows, or financial statement disclosures.
In February 2016, the FASB issued ASU 2016-02, Leases (Topic 842), to improve financial reporting for leasing transactions. The new standard requires lessees to recognize on the balance sheets a right of use asset and related lease liability. Lessor accounting under the new standard remains similar under current GAAP. The ASU also requires disclosures about the amount, timing, and uncertainty of cash flows arising from leases. The effective date for public entities is fiscal years beginning after December 15, 2018, including interim periods within those fiscal years. Early adoption is permitted for all entities. We are currently evaluating any impact this standard may have on our consolidated financial position and results of operations.
In January 2016, the FASB issued ASU 2016-01, Financial Instruments – Overall (Subtopic 825-10): Recognition and Measurement of Financial Assets and Financial Liabilities. The guidance will change how entities measure equity investments that do not result in consolidation and are not accounted for under the equity method and how they present changes in the fair value of financial liabilities measured under the fair value option that are attributable to their own credit. The new guidance also changes certain disclosure requirements and other aspects of current US GAAP. It does not change the guidance for classifying and measuring investments in debt securities and loans. ASU 2016-01 is effective for public business entities for fiscal years beginning after December 15, 2017, including interim periods within those fiscal years. With the exception of early application guidance outlined in this standard, early adoption is not permitted. We adopted this standard on January 1, 2018. The adoption of this standard did not have a material impact on our financial condition, results of operations and cash flows, or financial statement disclosures.
In August 2015, FASB issued ASU 2015-14, Revenue from Contracts with Customers (Topic 606)—Deferral of the Effective Date, which defers by one year the effective date of ASU 2014-09, Revenue from Contracts with Customers. For public entities, the standard is effective for annual reporting periods beginning after December 15, 2017, including interim reporting periods within that reporting period. Early adoption is permitted as of annual reporting periods beginning after December 15, 2016, including interim reporting periods within those annual periods. We adopted this standard on January 1, 2018. As we do not currently have any revenue arrangements in the scope of the new revenue standard, this standard did not have an effect on our financial position or results of operations upon adoption.
| ITEM 7A. | Quantitative and Qualitative Disclosure About Market Risk |
Interest Rate Sensitivity
We had cash, cash equivalents, short-term investments and long-term investments totaling $101.0 million and $62.8 million as of December 31, 2017 and 2016, respectively. We do not enter into investments for trading or speculative purposes. We believe that we do not have any material exposure to changes in the fair value of these assets as a result of changes in interest rates since a majority of these assets are of a short-term nature. Declines in interest rates, however, would reduce future investment income. A 10 basis point decline in interest rates, occurring January 1, 2017 and sustained throughout the period ended December 31, 2017, would have resulted in a decline in investment income of approximately $81,900 for that same period.
46
Table of Contents
| ITEM 8. | Financial Statements and Supplementary Data |
See Financial Statements beginning on page F-1.
| ITEM 9. | Changes in and Disagreements with Accountants on Accounting and Financial Disclosure |
None.
| ITEM 9A. | Controls and Procedures |
Evaluation of Disclosure Controls and Procedures
Under the supervision and with the participation of our management, including our interim chief executive officer and chief financial officer, we conducted an evaluation of the effectiveness, as of the end of the period covered by this report, of our disclosure controls and procedures, as defined in Rules 13a-15(e) and 15d-15(e) under the Securities Exchange Act of 1934, as amended, or the Exchange Act. The purpose of this evaluation was to determine whether as of the evaluation date our disclosure controls and procedures were effective to provide reasonable assurance that the information we are required to disclose in our filings with the SEC, under the Exchange Act (1) is recorded, processed, summarized and reported within the time periods specified in the SEC’s rules and forms and (2) accumulated and communicated to our management, including our interim chief executive officer and chief financial officer, as appropriate to allow timely decisions regarding required disclosure. Based on this evaluation, our interim chief executive officer and chief financial officer have concluded that, as of December 31, 2017, our disclosure controls and procedures were effective.
Management’s Report on Internal Control over Financial Reporting
Our management is responsible for establishing and maintaining adequate internal control over financial reporting as defined in Rules 13a-15(f) and 15d-15(f) of the Exchange Act. We have designed our internal controls to provide reasonable assurance that our financial statements are prepared in accordance with generally accepted accounting principles in the United States (U.S. GAAP), and include those policies and procedures that:
| • | pertain to the maintenance of records that in reasonable detail accurately and fairly reflect the transactions and disposition of our assets; |
| • | provide reasonable assurance that transactions are recorded as necessary to permit preparation of financial statements in accordance with generally accepted accounting principles, and that receipts and expenditures are being made only in accordance with authorization of our management and directors; and |
| • | provide reasonable assurance regarding prevention or timely detection of unauthorized acquisition, use or disposition of our assets that could have a material effect on the financial statements. |
Our management conducted an evaluation of the effectiveness of our internal controls based on the COSO criteria (2013 framework) as of December 31, 2017.
Based on our evaluation, our management concluded that our internal control over financial reporting was effective as of December 31, 2017. The effectiveness of our internal control over financial reporting as of December 31, 2017 has been audited by Ernst & Young LLP, an independent registered public accounting firm, as stated in their report thereto, appearing below.
Inherent Limitation on the Effectiveness of Internal Controls
The effectiveness of any system of internal control over financial reporting, including ours, is subject to inherent limitations, including the exercise of judgment in designing, implementing, operating, and evaluating the controls and procedures, and the inability to eliminate misconduct completely. Accordingly, any system of internal control over financial reporting, including ours, no matter how well designed and operated, can only provide reasonable, not absolute assurances. In addition, projections of any evaluation of effectiveness to future periods are subject to the risk that controls may become inadequate because of changes in conditions, or that the degree of compliance with the policies or procedures may deteriorate. We intend to continue to monitor and upgrade our internal controls as necessary or appropriate for our business, but cannot assure you that such improvements will be sufficient to provide us with effective internal control over financial reporting.
47
Table of Contents
Changes in Internal Control over Financial Reporting
There have been no changes in our internal control over financial reporting during the quarter ended December 31, 2017 that have materially affected, or are reasonably likely to materially affect, our internal control over financial reporting.
Report of Independent Registered Public Accounting Firm
To the Stockholders and the Board of Directors of Cascadian Therapeutics, Inc.
Opinion on Internal Control over Financial Reporting
We have audited Cascadian Therapeutics, Inc.’s internal control over financial reporting as of December 31, 2017, based on criteria established in Internal Control — Integrated Framework issued by the Committee of Sponsoring Organizations of the Treadway Commission 2013 framework (the COSO criteria). In our opinion, Cascadian Therapeutics, Inc. (the Company) maintained, in all material respects, effective internal control over financial reporting as of December 31, 2017, based on the COSO criteria.
We also have audited, in accordance with the standards of the Public Company Accounting Oversight Board (United States) (PCAOB), the 2017 consolidated financial statements of the Company and our report dated March 8, 2018 expressed an unqualified opinion thereon.
Basis of Opinion
The Company’s management is responsible for maintaining effective internal control over financial reporting and for its assessment of the effectiveness of internal control over financial reporting included in the accompanying Management’s Report on Internal Control over Financial Reporting. Our responsibility is to express an opinion on the Company’s internal control over financial reporting based on our audit. We are a public accounting firm registered with the PCAOB and are required to be independent with respect to the Company in accordance with the U.S. federal securities laws and the applicable rules and regulations of the Securities and Exchange Commission and the PCAOB.
We conducted our audit in accordance with the standards of the PCAOB. Those standards require that we plan and perform the audit to obtain reasonable assurance about whether effective internal control over financial reporting was maintained in all material respects.
Our audit included obtaining an understanding of internal control over financial reporting, assessing the risk that a material weakness exists, testing and evaluating the design and operating effectiveness of internal control based on the assessed risk, and performing such other procedures as we considered necessary in the circumstances. We believe that our audit provides a reasonable basis for our opinion.
Definition and Limitations of Internal Control Over Financial Reporting
A company’s internal control over financial reporting is a process designed to provide reasonable assurance regarding the reliability of financial reporting and the preparation of financial statements for external purposes in accordance with generally accepted accounting principles. A company’s internal control over financial reporting includes those policies and procedures that (1) pertain to the maintenance of records that, in reasonable detail, accurately and fairly reflect the transactions and dispositions of the assets of the company; (2) provide reasonable assurance that transactions are recorded as necessary to permit preparation of financial statements in accordance with generally accepted accounting principles, and that receipts and expenditures of the company are being made only in accordance with authorizations of management and directors of the company; and (3) provide reasonable assurance regarding prevention or timely detection of unauthorized acquisition, use, or disposition of the company’s assets that could have a material effect on the financial statements.
Because of its inherent limitations, internal control over financial reporting may not prevent or detect misstatements. Also, projections of any evaluation of effectiveness to future periods are subject to the risk that controls may become inadequate because of changes in conditions, or that the degree of compliance with the policies or procedures may deteriorate.
/s/ Ernst & Young LLP
Seattle, Washington
March 8, 2018
| ITEM 9B. | Other Information |
None.
48
Table of Contents
| ITEM 10. | Directors, Executive Officers and Corporate Governance |
Executive Officers
The names, ages and positions of each of our executive officers as of March 8, 2018 are set forth below.
| Name |
Age |
Office | ||
| Executive Officers |
||||
| SCOTT D. MYERS |
51 | President, Chief Executive Officer and Director | ||
| JULIA M. EASTLAND |
53 | Chief Financial Officer, Chief Business Officer and Secretary | ||
| GARY W. CHRISTIANSON |
63 | Chief Operating Officer | ||
| SCOTT PETERSON, Ph.D. |
56 | Chief Scientific Officer | ||
| LUKE N. WALKER, M.D. |
46 | Senior Vice President, Clinical Development |
Scott D. Myers. See “Directors, Executive Officers and Corporate Governance — Directors” included elsewhere in this Annual Report on Form 10-K for Mr. Myers’s biographical information.
Julia M. Eastland has served as our chief financial officer since August 2010, as our chief business officer since January 2017, and as our secretary since October 2010. From February 2006 to 2010, Ms. Eastland served as chief financial officer and vice president of Finance and Operations of VLST Corporation, a privately held biotechnology company. From 2000 to 2005, Ms. Eastland held various finance positions at Dendreon Corporation, a publicly-traded biotechnology company, most recently as the vice president of strategic planning. Prior to Dendreon, Ms. Eastland worked for Amgen, Inc. as area finance manager and assistant controller for its Colorado operations. Ms. Eastland has also worked as director of finance and planning for Encore Media Group, international finance and business manager and senior financial analyst for SCIENCE Magazine and financial manager for the Discovery Channel. Ms. Eastland received an M.B.A. from Edinburgh University Management School and a B.S. in finance from Colorado State University.
Gary Christianson has served as our chief operating officer since July 2007. From 2005 to 2007, Mr. Christianson was site director for the Biologics Unit of GlaxoSmithKline plc, a global healthcare company. From 1999 to 2003, Mr. Christianson was vice president, technical operations at Corixa Corp., a biopharmaceutical and biotechnology company, and from 2003 to 2005, he was general manager of the Hamilton, Montana site in addition to his duties as vice president. From 1987 to 1999, Mr. Christianson held various positions at RIBI ImmunoChem Research, Inc., a biopharmaceuticals company. Mr. Christianson received a B.S. in mechanical engineering technology from Montana State University.
Scott Peterson, Ph.D. has served as our chief scientific officer since June 2012. From June 2009 until June 2012, Dr. Peterson served as our vice president, research and development. From 2007 until 2009 Dr. Peterson served as director and department head, oncology research at Zymogenetics, Inc., a biopharmaceutical company. From 1999 to 2007, Dr. Peterson held a variety of positions at ICOS Corporation, a biopharmaceutical company. Dr. Peterson received his Ph.D. in chemistry (biochemistry) from the University of Colorado, Boulder and holds a B.S. in biology from Washington State University.
Luke N. Walker, M.D., has served as our senior vice president, clinical development, since January 2017 and held positions of vice president, clinical development, senior director, clinical research, and director, clinical research since joining us in September 2011. Prior to that, Dr. Walker served as a medical oncologist and hematologist at Providence Regional Medical Center, Everett from 2007 to 2011 and at The Everett Clinic, Center for Cancer Care from 2005 to 2007. Dr. Walker completed fellowships in bone marrow and stem cell transplantation and hematology and medical oncology at Oregon Health Sciences University and received an M.D. from University of Oklahoma Health Sciences Center. He received a B.A. in letters and French from the University of Oklahoma.
49
Table of Contents
Directors
The name, age, position(s), term, board committee membership and biographical information for each member of our board of directors is set forth below as of March 8, 2017:
Directors Continuing in Office until the 2018 Annual Meeting of Stockholders
Christopher Henney, Ph.D., age 77, has served as the chairman of our board of directors since September 2006 and as a member of our board of directors since March 2005. Dr. Henney is chair of our corporate governance and nominating committee and a member of our compensation committee. Dr. Henney also served as our Interim President and Chief Executive Officer from January 2016 to April 2016. From 1995 to 2003, Dr. Henney was chairman and chief executive officer of Dendreon Corporation, a publicly-traded biotechnology company that he co-founded and from 2003 to 2005 continued as executive chairman. Dr. Henney was also a co-founder of Immunex Corporation and ICOS Corporation, both publicly-traded biotechnology companies. Our corporate governance and nominating committee believes that Dr. Henney’s qualifications for membership on the board of directors include his roles as co-founder of Dendreon, Immunex and ICOS, as well as his membership on the boards of directors of several development-stage biotechnology companies. Through his experience in working with biotechnology companies from founding until commercialization of their product candidates, Dr. Henney provides our board of directors with significant insights into the strategic, operational and clinical development aspects of the company. Dr. Henney currently serves as vice-chairman of the board of directors of Cyclacel Pharmaceuticals, Inc., a development-stage biopharmaceuticals company, as a member of the board of directors of Anthera Pharmaceuticals, Inc., a biopharmaceutical company and as a member of the board of directors of Prothena Corporation plc, a biotechnology company. Dr. Henney received a Ph.D. in experimental pathology from the University of Birmingham, England, where he also obtained his D.Sc. for contributions in the field of immunology. In 2011, he received the honorary degree of Doctor of the University from his alma mater for contributions to the biotechnology industry and in 2012 was elected to the Hall of Fame of the Association of International Biotechnology CEOs. Dr. Henney is a former professor of immunology and microbiology and has held faculty positions at Johns Hopkins University, the University of Washington and the Fred Hutchinson Cancer Research Center.
Steven P. James, age 59, has been a member of our board of directors since February 2015. Mr. James is a member of our audit and compensation committees. Mr. James served as President and Chief Executive Officer of Labrys Biologics, Inc., from December 2012 until its acquisition by Teva Pharmaceuticals in July 2014. He was President and Chief Executive Officer of KAI Pharmaceuticals, Inc., from October 2004 until its acquisition by Amgen in July 2012. He was Senior Vice President, Commercial Operations, at Exelixis, Inc., from 2003 until 2004. Previously he held senior business roles at Sunesis Pharmaceuticals, Inc., and Isis Pharmaceuticals, Inc. He began his career in new product planning at Eli Lilly and Company. Mr. James was also a member of the board of directors of Ocera Therapeutics, Inc., and is currently a director of Antiva Biosciences, Allakos, Inc., Chrono Therapeutics, and Pionyr Immunotherapeutics, where he is also President and Chief Executive Officer. Our corporate governance and nominating committee believes that Mr. James’ qualifications for membership on the board of directors include his extensive experience in the leadership of development stage biotechnology companies and in business development. Mr. James earned a Bachelor of Arts degree in biology from Brown University and a Masters in Management degree from the Kellogg Graduate School of Management at Northwestern University.
Directors Continuing in Office until the 2019 Annual Meeting of Stockholders
Robert W. Azelby, M.B.A., age 50, has been a member of our board of directors since April 2017. Mr. Azelby is a member of our corporate governance and nominating committee. Since November 2015, Mr. Azelby has served as the Executive Vice President, Chief Commercial Officer at Juno Therapeutics, Inc., a biotechnology company. Prior to joining Juno, Mr. Azelby was Vice President and General Manager, Oncology at Amgen Inc. from June 2012 to October 2015. From October 2010 to September 2012, he served as Amgen’s Vice President, Amgen Oncology Sales. Prior to that, he served in various positions at Amgen, including periods as Vice President, Commercial Effectiveness Unit and General Manager of Amgen Netherlands. Our corporate governance and nominating committee believes that Mr. Azelby’s qualifications for membership on the board of directors include nearly 25 years of experience in the biotechnology and pharmaceutical industry, including leadership positions in many commercial oncology organizations. This experience allows Mr. Azelby to provide our board of directors with significant insights into the clinical development of our product candidates. Mr. Azelby received his B.A. in Economics and Religious Studies from the University of Virginia and his M.B.A. from Harvard Business School.
Ted W. Love, M.D., age 59, has been a member of our board of directors since September 2013. Dr. Love is the chair of our compensation committee and a member of our audit committee. Since June 2014, Dr. Love has served as Chief Executive Officer of Global Blood Therapeutics, Inc. From February 2010 until August 2012, Dr. Love served as Executive Vice President and Head of Research and Development and Technical Operations at Onyx Pharmaceuticals, Inc. From
50
Table of Contents
2001 to January 2009, Dr. Love served as Chairman and Chief Executive Officer of Nuvelo, Inc. Dr. Love joined Nuvelo from Theravance, Inc., where he served as Senior Vice President of Development from 1998 to 2001. Previously, he spent six years at Genentech, Inc., where he held a number of senior management positions in medical affairs and product development and served as chairman of Genentech’s Product Development Committee. Dr. Love also serves as a member of the board of directors of biopharmaceutical companies Amicus Therapeutics, Inc. and Global Blood Therapeutics, Inc. From March 2009 to November 2015, Dr. Love served as a member of the board of directors of KaloBios Pharmaceuticals, Inc. Dr. Love also previously served on the board of directors of Santarus, Inc. until its acquisition by Salix Pharmaceuticals, Ltd. Our corporate governance and nominating committee believes that Dr. Love’s qualifications for membership on the board of directors include over 15 years of experience in the biotechnology industry. This experience provides our board of directors with significant insights into the strategic and operational issues facing our company. Dr. Love earned his Bachelor of Science in molecular biology from Haverford College and his M.D. from Yale Medical School.
Gwen Fyfe, M.D., age 66, has been a member of our board of directors since January 2016. From 1997 to 2009, Dr. Fyfe held various positions with Genentech Inc. (now a member of the Roche Group), including Vice President, Oncology Development; Vice President, Avastin Franchise Team, as well as the honorary title of Senior Staff Scientist. Dr. Fyfe played an important role in the development of Genentech’s approved oncology agents including Rituxan ®, Herceptin ®, Avastin ® and Tarceva ®. Dr. Fyfe sat on the development oversight committee for all of Genentech’s products and participated in the Research Review Committee that moved products from research into clinical development. Since leaving Genentech in 2009, Dr. Fyfe has been a consultant for venture capital firms and for a variety of biotechnology companies. Dr. Fyfe currently serves as a director of Array Biopharma, Inc. and Molecular Partners. Dr. Fyfe previously served as a director of Infinity Pharmaceuticals, Inc. Dr. Fyfe has been an invited member of Institute of Medicine panels, National Cancer Institute working groups and grant committees and American Society of Clinical Oncologists oversight committees. Our corporate governance and nominating committee believes that Dr. Fyfe’s qualifications for membership on the board of directors include over 20 years of experience in the biotechnology industry. This experience allows Dr. Fyfe to provide our board of directors with extensive industry experience in clinical development for novel oncology therapeutics. Dr. Fyfe received her A.B. and M.D. from Washington University School of Medicine and a board certified pediatric oncologist.
Directors Continuing in Office Until the 2020 Annual Meeting of Stockholders
Daniel Spiegelman, M.B.A., age 59, has been a member of our board of directors since June 2008. Mr. Spiegelman is the chair of our audit committee and a member of our corporate governance and nominating committee. Since May 2012, Mr. Spiegelman has been the executive vice president and chief financial officer of Biomarin Pharmaceuticals Inc., a biopharmaceutical company focused on the development and commercialization of therapies for rare diseases. From October 2009 to May 2012, Mr. Spiegelman served as the chief executive officer of Filtini, Inc., a start-up company developing next generation circulating tumor cell capture and analysis technology. Mr. Spiegelman is also a co-founder of, and from July 2009 to May 2012, served as the chief financial officer of Rapidscan Pharma Solutions, Inc., a start-up company that has licensed the rights to sell regadenoson in Europe and other select territories. From 1998 to 2009, Mr. Spiegelman was employed at CV Therapeutics, Inc., a biopharmaceutical company acquired in 2009 by Gilead, most recently as senior vice president and chief financial officer. From 1992 to 1998, Mr. Spiegelman was an employee at Genentech, Inc., a biotechnology company, serving most recently as its treasurer. Mr. Spiegelman previously served as a member of the boards of directors of Relypsa, Inc., Affymax, Inc., Anthera Pharmaceuticals, Inc., Omeros Corporation, Cyclacel Pharmaceuticals, Inc., Xcyte Therapies, Inc. and Jennerex Biotherapeutics, Inc. Our corporate governance and nominating committee believes that Mr. Spiegelman’s qualifications for membership on the board of directors include his extensive background in the financial and commercial issues facing growing biotechnology companies. Additionally, as chief financial officer of CV Therapeutics prior to its sale to Gilead Sciences, Mr. Spiegelman was involved in transitioning the company from a research and development focus to a commercial entity with two approved products. This experience allows Mr. Spiegelman to provide our board of directors with significant insights into financial strategy and organizational development. Mr. Spiegelman received his B.A. and M.B.A. from Stanford University.
Scott D. Myers, M.B.A., age 51, has been a member of our board of directors since April 2016. From September 2011 to July 2015, Mr. Myers served as the Chief Executive Officer of Aerocrine AB, a biopharmaceutical company that was acquired by Circassia Pharmaceuticals plc in July 2015. From January 2007 to September 2011, Mr. Myers served as a Vice President of UCB S.A., a biopharmaceutical company. From December 2005 to January 2007, Mr. Myers served as the Chief Commercial Officer for DOV Pharmaceutical, a biotechnology company, and from 2000 to 2005, Mr. Myers served as a Senior Vice President and General Manager for Johnson & Johnson. Additionally, from April 2012 to April 2014, Mr. Myers served as a member of the board of directors of Orexo AB, a pharmaceutical company and is currently an Industry Advisor for EQT, an investment fund. Our corporate governance and nominating committee believes that Mr. Myers’ qualifications for membership on our board of directors include over 20 years of experience in the biotechnology industry and his extensive experience in the leadership of both commercial and development stage biopharmaceutical companies, including his position as our President and Chief Executive Officer. Mr. Myers received his Bachelor of Arts degree in biology from Northwestern University and M.B.A. from the Graduate School of Business at the University of Chicago.
51
Table of Contents
Section 16(a) Beneficial Ownership Reporting Compliance
Section 16(a) of the Exchange Act requires our directors and executive officers, and persons who own more than ten percent of a registered class of our equity securities, to file reports of ownership of, and transactions in, our securities with the Securities and Exchange Commission and Nasdaq. Such directors, executive officers and ten percent stockholders are also required to furnish us with copies of all Section 16(a) reports that they file.
Based solely on a review of the copies of such reports received by us, or written representations from certain reporting persons, we believe that during 2017, our directors, executive officers and ten percent stockholders complied with all Section 16(a) filing requirements applicable to them.
Code of Conduct
Our board of directors has adopted a Code of Business Conduct and Ethics (the Code of Conduct) for all our officers, directors and employees, and a Code of Ethics for the President and Chief Executive Officer, the Chief Financial Officer and the Corporate Controller (the Code of Ethics). The Code of Conduct details the responsibilities of all our officers, directors and employees to conduct our affairs in an honest and ethical manner and to comply with all applicable laws, rules and regulations. The Code of Conduct addresses issues such as general standards of conduct, avoiding conflicts of interest, communications, financial reporting, safeguarding our assets, responsibilities to our customers, suppliers and competitors and dealing with governments. The Code of Ethics imposes additional requirements on our senior executive, financial and accounting officers with respect to conflicts of interest, accuracy of accounting records and periodic reports and compliance with laws. Each of the Code of Conduct and Code of Ethics is available on our website at www.cascadianrx.com.
Stockholder Nominations and Recommendations for Director Candidates
We have not made any material changes to the procedures by which our stockholders may recommend nominees to our board of directors since we last disclosed the procedures by which stockholders may nominate director candidates under the caption “Corporate Governance and Board Matters — Committees of the Board of Directors — Corporate Governance and Nominating Committee” in our definitive proxy statement for the 2017 annual meeting of stockholders of Cascadian filed with the Securities and Exchange Commission on April 26, 2017.
Audit Committee
We have a standing audit committee, which reviews with our independent registered public accounting firm the scope, results, and costs of the annual audit and our accounting policies and financial reporting. Our audit committee (1) has direct responsibility for the appointment, compensation, retention, and oversight of our independent registered public accounting firm, (2) establishes procedures for handling complaints regarding our accounting practices, (3) has authority to engage any independent advisors it deems necessary to carry out its duties and (4) has appropriate funding to engage any necessary outside advisors. The current members of the audit committee are Mr. Spiegelman (Chairman), Mr. James and Dr. Love. Our board of directors has determined that Mr. Spiegelman, the chairman of the audit committee, is an “audit committee financial expert” as that term is defined in Item 407(d)(5) of Regulation S-K promulgated by the SEC and is an “independent director” as that term is defined under the applicable rules and regulations of The Nasdaq Stock Market. The audit committee reviews and reassesses the adequacy of its charter on an annual basis.
| ITEM 11. | Executive Compensation |
Compensation Discussion and Analysis
This compensation discussion and analysis describes our executive compensation programs, policies and practices for our named executive officers in 2017: Mr. Myers, Ms. Eastland, Mr. Christianson, Dr. Peterson and Dr. Walker.
Compensation Philosophy and Objectives
The principal objectives of our compensation programs, policies and practices have been to attract and retain senior executive management, to motivate their performance toward clearly defined corporate goals and to align their long-term interests with those of our stockholders. In addition, our compensation committee believes that maintaining and improving the quality and skills of our management and appropriately incentivizing their performance are critical factors affecting our stockholders’ realization of long-term value.
52
Table of Contents
Our compensation programs have reflected, and we expect that they will continue to reflect, the fact that we are a biopharmaceutical company whose product candidates are in preclinical and clinical development and subject to regulatory approval. As a result, our revenues have been and will continue to be limited, and we expect to continue to incur net losses for at least the next several years. In an effort to preserve cash resources, our historical compensation programs have focused on long-term equity incentives relative to cash compensation. This approach seeks to place a substantial portion of executive compensation at risk by rewarding our executive officers, in a manner comparable to our stockholders, for achieving our business and financial objectives.
In addition to long-term equity incentives, we have also implemented a performance-based annual cash bonus program for our executive officers. Payments under this bonus program are based on achievement of pre-established corporate performance goals. All of the performance goals of our executive officers are tied to corporate objectives to reflect the fact that our executive officers make key strategic decisions influencing our company as a whole.
We design and implement compensation programs that combine both cash incentive elements based on annual performance objectives and equity incentives based on our long-term performance. Our compensation committee has not, however, adopted any formal or informal policies or guidelines for allocating compensation between cash and equity compensation or among different forms of non-cash compensation. Our compensation committee’s philosophy is that a substantial portion of an executive officer’s target total direct compensation opportunity should be performance-based. In that regard, we expect to continue to use options to purchase shares of our common stock and other equity incentives as a significant component of compensation because we believe that they align individual compensation with the creation of stockholder value, and we expect any payments under cash incentive plans to be tied to annual performance objectives.
Previous Stockholder Advisory Votes on Named Executive Officer Compensation
We believe our executive compensation programs are effectively designed and work well in aligning the interests of our executive officers and stockholders and are instrumental to achieving our company objectives. In determining executive compensation for 2017, our compensation committee considered the level of stockholder support that the advisory “Say-on-Pay” proposals received at our 2014 and 2017 annual meetings of stockholders. As a result, our compensation committee continued to apply the same effective principles and philosophy it has used in previous years in determining executive compensation and will continue to consider stockholder concerns and feedback in the future.
With respect to the frequency of future “Say-on-Pay” advisory votes, consistent with the recommendation of our board of directors and the outcome of the stockholder vote regarding the proposal at our 2017 annual meeting of stockholders, our board of directors has determined to hold an advisory “Say-on-Pay” vote on the compensation of our named executive officers every year. Our next advisory “Say-on-Pay” vote will occur at our 2018 annual meeting of stockholders, if such meeting is held.
Role of Our Compensation Committee
During 2017, our compensation committee was comprised of three non-employee members of our board of directors, Dr. Love (Chairman), Dr. Henney and Mr. James, each of whom is an independent director under the applicable rules and regulations of The Nasdaq Stock Market and a “non-employee director” for purposes of Rule 16b-3 under the Exchange Act.
Our compensation committee approves and oversees our executive compensation and benefit policies. Our compensation committee acts as the administrator of our equity incentive plan and approves all equity awards granted to our executive officers. Our compensation committee operates pursuant to a written charter under which our board of directors has delegated specific authority with respect to compensation determinations. Among the responsibilities of our compensation committee are the following:
| • | evaluating our compensation policies and practices and assisting in developing and implementing our executive compensation programs and philosophy; |
| • | establishing a practice, in accordance with the applicable rules and regulations of The Nasdaq Stock Market, of determining the compensation earned, paid or awarded to our chief executive officer independent of input from him; and |
53
Table of Contents
| • | establishing a policy, in accordance with the applicable rules and regulations of The Nasdaq Stock Market, of reviewing on an annual basis the performance of our other executive officers with assistance from our chief executive officer and determining what we believe to be appropriate compensation levels for such officers. |
Our compensation committee’s charter allows the committee to form subcommittees for any purpose that it deems appropriate and may delegate to such subcommittees such power and authority as it deems appropriate. For example, our compensation committee has delegated certain powers and authority to the new employee and promotion equity committee as set forth in “— 2016 Equity Incentive Plan” included elsewhere in this Annual Report on Form 10-K.
Role of our Chief Executive Officer
During 2017, our chief executive officer actively supported our compensation committee’s work by providing information relating to our financial plans, performance assessments of our executive officers and other personnel-related data. In particular, our chief executive officer, as the person to whom our other executive officers reported, was responsible for evaluating individual officers’ contributions to our corporate objectives. Our chief executive officer made recommendations to our compensation committee with respect to merit salary increases, annual cash bonus payments and stock option grants or other equity incentives for our other executive officers. Our compensation committee met to evaluate, discuss, modify or approve these recommendations. Without the participation of our chief executive officer, our compensation committee as part of the annual review process conducted a similar evaluation of our chief executive officer’s contributions and performance and made determinations with respect to a merit salary increase, annual cash bonus payment, stock option grants or other forms of compensation for our chief executive officer.
Role of our Compensation Consultant
Our compensation committee has the authority under its charter to engage the services of outside advisors, experts and others for assistance.
During 2017, our compensation committee engaged the services of Compensia, Inc., a national compensation consulting firm (Compensia), to advise the committee and our corporate governance and nominating committee regarding the amount and types of compensation that we provide to our executive officers and non-employee members of our board of directors and how our compensation practices compare to the compensation practices of other companies. Specifically, in 2017, Compensia was engaged to:
| (i) | develop a peer group for assessing executive and non-employee director compensation market practices; |
| (ii) | assess our executive officer and non-employee director compensation practices, including our cash and short-term incentive and equity usage practices, relative to comparable companies; and |
| (iii) | advise on 2017 compensation strategies and structure. |
Our compensation committee considered Compensia’s analysis when determining 2017 base salaries, target cash bonus opportunities and equity-based incentive compensation. Compensia reports directly to our compensation committee and does not provide any services to us other than the services provided to our compensation committee and to our corporate governance and nominating committee in connection with recommendations regarding non-employee director compensation.
Our compensation committee has evaluated Compensia’s engagement and, based on the factors for assessing independence and identifying potential conflicts of interest that are set forth in the applicable SEC and Nasdaq rules, has determined that its relationship with Compensia and the work of Compensia on behalf of the committee did not raise any conflict of interest.
Competitive Market Review for 2017
The market for experienced management is highly competitive in the life sciences and biopharmaceutical industries. We seek to attract and retain the most highly qualified executives to manage each of our business functions, and we face substantial competition in recruiting and retaining management from companies ranging from large and established pharmaceutical companies to entrepreneurial early-stage companies. We expect competition for appropriate technical, commercial and management skills to remain strong for the foreseeable future.
54
Table of Contents
In making our executive compensation determinations for 2017, our compensation committee assessed our compensation levels using data derived from a group of peer companies. In developing our compensation peer group, our compensation committee identified publicly-traded clinical-stage biotechnology companies with shares listed on Nasdaq that were comparable to us based on the stage of clinical development, revenue, cash reserves, market capitalization and number of employees. Based on this analysis and the recommendations of Compensia, our compensation committee selected the following companies to comprise our compensation peer group:
| Advaxis |
GTx | |
| Akebia Therapeutics |
Idera Pharmaceuticals | |
| ArQule |
Ignyta | |
| Arrowhead Pharmaceuticals |
Immune Design | |
| AVEO Pharmaceuticals |
Karyopharm Therapeutics | |
| Calithera Biosciences |
Mirati Therapeutics | |
| Cerulean Pharma |
OncoMed Pharmaceuticals | |
| ChemoCentryx |
Regulus Therapeutics | |
| Endocyte |
Stemline Therapeutics | |
| Geron |
Verastem |
In addition to the compensation practices of the compensation peer group described above, our compensation committee also considered data from the Radford Global Life Sciences Salary Survey. This survey included life sciences companies based predominantly in biotechnology markets in the U.S. with which we compete for executive talent.
In evaluating the compensation peer group data, our compensation committee compared our compensation practices with those of the companies in our peer group. This information was used to determine appropriate levels of compensation based on market benchmarks for similarly situated officers. In 2017, our compensation committee benchmarked base salary, cash bonus payments and the existing long-term incentive value of our equity-based incentive compensation using an analysis prepared by Compensia of the base salaries, incentive bonuses and the long-term incentive value of equity awards held by executive officers in comparable positions in our compensation peer group. In determining base salary levels, target cash bonus opportunities and equity-based incentive compensation for 2017, our compensation committee referenced the 50th percentile of the compensation peer group, which it believes provides the means to allow a company of our size to attract, compete for and retain the executive talent necessary for us to achieve our goals and also conserve our cash and equity as much as possible.
Principal Elements of Executive Compensation
Our executive compensation program consists of five components:
| • | base salary; |
| • | performance-based annual cash bonuses; |
| • | long-term incentives in the form of equity awards; |
| • | health and welfare benefits; and |
| • | severance/termination protection. |
We believe that each of these components, combining both short-term and long-term incentives, enables us to achieve our compensation objectives and that collectively these components have been effective in achieving our corporate goals.
Annual Review Process
Our compensation committee reviews competitive market data and makes executive compensation decisions on an annual basis, typically during the last quarter of the year and the first quarter of the new year. From time to time, our compensation committee may make mid-year changes to executive compensation based on new developments in our business or industry.
In connection with our annual goal-setting process, our executive officers are responsible for establishing proposed corporate goals, which are submitted to the compensation committee for review in the form of draft corporate goals. Our compensation committee then reviews, considers and may amend the draft corporate goals prior to the committee’s final approval of the corporate goals.
55
Table of Contents
Weighting of Compensation Components
For 2017, our compensation committee’s determination of the appropriate use and weight of each component of executive compensation was subjective, based on its view of the relative importance of each component in meeting our overall objectives and factors relevant to the individual executive officer. Like many biopharmaceutical companies with preclinical and clinical-stage product candidates, we seek to place a significant amount of each executive officer’s target total direct compensation “at risk” based on performance.
Base Salary
For 2017, our compensation committee, in its discretion, made changes to the annual base salaries for our executive officers. Base salary for our executive officers are set to reflect the scope of their respective responsibilities, their relative seniority and experience and competitive market factors, including our compensation committee’s review of competitive market data for the executive officers in comparable positions in our compensation peer group. Our compensation committee seeks to set base salaries at approximately the 50th percentile of base salaries reported for comparable positions within our compensation peer group.
Base salary adjustments for 2017 for our executive officers were based on a comparison of 2016 base salaries to the 50th percentile of base salaries reported for comparable positions within our compensation peer group, individual performance and changes in job duties. Based on these factors, our compensation committee determined that it was appropriate to increase Ms. Eastland’s base salary by 5.9% to reflect her exemplary performance and to more closely align her salary with approximately the 50th percentile of the comparable base salaries reported in the Radford Global Life Sciences Salary Survey, and to increase Dr. Walker’s base salary by 19.4% to reflect an increase in his job responsibilities, his exemplary performance and to more closely align his salary with approximately the 50th percentile of the comparable base salaries reported in the Radford Global Life Sciences Salary Survey.
Our compensation committee approved base salaries for our named executive officers, effective January 1, 2017, as follows:
| Named Executive Officer |
2017 Base Salary |
2016 Base Salary |
||||||
| Scott Myers |
$ | 600,000 | $ | 600,000 | ||||
| Julia Eastland |
$ | 360,000 | $ | 340,000 | ||||
| Gary Christianson |
$ | 330,475 | $ | 330,475 | ||||
| Dr. Scott Peterson |
$ | 360,000 | $ | 360,000 | ||||
| Dr. Luke Walker |
$ | 370,000 | $ | 310,000 | ||||
Variable Cash Compensation — Annual Cash Bonuses
We pay performance-based cash bonuses to our executive officers pursuant to our performance review policy, which we believe enhances each executive’s incentive to contribute to the successful achievement of our corporate objectives and aligns their interests with those of our stockholders. Under the performance review policy, our executive officers are eligible to receive cash bonuses based on achievement of one or more pre-established corporate performance goals. As further described below, each goal is assigned a percentage based on the importance to us that the goal be achieved. Generally, achievement of a particular goal will result in the payment of the expected level of incentive compensation associated with such goal. Partial achievement can result in the payment of reduced or no incentive compensation and superior achievement of any performance goal may result in the payment in excess of the target level of incentive compensation; however, there is not a fixed formula for determining the amount of incentive compensation for partial or above-target achievement. Rather, our compensation committee retains discretion to increase or decrease the annual cash bonus payment to our executive officers as it determines appropriate, based on actual individual performance.
Typically, the target annual cash bonus that an executive officer may earn is based on a percentage of his or her annual base salary. For example, if (1) an executive’s base salary is $100,000, (2) he or she is eligible to receive a bonus payment equal to 50% of his or her base salary, or $50,000, (3) our compensation committee has established four corporate performance goals, each weighted at 25% and (4) our compensation committee determines that we have achieved two of the four performance goals, then, he or she would be eligible to receive, subject to the discretion of our compensation committee, a bonus payment of $25,000.
56
Table of Contents
Performance goals may be either qualitative and quantitative and are designed to be specific, measurable and completed within a fixed period of time. Our compensation committee is responsible for selecting performance goals, establishing the related target performance level (if any), assessing whether such goals have been achieved and determining the amount (if any) to be paid with respect to the actual achievement level to our executive officers. Performance goals for the current year are typically established at or shortly after the end of the prior year. If a bonus has been earned, we typically pay bonuses to our executive officers shortly after the first scheduled meeting of our compensation committee each year. An executive officer must remain actively employed by us through the actual date of payment to receive a bonus.
The 2017 performance goals approved by our compensation committee are set forth in the table below. With input from our board of directors, our compensation committee selected these particular corporate goals based on its judgment that they represented areas in which our executive officers have significant operational control and on which our board of directors and compensation committee believed our executive officers should focus to move our strategic plan forward and enhance stockholder value. Consistent with its determination in 2016, our compensation committee determined in 2017 that the performance goals should apply equally to each executive officer in order to encourage management to act collaboratively as a team (with discretion to adjust for individual factors in performance that were not reflected in the 2017 performance goals), which it believed would result in the furtherance of our strategic plans.
| Advance HER2CLIMB |
Regulatory Plan (2) |
Preclinical Assessment (3) |
Financing (4) |
Work Environment (5) | ||||
| 70% |
15% | 5% | 5% | 5% |
| (1) | Ensure HER2CLIMB achieves 2017 site initiation and patient enrollment targets. |
| (2) | Drive three to five year tucatinib product development and regulatory plan. |
| (3) | Define and develop three-year research and business development plan and business case for CASC-578 and CASC-674. |
| (4) | Pursue financing vehicles to ensure operations are appropriately funded. |
| (5) | Enhance work environment and culture to attract and retain top talent. |
Mr. Myers, Ms. Eastland, Mr. Christianson, Dr. Peterson and Dr. Walker were eligible to receive annual cash bonuses of up to 50%, 35%, 35%, 35% and 35%, respectively, of their base salary. The annual cash bonus opportunity (expressed as a percentage of base salary) for each executive officer is determined by the compensation committee and is based on a review of potential bonuses for similarly positioned executives at companies included in our compensation peer group.
In January 2018, our compensation committee reviewed our goals collectively, noting that we had made substantial progress with respect to certain goals and exceeded expectations with respect to other goals. As a result, our compensation committee determined that, in the aggregate, we had exceeded 100% achievement of the 2017 performance goals. The target and actual bonus payments for 2017 for our named executive officers are set forth below.
| Named Executive Officer |
Base Salary ($) |
2017 Annual Target as Percentage of Base Salary |
Target Bonus ($) |
Target Goals Achieved |
2017 Incentive Bonus ($) |
|||||||||||||||
| Scott Myers |
$ | 600,000 | 50 | % | $ | 300,000 | 115.0 | % | $ | 345,000 | ||||||||||
| Julia Eastland |
360,000 | 35 | 126,000 | 105.0 | 132,300 | |||||||||||||||
| Gary Christianson |
330,475 | 35 | 115,666 | 115.0 | 133,016 | |||||||||||||||
| Scott Peterson |
360,000 | 35 | 126,000 | 105.0 | 132,300 | |||||||||||||||
| Luke Walker |
370,000 | 35 | 129,500 | 105.0 | 135,975 | |||||||||||||||
Long-Term Incentives
We grant long-term incentive compensation in the form of equity awards to our employees, including our named executive officers, to create a corporate culture that aligns employee interests with stockholder interests. We have not adopted any specific stock ownership guidelines, and our equity incentive plans have provided the principal method for our named executive officers to acquire an equity stake in our company. All equity incentive programs are administered by our compensation committee, other than grants of restricted share unit (“RSU”) awards to our non-employee directors, which are recommended by our corporate governance and nominating committee, and grants of stock options and RSU awards to certain newly-hired or promoted employees (other than our executive officers and senior vice presidents), which are granted by the new employee and promotion equity committee.
57
Table of Contents
During 2017, our long-term incentive compensation opportunities for our executive officers consisted of stock options and RSU awards granted under the 2016 EIP. We use stock options and RSU awards as our principal long-term incentive vehicle because they align the interests of our executive officers with those of our stockholders, support a pay-for-performance culture, foster employee stock ownership and focus the management team on increasing value for our stockholders. In addition, stock options and RSU awards help to provide a balance to the overall executive compensation program as base salary and our bonus program focus on nearer-term achievements, while the grant and vesting of equity awards is intended to focus our executive officers’ efforts toward increasing stockholder value over the longer term.
The practice of our compensation committee has been to consider the annual grant of equity awards to our executive officers in connection with its annual compensation review process. In making its determination of the size of annual equity award grants for our executive officers, our compensation committee considers the individual performance of the executive officer in the prior year, the industry experience and background of the executive officer, the value of the executive officer’s outstanding equity awards in the then-current competitive environment, including the value of such outstanding equity awards as a retention tool, and a competitive market analysis of the equity awards granted to executive officers in similar roles at the companies in our compensation peer group. Adjustments may be made as our compensation committee deems reasonable to attract and retain executive officers in the competitive environment for highly-qualified employees in which we operate.
In 2017, our compensation committee began granting a combination of RSU awards and stock options to our executive officers to maintain the overall retention value of equity awards.
The analysis prepared by Compensia indicated that the long-term incentive value of the equity awards held by each of our executive officers fell below the 10th percentile of our peer group. To achieve a long-term incentive value for each of our executive officers that was consistent with approximately the 50th percentile of our compensation peer group, our compensation committee granted RSU awards and stock options to our executive officers as set forth in the table below, which it believed was appropriate in light of our long-term retention objectives.
| Executive Officer |
Restricted Stock Units (#)(1) |
Options (#)(2) | ||||||
| Scott Myers |
63,800 | 250,000 | ||||||
| Julia Eastland |
27,800 | 126,200 | ||||||
| Gary Christianson |
26,300 | 119,200 | ||||||
| Dr. Scott Peterson |
25,300 | 116,200 | ||||||
| Dr. Luke Walker |
19,800 | 85,100 | ||||||
| (1) | These RSU awards vest as follows: 25% of the shares of our common stock underlying the award will vest and settle, net of taxes, on each anniversary of the grant date, subject to the executive officer’s continued service. |
| (2) | These stock options vest as follows: 25% of the shares of our common stock underlying the option will vest and become exercisable on the first anniversary of the grant date and, thereafter, 1/48th of the shares underlying the option will vest and become exercisable on each monthly anniversary of the grant date, subject to the executive officer’s continued service, such that the option will be fully exercisable on the fourth anniversary of the grant date. The exercise price of these options is the closing sales price of our common stock on the date of grant, January 11, 2017 and September 18, 2017, or $4.64 and $3.99, respectively. |
Health and Welfare Benefits
We provide the following benefits to our named executive officers, generally on the same basis provided to all of our employees:
| • | health, dental insurance and vision insurance (for the employee and eligible dependents); |
| • | flexible spending accounts for medical and dependent care; |
| • | life insurance; |
| • | an employee assistance plan (for the employee and eligible dependents); |
| • | short-term and long-term disability, accidental death and dismemberment insurance; and |
| • | a Section 401(k) plan with an employer matching feature into the plan. |
58
Table of Contents
Severance/Termination Protection
We are a party to agreements with our executive officers that provide eligibility for payments and benefits in connection with a termination of employment following a change in control of the company. Our compensation committee considers such payments and benefits to be competitive in the hiring and retention of our executive officers. When establishing the retention, termination and change of control provisions in our agreements with our executive officers, our compensation committee considered industry practice and an analysis of current market trends.
In addition, these payments and benefits are intended to incentivize and retain our executive officers during the pendency of a proposed change in control transaction and align their interests with the interests of our stockholders in the event of a change in control of the company.
All arrangements with our named executive officers and the potential payments that each of our named executive officers would have received if a change in control of the company or termination of employment would have occurred on December 31, 2017, are described in “— Termination and Change of Control Provisions” and “— Potential Payments Upon Termination or Change in Control” included elsewhere in this Annual Report on Form 10-K.
Tax Considerations
Section 162(m) of the Internal Revenue Code (Section 162(m)) limits the amount that we may deduct for compensation paid to our chief executive officer, chief financial officer and the next three most highly compensated executive officers to $1 million per person per year.
The exemption from Section 162(m)’s deduction limit for performance-based compensation has been repealed, effective for taxable years beginning after December 31, 2017, such that compensation paid to our covered executive officers in excess of $1 million will not be deductible unless it qualifies for transition relief applicable to certain arrangements in place as of November 2, 2017.
Our compensation committee cannot determine with certainty how the deduction limit of Section 162(m) may impact our executive compensation programs in future years. While our compensation committee has not adopted a formal policy regarding tax deductibility of the compensation paid to our executive officers, it considers tax deductibility under Section 162(m) as one factor in its compensation deliberations. However, because of ambiguities and uncertainties as to the application and interpretation of Section 162(m) and the regulations thereunder, including the uncertain scope of the transition relief for certain arrangements in place as of November 2, 2017, no assurance can be given that compensation intended to satisfy the requirements for exemption from Section 162(m) in fact will. Additionally, our compensation committee retains the flexibility to award compensation that it determines to be consistent with the goals of our executive compensation programs even if we are unable to deduct the awards for tax purposes. Our compensation committee may, in its judgment, approve compensation for our executive officers that does not comply with an exemption from the deduction limit, and reserves the right to modify compensation that was initially intended to be exempt from Section 162(m) when it believes that such compensation is in the best interests of our company and our stockholders.
Securities Trading Policies
Our Insider Trading Policy provides that, except for trades pursuant to approved Exchange Act Rule 10b5-1 plans, the non-employee members of our board of directors, executive officers and employees may not trade in our securities while possessing material nonpublic information concerning us or trade in our securities outside of the applicable trading windows. Our Insider Trading Policy further provides that the non-employee members of our board of directors and executive officers may not purchase or sell puts or calls that underlie a purchase or sale of our common stock, engage in short sales or any other hedging transactions with respect to our common stock, or buy our common stock on margin or pledge shares of our common stock. Except for trades pursuant to approved Exchange Act Rule 10b5-1 plans, our policy restricts trading in our securities by the non-employee members of our board of directors, executive officers and employees to open window periods following the widespread public release of our quarterly and annual financial results.
Compensation Committee Interlocks and Insider Participation
During 2017, Dr. Love, Dr. Henney, and Mr. James served on our compensation committee. During 2017, no member of our compensation committee was an officer or employee or formerly an officer of our company, and no member had any relationship that would require disclosure under Item 404 of Regulation S-K. None of our executive officers has served on the board of directors or the compensation committee (or other board committee performing equivalent functions) of any other entity, one of whose executive officers served on our board of directors or on our compensation committee.
59
Table of Contents
Risk Analysis of Compensation Plans
The mix and design of the elements of our compensation programs do not encourage management to assume excessive risks. Any risks arising from our compensation policies and practices for our employees are not reasonably likely to have a material adverse effect on the company.
Our compensation committee has reviewed the elements of executive compensation to determine whether any portion of this compensation encouraged excessive risk taking and concluded:
| • | significant weighting towards long-term incentive compensation discourages short-term risk-taking; and |
| • | several categories of goals generally apply, so that if any particular goal is not achieved, then a disproportionate amount of total compensation is not forfeited. |
Compensation Committee Report
The information contained in this report will not be deemed to be “soliciting material” or to be “filed” with the SEC, nor will such information be incorporated by reference into any future filing under the Securities Act or the Exchange Act, except to the extent that we specifically incorporate it by reference in such filing.
In reliance on the reviews and discussions referred to above and the review and discussion of the section captioned “Compensation Discussion and Analysis” with our management, the compensation committee has recommended to the board of directors, that the section captioned “Compensation Discussion and Analysis” be included in this Annual Report on Form 10-K.
| COMPENSATION COMMITTEE |
| Dr. Ted W. Love, Chairman |
| Dr. Christopher Henney |
| Steven P. James |
60
Table of Contents
2017 Summary Compensation Table
The following table sets forth the compensation earned by or awarded to, as applicable, our named executive officers during each of 2017, 2016 and 2015.
| Name and Principal Position |
Year | Salary ($) |
Restricted Stock Unit Awards ($) (1) |
Option Awards ($)(1) |
Non-Equity Incentive Plan Compensation ($)(2) |
All Other Compensation ($)(3) |
Total ($) |
|||||||||||||||||||||
| Scott Myers (4) |
2017 | $ | 600,000 | $ | 282,303 | $ | 739,900 | $ | 345,000 | $ | 8,661 | $ | 1,975,864 | |||||||||||||||
| President, Chief Executive Officer and Director |
2016 | 448,076 | — | 2,226,859 | 222,951 | 73,542 | 2,971,428 | |||||||||||||||||||||
| Julia Eastland |
2017 | 360,000 | 118,267 | 352,934 | 358,967 | 8,867 | 1,199,035 | |||||||||||||||||||||
| Chief Financial Officer, Chief |
2016 | 340,000 | — | 229,000 | 119,000 | 8,442 | 696,442 | |||||||||||||||||||||
| Business Officer and Secretary |
2015 | 300,000 | — | 562,500 | 68,250 | 8,442 | 939,192 | |||||||||||||||||||||
| Gary Christianson |
2017 | 330,475 | 112,282 | 334,664 | 353,333 | 8,592 | 1,139,346 | |||||||||||||||||||||
| Chief Operating Officer |
2016 | 330,475 | — | 190,835 | 104,100 | 8,442 | 854,169 | |||||||||||||||||||||
| 2015 | 319,300 | — | 562,500 | 68,171 | 8,442 | 958,413 | ||||||||||||||||||||||
| Scott Peterson |
2017 | 360,000 | 108,292 | 326,834 | 372,300 | 8,867 | 1,176,293 | |||||||||||||||||||||
| Chief Scientific Officer |
2016 | 360,000 | — | 248,085 | 126,000 | 8,442 | 982,527 | |||||||||||||||||||||
| 2015 | 315,000 | — | 562,500 | 75,521 | 8,442 | 961,463 | ||||||||||||||||||||||
| Luke Walker Senior Vice President, Clinical Development |
2017 | 370,000 | 84,072 | 238,257 | 258,990 | 15,638 | 966,957 | |||||||||||||||||||||
| (1) | The amounts in this column represent the aggregate grant date fair value of option and RSU awards for fiscal years 2017, 2016 and 2015. These amounts do not represent the actual amounts paid to or realized by our named executive officer for these awards during fiscal years 2017, 2016 and 2015. The value as of the grant date for stock options and RSU awards is recognized over the number of days of service required for the award to vest. For a more detailed description of the assumptions used for purposes of determining these grant date fair values, see “Note 7 — Share-based Compensation” of the audited financial statements included elsewhere in this Annual Report on Form 10-K. |
| (2) | The amounts in this column represent retention bonuses and total performance-based annual cash bonuses earned for services rendered during the year by our named executive officers, which performance-based cash bonuses were awarded based on the achievement of corporate performance goals determined each year by our compensation committee. See “— Compensation Discussion and Analysis — Variable Cash Compensation — Incentive Bonuses” included elsewhere in this Annual Report on Form 10-K for additional information regarding the performance-based annual cash bonuses for our named executive officers. |
| (3) | The amounts in this column consist of contributions made by us pursuant to our Section 401(k) plan, life insurance premiums, relocation and miscellaneous service awards. |
| (4) | Mr. Myers began serving as our Chief Executive Officer in April 2016. |
61
Table of Contents
2017 Grants of Plan-Based Awards Table
The following table sets forth each grant of an award made to a named executive officer during 2017 under any of our incentive plans or equity plans.
| Name and Principal Position |
Grant Date (1) | Estimated Possible Payouts Under Non- Equity Incentive Plan Awards($)(1) |
Number of Securities Underlying Restricted Stock Unit (#) |
Exercise or Base Price of Restricted Stock Unit Awards ($/Sh)(2) |
All Other Option Awards: Number of Securities Underlying Options (#) |
Exercise or Base Price of Option Awards ($/Sh)(2) |
Grant Date Fair Value of Restricted Stock Unit and Option Awards ($)(3) |
|||||||||||||||||||||
| Scott Myers |
January 11,2017 | $ | 300,000 | 42,000 | $ | — | 190,000 | $ | 4.64 | $ | 778,180 | |||||||||||||||||
| September 18, 2017 | — | 15,500 | — | 60,000 | 3.99 | 218,445 | ||||||||||||||||||||||
| November 10, 2017 | — | 6,300 | — | — | — | 25,578 | ||||||||||||||||||||||
| Julia Eastland |
January 11,2017 | 126,000 | 11,300 | — | 51,200 | 4.64 | 209,616 | |||||||||||||||||||||
| September 18, 2017 | — | 16,500 | — | 75,000 | 3.99 | 261,585 | ||||||||||||||||||||||
| Gary Christianson |
January 11,2017 | 115,666 | 11,300 | — | 51,200 | 4.64 | 209,616 | |||||||||||||||||||||
| September 18, 2017 | — | 15,000 | — | 68,000 | 3.99 | 237,330 | ||||||||||||||||||||||
| Scott Peterson |
January 11,2017 | 126,000 | 11,300 | — | 51,200 | 4.64 | 209,616 | |||||||||||||||||||||
| September 18, 2017 | — | 14,000 | — | 65,000 | 3.99 | 225,510 | ||||||||||||||||||||||
| Luke Walker |
January 11,2017 | 129,500 | 7,800 | — | 35,100 | 4.64 | 143,949 | |||||||||||||||||||||
| September 18, 2017 | — | 12,000 | — | 50,000 | 3.99 | 178,380 | ||||||||||||||||||||||
| (1) | The amounts in this column represent the “target” amount of each award. There was no set “Threshold” or “Maximum” performance bonus amounts established with respect to our 2017 non-equity incentive plan awards. In January 2018, our compensation committee awarded non-equity incentive plan awards based on achievement of our 2017 performance goals. The actual amounts paid to each of our named executive officers for 2017 are set forth in the “Non-Equity Incentive Plan Compensation” column of the Summary Compensation Table. For more information regarding the 2017 non-equity incentive plan awards, see “— Compensation Discussion and Analysis — Variable Cash Compensation — Incentive Bonuses” included elsewhere in this Annual Report on Form 10-K. |
| (2) | Except as otherwise noted below and consistent with the provisions of our 2016 EIP in effect at the date of grant, all options reflected in the table had an exercise price equal to the closing sales price of our common stock as reported by The Nasdaq Global Market on the grant date. All RSU awards and options were granted under our 2016 EIP. |
| (3) | The amounts reported in this column represent the grant date fair value of RSU awards and stock options granted in 2017. These amounts do not represent the actual amounts paid to or realized by the named executive officer for these awards during fiscal year 2017. The value as of the grant date is recognized over the number of days of service required for the grant to vest. For a more detailed description of the assumptions used for purposes of determining these grant date fair values, see “Part II — Item 7 — Management’s Discussion and Analysis of Financial Condition and Results of Operations — Critical Accounting Policies and Significant Judgments and Estimates — Share-based Compensation” and “Note 7 — Share-based Compensation” of the audited financial statements included elsewhere in this Annual Report on Form 10-K. |
62
Table of Contents
2017 Outstanding Equity Awards at Fiscal Year-End Table
The following table sets forth the equity awards outstanding at December 31, 2017 for each of our named executive officers. Except as set forth in the footnotes to the following table, each equity award is fully vested.
| Option Awards | Stock Awards | |||||||||||||||||||||
| Name |
Number of Securities Underlying Unexercised Options (#) Exercisable |
Number of Securities Underlying Unexercised Options (#) Unexercisable |
Option Exercise Price(1) |
Option Expiration Date |
Number of unearned shares, units or other rights that have not vested (#) |
Market or payout value of unearned shares, units or other rights that have not vested ($) | ||||||||||||||||
| Scott Myers |
197,839 | 276,971 | (2) | $ | 7.08 | April 4, 2026 | 63,800 | 236,060 | ||||||||||||||
| — | 190,000 | (3) | $ | 4.64 | January 11, 2027 | — | — | |||||||||||||||
| — | 60,000 | (4) | $ | 3.99 | September 18, 2027 | — | — | |||||||||||||||
| Julia Eastland |
6,667 | — | (5) | $ | 19.86 | November 10, 2018 | 27,800 | 102,860 | ||||||||||||||
| 8,334 | — | (6) | $ | 19.92 | December 1, 2018 | |||||||||||||||||
| 8,334 | — | (7) | $ | 41.52 | December 1, 2019 | — | — | |||||||||||||||
| 8,334 | — | (8) | $ | 28.44 | December 12, 2020 | — | — | |||||||||||||||
| 25,000 | — | (9) | $ | 10.44 | December 12, 2021 | — | — | |||||||||||||||
| 12,503 | 4,164 | (10) | $ | 10.56 | December 16, 2022 | — | — | |||||||||||||||
| 23,442 | 18,225 | (11) | $ | 21.06 | September 24, 2023 | — | — | |||||||||||||||
| 19,794 | 30,206 | (12) | $ | 6.90 | May 17, 2024 | — | — | |||||||||||||||
| — | 51,200 | (3) | $ | 4.64 | January 11, 2027 | — | — | |||||||||||||||
| — | 75,000 | (4) | $ | 3.99 | September 18, 2027 | — | — | |||||||||||||||
| Gary Christianson |
8,334 | — | (6) | $ | 19.92 | December 1, 2018 | 26,300 | 97,310 | ||||||||||||||
| 8,334 | — | (7) | $ | 41.52 | December 1, 2019 | — | — | |||||||||||||||
| 8,334 | — | (8) | $ | 28.44 | December 12, 2020 | — | — | |||||||||||||||
| 25,000 | — | (9) | $ | 10.44 | December 12, 2021 | — | — | |||||||||||||||
| 12,503 | 4,146 | (10) | $ | 10.56 | December 16, 2022 | — | — | |||||||||||||||
| 23,442 | 18,225 | (11) | $ | 21.06 | September 24, 2023 | — | — | |||||||||||||||
| 16,495 | 25,172 | (12) | $ | 6.90 | May 17, 2024 | — | — | |||||||||||||||
| — | 51,200 | (3) | $ | 4.64 | January 11, 2027 | — | — | |||||||||||||||
| — | 68,000 | (4) | $ | 3.99 | September 18, 2027 | — | — | |||||||||||||||
| Scott Peterson |
8,334 | — | (6) | $ | 19.92 | December 1, 2018 | 25,300 | 93,610 | ||||||||||||||
| 8,334 | — | (7) | $ | 41.52 | December 1, 2019 | — | — | |||||||||||||||
| 8,334 | — | (8) | $ | 28.44 | December 12, 2020 | — | — | |||||||||||||||
| 25,000 | — | (9) | $ | 10.44 | December 12, 2021 | — | — | |||||||||||||||
| 18,754 | 6,246 | (10) | $ | 10.56 | December 16, 2022 | — | — | |||||||||||||||
| 23,442 | 18,225 | (11) | $ | 21.06 | September 24, 2023 | — | — | |||||||||||||||
| 21,445 | 32,722 | (12) | $ | 6.90 | May 17, 2024 | — | — | |||||||||||||||
| — | 51,200 | (3) | $ | 4.64 | January 11, 2027 | — | — | |||||||||||||||
| — | 65,000 | (4) | $ | 3.99 | September 18, 2027 | — | — | |||||||||||||||
| Luke Walker |
2,500 | — | (13) | $ | 35.88 | September 30, 2019 | 19,800 | 73,260 | ||||||||||||||
| 334 | — | (7) | $ | 41.52 | December 1, 2019 | — | — | |||||||||||||||
| 1,250 | — | (8) | $ | 28.44 | December 12, 2020 | — | — | |||||||||||||||
| 2,500 | — | (9) | $ | 10.44 | December 12, 2021 | — | — | |||||||||||||||
| 943 | 307 | (10) | $ | 10.56 | December 16, 2022 | — | — | |||||||||||||||
| 3,289 | 2,545 | (11) | $ | 21.06 | September 24, 2023 | — | — | |||||||||||||||
| 11,984 | 17,184 | (12) | $ | 6.90 | May 17, 2024 | — | — | |||||||||||||||
| — | 35,100 | (3) | $ | 4.64 | January 11, 2027 | — | — | |||||||||||||||
| — | 50,000 | (4) | $ | 3.99 | September 18, 2027 | — | — | |||||||||||||||
| (1) | In April 2008, our board of directors approved an amendment to our historical share option plan, which provided that the exercise price of any future grants would equal the closing price of our common stock traded on The Nasdaq Global Market on the date of grant. The 2016 EIP provides that the exercise price of any grant would equal or exceed the closing price, on the date of grant, of our common stock on the principal national exchange on which the stock is listed or traded. |
63
Table of Contents
| (2) | This stock option fully vests on April 4, 2020, and 1/4 vests on the first anniversary of grant, with the balance vesting in monthly increments for 36 months following the first anniversary of grant. This stock option was an inducement grant, and therefore not granted under our share option plan. |
| (3) | This stock option fully vests on January 11, 2021, and 1/4 vests on the first anniversary of grant, with the balance vesting in monthly increments for 36 months following the first anniversary of grant. |
| (4) | This stock option fully vests on September 18, 2021, and 1/4 vests on the first anniversary of grant, with the balance vesting in monthly increments for 36 months following the first anniversary of grant. |
| (5) | This stock option fully vested on September 7, 2014. |
| (6) | This stock option fully vested on December 1, 2014. |
| (7) | This stock option fully vested on December 1, 2015. |
| (8) | This stock option fully vested on December 12, 2016. |
| (9) | This stock option fully vested on December 12, 2017. |
| (10) | This stock option fully vests on December 16, 2018, and 1/4 vests on the first anniversary of grant, with the balance vesting in monthly increments for 36 months following the first anniversary of grant. |
| (11) | This stock option fully vests on September 24, 2019, and 1/4 vests on the first anniversary of grant, with the balance vesting in monthly increments for 36 months following the first anniversary of grant. |
| (12) | This stock option fully vests on May 17, 2020, and 1/4 vests on the first anniversary of grant, with the balance vesting in monthly increments for 36 months following the first anniversary of grant. |
| (13) | This stock option fully vested on September 16, 2015. |
2017 Option Exercises and Stock Vested
None of our named executive officers exercised stock options or had RSU awards vest during 2017.
2016 Equity Incentive Plan and Share Option Plan
Our 2016 Equity Incentive Plan (the “2016 EIP”), which became effective on June 23, 2016, governs the terms of the stock options and RSU awards granted on and after June 23, 2016. The 2016 EIP provides that, in the event of a change of control merger, sale of all or substantially all of our assets or another change of control transaction, unless otherwise determined by our compensation committee, all outstanding awards will be subject to the agreement governing such merger, asset sale or other change of control transaction. Such agreement need not treat all such awards in an identical manner, and it will provide for one or more of the following with respect to each award: the continuation of the award, the assumption of the award, the substitution of the award or the payment of the excess of the fair market value of the shares of our common stock subject to the award over the exercise price or purchase price of such shares. In the event the successor corporation refuses to either assume, convert, replace or substitute awards, then unless otherwise determined by our compensation committee, all outstanding awards granted under the equity incentive plan will accelerate in full as of the time of consummation of such change in control transaction. In addition, in the event of a merger, sale of all or substantially all of our assets or another change of control transaction, the vesting of all awards granted to our non-employee directors will accelerate and such awards will become exercisable (as applicable) in full as of the time of consummation of such change in control transaction.
Our share option plan, under which we ceased granting stock options on June 23, 2016, governs the terms of the stock options granted prior to June 23, 2016. The share option plan provides for the acceleration of vesting of awards in connection with or following a change in control of the company. A “change in control” under the share option plan will be deemed to have occurred if (i) our board of directors passes a resolution to the effect that, for purposes of the share option plan, a change in control has occurred or (ii) any person or any group of two or more persons acting jointly or in concert becomes the beneficial owner, directly or indirectly, or acquires the right to control or direct, 25% or more of our outstanding voting securities or any successor entity in any manner, including without limitation as a result of a takeover bid or an amalgamation with any other corporation or any other business combination or reorganization. Also under our share option plan, stock options held by employees at the level of Vice President or above who are terminated by us without cause (as defined in the share option plan) will remain outstanding and continue to vest and be exercisable for two years following the termination date. In addition, under our share option plan, stock options held by employees who retire (as defined in the share option plan) will remain outstanding and continue to vest and be exercisable for the term of the stock option.
In addition, the Merger Agreement provides that at the Acceptance Time, each stock option that is outstanding, whether vested or unvested, will automatically terminate and be cancelled and will be converted into the right to receive, without interest, an amount in cash (less applicable tax withholdings) equal to the product of (a) the excess, if any, of the Offer Price over the exercise price per share of such option and (b) the number of shares subject to such option immediately prior to the Acceptance Time. No cash amount will be payable with respect to an option that has a per share exercise
64
Table of Contents
price that is equal to or greater than the Offer Price, and such option will be cancelled and terminated. Each holder of an option that is cancelled as provided in the Merger Agreement will cease to have any rights with respect thereto, except the right to receive the cash consideration, if any, described above.
In addition, the Merger Agreement provides that at the Acceptance Time, any vesting conditions applicable to each outstanding RSU will automatically accelerate in full and each RSU will terminate and be cancelled in exchange for the right to receive, without interest, an amount in cash (less applicable tax withholdings) equal to (a) the number of Shares subject to such RSU immediately prior to the Acceptance Time multiplied by (b) the Offer Price. Each holder of a RSU that is cancelled as provided in the Merger Agreement will cease to have any rights with respect thereto, except the right to receive the cash consideration described above.
Termination and Change of Control Agreements
Mr. Myers
We are a party to an offer letter dated March 23, 2016 with Mr. Myers, our president and chief executive officer. Our employment agreement with Mr. Myers provides that if at any time within 12 months following a change in control of Cascadian, his employment is terminated “without cause” or if he is “constructively terminated” (as those terms are defined in his employment agreement), he will be entitled to receive, in addition to amounts that have been earned prior to the termination date, the following severance payments and benefits:
| • | a lump sum payment of 18 months base salary, less required withholding; |
| • | a lump sum payment of one year’s equivalent of performance review bonus at target, less required withholding; |
| • | acceleration as to 100% of the then-unvested portion of his initial April 4, 2016 inducement stock option grant; and |
| • | 100% of the COBRA premium that would otherwise be due under our group health plan for 18 months following termination of employment. |
Additionally, if Mr. Myers’ employment is terminated without cause or constructively terminated (outside of a change of control of Cascadian), he will receive the following payments and benefits:
| • | a lump sum payment of 12 months base salary, less required withholding; |
| • | a lump sum payment of 50% of one year’s equivalent of performance review bonus at target, less required withholding; |
| • | acceleration as to 50% of the then-unvested portion of his initial inducement stock option grant; and |
| • | 100% of the COBRA premium that would otherwise be due under our group health plan for 12 months following termination of employment. |
Ms. Eastland, Mr. Christianson, and Dr. Peterson
We are a party to executive employment agreements dated May 17, 2016 with each of Ms. Eastland, our Chief Financial Officer, Chief Business Officer and Secretary, Mr. Christianson, our Chief Operating Officer, and Dr. Peterson, our Chief Scientific Officer.
Our employment agreements with Ms. Eastland, Mr. Christianson, and Dr. Peterson provide that if at any time within 12 months following a change in control of Cascadian, his or her employment is terminated “without cause” or by him or her with “good reason” (as those terms are defined in his or her employment agreement), he or she will be entitled to receive, in addition to amounts that have been earned prior to the termination date, the following severance payments and benefits:
| • | a lump sum payment of 18 months’ base salary; |
| • | a lump sum payment of one year’s equivalent of his or her performance review bonus at target; |
| • | acceleration of the unvested portion of all of his or her then outstanding equity awards; and |
| • | continued medical benefits for 18 months. |
65
Table of Contents
Additionally, if the employment of Ms. Eastland, Mr. Christianson or Dr. Peterson is terminated without cause or for good reason other than within 12 months following a change in control of Cascadian (as defined in the employment agreements), he or she will receive the following payments and benefits:
| • | a lump sum payment of nine months’ base salary; |
| • | a lump sum payment of a pro-rated target cash bonus (which, in the case of a termination without cause, cannot be less than 75% of the target bonus amount); and |
| • | continued medical benefits for nine months. |
Ms. Eastland, Mr. Christianson, and Dr. Peterson’s employment agreements provide that if any of the payments or benefits provided to him or her in connection with the change in control constitutes an “excess parachute payment” within the meaning of Section 280G of the Internal Revenue Code, such payments or benefits will be either (i) payable in full or (ii) reduced to the minimum extent necessary to ensure that no portion of the payments or benefits is subject to the excise tax imposed under Section 4999 of the Internal Revenue Code, whichever results in the receipt by him or her on an after-tax basis of the greatest amount of payments and benefits. All severance payments under these employment agreements are subject to him or her executing a release of claims in Cascadian’s favor and to his or her compliance with the non-disclosure and restrictive covenants contained in his or her confidentiality agreement.
66
Table of Contents
Dr. Walker
We are a party to an executive employment agreement dated May 17, 2016 with Dr. Walker, our Senior Vice President, Clinical Development. Our employment agreement with Dr. Walker provides that if at any time within 12 months following a change in control of Cascadian, his employment is terminated “without cause” or by him with “good reason” (as those terms are defined in his employment agreement), he will be entitled to receive, in addition to amounts that have been earned prior to the termination date, the following severance payments and benefits:
| • | a lump sum payment of 12 months’ base salary; |
| • | a lump sum payment of a portion of his “annual cash bonus” (as such term is defined in his employment agreement) determined by multiplying his target annual cash bonus amount by a fraction equal to the number of days of his employment during the applicable period divided by the total number of days in the applicable bonus performance period; |
| • | acceleration of the unvested portion of all of his then outstanding equity awards; and |
| • | continued medical benefits for 12 months. |
Additionally, if Dr. Walker’s employment is terminated without cause or for good reason other than within 12 months following a change in control of Cascadian (as defined in the employment agreement), he will receive the following payments and benefits:
| • | a lump sum payment of six months’ base salary; |
| • | a lump sum payment of a pro-rated target cash bonus; and |
| • | continued medical benefits for six months. |
Dr. Walker’s employment agreement provides that if any of the payments or benefits provided to him in connection with the change in control constitutes an “excess parachute payment” within the meaning of Section 280G of the Internal Revenue Code, such payments or benefits will be either (i) payable in full or (ii) reduced to the minimum extent necessary to ensure that no portion of the payments or benefits is subject to the excise tax imposed under Section 4999 of the Internal Revenue Code, whichever results in the receipt by him on an after-tax basis of the greatest amount of payments and benefits. All severance payments under this employment agreement are subject to Dr. Walker executing a release of claims in Cascadian’s favor and to his compliance with the non-disclosure and restrictive covenants contained in his confidentiality agreement.
In February 2018, our Compensation Committee has also approved amendments to the employment agreements of Mr. Myers, Ms. Eastland, Dr. Peterson, Mr. Christianson, and Dr. Walker to provide them with tax preparation services for three years following the Merger. The amendments only provide for such tax preparation services, and do not provide for any tax gross-up payments or any other tax-related entitlements.
Retention Payment Plan
In January 2016, we adopted a Retention Plan to provide cash retention payments to our named executive officers (other than our chief executive officer) and certain other employees to induce them to remain employed by us through the transition period for the appointment of a new chief executive officer. Any named executive officers who participated in the Retention Plan and (i) remained continuously employed by us through January 10, 2017 or (ii) were terminated by us other than for “cause” prior to January 10, 2017, were paid a lump-sum cash payment in an amount equal to eight months of their base salary effective as of January 10, 2016.
For purposes of the Retention Plan, “cause” means (i) failure or refusal by such named executive officer to substantially perform his or her duties (except where the failure results from incapacity due to disability); or (ii) severe misconduct or activity deemed detrimental to our interests, as further described in the Retention Plan.
67
Table of Contents
Payments to our named executive officers were made pursuant to the Retention Plan in January 2017 in the following amounts:
| Named Executive Officer |
Retention Payment |
|||
| Julia Eastland |
$ | 226,667 | ||
| Gary Christianson |
$ | 220,317 | ||
| Dr. Scott Peterson |
$ | 240,000 | ||
| Dr. Luke Walker |
$ | 123,015 | ||
Potential Payments Upon Termination or Change in Control
The tables below describe the payments and benefits our executive officers would be entitled to receive assuming the occurrence on December 31, 2017 of either a change of control transaction or termination of their employment without “cause” (as defined below). For additional details regarding the payments and benefits our named executive officers are entitled to, please see “— Termination and Change of Control Agreements” included elsewhere in this Annual Report on Form 10-K.
Mr. Myers
| Change of Control | Termination Other Than for Cause(3) | |||||||||||||||||||||||
| Name |
Equity Acceleration (1) |
Salary (2) |
Insurance Benefits |
Equity Acceleration (4) |
Salary (5) |
Insurance Benefits |
||||||||||||||||||
| Scott Myers(1) |
$ | — | $ | 1,200,000 | $ | 45,986 | $ | — | $ | 750,000 | $ | 30,657 | ||||||||||||
| (1) | The amount shown in this column is calculated as the spread value of 100% of unvested stock options subject to Mr. Myers’ initial April 4, 2016 inducement grant of stock options held by Mr. Myers on December 31, 2017, assuming a stock price of $3.70 per share, the last reported sale price of our common stock on The Nasdaq Global Market on December 29, 2017. |
| (2) | The amount shown in this column is a lump sum payment equal to 18 months of Mr. Myers’s base salary for 2016 plus one year’s equivalent of his performance review bonus at target. |
| (3) | For purposes of Mr. Myers offer letter, “cause” includes, among other things (a) willful engaging in illegal conduct or gross misconduct which is injurious to us, (b) being convicted of, or entering a plea of nolo contendere or guilty to, a felony or a crime of moral turpitude, (c) engaging in fraud, misappropriation, embezzlement or any other act or acts of dishonesty resulting or intended to result directly or indirectly in a gain or personal enrichment of her at our expense, (d) material breach of any of our written policies, or (e) willful and continual failure substantially to perform his duties. “Constructively terminated” means any of the following taken without Mr. Myers’ written consent, and subject to certain conditions: (a) a reduction of title, position, responsibilities, authority or duties to a level less than the title, position, responsibilities, authorities or duties occupied or possessed on the date immediately preceding such reduction, or a failure to be nominated to the board of directors; (b) a reduction in base salary, subject to certain exceptions; (c) requirement to be based at any office or location more than 50 miles from the office where Mr. Myers was employed on the date immediately preceding the date of such change in location; or (d) the company’s material breach of any provision of the offer letter. |
| (4) | The amount shown in this column is calculated as the spread value of 50% of unvested stock options subject to Mr. Myers’ initial April 4, 2016 inducement grant of stock options held by Mr. Myers on December 31, 2017, assuming a stock price of $3.70 per share, the last reported sale price of our common stock on The Nasdaq Global Market on December 29, 2017. |
| (5) | The amount shown in this column is a lump sum payment equal to Mr. Myers’s base salary for 2017 plus one year’s equivalent of his performance review bonus at 50% of target. |
68
Table of Contents
Ms. Eastland, Mr. Christianson, and Dr. Peterson
| Change of Control | Termination Other Than for Cause(3) | |||||||||||||||||||||||
| Name |
Equity Acceleration (1) |
Salary (2) |
Insurance Benefits |
Equity Acceleration (4) |
Salary (5) |
Insurance Benefits |
||||||||||||||||||
| Julia Eastland |
$ | — | $ | 666,000 | $ | 45,986 | $ | — | $ | 364,500 | $ | 22,993 | ||||||||||||
| Gary Christianson |
$ | — | $ | 611,379 | $ | 45,986 | $ | — | $ | 334,606 | $ | 22,993 | ||||||||||||
| Scott Peterson |
$ | — | $ | 666,000 | $ | 45,986 | $ | — | $ | 364,500 | $ | 22,993 | ||||||||||||
| (1) | The amount shown in this column is calculated as the spread value of all unvested stock options held by the named executive officer on December 31, 2017, assuming a stock price of $3.70 per share, the last reported sale price of our common stock on The Nasdaq Global Market on December 29, 2017. |
| (2) | The amount shown in this column is a lump sum payment equal to 18 months of the named executive officer’s base salary for 2017 plus one year’s equivalent of her performance review bonus at target. Such payments will be made within 60 days following a change of control, provided that, within 45 days of a change of control, the named executive officer signs a separation agreement in a form reasonably satisfactory to us, which shall include a general release of all claims against us. |
| (3) | For purposes of the named executive officer’s employment agreement, “cause” includes, among other things (a) willful engaging in illegal conduct or gross misconduct which is injurious to us, (b) being convicted of, or entering a plea of nolo contendere or guilty to, a felony or a crime of moral turpitude, (c) engaging in fraud, misappropriation, embezzlement or any other act or acts of dishonesty resulting or intended to result directly or indirectly in a gain or personal enrichment of her at our expense, (d) material breach of any of our written policies, or (e) willful and continual failure substantially to perform her duties, which failure has continued for a period of at least 30 days after written notice by us. “Good reason” means, subject to certain conditions, the occurrence of any of the following events without the named executive officer’s express prior written consent: (a) material diminution of job responsibilities as such responsibilities exist as of the effective date of the employment agreement, subject to certain exceptions; (b) the material reduction in salary, unless such reduction is part of a reduction in compensation for all employees of the company in general; or (c) relocation of principal office, or principal place of employment, to a location that is more than 50 miles from the principal office or principal place of employment. |
| (4) | Pursuant to the terms of our share option plan, there is no acceleration of vesting if the named executive officer is terminated without cause, but stock option vesting and exercisability will continue as described above under “—2016 Equity Incentive Plan”. |
| (5) | The amount shown in this column is a lump sum payment equal to nine months of the named executive officer’s base salary for 2017 plus nine month’s equivalent of her performance review bonus at target. |
Dr. Walker
| Change of Control | Termination Other Than for Cause(3) | |||||||||||||||||||||||
| Name |
Equity Acceleration (1) |
Salary (2) |
Insurance Benefits |
Equity Acceleration (4) |
Salary (5) |
Insurance Benefits |
||||||||||||||||||
| Luke Walker |
$ | — | $ | 499,500 | $ | 21,115 | $ | — | $ | 249,750 | $ | 10,558 | ||||||||||||
| (1) | The amount shown in this column is calculated as the spread value of all unvested stock options held by Dr. Walker on December 31, 2017, assuming a stock price of $3.70 per share, the last reported sale price of our common stock on The Nasdaq Global Market on December 29, 2017. |
| (2) | The amount shown in this column is a lump sum payment equal to Dr. Walker’s base salary for 2017 plus one year’s equivalent of his performance review bonus at target. Such payments will be made within 60 days following a change of control, provided that, within 45 days of a change of control, Dr. Walker signs a separation agreement in a form reasonably satisfactory to us, which shall include a general release of all claims against us. |
| (3) | For purposes of Dr. Walker’s employment agreement, “cause” includes, among other things (a) willful engaging in illegal conduct or gross misconduct which is injurious to us, (b) being convicted of, or entering a plea of nolo contendere or guilty to, a felony or a crime of moral turpitude, (c) engaging in fraud, misappropriation, embezzlement or any other act or acts of dishonesty resulting or intended to result directly or indirectly in a gain or personal enrichment of his at our expense, (d) material breach of any of our written policies or (e) willful and continual failure substantially to perform his duties, which failure has continued for a period of at least 30 days after written notice by us. “Good reason” means, subject to certain conditions, the occurrence of any of the following events without Dr. Walker’s express prior written consent: (a) material diminution of job responsibilities as such responsibilities exist as of the effective date of the employment agreement, subject to certain exceptions; (b) the material reduction in salary, unless such reduction is part of a reduction in compensation for all employees of the company in general; or (c) relocation of principal office, or principal place of employment, to a location that is more than 50 miles from the principal office or principal place of employment. |
69
Table of Contents
| (4) | Pursuant to the terms of our share option plan, there is no acceleration of vesting if Dr. Walker is terminated without cause, but stock option vesting and exercisability will continue as described above under “—2016 Equity Incentive Plan”. |
| (5) | The amount shown in this column is a lump sum payment equal to six months of Dr. Walker’s base salary for 2017, 50% of his performance review bonus at target. |
2018 Merger Agreement
We entered into an Agreement and Plan of Merger (the Merger Agreement) with Seattle Genetics, Inc., on January 30, 2018, as described under the heading titled “Item 1 — Business — Overview — “2018 Merger Agreement” elsewhere in this Annual Report on Form 10-K which is described under. The Merger Agreement provides that at the Acceptance Time (as defined in the Merger Agreement), each option that is outstanding, whether vested or unvested, will automatically terminate and be cancelled and will be converted into the right to receive, without interest, an amount in cash (less applicable tax withholdings) equal to the product of (a) the excess, if any, of $10 over the exercise price per share of such option and (b) the number of shares subject to such option immediately prior to the Acceptance Time. No cash amount will be payable with respect to an Option that has a per share exercise price that is equal to or greater than the Offer Price, and such Option will be cancelled and terminated. Each holder of an Option that is cancelled as provided in the Merger Agreement will cease to have any rights with respect thereto, except the right to receive the cash consideration, if any, described above.
The table set forth below provides information regarding the options held by our named executive officers as of March 8, 2018, based on the offer price of $10 per share. The values shown were calculated assuming that all options held by each individual as of the date hereof remain unexercised at the assumed closing date of the Merger.
| Name |
Number of Options |
Value of Options |
||||||
| Scott D. Myers |
724,810 | $ | 2,765,445 | |||||
| Gary W. Christianson |
269,203 | $ | 812,280 | |||||
| Julia M. Eastland |
291,203 | $ | 880,182 | |||||
| Scott R. Peterson |
287,036 | $ | 833,000 | |||||
| Luke N. Walker |
127,936 | $ | 579,057 | |||||
The Merger Agreement also provides that at the Acceptance Time, any vesting conditions applicable to each outstanding RSU will automatically accelerate in full and each RSU will terminate and be cancelled in exchange for the right to receive, without interest, an amount in cash (less applicable tax withholdings) equal to (a) the number of shares subject to such RSU immediately prior to the Acceptance Time multiplied by (b) $10. Each holder of a RSU that is cancelled as provided in the Merger Agreement will cease to have any rights with respect thereto, except the right to receive the cash consideration described above. The table set forth below
The table set forth below provides information regarding the RSUs held by our named executive officers as of March 8, 2018, based on the offer price of $10 per share.
| Name |
Number of RSUs | Value of RSUs | ||||||
| Scott D. Myers |
303,300 | $ | 3,033,000 | |||||
| Gary W. Christianson |
187,975 | $ | 1,879,750 | |||||
| Julia M. Eastland |
223,975 | $ | 2,239,750 | |||||
| Scott R. Peterson |
177,975 | $ | 1,779,750 | |||||
| Luke N. Walker |
147,850 | $ | 1,478,500 | |||||
In connection with the Merger, our compensation committee approved amendments to the confidentiality agreements of our named executive officers to bind each named executive officer to a two-year covenant not to compete with us. Mr. Myers had not previously been subject to a non-compete covenant, and our other named executive officers had previously been subject to a one-year non-compete covenant. Contingent upon the execution of the two-year covenant not to compete, Mr. Myers, Ms. Eastland and Dr. Walker are eligible to receive transaction bonuses, subject to the completion of the Merger, for their efforts associated with leading Cascadian to the signing of the Merger Agreement and
70
Table of Contents
in ultimately consummating the Merger. The transaction bonuses are in the following amounts: Mr. Myers–$3,920,000; Ms. Eastland–$793,800; and Dr. Walker–$266,700. Our compensation committee considered whether to offer transaction bonuses, and based on the recommendation of Cascadian’s independent compensation consultant, it found the award of these transaction bonuses to be appropriate contingent upon the execution of a two-year covenant not to compete and given the additional services Mr. Myers, Ms. Eastland, and Dr. Walker performed in connection with evaluating the proposed Merger and other alternatives available to Cascadian, negotiations and discussions related to the Merger, and the signing of the Merger Agreement. The form of agreement setting forth the terms of the transaction bonuses has also been approved by our compensation committee.
CEO Pay Ratio
Following is a reasonable estimate, prepared under applicable SEC rules, of the ratio of the annual total compensation of our CEO to the median of the annual total compensation of our other employees. We determined our median employee based on W-2 wages (annualized in the case of full- and part-time employees who joined us during 2017) of each of our 71 employees (excluding the CEO) as of December 31, 2017.
Total annual compensation includes, among other things, base salary, cash bonuses, equity awards (based on the grant date fair value of awards granted during 2017), perquisites, company contributions to our 401K plan, and insurance premiums paid by the Company. Mr. Myers had a fiscal 2017 total compensation of $1,975,864, as reflected in the Summary Compensation Table included in this Annual Report on Form 10-K. The median annual compensation for our median employee (excluding our CEO), was $176,658 for 2017. Based on the foregoing, our estimate of the ratio of the annual total compensation of our CEO to the median of the annual total compensation of all other employees was 11 to 1. Given the different methodologies that various public companies will use to determine an estimate of their pay ratio, the estimated ratio reported above should not be used as a basis for comparison between companies.
Compensation of Directors
During 2017, we paid our non-employee directors an annual cash fee of $50,000 for their service on our board of directors and its committees. Fees were paid quarterly and are prorated over the period based on the non-employee director’s service. We also paid the chairman of our board of directors an additional annual fee of $50,000, the chairman of our audit committee an additional annual fee of $25,000 and the chairmen of our other standing committees of our board of directors an additional annual fee of $5,000 each. Beginning in March 2017, we paid our non-employee directors the following annual cash retainers for committee service during 2017:
| Committee |
Chair | Member | ||||||
| Audit Committee |
$ | 25,000 | $ | 7,500 | ||||
| Compensation Committee |
15,000 | 5,000 | ||||||
| Corporate Governance and Nominating Committee |
7,500 | 3,750 | ||||||
In addition, each non-employee director was entitled to receive an annual RSU award equal to the greater of (i) 1,250 shares or (ii) $50,000 divided by the closing price of our common stock on the Nasdaq Global Market on the date of grant, and an initial restricted share unit grant upon joining the board of directors equal to the greater of (i) 1,250 shares or (ii) $50,000 divided by the closing price of our common stock on The Nasdaq Global Market on the date of grant. We also reimbursed our non-employee directors for travel and other necessary business expenses incurred in the performance of their services for us.
2017 Director Compensation Table
The following table sets forth compensation information for our non-employee directors for the year ended December 31, 2017. All compensation numbers are expressed in U.S. dollars.
| Name |
Fees Earned or Paid in Cash ($) |
Stock Awards ($) (1)(2)(3) |
Total ($) | |||||||||
| Christopher Henney |
$ | 111,104 | $ | 50,000 | $ | 161,104 | ||||||
| Daniel Spiegelman |
78,052 | 50,000 | 128,052 | |||||||||
| Gwen Fyfe |
50,000 | 50,000 | 100,000 | |||||||||
| Ted W. Love |
69,243 | 50,000 | 119,243 | |||||||||
| Steven James |
60,174 | 50,000 | 110,174 | |||||||||
| Robert Azelby |
40,462 | 100,000 | 140,462 | |||||||||
71
Table of Contents
| (1) | The amounts in this column represent the aggregate grant date fair value of the RSU awards granted in 2017. |
| (2) | As of December 31, 2017, our non-employee directors held the following outstanding equity awards: Dr. Henney (25,000 options, 13,927 RSUs); Mr. Spiegelman (13,927 RSUs); Dr. Fyfe (13,927 RSUs); Dr. Love (13,927 RSUs); Mr. James (13,927 RSUs) and Mr. Azelby (26,364 RSUS). |
| (3) | Each RSU award may be converted into one share of our common stock at the end of the grant period, which is one year for each of the RSU awards granted. |
| ITEM 12. | Security Ownership of Certain Beneficial Owners and Management and Related Stockholder Matters |
Equity Compensation Plan Information as of December 31, 2017
The following table sets forth the securities authorized for issuance under Cascadian’s equity compensation plans.
| Plan Category |
(A) Number of Securities to be Issued Upon Exercise of Outstanding Options, Warrants and Rights |
(B) Weighted Average Exercise Price of Outstanding Options, Warrants and Rights (1) |
(C) Number of Securities Remaining Available for Future Issuance Under Equity Compensation Plans (Excluding Securities Reflected in Column (A)) |
|||||||||
| Equity compensation plans approved by security holders |
3,119,551 | $ | 9.02 | 5,723,523 | ||||||||
| Equity compensation plans not approved by security holders (2) |
474,810 | 7.08 | — | |||||||||
| Total |
3,594,361 | 8.73 | 5,723,523 | |||||||||
| (1) | The weighted average exercise price relates solely to outstanding stock option shares because shares subject to RSUs have no exercise price. |
| (2) | Represents the inducement award granted to our Chief Executive Officer in April 2016. |
For more information regarding our 2016 EIP, see Note 7 to our consolidated financial statements included elsewhere in this Annual Report on Form 10-K.
Security Ownership of Certain Beneficial Owners and Management
The following table sets forth certain information regarding beneficial ownership of our capital stock as of February 28, 2018 by (i) each person known by us to be the beneficial owner of more than 5% of any class of our voting securities, (ii) each of our directors, (iii) each of our named executive officers and (iv) our directors and executive officers as a group, including shares they had the right to acquire within 60 days after February 28, 2018. Beneficial ownership excludes stockholders of Series A convertible preferred stock, Series B convertible preferred stock and Series C convertible preferred stock, each of which are convertible into 166.67 shares of the Company’s common stock at any time at the holder’s option, provided the holder would not beneficially own in the aggregate more than 4.99%, 4.99% or 9.99% of the company’s securities, respectively, subject to an exception that may permit beneficial ownership up to 19.99% upon 61 day’s written notice.
72
Table of Contents
| Common Stock Beneficially Owned | ||||||||
| Name of Beneficial Owner(1) |
Number of Shares(2) | Percent of Class(3) | ||||||
| 5% Stockholders: |
||||||||
| New Enterprise Associates (4) |
10,882,574 | 19.67% | ||||||
| The Baupost Group, L.L.C.(5) |
8,721,079 | 15.77% | ||||||
| BVF, Inc.(7) |
6,008,279 | 10.86% | ||||||
| Redmile (6) |
4,250,000 | 7.68% | ||||||
| EcoR1 Capital Fund (8) |
3,000,000 | 5.42% | ||||||
| Directors and Named Executive Officers: |
||||||||
| Christopher Henney(9) |
85,185 | * | ||||||
| Steven James(10) |
13,677 | * | ||||||
| Ted W. Love(11) |
37,394 | * | ||||||
| Daniel Spiegelman(12) |
21,006 | * | ||||||
| Robert Azelby (13) |
9,328 | * | ||||||
| Gwen Fyfe(14) |
10,125 | * | ||||||
| Scott Myers(15) |
353,569 | * | ||||||
| Gary Christianson(16) |
133,292 | * | ||||||
| Julia Eastland(17) |
142,674 | * | ||||||
| Scott Peterson(18) |
143,355 | * | ||||||
| Luke Walker(19) |
47,110 | * | ||||||
| All directors and executive officers as a group (11 persons)(20) |
996,715 | 1.97% | ||||||
| * | Represents less than 1% of class or combined classes. |
| (1) | Except as otherwise indicated, the address of each stockholder identified is c/o Cascadian Therapeutics, Inc., 3101 Western Avenue, Suite 600, Seattle, Washington 98121. Except as indicated in the other footnotes to this table, each person named in this table has sole voting and investment power with respect to all shares of stock beneficially owned by that person. |
| (2) | Options, RSUs and warrants exercisable within 60 days after February 28, 2018 and shares of preferred stock convertible within 60 days after February 28, 2018 are deemed outstanding for the purposes of computing the percentage of shares owned by that person but are not deemed outstanding for purposes of computing the percentage of shares owned by any other person. |
| (3) | Based on 55,312,923 shares of common stock issued and outstanding as of February 28, 2018. |
| (4) | Based on information of beneficial ownership as of December 31, 2017, included in a Form 4 filed with the SEC on February 22, 2018. Growth Equity Opportunities Fund IV, LLC, New Enterprise Associates 15, L.P., NEA Partners 15, L.P., NEA 15 GP, LLC, Peter J. Barris, Forest Baskett, Anthony A. Florence, Jr., Joshua Makower, David M. Mott, Jon M. Sakoda, Scott D. Sandell, Peter W. Sonsini and Ravi Viswanathan share voting and investment power over the shares. The address of New Enterprise Associates is 1954 Greenspring Drive, Suite 600, Timonium, MD 21093. |
| (5) | Based on information of beneficial ownership as of December 31, 2017, included in a Schedule 13G/A filed with the SEC on February 13, 2018. The Baupost Group, L.L.C., SAK Corporation and Seth A. Klarman share voting and investment control over the shares. The address of The Baupost Group, L.L.C. is 10 St. James Avenue, Boston, Massachusetts 02116. |
| (6) | Based on information of beneficial ownership as of December 31, 2017, included in a Schedule 13G/A filed with the SEC on April 14, 2017. The address of Redmile is Golden Gate National Recreation Area, 1 Letterman Dr., San Francisco, California 94129. |
| (7) | Based on information of beneficial ownership as of December 31, 2017, included in a Schedule 13D/A filed with the SEC on February 2, 2017. Includes 3,133,224 shares of common stock beneficially owned by BVF Inc. and various affiliated entities and one individual. BVF Partners L.P. is the general partner of Biotechnology Value Fund, L.P. and Biotechnology Value Fund II, L.P., the sole member of BVF Partners OS Ltd. and the investment manager of Biotechnology Value Trading Fund OS, L.P. and of certain management accounts, each of which may be deemed to beneficially own the shares. Mark Lampert is the sole officer and director of BVF Inc. and may be deemed to beneficially own the shares. Excludes 833,332 shares issuable upon the exercise of warrants, 1,250,022 shares issuable upon the conversion of Series C convertible preferred stock, 888,851 shares issuable upon the conversion of Series B convertible preferred stock and 416,673 shares issuable upon the conversion of Series A convertible preferred stock, none of which can be exercised or converted within 60 days of February 28, 2017. The address of BVF Inc. is 1 Sansome Street, 30th Floor, San Francisco, California 94104. |
| (8) | Based on information of beneficial ownership as of December 31, 2017, included in a Schedule 13G/A filed with the SEC on April 14, 2017. The address of EcoR1 Capital Fund is 409 Illinois St., San Francisco, California 94158. |
73
Table of Contents
| (9) | Includes 25,000 shares of common stock that Dr. Henney has the right to acquire under outstanding options exercisable within 60 days after February 28, 2018. Shares attributable to restricted stock units owned by Dr. Henney are not reflected as none of the shares underlying the restricted stock units have vested or will vest within 60 days after February 28, 2018. |
| (10) | Shares attributable to restricted stock units owned by Mr. James are not reflected as none of the shares underlying the RSUs have vested or will vest within 60 days after February 28, 2018. |
| (11) | Shares attributable to restricted stock units owned Dr. Love are not reflected as none of the shares underlying the RSUs have vested or will vest within 60 days after February 28, 2018. |
| (12) | Shares attributable to restricted stock units owned by Mr. Spiegelman are not reflected as none of the shares underlying the RSUs have vested or will vest within 60 days after February 28, 2018. |
| (13) | Includes shares attributable to restricted stock units will be owned by Mr. Azelby that will vest on April 3, 2018. |
| (14) | Shares attributable to restricted stock units owned by Dr. Fyfe are not reflected as none of the shares underlying the RSUs have vested or will vest within 60 days after February 28, 2018. |
| (15) | Includes 296,782 shares of common stock that Mr. Myers has the right to acquire under outstanding options exercisable within 60 days after February 28, 2018. |
| (16) | Includes 126,777 shares of common stock that Mr. Christianson has the right to acquire under outstanding options exercisable within 60 days after February 28, 2018. |
| (17) | Includes 137,437 shares of common stock that Ms. Eastland has the right to acquire under outstanding options exercisable within 60 days after February 28, 2018. |
| (18) | Includes 139,719 shares of common stock that Dr. Peterson has the right to acquire under outstanding options exercisable within 60 days after February 28, 2018 |
| (19) | Includes 36,795 shares of common stock that Dr. Walker has the right to acquire under outstanding options exercisable within 60 days after February 28, 2018. |
| (20) | Includes 762,507 shares of common stock issuable upon exercise of options within 60 days after February 28, 2018 and 9,328 shares of common stock that would be fully vested and issuable upon the vesting of RSUs within 60 days after February 28, 2018. |
We entered into an Agreement and Plan of Merger with Seattle Genetics, Inc., on January 30, 2018, as described under the heading titled “Item 1 — Business — Overview — “2018 Merger Agreement” elsewhere in this Annual Report on Form 10-K.
| ITEM 13. | Certain Relationships and Related Transactions and Director Independence |
Certain Relationships and Related Transactions
We have entered into the arrangements which are described where required under the heading titled “ Item 11 — Executive Compensation — “Termination and Change of Control Provisions under Offer Letters” and “Item 11 — Executive Compensation — Potential Payments Upon Termination or Change in Control” included elsewhere in this Annual Report on Form 10-K.
In January 2017, we closed an underwritten offering of 26,659,300 shares of our common stock at a price of $3.30 per share, for gross proceeds of $88.0 million, and 1,818 shares of our Series E convertible preferred stock at a price of $3,300 per share for gross proceeds of $6.0 million. In this offering, affiliates of New Enterprise Associates, a holder of more than 5% of our outstanding common stock, purchased 1,818 shares of our Series E preferred stock for an aggregate purchase price of $6.0 million.
In December 2017, we entered into an agreement with CTI BioPharma, Corp (CTI) to sublease property located at 3101 Western Avenue, Seattle, Washington. BVF, a holder of more than 5% of our outstanding common stock, is a greater than 10% stockholder of CTI, and Mr. Lampert, who resigned from our board of directors in January 2017, may be deemed to be a beneficial owner of BVF.
Approval of Related Party Transactions
We have adopted a formal, written policy that our executive officers, directors (including director nominees), holders of more than 5% of any class of our voting securities, or any member of the immediate family of or any entities affiliated with any of the foregoing persons, are not permitted to enter into a related party transaction with us without the prior approval or, in the case of pending or ongoing related party transactions, ratification of our audit committee. For purposes of our policy, a related party transaction is a transaction, arrangement or relationship where the company was, is or will be involved and in which a related party had, has or will have a direct or indirect material interest. Certain transactions with related parties, however, are excluded from the definition of a related party transaction including, but not limited to (1) transactions involving the purchase or sale of products or services in the ordinary course of business, not exceeding
74
Table of Contents
$120,000, (2) transactions where a related party’s interest derives solely from his or her service as a director of another entity that is a party to the transaction, (3) transactions where a related party’s interest derives solely from his or her ownership of less than 10% of the equity interest in another entity that is a party to the transaction, and (4) transactions where a related party’s interest derives solely from his or her ownership of a class of our equity securities and all holders of that class received the same benefit on a pro rata basis. No member of the audit committee may participate in any review, consideration or approval of any related party transaction where such member or any of his or her immediate family members is the related party. In approving or rejecting the proposed agreement, our audit committee shall consider the relevant facts and circumstances available and deemed relevant to the audit committee, including, but not limited to (1) the benefits and perceived benefits to the company, (2) the materiality and character of the related party’s direct and indirect interest, (3) the availability of other sources for comparable products or services, (4) the terms of the transaction, and (5) the terms available to unrelated third parties under the same or similar circumstances. In reviewing proposed related party transactions, the audit committee will only approve or ratify related party transactions that are in, or not inconsistent with, the best interests of the company and our stockholders.
Determinations Regarding Director Independence
Our board of directors has determined that each of our current directors, except Mr. Myers and Dr. Fyfe, is an “independent director” as that term is defined by the applicable rules and regulations of The Nasdaq Stock Market. The independent directors generally meet in executive session at each quarterly board of directors’ meeting.
Our board of directors has also determined that each member of the audit committee, the compensation committee, and the corporate governance and nominating committee meets the independence standards applicable to those committees prescribed by the applicable rules and regulations of The Nasdaq Stock Market, the SEC, and the Internal Revenue Service.
Our board of directors has determined that Mr. Spiegelman, the chairman of the audit committee, is an “audit committee financial expert” as that term is defined in Item 407(d)(5) of Regulation S-K promulgated by the SEC.
| ITEM 14. | Principal Accountant Fees and Services |
Audit Fees
Fees and related expenses for the 2017 audit by Ernst & Young LLP of our annual financial statements, its review of the financial statements included in our 2017 quarterly reports and other services, which include comfort letters, consents and accounting consultations that are provided in connection with statutory and regulatory filings totaled $517,885. Fees and related expenses for 2016 totaled $592,002.
Audit-Related Fees
None.
Tax Fees
None.
All Other Fees
Ernst & Young LLP billed us $1,995 for each of the years 2017 and 2016 for a subscription to their technical accounting database.
Policy on Audit Committee Pre-Approval of Fees
In its pre-approval policy, the audit committee has authorized our chief executive officer or our chief financial officer to engage the services of Ernst & Young LLP with respect to the following:
| • | audit related services that are outside the scope of our annual audit and generally are (1) required on a project, recurring, or on a one-time basis, (2) requested by one of our business partners (for example, a review or audit of royalty payments), or (3) needed by us to assess the impact of a proposed accounting standard; |
75
Table of Contents
| • | audits of the annual statutory financial statements required by the non-U.S. governmental agencies for our overseas subsidiaries; |
| • | accounting services related to potential or actual acquisitions or investment transactions that if consummated would be reflected in our financial results or tax returns (this does not include any due diligence engagements, which must be pre-approved by the audit committee separately); and |
| • | other accounting and tax services, such as routine consultations on accounting and/or tax treatments for contemplated transactions. |
Notwithstanding this delegation of authorization, the audit committee pre-approves all audit and non-audit related services performed by Ernst & Young LLP. On an annual basis prior to the completion of the audit, the audit committee will review a listing prepared by management of all proposed non-audit services to be performed by the external auditor for the upcoming fiscal year, such listing to include scope of activity and estimated budget amount. The audit committee, if satisfied with the appropriateness of the services, will provide pre-approval of such services. If non-audit services are required subsequent to the annual pre-approval of services, management will seek approval of such services at the next regularly scheduled audit committee meeting. If such services are required prior to the next audit committee meeting, management will confer with the audit committee chairman regarding either conditional approval subject to full audit committee ratification or the necessity to reconvene a meeting. The audit committee has considered the non-audit services provided to us by our independent registered public accountants and has determined that the provision of such services is compatible with their independence.
All audit-related, tax and other fees were approved by the audit committee.
| ITEM 15. | Exhibits and Financial Statement Schedules |
| (a) | The following documents are filed as part of this Annual Report on Form 10-K: |
1. Financial Statements:
Our consolidated financial statements are contained in Item 8 of this annual report on Form 10-K.
2. Financial Statement Schedules:
All financial statement schedules have been omitted because the required information is either included in the financial statements or notes thereto, or is not applicable.
3. Exhibits:
The exhibits required by Item 601 of Regulation S-K are listed in paragraph (b) below.
76
Table of Contents
| (b) | Exhibits: |
The following exhibits are filed herewith or are incorporated by reference to exhibits previously filed with the SEC:
77
Table of Contents
78
Table of Contents
| Incorporated by Reference | ||||||||||||
| Exhibit Number |
Description |
Form |
File No. |
Exhibit |
Filing Date |
Filed Herewith | ||||||
| 10.20* | Form of Amendment to Employee Confidentiality, Invention Assignment and Non-Compete Agreements. | 8-K | 001-33882 | 10.2 | February 7, 2018 | |||||||
| 10.21* | Amendment to Scott Myers Confidentiality Agreement. | 8-K | 001-33882 | 10.3 | February 7, 2018 | |||||||
| 10.22* | Form of Amendment to Executive Employment Agreements. | 8-K | 001-33882 | 10.4 | February 7, 2018 | |||||||
| 10.23* | Form of Transaction Bonus Agreement. | 8-K | 001-33882 | 10.5 | February 7, 2018 | |||||||
| 21.1 | Subsidiaries of Cascadian Therapeutics, Inc. | X | ||||||||||
| 23.1 | Consent of Independent Registered Public Accounting Firm. | X | ||||||||||
| 31.1 | Rule 13a-14(a) / 15d-14(a) Certification of the Principal Executive Officer. | X | ||||||||||
| 31.2 | Rule 13a-14(a) / 15d-14(a) Certification of the Principal Financial Officer. | X | ||||||||||
| 32.1+ | Section 1350 Certification of the Principal Executive Officer. | X | ||||||||||
| 32.2+ | Section 1350 Certification of the Principal Financial Officer. | X | ||||||||||
| 101.INS | XBRL Instance Document. | X | ||||||||||
| 101.SCH | XBRL Taxonomy Extension Schema Document. | X | ||||||||||
| 101.CAL | XBRL Taxonomy Extension Calculation Linkbase Document. | X | ||||||||||
| 101.DEF | XBRL Taxonomy Extension Definition Linkbase Document. | X | ||||||||||
| 101.LAB | XBRL Taxonomy Extension Labels Linkbase Document. | X | ||||||||||
| 101.PRE | XBRL Taxonomy Extension Presentation Linkbase Document. | X | ||||||||||
| * | Indicates a management contract or compensatory plan or arrangement. |
| † | Pursuant to a request for confidential treatment, portions of this Exhibit have been redacted from the publicly filed document and have been furnished separately to the Securities and Exchange Commission as required by Rule 24b-2 under the Securities Exchange Act of 1934. |
| + | This certification is deemed not filed for purposes of section 18 of the Securities Exchange Act of 1934, as amended, or Exchange Act, or otherwise subject to the liability of that section, nor shall it be deemed incorporated by reference into any filing under the Securities Act of 1933, as amended, or Securities Act, or the Exchange Act, irrespective of any general incorporation language contained in such filing. |
| ITEM 16. | Form 10-K Summary |
None.
79
Table of Contents
Pursuant to the requirements of Section 13 or 15(d) of the Securities Exchange Act of 1934, the Registrant has duly caused this Report to be signed on its behalf by the undersigned, thereunto duly authorized in the City of Seattle, County of King, State of Washington on March 8, 2018.
| CASCADIAN THERAPEUTICS INC. | ||
| By: | /s/ Scott D. Myers | |
| Scott D. Myers, | ||
| President and Chief Executive Officer (Principal Executive Officer) | ||
POWER OF ATTORNEY
Each person whose signature appears below hereby constitutes and appoints Christopher Henney, Ph.D and Julia M. Eastland and each of them, his or her true and lawful attorneys-in-fact and agents, with full power to act without the other and with full power of substitution and resubstitution, to execute in his or her name and on his or her behalf, individually and in each capacity stated below, any and all amendments and supplements to this Report, and any and all other instruments necessary or incidental in connection herewith, and to file the same with the Commission.
Pursuant to the requirements of the Securities Exchange Act of 1934, this Report has been signed below by the following persons on behalf of the Registrant and in the capacities and on the dates indicated.
| Signature |
Title |
Date | ||
| /s/ Scott D. Myers | President and Chief Executive Officer (Principal Executive Officer) | March 8, 2018 | ||
| Scott D. Myers | ||||
| /s/ Julia M. Eastland | Chief Financial Officer, Chief Business Officer and Secretary (Principal Financial and Accounting Officer) | March 8, 2018 | ||
| Julia M. Eastland | ||||
| /s/ Christopher S. Henney, Ph.D. | Director | March 8, 2018 | ||
| Christopher S. Henney, Ph.D. | ||||
| /s/ Gwen A. Fyfe, M.D. | Director | March 8, 2018 | ||
| Gwen A. Fyfe, M.D. | ||||
| /s/ Steven P. James | Director | March 8, 2018 | ||
| Steven P. James | ||||
| /s/ Ted W. Love, M.D. | Director | March 8, 2018 | ||
| Ted W. Love, M.D. | ||||
| /s/ Daniel K. Spiegelman | Director | March 8, 2018 | ||
| Daniel K. Spiegelman | ||||
| /s/ Robert W. Azelby |
Director | March 8, 2018 | ||
| Robert W. Azelby |
||||
80
Table of Contents
INDEX TO CONSOLIDATED FINANCIAL STATEMENTS
F-1
Table of Contents
REPORT OF INDEPENDENT REGISTERED PUBLIC ACCOUNTING FIRM
To the Stockholders and the Board of
Directors of Cascadian Therapeutics, Inc.
Opinion on the Financial Statements
We have audited the accompanying consolidated balance sheets of Cascadian Therapeutics, Inc. as of December 31, 2017 and 2016, the related consolidated statements of operations, comprehensive loss, stockholders’ equity and cash flows for each of the three years in the period ended December 31, 2017, and the related notes (collectively referred to as the “consolidated financial statements”). In our opinion, the consolidated financial statements present fairly, in all material respects, the financial position of the Company at December 31, 2017 and 2016, and the results of its operations and its cash flows for each of the three years in the period ended December 31, 2017, in conformity with U.S. generally accepted accounting principles.
We also have audited, in accordance with the standards of the Public Company Accounting Oversight Board (United States) (PCAOB), the Company’s internal control over financial reporting as of December 31, 2017, based on criteria established in Internal Control-Integrated Framework issued by the Committee of Sponsoring Organizations of the Treadway Commission (2013 framework) and our report dated March 8, 2018 expressed an unqualified opinion thereon.
Basis for Opinion
These financial statements are the responsibility of the Company’s management. Our responsibility is to express an opinion on the Company’s financial statements based on our audits. We are a public accounting firm registered with the PCAOB and are required to be independent with respect to the Company in accordance with the U.S. federal securities laws and the applicable rules and regulations of the Securities and Exchange Commission and the PCAOB.
We conducted our audits in accordance with the standards of the PCAOB. Those standards require that we plan and perform the audit to obtain reasonable assurance about whether the financial statements are free of material misstatement, whether due to error or fraud. Our audits included performing procedures to assess the risks of material misstatement of the financial statements, whether due to error or fraud, and performing procedures that respond to those risks. Such procedures included examining, on a test basis, evidence regarding the amounts and disclosures in the financial statements. Our audits also included evaluating the accounting principles used and significant estimates made by management, as well as evaluating the overall presentation of the financial statements. We believe that our audits provide a reasonable basis for our opinion.
/s/ Ernst & Young LLP
We have served as the Company’s auditor since 2010.
Seattle, Washington
March 8, 2018
F-2
Table of Contents
CASCADIAN THERAPEUTICS, INC.
(In thousands, except share and per share amounts)
| As of December 31, | ||||||||
| 2017 | 2016 | |||||||
| ASSETS | ||||||||
| Current: |
||||||||
| Cash and cash equivalents |
$ | 16,777 | $ | 13,721 | ||||
| Short-term investments |
76,500 | 49,084 | ||||||
| Accounts and other receivables |
344 | 238 | ||||||
| Prepaid and other current assets |
1,218 | 1,411 | ||||||
|
|
|
|
|
|||||
| Total current assets |
94,839 | 64,454 | ||||||
| Long-term investments |
7,711 | — | ||||||
| Property and equipment, net |
656 | 1,402 | ||||||
| Goodwill |
16,659 | 16,659 | ||||||
| Other assets |
960 | 750 | ||||||
|
|
|
|
|
|||||
| Total assets |
$ | 120,825 | $ | 83,265 | ||||
|
|
|
|
|
|||||
| LIABILITIES AND STOCKHOLDERS’ EQUITY | ||||||||
| Current: |
||||||||
| Accounts payable |
$ | 2,246 | $ | 824 | ||||
| Accrued and other liabilities |
6,085 | 3,323 | ||||||
| Accrued compensation and related liabilities |
3,073 | 4,274 | ||||||
| Current portion of restricted share unit liability |
355 | 352 | ||||||
|
|
|
|
|
|||||
| Total current liabilities |
11,759 | 8,773 | ||||||
| Other liabilities |
— | 105 | ||||||
| Class UA preferred stock, 12,500 shares authorized, 12,500 shares issued and
|
30 | 30 | ||||||
| Commitments and contingencies |
||||||||
| Stockholders’ equity: |
||||||||
| Preferred stock, $0.0001 par value; 10,000,000 shares authorized as of December 31, 2017 and 2016; Series A Convertible Preferred Stock – 2,500 shares and 10,000 shares issued and outstanding as of December 31, 2017 and 2016, respectively; Series B Convertible Preferred Stock – 5,333 shares issued and outstanding as of December 31, 2017 and 2016; Series C Convertible Preferred Stock – 7,500 shares issued and outstanding as of December 31, 2017 and 2016; Series D Convertible Preferred Stock – 17,250 shares issued and outstanding as of December 31, 2017 and 2016; Series E Convertible Preferred Stock – 1,818 shares and zero shares issued and outstanding as of December 31, 2017 and 2016, respectively |
— | — | ||||||
| Common stock, $0.0001 par value; 130,000,000 shares and 66,666,667 shares authorized as of December 31, 2017 and 2016, respectively; 50,598,611 shares and 22,562,640 shares issued and outstanding as of December 31, 2017 and 2016, respectively |
353,852 | 353,849 | ||||||
| Additional paid-in capital |
389,637 | 297,922 | ||||||
| Accumulated deficit |
(629,268 | ) | (572,334 | ) | ||||
| Accumulated other comprehensive loss |
(5,185 | ) | (5,080 | ) | ||||
|
|
|
|
|
|||||
| Total stockholders’ equity |
109,036 | 74,357 | ||||||
|
|
|
|
|
|||||
| Total liabilities and stockholders’ equity |
$ | 120,825 | $ | 83,265 | ||||
|
|
|
|
|
|||||
See accompanying notes to the consolidated financial statements
F-3
Table of Contents
CASCADIAN THERAPEUTICS, INC.
Consolidated Statements of Operations
(In thousands, except share and per share amounts)
| Years Ended December 31, | ||||||||||||
| 2017 | 2016 | 2015 | ||||||||||
| Operating expenses |
||||||||||||
| Research and development |
$ | 43,980 | $ | 27,467 | $ | 23,468 | ||||||
| General and administrative |
14,109 | 17,630 | 9,321 | |||||||||
| Intangible asset impairment |
— | 19,738 | — | |||||||||
|
|
|
|
|
|
|
|||||||
| Total operating expenses |
58,089 | 64,835 | 32,789 | |||||||||
|
|
|
|
|
|
|
|||||||
| Loss from operations |
(58,089 | ) | (64,835 | ) | (32,789 | ) | ||||||
| Other income |
||||||||||||
| Investment and other income, net |
1,155 | 222 | 80 | |||||||||
| Change in fair value of warrant liability |
— | — | 128 | |||||||||
|
|
|
|
|
|
|
|||||||
| Total other income, net |
1,155 | 222 | 208 | |||||||||
|
|
|
|
|
|
|
|||||||
| Loss before income taxes |
(56,934 | ) | (64,613 | ) | (32,581 | ) | ||||||
| Income tax benefit |
— | (6,908 | ) | — | ||||||||
|
|
|
|
|
|
|
|||||||
| Net loss |
(56,934 | ) | (57,705 | ) | (32,581 | ) | ||||||
|
|
|
|
|
|
|
|||||||
| Deemed dividend related to beneficial conversion feature on convertible preferred stock |
(982 | ) | (2,588 | ) | — | |||||||
|
|
|
|
|
|
|
|||||||
| Net loss attributable to common stockholders |
$ | (57,916 | ) | $ | (60,293 | ) | $ | (32,581 | ) | |||
|
|
|
|
|
|
|
|||||||
| Net loss per share — basic and diluted (1) |
$ | (1.21 | ) | $ | (3.13 | ) | $ | (2.02 | ) | |||
|
|
|
|
|
|
|
|||||||
| Shares used to compute basic and diluted net loss per share (1) |
47,966,493 | 19,264,121 | 16,102,860 | |||||||||
|
|
|
|
|
|
|
|||||||
| (1) | Basic and diluted net loss per share, and shares to used compute basic and diluted net loss per share for the year ended December 31, 2015 have been adjusted retroactively to reflect the 1-for-6 reverse stock split. |
See accompanying notes to the consolidated financial statements
F-4
Table of Contents
CASCADIAN THERAPEUTICS, INC.
Consolidated Statements of Comprehensive Loss
(In thousands)
| Years Ended December 31, | ||||||||||||
| 2017 | 2016 | 2015 | ||||||||||
| Net loss |
$ | (56,934 | ) | $ | (57,705 | ) | $ | (32,581 | ) | |||
| Other comprehensive income (loss): |
||||||||||||
| Available-for-sale securities: |
||||||||||||
| Unrealized gains (loss) during the period, net |
(105 | ) | (16 | ) | 27 | |||||||
|
|
|
|
|
|
|
|||||||
| Other comprehensive income (loss) |
(105 | ) | (16 | ) | 27 | |||||||
|
|
|
|
|
|
|
|||||||
| Comprehensive loss |
$ | (57,039 | ) | $ | (57,721 | ) | $ | (32,554 | ) | |||
|
|
|
|
|
|
|
|||||||
See accompanying notes to the consolidated financial statements
F-5
Table of Contents
CASCADIAN THERAPEUTICS, INC.
Consolidated Statements of Stockholders’ Equity
(In thousands, except share amounts)
| Common Stock | Preferred Stock | Additional |
Accumulated | Accumulated Other Comprehensive |
Stockholders’ | |||||||||||||||||||||||||||
| Shares (1) | Amount | Shares | Amount | Capital | Deficit | Loss | Equity | |||||||||||||||||||||||||
| Balance at January 1, 2015 |
15,266,899 | $ | 353,856 | 10,000 | $ | — | $ | 224,549 | $ | (482,048 | ) | $ | (5,091 | ) | $ | 91,266 | ||||||||||||||||
|
|
|
|
|
|
|
|
|
|
|
|
|
|
|
|
|
|||||||||||||||||
| Net loss |
— | — | — | — | — | (32,581 | ) | — | (32,581 | ) | ||||||||||||||||||||||
| Unrealized gains on available-for-sale securities |
— | — | — | — | — | — | 27 | 27 | ||||||||||||||||||||||||
| Common stock issued, net of offering costs of $1.5 million |
2,449,943 | 1 | — | — | 20,557 | — | — | 20,558 | ||||||||||||||||||||||||
| Series B Convertible Preferred Stock issued, net of offering costs of $0.1 million |
(666,667 | ) | — | 5,333 | — | 1,863 | — | — | 1,863 | |||||||||||||||||||||||
| Series C Convertible Preferred Stock issued |
(1,250,000 | ) | (1 | ) | 7,500 | — | — | — | — | (1 | ) | |||||||||||||||||||||
| Issuances under employee stock purchase plan |
11,255 | — | — | — | 112 | — | — | 112 | ||||||||||||||||||||||||
| Restricted stock units converted |
12,231 | — | — | — | 278 | — | — | 278 | ||||||||||||||||||||||||
| Share-based compensation expense |
— | — | — | — | 2,179 | — | — | 2,179 | ||||||||||||||||||||||||
| Stock options exercised |
3,324 | — | — | — | 34 | — | — | 34 | ||||||||||||||||||||||||
|
|
|
|
|
|
|
|
|
|
|
|
|
|
|
|
|
|||||||||||||||||
| Balance at December 31, 2015 |
15,826,985 | 353,856 | 22,833 | — | 249,572 | (514,629 | ) | (5,064 | ) | 83,735 | ||||||||||||||||||||||
|
|
|
|
|
|
|
|
|
|
|
|
|
|
|
|
|
|||||||||||||||||
| Net loss |
— | — | — | — | — | (57,705 | ) | — | (57,705 | ) | ||||||||||||||||||||||
| Unrealized loss on available-for-sale securities |
— | — | — | — | — | — | (16 | ) | (16 | ) | ||||||||||||||||||||||
| Common stock issued, net of offering costs of $2.4 million |
6,708,333 | 4 | — | — | 29,820 | — | — | 29,824 | ||||||||||||||||||||||||
| Series D Convertible Preferred Stock issued, net of offering costs of $0.3 million |
— | — | 17,250 | — | 13,458 | — | — | 13,458 | ||||||||||||||||||||||||
| Beneficial conversion feature related to the issuance of Series D preferred stock |
— | — | — | (2,588 | ) | 2,588 | — | — | — | |||||||||||||||||||||||
| Deemed dividend related to beneficial conversion feature of Series D preferred stock |
— | — | — | 2,588 | (2,588 | ) | — | — | — | |||||||||||||||||||||||
| Reverse stock split adjustment |
(7 | ) | (11 | ) | — | — | 11 | — | — | — | ||||||||||||||||||||||
| Issuances under employee stock purchase plan |
19,161 | — | — | — | 91 | — | — | 91 | ||||||||||||||||||||||||
| Restricted stock units converted |
8,168 | — | — | — | 60 | — | — | 60 | ||||||||||||||||||||||||
| Share-based compensation expense |
— | — | — | — | 4,685 | — | — | 4,685 | ||||||||||||||||||||||||
| Recovery of related party short-swing profit |
— | — | — | — | 225 | — | — | 225 | ||||||||||||||||||||||||
|
|
|
|
|
|
|
|
|
|
|
|
|
|
|
|
|
|||||||||||||||||
| Balance at December 31, 2016 |
22,562,640 | 353,849 | 40,083 | — | 297,922 | (572,334 | ) | (5,080 | ) | 74,357 | ||||||||||||||||||||||
|
|
|
|
|
|
|
|
|
|
|
|
|
|
|
|
|
|||||||||||||||||
| Net loss |
— | — | — | — | — | (56,934 | ) | — | (56,934 | ) | ||||||||||||||||||||||
| Unrealized loss on available-for-sale securities |
— | — | — | — | — | — | (105 | ) | (105 | ) | ||||||||||||||||||||||
| Common stock issued, net of offering costs of $5.6 million |
26,659,300 | 3 | — | — | 82,353 | — | — | 82,356 | ||||||||||||||||||||||||
| Series E Convertible Preferred Stock issued, net of offering costs of $0.4 million |
— | — | 1,818 | — | 5,616 | — | — | 5,616 | ||||||||||||||||||||||||
| Conversion of Series A Preferred Shares |
1,250,024 | — | (7,500 | ) | — | — | — | — | — | |||||||||||||||||||||||
| Issuances under employee stock purchase plan |
65,437 | — | — | — | 184 | — | — | 184 | ||||||||||||||||||||||||
| Beneficial conversion feature related to the issuance of Series E preferred stock |
— | — | — | (982 | ) | 982 | — | — | — | |||||||||||||||||||||||
| Deemed dividend related to beneficial conversion feature of Series E preferred stock |
— | — | — | 982 | (982 | ) | — | — | — | |||||||||||||||||||||||
| Restricted stock units converted |
61,210 | — | — | — | 236 | — | — | 236 | ||||||||||||||||||||||||
| Share-based compensation expense |
— | — | — | — | 3,026 | — | — | 3,026 | ||||||||||||||||||||||||
| Recovery of related party short-swing profit |
— | — | — | — | 300 | — | — | 300 | ||||||||||||||||||||||||
|
|
|
|
|
|
|
|
|
|
|
|
|
|
|
|
|
|||||||||||||||||
| Balance at December 31, 2017 |
50,598,611 | $ | 353,852 | 34,401 | $ | — | $ | 389,637 | $ | (629,268 | ) | $ | (5,185 | ) | $ | 109,036 | ||||||||||||||||
|
|
|
|
|
|
|
|
|
|
|
|
|
|
|
|
|
|||||||||||||||||
| (1) | Common stock shares for the years ended December 31, 2015 and 2014 have been adjusted retroactively to reflect the 1-for-6 reverse stock split. |
See accompanying notes to the consolidated financial statements
F-6
Table of Contents
CASCADIAN THERAPEUTICS, INC.
Consolidated Statements of Cash Flows
(In thousands)
| Years Ended December 31, | ||||||||||||
| 2017 | 2016 | 2015 | ||||||||||
| Cash flows from operating activities |
||||||||||||
| Net loss |
$ | (56,934 | ) | $ | (57,705 | ) | $ | (32,581 | ) | |||
| Adjustments to reconcile net loss to net cash used in operating activities: |
||||||||||||
| Depreciation and amortization |
956 | 642 | 613 | |||||||||
| Amortization of premiums and accretion of discounts on securities |
(6 | ) | 238 | 305 | ||||||||
| Share-based compensation expense |
3,345 | 4,609 | 2,748 | |||||||||
| Change in fair value of warrant liability |
— | — | (128 | ) | ||||||||
| Intangible assets impairment |
— | 19,738 | — | |||||||||
| Income tax benefit |
— | (6,908 | ) | — | ||||||||
| Other |
(96 | ) | 69 | (7 | ) | |||||||
| Net changes in assets and liabilities: |
||||||||||||
| Accounts and other receivables |
(106 | ) | (38 | ) | 98 | |||||||
| Prepaid and other current assets |
193 | 7 | (530 | ) | ||||||||
| Other long-term assets |
(211 | ) | (396 | ) | (124 | ) | ||||||
| Accounts payable |
1,422 | 385 | (250 | ) | ||||||||
| Accrued and other liabilities |
2,762 | 514 | 765 | |||||||||
| Accrued compensation and related liabilities |
(1,201 | ) | 2,752 | (92 | ) | |||||||
| Other long-term liabilities |
(105 | ) | (638 | ) | 406 | |||||||
|
|
|
|
|
|
|
|||||||
| Net cash used in operating activities |
(49,981 | ) | (36,731 | ) | (28,777 | ) | ||||||
|
|
|
|
|
|
|
|||||||
| Cash flows from investing activities |
||||||||||||
| Purchases of investments |
(131,752 | ) | (92,268 | ) | (61,556 | ) | ||||||
| Redemption of investments |
96,526 | 71,440 | 86,027 | |||||||||
| Purchases of property and equipment |
(114 | ) | (147 | ) | (771 | ) | ||||||
|
|
|
|
|
|
|
|||||||
| Net cash provided by (used in) investing activities |
(35,340 | ) | (20,975 | ) | 23,700 | |||||||
|
|
|
|
|
|
|
|||||||
| Cash flows from financing activities |
||||||||||||
| Proceeds from issuance of common stock and warrants, net of issuance costs |
82,540 | 29,914 | 20,669 | |||||||||
| Proceeds from issuance of convertible preferred stock, net of issuance costs |
5,616 | 13,458 | 1,863 | |||||||||
| Proceeds from stock options exercised |
— | — | 34 | |||||||||
| Cash paid upon conversion of restricted share units |
(79 | ) | (20 | ) | (93 | ) | ||||||
| Recovery of related party short-swing profit |
300 | 225 | — | |||||||||
|
|
|
|
|
|
|
|||||||
| Net cash provided by financing activities |
88,377 | 43,577 | 22,473 | |||||||||
|
|
|
|
|
|
|
|||||||
| Increase (decrease) in cash and cash equivalents |
3,056 | (14,129 | ) | 17,396 | ||||||||
| Cash and cash equivalents, beginning of year |
13,721 | 27,850 | 10,454 | |||||||||
|
|
|
|
|
|
|
|||||||
| Cash and cash equivalents, end of year |
$ | 16,777 | $ | 13,721 | $ | 27,850 | ||||||
|
|
|
|
|
|
|
|||||||
| Supplemental disclosures of non-cash investing and financing activities: |
||||||||||||
| Accretion on convertible preferred stock associated with beneficial conversion feature |
$ | 982 | $ | 2,588 | $ | — | ||||||
|
|
|
|
|
|
|
|||||||
See accompanying notes to the consolidated financial statements
F-7
Table of Contents
CASCADIAN THERAPEUTICS, INC.
Notes to the Consolidated Financial Statements
| 1. | DESCRIPTION OF BUSINESS |
Cascadian Therapeutics, Inc. (the Company) is a clinical-stage biopharmaceutical company incorporated in the State of Delaware on September 7, 2007 and is listed on the Nasdaq Global Select Market under the ticker symbol “CASC.” The Company is focused primarily on the development of targeted therapeutic products for the treatment of cancer. The Company’s goal is to develop and commercialize compounds that have the potential to improve the lives and outcomes of cancer patients. The Company’s operations are not subject to any seasonality or cyclicality factors.
On January 30, 2018, the Company entered into an Agreement and Plan of Merger (the Merger Agreement) with Seattle Genetics, Inc., a Delaware corporation (Seattle Genetics), and Valley Acquisition Sub, Inc., a Delaware corporation and a wholly owned subsidiary of Seattle Genetics (Merger Sub). Pursuant to the Merger Agreement, and upon the terms and subject to the conditions thereof, on February 8, 2018, Merger Sub commenced a tender offer (the Offer) to acquire all of our issued and outstanding shares of common stock (the Shares) at a purchase price of $10 per Share (the Offer Price), net to the seller in cash, without interest and subject to any required withholding taxes.
| 2. | SIGNIFICANT ACCOUNTING POLICIES |
Basis of presentation
These consolidated financial statements have been prepared using accounting principles generally accepted in the United States of America (U.S. GAAP) and reflect the following significant accounting policies.
Change in Authorized Shares and Reverse Stock Split
On November 18, 2016, the Company’s stockholders approved a decrease in the Company’s authorized shares of common stock from 200,000,000 to 66,666,667 shares. On a split-effected basis, authorized shares increased from 33,333,333 to 66,666,667 shares. On June 8, 2017, the stockholders of the Company approved an amendment to the Company’s certificate of incorporation to increase the number of the Company’s authorized shares of common stock from 66,666,667 to 130,000,000. The Company filed the Certificate of Amendment to the Amended and Restated Certificate of Incorporation with the Delaware Secretary of State to effect such amendment.
On November 29, 2016, the Company effected a one-for-six reverse stock split of its outstanding common stock. Each six outstanding shares of the Company’s common stock were combined into one outstanding share of common stock. All per share and share amounts for all periods presented have been adjusted retrospectively to reflect the 1-for-6 reverse stock split.
Basis of consolidation
The Company’s consolidated financial statements include the accounts of the company and its wholly-owned subsidiaries, including Cascadian Therapeutics (Australia) Pty Ltd, Protocell Therapeutics Inc., Oncothyreon Canada Inc., Biomira Management Inc., ProlX Pharmaceuticals Corporation, Biomira BV and Oncothyreon Luxembourg. All intercompany balances and transactions have been eliminated upon consolidation.
Accounting estimates
The preparation of financial statements in accordance with U.S. GAAP requires management to make complex and subjective judgments and estimates that affect the reported amounts of assets and liabilities, the disclosure of contingent assets and liabilities at the date of the financial statements, and the reported amounts of revenues and expenses during the reporting period. By their nature, these judgments are subject to an inherent degree of uncertainty and as a consequence actual results may differ from those estimates.
Cash and cash equivalents
Cash equivalents include short-term, highly liquid investments that are readily convertible to known amounts of cash with original maturities of 90 days or less at the time of purchase. At December 31, 2017, cash and cash equivalents was comprised of $10.3 million in cash, and $6.5 million in money market funds and government securities. As of December 31, 2016, cash and cash equivalents was comprised of $7.2 million in cash and $6.6 million in money market funds. The carrying value of cash equivalents approximates their fair value.
F-8
Table of Contents
Investments
Investments are classified as available-for-sale securities and are carried at fair value with unrealized temporary holding gains and losses excluded from net income or loss and reported in other comprehensive income or loss and as a net amount in accumulated other comprehensive income or loss until realized. Available-for-sale securities are written down to fair value through income whenever it is necessary to reflect other-than-temporary impairments. The Company determined that the unrealized losses on its marketable securities as of December 31, 2017 were temporary in nature, and the Company currently does not intend to sell these securities before recovery of their amortized cost basis. All short-term investments are limited to a final maturity of less than one year from the reporting date. The Company’s long-term investments are investments with maturities exceeding 12 months from the reporting date. The Company is exposed to credit risk on its cash equivalents, short-term investments and long-term investments in the event of non-performance by counterparties, but does not anticipate such non-performance and mitigates exposure to concentration of credit risk through the nature of its portfolio holdings. If a security falls out of compliance with the Company’s investment policy, it may be necessary to sell the security before its maturity date in order to bring the investment portfolio back into compliance. The cost basis of any securities sold is determined by specific identification. The fair value of available-for-sale securities is based on prices obtained from third-party pricing services. The Company reviews the pricing methodology used by the third-party pricing services including the manner employed to collect market information. On a periodic basis, the Company also performs review and validation procedures on the pricing information received from the third-party pricing services. These procedures help ensure that the fair value information used by the Company is determined in accordance with applicable accounting guidance. The amortized cost, unrealized gain or losses and fair value of the Company’s cash, cash equivalents and investments for the periods presented are summarized below:
| Amortized Cost |
Gross Unrealized Gains |
Gross Unrealized Losses |
Fair Value | |||||||||||||
| (In thousands) | ||||||||||||||||
| As of December 31, 2017: |
||||||||||||||||
| Cash |
$ | 10,300 | $ | — | $ | — | $ | 10,300 | ||||||||
| Money market funds |
6,477 | — | — | 6,477 | ||||||||||||
| Debt securities of U.S. government agencies |
57,851 | — | (98 | ) | 57,753 | |||||||||||
| Corporate bonds |
26,479 | — | (21 | ) | 26,458 | |||||||||||
|
|
|
|
|
|
|
|
|
|||||||||
| Total |
$ | 101,107 | $ | — | $ | (119 | ) | $ | 100,988 | |||||||
|
|
|
|
|
|
|
|
|
|||||||||
| As of December 31, 2016: |
||||||||||||||||
| Cash |
$ | 7,162 | $ | — | $ | — | $ | 7,162 | ||||||||
| Money market funds |
6,559 | — | — | 6,559 | ||||||||||||
| Debt securities of U.S. government agencies |
38,387 | 1 | (10 | ) | 38,378 | |||||||||||
| Corporate bonds |
10,711 | — | (5 | ) | 10,706 | |||||||||||
|
|
|
|
|
|
|
|
|
|||||||||
| Total |
$ | 62,819 | $ | 1 | $ | (15 | ) | $ | 62,805 | |||||||
|
|
|
|
|
|
|
|
|
|||||||||
The following table summarizes the aggregate related fair value of investments with unrealized losses by investment category:
| As of December 31, 2017 | As of December 31, 2016 | |||||||||||||||
| Fair Value | Gross Unrealized Losses |
Fair Value | Gross Unrealized Losses |
|||||||||||||
| (In thousands) | ||||||||||||||||
| Debt securities of U.S. government agencies |
$ | 55,276 | $ | (98 | ) | $ | 31,990 | $ | (10 | ) | ||||||
| Corporate bonds |
26,458 | (21 | ) | 8,955 | (5 | ) | ||||||||||
|
|
|
|
|
|
|
|
|
|||||||||
| Total |
$ | 81,734 | $ | (119 | ) | $ | 40,945 | $ | (15 | ) | ||||||
|
|
|
|
|
|
|
|
|
|||||||||
The following table summarizes the Company’s available for sale securities by contractual maturity:
F-9
Table of Contents
| As of December 31, 2017 | As of December 31, 2016 | |||||||||||||||
| Amortized Cost | Fair Value | Amortized Cost | Fair Value | |||||||||||||
| (In thousands) | ||||||||||||||||
| Less than one year |
$ | 83,080 | $ | 82,977 | $ | 55,657 | $ | 55,643 | ||||||||
| Greater than one year but less than five years |
7,727 | 7,711 | — | — | ||||||||||||
|
|
|
|
|
|
|
|
|
|||||||||
| Total |
$ | 90,807 | $ | 90,688 | $ | 55,657 | $ | 55,643 | ||||||||
|
|
|
|
|
|
|
|
|
|||||||||
Warrants
Warrants issued in connection with the Company’s September 2010 financings were recorded as liabilities as they had the potential for cash settlement upon the occurrence of a fundamental transaction. Changes in the fair value of the warrants were recognized as other income (expense) in the consolidated statements of operations. Warrants issued in connection with the Company’s September 2010 financing expired on October 12, 2015. No liability-classified warrants were outstanding as of December 31, 2017 and 2016.
Accounts and other receivables
Accounts and other receivables are reviewed whenever circumstances indicate that the carrying amount of the receivable may not be recoverable. As of December 31, 2017, the Company does not deem an allowance to be necessary.
Property and equipment, depreciation and amortization
Property and equipment are recorded at cost and depreciated over their estimated useful lives on a straight-line basis, as follows:
| Scientific and office equipment |
5 years | |||
| Computer software and equipment |
3 years | |||
| Leasehold improvements and leased equipment |
Shorter of useful life or the term of the lease |
Long-lived assets
Long-lived assets, such as property and equipment, are reviewed for impairment whenever events or changes in circumstances indicate that the carrying amount of an asset may not be recoverable. If circumstances require a long-lived asset be tested for impairment, the Company first compares the undiscounted cash flows expected to be generated by the asset to the carrying value of the asset. If the carrying value of the long-lived asset is not recoverable on an undiscounted cash flow basis, impairment is recognized to the extent that the carrying value exceeds its estimated fair value. Fair value is determined by management through various valuation techniques, including discounted cash flow models, quoted market values and third-party independent appraisals, as considered necessary. An impairment charge of approximately $0.1 million related to laboratory equipment was recorded in our consolidated statement of operations for the year ended December 31, 2017. No impairment charges were recorded for the years ended December 31, 2016 and 2015.
Indefinite-lived intangible assets — IPR&D
Intangible assets related to In Process Research & Development (IPR&D) are considered to be indefinite-lived until the completion or abandonment of the associated research and development efforts. Upon completion of the project, the Company will make a separate determination of useful life of the IPR&D and the related amortization will be recorded as an expense over the estimated useful life. If the IPR&D is abandoned, the carrying value of the asset will be expensed. During the period the assets are considered indefinite-lived, they will not be amortized but will be tested for impairment on October 1 of each year or more frequently when events or changes in circumstances indicate that the asset may be impaired. In the event that the carrying value of IPR&D exceeds its fair value, an impairment loss would be recognized. Subsequent research and development costs associated with the initial recognition of IPR&D assets are expensed as incurred.
F-10
Table of Contents
Goodwill
Goodwill is not amortized, but is reviewed annually for impairment on October 1 of each year or more frequently when events or changes in circumstances indicate that the asset may be impaired. In the event that the carrying value of goodwill exceeds its fair value, an impairment loss would be recognized. No impairment charges were recorded for any of the periods presented.
Other liabilities
Other liabilities include the long-term portion of accrued milestone payments and deferred rent. Certain milestone payments under our previous agreement with STC.UNM are accrued on a straight-line basis from initiation of the license agreement to the milestone payment date. Also included in this line item is the long-term portion of deferred rent. Rent expense is recognized on a straight-line basis over the term of the lease. Lease incentives, including rent holidays provided by lessors, and rent escalation provisions are accounted for as deferred rent.
Revenue recognition
The Company recognizes revenue when there is persuasive evidence that an arrangement exists, delivery has occurred, the price is fixed and determinable, and collection is reasonably assured.
Research and development costs
Research and development expenses include personnel and facility related expenses, which includes depreciation and amortization, outside contract services including clinical trial costs, manufacturing and process development costs, research costs and other consulting services. Research and development costs are expensed as incurred. In instances where the Company enters into agreements with third parties for clinical trials, manufacturing and process development, research, licensing arrangements and other consulting activities, costs are expensed as services are performed. Amounts due under such arrangements may be either fixed fee or fee for service, and may include upfront payments, monthly payments, and payments upon the completion of milestones or receipt of deliverables.
The Company’s accruals for clinical trials are based on estimates of the services received and pursuant to contracts with numerous clinical trial centers and clinical research organizations. In the normal course of business, the Company contracts with third parties to perform various clinical trial activities in the ongoing development of potential products. The financial terms of these agreements are subject to negotiation and variation from contract to contract and may result in uneven payment flows. Payments under the contracts depend on factors such as the achievement of certain events, the successful accrual of patients, and the completion of portions of the clinical trial or similar conditions. The objective of the Company’s accrual policy is to match the recording of expenses in its consolidated financial statements to the period in which they are incurred. As such, expense accruals related to clinical trials are recognized based on its estimate of the degree of completion of the event or events specified in the specific clinical study or trial contract.
Income or loss per share
Basic net loss per share is calculated by dividing net loss attributable to common stockholders, which may include a deemed dividend from the amortization of a beneficial conversion feature, by the weighted average number of shares outstanding for the period. Diluted net loss per share is calculated by adjusting the numerator and denominator of the basic net loss per share calculation for the effects of all potentially dilutive common shares. Potential dilutive shares of the Company’s common stock include stock options, restricted share units, warrants, Series A, B, C, D and E convertible preferred stock and shares granted under the 2010 Employee Stock Purchase Plan (ESPP). The calculation of diluted loss per share requires that, to the extent the average market price of the underlying shares for the reporting period exceeds the exercise price of the warrants and the presumed exercise of such securities are dilutive to loss per share for the period, adjustments to net loss used in the calculation are required to remove the change in fair value of the warrants for the period. Furthermore, adjustments to the denominator are required to reflect the addition of the related dilutive shares. Shares used to calculate basic and dilutive net loss per share for the years ended December 31, 2017, 2016 and 2015, were the same, since all potentially dilutive shares were anti-dilutive. Basic and diluted net loss per share for all periods presented have been adjusted retrospectively to reflect the 1-for-6 reverse stock split. For additional information regarding the income or loss per share, see “Note 6 — Share Capital.”
F-11
Table of Contents
Income taxes
The Company follows the asset and liability method of accounting for income taxes. Under this method, deferred tax assets and liabilities are recognized for the future income tax consequences attributable to differences between the carrying amounts and tax bases of assets and liabilities and losses carried forward and tax credits. Deferred tax assets and liabilities are measured using enacted tax rates and laws applicable to the years in which the differences are expected to reverse. The effect on deferred tax assets and liabilities of a change in tax rates is recognized in income in the period that includes the enactment date. A valuation allowance is provided to the extent that it is more likely than not that deferred tax assets will not be realized.
The Company recognizes the financial statement effects of a tax position when it is more likely than not, based on the technical merits, that the position will be sustained upon examination. The Company does not believe any uncertain tax positions currently pending will have a material adverse effect on its consolidated financial statements nor expects any material change in its position in the next twelve months. Penalties and interest, of which there are none, would be reflected in income tax expense. Tax years are open to the extent the Company has net operating loss carryforwards available to be utilized currently.
Accumulated other comprehensive income (loss)
Comprehensive income or loss is comprised of net income or loss and other comprehensive income or loss. Other comprehensive income or loss includes unrealized gains and losses on the Company’s available-for-sale investments. In addition to unrealized gains and losses on investments, accumulated other comprehensive income or loss consists of foreign currency translation adjustments which arose from the conversion of the Canadian dollar functional currency consolidated financial statements to the U.S. dollar reporting currency consolidated financial statements prior to January 1, 2008. Should the Company liquidate or substantially liquidate its investments in its foreign subsidiaries, the Company would be required to recognize the related cumulative translation adjustments pertaining to the liquidated or substantially liquidated subsidiaries, as a charge to earnings in the Company’s consolidated statements of operations and comprehensive loss.
There were no reclassifications out of accumulated other comprehensive loss during the years ended December 31, 2017, 2016 and 2015. The table below shows the changes in accumulated balances of each component of accumulated other comprehensive loss for the years ended December 31, 2017, 2016 and 2015:
| Net Unrealized Gains/(losses) on Available-for-Sale Securities |
Foreign Currency Translation Adjustment |
Accumulated Other Comprehensive Loss |
||||||||||
| (In thousands) | ||||||||||||
| Balance at December 31, 2014 |
$ | (25 | ) | $ | (5,066 | ) | $ | (5,091 | ) | |||
| Other comprehensive income |
27 | — | 27 | |||||||||
|
|
|
|
|
|
|
|||||||
| Balance at December 31, 2015 |
$ | 2 | $ | (5,066 | ) | $ | (5,064 | ) | ||||
| Other comprehensive loss |
(16 | ) | — | (16 | ) | |||||||
|
|
|
|
|
|
|
|||||||
| Balance at December 31, 2016 |
$ | (14 | ) | $ | (5,066 | ) | $ | (5,080 | ) | |||
| Other comprehensive loss |
(105 | ) | — | (105 | ) | |||||||
|
|
|
|
|
|
|
|||||||
| Balance at December 31, 2017 |
$ | (119 | ) | $ | (5,066 | ) | $ | (5,185 | ) | |||
|
|
|
|
|
|
|
|||||||
Share-based compensation
The Company recognizes in the statements of operations the estimated grant date fair value of share-based compensation awards granted to employees over the requisite service period. Share-based compensation expense in the consolidated statements of operations is recorded on a straight-line basis over the requisite service period for the entire award, which is generally the vesting period, with the offset to additional paid-in capital. The Company uses the Black-Scholes option pricing model to estimate the fair value of stock options granted to employees. Forfeitures are estimated at the time of grant and revised, if necessary, in subsequent periods if actual forfeitures differ from those estimates.
On June 23, 2016, the Company’s stockholders approved a new 2016 Equity Incentive Plan (2016 EIP). As of that date, the Company ceased granting options under its Amended and Restated Share Option Plan (the Option Plan) and transferred the remaining shares available for issuance under the Option Plan to the 2016 EIP. On June 8, 2017, the Company’s stockholders approved an amendment to the 2016 EIP to increase the total shares of common stock available for issuance under the 2016 EIP from 1,200,905 shares to 7,900,905 shares.
F-12
Table of Contents
For non-employee directors, the Company sponsors a RSU Plan that was established in 2005. According to an amendment to the RSU Plan in October 2011, approximately 25% of each RSU represents a contingent right to receive cash upon vesting, and the Company is required to deliver an amount in cash equal to the fair market value of the shares on the vesting date to facilitate the satisfaction of the non-employee directors’ U.S. federal income tax obligation with respect to the vested RSUs. This amendment resulted in the RSUs being classified as a liability. The outstanding RSU awards are required to be re-measured at each reporting date until settlement of the award, and changes in valuation are recorded as compensation expense for the period. To the extent that the liability recorded in the balance sheet is less than the original award value, the difference is recognized in equity. The Company uses the closing share price of its shares on the Nasdaq Global Market at the reporting or settlement date to determine the fair value of RSUs. In June 2014, the Company’s stockholders approved an increase of 83,333 shares in the number of shares of the Company’s common stock reserved for issuance under the RSU Plan. On June 23, 2016, the stockholders approved the 2016 EIP and the Company ceased granting RSUs under the RSU Plan and transferred the remaining shares available for issuance under the RSU Plan to the 2016 EIP.
The Company maintains an ESPP under which a total of 150,000 shares of common stock were reserved for sale to employees of the Company. The Company recognizes in the statement of operations the estimated fair value of the ESPP, which is determined by the Black-Scholes option pricing model.
For additional information regarding share-based compensation, see “Note 7 — Share-based Compensation.”
Business Combinations
In a business combination, the Company determines if the acquired property and activities meet the definition of a business under current accounting guidance. If the combination meets the definition of a business, the Company measures the significance of the combination to determine the required reporting and disclosure requirements for the transaction. Business combinations are required to be accounted for under the acquisition method which requires that identifiable assets acquired, liabilities assumed and any non-controlling interest in the acquiree be recognized and measured as of the acquisition date at fair value. In addition, all consideration transferred must be measured at its acquisition-date fair value.
When necessary, the Company uses a third party valuation expert to determine the fair value of the identifiable assets and liabilities acquired. The estimated fair values of in-process research and development acquired in a business combination which have not been fully developed are capitalized as indefinite-lived intangible assets and impairment testing is conducted periodically.
Segment information
The Company operates in a single business segment — research and development of therapeutic products for the treatment of cancer.
Recent accounting pronouncements
In January 2017, the Financial Accounting Standards Board (FASB) issued Accounting Standards Update (ASU) 2017-04, Intangibles – Goodwill and Other (Topic 350): Simplifying the Test for Goodwill Impairment. This standard simplifies the subsequent measurement of goodwill by eliminating Step 2 from the goodwill impairment test which previously required measurement of any goodwill impairment loss by comparing the implied fair value of a reporting unit’s goodwill with the carrying amount of that goodwill. Instead, under this update, the impairment charge will be measured based on the excess of a reporting unit’s carrying value over its fair value. The standard will be applied prospectively and is effective for a public business entity that is an SEC filer for its annual and interim impairment tests performed in periods beginning after December 15, 2019. Early adoption is permitted for annual and interim goodwill impairment testing dates after January 1, 2017. The Company is currently evaluating any impact this standard may have on its consolidated financial position and results of operations.
In August 2016, the FASB issued ASU 2016-15, Statement of Cash Flows (Topic 230), a consensus of the FASB’s Emerging Issues Task Force. The standard is intended to reduce diversity in practice in how certain transactions are classified in the statement of cash flows. The standard addresses the classification of cash flows related to (1) debt
F-13
Table of Contents
prepayment or extinguishment costs, (2) settlement of zero-coupon debt instruments, (3) contingent consideration payments made after a business combination, (4) proceeds from the settlement of insurance claims, (5) proceeds from the settlement of corporate-owned life insurance, including bank-owned life insurance, (6) distributions received from equity method investees and (7) beneficial interests in securitization transactions. The standard requires application using a retrospective transition method and is effective for public business entities for fiscal years beginning after December 15, 2017, and interim periods within those years. Early adoption is permitted. The Company adopted this standard on January 1, 2018. The adoption of this standard did not have a material impact on the Company’s consolidated statements of cash flows.
In March 2016, FASB issued ASU 2016-09, Improvements to Employee Share-Based Payment Accounting, which amends ASC Topic 718, Compensation – Stock Compensation. This standard changes how companies account for certain aspects of share-based payments to employees including income tax consequences, classification of awards as either equity or liabilities, and classification on the statement of cash flows. This standard is effective for public business entities for fiscal years beginning after December 15, 2016, and interim periods within those years. The Company adopted this standard as of January 1, 2017. Because the Company has incurred net losses since its inception and maintains a full valuation allowance on its net deferred tax assets, the adoption of this standard did not have a material impact on the Company’s financial condition, results of operations and cash flows, or financial statement disclosures.
In February 2016, the FASB issued ASU 2016-02, Leases (Topic 842), to improve financial reporting for leasing transactions. The new standard requires lessees to recognize on the balance sheets a right of use asset and related lease liability. Lessor accounting under the new standard remains similar under current GAAP. The ASU also requires disclosures about the amount, timing, and uncertainty of cash flows arising from leases. The effective date for public entities is fiscal years beginning after December 15, 2018, including interim periods within those fiscal years. Early adoption is permitted for all entities. The Company is currently evaluating any impact this standard may have on its consolidated financial position and results of operations.
In January 2016, the FASB issued ASU 2016-01, Financial Instruments – Overall (Subtopic 825-10): Recognition and Measurement of Financial Assets and Financial Liabilities. The guidance will change how entities measure equity investments that do not result in consolidation and are not accounted for under the equity method and how they present changes in the fair value of financial liabilities measured under the fair value option that are attributable to their own credit. The new guidance also changes certain disclosure requirements and other aspects of current US GAAP. It does not change the guidance for classifying and measuring investments in debt securities and loans. ASU 2016-01 is effective for public business entities for fiscal years beginning after December 15, 2017, including interim periods within those fiscal years. With the exception of early application guidance outlined in this standard, early adoption is not permitted. The Company adopted this standard on January 1, 2018. The adoption of this standard did not have a material impact on the Company’s financial condition, results of operations and cash flows, or financial statement disclosures.
In August 2015, FASB issued ASU 2015-14, Revenue from Contracts with Customers (Topic 606)—Deferral of the Effective Date, which defers by one year the effective date of ASU 2014-09, Revenue from Contracts with Customers. For public entities, the standard is effective for annual reporting periods beginning after December 15, 2017, including interim reporting periods within that reporting period. Early adoption is permitted as of annual reporting periods beginning after December 15, 2016, including interim reporting periods within those annual periods. The Company adopted this standard on January 1, 2018. As the Company does not currently have any revenue arrangements in the scope of the new revenue standard, this standard did not have an effect on its financial position or results of operations upon adoption.
| 3. | FAIR VALUE MEASUREMENTS |
The Company measures certain financial assets and liabilities at fair value in accordance with a hierarchy which requires an entity to maximize the use of observable inputs which reflect market data obtained from independent sources and minimize the use of unobservable inputs. There are three levels of inputs that may be used to measure fair value:
| • | Level 1 — quoted prices in active markets for identical assets or liabilities; |
| • | Level 2 — observable inputs other than Level 1 prices such as quoted prices for similar assets or liabilities, quoted prices in markets that are not active, or other inputs that are observable or can be corroborated by observable market data for substantially the full term of the assets or liabilities; and |
| • | Level 3 — unobservable inputs that are supported by little or no market activity and that are significant to the fair value of the assets or liabilities. |
F-14
Table of Contents
The Company’s financial assets and liabilities measured at fair value on a recurring basis consisted of the following as of December 31, 2017 and 2016:
| December 31, 2017 | December 31, 2016 | |||||||||||||||||||||||||||||||
| Level 1 | Level 2 | Level 3 | Total | Level 1 | Level 2 | Level 3 | Total | |||||||||||||||||||||||||
| (In thousands) | ||||||||||||||||||||||||||||||||
| Financial Assets: |
||||||||||||||||||||||||||||||||
| Money market funds |
$ | 6,477 | $ | — | $ | — | $ | 6,477 | $ | 6,559 | $ | — | $ | — | $ | 6,559 | ||||||||||||||||
| Debt securities of U.S. government agencies |
— | 57,753 | — | 57,753 | — | 38,378 | — | 38,378 | ||||||||||||||||||||||||
| Corporate bonds |
— | 26,458 | — | 26,458 | — | 10,706 | — | 10,706 | ||||||||||||||||||||||||
|
|
|
|
|
|
|
|
|
|
|
|
|
|
|
|
|
|||||||||||||||||
| $ | 6,477 | $ | 84,211 | $ | — | $ | 90,688 | $ | 6,559 | $ | 49,084 | $ | — | $ | 55,643 | |||||||||||||||||
|
|
|
|
|
|
|
|
|
|
|
|
|
|
|
|
|
|||||||||||||||||
| Financial Liability: |
||||||||||||||||||||||||||||||||
| Restricted Share Units |
$ | 355 | $ | — | $ | — | $ | 355 | $ | 352 | $ | — | $ | — | $ | 352 | ||||||||||||||||
If quoted market prices in active markets for identical assets are not available to determine fair value, then the Company uses quoted prices of similar instruments and other significant inputs derived from observable market data obtained from third-party data providers. These investments are included in Level 2 and consist of debt securities of U.S government agencies and corporate bonds.
There were no transfers between Level 1 and Level 2 during 2016.
| 4. | PROPERTY AND EQUIPMENT |
The table below outlines the cost, accumulated depreciation and amortization and net carrying value of the Company’s property and equipment for the years ended December 31, 2017 and 2016:
| 2017 | ||||||||||||
| Cost | Accumulated Depreciation and Amortization |
Net Carrying Value |
||||||||||
| (In thousands) | ||||||||||||
| Scientific equipment |
$ | 1,192 | $ | (939 | ) | $ | 253 | |||||
| Leasehold improvements |
1,868 | (1,829 | ) | 39 | ||||||||
| Computer software and equipment |
423 | (325 | ) | 98 | ||||||||
| Office equipment |
364 | (98 | ) | 266 | ||||||||
|
|
|
|
|
|
|
|||||||
| $ | 3,847 | $ | (3,191 | ) | $ | 656 | ||||||
|
|
|
|
|
|
|
|||||||
| 2016 | ||||||||||||
| Cost | Accumulated Depreciation and Amortization |
Net Carrying Value |
||||||||||
| (In thousands) | ||||||||||||
| Scientific equipment |
$ | 3,077 | $ | (2,241 | ) | $ | 836 | |||||
| Leasehold improvements |
1,627 | (1,269 | ) | 358 | ||||||||
| Computer software and equipment |
390 | (315 | ) | 75 | ||||||||
| Office equipment |
170 | (37 | ) | 133 | ||||||||
|
|
|
|
|
|
|
|||||||
| $ | 5,264 | $ | (3,862 | ) | $ | 1,402 | ||||||
|
|
|
|
|
|
|
|||||||
Depreciation and leasehold improvement amortization expense was $1.0 million, $0.6 million and $0.6 million for the years ended December 31, 2017, 2016 and 2015, respectively. Depreciation and leasehold improvement amortization expense for the year ended December 31, 2017 included accelerated depreciation of $0.3 million on leasehold improvements due to a change in the termination date of the Company’s May 2008 lease.
F-15
Table of Contents
| 5. | INTANGIBLE ASSET IMPAIRMENT |
On May 5, 2016, the Company entered into an agreement with STC.UNM to mutually terminate the license agreement relating to protocell technology. As a result of the termination and the Company’s intent to no longer develop, license or commercialize the protocell technology, the indefinite-lived intangible assets acquired in the 2014 acquisition of Alpine Biosciences, Inc. (Alpine) were considered impaired. Accordingly, $19.7 million was fully written-off and recorded as intangible asset impairment in the Company’s consolidated statements of operations for the year ended December 31, 2016. The indefinite-lived intangible assets represented the value assigned to in-process research and development when the Company acquired the protocell technology. Additionally, as a result of the impairment, the deferred tax liability, which solely relates to the indefinite-lived intangible assets was reversed, resulting in a federal tax benefit of $6.9 million during the year ended December 31, 2016. See “Note 10 — Income Tax”. The impairment charge did not result in any significant cash expenditures or otherwise impact the Company’s liquidity or cash.
| 6. | SHARE CAPITAL |
The Company has the authority to issue a total of 140,012,500 shares of capital stock divided into three classes as follows:
| • | 130,000,000 shares of Common Stock, $0.0001 par value per share. |
| • | 10,000,000 shares of Preferred Stock(1), $0.0001 par value per share |
| • | 12,500 shares of Class UA Preferred Stock, no par value (the “ Class UA Preferred Stock ”). |
| (1) | The Preferred Stock may be issued from time to time in one or more series pursuant to a resolution or resolutions providing for such issue duly adopted by the Board of Directors (authority to do so being hereby expressly vested in the Board of Directors). The Board of Directors is further authorized, subject to limitations prescribed by law, to fix by resolution or resolutions the designations, powers, preferences and rights, and the qualifications, limitations or restrictions thereof, of any wholly unissued series of Preferred Stock, including without limitation authority to fix by resolution or resolutions the dividend rights, dividend rate, conversion rights, voting rights, rights and terms of redemption (including sinking fund provisions), redemption price or prices, and liquidation preferences of any such series, and the number of shares constituting any such series and the designation thereof, or any of the foregoing |
Class UA preferred stock
As of December 31, 2017 and 2016, the Company had 12,500 shares of Class UA preferred stock authorized, issued and outstanding. The Class UA preferred stock has the following rights, privileges, and limitations:
Voting. Each share of Class UA preferred stock will not be entitled to receive notice of, or to attend and vote at, any Stockholder meeting unless the meeting is called to consider any matter in respect of which the holders of the shares of Class UA preferred stock would be entitled to vote separately as a class, in which case the holders of the shares of Class UA preferred stock shall be entitled to receive notice of and to attend and vote at such meeting. Amendments to the certificate of incorporation of Cascadian Therapeutics that would increase or decrease the par value of the Class UA preferred stock or alter or change the powers, preferences or special rights of the Class UA preferred stock so as to affect them adversely would require the approval of the holders of the Class UA preferred stock.
Conversion. The Class UA preferred stock is not convertible into shares of any other class of Cascadian Therapeutics capital stock.
Dividends. The holders of the shares of Class UA preferred stock will not be entitled to receive dividends.
Liquidation preference. In the event of any liquidation, dissolution or winding up of the Company, the holders of the Class UA preferred stock will be entitled to receive, in preference to the holders of the Company’s common stock, an amount equal to the lesser of (1) 20% of the after tax profits (“net profits”), determined in accordance with Canadian generally accepted accounting principles, where relevant, consistently applied, for the period commencing at the end of the last completed financial year of the Company and ending on the date of the distribution of assets of the Company to its stockholders together with 20% of the net profits of the Company for the last completed financial year and (2) CDN $100 per share.
F-16
Table of Contents
Holders of Class UA preferred stock are entitled to mandatory redemption of their shares if the Company realizes “net profits” in any year. For this purpose, “net profits … means the after-tax profits determined in accordance with generally accepted accounting principles, where relevant, consistently applied.” The Company has taken the position that this applies to Canadian GAAP and, accordingly, there have been no redemptions to date.
Redemption. The Company may, at its option and subject to the requirements of applicable law, redeem at any time the whole or from time to time any part of the then-outstanding shares of Class UA preferred stock for CDN $100 per share. The Company is required each year to redeem at CDN $100 per share that number of shares of Class UA preferred stock as is determined by dividing 20% of the net profits by CDN $100.
The difference between the redemption value and the book value of the Class UA preferred stock will be recorded at the time that the fair value of the shares increases to redemption value based on the Company becoming profitable as measured using Canadian GAAP.
Preferred stock
As of December 31, 2017 and 2016, the Company had authorized 10,000,000 shares of undesignated preferred stock, $0.0001 par value per share. As of December 31, 2017, the Company had 2,500 shares of Series A convertible preferred stock, 5,333 shares of Series B convertible preferred stock, 7,500 shares of Series C convertible preferred stock, 17,250 shares of Series D convertible preferred stock and 1,818 shares of Series E convertible preferred stock issued and outstanding. As of December 31, 2016, the Company had 10,000 shares of Series A convertible preferred stock, 5,333 shares of Series B convertible preferred stock and 7,500 shares of Series C convertible preferred stock and 17,250 shares of Series D convertible preferred stock issued and outstanding. Shares of preferred stock may be issued in one or more series from time to time by the board of directors of the Company, and the board of directors is expressly authorized to fix by resolution or resolutions the designations and the powers, preferences and rights, and the qualifications, limitations and restrictions thereof, of the shares of each series of preferred stock. Subject to the determination of the board of directors of the Company, the preferred stock would generally have preferences over common stock with respect to the payment of dividends and the distribution of assets in the event of the liquidation, dissolution or winding up of the Company.
Series A Convertible Preferred Stock
As of December 31, 2017 and 2016, the Company had 2,500 shares and 10,000 shares of Series A convertible preferred stock issued and outstanding, respectively. In July 2017, 7,500 shares of Series A convertible preferred stock were converted into 1,250,024 shares of the Company’s common stock.
On September 22, 2014, in connection with the public offering of 10,000 shares of the Company’s Series A convertible preferred stock, the Company designated 10,000 shares of its authorized and unissued preferred stock as Series A convertible preferred stock and filed a Certificate of Designation of Preferences, Rights and Limitations of Series A Convertible Preferred Stock with the Delaware Secretary of State. Each share of Series A convertible preferred stock is convertible into 166.67 shares of the Company’s common stock at any time at the holder’s option. The holder, however, will be prohibited from converting Series A convertible preferred stock into shares of common stock if, as a result of such conversion, the holder, together with its affiliates, would own more than 4.99% of the shares of the Company’s common stock then issued and outstanding. In the event of the Company’s liquidation, dissolution, or winding up, holders of Series A convertible preferred stock will receive a payment equal to $0.0001 per share of Series A convertible preferred stock before any proceeds are distributed to the holders of common stock, after any proceeds are distributed to the holder of the Company’s Class UA preferred stock and on parity with any distributions to the holders of the Company’s Series B convertible preferred stock and Series C convertible preferred stock. Shares of Series A convertible preferred stock will generally have no voting rights, except as required by law and except that the consent of holders of a majority of the outstanding Series A convertible preferred stock will be required to amend the terms of the Series A convertible preferred stock. Shares of Series A convertible preferred stock will not be entitled to receive any dividends, unless and until specifically declared by the Company’s board of directors, and will rank:
| • | senior to all common stock; |
| • | senior to any class or series of capital stock created specifically ranking by its terms junior to the Series A convertible preferred stock; |
| • | on parity with the Company’s Series B convertible preferred stock, Series C convertible preferred stock and any class or series of capital stock created specifically ranking by its terms on parity with the Series A convertible preferred stock; and |
F-17
Table of Contents
| • | junior to the Company’s Class UA preferred stock and any class or series of capital stock created specifically ranking by its terms senior to the Series A convertible preferred stock; |
in each case, as to distribution of assets upon the Company’s liquidation, dissolution or winding up whether voluntarily or involuntarily.
Series B Convertible Preferred Stock
As of December 31, 2017 and 2016, the Company had 5,333 shares of Series B convertible preferred stock issued and outstanding.
On February 11, 2015, in connection with the public offering of 1,333 shares of the Company’s Series B convertible preferred stock, the Company designated 5,333 shares of its authorized and unissued preferred stock as Series B convertible preferred stock and filed a Certificate of Designation of Preferences, Rights and Limitations of Series B Convertible Preferred Stock with the Delaware Secretary of State. Each share of Series B convertible preferred stock is convertible into 166.67 shares of the Company’s common stock at any time at the holder’s option. The holder, however, will be prohibited from converting Series B convertible preferred stock into shares of common stock if, as a result of such conversion, the holder, together with its affiliates, would own more than 4.99% of the shares of the Company’s common stock then issued and outstanding. In the event of the Company’s liquidation, dissolution, or winding up, holders of Series B convertible preferred stock will receive a payment equal to $0.0001 per share of Series B convertible preferred stock before any proceeds are distributed to the holders of common stock, after any proceeds are distributed to the holder of the Company’s Class UA preferred stock and on parity with any distributions to the holders of the Company’s Series A convertible preferred stock and Series C convertible preferred stock. Shares of Series B convertible preferred stock will generally have no voting rights, except as required by law and except that the consent of holders of a majority of the outstanding Series B convertible preferred stock will be required to amend the terms of the Series B convertible preferred stock. Shares of Series B convertible preferred stock will not be entitled to receive any dividends, unless and until specifically declared by the Company’s board of directors, and will rank:
| • | senior to all common stock; |
| • | senior to any class or series of capital stock created specifically ranking by its terms junior to the Series B convertible preferred stock; |
| • | on parity with the Company’s Series A convertible preferred stock, Series C convertible preferred stock and any class or series of capital stock created specifically ranking by its terms on parity with the Series B convertible preferred stock; and |
| • | junior to the Company’s Class UA preferred stock and any class or series of capital stock created specifically ranking by its terms senior to the Series B convertible preferred stock; |
in each case, as to distributions of assets upon the Company’s liquidation, dissolution or winding up whether voluntarily or involuntarily.
Series C Convertible Preferred Stock
As of December 31, 2017 and 2016, the Company had 7,500 shares of Series C convertible preferred stock issued and outstanding.
On May 14, 2015, the Company designated 7,500 shares of its authorized and unissued preferred stock as Series C Convertible Preferred Stock and filed a Certificate of Designation of Preferences, Rights and Limitations of Series C Convertible Preferred Stock with the Delaware Secretary of State. The Company entered into an exchange agreement with certain affiliates of Biotechnology Value Fund (BVF) to exchange 1,245,022 shares of common stock previously purchased by BVF for 7,500 shares of Series C Convertible Preferred Stock. Each share of Series C Convertible Preferred Stock is convertible into 166.67 shares of the Company’s Common Stock at any time at the holder’s option. The holder, however, will be prohibited from converting Series C Convertible Preferred Stock into shares of common stock if, as a result of such conversion, the holder, together with its affiliates, would own more than 9.99% of the shares of the Company’s Common Stock then issued and outstanding. In the event of the Company’s liquidation, dissolution, or winding up, holders of Series C Convertible Preferred Stock will receive a payment equal to $0.0001 per share of Series C Convertible Preferred Stock before any proceeds are distributed to the holders of common stock, after any proceeds are distributed to the holder of the Company’s Class UA Preferred Stock and on parity with any distributions to the holders of the Company’s Series A Convertible Preferred Stock and Series B Convertible Preferred Stock. Shares of Series C Convertible Preferred Stock will generally have no voting rights, except as required by law and except that the consent of holders of a majority of the outstanding Series C Convertible Preferred Stock will be required to amend the terms of the
F-18
Table of Contents
Series C Convertible Preferred Stock. Shares of Series C Convertible Preferred Stock will not be entitled to receive any dividends, unless and until specifically declared by the Company’s board of directors, and will rank:
| • | senior to all common stock; |
| • | senior to any class or series of capital stock hereafter created specifically ranking by its terms junior to the Series C Convertible Preferred Stock; |
| • | on parity with the Company’s Series A Convertible Preferred Stock, Series B Convertible Preferred Stock and any class or series of capital stock hereafter created specifically ranking by its terms on parity with the Series C Convertible Preferred Stock; and |
| • | junior to the Company’s Class UA Preferred Stock and any class or series of capital stock hereafter created specifically ranking by its terms senior to the Series C Convertible Preferred Stock; |
in each case, as to distributions of assets upon the Company’s liquidation, dissolution or winding up whether voluntarily or involuntarily.
Series D Convertible Preferred Stock
As of December 31, 2017 and 2016, the Company had 17,250 shares of Series D convertible preferred stock issued and outstanding.
On June 28, 2016, the Company closed a registered direct offering of 17,250 shares of its Series D Convertible Preferred Stock at a price of $800.00 per share directly to affiliates of BVF Partners L.P. (BVF), which are existing stockholders and affiliates of a member of the board of directors, for gross proceeds of $13.8 million. The Company designated 17,250 shares of its authorized and unissued preferred stock as Series D convertible preferred stock and filed a Certificate of Designation of Preferences, Rights and Limitations of Series D Convertible Preferred Stock with the Delaware Secretary of State.
Each share of Series D Convertible Preferred Stock is convertible into 166.67 shares of the Company’s Common Stock at any time at the holder’s option. The holder, however, will be prohibited from converting Series D Convertible Preferred Stock into shares of common stock if, as a result of such conversion, the holder, together with its affiliates, would own more than 19.99% of the shares of the Company’s Common Stock then issued and outstanding, which percentage may change at the holders’ election to any other number less than or equal to 19.99% upon 61 days’ notice to the Company. In the event of the Company’s liquidation, dissolution, or winding up, holders of Series D Convertible Preferred Stock will receive a payment equal to $0.0001 per share of Series D Convertible Preferred Stock before any proceeds are distributed to the holders of common stock, after any proceeds are distributed to the holder of the Company’s Class UA Preferred Stock and on parity with any distributions to the holders of the Company’s Series A Convertible Preferred Stock, Series B Convertible Preferred Stock and Series C Convertible Preferred Stock. Shares of Series D Convertible Preferred Stock will generally have no voting rights, except as required by law and except that the consent of holders of a majority of the outstanding Series D Convertible Preferred Stock will be required to amend the terms of the Series D Convertible Preferred Stock. Shares of Series D Convertible Preferred Stock will not be entitled to receive any dividends, unless and until specifically declared by the Company’s board of directors, and will rank:
| • | senior to all common stock; |
| • | senior to any class or series of capital stock created that specifically ranks by its terms junior to the Series D convertible preferred stock; |
| • | on parity with the Company’s Series A convertible preferred stock, Series B Convertible Preferred Stock and Series C convertible preferred stock, and any class or series of capital stock created that specifically ranks by its terms on parity with the Series D convertible preferred stock; and |
| • | junior to the Company’s Class UA preferred stock and any class or series of capital stock created that specifically ranks by its terms senior to the Series D convertible preferred stock; |
in each case, as to distributions of assets upon the Company’s liquidation, dissolution or winding up, whether voluntarily or involuntarily.
Beneficial Conversion Feature
A beneficial conversion feature exists when the effective conversion price of a convertible security is less than the market price per share on the commitment date, creating a discount. The value of the discount is determined by the difference between the market price and the conversion price multiplied by the potential conversion shares purchased. The discount is recognized as a non-cash deemed dividend from the date of issuance to the earliest conversion date.
F-19
Table of Contents
The Company recognized a beneficial conversion feature in the amount of $2.6 million, calculated as the number of potential conversion shares multiplied by the excess of the market price of its common stock over the price per conversion share of the Series D convertible preferred stock on the commitment date. The non-cash deemed dividends of $2.6 million was recorded in additional paid-in capital and as a deemed dividend on the Series D convertible preferred stock, and was used in determining the net loss applicable to common stockholders in the consolidated statement of operations for the year ended December 31, 2016.
Series E Convertible Preferred Stock
As of December 31, 2017 and 2016, the Company had 1,818 shares and zero shares of Series E convertible preferred stock issued and outstanding.
On January 27, 2017, the Company closed an underwritten offering of 1,818 shares of its Series E convertible preferred stock at a price to the public of $3,300 per share, for gross proceeds of approximately $6.0 million. The Company designated 1,818 shares of its authorized and unissued preferred stock as Series E convertible preferred stock and filed a Certificate of Designation of Preferences, Rights and Limitations of Series E Convertible Preferred Stock with the Delaware Secretary of State.
Each share of Series E Convertible Preferred Stock is convertible into 1,000 shares of the Company’s Common Stock at any time at the holder’s option. The holder, however, will be prohibited from converting Series E Convertible Preferred Stock into shares of common stock if, as a result of such conversion, the holder, together with its affiliates, would own more than 19.99% of the shares of the Company’s Common Stock then issued and outstanding, which percentage may change at the holders’ election to any other number less than or equal to 19.99% upon 61 days’ notice to the Company. In the event of the Company’s liquidation, dissolution, or winding up, holders of Series E Convertible Preferred Stock will receive a payment equal to $0.0001 per share of Series E Convertible Preferred Stock before any proceeds are distributed to the holders of common stock, after any proceeds are distributed to the holder of the Company’s Class UA Preferred Stock and on parity with any distributions to the holders of the Company’s Series A Convertible Preferred Stock, Series B Convertible Preferred Stock, Series C Convertible Preferred Stock and Series D Convertible Preferred Stock. Shares of Series E Convertible Preferred Stock will generally have no voting rights, except as required by law and except that the consent of holders of a majority of the outstanding Series E Convertible Preferred Stock will be required to amend the terms of the Series E Convertible Preferred Stock. Shares of Series E Convertible Preferred Stock will not be entitled to receive any dividends, unless and until specifically declared by the Company’s board of directors, and will rank:
| • | senior to all common stock; |
| • | senior to any class or series of capital stock created that specifically ranks by its terms junior to the Series E convertible preferred stock; |
| • | on parity with the Company’s Series A convertible preferred stock, Series B Convertible Preferred Stock, Series C convertible preferred stock and Series D convertible preferred stock, and any class or series of capital stock created that specifically ranks by its terms on parity with the Series E convertible preferred stock; and |
| • | junior to the Company’s Class UA preferred stock and any class or series of capital stock created that specifically ranks by its terms senior to the Series E convertible preferred stock; |
in each case, as to distributions of assets upon the Company’s liquidation, dissolution or winding up, whether voluntarily or involuntarily.
Beneficial Conversion Feature
A beneficial conversion feature exists when the effective conversion price of a convertible security is less than the market price per share on the commitment date, creating a discount. The value of the discount is determined by the difference between the market price and the conversion price multiplied by the potential conversion shares purchased. The discount is recognized as a non-cash deemed dividend from the date of issuance to the earliest conversion date.
The Company recognized a beneficial conversion feature as a non-cash dividend in the amount of $1.0 million, calculated as the number of potential conversion shares multiplied by the excess of the market price of its common stock over the price per conversion share of the Series E convertible preferred stock on the commitment date. The non-cash deemed dividend of $1.0 million was recorded in additional paid-in capital as a deemed dividend on the Series E convertible preferred stock, and was used in determining the net loss applicable to common stockholders in the consolidated statement of operations for the year ended December 31, 2017.
F-20
Table of Contents
Common stock
On June 8, 2017, the stockholders of the Company approved an amendment to the Company’s certificate of incorporation to increase the number of the Company’s authorized shares of common stock from 66,666,667 to 130,000,000. The Company filed the Certificate of Amendment to the Amended and Restated Certificate of Incorporation with the Delaware Secretary of State to effect such amendment.
On November 18, 2016, the Company’s stockholders approved a 1-for-6 reverse stock split and separately approved a decrease in the Company’s authorized shares of common stock from 200,000,000 to 66,666,667 shares. On a split-effected basis, authorized shares increased from 33,333,333 to 66,666,667 shares. The reverse stock split became effective on November 29, 2016.
As of December 31, 2017 and 2016, the Company had 130,000,000 shares and 66,666,667 shares of common stock, $0.0001 par value per share, authorized, respectively. The holders of common stock are entitled to receive such dividends or distributions as are lawfully declared on the Company’s common stock, to have notice of any authorized meeting of stockholders, and to exercise one vote for each share of common stock on all matters which are properly submitted to a vote of the Company’s stockholders. As a Delaware corporation, the Company is subject to statutory limitations on the declaration and payment of dividends. In the event of a liquidation, dissolution or winding up of the Company, holders of common stock have the right to a ratable portion of assets remaining after satisfaction in full of the prior rights of creditors, including holders of the Company’s indebtedness, all liabilities and the aggregate liquidation preferences of any outstanding shares of preferred stock. The holders of common stock have no conversion, redemption, preemptive or cumulative voting rights.
Amounts pertaining to issuances of common stock are classified as common stock on the consolidated balance sheet, approximately $5,060 and $2,256 of which represents par value of common stock as of December 31, 2017 and 2016, respectively. Additional paid-in capital primarily relates to amounts for equity financings and share-based compensation.
Warrants
In connection with certain equity and debt financings, the Company issued warrants to purchase shares of its common stock.
In February 2011, the Company issued 8,116 warrants, which were classified as equity, to purchase shares of common stock in connection with a Loan and Security Agreement entered into with General Electric Capital Corporation.
In June 2013, the Company issued warrants to purchase 833,333 shares of common stock, which were classified as equity, in connection with a registered direct offering to Biotechnology Value Fund, L.P. and other affiliates of BVF Partners L.P. (collectively, “BVF”).
A summary of outstanding warrants as of December 31, 2017 and 2016 and changes during the years are presented below.
| 2017 | 2016 | |||||||
| Shares Underlying Warrants |
Shares Underlying Warrants |
|||||||
| Balance, beginning of year |
841,449 | 841,449 | ||||||
|
|
|
|
|
|||||
| Balance, end of year |
841,449 | 841,449 | ||||||
|
|
|
|
|
|||||
The following table summarizes information regarding warrants outstanding at December 31, 2017:
| Exercise Prices |
Shares Underlying Outstanding Warrants |
Expiry Date | ||||||
| $18.48 |
8,116 | February 8, 2018 | ||||||
| $30.00 |
833,333 | December 5, 2018 | ||||||
|
|
|
|||||||
| 841,449 | ||||||||
|
|
|
|||||||
F-21
Table of Contents
Years Ended December 31, |
||||||||
| 2017 | 2016 | |||||||
| Shares underlying warrants outstanding classified as equity |
841,449 | 841,449 | ||||||
Equity Financings
On January 27, 2017, the Company closed an underwritten offering of 26,659,300 shares of its common stock at a price to the public of $3.30 per share, for gross proceeds of approximately $88.0 million. The shares included 3,477,300 shares of common stock sold pursuant to the over-allotment option granted by us to the underwriters, which option was exercised in full. In addition, the Company closed a concurrent underwritten offering of 1,818 shares of its Series E convertible preferred stock at a price to the public of $3,300 per share, for gross proceeds of approximately $6.0 million. Each share of Series E convertible preferred stock is non-voting and convertible into 1,000 shares of its common stock, provided that conversion will be prohibited if, as a result, the holder and its affiliates would beneficially own more than 19.99% of the common stock then outstanding. Aggregate gross proceeds from the offerings were approximately $94.0 million. Aggregate net proceeds from the offerings, after underwriting discounts and commissions and other expenses of $6.0 million, were approximately $88.0 million.
On June 28, 2016, the Company closed an underwritten public offering of 6,708,333 shares of its common stock at a price to the public of $4.80 per share for gross proceeds of $32.2 million. The shares include 875,000 shares of common stock sold pursuant to the over-allotment option granted by the Company to the underwriters, which option was exercised in full. In addition, the Company closed a registered direct offering of 17,250 shares of its Series D convertible preferred stock at a price of $800.00 per share directly to affiliates of BVF for gross proceeds of $13.8 million. Each share of Series D convertible preferred stock is non-voting and convertible into 1,000 shares of its common stock, provided that conversion will be prohibited if, as a result, the holder and its affiliates would beneficially own more than 19.99% of the common stock then outstanding. Aggregate gross proceeds from the offerings were approximately $46.0 million. Aggregate net proceeds from the offerings, after underwriting discounts, commissions and other expenses of $2.7 million, were approximately $43.3 million.
On February 6, 2015, the Company entered into two underwriting agreements with Jefferies LLC, as underwriter, for separate but concurrent offerings of the Company’s securities. On February 11, 2015, the Company closed concurrent but separate underwritten offerings of 2,250,000 shares of its common stock at a price to the public of $9.00 per share, for gross proceeds of approximately $20.3 million and 1,333 shares of its Series B convertible preferred stock at a price to the public of $1,500 per share, for gross proceeds of approximately $2.0 million. Each share of Series B convertible preferred stock is non-voting and convertible into 166.67 shares of the Company’s common stock, provided that conversion will be prohibited if, as a result, the holder and its affiliates would beneficially own more than 4.99% of the common stock then outstanding. As part of the common stock offering, the Company also granted the underwriters a 30-day option to purchase 337,500 additional shares of its common stock. On February 18, 2015, the Company closed a partial exercise of the underwriter’s option to purchase 199,943 additional shares of its common stock, at a price to the public of $9.00 per share, less underwriting discounts and commissions, which resulted in net proceeds to the Company of approximately $1.7 million. Aggregate gross proceeds from the offerings were approximately $24.0 million. Aggregate net proceeds from the offerings, after underwriting discounts, commissions and other expenses of $1.6 million, were approximately $22.4 million.
“At-the-Market” Equity Offering Program
On June 2, 2016, the Company entered into a Sales Agreement (the Sales Agreement) with Cowen and Company, LLC (Cowen) to sell shares of the Company’s common stock, par value $0.0001 per share, having aggregate sales proceeds of up to $50,000,000, from time to time, through an “at the market” equity offering program under which Cowen will act as sales agent. The Company terminated the Sales Agreement effective as of the close of business on January 23, 2017. No shares were sold under the Sales Agreement.
Net loss per share
Basic net loss per share is calculated by dividing net loss attributable to common stockholders, which may include a deemed dividend from the amortization of a beneficial conversion feature, by the weighted average number of shares outstanding for the period. Diluted net loss per share is calculated by adjusting the numerator and denominator of the basic net loss per share calculation for the effects of all potentially dilutive common shares. Potential dilutive shares of the Company’s common stock include stock options, restricted share units, warrants, Series A, B, C, D and E convertible preferred stock and shares granted under the 2010 ESPP. The calculation of diluted loss per share requires that, to the extent the average market price of the underlying shares for the reporting period exceeds the exercise price of the
F-22
Table of Contents
warrants and the presumed exercise of such securities are dilutive to loss per share for the period, adjustments to net loss used in the calculation are required to remove the change in fair value of the warrants for the period. Furthermore, adjustments to the denominator are required to reflect the addition of the related dilutive shares. Shares used to calculate basic and dilutive net loss per share for the years ended December 31, 2017, 2016 and 2015 were the same, since all potentially dilutive shares were anti-dilutive.
The following table is a reconciliation of the numerators and denominators used in the calculation of basic and diluted net loss per share computations for the years ended December 31, 2017, 2016 and 2015.
| Years Ended December 31, | ||||||||||||
| 2017 | 2016 | 2015 | ||||||||||
| (in thousands, except share and per share amounts) | ||||||||||||
| Numerator: |
||||||||||||
| Net loss attributable to common stockholders used to compute net loss per share |
||||||||||||
| Basic |
$ | (57,916 | ) | $ | (60,293 | ) | $ | (32,581 | ) | |||
|
|
|
|
|
|
|
|||||||
| Diluted |
$ | (57,916 | ) | $ | (60,293 | ) | $ | (32,581 | ) | |||
|
|
|
|
|
|
|
|||||||
| Denominator: |
||||||||||||
| Weighted average shares outstanding used to compute net loss per share: |
||||||||||||
| Basic |
47,966,493 | 19,264,121 | 16,102,860 | |||||||||
|
|
|
|
|
|
|
|||||||
| Diluted |
47,966,493 | 19,264,121 | 16,102,860 | |||||||||
|
|
|
|
|
|
|
|||||||
| Net loss per share—basic and diluted |
$ | (1.21 | ) | $ | (3.13 | ) | $ | (2.02 | ) | |||
|
|
|
|
|
|
|
|||||||
The following table presents the number of shares that were excluded from the number of shares used to calculate diluted net loss per share. The share data for the years ended December 31, 2017, 2016 and 2015 has been adjusted to reflect the 1-for-6 reverse stock split.
| Years Ended December 31, | ||||||||||||
| 2017 | 2016 | 2015 | ||||||||||
| Director and employee stock options |
3,170,542 | 1,866,711 | 1,225,194 | |||||||||
| Warrants |
841,449 | 841,449 | 841,449 | |||||||||
| Convertible preferred stock (as converted to common stock): |
||||||||||||
| Series A |
416,673 | 1,666,697 | 1,666,697 | |||||||||
| Series B |
888,851 | 888,851 | 888,851 | |||||||||
| Series C |
1,250,022 | 1,250,022 | 1,250,022 | |||||||||
| Series D |
2,875,055 | 2,875,055 | — | |||||||||
| Series E |
1,818,000 | — | — | |||||||||
| Employee restricted share units |
327,820 | — | — | |||||||||
| Non-employee director restricted share units |
95,999 | 81,619 | 38,157 | |||||||||
| Employee stock purchase plan |
4,237 | 1,830 | 449 | |||||||||
| 7. | SHARE-BASED COMPENSATION |
The Company uses the Black-Scholes option pricing model to value the options at each grant date, using the following weighted average assumptions:
| 2017 | 2016 | 2015 | ||||||||||
| Expected dividend rate |
0.00 | % | 0.00 | % | 0.00 | % | ||||||
| Expected volatility |
76.47 | % | 74.63 | % | 72.15 | % | ||||||
| Risk-free interest rate |
1.94 | % | 1.46 | % | 1.63 | % | ||||||
| Expected life of options in years |
5.69 | 6.22 | 6.00 | |||||||||
F-23
Table of Contents
The expected life represents the period that the Company’s stock options are expected to be outstanding and is based on historical data. The expected volatility is based on the historical volatility of the Company’s common stock for a period equal to the stock option’s expected life. The risk-free interest rate is based on the yield at the time of grant of a U.S. Treasury security with an expected term equivalent to the expected term of the option. The Company does not expect to pay dividends on its common stock. The amounts estimated according to the Black-Scholes option pricing model may not be indicative of the actual values realized upon the exercise of these options by the holders.
The Company recognizes share-based compensation expense net of estimated forfeitures. The forfeiture rate is estimated at the time of grant and revised, if necessary, in subsequent periods if actual forfeitures differ from estimates. The Company’s estimated forfeiture rate at the time of grant is based on its historical experience.
Share-based compensation expense under the 2016 Equity Incentive Plan (2016 EIP), the Amended and Restated Share Option Plan (the Option Plan), and for an inducement grant, was $3.2 million, 4.8 million and $2.1 million for the years ended December 31, 2017, 2016 and 2015, respectively. The Share-based compensation expense for the year ended December 31, 2016 included the acceleration of share-based compensation expense in connection with management changes in the first quarter of 2016. Total compensation cost related to non-vested stock options not yet recognized was $5.3 million as of December 31, 2017, which is expected to be recognized over the next 33 months on a weighted-average basis.
A summary of option activity under the 2016 EIP, Inducement Grant and Option Plan as of December 31, 2017, and changes during the year ended December 31, 2017 is presented below.
| Options |
Stock Options | Weighted Average Exercise Price |
Weighted Average Remaining Contractual Term |
Aggregate Intrinsic Value |
||||||||||||
| In US dollars ($US): |
||||||||||||||||
| Outstanding at January 1, 2017 |
1,866,711 | $ | 13.36 | |||||||||||||
| Granted |
1,508,623 | 4.27 | ||||||||||||||
| Exercised |
— | — | ||||||||||||||
| Forfeited |
(100,680 | ) | 13.08 | |||||||||||||
| Expired |
(104,112 | ) | 23.16 | |||||||||||||
|
|
|
|||||||||||||||
| Outstanding at December 31, 2017 |
3,170,542 | $ | 8.73 | 7.57 | $ | 1,128 | ||||||||||
|
|
|
|||||||||||||||
| Vested or expected to vest at December 31, 2017 |
2,940,709 | $ | 9.02 | 7.45 | $ | 976 | ||||||||||
|
|
|
|||||||||||||||
| Vested and exercisable at December 31, 2017 |
1,096,633 | $ | 14.57 | 5.25 | $ | — | ||||||||||
|
|
|
|||||||||||||||
The weighted average grant-date fair values of options granted were $2.81, $4.53 and $13.40 for the years ended December 31, 2017, 2016 and 2015, respectively.
The aggregate intrinsic value is calculated as the difference between the exercise price of the underlying awards and the quoted price of the Company’s common stock for all options that were in-the-money at December 31, 2017. The total fair value of stock options vested during the years ended December 31, 2017, 2016 and 2015 was $10.9 million, $10.6 million and $8.0 million, respectively. No stock options were exercised for the year ended December 31, 2017 and 2016. There were 3,324 stock options exercised for the year ended December 31, 2015. Cash received from stock option exercises and the total intrinsic value of stock option exercises for the year ended December 31, 2017 and 2016 was zero. Cash received from stock option exercises and the total intrinsic value of stock option exercises for the years ended December 31, 2015 were $34,568 and $39,859, respectively. As of December 31, 2017, there was no exercisable, in-the-money stock options based on the Company’s closing share price of $3.70 on The Nasdaq Global Market.
2016 Equity Incentive Plan
On June 23, 2016, the Company’s stockholders approved the 2016 EIP. As of that date, the Company ceased granting options under its Option Plan, ceased granting restricted shares units under its Amended and Restated RSU Plan (the RSU Plan) and transferred the remaining shares available for issuance under the Option Plan and the RSU Plan to the 2016 EIP. As of the effective date of the 2016 EIP, 1,200,905 shares of common stock were reserved for issuance under
F-24
Table of Contents
the 2016 EIP, consisting of 1,050,000 shares available for awards under the 2016 EIP plus 82,884 and 68,021 shares of common stock previously reserved but unissued under the Option Plan and the RSU Plan, respectively, that were available for issuance under the 2016 EIP on the effective date of the 2016 EIP. On June 8, 2017, the Company’s stockholders approved an amendment to the 2016 EIP to increase the total shares of common stock available for issuance under the 2016 EIP from 1,200,905 shares to 7,900,905 shares. As of December 31, 2017, there were 5,723,523 shares of common stock available for future grant under the 2016 EIP.
All grants under the 2016 EIP may have a term up to ten years from the date of grant. Vesting schedules are determined by the compensation committee of the board of directors or its designee when each award is granted. Upon vesting of RSUs granted to employees, a portion of the RSUs will be settled in cash equivalent to the employee’s minimum required withholding tax on the value of the vested RSUs. The Company measures and recognizes compensation expense for equity-classified restricted stock units (RSUs), and stock options granted to its employees based on the fair value of the awards on the date of grant. The fair value of each RSU was determined to be the closing trading price of the Company’s common shares on the date of grant as quoted in Nasdaq Global Market. The fair value of stock options is estimated at the date of grant using the Black-Scholes option pricing model. Share-based compensation expense for equity-classified RSUs, and stock options is recognized on a straight-line basis over the requisite service period, which is generally the vesting period of the respective award. RSU grants made to its non-employee directors are classified as liabilities. Share-based compensation expense for liability-classified RSUs are re-measured at each reporting date until settlement of the award.
A summary of the RSU activity under the 2016 EIP as of December 31, 2017, and changes during such year is presented below:
| Restricted Share Units to Employees |
Restricted Share Units |
Weighted Average Fair Value per Unit |
||||||
| Non-vested at January 1, 2017 |
— | $ | — | |||||
| Granted |
335,920 | 4.24 | ||||||
| Forfeited |
(8,100 | ) | 4.55 | |||||
|
|
|
|||||||
| Non-vested at December 31, 2017 |
327,820 | $ | 3.70 | |||||
|
|
|
|||||||
| Expected to vest at December 31, 2017 |
327,820 | $ | 3.70 | |||||
|
|
|
|||||||
| Restricted Share Units to Non-Employee Directors |
Restricted Share Units |
Weighted Average Fair Value per Unit |
||||||
| Non-vested at January 1, 2017 |
54,348 | $ | 4.31 | |||||
| Granted |
95,999 | 3.65 | ||||||
| Converted |
(54,348 | ) | 3.86 | |||||
|
|
|
|||||||
| Non-vested at December 31, 2017 |
95,999 | $ | 3.70 | |||||
|
|
|
|||||||
| Expected to vest at December 31, 2017 |
95,999 | $ | 3.70 | |||||
|
|
|
|||||||
Under the 2016 EIP, the Company granted 95,999 RSUs with a fair value of approximately $350,000 and 54,348 RSUs with a fair value of $300,000 to its non-employee directors for the year ended December 31, 2017 and 2016, respectively. The Company issued 54,348 shares to its non-employee directors upon conversion of RSUs for the year ended December 31, 2017. Upon vesting, RSUs of 54,348 with a weighted average fair value of $3.86 were converted into 54,348 shares of common stock for the years ended December 31, 2017. The Company withheld 13,590 shares of the 54,348 for the year ended December 31, 2017. The Company delivered to non-employee directors cash totaling $52,412, which was equal to the fair value of the shares withheld on the vesting date in order to facilitate satisfaction of the non-employee directors’ income tax obligation with respect to the vested RSUs for the years ended December 31, 2017. As of December 31, 2017, there was no unrecognized compensation cost related to unvested RSUs.
Share option plan
The Company sponsored an Option Plan under which a maximum fixed reloading percentage of 10% of the issued and outstanding common shares of the Company may be granted to employees, directors, and service providers. Prior to April 1, 2008, options were granted with a per share exercise price, in Canadian dollars, equal to the closing market price of the Company’s shares of common stock on the Toronto Stock Exchange on the date immediately preceding the date of the grant. After April 1, 2008, options were granted with a per share exercise price, in U.S. dollars, equal to the closing price of the Company’s shares of common stock on The Nasdaq Global Market on the date of grant. During the year ended December 31, 2016, the Company granted 313,040 stock options under the Option Plan. No stock options were
F-25
Table of Contents
exercised under the Option Plan during the year ended December 31, 2016. On June 23, 2016, the stockholders approved the 2016 EIP and the Company ceased granting options under the Option Plan. Options granted under the Option Plan prior to January 2010 began vesting after one year from the date of grant, are exercisable in equal amounts over four years on the anniversary date of the grant, and expire eight years following the date of grant. Options granted to employees under the Option Plan after January 2010 vest 25% on the first anniversary of the vesting commencement date, with the balance vesting in monthly increments for 36 months following the first anniversary of grant, and expire eight years following the date of grant. Due to the adoption of the 2016 EIP on June 23, 2016, all shares remaining for future grant under the Option Plan were transferred to the 2016 EIP plan leaving no shares of common stock available for future grant under the Option Plan.
Inducement Grant
On April 4, 2016, the Company made an inducement stock option grant (Inducement Grant) of 474,810 options. Options granted under the Inducement Grant vest 25% on the first anniversary of the vesting commencement date, with the balance vesting in monthly increments for 36 months following the first anniversary of grant, and expire ten years following the date of grant. No stock options were exercised under the inducement grant during the year ended December 31, 2017.
Restricted share unit plan
The RSU Plan was established in 2005 for non-employee directors. On June 23, 2016, the stockholders approved the 2016 EIP and the Company ceased granting RSUs under the RSU Plan.
The RSU Plan provided for grants to be made from time to time by the board of directors or a committee thereof. RSU grants to non-employee directors are classified as liabilities. The fair value of each RSU was determined to be the closing trading price of the Company’s common shares on the date of grant as quoted in Nasdaq Global Market. Each RSU granted was made in accordance with the RSU Plan and terms specific to that grant. Outstanding RSUs under the RSU Plan have a vesting term of one to two years. Approximately 75% of each RSU represents a contingent right to receive approximately 0.75 of a share of the Company’s common stock upon vesting and approximately 25% represents a contingent right to receive cash, equivalent to the value of 0.25 of a share, upon vesting without any further consideration payable to the Company in respect thereof. For the contingent right to receive cash, the Company is required to deliver an amount in cash equal to the fair market value of these shares on the vesting date to facilitate the satisfaction of the non-employee directors’ U.S. federal income tax obligation with respect to the vested RSUs. The outstanding RSU awards are required to be re-measured at each reporting date until settlement of the award, and changes in valuation are recorded as compensation expense for the period. The fair value of the outstanding RSUs on the reporting date was determined to be the closing trading price of the Company’s common shares on that date.
Upon vesting, RSUs of 27,271,10,893 and 16,308 with a weighted average fair value per unit of $3.87, $18.36 and $22.75 were converted into 27,271, 10,893 and 16,308 shares of common stock for the years ended December 31, 2017, 2016 and 2015, respectively. Pursuant to an October 2011 amendment to the Company’s RSU Plan, the Company withheld 6,819 shares of the 27,271 for the year ended December 31, 2017, 2,723 shares of the 10,893 RSUs for the year ended December 31, 2016 and 4,078 shares of the 16,308 RSUs for the year ended December 31, 2015. The Company delivered to its non-employee directors cash totaling $26,395, $20,098 and $92,759, which was equal to the fair value of the shares withheld on the vesting date in order to facilitate satisfaction of the non-employee directors’ income tax obligation with respect to the vested RSUs for the years ended December 31, 2017, 2016 and 2015, respectively.
Upon the adoption of the 2016 EIP on June 23, 2016, all shares remaining for future grant under the RSU Plan became available for issuance under the 2016 EIP plan and the Company ceased granting RSUs under the RSU Plan.
A summary of the RSU activity under the RSU Plan as of December 31, 2017, and changes during the year ended December 31, 2017 is presented below:
| Restricted Share Units |
Restricted Share Units |
Weighted Average Fair Value per Unit |
||||||
| Non-vested at January 1, 2017 |
27,271 | $ | 4.31 | |||||
| Converted |
(27,271 | ) | 3.87 | |||||
|
|
|
|||||||
| Non-vested at December 31, 2017 |
— | $ | — | |||||
|
|
|
|||||||
| Expected to vest at December 31, 2017 |
— | $ | — | |||||
|
|
|
|||||||
F-26
Table of Contents
As of December 31, 2017, there was no unrecognized compensation cost related to unvested RSUs. Under the RSU Plan, the re-measurement of the outstanding RSUs together with the grant and conversion of the RSUs resulted in a reduction of $11,980 and $0.3 million in share-based compensation expense recorded in general and administrative expenses in the consolidated statement of operations for the years ended December 31, 2017 and 2016, respectively. The re-measurement of the outstanding RSUs together with the grant and conversion of the RSUs resulted in $0.6 million in share-based compensation expense recorded in general and administrative expenses in the consolidated statement of operations for the years ended December 31, 2015.
Employee Stock Purchase Plan (ESPP)
The Company adopted an ESPP on June 3, 2010, pursuant to which a total of 150,000 shares of common stock were reserved for sale to employees of the Company. The ESPP is administered by the compensation committee of the board of directors and is open to all eligible employees of the Company. Under the terms of the ESPP, eligible employees may purchase shares of the Company’s common stock at six month intervals during 18-month offering periods through their periodic payroll deductions, which may not exceed 15% of any employee’s compensation and may not exceed a value of $25,000 in any calendar year, at a price not less than the lesser of an amount equal to 85% of the fair market value of the Company’s common stock at the beginning of the offering period or an amount equal to 85% of the fair market value of the Company’s common stock on each purchase date. The maximum aggregate number of shares that may be purchased by each eligible employee during each offering period is 15,000 shares of the Company’s common stock.
Fair value of shares purchases under the Company’s ESPP was estimated at subscription dates using a Black-Scholes valuation model, which requires the input of highly subjective assumptions including expected stock price volatility and expected term. The expected volatility is based on the historical volatility of the Company’s common stock for a period equal to the ESPP’s expected term, which is determined by length of time between the subscription date and the purchase date. The risk-free interest rate is based on the yield at the time of grant of a U.S. Treasury security with an equivalent expected term of the ESPP. The Company does not expect to pay dividends on its common stock.
For the year ended December 31, 2017, 2016 and 2015, expense related to this plan was $0.2 million, $0.1 million and $0.1 million, respectively. As of December 31, 2017, there are 4,237 shares reserved for future purchases and there was approximately $0.1 million of unrecognized compensation cost related to the ESPP, which is expected to be recognized over an estimated weighted-average period of 1.04 years. The following table summarizes information for shares issued under the ESPP for the years ended December 31, 2017, 2016 and 2015:
| Shares Issued for the Years Ended December 31, | ||||||||||||
| Purchase Prices |
2017 | 2016 | 2015 | |||||||||
| $2.81 |
65,437 | — | — | |||||||||
| $4.45 |
— | 10,900 | — | |||||||||
| $5.10 |
— | 8,261 | — | |||||||||
| $8.94 |
— | — | 4,698 | |||||||||
| $9.72 |
— | — | 1,899 | |||||||||
| $11.10 |
— | — | 4,656 | |||||||||
|
|
|
|
|
|
|
|||||||
| Total |
65,437 | 19,161 | 11,253 | |||||||||
|
|
|
|
|
|
|
|||||||
| 8. | COLLABORATIVE AND LICENSE AGREEMENTS |
Array BioPharma, Inc.
On December 11, 2014, the Company entered into a License Agreement (the License Agreement) with Array BioPharma Inc. (Array). Pursuant to the License Agreement, Array granted the Company an exclusive license to develop, manufacture and commercialize tucatinib (previously known as ONT-380), an orally active, reversible and selective small-molecule HER2 inhibitor.
F-27
Table of Contents
Under the terms of the License Agreement, the Company paid Array an upfront fee of $20 million, which was recorded as part of research and development expense upon initiation of the exclusive license agreement. In addition, if the Company sublicenses rights to tucatinib to a third party, the Company will pay Array a percentage of any sublicense payments it receives, with the percentage varying according to the stage of development of tucatinib at the time of the sublicense. Array is also entitled to receive up to a low double-digit royalty based on net sales of tucatinib by the Company and a single-digit royalty based on net sales of tucatinib by the Company’s sublicensees. The term of the license agreement expires on a country-by-country basis upon the later of the expiration of the last valid claim covering tucatinib within that country or 10 years after the first commercial sale of tucatinib within that country.
The License Agreement will expire on a country-by-country basis 10 years following the first commercial sale of the product in each respective country, but may be terminated earlier by either party upon material breach of the License Agreement by the other party or the other party’s insolvency, or by the Company on 180 days’ notice to Array. The Company and Array have also agreed to indemnify the other party for certain of their respective warranties and obligations under the License Agreement.
STC.UNM
Effective June 30, 2014, Alpine Biosciences, Inc, (Alpine) entered into an exclusive license agreement with STC.UNM, by assignment from The Regents of the University of New Mexico, to license the rights to use certain technology relating to protocells, a mesoporous silica nanoparticle delivery platform. The Company subsequently acquired Alpine in August 2014. Under the terms of the license agreement, the Company, as successor to Alpine, had the right to conduct research, clinical development and commercialize all inventions and products that are developed from the platform technology in certain fields of use as described in the license agreement.
On May 5, 2016, the Company entered into an agreement with STC.UNM to terminate the license agreement relating to protocell technology. The agreement provided for a mutual release of claims and payment of a termination and license fee totaling $325,000. As a result of the termination and the Company’s intent to no longer develop, license or commercialize the protocell technology, the indefinite-lived intangible assets acquired in the 2014 acquisition of Alpine were considered impaired. Accordingly, $19.7 million was fully written-off and recorded as intangible asset impairment in the Company’s consolidated statements of operations for the year ended December 31, 2016. The indefinite-lived intangible assets represent the value assigned to in-process research and development when the Company acquired the protocell technology. The Company also recognized a $6.9 million tax benefit during the year ended December 31, 2016, upon the reversal of its deferred tax liability, which solely relates to the indefinite-lived intangible assets. In addition, $1.5 million of previously recorded time-based milestones for license fees associated with the STC.UNM license agreement was reversed from research and development expenses during year ended December 31, 2016. The impairment charge did not result in any significant future cash expenditures, or otherwise impact the Company’s liquidity or cash. Please refer to the “Note 5 – Intangible Asset Impairment” and “Note 10 — Income Tax” of the audited financial statements included in this report for additional information.
Sentinel Oncology Ltd.
In April 2014, the Company entered into an exclusive license and research collaboration agreement with Sentinel Oncology Limited (Sentinel) for the development of novel small molecule Chk1 kinase inhibitors. Under the agreement, the Company has made payments to Sentinel to support their chemistry research. The Company is responsible for preclinical and clinical development, manufacturing and commercialization of any resulting compounds. Sentinel is eligible to receive success-based development and commercial milestone payments up to approximately $90 million based on development and commercialization events, including a $1.0 million milestone for the initiation of GLP toxicology studies and certain payments related to the initiation of certain clinical trials, regulatory approval and first commercial sale. Sentinel is also entitled to a single-digit royalty based on net sales.
| 9. | NET INVESTMENT AND OTHER INCOME (EXPENSE) |
Net investment and other income (expense) include the following components for the periods indicated:
| Years Ended December 31, | ||||||||||||
| 2017 | 2016 | 2015 | ||||||||||
| (In thousands) | ||||||||||||
| Investment income, net |
$ | 1,065 | $ | 240 | $ | 73 | ||||||
| Net foreign exchange gain (loss) |
(5 | ) | 1 | (5 | ) | |||||||
| Gain (loss) on sale of equipment |
170 | (69 | ) | 7 | ||||||||
| Gain on sale of investment |
— | — | — | |||||||||
| Impairment expense |
(75 | ) | — | — | ||||||||
| Other income |
— | 50 | 5 | |||||||||
|
|
|
|
|
|
|
|||||||
| Total investment and other income, net |
$ | 1,155 | $ | 222 | $ | 80 | ||||||
|
|
|
|
|
|
|
|||||||
F-28
Table of Contents
| 10. | INCOME TAX |
The provision (benefit) for income taxes consists of the following:
| 2017 | 2016 | 2015 | ||||||||||
| (In thousands) | ||||||||||||
| Current income tax expense (benefit) |
$ | — | $ | — | $ | — | ||||||
| Deferred income tax expense (benefit) |
— | (6,908 | ) | — | ||||||||
|
|
|
|
|
|
|
|||||||
| Total income tax expense (benefit) |
$ | — | $ | (6,908 | ) | $ | — | |||||
|
|
|
|
|
|
|
|||||||
The Company recorded an income tax benefit of $6.9 million in 2016 due to the reversal of its deferred tax liability, which related solely to the impairment of the indefinite-lived intangible asset.
Tax Reform
The Tax Cuts and Jobs Act (“U.S. Tax Act”) was enacted on December 22, 2017. At December 31, 2017, the Company has not completed accounting for the tax effects of enactment of the Act; however, in certain cases, as described below, the Company has made a reasonable estimate of the effects on its existing deferred tax balances. In all cases, the Company will continue to make and refine its calculations as additional analysis is completed. In addition, its estimates may also be affected as the Company gains a more thorough understanding of the tax law.
The U.S. Tax Act reduces the U.S. federal corporate tax rate from 35% to 21% beginning in 2018. The impact of the U.S. Tax Act for the Company is estimated to be a $50.1 million reduction in the Company’s net deferred tax assets to reflect the new statutory rate at which they are expected to reverse. The rate adjustment to the net deferred tax assets is a component of income tax expense and is fully offset by a decrease in the valuation allowance so there is no impact to the Company’s total tax expense.
Starting in 2018, companies may be subject to global intangible low tax income (“GILTI”) which is a tax on foreign income in excess of a deemed return on tangible assets of foreign corporations as well as the new base erosion anti-abuse tax (“BEAT”) under the TCJA. GILTI will be effectively taxed at a tax rate of 10.5%. Due to the complexity of the GILTI tax rules, companies are allowed to make an accounting policy choice of either (1) treating taxes due on future U.S. inclusions in taxable income related to GILTI as a current-period expense when incurred or (2) factoring such amounts into a company’s measurement of its deferred taxes under the SAB 118. The Company has not yet made an election with respect to GILTI. The Company will continue to review the GILTI and BEAT rules to determine their applicability to the company as the rules become effective.
The provision for income taxes was different from the expected statutory federal income tax rate as follows:
| 2017 | 2016 | 2015 | ||||||||||
| Tax benefit at statutory rate |
35.0 | % | 35.0 | % | 35.0 | % | ||||||
| Change in fair value of warrant liability |
0.0 | 0.0 | 0.1 | |||||||||
| Stock based compensation |
(1.6 | ) | (0.9 | ) | 0.8 | |||||||
| Other |
0.0 | 0.4 | 0.4 | |||||||||
| Tax law changes |
(88.1 | ) | 0.0 | 0.0 | ||||||||
| Change in valuation allowance |
54.7 | (23.7 | ) | (40.0 | ) | |||||||
| Net operating loss expiration and true ups |
0.0 | 0.0 | 3.7 | |||||||||
|
|
|
|
|
|
|
|||||||
| Income tax benefit (provision) |
0.0 | % | 10.8 | % | 0.0 | % | ||||||
|
|
|
|
|
|
|
|||||||
F-29
Table of Contents
The Company’s net deferred tax assets and deferred tax liabilities were recorded in other assets and accrued and other liabilities, respectively on the Consolidated Balance Sheets and consist of the following as of December 31, 2017 and 2016:
| 2017 | 2016 | |||||||
| (In thousands) | ||||||||
| Deferred tax assets |
||||||||
| Accrued expenses and other |
$ | 623 | $ | 1,510 | ||||
| Tax benefits from losses carried forward and tax credits |
126,552 | 147,001 | ||||||
| Stock based compensation |
2,547 | 4,119 | ||||||
| Intangible assets |
5,312 | 9,776 | ||||||
| Other |
242 | 207 | ||||||
|
|
|
|
|
|||||
| Total deferred tax assets |
$ | 135,276 | $ | 162,613 | ||||
| Valuation allowance |
(135,180 | ) | (162,414 | ) | ||||
|
|
|
|
|
|||||
| Net deferred tax assets |
96 | 199 | ||||||
|
|
|
|
|
|||||
| Deferred tax liabilities |
||||||||
| Prepaid expenses |
96 | 199 | ||||||
| Intangible asset |
— | — | ||||||
|
|
|
|
|
|||||
| Total deferred tax liabilities |
96 | 199 | ||||||
| Net deferred tax liability |
$ | — | $ | — | ||||
|
|
|
|
|
|||||
Based on the available evidence, the Company has recorded a full valuation allowance against its net deferred income tax assets as it is more likely than not that the benefit of these deferred tax assets will not be realized. The valuation allowance decreased by $27.2 million and increased by $17.0 million during the years ended December 31, 2017 and December 31, 2016, respectively.
The Company has recorded the following reserve for uncertain tax positions as of December 31, 2017, 2016 and 2015:
| 2017 | 2016 | 2015 | ||||||||||
| (In thousands) | ||||||||||||
| Balance at January 1 |
$ | 662 | $ | 662 | $ | 545 | ||||||
| Increase related to prior year tax positions |
117 | |||||||||||
| Decrease related to current year tax positions |
— | — | — | |||||||||
| Lapses of statute of limitations |
— | — | — | |||||||||
|
|
|
|
|
|
|
|||||||
| Balance at December 31 |
$ | 662 | $ | 662 | $ | 662 | ||||||
|
|
|
|
|
|
|
|||||||
None of the unrecognized tax benefits that, if recognized, would affect the effective tax rate due to valuation allowance. We are currently not under audit by the federal, state and foreign tax authorities. We do not believe that it is reasonably possible that the total amounts of unrecognized tax benefit will materially increase or decrease within the next 12 months.
United States
The Company has accumulated net operating losses of $317.1 million and $260.0 million for United States federal tax purposes at December 31, 2017 and 2016, respectively, some of which are restricted pursuant to Section 382 of the Internal Revenue Code, and which may not be available entirely for use in future years. These losses expire in fiscal years 2018 through 2037. The Company has federal research and development tax credit carryforwards of $0.7 million that will expire in fiscal years 2018 through 2029, if not utilized.
Canada
The Company has unclaimed Canada federal investment tax credits of $16.2 million and $15.2 million at December 31, 2017 and 2016, respectively, that expire in fiscal years 2018 through 2028. The Company has scientific research & experimental development expenditures of $109.1 million and $102.1 million for Canada federal purposes and $47.8 million and $44.7 million for provincial purposes at December 31, 2017 and 2016, respectively. These expenditures may
F-30
Table of Contents
be utilized in any period and may be carried forward indefinitely. The Company also has Canada federal capital losses of $150.2 million and $140.6 million and provincial capital losses of $150.3 million and $140.7 million at December 31, 2017 and 2016, respectively, which can be carried forward indefinitely to offset future capital gains. The Company has accumulated net operating losses of $5.2 million and $4.8 million at December 31, 2017 and 2016 for Canada federal tax purposes and $3.4 million and $3.1 million at December 31, 2017 and 2016 for provincial purposes which expire between 2026 and 2036. The Company is subject to examination by the Canada Revenue Agency for years after 2008. However, carryforward attributes that were generated prior to 2008 may still be adjusted by a taxing authority upon examination if the attributes have been or will be used in a future period.
Australia
The Company formed an Australian entity in late 2017. The Australian entity has accumulated net operating losses of $0.2 million at December 31, 2017. A full valuation allowance has been recorded against its net deferred income tax assets.
Other
The Company files federal and foreign income tax returns in the United States and abroad. For U.S. federal income tax purposes, the statute of limitations is open for 1998 and onward for the United States and Canada due to net operating loss carried forwards.
ASU 2016-09
In 2017, the Company adopted ASU 2016-09 Stock Compensation: Improvements to Employee Share-Based Payment Accounting. As a result, the net operating loss deferred tax asset has increased by $5,000 as a result of the inclusion of the net operating losses related to excess tax benefits. The increase in the deferred tax asset was offset by a full valuation allowance.
| 11. | CONTINGENCIES, COMMITMENTS, AND GUARANTEES |
On January 9, 2016, the Company adopted a Retention Payment Plan, effective as of January 11, 2016 (Retention Plan), to provide cash retention payments to certain employees in order to induce such employees to remain employed through January 10, 2017 (Retention Date). Any employee who participated in the Retention Plan and (i) remained continuously employed by the Company through the Retention Date or (ii) had been terminated by the Company other than for cause prior to the Retention Date, and (iii) signed a general release of claims was paid a lump-sum cash payment as determined on an individual basis. If such employee’s service was terminated for cause or the employee voluntarily resigned prior to the Retention Date, no such payments were to be made. In January 2017, the Company paid $2.5 million related to this plan. An expense of $0.1 million and $2.3 million related to the Retention Plan was recorded in the consolidated statement of operations for the year ended December 31, 2017 and 2016, respectively. As of December 31, 2017, there were no liabilities recorded under the Retention Plan, since all obligations under the Retention Plan were paid in full.
Royalties
Pursuant to various license agreements, the Company may be obligated to make payments based on the achievement of certain event-based milestones, a percentage of revenues derived from the licensed technology and royalties on net sales. As of December 31, 2017, no payments were obligated as there were no milestones achieved, no technology licensed and the Company had no net sales, as defined in the agreements. As such, the Company is not currently contractually committed to any significant quantifiable payments for licensing fees, royalties or other contingent payments.
Employee benefit plan
Under a defined contribution plan available to permanent employees, the Company is committed to matching employee contributions up to limits set by the terms of the plan, as well as limits set by U.S. tax authorities. The Company’s matching contributions to the plan totaled $0.3 million, $0.2 million and $0.2 million for the years ended December 31, 2017, 2016 and 2015, respectively. There were no changes to the plan during the year ended December 31, 2017.
F-31
Table of Contents
Lease obligations — operating leases
The Company is committed to annual minimum payments under operating lease agreements for its office and laboratory space and equipment) as follows (in thousands):
| Year Ending December 31, |
||||
| 2018 |
$ | 849 | ||
| 2019 |
1,368 | |||
| 2020 |
1,410 | |||
| 2021 |
1,454 | |||
| 2022 |
499 | |||
| Thereafter |
— | |||
|
|
|
|||
| Total |
$ | 5,580 | ||
|
|
|
|||
Rental expense for operating leases in the amount of $0.5 million has been recorded in the consolidated statements of operations for each of the years ended December 31, 2017, 2016 and 2015.
On December 4, 2017, the Company entered into a lease for a new office location in Seattle, Washington totaling approximately 44,050 rentable square feet (the “New Lease”). The New Lease commenced on January 1, 2018and expires on April 30, 2022. The lease provides for a monthly base rent of $110,125 in 2018, increasing to $124,808 in 2022.
In May 2008, the Company entered into a lease for a facility in Seattle, Washington totaling approximately 17,000 square feet, which was amended in November 2016 to add approximately 2,600 square feet. The lease provided for a monthly base rent of $47,715, increasing to $57,910 in 2018. In connection with the execution of the New Lease, on December 4, 2017, the Company entered into a lease termination agreement for the early termination of the lease dated May 9, 2008 without an early termination fee. In January 2018, the Company terminated the lease.
The Company has also entered into operating lease obligations through November 2019 for certain office equipment, which are included in the table above.
Guarantees
In the normal course of operations, the Company indemnifies counterparties in transactions such as purchase and sale contracts for assets or shares, manufacturing and other service agreements, license agreements, director/officer contracts and leasing transactions. These indemnification agreements may require the Company to compensate the counterparties for costs incurred to third parties as a result of various events, including changes in (or in the interpretation of) laws and regulations, the Company’s breach of contract or negligence, environmental liabilities, or as a result of litigation claims or statutory sanctions that may be suffered by the counterparties as a consequence of the transaction. The terms of these indemnification agreements vary based upon the contract, the nature of which prevents the Company from making a reasonable estimate of the maximum potential amount that could be required to pay to counterparties. Historically, the Company has not made any significant payments under such indemnification agreements and no amounts have been accrued in the accompanying consolidated financial statements with respect to these indemnification agreements.
| 12. | RELATED PARTY TRANSACTIONS |
Certain of the Company’s affiliates participated in the Company’s recent public underwritten offerings. In January 2017, the Company closed an underwritten offering of 26,659,300 shares of its common stock at a price of $3.30 per share, for gross proceeds of $88.0 million, and 1,818 shares of its Series E convertible preferred stock at a price of $3,300 per share for gross proceeds of $6.0 million. In this offering, affiliates of New Enterprise Associates, a holder of more than 5% of the Company’s outstanding common stock, purchased 1,818 shares of the Company’s Series E preferred stock for an aggregate purchase price of $6.0 million. In June 2016, the Company closed an underwritten public offering of 6,708,333 shares of our common stock at a price to the public of $4.80 per share, for gross proceeds of $32.2 million, and 17,250 shares of its Series D convertible preferred stock at a price of $800.00 per share for gross proceeds of $13.8 million. In this offering, affiliates of BVF, a holder of more than 5% of the Company’s outstanding common stock, purchased 17,250 shares of the Company’s Series D preferred stock for an aggregate purchase price of $13.8 million.
F-32
Table of Contents
In January 2016, the Company appointed Mr. Mark Lampert as a member of the board of directors as a Class I director of the Company. Mr. Lampert is an affiliate of BVF. On January 17, 2017, Mr. Mark Lampert resigned from the board of directors.
In December 2017, the Company entered into an agreement with CTI BioPharma, Corp (CTI) to sublease property located at 3101 Western Avenue, Seattle, Washington. BVF, a holder of more than 5% of the Company’s outstanding common stock, is a greater than 10% stockholder of CTI, and Mr. Lampert, who resigned from the Company’s board of directors in January 2017, may be deemed to be a beneficial owner of BVF.
Recovery of Stockholder Short-Swing Profit
In August 2016 and November 2017, the Company received a payment of $0.2 million and $0.3 million, respectively, from a related-party stockholder in settlement of a short-swing profit claim under Section 16(b) of the Securities Exchange Act of 1934. The Company recognized these proceeds as a capital contribution from a stockholder, and recorded it as an increase to additional paid-in capital in its Consolidated Balance Sheets as of December 31, 2016 and 2017, respectively.
| 13. | SUBSEQUENT EVENTS |
On January 31, 2018, the Company announced the signing of a definitive merger agreement under which Seattle Genetics has agreed to acquire the Company. Under the terms of the agreement, Seattle Genetics will pay $10.00 per share in cash, or approximately $614 million. The transaction was unanimously approved by the Boards of Directors of both companies.
Under the terms of the definitive merger agreement, on February 8, 2018, Merger Sub commenced a tender offer on or about February 8, 2018 to acquire all of the outstanding shares of common stock of the Company for $10 per share in cash. The tender offer is subject to customary closing conditions, including the tender of at least a majority of the outstanding shares of the Company’s common stock (on a fully diluted basis) and the expiration or early termination of the applicable waiting period under the Hart-Scott-Rodino Antitrust Improvements Act of 1976. Following the closing of the tender offer, a wholly-owned subsidiary of Seattle Genetics will merge with and into the Company, with each share of the Company’s common stock that has not been tendered being converted into the right to receive the same $10 per share in cash offered in the tender offer. The transaction is anticipated to close in the first quarter of 2018.
| 14. | CONDENSED QUARTERLY FINANCIAL DATA (unaudited) |
The following table contains selected unaudited statement of operations information for each quarter of 2017 and 2016. The unaudited information should be read in conjunction with the Company’s audited financial statements and related notes included elsewhere in this report. The Company believes that the following unaudited information reflects all normal recurring adjustments necessary for a fair presentation of the information for the periods presented. The operating results for any quarter are not necessarily indicative of results for any future period.
Quarterly Financial Data:
| Three Months Ended, | ||||||||||||||||
| March 31 | June 30 | September 30 | December 31 | |||||||||||||
| (In thousands, except per share data) | ||||||||||||||||
| 2017 |
||||||||||||||||
| Operating expenses (1) |
$ | 11,562 | $ | 15,021 | $ | 14,358 | $ | 17,148 | ||||||||
| Net loss attributable to common stockholders (3) |
(12,384 | ) | (14,709 | ) | (14,061 | ) | (16,762 | ) | ||||||||
| Net loss per share — basic and diluted(2) |
(0.30 | ) | (0.30 | ) | (0.28 | ) | (0.33 | ) | ||||||||
| 2016 |
||||||||||||||||
| Operating expenses (1) |
$ | 12,970 | $ | 30,483 | $ | 10,792 | $ | 10,590 | ||||||||
| Net loss attributable to common stockholders (3) |
(12,887 | ) | (25,132 | ) | (11,762 | ) | (10,512 | ) | ||||||||
| Net loss per share — basic and diluted(2) |
(0.81 | ) | (1.57 | ) | (0.52 | ) | (0.47 | ) | ||||||||
| (1) | Operating expenses for the three months ended March 31, 2016 includes a cash severance and insurance benefits of $1.6 million and non-cash compensation expense of $2.3 million due to the acceleration of share-based compensation related to changes in management in January 2016. Operating expenses for the three months ended June 30, 2016 includes an intangible asset impairment charge of $19.7 million in connection with our termination of the STC.UNM license agreement and a $1.5 million reversal of the previously recorded time-based milestones for license fees in connection with the termination of the STC.UNM license agreement (see Note 8). |
F-33
Table of Contents
| (2) | Basic and diluted net loss per share for all periods presented have been adjusted retroactively to reflect the 1-for-6 reverse stock split. |
| (3) | Net loss attributable to common stockholders for the three months ended June 30, 2016 included an income tax benefit of $6.9 million due to the reversal of its deferred tax liability, which related solely to the impairment of the indefinite-lived intangible asset (see Note 8), and a $1.6 million deemed dividend related to the beneficial conversion feature on our Series D convertible preferred stock. Net loss attributable to common stockholders for the three months ended September 30, 2016 included a $1.0 million deemed dividend. |
F-34