Attached files
| file | filename |
|---|---|
| 8-K - 8-K - WADDELL & REED FINANCIAL INC | a18-7223_18k.htm |
This presentation contains "forward-looking statements" within the meaning of Section 27A of the Securities Act of 1933, as amended, and Section 21E of the Securities Exchange Act of 1934, as amended, which reflect the current views and assumptions of management with respect to future events regarding our business and industry in general. These forward-looking statements include all statements, other than statements of historical fact, regarding our financial position, business strategy and other plans and objectives for future operations, including statements with respect to revenues and earnings, the amount and composition of assets under management, distribution sources, expense levels, redemption rates and the financial markets and other conditions. These statements are generally identified by the use of such words as "may," "could," "should," "would," "believe," "anticipate," "forecast," "estimate," "expect," "intend," "plan," "project," "outlook," "will," "potential" and similar statements of a future or forward-looking nature. Readers are cautioned that any forward-looking information provided by us or on our behalf is not a guarantee of future performance. Actual results may differ materially from those contained in these forward-looking statements as a result of various factors, including but not limited to those discussed below. If one or more events related to these or other risks, contingencies or uncertainties materialize, or if our underlying assumptions prove to be incorrect, actual results may differ materially from those forecasted or expected. Certain important factors that could cause actual results to differ materially from our expectations are disclosed in the "Risk Factors" section of our Annual Report on Form 10-K for the year ended December 31, 2017, which include, without limitation: The loss of existing distribution channels or inability to access new distribution channels; A reduction in assets under our management on short notice, through increased redemptions in our distribution channels or our Funds, particularly those Funds with a high concentration of assets, or investors terminating their relationship with us or shifting their funds to other types of accounts with different rate structures; The adverse ruling or resolution of any litigation, regulatory investigations and proceedings, or securities arbitrations by a federal or state court or regulatory body; Changes in our business model, operations and procedures, including our methods of distributing our proprietary products, as a result of the Department of Labor’s new fiduciary rule; The introduction of legislative or regulatory proposals or judicial rulings that change the independent contractor classification of our financial advisors at the federal or state level for employment tax or other employee benefit purposes; A decline in the securities markets or in the relative investment performance of our Funds and other investment portfolios and products as compared to competing funds; Our inability to reduce expenses rapidly enough to align with declines in our revenues, the level of our assets under management or our business environment. Non-compliance with applicable laws or regulations and changes in current legal, regulatory, accounting, tax or compliance requirements or governmental policies; Our inability to attract and retain senior executive management and other key personnel to conduct our broker-dealer, fund management and investment advisory business; A failure in, or breach of, our operational or security systems or our technology infrastructure, or those of third parties on which we rely; and Our inability to implement new information technology and systems, or our inability to complete such implementation in a timely or cost effective manner. The foregoing factors should not be construed as exhaustive and should be read together with other cautionary statements included in this and other reports and filings we make with the Securities and Exchange Commission, including the information in Item 1 "Business" and Item 1A "Risk Factors" of Part I and Item 7 "Management's Discussion and Analysis of Financial Condition and Results of Operations" of Part II to our Annual Report on Form 10-K for the year ended December 31, 2017 and as updated in our quarterly reports on Form 10-Q for the year ending December 31, 2018. All forward-looking statements speak only as of the date on which they are made and we undertake no duty to update or revise any forward-looking statements, whether as a result of new information, future events or otherwise, except to the extent required by law. Forward looking statements
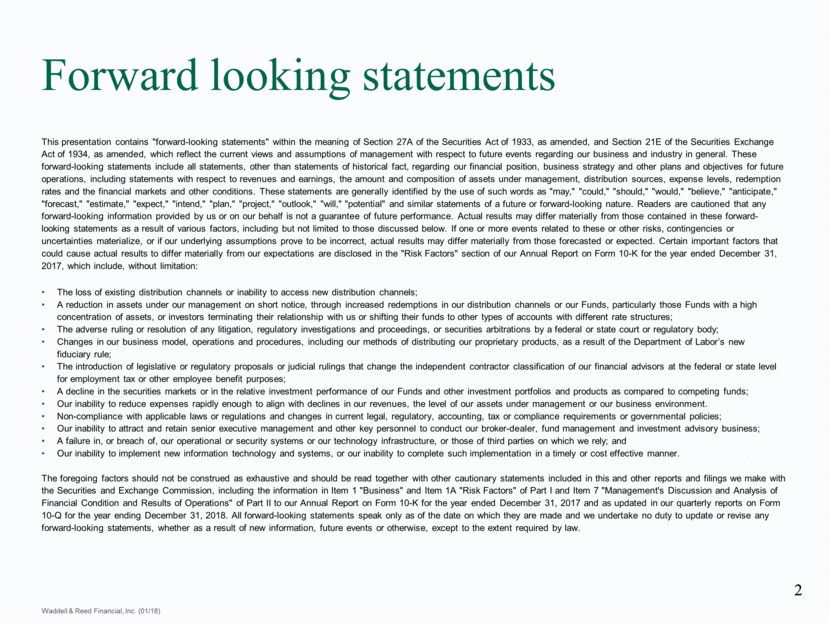
Our distinct business model, refined across more than 80 years in the industry, is built upon a unique combination of manufacturing and distribution: Overview
The industry and Waddell & Reed are navigating an era of change and transformation. We understand that: Where we are; where we’re going Our industry is changing at an unprecedented rate As we evolve, our focus is on establishing the framework for long-term success and increasing operational efficiency The foundation of our business today supports our strategic plan for the years to come
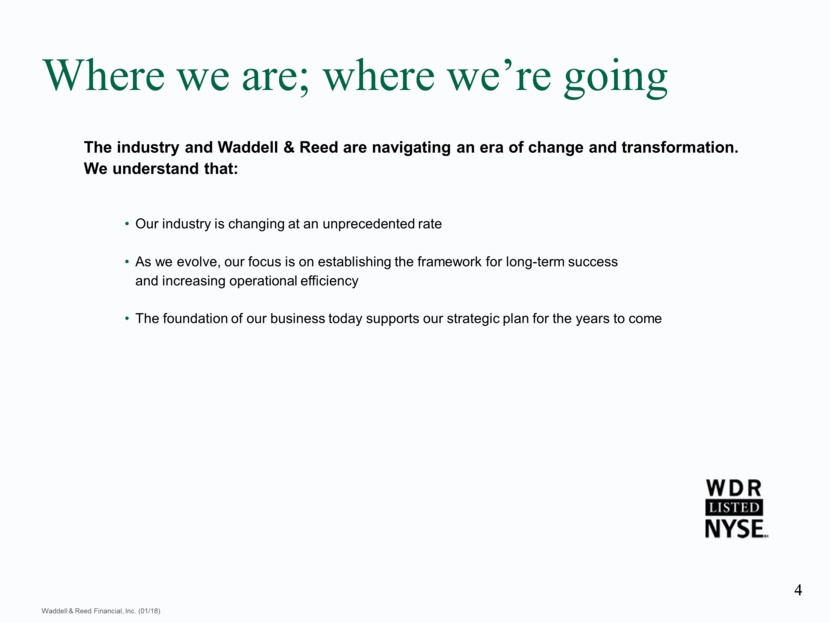
Our strategy Strengthen investment management resources, processes and results Reinvigorate product line and sales Evolve broker-dealer to self-sustaining, competitive, profitable entity Focus investment on support of business model, improving operating efficiency Key to growth is continued execution upon four key imperatives, identified in 2016.
Strengthen investment resources, results strategy Aligning investment management resources toward strongest growth opportunities and products Identifying processes and technologies to drive information sharing Ensuring performance-based compensation that aligns with philosophy and industry standards Implemented a central data collaboration warehouse to capture and leverage our intellectual capital Implemented an analyst performance measurement system to automate and publish analyst performance These changes strengthen our data and performance analytics, providing the support for an enhanced bonus system that aligns with our product performance objectives and analyst development. KEY STEPS: PROGRESS T O DA TE:
Reinvigorate product line and sales strategy Directing sales to best opportunities across product, channel, distributor and advisor Strengthening our ability to aggregate and analyze industry, product and sales data Focus on asset retention, as well as new sales Evaluating expansion through inorganic growth opportunities Launched a client relationship management (CRM) tool that facilitates the aggregation of sales data and targeted sales initiatives Merged fund families, resulting in operational efficiency and added fund-level scale KEY STEPS: PROGRESS T O DA TE:
Evolve broker-dealer strategy Enhancing data management and simplifying business processes to allow financial advisors to improve the way they do business with their clients Reviewing advisory service programs; evaluating the launch of new fee-based planning models that span the range from model through more discretionary options for higher-balance accounts Creating an environment that will allow independent financial advisors affiliated with our broker-dealer to increase their efficiency and productivity Offering attractive and competitive advisor programs and services Continuing to adapt to an evolving regulatory environment Project E introduced a series of new business processing systems to streamline account management systems and modernize planning tools Realigned our field resources under a new market structure model to facilitate local management accountability and enhance collaboration Continue to adapt with the evolution of the DOL fiduciary standard and are prepared for further regulatory review as standards evolve KEY STEPS: PROGRESS T O DA TE:
Support business model, improve operating efficiency strategy Balance efficiency and cost controls with targeted investments in business, technology and people Implement a corporate project management organization and related project and process governance Drive targeted allocation and efficient utilization of resources Targeted cost reductions across 2016 and 2017 mean expenses have begun to be better aligned with the firm's lower overall asset levels Announced our goal of adding $30 to $40 million, on a run-rate basis, to pre-tax income by 2019 as we seek operational efficiencies Established a Project Management Organization to drive transparency, accountability and to ensure the right focus of our resources through enterprise-wide prioritization The firm's human resources capabilities are being enhanced to function as a strategic business partner KEY STEPS: PROGRESS T O DA TE:
Current business metrics inform our strategy for tomorrow. Business review Asset levels and flows Diversification Broker-dealer measurements Financial summary Capital return policy Four pillars of our strategic plan
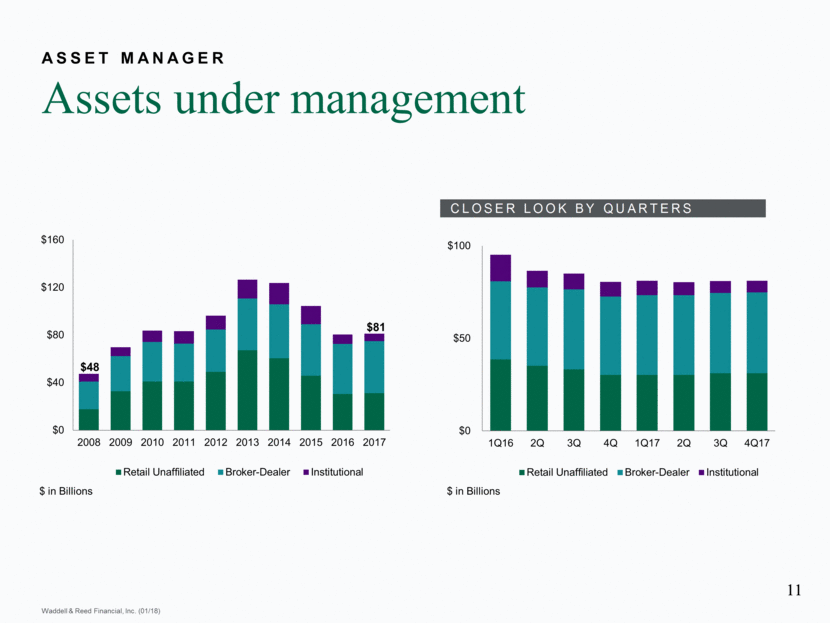
Assets under management Asset Manager $48 $81 $ in Billions $ in Billions $0 $40 $80 $120 $160 2008 2009 2010 2011 2012 2013 2014 2015 2016 2017 Thousands Retail Unaffiliated Broker-Dealer Institutional $0 $50 $100 1Q16 2Q 3Q 4Q 1Q17 2Q 3Q 4Q17 Retail Unaffiliated Broker-Dealer Institutional CLOSER LOOK BY QUAR TERS
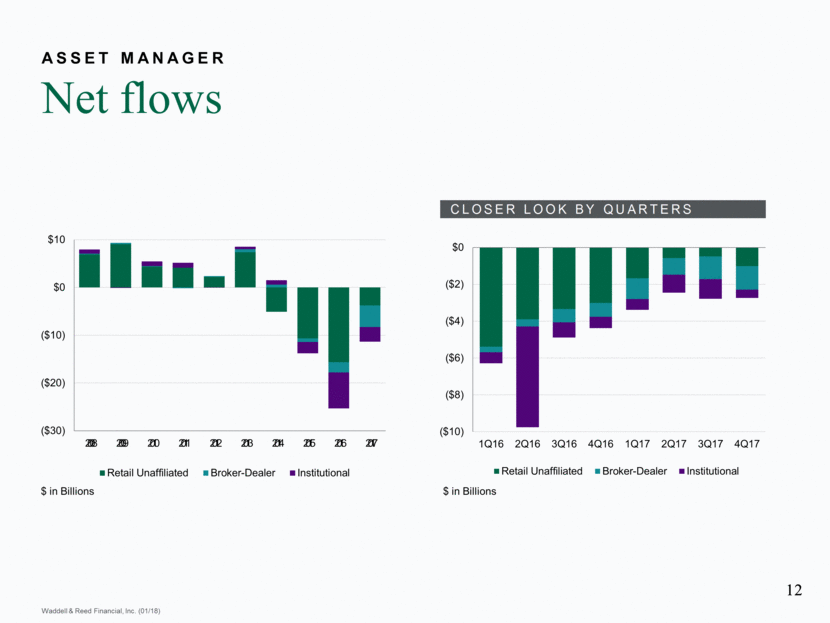
Net flows Asset Manager $ in Billions $ in Billions ($30) ($20) ($10) $0 $10 2008 2009 2010 2011 2012 2013 2014 2015 2016 2017 Retail Unaffiliated Broker-Dealer Institutional ($10) ($8) ($6) ($4) ($2) $0 1Q16 2Q16 3Q16 4Q16 1Q17 2Q17 3Q17 4Q17 Retail Unaffiliated Broker-Dealer Institutional CLOSER LOOK BY QUAR TERS
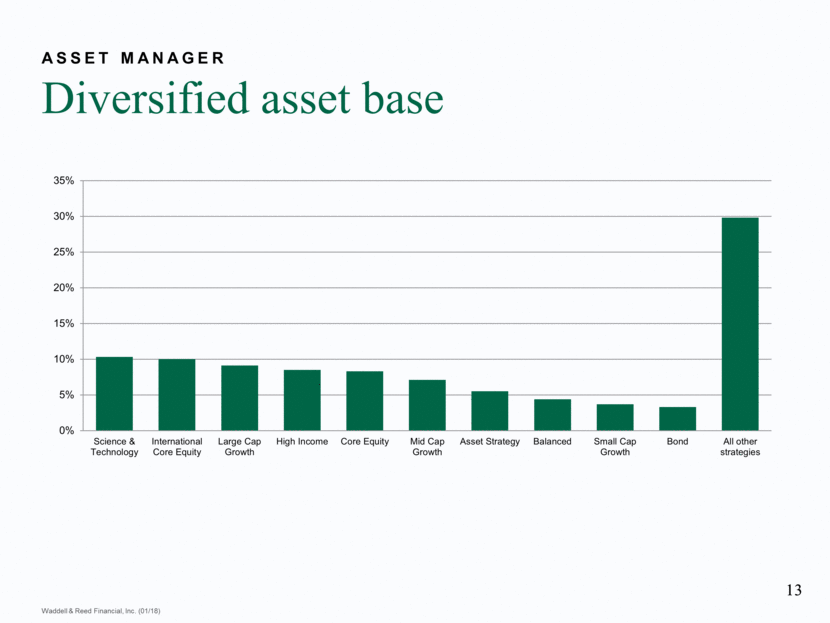
Diversified asset base Asset Manager 0% 5% 10% 15% 20% 25% 30% 35% Science & Technology International Core Equity Large Cap Growth High Income Core Equity Mid Cap Growth Asset Strategy Balanced Small Cap Growth Bond All other strategies
We are making a series of changes aimed at evolving our broker-dealer into a profitable self-sustaining entity. Broker-Dealer Focus on growing assets under administration (AUA) Providing advisors with access to an attractive span of fee-based advisory programs Continuing our development of efficient business processing platforms Evolving the programs and services offered to advisors Increasing minimum production requirements for advisors
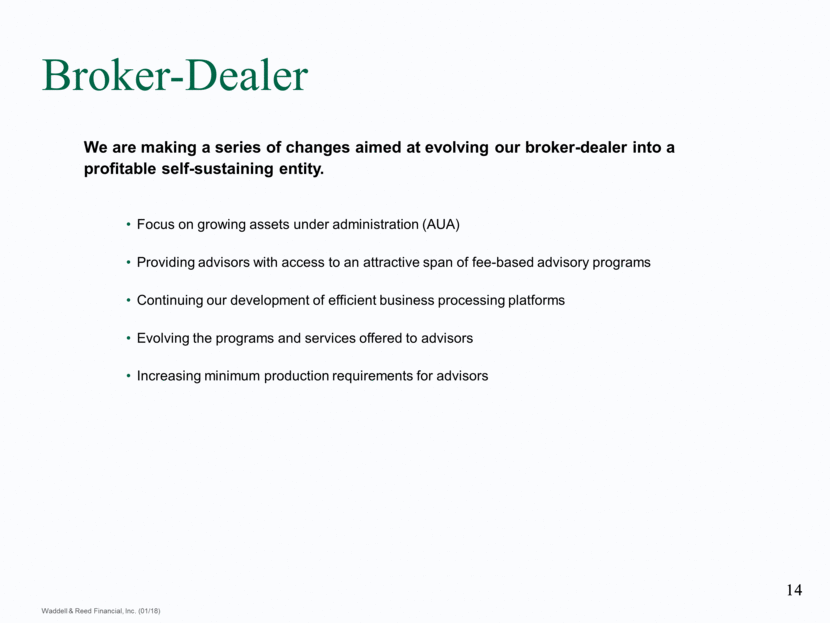
Assets under administration Broker-dealer $ in Billions
Advisory programs Broker-dealer Adapting to industry trends toward preference for fee-based advisory programs. Two-thirds of sales today in advisory programs Introduced broader selection of fee-based programs MAP Navigator offers a mix of affiliated and unaffiliated mutual funds in advisor-managed model portfolios MAP Latitude offers advisor-created portfolios in an open-architecture product platform (rep as PM) Strategic Portfolio Allocation (SPA) offers model portfolios managed by Wilshire Associates
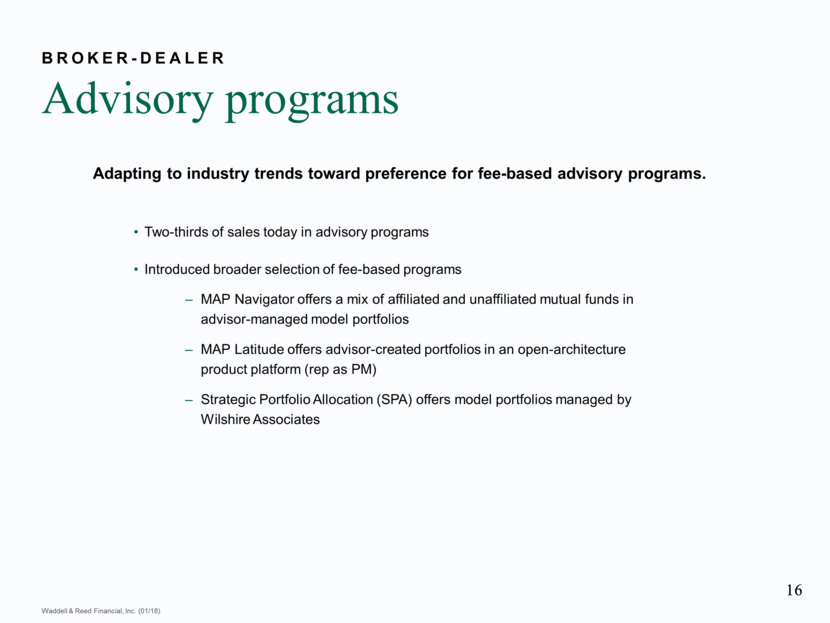
Growth in advisory program assets Broker-dealer
Revenue and productivity Broker-dealer Ongoing model shift focuses on increasing revenue and productivity: Moving toward a more open architecture model Improving the way advisors do business with their clients Raising minimum productivity standards to meet profitability goals
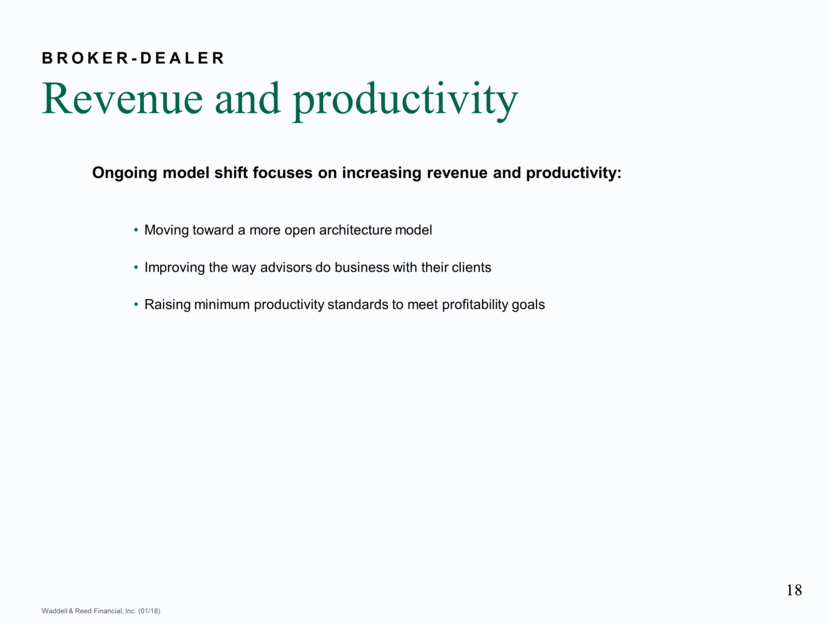
Revenue and productivity Broker-dealer $ in Thousands $ in Millions
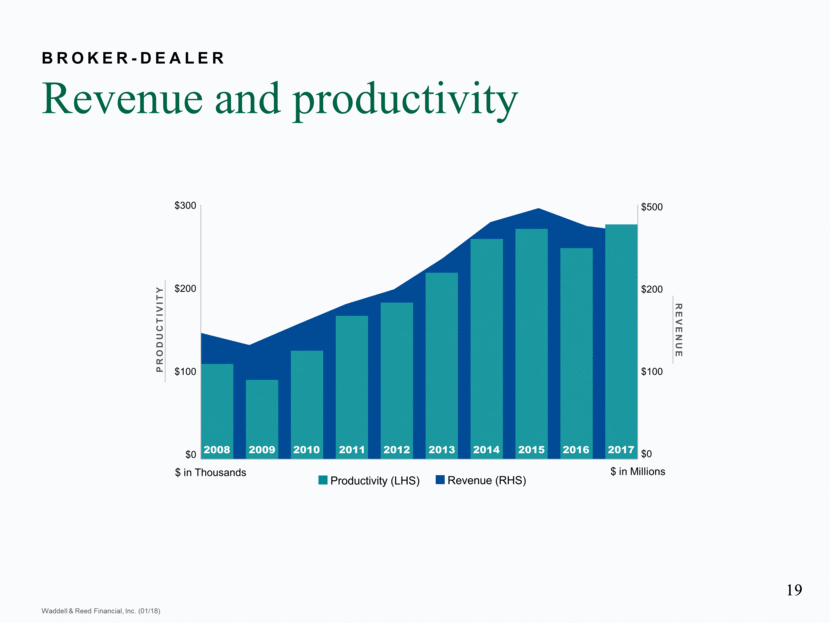
Revenue and productivity Broker-dealer
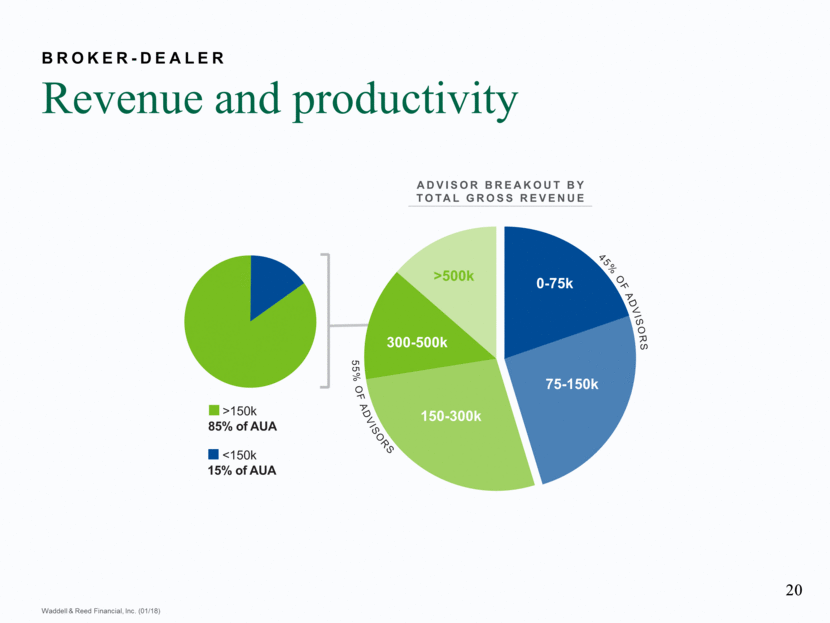
Advisor teams Broker-dealer Less productive advisors moving to teams with more productive advisors.
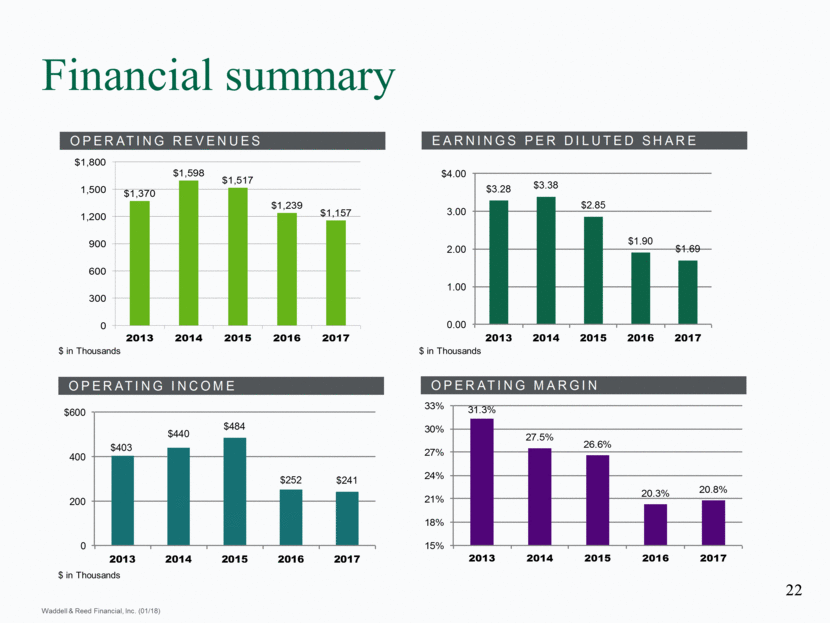
Financial summary $ in Thousands $ in Thousands $ in Thousands $1,370 $1,598 $1,517 $1,239 $1,157 0 300 600 900 1,200 1,500 $1,800 2013 2014 2015 2016 2017 $3.28 $3.38 $2.85 $1.90 $1.69 0.00 1.00 2.00 3.00 $4.00 2013 2014 2015 2016 2017 $403 $440 $484 $252 $241 0 200 400 $600 2013 2014 2015 2016 2017 31.3% 27.5% 26.6% 20.3% 20.8% 15% 18% 21% 24% 27% 30% 33% 2013 2014 2015 2016 2017 OPERA TING REVENUES EARNINGS PER DILUTED SHARE OPERA TING MARGIN OPERA TING INCOME
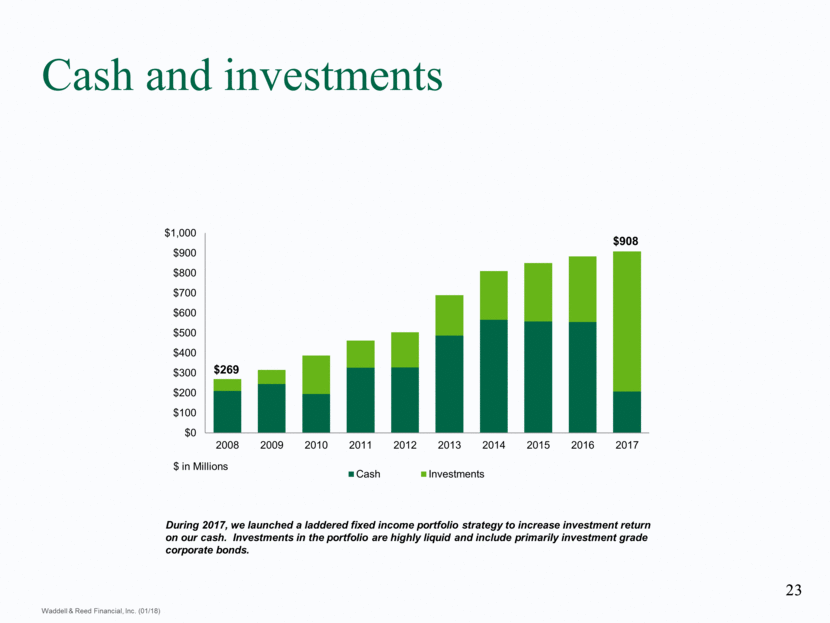
Cash and investments $269 $908 $ in Millions During 2017, we launched a laddered fixed income portfolio strategy to increase investment return on our cash. Investments in the portfolio are highly liquid and include primarily investment grade corporate bonds. $0 $100 $200 $300 $400 $500 $600 $700 $800 $900 $1,000 2008 2009 2010 2011 2012 2013 2014 2015 2016 2017 Cash Investments
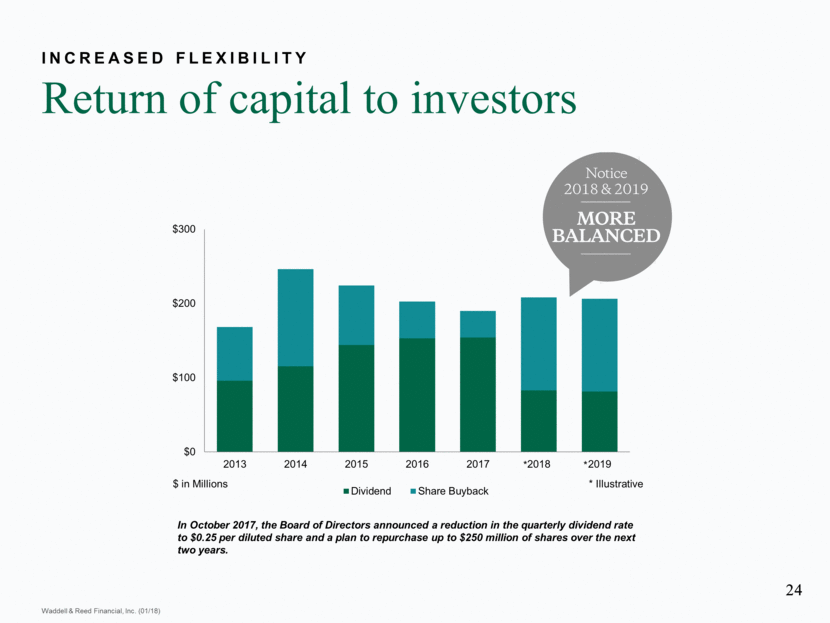
Return of capital to investors Increased flexibility * * $ in Millions * Illustrative In October 2017, the Board of Directors announced a reduction in the quarterly dividend rate to $0.25 per diluted share and a plan to repurchase up to $250 million of shares over the next two years. $0 $100 $200 $300 2013 2014 2015 2016 2017 2018 2019 Dividend Share Buyback
Q&A
