Attached files
UNITED STATES
SECURITIES AND EXCHANGE COMMISSION
Washington, D.C. 20549
FORM 10-K
ý Annual report pursuant to Section 13 or 15(d) of the Securities Exchange Act of 1934
For the fiscal year ended December 31, 2009
OR
o Transition report pursuant to Section 13 or 15(d) of the Securities Exchange Act of 1934
Commission file number 001-13913
WADDELL & REED FINANCIAL, INC.
(Exact name of registrant as specified in its charter)
| Delaware (State or other jurisdiction of incorporation or organization) |
51-0261715 (I.R.S. Employer Identification No.) |
6300 Lamar Avenue
Overland Park, Kansas 66202
913-236-2000
(Address, including zip code, and telephone number of Registrant's principal executive offices)
SECURITIES REGISTERED PURSUANT TO SECTION 12(b) OF THE ACT
| Title of each class | Name of each exchange on which registered | |
| Class A Common Stock, $.01 par value | New York Stock Exchange |
SECURITIES REGISTERED PURSUANT TO SECTION 12(g) OF THE ACT:
None
(Title of class)
Indicate by check mark if the registrant is a well-known seasoned issuer, as defined in Rule 405 of the Securities Act. YES ý NO o
Indicate by check mark if the registrant is not required to file reports pursuant to Section 13 or Section 15(d) of the Act. YES o NO ý .
Indicate by check mark whether the registrant (1) has filed all reports required to be filed by Section 13 or 15(d) of the Securities Exchange Act of 1934 during the preceding 12 months (or for such shorter period that the registrant was required to file such reports), and (2) has been subject to such filing requirements for the past 90 days. Yes ý No o.
Indicate by check mark whether the registrant has submitted electronically and posted on its corporate Web site, if any, every Interactive Data File required to be submitted and posted pursuant to Rule 405 of Regulation S-T during the preceding 12 months (or for such shorter period that the registrant was required to submit and post such files). Yes o No o.
Indicate by check mark if disclosure of delinquent filers pursuant to Item 405 of Regulation S-K is not contained herein, and will not be contained, to the best of registrant's knowledge, in definitive proxy or information statements incorporated by reference in Part III of this Form 10-K or any amendments to this Form 10-K. ( )
Indicate by check mark whether the registrant is a large accelerated filer, an accelerated filer, a non-accelerated filer or a smaller reporting company (as defined in Rule 12b-2 of the Exchange Act).
| Large accelerated Filer | ý | Accelerated Filer | o | |||
| Non-accelerated Filer | o | Smaller Reporting Company | o | |||
| (Do not check if a smaller reporting company) |
||||||
Indicate by check mark whether the registrant is a shell company (as defined by Rule 12b-2 of the Exchange Act). Yes o No ý .
The aggregate market value of the voting and non-voting common stock equity held by non-affiliates (i.e. persons other than officers, directors and stockholders holding greater than 5% of the registrant's common stock) based on the closing sale price on June 30, 2009 was $2.196 billion.
Shares outstanding of each of the registrant's classes of common stock as of February 18, 2010 Class A common stock, $.01 par value: 85,528,188
DOCUMENTS INCORPORATED BY REFERENCE
In Part III of this Form 10-K, portions of the definitive proxy statement for the 2010 Annual Meeting of Stockholders to be held April 7, 2010.
Index of Exhibits (Pages 86 through 95)
Total Number of Pages Included Are 95
WADDELL & REED FINANCIAL, INC.
INDEX TO ANNUAL REPORT ON FORM 10-K
For the fiscal year ended December 31, 2009
2
General
Waddell & Reed Financial, Inc. (hereinafter referred to as the "Company," "we," "our" or "us") is a corporation, incorporated in the state of Delaware in 1981, that conducts business through its subsidiaries. Founded in 1937, we are one of the oldest mutual fund complexes in the United States, having introduced the Waddell & Reed Advisors Group of Mutual Funds (the "Advisors Funds") in 1940. We launched our Ivy Funds in 2003 in an effort to expand our distribution to third-party outlets. As of December 31, 2009, we had $69.8 billion in assets under management and approximately 3.9 million mutual fund shareholder accounts owned by individuals, plans or omnibus accounts at third parties.
We derive our revenues primarily from providing investment management, investment product underwriting and distribution, and shareholder services administration to mutual funds and institutional and separately managed accounts. Investment management fees are based on the amount of average assets under management and are affected by sales levels, financial market conditions, redemptions and the composition of assets. Our underwriting and distribution revenues consist of commissions derived from sales of investment and insurance products, Rule 12b-1 asset-based service and distribution fees, distribution fees on certain variable products, fees earned on fee-based asset allocation products, and related advisory services. The products sold have various commission structures and the revenues received from those sales vary based on the type and amount sold.
We operate our business through three distinct distribution channels. Our retail products are distributed through our sales force of registered financial advisors (the "Advisors channel") or through third-parties such as other broker/dealers, registered investment advisors (including the retirement advisors of the Legend group of subsidiaries ("Legend")) and various retirement platforms, (collectively, the "Wholesale channel"). We also market our investment advisory services to institutional investors, either directly or through consultants (the "Institutional channel").
In the Advisors channel, our sales force focuses its efforts primarily on the sale of investment products advised by the Company. We compete primarily with smaller broker/dealers and independent financial advisors, as well as a span of other financial providers. Assets under management acquired through this channel were $29.5 billion at December 31, 2009.
Our Wholesale channel efforts include retail fund distribution through broker/dealers (the largest method of distributing mutual funds for the industry), registered investment advisors (fee-based financial advisors who generally sell mutual funds through financial supermarkets) and retirement platforms (401(k) platforms using multiple managers). Assets under management acquired through this channel were $32.8 billion at the end of 2009.
Through our Institutional channel we manage assets for defined benefit pension plans, other investment companies (as a subadvisor), defined contribution plans, endowments and high net worth clients. Assets under management acquired through the Institutional channel were $7.5 billion at December 31, 2009.
Organization
We operate our investment advisory business through our subsidiary companies, primarily Waddell & Reed Investment Management Company ("WRIMCO"), a registered investment adviser and Ivy Investment Management Company ("IICO"), the registered investment adviser for Ivy Funds, Inc. and the Ivy Funds portfolios (collectively, the "Ivy Funds"). Other investment advisory subsidiaries include Legend Advisory Corporation (the registered investment adviser for Legend) and Austin, Calvert & Flavin, Inc. ("ACF"), which was sold effective July 15, 2009.
3
Our underwriting and distribution business operates through three broker/dealers: Waddell & Reed, Inc. ("W&R"), Ivy Funds Distributor, Inc. ("IFDI") and Legend Equities Corporation ("LEC"). W&R is a registered broker/dealer and investment adviser that acts primarily as the national distributor and underwriter for shares of Advisors Funds and a distributor of variable annuities and other insurance products issued by our business partners. In addition, W&R is the ninth largest distributor of our Ivy Funds. IFDI, a registered broker/dealer, is the distributor and underwriter for the Ivy Funds. LEC is the registered broker/dealer for Legend, a mutual fund distribution and retirement planning subsidiary based in Palm Beach Gardens, Florida. Through its network of financial advisors, Legend primarily serves employees of school districts and other not-for-profit organizations.
Waddell & Reed Services Company ("WRSCO") provides transfer agency and accounting services to the Advisors Funds, the Ivy Funds, Ivy Funds Variable Insurance Portfolios (the "Ivy Funds VIP") and Waddell & Reed InvestEd Portfolios, our college savings plan ("InvestEd"). W&R, WRIMCO, WRSCO, Legend, IICO and IFDI are hereafter collectively referred to as the "Company," "we," "us" or "our" unless the context requires otherwise.
Investment Management Operations
Our investment advisory business provides one of our largest sources of revenues and profits. We earn investment management fee revenues by providing investment advisory and management services pursuant to an investment management agreement with each fund within the Advisors Funds family, the Ivy Funds families, the Ivy Funds VIP family, and InvestEd, (collectively, the "Funds"). While the specific terms of the agreements vary, the basic terms are similar. The agreements provide that we render overall investment management services to each of the Funds, subject to the oversight of each Fund's board of directors/trustees and in accordance with each Fund's investment objectives and policies. The agreements permit us to enter into separate agreements for shareholder services or accounting services with each respective Fund.
Each Fund's board of directors/trustees, including a majority of the directors/trustees who are not "interested persons" of the Fund or the Company within the meaning of the Investment Company Act of 1940, as amended (the "ICA") ("disinterested members") and the Fund's shareholders must approve the investment management agreement between the respective Fund and the Company. These agreements may continue in effect from year to year if specifically approved at least annually by (i) the Fund's board, including a majority of the disinterested members, or (ii) the vote of a majority of both the shareholders of the Fund and the disinterested members of each Fund's board, each vote being cast in person at a meeting called for such purpose. Each agreement automatically terminates in the event of its assignment, as defined by the ICA or the Investment Advisers Act of 1940, as amended, (the "Advisers Act"), and may be terminated without penalty by any Fund by giving us 60 days' written notice if the termination has been approved by a majority of the Fund's directors/trustees or the Fund's shareholders. We may terminate an investment management agreement without penalty on 120 days' written notice.
In addition to performing investment management services for the Funds, we act as an investment adviser for institutional and other private investors and we provide subadvisory services to other investment companies. Our fee for these services is generally based on a percentage of assets under management. Such services are provided pursuant to various written agreements.
Our investment management effort has a strong foundation based upon its people and resources. We have 64 investment professionals including a team of 29 portfolio managers who average 19 years of industry experience and 14 years of tenure with the Company. The team has substantial resources available to them, including the efforts of internal equity and fixed income analysts who conduct primary fundamental research. Our investment professionals attend numerous on and off-site meetings annually with management of the companies in which they invest. In addition, we use research provided by brokerage firms and independent outside consultants. Portfolio managers participate in a collaborative process that blends their individual accountability with the ideas of their peers which, when backed by an
4
intensive research capability, supports our efforts to deliver consistent, long-term performance. Our investment management team also includes a premier group of subadvisors who bring similar investment philosophies and additional expertise in specific asset classes.
We have significant experience in virtually all major asset classes, several specialized asset classes and a range of investment styles. Our ending assets under management are summarized below by broad asset class, many of which incorporate multiple investment styles.
Ending Assets Under Management by Broad Asset Class
| |
December 31, 2009 |
||||||||
|---|---|---|---|---|---|---|---|---|---|
| |
Ending Assets |
Percentage of Total |
|||||||
| |
(in millions) |
|
|||||||
Investment Style: |
|||||||||
Balanced & Flexible |
$ | 25,725 | 37% | ||||||
Narrowly Diversified |
10,213 | 15% | |||||||
Large Capitalization Growth Equities |
8,094 | 12% | |||||||
Large Capitalization Core Equities |
4,987 | 7% | |||||||
Taxable Investment Grade Fixed Income |
4,452 | 6% | |||||||
International Equities |
3,754 | 5% | |||||||
Small Capitalization Growth Equities |
2,901 | 4% | |||||||
High Yield Fixed Income |
2,609 | 4% | |||||||
Money Market |
1,720 | 2% | |||||||
Multi-Capitalization Core Equities |
1,409 | 2% | |||||||
Middle Capitalization Growth Equities |
1,402 | 2% | |||||||
Tax Exempt Fixed Income |
1,271 | 2% | |||||||
Value Equities |
1,150 | 2% | |||||||
International Fixed Income |
96 | 0% | |||||||
Total |
$ | 69,783 | 100% | ||||||
Our investment strategy generally emphasizes investments in companies that the portfolio managers believe can produce above average growth in earnings. Our portfolio managers also strive for consistent long-term performance while seeking to provide downside protection in turbulent markets. Our investment philosophy lends itself well to the financial planning approach used by our Advisors channel while our consistent long-term investment performance record supports the distribution efforts in both our Wholesale and Institutional channels.
Investment Management Products
Our mutual fund families offer a wide variety of investment options. We are the exclusive underwriter and distributor of 80 registered open-end mutual fund portfolios, including 20 portfolios in the Advisors Funds family, 32 portfolios in the Ivy Funds family, 25 portfolios in the Ivy Funds VIP family and three portfolios in InvestEd. The Advisors Funds, variable products offering the Ivy Funds VIP, and InvestEd are offered primarily through our financial advisors and Legend advisors; in some circumstances, certain of these funds are also offered through the Wholesale channel. The Ivy Funds are offered through both our Advisors channel and Wholesale channel. The Funds' assets under management are included in either our Advisors channel or our Wholesale channel depending on who marketed the client account or is the broker of record.
We added three funds to our product line in 2009. We launched the Ivy Micro Cap Growth fund for investors seeking long-term capital appreciation and we invest a majority of the fund's net assets in equity securities of primarily domestic and, to a lesser extent, foreign micro cap companies. The Ivy Municipal High Income fund was added for investors interested in a high level of income that is not subject to federal
5
income tax. The fund invests the majority of net assets in a diversified portfolio of tax-exempt municipal bonds. The Ivy Tax-Managed Equity fund's objective is long-term capital growth while minimizing taxable gains and income to shareholders. The fund invests primarily in a diversified portfolio of common stocks of domestic and, to a lesser extent, foreign companies considered to be high in quality and attractive in their long-term investment potential, with a majority of net assets in equity securities.
In addition to the introduction of these new products, we began direct management of three previously subadvised funds during 2009, which will result in decreased subadvisory expenses on a forward looking basis. The three funds now under direct management are: the Ivy International Balanced fund, the Ivy VIP International Value fund and the Ivy European Opportunities fund.
Other Products
Pursuant to general agency arrangements with our business partners, we distribute certain of their variable annuity products, which offer the Ivy Funds VIP as an investment vehicle. We also offer our customers retirement and life insurance products underwritten by our business partners. Through our insurance agency subsidiaries, our financial advisors also sell life insurance and disability products underwritten by various carriers.
In addition, we offer asset allocation investment advisory products, including Managed Allocation Portfolio ("MAP") and Strategic Portfolio Allocation ("SPA"), which utilize our Funds. MAP includes two mutual fund asset allocation programs, MAP and MAPPlus, that offer clients a selection of traditional asset allocation models, as well as features such as systematic rebalancing and client participation in determining (to a limited extent) asset allocation across asset classes. MAP and MAPPlus are fee-based mutual fund asset allocation programs, structured to provide advisors and clients with advisory services, a pricing option competitive with other firms' fee-based products, and flexibility to allow advisors to assist clients in selecting underlying funds based upon their individual needs. As of December 31, 2009, clients have $2.5 billion invested in our MAP and MAPPlus products. These assets are included in our mutual fund assets under management.
Using a variety of funds ranging from money market and fixed income funds to domestic and international equity funds, SPA is a predictive, dynamic asset allocation system that reallocates asset classes within model portfolios. Clients investing assets in SPA can choose from five available model portfolios with objectives ranging from conservative to aggressive, based on their investment objectives, goals, risk tolerance and other factors. Clients have $229 million invested in our SPA products as of December 31, 2009 and these assets are included in our mutual fund assets under management.
A primary difference between MAP and SPA is that advisors assist clients in selecting the underlying mutual funds within MAP models in accordance with pre-established ranges, whereas for SPA, the Company's Investment Policy Committee determines the model compositions.
Underwriting and Distribution
We earn underwriting and distribution fee revenues primarily by distributing the Funds pursuant to an underwriting agreement with each Fund (except the Ivy Funds VIP as explained below) and, to a lesser extent, by distributing mutual funds offered by other companies not affiliated with us. Pursuant to each agreement, we offer and sell the Funds' shares on a continuous basis (open-end funds) and pay certain costs associated with underwriting and distributing the Funds, including the costs of developing and producing sales literature and printing of prospectuses, which may be either partially or fully reimbursed by the Funds. The Funds are sold in various classes that are structured in ways that conform to industry standards (i.e., "front-end load," "back-end load," "level-load" and institutional).
When a client purchases Class A shares (front-end load), the client pays an initial sales charge of up to 5.75% of the amount invested. The sales charge for Class A shares typically declines as the investment amount increases. In addition, investors may combine their purchases of all fund shares to qualify for a
6
reduced sales charge. Class A shares purchased at net asset value are assessed a 1% contingent deferred sales charge ("CDSC") if the shares are redeemed within 12 months of purchase. When a client invests in an asset allocation product, Class A shares are purchased at net asset value. We do not charge an initial sales charge, but investors are assessed a CDSC upon early redemption of shares, up to 3% of the amount originally invested and declining to zero for investments held more than three years. When a client purchases Class B shares (back-end load), we do not charge an initial sales charge, but we do charge a CDSC upon early redemption of shares, up to 5% of the lesser of the current market net asset value or the purchase cost of the redeemed shares in the first year and declining to zero for shares held for more than six years. Class B shares convert to Class A shares after seven years. When a client purchases Class C shares (level-load), we do not charge an initial sales charge, but we do charge investors who redeem their Class C shares in the first year a CDSC of 1% of the current market net asset value or the purchase cost of the shares redeemed, whichever is less.
Under a Rule 12b-1 service plan, the Funds may charge a maximum fee of 0.25% of the average daily net assets under management for expenses paid to broker/dealers and other sales professionals in connection with providing ongoing services to the Funds' shareholders and/or maintaining the Funds' shareholder accounts. The Funds' Class B and Class C shares may charge a maximum of 0.75% of the average daily net assets under management under a Rule 12b-1 distribution plan to broker/dealers and other sales professionals for their services in connection with distributing shares of that class. The Rule 12b-1 plans are subject to annual approval by the Funds' board of directors/trustees, including a majority of the disinterested members, by votes cast in person at a meeting called for the purpose of voting on such approval. All Funds may terminate the service plan at any time with approval of fund directors or portfolio shareholders (a majority of either) without penalty.
We distribute variable products offering the Ivy Funds VIP as investment vehicles pursuant to general agency arrangements with our business partners and receive commissions, marketing allowances and other compensation as stipulated by such agreements. In connection with these arrangements, the Ivy Funds VIP are offered and sold on a continuous basis.
In addition to distributing variable products, we distribute a number of other insurance products through our insurance agency subsidiaries, including individual term life, group term life, whole life, accident and health, long-term care, Medicare supplement and disability insurance. We receive commissions and compensation from various underwriters for distributing these products. We are not an underwriter for any insurance policies.
Distribution Channels
We distribute our investment products through the Advisors, Wholesale and Institutional channels.
Advisors Channel
Our advisors sell investment products primarily to middle-income and mass affluent individuals, families and businesses across the country in geographic markets of all sizes. We assist clients on a wide range of financial issues with a significant focus on helping them plan, generally, for long-term investments such as retirement and education and offer one-on-one consultations that emphasize long-term relationships through continued service. As a result of this approach, this channel has developed a loyal customer base with clients maintaining their accounts significantly longer than the industry average. The redemption rate in the Advisors channel for the year ended December 31, 2009 was 8.4%, compared to the industry average of 26.3%, as derived from statistics provided by the Investment Company Institute ("ICI").
Our sales force consisted of 2,393 financial advisors, including 156 district managers, as of December 31, 2009. Eight regional vice presidents and 102 managing principals oversee this sales force, which operates out of 170 offices located throughout the United States and 288 individual advisor offices. We believe, based on industry data, that our financial advisors are currently one of the largest sales forces
7
in the United States selling primarily mutual funds, and that W&R, our broker/dealer subsidiary, ranks among the largest independent broker/dealers. As of December 31, 2009, our Advisors channel had approximately 530,000 mutual fund customers with an average investment of $47,000 and approximately 76,000 variable account customers with an average investment of $57,000.
As of December 31, 2009, 38% of our financial advisors have been with us for more than five years and 25% for more than ten years. Our New Advisor Career Transition program(s), designed to meet the needs of the different audiences from which we recruit, such as college graduates, career changers and industry experienced professionals, provide our new advisors with a unique transition experience until they can develop the skills and client base necessary to earn a stable income from commissions alone. These programs have played an important role in advisor retention and are designed to improve productivity of our new advisors. We undertook technology initiatives in 2007, fully implemented in 2008, which allow us to provide our clients consolidated statements and more robust brokerage capabilities. We believe these efforts support the retention of existing advisors and our recruiting efforts, including those aimed at experienced advisors. Sales per advisor (investment product sales divided by the average number of advisors) were $1.0 million, $1.2 million and $1.2 million, for the years ended December 31, 2009, 2008 and 2007, respectively. This metric is important to us since investment product sales are invested in our Funds' assets.
Gross production per advisor is an additional method of measuring advisor productivity that is more closely aligned with industry standard methods, which use gross commissions per sales representative to measure productivity. For purposes of this measure, gross production consists of front-end load sales and distribution fee revenues, as would be received from an underwriter, from sales of both our Funds and other mutual funds. It also includes fee revenues from our asset allocation products and financial plans, and commission revenues earned on insurance products. This measure excludes Rule 12b-1 service fee revenues, variable annuity distribution fee revenues and all revenues related to Class Y shares, all of which do not relate to the distribution activities of our financial advisors. Gross production per advisor was $59.9 thousand, $64.1 thousand and $64.7 thousand for the years ended December 31, 2009, 2008 and 2007, respectively.
Wholesale Channel
Our Wholesale channel consists of sales garnered through various third-party distribution outlets and Legend advisors. In an effort to accelerate sales growth, we have focused on expanding our Wholesale distribution efforts over the past several years. As a result of an increased demand for our funds in the Wholesale channel due to strong investment performance, our assets under management from the Wholesale channel have increased from $3.8 billion at December 31, 2003 to $32.8 billion at December 31, 2009, including $5.2 billion in assets at December 31, 2009 that are subadvised by other managers.
The following table summarizes certain components of the changes in the Wholesale channel's assets under management for the last three fiscal years.
| |
2009 | 2008 | 2007 | |||||||
|---|---|---|---|---|---|---|---|---|---|---|
| |
(in millions) |
|||||||||
Sales (net of commissions) |
$ | 14,745 | 15,599 | 9,470 | ||||||
Redemptions |
(5,951) | (8,541) | (2,795) | |||||||
Net Sales |
8,794 | 7,058 | 6,675 | |||||||
Market Appreciation (Depreciation) |
6,261 | (10,980) | 3,894 | |||||||
Ending Assets Under Management |
$ | 32,818 | 17,489 | 21,537 | ||||||
During 2009, our mutual fund sales levels through wholesale distribution rivaled those achieved in the previous, record-setting year, even through volatile market conditions. The Ivy Funds family increased its
8
presence in a number of broker/dealer platforms. These third parties have a client relationship with, and maintain an account for, the investors. Typically, investors purchase our investment products at the suggestion of third parties, thereby expanding our opportunities to gain new investors. Our wholesaling efforts focus principally on distributing the Ivy Funds through three segments: broker/dealers (the largest method of distributing mutual funds for the industry and for us), retirement platforms (401(k) platforms using multiple managers) and registered investment advisors (fee-based financial advisors who generally sell mutual funds through financial supermarkets). We continued to expand our team of national wholesalers, reaching a total of 34 external wholesalers, six hybrid wholesalers and 33 internal wholesalers by year-end. In 2010, we plan to restructure our wholesaler territories into smaller, more manageable areas to enable our wholesalers to focus on additional distribution partners in their territory.
Legend advisors distribute our Funds, along with mutual funds managed by other investment companies, through Legend's retirement advisor sales force. At December 31, 2009, Legend had 423 registered retirement advisors in 193 offices, which are primarily individual advisor offices, located mainly in the eastern part of the United States. These retirement advisors are not included in the discussion of our financial advisors, nor in disclosures of the number of advisors we have licensed. For the years ended December 31, 2009, 2008 and 2007, Legend advisors sold $82.1 million, $63.8 million and $74.2 million, respectively, of our mutual funds, and $280.9 million, $262.4 million and $363.5 million, respectively, of unaffiliated mutual funds. Sales per Legend advisor were $764 thousand in 2009. Legend had $4.6 billion of client assets under administration as of December 31, 2009, including $490.3 million in our funds.
Institutional Channel
WRIMCO markets its investment advisory services to institutions directly or through consultants that assist with the manager selection process. Most of our institutional business is in defined contribution pension plans, defined benefit pension plans and subadvised mutual funds. A significant amount of assets are also managed for foundations, endowments, Taft-Hartley plans, high net worth individuals and insurance company general accounts.
Over time, WRIMCO's business within the Institutional channel has been successful in developing subadvisory and defined contribution pension mandates. This type of business now comprises 60% of the Institutional channel's assets, which management views as a positive development as it believes this type of business is more likely to grow than the defined benefit business.
ACF, an investment advisory subsidiary previously operating in this channel, was sold effective July 15, 2009. Prior to the closing date, ACF had assets under management of $488.0 million. ACF was marketed separately from WRIMCO.
Service Agreements
We earn service fee revenues by providing various services to the Funds and their shareholders pursuant to shareholder servicing and accounting service agreements with each Fund. Pursuant to the shareholder servicing agreements, we perform shareholder servicing functions for which the Funds pay us a monthly fee, including: maintaining shareholder accounts; issuing, transferring and redeeming shares; distributing dividends and paying redemptions; furnishing information related to the Funds; and handling shareholder inquiries. Pursuant to the accounting service agreements, we provide the Funds with bookkeeping and accounting services and assistance for which the Funds pay us a monthly fee, including: maintaining the Funds' records; pricing Fund shares; and preparing prospectuses for existing shareholders, proxy statements and certain other shareholder reports.
These agreements may be adopted or amended with the approval of the disinterested members of each Fund's board of directors/trustees and have annually renewable terms of one year.
9
Regulation
The securities industry is subject to extensive regulation and virtually all aspects of our business are subject to various federal and state laws and regulations. These laws and regulations are primarily intended to protect investment advisory clients and shareholders of registered investment companies. Under such laws and regulations, agencies and organizations that regulate investment advisers, broker/dealers, and transfer agents like us have broad administrative powers, including the power to limit, restrict or prohibit an investment adviser, broker/dealer or transfer agent from carrying on its business in the event that it fails to comply with applicable laws and regulations. In such event, the possible sanctions that may be imposed include, but are not limited to, the suspension of individual employees or agents, limitations on engaging in certain lines of business for specified periods of time, censures, fines and the revocation of investment adviser and other registrations.
The Securities and Exchange Commission (the "SEC") is the federal agency responsible for the administration of federal securities laws. Certain of our subsidiaries are registered with the SEC as investment advisers under the Advisers Act, which imposes numerous obligations on registered investment advisers including, among other things, fiduciary duties, record-keeping and reporting requirements, operational requirements and disclosure obligations, as well as general anti-fraud prohibitions. Investment advisers are subject to periodic examination by the SEC, and the SEC is authorized to institute proceedings and impose sanctions for violations of the Advisers Act, ranging from censure to termination of an investment adviser's registration.
Our Funds are registered as investment companies with the SEC under the ICA, and various filings are made with states under applicable state rules and regulations. The ICA regulates the relationship between a mutual fund and its investment adviser and prohibits or severely restricts principal transactions and joint transactions. Various regulations cover certain investment strategies that may be used by the Funds for hedging and/or speculative purposes. To the extent the Funds purchase futures contracts, options on futures contracts and foreign currency contracts, they are subject to the commodities and futures regulations of the Commodity Futures Trading Commission.
We derive a large portion of our revenues from investment management agreements. Under the Advisers Act, our investment management agreements terminate automatically if assigned without the client's consent. Under the ICA, investment advisory agreements with registered investment companies, such as the Funds, terminate automatically upon assignment. The term "assignment" is broadly defined and includes direct assignments, as well as assignments that may be deemed to occur, under certain circumstances, upon the transfer, directly or indirectly, of a controlling interest in the Company.
The Company is also subject to federal and state laws affecting corporate governance, including the Sarbanes-Oxley Act of 2002 ("S-OX"), as well as rules adopted by the SEC. In 2004, we implemented compliance with Section 404 of S-OX. Our related report on internal controls over financial reporting for 2009 is included in Part I, Item 9A.
As a publicly traded company, we are also subject to the rules of the New York Stock Exchange (the "NYSE"), the exchange on which our stock is listed, including the corporate governance listing standards approved by the SEC.
Three of our subsidiaries, W&R, LEC and IFDI, are also registered as broker/dealers with the SEC and the states. Much of the broker/dealer regulation has been delegated by the SEC to self-regulatory organizations, principally the Municipal Securities Rulemaking Board and the Financial Industry Regulatory Authority ("FINRA"), which is the primary regulator of our broker/dealer activities. These self-regulatory organizations adopt rules (subject to approval by the SEC) that govern the industry and conduct periodic examinations of our operations over which they have jurisdiction. Securities firms are also subject to regulation by state securities administrators in those states in which they conduct business. Broker/dealers are subject to regulations that cover all aspects of the securities business, including sales
10
practices, market making and trading among broker/dealers, the use and safekeeping of clients' funds and securities, capital structure, record-keeping, and the conduct of directors, officers and employees. Violation of applicable regulations can result in the revocation of broker/dealer licenses, the imposition of censures or fines, and the suspension or expulsion of a firm, its officers or employees.
W&R, LEC and IFDI are also each subject to certain net capital requirements pursuant to the Securities Exchange Act of 1934, as amended (the "Exchange Act"). Uniform Net Capital Rule 15c3-1 of the Exchange Act (the "Net Capital Rule") specifies the minimum level of net capital a registered broker/dealer must maintain and also requires that part of its assets be kept in a relatively liquid form. The Net Capital Rule is designed to ensure the financial soundness and liquidity of broker/dealers. Any failure to maintain the required minimum net capital may subject us to suspension or revocation of our registration or other limitations on our activity by the SEC, and suspension or expulsion by FINRA or other regulatory bodies, and ultimately could require the broker/dealer's liquidation. The maintenance of minimum net capital requirements may also limit our ability to pay dividends. As of December 31, 2009, 2008 and 2007, net capital for W&R, LEC and IFDI exceeded all minimum requirements.
Pursuant to the requirements of the Securities Investor Protection Act of 1970, W&R and LEC are members of the Securities Investor Protection Corporation (the "SIPC"). IFDI is not a member of the SIPC. The SIPC provides protection against lost, stolen or missing securities (but not loss in value due to a rise or fall in market prices) for clients in the event of the failure of a broker/dealer. Accounts are protected up to $500,000 per client with a limit of $100,000 for cash balances. However, since the Funds, and not our broker/dealer subsidiaries, maintain customer accounts, SIPC protection would not cover mutual fund shareholders.
Title III of the USA PATRIOT Act, the International Money Laundering Abatement and Anti-Terrorist Financing Act of 2001, imposes significant anti-money laundering requirements on all financial institutions, including domestic banks and domestic operations of foreign banks, broker/dealers, futures commission merchants and investment companies.
Our businesses may be materially affected not only by regulations applicable to us as an investment adviser, broker/dealer or transfer agent, but also by law and regulations of general application. For example, the volume of our principal investment advisory business in a given time period could be affected by, among other things, existing and proposed tax legislation and other governmental regulations and policies (including the interest rate policies of the Federal Reserve Board), and changes in the interpretation or enforcement of existing laws and rules that affect the business and financial communities.
Competition
The financial services industry is a highly competitive global industry. According to the ICI, at the end of 2009 there were more than 8,600 open-end investment companies of varying sizes, investment policies and objectives whose shares are being offered to the public in the United States alone. Factors affecting our business include brand recognition, business reputation, investment performance, quality of service and the continuity of both client relationships and assets under management. A majority of mutual fund sales go to funds that are highly rated by a small number of well-known ranking services that focus on investment performance. Competition is based on distribution methods, the type and quality of shareholder services, the success of marketing efforts and the ability to develop investment products for certain market segments to meet the changing needs of investors, and to achieve competitive investment management performance.
We compete with hundreds of other mutual fund management, distribution and service companies that distribute their fund shares through a variety of methods, including affiliated and unaffiliated sales forces, broker/dealers and direct sales to the public of shares offered at a low or no sales charge. Many larger mutual fund complexes have significant advertising budgets and established relationships with brokerage houses with large distribution networks, which enable these fund complexes to reach broad
11
client bases. Many investment management firms offer services and products similar to ours, as well as other independent financial advisors. We also compete with brokerage and investment banking firms, insurance companies, commercial banks and other financial institutions and businesses offering other financial products in all aspects of their businesses. Although no single company or group of companies consistently dominates the mutual fund management and services industry, many are larger than us, have greater resources and offer a wider array of financial services and products. We believe that competition in the mutual fund industry will increase as a result of increased flexibility afforded to banks and other financial institutions to sponsor mutual funds and distribute mutual fund shares. Additionally, barriers to entry into the investment management business are relatively few, and thus, we face a potentially growing number of competitors, especially during periods of strong financial and economic markets.
The distribution of mutual funds and other investment products has undergone significant developments in recent years, which has intensified the competitive environment in which we operate. These developments include the introduction of new products, increasingly complex distribution systems with multiple classes of shares, the development of Internet websites providing investors with the ability to invest on-line, the introduction of sophisticated technological platforms used by financial advisors to sell and service mutual funds for their clients, the introduction of separately managed accounts—previously available only to institutional investors—to individuals, and growth in the number of mutual funds offered. We believe our business model targets customers seeking personal assistance from financial advisors or planners where the primary competition is companies distributing products through a financial advisor or broker/dealer sales force. Our financial advisors compete primarily with large and small broker/dealers, independent financial advisors and insurance representatives. The market for financial planning and advice is extremely fragmented, consisting primarily of relatively small companies with fewer than 100 investment professionals. Competition is based on sales techniques, personal relationships and skills, and the quality of financial planning products and services offered.
We also face competition in attracting and retaining qualified financial advisors and employees. The ability to continue to compete effectively in our business depends in part on our ability to compete effectively in the labor market. In order to maximize this ability, we offer competitive compensation, a wide range of benefits and have several stock-based compensation incentive programs.
Intellectual Property
We regard our names as material to our business, and have registered certain service marks associated with our business with the United States Patent and Trademark Office.
Employees and Financial Advisors
At December 31, 2009, we had 1,462 full-time employees, consisting of 905 home office employees, 121 Legend employees, 102 managing principals, eight regional vice presidents, 14 associate managers, 156 field office support personnel, and 156 district managers.
At December 31, 2009, our sales force (excluding Legend advisors) was comprised of 2,393 financial advisors, including 2,237 financial advisors who are independent contractors and 156 district managers who are considered employees. Legend, which is a part of our Wholesale channel, had 423 retirement advisors who are independent contractors.
Available Information
We file reports, proxy statements, and other information with the SEC, copies of which can be obtained from the SEC's Public Reference Room at 100 F Street NE, Washington, D.C. 20549. Information on the operation of the Public Reference Room can be obtained by calling the SEC at 1-800-SEC-0330.
12
Reports we file electronically with the SEC via the SEC's Electronic Data Gathering, Analysis and Retrieval system ("EDGAR") may be accessed through the Internet. The SEC maintains an Internet site that contains reports, proxy and information statements, and other information regarding issuers that file electronically with the SEC, at www.sec.gov. The Company makes available free of charge our proxy statements, annual reports on Form 10-K, quarterly reports on Form 10-Q, current reports on Form 8-K and amendments to those reports under the "Corporate" section of our internet website at www.waddell.com as soon as it is reasonably practical after such filing has been made with the SEC.
Also available under the "Corporate" section is information on corporate governance. Stockholders can view our Corporate Code of Business Conduct and Ethics (the "Code of Ethics"), which applies to directors, officers and all employees of the Company, our Corporate Governance Guidelines, and the charters of key committees (including the Audit, Compensation, and Nominating and Corporate Governance Committees). Printed copies of these documents are available to any stockholder upon request by calling the investor relations department at 1-800-532-2757. Any future amendments to or waivers of the Code of Ethics will be posted to our website, as required.
Our Revenues, Earnings And Prospects Could Be Adversely Affected If The Securities Markets Decline. Our results of operations are affected by certain economic factors, including the level of the securities markets. The on-going existence of adverse market conditions, which is particularly material to us due to our high concentration of assets under management in the United States domestic stock market, and lack of investor confidence could result in investors further withdrawing from the markets or decreasing their rate of investment, either of which could adversely affect our revenues, earnings and growth prospects to a greater extent. Because our revenues are, to a large extent, investment management fees that are based on the value of assets under management, a decline in the value of these assets adversely affects our revenues and earnings. Our growth is dependent to a significant degree upon our ability to attract and retain mutual fund assets, and, in an adverse economic environment, this may prove more difficult. Our growth rate has varied from year to year and there can be no assurance that the average growth rates sustained in recent years will continue. Declines in the securities markets could significantly reduce future revenues and earnings. In addition, a decline in the market value of these assets could cause our clients to withdraw funds in favor of investments they perceive as offering greater opportunity or lower risk, which could also negatively impact our revenues and earnings. The combination of adverse markets reducing sales and investment management fees could compound on each other and materially affect earnings.
There May Be Adverse Effects On Our Revenues And Earnings If Our Funds' Performance Declines. Success in the investment management and mutual fund businesses is dependent on the investment performance of client accounts relative to market conditions and the performance of competing funds. Good relative performance stimulates sales of the Funds' shares and tends to keep redemptions low. Sales of the Funds' shares in turn generate higher management fees and distribution revenues. Good relative performance also attracts institutional and separate accounts. Conversely, poor relative performance results in decreased sales, increased redemptions of the Funds' shares and the loss of institutional and separate accounts, resulting in decreases in revenues. Failure of our Funds to perform well could, therefore, have a material adverse effect on our revenues and earnings.
Our Financial Advisors Are Classified As Independent Contractors, And Changes To Their Classification May Increase Our Operating Expenses. From time to time, various legislative or regulatory proposals are introduced at the federal or state levels to change the status of independent contractors' classification to employees for either employment tax purposes (withholding, social security, Medicare and unemployment taxes) or other benefits available to employees. Currently, most individuals are classified as employees or independent contractors for employment tax purposes based on 20 "common law" factors, rather than any definition found in the Internal Revenue Code or Treasury regulations. We classify the majority of our financial advisors as independent contractors for all purposes, including employment tax and employee
13
benefit purposes. There can be no assurance that legislative, judicial or regulatory (including tax) authorities will not introduce proposals or assert interpretations of existing rules and regulations that would change the independent contractor/employee classification of those financial advisors currently doing business with us. The costs associated with potential changes, if any, with respect to these independent contractor classifications could have a material adverse effect on the Company, including our results of operations and financial condition. See Part I, Item 3. "Legal Proceedings."
Our Business Is Subject To Substantial Risk From Litigation, Regulatory Investigations And Potential Securities Laws Liability. Many aspects of our business involve substantial risks of litigation, regulatory investigations and/or arbitration, and from time to time, we are involved in various legal proceedings in the course of operating our business. The Company is exposed to liability under federal and state securities laws, other federal and state laws and court decisions, as well as rules and regulations promulgated by the SEC, FINRA and other regulatory bodies. We, our subsidiaries, and/or certain of our past and present officers, have been named as parties in legal actions, regulatory investigations and proceedings, and securities arbitrations in the past and have been subject to claims alleging violation of such laws, rules and regulations, which have resulted in the payment of fines and settlements. An adverse resolution of any lawsuit, legal or regulatory proceeding or claim against us could result in substantial costs or reputational harm to the Company, and have a material adverse effect on the Company's business, financial condition or results of operations, which, in turn, may negatively affect the market price of our common stock and our ability to pay dividends. In addition to these financial costs and risks, the defense of litigation or arbitration may divert resources and management's attention from operations. See Part I, Item 3. "Legal Proceedings."
Regulatory Risk Is Substantial In Our Business And Non-Compliance With Regulations, Or Changes In Regulations, Could Have A Significant Impact On The Conduct Of Our Business And Our Prospects, Revenues And Earnings. Our investment advisory and broker/dealer businesses are heavily regulated, primarily at the federal level. Non-compliance with applicable laws or regulations could result in sanctions being levied against us, including fines and censures, suspension or expulsion from a certain jurisdiction or market, or the revocation of licenses. Non-compliance with applicable laws or regulations could also adversely affect our reputation, prospects, revenues and earnings. In addition, changes in current legal, regulatory, accounting, tax or compliance requirements or in governmental policies could adversely affect our operations, revenues and earnings by, among other things, increasing expenses and reducing investor interest in certain products we offer. Additionally, our profitability could be affected by rules and regulations that impact the business and financial communities generally, including changes to the laws governing state and federal taxation.
In recent years, allegations of late trading, market timing and selective disclosure of portfolio information in the mutual fund industry have prompted various legislative and regulatory proposals, some of which have been adopted by the SEC, the United States Congress, the legislatures in states in which we conduct operations and the various regulatory agencies that supervise our operations. In particular, new rules and regulations adopted by the SEC and FINRA place greater regulatory compliance and administrative burdens on us and could have a substantial impact on the regulation, operation and distribution of mutual funds and variable products, and could adversely affect our ability to distribute and retain the assets we manage and our revenues and net income. For example, recently adopted rules require investment advisers and mutual funds to adopt, implement, review and administer written policies and procedures reasonably designed to prevent violation of the federal securities laws. Similarly, public disclosure requirements applicable to mutual funds have become more stringent. We may require additional staff to satisfy these obligations, which would increase our operating expenses.
An Increasing Percentage Of Our Assets Under Management Are Distributed Through Our Wholesale Channel, Which Has Higher Redemption Rates Than Our Traditional Advisors Channel. In recent years, we have focused on expanding distribution efforts relating to our Wholesale channel. The percentage of our assets under management in the Wholesale channel has increased from 10.4% at December 31, 2003 to
14
47.0% at December 31, 2009, and the percentage of our total sales represented by the Wholesale channel has increased from 16.5% for the year ended December 31, 2003 to 75.0% for the year ended December 31, 2009. The success of sales in our Wholesale channel depends upon our maintaining strong relationships with institutional accounts, certain strategic partners and our third party distributors. Many of those distribution sources also offer investors competing funds that are internally or externally managed, which could limit the distribution of our products. The loss of any of these distribution channels and the inability to continue to access new distribution channels could decrease our assets under management and adversely affect our results of operations and growth. There are no assurances that these channels and their client bases will continue to be accessible to us. The loss or diminution of the level of business we do with those providers could have a material adverse effect on our business, especially with the high concentration of assets in certain funds in this channel, namely the Asset Strategy fund. In addition, the Wholesale channel had redemption rates of 24.0% and 35.5% for the years ended December 31, 2009 and 2008, respectively, compared to redemption rates of 8.4% and 8.9% for our Advisors channel in the same periods, reflecting the higher rate of transferability of investment assets in the Wholesale channel.
There May Be An Adverse Effect On Our Revenues And Earnings If Our Investors Redeem The Assets We Manage On Short Notice. Mutual fund investors may redeem their investments in our mutual funds at any time without any prior notice. Additionally, our investment management agreements with institutions and other non-mutual fund accounts are generally terminable upon relatively short notice. Investors can terminate their relationship with us, reduce their aggregate amount of assets under management, or shift their funds to other types of accounts with different rate structures for any number of reasons, including investment performance, changes in prevailing interest rates and financial market performance. The ability of our investors to accomplish this on short notice has increased materially due to the growth of assets in our Wholesale channel, and with the high concentration of assets in certain funds in this channel, including the Asset Strategy fund. The decrease in revenues that could result from any such event could have a material adverse effect on our business and earnings.
There Are No Assurances That We Will Pay Future Dividends, Which Could Adversely Affect Our Stock Price. The Waddell & Reed Financial, Inc. Board of Directors (the "Board of Directors") currently intends to continue to declare quarterly dividends on our Class A common stock (our "common stock"); however, the declaration and payment of dividends is subject to the discretion of our Board of Directors. Any determination as to the payment of dividends, as well as the level of such dividends, will depend on, among other things, general economic and business conditions, our strategic plans, our financial results and condition, and contractual, legal, and regulatory restrictions on the payment of dividends by us or our subsidiaries. We are a holding company and, as such, our ability to pay dividends is subject to the ability of our subsidiaries to provide us with cash. There can be no assurance that the current quarterly dividend level will be maintained or that we will pay any dividends in any future period(s). Any change in the level of our dividends or the suspension of the payment thereof could adversely affect our stock price.
Our Ability To Hire And Retain Senior Executive Management And Other Key Personnel Is Significant To Our Success And Growth. Our continued success depends to a substantial degree on our ability to attract and retain qualified senior executive management and other key personnel to conduct our broker/dealer, fund management and investment advisory businesses. The market for qualified fund managers, investment analysts and financial advisors is extremely competitive. Additionally, we are dependent on our financial advisors and select wholesale distributors to sell our mutual funds and other investment products. Our growth prospects will be directly affected by the quality, quantity and productivity of financial advisors we are able to successfully recruit and retain. There can be no assurances that we will be successful in our efforts to recruit and retain the required personnel.
We Have Substantial Intangibles On Our Balance Sheet, And Any Impairment Of Our Intangibles Could Adversely Affect Our Results of Operations And Financial Position. At December 31, 2009, our total assets were approximately $983.4 million, of which approximately $221.2 million, or 22%, consisted of goodwill and identifiable intangible assets. We complete an ongoing review of goodwill and intangible assets for
15
impairment on an annual basis or more frequently whenever events or a change in circumstances warrant. Important factors in determining whether an impairment of goodwill or intangible assets might exist include significant continued underperformance compared to peers, the likelihood of termination or non-renewal of a mutual fund advisory or subadvisory contract or substantial changes in revenues earned from such contracts, significant changes in our business and products, material and ongoing negative industry or economic trends, or other factors specific to each asset or subsidiary being tested. Because of the significance of goodwill and other intangibles to our consolidated balance sheets, the annual impairment analysis is critical. Any changes in key assumptions about our business and our prospects, or changes in market conditions or other externalities, could result in an impairment charge. Any such charge could have a material effect on our results of operations and financial position.
There May Be Adverse Effects On Our Business And Earnings Upon The Termination Of, Or Failure To Renew, Certain Agreements. A majority of our revenues are derived from investment management agreements with the Funds that, as required by law, are terminable on 60 days' notice. Each investment management agreement must be approved and renewed annually by the disinterested members of each Fund's board of directors/trustees or its shareholders, as required by law. Additionally, our investment management agreements provide for automatic termination in the event of assignment, which includes a change of control, without the consent of our clients and, in the case of the Funds, approval of the Funds' board of directors/trustees and shareholders to continue the agreements. There can be no assurances that our clients will consent to any assignment of our investment management agreements, or that those and other contracts will not be terminated or will be renewed on favorable terms, if at all, at their expiration and new agreements may not be available. See "Business – Distribution Channels – Wholesale Channel, Institutional Channel." The decrease in revenues that could result from any such event could have a material adverse effect on our business and earnings.
There Is No Assurance That New Information Systems Will be Implemented Successfully. A number of the Company's key information technology systems were developed solely to handle the Company's particular information technology infrastructure. The Company is in the process of evaluating and implementing new information technology and systems that it believes could facilitate and improve our core businesses and our productivity. There can be no assurance that the Company will be successful in implementing the new information technology and systems or that their implementation will be completed in a timely or cost effective manner. Failure to implement or maintain adequate information technology infrastructure could impede our ability to support business growth.
Systems Failure May Disrupt Our Business And Result In Financial Loss And Liability To Our Clients. Our business is highly dependent on financial, accounting and other data processing systems, and other communications and information systems, including our mutual fund transfer agency system maintained by a third-party service provider. We process a large number of transactions on a daily basis and rely upon the proper functioning of computer systems of third parties. If any of these systems do not function properly, we could suffer financial loss, business disruption, liability to clients, regulatory intervention or damage to our reputation. If our systems are unable to accommodate an increasing volume of transactions, our ability to expand could be affected. Although we have back-up systems in place, we cannot be sure that any systems failure or interruption, whether caused by a fire, other natural disaster, power or telecommunications failure, acts of terrorism or war or otherwise will not occur, or that back-up procedures and capabilities in the event of any failure or interruption will be adequate.
Regulations Restricting The Use Of "Soft Dollars" Could Result In An Increase In Our Expenses. On behalf of our mutual fund and investment advisory clients, we make decisions to buy and sell securities for each portfolio, select broker/dealers to execute trades, and negotiate brokerage commission rates. In connection with these transactions, we may receive "soft dollar credits" from broker/dealers that we can use to defray certain of our expenses. If regulations are adopted eliminating the ability of asset managers to use "soft dollars," our operating expenses could increase.
16
Fee Pressures Could Reduce Our Revenues And Profitability. There is a trend toward lower fees in some segments of the investment management business. In addition, the SEC has adopted rules that are designed to improve mutual fund corporate governance, which could result in further downward pressure on investment advisory fees in the mutual fund industry. Accordingly, there can be no assurance that we will be able to maintain our current fee structure. Fee reductions on existing or future new business could have an adverse impact on our revenues and profitability.
We Could Experience Adverse Effects On Our Revenues, Profits And Market Share Due To Strong Competition From Numerous And Sometimes Larger Companies. We compete with stock brokerage firms, mutual fund companies, investment banking firms, insurance companies, banks, Internet investment sites, and other financial institutions and individual registered investment advisers. Many of these companies not only offer mutual fund investments and services, but also offer an ever-increasing number of other financial products and services. Many of our competitors have more products and product lines, services and brand recognition and may also have substantially greater assets under management. Many larger mutual fund complexes have developed more extensive relationships with brokerage houses with large distribution networks, which may enable those fund complexes to reach broader client bases. In recent years, there has been a trend of consolidation in the mutual fund industry resulting in stronger competitors with greater financial resources than us. There has also been a trend toward online Internet financial services. If existing or potential customers decide to invest with our competitors instead of with us, our market share, revenues and income could decline.
The Terms Of Our Credit Facility Impose Restrictions On Our Operations That May Adversely Impact Our Prospects And The Operations Of Our Business. There are no assurances that we will be able to raise additional capital if needed, which could negatively impact our liquidity, prospects and operations. We have entered into a 364-day revolving credit facility with various lenders providing for total loans of $125.0 million. Under this facility, the lenders may, at their option upon our request, expand the facility to $200.0 million. At February 18, 2010, there was no balance outstanding under the revolving credit facility. The terms and conditions of our revolving credit facility and the money market loans impose restrictions that affect, among other things, our ability to incur additional debt, make capital expenditures and acquisitions, merge, sell assets, pay dividends and create or incur liens. Our ability to comply with the financial covenants set forth in our credit facility could be affected by events beyond our control, and there can be no assurance that we will achieve operating results that will comply with such terms and conditions, a breach of which could result in a default under our credit facility. In the event of a default, the banks could elect to declare the outstanding principal amount of our credit facility, all interest thereon, and all other amounts payable under our credit facility to be immediately due and payable.
Our ability to meet our cash needs and satisfy our debt obligations will depend upon our future operating performance, asset values, the perception of our creditworthiness and, indirectly, the market value of our stock. These factors will be affected by prevailing economic, financial and business conditions and other circumstances, some of which are beyond our control. We anticipate that any borrowings from our existing credit facility, money market loans and/or cash provided by operating activities will provide sufficient funds to finance our business plans, meet our operating expenses and service our debt obligations as they become due. However, in the event that we require additional capital, there can be no assurance that we will be able to raise such capital when needed or on satisfactory terms, if at all, and there can be no assurance that we will be able to renew or refinance our credit facility upon its maturity or on favorable terms. If we are unable to raise capital or obtain financing, we may be forced to incur unanticipated costs or revise our business plan.
Potential Misuse Of Funds And Information In The Possession Of Our Employees And/Or Advisors Could Result In Liability To Our Clients, Subject Us To Regulatory Sanctions Or Otherwise Adversely Affect Our Revenues and Profitability. Our business is based on the trust and confidence of our clients, for whom our financial advisors handle a significant amount of funds, as well as financial and personal information. Although we have implemented a system of internal controls to minimize the risk of fraudulent taking or misuse of
17
funds and information, there can be no assurance that our controls will be adequate or that a taking or misuse by our employees or financial advisors can be prevented. We could be liable in the event of a taking or misuse by our employees or financial advisors and we could also be subject to regulatory sanctions. Although we believe that we have adequately insured against these risks, there can be no assurance that our insurance will be maintained or that it will be adequate to meet any liability. Any damage to the trust and confidence placed in us by our clients may cause assets under management to decline, which could adversely affect our revenues, financial condition, results of operations and business prospects.
Our Stockholders Rights Plan Could Deter Takeover Attempts, Which Some Of Our Stockholders May Believe To Be In Their Best Interest. Under certain conditions, the rights under our stockholders rights plan entitle the holders of such rights to receive shares of our common stock having a value equal to two times the exercise price of the right. The rights are attached to each share of our outstanding common stock and generally are exercisable only if a person or group acquires 15% or more of the voting power represented by our common stock. Our stockholders rights plan could impede the completion of a merger, tender offer, or other takeover attempt even though some or a majority of our stockholders might believe that a merger, tender offer or takeover is in their best interests, and even if such a transaction could result in our stockholders receiving a premium for their shares of our stock over the then current market price of our stock.
Provisions Of Our Organizational Documents Could Deter Takeover Attempts, Which Some Of Our Stockholders May Believe To Be In Their Best Interest. Under our Certificate of Incorporation, our Board of Directors has the authority, without action by our stockholders, to fix certain terms and issue shares of our Preferred Stock, par value $1.00 per share. Actions of our Board of Directors pursuant to this authority may have the effect of delaying, deterring or preventing a change in control of the Company. Other provisions in our Certificate of Incorporation and in our Bylaws impose procedural and other requirements that could be deemed to have anti-takeover effects, including replacing incumbent directors. Our Board of Directors is divided into three classes, each of which is to serve for a staggered three-year term after the initial classification and election, and incumbent directors may not be removed without cause, all of which may make it more difficult for a third party to gain control of our Board of Directors. In addition, as a Delaware corporation we are subject to section 203 of the Delaware General Corporation Law. With certain exceptions, section 203 imposes restrictions on mergers and other business combinations between us and any holder of 15% or more of our voting stock.
Our Holding Company Structure Results In Structural Subordination And May Affect Our Ability To Fund Our Operations And Make Payments On Our Debt. We are a holding company and, accordingly, substantially all of our operations are conducted through our subsidiaries. As a result, our cash flow and our ability to service our debt, including $200 million of our senior notes, are dependent upon the earnings of our subsidiaries and the distribution of earnings, loans or other payments by our subsidiaries to us. Our subsidiaries are separate and distinct legal entities and have no obligation to pay any amounts due on our debt or provide us with funds for our payment obligations, whether by dividends, distributions, loans or other payments. In addition, any payment of dividends, distributions, loans or advances to us by our subsidiaries could be subject to statutory or contractual restrictions. Payments to us by our subsidiaries will also be contingent upon our subsidiaries' earnings and business considerations. Our right to receive any assets of any of our subsidiaries upon their liquidation or reorganization, and therefore the right of the holders of our debt to participate in those assets, would be effectively subordinated to the claims of those subsidiaries' creditors, including trade creditors. In addition, even if we were a creditor of any of our subsidiaries, our rights as a creditor would be effectively subordinate to any security interest in the assets of our subsidiaries and any indebtedness of our subsidiaries senior to that held by us.
ITEM 1B. Unresolved Staff Comments
None.
18
Our home offices lease approximately 358,000 square feet for Waddell & Reed and Legend located in Overland Park, Kansas and Palm Beach Gardens, Florida, respectively. This figure does not include office space of 41,000 square feet formerly leased by Mackenzie Investment Management Inc. in Boca Raton, Florida, which has been sublet. In addition, we lease office space for financial advisors and sales management in various locations throughout the United States totaling approximately 639,000 square feet. In the opinion of management, the office space leased by the Company is adequate for existing operating needs.
The Company is involved from time to time in various legal proceedings, regulatory investigations and claims incident to the normal conduct of business, which may include proceedings that are specific to us and others generally applicable to the business practices within the industries in which we operate. A substantial legal liability or a significant regulatory action against us could have an adverse effect on our business, financial condition and on the results of operations in a particular quarter or year.
Michael E. Taylor, Kenneth B. Young, individuals, on behalf of themselves individually and on behalf of others similarly situated v. Waddell & Reed, Inc., a Delaware Corporation; Waddell & Reed Financial, Inc., a Delaware Corporation; Waddell & Reed Development, Inc., a Delaware Corporation; Waddell & Reed Financial Advisors, a fictitious business name; and DOES 1 through 10 inclusive; Case No. 09-CV-2909 DMS WVG; in the United States District Court for the Southern District of California.
In an action filed December 28, 2009, the Company, along with various of its affiliates, were sued in an individual action, class action and Fair Labor Standards Act ("FLSA") nationwide collective action by two former advisors asserting misclassification of financial advisers as independent contractors. Plaintiffs assert claims under the FLSA for minimum wages and overtime wages, and under California Labor Code Statutes for timely pay wages, minimum wages, overtime compensation, meal periods, reimbursement of losses and business expenses and itemized wage statements and a claim for Unfair Business Practices under §17200 of the California Business & Professions Code. Plaintiffs seek declaratory and injunctive relief and monetary damages. As yet, no responsive pleading has been filed, but the Company intends to vigorously contest plaintiffs' claims.
In the opinion of management, the ultimate resolution and outcome of this matter is uncertain. At this stage of the litigation, the Company is unable to estimate the expense or exposure, if any, that it may represent. The ultimate resolution of this matter, or an adverse determination against the Company, could have a material adverse impact on the financial position and results of operations of the Company. However, this possible impact is unknown and not reasonably determinable; therefore, no liability has been recorded in the consolidated financial statements.
ITEM 4. Submission of Matters to a Vote of Security Holders
During the fourth quarter of the fiscal year covered by this report, no matter was submitted to a vote of the Company's security holders, through the solicitation of proxies or otherwise.
19
ITEM 5. Market for Registrant's Common Equity, Related Stockholder Matters and Issuer Purchases of Equity Securities
Our Class A common stock ("common stock") is traded on the NYSE under the ticker symbol "WDR." The following table sets forth, for the periods indicated, the high and low sale prices of our common stock, as reported by the NYSE, as well as the cash dividends declared for these time periods:
| |
2009 | 2008 | ||||||||||||||||||
|---|---|---|---|---|---|---|---|---|---|---|---|---|---|---|---|---|---|---|---|---|
| Quarter |
High |
Low |
Dividends Per Share |
High |
Low |
Dividends Per Share |
||||||||||||||
| 1 | $ | 19.64 | $ | 11.40 | $ | 0.19 | $ | 36.08 | $ | 27.76 | $ | 0.19 | ||||||||
| 2 | 28.00 | 17.16 | 0.19 | 38.00 | 30.88 | 0.19 | ||||||||||||||
| 3 | 29.27 | 23.25 | 0.19 | 35.07 | 21.25 | 0.19 | ||||||||||||||
| 4 | 31.50 | 26.76 | 0.19 | 25.27 | 8.57 | 0.19 | ||||||||||||||
Year-end closing prices of our common stock were $30.54 and $15.46 for 2009 and 2008, respectively. The closing price of our common stock on February 18, 2010 was $32.35.
According to the records of our transfer agent, we had 3,526 holders of record of common stock as of February 18, 2010. We believe that a substantially larger number of beneficial stockholders hold such shares in depository or nominee form.
Dividends
The declaration of dividends is subject to the discretion of the Board of Directors. We intend, from time to time, to pay cash dividends on our common stock as our Board of Directors deems appropriate, after consideration of our operating results, financial condition, cash and capital requirements, compliance with covenants in our revolving credit facility and such other factors as the Board of Directors deems relevant. Our current credit facility does not limit our ability to pay cash dividends. To the extent assets are used to meet minimum net capital requirements under the Net Capital Rule, they are not available for distribution to stockholders as dividends. See Part I, Item 1. "Business—Regulation." We anticipate that quarterly dividends will continue to be paid.
Common Stock Repurchases
Our Board of Directors has authorized the repurchase of our common stock in the open market and/or private purchases. The acquired shares may be used for corporate purposes, including shares issued to employees in our stock-based compensation programs. During the year ended December 31, 2009, we repurchased (i) 1,542,733 shares in the open market and privately at an aggregate cost, including commissions, of $36.4 million, (ii) 6,493 mature shares from stock incentive plan participants to cover the strike price of options exercised in connection with a Stock Option Restoration Program (the "SORP"), (iii) nine newly issued shares from SORP participants to cover their statutory minimum tax withholdings on option exercises, and (iv) 327,301 shares from related parties to cover their tax withholdings from the vesting of nonvested shares. The aggregate cost of shares obtained from related parties during 2009 was $7.1 million. The purchase price paid by us for private repurchases of our common stock from related parties is the closing market price on the purchase date.
20
The following table sets forth certain information about the shares of common stock we repurchased during the fourth quarter of 2009.
Period
|
Total Number of Shares Purchased (1) |
Average Price Paid per Share |
Total Number of Shares Purchased as Part of Publicly Announced Program |
Maximum Number (or Approximate Dollar Value) of Shares That May Yet Be Purchased Under The Program |
|||||||
|---|---|---|---|---|---|---|---|---|---|---|---|
October 1 - October 31 |
- | $ | - | - | n/a (1) | ||||||
November 1 - November 30 |
10,000 | 31.00 | 10,000 | n/a (1) | |||||||
December 1 - December 31 |
93,693 | 30.15 | 93,693 | n/a (1) | |||||||
Total |
103,693 | $ | 30.23 | 103,693 | |||||||
- (1)
- On August 31, 1998, we announced that our Board of Directors approved a program to repurchase shares of our common stock on the open market. Under the repurchase program, we are authorized to repurchase, in any seven-day period, the greater of (i) 3% of our outstanding common stock or (ii) $50 million of our common stock. We may repurchase our common stock through the NYSE, other national or regional market systems, electronic communication networks or alternative trading systems such as POSIT, during regular or after-hours trading sessions. POSIT is an alternative trading system that uses passive pricing to anonymously match buy and sell orders. To date, we have not used electronic communication networks or alternative trading systems to repurchase any of our common stock and do not intend to use such networks or systems in the foreseeable future. Our stock repurchase program does not have an expiration date or an aggregate maximum number or dollar value of shares that may be repurchased. Our Board of Directors reviewed and ratified the stock repurchase program in July 2004. During the fourth quarter of 2009, all stock repurchases were made pursuant to the repurchase program, including 71,193 shares, reflected in the table above, that were purchased in connection with funding employee income tax withholding obligations arising from the vesting of nonvested shares.
21
Total Return Performance
Comparison of Cumulative Total Return (1)
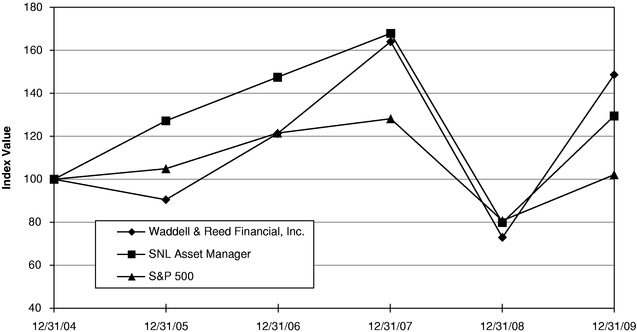
The above graph compares the cumulative total stockholder return on the Company's Class A common stock from December 31, 2004 through December 31, 2009, with the cumulative total return of the Standard & Poor's 500 Stock Index and the SNL Asset Manager Index. The SNL Asset Manager Index is a composite of 32 publicly traded asset management companies (including, among others, the companies in the peer group reviewed by the Compensation Committee for executive compensation purposes) prepared by SNL Financial, Charlottesville, Virginia. The graph assumes the investment of $100 in the Company's Class A common stock and in each of the two indices on December 31, 2004 with all dividends being reinvested. The closing price of the Company's Class A common stock on December 31, 2004 (the last trading day of the year) was $23.89 per share. The stock price performance on the graph is not necessarily indicative of future price performance.
| |
Period Ending | |
||||||||||||
|---|---|---|---|---|---|---|---|---|---|---|---|---|---|---|
| Index |
12/31/04 |
12/31/05 |
12/31/06 |
12/31/07 |
12/31/08 |
12/31/09 |
|
|||||||
Waddell & Reed Financial, Inc. |
100.00 |
90.46 |
121.25 |
164.01 |
72.92 |
148.62 |
||||||||
SNL Asset Manager |
100.00 |
127.18 |
147.49 |
167.89 |
79.79 |
129.44 |
||||||||
S&P 500 |
100.00 |
104.91 |
121.48 |
128.16 |
80.74 |
102.11 |
||||||||
|
||||||||||||||
- (1)
- Cumulative Total Return assumes an initial investment of $100 on December 31, 2004, with the reinvestment of all dividends through December 31, 2009.
22
ITEM 6. Selected Financial Data
The following table sets forth our selected consolidated financial and other data at the dates and for the periods indicated. Selected financial data should be read in conjunction with, and is qualified in its entirety by, "Management's Discussion and Analysis of Financial Condition and Results of Operations" and our Consolidated Financial Statements and the Notes thereto appearing elsewhere in this report.
| |
For the Year Ended December 31, | |||||||||||||||
|---|---|---|---|---|---|---|---|---|---|---|---|---|---|---|---|---|
| |
2009 (1) | 2008 (2) | 2007 | 2006 (3) | 2005 (4) | |||||||||||
| |
(in thousands, except per share data and number of financial advisors) |
|||||||||||||||
Revenues from: |
||||||||||||||||
Investment management fees |
$ | 354,593 | 399,863 | 372,345 | 311,525 | 267,681 | ||||||||||
Underwriting and distribution fees |
378,678 | 416,762 | 371,085 | 317,458 | 272,590 | |||||||||||
Shareholder service fees |
105,818 | 102,495 | 94,124 | 89,672 | 81,809 | |||||||||||
Total revenues |
839,089 | 919,120 | 837,554 | 718,655 | 622,080 | |||||||||||
Net income |
105,505 |
96,163 |
125,497 |
46,112 |
60,121 |
|||||||||||
per common share—basic |
1.23 | 1.12 | 1.49 | 0.55 | 0.72 | |||||||||||
per common share—diluted |
1.23 | 1.12 | 1.48 | 0.54 | 0.72 | |||||||||||
Dividends declared per common share |
$ | 0.76 | 0.76 | 0.68 | 0.60 | 0.60 | ||||||||||
Advisor and productivity data (excluding Legend): |
||||||||||||||||
Investment product sales (5) |
$ | 2,236,642 | 2,696,910 | 2,632,411 | 2,276,405 | 1,901,356 | ||||||||||
Number of financial advisors |
2,393 | 2,366 | 2,293 | 2,255 | 2,409 | |||||||||||
Average number of financial advisors |
2,336 | 2,297 | 2,190 | 2,290 | 2,453 | |||||||||||
Investment product sales per advisor |
$ | 957 | 1,174 | 1,189 | 994 | 776 | ||||||||||
Wholesale channel data: |
||||||||||||||||
Sales (net of commissions) |
$ | 14,745,230 | 15,598,998 | 9,469,932 | 4,541,812 | 2,346,749 | ||||||||||
Number of external wholesalers |
34 | 35 | 34 | 26 | 23 | |||||||||||
Institutional channel sales |
$ |
1,703,470 |
2,358,104 |
1,882,908 |
968,106 |
654,333 |
||||||||||
| |
As of December 31, | |||||||||||||||
|---|---|---|---|---|---|---|---|---|---|---|---|---|---|---|---|---|
| |
2009 | 2008 | 2007 | 2006 | 2005 | |||||||||||
| |
(in millions) |
|||||||||||||||
Assets under management |
$ | 69,783 | 47,484 | 64,868 | 48,401 | 41,863 | ||||||||||
Balance sheet data: |
||||||||||||||||
Goodwill and identifiable intangible assets |
221.2 | 221.2 | 228.4 | 228.4 | 250.3 | |||||||||||
Total assets |
983.4 | 775.4 | 893.8 | 662.7 | 632.3 | |||||||||||
Short-term debt |
— | — | — | — | 1.7 | |||||||||||
Long-term debt |
200.0 | 200.0 | 200.0 | 199.9 | 198.2 | |||||||||||
Total liabilities |
614.3 | 455.3 | 512.1 | 418.0 | 384.9 | |||||||||||
Stockholders' equity |
369.1 | 320.1 | 381.7 | 244.7 | 247.4 | |||||||||||
23
- (1)
- Includes
a pre-tax charge of $3.7 million ($2.3 million net of tax) to reflect the "other than temporary" decline in value of
certain of the Company's investments in affiliated mutual funds as the fair value of these investments had been below cost for an extended period; a pre-tax charge of $1.1 million
($800 thousand net of tax) for severance and other transaction costs in connection with the divestiture of our investment in ACF; and tax benefits of $1.6 million related to carrying
back a portion of the capital loss generated by the divestiture of our investment in ACF to fully offset capital gains generated during the three year carryback period.
- (2)
- Includes
a pre-tax charge of $16.5 million ($10.5 million net of tax) for restructuring charges consisting primarily of severance
costs associated with our voluntary separation program as well as costs associated with terminating various projects under development; a charge of $7.2 million (not deductible for income tax
purposes) to recognize the impairment of goodwill associated with ACF; additional amortization of our deferred sales commission asset of $6.5 million ($4.1 million net of tax) due to
significant asset redemption activity and our review of the recoverability of our deferred sales commission asset; and a pre-tax charge of $2.1 million ($1.4 million net of
tax) related to the settlement of miscellaneous litigation and other matters.
- (3)
- Includes
a pre-tax charge of $55.0 million ($39.4 million net of tax) to recognize our settlement with the SEC, New York Attorney
General and Kansas Securities Commissioner related to market-timing allegations; a charge of $20.0 million (not deductible for income tax purposes) to recognize the impairment of goodwill
associated with ACF; charges associated with the resolution of the Williams excessive fee litigation; expenses related to prior regulatory settlements; and a pre-tax charge of
$1.9 million ($1.3 million net of tax) related to employee separation costs at ACF in response to a decline in investment performance and related loss of assets under management.
- (4)
- Includes
pre-tax charges totaling $47.4 million ($30.8 million net of tax) recorded during 2005 related to settlements of
outstanding legal matters with Torchmark for actions in Alabama, California and Kansas, a settlement with the National Association of Securities Dealers ("NASD") and a consortium of states relating to
variable annuity sales practices; separation of employment payments to our former chief executive officer; a NASD arbitration settlement with a former financial advisor; and other employee separation
payments related to the restructuring of the Advisors channel.
- (5)
- Investment product sales are commissionable sales by our financial advisors, shown gross of commissions, and do not include mutual funds sold at net asset value or sales of other wholesale mutual funds or insurance products.
24
ITEM 7. Management's Discussion and Analysis of Financial Condition and Results of Operations
This Item contains "forward-looking statements" within the meaning of Section 27A of the Securities Act of 1933, as amended, and Section 21E of the Securities Exchange Act of 1934, as amended, which reflect the current views and assumptions of management with respect to future events regarding our business and the industry in general. These forward-looking statements include all statements, other than statements of historical fact, regarding our financial position, business strategy and other plans and objectives for future operations, including statements with respect to revenues and earnings, the amount and composition of assets under management, distribution sources, expense levels, redemption rates and the financial markets and other conditions. These statements are generally identified by the use of words such as "may," "could," "should," "would," "believe," "anticipate," "forecast," "estimate," "expect," "intend," "plan," "project," "outlook," "will," "potential" and similar statements of a future or forward- looking nature. Readers are cautioned that any forward-looking information provided by or on behalf of the Company is not a guarantee of future performance. Certain important factors that could cause actual results to differ materially from our expectations are disclosed in the "Risk Factors" section of this Form 10-K, which include, without limitation, the adverse effect from a decline in securities markets or in the relative investment performance of our products, our inability to pay future dividends, the loss of existing distribution channels or the inability to access new ones, a reduction of the assets we manage on short notice, and adverse results of litigation and/or arbitration. All forward-looking statements speak only as of the date on which they are made and we undertake no duty to update or revise any forward-looking statements, whether as a result of new information, future events or otherwise.
The following should be read in conjunction with the "Selected Financial Data" and our Consolidated Financial Statements and Notes thereto appearing elsewhere in this report.
Executive Overview
We are one of the oldest mutual fund and asset management firms in the country, with expertise in a broad range of investment styles and across a variety of market environments. Our earnings and cash flows are heavily dependent on financial market conditions. Significant increases or decreases in the various securities markets, particularly United States equity markets, can have a material impact on our results of operations, financial condition and cash flows.
Revenue Sources
We derive our revenues primarily from providing investment management, investment product underwriting and distribution, and shareholder services administration to mutual funds and institutional and separately managed accounts. Investment management fees, a substantial source of our revenues, are based on the amount of average assets under management and are affected by sales levels, financial market conditions, redemptions and the composition of assets. Underwriting and distribution revenues, another substantial source of revenues, consist of commissions derived from sales of investment and insurance products, distribution fees on certain variable products, and fees earned on fee-based asset allocation products, as well as advisory services. The products sold have various commission structures and the revenues received from product sales vary based on the type and amount sold. Rule 12b-1 service and distribution fees earned for servicing and/or distributing certain mutual fund shares are based upon assets under management and fluctuate based on sales, redemptions and financial market conditions. Other service fees include transfer agency fees, custodian fees for retirement plan accounts and portfolio accounting.
Expense Drivers
Our major expenses are underwriting and distribution-related commissions, employee compensation, amortization of deferred sales commissions, subadvisory fee expenses and information technology expense.
25
Our Distribution Channels
One of our distinctive qualities is that we are a significant distributor of investment products. Our retail products are distributed through our Advisors channel sales force of independent financial advisors or through our Wholesale channel, which includes third-parties such as other broker/dealers, registered investment advisors (including the retirement advisors of Legend) and various retirement platforms. We also market our investment advisory services to institutional investors, either directly or through consultants, in our Institutional channel.
In the Advisors channel, our sales force consists of 2,393 independent financial advisors providing personal financial planning services to our clients across the United States, focusing on investment strategies for retirement, education funding, insurance, estate planning and other specific needs.
In our Wholesale channel, we distribute retail mutual funds through broker/dealers, registered investment advisors, including Legend, our Florida-based retirement planning subsidiary and various retirement platforms. A team of 34 external wholesalers, six hybrid wholesalers and 33 internal wholesalers lead the efforts in this channel.
Through our Institutional channel we manage assets for defined benefit pension plans, other investment companies (as a subadvisor), defined contribution plans, endowments and high net worth clients.
Sale of Austin, Calvert & Flavin, Inc.
On July 15, 2009, the Company completed the sale of its wholly-owned subsidiary, ACF, pursuant to a stock purchase agreement dated June 26, 2009. The agreement includes an earnout provision based on a percentage of revenues on existing accounts over the three-year period subsequent to the closing date. Prior to the closing date, ACF had 10 employees and assets under management of $488.0 million.
We recorded charges for severance and other transaction costs of $1.1 million in connection with the divestiture of our investment in ACF in 2009, which are included in general and administrative expenses in the consolidated statement of income.
For tax purposes, this sale resulted in a capital loss of $28.1 million, which will generate future tax benefits available to offset potential future and prior period capital gains. Due to the character of the loss and the limited carryforward period permitted by law, the Company may not realize the full tax benefit of the capital loss. We recorded tax benefits in 2009 of $1.6 million related to carrying back a portion of the capital loss to fully offset capital gains generated during the applicable three-year carryback period.
Market Developments
During 2008, we operated in a period of high volatility in the financial markets—the Dow Jones Industrial Average declined 34% and the Standard & Poor's 500 Index declined 38%. Almost every class of financial assets experienced significant price declines and high volatility. The U.S. government took steps to stabilize the financial markets and the banking system to ensure continued availability of commercial and consumer credit. Markets rallied in 2009; the Dow Jones Industrial Average increased 19% and the Standard & Poor's 500 Index increased 23%. Even with the recent market improvements, the economic outlook remains uncertain and we anticipate a challenging business climate in the foreseeable future.
Consequences of Market Developments
We took steps in the fourth quarter of 2008 to manage our expenses in response to the deteriorating market conditions. In December 2008, we offered a voluntary separation program to our employees that included enhanced severance benefits. A total of 169 employees accepted the program, which for most was effective by December 31, 2008. Related to this program, we recorded a restructuring charge of $16.5 million in general and administrative expenses. During 2009 we focused on cost control, especially in the areas of salaries and benefits, business meetings and travel, and convention costs.
26
Average assets under management during 2009 were down 9% compared to average assets under management during 2008, which resulted in a significant decline in revenue in 2009 relative to 2008. However, our assets under management as of December 31, 2009 have returned to the peak levels achieved in 2008. We will continue to employ expense control in response to uncertain future market conditions, but plan to add investment management, back office and sales personnel strategically to support our current growth.
Current State
Our balance sheet remains strong, as we ended the year with cash and investments of $314.9 million. We renewed our 364-day unsecured line of credit in October of 2009 with commitments from a syndicate of banks for $125.0 million, expandable to $200.0 million. We believe that our current liquidity position will allow us to manage through further possible market declines for the foreseeable future.
Our $200.0 million in outstanding senior notes are scheduled to mature in January 2011 and we are currently evaluating our refinancing alternatives.
27
Assets Under Management
Assets under management of $69.8 billion on December 31, 2009 grew 47% compared to the $47.5 billion reported a year earlier due to market appreciation of $13.5 billion and net sales of $8.7 billion generated primarily by the Wholesale channel.
Change in Assets Under Management (1)
| |
Advisors Channel |
Wholesale Channel |
Institutional Channel |
Total | ||||||||
|---|---|---|---|---|---|---|---|---|---|---|---|---|
| |
(in millions) |
|||||||||||
December 31, 2009 |
||||||||||||
Beginning Assets |
$ | 23,472 | 17,489 | 6,523 | 47,484 | |||||||
Disposition of Assets |
- |
- |
(488) |
(488) |
||||||||
Sales (net of commissions) |
3,202 |
14,745 |
1,703 |
19,650 |
||||||||
Redemptions |
(3,052) | (5,951) | (1,942) | (10,945) | ||||||||
Net Sales |
150 | 8,794 | (239) | 8,705 | ||||||||
Net Exchanges |
(197) |
150 |
41 |
(6) |
||||||||
Reinvested Dividends and Capital Gains |
329 | 124 | 113 | 566 | ||||||||
Net Flows |
282 | 9,068 | (85) | 9,265 | ||||||||
Market Appreciation |
5,720 |
6,261 |
1,541 |
13,522 |
||||||||
Ending Assets |
$ | 29,474 | 32,818 | 7,491 | 69,783 | |||||||
December 31, 2008 |
||||||||||||
Beginning Assets |
$ | 34,562 | 21,537 | 8,769 | 64,868 | |||||||
Sales (net of commissions) |
3,724 |
15,599 |
2,359 |
21,682 |
||||||||
Redemptions |
(3,771) | (8,541) | (1,561) | (13,873) | ||||||||
Net Sales |
(47) | 7,058 | 798 | 7,809 | ||||||||
Net Exchanges |
(150) |
145 |
- |
(5) |
||||||||
Reinvested Dividends and Capital Gains |
325 | (271) | 119 | 173 | ||||||||
Net Flows |
128 | 6,932 | 917 | 7,977 | ||||||||
Market Depreciation |
(11,218) |
(10,980) |
(3,163) |
(25,361) |
||||||||
Ending Assets |
$ | 23,472 | 17,489 | 6,523 | 47,484 | |||||||
December 31, 2007 |
||||||||||||
Beginning Assets |
$ | 29,905 | 10,819 | 7,677 | 48,401 | |||||||
Sales (net of commissions) |
3,551 |
9,470 |
1,883 |
14,904 |
||||||||
Redemptions |
(3,829) | (2,795) | (2,128) | (8,752) | ||||||||
Net Sales |
(278) | 6,675 | (245) | 6,152 | ||||||||
Net Exchanges |
(180) |
173 |
- |
(7) |
||||||||
Reinvested Dividends and Capital Gains |
245 | (24) | 105 | 326 | ||||||||
Net Flows |
(213) | 6,824 | (140) | 6,471 | ||||||||
Market Appreciation |
4,870 |
3,894 |
1,232 |
9,996 |
||||||||
Ending Assets |
$ | 34,562 | 21,537 | 8,769 | 64,868 | |||||||
- (1)
- Includes all activity of the Funds and institutional and separate accounts, including money market funds and transactions at net asset value, accounts for which we receive no commissions.
28
Average assets under management, which are generally more indicative of trends in revenue for providing investment management services than the year over year change in ending assets under management, decreased by 9% as compared to 2008. However, average assets under management for the fourth quarter of 2009 were $67.0 billion, a 38% increase from the fourth quarter average of $48.4 billion in 2008. Our quarterly average assets under management have increased each quarter since a low mark in the first quarter of 2009.
Average Assets Under Management
| |
2009 | 2008 | 2007 | |||||||||||||||||
|---|---|---|---|---|---|---|---|---|---|---|---|---|---|---|---|---|---|---|---|---|
| |
Average | Percentage of Total |
Average | Percentage of Total |
Average | Percentage of Total |
||||||||||||||
| |
(in millions, except percentage data) |
|||||||||||||||||||
Distribution Channel: |
||||||||||||||||||||
Advisors Channel |
||||||||||||||||||||
Equity |
$ | 18,916 | 74% | 24,201 | 80% | 27,048 | 84% | |||||||||||||
Fixed income |
5,211 | 20% | 4,490 | 15% | 4,154 | 13% | ||||||||||||||
Money market |
1,600 | 6% | 1,428 | 5% | 1,046 | 3% | ||||||||||||||
Total |
$ | 25,727 | 100% | 30,119 | 100% | 32,248 | 100% | |||||||||||||
Wholesale Channel |
||||||||||||||||||||
Equity |
$ | 22,556 | 94% | 23,268 | 98% | 14,395 | 97% | |||||||||||||
Fixed income |
1,147 | 5% | 413 | 2% | 380 | 3% | ||||||||||||||
Money market |
301 | 1% | 152 | 0% | 64 | 0% | ||||||||||||||
Total |
$ | 24,004 | 100% | 23,833 | 100% | 14,839 | 100% | |||||||||||||
Institutional Channel |
||||||||||||||||||||
Equity |
$ | 6,208 | 90% | 7,445 | 93% | 7,199 | 92% | |||||||||||||
Fixed income |
658 | 10% | 584 | 7% | 614 | 8% | ||||||||||||||
Money market |
- | - | - | - | - | - | ||||||||||||||
Total |
$ | 6,866 | 100% | 8,029 | 100% | 7,813 | 100% | |||||||||||||
Total by Asset Class: |
||||||||||||||||||||
Equity |
$ | 47,680 | 85% | 54,914 | 89% | 48,642 | 89% | |||||||||||||
Fixed income |
7,016 | 12% | 5,487 | 9% | 5,148 | 9% | ||||||||||||||
Money market |
1,901 | 3% | 1,580 | 2% | 1110 | 2% | ||||||||||||||
Total |
$ | 56,597 | 100% | 61,981 | 100% | 54,900 | 100% | |||||||||||||
29
The following table summarizes our five largest mutual funds as of December 31, 2009 by ending assets under management and investment management fees for the last three years. The assets under management and management fees of our five largest mutual funds are presented as a percentage of our total assets under management and total management fees.
Five Largest Mutual Funds by Ending Assets Under Management and Investment Management Fees
| |
2009 | 2008 | 2007 | |||||||||||||||||
|---|---|---|---|---|---|---|---|---|---|---|---|---|---|---|---|---|---|---|---|---|
| |
Ending | Percentage of Total |
Ending | Percentage of Total |
Ending | Percentage of Total |
||||||||||||||
| |
(in millions, except percentage data) |
|||||||||||||||||||
By Assets Under Management: |
||||||||||||||||||||
Ivy Asset Strategy |
$ | 20,029 | 29% | $ | 10,430 | 22% | 8,419 | 14% | ||||||||||||
Ivy Global Natural Resources |
5,736 | 8% | 2,618 | 5% | 8,464 | 15% | ||||||||||||||
Advisors Asset Strategy |
3,235 | 5% | 2,411 | 5% | 3,118 | 5% | ||||||||||||||
Advisors Core Investment |
2,657 | 4% | 2,377 | 5% | 4,240 | 7% | ||||||||||||||
Advisors Science & Technology |
2,289 | 3% | 1,670 | 4% | 2,851 | 5% | ||||||||||||||
Total |
$ | 33,946 | 49% | $ | 19,506 | 41% | 27,092 | 46% | ||||||||||||
|
(in thousands, except percentage data) |
|||||||||||||||||||
By Management Fees: |
||||||||||||||||||||
Ivy Asset Strategy |
$ | 82,313 | 23% | $ | 71,957 | 18% | 24,802 | 7% | ||||||||||||
Ivy Global Natural Resources (1) |
34,353 | 10% | 56,247 | 14% | 50,944 | 14% | ||||||||||||||
Advisors Asset Strategy |
18,139 | 5% | 19,966 | 5% | 15,696 | 4% | ||||||||||||||
Advisors Science & Technology |
15,953 | 4% | 19,202 | 5% | 22,310 | 6% | ||||||||||||||
Advisors Core Investment |
15,118 | 4% | 21,053 | 5% | 25,861 | 7% | ||||||||||||||
Total |
$ | 165,876 | 46% | $ | 188,425 | 47% | 139,613 | 38% | ||||||||||||
- (1)
- For the years ended December 31, 2009, 2008 and 2007, we paid subadvisory fees of $17.3 million, $28.8 million and $25.6 million, respectively.
30
Results of Operations
Net Income
| |
For the Year Ended December 31, |
Variance | ||||||||||||||
|---|---|---|---|---|---|---|---|---|---|---|---|---|---|---|---|---|
| |
2009 | 2008 | 2007 | 2009 vs. 2008 |
2008 vs. 2007 |
|||||||||||
| |
(in thousands, except percentage data) |
|||||||||||||||
Net Income |
$ | 105,505 | 96,163 | 125,497 | 10% | -23% | ||||||||||
Earnings per share: |
||||||||||||||||
Basic |
$ | 1.23 | 1.12 | 1.49 | 10% | -25% | ||||||||||
Diluted |
$ | 1.23 | 1.12 | 1.48 | 10% | -24% | ||||||||||
Operating Margin |
20% | 18% | 23% | 2% | -5% | |||||||||||
We reported net income of $105.5 million, or $1.23 per diluted share, in 2009 compared to $96.2 million, or $1.12 per diluted share, in 2008 and $125.5 million, or $1.48 per diluted share, in 2007.
Operating results for 2009 include a first quarter charge of $3.7 million recorded in investment and other income in the consolidated statement of income to reflect the "other than temporary" decline in value of certain of the Company's investments in affiliated mutual funds as the fair value of these investments had been below cost for an extended period. Charges for severance and other transaction costs of $1.1 million were recorded in 2009 in connection with the divestiture of our investment in ACF and are included in general and administrative expenses in the consolidated statement of income. Tax benefits of $1.6 million related to carrying back a portion of the capital loss to fully offset capital gains generated during the applicable three-year carryback period based on the divestiture of ACF were also recorded in 2009's operating results. Operating results for 2008 include a restructuring charge of $16.5 million, a goodwill impairment charge of $7.2 million related to ACF based on declines in ACF's assets under management and the related adverse impact on its earnings potential, and $6.5 million in additional amortization to reduce our deferred sales commission asset. Each of these items is described in detail below.
During the fourth quarter of 2008 we offered a voluntary separation program to our employees that included enhanced severance benefits. A total of 169 employees accepted the program, which for most was effective by December 31, 2008. Related to this program, we recorded a restructuring charge of $16.5 million, included in general and administrative expenses in the consolidated statement of income. The restructuring charge includes $700 thousand for termination of various projects under development.
Due to significant asset redemption activity and our review of the recoverability of our deferred sales commission assets in the fourth quarter of 2008, we recorded $6.5 million in additional amortization ($700 thousand related to Class B shares and $5.8 million related to Class C shares).
Based on a review of goodwill and intangibles in the fourth quarter of 2008, we recorded a goodwill impairment charge of $7.2 million related to ACF based on declines in ACF's assets under management and the related adverse impact on its earnings potential.
Total Revenues
Total revenues decreased 9% in 2009 compared to 2008, attributable to a decline in average assets under management of 9% and a decrease in gross sales of 9%, while revenues increased 10% in 2008
31
compared to 2007, based on growth in average assets under management of 13% and an increase in gross sales of 45%.
| |
For the Year Ended December 31, |
Variance | ||||||||||||||
|---|---|---|---|---|---|---|---|---|---|---|---|---|---|---|---|---|
| |
2009 | 2008 | 2007 | 2009 vs. 2008 |
2008 vs. 2007 |
|||||||||||
| |
(in thousands, except percentage data) |
|||||||||||||||
Investment management fees |
$ | 354,593 | 399,863 | 372,345 | -11% | 7% | ||||||||||
Underwriting and distribution fees |
378,678 | 416,762 | 371,085 | -9% | 12% | |||||||||||
Shareholder service fees |
105,818 | 102,495 | 94,124 | 3% | 9% | |||||||||||
Total revenues |
$ | 839,089 | 919,120 | 837,554 | -9% | 10% | ||||||||||
Investment Management Fee Revenues
Investment management fee revenues are earned for providing investment advisory services to the Funds and to institutional and separate accounts. Investment management fee revenues decreased $45.3 million, or 11%, in 2009 and increased $27.5 million, or 7%, in 2008.
Revenues from investment management services provided to our retail mutual funds, which are distributed through the Advisors, Wholesale and Institutional channels, were $326.3 million in 2009 and decreased $38.4 million, or 11%, compared to 2008, while the related retail average assets decreased 8%. Revenues from investment management services provided to our retail mutual funds were $364.7 million in 2008 and increased $31.9 million, or 10%, compared to 2007, while the related retail average assets increased 15%. Investment management fee revenues increased less than the related retail average assets due to significant sales growth in our Asset Strategy funds, which have lower than average management fee rates. Retail sales in 2009 were $17.9 billion and decreased 7% compared to $19.3 billion in 2008. Retail sales in 2008 increased 48% compared to sales in 2007, with the majority of the growth in retail sales occurring in our Wholesale channel.
Prior to the sale of ACF effective July 15, 2009, ACF had assets under management of $488.0 million, which along with related investment management fee revenues, were previously included in the Institutional channel.
Institutional and separate account revenues were $28.3 million, $35.2 million and $39.5 million in 2009, 2008 and 2007, respectively. While the decrease in account revenues in 2009 was partially due to the sale of ACF, we experienced a further decline in average assets of 12%, and a management fee rate decrease on certain institutional accounts. The decrease in account revenues in 2008 was primarily attributable to a management fee rate decrease on certain institutional accounts.
Long-term redemption rates (which exclude money market fund redemptions) in the Advisors channel improved to 8.4% in 2009 compared to 8.9% and 9.1% in 2008 and 2007, respectively. In the Wholesale channel, long-term redemption rates were 24.0% in 2009, a decrease from 35.5% in 2008 and an increase compared to 18.5% in 2007. The Wholesale channel's elevated rate in 2008 is a direct consequence of the volatility in the financial markets that occurred during the second half of the year. We expect the Advisors channel long-term redemption rate to remain lower than that of the Wholesale channel due to the personal and customized nature in which our financial advisors provide service to our clients.
The long-term redemption rate for our Institutional channel was 28.3% in 2009 compared to 19.4% in 2008 and 27.2% in 2007. Subadvisory and defined contribution pension business comprise 60% of the Institutional channel's assets as of December 31, 2009 and unlike defined benefit pension accounts, the
32
active daily flows in or out of these accounts has resulted in an increase in contributions and withdrawals and has impacted the channel's redemption rate increase.
Underwriting and Distribution Fee Revenues and Expenses
The following tables illustrate our underwriting and distribution fee revenues and expenses segregated by distribution channel for the years ended December 31, 2009, 2008 and 2007:
| |
Total | |
|
|||||||||||||
|---|---|---|---|---|---|---|---|---|---|---|---|---|---|---|---|---|
| |
2009 | 2008 | 2007 | 2009 vs. 2008 |
2008 vs. 2007 |
|||||||||||
| |
(in thousands, except percentage data) |
|||||||||||||||
Revenue |
$ | 378,678 | 416,762 | 371,085 | -9% | 12% | ||||||||||
Expenses: |
||||||||||||||||
Direct |
325,836 | 361,005 | 300,929 | -10% | 20% | |||||||||||
Indirect |
124,089 | 135,817 | 121,345 | -9% | 12% | |||||||||||
Total Expenses |
449,925 | 496,822 | 422,274 | -9% | 18% | |||||||||||
Net Underwriting & Distribution |
$ | (71,247) | (80,060) | (51,189) | 11% | -56% | ||||||||||
| |
Advisors Channel | |
|
|||||||||||||
|---|---|---|---|---|---|---|---|---|---|---|---|---|---|---|---|---|
| |
2009 | 2008 | 2007 | 2009 vs. 2008 |
2008 vs. 2007 |
|||||||||||
Revenue |
$ | 213,258 | 235,343 | 238,210 | -9% | -1% | ||||||||||
Expenses: |
||||||||||||||||
Direct |
147,469 | 163,183 | 163,513 | -10% | 0% | |||||||||||
Indirect |
83,917 | 92,384 | 84,777 | -9% | 9% | |||||||||||
Total Expenses |
231,386 | 255,567 | 248,290 | -9% | 3% | |||||||||||
Net Underwriting & Distribution |
$ | (18,128) | (20,224) | (10,080) | 10% | -101% | ||||||||||
| |
Wholesale Channel | |
|
|||||||||||||
|---|---|---|---|---|---|---|---|---|---|---|---|---|---|---|---|---|
| |
2009 | 2008 | 2007 | 2009 vs. 2008 |
2008 vs. 2007 |
|||||||||||
Revenue |
$ | 165,420 | 181,419 | 132,875 | -9% | 37% | ||||||||||
Expenses: |
||||||||||||||||
Direct |
178,367 | 197,822 | 137,416 | -10% | 44% | |||||||||||
Indirect |
40,172 | 43,433 | 36,568 | -8% | 19% | |||||||||||
Total Expenses |
218,539 | 241,255 | 173,984 | -9% | 39% | |||||||||||
Net Underwriting & Distribution |
$ | (53,119) | (59,836) | (41,109) | 11% | -46% | ||||||||||
The Advisors channel is the largest source of underwriting and distribution revenue, given that a significant amount of Wholesale mutual fund sales are load-waived, with the exception of investment product sales by Legend advisors. A portion of underwriting and distribution fee revenues are derived from sales commissions charged on front-end load products sold by our financial advisors, including mutual fund Class A shares (those sponsored by the Company and those underwritten by other non-proprietary mutual fund companies), variable annuities and financial planning fees. The remainder of underwriting and distribution revenues are received from Rule 12b-1 asset-based distribution and service fees earned on both load and load-waived and deferred-load products sold by our financial advisors and
33
third party intermediaries, asset-based fees earned on our asset allocation products, and commissions earned on the sale of other insurance products.
We divide the costs of underwriting and distribution into two components—direct costs and indirect costs. Direct selling costs fluctuate with sales volume, such as advisor commissions and commission overrides paid to field management, advisor incentive compensation, commissions paid to third parties and to our own wholesalers, and related overrides in our Wholesale channel. To a lesser extent, direct selling costs fluctuate with assets under management, such as Rule 12b-1 service and distribution fees paid to the same parties. Indirect selling costs are fixed costs that do not necessarily fluctuate with sales levels. Indirect costs include expenses incurred by our home office and field offices such as wholesaler salaries, marketing costs, promotion and distribution of our products through the Advisors and Wholesale channels; support and management of our financial advisors such as field office overhead, sales programs and technology infrastructure; and costs of managing and supporting our wholesale efforts through technology infrastructure and personnel. While the Institutional channel does have marketing expenses, those expenses are accounted for in our compensation and related costs and general and administrative expense lines instead of underwriting and distribution because of the channel's integration with our investment management division, its relatively small size and the fact that there are no Rule 12b-1 fees, loads, CDSCs, or any other charges to separate account clients except investment management fees.
We recover certain of our underwriting and distribution costs through Rule 12b-1 service and distribution fees, which are paid by the Funds. All Rule 12b-1 service and distribution fee revenue received from the Funds is recorded on a gross basis.
Underwriting and distribution revenues earned in 2009 decreased by $38.1 million, or 9%, compared to 2008. A majority of the decrease in revenues was due to lower Rule 12b-1 asset-based service and distribution fees of $23.8 million as a result of a decrease in average mutual fund assets under management. Revenues from front-load product sales sold in the Advisors channel decreased by $12.7 million, which included a decrease in Class A share revenues of $9.5 million and a decrease in variable annuity revenues of $3.6 million year over year. Revenues from front-load product sales sold in the Wholesale channel decreased $2.3 million. In the Wholesale channel, CDSC revenues decreased by $3.3 million due to higher mutual fund redemptions in 2008, concentrated in the second half of the year. Lower advisory fees and point of sale commissions earned by Legend decreased revenue by $3.3 million compared to the prior year. Offsetting these decreases, revenues from fee-based allocation products increased $7.0 million and insurance-related revenues increased $1.0 million.
Underwriting and distribution revenues increased by $45.7 million, or 12%, in 2008 compared to 2007. A majority of the increase in revenues was due to higher Rule 12b-1 asset-based service and distribution fees of $36.7 million as a result of an increase in average mutual fund assets under management. Additionally, revenues from fee-based asset allocation products increased $11.5 million. CDSC revenues increased in the Wholesale channel by $4.9 million due to higher redemptions in 2008, concentrated in the second half of the year. Revenue on front-load product sales sold in the Wholesale channel increased by $3.0 million but decreased in the Advisors channel by $4.5 million. Financial planning revenues decreased by $1.6 million. Lower advisory fees, Rule 12b-1 service fee revenues and point of sale commissions earned by Legend decreased revenue by $6.9 million compared to 2007 as their assets under administration decreased from $5.1 billion at the beginning of 2008 to $3.5 billion at the end of the year.
Underwriting and distribution expenses in 2009 decreased by $46.9 million, or 9%, compared with the prior year. A significant part of this decrease was attributed to lower direct expenses in the Wholesale channel of $19.5 million. Specifically, we incurred lower amortization expense of deferred sales commissions, lower dealer compensation paid to third party distributors and lower wholesaler commissions, offset partially by higher Rule 12b-1 asset-based service and distribution expenses. During 2008, based on significant asset redemption activity in the latter part of the year and our review of the recoverability of our deferred sales commission assets, we recorded $6.5 million in additional amortization
34
in the Wholesale channel ($700 thousand related to Class B shares and $5.8 million related to Class C shares). Direct expenses in the Advisors channel decreased $15.7 million, or 10%, compared to 2008 due to lower Rule 12b-1 asset-based service and distribution commissions of $11.9 million, lower point of sale commissions on front-load product sales of $10.7 million and lower fee-based asset allocation expenses of $1.1 million, offset partially by higher amortization expense of deferred sales commissions of $6.8 million and higher insurance-related expenses of $600 thousand. The decrease in indirect expenses in the Advisors channel of $8.5 million was due to decreased employee compensation and benefits expenses, lower convention costs and lower business meetings and travel expenses, partially offset by higher field office expenses, information technology costs and group health insurance costs. The indirect expenses decrease of $3.3 million in the Wholesale channel was due to lower business meeting expenses and marketing and promotion costs.
Underwriting and distribution expenses increased by $74.5 million, or 18%, in 2008, when compared with 2007. A majority of this increase was attributed to higher direct expenses in the Wholesale channel of $60.4 million as a result of higher sales volume and an increase in average wholesale assets under management. Specifically, we incurred higher Rule 12b-1 asset-based service and distribution expenses, increased dealer compensation paid to third party distributors, higher wholesaler commissions and higher amortization expense of deferred sales commissions. As previously mentioned, 2008 includes $6.5 million in additional amortization expense of deferred sales commission assets. This additional expense was partially offset by higher CDSC revenue of $2.0 million received in the fourth quarter due to higher redemptions. Direct expenses in the Advisors channel remained largely unchanged due to higher amortization expense of deferred sales commissions of $1.8 million and higher Rule 12b-1 asset-based service and distribution commissions of $1.4 million, offset by lower point of sale commissions on front-load product sales of $2.6 million and a $1.2 million decrease in financial planning fee expenses. The increase in indirect expenses in the Advisors channel of $7.6 million was due to increased convention, employee compensation and benefits, information technology and field office expenses. The indirect expenses increase of $6.9 million in the Wholesale channel was driven by higher costs associated with developing our non-proprietary distribution outlets. These costs include a $4.2 million increase for higher marketing costs for promotion and distribution of our products through the Wholesale channel based on higher sales volume and a $2.7 million increase in compensation expenses, partially due to adding more wholesalers during 2008.
Shareholder Service Fee Revenues
Shareholder service fee revenues primarily include transfer agency fees, custodian fees from retirement plan accounts, and portfolio accounting and administration fees. Portfolio accounting and administration fees are asset-based revenues while all other shareholder service fee revenues are based on number of accounts. During 2009, shareholder service fee revenues increased $3.3 million, or 3%, over 2008, primarily due to a higher asset base year over year in certain share classes.
During 2008, shareholder service fee revenue increased by $8.4 million, or 9%, compared to 2007. Of this increase, $2.8 million is due to a higher asset base compared to 2007 and $5.6 million is attributable to account-based revenues, due to a 16% increase in the average number of accounts. The average number of shareholder accounts grew to 3.56 million in 2008 compared to 3.06 million in 2007. Revenues did not correlate with the increase in average number of accounts due to a lower fee structure for servicing certain wholesale accounts. A portion of the fee reduction for wholesale accounts was offset by negotiating a networking fee reimbursement with the Funds for amounts paid to third party broker/dealers.
35
Total Operating Expenses
Operating expenses decreased $84.5 million, or 11%, in 2009 compared to 2008 primarily due to decreased underwriting and distribution expenses and subadvisory fees, as well as a $16.5 million restructuring charge recorded in general and administrative and a goodwill impairment charge, both recorded in 2008. Underwriting and distribution expenses are discussed above.
Operating expenses increased $110.9 million, or 17%, in 2008 compared to 2007 primarily due to increased underwriting and distribution expense, a 2008 restructuring charge recorded in general and administrative and a goodwill impairment charge recorded in 2008.
| |
For the Year Ended December 31, |
Variance | ||||||||||||||
|---|---|---|---|---|---|---|---|---|---|---|---|---|---|---|---|---|
| |
2009 | 2008 | 2007 | 2009 vs. 2008 |
2008 vs. 2007 |
|||||||||||
| |
(in thousands, except percentage data) |
|||||||||||||||
Underwriting and distribution |
$ | 449,925 | 496,822 | 422,274 | -9% | 18% | ||||||||||
Compensation and related costs |
124,463 | 119,057 | 115,905 | 5% | 3% | |||||||||||
General and administrative |
58,034 | 76,370 | 48,487 | -24% | 58% | |||||||||||
Subadvisory fees |
23,202 | 41,122 | 43,844 | -44% | -6% | |||||||||||
Depreciation |
13,653 | 13,198 | 12,412 | 3% | 6% | |||||||||||
Goodwill impairment |
- | 7,222 | - | NM | NM | |||||||||||
Total operating expenses |
$ | 669,277 | 753,791 | 642,922 | -11% | 17% | ||||||||||
Compensation and Related Costs
Compensation and related costs in 2009 increased $5.4 million, or 5%, compared to 2008. An incentive compensation expense increase of $8.8 million was the primary driver, as well as increased pension plan costs of $2.2 million based on unfavorable investment returns on our pension assets experienced during 2008. We also had decreased capitalized software development activities of $2.0 million and increased group insurance costs of $300 thousand based on unfavorable claims experience. These expense increases were offset by decreased base salaries and payroll taxes of $8.1 million, primarily due to the voluntary separation program effective as of December 31, 2008 and the fact that there were no salary increases in 2009. Savings plan costs also declined $1.3 million. Share-based compensation increased $1.6 million compared to 2008 primarily due to higher amortization expense associated with our April 2008, December 2008 and April 2009 grants of nonvested stock compared to grants that became fully vested in 2009 and, to a lesser extent, due to higher non-employee advisor (independent contractor) stock award amortization expense in 2009. Non-employee stock awards are adjusted to market each period based on the fluctuation in our share price. These share-based compensation increases were partially offset by lower amortization expense in 2009 for shares vested under the voluntary separation program in 2008.
Compensation and related costs in 2008 increased $3.2 million, or 3%, compared to 2007. Base salaries and payroll taxes contributed $6.3 million to the increase, primarily due to an increase in average headcount of 8.3% and annual merit increases during 2008. Share-based compensation accounted for $5.3 million of the increase primarily due to higher amortization expense associated with our April 2007, December 2007 and April 2008 grants of nonvested stock compared to grants that became fully vested in 2008. Group insurance costs increased $1.9 million compared to 2007 based on unfavorable claims experience. These expense increases were offset by decreased incentive compensation expense of $7.5 million and increased capitalized software development activities of $2.3 million, primarily due to technology initiatives associated with expansion of our brokerage capabilities and lower pension and savings plan costs of $1.2 million based on favorable investment returns on our pension assets experienced during 2007.
36
General and Administrative Expenses
General and administrative expenses are operating costs other than those related to compensation and to distribution efforts, including, but not limited to, computer services and software costs, telecommunications, facilities costs of our home offices, costs of professional services including legal and accounting, and insurance.
General and administrative expenses decreased $18.3 million for the year ended December 31, 2009 compared to the prior year. Fiscal year 2008 included a $16.5 million restructuring charge related to the voluntary separation of 169 employees and the termination of various projects under development. The $16.5 million charge was comprised of $15.0 million in employee compensation and other benefit costs, $795 thousand for accelerated vesting of nonvested stock and $717 thousand in project development costs, including $500 thousand for the early termination of a contract. We also recorded a $1.6 million charge for the settlement of miscellaneous litigation in 2008. Excluding these charges, general and administrative expenses decreased $200 thousand compared to 2008. These lower costs are due to a focus on cost control in the areas of business meetings and travel and personnel recruiting, offset partially by increased expenses for third party subaccounting and networking fees and fund expenses.
General and administrative expenses increased $27.9 million in 2008 compared to 2007. Fiscal year 2008 included a total of $18.1 million of restructuring and litigation-related charges as noted above. Excluding these charges, general and administrative expenses increased $9.8 million compared to 2007. Higher costs for third party subaccounting, networking fees and computer services were primarily responsible for the increase.
Goodwill Impairment
Due to the decline in the financial markets during the second half of 2008, we performed a review of goodwill and intangibles in the fourth quarter. We recorded an impairment charge of $7.2 million to write off the remaining balance of ACF's goodwill based on declines in ACF's assets under management and the related adverse impact on its earnings potential. ACF was sold during the third quarter of 2009.
Subadvisory Fees
Subadvisory fees represent fees paid to other asset managers for providing advisory services for certain mutual fund portfolios. These expenses reduce our operating margin since we pay out approximately half of our management fee revenue received from subadvised products. Gross management fee revenues for products subadvised by others were $46.0 million for the year ended December 31, 2009 compared to $81.0 million and $85.4 million for 2008 and 2007, respectively, due to declines in average assets of 45% and 2%, respectively. Subadvisory expenses followed the same declining pattern for the past three years. We began direct management of three previously subadvised funds during 2009, which contributed to the decline in both subadvisory revenues and expenses in 2009.
Subadvised assets under management at December 31, 2009 were $7.0 billion compared to the annual average of $5.6 billion for 2009. Since subadvisory expenses are a function of sales, redemptions and market action for subadvised assets, the higher asset base will likely result in an increase to both gross management fee revenues and subadvisory expenses for the coming year.
Other Income and Expenses
Investment and Other Income
Investment and other income increased $1.9 million in 2009 compared to the prior year. Included in the current year is a non-cash charge of $3.7 million to reflect the "other than temporary" impairment of certain of the Company's investments in affiliated mutual funds as the fair value of those investments was below cost for an extended period. Excluding the impairment in 2009, investment and other income increased $5.6 million compared to 2008. Mark-to-market adjustments to our trading portfolio accounted
37
for an increase of $10.1 million year over year. Gains on mutual fund holdings in our trading portfolio were $4.6 million compared to losses of $5.5 million in 2008. Gains from the sale of available-for-sale mutual fund holdings in 2009 were $2.6 million and there were no gains from the sale of available-for-sale mutual fund holdings in 2008. These increases were partially offset by lower investment income of $5.3 million due to lower average balances and lower effective interest rates on cash and short-term investments in 2009, other write-downs of $1.0 million and lower dividend income on available-for-sale mutual fund holdings of $800 thousand.
Investment and other income for 2008 decreased by $13.3 million compared to 2007. Mark-to-market adjustments to our trading portfolio accounted for $6.4 million of the decline. Losses in our trading portfolio were $5.5 million compared to gains of $900 thousand in 2007. There were no gains from the sale of available-for-sale mutual fund holdings in 2008 compared to $3.6 million in gains recorded on sales in 2007. Lower effective interest rates on cash and short-term investments in 2008, partially offset by higher average balances, also resulted in a reduction to investment income of $3.3 million.
Interest Expense
Interest expense increased $600 thousand in 2009 compared to 2008 due to increased costs associated with our $125.0 million credit facility, which was renewed in October 2009.
Interest expense increased $200 thousand in 2008 compared to the prior year due to increased costs associated with our $175.0 million credit facility, which was renewed in October 2008.
Income Taxes
Our effective income tax rate was 34.9%, 38.5% and 37.0% in 2009, 2008 and 2007, respectively. The lower effective tax rate in 2009 was primarily a result of recognizing the tax benefits for the carryback of capital losses generated in connection with the sale of ACF and for the offset of capital gains recognized in income during 2009. The higher effective tax rate in 2008 was primarily the result of the ACF goodwill impairment charge, which was nondeductible for tax purposes. Our 2009 effective tax rate, removing the effect of the loss on the sale of ACF, would have been 36.8%. Our 2008 effective tax rate, removing the effect of the nondeductible goodwill impairment charge, would have been 36.9%. The effective income tax rate, exclusive of the 2009 ACF loss and 2008 nondeductible goodwill impairment, decreased slightly in 2009 over that of 2008 due to the Company generating larger state tax incentives in 2009 than those generated in 2008. The higher effective tax rate in 2008 as compared to 2007 was mainly a result of the non-deductible goodwill impairment charge offset slightly by an increase in the state tax incentives generated in 2008.
38
Liquidity and Capital Resources
The following table summarizes certain key financial data relating to our liquidity and capital resources:
| |
For the Year Ended December 31, |
Variance | |||||||||||||
|---|---|---|---|---|---|---|---|---|---|---|---|---|---|---|---|
| |
2009 | 2008 | 2007 | 2009 vs. 2008 |
2008 vs. 2007 |
||||||||||
| |
(in thousands, except percentage data) |
||||||||||||||
Balance Sheet Data: |
|||||||||||||||
Cash and cash equivalents |
$ | 244,359 | 210,328 | 263,914 | 16% | -20% | |||||||||
Cash and cash equivalents - restricted |
72,941 | 48,713 | 99,886 | 50% | -51% | ||||||||||
Investment Securities |
70,524 | 58,684 | 50,913 | 20% | 15% | ||||||||||
Long-term debt |
199,984 |
199,969 |
199,955 |
0% |
0% |
||||||||||
Cash Flow Data: |
|||||||||||||||
Operating cash flows |
155,179 | 123,911 | 128,018 | 25% | -3% | ||||||||||
Investing cash flows |
(29,488) | (23,963) | (5,053) | 23% | 374% | ||||||||||
Financing cash flows |
(91,660) | (153,534) | (22,938) | 40% | -569% | ||||||||||
Our operations provide much of the cash necessary to fund our priorities, as follows:
- •
- Finance internal growth
- •
- Pay dividends
- •
- Repurchase our stock
Finance Internal Growth
We use cash to fund growth in our distribution channels. Our Wholesale channel, which has a higher cost to gather assets, requires cash outlays for wholesaler commissions and commissions to third parties on deferred load product sales. We continue to invest in our Advisors channel by providing additional support to our advisors through training opportunities, wholesaling efforts and enhanced technology tools.
Pay Dividends
The Board of Directors approved an increase in the quarterly dividend on our common stock from $.17 per share to $.19 per share beginning with our first quarter 2008 dividend, paid on May 1, 2008. Dividends on our common stock resulted in financing cash outflows of $65.0 million, $63.7 million and $55.4 million in 2009, 2008 and 2007, respectively.
Repurchase Our Stock
In 2009, we repurchased 1.9 million of our shares, compared to 3.8 million shares and 2.6 million shares in 2008 and 2007, respectively, which included 327,301 shares, 430,145 shares and 234,162 shares from employees who elected to tender shares to cover their minimum tax withholdings with respect to vesting of stock awards during the years ended December 31, 2009, 2008 and 2007, respectively.
In the future, we plan to repurchase shares, at a minimum, to offset dilution from shares issued for employee share plans. Additionally, during 2010 we estimate that we will repurchase approximately 435,000 shares from employees who elect to tender shares to cover their minimum tax withholdings arising from the vesting of nonvested shares.
39
Operating Cash Flows
Cash from operations is our primary source of funds and increased $31.3 million in the current year. The increase is due to higher net income and lower non-cash amortization of deferred sales commissions in 2009 combined with net sales of trading securities in 2009 compared to net purchases of trading securities in 2008. From the end of 2008 to the end of 2009 there was a significant increase in Fund shareholder investments received prior to the balance sheet date that were in the process of being invested in the Funds. As a result, on our consolidated balance sheet there was an increase in both the payable to investment companies and an increase in the cash and receivable accounts. On the statement of cash flows, there were corresponding increases and decreases to cash from operations.
We pay our financial advisors and third parties upfront commissions on the sale of Class B shares, Class C shares and certain fee-based asset allocation products. Funding of such commissions during the years ended December 31, 2009, 2008 and 2007 totaled $54.7 million, $69.5 million and $49.6 million, respectively. The primary driver of commission funding in all three years was Class C shares, for which $29.8 million, $40.3 million and $26.9 million of commissions were funded in 2009, 2008 and 2007, respectively. Management expects future cash requirements for sales commissions may exceed the level experienced in previous years due to increased sales in our fee-based asset allocation products and sales growth in the sale of Class B and Class C shares.
We anticipate that our 2010 contribution to our Pension Plan will be made from cash generated from operations and will be in the range from $7.0 to $10.0 million, $5.0 million of which was contributed during January 2010.
Investing Cash Flows
Investing activities consist primarily of the purchase and sale of available-for-sale investment securities, as well as capital expenditures. We expect our 2010 capital expenditures to be in the range of $13.0 to $15.0 million.
Financing Cash Flows
As noted previously, dividends and stock repurchases accounted for a majority of our financing cash outflows in 2009. An increase in our stock price during 2007 resulted in substantial stock option exercises, and cash provided by stock option exercises was $84.6 million for that year.
The Company entered into a 364-day revolving credit facility (the "Credit Facility") with various lenders, effective October 5, 2009, which initially provides for borrowings of up to $125.0 million and replaced the Company's previous revolving credit facility. Lenders could, at their option upon the Company's request, expand the facility to $200.0 million. During 2009 and at December 31, 2009 there were no borrowings outstanding under the Credit Facility. Borrowings under the Credit Facility bear interest at various rates including adjusted LIBOR or an alternative base rate plus, in each case, an incremental margin based on the Company's credit rating. The Credit Facility also provides for a facility fee on the aggregate amount of commitment under the revolving facility (whether or not utilized). The facility fee is also based on the Company's credit rating level. The Credit Facility contains financial covenants with respect to leverage and interest coverage, both of which we were in compliance with throughout fiscal 2009.
Short Term Liquidity and Capital Requirements
Management believes its available cash, marketable securities and expected cash flow from operations will be sufficient to fund its short-term operating and capital requirements during 2010. Expected short-term uses of cash include expected dividend payments, interest payments on outstanding debt, income tax payments, share repurchases, payment of deferred commissions to our financial advisors and third parties, capital expenditures, pension funding and home office leasehold improvements, and could include strategic acquisitions.
40
Long Term Liquidity and Capital Requirements
Expected long-term capital requirements include indebtedness, operating leases and purchase obligations, and potential recognition of tax liabilities, summarized in the following table as of December 31, 2009. Purchase obligations include amounts that will be due for the purchase of goods and services to be used in our operations under long-term commitments or contracts. The majority of our purchase obligations are reimbursable to us by the Funds.
| |
Total | 2010 | 2011- 2012 |
2013- 2014 |
Thereafter/ Indeterminate |
|||||
|---|---|---|---|---|---|---|---|---|---|---|
| |
(in thousands) |
|||||||||
Long-term debt obligations, including interest |
$216,784 | 11,200 | 205,584 | - | - | |||||
Non-cancelable operating lease commitments |
72,834 | 18,440 | 28,983 | 14,018 | 11,393 | |||||
Purchase obligations |
102,969 | 37,201 | 60,345 | 3,262 | 2,161 | |||||
Unrecognized tax benefits |
6,848 | 2,166 | - | - | 4,682 | |||||
|
$399,435 | 69,007 | 294,912 | 17,280 | 18,236 | |||||
Other possible long-term discretionary uses of cash could include capital expenditures for enhancement of technology infrastructure and home office expansion, strategic acquisitions, payment of dividends, income tax payments, seed money for new products, payment of upfront fund commissions for Class B shares, Class C shares and certain fee-based asset allocation products, and repurchases of our common stock.
Off-Balance Sheet Arrangements
Other than operating leases, which are included in the table above, the Company does not have any off-balance sheet financing. The Company has not created, and is not party to, any special-purpose or off-balance sheet entities for the purpose of raising capital, incurring debt or operating its business.
Critical Accounting Policies and Estimates
Management believes the following critical accounting policies affect its more significant judgments and estimates used in the preparation of its consolidated financial statements.
Accounting for Goodwill and Intangible Assets
As of December 31, 2009, our total goodwill and intangible assets were $221.2 million, or 22%, of our total assets. Two significant considerations arise with respect to these assets that require management estimates and judgment: (i) the valuation in connection with the initial purchase price allocation, and (ii) the ongoing evaluation of impairment.
In connection with all of our acquisitions, an evaluation is completed to determine reasonable purchase price allocations. The purchase price allocation process requires management estimates and judgments as to expectations for the various products, distribution channels, and business strategies. For example, certain growth rates and operating margins were assumed for different products and distribution channels. If actual growth rates or operating margins, among other assumptions, differ from the estimates and judgments used in the purchase price allocation, the amounts recorded in the financial statements for identifiable intangible assets and goodwill could be subject to charges for impairment in the future.
We complete an ongoing review of the recoverability of goodwill and intangible assets using a fair-value based approach on an annual basis or more frequently whenever events occur or circumstances change that would more likely than not reduce the fair value of a reporting unit below its carrying amount. Intangible assets with indefinite lives, primarily acquired mutual fund advisory contracts, are also tested for impairment annually by comparing their fair value to the carrying amount of the asset. We consider mutual fund advisory contracts indefinite lived intangible assets as they are expected to be renewed without
41
significant cost or modification of terms. Factors that are considered important in determining whether an impairment of goodwill or intangible assets might exist include significant continued underperformance compared to peers, the likelihood of termination or non-renewal of a mutual fund advisory or subadvisory contract or substantial changes in revenues earned from such contracts, significant changes in our business and products, material and ongoing negative industry or economic trends, or other factors specific to each asset or subsidiary being evaluated. Because of the significance of goodwill and other intangibles to our consolidated balance sheets, the annual impairment analysis is critical. Any changes in key assumptions about our business and our prospects, or changes in market conditions or other externalities, could result in an impairment charge.
Accounting for Income Taxes
In the ordinary course of business, many transactions occur for which the ultimate tax outcome is uncertain. In addition, respective tax authorities periodically audit our income tax returns. These audits examine our significant tax filing positions, including the timing and amounts of deductions and the allocation of income among tax jurisdictions. We adjust our income tax provision in the period in which we determine the actual outcomes will likely be different from our estimates. The recognition or derecognition of income tax expense related to uncertain tax positions is determined under the guidance as prescribed by Accounting Standards Codification ("ASC") "Income Taxes Topic," ASC 740. During 2009, 2008, and 2007, the Company settled three open tax years, five open tax years, and six open tax years, respectively, that were undergoing audit by state jurisdictions in which the Company operates. These audits were settled in all material respects with no significant adjustments. The Company is currently undergoing audits in various other state jurisdictions that have not yet been settled.
We recognize an asset or liability for the deferred tax consequences of temporary differences between the tax basis of assets and liabilities and their reported amounts in the financial statements, including the determination of any valuation allowance that might be required for deferred tax assets. These temporary differences will result in taxable or deductible amounts in future years when the reported amounts of assets are recovered or liabilities are settled. During 2009, the Company sold ACF, which generated a capital loss available to offset potential future and prior period capital gains. Due to the character of the loss and the limited carryforward period permitted by law, the Company may not realize the full tax benefit of the capital loss. The capital loss carryforward, if not utilized, will expire in 2014. Management believes it is not more likely than not that the Company will generate sufficient future capital gains to realize the full benefit of this capital loss. Accordingly, a valuation allowance has been recorded on a portion of this capital loss as of December 31, 2009. Also as of December 31, 2009, two of the Company's subsidiaries have state net operating loss carryforwards in certain states in which those companies file on a separate company basis. These entities have recognized a deferred tax asset for such carryforwards. The carryforwards, if not utilized, will expire between 2010 and 2029. Management believes it is not more likely than not that the subsidiaries will generate sufficient future taxable income in these states to realize the benefit of these state net operating loss carryforwards and, accordingly, a valuation allowance has been recorded at December 31, 2009, December 31, 2008 and December 31, 2007. We have not recorded a valuation allowance on any other deferred tax assets as of the current reporting period based on our belief that operating income will, more likely than not, be sufficient to realize the benefit of these assets over time. In the event that actual results differ from estimates or if our historical trend of positive operating income changes, we may be required to record a valuation allowance on deferred tax assets, which could have a significant effect on our consolidated financial condition and results of operations. Finally, income taxes are recorded at the rates in effect in the various tax jurisdictions in which we operate. Tax law and rate changes are reflected in the income tax provision in the period in which such changes are enacted.
Pension and Other Postretirement Benefits
Accounting for our pension and postretirement benefit plans requires us to estimate the cost of benefits to be provided well into the future and the current value of our benefit obligations. Three critical
42
assumptions affecting these estimates are the discount rate, the expected return on assets, and the expected health care cost trend rate. The discount rate assumption is based on the Mercer Bond Model, which calculates the yield on a theoretical portfolio of high-grade corporate bonds with cash flows that generally match our expected benefit payments. The expected return on plan assets and health care cost trend rates are based upon an evaluation of our historical trends and experience, taking into account current and expected future market conditions. Other assumptions include rates of future compensation increases, participant withdrawals and mortality rates, and participant retirement ages. These estimates and assumptions impact the amount of net pension expense or income recognized each year and the measurement of our reported benefit obligation under the plans.
In 2009, we decreased the discount rate for our pension and postretirement plans to 6.25% from the 6.75% used in 2008 and 2007 to reflect market interest rates. We continue to assume long-term asset returns of 7.75% on the assets in our pension plan, the same as our assumption in 2008 and 2007. Our pension plan assets at December 31, 2009 were 100% invested in the Asset Strategy style and we have targeted this same investment strategy going forward.
The effect of hypothetical changes to selected assumptions on the Company's retirement benefit plans would be as follows:
| |
|
December 31, 2009 |
December 31, 2010 |
||||||
|---|---|---|---|---|---|---|---|---|---|
| Assumptions | Change | Increase (Decrease) PBO/APBO (1) |
Increase (Decrease) Expense (2) |
||||||
| |
|
(in thousands) |
|||||||
Pension |
|||||||||
Discount rate |
+/-50 bps | $ | (5,499)/8,439 | $ | (649)/1161 | ||||
Expected return on assets |
+/-50 bps | N/A | (488)/488 | ||||||
OPEB |
|||||||||
Discount rate |
+/-50 bps | (289)/314 | (20)/21 | ||||||
Health care cost trend rate |
+/-100 bps | 612/(531) | 105/(89) | ||||||
- (1)
- Projected
benefit obligation ("PBO") for pension plans and accumulated postretirement benefit obligation ("APBO") for Postretirement Benefits Other Than
Pension Plans.
- (2)
- Pre-tax impact on expense.
Deferred Sales Commissions
We pay upfront sales commissions to our financial advisors and third party intermediary broker/dealers in connection with the sale of certain classes of mutual fund shares sold without a front-end sales charge. These costs are capitalized and amortized over the period during which the shareholder is subject to a CDSC, not to exceed five years. We recover these costs through Rule 12b-1 and other distribution plan fees, which are paid by the applicable share classes of the Advisors Funds, Ivy Funds and InvestEd portfolios, along with CDSCs paid by shareholders who redeem their shares prior to completion of the required holding periods. Should we lose our ability to recover such sales commissions through distribution plan payments and CDSCs, the value of these assets would immediately decline, as would future cash flows. We periodically review the recoverability of deferred sales commission assets as events or changes in circumstances indicate that the carrying amount of deferred sales commission assets may not be recoverable and adjust the deferred assets accordingly.
43
Valuation of Investments
We record substantially all investments in our financial statements at fair value. Where available, we use prices from independent sources such as listed market prices or broker/dealer price quotations. We evaluate our investments for other than temporary declines in value on a periodic basis. This may exist when the fair value of an investment security has been below the current value for an extended period of time. As most of our investments are carried at fair value, if an other than temporary decline in value is determined to exist, the unrealized investment loss recorded net of tax in accumulated other comprehensive income is realized as a charge to net income, in the period in which the other than temporary decline in value is determined. While we believe that we have accurately estimated the amount of the other than temporary decline in the value of our portfolio, different assumptions could result in changes to the recorded amounts in our financial statements.
Loss Contingencies
The likelihood that a loss contingency exists is evaluated using the criteria of "Contingencies Topic," ASC 450 through consultation with legal counsel. A loss contingency is recorded if the contingency is considered probable and reasonably estimable as of the date of the financial statements.
Accounting Pronouncements Not Yet Adopted
In January 2010, the FASB issued Accounting Standards Update No. 2010-06 to amend "Fair Value Measurements and Disclosures Topic," ASC 820. The guidance requires disclosure changes related to recurring or nonrecurring fair value measurements. Specifically, companies are required to disclose separately the amounts of significant transfers in and out of Level 1 and Level 2 fair value measurements, describe the reasons for the transfers and provide additional detail related to the reconciliation of Level 3 fair value measurements. Additionally, the guidance clarifies existing disclosure requirements. The guidance is effective for interim and annual reporting periods beginning after December 15, 2009, except for certain provisions related to the rollforward of activity in Level 3 fair value measurements, which are effective for fiscal years beginning after December 15, 2010 and for interim periods within those fiscal years. The Company will adopt the applicable disclosure requirements effective with our first quarter 2010 reporting period.
In June 2009, the FASB issued SFAS No. 167, "Amendments to FASB Interpretation No. 46(R)" ("SFAS No. 167"). SFAS No. 167 improves how enterprises account for and disclose their involvement with variable interest entities ("VIEs") and other entities whose equity at risk is insufficient or lacks certain characteristics. SFAS No. 167 changes how an entity determines whether it is the primary beneficiary of a VIE and whether that VIE should be consolidated and requires additional disclosures. In January 2010, the FASB agreed to issue accounting guidance to indefinitely defer this standard's consolidation requirements, which were initially effective for fiscal years beginning after November 15, 2009 and interim periods within those fiscal years, for reporting enterprises' interests in entities that either have all of the characteristics of investment companies or for which it is industry practice to apply measurement principles for financial reporting purposes consistent with those that apply to investment companies. The Company meets the criteria to defer this standard's consolidation requirements. According to the FASB, this deferral will continue until the FASB and the International Accounting Standards Board, in their joint consolidation project, resolve the issue of how to determine whether an asset manager functions as a principal or as an agent.
Seasonality and Inflation
We do not believe our operations are subject to significant seasonal fluctuation. We have historically experienced increased sales activity in the first and fourth quarters of the year due to funding of retirement accounts by our clients; however, the fourth quarter of 2008 did not reflect increased sales activity. The Company has not suffered material adverse effects from inflation in the past. However, a substantial increase in the inflation rate in the future may adversely affect customers' purchasing decisions, may
44
increase the costs of borrowing, or may have an impact on the Company's margins and overall cost structure.
ITEM 7A. Quantitative and Qualitative Disclosures About Market Risk
We use various financial instruments with certain inherent market risks, primarily related to interest rates and securities prices. The principal risks of loss arising from adverse changes in market rates and prices to which we are exposed relate to interest rates on debt and marketable securities. Generally, these instruments have not been entered into for trading purposes. Management actively monitors these risk exposures; however, fluctuations could impact our results of operations and financial position. As a matter of policy, we only execute derivative transactions to manage exposures arising in the normal course of business and not for speculative or trading purposes. The following information, together with information included in other parts of Management's Discussion and Analysis of Financial Condition and Results of Operations, which are incorporated herein by reference, describe the key aspects of certain financial instruments that have market risk to us.
Interest Rate Sensitivity
Our interest sensitive liabilities include our long-term fixed rate senior notes and obligations for any balances outstanding under our credit facility or other short-term borrowings. Increases in market interest rates would generally cause a decrease in the fair value of the senior notes and an increase in interest expense associated with short-term borrowings and borrowings under the credit facility. Decreases in market interest rates would generally cause an increase in the fair value of the senior notes and a decrease in interest expense associated with short-term borrowings and borrowings under the credit facility. We had no short-term borrowings outstanding as of December 31, 2009. On January 13, 2006, we issued $200.0 million in principal amount of 5.60% fixed rate senior notes due 2011. Proceeds from the senior notes were used to pay down our $200.0 million in 7.50% senior notes that matured on January 18, 2006.
Available for Sale Investments Sensitivity
We maintain an investment portfolio of various holdings, types and maturities. Our portfolio is diversified and consists primarily of investment grade debt securities and equity mutual funds. A portion of investments are classified as available-for-sale investments. At any time, a sharp increase in interest rates or a sharp decline in the United States stock market could have a significant negative impact on the fair value of our investment portfolio. If a decline in fair value is determined to be other than temporary by management, the cost basis of the individual security or mutual fund is written down to fair value. Conversely, declines in interest rates or a sizeable rise in the United States stock market could have a significant positive impact on our investment portfolio. However, unrealized gains are not recognized on available-for-sale securities until they are sold. We do not currently hedge these exposures.
Securities Price Sensitivity
Our revenues are dependent on the underlying assets under management in the Funds to which investment advisory services are provided. The Funds include portfolios of investments comprised of various combinations of equity, fixed income and other types of securities. Fluctuations in the value of these securities are common and are generated by numerous factors, including, without limitation, market volatility, the overall economy, inflation, changes in investor strategies, availability of alternative investment vehicles, government regulations and others. Accordingly, declines in any one or a combination of these factors, or other factors not separately identified, may reduce the value of investment securities and, in turn, the underlying assets under management on which our revenues are earned. These declines have an impact in our investment sales, thereby compounding the impact on our earnings.
45
ITEM 8. Financial Statements and Supplementary Data
Reference is made to the Consolidated Financial Statements referred to in the Index on page 50 setting forth our consolidated financial statements, together with the report of KPMG LLP dated February 25, 2010 on page 51.
ITEM 9. Changes in and Disagreements with Accountants on Accounting and Financial Disclosure
None.
ITEM 9A. Controls and Procedures
- (a)
- Evaluation of Disclosure Controls and Procedures. The Company maintains a system of disclosure
controls and procedures that is designed to provide reasonable assurance that information, which is required to be timely disclosed, is accumulated and communicated to management in a timely fashion.
A control system, no matter how well conceived and operated, can provide only reasonable, not absolute, assurance that the objectives of the control system are met. The Company's Chief Executive
Officer and Chief Financial Officer, after evaluating the effectiveness of the Company's disclosure controls and procedures (as defined in Rules 13a-15(e) and 15d-15(e)
of the Securities Exchange Act of 1934, as amended (the "Exchange Act")) as of the end of the period covered by this report, have concluded that the Company's disclosure controls and procedures are
effective to provide reasonable assurance that information required to be disclosed by the Company in the reports that it files or submits under the Exchange Act is accumulated and communicated to the
Company's management, including its principal executive officer and principal financial officer, as appropriate to allow timely decisions regarding required disclosure and are effective to provide
reasonable assurance that such information is recorded, processed, summarized and reported within the time periods specified in the SEC's rules and forms.
- (b)
- Management's Report on Internal Control Over Financial Reporting. Our management is responsible
for establishing and maintaining adequate internal control over financial reporting, as such term is defined in Exchange Act Rules 13a-15(f) and 15d-15(f). Under the
supervision and with the participation of our management, including our principal executive officer and our principal financial officer, we conducted an evaluation of the effectiveness of our internal
control over financial reporting based on the framework in "Internal Control-Integrated Framework" issued by the Committee of Sponsoring Organizations
of the Treadway Commission. All internal control systems, no matter how well designed, have inherent limitations. Therefore, even those systems determined to be effective can provide only reasonable,
not absolute, assurance with respect to financial statement preparation and presentation. Because of its inherent limitations, internal control over financial reporting may not prevent or detect
misstatements. Projections of any evaluation of effectiveness to future periods are subject to the risks that controls may become inadequate because of changes in conditions, or that the degree of
compliance with the policies or procedures may deteriorate.
Based on our evaluation under the framework in "Internal Control-Integrated Framework," management concluded that, as of December 31, 2009, our internal control over financial reporting was effective. KPMG LLP, the independent registered public accounting firm that audited the financial statements included in this Annual Report on Form 10-K, also audited the effectiveness of our internal control over financial reporting as of December 31, 2009, as stated in their attestation report which follows.
46
Report of Independent Registered Public Accounting Firm
The
Board of Directors and Shareholders
Waddell & Reed Financial, Inc.:
We have audited Waddell & Reed Financial, Inc.'s (the Company) internal control over financial reporting as of December 31, 2009, based on criteria established in Internal Control—Integrated Framework issued by the Committee of Sponsoring Organizations of the Treadway Commission (COSO). Waddell & Reed Financial Inc.'s management is responsible for maintaining effective internal control over financial reporting and for its assessment of the effectiveness of internal control over financial reporting, included in the accompanying Management's Report on Internal Control over Financial Reporting. Our responsibility is to express an opinion on the Company's internal control over financial reporting based on our audit.
We conducted our audit in accordance with the standards of the Public Company Accounting Oversight Board (United States). Those standards require that we plan and perform the audit to obtain reasonable assurance about whether effective internal control over financial reporting was maintained in all material respects. Our audit included obtaining an understanding of internal control over financial reporting, assessing the risk that a material weakness exists, and testing and evaluating the design and operating effectiveness of internal control based on the assessed risk. Our audit also included performing such other procedures as we considered necessary in the circumstances. We believe that our audit provides a reasonable basis for our opinion.
A company's internal control over financial reporting is a process designed to provide reasonable assurance regarding the reliability of financial reporting and the preparation of financial statements for external purposes in accordance with generally accepted accounting principles. A company's internal control over financial reporting includes those policies and procedures that (1) pertain to the maintenance of records that, in reasonable detail, accurately and fairly reflect the transactions and dispositions of the assets of the company; (2) provide reasonable assurance that transactions are recorded as necessary to permit preparation of financial statements in accordance with generally accepted accounting principles, and that receipts and expenditures of the company are being made only in accordance with authorizations of management and directors of the company; and (3) provide reasonable assurance regarding prevention or timely detection of unauthorized acquisition, use, or disposition of the company's assets that could have a material effect on the financial statements.
Because of its inherent limitations, internal control over financial reporting may not prevent or detect misstatements. Also, projections of any evaluation of effectiveness to future periods are subject to the risk that controls may become inadequate because of changes in conditions, or that the degree of compliance with the policies or procedures may deteriorate.
In our opinion, Waddell & Reed Financial, Inc. maintained, in all material respects, effective internal control over financial reporting as of December 31, 2009, based on criteria established in Internal Control—Integrated Framework issued by COSO.
We also have audited, in accordance with the standards of the Public Company Accounting Oversight Board (United States), the consolidated balance sheets of Waddell & Reed Financial, Inc. and subsidiaries as of December 31, 2009 and 2008, and the related consolidated statements of income, stockholders' equity, comprehensive income, and cash flows for each of the years in the three-year period ended December 31, 2009, and our report dated February 25, 2010 expressed an unqualified opinion on those consolidated financial statements.
/s/ KPMG LLP
Kansas
City, Missouri
February 25, 2010
47
- (c)
- Changes in Internal Control over Financial Reporting. The Company's internal control over financial reporting (as defined in Exchange Act Rules 13a-15(f) and 15d-15(f)) is designed to provide reasonable assurance regarding the reliability of financial reporting and the preparation of financial statements for external purposes in accordance with generally accepted accounting principles. There were no changes in the Company's internal control over financial reporting that occurred during the Company's most recent fiscal quarter that have materially affected, or are reasonably likely to materially affect, the Company's internal control over financial reporting.
None.
ITEM 10. Directors, Executive Officers and Corporate Governance
Information required by this Item 10. is incorporated herein by reference to our definitive proxy statement for our 2010 Annual Meeting of Stockholders to be filed pursuant to Regulation 14A under the Exchange Act.
ITEM 11. Executive Compensation
Information required by this Item 11. is incorporated herein by reference to our definitive proxy statement for our 2010 Annual Meeting of Stockholders to be filed pursuant to Regulation 14A under the Exchange Act.
ITEM 12. Security Ownership of Certain Beneficial Owners and Management and Related Stockholder Matters
Information required by this Item 12. is incorporated herein by reference to our definitive proxy statement for our 2010 Annual Meeting of Stockholders to be filed pursuant to Regulation 14A under the Exchange Act.
ITEM 13. Certain Relationships and Related Transactions, and Director Independence
Information required by this Item 13. is incorporated herein by reference to our definitive proxy statement for our 2010 Annual Meeting of Stockholders to be filed pursuant to Regulation 14A under the Exchange Act.
ITEM 14. Principal Accounting Fees and Services
Information required by this Item 14. is incorporated herein by reference to our definitive proxy statement for our 2010 Annual Meeting of Stockholders to be filed pursuant to Regulation 14A under the Exchange Act.
ITEM 15. Exhibits, Financial Statement Schedules
| |
|
|||
|---|---|---|---|---|
| (a)(1) | Financial Statements. | |||
| Reference is made to the Index to Consolidated Financial Statements on page 50 for a list of all financial statements filed as part of this Report. | ||||
(a)(2) |
Financial Statement Schedules. |
|||
| None. | ||||
(b) |
Exhibits. |
|||
| Reference is made to the Index to Exhibits beginning on page 86 for a list of all exhibits filed as part of this Report. | ||||
48
Pursuant to the requirements of Section 13 or 15(d) of the Securities Exchange Act of 1934, as amended, the Company has duly caused this Report to be signed on its behalf by the undersigned, thereunto duly authorized, in the City of Overland Park, State of Kansas, on February 26, 2010.
| WADDELL & REED FINANCIAL, INC. | ||||
By: |
/s/ HENRY J. HERRMANN Henry J. Herrmann Chairman of the Board and Chief Executive Officer |
|||
Pursuant to the requirements of the Securities Exchange Act of 1934, as amended, this Report has been signed below by the following persons on behalf of the Company and in the capacities and on the dates indicated.
Name
|
Title
|
Date
|
||
|---|---|---|---|---|
/s/ HENRY J. HERRMANN |
Chief Executive Officer, Chairman of the Board and Director (Principal Executive Officer) |
February 26, 2010 | ||
/s/ DANIEL P. CONNEALY |
Senior Vice President and Chief Financial Officer |
February 26, 2010 |
||
/s/ BRENT K. BLOSS |
Senior Vice President – Finance and Treasurer |
February 26, 2010 |
||
/s/ ALAN W. KOSLOFF |
Director |
February 26, 2010 |
||
/s/ DENNIS E. LOGUE |
Director |
February 26, 2010 |
||
/s/ JAMES M. RAINES |
Director |
February 26, 2010 |
||
/s/ RONALD C. REIMER |
Director |
February 26, 2010 |
||
/s/ WILLIAM L. ROGERS |
Director |
February 26, 2010 |
||
/s/ JERRY W. WALTON |
Director |
February 26, 2010 |
49
WADDELL & REED FINANCIAL, INC.
Index to Consolidated Financial Statements
| |
Page | |
|---|---|---|
Report of Independent Registered Public Accounting Firm |
51 | |
Consolidated Balance Sheets at December 31, 2009 and 2008 |
52 | |
Consolidated Statements of Income for each of the years in the three-year period ended December 31, 2009 |
53 | |
Consolidated Statements of Stockholders' Equity for each of the years in the three-year period ended December 31, 2009 |
54 | |
Consolidated Statements of Comprehensive Income for each of the years in the three-year period ended December 31, 2009 |
55 | |
Consolidated Statements of Cash Flows for each of the years in the three-year period ended December 31, 2009 |
56 | |
Notes to Consolidated Financial Statements |
57 |
50
Report of Independent Registered Public Accounting Firm
The
Board of Directors and Shareholders
Waddell & Reed Financial, Inc.:
We have audited the accompanying consolidated balance sheets of Waddell & Reed Financial, Inc. and subsidiaries (the Company) as of December 31, 2009 and 2008, and the related consolidated statements of income, stockholders' equity, comprehensive income, and cash flows for each of the years in the three-year period ended December 31, 2009. These consolidated financial statements are the responsibility of the Company's management. Our responsibility is to express an opinion on these consolidated financial statements based on our audits.
We conducted our audits in accordance with the standards of the Public Company Accounting Oversight Board (United States). Those standards require that we plan and perform the audit to obtain reasonable assurance about whether the financial statements are free of material misstatement. An audit includes examining, on a test basis, evidence supporting the amounts and disclosures in the financial statements. An audit also includes assessing the accounting principles used and significant estimates made by management, as well as evaluating the overall financial statement presentation. We believe that our audits provide a reasonable basis for our opinion.
In our opinion, the consolidated financial statements referred to above present fairly, in all material respects, the financial position of Waddell & Reed Financial, Inc. and subsidiaries as of December 31, 2009 and 2008, and the results of their operations and their cash flows for each of the years in the three-year period ended December 31, 2009 in conformity with U.S. generally accepted accounting principles.
We also have audited, in accordance with the standards of the Public Company Accounting Oversight Board (United States), Waddell & Reed Financial, Inc.'s internal control over financial reporting as of December 31, 2009 based on criteria established in Internal Control—Integrated Framework issued by the Committee of Sponsoring Organizations of the Treadway Commission (COSO), and our report dated February 25, 2010 expressed an unqualified opinion on the effectiveness of the Company's internal control over financial reporting.
/s/ KPMG LLP
Kansas
City, Missouri
February 25, 2010
51
WADDELL & REED FINANCIAL, INC.
CONSOLIDATED BALANCE SHEETS
December 31, 2009 and 2008
| |
2009 | 2008 | ||||||
|---|---|---|---|---|---|---|---|---|
| |
(in thousands) |
|||||||
Assets: |
||||||||
Cash and cash equivalents |
$ | 244,359 | 210,328 | |||||
Cash and cash equivalents - restricted |
72,941 | 48,713 | ||||||
Investment securities |
70,524 | 58,684 | ||||||
Receivables: |
||||||||
Funds and separate accounts |
34,948 | 33,539 | ||||||
Customers and other |
179,100 | 61,280 | ||||||
Deferred income taxes |
8,225 | 11,182 | ||||||
Prepaid expenses and other current assets |
8,619 | 7,109 | ||||||
Total current assets |
618,716 | 430,835 | ||||||
Property and equipment, net |
68,171 | 59,966 | ||||||
Deferred sales commissions, net |
64,123 | 52,183 | ||||||
Goodwill and identifiable intangible assets |
221,210 | 221,210 | ||||||
Other non-current assets |
11,162 | 11,166 | ||||||
Total assets |
$ | 983,382 | 775,360 | |||||
Liabilities: |
||||||||
Accounts payable |
$ | 25,210 | 40,002 | |||||
Payable to investment companies for securities |
222,168 | 67,848 | ||||||
Accrued compensation |
35,341 | 24,296 | ||||||
Income taxes payable |
1,044 | 2,397 | ||||||
Other current liabilities |
76,994 | 70,165 | ||||||
Total current liabilities |
360,757 | 204,708 | ||||||
Long-term debt |
199,984 | 199,969 | ||||||
Accrued pension and postretirement costs |
28,731 | 29,083 | ||||||
Deferred income taxes |
6,983 | 3,564 | ||||||
Other non-current liabilities |
17,872 | 17,911 | ||||||
Total liabilities |
614,327 | 455,235 | ||||||
Commitments and Contingencies (Note 18) |
||||||||
Stockholders' equity: |
||||||||
Preferred stock—$1.00 par value: 5,000 shares authorized; none issued |
- | - | ||||||
Class A Common stock—$0.01 par value: 250,000 shares authorized; 99,701 shares issued; 85,807 shares outstanding (84,877 at December 31, 2008) |
997 | 997 | ||||||
Additional paid-in capital |
189,900 | 207,886 | ||||||
Retained earnings |
527,876 | 487,558 | ||||||
Cost of 13,894 common shares in treasury (14,824 at December 31, 2008) |
(328,154) | (350,463) | ||||||
Accumulated other comprehensive loss |
(21,564) | (25,853) | ||||||
Total stockholders' equity |
369,055 | 320,125 | ||||||
Total liabilities and stockholders' equity |
$ | 983,382 | 775,360 | |||||
See accompanying notes to consolidated financial statements.
52
WADDELL & REED FINANCIAL, INC.
CONSOLIDATED STATEMENTS OF INCOME
Years ended December 31, 2009, 2008 and 2007
| |
|
2009 | 2008 | 2007 | |||||||||
|---|---|---|---|---|---|---|---|---|---|---|---|---|---|
| |
|
(in thousands, except per share data) |
|||||||||||
Revenues: |
|||||||||||||
Investment management fees |
$ | 354,593 | 399,863 | 372,345 | |||||||||
Underwriting and distribution fees |
378,678 | 416,762 | 371,085 | ||||||||||
Shareholder service fees |
105,818 | 102,495 | 94,124 | ||||||||||
Total |
839,089 | 919,120 | 837,554 | ||||||||||
|
|||||||||||||
Underwriting and distribution |
449,925 | 496,822 | 422,274 | ||||||||||
Compensation and related costs (including share-based compensation of $30,573, $28,967 and $23,704, respectively) |
124,463 | 119,057 | 115,905 | ||||||||||
General and administrative |
58,034 | 76,370 | 48,487 | ||||||||||
Subadvisory fees |
23,202 | 41,122 | 43,844 | ||||||||||
Depreciation |
13,653 | 13,198 | 12,412 | ||||||||||
Goodwill impairment |
- | 7,222 | - | ||||||||||
Total |
669,277 | 753,791 | 642,922 | ||||||||||
Operating income |
169,812 | 165,329 | 194,632 | ||||||||||
Investment and other income |
5,039 | 3,178 | 16,452 | ||||||||||
Interest expense |
(12,695) | (12,087) | (11,924) | ||||||||||
Income before provision for income taxes |
162,156 | 156,420 | 199,160 | ||||||||||
Provision for income taxes |
56,651 | 60,257 | 73,663 | ||||||||||
Net income |
$ | 105,505 | $ | 96,163 | 125,497 | ||||||||
Net income per share: |
|||||||||||||
Basic |
$ | 1.23 | $ | 1.12 | 1.49 | ||||||||
Diluted |
$ | 1.23 | $ | 1.12 | 1.48 | ||||||||
Weighted average shares outstanding |
— basic | 85,484 | 85,761 | 83,975 | |||||||||
|
— diluted | 85,544 | 86,113 | 84,699 | |||||||||
Dividends declared per common share |
$ | 0.76 | $ | 0.76 | 0.68 | ||||||||
See accompanying notes to consolidated financial statements.
53
WADDELL & REED FINANCIAL, INC.
STATEMENTS OF STOCKHOLDERS' EQUITY
Years ended December 31, 2009, 2008 and 2007
(in thousands)
| |
Common Stock | |
|
|
|
|
|||||||||||||||
|---|---|---|---|---|---|---|---|---|---|---|---|---|---|---|---|---|---|---|---|---|---|
| |
Additional Paid-in Capital |
Retained Earnings |
|
Accumulated Other Comprehensive Income (Loss) |
Total Stockholders' Equity |
||||||||||||||||
| |
Shares | Amount | Treasury Stock | ||||||||||||||||||
Balance at December 31, 2006 |
99,701 | $ | 997 | 189,299 | 388,422 | (327,966) | (6,052) | 244,700 | |||||||||||||
Net income |
— | — | — | 125,497 | — | — | 125,497 | ||||||||||||||
Recognition of equity compensation |
— | — | 23,704 | — | — | — | 23,704 | ||||||||||||||
Issuance of nonvested shares and other |
— | — | (24,517) | — | 24,517 | — | — | ||||||||||||||
Dividends accrued, $.68 per share |
— | — | — | (57,420) | — | — | (57,420) | ||||||||||||||
Exercise of stock options |
— | — | 7,805 | — | 76,757 | — | 84,562 | ||||||||||||||
Excess tax benefits from share-based payment arrangements |
— | — | 12,919 | — | — | — | 12,919 | ||||||||||||||
Other stock transactions |
— | — | — | — | (5,539) | — | (5,539) | ||||||||||||||
Repurchase of common stock |
— | — | — | — | (59,488) | — | (59,488) | ||||||||||||||
Unrealized gain on available for sale investment securities |
— | — | — | — | — | 2,345 | 2,345 | ||||||||||||||
Reclassification for amounts included in net income |
— | — | — | — | — | (2,428) | (2,428) | ||||||||||||||
Pension and postretirement benefits |
— | — | — | — | — | 12,766 | 12,766 | ||||||||||||||
Balance at December 31, 2007 |
99,701 | 997 | 209,210 | 456,499 | (291,719) | 6,631 | 381,618 | ||||||||||||||
Net income |
— | — | — | 96,163 | — | — | 96,163 | ||||||||||||||
Recognition of equity compensation |
— | — | 28,933 | 34 | — | — | 28,967 | ||||||||||||||
Recognition of equity compensation related to restructuring |
— | — | 795 | — | — | 795 | |||||||||||||||
Issuance of nonvested shares and other |
— | — | (34,990) | — | 34,990 | — | — | ||||||||||||||
Dividends accrued, $.76 per share |
— | — | — | (65,138) | — | — | (65,138) | ||||||||||||||
Exercise of stock options |
— | — | (3,533) | — | 11,581 | — | 8,048 | ||||||||||||||
Excess tax benefits from share-based payment arrangements |
— | — | 7,471 | — | — | — | 7,471 | ||||||||||||||
Other stock transactions |
— | — | — | — | (12,303) | — | (12,303) | ||||||||||||||
Repurchase of common stock |
— | — | — | — | (93,012) | — | (93,012) | ||||||||||||||
Unrealized loss on available for sale investment securities |
— | — | — | — | — | (8,435) | (8,435) | ||||||||||||||
Reclassification for amounts included in net income |
— | — | — | — | — | (142) | (142) | ||||||||||||||
Pension and postretirement benefits |
— | — | — | — | — | (23,907) | (23,907) | ||||||||||||||
Balance at December 31, 2008 |
99,701 | 997 | 207,886 | 487,558 | (350,463) | (25,853) | 320,125 | ||||||||||||||
Net income |
— | — | — | 105,505 | — | — | 105,505 | ||||||||||||||
Recognition of equity compensation |
— | — | 30,565 | 8 | — | — | 30,573 | ||||||||||||||
Recognition of equity compensation related to divestiture of ACF |
— | — | 400 | — | — | — | 400 | ||||||||||||||
Issuance of nonvested shares and other |
— | — | (46,345) | — | 46,345 | — | — | ||||||||||||||
Dividends accrued, $.76 per share |
— | — | — | (65,195) | — | — | (65,195) | ||||||||||||||
Exercise of stock options |
— | — | (5,393) | — | 19,529 | — | 14,136 | ||||||||||||||
Excess tax benefits from share-based payment arrangements |
— | — | 2,787 | — | — | — | 2,787 | ||||||||||||||
Other stock transactions |
— | — | — | — | (7,124) | — | (7,124) | ||||||||||||||
Repurchase of common stock |
— | — | — | — | (36,441) | — | (36,441) | ||||||||||||||
Unrealized gain on available for sale investment securities |
— | — | — | — | — | 4,974 | 4,974 | ||||||||||||||
Reclassification for amounts included in net income |
— | — | — | — | — | 264 | 264 | ||||||||||||||
Pension and postretirement benefits |
— | — | — | — | — | (949) | (949) | ||||||||||||||
Balance at December 31, 2009 |
99,701 | $ | 997 | 189,900 | 527,876 | (328,154) | (21,564) | 369,055 | |||||||||||||
See accompanying notes to consolidated financial statements.
54
WADDELL & REED FINANCIAL, INC.
CONSOLIDATED STATEMENTS OF COMPREHENSIVE INCOME
Years ended December 31, 2009, 2008 and 2007
| |
2009 | 2008 | 2007 | |||||||
|---|---|---|---|---|---|---|---|---|---|---|
| |
(in thousands) |
|||||||||
Net income |
$ | 105,505 | 96,163 | 125,497 | ||||||
Other comprehensive income: |
||||||||||
Net unrealized appreciation (depreciation) of investment securities during the year, net of income taxes of $2,950, $(4,855) and $1,354, respectively |
4,974 |
(8,435) |
2,345 |
|||||||
Pension and postretirement benefits, net of income taxes of $(821), $(13,764) and $7,178, respectively |
(949) |
(23,907) |
12,766 |
|||||||
Reclassification adjustments for amounts included in net income, net of income taxes of $159, $(84) and $(1,396), respectively |
264 |
(142) |
(2,428) |
|||||||
Comprehensive income |
$ | 109,794 | 63,679 | 138,180 | ||||||
See accompanying notes to consolidated financial statements.
55
WADDELL & REED FINANCIAL, INC.
CONSOLIDATED STATEMENTS OF CASH FLOWS
Years ended December 31, 2009, 2008 and 2007
| |
2009 | 2008 | 2007 | ||||||||
|---|---|---|---|---|---|---|---|---|---|---|---|
| |
(in thousands) |
||||||||||
Cash flows from operating activities: |
|||||||||||
Net income |
$ | 105,505 | 96,163 | 125,497 | |||||||
Adjustments to reconcile net income to net cash provided by operating activities: |
|||||||||||
Depreciation and amortization |
13,476 | 12,969 | 12,395 | ||||||||
Other than temporary impairment of investments in affiliated mutual funds |
3,686 | — | — | ||||||||
Amortization of deferred sales commissions |
42,771 | 62,560 | 24,766 | ||||||||
Share-based compensation |
30,973 | 29,762 | 23,704 | ||||||||
Excess tax benefits from share-based payment arrangements |
(2,787) | (7,471) | (12,919) | ||||||||
Gain on sale of available-for-sale investment securities |
(2,623) | — | (3,598) | ||||||||
Net purchases and sales of trading securities |
7,864 | (26,885) | (926) | ||||||||
Unrealized (gain) loss on trading securities |
(4,779) | 6,072 | (1,001) | ||||||||
Goodwill impairment |
— | 7,222 | — | ||||||||
Loss on sale and retirement of property and equipment |
1,009 | 433 | 312 | ||||||||
Capital gains and dividends reinvested |
(1,141) | (1,880) | (2,135) | ||||||||
Deferred income taxes |
4,093 | (2,040) | (3,171) | ||||||||
Changes in assets and liabilities: |
|||||||||||
Cash and cash equivalents - restricted |
(24,228) | 51,173 | (67,257) | ||||||||
Receivables from funds and separate accounts |
(1,409) | 10,063 | (4,796) | ||||||||
Other receivables |
(117,820) | 19,629 | (21,046) | ||||||||
Other assets |
(1,480) | (2,943) | 1,375 | ||||||||
Deferred sales commissions |
(54,711) | (69,453) | (49,594) | ||||||||
Accounts payable and payable to investment companies |
139,528 | (73,534) | 89,523 | ||||||||
Other liabilities |
17,252 | 12,071 | 16,889 | ||||||||
Net cash provided by operating activities |
155,179 | 123,911 | 128,018 | ||||||||
Cash flows from investing activities: |
|||||||||||
Purchases of available-for-sale investment securities |
(21,364) | (100) | (5,650) | ||||||||
Proceeds from sales and maturities of available-for-sale investment securities |
15,052 | 1,750 | 10,429 | ||||||||
Additions to property and equipment |
(30,861) | (26,079) | (9,925) | ||||||||
Proceeds from sales of property and equipment |
7,685 | 466 | 93 | ||||||||
Net cash used in investing activities |
(29,488) | (23,963) | (5,053) | ||||||||
Cash flows from financing activities: |
|||||||||||
Dividends paid |
(65,018) | (63,738) | (55,392) | ||||||||
Repurchase of common stock |
(36,441) | (93,012) | (59,488) | ||||||||
Exercise of stock options |
14,136 | 8,048 | 84,562 | ||||||||
Excess tax benefits from share-based payment arrangements |
2,787 | 7,471 | 12,919 | ||||||||
Other stock transactions |
(7,124) | (12,303) | (5,539) | ||||||||
Net cash used in financing activities |
(91,660) | (153,534) | (22,938) | ||||||||
Net increase (decrease) in cash and cash equivalents |
34,031 | (53,586) | 100,027 | ||||||||
Cash and cash equivalents at beginning of year |
210,328 | 263,914 | 163,887 | ||||||||
Cash and cash equivalents at end of year |
$ | 244,359 | 210,328 | 263,914 | |||||||
Cash paid for: |
|||||||||||
Income taxes (net) |
$ | 50,369 | 53,146 | 74,439 | |||||||
Interest |
$ | 12,266 | 11,965 | 11,354 | |||||||
See accompanying notes to consolidated financial statements.
56
WADDELL & REED FINANCIAL, INC.
NOTES TO CONSOLIDATED FINANCIAL STATEMENTS
December 31, 2009, 2008 and 2007
1. Description of Business
Waddell & Reed Financial, Inc. and subsidiaries (hereinafter referred to as the "Company," "we," "our" and "us") derive revenues primarily from investment management, investment product underwriting and distribution, and shareholder services administration provided to the Waddell & Reed Advisors Group of Mutual Funds (the "Advisors Funds"), Ivy Funds Variable Insurance Portfolios (the "Ivy Funds VIP"), Ivy Funds, Inc. and the Ivy Funds portfolios (collectively, the "Ivy Funds"), and Waddell & Reed InvestEd Portfolios ("InvestEd") (collectively, the Advisors Funds, Ivy Funds VIP, Ivy Funds and InvestEd are referred to as the "Funds"), and institutional and separately managed accounts. The Funds and the institutional and separately managed accounts operate under various rules and regulations set forth by the United States Securities and Exchange Commission (the "SEC"). Services to the Funds are provided under investment management agreements that set forth the fees to be charged for these services. The majority of these agreements are subject to annual review and approval by each Fund's board of directors/trustees and shareholders. Our revenues are largely dependent on the total value and composition of assets under management, which include mainly domestic equity securities, but also include debt securities and international equities. Accordingly, fluctuations in financial markets and composition of assets under management can significantly impact revenues and results of operations.
2. Summary of Significant Accounting Policies
Basis of Presentation
The accompanying consolidated financial statements are prepared in accordance with accounting principles generally accepted in the United States of America ("GAAP") and include the accounts of the Company and its subsidiaries. All significant intercompany accounts and transactions have been eliminated in consolidation. Amounts in the accompanying financial statements and notes are rounded to the nearest thousand unless otherwise stated. Certain amounts in the prior years' financial statements have been reclassified for consistent presentation.
The Company has evaluated subsequent events through February 26, 2010, the date that these financial statements were issued, and determined there are no other items to disclose.
Pursuant to SFAS No. 168, "The FASB Accounting Standards Codification and the Hierarchy of Generally Accepted Accounting Principles – a replacement of FASB Statement No. 162," the FASB Accounting Standards Codification ("ASC") became the sole source of authoritative GAAP for interim and annual periods ending after September 15, 2009, except for rules and interpretive releases of the SEC, which are sources of authoritative GAAP for SEC registrants. The Company adopted this standard, now codified as "Generally Accepted Accounting Principles Topic," ASC 105, during the third quarter of 2009. References to specific accounting standards in the footnotes to our consolidated financial statements have been changed to refer to the appropriate section of the ASC.
Use of Estimates
GAAP requires us to make estimates and assumptions that affect the reported amounts of assets, liabilities, revenues and expenses in the consolidated financial statements and accompanying notes, and related disclosures of commitments and contingencies. Estimates are used for, but are not limited to, depreciation and amortization, taxes, valuation of assets, pension and postretirement obligations, and contingencies. Management evaluates its estimates and assumptions on an ongoing basis using historical experience and other factors, including the current economic environment. Actual results could differ from our estimates.
57
WADDELL & REED FINANCIAL, INC.
NOTES TO CONSOLIDATED FINANCIAL STATEMENTS (Continued)
December 31, 2009, 2008 and 2007
Cash and Cash Equivalents
Cash and cash equivalents include cash on hand and short-term investments. We consider all highly liquid investments with original or remaining maturities of 90 days or less at the date of purchase to be cash equivalents. Cash and cash equivalents – restricted represents cash held for the benefit of customers segregated in compliance with federal and other regulations. Substantially all cash balances are in excess of federal deposit insurance limits.
Disclosures About Fair Value of Financial Instruments
Fair value of cash and cash equivalents, short-term investments, receivables, payables and long-term debt approximates carrying value. Fair values for investment securities are based on quoted market prices, where available. Otherwise, fair values are based on quoted market prices of comparable instruments.
The Company adopted "Fair Value Measurements and Disclosures Topic," ("ASC 820") effective January 1, 2008. ASC 820 defines fair value, establishes a framework for measuring fair value and expands disclosure of fair value measurements. The Company did not have a transition adjustment to beginning retained earnings as a result of adopting this standard. ASC 820 applies to all financial instruments that are measured and reported on a fair value basis. This includes those items reported in investment securities on the consolidated balance sheets.
In conjunction with the adoption of ASC 820, the Company also adopted "Financial Instruments Topic," ("ASC 825") as of January 1, 2008. ASC 825 provides companies the option to report select financial assets and liabilities at fair value on an instrument-by-instrument basis with changes in fair value reported in earnings. Additionally, the transition provisions of ASC 825 permit a one-time election for existing positions at the adoption date with a cumulative-effect adjustment included in beginning retained earnings and future changes in fair value reported in earnings. This statement also establishes presentation and disclosure requirements designed to facilitate comparisons between companies that choose different measurement attributes for similar types of assets and liabilities. After the initial adoption, the election is made at the acquisition of a financial asset or financial liability and it may not be revoked. The adoption of ASC 825 did not result in a transition adjustment to beginning retained earnings.
Investment Securities and Investments in Affiliated Mutual Funds
Our investments are comprised of United States, state and government obligations, corporate debt securities and investments in affiliated mutual funds. Investments are classified as available-for-sale or trading. Unrealized holding gains and losses on securities available-for-sale, net of related tax effects, are excluded from earnings until realized and are reported as a separate component of comprehensive income. For trading securities, unrealized holding gains and losses are included in earnings. Realized gains and losses are computed using the specific identification method for investment securities, other than mutual funds. For mutual funds, realized gains and losses are computed using the average cost method.
Our available-for-sale investments are reviewed each quarter and adjusted for other than temporary declines in value. We consider factors affecting the issuer and the industry the issuer operates in, general market trends including interest rates, and our ability and intent to hold an investment until it has recovered. Consideration is given to the length of time an investment's market value has been below carrying value and prospects for recovery to carrying value. When a decline in the fair value of equity securities is determined to be other than temporary, the unrealized loss recorded net of tax in other comprehensive income is realized as a charge to net income and a new cost basis is established for financial reporting purposes. Based on a change to "Investments – Debt and Equity Securities Topic," ASC 320, adopted in 2009, when a decline in the fair value of debt securities is determined to be other than
58
WADDELL & REED FINANCIAL, INC.
NOTES TO CONSOLIDATED FINANCIAL STATEMENTS (Continued)
December 31, 2009, 2008 and 2007
temporary, the amount of the impairment recognized in earnings depends on whether the Company intends to sell the security or more likely than not will be required to sell the security before recovery of its amortized cost basis less any current-period credit loss. If so, the other-than-temporary impairment recognized in earnings is equal to the entire difference between the investment's amortized cost basis and its fair value at the balance sheet date. If not, the portion of the impairment related to the credit loss is recognized in earnings while the portion of the impairment related to other factors is recognized in other comprehensive income, net of tax.
Property and Equipment
Property and equipment are carried at cost. The costs of improvements that extend the life of a fixed asset are capitalized, while the costs of repairs and maintenance are expensed as incurred. Depreciation and amortization are calculated and recorded using the straight-line method over the estimated useful life of the related asset (or lease term if shorter), generally five to ten years for furniture, fixtures, data processing equipment and computer software; five to 26 years for equipment and machinery; and up to 15 years for leasehold improvements, which is the lesser of the lease term or expected life.
Software Developed for Internal Use
Certain internal costs incurred in connection with developing or obtaining software for internal use are capitalized in accordance with "Intangibles – Goodwill and Other Topic," ASC 350. Internal costs capitalized are included in property and equipment, net on the consolidated balance sheets, and were $11.8 million and $14.4 million as of December 31, 2009 and 2008, respectively. Amortization begins when the software project is complete and ready for its intended use and continues over the estimated useful life, generally five to ten years.
Goodwill and Identifiable Intangible Assets
Goodwill represents the excess of the cost of the Company's investment in the net assets of acquired companies over the fair value of the underlying identifiable net assets at the dates of acquisition. Goodwill is not amortized, but is reviewed annually and when events or circumstances occur that indicate that goodwill might be impaired. Impairment of goodwill is tested at the Company's reporting unit level. To determine fair value, our review process uses the income and market approaches. In performing the analysis, we use the best information available under the circumstances, including reasonable and supportable assumptions and projections. If the carrying amount of the reporting unit exceeds its implied fair value, goodwill is considered impaired and a second step is performed to measure the amount of impairment loss, if any.
Identifiable intangible assets with indefinite useful lives are not amortized. Indefinite life intangible assets represent advisory and subadvisory management contracts for managed assets obtained in acquisitions. We consider these contracts to be indefinite lived intangible assets as they are expected to be renewed without significant cost or modification of terms. We complete an ongoing review of the recoverability of identifiable intangible assets on an annual basis or more frequently whenever events occur or circumstances change that would more likely than not reduce their fair value.
Factors that are considered important in determining whether an impairment of goodwill or intangible assets might exist include significant continued underperformance compared to peers, the likelihood of termination or non-renewal of a mutual fund advisory or subadvisory contract or substantial changes in revenues earned from such contracts, significant changes in our business and products, material and ongoing negative industry or economic trends, or other factors specific to each asset or subsidiary being evaluated. Because of the significance of goodwill and other intangible assets to our consolidated balance
59
WADDELL & REED FINANCIAL, INC.
NOTES TO CONSOLIDATED FINANCIAL STATEMENTS (Continued)
December 31, 2009, 2008 and 2007
sheet, any changes in key assumptions about our business or prospects, or changes in market conditions or other externalities, could result in an impairment charge and such a charge could have a material effect on our financial condition and results of operations.
Deferred Sales Commissions
We defer certain costs, principally sales commissions and related compensation, which are paid to financial advisors and broker/dealers in connection with the sale of certain mutual fund shares sold without a front-end load sales charge. The costs incurred at the time of the sale of Class B shares are amortized on a straight-line basis over five years, which approximates the expected life of the shareholders' investments. The costs incurred at the time of the sale of Class C shares are amortized on a straight-line basis over 12 months. In addition, the costs incurred at the time of the sale of shares for certain asset allocation products are deferred and amortized on a straight-line basis, not to exceed three years. We recover these deferred costs through Rule 12b-1 and other distribution fees, which are paid on the Class B and Class C shares of the Advisors Funds and Ivy Funds, along with contingent deferred sales charges ("CDSCs") paid by shareholders who redeem their shares prior to completion of the required holding period (three years for shares of certain asset allocation products, six years for a Class B share and 12 months for a Class C share), as well as through client fees paid on the asset allocation products. Should we lose our ability to recover such sales commissions through distribution fees or CDSCs, the value of these assets would immediately decline, as would future cash flows. We periodically review the recoverability of the deferred sales commission assets as events or changes in circumstances indicate that their carrying amount may not be recoverable and adjust them accordingly. As part of our review in the fourth quarter of 2008, we recorded $6.5 million in additional amortization ($700 thousand related to Class B shares and $5.8 million related to Class C shares).
Revenue Recognition
We recognize investment management fees as earned over the period in which services are rendered. We charge the Funds daily based upon average daily net assets under management in accordance with investment management agreements between the Funds and the Company. In general, the majority of investment management fees earned from institutional and separate accounts are charged either monthly or quarterly based upon an average of net assets under management in accordance with such investment management agreements.
Shareholder service fees are recognized monthly and are calculated based on the number of accounts or assets under management as applicable. Other administrative service fee revenues are recognized when contractual obligations are fulfilled or as services are provided.
Underwriting and distribution commission revenues resulting from the sale of investment products are recognized on the trade date.
We also recognize distribution revenues monthly for certain types of investment products, primarily variable annuity products that are generally calculated based upon average daily net assets under management.
Advertising and Promotion
We expense all advertising and promotion costs as incurred. Advertising expense was $4.7 million, $5.3 million and $4.8 million for the years ended December 31, 2009, 2008 and 2007, respectively, and is classified in underwriting and distribution expense in the statement of income.
60
WADDELL & REED FINANCIAL, INC.
NOTES TO CONSOLIDATED FINANCIAL STATEMENTS (Continued)
December 31, 2009, 2008 and 2007
Share-Based Compensation
We account for share-based compensation expense using the fair value method. Under the fair value method, share-based compensation expense reflects the fair value of share-based awards measured at grant date, is recognized over the service period, and is adjusted each period for anticipated forfeitures. The fair value of options granted are calculated using a Black-Scholes option-pricing model. The Black-Scholes model incorporates assumptions as to dividend yield, risk-free interest rate, expected volatility and expected life of the option.
Accounting for Income Taxes
Income tax expense is based on pre-tax financial accounting income, including adjustments made for the recognition or derecognition related to uncertain tax positions. The recognition or derecognition of income tax expense related to uncertain tax positions is determined under the guidance as prescribed by "Income Taxes Topic, " ASC 740. Deferred tax assets and liabilities are recognized for the future tax attributable to differences between the financial statement carrying amounts of existing assets and liabilities and their respective tax basis. A valuation allowance is recognized for deferred tax assets if, based on available evidence, it is more likely than not that all or some portion of the asset will not be realized. Deferred tax assets and liabilities are measured using enacted tax rates expected to be recovered or settled. The effect on deferred tax assets and liabilities of a change in tax rates is recognized in earnings in the period that includes the enactment date.
Earnings per Share
The Company adopted "Earnings Per Share Topic," ASC 260 on January 1, 2009. This standard provides that unvested share-based payment awards that contain nonforfeitable rights to dividends are considered to be participating securities and must be included in the computation of earnings per share pursuant to the two-class method. As required upon adoption, we retrospectively adjusted prior year earnings per share data to conform to the provisions of this standard. See Note 13 for additional information.
Derivatives and Hedging Activities
Derivative instruments are recorded on the balance sheet at fair value. The Company periodically uses interest rate swaps to manage risks associated with interest rate volatility. All derivative instruments have been designated as hedges, in accordance with GAAP. If the underlying hedged transaction ceases to exist, all changes in fair value of the related derivatives that have not been settled are recognized in current earnings or amortized over the term of the hedged transaction. Derivatives that do not qualify for hedge accounting are marked to market with changes recognized in current earnings. The Company does not hold or issue derivative financial instruments for trading purposes and is not a party to leveraged derivatives.
3. Accounting Pronouncements Not Yet Adopted
In January 2010, the FASB issued Accounting Standards Update No. 2010-06 to amend "Fair Value Measurements and Disclosures Topic," ASC 820. The guidance requires disclosure changes related to recurring or nonrecurring fair value measurements. Specifically, companies are required to disclose separately the amounts of significant transfers in and out of Level 1 and Level 2 fair value measurements, describe the reasons for the transfers and provide additional detail related to the reconciliation of Level 3 fair value measurements. Additionally, the guidance clarifies existing disclosure requirements. The guidance is effective for interim and annual reporting periods beginning after December 15, 2009, except
61
WADDELL & REED FINANCIAL, INC.
NOTES TO CONSOLIDATED FINANCIAL STATEMENTS (Continued)
December 31, 2009, 2008 and 2007
for certain provisions related to the rollforward of activity in Level 3 fair value measurements, which are effective for fiscal years beginning after December 15, 2010 and for interim periods within those fiscal years. The Company will adopt the applicable disclosure requirements effective with our first quarter 2010 reporting period.
In June 2009, the FASB issued SFAS No. 167, "Amendments to FASB Interpretation No. 46(R)" ("SFAS No. 167"). SFAS No. 167 improves how enterprises account for and disclose their involvement with variable interest entities ("VIEs") and other entities whose equity at risk is insufficient or lacks certain characteristics. SFAS No. 167 changes how an entity determines whether it is the primary beneficiary of a VIE and whether that VIE should be consolidated and requires additional disclosures. In January 2010, the FASB agreed to issue accounting guidance to indefinitely defer this standard's consolidation requirements, which were initially effective for fiscal years beginning after November 15, 2009 and interim periods within those fiscal years, for reporting enterprises' interests in entities that either have all of the characteristics of investment companies or for which it is industry practice to apply measurement principles for financial reporting purposes consistent with those that apply to investment companies. The Company meets the criteria to defer this standard's consolidation requirements. According to the FASB, this deferral will continue until the FASB and the International Accounting Standards Board, in their joint consolidation project, resolve the issue of how to determine whether an asset manager functions as a principal or as an agent.
62
WADDELL & REED FINANCIAL, INC.
NOTES TO CONSOLIDATED FINANCIAL STATEMENTS (Continued)
December 31, 2009, 2008 and 2007
4. Investment Securities
Investment securities at December 31, 2009 and 2008 are as follows:
2009
|
Amortized cost |
Unrealized gains |
Unrealized losses |
Fair value | ||||||||
|---|---|---|---|---|---|---|---|---|---|---|---|---|
| |
(in thousands) |
|||||||||||
Available-for-sale securities: |
||||||||||||
Mortgage-backed securities |
$ | 10 | 2 | - | 12 | |||||||
Municipal bonds |
4,959 | - | (286) | 4,673 | ||||||||
Affiliated mutual funds |
29,817 | 3,241 | (143) | 32,915 | ||||||||
|
$ | 34,786 | 3,243 | (429) | 37,600 | |||||||
Trading securities: |
||||||||||||
Mortgage-backed securities |
107 | |||||||||||
Municipal bonds |
478 | |||||||||||
Corporate bonds |
94 | |||||||||||
Common stock |
30 | |||||||||||
Affiliated mutual funds |
32,215 | |||||||||||
|
32,924 | |||||||||||
Total investment securities |
70,524 |
|||||||||||
2008
|
Amortized cost |
Unrealized gains |
Unrealized losses |
Fair value | ||||||||
|---|---|---|---|---|---|---|---|---|---|---|---|---|
| |
(in thousands) |
|||||||||||
Available-for-sale securities: |
||||||||||||
Mortgage-backed securities |
$ | 11 | 1 | - | 12 | |||||||
Municipal bonds |
5,290 | - | (1,086) | 4,204 | ||||||||
Affiliated mutual funds |
23,966 | 459 | (5,133) | 19,292 | ||||||||
|
$ | 29,267 | 460 | (6,219) | 23,508 | |||||||
Trading securities: |
||||||||||||
Mortgage-backed securities |
108 | |||||||||||
Municipal bonds |
372 | |||||||||||
Corporate bonds |
93 | |||||||||||
Common stock |
37 | |||||||||||
Affiliated mutual funds |
34,566 | |||||||||||
|
35,176 | |||||||||||
Total investment securities |
58,684 | |||||||||||
63
WADDELL & REED FINANCIAL, INC.
NOTES TO CONSOLIDATED FINANCIAL STATEMENTS (Continued)
December 31, 2009, 2008 and 2007
A summary of debt securities and affiliated mutual funds with fair values below carrying values at December 31, 2009 is as follows:
| |
Less than 12 months | 12 months or longer | Total | |||||||||||||||
|---|---|---|---|---|---|---|---|---|---|---|---|---|---|---|---|---|---|---|
| |
Fair value | Unrealized losses |
Fair value | Unrealized losses |
Fair value | Unrealized losses |
||||||||||||
| |
(in thousands) |
|||||||||||||||||
Municipal bonds |
$ | 3,843 | (125) | 830 | (161) | 4,673 | (286) | |||||||||||
Affiliated mutual funds |
11,064 | (64) | 823 | (79) | 11,887 | (143) | ||||||||||||
Total temporarily impaired securities |
$ |
14,907 |
(189) |
1,653 |
(240) |
16,560 |
(429) |
|||||||||||
Based upon our assessment of these municipal bonds and affiliated mutual funds, the time frame investments have been in a loss position, our intent to hold the affiliated mutual funds until they have recovered and our history of holding bonds until maturity, we determined that a write-down was not necessary at December 31, 2009.
During the first quarter of 2009, we recorded a pre-tax charge of $3.7 million to reflect the "other than temporary" decline in value of certain of the Company's investments in affiliated mutual funds as the fair value of these investments had been below cost for an extended period. This charge is recorded in investment and other income in the consolidated statement of operations for 2009.
Mortgage-backed securities and municipal bonds accounted for as available-for-sale and held as of December 31, 2009 mature as follows:
| |
Amortized cost | Fair value | ||||
|---|---|---|---|---|---|---|
| |
(in thousands) |
|||||
After one year but within ten years |
$ | 3,968 | 3,843 | |||
After ten years |
1,001 | 842 | ||||
|
$ | 4,969 | 4,685 | |||
Mortgage-backed securities, municipal bonds and corporate bonds accounted for as trading and held as of December 31, 2009 mature as follows:
| |
Fair value | |
||||
|---|---|---|---|---|---|---|
| |
(in thousands) |
|
||||
After one year but within ten years |
$ | 572 | ||||
After ten years |
107 | |||||
|
$ | 679 | ||||
Investment securities with fair values of $24.7 million, $1.1 million and $10.9 million were sold during 2009, 2008 and 2007, respectively. During 2009, a net gain of $2.6 million was recognized from the sale of $14.7 million in available-for-sale securities and a net gain of $126 thousand was recognized from the sale of $10.0 million in trading securities. In 2008, a net loss of $31 thousand was recognized from the sale of
64
WADDELL & REED FINANCIAL, INC.
NOTES TO CONSOLIDATED FINANCIAL STATEMENTS (Continued)
December 31, 2009, 2008 and 2007
$1.1 million in trading securities. A net gain of $3.6 million was recognized during 2007 from the sale of $10.4 million in available-for-sale securities.
The aggregate carrying amount of our equity method investments, classified in other assets, was $3.7 million and $3.9 million at December 31, 2009 and 2008, respectively. At December 31, 2009, our investment consists of a limited partnership interest in venture capital funds.
We determine the fair value of our investments using broad levels of inputs as defined by related accounting standards:
- •
- Level 1 – Quoted prices in active markets for identical securities
- •
- Level 2 – Other significant observable inputs (including quoted prices in active markets for similar
securities)
- •
- Level 3 – Significant unobservable inputs (including the Company's own assumptions in determining the fair value of investments)
The following table summarizes our investment securities as of December 31, 2009 and 2008 that are recognized in our balance sheet using fair value measurements based on the differing levels of inputs:
| |
2009 | 2008 | |||||
|---|---|---|---|---|---|---|---|
| |
(in thousands) |
||||||
Level 1 |
$ | 65,160 | 53,895 | ||||
Level 2 |
5,364 | 4,789 | |||||
Level 3 |
- | - | |||||
Total |
$ | 70,524 | 58,684 | ||||
5. Property and Equipment
A summary of property and equipment at December 31, 2009 and 2008 is as follows:
| |
2009 | 2008 | Estimated useful lives |
||||||
|---|---|---|---|---|---|---|---|---|---|
| |
(in thousands) |
|
|||||||
Leasehold improvements |
$ | 17,962 | 14,707 | 1 - 15 years | |||||
Furniture and fixtures |
29,870 | 27,810 | 5 - 10 years | ||||||
Equipment and machinery |
16,545 | 21,622 | 5 - 26 years | ||||||
Computer software |
56,954 | 50,645 | 5 - 10 years | ||||||
Data processing equipment |
21,844 | 20,658 | 5 - 10 years | ||||||
Property and equipment, at cost |
143,175 | 135,442 | |||||||
Accumulated depreciation |
(75,004) | (75,476) | |||||||
Property and equipment, net |
$ | 68,171 | 59,966 | ||||||
Depreciation expense was $13.7 million, $13.2 million and $12.4 million during the years ended December 31, 2009, 2008 and 2007, respectively.
At December 31, 2009, we had property and equipment under capital leases with a cost of $1.5 million and accumulated depreciation of $748 thousand. At December 31, 2008, we had property and equipment under capital leases with a cost of $724 thousand and accumulated depreciation of $102 thousand.
65
WADDELL & REED FINANCIAL, INC.
NOTES TO CONSOLIDATED FINANCIAL STATEMENTS (Continued)
December 31, 2009, 2008 and 2007
6. Goodwill and Identifiable Intangible Assets
Goodwill represents the excess of purchase price over the tangible assets and identifiable intangible assets of an acquired business. Our goodwill is not deductible for tax purposes. Goodwill and identifiable intangible assets (all considered indefinite lived) at December 31, 2009 and 2008 are as follows:
| |
December 31, 2009 |
December 31, 2008 |
|||||
|---|---|---|---|---|---|---|---|
| |
(in thousands) |
||||||
Goodwill |
$ | 202,518 | 202,518 | ||||
Accumulated amortization |
(36,307) | (36,307) | |||||
Total goodwill |
166,211 | 166,211 | |||||
Mutual fund management advisory contracts |
38,699 |
38,699 |
|||||
Mutual fund subadvisory management contracts |
16,300 | 16,300 | |||||
Total indentifiable intangible assets |
54,999 | 54,999 | |||||
Total |
$ | 221,210 | 221,210 | ||||
Based on our annual review of goodwill in the second quarter of 2008 in accordance with applicable accounting literature, the implied fair value of all reporting units exceeded their carrying amounts. Due to the decline in the financial markets during the second half of 2008, we performed another review of goodwill and intangibles in the fourth quarter of 2008. We recorded an impairment charge of $7.2 million in the fourth quarter of 2008 to write off the remaining balance of goodwill related to our former subsidiary, Austin Calvert & Flavin, Inc. ("ACF") based on declines in ACF's assets under management and the related adverse impact on its earnings potential. The goodwill impairment charge related to ACF was not deductible for income tax purposes and as a result, no tax benefit was recognized for the charge in 2008. See Note 8 for details relating to the sale of ACF in 2009.
The Company has recognized total goodwill impairment charges of $27.2 million, all related to ACF, since its adoption of "Intangibles – Goodwill and Other Topic," ASC 350 in 2002.
7. Restructuring
In the fourth quarter of 2008, we initiated a restructuring plan to reduce our operating costs. We completed the restructuring by December 31, 2008, which included a voluntary separation of 169 employees and the termination of various projects under development. We recorded a pre-tax restructuring charge of $16.5 million, consisting of $15.0 million in employee compensation and other benefit costs, $795 thousand for accelerated vesting of nonvested stock and $717 thousand in project development costs, including $500 thousand for the early termination of a contract. The restructuring charge is included in general and administrative expenses in the consolidated statement of income in 2008.
66
WADDELL & REED FINANCIAL, INC.
NOTES TO CONSOLIDATED FINANCIAL STATEMENTS (Continued)
December 31, 2009, 2008 and 2007
The activity in the accrued restructuring liability for the year ended December 31, 2009 is summarized as follows:
| |
Accrued Liability as of December 31, 2008 |
Cash Payments |
Non-cash Settlements and Other |
Accrued Liability as of December 31, 2009 |
||||||||
|---|---|---|---|---|---|---|---|---|---|---|---|---|
| |
(in thousands) |
|||||||||||
Employee compensation and other benefit costs |
$ | 14,530 | (11,451) | (288) | 2,791 | |||||||
Contract termination and project development costs |
500 | - | - | 500 | ||||||||
|
$ | 15,030 | (11,451) | (288) | 3,291 | |||||||
We expect the remaining restructuring costs to be paid out in 2010. The restructuring liability of $3.3 million is included in other current liabilities in the consolidated balance sheet.
8. Sale of Austin, Calvert & Flavin, Inc.
On July 15, 2009, the Company completed the sale of its wholly-owned subsidiary, ACF, pursuant to a stock purchase agreement dated June 26, 2009. The agreement includes an earnout provision based on a percentage of revenues on existing accounts over the three-year period subsequent to the closing date. Prior to the closing date, ACF had 10 employees and assets under management of $488.0 million.
We recorded charges for severance and other transaction costs of $1.1 million in connection with the divestiture of our investment in ACF in 2009, which are included in general and administrative expenses in the 2009 consolidated statement of income.
For tax purposes, this sale resulted in a capital loss of $28.1 million, a portion of which will be carried back to recover taxes previously paid on capital gains in prior periods. The remaining loss will be carried forward and will be available to offset potential future capital gains. Due to the character of the loss and the limited carryforward period permitted by law, the Company may not realize the full tax benefit of the capital loss carryforward. We recorded tax benefits in 2009 of $3.6 million. Of this amount, $1.6 million relates to carrying back a portion of the capital loss to fully offset capital gains generated during the applicable three-year carryback period. The remaining $2.0 million tax benefit relates to utilizing capital losses to offset capital gains generated during 2009.
9. Indebtedness
On January 13, 2006, the Company issued $200.0 million in principal amount 5.60% senior notes due 2011 (the "Notes") resulting in net proceeds of approximately $198.2 million (net of discounts, commissions and estimated expenses). The Company used these proceeds, together with cash on hand, to repay the entire $200.0 million aggregate principal amount outstanding of its prior $200.0 million notes. The Notes represent senior unsecured obligations and are rated "Baa2" by Moody's and "BBB" by Standard & Poor's. Interest is payable semi-annually on January 15 and July 15 at a fixed rate of 5.60% per annum. The Company may, at its option, call the Notes at any time pursuant to a make whole redemption provision, which would compensate holders for any changes in interest rate levels of the notes upon early extinguishment. The Company currently has no intention to call the Notes.
67
WADDELL & REED FINANCIAL, INC.
NOTES TO CONSOLIDATED FINANCIAL STATEMENTS (Continued)
December 31, 2009, 2008 and 2007
The following is a summary of long-term debt at December 31, 2009 and 2008:
| |
2009 | 2008 | |||||
|---|---|---|---|---|---|---|---|
| |
(in thousands) |
||||||
Principal amount unsecured 5.60% senior notes due in 2011 |
$ | 200,000 | 200,000 | ||||
Discount on unsecured 5.60% senior notes due in 2011 |
(16) | (31) | |||||
Total long-term debt |
$ | 199,984 | 199,969 | ||||
The fair value of the long-term debt is approximately $204.5 million as of December 31, 2009 compared to the carrying value of $200.0 million.
On January 10, 2006, the Company terminated two forward interest rate swap agreements entered into in 2005 upon the closing of the New Notes. The swaps, considered completely effective cash flow hedges under "Derivatives and Hedging Topic," ASC 815, were put in place to hedge against changes in forecasted interest payments attributable to changes in the LIBOR swap rate between the time the Company entered into the swap agreement and the time we anticipated refinancing our previously issued 7.50% notes in January 2006. In connection with the termination of the swap agreements, the Company received a net cash settlement of $1.1 million. The Company's gain on these transactions was deferred in accumulated other comprehensive income and is being amortized into earnings as a reduction to interest expense over the five year term of the Notes. As of December 31, 2009, the remaining unamortized amount was approximately $200 thousand.
The Company entered into a 364-day revolving credit facility (the "Credit Facility") with various lenders, effective October 5, 2009, which initially provides for borrowings of up to $125.0 million and replaced the Company's previous revolving credit facility. Lenders could, at their option upon the Company's request, expand the facility to $200.0 million. At December 31, 2009, there were no borrowings outstanding under the Credit Facility. Borrowings under the Credit Facility bear interest at various rates including adjusted LIBOR or an alternative base rate plus, in each case, an incremental margin based on the Company's credit rating. The Credit Facility also provides for a facility fee on the aggregate amount of commitment under the revolving facility (whether or not utilized). The facility fee is also based on the Company's credit rating level. The most restrictive provisions of the credit agreement require the Company to maintain a consolidated leverage ratio not to exceed 3.0 to 1.0 for four consecutive quarters and a consolidated interest coverage ratio of not less than 4.0 to 1.0 for four consecutive quarters. The Company was in compliance with these covenants and similar covenants in prior facilities for all years presented.
10. Income Taxes
The provision for income taxes for the years ended December 31, 2009, 2008 and 2007 consists of the following:
| |
2009 | 2008 | 2007 | ||||
|---|---|---|---|---|---|---|---|
| |
(in thousands) |
||||||
| Currently payable: | |||||||
| Federal | $ 48,249 | 59,149 | 72,760 | ||||
| State | 4,312 | 3,149 | 5,092 | ||||
| 52,561 | 62,298 | 77,852 | |||||
| Deferred taxes | 4,090 | (2,041) | (4,189) | ||||
| Provision for income taxes | $ 56,651 | 60,257 | 73,663 | ||||
68
WADDELL & REED FINANCIAL, INC.
NOTES TO CONSOLIDATED FINANCIAL STATEMENTS (Continued)
December 31, 2009, 2008 and 2007
The following table reconciles the statutory federal income tax rate with our effective income tax rate for the years ended December 31, 2009, 2008 and 2007:
| |
2009 | 2008 | 2007 | ||||||
|---|---|---|---|---|---|---|---|---|---|
Statutory federal income tax rate |
35.0% | 35.0% | 35.0% | ||||||
State income taxes, net of federal tax benefits |
1.9 | 1.4 | 2.1 | ||||||
State tax incentives |
(0.7) | (0.3) | (0.1) | ||||||
Sale of ACF |
(6.0) | — | — | ||||||
Valuation allowance on losses capital in nature |
4.1 | — | — | ||||||
Nondeductible goodwill impairment expense |
— | 1.6 | — | ||||||
Other items |
0.6 | 0.8 | — | ||||||
Effective income tax rate |
34.9% | 38.5% | 37.0% | ||||||
The tax effect of temporary differences that give rise to significant portions of deferred tax liabilities and deferred tax assets at December 31, 2009 and 2008 are as follows:
| |
2009 | 2008 | ||||
|---|---|---|---|---|---|---|
| |
(in thousands) |
|||||
| Deferred tax liabilities: | ||||||
| Deferred sales commissions | $ (7,895) | (6,019) | ||||
| Property and equipment | (11,372) | (9,213) | ||||
| Benefit plans | (4,289) | (3,609) | ||||
| Identifiable intangible assets | (8,463) | (8,359) | ||||
| Unrealized gains on derivatives | (83) | (165) | ||||
| Unrealized gains on available for sale investment securities | (1,036) | - | ||||
| Purchase of fund assets | (5,022) | (4,189) | ||||
| Prepaid expenses | (1,886) | (1,544) | ||||
| Other | (342) | (323) | ||||
| Total gross deferred liabilities | (40,388) | (33,421) | ||||
| Deferred tax assets: | ||||||
| Acquisition lease liability | 949 | 784 | ||||
| Additional pension and postretirement liability | 13,799 | 12,978 | ||||
| Accrued expenses | 8,598 | 11,225 | ||||
| Unrealized losses on investment securities | 1,402 | 2,333 | ||||
| Capital loss carryforwards | 6,264 | - | ||||
| Nonvested stock | 12,935 | 10,827 | ||||
| Unused state tax credits | 1,018 | 337 | ||||
| State net operating loss carryforwards | 5,034 | 4,698 | ||||
| Other | 2,967 | 2,242 | ||||
| Total gross deferred assets | 52,966 | 45,424 | ||||
| Valuation allowance | (11,336) | (4,385) | ||||
| Net deferred tax asset | $ 1,242 | 7,618 | ||||
69
WADDELL & REED FINANCIAL, INC.
NOTES TO CONSOLIDATED FINANCIAL STATEMENTS (Continued)
December 31, 2009, 2008 and 2007
During 2009, the Company sold ACF, which generated a capital loss available to offset potential future and prior period capital gains. Due to the character of the loss and the limited carryforward period permitted by law, the Company may not realize the full tax benefit of the capital loss. The deferred tax asset, net of federal tax effect, relating to the capital losses as of December 31, 2009 is approximately $6.3 million. The capital loss carryforward, if not utilized, will expire in 2014. As of December 31, 2009, other net deferred tax assets that are capital in nature are approximately $300 thousand. Management believes it is not more likely than not that the Company will generate sufficient future capital gains to realize the full benefit of these capital losses and accordingly, a valuation allowance in the amount of $6.6 million has been recorded at December 31, 2009. Certain subsidiaries of the Company have net operating loss carryforwards in certain states in which these companies file on a separate company basis. The deferred tax asset, net of federal tax effect, relating to the carryforwards as of December 31, 2009 and December 31, 2008 is approximately $5.0 million and $4.7 million, respectively. The carryforwards, if not utilized, will expire between 2010 and 2029. Management believes it is not more likely than not that these subsidiaries will generate sufficient future taxable income in these states to realize the benefit of the net operating loss carryforwards and, accordingly, a valuation allowance in the amount of $4.7 million and $4.4 million has been recorded at December 31, 2009 and December 31, 2008, respectively. The Company generated state tax credits in 2008 and 2009 that will expire in 2018 and 2019, respectively, if not utilized. The Company anticipates these credits will be fully utilized prior to their expiration date.
As of January 1, 2009, the Company had unrecognized tax benefits, including penalties and interest, of $4.9 million ($3.4 million net of federal benefit) that, if recognized, would impact the Company's effective tax rate. As of December 31, 2009, the Company had unrecognized tax benefits, including penalties and interest, of $6.8 million ($4.7 million net of federal benefit) that, if recognized, would impact the Company's effective tax rate. The unrecognized tax benefits that are not expected to be settled within the next 12 months are included in other liabilities in the accompanying consolidated balance sheet; unrecognized tax benefits that are expected to be settled within the next 12 months are included in income taxes payable.
The Company's historical accounting policy with respect to interest and penalties related to tax uncertainties has been to classify these amounts as income taxes, and the Company continued this classification upon the adoption of "Income Taxes Topic," ASC 740. As of January 1, 2009, the total amount of accrued interest and penalties related to uncertain tax positions recognized in the consolidated balance sheet was $1.6 million ($1.2 million net of federal benefit). The total amount of penalties and interest, net of federal benefit, related to tax uncertainties recognized in the statement of income for the period ended December 31, 2009 was $307 thousand. The total amount of accrued penalties and interest related to uncertain tax positions at December 31, 2009 of $2.0 million ($1.6 million net of federal benefit) is included in the total unrecognized tax benefits described above.
70
WADDELL & REED FINANCIAL, INC.
NOTES TO CONSOLIDATED FINANCIAL STATEMENTS (Continued)
December 31, 2009, 2008 and 2007
The following table summarizes the Company's reconciliation of unrecognized tax benefits, excluding penalties and interest, for the year ended December 31, 2009:
| |
Unrecognized Tax Benefits |
|||
|---|---|---|---|---|
| |
(in thousands) |
|||
Balance at January 1, 2009 |
$ | 3,332 | ||
Increases during the year: |
||||
Gross increases - tax positions in prior period |
1,064 | |||
Gross increases - current-period tax positions |
636 | |||
Decreases during the year: |
||||
Decreases due to settlements with taxing authorities |
(1) | |||
Decreases due to lapse of statute of limitations |
(174) | |||
Balance at December 31, 2009 |
$ | 4,857 | ||
In the ordinary course of business, many transactions occur for which the ultimate tax outcome is uncertain. In addition, respective tax authorities periodically audit our income tax returns. These audits examine our significant tax filing positions, including the timing and amounts of deductions and the allocation of income among tax jurisdictions. In 2009, the Company settled three open tax years that were undergoing audit by a state jurisdiction in which the Company operates. During 2008, the Company settled five open tax years that were undergoing audit by a state jurisdiction in which the Company operates. The Company also received notification of a favorable outcome on a tax position in which the Company had previously considered partially uncertain, and therefore, had not previously recognized the full tax benefit. During 2007, the Company settled six open tax years that were undergoing audit by a state jurisdiction in which the Company operates. The 2006, 2007 and 2008 federal income tax returns are open tax years that remain subject to potential future audit. The 2005 federal tax year also remains open to a limited extent due to a capital loss carryback claim. State income tax returns for all years after 2005 and, in certain states, income tax returns for 2005, are subject to potential future audit by tax authorities in the Company's major state tax jurisdictions.
The Company is currently being audited in three state jurisdictions. It is reasonably possible that the Company will settle the audits in these jurisdictions within the next 12-month period. It is estimated that the Company's liability for unrecognized tax benefits, including penalties and interest, could decrease by approximately $1.9 million to $3.3 million ($1.3 million to $2.2 million net of federal benefit) upon settlement of these audits. Such settlements are not anticipated to have a significant impact on the results of operations.
11. Pension Plan and Postretirement Benefits Other Than Pension
We provide a non-contributory retirement plan that covers substantially all employees and certain vested employees of our former parent company (the "Pension Plan"). Benefits payable under the Pension Plan are based on employees' years of service and compensation during the final ten years of employment. We also sponsor an unfunded defined benefit postretirement medical plan that covers substantially all employees, including Waddell & Reed and Legend advisors. The medical plan is contributory with retiree contributions adjusted annually. The medical plan does not provide for post age 65 benefits with the exception of a small group of employees that were grandfathered when such plan was established.
71
WADDELL & REED FINANCIAL, INC.
NOTES TO CONSOLIDATED FINANCIAL STATEMENTS (Continued)
December 31, 2009, 2008 and 2007
A reconciliation of the funded status of these plans and the assumptions related to the obligations at December 31, 2009, 2008 and 2007 follows:
| |
Pension Benefits | Other Postretirement Benefits |
|||||||||||
|---|---|---|---|---|---|---|---|---|---|---|---|---|---|
| |
2009 | 2008 | 2007 | 2009 | 2008 | 2007 | |||||||
| |
(in thousands) |
||||||||||||
| Change in projected benefit obligation: | |||||||||||||
| Net benefit obligation at beginning of year | $ 98,594 | 94,893 | 88,320 | 5,205 | 3,975 | 4,174 | |||||||
| Service cost | 5,276 | 5,727 | 5,718 | 371 | 296 | 292 | |||||||
| Interest cost | 6,386 | 6,326 | 5,490 | 343 | 262 | 244 | |||||||
| Benefits and expenses paid | (11,692) | (6,553) | (3,690) | (493) | (616) | (313) | |||||||
| Actuarial (gain) loss | 12,398 | (1,799) | (945) | 362 | 1,126 | (570) | |||||||
| Retiree contributions | — | — | — | 157 | 162 | 148 | |||||||
| Net benefit obligation at end of year | $ 110,962 | 98,594 | 94,893 | 5,945 | 5,205 | 3,975 | |||||||
The accumulated benefit obligation for the Pension Plan was $94.9 million and $86.9 million at December 31, 2009 and 2008, respectively.
| |
Pension Benefits | Other Postretirement Benefits |
||||||||||||
|---|---|---|---|---|---|---|---|---|---|---|---|---|---|---|
| |
2009 | 2008 | 2007 | 2009 | 2008 | 2007 | ||||||||
| |
(in thousands) |
|||||||||||||
| Change in plan assets: | ||||||||||||||
| Fair value of plan assets at beginning of year | $ 78,020 | 109,822 | 82,889 | — | — | — | ||||||||
| Actual return on plan assets | 15,223 | (30,249) | 23,622 | — | — | — | ||||||||
| Employer contributions | 10,000 | 5,000 | 7,000 | 336 | 454 | 165 | ||||||||
| Retiree contributions | — | — | — | 157 | 162 | 148 | ||||||||
| Benefits paid | (11,692) | (6,553) | (3,689) | (493) | (616) | (313) | ||||||||
| Fair value of plan assets at end of year | $ 91,551 | 78,020 | 109,822 | — | — | — | ||||||||
| Funded status at end of year | $ (19,411) | (20,574) | 14,929 | (5,945) | (5,205) | (3,975) | ||||||||
72
WADDELL & REED FINANCIAL, INC.
NOTES TO CONSOLIDATED FINANCIAL STATEMENTS (Continued)
December 31, 2009, 2008 and 2007
| |
Pension Benefits | Other Postretirement Benefits |
||||||||||||||||||||
|---|---|---|---|---|---|---|---|---|---|---|---|---|---|---|---|---|---|---|---|---|---|---|
| |
2009 | |
2008 | 2007 | 2009 | 2008 | 2007 | |||||||||||||||
| |
(in thousands, except percentage data) |
|||||||||||||||||||||
| Amounts recognized in the statement of financial position: | ||||||||||||||||||||||
| Noncurrent assets | $ | - | - | 14,929 | - | - | - | |||||||||||||||
| Current liabilities | - | - | - | (250) | (252) | (192) | ||||||||||||||||
| Noncurrent liabilities | (19,411) | (20,574) | - | (5,695) | (4,953) | (3,783) | ||||||||||||||||
| Net amount recognized at end of year | $ | (19,411) | (20,574) | 14,929 | (5,945) | (5,205) | (3,975) | |||||||||||||||
Amounts not yet reflected in net periodic benefit cost and included in accumulated other comprehensive income: |
||||||||||||||||||||||
| Transition obligation | $ | (47) | (52) | (57) | - | - | - | |||||||||||||||
| Prior service cost | (4,041) | (4,596) | (3,714) | (284) | (323) | (362) | ||||||||||||||||
| Accumulated gain (loss) | (32,842) | (30,835) | 4,792 | (79) | 283 | 1,489 | ||||||||||||||||
| Accumulated other comprehensive income (loss) | (36,930) | (35,483) | 1,021 | (363) | (40) | 1,127 | ||||||||||||||||
| Cumulative employer contributions in excess of net periodic benefit cost | 17,519 | 14,909 | 13,908 | (5,582) | (5,165) | (5,102) | ||||||||||||||||
| Net amount recognized at end of year | $ | (19,411) | (20,574) | 14,929 | (5,945) | (5,205) | (3,975) | |||||||||||||||
Weighted average assumptions used to determine benefit obligation at December 31: |
||||||||||||||||||||||
| Discount rate | 6.25% | 6.75% | 6.75% | 6.25% | 6.75% | 6.75% | ||||||||||||||||
| Rate of compensation increase | 3.86% | (1) | 3.86% | Not applicable |
||||||||||||||||||
- (1)
- Rate of compensation increase was 0% for 2009, 2.5% for 2010 and 3.86% for 2011 and after.
The discount rate assumptions used to determine the postretirement obligations and expense were based on the Mercer Bond Model. This model was designed by Mercer Human Resource Consulting to provide a means for plan sponsors to value the liabilities of their postretirement benefit plans. The Mercer Bond Model calculates the yield on a theoretical portfolio of high-grade corporate bonds (rated "Aa" or better) with cash flows that generally match our expected benefit payments. To the extent scheduled bond proceeds exceed the estimated benefit payments in a given period, the yield calculation assumes those excess proceeds are reinvested at the one-year forward rates implied by the Citigroup Pension Discount Curve.
73
WADDELL & REED FINANCIAL, INC.
NOTES TO CONSOLIDATED FINANCIAL STATEMENTS (Continued)
December 31, 2009, 2008 and 2007
Our Pension Plan asset allocation at December 31, 2009 and 2008 is as follows:
Plan assets by category
|
Percentage of Plan Assets at December 31, 2009 |
Percentage of Plan Assets at December 31, 2008 |
|||||
|---|---|---|---|---|---|---|---|
Cash |
3% | 14% | |||||
Equity securities: |
|||||||
Domestic |
21% | 53% | |||||
International |
60% | 7% | |||||
Debt securities |
- | 19% | |||||
Gold bullion |
16% | 7% | |||||
Total |
100% | 100% | |||||
The primary investment objective is to maximize growth of the Pension Plan assets to meet the projected obligations to the beneficiaries over a long period of time, and to do so in a manner that is consistent with the Company's earnings strength and risk tolerance. Asset allocation is the most important decision in managing the assets and it is reviewed regularly. The asset allocation policy considers the Company's financial strength and long-term asset class risk/return expectations since the obligations are long-term in nature. As of December 31, 2009, our Pension Plan assets were invested in our Asset Strategy style, and our Plan assets are managed by our in-house investment professionals.
Asset Strategy invests in the domestic or foreign market that is believed to offer the greatest probability of return or, alternatively, that provides the highest degree of safety in uncertain times. This style may allocate its assets among stocks, bonds and short-term investments and since the allocation is dynamically managed and able to take advantage of opportunities as they are presented by the market, there is not a predetermined asset allocation. Dependent on the outlook for the U.S. and global economies, our investment managers make top-down allocations among stocks, bonds, cash, precious metals and currency markets around the globe. After determining allocations, we seek the best opportunities within each market. Derivative instruments play an important role in this style's investment process, to manage risk and maximize stability of the assets in the portfolio.
At December 31, 2009, the Plan had multiple investment concentrations that are not typical of a classic pension plan, including a significant weighting of plan assets invested in equity securities, including 60% international equities, of which almost half was invested in Chinese equities. The Plan also had 16% of plan assets invested in gold bullion. During 2009, the Plan also had a significant concentration in derivative instruments.
Risk management is primarily the responsibility of the investment portfolio manager, who incorporates it with their day-to-day research and management. Although investment flexibility is essential to this style's investment process, the Plan does not invest in a number of asset classes that are commonly referred to as alternative investments, namely venture capital, private equity, direct real estate properties, timber, or oil, gas or other mineral explorations or development programs or leases. The Plan also has a number of specific guidelines that serve to manage investment risk by placing limits on net securities exposure and concentration of assets within specific companies or industries.
74
WADDELL & REED FINANCIAL, INC.
NOTES TO CONSOLIDATED FINANCIAL STATEMENTS (Continued)
December 31, 2009, 2008 and 2007
We determine the fair value of our plan assets using broad levels of inputs as defined by related accounting standards and categorized as Level 1, Level 2 or Level 3, as previously defined in Note 4. The following table summarizes our plan assets as of December 31, 2009:
| |
Level 1 | Level 2 | Level 3 | Total | |||||||||
|---|---|---|---|---|---|---|---|---|---|---|---|---|---|
| |
(in thousands) |
||||||||||||
Equity securities: |
|||||||||||||
Domestic |
$ | 20,340 | - | - | 20,340 | ||||||||
International |
6,430 | 47,663 | - | 54,093 | |||||||||
Fixed income securities: |
|||||||||||||
Foreign bonds |
- | 68 | - | 68 | |||||||||
Industrial bond |
- | 12 | - | 12 | |||||||||
Mortgage-backed security |
- | 195 | - | 195 | |||||||||
Gold bullion |
14,438 | - | - | 14,438 | |||||||||
Total investment securities |
41,208 | 47,938 | - | 89,146 | |||||||||
Cash and other |
2,405 | ||||||||||||
Total |
$ | 91,551 | |||||||||||
The international equity securities classification as Level 2 as of December 31, 2009 of $47.7 million is due to the use of fair value pricing, triggered by the Standard & Poor's 500 Index movement of more than 100 basis points on the valuation date. Without this change, international equity securities would be classified as Level 1 in the fair value hierarchy.
The following table summarizes the activity of plan assets categorized as Level 3 for the year ended December 31, 2009:
| |
Options | |||
|---|---|---|---|---|
| |
(in thousands) |
|||
Balance at December 31, 2008 |
$ | (11) | ||
Purchases, issuances and settlements |
262 | |||
Actual return on plan assets, sold during the period |
(123) | |||
Proceeds from sales |
(128) | |||
Balance at December 31, 2009 |
$ | - | ||
The 7.75% expected long-term rate of return on Pension Plan assets reflects management's expectations of long-term average rates of return on funds invested to provide for benefits included in the projected benefit obligations. The Plan expects a relatively high return because of the types of investment the portfolio incorporates, the success the portfolio managers have had with generating returns in excess of passive management in those types of investments, and the past history of returns. The ability to use a high concentration of equities, especially international equities, within the Plan's investment policy presents portfolio managers the opportunity to earn higher returns than other investment strategies that are restricted to owning lower returning assets classes. The expected return is based on the outlook for inflation, fixed income returns and equity returns, while also considering historical returns, asset allocation and investment strategy.
75
WADDELL & REED FINANCIAL, INC.
NOTES TO CONSOLIDATED FINANCIAL STATEMENTS (Continued)
December 31, 2009, 2008 and 2007
The components of net periodic pension and other postretirement costs and the assumptions related to those costs consisted of the following for the years ended December 31, 2009, 2008 and 2007:
| |
Pension Benefits | Other Postretirement Benefits |
|||||||||||||||||
|---|---|---|---|---|---|---|---|---|---|---|---|---|---|---|---|---|---|---|---|
| |
2009 | 2008 | 2007 | 2009 | 2008 | 2007 | |||||||||||||
| |
(in thousands) |
||||||||||||||||||
Components of net periodic benefit cost: |
|||||||||||||||||||
Service cost |
$ | 5,276 | 5,727 | 5,718 | 371 | 296 | 292 | ||||||||||||
Interest cost |
6,387 | 6,326 | 5,490 | 343 | 262 | 244 | |||||||||||||
Expected return on plan assets |
(6,428) | (8,614) | (6,442) | — | — | — | |||||||||||||
Actuarial (gain) loss amortization |
1,595 | — | 808 | — | (80) | (39) | |||||||||||||
Prior service cost amortization |
555 | 555 | 436 | 39 | 39 | 38 | |||||||||||||
Transition obligation amortization |
5 | 5 | 5 | — | — | — | |||||||||||||
Net periodic benefit cost |
$ | 7,390 | 3,999 | 6,015 | 753 | 517 | 535 | ||||||||||||
The estimated net loss, prior service cost and transition obligation for the Pension Plan that will be amortized from accumulated other comprehensive income into net periodic benefit cost in 2010 are $1.8 million, $555 thousand and $5 thousand, respectively. The estimated prior service cost for the postretirement medical plan that will be amortized from accumulated other comprehensive income into net periodic benefit cost in 2010 is $46 thousand.
| |
Pension Benefits | Other Postretirement Benefits |
|||||||||||||||||
|---|---|---|---|---|---|---|---|---|---|---|---|---|---|---|---|---|---|---|---|
| |
2009 | 2008 | 2007 | 2009 | 2008 | 2007 | |||||||||||||
| Weighted average assumptions used to determine net periodic benefit cost for the years ended December 31: | |||||||||||||||||||
| Discount rate | 6.75% | 6.75% | 6.00% | 6.75 | 6.75% | 6.00% | |||||||||||||
| Expected return on plan assets | 7.75% | 7.75% | 7.75% | Not applicable | |||||||||||||||
| Rate of compensation increase | (1) | 3.86% | 3.86% | Not applicable |
|||||||||||||||
- (1)
- Rate of compensation increase was 0% for 2009, 2.5% for 2010 and 3.86% for 2011 and after.
76
WADDELL & REED FINANCIAL, INC.
NOTES TO CONSOLIDATED FINANCIAL STATEMENTS (Continued)
December 31, 2009, 2008 and 2007
We expect the following benefit payments to be paid which reflect future service, as appropriate:
| |
Pension Benefits |
Other Postretirement Benefits |
||||
|---|---|---|---|---|---|---|
| |
(in thousands) |
|||||
2010 |
$ | 4,581 | 258 | |||
2011 |
7,187 | 332 | ||||
2012 |
6,971 | 388 | ||||
2013 |
7,600 | 438 | ||||
2014 |
9,806 | 447 | ||||
2015 through 2019 |
52,320 | 2,599 | ||||
|
$ | 88,465 | 4,462 | |||
Our policy with respect to funding the Pension Plan is to fund at least the minimum required by the Employee Retirement Income Security Act of 1974, as amended, and not more than the maximum amount deductible for tax purposes. All contributions made to the Pension Plan for 2009 and 2008 were voluntary. We anticipate that our 2010 contribution to our Pension Plan will be made from cash generated from operations and will be in the range from $7.0 to $10.0 million, $5.0 million of which was contributed during January 2010.
All Company contributions to other postretirement medical benefits are voluntary, as the postretirement medical plan is not funded and is not subject to any minimum regulatory funding requirements. The contributions for each year represent claims paid for medical expenses, and we anticipate making the 2010 expected contribution with cash generated from operations. Contributions by participants to the postretirement plan were $157 thousand and $162 thousand for the years ended December 31, 2009 and 2008, respectively.
For measurement purposes, the initial health care cost trend rate was 9% for 2009 and 10% for 2008 and 2007. The health care cost trend rate reflects anticipated increases in health care costs. The initial assumed growth rate of 9% for 2009 is assumed to gradually decline over the next four years to a rate of 5% in the fourth year. The effect of a 1% annual increase in assumed cost trend rates would increase the December 31, 2009 accumulated postretirement benefit obligation by approximately $612 thousand, and the aggregate of the service and interest cost components of net periodic postretirement benefit cost for the year ended December 31, 2009 by approximately $105 thousand. The effect of a 1% annual decrease in assumed cost trend rates would decrease the December 31, 2009 accumulated postretirement benefit obligation by approximately $531 thousand, and the aggregate of the service and interest cost components of net periodic postretirement benefit cost for the year ended December 31, 2009 by approximately $89 thousand.
We also sponsor the Waddell & Reed Financial, Inc. Supplemental Executive Retirement Plan, as amended and restated (the "SERP"), a non-qualified deferred compensation plan covering eligible employees. The SERP provides certain benefits for Company officers that the Pension Plan is prevented from providing because of compensation and benefit limits in the Internal Revenue Code.
The SERP was adopted to supplement the annual pension paid to certain senior executive officers. Each calendar year, the Compensation Committee of the Board of Directors (the "Compensation
77
WADDELL & REED FINANCIAL, INC.
NOTES TO CONSOLIDATED FINANCIAL STATEMENTS (Continued)
December 31, 2009, 2008 and 2007
Committee") credits participants' SERP accounts with (i) an amount equal to 4% of the executive's base salary, less the amount of the maximum employer matching contribution available under our 401(k) plan, and (ii) a non-formula award, if any, as determined by the Compensation Committee in its discretion. There were no discretionary awards made to participants during 2009. Additionally, each calendar year, participants' accounts are credited (or charged) with an amount equal to the performance of certain hypothetical or investment vehicles since the last preceding year. Upon a participant's separation, or at such other time based on a pre-existing election by a participant, benefits accumulated under the SERP are payable in installments or in a lump sum. As of December 31, 2009 and 2008, the aggregate liability to participants was $3.6 million and $3.5 million, respectively.
At December 31, 2009, the accrued pension and postretirement liability recorded on the balance sheet was comprised of accrued pension costs of $19.4 million, a liability for postretirement benefits in the amount of $5.7 million and an accrued liability for SERP benefits of $3.6 million. The current portion of postretirement liability of $0.3 million is included in other current liabilities on the balance sheet. At December 31, 2008, the accrued pension and postretirement liability recorded on the balance sheet was comprised of accrued pension costs of $20.6 million, an accrued liability for SERP benefits of $3.5 million and a liability for postretirement benefits in the amount of $5.0 million. The current portion of postretirement liability of $0.3 million is included in other current liabilities on the balance sheet.
12. Employee Savings Plan
We sponsor a defined contribution plan that qualifies under Section 401(k) of the Internal Revenue Code to provide retirement benefits to substantially all of our employees following the completion of an eligibility period. As allowed under Section 401(k), the plan provides tax-deferred salary deductions for eligible employees. Our matching contributions to the plan for the years ended December 31, 2009, 2008 and 2007 were $1.6 million, $4.0 million and $3.7 million, respectively.
13. Stockholders' Equity
Earnings per Share
For the years ended December 31, 2009, 2008 and 2007, earnings per share were computed as follows:
| |
2009 | 2008 | 2007 | |||||||
|---|---|---|---|---|---|---|---|---|---|---|
| |
(in thousands, except per share amounts) |
|||||||||
Net income |
$ | 105,505 | 96,163 | 125,497 | ||||||
Weighted average shares outstanding — basic |
85,484 | 85,761 | 83,975 | |||||||
Dilutive potential shares from stock options |
60 | 352 | 724 | |||||||
Weighted average shares outstanding — diluted |
85,544 | 86,113 | 84,699 | |||||||
Earnings per share: |
||||||||||
Basic |
$ | 1.23 | 1.12 | 1.49 | ||||||
Diluted |
$ | 1.23 | 1.12 | 1.48 | ||||||
Effective January 1, 2009, we adopted "Earnings Per Share Topic," ASC 260. This standard provides that unvested share-based payment awards that contain nonforfeitable rights to dividends are considered to be participating securities and must be included in the computation of earnings per share pursuant to the two-class method. As required upon adoption, we retrospectively adjusted prior year earnings per
78
WADDELL & REED FINANCIAL, INC.
NOTES TO CONSOLIDATED FINANCIAL STATEMENTS (Continued)
December 31, 2009, 2008 and 2007
share data to conform to the provisions of this standard. Stock options are included in the calculation of diluted earnings per share using the treasury stock method.
Anti-dilutive Securities
Options to purchase 777 thousand shares, 688 thousand shares and 659 thousand shares of Class A common stock ("common stock") were excluded from the diluted earnings per share calculation for years ended December 31, 2009, 2008 and 2007, respectively, because they were anti-dilutive.
Dividends
We declared dividends on our common stock of $0.76 per share, $0.76 per share and $0.68 per share for the years ended December 31, 2009, 2008 and 2007, respectively. As of December 31, 2009 and 2008, other current liabilities included $16.3 million and $16.1 million, respectively, for dividends payable to stockholders.
Common Stock Repurchases
The Board of Directors has authorized the repurchase of our common stock in the open market and/or private purchases. The acquired shares may be used for corporate purposes, including shares issued to employees in our stock-based compensation programs. There were 1,870,034 shares, 3,779,953 shares and 2,584,216 shares repurchased in the open market or privately during the years ended December 31, 2009, 2008 and 2007, respectively, which includes 327,301 shares, 430,145 shares and 234,162 shares repurchased from employees who elected to tender shares to cover their minimum tax withholdings with respect to vesting of stock awards during the years ended December 31, 2009, 2008 and 2007, respectively.
14. Share-Based Compensation
The Company has three stock-based compensation plans: the Company 1998 Stock Incentive Plan, as amended and restated (the "SI Plan"), the Company 1998 Executive Stock Award Plan, as amended and restated (the "ESA Plan") and the Company 1998 Non-Employee Director Stock Award Plan, as amended and restated (the "NED Plan") (collectively, the "Stock Plans").
The SI Plan allows us to grant equity compensation awards, including, among other awards, non-qualified stock options and nonvested stock as part of our overall compensation program to attract and retain key personnel and encourage a greater personal financial investment in the Company. All of the Stock Plans also allow us to grant non-qualified stock options and/or nonvested stock to promote the long-term growth of the Company. A maximum of 30,000,000 shares of common stock are authorized for issuance under the SI Plan. A maximum of 3,750,000 and 1,200,000 shares of common stock are authorized for issuance under the ESA Plan and NED Plan, respectively. In total, 11,834,808 shares of common stock are available for issuance as of December 31, 2009 under these plans. In addition, we make incentive payments under the Company 2003 Executive Incentive Plan, as amended and restated (the "EIP") in the form of cash, stock options, nonvested stock or a combination thereof. Incentive awards paid under the EIP in the form of stock options or nonvested stock are issued out of shares reserved for issuance under the SI and ESA Plans. Generally, shares of common stock covered by terminated, surrendered or cancelled options, by forfeited nonvested stock, or by the forfeiture of other awards that do not result in issuance of shares of common stock are again available for awards under the plan from which they were terminated, surrendered, cancelled or forfeited.
79
WADDELL & REED FINANCIAL, INC.
NOTES TO CONSOLIDATED FINANCIAL STATEMENTS (Continued)
December 31, 2009, 2008 and 2007
Under our Stock Plans, the exercise price of a stock option is equal to the closing market price of Company common stock on the date of grant. The maximum term of non-qualified options granted under the SI Plan is ten years and two days and the options generally vest in 331/3% increments on the second, third and fourth anniversaries of the grant date. The maximum term of non-qualified options granted under the ESA Plan and NED Plan is 11 years and the options generally vest 10% each year, beginning on the first anniversary of the grant date. Our Stock Plans include a Stock Option Restoration Program feature (the "SORP") that allows, on the first trading day of August, a holder to pay the exercise price on vested in-the-money options by surrendering common stock of the Company that has been owned for at least six months. This feature also permits a holder exercising an option to be granted new options in an amount equal to the number of common shares used to satisfy both the exercise price and withholding taxes due upon exercise. New options are granted with an expiration date equal to that of the original option and vest six months after the grant date. The SORP results in a net issuance of shares of common stock and fewer stock options outstanding. We receive a current income tax benefit for stock option exercises.
Nonvested stock awards are valued on the date of grant, have no purchase price and generally vest over four years in 331/3% increments on the second, third and fourth anniversaries of the grant date. The Company also issues nonvested stock awards to our financial advisors (our sales force) who are independent contractors. These awards have the same terms as awards issued to employees; however, changes in the Company's share price result in variable compensation expense over the vesting period. Under the Stock Plans, nonvested shares are forfeited upon the termination of employment with the Company or service on the Board, dependent upon the circumstances of termination. Except for restrictions placed on the transferability of nonvested stock, holders of nonvested stock have full stockholders' rights during the term of restriction, including voting rights and the rights to receive cash dividends.
- (a)
- Stock Options
A summary of stock option activity and related information for the year ended December 31, 2009 follows:
| |
Options | Weighted average exercise price |
Weighted average remaining contractual term (in years) |
||||||
|---|---|---|---|---|---|---|---|---|---|
Outstanding at December 31, 2008 |
2,021,844 | $ | 23.44 | 1.40 | |||||
Granted |
— | — | |||||||
Exercised |
(831,600) | 17.00 | |||||||
Granted in restoration |
6,502 | 28.01 | |||||||
Exercised in restoration |
(6,793) | 26.76 | |||||||
Terminated/Canceled |
(292,450) | 19.66 | |||||||
Outstanding at December 31, 2009 |
897,503 | $ | 30.65 | 1.12 | |||||
Exercisable at December 31, 2009 |
891,802 | $ | 30.67 | 1.12 | |||||
80
WADDELL & REED FINANCIAL, INC.
NOTES TO CONSOLIDATED FINANCIAL STATEMENTS (Continued)
December 31, 2009, 2008 and 2007
The aggregate intrinsic value of outstanding options and exercisable options as of December 31, 2009 was $1.6 million. The total intrinsic value (on date of exercise) of options exercised during the years ended December 31, 2009, 2008 and 2007 was $7.3 million, $9.4 million and $31.9 million, respectively. The related income tax benefit recognized was $2.5 million, $3.3 million and $11.6 million for the years ended December 31, 2009, 2008 and 2007, respectively.
SORP options with vesting periods of six months were the only options granted during 2009, 2008 and 2007. Compensation expense related to options issued under the SORP of $90 thousand, $217 thousand and $19 thousand was recorded for the years ended December 31, 2009, 2008 and 2007, respectively.
The weighted average fair value of options granted during the years ended December 31, 2009, 2008 and 2007 were $8.68, $5.47 and $2.76, respectively. The grant date fair value of options granted has been calculated using a Black-Scholes option-pricing model with assumptions as follows:
| |
2009 | 2008 | 2007 | ||||||
|---|---|---|---|---|---|---|---|---|---|
Dividend yield |
2.71% | 2.24% | 2.70% | ||||||
Risk-free interest rate |
0.88% | 2.05% | 4.57% | ||||||
Expected volatility |
64.90% | 32.10% | 24.50% | ||||||
Expected life (in years) |
1.79 | 1.89 | 1.21 | ||||||
- (b)
- Nonvested Stock
A summary of nonvested share activity and related fair value for the year ended December 31, 2009 follows:
| |
Nonvested Stock Shares | Weighted Average Grant Date Fair Value | ||||
|---|---|---|---|---|---|---|
Nonvested at December 31, 2008 |
3,562,598 | $ | 25.92 | |||
Granted |
1,990,060 | 21.24 | ||||
Vested |
(1,094,007) | 23.60 | ||||
Forfeited |
(22,807) | 23.42 | ||||
Nonvested at December 31, 2009 |
4,435,844 | $ | 24.40 | |||
For the years ended December 31, 2009, 2008 and 2007, compensation expense related to nonvested stock totaled $30.5 million, $29.0 million and $23.7 million, respectively. In 2009, we also recognized compensation expense of $400 thousand related to nonvested stock that was immediately vested for employees in connection with the divestiture of our investment in ACF. These costs are included in general and administrative expenses in the consolidated statement of income. In 2008, we recognized $795 thousand related to nonvested stock that was immediately vested under the voluntary separation program, discussed in Note 7 and included in general and administrative expense in the consolidated statement of income.
The related income tax benefit was $11.2 million, $10.5 million and $8.6 million for the years ended December 31, 2009, 2008 and 2007, respectively, which may be recognized upon vesting. As of
81
WADDELL & REED FINANCIAL, INC.
NOTES TO CONSOLIDATED FINANCIAL STATEMENTS (Continued)
December 31, 2009, 2008 and 2007
December 31, 2009, the remaining unamortized expense of $73.0 million is expected to be recognized over a weighted average period of 2.5 years.
The total fair value of shares vested (at vest date) during the years ended December 31, 2009, 2008 and 2007 was $23.3 million, $40.0 million and $21.0 million, respectively. The Company permits employees the right to tender a portion of their vested shares to the Company to satisfy the minimum tax withholding obligations of the Company with respect to vesting of the shares. During 2010, we expect to repurchase approximately 435,000 shares from employees who elect to tender shares to cover their minimum tax withholdings.
For nonvested stock awards granted prior to the adoption of "Compensation — Stock Compensation Topic," ASC 718, the Company will continue to recognize compensation expense over the contractual vesting period. Had compensation expense for nonvested stock awards issued prior to January 1, 2006 been determined based on the date a participant first becomes eligible for retirement, the Company's net income would have been increased by $66 thousand for the year ended December 31, 2009, increased by $372 thousand for the year ended December 31, 2008 and decreased by $45 thousand for the year ended December 31, 2007.
15. Uniform Net Capital Rule Requirements
Three of our subsidiaries, Waddell & Reed, Inc. ("W&R"), Legend Equities Corporation ("LEC"), and Ivy Funds Distributor, Inc. ("IFDI") are registered broker/dealers and members of the Financial Industry Regulatory Authority. Broker/dealers are subject to the SEC's Uniform Net Capital Rule (Rule 15c3-1), which requires the maintenance of minimum net capital and requires that the ratio of aggregate indebtedness to net capital, both as defined, shall not exceed 15.0 to 1.0. The primary difference between net capital and stockholders' equity is the non-allowable assets that are excluded from net capital.
A broker/dealer may elect not to be subject to the Aggregate Indebtedness Standard of paragraph (a)(1)(i) of Rule 15c3-1, in which case net capital must exceed the greater of $250 thousand or 2% of aggregate debit items computed in accordance with the Formula for Determination of Reserve Requirements for broker/dealers. W&R made this election and thus is not subject to the aggregate indebtedness ratio as of December 31, 2009 or 2008.
Net capital and aggregated indebtedness information for our broker/dealer subsidiaries is presented in the following table as of December 31, 2009 and 2008 (in thousands):
| |
2009 | 2008 | ||||||||||||||||
|---|---|---|---|---|---|---|---|---|---|---|---|---|---|---|---|---|---|---|
| |
W&R | LEC | IFDI | W&R | LEC | IFDI | ||||||||||||
Net capital |
$ | 21,579 | 1,948 | 17,093 | 7,494 | 2,148 | 25,108 | |||||||||||
Required capital |
250 | 229 | 2,089 | 250 | 172 | 1,298 | ||||||||||||
Excess of required capital |
$ | 21,329 | 1,719 | 15,004 | 7,244 | 1,976 | 23,810 | |||||||||||
Ratio of aggregate indebtedness to net capital |
Not applicable |
1.76 to 1.0 | 1.83 to 1.0 | Not applicable |
1.20 to 1.0 | 0.78 to 1.0 | ||||||||||||
82
WADDELL & REED FINANCIAL, INC.
NOTES TO CONSOLIDATED FINANCIAL STATEMENTS (Continued)
December 31, 2009, 2008 and 2007
16. Rental Expense and Lease Commitments
We lease our home office buildings, certain sales and other office space and equipment under long-term operating leases. Rent expense was $22.0 million, $20.1 million and $18.6 million, for the years ended December 31, 2009, 2008 and 2007, respectively. Future minimum rental commitments under non-cancelable operating leases are as follows (in thousands):
2010 |
$ | 18,440 | |
2011 |
15,738 | ||
2012 |
13,245 | ||
2013 |
8,594 | ||
2014 |
5,424 | ||
Thereafter |
11,393 | ||
|
$ | 72,834 | |
New leases are expected to be executed as existing leases expire. Thus, future minimum lease commitments are not expected to be less than those in 2009.
17. Related Party Transactions
We earn investment management fees from the Funds for which we also act as an investment adviser, pursuant to an investment management agreement with each Fund. In addition, we have agreements with the Funds pursuant to Rule 12b-1 under the Investment Company Act of 1940, as amended, pursuant to which distribution and service fees are collected from the Funds for distribution of mutual fund shares, for costs such as advertising and commissions paid to broker/dealers, and for providing ongoing services to shareholders of the Funds and/or maintaining shareholder accounts. We also earn service fee revenues by providing various services to the Funds and their shareholders pursuant to a shareholder servicing agreement with each Fund (except the Ivy Funds VIP) and an accounting service agreement with each Fund. Certain of our officers and directors are also officers, directors and/or trustees for the various Funds for which we act as an investment adviser. These agreements are approved or renewed on an annual basis by each Fund's board of directors/trustees, including a majority of the disinterested members. Funds and separate accounts receivable includes amounts due from the Funds for aforementioned services.
18. Contingencies
The Company is involved from time to time in various legal proceedings, regulatory investigations and claims incident to the normal conduct of business, which may include proceedings that are specific to us and others generally applicable to the business practices within the industries in which we operate. A substantial legal liability or a significant regulatory action against us could have an adverse effect on our business, financial condition and on the results of operations in a particular quarter or year.
Michael E. Taylor, Kenneth B. Young, individuals, on behalf of themselves individually and on behalf of others similarly situated v. Waddell & Reed, Inc., a Delaware Corporation; Waddell & Reed Financial, Inc., a Delaware Corporation; Waddell & Reed Development, Inc., a Delaware Corporation; Waddell & Reed Financial Advisors, a fictitious business name; and DOES 1 through 10 inclusive; Case No. 09-CV-2909 DMS WVG; in the United States District Court for the Southern District of California.
In an action filed December 28, 2009, the Company, along with various of its affiliates, were sued in an individual action, class action and Fair Labor Standards Act ("FLSA") nationwide collective action by two
83
WADDELL & REED FINANCIAL, INC.
NOTES TO CONSOLIDATED FINANCIAL STATEMENTS (Continued)
December 31, 2009, 2008 and 2007
former advisors asserting misclassification of financial advisers as independent contractors. Plaintiffs assert claims under the FLSA for minimum wages and overtime wages, and under California Labor Code Statutes for timely pay wages, minimum wages, overtime compensation, meal periods, reimbursement of losses and business expenses and itemized wage statements and a claim for Unfair Business Practices under §17200 of the California Business & Professions Code. Plaintiffs seek declaratory and injunctive relief and monetary damages. As yet, no responsive pleading has been filed, but the Company intends to vigorously contest plaintiffs' claims.
In the opinion of management, the ultimate resolution and outcome of this matter is uncertain. At this stage of the litigation, the Company is unable to estimate the expense or exposure, if any, that it may represent. The ultimate resolution of this matter, or an adverse determination against the Company, could have a material adverse impact on the financial position and results of operations of the Company. However, this possible impact is unknown and not reasonably determinable; therefore, no liability has been recorded in the consolidated financial statements.
19. Selected Quarterly Information (Unaudited)
| |
Quarter | ||||||||||||||
|---|---|---|---|---|---|---|---|---|---|---|---|---|---|---|---|
| |
First | Second | Third | Fourth | |||||||||||
| |
(in thousands) |
||||||||||||||
2009 |
|||||||||||||||
Total revenues |
$ | 176,672 | 199,628 | 217,976 | 244,813 | ||||||||||
Net income |
15,466 | (1) | 23,374 | (2) | 33,413 | (3) | 33,252 | ||||||||
Earnings per share: |
|||||||||||||||
Basic |
$ | 0.18 | 0.27 | 0.39 | 0.39 | ||||||||||
Diluted |
$ | 0.18 | 0.27 | 0.39 | 0.39 | ||||||||||
| |
Quarter | ||||||||||||||
|---|---|---|---|---|---|---|---|---|---|---|---|---|---|---|---|
| |
First | Second | Third | Fourth | |||||||||||
| |
(in thousands) |
||||||||||||||
2008 |
|||||||||||||||
Total revenues |
$ | 234,069 | 252,783 | 241,224 | 191,044 | ||||||||||
Net income |
28,341 | 35,187 | 33,365 | (730) | (4) | ||||||||||
Earnings per share: |
|||||||||||||||
Basic |
$ | 0.33 | 0.41 | 0.39 | (0.01) | ||||||||||
Diluted |
$ | 0.33 | 0.40 | 0.39 | (0.01) | ||||||||||
- (1)
- Includes
a pre-tax charge of $3.7 million ($2.3 million net of tax) to reflect the "other than temporary" decline in value of
certain of the Company's investments in affiliated mutual funds as the fair value of these investments had been below cost for an extended period.
- (2)
- Includes
a pre-tax charge of $548 thousand ($395 thousand net of tax) for severance and other transaction costs in connection with
the divestiture of our investment in ACF.
- (3)
- Includes a pre-tax charge of $543 thousand ($423 thousand net of tax) for severance and other transaction costs in connection with the divestiture of our investment in ACF; and tax benefits of
84
WADDELL & REED FINANCIAL, INC.
NOTES TO CONSOLIDATED FINANCIAL STATEMENTS (Continued)
December 31, 2009, 2008 and 2007
$1.6 million related to carrying back a portion of the capital loss generated by the divestiture of our investment in ACF to fully offset capital gains generated during the three year carryback period.
- (4)
- Includes a pre-tax charge of $16.5 million ($10.5 million net of tax) for restructuring charges consisting primarily of severance costs associated with our voluntary separation program as well as costs associated with terminating various projects under development; a charge of $7.2 million (not deductible for income tax purposes) to recognize the impairment of goodwill associated with ACF; additional amortization of our deferred sales commission asset of $6.5 million ($4.1 million net of tax) due to significant asset redemption activity and our review of the recoverability of our deferred sales commission asset; and a pre-tax charge of $2.1 million ($1.4 million net of tax) related to the settlement of miscellaneous litigation and other matters. These charges were offset by the reversal of bonus accruals of $7.9 million ($5.1 million net of tax) to reflect lower annual awards.
85
WADDELL & REED FINANCIAL, INC.
Index to Exhibits
| Exhibit No. |
Exhibit Description | |
|---|---|---|
| 3.1 | Restated Certificate of Incorporation of Waddell & Reed Financial, Inc. Filed as Exhibit 3.1 to the Company's Quarterly Report on Form 10-Q, File No. 333-43687, for the quarter ended June 30, 2006 and incorporated herein by reference. | |
3.2 |
Amended and Restated Bylaws of Waddell & Reed Financial, Inc. Filed as Exhibit 3.1 to the Company's Current Report on Form 8-K, File No. 333-43687, filed September 17, 2008 and incorporated herein by reference. |
|
4.1 |
Specimen of Class A Common Stock Certificate, par value $0.01 per share. Filed as Exhibit 4.1 to the Company's Registration Statement on Form S-1/A, File No. 333-43687, on February 27, 1998 and incorporated herein by reference. |
|
4.2 |
Certificate of Designation, Preferences and Rights of Series B Junior Participating Preferred Stock of Waddell & Reed Financial, Inc., as filed on April 9, 2009 with the Secretary of State of the State of Delaware. Filed as Exhibit 4.1 to the Company's Current Report on Form 8-K, File No. 333-43687, on April 10, 2009 and incorporated herein by reference. |
|
4.3 |
Rights Agreement, dated as of April 28, 1999, by and between Waddell & Reed Financial, Inc. and Computershare Trust Company, N.A., as successor to First Chicago Trust Company of New York, which includes the Certificate of Designation, Preferences and Rights of Series A Junior Participating Preferred Stock of the Company, as filed on May 13, 1999 with the Secretary of State of Delaware, as Exhibit A and the form of Rights Certificate as Exhibit B. Filed as Exhibit 4 to the Company's Quarterly Report on Form 10-Q, File No. 001-13913, for the quarter ended June 30, 1999 and incorporated herein by reference. |
|
4.4 |
First Amendment to Rights Agreement, dated as of February 14, 2001, by and between Waddell & Reed Financial, Inc. and Computershare Trust Company, N.A., as successor to First Chicago Trust Company of New York. Filed as Exhibit 4.4 to the Company's Annual Report on Form 10-K, File No. 001-13913, for the year ended December 31, 2000 and incorporated herein by reference. |
|
4.5 |
Rights Agreement, dated as of April 8, 2009, by and between Waddell & Reed Financial, Inc. and Computershare Trust Company, N.A., which includes the Certificate of Designation, Preferences and Rights of Series A Junior Participating Preferred Stock of the Company, as filed on April 9, 2009 with the Secretary of State of Delaware, as Exhibit A and the form of Rights Certificate as Exhibit B. Filed as Exhibit 4.2 to the Company's Current Report on Form 8-K, File No. 333-43687, on April 10, 2009 and incorporated herein by reference. |
|
4.6 |
Indenture, dated as of January 18, 2001, by and between Waddell & Reed Financial, Inc. and The Bank of New York Mellon Trust Company, National Association, as successor in interest to JPMorgan Chase Bank, National Association. Filed as Exhibit 4.1(a) to the Company's Current Report on Form 8-K, File No. 001-13913, on February 5, 2001 and incorporated herein by reference. |
86
WADDELL & REED FINANCIAL, INC.
Index to Exhibits
| Exhibit No. |
Exhibit Description | |
|---|---|---|
| 4.7 | First Supplemental Indenture, dated as of January 18, 2001 by and between Waddell & Reed Financial, Inc. and The Bank of New York Mellon Trust Company, National Association, as successor in interest to JPMorgan Chase Bank, National Association, including the form of the 7.50% notes due January 2006 as Exhibit A. Filed as Exhibits 4.1(b) and 4.2 to the Company's Current Report on Form 8-K, File No. 333-43687, on February 5, 2001 and incorporated herein by reference. | |
4.8 |
Second Supplemental Indenture, dated as of January 13, 2006, between Waddell & Reed Financial, Inc. and The Bank of New York Mellon Trust Company, National Association, as successor in interest to JP Morgan Trust Company, National Association, as trustee, and the form of the Global Note for the Company's 5.60% Notes due 2011 as Exhibit A. Filed as Exhibits 4.1 and 4.2 to the Company's Current Report on Form 8-K, File No. 333-43687, on January 13, 2006 and incorporated herein by reference. |
|
4.9 |
Form of Indenture to be used in connection with the issuance of the Subordinated Debt Securities. Filed as Exhibit 4.7 to the Company's Form S-3/A, File No. 333-43682, on September 7, 2000 and incorporated herein by reference. |
|
10.1 |
General Agent Contract, dated as of October 20, 2000, by and among Nationwide Life Insurance Company, Nationwide Life and Annuity Insurance Company and Waddell & Reed, Inc. and its affiliated insurance companies. Filed as Exhibit 10.5 to the Company's Annual Report on Form 10-K, File No. 001-13913, for the year ended December 31, 2000 and incorporated herein by reference. |
|
10.2 |
Administrative Services Agreement, dated as of October 20, 2008, by and among Nationwide Life Insurance Company, Nationwide Life and Annuity Insurance Company and Waddell & Reed, Inc. and its affiliated insurance companies. Filed as Exhibit 10.2 to the Company's Annual Report on Form 10-K, File No. 333-43687, for the year ended December 31, 2008 and incorporated herein by reference. |
|
10.3 |
Fund Participation Agreement, dated as of December 1, 2000, by and among Nationwide Life Insurance Company and/or Nationwide Life and Annuity Insurance Company, Waddell & Reed Services Company and Waddell & Reed, Inc. Filed as Exhibit 10.6 to the Company's Annual Report on Form 10-K, File No. 001-13913, for the year ended December 31, 2000 and incorporated herein by reference. |
|
10.4 |
Fund Participation Agreement, dated as of September 19, 2003, by and among Minnesota Life Insurance Company, Waddell & Reed, Inc. and Ivy Funds VIP. Filed as Exhibit 10.3 to the Company's Annual Report on Form 10-K, File No. 333-43687, for the year ended December 31, 2007 and incorporated herein by reference. |
87
WADDELL & REED FINANCIAL, INC.
Index to Exhibits
| Exhibit No. |
Exhibit Description | |
|---|---|---|
| 10.5 | Variable Products Distribution Agreement, dated as of December 12, 2003, by and among Minnesota Life Insurance Company, Securian Financial Services, Inc. and Waddell & Reed, Inc. and its affiliated insurance companies. Filed as Exhibit 10.4 to the Company's Annual Report on Form 10-K, File No. 333-43687, for the year ended December 31, 2004 and incorporated herein by reference. | |
10.6 |
Waddell & Reed Financial, Inc. 1998 Stock Incentive Plan, as amended and restated. Filed as Exhibit 10.6 to the Company's Annual Report on Form 10-K, File No. 333-43687, for the year ended December 31, 2008 and incorporated herein by reference.* |
|
10.7 |
Waddell & Reed Financial, Inc. 1998 Executive Stock Award Plan, as amended and restated. Filed as Exhibit 10.2 to the Company's Quarterly Report on Form 10-Q, File No. 333-43687, for the quarter ended September 30, 2005 and incorporated herein by reference.* |
|
10.8 |
Waddell & Reed Financial, Inc. 1998 Non-Employee Director Stock Award Plan, as amended and restated. Filed as Exhibit 10.3 to the Company's Quarterly Report on Form 10-Q, File No. 333-43687, for the quarter ended September 30, 2005 and incorporated herein by reference.* |
|
10.9 |
Credit Agreement, dated as of October 6, 2008, by and among Waddell & Reed Financial, Inc., the Lenders, Bank of America, N.A. and Bank of America Securities LLC. Filed as Exhibit 10.1 to the Company's Current Report on Form 8-K, File No. 333-43687, on October 6, 2008 and incorporated herein by reference. |
|
10.10 |
Credit Agreement, dated as of October 5, 2009, by and among Waddell & Reed Financial, Inc., the Lenders, Bank of America, N.A. and Bank of America Securities LLC. Filed as Exhibit 10.1 to the Company's Current Report on Form 8-K, File No. 333-43687, on October 7, 2009 and incorporated herein by reference. |
|
10.11 |
Fixed Rate Promissory Note for Multiple Loans, dated as of August 15, 2000, by and between Waddell & Reed Financial, Inc. and Chase Manhattan Bank. Filed as Exhibit 10.15 to the Company's Annual Report on Form 10-K, File No. 001-13913, for the year ended December 31, 2000 and incorporated herein by reference. |
|
10.12 |
Waddell & Reed Financial, Inc. Supplemental Executive Retirement Plan, as amended and restated. Filed as Exhibit 10.11 to the Company's Annual Report on Form 10-K, File No. 333-43687, for the year ended December 31, 2008 and incorporated herein by reference.* |
|
10.13 |
Waddell & Reed Financial, Inc. 2003 Executive Incentive Plan, as amended and restated. Filed as Exhibit 10.1 to the Company's Current Report on Form 8-K, File No. 333-43687, on April 11, 2008 incorporated herein by reference.* |
88
WADDELL & REED FINANCIAL, INC.
Index to Exhibits
| Exhibit No. |
Exhibit Description | |
|---|---|---|
| 10.14 | Form of Accounting Services Agreement, amended and restated as of July 1, 2003, by and between the Funds and Waddell & Reed Services Company. Filed as Exhibit 10.12 to the Company's Annual Report on Form 10-K, File No. 333-43687, for the year ended December 31, 2007 and incorporated herein by reference. | |
10.15 |
Accounting Services Agreement, dated January 30, 2009, by and between the Advisors Funds and Waddell & Reed Services Company. |
|
10.16 |
Accounting and Administrative Services Agreement, dated August 25, 2004, as amended February 13, 2008, by and between the Ivy Funds portfolios and Waddell & Reed Services Company. |
|
10.17 |
Accounting and Administrative Services Agreement, dated November 29, 2006, by and between the Ivy Funds portfolios and Waddell & Reed Services Company. |
|
10.18 |
Accounting and Administrative Services Agreement, dated August 25, 2004, as amended May 31, 2009, by and between Ivy Funds, Inc. and Waddell & Reed Services Company. |
|
10.19 |
Accounting Services Agreement, dated April 30, 2009, by and between Ivy Funds VIP and Waddell & Reed Services Company. |
|
10.20 |
Form of Investment Management Agreement, amended and restated as of November 9, 2005, by and between each of the Advisors Funds and Waddell & Reed Investment Management Company. Filed as Exhibit 10.13 to the Company's Annual Report on Form 10-K, File No. 333-43687, for the year ended December 31, 2007 and incorporated herein by reference. |
|
10.21 |
Investment Management Agreement, dated January 30, 2009, by and between the Advisors Funds and Waddell & Reed Investment Management Company. |
|
10.22 |
Investment Management Agreement, dated April 9, 2003, as amended February 13, 2008, by and between the Ivy Funds portfolios and Ivy Investment Management Company. |
|
10.23 |
Investment Management Agreement, dated July 23, 2003, as amended November 12, 2008, by and between the Ivy Funds portfolios and Ivy Investment Management Company. |
|
10.24 |
Investment Management Agreement, dated August 31, 1992, as amended May 15, 2009, by and between Ivy Funds, Inc. and Waddell & Reed Investment Management Company and assigned to Ivy Investment Management Company. |
|
10.25 |
Investment Management Agreement, amended as of November 9, 2005, by and between Ivy Funds VIP and Waddell & Reed, Inc., assigned to Waddell & Reed Investment Management Company. Filed as Exhibit 10.15 to the Company's Annual Report on Form 10-K, File No. 333-43687, for the year ended December 31, 2007 and incorporated herein by reference. |
89
WADDELL & REED FINANCIAL, INC.
Index to Exhibits
| Exhibit No. |
Exhibit Description | |
|---|---|---|
| 10.26 | Investment Management Agreement, dated April 10, 2009, by and between Ivy Funds VIP and Waddell & Reed Investment Management Company. | |
10.27 |
Investment Management Agreement, dated April 10, 2009, by and between Ivy Funds VIP and Waddell & Reed Investment Management Company. |
|
10.28 |
Form of Shareholder Servicing Agreement, amended as of August 22, 2001, by and between each of the Advisors Funds or the Ivy Funds and Waddell & Reed Services Company. Filed as Exhibit 10.16 to the Company's Annual Report on Form 10-K, File No. 333-43687, for the year ended December 31, 2007 and incorporated herein by reference. |
|
10.29 |
Shareholder Servicing Agreement, dated January 30, 2009, by and between the Advisors Funds and Waddell & Reed Services Company. |
|
10.30 |
Shareholder Servicing Agreement, dated April 9, 2003, as amended May 31, 2009, by and between the Ivy Funds portfolios and Waddell & Reed Services Company. |
|
10.31 |
Shareholder Servicing Agreement, dated April 1, 1996, as amended May 31, 2009, by and between Ivy Funds, Inc. and Waddell & Reed Services Company. |
|
10.32 |
Form of Underwriting Agreement, by and between each of the Advisors Funds and Waddell & Reed, Inc. Filed as Exhibit 10.35 to the Company's Annual Report on Form 10-K, File No. 001-13913, for the year ended December 31, 1998 and incorporated herein by reference. |
|
10.33 |
Form of Amendment to Underwriting Agreement, dated July 24, 2002, by and between each of the Advisors Funds and Waddell & Reed, Inc. Filed as Exhibit 10.18 to the Company's Annual Report on Form 10-K, File No. 333-43687, for the year ended December 31, 2007 and incorporated herein by reference. |
|
10.34 |
Underwriting Agreement, dated January 30, 2009, by and between the Advisors Funds and Waddell & Reed, Inc. |
|
10.35 |
Underwriting Agreement, dated April 15, 2009, by and between Ivy Funds VIP and Waddell & Reed, Inc. |
|
10.36 |
Distribution Agreement, amended and restated as of September 3, 2003, by and between Ivy Funds, Inc. and Waddell & Reed, Inc., assigned to Ivy Funds Distributor, Inc. Filed as Exhibit 10.19 to the Company's Annual Report on Form 10-K, File No. 333-43687, for the year ended December 31, 2007 and incorporated herein by reference. |
|
10.37 |
Distribution Agreement, dated September 3, 2003, by and between the Ivy Funds portfolios and Ivy Funds Distributor, Inc. |
90
WADDELL & REED FINANCIAL, INC.
Index to Exhibits
| Exhibit No. |
Exhibit Description | |
|---|---|---|
| 10.38 | Form of Distribution and Service Plan, amended and restated as of November 29, 2006, by and between each of the Advisors Funds or Ivy Funds and Waddell & Reed, Inc. or Ivy Funds Distributor, Inc., respectively. Filed as Exhibit 10.20 to the Company's Annual Report on Form 10-K, File No. 333-43687, for the year ended December 31, 2007 and incorporated herein by reference. | |
10.39 |
Distribution and Service Plan, effective January 30, 2009, for the Advisors Funds Class A shares. |
|
10.40 |
Distribution and Service Plan, effective January 30, 2009, for the Advisors Funds Class B shares. |
|
10.41 |
Distribution and Service Plan, effective January 30, 2009, for the Advisors Funds Class C shares. |
|
10.42 |
Distribution and Service Plan, dated November 29, 2006, as amended November 12, 2008, for the Ivy Funds portfolios Class A, Class B, Class C, Class E, and Class Y Shares. |
|
10.43 |
Distribution and Service Plan, dated November 14, 2007, for the Ivy Funds portfolios Class A, Class B, Class C, Class E, Class R and Class Y Shares. |
|
10.44 |
Distribution and Service Plan, amended and restated May 18, 2009, for Ivy Funds, Inc. Class A, Class B, Class C, Class E, Class R and Class Y Shares. |
|
10.45 |
Service Plan, revised as of May 16, 2001, by and between Ivy Funds VIP and Waddell & Reed, Inc. Filed as Exhibit 10.21 to the Company's Annual Report on Form 10-K, File No. 333-43687, for the year ended December 31, 2007 and incorporated herein by reference. |
|
10.46 |
Ivy Funds VIP Service Plan, dated April 30, 2009. |
|
10.47 |
Master Business Management and Investment Advisory Agreement, dated December 31, 2002, as amended August 26, 2009, by and between the Ivy Funds portfolios and Ivy Investment Management Company (formerly, Waddell & Reed Ivy Investment Company). |
|
10.48 |
Administrative Agreement, dated as of March 9, 2001, by and among W&R Insurance Agency, Inc., Waddell & Reed, Inc., BISYS Insurance Services, Inc. and Underwriters Equity Corp. Filed as Exhibit 10.28 to the Company's Annual Report on Form 10-K, File No. 333-43687, for the year ended December 31, 2001 and incorporated herein by reference. |
|
10.49 |
Consulting Agreement, dated May 25, 2005, by and between Waddell & Reed Financial, Inc. and Keith A. Tucker. Filed as Exhibit 10.1 to the Company's Current Report on Form 8-K, File No. 333-43687, on May 26, 2005 and incorporated herein by reference. |
91
WADDELL & REED FINANCIAL, INC.
Index to Exhibits
| Exhibit No. |
Exhibit Description | |
|---|---|---|
| 10.50 | Form of Change in Control Employment Agreement, dated December 14, 2001, by and between Henry J. Herrmann and Waddell & Reed Financial, Inc. Filed as Exhibit 10.30 to the Company's Annual Report on Form 10-K, File No. 333-43687, for the year ended December 31, 2001 and incorporated herein by reference.* | |
10.51 |
First Amendment to Change in Control Employment Agreement, dated December 17, 2008, by and between Henry J. Herrmann and Waddell & Reed Financial, Inc. Filed as Exhibit 10.26 to the Company's Annual Report on Form 10-K, File No. 333-43687, for the year ended December 31, 2008 and incorporated herein by reference.* |
|
10.52 |
Second Amendment to Change in Control Employment Agreement, dated December 17, 2009, by and between Henry J. Herrmann and Waddell & Reed Financial, Inc. |
|
10.53 |
Form of Restricted Stock Award Agreement for awards to Employees pursuant to the Waddell & Reed Financial, Inc. 1998 Stock Incentive Plan, as amended and restated. Filed as Exhibit 10.2 to the Company's Current Report on Form 8-K, File No. 333-43687, on March 7, 2005 and incorporated herein by reference.* |
|
10.54 |
Form of Restricted Stock Award Agreement for awards to Employees pursuant to the Waddell & Reed Financial, Inc. 1998 Stock Incentive Plan, as amended and restated. Filed as Exhibit 10.4 to the Company's Quarterly Report on Form 10-Q, File No. 333-43687, for the quarter ended September 30, 2005 and incorporated herein by reference.* |
|
10.55 |
Form of Restricted Stock Award Agreement for awards to Employees pursuant to the Waddell & Reed Financial, Inc. 1998 Stock Incentive Plan, as amended and restated. Filed as Exhibit 10.1 to the Company's Quarterly Report on Form 10-Q, File No. 333-43687, for the quarter ended September 30, 2007 and incorporated herein by reference.* |
|
10.56 |
Form of Restricted Stock Award Agreement for awards to Employees pursuant to the Waddell & Reed Financial, Inc. 1998 Stock Incentive Plan, as amended and restated. Filed as Exhibit 10.29 to the Company's Annual Report on Form 10-K, File No. 333-43687, for the year ended December 31, 2008 and incorporated herein by reference * |
|
10.57 |
Form of Restricted Stock Award Agreement for awards to Employees pursuant to the Waddell & Reed Financial, Inc. 1998 Stock Incentive Plan, as amended and restated. Filed as Exhibit 10.2 to the Company's Quarterly Report on Form 10-Q, File No. 333-43687, for the quarter ended March 31, 2009 and incorporated herein by reference.* |
|
10.58 |
Form of Restricted Stock Award Agreement for awards to Non-Employee Directors pursuant to the Waddell & Reed Financial, Inc. 1998 Stock Incentive Plan, as amended and restated. Filed as Exhibit 10.4 to the Company's Current Report on Form 8-K, File No. 333-43687, on March 7, 2005 and incorporated herein by reference.* |
92
WADDELL & REED FINANCIAL, INC.
Index to Exhibits
| Exhibit No. |
Exhibit Description | |
|---|---|---|
| 10.59 | Form of Restricted Stock Award Agreement for awards to Non-Employee Directors pursuant to the Waddell & Reed Financial, Inc. 1998 Stock Incentive Plan, as amended and restated. Filed as Exhibit 10.5 to the Company's Quarterly Report on Form 10-Q, File No. 333-43687, for the quarter ended September 30, 2005 and incorporated herein by reference.* | |
10.60 |
Form of Restricted Stock Award Agreement for awards to Non-Employee Directors pursuant to the Waddell & Reed Financial, Inc. 1998 Stock Incentive Plan, as amended and restated. Filed as Exhibit 10.2 to the Company's Quarterly Report on Form 10-Q, File No. 333-43687, for the quarter ended September 30, 2007 and incorporated herein by reference.* |
|
10.61 |
Form of Restricted Stock Award Agreement for awards to Non-Employee Directors pursuant to the Waddell & Reed Financial, Inc. 1998 Stock Incentive Plan, as amended and restated. Filed as Exhibit 10.2 to the Company's Quarterly Report on Form 10-Q, File No. 333-43687, for the quarter ended September 30, 2007 and incorporated herein by reference.* |
|
10.62 |
Form of Restricted Stock Award Agreement for awards pursuant to the Waddell & Reed Financial, Inc. 1998 Executive Stock Award Plan, as amended and restated. Filed as Exhibit 10.1 to the Company's Current Report on Form 8-K, File No. 333-43687, on March 7, 2005 and incorporated herein by reference.* |
|
10.63 |
Form of Restricted Stock Award Agreement for awards pursuant to the Waddell & Reed Financial, Inc. 1998 Executive Stock Award Plan, as amended and restated. Filed as Exhibit 10.6 to the Company's Quarterly Report on Form 10-Q, File No. 333-43687, for the quarter ended September 30, 2005 and incorporated herein by reference.* |
|
10.64 |
Form of Restricted Stock Award Agreement for awards pursuant to the Waddell & Reed Financial, Inc. 1998 Executive Stock Award Plan, as amended and restated. Filed as Exhibit 10.3 to the Company's Quarterly Report on Form 10-Q, File No. 333-43687, for the quarter ended September 30, 2007 and incorporated herein by reference.* |
|
10.65 |
Form of Restricted Stock Award Agreement for awards pursuant to the Waddell & Reed Financial, Inc. 1998 Executive Stock Award Plan, as amended and restated. Filed as Exhibit 10.29 to the Company's Annual Report on Form 10-K, File No. 333-43687, for the year ended December 31, 2008 and incorporated herein by reference * |
|
10.66 |
Form of Restricted Stock Award Agreement for awards pursuant to the Waddell & Reed Financial, Inc. 1998 Executive Stock Award Plan, as amended and restated. Filed as Exhibit 10.3 to the Company's Quarterly Report on Form 10-Q, File No. 333-43687, for the quarter ended March 31, 2009 and incorporated herein by reference.* |
|
10.67 |
Form of Restricted Stock Award Agreement for awards pursuant to the Waddell & Reed Financial, Inc. 1998 Non-Employee Director Stock Award Plan, as amended and restated. Filed as Exhibit 10.5 to the Company's Current Report on Form 8-K, File No. 333-43687, on March 7, 2005 and incorporated herein by reference.* |
93
WADDELL & REED FINANCIAL, INC.
Index to Exhibits
| Exhibit No. |
Exhibit Description | |
|---|---|---|
| 10.68 | Form of Restricted Stock Award Agreement for awards pursuant to the Waddell & Reed Financial, Inc. 1998 Non-Employee Director Stock Award Plan, as amended and restated. Filed as Exhibit 10.7 to the Company's Quarterly Report on Form 10-Q, File No. 333-43687, for the quarter ended September 30, 2005 and incorporated herein by reference.* | |
10.69 |
Form of Restricted Stock Award Agreement for awards pursuant to the Waddell & Reed Financial, Inc. 1998 Non-Employee Director Stock Award Plan, as amended and restated. Filed as Exhibit 10.4 to the Company's Quarterly Report on Form 10-Q, File No. 333-43687, for the quarter ended September 30, 2007 and incorporated herein by reference.* |
|
10.70 |
Form of Restricted Stock Award Agreement for awards pursuant to the Waddell & Reed Financial, Inc. 1998 Non-Employee Director Stock Award Plan, as amended and restated. Filed as Exhibit 10.4 to the Company's Quarterly Report on Form 10-Q, File No. 333-43687, for the quarter ended September 30, 2007 and incorporated herein by reference.* |
|
10.71 |
Form of Non-Qualified Stock Option Grant Agreement for awards pursuant to the Waddell & Reed Financial, Inc. 1998 Stock Incentive Plan, as amended and restated. Filed as Exhibit 10.33 to the Company's Annual Report on Form 10-K, File No. 333-43687, for the year ended December 31, 2007 and incorporated herein by reference.* |
|
10.72 |
First Amendment to the Waddell & Reed Financial, Inc. Non-Qualified Stock Option Grant Agreement, dated November 7, 2007, by and between Waddell & Reed Financial, Inc. and Henry J. Herrmann. Filed as Exhibit 10.34 to the Company's Annual Report on Form 10-K, File No. 333-43687, for the year ended December 31, 2007 and incorporated herein by reference.* |
|
10.73 |
2009 Performance Goals established pursuant to the Waddell & Reed Financial, Inc. 2003 Executive Incentive Plan, as amended and restated. Filed as Exhibit 10.1 to the Company's Current Report on Form 8-K, File No. 333-43687, on February 19, 2009 and incorporated herein by reference.* |
|
10.74 |
2010 Performance Goals established pursuant to the Waddell & Reed Financial, Inc. 2003 Executive Incentive Plan, as amended and restated. Filed as Exhibit 10.1 to the Company's Current Report on Form 8-K, File No. 333-43687, on February 19, 2010 and incorporated herein by reference.* |
|
10.75 |
Offer of Settlement. Filed as Exhibit 10.1 to the Company's Current Report on Form 8-K, File No. 333-43687, on July 24, 2006 and incorporated herein by reference. |
|
10.76 |
Assurance of Discontinuance. Filed as Exhibit 10.2 to the Company's Current Report on Form 8-K, File No. 333-43687, on July 24, 2006 and incorporated herein by reference. |
|
10.77 |
Stipulation for Consent Order. Filed as Exhibit 10.3 to the Company's Current Report on Form 8-K, File No. 333-43687, on July 24, 2006 and incorporated herein by reference. |
94
WADDELL & REED FINANCIAL, INC.
Index to Exhibits
| Exhibit No. |
Exhibit Description | |
|---|---|---|
| 11 | Statement regarding computation of per share earnings. | |
12 |
Statement re computation of ratios of earnings to fixed charges. |
|
21 |
Subsidiaries of Waddell & Reed Financial, Inc. |
|
23 |
Consent of KPMG LLP. |
|
31.1 |
Rule 13a-14(a)/15d-14(a) Certification of the Chief Executive Officer. |
|
31.2 |
Rule 13a-14(a)/15d-14(a) Certification of the Chief Financial Officer. |
|
32.1 |
Section 1350 Certification of the Chief Executive Officer. |
|
32.2 |
Section 1350 Certification of the Chief Financial Officer. |
- *
- Indicates management contract or compensatory plan, contract or arrangement.
95