Attached files
UNITED STATES
SECURITIES AND EXCHANGE COMMISSION
Washington, D.C. 20549
FORM 10-K
☑ Annual report pursuant to Section 13 or 15(d) of the Securities Exchange Act of 1934
For the fiscal year ended December 31, 2017
OR
☐ Transition report pursuant to Section 13 or 15(d) of the Securities Exchange Act of 1934
Commission file number 001-13913
WADDELL & REED FINANCIAL, INC.
(Exact name of registrant as specified in its charter)
|
Delaware |
51-0261715 |
6300 Lamar Avenue
Overland Park, Kansas 66202
913-236-2000
(Address, including zip code, and telephone number of Registrant’s principal executive offices)
SECURITIES REGISTERED PURSUANT TO SECTION 12(b) OF THE ACT
|
Title of each class |
Name of each exchange on which registered |
|
Class A Common Stock, $.01 par value |
New York Stock Exchange |
SECURITIES REGISTERED PURSUANT TO SECTION 12(g) OF THE ACT:
None
(Title of class)
Indicate by check mark if the registrant is a well-known seasoned issuer, as defined in Rule 405 of the Securities Act. YES ☑ NO ☐
Indicate by check mark if the registrant is not required to file reports pursuant to Section 13 or Section 15(d) of the Act. YES ☐ NO ☑.
Indicate by check mark whether the registrant (1) has filed all reports required to be filed by Section 13 or 15(d) of the Securities Exchange Act of 1934 during the preceding 12 months (or for such shorter period that the registrant was required to file such reports), and (2) has been subject to such filing requirements for the past 90 days. Yes ☑ No ☐.
Indicate by check mark whether the registrant has submitted electronically and posted on its corporate Web site, if any, every Interactive Data File required to be submitted and posted pursuant to Rule 405 of Regulation S-T during the preceding 12 months (or for such shorter period that the registrant was required to submit and post such files). Yes ☑ No ☐.
Indicate by check mark if disclosure of delinquent filers pursuant to Item 405 of Regulation S-K is not contained herein, and will not be contained, to the best of registrant’s knowledge, in definitive proxy or information statements incorporated by reference in Part III of this Form 10-K or any amendments to this Form 10-K. ☐
Indicate by check mark whether the registrant is a large accelerated filer, an accelerated filer, a non-accelerated filer, smaller reporting company, or an emerging growth company. See the definitions of “large accelerated filer,” “accelerated filer,” “smaller reporting company,” and “emerging growth company” in Rule 12b-2 of the Exchange Act.
|
Large accelerated filer ☒ |
|
Accelerated filer ☐ |
|
|
|
|
|
Non-accelerated filer ☐ |
|
Smaller reporting company ☐ |
|
(Do not check if a smaller reporting company) |
|
|
|
|
|
Emerging growth company ☐ |
If an emerging growth company, indicate by check mark if the registrant has elected not to use the extended transition period for complying with any new or revised financial accounting standards provided pursuant to Section 13(a) of the Exchange Act. ☐
Indicate by check mark whether the registrant is a shell company (as defined by Rule 12b-2 of the Exchange Act). Yes ☐ No ☑.
The aggregate market value of the voting and non-voting common stock equity held by non-affiliates based on the closing sale price on June 30, 2017 was $1.52 billion.
Shares outstanding of each of the registrant’s classes of common stock as of February 9, 2018 Class A common stock, $.01 par value: 83,361,517
DOCUMENTS INCORPORATED BY REFERENCE
In Parts II and III of this Form 10-K, portions of the definitive proxy statement for the 2018 Annual Meeting of Stockholders to be held April 26, 2018.
Index of Exhibits (Pages 53 through 55)
Total Number of Pages Included Are 92
WADDELL & REED FINANCIAL, INC.
INDEX TO ANNUAL REPORT ON FORM 10‑K
For the fiscal year ended December 31, 2017
2
Forward‑Looking Statements
This Annual Report on Form 10‑K and the letter to stockholders contains “forward‑looking statements” within the meaning of Section 27A of the Securities Act of 1933, as amended, and Section 21E of the Securities Exchange Act of 1934, as amended, which reflect the current views and assumptions of management with respect to future events regarding our business and the industry in general. These forward‑looking statements include all statements, other than statements of historical fact, regarding our financial position, business strategy and other plans and objectives for future operations, including statements with respect to revenues and earnings, the amount and composition of assets under management, distribution sources, expense levels, redemption rates and the financial markets and other conditions. These statements are generally identified by the use of words such as “may,” “could,” “should,” “would,” “believe,” “anticipate,” “forecast,” “estimate,” “expect,” “intend,” “plan,” “project,” “outlook,” “will,” “potential” and similar statements of a future or forward‑looking nature. Readers are cautioned that any forward‑looking information provided by or on behalf of the Company is not a guarantee of future performance. Certain important factors that could cause actual results to differ materially from our expectations are disclosed in the Item 1 “Business” and Item 1A “Risk Factors” sections of this Annual Report on Form 10‑K, which include, without limitation, the adverse effect from a decline in securities markets or in the relative investment performance of our products, our inability to pay future dividends, the loss of existing distribution channels or the inability to access new ones, a reduction of the assets we manage on short notice, and adverse results of litigation and/or arbitration. The forgoing factors should not be construed as exhaustive and should be read together with other cautionary statements included in this and other reports and filings we make with the SEC. All forward‑looking statements speak only as of the date on which they are made and we undertake no duty to update or revise any forward‑looking statements, whether as a result of new information, future events or otherwise.
General
Waddell & Reed Financial, Inc. (hereinafter referred to as the “Company,” “we,” “our” or “us”) is a holding company, incorporated in the state of Delaware in 1981, that conducts business through its subsidiaries. Founded in 1937, we are one of the oldest mutual fund complexes in the United States, having introduced the Waddell & Reed Advisors group of mutual funds (the “Advisors Funds”) in 1940. Over time we’ve added additional mutual funds: Ivy Funds (the “Ivy Funds”); Ivy Variable Insurance Portfolios, our variable product offering (“Ivy VIP”); InvestEd Portfolios, our 529 college savings plan (“InvestEd”); Ivy High Income Opportunities Fund, a closed-end mutual fund (“IVH”); the Ivy Global Investors Société d’Investissement à Capital Variable (the “SICAV”) and its Ivy Global Investors sub‑funds (the “IGI Funds”), an undertaking for the collective investment in transferable securities (“UCITS”); and the Ivy NextShares® exchange-traded managed funds (“Ivy NextShares”) (collectively, the Advisors Funds, Ivy Funds, Ivy VIP, InvestEd, IVH, and Ivy NextShares are referred to as the “Funds”). As of December 31, 2017, we had $81.1 billion in assets under management.
We derive our revenues from providing investment management and advisory services, investment product underwriting and distribution, and shareholder services administration to the Funds, the IGI Funds, and institutional and separately managed accounts. Investment management and/or advisory fees are based on the amount of average assets under management and are affected by sales levels, financial market conditions, redemptions and the composition of assets. Our underwriting and distribution revenues consist of fees earned on fee‑based asset allocation programs and related advisory services, asset‑based service and distribution fees promulgated under the 1940 Act (“Rule 12b-1”), distribution fees on certain variable products, and commissions derived from sales of investment and insurance products. The products sold have various commission structures and the revenues received from those sales vary based on the type and dollar amount sold. Shareholder service fee revenue includes transfer agency fees, custodian fees from retirement plan accounts, portfolio accounting and administration fees, and is earned based on assets under management or number of client accounts. Our major expenses are for commissions, employee compensation, field services, dealer services and information technology.
Organization
We operate our investment advisory business through our subsidiary companies, primarily Waddell & Reed Investment Management Company (“WRIMCO”), a registered investment adviser for the Advisors Funds and Ivy
3
Investment Management Company (“IICO”), the registered investment adviser for the Ivy Funds, Ivy VIP, InvestEd, the IGI Funds and Ivy NextShares. IICO also serves as the global distributor of the IGI Funds.
Our underwriting and distribution business operates through two broker-dealers: Waddell & Reed, Inc. (“W&R”) and Ivy Distributors, Inc. (“IDI”). W&R is a registered broker-dealer and investment adviser that acts primarily as the national distributor and underwriter for shares of the Advisors Funds, InvestEd and other mutual funds, and as a distributor of variable annuities and other insurance products issued by our business partners. In addition, W&R is a leading distributor of the Ivy Funds. IDI is the distributor and underwriter for the Ivy Funds, Ivy VIP and Ivy Nextshares.
Waddell & Reed Services Company (“WRSCO”) provides transfer agency and accounting services to the Funds. Waddell & Reed Financial, Inc., W&R, WRIMCO, WRSCO, IICO and IDI are hereafter collectively referred to as the “Company,” “we,” “us” or “our” unless the context requires otherwise.
Investment Management Operations
Our investment advisory business provides one of our largest sources of revenues. We earn investment management fee revenues by providing investment advisory and management services pursuant to investment management agreements with the Funds. While the specific terms of the agreements vary, the basic terms are similar. The agreements provide that we render overall investment management services to each of the Funds, subject to the oversight of each Fund’s board of trustees and in accordance with each Fund’s investment objectives and policies. The agreements permit us to enter into separate agreements for shareholder services or accounting services with each respective Fund.
Each Fund’s board of trustees, including a majority of the trustees who are not “interested persons” of the Fund or the Company within the meaning of the Investment Company Act of 1940, as amended (the “ICA”) (“disinterested members”) and the Fund’s shareholders must approve the investment management agreement between the respective Fund and the Company. These agreements may continue in effect from year to year if specifically approved at least annually by (i) the Fund’s board, including a majority of the disinterested members, or (ii) the vote of a majority of both the shareholders of the Fund and the disinterested members of each Fund’s board, each vote being cast in person at a meeting called for such purpose. Each agreement automatically terminates in the event of its assignment, as defined by the ICA or the Investment Advisers Act of 1940, as amended (the “Advisers Act”), and may be terminated without penalty by any Fund by giving us 60 days’ written notice if the termination has been approved by a majority of the Fund’s trustees or the Fund’s shareholders. We may terminate an investment management agreement without penalty on 120 days’ written notice.
In addition to performing investment management services for the Funds, we act as an investment adviser for the IGI Funds, institutional and other private investors and we provide subadvisory services to other investment companies. Such services are provided pursuant to various written agreements and our fees are generally based on a percentage of assets under management.
Our investment management team begins each business day in a collaborative discussion that fosters idea sharing, yet reinforces individual accountability. Through all market cycles, we remain dedicated to the following investment principles:
|
· |
Rigorous fundamental research—an enduring investment culture that dedicates itself to analyzing companies on our own rather than relying exclusively on widely available research produced by others. |
|
· |
Collaboration and accountability—a balance of collaboration and individual accountability, which ensures the sharing and analysis of investment ideas among investment professionals while empowering portfolio managers to shape their portfolios individually. |
|
· |
Focus on growing and protecting investors’ assets—a sound approach that seeks to capture asset appreciation when market conditions are favorable and strives to manage risk during difficult market periods. |
These three principles shape our investment philosophy and money management approach. For 80 years, our investment organization has delivered consistently competitive investment performance. Through bull and bear markets, our investment professionals have not strayed from what works—fundamental research and a time‑tested investment
4
process. We believe investors turn to us because they appreciate that our investment approach continues to identify and create opportunities for wealth creation.
Our investment management team is comprised of 83 professionals, including 37 portfolio managers who average 23 years of industry experience and 16 years of tenure with our firm. We have significant experience in virtually all major asset classes, several specialized asset classes and a range of investment styles. We have moved more fully to team-based portfolio management on many funds, and have fortified our research team with additional investment analysts. We engage subadvisors who bring additional expertise in specific asset classes.
Investment Management Products
Our mutual fund families offer a wide variety of investment options. We are the exclusive underwriter and distributor of 94 registered open‑end mutual fund portfolios in the Funds, which includes 14 investment styles. During the fourth quarter of 2017, nine Advisors Funds merged into Ivy Funds with substantially similar objectives and strategies, the remaining 11 Advisors Funds will merge into Ivy Funds and is expected to close in February 2018. Additionally, we have one closed‑end offering and three Ivy NextShares exchange-traded managed funds. The Advisors Funds, variable products offering Ivy VIP and InvestEd are offered primarily through W&R independent financial advisors in the retail broker-dealer channel; in some circumstances, certain of those funds are also offered through the retail unaffiliated distribution channel. The Ivy Funds are offered through both our retail unaffiliated broker-dealer channel and retail broker-dealer channel. The Funds’ assets under management are included in either our retail unaffiliated distribution channel or our retail broker-dealer channel depending on which channel marketed the client account or is the broker of record.
During 2017, we launched the Ivy IG International Small Cap Fund, subadvised by IG International Management Ltd., the Ivy Crossover Credit Fund, and the Ivy PineBridge High Yield Fund in partnership with PineBridge Investments. The Ivy IG International Small Cap Fund seeks smaller-capitalization companies outside North America that exhibit perceived growth at a reasonable price. The Ivy Crossover Credit Fund is an actively managed strategy designed to provide exposure to both investment grade and non-investment grade fixed income securities. The Ivy PineBridge High Yield Fund seeks to provide total return through a combination of high current income and capital appreciation, primarily by investing in a diversified portfolio of high-yield, high risk fixed income securities from both U.S. and foreign issuers. In addition, the Waddell & Reed Advisors Asset Strategy Fund was renamed Waddell & Reed Advisors Wilshire Global Allocation Fund and the investment strategy was changed to operate as a “fund-of-funds” that allocates assets among a diverse group of affiliated equity and fixed income mutual funds with both domestic and foreign investments. Wilshire Associates, Inc. sub-advises a portion of the fund consisting of the multi asset segment, which invests in affiliated mutual funds.
Additionally in 2017, we introduced five new index funds in partnership with ProShares Advisors LLC. Ivy ProShares S&P 500 Dividend Aristocrats Index Fund invests in S&P 500 companies with at least 25 years of consecutive dividend growth. Ivy ProShares Russell 2000 Dividend Growers Index Fund invests in small cap companies that have increased dividend payments for at least 10 consecutive years. Ivy ProShares MSCI ACWI Index Fund seeks to track MSCI ACWI performance. Ivy ProShares S&P 500 Bond Index Fund is designed to track index of corporate bonds issued by S&P 500 companies. Ivy ProShares Interest Rate Hedged High Yield Index Fund invests in a diversified portfolio of high yield bonds with an interest-rate hedge using short Treasury futures to minimize the effects of rising rates.
Broker-Dealer Products
We offer our retail broker-dealer channel clients a variety of fee‑based asset allocation products, including Managed Allocation Portfolio (“MAP”), MAP Choice, MAP Flex, MAP Select, MAP Latitude and Strategic Portfolio Allocation (“SPA”). These programs utilize a variety of investment options including mutual funds, as well as individual stock, bond and exchange traded fund investment options. During 2017, we launched MAP Navigator, an open architecture advisory program and enhanced the SPA program, partnering with Wilshire Associates, Inc. to develop five proprietary investment models consisting of Advisors Funds and Ivy Funds. As of December 31, 2017, clients had $21.6 billion invested in our fee‑based asset allocation programs.
In our retail broker-dealer channel, we distribute various business partners’ variable annuity products, which offer Ivy VIP as an investment vehicle. In 2017, we enhanced InvestEd by lowering fees and expanding the available investment options. InvestEd offers lower sales charges, reduced minimum initial investment, an increased number of aged-based and static portfolios and individual fund options, along with an expanded range of underlying funds within aged-based and
5
static portfolios. We also offer our retail broker-dealer channel customers retirement and life insurance products underwritten by our business partners. Through our insurance agency subsidiary, W&R’s independent financial advisors also sell life insurance and disability products underwritten by various carriers. We offer unaffiliated mutual fund products, other variable annuity products, and full service brokerage products and services through a clearing broker-dealer.
Distribution Channels
One of our distinctive qualities is that we distribute our investment products through a balanced distribution network. Our retail products are distributed through our retail unaffiliated distribution channel, or through our retail broker-dealer channel by W&R independent financial advisors. Through our institutional channel, we distribute a variety of investment styles for a variety of clients.
Retail Unaffiliated Distribution Channel
Our team of 37 external wholesalers lead our wholesaling efforts, which focus principally on distributing the Ivy Funds through three segments: broker-dealers (the largest method of distributing mutual funds for the industry and for us), retirement platforms (401(k) platforms using multiple managers) and registered investment advisers (fee‑based financial advisors who generally sell mutual funds through financial supermarkets). Additionally, our national accounts team, comprised of 10 employees, is dedicated to home office relationship coverage. The Ivy Funds maintain strong positions on many of the leading third party distribution platforms, and we continue efforts to diversify our sales. During 2017, we had five funds exceed gross sales of $250 million. We expect the retail unaffiliated distribution channel to be critical in driving our organic growth rate in the coming years. Assets under management in this channel were $31.1 billion at the end of 2017.
Retail Broker-Dealer Channel
Throughout our history, W&R independent financial advisors have sold investment products to individuals, families and businesses across the country in geographic markets of all sizes. We assist clients on a wide range of financial issues with a significant focus on helping them plan, generally, for long‑term goals such as retirement, education funding and estate planning, and offer one‑on‑one consultations that emphasize long‑term relationships through continued service. Over the past several years and continuing, we have expanded our brokerage platform technology and offerings, which enhances our ability to competitively recruit experienced advisors.
As of December 31, 2017, there were 1,367 independent financial advisors associated with W&R who operate out of offices located throughout the United States. We believe, based on industry data, that W&R ranks among the largest independent broker-dealers. Retail broker-dealer channel underwriting and distribution fee revenues (average per advisor) were $270 thousand, $243 thousand and $265 thousand for the years ended December 31, 2017, 2016 and 2015, respectively. As of December 31, 2017, our retail broker-dealer channel had approximately 400,000 mutual fund customers. Assets under administration (“AUA”) in this channel were $56.7 billion at December 31, 2017.
Institutional Channel
Through this channel, we manage assets in a variety of investment styles for a variety of types of institutions. The largest client type is other asset managers that hire us to act as subadviser for their branded products; they are typically domestic and foreign distributors of investment products who lack scale or the track record to manage internally, or choose to market multi‑manager styles. Our diverse client list includes the IGI Funds, pension funds, Taft‑Hartley plans and endowments. Assets under management in the institutional channel were $6.3 billion at December 31, 2017.
Service Agreements
We earn service fee revenues by providing various services to the Funds and their shareholders. Pursuant to shareholder servicing agreements, we perform shareholder servicing functions for which the Funds pay us a monthly fee, including: maintaining shareholder accounts; issuing, transferring and redeeming shares; distributing dividends and paying redemptions; furnishing information related to the Funds; and handling shareholder inquiries. Pursuant to accounting service agreements, we provide the Funds with bookkeeping and accounting services and assistance for which the Funds pay us a monthly fee, including: maintaining the Funds’ records; pricing Fund shares; and preparing prospectuses for existing shareholders, proxy statements and certain other shareholder reports.
6
Agreements with the Funds may be adopted or amended with the approval of the disinterested members of each Fund’s board of trustees and have annually renewable terms.
Competition
The financial services industry is a highly competitive global industry. According to the Investment Company Institute (the “ICI”), at the end of 2017 there were more than 9,300 open‑end investment companies, more than 500 closed‑end investment companies and more than 1,800 exchange traded funds of varying sizes, investment policies and objectives whose shares are being offered to the public in the United States alone. Factors affecting our business include investment performance, fees, brand recognition, business reputation, quality of service and the continuity of both client relationships and assets under management. A majority of mutual fund sales go to funds that are highly rated by a small number of well‑known ranking services that focus on investment performance. Competition is influenced by the achievement of competitive investment management performance, distribution methods, the type and quality of shareholder services, the success of marketing efforts and the ability to develop investment products for certain market segments to meet the changing needs of investors.
We compete with hundreds of other mutual fund management, distribution and service companies that distribute their fund shares through a variety of methods, including affiliated and unaffiliated sales forces, broker-dealers and direct sales to the public of shares offered at a low or no sales charge. Many larger mutual fund complexes have significant advertising budgets and established relationships with brokerage houses with large distribution networks, which enable these fund complexes to reach broad client bases. Many investment management firms and independent financial advisors offer services and products similar to ours. We also compete with brokerage and investment banking firms, insurance companies, commercial banks and other financial institutions and businesses offering other financial products in all aspects of their businesses.
The distribution of mutual funds and other investment products has experienced significant developments in recent years, which has intensified the competitive environment in which we operate. These developments include the introduction of new products, the rationalization of the number of products offered on third party platforms, increasingly complex distribution systems with multiple classes of shares, the development of investors’ ability to invest on‑line, the introduction of sophisticated technological platforms used by financial advisors to sell and service mutual funds for their clients, the introduction of separately managed accounts—previously available only to institutional investors—to individuals, and growth in the number of mutual funds offered. In recent years, we have faced significant competition from passive oriented investment strategies, which have taken market share from active managers like ourselves. While we cannot predict how much market share these competitors will gain, we believe there will always be demand for active management.
We believe we effectively compete across multiple dimensions of the asset management and broker-dealer businesses. First, we market our products, primarily the Ivy Funds family, to unaffiliated broker-dealers and advisors and compete against other asset managers offering mutual fund products. This distribution method allows us to move beyond proprietary distribution and increases our potential pool of clients. Competition is impacted by sales techniques, personal relationships and skills, and the quality of financial planning products and services offered. We compete against a broad range of asset managers that are both larger and smaller than our firm, but we believe that the breadth and depth of our products position us to compete in this environment. Second, we believe our business model targets customers seeking personal assistance from financial advisors or planners. The market for financial advice is extremely broad and fragmented. W&R independent financial advisors compete with large and small broker-dealers, independent financial advisors, registered investment advisers, financial institutions, insurance representatives and others. Finally, we compete in the institutional marketplace, working with consultants who select asset managers for various opportunities, as well as working directly with plan sponsors, foundations, endowments, sovereign funds and other asset managers who hire subadvisors.
We also face competition in attracting and retaining qualified employees and independent financial advisors. To maximize our ability to compete effectively in our business, we offer competitive compensation.
For additional discussion regarding the impact of competition, please see the Market and Competition risk factors included in Item 1A—“Risk Factors” in this Annual Report.
7
Regulation
The securities industry is subject to extensive regulation and virtually all aspects of our business are subject to various federal and state laws and regulations. These laws and regulations are primarily intended to protect investment advisory clients and shareholders of registered investment companies. Under such laws and regulations, agencies and organizations that regulate investment advisers, broker-dealers, and transfer agents like us have broad administrative powers, including the power to limit, restrict or prohibit an investment adviser, broker-dealer or transfer agent from carrying on its business in the event that it fails to comply with applicable laws and regulations. In such event, the possible sanctions that may be imposed include, but are not limited to, the suspension of individual employees or agents, limitations on engaging in certain lines of business for specified periods of time, censures, fines and the revocation of investment adviser and other registrations.
The United States Securities and Exchange Commission (the “SEC”) is the federal agency responsible for the administration of federal securities laws. Certain of our subsidiaries are registered with the SEC as investment advisers under the Advisers Act, which imposes numerous obligations on registered investment advisers including, among other things, fiduciary duties, record‑keeping and reporting requirements, operational requirements and disclosure obligations, as well as general anti‑fraud prohibitions. Investment advisers are subject to periodic examination by the SEC, and the SEC is authorized to institute proceedings and impose sanctions for violations of the Advisers Act, ranging from censure to termination of an investment adviser’s registration.
The Funds are registered as investment companies with the SEC under the ICA, and various filings are made with states under applicable state rules and regulations. The ICA regulates the relationship between a mutual fund and its investment adviser and prohibits or severely restricts principal transactions and joint transactions. Various regulations cover certain investment strategies that may be used by the Funds for hedging and/or speculative purposes. To the extent the Funds purchase futures contracts, options on futures contracts, swaps and foreign currency contracts, they are subject to the commodities and futures regulations of the Commodity Futures Trading Commission.
We derive a large portion of our revenues from investment management agreements. Under the Advisers Act, our investment management agreements terminate automatically if assigned without the client’s consent. Under the ICA, investment advisory agreements with registered investment companies, such as the Funds, terminate automatically upon assignment. The term “assignment” is broadly defined and includes direct assignments, as well as assignments that may be deemed to occur, under certain circumstances, upon the transfer, directly or indirectly, of a controlling interest in the Company.
The Company is also subject to federal and state laws affecting corporate governance, including the Sarbanes‑Oxley Act of 2002, as well as rules adopted by the SEC. Our report on internal controls over financial reporting for 2017 is included in Part I, Item 9A.
As a publicly traded company, we are also subject to the rules of the New York Stock Exchange (the “NYSE”), the exchange on which our stock is listed, including the corporate governance listing standards approved by the SEC.
Two of our subsidiaries, W&R and IDI, are registered as broker-dealers with the SEC and the states. Much of the broker-dealer regulation has been delegated by the SEC to self‑regulatory organizations, principally the Municipal Securities Rulemaking Board and the Financial Industry Regulatory Authority, Inc. (“FINRA”), which is the primary regulator of our broker-dealer activities. These self‑regulatory organizations adopt rules (subject to approval by the SEC) that govern the industry and conduct periodic examinations of our operations over which they have jurisdiction. Securities firms are also subject to regulation by state securities administrators in those states in which they conduct business. Broker-dealers are subject to regulations that cover all aspects of the securities business, including sales practices, market making and trading among broker-dealers, the use and safekeeping of clients’ funds and securities, capital structure, record‑keeping, and the conduct of directors, officers, employees and associated persons. Violation of applicable regulations can result in the revocation of broker-dealer licenses, the imposition of censures or fines, and the suspension or expulsion of a firm, its officers or employees.
W&R and IDI are each subject to certain net capital requirements pursuant to the Securities Exchange Act of 1934, as amended (the “Exchange Act”). Uniform Net Capital Rule 15c3‑1 of the Exchange Act (the “Net Capital Rule”) specifies the minimum level of net capital a registered broker-dealer must maintain and also requires that part of its assets be kept in a relatively liquid form. The Net Capital Rule is designed to ensure the financial soundness and liquidity of
8
broker-dealers. Any failure to maintain the required minimum net capital may subject us to suspension or revocation of our registration or other limitations on our activity by the SEC, and suspension or expulsion by FINRA or other regulatory bodies, and ultimately could require the broker-dealer’s liquidation. The maintenance of minimum net capital requirements may also limit our ability to pay dividends. As of December 31, 2017 and 2016, net capital for W&R and IDI exceeded all minimum requirements.
Pursuant to the requirements of the Securities Investor Protection Act of 1970, W&R is a member of the Securities Investor Protection Corporation (the “SIPC”). IDI is exempt from the membership requirements and is not a member of the SIPC. The SIPC provides protection against lost, stolen or missing securities (but not loss in value due to a rise or fall in market prices) for clients in the event of the failure of a broker-dealer. Accounts are protected up to $500,000 per client with a limit of $250,000 for cash balances. However, since the Funds, and not our broker-dealer subsidiaries, maintain customer accounts, SIPC protection would not cover mutual fund shareholders whose accounts are maintained directly with the Funds, but would apply to brokerage accounts held on our brokerage platform.
Title III of the USA PATRIOT Act, the International Money Laundering Abatement and Anti‑Terrorist Financing Act of 2001, imposes significant anti‑money laundering requirements on all financial institutions, including domestic banks and domestic operations of foreign banks, broker-dealers, futures commission merchants and investment companies.
The Company and independent financial advisors associated with W&R in our retail broker-dealer channel are subject to the Employee Retirement Income Security Act of 1974, as amended (“ERISA”), and related provisions of the Internal Revenue Code of 1986, as amended, to the extent they are considered “fiduciaries” under ERISA with respect to certain clients. The U.S. Department of Labor, which administers ERISA, adopted regulations in April 2016 that, among other things, treat as fiduciaries any person who provides investment advice or recommendations to employee benefit plans, plan fiduciaries, plan participants, plan beneficiaries, IRAs or IRA owners.
Our operations outside the United States are subject to the laws and regulations of various non‑U.S. jurisdictions and non‑U.S. regulatory agencies and bodies, including the regulation of the IGI Funds by Luxembourg’s Commission de Surveillance du Secteur Financier. Similar to the United States, non‑U.S. regulatory agencies have broad authority in the event of non‑compliance with laws and regulations.
Our businesses may be materially affected not only by regulations applicable to us as an investment adviser, broker-dealer or transfer agent, but also by law and regulations of general application. For example, the volume of our principal investment advisory business in a given time period could be affected by, among other things, existing and proposed tax legislation and other governmental regulations and policies (including the interest rate policies of the Federal Reserve Board), and changes in the interpretation or enforcement of existing laws and rules that affect the business and financial communities.
Our business is also subject to new and changing laws and regulations. For additional discussion regarding the impact of current and proposed legal or regulatory requirements, please see the Legal, Regulatory and Tax risk factors included in Item 1A—“Risk Factors” in this Annual Report.
Intellectual Property
We regard our names as material to our business, and have registered certain service marks associated with our business with the United States Patent and Trademark Office.
Employees
At December 31, 2017 we had 1,430 full‑time employees, consisting of 1,177 home office employees and 253 employees responsible for field supervision and administration.
Available Information
We make available free of charge our proxy statements, Annual Reports on Form 10‑K, quarterly reports on Form 10‑Q, current reports on Form 8‑K and amendments to those reports under the “Reports & SEC Filings” menu on the “Investor Relations” section of our internet website at ir.waddell.com as soon as reasonably practical after such filing has been made with the SEC.
9
You should carefully consider the following risk factors as well as the other risks and uncertainties contained in this Annual Report on Form 10‑K or in our other SEC filings. The occurrence of one or more of these risks or uncertainties could materially and adversely affect our business, financial condition, operating results and cash flows. In this Annual Report on Form 10‑K, unless the context expressly requires a different reading, when we state that a factor could “adversely affect us,” have a “material adverse effect on our business,” “adversely affect our business” and similar expressions, we mean that the factor could materially and adversely affect our business, financial condition, operating results and cash flows. Information contained in this section may be considered “forward‑looking statements.” See “Part I—Forward Looking Statements” for a discussion of cautionary statements regarding forward‑looking statements.
MARKET AND COMPETITION RISKS
We Could Experience Adverse Effects On Our Market Share Due To Strong Competition From Numerous And Sometimes Larger Companies. The investment management industry is highly competitive. We compete with stock brokerage firms, mutual fund companies, investment banking firms, insurance companies, banks, internet investment sites, mobile investment products, automated financial advisors, registered investment advisers, and other financial institutions and individuals based on a number of factors, including investment performance, the level of fees charged, the quality and diversity of products and services offered, name recognition and reputation, and the ability to develop new investment strategies and products to meet the changing needs of investors. Many of these competitors not only offer mutual fund investments and services, but also offer an ever-increasing number of other financial products and services. Many of our competitors have more products and product lines, services and brand recognition and also may have substantially greater assets under management. See Item 1 – “Business – Competition.”
Many larger mutual fund complexes have developed more extensive relationships with brokerage houses that have large distribution networks, which may enable those fund complexes to reach broader client bases. In recent years, there has been a trend of consolidation in the mutual fund industry resulting in stronger competitors with greater financial resources than us.
There has also been a trend toward online internet financial services and financial services that are based on mobile applications or automated processes as clients increasingly seek to manage their investment portfolios digitally. This is leading to increased utilization of “robo” adviser platforms. If existing or potential customers decide to invest with our competitors instead of with us, our market share could decline, which could have a material adverse effect on our business.
We have faced significant competition in recent years from lower fee, passive investment strategies. Investment advisers that emphasize passive products have gained, and may continue to gain, market share from active managers like us, which could have a material impact on our business.
We Could Lose Market Share To Competitors That Have Broader Investment Product Offerings. There are a number of asset classes and product types that are not well covered by our current products and services. When these asset classes or products are in favor with investors, our competitors may receive outsized flows compared to others in the industry. As a result, we may miss the opportunity to gain the assets under management that are being invested in these assets and face the risk of our managed assets being withdrawn in favor of competitors who provide services covering these classes or products. For example, to the extent there is a trend in the asset management business in favor of passive products, such as index and certain types of exchange-traded funds, it favors our competitors who provide those products over active managers like us. In addition, we are not typically the lowest cost provider of asset management services. To the extent that we compete on the basis of price, we may not be able to maintain our current fee structure, which could adversely affect our operating revenues.
Our Business And Prospects Could Be Adversely Affected If The Securities Markets Decline. Our results of operations are affected by certain economic factors, including the success of the securities markets. There are often substantial fluctuations in price levels in the securities markets. These fluctuations can occur on a daily basis and over longer periods as a result of a variety of factors, including national and international economic and political events, broad trends in business and finance, and interest rate movements. Adverse market conditions, particularly in the U.S. domestic stock market due to our high concentration of assets under management in that market, and lack of investor confidence
10
could result in investors further withdrawing from the markets or decreasing their rate of investment, either of which could adversely affect our revenues, earnings and growth prospects.
Our revenues are, to a large extent, investment management fees that are based on the market value of assets under management. A decline in the securities market may cause the value of our assets under management to decline or cause investors to redeem assets in favor of investments they perceive offer greater opportunity or lower risk, both of which decrease investment management and other fees and could significantly reduce our revenues and earnings. We do not hedge our revenue stream from this risk through derivatives or other financial contracts. Our growth is dependent to a significant degree upon our ability to attract and retain mutual fund assets, and, in an adverse economic environment, this may prove more difficult. The combination of adverse market conditions reducing both sales and investment management fees could compound one another and materially affect our business.
There May Be Adverse Effects On Our Business If Our Funds’ Performance Declines. Success in the investment management and mutual fund businesses, including the growth and retention of assets under management, is dependent on the investment performance of client accounts relative to market conditions and the performance of competing funds. Good relative performance stimulates sales of the Funds’ shares and tends to keep redemptions low. Sales of the Funds’ shares in turn generate higher management fees and distribution revenues. Good relative performance also attracts institutional and separate accounts. It may also result in higher ratings or rankings by research services such as Morningstar, Lipper or eVestment Alliance, which may compound the foregoing effects. Conversely, poor relative performance results in decreased sales, increased redemptions of the Funds’ shares and the loss of institutional and separate accounts, resulting in decreases in our assets under management and revenues. Poor investment performance also may adversely affect our ability to expand the distribution of our products through unaffiliated third parties. Further, any drop in market share of mutual fund sales in our retail broker-dealer channel may further reduce profits as sales of unaffiliated mutual funds are less profitable than sales of our affiliated mutual funds. As of December 31, 2017, 29% our assets under management were concentrated in five Funds. As a result, our operating results are significantly affected by the performance of those Funds and our ability to minimize redemptions from and maintain assets under management in those Funds. If we experienced a significant amount of redemptions of those Funds for any reason, our revenues would decline and our operating results would be adversely affected. Further, any adverse performance of those Funds may also indirectly affect the net sales and redemptions in our other products, which in turn, may adversely affect our business. We have experienced net outflows in recent years due in part to underperformance of our mutual funds and depressed sales. During fiscal years 2017 and 2016, we had $11.4 billion and $25.3 billion of net outflows, respectively.
In the ordinary course of our business, we may reduce or waive investment management fees, or limit total expenses, on certain products or services for particular time periods to manage fund expenses, or for other reasons, and to help retain or increase assets under management. If our revenues decline without a commensurate reduction in our expenses, our net income will be reduced. From time to time, we may experience poor investment performance, on a relative or absolute basis, in certain products or accounts that we manage, which may contribute to a significant reduction in our assets under management and revenues. In recent years we have experienced a decline in investment performance for several of our investment products, particularly in connection with shorter-term performance. There is typically a lag before improvements in investment performance produce a positive effect on asset flows. The implementation of the DOL Fiduciary Rule could also reduce asset flows in the event of underperformance. There can be no assurances as to when, or if, investment performance issues will cease to negatively influence our assets under management and revenues.
Changes In The Distribution Channels In Which We Operate Could Reduce Our Net Revenues and Adversely Affect Our Assets Under Management, Revenues and Growth Prospects. Our ability to market and distribute mutual funds and other investment products we manage is significantly dependent on access to third party financial intermediaries that distribute these products. We sell a significant portion of our investment products through a variety of such intermediaries, including major wire houses, national and regional broker-dealers, defined contribution plan administrators, retirement platforms and registered investment advisers. Assets under management in our retail unaffiliated channel at December 31, 2017 were $31.1 billion, or 38% of total assets under management. It would be difficult for us to acquire or retain the management of those assets without the assistance of the intermediaries. As third party intermediaries rationalize and reduce the number of product offerings on their platforms, including in response to the recently adopted U.S. Department of Labor (the “DOL”) fiduciary standard regulations, we cannot provide assurances that we will be able to maintain an adequate number of investment product offerings, or access to these intermediaries, which could have a material adverse effect on our business. Relying on third party intermediaries also exposes us to the risk of increasing costs of distribution, as certain intermediaries with which we conduct business charge fees (largely determined by the distributor) to maintain access to their distribution networks. If we choose not to pay such fees, our
11
ability to distribute through those intermediaries would be limited; significant increases in such fees will cause our distribution costs to increase, which could lower our profitability. In addition, over time certain sectors of the financial services industry have become considerably more concentrated, as financial institutions involved in a broad range of financial services have been acquired by or merged into other firms. In April 2016, the DOL adopted regulations that, among other things, treat as fiduciaries any person who provides investment advice or recommendations to employee benefit plans, plan fiduciaries, plan participants, plan beneficiaries, IRAs or IRA owners (the “DOL Fiduciary Rule”). The implementation of the DOL Fiduciary Rule is likely to require modifications to our distribution activities and may impact our ability to service clients or engage in certain types of distribution or other business activities. The convergence of all of these activities could result in our competitors gaining greater resources, and we may experience pressure on our pricing and market share as a result, and as some of our competitors seek to increase market share by reducing prices. If these changes continue, our distribution costs could increase as a percentage of our revenues generated. We could experience lower sales or incur higher distribution costs or other developments, which could have an adverse effect on our results of operations if third party selling agreements are terminated or there is a change in the terms of those agreements.
Approximately half of our assets under management, $43.7 billion, or 54%, as of December 31, 2017 are held in our retail broker-dealer channel. The investment products distributed in our retail broker-dealer channel include our affiliated mutual funds and other products, as well as products issued by unaffiliated mutual fund companies. A majority of the sales in this channel are sales of affiliated mutual funds, upon which we earn higher revenues from asset management fees as compared to the sale of unaffiliated funds. Sales of affiliated investment products in our retail broker-dealer channel may decrease (and redemptions increase) materially with the introduction of additional unaffiliated investment products in our advisory programs. Further, qualified accounts, particularly IRAs, make up a significant portion of our assets under management and administration in this channel, and a significant portion of those retirement assets are invested in our affiliated products. The introduction of additional unaffiliated products in this channel, sustained underperformance of key investment products, and the implementation of the DOL Fiduciary Rule, which has significant impacts relative to retirement assets, could cause us to experience lower sales of our affiliated investment products, increased redemptions, or other developments that may not be fully offset by higher distribution revenues or other benefits. As a result, our assets under management, revenues and earnings may decline. See “Legal, Regulatory and Tax Risks.”
Increasingly, investors, particularly in the institutional market, rely on external consultants and other third party financial professionals for advice on the choice of an investment adviser and investment portfolio. Further, the institutional separate account business uses referrals from investment consultants, investment advisers and other professionals. These consultants and third parties tend to exert a significant degree of influence over their clients’ choices, and they may favor a competitor of ours. We cannot assure that our investment offerings will be among their recommended choices in the future. The Company cannot be certain that it will continue to have access to these third party distribution channels or have an opportunity to offer some or all of its investment products through these channels. Further, their recommendations can change over time and we could lose their recommendation and their client assets under our management. Any failure to maintain strong business relationships with these distribution sources and the consultant community could impair our ability to sell our products, which in turn could have a negative effect on our revenues and profitability.
A Significant Percentage Of Our Assets Under Management Are Distributed Through Our Retail Unaffiliated Channel, Which Has Higher Redemption Rates Than Our Retail Broker-Dealer Channel. In recent years, we have focused on expanding distribution efforts relating to our retail unaffiliated channel. The percentage of our assets under management in the retail unaffiliated channel was 38% at December 31, 2017, and the percentage of our total sales represented by the retail unaffiliated channel was 61% for the year ended December 31, 2017. The success of sales in our retail unaffiliated channel depends upon our maintaining strong relationships with certain strategic partners, third party distributors and institutional accounts, as well as on the performance of our investment products marketed through this channel. Many of those distribution sources also offer investors competing funds that are internally or externally managed, or may reduce the number of competing products on their platforms through systemic rationalization and reduction, which could limit the distribution of our products. The loss of any of these distribution channels and the inability to continue to access new distribution channels could decrease our assets under management and adversely affect our results of operations and growth. There are no assurances that these channels and their client bases will continue to be accessible to us. The loss or diminution of the level of business we do with those providers could have a material adverse effect on our business. Compared to the industry average redemption rate of 22.9% and 25.4% for the years ended December 31, 2017 and 2016, respectively, the retail unaffiliated channel had redemption rates of 40.1% and 63.7% for the years ended December 31, 2017 and 2016, respectively. Redemption rates were 15.6% and 11.1% for our retail broker-dealer channel in the same periods, reflecting the higher rate of transferability of investment assets in the retail unaffiliated channel. However, the modernization of our brokerage and advisory platforms and products and the introduction of additional
12
unaffiliated investment products in our advisory programs, as well as changes resulting from the DOL Fiduciary Rule, may result in a higher redemption rate in our retail broker-dealer channel, as independent financial advisors may move to sell more unaffiliated products. An increase in the sale of unaffiliated mutual funds compared to sales of the Funds in our retail broker-dealer channel may reduce profits, as sales of unaffiliated mutual funds are less profitable than sales of our Funds. See “Legal, Regulatory and Tax Risks.”
Fee Pressures Could Reduce Our Revenues And Profitability. There is an accelerating trend toward lower fees in some segments of the investment management business. The SEC has adopted rules that are designed to alter mutual fund corporate governance, which could result in further downward pressure on investment advisory fees in the mutual fund industry. Investors and clients are increasingly fee sensitive. Active management continues to experience pressure by increased flows to lower fee passive products. This trend has resulted in pressure on active management firms to reduce fees to compete with passive products. The DOL Fiduciary Rule could increase fee pressure as financial advisors may have more fee sensitivity given their new fiduciary role. In addition, competition could cause us to reduce the fees we charge for products and services. In the event that competitors charge lower fees for substantially similar products, we may be forced to compete on the basis of price in order to attract and retain customers. The investment management agreements with the Funds continue in effect from year to year only if approved by the Funds’ board of trustees. Periodic review of these advisory agreements could result in a reduction in investment management fee revenues received from the Funds. Accordingly, there can be no assurance that we will be able to maintain our current fee structure. Fee reductions on existing or future new business could reduce our operating revenues and may adversely affect our business, future revenue and profitability.
The fees we earn vary depending on the type of asset managed, the type of client, the type of asset management product or service provided and whether the product is sub-advised. A shift in the mix of our assets under management from higher revenue-generating assets to lower revenue-generating assets may result in a decrease in our operating revenues even if our aggregate assets under management do not change. There can be no assurance that we will achieve a more favorable product mix in the future. See “Legal, Regulatory and Tax Risks.”
Our Ability To Attract And Retain Key Personnel Is Significant To Our Success And Growth. Our success is largely dependent on our ability to attract and retain highly skilled personnel, including our corporate officers, portfolio managers, investment analysts, and sales and client relationship personnel, many of whom have specialized expertise and extensive experience in our industry. The market for experienced asset management personnel is extremely competitive, and is increasingly characterized by the movement of employees among different firms. Our employees do not have employment contracts, and generally can terminate their employment with us at any time. Due to the competitive market for these professionals and the success of our highly skilled employees, our costs to attract and retain key personnel are significant. If we are unable to offer competitive compensation or otherwise attract and retain talented individuals, the Company’s ability to compete effectively and retain its existing clients may be materially impacted. Because the investment track record of many of our products and services is often attributed to a small number of individual employees, the departure of one or more of these employees could damage our reputation and result in the loss of assets or client accounts, which could have a material adverse effect on our results of operations and financial condition. If we are unable to attract and retain qualified personnel, it could damage our reputation, make it more difficult to retain and attract new employees, cause our retention costs to increase significantly, and materially adversely impact our financial condition and results of operations.
Additionally, a significant portion of the sales of our mutual funds, investment products, annuities and insurance products are sold in our retail broker-dealer channel. Our growth prospects are directly affected by the quality, quantity and productivity of these financial advisors who continue to manage their independent practices through their association with us.
There May Be An Adverse Effect On Our Business If Our Investors Redeem The Assets We Manage On Short Notice. Our investment management agreements with institutions and other non-mutual fund accounts are generally terminable upon relatively short notice, and investors in the Funds that we manage may redeem their investments in the Funds at any time without prior notice. Institutional and individual clients can terminate their relationships with us, reduce the aggregate amount of assets under management, or shift their funds to other types of accounts with different rate structures for any number of reasons, including investment trends, investment performance, changes in prevailing interest rates, changes in investment preferences of clients, changes in our reputation in the marketplace, changes in management or control of clients or third party distributors with whom we have relationships, loss of key investment management or other personnel, and financial market performance. In addition, in a declining securities market, the pace of mutual fund
13
redemptions and withdrawal of assets from other accounts could accelerate. Poor investment performance generally or relative to other investment management firms tends to result in decreased purchases of Fund shares, increased redemptions of Fund shares, and the loss of institutional or individual accounts. The risk of our investors redeeming their investments in the Funds on short notice has increased materially due to the level of assets in our retail unaffiliated channel and the high concentration of assets in certain Funds in this channel. Additionally, redemptions in our retail broker-dealer channel may increase materially with the introduction of additional unaffiliated investment products in our advisory programs. The implementation of the DOL Fiduciary Rule could also result in increased redemptions. An increase in redemptions and the corresponding decrease in our assets under management may have a material adverse effect on our business.
There May Be Adverse Effects On Our Business Upon The Termination Of, Or Failure To Renew, Certain Agreements. A majority of our revenues are derived from investment management agreements with the Funds that, as required by law, are terminable on 60 days’ notice. Each investment management agreement must be approved and renewed annually by the disinterested members of each Fund’s board of trustees or its shareholders, as required by law. Additionally, our investment management agreements provide for automatic termination in the event of assignment, which includes a change of control, without the consent of our clients and, in the case of the Funds, approval of the Funds’ board of trustees and shareholders to continue the agreements. There can be no assurances that our clients will consent to any assignment of our investment management agreements, or that those and other contracts will not be terminated or will be renewed on favorable terms, if at all, at their expiration and new agreements may not be available. See “Item. 1 Business – Distribution Channels – Retail Unaffiliated Distribution Channel” and “Institutional Channel.” The decrease in revenues that could result from any such event could have a material adverse effect on our business.
We May Be Unable To Develop New Products And Support Provided To New Products May Reduce Fee Revenue, Increase Expenses And Expose Us To Potential Loss On Invested Capital. Our financial performance depends, in part, on our ability to develop, market and manage new investment products and services, which may require significant time and resources, as well as ongoing support and investment. Substantial risk and uncertainties are associated with the introduction of new products and services, including the implementation of new and appropriate operational controls and procedures, shifting client and market preferences, the introduction of competing products or services, and compliance with regulatory requirements. A failure to continue to innovate to introduce new products and services, or to manage successfully the risks associated with such products and services, may impact our market share relevance and may cause our assets under management, revenue and earnings to decline.
Additionally, we may support the development of new investment products by waiving a portion of the fees we usually receive for managing such products, by subsidizing expenses, or by making seed capital investments. There can be no assurance that new investment products we develop will be successful, which could have a material adverse effect on our business. Failure to have or devote sufficient capital to support new products could have an adverse impact on our future growth. Seed capital investments in new products utilize capital that would otherwise be available for general corporate purposes and expose us to capital losses due to investment market risk. Our non-operating investment and other income could be adversely affected by the realization of losses upon the disposition of our investments or the recognition of significant other-than-temporary impairments in the case of our available-for-sale portfolio and the recognition of unrealized losses related to our sponsored investment portfolios that are held as trading and accounted for under the equity method. We may use various derivative instruments to mitigate the risk of our seed capital investments, although some market risk would remain. The risk of loss may be greater for seed capital investments that are not hedged, or if an intended hedge does not perform as expected. Our use of derivatives would result in counterparty risk in the event of non-performance by counterparties to these derivative instruments, regulatory risk and the risk that the underlying positions do not move in relation to the related derivative instruments. As a result, volatility in the capital markets may affect the value of our seed capital investments, which may increase the volatility of our earnings and adversely affect our business.
The Failure Or Negative Performance Of Products Offered By Competitors May Cause Assets Under Management In Our Similar Products To Decline Irrespective Of The Performance Of Our Products. Many competitors offer similar products to those offered by us and the failure or negative performance of competitors’ products or the loss of confidence in a product type could lead to a loss of confidence in similar products offered by us, irrespective of the performance of our products. Any loss of confidence in a product type could lead to redemptions in such products, which may cause the Company’s assets under management to decline and materially affect our business.
The Impairment Or Failure Of Other Financial Institutions Could Adversely Affect Our Business. The investment management activities expose the Company, and the Funds and institutional clients we manage, to many
14
different industries and counterparties. We routinely execute transactions with counterparties, including brokers-dealers, commercial and investment banks, clearing organizations, mutual and hedge funds, and other institutional clients that expose us or the Funds or accounts we manage to operational, credit or other risks in the event that a counterparty with whom the Company transacts defaults on its obligations or if there are other unrelated systemic failures in the markets. Although we regularly assess risks posed by counterparties, such counterparties may be subject to sudden swings in the financial and credit markets that may impair their ability to perform or they may otherwise fail to meet their obligations. Any such impairment failure could negatively impact the performance of products or accounts we manage, which could lead to the loss of clients and may cause our assets under management, revenue and earnings to decline.
Regulations Restricting The Use Of “Soft Dollars” Could Result In An Increase In Our Expenses. On behalf of our mutual fund and investment advisory clients, we make decisions to buy and sell securities for each portfolio, select broker-dealers to execute trades, and negotiate brokerage commission rates. In connection with these transactions, we may receive “soft dollar credits” from broker-dealers that we can use to defray certain of our research and brokerage expenses consistent with Section 28(e) of the Investment Company Act of 1940, as amended. If regulations are adopted eliminating the ability of asset managers to use “soft dollars,” our operating expenses could increase.
LEGAL, REGULATORY AND TAX RISKS
Regulatory Risk Is Substantial In Our Business And Regulatory Reforms Could Have A Material Adverse Effect On Our Business, Reputation And Prospects. Virtually all aspects of our business, including the activities of our parent company and our investment advisory and broker-dealer subsidiaries, are heavily regulated, primarily at the federal level. See Item 1 – “Business – Regulation.” The regulatory environment in which we operate frequently changes and has seen a significant increase in regulation in recent years, which could have a material adverse effect on our business.
Potential impacts of current or proposed legal or regulatory requirements include, without limitation, the following:
|
· |
As part of the debate in Washington, D.C. related to the economy and the U.S. deficit, there has been increasing focus on the framework of the U.S. retirement system. Under the DOL Fiduciary Rule, firms and individuals who recommend financial products to retirement investors would be required to act in the best interest of the investor and, to receive variable compensation, would be required to enter into a contract with clients and produce complex disclosure documents intended to highlight financial conflicts of interest that may arise from the compensation the financial advisor receives from firms like us. As discussed in more detail below, these regulations have wide-ranging consequences for the Company. Additionally, changes to the current retirement system framework may impact our business in other ways. For example, proposals to reduce contributions to IRAs and defined contribution plans for certain individuals, as well as potential changes to defined benefit plans, may result in increased plan terminations and reduce our opportunity to manage and service retirement assets. |
|
· |
In addition to the DOL Fiduciary Rule, it is expected that the SEC will separately propose a rule that would establish a uniform fiduciary duty standard applicable to broker-dealers and investment advisers. Similar to the DOL Fiduciary Rule, such a rule, if adopted, could have wide ranging impact on our business and the businesses of those parties through which we distribute our products. For example, such a rule could result in increased costs or increased regulatory risks for the Company. Such a rule could necessitate changes in our product structures in order to accommodate the new rules or changed business conditions. In addition, it could reduce our opportunities to distribute our products through our current network of business partners and hinder our ability to develop new business relationships. |
|
· |
In July 2010, the Dodd-Frank Wall Street Reform and Consumer Protection Act (the “Dodd-Frank Act”) was signed into law. The Dodd-Frank Act established enhanced regulatory requirements for non-bank financial institutions designated as “systemically important” by the Financial Stability Oversight Committee (“FSOC”). Under a final rule and interpretive guidance issued by the FSOC in April 2012, certain non-bank financial companies have been designated as Systemically Important Financial Institutions (“SIFIs”). Additional non-bank financial companies, which may include large asset management companies such as us, may be designated as SIFIs in the future. We do not believe that mutual funds should be deemed SIFIs. Further, we do not believe SIFI designation was intended for traditional asset management businesses. However, if any of the Funds or our affiliates is deemed a SIFI, we would be subject to enhanced prudential |
15
measures, which could include capital and liquidity requirements, leverage limits, enhanced public disclosures and risk management requirements, annual stress testing by the Federal Reserve, credit exposure and concentration limits, supervisory and other requirements. These heightened regulatory obligations could, individually or in the aggregate, adversely impact our business and operations. |
|
· |
Pursuant to the mandate of the Dodd-Frank Act, the Commodity Futures Trading Commission (the “CFTC”) and the SEC have promulgated rules that increase the regulation of over-the-counter derivatives markets. The CFTC has adopted certain amendments to its rules that would limit the ability of mutual funds and certain other products we sponsor to use commodities, futures, swaps, and other derivatives without additional registration. If our use of these products on behalf of client accounts increases so as to require registration, we would be subject to additional regulatory requirements and costs associated with registration. The Dodd-Frank Act also expanded the CFTC’s authority to limit the maximum long or short position that any person may take in futures contracts, options on futures contracts and certain swaps. CFTC rules implementing this authority could apply to the activities of the Company and complying with these rules may negatively affect the Company’s financial condition or performance by requiring changes to existing strategies or preventing an investment strategy from being fully implemented. |
|
· |
On July 23, 2014, the SEC adopted additional reforms regulating money market funds to address the perceived systemic risks that such funds present. These reforms, which became effective in October 2016, require certain institutional non-government money market funds to operate with a floating net asset value (“NAV”), which allows the daily share prices of these funds to fluctuate along with changes in the market-based value of fund assets, and require all non-government money market funds to impose liquidity fees and redemption limits or “gates” when fund liquidity is depleted. Government and retail money market funds will continue using current pricing and accounting methods to seek to maintain a stable NAV. The new rules do not apply to government (non-municipal) money market funds, although such funds may “opt-in” to the new liquidity fee and redemption gate provisions if previously disclosed to investors. The SEC also adopted other reforms for money market funds, including additional disclosure and reporting requirements, tightening of diversification requirements, and enhanced stress testing. The impact of the rules that affect the structure of the funds on our business remains uncertain as clients continue to decide which products fit their investment needs. The new rules have impacted both the money market funds and shareholders in the form of additional implementation costs and ongoing operational costs. The changes have required extensive client communications to avoid confusion concerning product changes and will likely limit the returns these Funds can generate in exchange for additional liquidity and shortened maturities. |
|
· |
The SEC and its staff continue to engage in various initiatives and reviews that seek to modify the regulatory structure governing the asset management industry, and registered investment companies in particular. In 2016, the SEC adopted new rules to revise Form ADV and establish Form N-PORT, which require mutual funds to report information about their monthly portfolio holdings to the SEC in a structured data format and impose further reporting obligations on us and the Funds. These filings have required, and will continue to require, significant investments in people and systems to ensure timely and accurate reporting. In late 2016, the SEC adopted new rules that require registered open-end funds to adopt liquidity risk management programs with specific requirements for measuring and reporting the liquidity of fund holdings. These rules could limit investment opportunities for certain Funds we manage and may increase our management and administration costs, with potential adverse effects on our revenues, expenses and results of operations. The SEC has also been directed toward risk identification and controls in trading practices, cyber-security and the evaluation of systemic risks and has indicated an intention to propose new rules for transition planning by asset managers, including the transfer of client assets. When finalized, these new rules can be expected to add additional reporting and compliance costs and may affect the development of new products and the ability to continue to offer certain strategies through a registered investment company format. |
|
· |
There has been increased global regulatory focus on the manner in which intermediaries are paid for distribution of mutual funds. Changes to long-standing market practices related to fees or enhanced disclosure requirements may negatively impact sales of mutual funds by intermediaries, especially if such requirements are not applied to other investment products. |
|
· |
In recent years the asset management and financial services industries have experienced heightened regulatory examinations and inspections, including enforcement reviews, and a more aggressive posture |
16
regarding commencing enforcement proceedings resulting in fines, penalties and additional remedial activities to firms and to individuals. Such an enforcement proceeding, if involving the Company, also could lead to potential harm to business reputation and could result in loss of client relationships. Without limiting the generality of the foregoing, regulators in the U.S. have taken, and can be expected to continue to take, a more aggressive posture on bringing enforcement proceedings. |
At this time, we cannot predict the nature or full impact of future changes to the legal and regulatory requirements applicable to our business, nor the extent to which current or future proposals, or possible enforcement proceedings, will impact our business. All of these new and developing laws and regulations are likely to result in greater compliance and administrative burdens on the Company, including the investment of significant management time and resources in order to satisfy new regulatory requirements or to compete in a changed business environment, and the imposition of new compliance costs and/or capital requirements, including costs related to information technology systems. The evolving regulatory environment may impact a number of our service providers and, to the extent such providers alter their services or increase their fees, it may impact our expenses or those of the products we offer. Changes in current rules and regulations that impact the business and financial communities generally, including changes in current legal, regulatory, accounting or compliance requirements, including state and federal taxation, or in governmental policies, could have a material adverse impact on our results of operations, financial condition or liquidity.
The Department Of Labor’s New Fiduciary Regulations Could Result In Material Changes In Our Business Model, Operations And Procedures, Including Our Distribution Channels And Product Offerings, Which Could Have A Material Adverse Effect On Our Business and Results Of Operations. On April 8, 2016, the DOL published the DOL Fiduciary Rule, its final rule regarding the definition of who is an investment advice fiduciary under the Employee Retirement Income Security Act of 1974, as amended (“ERISA”) and Section 4975 of the Internal Revenue Code, as amended, a new “best interest contract” prohibited transaction exemption regarding how such advice can be provided to retirement investors (primarily account holders in 401(k) plans, IRAs and other types of ERISA clients), a new class prohibited transaction exemption for how ERISA investment advice fiduciaries can engage in certain principal transactions with retirement investors, and certain amendments and partial revocations of pre-existing exemptions. The DOL Fiduciary Rule focuses in large part on conflicts of interest related to investment recommendations made by financial advisors, registered investment advisers, and other investment professionals to retirement investors, how financial advisors are able to discuss IRA rollovers, as well as how financial advisors and affiliates can transact with retirement investors. Firms and individuals that recommend financial products to retirement investors would be required to act in the best interest of the investor and, to receive variable compensation, would be required to enter into a contract with clients and produce complex disclosure documents intended to highlight financial conflicts of interest that may arise from the compensation the financial advisor receives.
These regulations have wide-ranging consequences for the Company, our distribution partners and our product offerings. Qualified accounts, particularly IRAs, make up a significant portion of our assets under management and administration. Further, a significant portion of those retirement assets are invested in our affiliated products. The DOL Fiduciary Rule, coupled with the introduction of unaffiliated products in our advisory programs and sustained underperformance of key investment products, could cause us to experience lower sales of our affiliated investment products, increased redemptions, or other developments that could materially and adversely affect our business.
The expanded fiduciary definition became applicable on June 9, 2017, as did the revised exemptions subject to certain transition provisions that expire on July 1, 2019. The DOL is studying whether to make changes to the DOL Fiduciary Rule as adopted. We are continuing with the implementation of our business and compliance initiatives in order to make necessary changes to our distribution methods and operations. We intend to work with, and provide guidance to, our wealth management and asset management businesses, including independent financial advisors in our retail broker-dealer channel, to make the necessary changes to effectively implement these new regulations. We are likely to incur additional compliance costs in 2018 for required consulting, legal advice and technology enhancements.
The DOL Fiduciary Rule will require various changes in the asset management industry and, among other things, our distribution methods, compensation models, products, and business operations that could materially and adversely affect our marketing strategy, our fee structure, our independent financial advisor compensation model, our ability to engage with independent financial advisors, and the design of our investments and services for qualified accounts, any of which could materially and adversely affect our results of operations. Similarly, various changes in the asset management industry due to the DOL Fiduciary Rule may result in product rationalization and reduction, as well as changes to our share classes and fee structures, revenue sharing arrangements, and investment opportunities for certain funds we
17
manage. The DOL Fiduciary Rule will require us to implement new policies and procedures designed to comply with the new requirements. There are no assurances that we will be able to successfully execute the significant changes and enhancements to our business model, operations, technology and compliance policies and procedures required by the DOL Fiduciary Rule in a timely manner, which could materially and adversely affect our business. The new rules create additional liability exposure to regulatory enforcement activity, including litigation and arbitration, which may result in awards, settlements, penalties, injunctions, reputational risk, costs of defense regardless of outcome, or other adverse results. The SEC is targeting July 2019 for the release of its own fiduciary rule proposal; any such rule may also have an impact on our business activities.
Compliance Within A Complex Regulatory Environment Imposes Significant Financial And Strategic Costs On Our Business, and Non-Compliance Could Result in Fines And Penalties. Non-compliance with applicable laws or regulations could result in criminal and civil liability, the suspension of our employees, sanctions being levied against us, including fines, penalties and censures, injunctive relief, suspension or expulsion from a certain jurisdiction or market, or the temporary or permanent revocation of licenses or registrations necessary to conduct our business. A regulatory proceeding, even one that does not result in a finding of wrongdoing or sanctions, could consume substantial expenditures of time and capital. Any regulatory investigation and any failure to maintain compliance with applicable laws and regulations could severely damage our reputation or otherwise adversely affect our business and prospects.
Our Business Is Subject To Substantial Risk From Litigation, Regulatory Investigations And Potential Securities Laws Liability. Many aspects of our business involve substantial risks of litigation, regulatory investigations and/or arbitration, and from time to time, we are involved in various legal proceedings in the course of operating our business, including employment-related claims. See Item 3 – “Legal Proceedings.” We are exposed to liability under federal and state securities laws, other federal and state laws and court decisions, as well as rules and regulations promulgated by the SEC, FINRA and other regulatory bodies. These regulatory bodies have the authority to review our products and business practices, and those of employees and independent financial advisors, and to bring regulatory or other legal actions against us if, in their view, our practices, or those of employees or independent financial advisors, are improper. Actions brought against us may result in awards, settlements, penalties, injunctions or other adverse results, including reputational damage. In addition, we may incur significant expenses in connection with our defense against such actions regardless of their outcome. We, our subsidiaries, and/or certain of our past and present officers, have been named as parties in legal actions, regulatory investigations and proceedings, and/or securities arbitrations in the past, and have been subject to claims alleging violation of such laws, rules and regulations, which have resulted in the payment of fines and settlements. From time to time, we receive subpoenas or other requests for information from governmental and regulatory authorities in connection with certain industry-wide, company-specific or other investigations or proceedings. These examinations, inquiries and proceedings, have in the past and could in the future, if compliance failures or other violations are found, cause the relevant regulator to institute proceedings and impose sanctions for violations. Any such action may also result in litigation by investors in the Funds, other clients or by our stockholders, which could harm the Company’s reputation, potentially harm the investment returns of the Funds, or result in the Company being liable for damages.
In addition, the Funds to which we provide investment advisory and management services are subject to litigation and governmental and self-regulatory organization investigations and proceedings, any of which could harm the investment returns or reputation of the applicable Fund or result in our investment adviser subsidiaries being liable to the Funds for any resulting damages.
There has been an increase in litigation and regulatory investigations in the asset management and financial services industries in recent years, including customer claims, class action suits and government actions alleging substantial monetary damages and penalties. The “best interest contract” prohibited transaction exemption (“PTE”) under the DOL Fiduciary Rule prohibits class action waivers in best interest contracts, which also create private rights of action for IRA owners. To the extent we rely on the “best interest contract” PTE, we may be exposed to additional litigation risk associated with claims that we have failed to comply with the best interest contract and related PTE. An adverse resolution of any lawsuit, legal or regulatory proceeding or claim against us could result in substantial costs or reputational harm to us, and have a material adverse effect on our business. In addition to these financial costs and risks, the defense of litigation, regulatory investigations or arbitration may divert resources and management’s attention from operations.
Insurance May Not Be Available On A Cost Effective Basis To Protect Us From Liability. We face inherent liability risk related to litigation from mutual fund investors, clients, third party vendors and others, and actions taken by regulatory agencies. To help protect against these potential liabilities, we purchase insurance in amounts, and against
18
risks, that we consider appropriate and commercially reasonable, where such insurance is available at prices we deem acceptable. There can be no assurance, however, that a claim or claims will be covered by insurance or, if covered, will not exceed the limits of available insurance coverage, that any insurer will remain solvent and will meet its obligations to provide us with coverage, or that insurance coverage will continue to be available with sufficient limits at a reasonable cost. Insurance costs are impacted by market conditions and the risk profile of the insured, and may increase significantly over relatively short periods. In addition, certain insurance coverage may not be available or may only be available at prohibitive costs. Renewals of insurance policies may expose us to additional costs through higher premiums or the assumption of higher deductibles or co-insurance liability.
Financial Advisors In Our Retail Broker-Dealer Channel Are Classified As Independent Contractors, And Changes To Their Classification May Increase Our Operating Expenses. From time to time, various legislative or regulatory proposals are introduced at the federal or state levels addressing the criteria for determining the status of independent contractors’ classification as employees for either employment tax purposes (withholding, social security, Medicare and unemployment taxes) or other employment benefits. Currently, most individuals are classified as employees or independent contractors for employment tax purposes based on relevant statutory, regulatory and common law tests, including the multi-factor test utilized by the Internal Revenue Service. We classify financial advisors associated with W&R as independent contractors for all purposes, including employment tax. There can be no assurance that legislative, judicial or regulatory (including tax) authorities will not introduce proposals or assert interpretations of existing rules and regulations that would change the independent contractor classification of those financial advisors currently associated with us or that private litigants might file actions seeking to change such classification. The costs associated with potential changes, if any, with respect to these independent contractor classifications could have a material adverse effect on our business.
Misconduct By Our Employees And/Or By Independent Financial Advisors Could Result In Liability, Subject Us To Regulatory Sanctions Or Otherwise Adversely Affect Our Business, Results of Operations or Financial Condition. Our business is based on the trust and confidence of our clients, for whom independent financial advisors handle a significant amount of funds, as well as financial and personal information. Misconduct by our employees or by independent financial advisors could result in violations of law, regulatory sanctions and/or serious reputational or financial harm. Misconduct that could occur includes: (i) binding us to transactions that exceed authorized limits; (ii) hiding unauthorized or unsuccessful activities resulting in unknown and unmanaged risks or losses; (iii) improperly using, disclosing or otherwise compromising confidential information; (iv) recommending transactions that are not suitable; (v) engaging in fraudulent or otherwise improper activity, including the misappropriation of funds; (vi) engaging in unauthorized or excessive trading to the detriment of customers; or (vii) otherwise not complying with laws, regulations or our control procedures. Although we have implemented a system of internal controls to minimize the risk of misconduct, there can be no assurance that our controls or precautions to detect and prevent misconduct will be effective in all cases. Preventing and detecting misconduct among independent financial advisors, who are not employees, presents additional challenges. We could be liable in the event of misconduct by employees or independent financial advisors and we could also be subject to regulatory sanctions. Although we believe that we have adequately insured against these risks, there can be no assurance that our insurance will be maintained or that it will be adequate to meet any liability resulting from these activities. Any damage to the trust and confidence placed in us by our clients may cause our assets under management to decline, which could adversely affect our reputation, business and prospects and lead to a material adverse effect on our business, results of operations or financial condition.
The Application of Tax Laws and Regulations and Challenges To Our Tax Positions May Adversely Affect Our Effective Tax Rate and Business. The application of complex tax laws and regulations, including the Tax Cuts and Jobs Act enacted on December 22, 2017 (the “Tax Reform Act”), involves numerous uncertainties. The Company has recognized the provisional tax impact of the Tax Reform Act related to the revaluation of deferred tax assets and liabilities and included these amounts in its consolidated financial statements for the year ended December 31, 2017. The ultimate impact may differ from these provisional amounts, possibly materially, due to, among other things, additional analysis, changes in interpretations and assumptions the Company has made, additional regulatory guidance that may be issued, and actions the Company may take as a result of the Tax Reform Act. The impact of the Tax Reform Act is expected to be complete when the Company’s 2017 U.S. corporate income tax return is filed in 2018.
Tax authorities may disagree with certain tax positions that we have taken, as we are periodically under audit by various state and federal jurisdictions. We regularly assess the likely outcomes of these audits in order to determine the appropriateness of our tax provision. However, there can be no assurance that we will accurately predict the outcomes of these audits, and the actual outcomes of these audits could have a material impact on our financial statements. Tax
19
authorities may assess additional taxes, which could result in adjustments to, or impact the timing or amount of, taxable income, deductions or other tax allocations, and may adversely affect our effective tax rate and business.
TECHNOLOGY AND OPERATIONAL RISKS
Our Business Is Subject to Numerous Operational Risks. Sustained Interruptions In Our Operating Systems, Technology Systems, Or Other Failure In Operational Execution, Could Materially And Adversely Affect Our Business. We face numerous and complex operational risks related to our business on a day-to-day basis. Operating risks include, but are not limited to:
|
· |
failure to properly perform or oversee mutual fund or portfolio recordkeeping responsibilities, including portfolio accounting, security pricing, corporate actions, investment restrictions compliance, daily NAV computations, account reconciliations, and required distributions to Fund shareholders to comply with tax regulations; |
|
· |
failure to properly perform transfer agent and participant recordkeeping responsibilities, including transaction processing, supervision of staff, tax reporting, and record retention; |
|
· |
sales and marketing risks, including the intentional or unintentional misrepresentation of products and services in advertising materials, public relations information, or other external communications, and failure to properly calculate and present investment performance data accurately and in accordance with established guidelines and regulations; |
|
· |
failure to properly perform brokerage business responsibilities, including processing trades and client information timely and accurately, maintenance of books and records, execution of financial planning activities, and supervisory and compliance activities; and |
|
· |
our reliance on third party vendors who, now or in the future, may perform or support important parts of our operations as there can be no assurance that they will perform properly or that our processes and plans to execute, transition or delegate these functions to others will be successful or that there will not be interruptions in services from these third parties. |
The systems upon which we rely upon to conduct our business may fail to operate properly or become disabled as a result of events that are wholly or partially beyond our control, including a disruption of electrical or communications services, termination or capacity constraints of any of the clearing agents, exchanges, clearing houses or other third party service providers that we use to facilitate, or are component providers to, our brokerage operations, securities transactions and other product manufacturing and distribution activities. Any such failure, termination or constraint could adversely impact our ability to effect transactions, service our clients, manage our exposure to risk, or otherwise achieve desired outcomes. Failure to keep current and accurate books and records can render us subject to disciplinary action by governmental and self-regulatory authorities, as well as to claims by our clients. In connection with the modernization of our brokerage and advisory platforms and products, a significant portion of our software is licensed from and supported by third party vendors upon whom we rely to prevent operating system failure. A suspension or termination of these licenses or the related support, upgrades and maintenance could cause system delays or interruption. If any of our financial, portfolio accounting, brokerage or other data processing systems, or the systems of third parties on whom we rely, do not operate properly or are disabled, or if there are other shortcomings or failures in our internal processes, people or systems, or those of third parties on whom we rely, we could suffer financial loss, a disruption of our businesses, liability to clients, regulatory problems or damage to our reputation.
Interruptions could be caused by operational failures arising from service provider, employee or advisor error or malfeasance, interference by third parties, including hackers, our implementation of new technology, as well as from our maintenance of existing technology. Our financial, accounting, brokerage, data processing or other operating systems and facilities may fail to operate or report data properly, experience connectivity disruptions or otherwise become disabled as a result of events that are wholly or partially beyond our control, adversely affecting our ability to process transactions or provide products and services to our clients. These interruptions can include fires, floods, earthquakes and other natural disasters, power losses, equipment failures, attacks by third parties, failures of internal or vendor personnel, software, equipment or systems and other events beyond our control. Although we have developed and maintain a comprehensive business continuity plan, and require our key technology vendors and service providers to do the same, there are inherent
20
limitations in such plans and they might not, despite testing and monitoring, operate as designed. Further, we cannot control the execution of any business continuity plans implemented by our service providers.
Failure To Implement New Information Technology Systems Successfully Could Materially And Adversely Affect Our Business. We are in the process of modernizing our brokerage and advisory platforms and products and implementing new information technology systems, including innovative account management systems, real-time client access to information and financial planning tools that we believe will facilitate and improve our core businesses and our productivity, and position our retail broker-dealer channel for long-term competitiveness. Additionally, the DOL Fiduciary Rule will require significant changes to our business operations, including, but not limited to, our distribution methods, compensation models and product shelf. We may be required to make significant capital expenditures to maintain competitive infrastructure. Our technology infrastructure is vital to the competitiveness of our business. We depend on specialized technology to operate our business and a number of our key information technology systems were developed solely to handle our particular information technology infrastructure. Our continued success depends on our ability to effectively integrate necessary technology systems across our organization, and to adopt new or adapt existing technologies to meet client, industry, and regulatory demands. There can be no assurance that we will successfully implement new information technology systems, that our existing technology infrastructure can support new systems or changes to existing systems, that their implementation will be completed in a timely or cost effective manner, or that we will derive the expected benefits from these new systems. Failure to implement or maintain adequate information technology infrastructure may cause us to lose investors, clients, financial advisors and fail to maintain regulatory compliance, which could severely damage our reputation, impede our ability to support business growth, and materially and adversely affect our results of operations.
A Failure In Or Breach Of Our Operational Or Security Systems Or Our Technology Infrastructure, Or Those Of Third Parties, Or Failure To Maintain Adequate Business Continuity Plans, Could Result In A Material Adverse Effect On Our Business And Reputation. We are highly dependent upon the use of various proprietary and third party software applications and other technology systems to operate our business. As part of our normal operations, we process a large number of transactions on a daily basis and maintain and transmit confidential client and employee information, the safety and security of which is dependent upon the effectiveness of our information security policies, procedures, capabilities and employees to protect such systems and the data that reside on or are transmitted through them. Although we take protective measures and endeavor to modify these protective measures as circumstances warrant, technology is subject to rapid change and the nature of the threats continue to evolve. As a result, our operating and technology systems, software and networks may fail to operate properly or become disabled, or may be vulnerable to unauthorized access, inadvertent disclosure, loss or destruction of data (including confidential client information), computer viruses or other malicious code, cyber attacks and other events that could materially damage our operations, have an adverse security impact, or cause the disclosure or modification of sensitive or confidential information. Most of the software applications that we use in our business are licensed from, and supported, upgraded and maintained by, third party vendors. A suspension or termination of certain of these licenses or the related support, upgrades and maintenance could cause temporary system delays or interruption. We also take precautions to password protect and/or encrypt our laptops and other mobile electronic hardware. If such hardware is stolen, misplaced or left unattended, it may become vulnerable to hacking or other unauthorized use, creating a possible security risk and resulting in potentially costly actions by us. Further, while we have in place a disaster recovery plan to address business continuity and catastrophic and unpredictable events, there is no guarantee that this plan will be sufficient in responding to or ameliorating the effects of all disaster scenarios, and we may experience system delays and interruptions as a result of natural disasters, power failures, acts of war, and third party failures. In addition, we rely to varying degrees on outside vendors for disaster contingency support, and we cannot be assured that these vendors will be able to perform in an adequate and timely manner.
The breach of our operational or security systems or our technology infrastructure, or those of third parties, due to one or more of these events could cause interruptions, malfunctions or failures in our operations and/or the loss or inadvertent disclosure of confidential client information could result in substantial financial loss or costs, liability for stolen assets or information, breach of client contracts, client dissatisfaction and/or loss, regulatory actions, remediation costs to repair damage caused by the breach, additional security costs to mitigate against future incidents and litigation costs resulting from the incident. Although we seek to assess regularly and improve our existing business continuity plans, a major disaster, or one that affected certain important operating areas, or our inability to recover successfully should we experience a disaster or other business continuity problem, could materially interrupt our business operations and cause material financial loss, loss of human capital, regulatory actions, reputational harm or legal liability. These events, and those discussed above, could have a material adverse effect on our business and reputation.
21
Failure To Establish Adequate Controls And Risk Management Policies, The Circumvention Of Controls And Risk Management Policies, Or Fraud Could Have An Adverse Effect On Our Reputation And Financial Position. We have established a comprehensive risk management process and continue to enhance various controls, procedures, policies and systems to monitor and manage risks; however, we cannot assure that such controls, procedures, policies and systems will successfully identify and manage internal and external risks to our business. We are subject to the risk that our employees, contractors or other third parties may deliberately seek to circumvent established controls to commit fraud or act in ways that are inconsistent with our controls, policies and procedures. Persistent attempts to circumvent policies and controls, or repeated incidents involving fraud, conflicts of interests or transgressions of policies and controls, could have a materially adverse effect on our reputation and lead to costly regulatory inquiries, fines and/or sanctions.
Our Own Operational Failures Or Those Of Third Parties We Rely On, Including Failures Arising Out Of Human Error, Could Disrupt Our Business And Damage Our Reputation. Our business is highly dependent on our ability to process, on a daily basis, large numbers of transactions. These transactions generally must comply with client investment guidelines, as well as stringent legal and regulatory standards. Despite our employees being highly trained and skilled, due to the large number of transactions we process, errors may occur. If we make mistakes in performing our services that cause financial harm to our clients, our clients may seek to recover their losses. The occurrence of mistakes, particularly significant ones, could have a material adverse effect on our reputation and business.
RISKS RELATED TO OUR BUSINESS
A Failure To Protect Our Reputation Could Adversely Affect Our Businesses. Our reputation is one of our most important assets. Our ability to attract and retain customers, investors, employees and financial advisors is highly dependent upon external perceptions of our Company. Damage to our reputation could cause significant harm to our business and prospects and may arise from numerous sources, including litigation or regulatory actions, failing to deliver minimum standards of service and quality, compliance failures, any perceived or actual weakness in our financial strength or liquidity, technological, cybersecurity, or other security breaches (including attempted breaches) resulting in improper disclosure of client or employee personal information, unethical behavior, and the misconduct of employees, financial advisors and counterparties. Negative perceptions or publicity regarding these matters, even if they are baseless or eventually satisfactorily addressed, could damage our reputation among existing and potential customers, investors, employees and financial advisors. Reputations may take decades to build, and negative incidents can quickly erode trust and confidence, particularly if they result in adverse mainstream and social media publicity, governmental investigations or litigation. Adverse developments with respect to our industry may also, by association, negatively impact our reputation or result in greater regulatory or legislative scrutiny or litigation against us.
Our reputation is also dependent on our continued identification of and mitigation against conflicts of interest, including those relating to our proprietary activities. For example, conflicts may arise between our position as a provider of financial planning services and as an investment adviser to Funds that one of our financial advisors may recommend to a financial planning client. We have procedures and controls that are designed to identify, address and appropriately disclose perceived conflicts of interest. However, identifying and appropriately addressing conflicts of interest is complex, and our reputation could be damaged if we fail, or appear to fail, to address conflicts of interest appropriately.
In addition, the SEC and other federal and state regulators have increased their scrutiny of potential conflicts of interest, including through the implementation of the DOL Fiduciary Rule. It is possible that potential or perceived conflicts could give rise to litigation or enforcement actions. It is possible also that the regulatory scrutiny of, and litigation in connection with, conflicts of interest will make our clients less willing to enter into transactions in which such a conflict may occur, and may materially affect our business.
Our Expenses Are Subject To Fluctuations That Could Materially Affect Our Operating Results. Our results of operations are dependent on the level of expenses, which can vary significantly from period to period. Our expenses may fluctuate as a result of, among other things:
|
· |
expenses incurred in connection with our strategic plans to strengthen our long-term competitive position; |
|
· |
variations in the level of total compensation expense due to bonuses, equity compensation, changes in employee benefit costs due to regulatory or plan design changes, changes in our employee count and mix, competitive factors and inflation; |
22
|
· |
expenses incurred to support distribution of our investment products; |
|
· |
expenses incurred to develop new products; |
|
· |
expenses and capital costs incurred to maintain and enhance our administrative and operation services infrastructure, including compliance systems, technology assets, and related depreciation and amortization; |
|
· |
the future impairment of intangible assets or goodwill that is currently recognized on our balance sheet; |
|
· |
unanticipated costs incurred to protect investor accounts and client goodwill; |
|
· |
disruptions of third party services such as communications, power, client account management and processing systems, and mutual fund transfer agency and accounting systems; and |
|
· |
responding to significant changes in our business model brought on by regulatory change. |
Increases in our level of expenses, or our inability to reduce our level of expenses, could materially affect our operating results. In August 2017, we announced our goal of increasing pre-tax income by $30 to 40 million, on a run-rate basis, by 2019, of which we have already achieved approximately $20 million by December 31, 2017. If we are unable to effect appropriate expense reductions in a timely manner to align with decreases in our revenue due to, among other things, a decline in the level of our assets under management or our current business environment, through operational changes or performance improvement, our business may be adversely affected.
We Have Significant Goodwill and Intangibles On Our Balance Sheet, And Any Impairment Could Adversely Affect Our Results of Operations. At December 31, 2017, our total assets were approximately $1.38 billion, of which approximately $147.1 million, or 11%, consisted of goodwill and identifiable intangible assets. See Item 7 – “Management’s Discussion and Analysis of Financial Condition and Results of Operations – Critical Accounting Policies and Estimates.” We complete an ongoing review of goodwill and intangible assets for impairment on an annual basis or more frequently whenever events or a change in circumstances warrant. Important factors in determining whether an impairment of goodwill or intangible assets might exist include significant continued underperformance compared to peers, the likelihood of termination or non-renewal of a mutual fund advisory or sub-advisory contract or substantial changes in revenues earned from such contracts, significant changes in our business and products, material and ongoing negative industry or economic trends, or other factors specific to each asset or subsidiary being tested. Because of the significance of goodwill and other intangibles to our consolidated balance sheets, the impairment analysis is critical. Any changes in key assumptions about our business and our prospects, or changes in market conditions or other externalities, could result in an impairment charge. Any such charge could have a material effect on our results of operations.
We May Engage In Strategic Transactions And Opportunities That Could Create Risk In Order To Maintain Or Enhance Our Competitive Position. The Company has and may acquire or invest in businesses that it believes will add value and generate positive net returns. Any strategic transaction can involve a number of risks, including additional demands on our existing employees; additional or new regulatory requirements, operating facilities and technologies; adverse effects in the event acquired intangible assets or goodwill become impaired; and the existence of liabilities or contingencies not disclosed to or otherwise known by us prior to closing a transaction. Acquisitions also pose the risk that any business we acquire may lose customers or employees or could underperform relative to expectations. We could also experience financial or other setbacks if pending transactions encounter unanticipated problems, including problems related to closing or the integration of technology and new employees. There can be no assurance that we will find suitable candidates for strategic transactions at acceptable prices, have sufficient capital resources to pursue such transactions or be successful in negotiating the required agreements. Following the completion of an acquisition, we may have to rely on the seller to provide administrative and other support, including financial reporting and internal controls, to the acquired business for a period of time. There can be no assurance that such sellers will do so in a manner that is acceptable to us. We may be required to spend additional time or money on integration which could decrease its earnings and prevent the Company from focusing on the development and expansion of its existing business and services. These risks could result in decreased earnings and harm to the Company’s competitive position in the investment management and/or brokerage industry.
23
Our Ability To Maintain Our Credit Ratings And To Access The Capital Markets In A Timely Manner Should We Seek To Do So Depends On A Number Of Factors. Our access to the capital markets depends significantly on our credit ratings. We believe that rating agency concerns include, but are not limited to, the fact that our revenues are exposed to equity market volatility and the potential impact from regulatory changes to the industry. Additionally, the rating agencies could decide to downgrade the entire investment management industry based on their perspective of future growth and solvency. Material deterioration of these factors, and others defined by each rating agency, could result in downgrades to our credit ratings, thereby limiting our ability to generate additional financing. We cannot predict what actions rating organizations may take, or what actions we may take in response to the actions of rating organizations, which could adversely affect our business. As with other companies in the financial services industry, our ratings could be changed at any time and without any notice by the ratings organizations. Our credit facility borrowing rates are tied to our credit ratings. Management believes that solid investment grade ratings are an important factor in winning and maintaining institutional business and strives to manage the Company to maintain such ratings. A downgrade in our credit ratings, or the announced potential for a downgrade, could have a significant adverse effect on our financial condition and results of operations.
A reduction in our long-term credit ratings could increase our borrowing costs, could limit our access to the capital markets, and may result in outflows thereby reducing assets under management and operating revenues. Volatility in global finance markets may also affect our ability to access the capital markets should we seek to do so. If we are unable to access capital markets in a timely manner, our business could be adversely affected.
The Terms Of Our Credit Facility And Senior Unsecured Notes Impose Restrictions On Our Operations That May Adversely Impact Our Prospects And The Operations Of Our Business. There are no assurances that we will be able to raise additional capital if needed, which could negatively impact our liquidity, prospects and operations. We have entered into a three-year revolving credit facility (the “Credit Facility”) with various lenders providing for total availability of $100 million. Under the Credit Facility, the lenders may, at their option upon our request, expand the Credit Facility to $200 million. At February 9, 2018, there was no balance outstanding under the Credit Facility. We also have outstanding $95 million of 5.75% senior notes, series B, due 2021, which were issued on January 13, 2011 pursuant to a note purchase agreement. The terms and conditions of the Credit Facility and note purchase agreement impose restrictions that affect, among other things, our ability to incur additional debt, make capital expenditures and acquisitions, merge, sell assets, pay dividends and create or incur liens. Our ability to comply with the financial covenants set forth in the Credit Facility and note purchase agreement could be affected by events beyond our control, and there can be no assurance that we will achieve operating results that will comply with such terms and conditions, a breach of which could result in a default under our credit facility and note purchase agreement. In the event of a default under the Credit Facility and/or note purchase agreement, the banks could elect to declare the outstanding principal amount of the Credit Facility, all interest thereon, and all other amounts payable under the Credit Facility to be immediately due and payable, and the Company’s obligations under the senior unsecured notes could be accelerated and become due and payable, including any make-whole amount, respectively.
Our ability to meet our cash needs and satisfy our debt obligations will depend upon our future operating performance, asset values, the perception of our creditworthiness and, indirectly, the market value of our stock. These factors may be affected by prevailing economic, financial and business conditions and other circumstances, some of which are beyond our control. We anticipate that any funds generated by any borrowings from our existing credit facility and/or cash provided by operating activities will provide sufficient funds to finance our business plans, meet our operating expenses and service our debt obligations as they become due. However, in the event that we require additional capital, there can be no assurance that we will be able to raise such capital when needed or on satisfactory terms, if at all, and there can be no assurance that we will be able to renew or refinance our credit facility or senior unsecured notes upon their maturity or on favorable terms. If we are unable to raise capital or obtain financing, we may be forced to incur unanticipated costs or revise our business plan.
Net Capital Requirements May Impede The Business Operations Of Our Subsidiaries. Certain of our subsidiaries are subject to net capital requirements imposed by various federal, state, and foreign authorities. Each of our subsidiaries’ net capital meets or exceeds all current minimum requirements; however, a significant change in the required net capital, an operating loss, or an extraordinary charge against net capital could adversely affect the ability of our subsidiaries to expand or even maintain their operations if we were unable to make additional investments in them.
RISKS RELATED TO OUR COMMON STOCK
24
The Market Price Of Our Stock May Fluctuate. The market price of our Class A common stock may fluctuate widely, depending upon many factors, some of which may be beyond our control, including changes in expectations concerning our future financial performance and the future performance of the financial services industry in general, including financial estimates and recommendations by securities analysts; differences between our actual financial and operating results and those expected by investors and analysts; our strategic moves and those of our competitors, such as acquisitions, divestitures or restructurings; changes in the regulatory framework of the financial services industry and regulatory action; changes in and the adoption of accounting standards and securities and insurance rating agency processes and standards applicable to our businesses and the financial services industry; and changes in general economic or market conditions. Additionally, stock markets in general have experienced volatility that has often been unrelated to the operating performance of a particular company. These broad market fluctuations may adversely affect the trading price of our common stock.
Our Holding Company Structure Results In Structural Subordination And May Affect Our Ability To Fund Our Operations And Make Payments On Our Debt. We are a holding company and, accordingly, substantially all of our operations are conducted through our subsidiaries. As a result, our cash flow and our ability to service our debt, including $95 million of our senior notes, are dependent upon the earnings of our subsidiaries and the distribution of earnings, loans or other payments by our subsidiaries to us. Our subsidiaries are separate and distinct legal entities and have no obligation to pay any amounts due on our debt or provide us with funds for our payment obligations, whether by dividends, distributions, loans or other payments. In addition, any payment of dividends, distributions, loans or advances to us by our subsidiaries could be subject to statutory or contractual restrictions. Payments to us by our subsidiaries will also be contingent upon our subsidiaries’ earnings and business considerations. Our right to receive any assets of any of our subsidiaries upon their liquidation or reorganization, and therefore the right of the holders of our debt to participate in those assets, would be effectively subordinated to the claims of those subsidiaries’ creditors, including trade creditors. In addition, even if we were a creditor of any of our subsidiaries, our rights as a creditor would be effectively subordinate to any security interest in the assets of our subsidiaries and any indebtedness of our subsidiaries senior to that held by us.
There Are No Assurances That We Will Pay Future Dividends, Which Could Adversely Affect Our Stock Price. The Waddell & Reed Financial, Inc. Board of Directors (the “Board of Directors”) currently intends to continue to declare quarterly dividends on our Class A common stock. However, the declaration and payment of dividends is subject to the discretion of our Board of Directors. Any determination as to the payment of dividends, as well as the level of such dividends, will depend on, among other things, general economic and business conditions, our strategic plans, our financial results and condition, and contractual, legal, and regulatory restrictions on the payment of dividends by us or our subsidiaries. We are a holding company and, as such, our ability to pay dividends is subject to the ability of our subsidiaries to provide us with cash. There can be no assurance that the current quarterly dividend level will be maintained or that we will pay any dividends in any future period. Any change in the level of our dividends or the suspension of the payment of dividends could adversely affect our stock price. See Item 7 – “Management’s Discussion and Analysis of Financial Condition and Results of Operations – Liquidity and Capital Resources.”
Provisions Of Our Organizational Documents Could Deter Takeover Attempts, Which Some Of Our Stockholders May Believe To Be In Their Best Interest. Under our Restated Certificate of Incorporation, our Board of Directors has the authority, without action by our stockholders, to fix certain terms and issue shares of our Preferred Stock, par value $1.00 per share. Actions of our Board of Directors pursuant to this authority may have the effect of delaying, deterring or preventing a change in control of the Company. Other provisions in our Restated Certificate of Incorporation and in our Amended and Restated Bylaws impose procedural and other requirements that could be deemed to have anti-takeover effects, including replacing incumbent directors. Our Board of Directors is divided into three classes, each of which is to serve for a staggered three-year term after the initial classification and election, and incumbent directors may not be removed without cause, all of which may make it more difficult for a third party to gain control of our Board of Directors. In addition, as a Delaware corporation, we are subject to section 203 of the Delaware General Corporation Law. With certain exceptions, section 203 imposes restrictions on mergers and other business combinations between us and any holder of 15% or more of our voting stock.
ITEM 1B. Unresolved Staff Comments
None.
25
We own three buildings in the vicinity of buildings currently leased on our home office campus: two 50,000 square foot buildings and a 52,000 square foot building located in Overland Park, Kansas. Our existing home office lease agreements cover approximately 298,000 square feet located in Overland Park, Kansas and 38,000 square feet for our disaster recovery facility. In addition, we lease office space for sales management in various locations throughout the United States totaling approximately 734,000 square feet. In the opinion of management, the office space owned and leased by the Company is adequate for existing operating needs.
The information set forth in response to Item 103 of Regulation S-K under “Legal Proceedings” is incorporated by reference from Part II, Item 8. “Financial Statements and Supplementary Data,” Note 17 – Contingencies, of this Annual Report on Form 10-K.
ITEM 4. Mine Safety Disclosures
Not applicable.
ITEM 5. Market for Registrant’s Common Equity, Related Stockholder Matters and Issuer Purchases of Equity Securities
Our Class A common stock (“common stock”) is listed on the NYSE under the ticker symbol “WDR.” The following table sets forth the high and low sale prices of our common stock, as well as the cash dividends paid for the past two years:
Market Price
|
|
|
2017 |
|
2016 |
|
||||||||||||||
|
|
|
|
|
|
|
|
|
Dividend |
|
|
|
|
|
|
|
Dividend |
|
||
|
|
|
|
|
|
|
|
|
Per |
|
|
|
|
|
|
|
Per |
|
||
|
Quarter |
|
High |
|
Low |
|
Share |
|
High |
|
Low |
|
Share |
|
||||||
|
1 |
|
$ |
20.73 |
|
$ |
16.12 |
|
$ |
0.46 |
|
$ |
28.59 |
|
$ |
20.21 |
|
$ |
0.46 |
|
|
2 |
|
|
19.91 |
|
|
16.11 |
|
|
0.46 |
|
|
24.27 |
|
|
16.00 |
|
|
0.46 |
|
|
3 |
|
|
21.20 |
|
|
17.76 |
|
|
0.46 |
|
|
19.75 |
|
|
15.70 |
|
|
0.46 |
|
|
4 |
|
|
22.88 |
|
|
18.49 |
|
|
0.46 |
|
|
22.45 |
|
|
15.02 |
|
|
0.46 |
|
Year‑end closing prices of our common stock were $22.34 and $19.51 for 2017 and 2016, respectively. The closing price of our common stock on February 9, 2018 was $20.28.
According to the records of our transfer agent, we had 2,395 holders of record of common stock as of February 9, 2018. We believe that a substantially larger number of beneficial stockholders hold such shares in depository or nominee form.
Dividends
The declaration of dividends is subject to the discretion of the Board of Directors. We intend, from time to time, to pay cash dividends on our common stock as our Board of Directors deems appropriate, after consideration of our operating results, financial condition, cash and capital requirements, compliance with covenants in the Credit Facility, note purchase agreement and such other factors as the Board of Directors deems relevant. To the extent assets are used to meet minimum net capital requirements under the Net Capital Rule, they are not available for distribution to stockholders as dividends. See Part I, Item 1. “Business—Regulation.” We anticipate that quarterly dividends will continue to be paid. In connection with the implementation of our new capital return policy, the Company’s Board of Directors reduced the quarterly dividend on our common stock to $0.25 per share, for the dividend paid on February 1, 2018 to stockholders of
26
record as of January 11, 2018. See Part II, Item 7. “Management’s Discussion and Analysis of Financial Condition and Results of Operations—Liquidity and Capital Resources.”
Common Stock Repurchases
Our Board of Directors has authorized the repurchase of our common stock in the open market and/or private purchases. The acquired shares may be used for corporate purposes, including shares issued to employees in our stock‑based compensation programs. During the year ended December 31, 2017, we repurchased 1,842,337 shares in the open market and privately at an aggregate cost, including commissions, of $35.8 million, including 402,337 shares from employees to cover their tax withholdings from the vesting of shares granted under our stock‑based compensation programs. The aggregate cost of shares obtained from related parties during 2017 was $7.7 million. The purchase price paid by us for private repurchases of our common stock from related parties is the closing market price on the purchase date.
The following table sets forth certain information about the shares of common stock we repurchased during the fourth quarter of 2017:
|
|
|
|
|
|
|
|
Total Number of |
|
Maximum Number (or |
|
|
|
|
|
|
|
|
|
Shares |
|
Approximate Dollar |
|
|
|
|
|
|
|
|
|
Purchased as |
|
Value) of Shares That |
|
|
|
|
Total Number |
|
Average |
|
Part of Publicly |
|
May Yet Be |
|
|
|
|
|
of Shares |
|
Price Paid |
|
Announced |
|
Purchased Under The |
|
|
|
Period |
|
Purchased (1) |
|
per Share |
|
Program |
|
Program |
|
|
|
October 1 - October 31 |
|
— |
|
$ |
— |
|
— |
|
n/a |
(1) |
|
November 1 - November 30 |
|
125,020 |
|
|
19.05 |
|
125,000 |
|
n/a |
(1) |
|
December 1 - December 31 |
|
812,907 |
|
|
21.84 |
|
650,000 |
|
n/a |
(1) |
|
Total |
|
937,927 |
|
$ |
21.47 |
|
775,000 |
|
|
|
|
(1) |
On August 31, 1998, we announced that our Board of Directors approved a program to repurchase shares of our common stock on the open market. Under the repurchase program, we are authorized to repurchase, in any seven‑day period, the greater of (i) 3% of our outstanding common stock or (ii) $50 million of our common stock. We may repurchase our common stock in privately negotiated transactions or through the New York Stock Exchange, other national or regional market systems, electronic communication networks or alternative trading systems. Our stock repurchase program does not have an expiration date or an aggregate maximum number or dollar value of shares that may be repurchased. Our Board of Directors reviewed and ratified the stock repurchase program in October 2012. During the fourth quarter of 2017, we repurchased 775,000 shares of our common stock pursuant to the repurchase program and 162,927 shares, reflected in the table above, were purchased in connection with funding employee income tax withholding obligations arising from the vesting of nonvested shares. |
In connection with the implementation of our new capital return policy and based on our current financial forecast, we intend to purchase $250 million of our common stock from the fourth quarter of 2017 through the end of 2019, inclusive of buybacks to offset dilution of our equity grants.
27
Total Return Performance
Comparison of Cumulative Total Return (1)
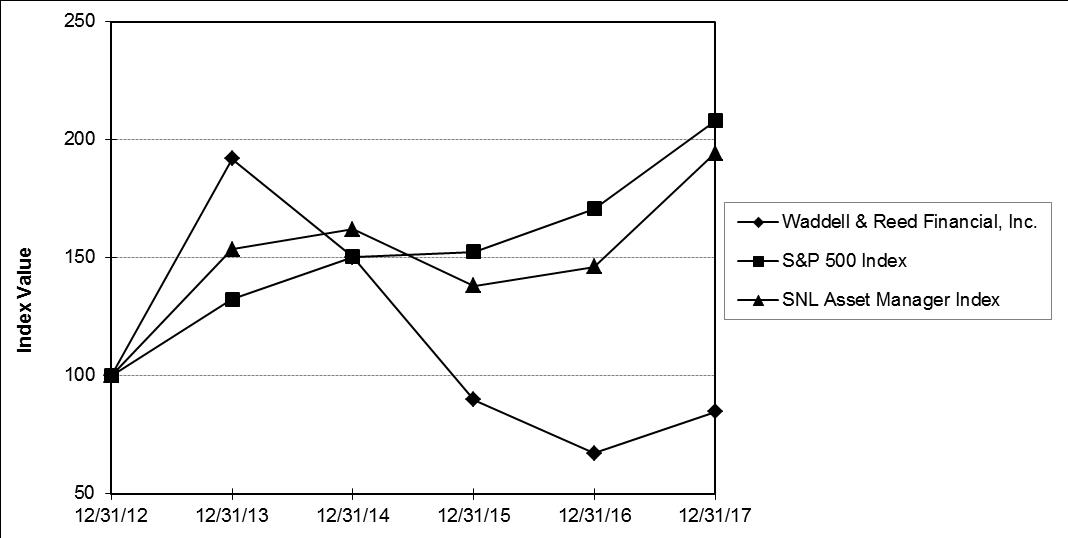
The above graph compares the cumulative total stockholder return on the Company’s common stock from December 31, 2012 through December 31, 2017 with the cumulative total return of the Standard & Poor’s 500 Stock Index and the SNL Asset Manager Index. The SNL Asset Manager Index is a composite of 41 publicly traded asset management companies (including, among others, the companies in the peer group reviewed by the Compensation Committee for executive compensation purposes) prepared by S&P Global Market Intelligence. The graph assumes the investment of $100 in the Company’s common stock and in each of the two indices on December 31, 2012 with all dividends being reinvested. The closing price of the Company’s common stock on December 31, 2012 was $34.82 per share. The stock price performance on the graph is not necessarily indicative of future price performance.
|
|
|
Period Ending |
|
||||||||||
|
Index |
|
12/31/2012 |
|
12/31/2013 |
|
12/31/2014 |
|
12/31/2015 |
|
12/31/2016 |
|
12/31/2017 |
|
|
Waddell & Reed Financial, Inc. |
|
100.00 |
|
191.89 |
|
150.15 |
|
89.87 |
|
67.11 |
|
84.67 |
|
|
SNL Asset Manager |
|
100.00 |
|
153.67 |
|
162.12 |
|
138.26 |
|
146.27 |
|
194.23 |
|
|
S&P 500 |
|
100.00 |
|
132.39 |
|
150.51 |
|
152.59 |
|
170.84 |
|
208.14 |
|
|
(1) |
Cumulative total return assumes an initial investment of $100 on December 31, 2012, with the reinvestment of all dividends through December 31, 2017. |
28
ITEM 6. Selected Financial Data
The following table sets forth our selected consolidated financial and other data as of the dates and for the periods indicated, and reflects continuing operations data. Selected financial data should be read in conjunction with, and is qualified in its entirety by, “Management’s Discussion and Analysis of Financial Condition and Results of Operations” and our Consolidated Financial Statements and the Notes thereto appearing elsewhere in this Annual Report.
|
|
|
For the Year Ended December 31, |
|
|||||||||
|
|
|
2017 |
|
2016 |
|
2015 |
|
2014 |
|
2013 |
|
|
|
|
|
(in thousands, except per share data and percentages) |
|
|||||||||
|
Revenues from: |
|
|
|
|
|
|
|
|
|
|
|
|
|
Investment management fees |
|
$ |
531,850 |
|
557,112 |
|
709,562 |
|
768,102 |
|
650,442 |
|
|
Underwriting and distribution fees |
|
|
518,699 |
|
561,670 |
|
663,998 |
|
678,678 |
|
582,819 |
|
|
Shareholder service fees |
|
|
106,595 |
|
120,241 |
|
143,071 |
|
150,979 |
|
137,093 |
|
|
Total revenues |
|
|
1,157,144 |
|
1,239,023 |
|
1,516,631 |
|
1,597,759 |
|
1,370,354 |
|
|
Net income attributable to Waddell & Reed Financial, Inc. |
|
$ |
141,279 |
|
156,695 |
|
237,578 |
|
285,360 |
|
280,655 |
|
|
Operating margin |
|
|
21 |
% |
20 |
% |
27 |
% |
28 |
% |
31 |
% |
|
Net income per share from continuing operations, basic and diluted |
|
$ |
1.69 |
|
1.90 |
|
2.85 |
|
3.38 |
|
3.28 |
|
|
Dividends declared per common share |
|
$ |
1.63 |
|
1.84 |
|
1.75 |
|
1.45 |
|
1.18 |
|
|
Shares outstanding at December 31, |
|
|
82,687 |
|
83,118 |
|
82,850 |
|
83,654 |
|
85,236 |
|
|
|
|
As of December 31, |
|
|||||||||
|
|
|
2017 |
|
2016 |
|
2015 |
|
2014 |
|
2013 |
|
|
|
|
|
(in millions) |
|
|||||||||
|
Assets under management |
|
$ |
81,082 |
|
80,521 |
|
104,399 |
|
123,650 |
|
126,543 |
|
|
|
|
|
|
|
|
|
|
|
|
|
|
|
|
Balance sheet data: |
|
|
|
|
|
|
|
|
|
|
|
|
|
Goodwill and identifiable intangible assets |
|
$ |
147.1 |
|
148.6 |
|
158.1 |
|
158.1 |
|
162.0 |
|
|
Total assets |
|
|
1,384.4 |
|
1,406.3 |
|
1,555.2 |
|
1,511.1 |
|
1,336.0 |
|
|
Long-term debt |
|
|
94.8 |
|
189.6 |
|
189.4 |
|
189.3 |
|
189.1 |
|
|
Total liabilities |
|
|
497.0 |
|
551.6 |
|
708.7 |
|
725.0 |
|
648.7 |
|
|
Total Waddell & Reed stockholders’ equity |
|
|
872.9 |
|
844.0 |
|
846.5 |
|
786.1 |
|
687.3 |
|
29
ITEM 7. Management’s Discussion and Analysis of Financial Condition and Results of Operations
The following should be read in conjunction with the “Selected Financial Data” and our Consolidated Financial Statements and Notes thereto appearing elsewhere in this Annual Report.
Strategic Initiatives
In 2017, we announced an actionable plan around four strategic pillars that is estimated to add $30 million to $40 million, on a run-rate basis, to pre-tax net income by 2019. The plan includes: (1) strengthening our investment management resources, processes and results; (2) reinvigorating our product line and sales; (3) continuing the evolution of our broker-dealer to a self-sustaining, fully competitive and profitable entity; and (4) making investments in support of our evolving business model, while improving efficiency. To strengthen our investment management resources, processes and results, we are working to align investment management resources and our philosophy toward the strongest growth opportunities, key products and new initiatives, and to fortify the foundation of our active management heritage. Over the course of 2017, we invested in our people, technology resources, and risk management capabilities, fortified our research team with additional investment analysts and implemented a central data collaboration warehouse to capture and leverage our intellectual capital. To reinvigorate our product line and sales, we are managing the product line dynamically to respond to the competitive environment and opportunities for growth, and are directing sales activities to the best opportunities across product, channel, distributor and advisor. In 2017, we introduced a customer relationship management tool that facilitates targeted sales for our unaffiliated distribution channel. We also began merging the Advisors Funds family into the Ivy Funds family, resulting in operational efficiency and added fund-level scale. Those mergers will be completed in the first quarter of 2018. To continue the evolution of our broker-dealer to a self-sustaining, fully competitive and profitable entity, we are improving competitiveness by evolving the platform and product offering; developing new revenue streams; and moved to an industry standard compensation and support model. We realigned our field resources under a new market structure model in 2017 and established new business processing systems and technology. To focus investment in support of our evolving business model while improving efficiency, we are investing in our people and technology to ensure optimal productivity, driven by performance-based compensation and enhanced human resource capabilities. Additionally, introduced an enterprise project management organization (PMO) and related project processes and governance, and are driving targeted allocation and efficient utilization of corporate resources. We will continue to monitor our cost reduction plans while making strategic investments in our business to position ourselves for long-term success, and have realized approximately $20 million of our goal, primarily through implementation of the broker-dealer market structure model and freezing future benefit accruals under our pension plan.
Operating Results
We earned $1.2 billion in revenues in 2017. The revenue decrease of 7% relative to 2016 was reflective of a decrease in our average assets under management of 9%, partially offset by an increase in the average management fee rate. Average assets under management were $81.0 billion in 2017 compared to $88.8 billion in 2016. Net income attributable to Waddell & Reed Financial, Inc. decreased 10% compared to 2016, while our operating margin increased to 20.8% from 20.3%.
Our balance sheet remains strong, as we ended the year with cash and investments of $902.7 million, excluding noncontrolling interests. There were no borrowings under the Credit Facility at December 31, 2017 or at any point during the year.
Assets Under Management
Assets under management of $81.1 billion on December 31, 2017 increased $0.6 billion, or 1%, compared to $80.5 billion on December 31, 2016. The increase in assets under management is primarily due to market appreciation of $11.9 billion, partially offset by net outflows of $11.4 billion.
30
Change in Assets Under Management (1)
|
|
|
Retail |
|
Retail |
|
|
|
|
|
||
|
|
|
Unaffiliated |
|
Broker- |
|
|
|
|
|
||
|
|
|
Distribution |
|
Dealer |
|
Institutional |
|
Total |
|
||
|
|
|
(in millions) |
|
||||||||
|
2017 |
|
|
|
|
|
|
|
|
|
|
|
|
Beginning Assets |
|
$ |
30,295 |
|
42,322 |
|
7,904 |
|
80,521 |
|
|
|
Sales(2) |
|
|
7,243 |
|
4,221 |
|
356 |
|
11,820 |
|
|
|
Redemptions |
|
|
(11,990) |
|
(7,753) |
|
(3,446) |
|
(23,189) |
|
|
|
Net Exchanges |
|
|
1,001 |
|
(1,007) |
|
6 |
|
— |
|
|
|
Net Flows |
|
|
(3,746) |
|
(4,539) |
|
(3,084) |
|
(11,369) |
|
|
|
Market Action |
|
|
4,584 |
|
5,877 |
|
1,469 |
|
11,930 |
|
|
|
Ending Assets at December 31, 2017 |
|
$ |
31,133 |
|
43,660 |
|
6,289 |
|
81,082 |
|
|
|
2016 |
|
|
|
|
|
|
|
|
|
|
|
|
Beginning Assets |
|
$ |
45,641 |
|
43,344 |
|
15,414 |
|
104,399 |
|
|
|
Sales(2) |
|
|
6,362 |
|
4,287 |
|
1,065 |
|
11,714 |
|
|
|
Redemptions |
|
|
(22,438) |
|
(5,736) |
|
(8,860) |
|
(37,034) |
|
|
|
Net Exchanges |
|
|
458 |
|
(712) |
|
254 |
|
— |
|
|
|
Net Flows |
|
|
(15,618) |
|
(2,161) |
|
(7,541) |
|
(25,320) |
|
|
|
Market Action |
|
|
272 |
|
1,139 |
|
31 |
|
1,442 |
|
|
|
Ending Assets at December 31, 2016 |
|
$ |
30,295 |
|
42,322 |
|
7,904 |
|
80,521 |
|
|
|
2015 |
|
|
|
|
|
|
|
|
|
|
|
|
Beginning Assets |
|
$ |
60,335 |
|
45,517 |
|
17,798 |
|
123,650 |
|
|
|
Sales(2) |
|
|
12,218 |
|
5,073 |
|
2,743 |
|
20,034 |
|
|
|
Redemptions |
|
|
(23,686) |
|
(5,044) |
|
(5,081) |
|
(33,811) |
|
|
|
Net Exchanges |
|
|
809 |
|
(809) |
|
— |
|
— |
|
|
|
Net Flows |
|
|
(10,659) |
|
(780) |
|
(2,338) |
|
(13,777) |
|
|
|
Market Action |
|
|
(4,035) |
|
(1,393) |
|
(46) |
|
(5,474) |
|
|
|
Ending Assets at December 31, 2015 |
|
$ |
45,641 |
|
43,344 |
|
15,414 |
|
104,399 |
|
|
|
(1) |
Includes all activity of the Funds, the IGI Funds and institutional and separate accounts, including money market funds and transactions at net asset value, accounts for which we receive no commissions. |
|
(2) |
Primarily gross sales (net of sales commission), but also includes net reinvested dividends and capital gains and investment income. |
Average assets under management, which are generally more indicative of trends in revenue for providing investment management services than the year over year change in ending assets under management, decreased by 9% compared to 2016.
31
Average Assets Under Management
|
|
|
2017 |
|
2016 |
|
2015 |
|
|||||||||
|
|
|
|
|
|
Percentage |
|
|
|
Percentage |
|
|
|
Percentage |
|
||
|
|
|
Average |
|
of Total |
|
Average |
|
of Total |
|
Average |
|
of Total |
|
|||
|
|
|
(in millions, except percentage data) |
|
|||||||||||||
|
Distribution Channel: |
|
|
|
|
|
|
|
|
|
|
|
|
|
|
||
|
Retail Unaffiliated Distribution |
|
|
|
|
|
|
|
|
|
|
|
|
|
|
||
|
Equity |
|
$ |
23,549 |
|
78 |
% |
28,078 |
|
79 |
% |
45,434 |
|
82 |
% |
||
|
Fixed income |
|
|
6,662 |
|
22 |
% |
7,289 |
|
21 |
% |
9,848 |
|
18 |
% |
||
|
Money market |
|
|
105 |
|
— |
|
159 |
|
— |
|
154 |
|
— |
|
||
|
Total |
|
$ |
30,316 |
|
100 |
% |
35,526 |
|
100 |
% |
55,436 |
|
100 |
% |
||
|
Retail Broker-Dealer |
|
|
|
|
|
|
|
|
|
|
|
|
|
|
||
|
Equity |
|
$ |
31,485 |
|
72 |
% |
30,681 |
|
72 |
% |
33,799 |
|
74 |
% |
||
|
Fixed income |
|
|
10,243 |
|
24 |
% |
9,828 |
|
23 |
% |
9,911 |
|
22 |
% |
||
|
Money market |
|
|
1,862 |
|
4 |
% |
2,029 |
|
5 |
% |
1,864 |
|
4 |
% |
||
|
Total |
|
$ |
43,590 |
|
100 |
% |
42,538 |
|
100 |
% |
45,574 |
|
100 |
% |
||
|
Institutional |
|
|
|
|
|
|
|
|
|
|
|
|
|
|
||
|
Equity |
|
$ |
6,773 |
|
96 |
% |
10,026 |
|
93 |
% |
15,440 |
|
93 |
% |
||
|
Fixed income |
|
|
298 |
|
4 |
% |
711 |
|
7 |
% |
1,134 |
|
7 |
% |
||
|
Money market |
|
|
— |
|
— |
|
— |
|
— |
|
— |
|
— |
|
||
|
Total |
|
$ |
7,071 |
|
100 |
% |
10,737 |
|
100 |
% |
16,574 |
|
100 |
% |
||
|
Total by Asset Class: |
|
|
|
|
|
|
|
|
|
|
|
|
|
|
||
|
Equity |
|
$ |
61,807 |
|
76 |
% |
68,785 |
|
77 |
% |
94,673 |
|
80 |
% |
||
|
Fixed income |
|
|
17,203 |
|
21 |
% |
17,828 |
|
20 |
% |
20,893 |
|
18 |
% |
||
|
Money market |
|
|
1,967 |
|
3 |
% |
2,188 |
|
3 |
% |
2,018 |
|
2 |
% |
||
|
Total |
|
$ |
80,977 |
|
100 |
% |
88,801 |
|
100 |
% |
117,584 |
|
100 |
% |
||
32
The following table summarizes our five largest mutual funds as of December 31, 2017 by ending assets under management and investment management fees, with the comparative positions in 2016 and 2015. The assets under management and management fees of these mutual funds are presented as a percentage of our total assets under management and total management fees. The increase in assets under management in the Ivy Core Equity Fund is primarily due to the merger of Advisor Core Investment Fund during the fourth quarter of 2017.
Five Largest Mutual Funds by Ending Assets Under Management and Investment Management Fees
|
|
|
2017 |
|
2016 |
|
2015 |
|
|||||||
|
|
|
|
|
|
Percentage |
|
|
|
Percentage |
|
|
|
Percentage |
|
|
|
|
Ending |
|
of Total |
|
Ending |
|
of Total |
|
Ending |
|
of Total |
|
|
|
|
|
(in millions, except percentage data) |
|
|||||||||||
|
By Assets Under Management: |
|
|
|
|
|
|
|
|
|
|
|
|
|
|
|
|
|
|
|
|
|
|
|
|
|
|
|
|
|
|
|
Ivy International Core Equity |
|
$ |
7,140 |
|
9 |
% |
4,405 |
|
5 |
% |
4,505 |
|
4 |
% |
|
Ivy Core Equity |
|
|
4,742 |
|
6 |
% |
972 |
|
1 |
% |
1,201 |
|
1 |
% |
|
Ivy High Income |
|
|
4,180 |
|
5 |
% |
4,616 |
|
6 |
% |
5,263 |
|
5 |
% |
|
Ivy Science & Technology |
|
|
4,116 |
|
5 |
% |
3,829 |
|
5 |
% |
5,921 |
|
6 |
% |
|
Advisors Science and Technology |
|
|
3,620 |
|
4 |
% |
3,186 |
|
4 |
% |
3,469 |
|
3 |
% |
|
Total |
|
$ |
23,798 |
|
29 |
% |
17,008 |
|
21 |
% |
20,359 |
|
19 |
% |
|
|
|
(in thousands, except percentage data) |
|
|||||||||||
|
By Management Fees: |
|
|
|
|
|
|
|
|
|
|
|
|
|
|
|
Ivy International Core Equity |
|
$ |
45,017 |
|
8 |
% |
35,181 |
|
6 |
% |
31,074 |
|
4 |
% |
|
Ivy Science & Technology |
|
|
32,933 |
|
6 |
% |
36,428 |
|
7 |
% |
49,199 |
|
7 |
% |
|
Advisors Science & Technology |
|
|
28,940 |
|
5 |
% |
25,698 |
|
5 |
% |
30,019 |
|
4 |
% |
|
Ivy Asset Strategy |
|
|
24,992 |
|
5 |
% |
50,501 |
|
9 |
% |
126,688 |
|
18 |
% |
|
Ivy High Income |
|
|
23,672 |
|
4 |
% |
25,106 |
|
5 |
% |
37,938 |
|
5 |
% |
|
Total |
|
$ |
155,554 |
|
28 |
% |
172,914 |
|
32 |
% |
274,918 |
|
38 |
% |
Results of Operations
Net Income
|
|
|
For the Year ended |
|
|
|
|
|
|||||
|
|
|
December 31, |
|
Variance |
|
|||||||
|
|
|
|
|
|
|
|
|
|
2017 vs. |
|
2016 vs. |
|
|
|
|
2017 |
|
2016 |
|
2015 |
|
2016 |
|
2015 |
|
|
|
|
|
(in thousands, except per share and percentage data) |
|
|||||||||
|
Net income attributable to Waddell & Reed |
|
|
|
|
|
|
|
|
|
|
|
|
|
Financial, Inc. (in thousands) |
|
$ |
141,279 |
|
156,695 |
|
237,578 |
|
(10) |
% |
(34) |
% |
|
Earnings per share, basic and diluted |
|
$ |
1.69 |
|
1.90 |
|
2.85 |
|
(11) |
% |
(33) |
% |
|
Operating Margin |
|
|
21 |
% |
20 |
% |
27 |
% |
1 |
% |
(7) |
% |
Total Revenues
Total revenues decreased 7% in 2017 compared to 2016, primarily attributable to a decrease in average assets under management of 9%. Total revenues decreased 18% in 2016 compared to 2015, attributable to a decrease in average assets under management of 24% and a decrease in sales of 42%.
33
|
|
|
For the Year ended |
|
|
|
|
|
|||||
|
|
|
December 31, |
|
Variance |
|
|||||||
|
|
|
|
|
|
|
|
|
|
2017 vs. |
|
2016 vs. |
|
|
|
|
2017 |
|
2016 |
|
2015 |
|
2016 |
|
2015 |
|
|
|
|
|
(in thousands, except percentage data) |
|
|||||||||
|
Investment management fees |
|
$ |
531,850 |
|
557,112 |
|
709,562 |
|
(5) |
% |
(21) |
% |
|
Underwriting and distribution fees |
|
|
518,699 |
|
561,670 |
|
663,998 |
|
(8) |
% |
(15) |
% |
|
Shareholder service fees |
|
|
106,595 |
|
120,241 |
|
143,071 |
|
(11) |
% |
(16) |
% |
|
Total revenues |
|
$ |
1,157,144 |
|
1,239,023 |
|
1,516,631 |
|
(7) |
% |
(18) |
% |
Investment Management Fee Revenues
Investment management fee revenues are earned by providing investment advisory services to the Funds, the IGI Funds and to institutional and separate accounts. Investment management fee revenues decreased $25.3 million, or 5%, in 2017 and decreased $152.5 million, or 21%, in 2016.
Investment management fee revenues are based on the level of average assets under management and are affected by sales, financial market conditions, redemptions and the composition of assets. The following graph illustrates the direct relationship between average assets under management and investment management fee revenues for the years ending December 31, 2017, 2016 and 2015.
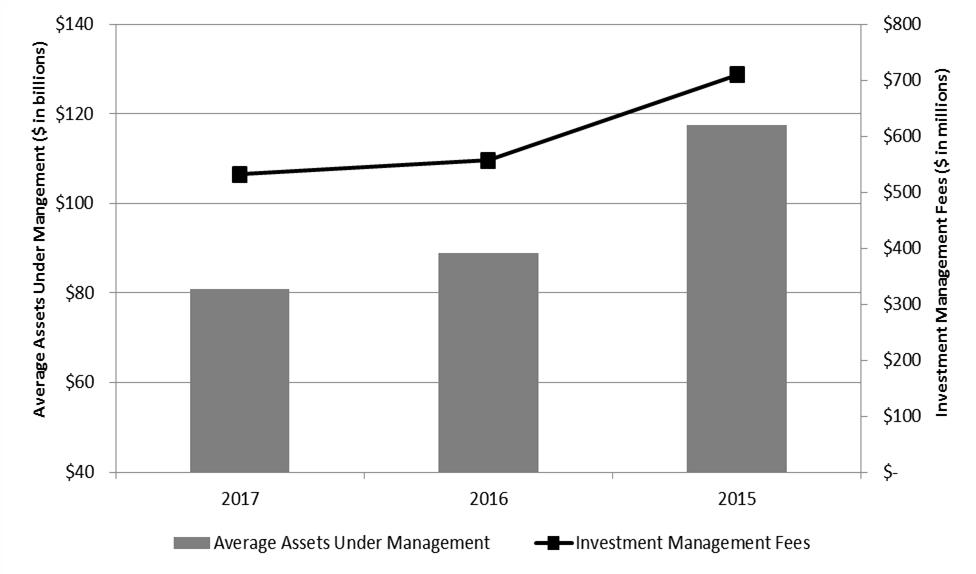
34
The following table summarizes investment management fee revenues, related average assets under management, fee waivers and investment management fee rates for the years ending December 31, 2017, 2016 and 2015.
|
|
|
For the Year ended |
|
|
|
|
|
|||||||
|
|
|
December 31, |
|
Variance |
|
|||||||||
|
|
|
|
|
|
|
|
|
|
|
|
2017 vs. |
|
2016 vs. |
|
|
|
|
2017 |
|
2016 |
|
2015 |
|
2016 |
|
2015 |
|
|||
|
|
|
(in thousands, except for management fee rate, average assets and |
|
|||||||||||
|
|
|
percentage data) |
|
|||||||||||
|
Retail investment management fees |
|
$ |
506,868 |
|
|
521,207 |
|
|
652,494 |
|
(3) |
% |
(20) |
% |
|
Retail average assets (in millions) |
|
|
73,906 |
|
|
78,065 |
|
|
101,010 |
|
(5) |
% |
(23) |
% |
|
Retail management fee rate |
|
|
0.6858 |
% |
|
0.6677 |
% |
|
0.6460 |
% |
|
|
|
|
|
|
|
|
|
|
|
|
|
|
|
|
|
|
|
|
|
Money market fee waivers |
|
|
231 |
|
|
3,158 |
|
|
7,239 |
|
(93) |
% |
(56) |
% |
|
Other fee waivers |
|
|
7,417 |
|
|
4,952 |
|
|
3,646 |
|
50 |
% |
36 |
% |
|
Total fee waivers |
|
$ |
7,648 |
|
|
8,110 |
|
|
10,885 |
|
(6) |
% |
(25) |
% |
|
|
|
|
|
|
|
|
|
|
|
|
|
|
|
|
|
Institutional investment management fees |
|
$ |
24,982 |
|
|
35,905 |
|
|
57,068 |
|
(30) |
% |
(37) |
% |
|
Institutional average assets (in millions) |
|
|
7,071 |
|
|
10,737 |
|
|
16,574 |
|
(34) |
% |
(35) |
% |
|
Institutional management fee rate |
|
|
0.3786 |
% |
|
0.3502 |
% |
|
0.3443 |
% |
|
|
|
|
Revenues from investment management services provided to our retail mutual funds, which are distributed through the retail unaffiliated distribution and retail broker-dealer channels, decreased $14.3 million in 2017, or 3%, compared to 2016. Revenues from investment management services provided to our retail mutual funds decreased $131.3 million in 2016, or 20%, compared to 2015. For both comparative periods, investment management fee revenues declined less on a percentage basis than the related average assets under management due to an increase in the average management fee rate. A lower asset base in the Ivy Asset Strategy Fund has resulted in increased management fee rates for both comparative periods, due to the fund having a management fee rate less than our average management fee rate. Fee waivers for the Funds are recorded as an offset to investment management fees up to the amount of fees earned and declined in 2017 due to lower money market fee waivers as a result of federal interest rate hikes in 2017 and 2016. Other fee waivers increased in 2017 compared to 2016 primarily due to the launch of new funds.
Institutional and separate account revenues in 2017 decreased $10.9 million, or 30%, compared to 2016 due to a 34% decrease in average assets under management. Institutional and separate account revenues in 2016 decreased $21.2 million, or 37%, compared to 2015 due to a 35% decrease in average assets under management. For both comparative periods, account revenues declined less on a percentage basis than the related average assets under management due to an increase in the average management fee rate driven by a mix‑shift of assets into investment styles and account types with higher management fee rates.
In the fourth quarter of 2017, nine Advisors Funds merged into Ivy Funds with substantially similar objectives and strategies. The mergers of the remaining Advisors Funds into Ivy Funds are expected to close in February of 2018. As a result, the Company anticipates investment management fee revenue in 2018 to decline between $10.0 million and $11.0 million.
|
|
|
Annualized long-term redemption rates |
|
||||
|
|
|
(excludes money market redemptions) |
|
||||
|
|
|
for the year ended December 31, |
|
||||
|
|
|
2017 |
|
2016 |
|
2015 |
|
|
Retail Unaffiliated Distribution channel |
|
40.1 |
% |
63.7 |
% |
43.0 |
% |
|
Retail Broker-Dealer channel |
|
15.6 |
% |
11.1 |
% |
9.1 |
% |
|
Institutional channel |
|
48.7 |
% |
82.5 |
% |
30.7 |
% |
|
Total |
|
27.8 |
% |
41.1 |
% |
28.3 |
% |
The decreased long-term redemption rate in 2017 compared to 2016 for the retail unaffiliated distribution channel was primarily driven by improved redemption rates in the Ivy Asset Strategy Fund, Ivy VIP Asset Strategy and Waddell & Reed Advisors Asset Strategy Fund (prior to being renamed in May of 2017) (the “Asset Strategy funds”). Redemptions in the Asset Strategy funds represented approximately 18% of the retail unaffiliated distribution channel’s redemptions during 2017, reduced from 42% in 2016. The increased long-term redemption rate in 2016 compared to 2015 for the retail
35
unaffiliated distribution channel was primarily driven by increased redemption activity in the Asset Strategy funds. Prolonged redemptions in the retail unaffiliated distribution channel could negatively affect revenues in future periods. In the retail broker-dealer channel, we historically experienced a long‑term redemption rate lower than that of the industry average. With the modernizing of our retail broker-dealer platform and the introduction of new fee-based products, such as the launch of the MAP Navigator product in 2017 (which increases the availability of third party products), we experienced pressure on the long-term redemption rate in 2017 and expect continued pressure on the long-term redemption rate for our proprietary products. In 2017, the institutional channel experienced an overall decrease in redemption activity with less significant redemptions from our core equity, core fixed income and large cap core strategies, compared to 2016. The increased long-term redemption rate for our institutional channel in 2016 compared to 2015 was primarily driven by a $2.0 billion redemption from an Asset Strategy account that we subadvise, a $2.1 billion redemption from an institutional account in our Large Cap Growth strategy, and an $800.0 million redemption from an institutional account in our Municipal High Income strategy. Our overall redemption rate of 27.8% in 2017 is higher than the industry average of 22.9% based on data provided by the ICI.
Underwriting and Distribution
We earn underwriting and distribution fee revenues primarily by distributing the Funds pursuant to an underwriting agreement with each Fund (except Ivy VIP as explained below) and by distributing mutual funds offered by other unaffiliated companies. Pursuant to each agreement, we offer and sell the Funds’ shares on a continuous basis (open‑end funds) and pay certain costs associated with underwriting and distributing the Funds, including the costs of developing and producing sales literature and printing of prospectuses, which may be either partially or fully reimbursed by the Funds. The Funds are sold in various classes that are structured in ways that conform to industry standards (i.e., “front‑end load,” “back‑end load,” “level‑load” and institutional).
We offer several fee‑based asset allocation products. These products offer clients a selection of traditional asset allocation models, as well as features such as systematic rebalancing and client and advisor participation in determining asset allocation across asset classes. We earn asset‑based fees on our asset allocation products. In connection with the implementation of significant enhancements to our investment advisory programs and financial planning capabilities, referred to internally as “Project E,” we converted the load‑waived Class A shares previously offered in our investment advisory programs to institutional share classes, which do not charge a Rule 12b‑1 fee. As a result, we no longer collect Rule 12b‑1 asset‑based service and distribution fee revenue on these assets under management.
We distribute variable products offering Ivy VIP as investment vehicles pursuant to general agency arrangements with our business partners and receive commissions, marketing allowances and other compensation as stipulated by such agreements. In connection with these arrangements, Ivy VIP is offered and sold on a continuous basis.
In addition to distributing variable products, we distribute a number of other insurance products through our insurance agency subsidiary, including individual term life, group term life, whole life, accident and health, long‑term care, Medicare supplement and disability insurance. We receive commissions and compensation from various underwriters for distributing these products. We are not an underwriter for any insurance policies.
Underwriting and Distribution Fee Revenues and Expenses
The following tables illustrate our underwriting and distribution fee revenues and expenses segregated by distribution channel for the years ended December 31, 2017, 2016 and 2015:
|
|
|
Total |
|
2017 vs. |
|
2016 vs. |
|
|||||
|
|
|
2017 |
|
2016 |
|
2015 |
|
2016 |
|
2015 |
|
|
|
|
|
(in thousands, except percentage data) |
|
|||||||||
|
Revenues |
|
$ |
518,699 |
|
561,670 |
|
663,998 |
|
(8) |
% |
(15) |
% |
|
Expenses—Direct |
|
|
(416,383) |
|
(477,314) |
|
(589,810) |
|
(13) |
% |
(19) |
% |
|
Expenses—Indirect |
|
|
(177,040) |
|
(187,334) |
|
(184,618) |
|
(5) |
% |
1 |
% |
|
Net Distribution Costs |
|
$ |
(74,724) |
|
(102,978) |
|
(110,430) |
|
27 |
% |
7 |
% |
36
|
|
|
Retail Unaffiliated Distribution Channel |
|
2017 vs. |
|
2016 vs. |
|
|||||
|
|
|
2017 |
|
2016 |
|
2015 |
|
2016 |
|
2015 |
|
|
|
Revenues |
|
$ |
93,994 |
|
125,415 |
|
194,041 |
|
(25) |
% |
(35) |
% |
|
Expenses—Direct |
|
|
(130,077) |
|
(164,641) |
|
(254,778) |
|
(21) |
% |
(35) |
% |
|
Expenses—Indirect |
|
|
(38,178) |
|
(52,210) |
|
(56,284) |
|
(27) |
% |
(7) |
% |
|
Net Distribution Costs |
|
$ |
(74,261) |
|
(91,436) |
|
(117,021) |
|
19 |
% |
22 |
% |
|
|
|
Retail Broker-Dealer Channel |
|
2017 vs. |
|
2016 vs. |
|
|||||
|
|
|
2017 |
|
2016 |
|
2015 |
|
2016 |
|
2015 |
|
|
|
Revenues |
|
$ |
424,706 |
|
436,255 |
|
469,957 |
|
(3) |
% |
(7) |
% |
|
Expenses—Direct |
|
|
(286,306) |
|
(312,673) |
|
(335,032) |
|
(8) |
% |
(7) |
% |
|
Expenses—Indirect |
|
|
(138,862) |
|
(135,124) |
|
(128,334) |
|
3 |
% |
5 |
% |
|
Net Distribution (Costs)/Excess |
|
$ |
(462) |
|
(11,542) |
|
6,591 |
|
96 |
% |
(275) |
% |
The following tables summarize the significant components of underwriting and distribution fee revenues segregated by distribution channel for the years ended December 31, 2017, 2016 and 2015:
|
|
|
Total |
|
|||||
|
|
|
2017 |
|
2016 |
|
2015 |
|
|
|
|
|
(in thousands) |
|
|||||
|
Underwriting and distribution fee revenues: |
|
|
|
|
|
|
|
|
|
Fee-based asset allocation product revenues |
|
$ |
240,089 |
|
224,319 |
|
224,918 |
|
|
Rule 12b-1 service and distribution fees |
|
|
167,163 |
|
215,186 |
|
309,279 |
|
|
Sales commissions on front-end load mutual fund and variable annuity sales |
|
|
56,791 |
|
67,734 |
|
78,923 |
|
|
Sales commissions on other products |
|
|
31,286 |
|
31,246 |
|
24,096 |
|
|
Other revenues |
|
|
23,370 |
|
23,185 |
|
26,782 |
|
|
Total |
|
$ |
518,699 |
|
561,670 |
|
663,998 |
|
|
|
|
Retail Unaffiliated Distribution Channel |
|
|||||
|
|
|
2017 |
|
2016 |
|
2015 |
|
|
|
|
|
(in thousands) |
|
|||||
|
Underwriting and distribution fee revenues: |
|
|
|
|
|
|
|
|
|
Rule 12b-1 service and distribution fees |
|
$ |
91,313 |
|
121,926 |
|
186,994 |
|
|
Sales commissions on front-end load mutual fund sales |
|
|
1,498 |
|
565 |
|
3,091 |
|
|
Other revenues |
|
|
1,183 |
|
2,924 |
|
3,956 |
|
|
Total |
|
$ |
93,994 |
|
125,415 |
|
194,041 |
|
|
|
|
Retail Broker-Dealer Channel |
|
|||||
|
|
|
2017 |
|
2016 |
|
2015 |
|
|
|
|
|
(in thousands) |
|
|||||
|
Underwriting and distribution fee revenues: |
|
|
|
|
|
|
|
|
|
Fee-based asset allocation product revenues |
|
$ |
240,089 |
|
224,319 |
|
224,918 |
|
|
Rule 12b-1 service and distribution fees |
|
|
75,850 |
|
93,260 |
|
122,285 |
|
|
Sales commissions on front-end load mutual fund and variable annuity sales |
|
|
55,293 |
|
67,169 |
|
75,832 |
|
|
Sales commissions on other products |
|
|
31,286 |
|
31,246 |
|
24,096 |
|
|
Other revenues |
|
|
22,188 |
|
20,261 |
|
22,826 |
|
|
Total |
|
$ |
424,706 |
|
436,255 |
|
469,957 |
|
A significant portion of underwriting and distribution revenues are received from asset‑based fees earned on our asset allocation products and commissions. Underwriting and distribution revenues also include Rule 12b‑1 asset‑based service and distribution fees earned on load, load‑waived and deferred‑load products sold by W&R independent financial advisors and third party intermediaries, sales commissions charged on front‑end load products sold by W&R independent financial advisors, including mutual fund Class A shares (those sponsored by the Company and those underwritten by other non‑proprietary mutual fund companies), variable annuities, sales of other insurance products, and financial planning fees. A significant amount of retail unaffiliated distribution channel mutual fund sales are load‑waived.
37
We divide the costs of underwriting and distribution into two components—direct costs and indirect costs. Direct selling costs fluctuate with sales volume, such as advisor commissions and commissions paid to field management, advisor incentive compensation, commissions paid to third parties and to our own wholesalers, and related management commissions in our retail unaffiliated distribution channel. Direct selling costs also fluctuate with assets under management, such as Rule 12b‑1 service and distribution fees paid to third parties. Indirect selling costs are fixed costs that do not necessarily fluctuate with sales levels. Indirect costs include expenses such as wholesaler salaries, marketing costs, and promotion and distribution of our products through the retail unaffiliated distribution and retail broker-dealer channels; services of W&R independent financial advisors such as field office overhead, sales programs and technology infrastructure; and costs of managing and supporting our wholesale efforts through technology infrastructure and personnel. While the institutional channel does have marketing expenses, those expenses are accounted for in compensation and related costs and general and administrative expense instead of underwriting and distribution because of the channel’s integration with our investment management division, its relatively small size and the fact that there are no Rule 12b‑1 service and distribution fees, loads, contingent deferred sales charges (“CDSCs”), or any other charges to separate account clients except investment management fees.
We recover certain of our underwriting and distribution costs through Rule 12b‑1 service and distribution fees, which are paid by the Funds. All Rule 12b‑1 service and distribution fee revenue received from the Funds is recorded on a gross basis. Starting in 2018, the compensation structure for W&R independent financial advisors has been revised to align the Company more closely with industry standards, offer competitive programs and services to independent financial advisors, and to facilitate compliance with the DOL Fiduciary Rule. Under the new compensation structure, the Company will receive compensation for certain services made available to independent financial advisors, including, but not limited to, facilities, technology and supervision.
Underwriting and distribution revenues earned in 2017 decreased by $43.0 million, or 8%, compared to 2016. Rule 12b‑1 asset based service and distribution fees across both channels decreased $48.0 million, or 22%, year over year, driven by a decrease in average mutual fund assets under management for which we earn Rule 12b‑1 revenues and the share class conversion from load-waived Class A shares previously in our advisory products to institutional share classes, which do not charge a Rule 12b-1 fee. Revenues from fee‑based asset allocation products increased to 57% of the retail broker-dealer channel’s underwriting and distribution revenues in 2017 compared to 51% in 2016. Fee-based asset allocation revenue increased 7% due to an increase in fee-based asset allocation average assets of 4%.
Underwriting and distribution revenues earned in 2016 decreased by $102.3 million, or 15%, compared to 2015. Rule 12b‑1 asset based service and distribution fees across both channels decreased $94.1 million, or 30%, year over year, driven by a decrease in average mutual fund assets under management for which we earn Rule 12b‑1 revenues and the share class conversion from load-waived Class A shares previously in our advisory products to institutional share classes, which do not charge a Rule 12b-1 fee. Revenues from fee‑based asset allocation products continued to be a meaningful contributor to revenues, increasing to 51% of the retail broker-dealer channel’s underwriting and distribution revenues in 2016 compared to 48% in 2015. Fee-based asset allocation revenue decreased less than 1% due to a decrease in fee-based asset allocation average assets of less than 1%.
Underwriting and distribution expenses in 2017 decreased by $71.2 million, or 11%, compared to 2016. Direct expenses in the retail unaffiliated distribution channel decreased $34.6 million compared to 2016 as a result of a decrease in average retail unaffiliated distribution assets under management, which resulted in lower Rule 12b‑1 asset‑based service and distribution expenses paid to third party distributors and lower dealer compensation. Direct expenses in the retail broker-dealer channel declined $26.4 million compared to 2016, primarily due to the changes we made to the management structure in our broker-dealer channel and a decrease in deferred acquisition expense due to a share class conversion in our advisory products in 2016. Compensation for managers has moved from commissions and overrides, which were captured as direct underwriting and distribution expense, to a salary and bonus, which is an indirect underwriting and distribution expense. Partially offsetting the direct expense decreases, advisory fee commissions increased due to the increase in fee-based asset allocation average assets and changes to the compensation plan. Indirect expenses in the retail unaffiliated distribution channel decreased $14.0 million, or 27%, compared to 2016, due to decreased employee compensation and benefits related to a workforce reduction in 2016, decreased computer services and software expenses, and pension settlement charges in 2016 related to the Company offering eligible terminated, vested pension plan participants an option to elect a one-time voluntary lump sum distribution equal to the present value of the participant’s pension benefit, in settlement of all future pension benefits to which they would otherwise have been entitled. Indirect expenses in the retail broker-dealer channel increased $3.7 million, or 3%, compared to 2016, due to increases in compensation and related costs, resulting from our change in management structure. Partially offsetting the increase in the
38
retail broker-dealer channel was a decrease in pension expense due to pension settlement charges in 2016 and a change in pension mark-to-market now evident with the change in the method of accounting for our net periodic pension costs.
Underwriting and distribution expenses in 2016 decreased by $109.8 million, or 14%, compared to 2015. Direct expenses in the retail unaffiliated distribution channel decreased $90.1 million compared to 2015 as a result of a decrease in average wholesale assets under management and lower sales volume year over year, which resulted in lower Rule 12b‑1 asset‑based service and distribution expenses paid to third party distributors, dealer compensation and wholesaler commissions. Direct expenses in the retail broker-dealer channel declined 7% consistent with the decline in revenue. Indirect expenses in the retail unaffiliated distribution channel decreased $4.1 million, or 7%, compared to 2015, due to decreased advertising costs and lower business meetings and travel expenses. Partially offsetting the decreases was an increase in employee compensation and benefits related to severance charges. Indirect expenses in the retail broker-dealer channel increased $6.8 million, or 5%, compared to 2015, primarily due to increased computer services and software expenses. Partially offsetting the increase were a curtailment gain as a result of discontinuing the availability of coverage in our defined benefit postretirement medical plan for any individuals who retired after December 31, 2016 and lower pension costs related to the change in the method of accounting for our net periodic pension costs.
Shareholder Service Fees Revenue
Shareholder service fee revenue primarily includes transfer agency fees, custodian fees from retirement plan accounts, and portfolio accounting and administration fees. Transfer agency fees and portfolio accounting and administration fees are asset‑based revenues or account‑based revenues, while custodian fees from retirement plan accounts are based on the number of client accounts.
During 2017, shareholder service fees revenue decreased $13.6 million, or 11%, over 2016. Account-based fees decreased $22.3 million compared to 2016 due to a decrease in the number of accounts, primarily as a result of the share class conversion in 2016 from account-based, load-waived Class A shares to asset-based, institutional share classes offered in our advisory programs. Asset-based fees for the I, Y, R and N share classes increased $9.0 million, or 26%, compared to 2016. Assets in the I, Y, R and N share classes increased from an average of $23.3 billion at December 31, 2016 to an average of $30.9 billion at December 31, 2017, representing an increase of 33%.
During 2016, shareholder service fees revenue decreased $22.8 million, or 16%, over 2015. Account-based fees decreased $18.5 million compared to 2015 due to a decrease in the number of accounts, primarily as a result of the share class conversion in 2016 from account-based, load-waived Class A shares to asset-based, institutional share classes offered in our advisory programs. Asset-based fees for the I, Y, R and N share classes decreased $4.1 million, or 11%, compared to 2015. Assets in the I, Y, R and N share classes declined from an average of $25.6 billion at December 31, 2015 to an average of $23.3 billion at December 31, 2016, representing a decrease of 9%.
Total Operating Expenses
Operating expenses decreased $71.2 million, or 7%, in 2017 compared to 2016 primarily due to decreased underwriting and distribution expenses, decreased compensation and related costs and a decline in intangible asset impairment charges, partially offset by an increase in general and administrative costs. Underwriting and distribution expenses are discussed above.
39
Operating expenses decreased $126.4 million, or 11%, in 2016 compared to 2015 primarily due to decreased underwriting and distribution expenses and general and administrative expenses, partially offset by intangible asset impairment charges of $9.7 million recorded in 2016.
|
|
|
For the Year ended |
|
|
|
|
|
|||||
|
|
|
December 31, |
|
Variance |
|
|||||||
|
|
|
|
|
|
|
|
|
|
2017 vs. |
|
2016 vs. |
|
|
|
|
2017 |
|
2016 |
|
2015 |
|
2016 |
|
2015 |
|
|
|
|
|
(in thousands, except percentage data) |
|
|||||||||
|
Underwriting and distribution |
|
$ |
593,424 |
|
664,648 |
|
774,428 |
|
(11) |
% |
(14) |
% |
|
Compensation and related costs |
|
|
181,376 |
|
200,822 |
|
208,841 |
|
(10) |
% |
(4) |
% |
|
General and administrative |
|
|
105,520 |
|
83,995 |
|
105,066 |
|
26 |
% |
(20) |
% |
|
Depreciation |
|
|
20,983 |
|
18,359 |
|
16,046 |
|
14 |
% |
14 |
% |
|
Subadvisory fees |
|
|
13,174 |
|
9,572 |
|
9,134 |
|
38 |
% |
5 |
% |
|
Intangible asset impairment |
|
|
1,500 |
|
9,749 |
|
— |
|
(85) |
% |
NM |
|
|
Total operating expenses |
|
$ |
915,977 |
|
987,145 |
|
1,113,515 |
|
(7) |
% |
(11) |
% |
Compensation and Related Costs
|
|
|
For the Year Ended |
|
|
|
|
|
|||||
|
|
|
December 31, |
|
Variance |
|
|||||||
|
|
|
|
|
|
|
|
|
|
2017 vs. |
|
2016 vs. |
|
|
|
|
2017 |
|
2016 |
|
2015 |
|
2016 |
|
2015 |
|
|
|
|
|
(in thousands, except percentage data) |
|
|||||||||
|
Compensation and related costs |
|
$ |
181,376 |
|
200,822 |
|
208,841 |
|
(10) |
% |
(4) |
% |
|
As a percent of revenue |
|
|
16 |
% |
16 |
% |
14 |
% |
0 |
% |
2 |
% |
Compensation and related costs in 2017 decreased $19.4 million, or 10%, compared to 2016. The primary drivers of the decrease were a decrease in pension expense of $23.7 million and a decrease in miscellaneous compensation of $6.0 million. Partially offsetting these decreases were an increase in share-based compensation (including cash-settled restricted stock units (“RSUs”)) of $6.2 million and an increase in group health insurance costs of $3.8 million. The decrease in pension expense was due to a settlement charge in 2016 and the change in mark-to-market gains and losses on pension assets which are included in periodic pension costs. The decrease in miscellaneous compensation was primarily due to severance expense in 2016 as a result of workforce reductions. The increase in share-based compensation is primarily due to the move of the employee grant date to January from April, mark-to-market expense on our restricted stock units and changes in forfeitures. The increase in group health insurance costs is due to a curtailment gain realized on the amendment of our defined benefit postretirement medical plan in 2016.
Compensation and related costs in 2016 decreased $8.0 million, or 4%, compared to 2015. The primary drivers of the decrease were a decrease in incentive compensation of $7.0 million, a decrease in group health insurance costs of $4.7 million, a decrease of base compensation of $4.4 million and a decrease in pension expense of $1.1 million. The decrease in group health insurance costs is due to a curtailment gain realized on the amendment of our defined benefit postretirement medical plan to discontinue coverage for any individuals who retire after December 31, 2016; the decrease in base compensation is due to a decrease in headcount; and the decrease in pension expense is due to the change in mark-to-market gains and losses on pension assets. Partially offsetting these decreases was an increase in severance expense of $7.1 million. The increase in severance expense was a result of workforce reductions.
40
General and Administrative Expenses
|
|
|
For the Year Ended |
|
|
|
|
|
|||||
|
|
|
December 31, |
|
Variance |
|
|||||||
|
|
|
|
|
|
|
|
|
|
2017 vs. |
|
2016 vs. |
|
|
|
|
2017 |
|
2016 |
|
2015 |
|
2016 |
|
2015 |
|
|
|
|
|
(in thousands, except percentage data) |
|
|||||||||
|
General and administrative expenses |
|
$ |
105,520 |
|
83,995 |
|
105,066 |
|
26 |
% |
(20) |
% |
|
As a percent of revenue |
|
|
9 |
% |
7 |
% |
7 |
% |
2 |
% |
0 |
% |
General and administrative expenses are operating costs, including, but not limited to, computer services and software costs, telecommunications, facilities costs of our home offices, costs of professional services including legal and accounting, and insurance.
General and administrative expenses increased $21.5 million for the year ended December 31, 2017 compared to 2016. Temporary office staff expense increased $9.4 million primarily due to increased technology consulting services and consulting services for DOL Fiduciary Rule implementation. There were also increases in legal, audit and consulting costs and fund expenses in 2017 compared to 2016, offset partly by decreased dealer service costs, which primarily represent account servicing costs to third party dealers, as a result of lower asset levels in certain share classes.
General and administrative expenses decreased $21.1 million for the year ended December 31, 2016 compared to 2015. Dealer service costs decreased $9.1 million due to lower asset levels in certain share classes. There were also decreases in advertising costs, fund expenses, temporary office staff expense, and travel and entertainment expenses in 2016 compared to 2015, offset partly by increased consulting costs for implementation of the DOL Fiduciary Rule.
Subadvisory Fees
Subadvisory fees represent fees paid to other asset managers for providing advisory services for certain mutual fund portfolios. These expenses reduce our operating margin since we pay out approximately half of our management fee revenues received from subadvised products.
Subadvisory expenses for the years ended 2017, 2016 and 2015 were $13.2 million, $9.6 million and $9.1 million, respectively. Subadvisory expenses increased $3.6 million for the year ended December 31, 2017 due to an increase in subadvised average assets of 97%, as well as the launch in 2017 of Ivy ProShares, the Ivy IG International Small Cap Fund, the Ivy PineBridge High Yield Fund, and the introduction of the Advisors Wilshire Global Allocation Fund. Subadvisory expenses increased $0.5 million for the year ended December 31, 2016 due to an increase in subadvised average assets of 2%, as well as the launch in 2016 of three new subadvised funds: the Ivy Apollo Multi-Asset Income Fund, the Ivy Apollo Strategic Income Fund, and the Ivy Pictet Targeted Return Bond Fund. For both comparative periods, subadvisory expenses were also impacted by a decrease in the average subadvisory fee rate due to a mix-shift of assets into subadvised funds with lower subadvisory fee rates.
Intangible Asset Impairment
During 2017 we recorded an intangible asset impairment charge of $1.5 million related to our subadvisory agreement to manage certain mutual fund products, as a result of a decline in assets under management primarily attributable to a realignment of fund offerings. It is possible that the assets we manage under this subadvisory agreement may decrease in the future, which would require us to assess the need for a write‑down of the intangible asset associated with our subadvisory agreement. At December 31, 2017, the remaining balance of our subadvisory intangible asset was $1.2 million. The deferred tax liability established as a part of purchase accounting related to this intangible asset was $0.3 million as of December 31, 2017.
During 2016, we recorded an intangible asset impairment charge of $5.7 million related to our subadvisory agreement to manage certain mutual fund products. The impairment charge was a result of a decline in assets under management primarily attributable to a realignment of fund offerings.
Also, during 2016, we delayed our strategic initiative to globalize our distribution network for the IGI funds. As a result of this decision, the valuation model for the advisory contract associated with the IGI funds was updated. Based upon the updated valuation model, we determined that the fair value of this intangible asset for the advisory contract was
41
less than the carrying amount, creating an impairment of $4.0 million, which was the remaining balance of this intangible asset.
Other Income and Expenses
Investment and Other Income (Loss)
Investment and other income increased $16.5 million in 2017 compared to 2016. Mark-to-market gains in 2017 on our consolidated sponsored funds, sponsored funds held as equity method securities and trading securities increased $19.9 million compared to 2016. The mark-to-market increases were offset by a $4.4 million increase in mark-to-market losses generated by our economic hedging program that uses total return swap contracts to hedge market risk in certain sponsored funds for the same comparative period. In 2017, interest and dividend income increased $4.3 million compared to 2016. The increase is due in part to a laddered fixed income investment portfolio we implemented in the second quarter of 2017 to optimize the return on our cash. Partially offsetting these increases, losses on the sales of sponsored funds and impairment charges on securities held as available for sale decreased $3.9 million.
Investment and other loss decreased $4.5 million in 2016 compared to 2015. The majority of the change is related to minority interest activity in consolidated sponsored funds held as trading in our investment portfolio. Mark-to-market gains in 2016 on our consolidated sponsored funds, sponsored funds held as equity method securities and trading securities increased $30.0 million compared to 2015. The mark-to-market increases were offset by a $31.5 million increase in mark-to-market losses on our economic hedging program that uses total return swap contracts to hedge market risk in certain sponsored funds for the same comparative period.
Interest Expense
Interest expense was $11.3 million in 2017 and $11.1 million in 2016 and 2015. The majority of our interest expense is fixed based on our $190.0 million senior unsecured notes. The $95.0 million Series A, senior unsecured notes that matured on January 13, 2018 were repaid. As a result, we anticipate $4.8 million in annual interest expense savings.
Income Taxes
Our effective income tax rate was 41.3%, 34.1%, and 38.6% in 2017, 2016, and 2015, respectively. The implementation of ASU 2016-09 on January 1, 2017 required prospective recognition of excess tax benefits or tax shortfalls of share-based payments through the income statement in the quarter that they occur. During 2017, the Company recognized a tax shortfall from share-based payments of $8.4 million, which increased our effective tax rate and accounted for the single greatest change to our effective tax rate for 2017 as compared to 2016. The Company expects the tax effects of share-based payments to create continued volatility in the effective tax rate in future periods.
Pursuant to the enactment of U.S. tax reform on December 22, 2017, the Company recorded a one-time charge to income tax expense of $5.4 million to reflect the value of its net deferred tax assets at the reduced federal statutory tax rate, which increased the effective tax rate.
The higher effective tax rate in 2017 as compared to 2016 was primarily the result of a tax shortfall from share-based payments, less of a reduction of valuation allowance on capital losses, and a charge to measure our net deferred tax assets for U.S. tax reform, all which occurred in 2017. The lower effective tax rate in 2016 as compared to 2015 was primarily the result of a release of the valuation allowance in 2016 as compared to an increase in the valuation allowance in 2015.
The Company has a deferred tax asset related to a capital loss carryforward, which is available to offset current and future capital gains. During 2017, realized capital gains on the sale of investment securities and capital gain dividend distributions exceeded the federal capital loss carryforward and therefore, the related deferred tax asset was realized. At December 31, 2017, the remaining deferred tax asset is related to a capital loss carryforward in a state jurisdiction. Due to the character of the losses and the limited carryforward permitted by law, a valuation allowance was recorded on a portion of this capital loss carryforward as of December 31, 2016. At December 31, 2017, management concluded that the remaining deferred tax asset related to a state capital loss carryforward would be realized prior to its expiration in 2018 and as a result, no valuation allowance was deemed necessary. During 2017, the overall effect of reversing the valuation allowance was recorded as a credit to income tax expense of $2.4 million, which decreased our effective tax rate. During
42
2016, increases in the fair value of the Company’s investment portfolios as well as realized capital gains on the sale of securities in the Company’s investment portfolio decreased the valuation allowance. As a result, the Company reduced income tax expense by $7.7 million, which decreased our effective tax rate. The higher effective tax rate in 2017 as compared to 2016 was partially attributable to increased investment gains in 2017 compared to 2016, offset by the extinguished balance of the valuation allowance available to be released. The lower effective tax rate in 2016 as compared to 2015 was primarily the result of investment gains in 2016 as compared to losses in 2015, which created an income tax benefit through the release of the valuation allowance in 2016.
Liquidity and Capital Resources
The following table summarizes certain key financial data relating to our liquidity and capital resources:
|
|
|
For the Year Ended |
|
Variance |
|
|||||||
|
|
|
December 31, |
|
2017 vs. |
|
2016 vs. |
|
|||||
|
|
|
2017 |
|
2016 |
|
2015 |
|
2016 |
|
2015 |
|
|
|
|
|
(in thousands, except percentage data) |
|
|||||||||
|
Balance Sheet Data: |
|
|
|
|
|
|
|
|
|
|
|
|
|
Cash and cash equivalents |
|
$ |
207,829 |
|
555,102 |
|
558,495 |
|
(63) |
% |
(1) |
% |
|
Investment securities |
|
|
700,492 |
|
328,750 |
|
291,743 |
|
113 |
% |
13 |
% |
|
Long-term debt |
|
|
94,783 |
|
189,605 |
|
189,432 |
|
(50) |
% |
0 |
% |
|
Cash Flow Data: |
|
|
|
|
|
|
|
|
|
|
|
|
|
Cash flows from operating activities |
|
|
53,832 |
|
123,647 |
|
233,950 |
|
(56) |
% |
(47) |
% |
|
Cash flows from investing activities |
|
|
(212,395) |
|
75,871 |
|
(22,595) |
|
NM |
|
NM |
|
|
Cash flows from financing activities |
|
|
(188,710) |
|
(202,911) |
|
(219,481) |
|
7 |
% |
8 |
% |
Our operations provide much of the cash necessary to fund our priorities, as follows:
|
· |
Pay dividends |
|
· |
Finance internal growth |
|
· |
Repurchase our stock |
Pay Dividends
In December 2017, the Board of Directors approved a quarterly dividend on our common stock of $0.25 per share payable on February 1, 2018 to stockholders of record as of January 11, 2018. Dividends on our common stock resulted in financing cash outflows of $154.0 million, $152.8 million and $144.0 million in 2017, 2016 and 2015, respectively.
Finance Internal Growth
We continue to invest in our retail broker-dealer channel by offering home office resources, wholesaling efforts and enhanced technology tools, including the modernization of our brokerage and product platform associated with Project E. We use cash to fund growth in our distribution channels. Our retail unaffiliated distribution channel requires cash outlays for wholesaler commissions and commissions to third parties on deferred load product sales. Across both channels, we provide seed money for new products. To strengthen our investment management resources, processes and results, we will align investment management resources and philosophy toward the strongest growth opportunities, key products and new initiatives, and fortify the foundation of our active management heritage.
Repurchase Our Stock
In 2017, we purchased 1.8 million shares of our common stock, compared to 2.3 million shares and 2.0 million shares in 2016 and 2015, respectively. These share repurchase amounts included 402,337 shares, 423,726 shares and 432,353 shares tendered by employees to cover their minimum tax withholdings with respect to vesting of stock awards during the years ended December 31, 2017, 2016 and 2015, respectively.
43
In connection with the implementation of our new capital return policy, we intend to repurchase $250 million our common stock from the fourth quarter of 2017 through the end of 2019, which is inclusive of buybacks to offset dilution of our equity grants. Based on our current financial forecast, we intend to engage in an opportunistic share repurchase plan to fulfill the targeted buybacks over the next two years.
Operating Cash Flows
Cash from operations is our primary source of funds and decreased $69.8 million from 2016 to 2017. The decrease is primarily due to increased purchases of trading securities of $41.8 million, a decrease in the amortization of deferred sales commission payments related to deferred sales load and fee based products of $18.7 million in 2017, and a decrease in net income of $13.9 million in 2017.
The payable to investment companies for securities, payable to customers and other receivables accounts can fluctuate significantly based on trading activity at the end of a reporting period. Changes in these accounts result in variances within cash from operations on the statement of cash flows; however, there is no impact to the Company’s liquidity and operations for the variances in these accounts.
A contribution of $10.0 million was made to our pension plan in February 2017. No contributions are planned for 2018.
Investing Cash Flows
Investing activities consist primarily of the seeding and sale of sponsored investment securities, purchases of investments held in our fixed income laddering program and capital expenditures. We expect our 2018 capital expenditures to be in the range of $10.0 to $15.0 million.
Financing Cash Flows
As noted previously, dividends and stock repurchases accounted for a majority of our financing cash outflows in 2017. Future financing cash flows will be affected by the new capital return policy.
On August 31, 2010, the Company entered into an agreement to complete a $190.0 million private placement of the Senior Notes. The $95.0 million Series A, senior unsecured notes that matured on January 13, 2018 were repaid. Interest is payable semi‑annually in January and July of each year. The most restrictive provisions of the agreement require the Company to maintain a consolidated leverage ratio not to exceed 3.0 to 1.0 for four consecutive quarters and a consolidated interest coverage ratio of not less than 4.0 to 1.0 for four consecutive quarters. The Company was in compliance with these covenants for all periods presented. As of December 31, 2017, the Company’s consolidated leverage ratio was 0.6 to 1.0, and consolidated interest coverage ratio was 29.2 to 1.0.
On October 20, 2017, we entered into a three-year unsecured revolving credit facility (the “New Credit Facility”) with various lenders, which initially provides for borrowings of up to $100.0 million and may be expanded to $200.0 million. The New Credit Facility replaced the prior credit facility, which was set to terminate in June 2018. There were no borrowings under the New Credit Facility at December 31, 2017 and no borrowings under the prior credit facility at any point during the year. The covenants in the New Credit Facility are consistent with the covenants in the prior credit facility, including the required consolidated leverage ratio and the consolidated interest coverage ratio, which match those outlined above for the Senior Notes.
Short Term Liquidity and Capital Requirements
Management believes its available cash, marketable securities and expected cash flow from operations will be sufficient to fund its short‑term operating and capital requirements during 2018. Expected short‑term uses of cash include dividend payments, repurchases of our common stock, interest on indebtedness, income tax payments, seed money for new products, capital expenditures, share repurchases, payment of deferred commissions to our financial advisors and third parties, collateral funding for margin accounts established to support derivative positions, and home office leasehold and building improvements, and could include strategic acquisitions. Our seed investments in consolidated sponsored funds are not treated as liquid assets because they may be longer term in nature.
44
Long Term Liquidity and Capital Requirements
Expected long‑term capital requirements include interest on indebtedness and maturities of outstanding debt, operating leases and purchase obligations, and potential recognition of tax liabilities, summarized in the following table as of December 31, 2017. Purchase obligations include amounts that will be due for the purchase of goods and services to be used in our operations under long‑term commitments or contracts.
|
|
|
|
|
|
|
|
2019- |
|
2021- |
|
Thereafter/ |
|
|
|
|
Total |
|
2018 |
|
2020 |
|
2022 |
|
Indeterminate |
|
|
|
|
|
(in thousands) |
|
|||||||||
|
Short-term and long-term debt obligations, including interest |
|
$ |
211,533 |
|
102,877 |
|
10,925 |
|
97,731 |
|
— |
|
|
Non-cancelable operating lease commitments |
|
|
58,727 |
|
19,920 |
|
23,232 |
|
8,086 |
|
7,489 |
|
|
Purchase obligations |
|
|
90,538 |
|
40,304 |
|
41,770 |
|
8,464 |
|
— |
|
|
Unrecognized tax benefits |
|
|
10,855 |
|
2,253 |
|
— |
|
— |
|
8,602 |
|
|
|
|
$ |
371,653 |
|
165,354 |
|
75,927 |
|
114,281 |
|
16,091 |
|
Other possible long‑term discretionary uses of cash could include capital expenditures for enhancement of technology infrastructure, strategic acquisitions, payment of dividends, income tax payments, seed money for new products, repurchases of our common stock, and payment of upfront fund commissions for Class C shares and certain fee‑based asset allocation products. We expect payment of upfront fund commissions for certain fee‑based asset allocation products will decline in future years due to a change in our advisor compensation plan whereby a smaller population of advisors are eligible for upfront fund commissions on the sale of these products.
Off‑Balance Sheet Arrangements
Other than operating leases, which are included in the table above, the Company does not have any off‑balance sheet financing. The Company has not created, and is not party to, any special‑purpose or off‑balance sheet entities for the purpose of raising capital, incurring debt or operating its business.
Critical Accounting Policies and Estimates
Management believes the following critical accounting policies affect its significant estimates and judgments used in the preparation of its consolidated financial statements.
Accounting for Goodwill and Intangible Assets
Two significant considerations arise with respect to goodwill and intangible assets that require management estimates and judgment: (i) the valuation in connection with the initial purchase price allocation, and (ii) the ongoing evaluation of impairment.
In connection with all of our acquisitions, an evaluation is completed to determine reasonable purchase price allocations. The purchase price allocation process requires management estimates and judgments as to expectations for the various products, distribution channels and business strategies. For example, certain growth rates and operating margins were assumed for different products and distribution channels. If actual growth rates or operating margins, among other assumptions, differ from the estimates and judgments used in the purchase price allocation, the amounts recorded in the financial statements for identifiable intangible assets and goodwill could be subject to charges for impairment in the future.
We complete an ongoing review of the recoverability of goodwill and intangible assets using a fair‑value or income based approach on an annual basis or more frequently whenever events occur or circumstances change that would more likely than not reduce the fair value of a reporting unit below its carrying amount. Intangible assets with indefinite lives, primarily acquired mutual fund advisory contracts, are also tested for impairment annually by comparing their fair value to the carrying amount of the asset. We consider mutual fund advisory contracts indefinite lived intangible assets as they are expected to be renewed without significant cost or modification of terms. Factors that are considered important in determining whether an impairment of goodwill or intangible assets might exist include significant continued underperformance compared to peers, the likelihood of termination or non‑renewal of a mutual fund advisory or
45
subadvisory contract or substantial changes in revenues earned from such contracts, significant changes in our business and products, material and ongoing negative industry or economic trends, or other factors specific to each asset or subsidiary being evaluated. Because of the significance of goodwill and other intangibles to our consolidated balance sheets, the annual impairment analysis is critical. Any changes in key assumptions about our business and our prospects, or changes in market conditions or other externalities, could result in an impairment charge.
Accounting for Income Taxes
In the ordinary course of business, many transactions occur for which the ultimate tax outcome is uncertain. In addition, respective tax authorities periodically audit our income tax returns. These audits examine our significant tax filing positions, including the timing and amounts of deductions and the allocation of income among tax jurisdictions. We adjust our income tax provision in the period in which we determine the actual outcomes will likely be different from our estimates. The recognition or derecognition of income tax expense related to uncertain tax positions is determined under the guidance as prescribed by Accounting Standards Codification (“ASC”) 740, “Income Taxes Topic.”
We recognize an asset or liability for the deferred tax consequences of temporary differences between the tax basis of assets and liabilities and their reported amounts in the financial statements, including the determination of any valuation allowance that might be required for deferred tax assets. These temporary differences will result in taxable or deductible amounts in future years when the reported amounts of assets are recovered or liabilities are settled.
Income taxes are recorded at the rates in effect in the various tax jurisdictions in which we operate. Tax law and rate changes are reflected in the income tax provision in the period in which such changes are enacted.
Pension and Other Postretirement Benefits
Accounting for our pension and postretirement benefit plans requires us to estimate the cost of benefits to be provided well into the future and the current value of our benefit obligations. Three critical assumptions affecting these estimates are the discount rate, the expected return on assets and the expected health care cost trend rate. The discount rate assumption was based on the Aon Hewitt AA Only Above Median Yield Curve. This discount rate was determined separately for each plan by plotting the expected benefit payments from each plan against a yield curve of high quality, zero coupon bonds and calculating the single rate that would produce the same present value of liabilities as the yield curve. The expected return on plan assets and health care cost trend rates are based upon an evaluation of our historical trends and experience, taking into account current and expected future market conditions. Other assumptions include rates of future compensation increases, participant withdrawals and mortality rates, and participant retirement ages. These estimates and assumptions impact the amount of net pension expense or income recognized each year and the measurement of our reported benefit obligation under the plans.
Effective January 1, 2017, the Company changed its method to estimate the service and interest cost components of net periodic benefit cost for our pension plan. Historically, we estimated these two cost components utilizing a single discount rate derived from the yield curve, as described above. The new method utilizes a full yield curve approach in the estimation of these components by applying the specific spot-rates along the yield curve used in the determination of the benefit obligation to their underlying projected cash flows. The new estimate provides a more precise measurement of service and interest costs by improving the correlation between projected benefit cash flows and their corresponding spot-rates. The change does not affect the measurement of our pension benefit obligation and was accounted for as a change in accounting estimate, applied prospectively.
46
The effect of hypothetical changes to selected assumptions on the Company’s retirement benefit plans would be as follows:
|
|
|
|
|
|
|
|
For the year |
|
|
|
|
|
|
|
As of |
|
ended |
|
||
|
|
|
|
|
December 31, |
|
December 31, |
|
||
|
|
|
|
|
2017 |
|
2018 |
|
||
|
|
|
|
|
Increase |
|
Increase |
|
||
|
|
|
|
|
(Decrease) |
|
(Decrease) |
|
||
|
Assumptions |
|
Change |
|
PBO/APBO (1) |
|
Expense (2) |
|
||
|
|
|
|
|
(in thousands) |
|
||||
|
Pension |
|
|
|
|
|
|
|
|
|
|
Discount rate |
|
+/−50 bps |
|
$ |
(11,413)/12,713 |
|
$ |
366/(431) |
|
|
Expected return on assets |
|
+/−100 bps |
|
|
N/A |
|
|
(1,656)/1,656 |
|
|
Salary scale |
|
+/−100 bps |
|
|
N/A |
|
|
N/A |
|
|
Other Postretirement |
|
|
|
|
|
|
|
|
|
|
Discount rate |
|
+/−50 bps |
|
|
(53)/57 |
|
|
(10)/11 |
|
|
Health care cost trend rate |
|
+/−100 bps |
|
|
102/(91) |
|
|
35/(31) |
|
|
(1) |
Projected benefit obligation (“PBO”) for pension plans and accumulated postretirement benefit obligation (“APBO”) for other postretirement plans. |
|
(2) |
Pre‑tax impact on expense. |
Loss Contingencies
The likelihood that a loss contingency exists is evaluated using the criteria of ASC 450, “Contingencies Topic,” through consultation with legal counsel. A loss contingency is recorded if the contingency is considered probable and reasonably estimable as of the date of the financial statements.
Seasonality and Inflation
We do not believe our operations are subject to significant seasonal fluctuation. We have historically experienced increased sales activity in the first and fourth quarters of the year due to funding of retirement accounts by our clients. The Company has not suffered material adverse effects from inflation in the past. However, a substantial increase in the inflation rate in the future may adversely affect customers’ purchasing decisions, may increase the costs of borrowing, or may have an impact on the Company’s margins and overall cost structure.
ITEM 7A. Quantitative and Qualitative Disclosures About Market Risk
We use various financial instruments with certain inherent market risks, primarily related to interest rates and securities prices. The principal risks of loss arising from adverse changes in market rates and prices to which we are exposed relate to interest rates on debt and marketable securities. Generally, these instruments have not been entered into for trading purposes. Management actively monitors these risk exposures; however, fluctuations could impact our results of operations and financial position. As a matter of policy, we only execute derivative transactions to manage exposures arising in the normal course of business and not for speculative or trading purposes. The following information, together with information included in other parts of Management’s Discussion and Analysis of Financial Condition and Results of Operations, which are incorporated herein by reference, describe the key aspects of certain financial instruments that have market risk to us.
Interest Rate Sensitivity
Our interest sensitive assets and liabilities include the debt security holdings in our fixed income laddering program, our long‑term fixed rate Senior Notes and obligations for any balances outstanding under the Credit Facility or other short‑term borrowings. Increases in market interest rates would generally cause a decrease in the fair value of the debt security holdings in the fixed income laddering program and the Senior Notes, and an increase in interest expense associated with short‑term borrowings and borrowings under the Credit Facility. Decreases in market interest rates would generally cause an increase in the fair value of the debt security holdings in the fixed income laddering program and Senior
47
Notes, and a decrease in interest expense associated with short‑term borrowings and borrowings under the Credit Facility. There were no borrowings under the Credit Facility at December 31, 2017 or at any point during the year.
Investment Securities Sensitivity
We maintain an investment portfolio of various holdings, types and maturities. Our portfolio is diversified and consists primarily of sponsored funds and debt securities. A portion of investments are classified as available for sale investments. At any time, a sharp increase in interest rates or a sharp decline in the United States stock market could have a significant negative impact on the fair value of our investment portfolio. If a decline in fair value is determined to be other than temporary by management, the cost basis of the individual security or mutual fund accounted for as available for sale is written down to fair value. We have established a hedging program that uses total return swaps to hedge our exposure to fluctuations in the value of our investment portfolio classified as trading, recorded using the equity method, or consolidated within our consolidated financial statements. Conversely, declines in interest rates or a sizeable rise in the United States stock market could have a significant positive impact on our investment portfolio, the results of which may be mitigated due to the hedging program. However, unrealized gains are not recognized in operations on available for sale securities until they are sold.
The following is a summary of the effect that a 10% increase or decrease in equity or fixed income prices would have on our investment portfolio subject to equity or fixed income price fluctuations at December 31, 2017:
|
|
|
|
|
|
Fair Value |
|
Fair Value |
|
|
|
|
|
|
|
Assuming a 10% |
|
Assuming a 10% |
|
|
Investment Securities |
|
Fair Value |
|
Increase |
|
Decrease |
|
|
|
|
|
(in thousands) |
|
|||||
|
Available for sale: |
|
|
|
|
|
|
|
|
|
Certificates of deposit |
|
$ |
12,999 |
|
14,299 |
|
11,699 |
|
|
Commercial paper |
|
|
34,978 |
|
38,476 |
|
31,480 |
|
|
Corporate bonds |
|
|
197,442 |
|
217,186 |
|
177,698 |
|
|
U.S. Treasury bills |
|
|
19,779 |
|
21,757 |
|
17,801 |
|
|
Sponsored funds |
|
|
124,016 |
|
136,418 |
|
111,614 |
|
|
Trading: |
|
|
|
|
|
|
|
|
|
Certificates of deposit |
|
|
1,999 |
|
2,199 |
|
1,799 |
|
|
Corporate bonds |
|
|
55,414 |
|
60,955 |
|
49,873 |
|
|
U.S. Treasury bills |
|
|
4,929 |
|
5,422 |
|
4,436 |
|
|
Mortgage-backed securities |
|
|
10 |
|
11 |
|
9 |
|
|
Common stock |
|
|
116 |
|
128 |
|
104 |
|
|
Consolidated sponsored funds |
|
|
139,086 |
|
152,995 |
|
125,177 |
|
|
Sponsored funds |
|
|
13,841 |
|
15,225 |
|
12,457 |
|
|
Sponsored privately offered funds |
|
|
695 |
|
765 |
|
626 |
|
|
Equity Method: |
|
|
|
|
|
|
|
|
|
Sponsored funds |
|
|
95,188 |
|
104,707 |
|
85,669 |
|
|
Total |
|
$ |
700,492 |
|
770,541 |
|
630,443 |
|
Securities Price Sensitivity
Our revenues are dependent on the underlying assets under management in the Funds and IGI Funds to which investment advisory services are provided. The Funds include portfolios of investments comprised of various combinations of equity, fixed income and other types of securities and commodities. Fluctuations in the value of these securities are common and are generated by numerous factors, including, without limitation, market volatility, the overall economy, inflation, changes in investor strategies, availability of alternative investment vehicles, government regulations and others. Accordingly, declines in any one or a combination of these factors, or other factors not separately identified, may reduce the value of investment securities and, in turn, the underlying assets under management on which our revenues are earned. These declines have an impact in our investment sales, and our trading portfolio, thereby compounding the impact on our earnings if our hedging strategy is not fully effective.
48
ITEM 8. Financial Statements and Supplementary Data
Reference is made to the Consolidated Financial Statements referred to in the Index on page 57 setting forth our consolidated financial statements, together with the report of KPMG LLP dated February 23, 2018 on page 58.
ITEM 9. Changes in and Disagreements with Accountants on Accounting and Financial Disclosure
None.
ITEM 9A. Controls and Procedures
|
(a) |
Evaluation of Disclosure Controls and Procedures. The Company maintains a system of disclosure controls and procedures that is designed to ensure that information required to be disclosed by the Company in the reports that it files or submits under the Securities Exchange Act of 1934, as amended (the “Exchange Act”) is recorded, processed, summarized and reported within the time periods specified in the SEC’s rules and forms and that such information is accumulated and communicated to the Company’s management, including the Chief Executive Officer and Chief Financial Officer, as appropriate, to allow timely decisions regarding required disclosure. A control system, no matter how well conceived and operated, can provide only reasonable, not absolute, assurance that the objectives of the control system are met. The Company’s Chief Executive Officer and Chief Financial Officer, after evaluating the effectiveness of the Company’s disclosure controls and procedures (as defined in Rule 13a‑15(e) and 15d‑15(e) of the Exchange Act) as of December 31, 2017, have concluded that the Company’s disclosure controls and procedures were effective as of December 31, 2017. |
|
(b) |
Management’s Report on Internal Control Over Financial Reporting. Our management is responsible for establishing and maintaining adequate internal control over financial reporting, as such term is defined in Exchange Act Rules 13a‑15(f) and 15d‑15(f). Under the supervision and with the participation of our management, including our principal executive officer and our principal financial officer, we evaluated of the effectiveness of our internal control over financial reporting as of December 31, 2017 based on the framework in “Internal Control—Integrated Framework (2013)” issued by the Committee of Sponsoring Organizations of the Treadway Commission. All internal control systems, no matter how well designed, have inherent limitations. Therefore, even those systems determined to be effective can provide only reasonable, not absolute, assurance with respect to financial statement preparation and presentation. Because of its inherent limitations, internal control over financial reporting may not prevent or detect misstatements. Projections of any evaluation of effectiveness to future periods are subject to the risks that controls may become inadequate because of changes in conditions, or that the degree of compliance with the policies or procedures may deteriorate. |
Based on our evaluation under the framework in “Internal Control‑Integrated Framework (2013),” management concluded that, as of December 31, 2017, our internal control over financial reporting was effective. KPMG LLP, the independent registered public accounting firm that audited the financial statements included in this Annual Report on Form 10‑K, also audited the effectiveness of our internal control over financial reporting as of December 31, 2017, as stated in their attestation report which follows.
49
Report of Independent Registered Public Accounting Firm
To the Stockholders and Board of Directors
Waddell & Reed Financial, Inc.:
Opinion on Internal Control Over Financial Reporting
We have audited Waddell & Reed Financial, Inc. and subsidiaries’ (the Company) internal control over financial reporting as of December 31, 2017, based on criteria established in Internal Control – Integrated Framework (2013) issued by the Committee of Sponsoring Organizations of the Treadway Commission. In our opinion, the Company maintained, in all material respects, effective internal control over financial reporting as of December 31, 2017, based on criteria established in Internal Control – Integrated Framework (2013) issued by the Committee of Sponsoring Organizations of the Treadway Commission.
We also have audited, in accordance with the standards of the Public Company Accounting Oversight Board (United States) (PCAOB), the consolidated balance sheets of the Company as of December 31, 2017 and 2016, the related consolidated statements of income, comprehensive income, stockholders’ equity, and cash flows for each of the years in the three-year period ended December 31, 2017, and the related notes (collectively, the consolidated financial statements), and our report dated February 23, 2018 expressed an unqualified opinion on those consolidated financial statements.
Basis for Opinion
The Company’s management is responsible for maintaining effective internal control over financial reporting and for its assessment of the effectiveness of internal control over financial reporting, included in the accompanying Management’s Report on Internal Control over Financial Reporting. Our responsibility is to express an opinion on the Company’s internal control over financial reporting based on our audit. We are a public accounting firm registered with the PCAOB and are required to be independent with respect to the Company in accordance with the U.S. federal securities laws and the applicable rules and regulations of the Securities and Exchange Commission and the PCAOB.
We conducted our audit in accordance with the standards of the PCAOB. Those standards require that we plan and perform the audit to obtain reasonable assurance about whether effective internal control over financial reporting was maintained in all material respects. Our audit of internal control over financial reporting included obtaining an understanding of internal control over financial reporting, assessing the risk that a material weakness exists, and testing and evaluating the design and operating effectiveness of internal control based on the assessed risk. Our audit also included performing such other procedures as we considered necessary in the circumstances. We believe that our audit provides a reasonable basis for our opinion.
Definition and Limitations of Internal Control Over Financial Reporting
A company’s internal control over financial reporting is a process designed to provide reasonable assurance regarding the reliability of financial reporting and the preparation of financial statements for external purposes in accordance with generally accepted accounting principles. A company’s internal control over financial reporting includes those policies and procedures that (1) pertain to the maintenance of records that, in reasonable detail, accurately and fairly reflect the transactions and dispositions of the assets of the company; (2) provide reasonable assurance that transactions are recorded as necessary to permit preparation of financial statements in accordance with generally accepted accounting principles, and that receipts and expenditures of the company are being made only in accordance with authorizations of management and directors of the company; and (3) provide reasonable assurance regarding prevention or timely detection of unauthorized acquisition, use, or disposition of the company’s assets that could have a material effect on the financial statements.
Because of its inherent limitations, internal control over financial reporting may not prevent or detect misstatements. Also, projections of any evaluation of effectiveness to future periods are subject to the risk that controls may become inadequate because of changes in conditions, or that the degree of compliance with the policies or procedures may deteriorate.
/s/ KPMG LLP
Kansas City, Missouri
February 23, 2018
50
|
(c) |
Changes in Internal Control over Financial Reporting. The Company’s internal control over financial reporting is designed to provide reasonable assurance regarding the reliability of financial reporting and the preparation of financial statements for external purposes in accordance with generally accepted accounting principles. There were no changes in the Company’s internal control over financial reporting that occurred during the fiscal quarter ended December 31, 2017 that have materially affected, or are reasonably likely to materially affect, the Company’s internal control over financial reporting. |
None.
ITEM 10. Directors, Executive Officers and Corporate Governance
Information required by this Item 10 is incorporated herein by reference to our definitive proxy statement for our 2018 Annual Meeting of Stockholders to be filed pursuant to Regulation 14A under the Exchange Act.
ITEM 11. Executive Compensation
Information required by this Item 11 is incorporated herein by reference to our definitive proxy statement for our 2018 Annual Meeting of Stockholders to be filed pursuant to Regulation 14A under the Exchange Act.
ITEM 12. Security Ownership of Certain Beneficial Owners and Management and Related Stockholder Matters
Information required by Item 403 of Regulation S-K is incorporated herein by reference to our definitive proxy statement for our 2018 Annual Meeting of Stockholders to be filed pursuant to Regulation 14A under the Exchange Act.
Equity Compensation Plan Information
The following table provides information as of December 31, 2017 with respect to shares of the Company’s common stock that may be issued under our existing equity compensation plans.
|
|
|
|
|
|
|||
|
Plan Category |
(a) |
|
(b) |
|
|||
|
|
|
|
|
|
|||
|
|
|
|
|
|
|||
|
Equity compensation plans approved by security holders |
6,301,669 |
(2) |
2,457,741 |
(3) |
|||
|
|
|
|
|
|
|||
|
Equity compensation plans not approved by security holders |
- |
|
- |
|
|||
|
|
|
|
|
|
|||
|
Total |
6,301,669 |
|
2,457,741 |
|
|||
|
|
|
|
|
|
|||
(1)All shares may be issued in the form of restricted stock.
(2)Represents shares of the Company’s unvested restricted common stock.
(3)Represents shares available for future issuance from the Stock Incentive Plan.
51
ITEM 13. Certain Relationships and Related Transactions, and Director Independence
Information required by this Item 13 is incorporated herein by reference to our definitive proxy statement for our 2018 Annual Meeting of Stockholders to be filed pursuant to Regulation 14A under the Exchange Act.
ITEM 14. Principal Accounting Fees and Services
Information required by this Item 14 is incorporated herein by reference to our definitive proxy statement for our 2018 Annual Meeting of Stockholders to be filed pursuant to Regulation 14A under the Exchange Act.
ITEM 15. Exhibits, Financial Statement Schedules
|
|
(a)(1) |
Financial Statements. |
|||
|
|
|
Reference is made to the Index to Consolidated Financial Statements on page 57 for a list of all financial statements filed as part of this Report. |
|||
|
|
(a)(2) |
Financial Statement Schedules. |
|||
|
|
|
None. |
|||
|
|
(b) |
Exhibits.
|
|||
|
Exhibit |
|
Exhibit Description |
|||
|
3.1 |
|
||||
|
3.2 |
|
||||
|
4.1 |
|
||||
|
4.2 |
|
||||
|
4.3 |
|
||||
|
10.1 |
|
||||
|
10.2 |
|
||||
|
10.3 |
|
||||
52
|
10.4 |
|
Waddell & Reed Financial, Inc. 2003 Executive Incentive Plan, as amended and restated.* |
|||
|
10.5 |
|
||||
|
10.5.1 |
|
||||
|
10.6 |
|
||||
|
10.7 |
|
||||
|
10.8 |
|
||||
|
10.9 |
|
||||
|
10.10 |
|
||||
|
10.11 |
|
||||
|
10.12 |
|
||||
|
10.13 |
|
||||
|
10.14 |
|
||||
|
10.15 |
|
||||
|
10.16 |
|
||||
|
10.17 |
|
||||
|
18 |
|
||||
53
|
21 |
|
||||
|
23 |
|
||||
|
24 |
|
||||
|
31.1 |
|
Rule 13a‑14(a)/15d‑14(a) Certification of the Chief Executive Officer |
|||
|
31.2 |
|
Rule 13a‑14(a)/15d‑14(a) Certification of the Chief Financial Officer |
|||
|
32.1 |
|
||||
|
32.2 |
|
||||
|
101 |
|
Materials from the Waddell & Reed Financial, Inc. Annual Report on Form 10‑K for the year ended December 31, 2015, formatted in Extensible Business Reporting Language (XBRL): (i) Consolidated Balance Sheets, (ii) Consolidated Statements of Income, (iii) Consolidated Statements of Comprehensive Income, (iv) Consolidated Statements of Stockholders’ Equity, (v) Consolidated Statements of Cash Flows, and (vi) related Notes to the Consolidated Financial Statements, tagged in detail. |
|||
|
*Indicates management contract or compensatory plan, contract or arrangement.
|
|||||
Not applicable.
54
Pursuant to the requirements of Section 13 or 15(d) of the Securities Exchange Act of 1934, as amended, the Company has duly caused this Report to be signed on its behalf by the undersigned, thereunto duly authorized, in the City of Overland Park, State of Kansas, on February 23, 2018.
|
|
WADDELL & REED FINANCIAL, INC. |
|
|
|
|
|
|
|
By: |
/s/ PHILIP J. SANDERS |
|
|
|
Philip J. Sanders |
|
|
|
Chief Executive Officer and Chief Investment Officer |
Pursuant to the requirements of the Securities Exchange Act of 1934, as amended, this Report has been signed below by the following persons on behalf of the Company and in the capacities and on the dates indicated.
|
Name |
|
Title |
|
Date |
|
|
|
|
|
|
|
/s/ PHILIP J. SANDERS |
|
Chief Executive Officer, Chief Investment Officer and Director (Principal Executive Officer) |
|
February 23, 2018 |
|
Philip J. Sanders |
|
|
|
|
|
|
|
|
|
|
|
/s/ BRENT K. BLOSS |
|
Executive Vice President, Chief Operating Officer, Chief Financial Officer and Treasurer (Principal Financial Officer) |
|
February 23, 2018 |
|
Brent K. Bloss |
|
|
|
|
|
|
|
|
|
|
|
/s/ BENJAMIN R. CLOUSE |
|
Vice President and Chief Accounting Officer (Principal Accounting Officer)
|
|
February 23, 2018 |
|
Benjamin R. Clouse |
|
|
|
|
|
/s/ HENRY J. HERRMANN* |
|
Chairman of the Board and Director |
|
February 23, 2018 |
|
Henry J. Herrmann |
|
|
|
|
|
|
|
|
|
|
|
/s/ SHARILYN S. GASAWAY* |
|
Director |
|
February 23, 2018 |
|
Sharilyn S. Gasaway |
|
|
|
|
|
|
|
|
|
|
|
/s/ THOMAS C. GODLASKY* |
|
Director |
|
February 23, 2018 |
|
Thomas C. Godlasky |
|
|
|
|
|
|
|
|
|
|
|
/s/ ALAN W. KOSLOFF* |
|
Director |
|
February 23, 2018 |
|
Alan W. Kosloff |
|
|
|
|
|
|
|
|
|
|
|
/s/ DENNIS E. LOGUE* |
|
Director |
|
February 23, 2018 |
|
Dennis E. Logue |
|
|
|
|
|
|
|
|
|
|
|
/s/ MICHAEL F. MORRISSEY* |
|
Director |
|
February 23, 2018 |
|
Michael F. Morrissey |
|
|
|
|
|
|
|
|
|
|
|
/s/ JAMES M. RAINES* |
|
Director |
|
February 23, 2018 |
|
James M. Raines |
|
|
|
|
|
|
|
|
|
|
|
/s/ JERRY W. WALTON* |
|
Director |
|
February 23, 2018 |
|
Jerry W. Walton |
|
|
|
|
|
|
|
|
|
|
|
/s/ JEFFREY P. BENNETT |
|
Attorney‑in‑fact |
|
February 23, 2018 |
|
Jeffrey P. Bennett |
|
|
|
*By: Attorney‑in‑fact
55
56
Report of Independent Registered Public Accounting Firm
To the Stockholders and Board of Directors
Waddell & Reed Financial, Inc.:
Opinion on the Consolidated Financial Statements
We have audited the accompanying consolidated balance sheets of Waddell & Reed Financial, Inc. and subsidiaries (the Company) as of December 31, 2017 and 2016, the related consolidated statements of income, comprehensive income, stockholders’ equity, and cash flows for each of the years in the three‑year period ended December 31, 2017, and the related notes (collectively, the consolidated financial statements). In our opinion, the consolidated financial statements present fairly, in all material respects, the financial position of the Company as of December 31, 2017 and 2016, and the results of its operations and its cash flows for each of the years in the three‑year period ended December 31, 2017, in conformity with U.S. generally accepted accounting principles. We also have audited, in accordance with the standards of the Public Company Accounting Oversight Board (United States) (PCAOB), the Company’s internal control over financial reporting as of December 31, 2017, based on criteria established in Internal Control – Integrated Framework (2013) issued by the Committee of Sponsoring Organizations of the Treadway Commission, and our report dated February 23, 2018 expressed an unqualified opinion on the effectiveness of the Company’s internal control over financial reporting.
Change in Accounting Principle
As discussed in Note 1 to the financial statements, the Company has elected to change its method of accounting for net periodic pension cost to immediately recognize actuarial gains and losses in net periodic pension cost in the year in which the gains and losses occur.
Basis for Opinion
These consolidated financial statements are the responsibility of the Company’s management. Our responsibility is to express an opinion on these consolidated financial statements based on our audits. We are a public accounting firm registered with the PCAOB and are required to be independent with respect to the Company in accordance with the U.S. federal securities laws and the applicable rules and regulations of the Securities and Exchange Commission and the PCAOB.
We conducted our audits in accordance with the standards of the PCAOB. Those standards require that we plan and perform the audit to obtain reasonable assurance about whether the consolidated financial statements are free of material misstatement, whether due to error or fraud. Our audits included performing procedures to assess the risks of material misstatement of the consolidated financial statements, whether due to error or fraud, and performing procedures that respond to those risks. Such procedures included examining, on a test basis, evidence regarding the amounts and disclosures in the consolidated financial statements. Our audits also included evaluating the accounting principles used and significant estimates made by management, as well as evaluating the overall presentation of the consolidated financial statements. We believe that our audits provide a reasonable basis for our opinion.
We have served as the Company’s auditor since 1981.
/s/ KPMG LLP
Kansas City, Missouri
February 23, 2018
57
WADDELL & REED FINANCIAL, INC.
December 31, 2017 and 2016
|
|
|
|
|
|
|
|
|
|
|
2017 |
|
2016 |
|
|
|
|
|
(in thousands) |
|
|||
|
Assets: |
|
|
|
|
|
|
|
Cash and cash equivalents |
|
$ |
207,829 |
|
555,102 |
|
|
Cash and cash equivalents - restricted |
|
|
28,156 |
|
31,137 |
|
|
Investment securities |
|
|
700,492 |
|
328,750 |
|
|
Receivables: |
|
|
|
|
|
|
|
Funds and separate accounts |
|
|
25,664 |
|
27,181 |
|
|
Customers and other |
|
|
131,108 |
|
128,095 |
|
|
Prepaid expenses and other current assets |
|
|
25,593 |
|
21,574 |
|
|
Total current assets |
|
|
1,118,842 |
|
1,091,839 |
|
|
|
|
|
|
|
|
|
|
Property and equipment, net |
|
|
87,667 |
|
102,449 |
|
|
Goodwill and identifiable intangible assets |
|
|
147,069 |
|
148,569 |
|
|
Deferred income taxes |
|
|
13,308 |
|
31,430 |
|
|
Other non-current assets |
|
|
17,476 |
|
31,985 |
|
|
Total assets |
|
$ |
1,384,362 |
|
1,406,272 |
|
|
|
|
|
|
|
|
|
|
Liabilities: |
|
|
|
|
|
|
|
Accounts payable |
|
$ |
38,998 |
|
28,023 |
|
|
Payable to investment companies for securities |
|
|
43,422 |
|
53,691 |
|
|
Payable to third party brokers |
|
|
25,153 |
|
31,735 |
|
|
Payable to customers |
|
|
66,830 |
|
82,918 |
|
|
Short-term notes payable |
|
|
94,996 |
|
— |
|
|
Accrued compensation |
|
|
47,643 |
|
41,670 |
|
|
Other current liabilities |
|
|
44,797 |
|
58,941 |
|
|
Total current liabilities |
|
|
361,839 |
|
296,978 |
|
|
|
|
|
|
|
|
|
|
Long-term debt |
|
|
94,783 |
|
189,605 |
|
|
Accrued pension and postretirement costs |
|
|
15,137 |
|
38,379 |
|
|
Other non-current liabilities |
|
|
25,210 |
|
26,655 |
|
|
Total liabilities |
|
|
496,969 |
|
551,617 |
|
|
|
|
|
|
|
|
|
|
Commitments and contingencies |
|
|
|
|
|
|
|
|
|
|
|
|
|
|
|
Redeemable noncontrolling interests |
|
|
14,509 |
|
10,653 |
|
|
|
|
|
|
|
|
|
|
Stockholders’ equity: |
|
|
|
|
|
|
|
Preferred stock—$1.00 par value: 5,000 shares authorized; none issued |
|
|
— |
|
— |
|
|
Class A Common stock—$0.01 par value: 250,000 shares authorized; 99,701 shares issued; 82,687 shares outstanding (83,118 at December 31, 2016) |
|
|
997 |
|
997 |
|
|
Additional paid-in capital |
|
|
301,410 |
|
291,908 |
|
|
Retained earnings |
|
|
1,092,394 |
|
1,089,122 |
|
|
Cost of 17,014 common shares in treasury (16,583 at December 31, 2016) |
|
|
(522,441) |
|
(531,268) |
|
|
Accumulated other comprehensive income (loss) |
|
|
524 |
|
(6,757) |
|
|
Total stockholders’ equity |
|
|
872,884 |
|
844,002 |
|
|
|
|
|
|
|
|
|
|
Total liabilities, redeemable noncontrolling interests and stockholders’ equity |
|
$ |
1,384,362 |
|
1,406,272 |
|
See accompanying notes to consolidated financial statements.
58
WADDELL & REED FINANCIAL, INC.
CONSOLIDATED STATEMENTS OF INCOME
Years ended December 31, 2017, 2016 and 2015
|
|
|
|
|
|
|
|
|
|
|
|
|
|
|
2017 |
|
2016 |
|
2015 |
|
|||
|
|
|
(in thousands, except per share data) |
|
|||||||
|
Revenues: |
|
|
|
|
|
|
|
|
|
|
|
Investment management fees |
|
$ |
531,850 |
|
|
557,112 |
|
|
709,562 |
|
|
Underwriting and distribution fees |
|
|
518,699 |
|
|
561,670 |
|
|
663,998 |
|
|
Shareholder service fees |
|
|
106,595 |
|
|
120,241 |
|
|
143,071 |
|
|
Total |
|
|
1,157,144 |
|
|
1,239,023 |
|
|
1,516,631 |
|
|
|
|
|
|
|
|
|
|
|
|
|
|
Operating expenses: |
|
|
|
|
|
|
|
|
|
|
|
Underwriting and distribution |
|
|
593,424 |
|
|
664,648 |
|
|
774,428 |
|
|
Compensation and related costs (including share-based compensation of $57,716, $51,514 and $47,518, respectively) |
|
|
181,376 |
|
|
200,822 |
|
|
208,841 |
|
|
General and administrative |
|
|
105,520 |
|
|
83,995 |
|
|
105,066 |
|
|
Depreciation |
|
|
20,983 |
|
|
18,359 |
|
|
16,046 |
|
|
Subadvisory fees |
|
|
13,174 |
|
|
9,572 |
|
|
9,134 |
|
|
Intangible asset impairment |
|
|
1,500 |
|
|
9,749 |
|
|
— |
|
|
Total |
|
|
915,977 |
|
|
987,145 |
|
|
1,113,515 |
|
|
|
|
|
|
|
|
|
|
|
|
|
|
Operating income |
|
|
241,167 |
|
|
251,878 |
|
|
403,116 |
|
|
Investment and other income (loss) |
|
|
15,689 |
|
|
(763) |
|
|
(5,244) |
|
|
Interest expense |
|
|
(11,279) |
|
|
(11,122) |
|
|
(11,068) |
|
|
|
|
|
|
|
|
|
|
|
|
|
|
Income before provision for income taxes |
|
|
245,577 |
|
|
239,993 |
|
|
386,804 |
|
|
Provision for income taxes |
|
|
101,368 |
|
|
81,884 |
|
|
149,226 |
|
|
Net income |
|
|
144,209 |
|
|
158,109 |
|
|
237,578 |
|
|
Net income attributable to redeemable noncontrolling interests |
|
|
2,930 |
|
|
1,414 |
|
|
— |
|
|
Net income attributable to Waddell & Reed Financial, Inc. |
|
$ |
141,279 |
|
|
156,695 |
|
|
237,578 |
|
|
|
|
|
|
|
|
|
|
|
|
|
|
Net income per share attributable to Waddell and Reed Financial, Inc. common shareholders, basic and diluted: |
|
$ |
1.69 |
|
|
1.90 |
|
|
2.85 |
|
|
|
|
|
|
|
|
|
|
|
|
|
|
Weighted average shares outstanding, basic and diluted: |
|
|
83,573 |
|
|
82,668 |
|
|
83,499 |
|
See accompanying notes to consolidated financial statements.
59
WADDELL & REED FINANCIAL, INC.
CONSOLIDATED STATEMENTS OF COMPREHENSIVE INCOME
Years ended December 31, 2017, 2016 and 2015
|
|
|
|
|
|
|
|
|
|
|
|
|
2017 |
|
2016 |
|
2015 |
|
|
|
|
|
(in thousands) |
|
|||||
|
Net income |
|
$ |
144,209 |
|
158,109 |
|
237,578 |
|
|
|
|
|
|
|
|
|
|
|
|
Other comprehensive income: |
|
|
|
|
|
|
|
|
|
|
|
|
|
|
|
|
|
|
|
Unrealized appreciation (depreciation) of available for sale investment securities during the period, net of income tax expense (benefit) of $(956), $(2), and $2, respectively |
|
|
7,505 |
|
(391) |
|
(4,771) |
|
|
|
|
|
|
|
|
|
|
|
|
Postretirement benefit, net of income tax expense (benefit) of $(99), $(718), and $983, respectively |
|
|
(224) |
|
(1,220) |
|
1,667 |
|
|
|
|
|
|
|
|
|
|
|
|
Comprehensive income |
|
|
151,490 |
|
156,498 |
|
234,474 |
|
|
Comprehensive income attributable to redeemable noncontrolling interests |
|
|
2,930 |
|
1,414 |
|
— |
|
|
Comprehensive income attributable to Waddell & Reed Financial, Inc. |
|
$ |
148,560 |
|
155,084 |
|
234,474 |
|
See accompanying notes to consolidated financial statements.
60
WADDELL & REED FINANCIAL, INC.
CONSOLIDATED STATEMENTS OF STOCKHOLDERS’ EQUITY
Years ended December 31, 2017, 2016 and 2015
(in thousands)
|
|
|
|
|
|
|
|
|
|
|
|
|
|
Accumulated |
|
|
|
Redeemable |
|
|
|
|
|
|
|
|
|
Additional |
|
|
|
|
|
Other |
|
Total |
|
Non |
|
|
|
|
Common Stock |
|
Paid-In |
|
Retained |
|
Treasury |
|
Comprehensive |
|
Stockholders’ |
|
Controlling |
|
|||
|
|
|
Shares |
|
Amount |
|
Capital |
|
Earnings |
|
Stock |
|
Income (Loss) |
|
Equity |
|
interest |
|
|
|
Balance at December 31, 2014 |
|
99,701 |
|
$ |
997 |
|
318,636 |
|
993,507 |
|
(525,015) |
|
(2,041) |
|
786,084 |
|
— |
|
|
Net income |
|
— |
|
|
— |
|
— |
|
237,578 |
|
— |
|
— |
|
237,578 |
|
— |
|
|
Recognition of equity compensation |
|
— |
|
|
— |
|
47,256 |
|
262 |
|
— |
|
— |
|
47,518 |
|
— |
|
|
Net issuance/forfeiture of nonvested shares |
|
— |
|
|
— |
|
(39,094) |
|
— |
|
39,094 |
|
— |
|
— |
|
— |
|
|
Dividends accrued, $1.75 per share |
|
— |
|
|
— |
|
— |
|
(146,099) |
|
— |
|
— |
|
(146,099) |
|
— |
|
|
Excess tax benefits from share-based payment arrangements |
|
— |
|
|
— |
|
4,813 |
|
— |
|
— |
|
— |
|
4,813 |
|
— |
|
|
Repurchase of common stock |
|
— |
|
|
— |
|
— |
|
— |
|
(80,335) |
|
— |
|
(80,335) |
|
— |
|
|
Other comprehensive loss |
|
— |
|
|
— |
|
— |
|
— |
|
— |
|
(3,104) |
|
(3,104) |
|
— |
|
|
Balance at December 31, 2015 |
|
99,701 |
|
|
997 |
|
331,611 |
|
1,085,248 |
|
(566,256) |
|
(5,145) |
|
846,455 |
|
— |
|
|
Adoption of consolidation guidance on January 1, 2016 - redeemable noncontrolling interests in sponsored funds |
|
— |
|
|
— |
|
— |
|
— |
|
— |
|
— |
|
— |
|
14,330 |
|
|
Net income |
|
— |
|
|
— |
|
— |
|
156,695 |
|
— |
|
— |
|
156,695 |
|
1,414 |
|
|
Net redemption of redeemable noncontrolling interests in sponsored funds |
|
— |
|
|
— |
|
— |
|
— |
|
— |
|
— |
|
— |
|
(5,091) |
|
|
Recognition of equity compensation |
|
— |
|
|
— |
|
51,382 |
|
132 |
|
— |
|
— |
|
51,514 |
|
— |
|
|
Net issuance/forfeiture of nonvested shares |
|
— |
|
|
— |
|
(84,741) |
|
— |
|
84,741 |
|
— |
|
— |
|
— |
|
|
Dividends accrued, $1.84 per share |
|
— |
|
|
— |
|
— |
|
(152,953) |
|
— |
|
— |
|
(152,953) |
|
— |
|
|
Tax impact of share-based payment arrangements |
|
— |
|
|
— |
|
(6,344) |
|
— |
|
— |
|
— |
|
(6,344) |
|
— |
|
|
Repurchase of common stock |
|
— |
|
|
— |
|
— |
|
— |
|
(49,753) |
|
— |
|
(49,753) |
|
— |
|
|
Other comprehensive loss |
|
— |
|
|
— |
|
— |
|
— |
|
— |
|
(1,612) |
|
(1,612) |
|
— |
|
|
Balance at December 31, 2016 |
|
99,701 |
|
|
997 |
|
291,908 |
|
1,089,122 |
|
(531,268) |
|
(6,757) |
|
844,002 |
|
10,653 |
|
|
Adoption of share-based compensation guidance on January 1, 2017 |
|
— |
|
|
— |
|
3,504 |
|
(2,200) |
|
— |
|
— |
|
1,304 |
|
— |
|
|
Net income |
|
— |
|
|
— |
|
— |
|
141,279 |
|
— |
|
— |
|
141,279 |
|
2,930 |
|
|
Net subscription of redeemable noncontrolling interests in sponsored funds |
|
— |
|
|
— |
|
— |
|
— |
|
— |
|
— |
|
— |
|
926 |
|
|
Recognition of equity compensation |
|
— |
|
|
— |
|
50,593 |
|
690 |
|
— |
|
— |
|
51,283 |
|
— |
|
|
Net issuance/forfeiture of nonvested shares |
|
— |
|
|
— |
|
(44,595) |
|
|
|
44,595 |
|
|
|
— |
|
— |
|
|
Dividends accrued, $1.63 per share |
|
— |
|
|
— |
|
— |
|
(136,497) |
|
— |
|
— |
|
(136,497) |
|
— |
|
|
Repurchase of common stock |
|
— |
|
|
— |
|
— |
|
— |
|
(35,768) |
|
— |
|
(35,768) |
|
— |
|
|
Other comprehensive income |
|
— |
|
|
— |
|
— |
|
— |
|
— |
|
7,281 |
|
7,281 |
|
— |
|
|
Balance at December 31, 2017 |
|
99,701 |
|
$ |
997 |
|
301,410 |
|
1,092,394 |
|
(522,441) |
|
524 |
|
872,884 |
|
14,509 |
|
See accompanying notes to consolidated financial statements.
61
WADDELL & REED FINANCIAL, INC.
CONSOLIDATED STATEMENTS OF CASH FLOWS
Years ended December 31, 2017, 2016 and 2015
|
|
|
|
|
|
|
|
|
|
|
|
|
2017 |
|
2016 |
|
2015 |
|
|
|
|
|
(in thousands) |
|
|||||
|
Cash flows from operating activities: |
|
|
|
|
|
|
|
|
|
Net income |
|
$ |
144,209 |
|
158,109 |
|
237,578 |
|
|
Adjustments to reconcile net income to net cash provided by operating activities: |
|
|
|
|
|
|
|
|
|
Depreciation and amortization |
|
|
20,983 |
|
18,359 |
|
16,050 |
|
|
Write-down of impaired assets |
|
|
1,500 |
|
9,749 |
|
— |
|
|
Amortization of deferred sales commissions |
|
|
4,855 |
|
23,601 |
|
43,074 |
|
|
Share-based compensation |
|
|
51,283 |
|
51,514 |
|
47,518 |
|
|
Investments (gain) loss, net |
|
|
(17,104) |
|
(12,075) |
|
12,412 |
|
|
Net purchases of trading securities |
|
|
(43,714) |
|
(24,352) |
|
(75,160) |
|
|
Deferred income taxes |
|
|
20,481 |
|
1,982 |
|
(6,188) |
|
|
Pension and postretirement plan benefits |
|
|
(17,714) |
|
3,166 |
|
18,390 |
|
|
Net change in trading securities held by consolidated sponsored funds |
|
|
(101,457) |
|
(79,065) |
|
— |
|
|
Other |
|
|
3,276 |
|
(2,523) |
|
(4,133) |
|
|
Changes in assets and liabilities: |
|
|
|
|
|
|
|
|
|
Cash and cash equivalents - restricted |
|
|
2,981 |
|
35,743 |
|
9,715 |
|
|
Customer and other receivables |
|
|
(3,013) |
|
92,565 |
|
(3,817) |
|
|
Payable to investment companies for securities and payable to customers |
|
|
(26,357) |
|
(97,459) |
|
(5,964) |
|
|
Receivables from funds and separate accounts |
|
|
1,517 |
|
7,218 |
|
4,711 |
|
|
Other assets |
|
|
10,134 |
|
2,255 |
|
(25,111) |
|
|
Accounts payable and payable to third party brokers |
|
|
4,395 |
|
(22,948) |
|
(17,510) |
|
|
Other liabilities |
|
|
(2,423) |
|
(42,192) |
|
(17,615) |
|
|
Net cash provided by operating activities |
|
|
53,832 |
|
123,647 |
|
233,950 |
|
|
|
|
|
|
|
|
|
|
|
|
Cash flows from investing activities: |
|
|
|
|
|
|
|
|
|
Purchases of available for sale and equity method securities |
|
|
(365,770) |
|
(72,096) |
|
(27,388) |
|
|
Proceeds from sales of available for sale and equity method securities |
|
|
160,158 |
|
156,965 |
|
36,657 |
|
|
Additions to property and equipment |
|
|
(6,783) |
|
(15,691) |
|
(29,610) |
|
|
Net cash of sponsored funds on consolidation |
|
|
— |
|
6,887 |
|
— |
|
|
Other |
|
|
— |
|
(194) |
|
(2,254) |
|
|
Net cash (used in) provided by investing activities |
|
|
(212,395) |
|
75,871 |
|
(22,595) |
|
|
|
|
|
|
|
|
|
|
|
|
Cash flows from financing activities: |
|
|
|
|
|
|
|
|
|
Dividends paid |
|
|
(154,042) |
|
(152,830) |
|
(143,959) |
|
|
Repurchase of common stock |
|
|
(35,768) |
|
(49,753) |
|
(80,335) |
|
|
Net subscriptions, (redemptions, distributions and deconsolidations) of redeemable noncontrolling interests in sponsored funds |
|
|
926 |
|
(3,473) |
|
— |
|
|
Other |
|
|
174 |
|
3,145 |
|
4,813 |
|
|
Net cash used in financing activities |
|
|
(188,710) |
|
(202,911) |
|
(219,481) |
|
|
|
|
|
|
|
|
|
|
|
|
Net decrease in cash and cash equivalents |
|
|
(347,273) |
|
(3,393) |
|
(8,126) |
|
|
Cash and cash equivalents at beginning of period |
|
|
555,102 |
|
558,495 |
|
566,621 |
|
|
Cash and cash equivalents at end of period |
|
$ |
207,829 |
|
555,102 |
|
558,495 |
|
|
Cash paid for: |
|
|
|
|
|
|
|
|
|
Income taxes, net |
|
$ |
85,299 |
|
76,982 |
|
152,262 |
|
|
Interest |
|
$ |
10,299 |
|
10,289 |
|
10,297 |
|
See accompanying notes to consolidated financial statements.
62
WADDELL & REED FINANCIAL, INC.
NOTES TO CONSOLIDATED FINANCIAL STATEMENTS
December 31, 2017, 2016 and 2015
1. Summary of Significant Accounting Policies
Basis of Presentation
The accompanying consolidated financial statements are prepared in accordance with accounting principles generally accepted in the United States of America (“GAAP”) and include the accounts of the Company and its subsidiaries. All significant intercompany accounts and transactions have been eliminated in consolidation. Amounts in the accompanying financial statements and notes are rounded to the nearest thousand unless otherwise stated. Certain amounts in the prior years’ financial statements have been reclassified for consistent presentation. Also, refer to the “Pension Plan” section below regarding a change in accounting.
The Company operates in one business segment as the Company’s management utilizes a consolidated approach to assess performance and allocate resources.
Effective January 1, 2017, the Company adopted Accounting Standards Update (“ASU”) 2016-09, “Improvements to Employee Share-Based Payment Accounting.” This ASU requires excess tax benefits and tax shortfalls to be recognized as income tax benefit or expense in the income statement on a prospective basis. Additionally, excess tax benefits or shortfalls recognized on share-based compensation are classified as an operating activity in the statement of cash flows. The Company has applied this provision prospectively, and thus, the prior period presented in the income statements and statement of cash flows has not been adjusted. This ASU allows entities to withhold shares issued during the settlement of a stock award or option, as means of meeting minimum tax withholding due by the employee, in an amount up to the employees’ maximum individual tax rate in the relevant jurisdiction without resulting in a liability classification of the award (versus an equity classification). The value of the withheld shares is then remitted by the Company in cash to the taxing authorities on the employees’ behalf. The Company’s historical policy to withhold shares equivalent to the minimum individual tax rate is consistent with the thresholds meeting the classification of an equity award and, therefore, a retrospective classification adjustment was not required. This ASU requires that all cash payments made to taxing authorities on the employees’ behalf for withheld shares be presented as financing activities on the statement of cash flows. As this requirement is consistent with the Company’s historical accounting policy, a retrospective adjustment to presentation of the statement of cash flows was not required. This ASU also allows for the option to account for forfeitures as they occur when determining the amount of share-based compensation expense to be recognized, rather than estimating expected forfeitures over the course of a vesting period. The Company elected to account for forfeitures as they occur. The net cumulative effect to the Company from the adoption of this ASU was an increase to additional paid-in capital of $3.5 million, a reduction to retained earnings of $2.2 million and an increase to the non-current deferred tax asset of $1.3 million as of January 1, 2017.
Pension Plan
During the fourth quarter of 2017, the Company retrospectively changed its method of accounting for net periodic pension cost. Historically, net actuarial gains or losses in excess of 10% of the greater of the market-related value of plan assets or the plan’s projected benefit obligation (the corridor) were amortized into operating expenses over the remaining working life of active plan participants. Unrecognized actuarial gains or losses were reflected as a component of stockholders’ equity in our consolidated balance sheets. Under the Company’s new method of accounting, the Company elected to immediately recognize all actuarial gains and losses in net periodic pension cost in the year in which the gains and losses occur noting that it is generally preferable to accelerate the recognition of gains and losses into income rather than to delay such recognition. This change is intended to improve the transparency of the Company’s underlying financial performance by recognizing the effects of current economic and interest rate trends on assumptions used to measure plan obligations and assets. These gains and losses are generally only measured annually as of December 31 and accordingly will be recorded in the fourth quarter, unless a remeasurement event occurs during an earlier interim period. Financial data for all periods presented has been adjusted to reflect the effect of this accounting change.
63
The cumulative effect of the change on retained earnings as of January 1, 2015 was a decrease of $48.4 million, with the corresponding adjustment to accumulated other comprehensive loss. The effects of the change in accounting on our consolidated statements of income and consolidated balance sheets for the periods presented were as follows:
|
|
|
Years ended December 31, |
|||||||||||
|
|
|
2017 |
|
2016 |
|
2015 |
|||||||
|
|
|
Historical |
|
Adjusted |
|
As Reported |
|
Adjusted |
|
As Reported |
|
Adjusted |
|
|
|
|
(dollars in thousands, except per share amounts) |
|||||||||||
|
Income Statement Information: |
|
|
|
|
|
|
|
|
|
|
|
|
|
|
Underwriting and distribution expenses |
|
$ |
600,067 |
|
593,424 |
|
671,105 |
|
664,648 |
|
769,781 |
|
774,428 |
|
Compensation and related costs |
|
|
196,209 |
|
181,376 |
|
209,850 |
|
200,822 |
|
200,752 |
|
208,841 |
|
Income before provision for income taxes |
|
|
224,101 |
|
245,577 |
|
224,508 |
|
239,993 |
|
399,540 |
|
386,804 |
|
Provision for income taxes |
|
|
92,592 |
|
101,368 |
|
76,188 |
|
81,884 |
|
154,004 |
|
149,226 |
|
Net income |
|
|
131,509 |
|
144,209 |
|
148,321 |
|
158,109 |
|
245,536 |
|
237,578 |
|
Net income attributable to Waddell & Reed Financial, Inc. |
|
|
128,579 |
|
141,279 |
|
146,906 |
|
156,695 |
|
245,536 |
|
237,578 |
|
Net income per share attributable to Waddell & Reed Financial, Inc. common shareholders, basic and diluted |
|
|
1.54 |
|
1.69 |
|
1.78 |
|
1.90 |
|
2.94 |
|
2.85 |
|
Statement of Comprehensive Income Information |
|
|
|
|
|
|
|
|
|
|
|
|
|
|
Pension and postretirement benefit, net of income tax expense (benefit) |
|
$ |
12,476 |
|
(224) |
|
8,569 |
|
(1,220) |
|
(6,291) |
|
1,667 |
|
Statement of Cash Flows Information: |
|
|
|
|
|
|
|
|
|
|
|
|
|
|
Net income |
|
$ |
131,509 |
|
144,209 |
|
148,321 |
|
158,109 |
|
245,536 |
|
237,578 |
|
Adjustments to reconcile net income to net cash provided by operating activities: |
|
|
|
|
|
|
|
|
|
|
|
|
|
|
Deferred income taxes |
|
|
11,705 |
|
20,481 |
|
(3,714) |
|
1,982 |
|
(1,410) |
|
(6,188) |
|
Pension and postretirement plan benefits |
|
$ |
3,762 |
|
(17,714) |
|
18,651 |
|
3,166 |
|
5,654 |
|
18,390 |
|
|
|
As of December 31 |
|||||||
|
|
|
2017 |
|
2016 |
|||||
|
|
|
Historical |
|
Adjusted |
|
As Reported |
|
Adjusted |
|
|
Balance Sheet Information |
|
|
|
|
|
|
|
|
|
|
Retained earnings |
|
$ |
1,126,263 |
|
1,092,394 |
|
1,135,694 |
|
1,089,122 |
|
Accumulated other comprehensive income (loss) |
|
$ |
(33,345) |
|
524 |
|
(53,329) |
|
(6,757) |
Consolidation
In the normal course of our business, we sponsor and manage various types of investment products. These investment products include open-end mutual funds, a closed-end mutual fund, privately offered funds, exchange-traded managed funds, and a Luxembourg SICAV. When creating and launching a new investment product, we typically fund the initial cash investment, commonly referred to as “seeding,” to allow the investment product the ability to generate an investment performance track record so that it is able to attract third party investors. Our initial investment in a new product typically represents 100% of the ownership in that product. We generally redeem our investment in seeded products when the related product establishes a sufficient track record, when third party investments in the related product are sufficient to sustain the strategy, or when a decision is made to no longer pursue the strategy. The length of time we hold a majority interest in a product varies based on a number of factors, including market demand, market conditions and investment performance. Our exposure to risk in these investment products is generally limited to any equity investment we have in the product and any earned but uncollected management or other fund-related service fees.
In accordance with financial accounting standards, we consolidate certain sponsored investment products in which we have a controlling interest or the investment product meets the criteria of a variable interest entity (“VIE”) and we are deemed to be the primary beneficiary. In order to make this determination, an analysis is performed to determine
64
if the investment product is a VIE or a voting interest entity (“VOE”). Assessing if an entity is a VIE or VOE involves judgment and analysis on an entity by entity basis. Factors included in this assessment include the legal organization of the entity, the Company’s contractual involvement with the entity and any implications resulting from or associated with related parties’ involvement with the entity.
A VIE is an entity which does not have adequate equity to finance its activities without subordinated financial support, the equity investors do not have the normal characteristics of equity investors for a potential controlling financial interest as a group, or the voting rights are not proportional to their obligations to absorb the expected losses or their rights to receive the expected residual returns of the entity. The Company is deemed to be the primary beneficiary if it absorbs a majority of the VIE’s expected losses, expected residual returns, or both. If the Company is the primary beneficiary of a VIE, we are required to consolidate the assets, liabilities, results of operations and cash flows of the VIE into our consolidated financial statements.
If an entity does not meet the criteria and is not considered a VIE, it is treated as a VOE, which is subject to traditional consolidation concepts based on ownership rights. Sponsored investment products that are considered VOEs are consolidated if we have a controlling financial interest in the entity absent substantive investor rights to replace the investment manager of the entity (kick-out rights).
Use of Estimates
GAAP requires us to make estimates and assumptions that affect the reported amounts of assets, liabilities, revenues and expenses in the consolidated financial statements and accompanying notes, and related disclosures of commitments and contingencies. Estimates are used for, but are not limited to, depreciation and amortization, income taxes, valuation of assets, pension and postretirement obligations, and contingencies. Management evaluates its estimates and assumptions on an ongoing basis using historical experience and other factors, including the current economic environment. Actual results could differ from our estimates.
Cash and Cash Equivalents
Cash and cash equivalents include cash on hand and short‑term investments. We consider all highly liquid investments with maturities upon acquisition of 90 days or less to be cash equivalents. Cash and cash equivalents – restricted represents cash held for the benefit of customers and non-customers segregated in compliance with federal and other regulations.
Disclosures About Fair Value of Financial Instruments
Fair value of cash and cash equivalents, receivables and payables approximates carrying value. Fair values for investment securities are based on quoted market prices, where available. Otherwise, fair values for investment securities are based on Level 2 or Level 3 inputs detailed in Note 3. Fair value of long‑term debt is disclosed in Note 7.
Investment Securities and Investments in Sponsored Funds
Our investments are comprised of debt and equity securities, investments in sponsored funds and sponsored privately offered funds. Sponsored funds, which include the Funds, IVH and the IGI Funds, are investments we have made to provide seed capital for new investment products. The Company has classified its investments in certain sponsored funds as either equity method investments (when the Company owns between 20% and 50% of the fund) or as available for sale investments (when the Company owns less than 20% of the fund). Investments held by our broker-dealer entities or certain investments that are anticipated to be purchased and sold on a more frequent basis are classified as trading.
Unrealized gains and losses on securities classified as available for sale, net of related tax effects, are excluded from earnings until realized and are reported as a separate component of comprehensive income. For trading securities, unrealized gains and losses are included in earnings. Realized gains and losses are computed using the specific identification method for all investment securities, other than sponsored funds. For sponsored funds, realized gains and losses are computed using the average cost method. Substantially all of the Company’s equity method investees are investment companies that record their underlying investments at fair value. Therefore, under the equity method of accounting, our share of the investee's underlying net income or loss is predominantly representative of fair value adjustments in the investments held by the equity method investee. Our share of the investee's net income or loss is based
65
on the most current information available and is recorded as a net gain or loss on investments within investment and other income (loss).
Our available for sale investments are reviewed each quarter and adjusted for other than temporary declines in value. We consider factors affecting the issuer and the industry in which the issuer operates, general market trends including interest rates, and our ability and intent to hold an investment until it has recovered. Consideration is given to the length of time an investment’s market value has been below carrying value as well as prospects for recovery to carrying value. When a decline in the fair value of equity securities is determined to be other than temporary, the unrealized loss recorded net of tax in other comprehensive income is realized as a charge to net income, and a new cost basis is established. When a decline in the fair value of debt securities is determined to be other than temporary, the amount of the impairment recognized in earnings depends on whether the Company intends to sell the security or more likely than not will be required to sell the security before recovery of its amortized cost basis less any current‑period credit loss. If so, the other than temporary impairment recognized in earnings is equal to the entire difference between the investment’s amortized cost basis and its fair value at the balance sheet date. If not, the portion of the impairment related to the credit loss is recognized in earnings while the portion of the impairment related to other factors is recognized in other comprehensive income, net of tax.
Property and Equipment
Property and equipment are carried at cost. The costs of improvements that extend the life of a fixed asset are capitalized, while the costs of repairs and maintenance are expensed as incurred. Depreciation and amortization are calculated and recorded using the straight‑line method over the estimated useful life of the related asset (or lease term if shorter), generally three to 10 years for furniture and fixtures; one to 10 years for computer software; one to five years for data processing equipment; one to 30 years for buildings; two to 26 years for other equipment; and up to 15 years for leasehold improvements, determined by the lesser of the lease term or expected life.
Software Developed for Internal Use
Certain internal costs incurred in connection with developing or obtaining software for internal use are capitalized in accordance with ASC 350, “Intangibles – Goodwill and Other Topic.” Internal costs capitalized are included in property and equipment, net in the consolidated balance sheets, and were $10.5 million and $13.3 million as of December 31, 2017 and 2016, respectively. Amortization begins when the software project is complete and ready for its intended use and continues over the estimated useful life, generally one to 10 years.
Goodwill and Identifiable Intangible Assets
Goodwill represents the excess of cost over fair value of the identifiable net assets of acquired companies. Indefinite-lived intangible assets represent advisory and subadvisory management contracts for managed assets obtained in acquisitions. The Company considers these contracts to be indefinite-lived intangible assets as they are expected to be renewed without significant cost or modification of terms. Goodwill and indefinite-lived intangible assets are tested for impairment annually or more frequently if events or circumstances indicate that the carrying value may not be recoverable. Goodwill and intangible assets require significant management estimates and judgment, including the valuation determination in connection with the initial purchase price allocation and the ongoing evaluation for impairment. Additional information related to the indefinite-lived intangible assets is included in Note 6.
Revenue Recognition
Investment Management and Advisory Fees
We recognize investment management fees as earned over the period in which services are rendered. We calculate investment management fees from the Funds daily based upon average daily net assets under management in accordance with investment management agreements between the Funds and the Company. The majority of investment and/or advisory fees earned from the IGI Funds and from institutional and separate accounts are calculated either monthly or quarterly based upon an average of net assets under management in accordance with such investment management agreements. The Company may waive certain fees for investment management services at its discretion, or in accordance with contractual expense limitations, and these waivers are reflected as a reduction to investment management fees on the consolidated statements of income.
66
Our investment advisory business receives research products and services from broker-dealers through “soft dollar” arrangements. Consistent with the “soft dollar” safe harbor established by Section 28(e) of the Securities Exchange Act of 1934, as amended, the investment advisory business does not have any contractual obligation requiring it to pay for research products and services obtained through soft dollar arrangements with brokers. As a result, we present “soft dollar” arrangements on a net basis.
The Company has contractual arrangements with third parties to provide subadvisory services. Investment advisory fees are recorded gross of any subadvisory payments and are included in investment management fees based on management’s determination that the Company is acting in the capacity of principal service provider with respect to its relationship with the Funds. Any corresponding fees paid to subadvisors are included in operating expenses.
Distribution, Underwriter and Shareholder Service Fees
Underwriting and distribution commission revenues resulting from the sale of investment products are recognized on the trade date. When a client purchases Class A or Class E shares (front-end load), the client pays an initial sales charge of up to 5.75% of the amount invested. The sales charge for Class A or Class E shares typically declines as the investment amount increases. In addition, investors may combine their purchases of all fund shares to qualify for a reduced sales charge. When a client invests in a fee-based asset allocation product, Class I or Y shares are purchased at net asset value, and we do not charge an initial sales charge.
Under a Rule 12b-1 service plan, the Funds may charge a maximum fee of 0.25% of the average daily net assets under management for Class B, C, E and Ivy Funds Y shares for expenses paid to broker-dealers and other sales professionals in connection with providing ongoing services to the Funds’ shareholders and/or maintaining the Funds’ shareholder accounts, with the exception of the Funds’ Class R shares, for which the maximum fee is 0.50% and for the Class I, N and Advisors Funds Y shares, which do not charge a service fee. The Funds’ Class B and Class C shares may charge a maximum of 0.75% of the average daily net assets under management under a Rule 12b-1 distribution plan to broker-dealers and other sales professionals for their services in connection with distributing shares of that class. The Funds’ Class A shares may charge a maximum fee of 0.25% of the average daily net assets under management under a Rule 12b-1 service and distribution plan for expenses detailed previously. The Rule 12b-1 plans are subject to annual approval by the Funds’ board of trustees, including a majority of the disinterested members, by votes cast in person at a meeting called for the purpose of voting on such approval. All Funds may terminate the service and distribution plans at any time with approval of fund trustees or portfolio shareholders (a majority of either) without penalty.
Fee‑based asset allocation revenues are calculated monthly based upon average daily net assets under management. For certain types of investment products, primarily variable annuities, distribution revenues are generally calculated based upon average daily net assets under management. Fees collected from financial advisors for various services are recorded in underwriting and distribution fees on a gross basis, as the Company is the primary obligor in these arrangements.
Shareholder service fees are recognized monthly and are calculated based on the number of accounts or assets under management as applicable. Other administrative service fee revenues are recognized when contractual obligations are fulfilled or as services are provided.
Advertising and Promotion
We expense all advertising and promotion costs as the advertising or event takes place. Advertising expense was $9.7 million, $9.4 million and $15.7 million for the years ended December 31, 2017, 2016 and 2015, respectively, and is classified in both underwriting and distribution expense and general and administrative expense in the consolidated statements of income.
Leases
The Company leases office space under various leasing arrangements. Most lease agreements contain renewal options, rent escalation clauses and/or other inducements provided by the landlord. Rent expense is recorded on a straight-line basis, including escalations and inducements, over the term of the lease.
67
Share‑Based Compensation
We account for share‑based compensation expense using the fair value method. Under the fair value method, share‑based compensation expense reflects the fair value of share‑based awards measured at grant date, and is recognized over the service period. The Company also issues share‑based awards to our financial advisors, who are independent contractors, and to our Board of Directors. Changes in the Company’s share price result in variable compensation expense over the vesting period of awards granted to our financial advisors and Board of Directors.
During the fourth quarter of 2016, the Company established a Cash Settled RSU Plan (the “RSU Plan”), which allows the Company to grant cash-settled restricted stock units (“RSUs”) Unvested RSUs have no purchase price and vest in 25% increments over four years, beginning on the first anniversary of the grant date. On the vesting date, RSU holders receive a lump sum cash payment equal to the fair market value of one share of the Company’s common stock, par value $0.01, for each RSU that has vested, subject to applicable tax withholdings. We treat RSUs as liability-classified awards and, therefore, account for them at fair value based on the closing price of our common stock on the reporting date, which results in variable compensation expense over the vesting period.
Accounting for Income Taxes
Income tax expense is based on pre-tax income, including adjustments made for the recognition or derecognition related to uncertain tax positions. The recognition or derecognition of income tax expense related to uncertain tax positions is determined under the guidance as prescribed by ASC 740, “Income Taxes Topic.” Deferred tax assets and liabilities are recognized for the future tax attributable to differences between the financial statement carrying amounts of existing assets and liabilities and their respective tax basis. A valuation allowance is recognized to reduce deferred tax assets if, based on available evidence, it is more likely than not that all or some portion of the asset will not be realized. Deferred tax assets and liabilities are measured using enacted tax rates that will be in effect when they are expected to be realized or settled. The effect on the measurement of deferred tax assets and liabilities of a change in income tax law is recognized in earnings in the period that includes the enactment date.
On December 22, 2017, the Tax Cuts and Jobs Act (the “Tax Reform Act”) was enacted, which significantly revised the U.S. corporate income tax system by, among other things, permanently reducing the federal statutory tax rate from 35% to 21% effective January 1, 2018. The Company recorded a one-time charge of $5.4 million in the fourth quarter of 2017 to measure our net deferred tax assets at the reduced federal statutory rate. The SEC staff issued Staff Accounting Bulletin No. 118 to address the application of GAAP in situations when a registrant does not have the necessary information available, prepared, or analyzed (including computations) in reasonable detail to complete the accounting for certain income tax effects of the Tax Reform Act. The Company has recognized the provisional tax impact related to the revaluation of deferred tax assets and liabilities and included these amounts in its consolidated financial statements for the year ended December 31, 2017. The ultimate impact may differ from these provisional amounts, possibly materially, due to, among other things, additional analysis, changes in interpretations and assumptions the Company has made, additional regulatory guidance that may be issued, and actions the Company may take as a result of the Tax Reform Act. The impact of the Tax Reform Act is expected to be complete when the Company’s 2017 U.S. corporate income tax return is filed in 2018.
2. New Accounting Guidance
Accounting Guidance Adopted During Fiscal Year 2017
On January 1, 2017 the Company adopted ASU 2016-07, “Investments-Equity Method and Joint Ventures.” This ASU eliminates the requirement that when an investment qualifies for the use of equity method as a result of an increase in the level of ownership interest or degree of influence, an investor must adjust the investment, results of operations, and retained earnings retroactively as if the equity method had been in effect during all previous periods that the investment had been held. This ASU also requires that when an entity has an available for sale equity security that becomes qualified for the equity method, it must recognize through earnings the unrealized holding gain or loss in accumulated other comprehensive income at the date the investment becomes qualified for use of the equity method. The adoption of this ASU has an immaterial impact on our consolidated financial statements and related disclosures.
On January 1, 2017, the Company adopted ASU 2016-09. See Note 1 – Summary of Significant Accounting Policies – Basis of Presentation for a description of this ASU and the financial statement impact of adopting this ASU.
68
New Accounting Guidance Not Yet Adopted
In May 2014, the Financial Accounting Standards Board (“FASB”) issued ASU 2014-09, “Revenue from Contracts with Customers,” which requires an entity to recognize the amount of revenue to which it expects to be entitled for the transfer of promised goods or services to customers. This standard also specifies the accounting for certain costs to obtain or fulfill a contract with a customer. This ASU will supersede much of the existing revenue recognition guidance in GAAP and is effective for annual reporting periods beginning after December 15, 2017, including interim periods within that reporting period; early application is permitted for the first interim period within annual reporting periods beginning after December 15, 2016. ASU 2014-09 permits the use of either the retrospective or cumulative effect transition method. Upon adoption, the Company will utilize the cumulative effect approach. We have evaluated our population of contracts and did not identify any material changes in our current revenue recognition practices and concluded that the adoption of this ASU will have an immaterial impact on our consolidated financial statements. Upon adoption of the amendments in this ASU, the Company will add qualitative and quantitative information to the notes to its consolidated financial statements related to contracts with customers, including revenue and impairments recognized, disaggregation of revenue, information about contract balances and performance obligations; significant judgments and changes in judgments about determining the timing of satisfaction of performance obligations and determining the transaction price and amounts allocated to performance obligations; and assets recognized from the costs to obtain or fulfill a contract.
In February 2016, FASB issued ASU 2016-02, “Leases,” which increases transparency and comparability among organizations by recognizing lease assets and lease liabilities on the balance sheet and disclosing key information about leasing arrangements. This ASU will be presented using a modified retrospective approach, which includes a number of optional practical expedients that entities may elect to apply. This ASU is effective for fiscal years beginning after December 15, 2018, including interim periods within those fiscal years, with early adoption permitted. Although we are currently evaluating the estimated impact the adoption of this ASU will have on our consolidated financial statements and related disclosures, we currently believe the most significant changes will be related to the recognition of new right-of-use assets and lease liabilities on our consolidated balance sheet for real estate operating leases.
In August 2016, FASB issued ASU 2016-15, “Classification of Certain Cash Receipts and Cash Payments.” This ASU eliminates the diversity in practice related to the classification of certain cash receipts and payments for debt prepayment or extinguishment costs, the maturing of a zero coupon bond, the settlement of contingent liabilities arising from a business combination, proceeds from insurance settlements, distributions from certain equity method investees and beneficial interests obtained in a financial asset securitization. This ASU designates the appropriate cash flow classification, including requirements to allocate certain components of these cash receipts and payments among operating, investing and financing activities. This ASU is effective for fiscal years, and interim periods within those fiscal years, beginning after December 15, 2017, with early adoption permitted. We have concluded that the adoption of this ASU will have an immaterial impact on our consolidated financial statements and related disclosures.
In November 2016, FASB issued ASU 2016-18, “Statement of Cash Flows: Restricted Cash.” This ASU is intended to reduce diversity in practice by adding or clarifying guidance on classification and presentation of changes in restricted cash on the statement of cash flows. The amendments in this ASU require that a statement of cash flows explain the change during the period in the total of cash, cash equivalents, and amounts generally described as restricted cash or restricted cash equivalents. This ASU is effective for fiscal years, and interim periods within those fiscal years, beginning after December 15, 2017, with early adoption permitted. The amendments in this ASU should be applied retrospectively to all periods presented. Upon adoption of this ASU on January 1, 2018, we will include cash and cash equivalents – restricted as a component of cash and cash equivalents on our consolidated statements of cash flows for all periods presented, and will remove the change in cash and cash equivalents-restricted as a component of net cash provided by operating activities.
69
In March 2017, FASB issued ASU 2017-07, “Compensation-Retirement Benefits: Improving the Presentation of Net Periodic Pension Cost and Net Periodic Postretirement Benefit Cost.” This ASU changes the income statement presentation of defined benefit plan expense by requiring separation between operating expense (service cost component) and non-operating expense (all other components, including interest cost, amortization of prior service cost, curtailments and settlements, etc.). The operating expense component is reported with similar compensation costs while the non-operating components are reported in a separate line item outside of operating items. In addition, only the service cost component is eligible for capitalization as part of an asset. This ASU is effective for fiscal years, and interim periods within those fiscal years, beginning after December 15, 2017, with early adoption permitted. We have concluded that the adoption of this ASU will have no effect on our net income because it only impacts the classification of certain information on the consolidated statement of income. The service cost component of net periodic benefit cost was recognized in underwriting and distribution, and compensation and related costs through September 30, 2017. An amendment to freeze our noncontributory retirement plan that covers substantially all employees and certain vested employees of our former parent company (the “Pension Plan”) was approved effective September 30, 2017; therefore, after September 30, 2017, we no longer incurred service cost. The other components of net periodic cost will be reclassified to investment and other income (loss) on a retrospective basis.
In May 2017, FASB issued ASU 2017-09, “Compensation-Stock Compensation: Scope of Modification Accounting.” This ASU provides guidance about which changes to the terms or conditions of a share-based payment award require an entity to apply modification accounting in Topic 718, Compensation – Stock Compensation Topic. This ASU is effective for fiscal years, and interim periods within those fiscal years, beginning after December 15, 2017, with early adoption permitted. We have concluded that the adoption of this ASU will have an immaterial impact on our consolidated financial statements and related disclosures.
3. Investment Securities
Investment securities at December 31, 2017 and 2016 are as follows:
|
|
|
December 31, |
|
December 31, |
|
|
|
|
|
2017 |
|
2016 |
|
|
|
|
|
|
(in thousands) |
|
||
|
Available for sale securities: |
|
|
|
|
|
|
|
Certificates of deposit |
|
$ |
12,999 |
|
— |
|
|
Commercial paper |
|
|
34,978 |
|
— |
|
|
Corporate bonds |
|
|
197,442 |
|
— |
|
|
U.S. Treasury bills |
|
|
19,779 |
|
— |
|
|
Sponsored funds |
|
|
124,016 |
|
122,806 |
|
|
Sponsored privately offered funds |
|
|
— |
|
570 |
|
|
Total available for sale securities |
|
|
389,214 |
|
123,376 |
|
|
Trading securities: |
|
|
|
|
|
|
|
Certificates of deposit |
|
|
1,999 |
|
— |
|
|
Corporate bonds |
|
|
55,414 |
|
— |
|
|
U.S. Treasury bills |
|
|
4,929 |
|
— |
|
|
Mortgage-backed securities |
|
|
10 |
|
13 |
|
|
Common stock |
|
|
116 |
|
101 |
|
|
Consolidated sponsored funds |
|
|
139,086 |
|
145,710 |
|
|
Sponsored funds |
|
|
13,841 |
|
29,541 |
|
|
Sponsored privately offered funds |
|
|
695 |
|
— |
|
|
Total trading securities |
|
|
216,090 |
|
175,365 |
|
|
Equity method securities: |
|
|
|
|
|
|
|
Sponsored funds |
|
|
95,188 |
|
26,775 |
|
|
Sponsored privately offered funds |
|
|
— |
|
3,234 |
|
|
Total equity method securities |
|
|
95,188 |
|
30,009 |
|
|
Total securities |
|
$ |
700,492 |
|
328,750 |
|
70
Certificates of deposit, commercial paper, corporate bonds and U.S. Treasury bills accounted for as available for sale and held as of December 31, 2017 mature as follows:
|
|
|
Amortized |
|
|
|
|
|
cost |
|
Fair value |
|
|
|
(in thousands) |
||
|
Within one year |
$ |
98,323 |
|
98,390 |
|
After one year but within five years |
|
167,936 |
|
166,808 |
|
|
$ |
266,259 |
|
265,198 |
Certificates of deposit, U.S. Treasury bills, corporate bonds and mortgage-backed securities accounted for as trading and held as of December 31, 2017 mature as follows:
|
|
|
|
|
Fair value |
|
|
|
|
|
(in thousands) |
|
Within one year |
|
|
$ |
12,064 |
|
After one year but within five years |
|
|
|
45,288 |
|
After 10 years |
|
|
|
5,000 |
|
|
|
|
$ |
62,352 |
The following is a summary of the gross unrealized gains (losses) related to securities classified as available for sale at December 31, 2017:
|
|
|
Amortized |
|
Unrealized |
|
Unrealized |
|
|
|
|
|
|
|
cost |
|
gains |
|
losses |
|
Fair value |
|
|
|
|
|
(in thousands) |
|
|||||||
|
Available for sale securities: |
|
|
|
|
|
|
|
|
|
|
|
Certificates of deposit |
|
$ |
13,000 |
|
1 |
|
(2) |
|
12,999 |
|
|
Commercial paper |
|
|
34,836 |
|
142 |
|
— |
|
34,978 |
|
|
Corporate bonds |
|
|
198,404 |
|
33 |
|
(995) |
|
197,442 |
|
|
U.S. Treasury bills |
|
|
20,019 |
|
— |
|
(240) |
|
19,779 |
|
|
Sponsored funds |
|
|
122,722 |
|
2,576 |
|
(1,282) |
|
124,016 |
|
|
|
|
$ |
388,981 |
|
2,752 |
|
(2,519) |
|
389,214 |
|
|
|
|
|
|
|
|
|
|
|
|
|
The following is a summary of the gross unrealized gains (losses) related to securities classified as available for sale at December 31, 2016:
|
|
|
Amortized |
|
Unrealized |
|
Unrealized |
|
|
|
|
|
|
|
cost |
|
gains |
|
losses |
|
Fair value |
|
|
|
|
|
(in thousands) |
|
|||||||
|
Available for sale securities: |
|
|
|
|
|
|
|
|
|
|
|
Sponsored funds |
|
$ |
129,427 |
|
828 |
|
(7,449) |
|
122,806 |
|
|
Sponsored privately offered funds |
|
|
265 |
|
305 |
|
— |
|
570 |
|
|
|
|
$ |
129,692 |
|
1,133 |
|
(7,449) |
|
123,376 |
|
Investment securities with fair values of $237.2 million, $234.4 million and $102.2 million were sold during 2017, 2016 and 2015, respectively. During 2017, net realized gains of $0.9 million, $6.9 million and $1.5 million were recognized from the sale of $86.9 million in available for sale securities, the sale of $73.2 million in equity method securities, and the sale of $57.1 million in consolidated traded securities, respectively, and net realized losses of $0.5 million were recognized from the sale of $19.8 million in trading securities. During 2016, net realized gains of $3.6 million were recognized from the sale of $98.2 million in available for sale securities and net realized losses of $2.3 million were recognized from the sale of $58.7 million in equity method securities. During 2015, net realized gains of $3.0 million and $0.6 million were recognized from the sale of $31.6 million in available for sale securities and the sale of $65.9 million in trading securities, respectively, and net realized losses of $0.5 million were recognized from the sale of $5.3 million in equity method securities.
71
A summary of available for sale sponsored funds with fair values below carrying values at December 31, 2017 is as follows:
|
|
|
Less than 12 months |
|
12 months or longer |
|
Total |
|||||||
|
|
|
|
|
|
Unrealized |
|
|
|
Unrealized |
|
|
|
Unrealized |
|
December 31, 2017 |
|
Fair value |
|
losses |
|
Fair value |
|
losses |
|
Fair value |
|
losses |
|
|
|
|
(in thousands) |
|||||||||||
|
Certificates of deposit |
|
$ |
2,998 |
|
(2) |
|
— |
|
— |
|
2,998 |
|
(2) |
|
Corporate bonds |
|
|
192,409 |
|
(995) |
|
— |
|
— |
|
192,409 |
|
(995) |
|
U.S. Treasury bills |
|
|
19,779 |
|
(240) |
|
— |
|
— |
|
19,779 |
|
(240) |
|
Sponsored funds |
|
|
49,641 |
|
(600) |
|
23,707 |
|
(682) |
|
73,348 |
|
(1,282) |
|
|
|
$ |
264,827 |
|
(1,837) |
|
23,707 |
|
(682) |
|
288,534 |
|
(2,519) |
During 2017, we recorded a pre-tax charge of $1.3 million to reflect the “other than temporary” decline in value of certain of the Company’s investments in sponsored funds as the fair value of these investments had been below cost for an extended period of time. This charge is recorded in investment and other income in the consolidated statement of operations for 2017.
Sponsored Privately Offered Funds
The Company holds voting interests in certain sponsored privately offered funds that are structured as investment companies in the legal form of LLCs. The Company held investments in these funds totaling $0.7 million and $3.8 million as of December 31, 2017 and December 31, 2016, respectively, which is our maximum loss exposure.
Consolidated Sponsored and Sponsored Privately Offered Funds
The following table details the balances related to consolidated sponsored and sponsored privately offered funds at December 31, 2017 and 2016, as well as the Company’s net interest in these funds:
|
|
|
December 31, |
|
|
December 31, |
|
|
|
|
2017 |
|
|
2016 |
|
|
|
|
(in thousands) |
||||
|
Cash |
|
$ |
8,472 |
|
|
6,885 |
|
Investments |
|
|
139,086 |
|
|
145,710 |
|
Other assets |
|
|
1,588 |
|
|
763 |
|
Other liabilities |
|
|
(1,040) |
|
|
(390) |
|
Redeemable noncontrolling interests |
|
|
(14,509) |
|
|
(10,653) |
|
Net interest in consolidated sponsored funds |
|
$ |
133,597 |
|
|
142,315 |
During the year ended December 31, 2017, we consolidated certain of the sponsored privately offered funds, Ivy Funds, Ivy NextShares and Ivy ProShares in which we provided initial seed capital at the time of the funds’ formation. When we no longer have a controlling financial interest in a sponsored fund, it is deconsolidated from our consolidated financial statements. During 2017, we closed and redeemed our investment in three IGI Funds. Additionally, we deconsolidated the Ivy Proshares funds and two Ivy funds, as we no longer have a controlling interest in those funds. Accordingly, we deconsolidated $2.6 million from cash and cash equivalents, $53.6 million from investments and $56.2 million from redeemable controlling interests. Four IGI funds, one Ivy Fund, one sponsored privately offered fund and the Ivy Nextshares funds remain consolidated as of December 31, 2017. There was no impact to the consolidated statement of income as a result of the closures and deconsolidations, as the funds were carried at fair value.
Fair Value
Accounting standards establish a framework for measuring fair value and a three‑level hierarchy for fair value measurements based upon the transparency of inputs to the valuation of the asset. Inputs may be observable or unobservable and refer broadly to the assumptions that market participants would use in pricing the asset. An individual
72
investment’s fair value measurement is assigned a level based upon the observability of the inputs that are significant to the overall valuation. The three‑level hierarchy of inputs is summarized as follows:
|
· |
Level 1 – Investments are valued using quoted prices in active markets for identical securities. |
|
· |
Level 2 – Investments are valued using other significant observable inputs, including quoted prices in active markets for similar securities. |
|
· |
Level 3 – Investments are valued using significant unobservable inputs, including the Company’s own assumptions in determining the fair value of investments. |
Assets classified as Level 2 can have a variety of observable inputs. These observable inputs are collected and utilized, primarily by an independent pricing service, in different evaluated pricing approaches depending upon the specific asset to determine a value. The carrying amounts of certificates of deposit and commercial paper are measured at amortized cost, which approximates fair value due to the short-time between purchase and expected maturity of the investments. Depending on the nature of the inputs, these investments are generally classified as Level 1 or 2 within the fair value hierarchy. U.S. Treasury bills are valued upon quoted market prices for similar assets in active markets, quoted prices for identical or similar assets that are not active and inputs other than quoted prices that are observable or corroborated by observable market data. The fair value of municipal bonds is measured based on pricing models that take into account, among other factors, information received from market makers and broker-dealers, current trades, bid‑wants lists, offerings, market movements, the callability of the bond, state of issuance and benchmark yield curves. The fair value of corporate bonds is measured using various techniques, which consider recently executed transactions in securities of the issuer or comparable issuers, market price quotations (where observable), bond spreads and fundamental data relating to the issuer. The fair value of equity derivatives is measured based on active market broker quotes, evaluated broker quotes and evaluated prices from vendors.
73
The following tables summarize our investment securities as of December 31, 2017 and 2016 that are recognized in our consolidated balance sheets using fair value measurements based on the differing levels of inputs. There were no transfers between levels for the years ended December 31, 2017 or 2016.
|
December 31, 2017 |
|
Level 1 |
|
Level 2 |
|
Level 3 |
|
Other Assets Held at Net Asset Value |
|
Total |
|
|
|
|
|
(in thousands) |
|
|||||||||
|
Cash equivalents: (1) |
|
|
|
|
|
|
|
|
|
|
|
|
|
Money market funds |
|
$ |
145,785 |
|
— |
|
— |
|
— |
|
145,785 |
|
|
Commercial paper |
|
|
— |
|
11,064 |
|
— |
|
— |
|
11,064 |
|
|
Total cash equivalents |
|
$ |
145,785 |
|
11,064 |
|
— |
|
— |
|
156,849 |
|
|
Available for sale securities: |
|
|
|
|
|
|
|
|
|
|
|
|
|
Certificates of deposit |
|
$ |
— |
|
12,999 |
|
— |
|
— |
|
12,999 |
|
|
Commercial paper |
|
|
— |
|
34,978 |
|
— |
|
— |
|
34,978 |
|
|
Corporate bonds |
|
|
— |
|
197,442 |
|
— |
|
— |
|
197,442 |
|
|
U.S. Treasury bills |
|
|
— |
|
19,779 |
|
— |
|
— |
|
19,779 |
|
|
Sponsored funds |
|
|
124,016 |
|
— |
|
— |
|
— |
|
124,016 |
|
|
Trading securities: |
|
|
|
|
|
|
|
|
|
|
|
|
|
Certificates of deposit |
|
|
— |
|
1,999 |
|
— |
|
— |
|
1,999 |
|
|
Corporate bonds |
|
|
— |
|
55,414 |
|
— |
|
|
|
55,414 |
|
|
U.S. Treasury bills |
|
|
— |
|
4,929 |
|
— |
|
— |
|
4,929 |
|
|
Mortgage-backed securities |
|
|
— |
|
10 |
|
— |
|
— |
|
10 |
|
|
Common stock |
|
|
116 |
|
— |
|
— |
|
— |
|
116 |
|
|
Consolidated sponsored funds |
|
|
77,128 |
|
61,958 |
|
— |
|
— |
|
139,086 |
|
|
Sponsored funds |
|
|
13,841 |
|
— |
|
— |
|
— |
|
13,841 |
|
|
Sponsored privately offered funds measured at net asset value (2) |
|
|
— |
|
— |
|
— |
|
695 |
|
695 |
|
|
Equity method securities: (3) |
|
|
|
|
|
|
|
|
|
|
|
|
|
Sponsored funds |
|
|
95,188 |
|
— |
|
— |
|
— |
|
95,188 |
|
|
Total |
|
$ |
310,289 |
|
389,508 |
|
— |
|
695 |
|
700,492 |
|
|
December 31, 2016 |
|
Level 1 |
|
Level 2 |
|
Level 3 |
|
Other Assets Held at Net Asset Value |
|
Total |
|
|
|
|
|
(in thousands) |
|
|||||||||
|
Cash equivalents: (1) |
|
|
|
|
|
|
|
|
|
|
|
|
|
Total cash equivalents |
|
$ |
71,758 |
|
— |
|
— |
|
— |
|
71,758 |
|
|
Available for sale securities: |
|
|
|
|
|
|
|
|
|
|
|
|
|
Sponsored funds |
|
$ |
122,806 |
|
— |
|
— |
|
— |
|
122,806 |
|
|
Sponsored privately offered funds measured at net asset value (2) |
|
|
— |
|
— |
|
— |
|
570 |
|
570 |
|
|
Trading securities: |
|
|
|
|
|
|
|
|
|
|
|
|
|
Mortgage-backed securities |
|
|
— |
|
13 |
|
— |
|
— |
|
13 |
|
|
Common stock |
|
|
101 |
|
— |
|
— |
|
— |
|
101 |
|
|
Consolidated sponsored funds |
|
|
100,847 |
|
44,863 |
|
— |
|
— |
|
145,710 |
|
|
Sponsored funds |
|
|
29,541 |
|
— |
|
— |
|
— |
|
29,541 |
|
|
Equity method securities: (3) |
|
|
|
|
|
|
|
|
|
|
|
|
|
Sponsored funds |
|
|
26,775 |
|
— |
|
— |
|
— |
|
26,775 |
|
|
Sponsored privately offered funds measured at net asset value (2) |
|
|
— |
|
— |
|
— |
|
3,234 |
|
3,234 |
|
|
Total |
|
$ |
280,070 |
|
44,876 |
|
— |
|
3,804 |
|
328,750 |
|
|
(1) |
Cash equivalents include highly liquid investments with original maturities of 90 days or less. Cash investments in actively traded money market funds are measured at NAV and are classified as Level 1. Cash investments in commercial paper are measured at cost, which approximates fair value because of the short time between purchase of the instrument and its expected realization, and are classified as Level 2. |
|
(2) |
Certain investments that are measured at fair value using the net asset value per share (or its equivalent) practical |
74
expedient have not been categorized in the fair value hierarchy. The fair value amounts presented in this table are intended to permit reconciliation of the fair value hierarchy to the amounts presented in the consolidated balance sheets. |
|
(3) |
Substantially all of the Company’s equity method investments are investment companies that record their underlying investments at fair value. |
4. Derivative Financial Instruments
In 2016, the Company implemented an economic hedge program that uses total return swap contracts to hedge market risk with its investments in certain sponsored funds. Certain of the consolidated sponsored funds may utilize derivative financial instruments within their portfolios in pursuit of their stated investment objectives. We do not hedge for speculative purposes.
Excluding derivative financial instruments held in certain consolidated sponsored funds, the Company was party to six total return swap contracts with a combined notional value of $213.9 million and three total return swap contracts with a combined notional value of $160.2 million as of December 31, 2017 and 2016, respectively. These derivative instruments are not designated as hedges for accounting purposes. Changes in fair value of the total return swap contracts are recognized in investment and other income (loss), net on the Company’s consolidated statement of income.
The Company posted $9.7 million and $7.1 million in cash collateral with the counterparties of the total return swap contracts as of December 31, 2017 and 2016, respectively. The cash collateral is included in customers and other receivables on the Company’s consolidated balance sheet. The Company does not record its fair value in derivative transactions against the posted collateral.
The following table presents the fair value of the derivative financial instruments, excluding derivative financial instruments held in certain consolidated sponsored funds as of December 31, 2017 and 2016 calculated based on Level 2 inputs:
|
|
|
|
|
|
December 31, |
|
|
December 31, |
|
|
|
|
|
|
2017 |
|
|
2016 |
|
|
|
Balance sheet |
|
|
|
|
|
|
|
|
|
location |
|
Fair value |
|
Fair value |
||
|
|
|
|
|
(in thousands) |
||||
|
Total return swap contracts |
|
Other current liabilities |
|
$ |
1,093 |
|
|
475 |
The following is a summary of net losses recognized in income for the years ended December 31, 2017 and 2016:
|
|
|
|
|
Year ended |
||
|
|
|
Income statement |
|
December 31, |
||
|
|
|
location |
|
|
2017 |
2016 |
|
|
|
|
|
(in thousands) |
||
|
Total return swap contracts |
|
Investment and other (loss) |
|
$ |
(36,368) |
(31,974) |
75
5. Property and Equipment
A summary of property and equipment at December 31, 2017 and 2016 is as follows:
|
|
|
|
|
|
|
|
Estimated |
|
|
|
|
|
2017 |
|
2016 |
|
useful lives |
|
||
|
|
|
(in thousands) |
|
|
|
|
|||
|
Leasehold improvements |
|
$ |
22,106 |
|
22,426 |
|
1 - 15 |
years |
|
|
Furniture and fixtures |
|
|
30,529 |
|
30,501 |
|
3 - 10 |
years |
|
|
Equipment |
|
|
20,802 |
|
20,616 |
|
2 - 26 |
years |
|
|
Computer software |
|
|
99,644 |
|
100,941 |
|
1 - 10 |
years |
|
|
Data processing equipment |
|
|
18,678 |
|
19,458 |
|
1 - 5 |
years |
|
|
Buildings |
|
|
11,759 |
|
11,699 |
|
1 - 30 |
years |
|
|
Land |
|
|
2,843 |
|
2,843 |
|
|
|
|
|
Property and equipment, at cost |
|
|
206,361 |
|
208,484 |
|
|
|
|
|
Accumulated depreciation |
|
|
(118,694) |
|
(106,035) |
|
|
|
|
|
Property and equipment, net |
|
$ |
87,667 |
|
102,449 |
|
|
|
|
Depreciation expense was $21.0 million, $18.4 million and $16.0 million during the years ended December 31, 2017, 2016 and 2015, respectively.
At December 31, 2017, we had property and equipment under capital leases with a cost of $1.9 million and accumulated depreciation of $1.0 million. At December 31, 2016, we had property and equipment under capital leases with a cost of $1.8 million and accumulated depreciation of $0.8 million.
6. Goodwill and Identifiable Intangible Assets
Goodwill and identifiable intangible assets (all considered indefinite-lived) at December 31, 2017 and 2016 are as follows:
|
|
|
December 31, |
|
December 31, |
|
|
|
|
|
2017 |
|
2016 |
|
|
|
|
|
(in thousands) |
|
|||
|
Goodwill |
|
$ |
106,970 |
|
106,970 |
|
|
|
|
|
|
|
|
|
|
Mutual fund management advisory contracts |
|
|
38,699 |
|
38,699 |
|
|
Mutual fund management subadvisory contract |
|
|
1,200 |
|
2,700 |
|
|
Other |
|
|
200 |
|
200 |
|
|
Total identifiable intangible assets |
|
|
40,099 |
|
41,599 |
|
|
|
|
|
|
|
|
|
|
Total |
|
$ |
147,069 |
|
148,569 |
|
7. Indebtedness
On August 31, 2010, the Company entered into a note purchase agreement to complete a $190.0 million private placement of the Senior Notes. Interest is payable semi‑annually in January and July of each year. The agreement requires the Company to maintain a consolidated leverage ratio not to exceed 3.0 to 1.0 for four consecutive quarters and a consolidated interest coverage ratio of not less than 4.0 to 1.0 for four consecutive quarters. The Company was in compliance with these covenants for all periods presented. As of December 31, 2017, the Company’s consolidated leverage ratio was 0.6 to 1.0, and the consolidated interest coverage ratio was 29.2 to 1.0.
Debt is reported at its carrying amount in the consolidated balance sheet. The fair value of the Company’s Series A Senior Notes maturing January 13, 2018 was $95.1 million at December 31, 2017 compared to the carrying value net of debt issuance costs of $95.0 million, which is listed under short-term notes payable in the consolidated balance sheet and was repaid upon maturity. The fair value of the Company’s Series B Senior Notes maturing January 13, 2021 was $101.7 million at December 31, 2017 compared to the carrying value net of debt issuance costs of $94.8 million, which is listed under long-term debt in the consolidated balance sheet. Fair value is calculated based on Level 2 inputs.
76
On October 20, 2017, we entered into a three-year unsecured revolving credit facility (the “New Credit Facility”) with various lenders, which initially provides for borrowings of up to $100.0 million and may be expanded to $200.0 million. The New Credit Facility replaced the prior credit facility, which was set to terminate in June 2018. At December 31, 2017 and 2016, there were no borrowings outstanding under the New Credit Facility or the prior credit facility. Borrowings under the Credit Facility bear interest at various rates including adjusted LIBOR or an alternative base rate plus, in each case, an incremental margin based on the Company’s credit rating. The Credit Facility also imposes a facility fee on the aggregate amount of commitments under the revolving facility (whether or not utilized). The facility fee is also based on the Company’s credit rating level. The covenants in the New Credit Facility are consistent with the covenants in the prior credit facility, including the required consolidated leverage ratio and the consolidated interest coverage ratio, which match those outlined above for the Senior Notes.
8. Income Taxes
The provision for income taxes from continuing operations for the years ended December 31, 2017, 2016 and 2015 consists of the following:
|
|
|
2017 |
|
2016 |
|
2015 |
|
|
|
|
|
(in thousands) |
|
|||||
|
Current taxes: |
|
|
|
|
|
|
|
|
|
Federal |
|
$ |
73,167 |
|
72,711 |
|
142,576 |
|
|
State |
|
|
7,720 |
|
7,174 |
|
12,800 |
|
|
Foreign |
|
|
— |
|
17 |
|
38 |
|
|
|
|
|
80,887 |
|
79,902 |
|
155,414 |
|
|
Deferred taxes |
|
|
20,481 |
|
1,982 |
|
(6,188) |
|
|
Provision for income taxes |
|
$ |
101,368 |
|
81,884 |
|
149,226 |
|
The following table reconciles the statutory federal income tax rate with our effective income tax rate from continuing operations for the years ended December 31, 2017, 2016 and 2015:
|
|
|
2017 |
|
2016 |
|
2015 |
|
|
Statutory federal income tax rate |
|
35.0 |
% |
35.0 |
% |
35.0 |
% |
|
State income taxes, net of federal tax benefits |
|
2.5 |
|
2.2 |
|
2.0 |
|
|
Share-based compensation |
|
3.4 |
|
— |
|
— |
|
|
Charges related to decrease in U.S. tax rate |
|
2.2 |
|
— |
|
— |
|
|
State tax incentives |
|
(0.2) |
|
(0.3) |
|
(0.2) |
|
|
Valuation allowance on losses capital in nature |
|
(1.0) |
|
(3.2) |
|
1.0 |
|
|
Other items |
|
(0.6) |
|
0.4 |
|
0.8 |
|
|
Effective income tax rate |
|
41.3 |
% |
34.1 |
% |
38.6 |
% |
77
The tax effect of temporary differences that give rise to significant portions of deferred tax liabilities and deferred tax assets at December 31, 2017 and 2016 are as follows:
|
|
|
2017 |
|
2016 |
|
|
|
|
|
(in thousands) |
|
|||
|
Deferred tax liabilities: |
|
|
|
|
|
|
|
Deferred sales commissions |
|
$ |
(331) |
|
(484) |
|
|
Property and equipment |
|
|
(7,301) |
|
(13,906) |
|
|
Identifiable intangible assets |
|
|
(7,419) |
|
(11,118) |
|
|
Unrealized gains on investments securities and partnerships |
|
|
(3,554) |
|
— |
|
|
Prepaid expenses |
|
|
(1,679) |
|
(1,968) |
|
|
Additional postretirement liability |
|
|
(150) |
|
(356) |
|
|
Total gross deferred liabilities |
|
|
(20,434) |
|
(27,832) |
|
|
Deferred tax assets: |
|
|
|
|
|
|
|
Benefit plans |
|
|
3,381 |
|
15,425 |
|
|
Accrued compensation |
|
|
5,558 |
|
10,678 |
|
|
Other accrued expenses |
|
|
4,094 |
|
7,058 |
|
|
Unrealized losses on investment securities and partnerships |
|
|
— |
|
1,834 |
|
|
Capital loss carryforwards |
|
|
57 |
|
3,920 |
|
|
Share-based compensation |
|
|
15,047 |
|
20,516 |
|
|
Unused state tax credits |
|
|
2,788 |
|
2,115 |
|
|
State net operating loss carryforwards |
|
|
7,235 |
|
5,716 |
|
|
Other |
|
|
2,817 |
|
3,428 |
|
|
Total gross deferred assets |
|
|
40,977 |
|
70,690 |
|
|
Valuation allowance |
|
|
(7,235) |
|
(11,428) |
|
|
Net deferred tax asset |
|
$ |
13,308 |
|
31,430 |
|
The Company has a deferred tax asset for a capital loss carryforward that is available to offset current and future capital gains. As of December 31, 2017 and 2016, the deferred tax asset, net of federal tax effect, related to this capital loss carryforward is $0.1 million and $3.9 million, respectively. During 2017, realized capital gains on investment securities and capital gain dividend distributions exceeded the federal capital loss carryforward and therefore, the related deferred tax asset was eliminated. As of December 31, 2017, $0.1 million deferred tax assets remains related to a state capital loss carryforward. Due to the character of the losses and the limited carryforward period permitted by law upon realization, the Company had a valuation allowance recorded against this deferred tax asset as of December 31, 2016 in the amount of $5.8 million. Management believes it is more likely than not that the Company will realize the full benefit of the state capital loss carryforward prior to its expiration in 2018. As a result, no valuation allowance remains on the balance sheet as of December 31, 2017.
Certain subsidiaries of the Company have net operating loss carryforwards in certain states in which these companies file on a separate company basis. The deferred tax asset, net of federal tax effect, relating to these carryforwards as of December 31, 2017 and 2016 is approximately $7.2 million and $5.7 million, respectively. The carryforwards, if not utilized, will expire between 2018 and 2037. Management believes it is not more likely than not that these subsidiaries will generate sufficient future taxable income in these states to realize the benefit of the net operating loss carryforwards and, accordingly, a valuation allowance in the amount of $7.2 million and $5.6 million has been recorded at December 31, 2017 and 2016, respectively.
The Company has state tax credit carryforwards of $2.8 million and $2.1 million as of December 31, 2017 and 2016, respectively. Of these state tax credit carryforwards, $2.6 million will expire between 2024 and 2033 if not utilized and $0.2 million will expire in 2026 if not utilized. The Company anticipates these credits will be fully utilized prior to their expiration date.
As of January 1, 2017, the Company had unrecognized tax benefits, including penalties and interest, of $11.5 million ($8.4 million net of federal benefit) that, if recognized, would impact the Company’s effective tax rate. As of December 31, 2017, the Company had unrecognized tax benefits, including penalties and interest, of $10.9 million ($8.9 million net of federal benefit) that, if recognized, would impact the Company’s effective tax rate. The unrecognized tax benefits that are not expected to be settled within the next 12 months are included in other liabilities in the accompanying consolidated balance sheets; unrecognized tax benefits that are expected to be settled within the next 12 months are
78
included in income taxes payable; and unrecognized tax benefits that reduce a net operating loss, similar tax loss, or tax credit carryforward are presented as a reduction to noncurrent deferred income taxes.
The Company’s accounting policy with respect to interest and penalties related to income tax uncertainties is to classify these amounts as income taxes. As of January 1, 2017, the total amount of accrued interest and penalties related to uncertain tax positions recognized in the consolidated balance sheet was $3.8 million ($3.1 million net of federal benefit). The total amount of penalties and interest, net of federal benefit, related to tax uncertainties recognized in the statement of income for the period ended December 31, 2017 was $0.5 million. As of December 31, 2017, the Company had total accrued penalties and interest related to uncertain tax positions of $4.0 million ($3.5 million net of federal benefit) in the consolidated balance sheet, which is included in the total unrecognized tax benefits described above.
The following table summarizes the Company's reconciliation of unrecognized tax benefits, excluding penalties and interest, for the years ended December 31, 2017, 2016 and 2015:
|
|
|
2017 |
|
2016 |
|
2015 |
|
|
|
|
|
(in thousands) |
|
|||||
|
Balance at January 1 |
|
$ |
7,734 |
|
8,448 |
|
8,105 |
|
|
Increases during the year: |
|
|
|
|
|
|
|
|
|
Gross increases - tax positions in prior period |
|
|
244 |
|
465 |
|
1,401 |
|
|
Gross increases - current-period tax positions |
|
|
97 |
|
494 |
|
700 |
|
|
Decreases during the year: |
|
|
|
|
|
|
|
|
|
Gross decreases - tax positions in prior period |
|
|
(56) |
|
(167) |
|
(308) |
|
|
Decreases due to settlements with taxing authorities |
|
|
(178) |
|
(21) |
|
(486) |
|
|
Decreases due to lapse of statute of limitations |
|
|
(998) |
|
(1,485) |
|
(964) |
|
|
Balance at December 31 |
|
$ |
6,843 |
|
7,734 |
|
8,448 |
|
In the ordinary course of business, many transactions occur for which the ultimate tax outcome is uncertain. In addition, respective tax authorities periodically audit our income tax returns. These audits examine our significant tax filing positions, including the timing and amounts of deductions and the allocation of income among tax jurisdictions. During 2017, the Company closed an Internal Revenue Service audit of the 2014 tax year. This audit was settled with no significant adjustments. During 2016, the Company settled two open tax years that were undergoing audit by a state jurisdiction in which the Company operates. During 2015, the Company settled three open tax years that were undergoing audit by state jurisdictions in which the Company operates. The Company is currently under one audit in one state jurisdiction in which the Company operates. The 2014, 2015, 2016 and 2017 federal income tax returns are open tax years that remain subject to potential future audit. State income tax returns for all years after 2013 and, in certain states, income tax returns for 2013, are subject to potential future audit by tax authorities in the Company’s major state tax jurisdictions.
9. Pension Plan and Postretirement Benefits Other Than Pension
Benefits payable under the Pension Plan are based on employees’ years of service and compensation during the final 10 years of employment. On July 26, 2017, the Compensation Committee of the Company’s Board of Directors approved an amendment to freeze the Pension Plan effective September 30, 2017. After September 30, 2017, participants in the Pension Plan will not accrue additional benefits for future service or compensation. Participants will retain benefits accumulated as of September 30, 2017 in accordance with the terms of the Pension Plan. In accordance with applicable accounting standards, the Pension Plan’s assets and liabilities were remeasured as of July 31, 2017, the date participants were notified of the freeze. This resulted in a reduction of the accrued pension liability of approximately $30.0 million and a curtailment gain of $31.6 million.
During 2016, the Company offered eligible terminated, vested pension plan participants an option to elect a one-time voluntary lump sum window distribution equal to the present value of the participant’s pension benefit, in settlement of all future pension benefits to which they would otherwise have been entitled. This offer was made in an effort to reduce pension obligations and ongoing annual pension expense. Payments were distributed to participants who accepted the lump sum offer in 2016 from the assets of the Pension Plan. The Company recognized a non-cash settlement charge of $20.7 million in 2016 related to this event.
79
We also sponsor an unfunded defined benefit postretirement medical plan that previously covered substantially all employees, as well as independent financial advisors associated with W&R. The medical plan is contributory with participant contributions adjusted annually. The medical plan does not provide for benefits after age 65 with the exception of a small group of employees that were grandfathered when such plan was established. During 2016, the Company amended this plan to discontinue the availability of coverage for any individuals who retire after December 31, 2016. The plan amendment resulted in an $8.5 million curtailment gain, recorded in 2016 as part of net other postretirement benefit costs.
A reconciliation of the funded status of these plans and the assumptions related to the obligations at December 31, 2017, 2016 and 2015 are as follows:
|
|
|
|
|
|
|
|
|
|
Other |
|
||||
|
|
|
Pension Benefits |
|
Postretirement Benefits |
|
|||||||||
|
|
|
|
|
|
|
|
|
|
|
|
|
|
|
|
|
|
|
2017 |
|
2016 |
|
2015 |
|
2017 |
|
2016 |
|
2015 |
|
|
|
|
|
(in thousands) |
|
|||||||||||
|
Change in projected benefit obligation: |
|
|
|
|
|
|
|
|
|
|
|
|
|
|
|
Net benefit obligation at beginning of year |
|
$ |
180,921 |
|
210,783 |
|
208,085 |
|
2,446 |
|
8,421 |
|
9,902 |
|
|
Service cost |
|
|
8,367 |
|
12,199 |
|
12,080 |
|
— |
|
555 |
|
910 |
|
|
Interest cost |
|
|
6,248 |
|
9,432 |
|
8,420 |
|
58 |
|
297 |
|
397 |
|
|
Benefits paid |
|
|
(8,511) |
|
(52,288) |
|
(10,184) |
|
(954) |
|
(674) |
|
(505) |
|
|
Actuarial (gain) loss |
|
|
28,841 |
|
(19,886) |
|
(7,618) |
|
139 |
|
1,790 |
|
(2,632) |
|
|
Retiree contributions |
|
|
— |
|
— |
|
— |
|
506 |
|
532 |
|
349 |
|
|
Curtailment gain |
|
|
(31,621) |
|
— |
|
— |
|
— |
|
(8,475) |
|
— |
|
|
Settlement loss |
|
|
— |
|
20,681 |
|
— |
|
— |
|
— |
|
— |
|
|
Net benefit obligation at end of year |
|
$ |
184,245 |
|
180,921 |
|
210,783 |
|
2,195 |
|
2,446 |
|
8,421 |
|
The accumulated benefit obligation for the Pension Plan was $150.1 million at December 31, 2016.
|
|
|
|
|
|
|
|
|
|
Other |
|
||||
|
|
|
Pension Benefits |
|
Postretirement Benefits |
|
|||||||||
|
|
|
2017 |
|
2016 |
|
2015 |
|
2017 |
|
2016 |
|
2015 |
|
|
|
|
|
(in thousands) |
|
|||||||||||
|
Change in plan assets: |
|
|
|
|
|
|
|
|
|
|
|
|
|
|
|
Fair value of plan assets at beginning of year |
|
$ |
144,529 |
|
173,885 |
|
175,548 |
|
— |
|
— |
|
— |
|
|
Actual return on plan assets |
|
|
24,863 |
|
2,932 |
|
(11,479) |
|
— |
|
— |
|
— |
|
|
Employer contributions |
|
|
10,000 |
|
20,000 |
|
20,000 |
|
448 |
|
142 |
|
156 |
|
|
Retiree contributions |
|
|
— |
|
— |
|
— |
|
506 |
|
532 |
|
349 |
|
|
Benefits paid |
|
|
(8,511) |
|
(52,288) |
|
(10,184) |
|
(954) |
|
(674) |
|
(505) |
|
|
Fair value of plan assets at end of year |
|
$ |
170,881 |
|
144,529 |
|
173,885 |
|
— |
|
— |
|
— |
|
|
Funded status at end of year |
|
$ |
(13,364) |
|
(36,392) |
|
(36,898) |
|
(2,195) |
|
(2,446) |
|
(8,421) |
|
|
|
|
|
|
|
|
|
|
|
Other |
|
||||
|
|
|
Pension Benefits |
|
Postretirement Benefits |
|
|||||||||
|
|
|
2017 |
|
2016 |
|
2015 |
|
2017 |
|
2016 |
|
2015 |
|
|
|
|
|
(in thousands, except percentage data) |
|
|||||||||||
|
Amounts recognized in the statement of financial position: |
|
|
|
|
|
|
|
|
|
|
|
|
|
|
|
Current liabilities |
|
$ |
— |
|
— |
|
— |
|
(422) |
|
(458) |
|
(316) |
|
|
Noncurrent liabilities |
|
|
(13,364) |
|
(36,392) |
|
(36,898) |
|
(1,773) |
|
(1,988) |
|
(8,105) |
|
|
Net amount recognized at end of year |
|
$ |
(13,364) |
|
(36,392) |
|
(36,898) |
|
(2,195) |
|
(2,446) |
|
(8,421) |
|
|
Weighted average assumptions used to determine benefit obligation at December 31: |
|
|
|
|
|
|
|
|
|
|
|
|
|
|
|
Discount rate |
|
|
3.76 |
% |
4.39 |
% |
4.60 |
% |
3.28 |
% |
3.46 |
% |
4.44 |
% |
|
Rate of compensation increase |
|
|
Not applicable |
|
5.12 |
% |
5.12 |
% |
Not applicable |
|
||||
The discount rate assumption used to determine the pension and other postretirement benefits obligations was based on the Aon Hewitt AA Only Above Median Yield Curve. This discount rate was determined separately for each
80
plan by plotting the expected benefit payments from each plan against a yield curve of high quality, zero coupon bonds and calculating the single rate that would produce the same present value of liabilities as the yield curve.
Our Pension Plan asset allocation at December 31, 2017 and 2016 is as follows:
|
|
|
Percentage of |
|
Percentage of |
|
|
|
|
Plan Assets at |
|
Plan Assets at |
|
|
Plan assets by category |
|
December 31, 2017 |
|
December 31, 2016 |
|
|
Cash |
|
40 |
% |
18 |
% |
|
Equity securities: |
|
|
|
|
|
|
Domestic |
|
29 |
% |
49 |
% |
|
International |
|
18 |
% |
17 |
% |
|
Fixed income securities |
|
8 |
% |
10 |
% |
|
Gold bullion |
|
5 |
% |
6 |
% |
|
Total |
|
100 |
% |
100 |
% |
Historically, the primary investment objective has been to maximize growth of the Pension Plan assets to meet the projected obligations to the beneficiaries over a long period of time and to do so in a manner that is consistent with the Company’s earnings strength and risk tolerance. Asset allocation is the most important decision in managing the assets and is reviewed regularly. The asset allocation policy considers the Company’s financial strength and long‑term asset class risk/return expectations since the obligations are long‑term in nature. Prior to the Pension Plan freeze in 2017, assets were invested in our Asset Strategy investment style, managed by our in‑house investment professionals. Subsequent to the freeze, the Company adjusted the Pension Plan’s asset allocation to decrease the exposure to equity securities. In 2018, the Company started the implementation of a new pension de-risking strategy designed to more closely match assets to the pension obligations by shifting exposure from return-seeking assets to liability-hedging assets as the funded status of the Pension Plan increases.
We determine the fair value of our Pension Plan assets using broad levels of inputs as defined by related accounting standards and categorized as Level 1, Level 2 or Level 3, as described in Note 3. The following tables summarize our Pension Plan assets as of December 31, 2017 and 2016. As of December 31, 2017 a portion of the international equity securities were valued utilizing Level 2 inputs, in accordance with company policy based on market movement greater than or equal to 0.50% on the final trading day of the year.
|
2017 |
|
Level 1 |
|
Level 2 |
|
Level 3 |
|
Total |
|
||
|
|
|
(in thousands) |
|
||||||||
|
Equity securities: |
|
|
|
|
|
|
|
|
|
|
|
|
Domestic |
|
$ |
49,540 |
|
— |
|
— |
|
|
49,540 |
|
|
International |
|
|
4,889 |
|
26,542 |
|
— |
|
|
31,431 |
|
|
Fixed income securities: |
|
|
|
|
|
|
|
|
|
|
|
|
U.S. Treasuries |
|
|
— |
|
6,455 |
|
— |
|
|
6,455 |
|
|
Corporate bond |
|
|
— |
|
587 |
|
— |
|
|
587 |
|
|
Foreign bonds |
|
|
— |
|
6,591 |
|
— |
|
|
6,591 |
|
|
Gold bullion |
|
|
8,369 |
|
— |
|
— |
|
|
8,369 |
|
|
Total investment securities |
|
|
62,798 |
|
40,175 |
|
— |
|
|
102,973 |
|
|
Cash and cash equivalents |
|
|
|
|
|
|
|
|
|
67,908 |
|
|
Total |
|
|
|
|
|
|
|
|
$ |
170,881 |
|
81
|
2016 |
|
Level 1 |
|
Level 2 |
|
Level 3 |
|
Total |
|
||
|
|
|
(in thousands) |
|
||||||||
|
Equity securities: |
|
|
|
|
|
|
|
|
|
|
|
|
Domestic |
|
$ |
71,159 |
|
— |
|
— |
|
|
71,159 |
|
|
International |
|
|
24,622 |
|
— |
|
— |
|
|
24,622 |
|
|
Equity derivatives |
|
|
— |
|
12 |
|
— |
|
|
12 |
|
|
Fixed income securities: |
|
|
|
|
|
|
|
|
|
|
|
|
Mortgage-backed securities |
|
|
— |
|
10 |
|
— |
|
|
10 |
|
|
U.S. Treasuries |
|
|
— |
|
4,801 |
|
— |
|
|
4,801 |
|
|
Corporate bond |
|
|
— |
|
526 |
|
— |
|
|
526 |
|
|
Foreign Bonds |
|
|
— |
|
8,897 |
|
— |
|
|
8,897 |
|
|
Gold bullion |
|
|
8,420 |
|
— |
|
— |
|
|
8,420 |
|
|
Total investment securities |
|
|
104,201 |
|
14,246 |
|
— |
|
|
118,447 |
|
|
Cash and cash equivalents |
|
|
|
|
|
|
|
|
|
26,082 |
|
|
Total |
|
|
|
|
|
|
|
|
$ |
144,529 |
|
The 6.00% expected long‑term rate of return utilized after the plan freeze in 2017 reflected management’s expectations of long‑term average rates of return on funds invested to provide for benefits included in the projected benefit obligations. The expected return is based on the outlook for inflation, fixed income returns and equity returns, while also considering historical returns, asset allocation and investment strategy. In 2018, we will adjust the expected long-term rate of return to 5.00% to reflect a further decrease to the Plan’s equity securities’ holdings.
The components of net periodic pension and other postretirement costs consisted of the following for the years ended December 31, 2017, 2016 and 2015:
|
|
|
|
|
|
|
|
|
|
Other |
|
||||
|
|
|
Pension Benefits |
|
Postretirement Benefits |
|
|||||||||
|
|
|
2017 |
|
2016 |
|
2015 |
|
2017 |
|
2016 |
|
2015 |
|
|
|
|
|
(in thousands) |
|
|||||||||||
|
Components of net periodic benefit cost: |
|
|
|
|
|
|
|
|
|
|
|
|
|
|
|
Service cost |
|
$ |
8,367 |
|
12,199 |
|
12,080 |
|
— |
|
555 |
|
910 |
|
|
Interest cost |
|
|
6,248 |
|
9,432 |
|
8,420 |
|
58 |
|
297 |
|
397 |
|
|
Expected return on plan assets |
|
|
(10,113) |
|
(13,927) |
|
(14,510) |
|
— |
|
— |
|
— |
|
|
Actuarial gain (loss) |
|
|
14,091 |
|
(8,891) |
|
18,371 |
|
— |
|
— |
|
— |
|
|
Actuarial gain amortization |
|
|
— |
|
— |
|
— |
|
(180) |
|
(153) |
|
— |
|
|
Prior service cost amortization |
|
|
— |
|
— |
|
— |
|
(4) |
|
4 |
|
19 |
|
|
Curtailment gain |
|
|
(31,621) |
|
— |
|
— |
|
— |
|
(8,475) |
|
— |
|
|
Settlement loss |
|
|
— |
|
20,681 |
|
— |
|
— |
|
— |
|
— |
|
|
Total (1) |
|
$ |
(13,028) |
|
19,494 |
|
24,361 |
|
(126) |
|
(7,772) |
|
1,326 |
|
|
(1) |
For the year ended December 31, 2017, $9.7 million of net periodic pension and other postretirement benefit credits were included in compensation and related costs and $3.5 million included in underwriting and distribution expense. |
The estimated net actuarial gain and prior service credit for the postretirement medical plan that will be amortized from accumulated other comprehensive income into net periodic benefit cost in 2018 are $120 thousand and $2 thousand, respectively.
82
The weighted average assumptions used to determine net periodic benefit cost for the years ended December 31, 2017, 2016 and 2015 are as follows:
|
|
|
|
|
|
|
|
|
Other |
|
||||
|
|
|
Pension Benefits |
|
Postretirement Benefits |
|
||||||||
|
|
|
2017 |
|
2016 |
|
2015 |
|
2017 |
|
2016 |
|
2015 |
|
|
Discount rate |
|
4.39% / 3.96 |
1% |
4.60 |
% |
4.13 |
% |
3.46 |
% |
4.44 |
% |
4.07 |
% |
|
Expected return on plan assets |
|
7.00% / 6.00 |
1% |
7.50 |
% |
7.75 |
% |
Not applicable |
|
||||
|
Rate of compensation increase |
|
5.12 |
% |
5.12 |
% |
5.12 |
% |
Not applicable |
|
||||
|
(1) |
Due to the plan freeze and associated remeasurement as of July 31, 2017, the discount rate changed from 4.39% to 3.96% and the expected return on assets changed from 7.00% to 6.00%. |
We expect the following benefit payments to be paid:
|
|
|
|
|
|
Other |
|
|
|
|
Pension |
|
Postretirement |
|
|
|
|
|
Benefits |
|
Benefits |
|
|
|
|
|
(in thousands) |
|
|||
|
2018 |
|
$ |
10,895 |
|
421 |
|
|
2019 |
|
|
8,667 |
|
421 |
|
|
2020 |
|
|
8,642 |
|
315 |
|
|
2021 |
|
|
9,659 |
|
241 |
|
|
2022 |
|
|
9,406 |
|
199 |
|
|
2023 through 2027 |
|
|
50,906 |
|
484 |
|
|
|
|
$ |
98,175 |
|
2,081 |
|
Our policy with respect to funding the Pension Plan is to fund at least the minimum required by the Employee Retirement Income Security Act of 1974, as amended, and not more than the maximum amount deductible for tax purposes. All contributions made to the Pension Plan for 2017, 2016 and 2015 were voluntary.
All Company contributions to other postretirement medical benefits are voluntary, as the postretirement medical plan is not funded and is not subject to any minimum regulatory funding requirements. The contributions for each year represent claims paid for medical expenses, and we anticipate making the 2018 expected contribution with cash generated from operations. Contributions by participants to the postretirement plan were $506 thousand, $532 thousand and $349 thousand for the years ended December 31, 2017, 2016 and 2015, respectively.
For measurement purposes, the initial health care cost trend rate was 7.02% (prior to age 65) and 8.47% (subsequent to age 65) for 2017, 6.82% for 2016 and 7.55% for 2015. The health care cost trend rate reflects anticipated increases in health care costs. The initial growth rates for 2017 are assumed to gradually decline over the next 8 years to a rate of 4.5%. The effect of a 1% annual increase in assumed cost trend rates would increase the December 31, 2017 accumulated postretirement benefit obligation by approximately $102 thousand, and the aggregate of the service and interest cost components of net periodic postretirement benefit cost by approximately $108 thousand. The effect of a 1% annual decrease in assumed cost trend rates would decrease the December 31, 2017 accumulated postretirement benefit obligation by approximately $91 thousand, and the aggregate of the service and interest cost components of net periodic postretirement benefit cost by approximately $97 thousand.
We also sponsored the Waddell & Reed Financial, Inc. Supplemental Executive Retirement Plan, as amended and restated (the “SERP”), a non-qualified deferred compensation plan covering eligible employees. The SERP was adopted to supplement the annual pension benefit for certain senior executive officers that the Pension Plan was prevented from providing because of compensation and benefit limits in the Internal Revenue Code (the “IRC”).
Each calendar year, the Compensation Committee of the Board of Directors (the “Compensation Committee”) credited participants’ SERP accounts with (i) an amount equal to 4% of the participant’s base salary, less the amount of the maximum employer matching contribution available under our 401(k) plan, and (ii) a non formula award, if any, as determined by the Compensation Committee in its discretion. There were no discretionary awards made to participants during 2017, 2016 or 2015. Additionally, each calendar year, participants’ accounts were credited (or charged) with an amount equal to the performance of certain hypothetical investment vehicles since the last preceding year. Upon a participant’s separation, or at such other time based on a pre-existing election by a participant, benefits accumulated under
83
the SERP are payable in installments or in a lump sum. As of December 31, 2016, the aggregate liability to participants was $3.8 million. Following a lump sum payment of $3.8 million in February 2017 to the sole remaining participant in the SERP, the Board of Directors terminated the SERP.
At December 31, 2017, the accrued pension and postretirement liability recorded in the consolidated balance sheet was comprised of accrued pension costs of $13.4 million and a liability for postretirement benefits in the amount of $1.8 million. The current portion of postretirement liability of $0.4 million is included in other current liabilities on the consolidated balance sheet. At December 31, 2016, the accrued pension and postretirement liability recorded in the consolidated balance sheet was comprised of accrued pension costs of $36.4 million and a liability for postretirement benefits in the amount of $2.0 million. The accrued liability for SERP benefits of $3.8 million and the current portion of postretirement liability of $0.4 million is included in other current liabilities on the consolidated balance sheet.
10. Employee Savings Plan
We sponsor a defined contribution plan that qualifies under Section 401(k) of the IRC to provide retirement benefits to substantially all of our employees. As allowed under Section 401(k), the plan provides tax‑deferred salary deductions for eligible employees. Our matching contributions to the plan for the years ended December 31, 2017, 2016 and 2015 were $6.0 million, $6.8 million and $6.6 million, respectively.
In 2017, in connection with the Pension Plan freeze, the Company amended its 401(k) plan to permit employer discretionary nonelective contributions to eligible participants. For the 2017 plan year, the Company approved a discretionary nonelective contribution in an amount equal to 4% of such participant’s eligible compensation. These contributions, which were expensed over the service period in 2017, totaled $5.5 million and are expected to be funded and allocated to participant accounts during the first quarter of 2018.
11. Stockholders’ Equity
Earnings per Share
For the years ended December 31, 2017, 2016 and 2015, earnings per share were computed as follows:
|
|
|
|
|
|
|
|
|
|
|
|
|
|
|
|
|
|
|
|
|
|
|
2017 |
|
2016 |
|
2015 |
|
|
|
|
|
|
|
|
|
|
|
|
|
|
|
|
|
|
|
|
|
|
|
Net income attributable to Waddell & Reed Financial, Inc. |
|
$ |
141,279 |
|
156,695 |
|
237,578 |
|
|
|
|
|
|
|
|
|
|
|
|
Weighted average shares outstanding, basic and diluted |
|
|
83,573 |
|
82,668 |
|
83,499 |
|
|
|
|
|
|
|
|
|
|
|
|
Earnings per share, basic and diluted |
|
$ |
1.69 |
|
1.90 |
|
2.85 |
|
Dividends
The Board of Directors declared dividends on our common stock of $1.63 per share, $1.84 per share and $1.75 per share for the years ended December 31, 2017, 2016 and 2015, respectively. In December 2017, the Board of Directors approved a quarterly dividend on our common stock of $0.25 per share payable on February 1, 2018 to stockholders of record as of January 11, 2018. As of December 31, 2017 and 2016, other current liabilities included $20.7 million and $38.2 million, respectively, for dividends payable to stockholders.
Common Stock Repurchases
The Board of Directors has authorized the repurchase of our common stock in the open market and/or private purchases. The acquired shares may be used for corporate purposes, including as shares issued to employees in our stock‑based compensation programs. There were 1,842,337 shares, 2,320,726 shares and 1,955,509 shares repurchased in the open market or privately during the years ended December 31, 2017, 2016 and 2015, respectively. The repurchased shares include; 402,337 shares, 423,726 shares and 432,353 shares repurchased from employees who elected to tender
84
shares to cover their minimum tax withholdings with respect to vesting of stock awards during the years ended December 31, 2017, 2016 and 2015, respectively.
Accumulated Other Comprehensive Loss
The following table summarizes other comprehensive income (loss) activity for the years ended December 31, 2017 and 2016.
|
|
|
|
|
|
Change in |
|
|
|
|
|
|
|
|
|
|
|
|
valuation |
|
|
|
|
|
|
|
|
|
|
|
|
allowance for |
|
|
|
|
|
|
|
|
|
|
|
|
unrealized |
|
|
|
Total |
|
|
|
|
|
Unrealized |
|
gains |
|
Postretirement |
|
accumulated |
|
||
|
|
|
gains (losses) |
|
(losses) on |
|
benefits |
|
other |
|
||
|
|
|
on investment |
|
investment |
|
unrealized |
|
comprehensive |
|
||
|
Year ended December 31, 2017 |
|
securities |
|
securities |
|
gains (losses) |
|
income (loss) |
|
||
|
|
|
(in thousands) |
|
||||||||
|
Balance at December 31, 2016 |
|
$ |
(3,972) |
|
|
(3,388) |
|
603 |
|
(6,757) |
|
|
Other comprehensive income (loss) before reclassification |
|
|
4,039 |
|
|
3,743 |
|
(106) |
|
7,676 |
|
|
Amount reclassified from accumulated other comprehensive income (loss) |
|
|
78 |
|
|
(355) |
|
(118) |
|
(395) |
|
|
Net current period other comprehensive income (loss) |
|
|
4,117 |
|
|
3,388 |
|
(224) |
|
7,281 |
|
|
Balance at December 31, 2017 |
|
$ |
145 |
|
$ |
— |
|
379 |
|
524 |
|
|
|
|
|
|
|
Change in |
|
|
|
|
|
|
|
|
|
|
|
|
valuation |
|
|
|
|
|
|
|
|
|
|
|
|
allowance for |
|
|
|
|
|
|
|
|
|
|
|
|
unrealized |
|
|
|
Total |
|
|
|
|
|
Unrealized |
|
gains |
|
Postretirement |
|
accumulated |
|
||
|
|
|
gains (losses) |
|
(losses) on |
|
benefits |
|
other |
|
||
|
|
|
on investment |
|
investment |
|
unrealized |
|
comprehensive |
|
||
|
Year ended December 31, 2016 |
|
securities |
|
securities |
|
gains (losses) |
|
income (loss) |
|
||
|
|
|
(in thousands) |
|
||||||||
|
Balance at December 31, 2015 |
|
$ |
(3,729) |
|
|
(3,240) |
|
1,824 |
|
(5,145) |
|
|
Other comprehensive income (loss) before reclassification |
|
|
1,948 |
|
|
1,195 |
|
(1,125) |
|
2,018 |
|
|
Amount reclassified from accumulated other comprehensive loss |
|
|
(2,191) |
|
|
(1,343) |
|
(96) |
|
(3,630) |
|
|
Net current period other comprehensive loss |
|
|
(243) |
|
|
(148) |
|
(1,221) |
|
(1,612) |
|
|
Balance at December 31, 2016 |
|
$ |
(3,972) |
|
$ |
(3,388) |
|
603 |
|
(6,757) |
|
Reclassifications from accumulated other comprehensive income and included in net income are summarized in the table that follows for the years ended December 31, 2017 and 2016:
|
|
|
|
For the year ended December 31, 2017 |
|
|
|
||||
|
|
|
|
|
|
Tax |
|
|
|
|
|
|
|
|
|
|
|
(expense) |
|
|
|
|
|
|
|
|
Pre-tax |
|
benefit |
|
Net of tax |
|
Statement of income line item |
|
|
|
|
|
(in thousands) |
|
|||||||
|
Reclassifications included in net income: |
|
|
|
|
|
|
|
|
|
|
|
Sponsored funds investment losses |
|
$ |
(124) |
|
46 |
|
(78) |
|
Investment and other income (loss) |
|
|
Valuation allowance |
|
|
— |
|
355 |
|
355 |
|
Provision for income taxes |
|
|
Amortization of postretirement benefits |
|
|
184 |
|
(66) |
|
118 |
|
Underwriting and distribution expense and Compensation and related costs |
|
|
Total |
|
$ |
60 |
|
335 |
|
395 |
|
|
|
85
|
|
|
For the year ended December 31, 2016 |
|
|
|
|||||
|
|
|
|
|
|
Tax |
|
|
|
|
|
|
|
|
|
|
|
(expense) |
|
|
|
|
|
|
|
|
Pre-tax |
|
benefit |
|
Net of tax |
|
Statement of income line item |
|
|
|
|
|
(in thousands) |
|
|||||||
|
Reclassifications included in net income: |
|
|
|
|
|
|
|
|
|
|
|
Sponsored funds investment gains |
|
$ |
3,489 |
|
(1,298) |
|
2,191 |
|
Investment and other income (loss) |
|
|
Valuation allowance |
|
|
— |
|
1,343 |
|
1,343 |
|
Provision for income taxes |
|
|
Amortization of postretirement benefits |
|
|
149 |
|
(53) |
|
96 |
|
Underwriting and distribution expense and Compensation and related costs |
|
|
Total |
|
$ |
3,638 |
|
(8) |
|
3,630 |
|
|
|
12. Share‑Based Compensation
During 2017 the Company utilized one stock based compensation plan: the Company 1998 Stock Incentive Plan, as amended and restated (the “SI Plan”). Two other plans, the Company 1998 Executive Stock Award Plan, as amended and restated, and the Company 1998 Non Employee Director Stock Award Plan, as amended and restated, had no outstanding awards, and, effective February 2016, the Board of Directors terminated both plans.
The SI Plan allows us to grant equity compensation awards, including, among other awards, and nonvested stock as part of our overall compensation program to attract and retain key personnel and encourage a greater personal financial investment in the Company, thereby promoting the long-term growth of the Company. In April 2016, our stockholders approved amendments to the SI Plan to, among other things, increase by 5.6 million the number of shares available for awards. Following those amendments, a maximum of 35.6 million shares of common stock are authorized for issuance under the SI Plan and as of December 31, 2017, 2,458,263 shares of common stock were available for issuance under the SI Plan. In addition, we may make incentive payments under the Company 2003 Executive Incentive Plan, as amended and restated (the “EIP”) in the form of cash, stock options, nonvested stock or a combination thereof. Incentive awards paid under the EIP in the form of stock options or nonvested stock are issued out of shares reserved for issuance under the SI Plan. Generally, shares of common stock covered by terminated, surrendered or cancelled options, by forfeited nonvested stock, or by the forfeiture of other awards that do not result in issuance of shares of common stock are again available for awards under the plan from which they were terminated, surrendered, cancelled or forfeited.
Nonvested stock awards are valued on the date of grant and have no purchase price. These awards have historically vested over four years in 33 1/3% increments on the second, third and fourth anniversaries of the grant date; however, awards granted on or after December 31, 2016 vest in 25% increments on the first anniversary of the grant date. The Company has issued nonvested stock awards to financial advisors associated with W&R who are independent contractors. These awards have the same terms as awards issued to employees; however, changes in the Company’s share price result in variable compensation expense over the vesting period.
Beginning in 2017, the Company established a Cash Settled RSU Plan (the “RSU Plan”), which allows the Company to grant RSUs to attract and retain key personnel and enable them to participate in the long-term growth of the Company. Unvested RSUs have no purchase price and vest in 25% increments over four years, beginning on the first anniversary of the grant date. On the vesting date, RSU holders receive a lump sum cash payment equal to the fair market value of one share of the Company’s common stock, par value $0.01, for each RSU that has vested, subject to applicable tax withholdings. We treat RSUs as liability-classified awards and, therefore, account for them at fair value based on the closing price of our common stock on the reporting date, which results in variable compensation expense over the vesting period.
Nonvested shares and nonvested RSU’s are forfeited upon the termination of employment with or service to the Company, as applicable, or service on the Board of Directors, dependent upon the circumstances of termination. Except for restrictions placed on the transferability of nonvested stock, holders of nonvested stock have full stockholders’ rights during the term of restriction, including voting rights and the rights to receive cash dividends. Since nonvested RSUs are not shares of Company stock, holders of nonvested RSUs are not entitled to voting rights but are entitled to dividend equivalent payments for each RSU equal to the dividend paid on one share of our common stock.
86
A summary of nonvested share activity and related fair value for the year ended December 31, 2017 follows:
|
|
|
|
|
Weighted |
|
|
|
|
|
|
|
Average |
|
|
|
|
|
Nonvested |
|
Grant Date |
|
|
|
|
|
Stock Shares |
|
Fair Value |
|
|
|
Nonvested at December 31, 2016 |
|
4,786,103 |
|
$ |
34.74 |
|
|
Granted |
|
1,717,333 |
|
|
19.77 |
|
|
Vested |
|
(1,109,002) |
|
|
48.22 |
|
|
Forfeited |
|
(305,794) |
|
|
26.31 |
|
|
Nonvested at December 31, 2017 |
|
5,088,640 |
|
$ |
27.26 |
|
A summary of nonvested cash-settled unit activity for the year ended December 31, 2017 follows:
|
|
|
|
|
|
|
Nonvested |
|
|
|
Cash-Settled Units |
|
Nonvested at December 31, 2016 |
|
— |
|
Granted |
|
1,284,459 |
|
Vested |
|
(522) |
|
Forfeited |
|
(70,908) |
|
Nonvested at December 31, 2017 |
|
1,213,029 |
For the years ended December 31, 2017, 2016 and 2015 compensation expense related to nonvested stock totaled $57.7 million, $51.5 million and $47.5 million, respectively.
The income tax benefit from the compensation expense related to nonvested stock was $12.2 million, $19.2 million and $17.6 million for the years ended December 31, 2017, 2016 and 2015, respectively. These benefits will be recognized upon vesting and may increase or decrease depending on the fair value of the shares on the date of vesting. As of December 31, 2017, the remaining unamortized expense of $83.7 million is expected to be recognized over a weighted average period of 2.4 years.
The total fair value of shares vested (at vest date) during the years ended December 31, 2017, 2016 and 2015, was $20.8 million, $26.7 million and $53.9 million, respectively. The Company withholds a portion of each employee’s vested shares to satisfy the minimum tax withholding obligations of the Company with respect to vesting of the shares.
13. Uniform Net Capital Rule Requirements
Two of our subsidiaries, W&R and IDI are registered broker-dealers and members of FINRA. Broker-dealers are subject to the SEC’s Uniform Net Capital Rule (Rule 15c3‑1), which requires the maintenance of minimum net capital and requires that the ratio of aggregate indebtedness to net capital, both as defined, shall not exceed 15.0 to 1.0. The primary difference between net capital and stockholders’ equity is the non‑allowable assets that are excluded from net capital.
A broker-dealer may elect not to be subject to the Aggregate Indebtedness Standard of paragraph (a)(1)(i) of Rule 15c3‑1, in which case net capital must exceed the greater of $250 thousand or 2% of aggregate debit items computed in accordance with the Formula for Determination of Reserve Requirements for broker-dealers. W&R made this election and thus is not subject to the aggregate indebtedness ratio as of December 31, 2017 or 2016.
87
Net capital and aggregated indebtedness information for our broker-dealer subsidiaries is presented in the following table as of December 31, 2017 and 2016:
|
|
|
2017 |
|
2016 |
|
|||||||||
|
|
|
(in thousands) |
|
|||||||||||
|
|
|
W&R |
|
IDI |
|
W&R |
|
IDI |
|
|||||
|
Net capital |
|
$ |
28,024 |
|
|
|
21,167 |
|
52,639 |
|
|
|
12,894 |
|
|
Required capital |
|
|
250 |
|
|
|
1,757 |
|
250 |
|
|
|
2,152 |
|
|
Excess of required capital |
|
$ |
27,774 |
|
|
|
19,410 |
|
52,389 |
|
|
|
10,742 |
|
|
Ratio of aggregate indebtedness to net capital |
|
|
Not |
|
|
|
|
|
Not |
|
|
|
|
|
|
|
|
|
applicable |
|
|
|
1.25 to 1.0 |
|
applicable |
|
|
|
2.50 to 1.0 |
|
14. Rental Expense and Lease Commitments
We lease certain home office buildings, certain sales and other office space and equipment under operating leases. Rent expense was $24.5 million, $24.3 million and $23.7 million, for the years ended December 31, 2017, 2016 and 2015, respectively. Future minimum rental commitments under non‑cancelable operating leases are as follows:
|
Year |
|
Commitments |
|
|
|
|
|
(in thousands) |
|
|
|
2018 |
|
$ |
19,921 |
|
|
2019 |
|
|
14,181 |
|
|
2020 |
|
|
9,050 |
|
|
2021 |
|
|
5,340 |
|
|
2022 |
|
|
2,746 |
|
|
Thereafter |
|
|
7,489 |
|
|
|
|
$ |
58,727 |
|
15. Related Party Transactions
We earn investment management fee revenues from the Funds and IGI Funds for which we act as an investment adviser, pursuant to an investment management agreement with each Fund. In addition, we have agreements with the Funds pursuant to Rule 12b‑1 under the ICA for which distribution and service fees are collected from the Funds for distribution of mutual fund shares, for costs such as advertising and commissions paid to broker-dealers, and for providing ongoing services to shareholders of the Funds and/or maintaining shareholder accounts. We also earn service fee revenues by providing various services to the Funds and their shareholders pursuant to a shareholder servicing agreement with each Fund (except Ivy VIP) and an accounting service agreement with each Fund. Certain of our officers and directors are also officers and/or trustees for the various Funds for which we act as an investment adviser. These agreements are approved or renewed on an annual basis by each Fund’s board of trustees, including a majority of the disinterested members.
Revenues for services provided or related to the Funds and IGI Funds for the years ended December 31, 2017, 2016 and 2015 are as follows:
|
|
|
2017 |
|
2016 |
|
2015 |
|
|
|
|
|
(in thousands) |
|
|||||
|
Investment management fees |
|
$ |
508,035 |
|
523,304 |
|
654,727 |
|
|
Rule 12b-1 service and distribution fees |
|
|
159,873 |
|
208,901 |
|
303,046 |
|
|
Shareholder service fees |
|
|
106,595 |
|
120,241 |
|
143,071 |
|
|
Total revenues |
|
$ |
774,503 |
|
852,446 |
|
1,100,844 |
|
Included in Funds and separate accounts receivable at December 31, 2017 and 2016 are receivables due from the Funds of $20.6 and $21.6 million, respectively.
16. Contingencies
The Company is involved from time to time in various legal proceedings, regulatory investigations and claims incident to the normal conduct of business, which may include proceedings that are specific to us and others generally applicable to business practices within the industries in which we operate. A substantial legal liability or a significant
88
regulatory action against us could have an adverse effect on our business, financial condition and on the results of operations in a particular quarter or year.
The Company establishes reserves for litigation and similar matters when those matters present material loss contingencies that management determines to be both probable and reasonably estimable in accordance with ASC 450, “Contingencies Topic.” These amounts are not reduced by amounts that may be recovered under insurance or claims against third parties, but undiscounted receivables from insurers or other third parties may be accrued separately. The Company regularly revises such accruals in light of new information. The Company discloses the nature of the contingency when management believes it is reasonably possible the outcome may be significant to the Company’s consolidated financial statements and, where feasible, an estimate of the possible loss. For purposes of our litigation contingency disclosures, “significant” includes material matters as well as other items that management believes must be disclosed. Management’s judgment is required related to contingent liabilities because the outcomes are difficult to predict.
Shareholder Derivative Litigation
As previously disclosed, in an action filed on April 18, 2016 in the District Court of Johnson County, Kansas, Hieu Phan v. Ivy Investment Management Company, et al (Case No. I6CV02338 Div. 4), plaintiff filed a putative derivative action on behalf of the nominal defendant, a mutual fund trust affiliated with the Company, alleging breach of fiduciary duty and breach of contract claims relating to investments held in the affiliated mutual fund by the Company's registered investment adviser subsidiary, the nominal defendant trust, and the current and retired trustees of the trust. On behalf of the nominal defendant trust, plaintiff sought monetary damages and demanded a jury trial. On May 2, 2017, the nominal defendant trust filed a motion to stay the litigation pending the investigation and recommendation of a special litigation committee formed by the nominal defendant trust. On June 13, 2017, the court granted a 60-day stay until August 12, 2017, after which formal discovery commenced. While the Company denies that any of its subsidiaries breached their fiduciary duties to, or committed a breach of the investment management agreement with, the nominal defendant trust, on January 8, 2018 the parties to the litigation reached a settlement in principle. On February 22, 2018, the parties filed a joint motion for preliminary approval of the settlement and other associated pleadings with the court. The settlement contemplates the payment of $19.9 million, recoverable to the Company through insurance, to the affiliated mutual fund for the benefit of its shareholders. The settlement is subject to final approval by the court. The Company has recorded a liability and offsetting receivable from insurance, which are reflected in the Company's 2017 consolidated balance sheets.
401(k) Plan Class Action Litigation
In an action filed on June 23, 2017 and amended on June 26, 2017 in the U.S. District Court for the District of Kansas, Schapker v. Waddell & Reed Financial, Inc., et al, (Case No. 17-2365 D. Kan.), Stacy Schapker, a participant in the Company’s 401(k) and Thrift Plan, as amended and restated (the “401(k) Plan”), filed a lawsuit against the Company, the Company’s Board of Directors, the Administrative Committee of the 401(k) Plan, and unnamed Jane and John Doe Defendants 1-25. The amended complaint, which is filed on behalf of the 401(k) Plan and a proposed class of 401(k) Plan participants, purports to assert claims for breach of fiduciary duty and prohibited transactions under the Employee Retirement Income Security Act of 1974, as amended (“ERISA”) based on the 401(k) Plan’s offering of investments managed by the Company or its affiliates from June 23, 2011 to present. The amended complaint seeks, among other things, an order compelling the disgorgement of fees paid to the Company and its affiliates by the 401 (k) Plan and the restoration of losses to the 401(k) Plan arising from defendants alleged ERISA violations, attorneys’ fees and other injunctive and equitable relief. The Company believes the allegations are without merit and intends to vigorously defend this matter. On October 6, 2017, the defendants filed a motion to dismiss the amended complaint, and on February 22, 2018, the court denied the motion to dismiss. In the opinion of management, the ultimate resolution and outcome of this matter is uncertain. Given the preliminary nature of the proceedings and the Company’s dispute over the merits of the claims, the Company is unable to estimate a range of reasonably possible loss, if any, that such matter may represent. While the ultimate resolution of this matter is uncertain, an adverse determination against the Company could have a material adverse impact on our business, financial condition and results of operations.
89
17. Concentrations of Risk
Financial instruments that potentially subject the Company to concentrations of credit risk consist primarily of cash and cash equivalents held. The Company maintains cash and cash equivalents with various financial institutions. Cash deposits maintained at financial institutions may exceed the federally insured limit.
Our investments in sponsored funds and investments held as trading expose us to market risk. The underlying holdings of our assets under management are also subject to market risk, which may arise from changes in equity prices, credit ratings, foreign currency exchange rates, and interest rates.
18. Selected Quarterly Information (Unaudited)
|
|
|
Quarter |
|
|||||||
|
|
|
First |
|
Second |
|
Third |
|
Fourth |
|
|
|
|
|
(in thousands) |
|
|||||||
|
2017 |
|
|
|
|
|
|
|
|
|
|
|
Total revenues |
|
$ |
286,564 |
|
286,657 |
|
289,447 |
|
294,476 |
|
|
Net income attributable to Waddell & Reed Financial, Inc. |
|
$ |
33,871 |
|
24,061 |
|
53,582 |
|
29,765 |
|
|
Net income per share, basic and diluted |
|
$ |
0.40 |
|
0.29 |
|
0.64 |
|
0.36 |
|
|
|
|
Quarter |
|
|||||||
|
|
|
First |
|
Second |
|
Third |
|
Fourth |
|
|
|
|
|
(in thousands) |
|
|||||||
|
2016 |
|
|
|
|
|
|
|
|
|
|
|
Total revenues |
|
$ |
323,816 |
|
319,208 |
|
303,086 |
|
292,913 |
|
|
Net income attributable to Waddell & Reed Financial, Inc. |
|
$ |
38,069 |
|
34,678 |
|
54,908 |
|
29,040 |
|
|
Net income per share, basic and diluted |
|
$ |
0.46 |
|
0.42 |
|
0.66 |
|
0.35 |
|
90