Attached files
| file | filename |
|---|---|
| EX-32.1 - EX-32.1 - NAVIGANT CONSULTING INC | nci-ex321_7.htm |
| EX-31.2 - EX-31.2 - NAVIGANT CONSULTING INC | nci-ex312_6.htm |
| EX-31.1 - EX-31.1 - NAVIGANT CONSULTING INC | nci-ex311_8.htm |
| EX-23.1 - EX-23.1 - NAVIGANT CONSULTING INC | nci-ex231_9.htm |
| EX-21.1 - EX-21.1 - NAVIGANT CONSULTING INC | nci-ex211_10.htm |
UNITED STATES
SECURITIES AND EXCHANGE COMMISSION
Washington, D.C. 20549
Form 10-K
(Mark One)
|
☑ |
ANNUAL REPORT PURSUANT TO SECTION 13 OR 15(d) OF THE SECURITIES EXCHANGE ACT OF 1934 |
For the fiscal year ended December 31, 2017
OR
|
☐ |
TRANSITION REPORT PURSUANT TO SECTION 13 OR 15(d) OF THE SECURITIES EXCHANGE ACT OF 1934 |
Commission File No. 1-12173
Navigant Consulting, Inc.
(Exact name of Registrant as specified in its charter)
|
Delaware |
|
36-4094854 |
|
(State or other jurisdiction of incorporation or organization) |
|
(I.R.S. Employer Identification No.) |
150 North Riverside Plaza, Suite 2100, Chicago, Illinois 60606
(Address of principal executive offices, including zip code)
(312) 573-5600
(Registrant’s telephone number, including area code)
Securities registered pursuant to Section 12(b) of the Act:
|
Title of Each Class |
|
Name of Each Exchange on Which Registered |
|
Common Stock, par value $0.001 per share |
|
New York Stock Exchange |
Securities registered pursuant to Section 12(g) of the Act:
None
Indicate by check mark if the registrant is a well-known seasoned issuer, as defined in Rule 405 of the Securities Act. YES ☑ NO ☐
Indicate by check mark if the registrant is not required to file reports pursuant to Section 13 or Section 15(d) of the Act. YES ☐ NO ☑
Indicate by check mark whether the registrant (1) has filed all reports required to be filed by Section 13 or 15(d) of the Securities Exchange Act of 1934 during the preceding 12 months, and (2) has been subject to such filing requirements for the past 90 days. YES ☑ NO ☐
Indicate by check mark whether the registrant has submitted electronically and posted on its corporate website, if any, every Interactive Data File required to be submitted and posted pursuant to Rule 405 of Regulation S-T (§232.405 of this chapter) during the preceding 12 months (or for such shorter period that the registrant was required to submit and post such files). YES ☑ NO ☐
Indicate by check mark if disclosure of delinquent filers pursuant to Item 405 of Regulation S-K is not contained herein, and will not be contained, to the best of registrant’s knowledge, in definitive proxy or information statements incorporated by reference in Part III of this Form 10-K or any amendment to this Form 10-K. ☑
Indicate by check mark whether the registrant is a large accelerated filer, an accelerated filer, a non-accelerated filer, or a smaller reporting company. See the definitions of “large accelerated filer,” “accelerated filer” and “smaller reporting company” in Rule 12b-2 of the Exchange Act. (Check one):
|
Large accelerated filer |
☑ |
|
Accelerated filer |
☐ |
|
Non-accelerated filer |
☐ |
(Do not check if a smaller reporting company) |
Smaller reporting company |
☐ |
|
|
|
|
Emerging growth company |
☐ |
If an emerging growth company, indicate by checkmark if the registrant has elected not to use the extended transition period for complying with any new or revised financial accounting standards provided pursuant to Section 13(a) of the Exchange Act.☐
Indicate by check mark whether the registrant is a shell company (as defined in Rule 12b-2 of the Exchange Act). YES ☐ NO ☑
As of February 19, 2018, 45,067,499 shares of the registrant’s common stock, par value $0.001 per share (Common Stock), were outstanding. The aggregate market value of shares of the Common Stock held by non-affiliates, based upon the closing sale price per share of the Common Stock on the New York Stock Exchange on June 30, 2017, was approximately $913.1 million.
DOCUMENTS INCORPORATED BY REFERENCE
Certain information from the registrant’s definitive Proxy Statement for its Annual Meeting of Shareholders is incorporated by reference into Part III of this report. The registrant intends to file the Proxy Statement with the Securities and Exchange Commission within 120 days of December 31, 2017.
NAVIGANT CONSULTING, INC. AND SUBSIDIARIES
FORM 10-K
FOR THE FISCAL YEAR ENDED DECEMBER 31, 2017
TABLE OF CONTENTS
|
|
|
Page |
|
PART I |
|
|
|
Item 1. |
4 |
|
|
Item 1A. |
8 |
|
|
Item 1B. |
17 |
|
|
Item 2. |
17 |
|
|
Item 3. |
17 |
|
|
Item 4. |
17 |
|
|
|
18 |
|
|
|
|
|
|
PART II |
|
|
|
Item 5. |
19 |
|
|
Item 6. |
22 |
|
|
Item 7. |
Management’s Discussion and Analysis of Financial Condition and Results of Operations |
23 |
|
Item 7A. |
38 |
|
|
Item 8. |
39 |
|
|
Item 9. |
Changes in and Disagreements with Accountants on Accounting and Financial Disclosure |
39 |
|
Item 9A. |
39 |
|
|
Item 9B. |
39 |
|
|
|
|
|
|
PART III |
|
|
|
Item 10. |
41 |
|
|
Item 11. |
41 |
|
|
Item 12. |
Security Ownership of Certain Beneficial Owners and Management and Related Stockholder Matters |
41 |
|
Item 13. |
Certain Relationships and Related Transactions, and Director Independence |
41 |
|
Item 14. |
41 |
|
|
|
|
|
|
PART IV |
|
|
|
Item 15. |
42 |
|
|
|
F-2 |
|
|
|
F-3 |
|
|
|
F-4 |
|
|
|
F-5 |
|
|
|
F-6 |
|
|
|
F-7 |
|
|
S-1 |
||
2
Statements included in this report which are not historical in nature are “forward-looking statements” as defined in the Private Securities Litigation Reform Act of 1995. Forward-looking statements may generally be identified by words such as “anticipate,” “believe,” “may,” “could,” “intend,” “estimate,” “expect,” “continue,” “plan,” “outlook” and similar expressions. These statements are based upon management’s current expectations and speak only as of the date of this report. The Company cautions readers that there may be events in the future that the Company is not able to accurately predict or control and the information contained in the forward-looking statements is inherently uncertain and subject to a number of risks that could cause actual results to differ materially from those contained in or implied by the forward-looking statements including, without limitation: the execution of the Company’s long-term growth objectives and margin improvement initiatives; risks inherent in international operations, including foreign currency fluctuations; ability to make acquisitions and divestitures and complete such acquisitions and divestitures in the time anticipated; pace, timing and integration of acquisitions; operational risks associated with new or expanded service areas, including business process management services; impairments; changes in accounting standards or tax rates, laws or regulations; management of professional staff, including dependence on key personnel, recruiting, retention, attrition and the ability to successfully integrate new consultants into the Company’s practices; utilization rates; conflicts of interest; potential loss of clients or large engagements and the Company’s ability to attract new business; brand equity; competition; accurate pricing of engagements, particularly fixed fee and multi-year engagements; clients’ financial condition and their ability to make payments to the Company; risks inherent with litigation; higher risk client assignments; government contracting; professional liability; information security; the adequacy of our business, financial and information systems and technology; maintenance of effective internal controls; potential legislative and regulatory changes; continued and sufficient access to capital; compliance with covenants in our credit agreement; interest rate risk; and market and general economic and political conditions. Further information on these and other potential factors that could affect the Company’s business and financial condition and the results of operations are included under the “Risk Factors” section of this report. The Company cannot guarantee any future results, levels of activity, performance or achievement and undertakes no obligation to update any of its forward-looking statements.
3
Navigant Consulting, Inc. (“Navigant,” “we,” “us,” or “our”) (NYSE: NCI) is a specialized, global professional services firm that helps clients take control of their future. Navigant’s professionals apply deep industry knowledge, substantive technical expertise, and an enterprising approach to help clients build, manage, and/or protect their business interests. With a focus on markets and clients facing transformational change and significant regulatory or legal pressures, the firm primarily serves clients in the healthcare, energy, and financial services industries. Across a range of advisory, consulting, outsourcing, and technology/analytics services, we believe our practitioners bring sharp insight that pinpoints opportunities and delivers powerful results.
We are a Delaware corporation incorporated in 1996 and headquartered in Chicago, Illinois. Our executive office is located at 150 North Riverside Plaza, Suite 2100, Chicago, Illinois 60606. Our telephone number is (312) 573-5600. Our common stock is traded on the New York Stock Exchange under the symbol “NCI.”
General Development of the Business
Development of the Business – Reporting Segments
Our business is organized in four reporting segments — Healthcare; Energy; Financial Services Advisory and Compliance; and Disputes, Forensics and Legal Technology. Within these reporting segments we deliver consulting and advisory services and also provide technology-based solutions, data hosting and processing, and business process management services (which we refer to as Technology, Data & Process services herein). We conduct business globally in certain areas across our reporting segments and are strategically focused on offering services to industries and clients facing transformational change and significant regulatory or legal pressures, including clients in the healthcare, energy and financial services industries. Since our inception, we have grown through selective acquisitions of businesses (which we consider inorganic growth), recruitment of employees (which we consider organic growth) and investments in technology to complement our consulting skills and enhance our service offerings. These investments have enhanced or expanded existing expertise, added new services, broadened our geographic reach, and enhanced our market share.
Our Healthcare segment provides consulting services and business process management services. Clients of this segment include healthcare providers, payers and life sciences companies. This segment has grown significantly through a combination of strategic acquisitions and recruitment of senior hires. Our recruiting efforts within this segment have been focused on building multi-functional consulting teams that allow us to help our clients respond to the most significant issues impacting the healthcare industry today. Our services include strategy consulting, operational and performance improvement consulting, product planning and commercialization expertise and business process management services. The Cymetrix Corporation (“Cymetrix”) acquisition in 2014 and the RevenueMed, Inc. (“RevenueMed”) acquisition in 2015 greatly expanded our business process management service capabilities, extending those services to both hospitals and physician groups. These acquisitions and related hiring complement our traditional consulting services, and provide us with more recurring revenue streams. The term of contracts for business process management services is generally for multiple years. Our business process management services are enabled by systems, data and technology that can also be leveraged across our other healthcare consulting service offerings. In addition, the Healthcare segment continues to invest in analytical tools that help our clients manage resources and processes to improve their operations, patient care, and financial performance.
Our Energy segment’s professionals provide advisory solutions in business strategy and planning, distributed energy resources and renewables, energy efficiency and demand response and grid modernization transformation. Clients of this segment include utilities, governmental agencies, investors, manufacturers, oil and gas companies, and major corporations. The segment has grown through a combination of investments in hiring, solution development and acquisitions. These investments have expanded our operations in key markets and geographies and over time have broadened our service offerings to more effectively help our clients respond to and capitalize on the global transformation occurring within the energy sector. We have also grown our benchmarking, data, and research services which now enable us to offer a broad array of market research capabilities (included within our Technology, Data & Process services). Additionally, the November 2016 acquisition of Ecofys Investments B.V. (“Ecofys”), an international consulting firm specializing in renewable energy and sustainability, has provided us with a European platform to augment our capabilities in energy policy, climate strategies, energy systems and markets, urban energy, and sustainability services.
Our Financial Services Advisory and Compliance segment provides strategic, operational, valuation, risk management, investigative and compliance advisory services to clients primarily in the highly-regulated financial services industry, including major financial and insurance institutions. This segment also provides anti-corruption solutions and anti-money laundering consulting, litigation support, tax compliance and valuation services to clients in a broad variety of industries. From time to time clients seek the services of this segment to perform large scale, compliance-oriented engagements. The strategic, operational, valuation and risk management services within this segment have largely developed over time through the recruitment of senior hires. Senior hiring
4
remains a key strategy to drive future growth for this segment. We have also developed technology tools that enable our professionals to more efficiently identify compliance risks and streamline operational activities for our clients.
Our Disputes, Forensics and Legal Technology segment’s professional services include global dispute, accounting, regulatory, construction computer forensic expertise, valuation and economic analysis. In addition to these capabilities, our professionals use technological tools to perform eDiscovery services and to deliver custom technology, data analytic and cyber-security solutions. Our clients principally include companies along with their in-house counsel and law firms, as well as accounting firms, corporate boards and government agencies. Our professionals help clients across the globe through many complex business and legal matters. These matters include finance, economics, forensic accounting, regulatory compliance, international arbitration, defective construction, computer system disruptions and other information security events. Our clients operate within a broad range of industries which include but are not limited to financial services, healthcare, life sciences, energy, government and construction. We have built upon our service offerings within this segment and expanded our global and industry reach through investments in acquisitions, the recruitment of senior hires and the development of technology. Our development of technology tools has enabled our professionals to deliver both flexible and scalable solutions to our clients.
We operate globally across our reporting segments. We have continued to build our international footprint to facilitate and expand our service offerings to clients outside of the United States (“U.S.”). As global demand for our services has increased, we have established international offices to provide our clients with on-the-ground resources including within Europe, the Middle East, and Asia through hiring and acquisitions.
We continue to invest in technology infrastructure to support our evolving and expanding technology-based service offerings, and to allow us to deliver more scalable solutions to meet the changing demands of our clients.
We have supplemented these technology investments with employee-related initiatives to promote innovation and collaboration. In addition, we have invested in development programs for our client-service professionals designed to improve sales effectiveness and collaboration across the organization. We have also focused on other aspects of employee development, including talent management and mentoring programs. Collectively, these innovation, collaboration, development and sales initiatives are intended to contribute to the professional development of our employees while enhancing our ability to grow the business organically.
Human Capital Resources
At December 31, 2017, we had 6,130 employees. After adjusting total employees for part-time status and excluding project employees, we had 6,008 full-time equivalent (“FTE”) employees. These FTEs were comprised of the following:
|
|
• |
Client-service employees (“Client-Service FTE”) (related costs for these employees are recorded as cost of services before reimbursements) |
|
|
o |
1,905 consulting employees (“Consulting FTE”) in businesses that deliver professional services. These individuals record time to client engagements. |
|
|
o |
3,037 Technology, Data & Process employees (“Technology, Data & Process FTE”) in businesses that are comprised of technology-enabled professional services, including eDiscovery services, data analytics, business process management services, technology solutions, invoice and insurance claims processing, market research and benchmarking. While some of these individuals may record time to client engagements (in professional services engagements), many do not record time to specific engagements. Revenue generated by these engagements is generally recognized on a per unit basis. 1,608 of these Technology, Data & Process FTEs were based in India. |
|
|
• |
Non-billable employees (“Non-billable FTE”) |
|
|
o |
955 non-billable employees who are assigned to administrative and support functions, including office services, corporate functions, analytics and certain practice support functions. The majority of costs related to these employees is recorded in general and administrative expense while the costs directly relating to practice support functions are recorded as cost of services before reimbursements. During the year ended December 31, 2017, we centralized resources previously organized as separate practice functions and leveraged our lower cost India footprint for certain activities. |
We also had 111 project employees who perform client services on a contractual basis. Project employee levels vary from period to period based on staffing and resource requirements. The majority of costs related to these employees is recorded in cost of services before reimbursements.
Our revenues are primarily generated from services performed by our client-service employees. As a result, our success depends in large part on attracting, retaining and motivating talented, creative and experienced client-service employees at all levels
5
and across various geographies. We employ internal recruiters, retain executive search firms, and utilize personal and business contacts. Our client-service employees are drawn from a variety of sources, including the industries we serve, accounting and other consulting organizations, and top-rated colleges and universities. Our client-service employees include, but are not limited to, PhDs, MDs, MBAs, JDs, CPAs, CFEs (certified fraud examiners), ASAs (accredited senior appraisers), engineers, nurses and former government officials.
In developing and growing our Technology, Data, & Process services, we have added employees supporting these businesses. We recruit, retain, and manage many of our Technology, Data & Process employees differently from our consulting employees. Particularly, in our business process management services, we add Technology, Data & Process employees through traditional recruitment, by transitioning client employees to become Navigant employees, or by subcontracting services from our clients. Our demand for these resources may fluctuate depending on our clients’ needs and our ability to more efficiently perform our services by utilizing technology resources. By managing these employees with our processes, centralizing their functions in our business centers, and leveraging proprietary technology to enable work streams, we are able to more efficiently and effectively deliver services. We leverage our business centers not only to help us better manage our employees across work streams and projects but also to create opportunities for these employees to develop professionally by exposing them to new service areas and possibilities for promotion within the management teams at these locations.
We seek to retain our employees by offering competitive compensation packages of base and incentive compensation (and in certain instances share-based compensation and retention incentives), attractive benefits and rewarding careers. We periodically review and adjust, if needed, our employees’ total compensation (including salaries, annual cash incentive compensation, other cash and equity incentives, and benefits) to ensure that it is competitive within the industry and is consistent with our level of performance. In addition to compensation, we promote numerous charitable, philanthropic, and social awareness programs that not only support our community, but also provide experiences for our employees to promote a collaborative and rewarding work environment.
We regularly evaluate employees and their productivity against future demand expectations and historical trends. From time to time, we may reduce or add resources in certain areas in an effort to align with changing demands. We may utilize project employees and engage independent contractors on certain engagements, which allow us to quickly adjust staffing in response to changing demand for our services.
In connection with recruiting activities and business acquisitions, our general policy is to obtain non-solicitation covenants from senior and some mid-level employees. Most of these covenants have restrictions that extend 12 months or more beyond the termination of employment. We utilize these contractual agreements and other agreements to protect our business interests, which can also reduce the risk of attrition and provide stability to our existing clients, staff and projects.
In our consulting businesses, our bill rates or fees charged to clients are tiered in accordance with the experience and position of our employees staffed on each matter. We monitor and adjust those bill rates or fees according to then-current market conditions for our service offerings and within the various industries we serve. Similarly, pricing for our Technology, Data, & Process services is based upon the complexity of services delivered and markets served.
Industry Sectors
We provide services to clients in industries undergoing substantial regulatory or structural change, with a primary focus on the energy, healthcare and financial services industries. Our Disputes, Forensics and Legal Technology segment and Financial Services Advisory & Compliance segment both provide services across all three industries. Our legal and compliance-based service offerings are relevant to law firms and clients in many industries. In addition, we do work for governmental agencies.
Competition
The market for our services is highly competitive, highly fragmented and subject to rapid change. The market includes a large number of participants with a variety of skills and industry expertise, including general management and information technology consulting firms, strategy firms, global accounting firms, business process and technology solution providers and other local, boutique, regional, national and international consulting firms. Many of these companies are international in scope and have larger teams of personnel and greater financial, technical and marketing resources than we do. In particular, the Big Four accounting firms (PwC, Deloitte, EY and KPMG) are highly competitive in the consulting industry. However, we believe that our industry focus, deep industry and operational expertise, reputation, global business model and broad range of service offerings enable us to compete effectively in the marketplace.
Developing Client Relationships
We market our services directly to corporate executives and senior management, corporate counsel, law firms, corporate boards, special committees and governmental agencies. We use a variety of business development and marketing channels to communicate directly with current and prospective clients, including on-site presentations, industry seminars, thought leadership and industry-
6
specific articles. In addition, we have strengthened our market presence by developing our brand name and go-to-market strategy. New engagements are sought and won by our senior and mid-level employees working together across our reporting segments. We seek to leverage our client relationships in one business segment to cross-sell service offerings provided by other reporting segments. Clients frequently expand the scope of engagements during delivery to include follow-on or complementary services. Our future performance will continue to depend upon our ability to win new engagements, attract and retain employees, develop and continue client relationships and maintain our reputation.
We believe our unique mix of deep industry expertise, combined with our scale, global presence, multi-disciplinary professionals and specialized service offerings, positions us to address our clients’ critical business needs. We continue to establish programs to facilitate collaborative product development and marketing efforts, and also to develop new, innovative and repeatable solutions for our clients.
Financial Information about our Business Segments
See “Management’s Discussion and Analysis of Financial Condition and Results of Operations” and Note 4 – Segment Information to the notes to our consolidated financial statements for discussion of total revenues, revenues before reimbursements, segment operating profit and total assets by business segment. Certain areas within our reporting segments operate globally. For information regarding our total revenues and total assets by geographic region see Note 4 – Segment Information to the notes to our consolidated financial statements. For information regarding risks related to our international operations see “Risk Factors.”
How Our Income is Derived
Our clients’ demand for our services ultimately drives our revenues and expenses. We derive our revenues from fees on services provided. The majority of our revenues is generated on a time and materials basis, though we also have engagements where fees are a fixed amount (either in total or for a period of time) or are on a per unit or subscription basis. We may also earn incremental revenues, in addition to hourly or fixed fees, that are contingent on the attainment of certain contractual milestones or outcomes. Variations in our quarterly or yearly revenues and resulting operating profit margins may occur depending on the timing of such contractual outcomes and our ability to consider these revenues earned and realized. Regardless of the terms of our engagements, our ability to earn fees is reliant on experience and expertise of our client-service employees.
Our most significant expense is client-service employee compensation, which includes salaries, incentive compensation, and amortization of sign-on and retention incentive payments, share-based compensation and benefits. Client-service employee compensation is included in cost of services before reimbursable expenses, in addition to technology costs, sales and marketing expenses and the direct costs of recruiting and training client-service employees.
Our most significant overhead expenses are administrative compensation and benefits and office-related expenses. Administrative compensation includes salaries, incentive compensation, share-based compensation and benefits for corporate management and administrative personnel that indirectly support client engagements. Office-related expenses primarily consist of rent for our offices. Other administrative costs include bad debt expense, marketing, technology, finance and human capital management.
Concentration of Revenues
Revenues earned from our top 20 clients remained relatively steady at 27%, 27% and 25% of our total revenues for 2017, 2016 and 2015, respectively. No single client accounted for more than 10% of our total revenues during 2017, 2016 or 2015. For further information on segment concentration see Item 7 - Management, Discussion and Analysis of Financial condition and Results of Operations – Segment Results below.
Non-U.S. Operations
We operate globally and have offices outside the U.S. including in countries within Europe, the Middle East and Asia. No country, other than the U.S., accounted for more than 10% of our total revenues during 2017, 2016 or 2015. Our non-U.S. subsidiaries, in the aggregate, represented approximately 10%, or $100.7 million, of our total revenues in 2017 compared to 9%, or $96.3 million, in 2016 and 9%, or $86.0 million, in 2015. Revenues are allocated among our subsidiaries based on the respective entity or entities employing the personnel deployed on the engagements. For further geographic information, see Note 4 – Segment Information to the notes to our consolidated financial statements.
Available Information
We maintain a corporate website at www.navigant.com. The content of our website is not incorporated by reference into this report or any other reports we file with, or furnish to, the SEC. Investors may access our annual reports on Form 10-K, quarterly
7
reports on Form 10-Q and current reports on Form 8-K, and amendments to those reports, as well as the proxy statement for our annual meeting of shareholders, free of charge (as soon as reasonably practicable after these materials are electronically filed with, or furnished to, the SEC) by going to the Investor Relations section of our website (investors.navigant.com) and searching under “SEC Filings.” These materials are also available in printed form free of charge upon request. Requests should be submitted to: Navigant Consulting, Inc., 150 North Riverside Plaza, Suite 2100, Chicago, Illinois 60606, Attention: Investor Relations.
In addition to other information contained in this report and in the documents incorporated by reference herein, the following factors should be considered carefully in evaluating us and our business. These factors could materially affect our business, financial condition, results of operations and/or stock price in future periods. Additional risks not currently known to us or that we currently deem to be immaterial also could materially affect our business, financial condition, results of operations or stock price in future periods.
Risks Related to the Market
Our business, results of operations and financial condition could be adversely affected by disruptions in the marketplace caused by economic and political conditions.
Economic and political conditions affect our clients’ businesses and the markets they serve. A severe and/or prolonged economic downturn or a negative or uncertain political climate could adversely affect our clients’ financial condition and the levels and types of business activity engaged in by our clients and the industries we serve. Clients could determine that discretionary projects are no longer viable or that new projects are not advisable. This may reduce demand for our services, depress pricing for our services or render certain of our service offerings obsolete, all of which could have a material adverse effect on our business, results of operations and financial condition. Changes in economic and political conditions could drive changes to the regulatory or legislative landscape and consequently render certain of our service offerings obsolete or shift demand to services that we do not offer or for which we do not have competitive advantages, which could negatively affect the amount of new business that we are able to obtain. If we are unable to predict or assess the impact of changing economic and political conditions on our business or if we are unable to effectively plan for and respond to those changes, including realigning our resources and managing our costs, our business could be adversely affected. Additionally, significant economic turmoil or financial market disruptions could adversely impact the availability of financing to our clients and, in turn, could adversely impact our ability to secure new engagements or collect outstanding amounts due from our clients or cause them to terminate their existing contracts with us, each of which could adversely affect our financial position and results of operations.
Our business could be adversely impacted by competition.
The market for our services is highly competitive, highly fragmented, and subject to rapid change. The market includes a large number of participants with a variety of skills and industry expertise, including general management and information technology consulting firms, strategy firms, global accounting firms, business process and technology solution providers and other local, regional, national, and international consulting firms. Many of these firms are international in scope and have larger teams of personnel and greater financial, technical and marketing resources than we do. Some firms may have lower overhead and other operating costs and, therefore, may be able to more effectively compete through lower cost service offerings. If we are unable to compete effectively, our results of operations and financial condition could be adversely impacted.
We serve clients in industries undergoing significant change, and a significant change in the legal and regulatory landscape may reduce the demand for our services or render certain of our service offerings obsolete.
Many of our clients operate in highly regulated industries such as healthcare, energy, and financial services. These industries are subject to changing political, legislative, regulatory and other influences. The laws and regulations in these industries can be complex, and the application of those laws and regulations to our clients and to us is not always clear. Regulatory and legislative changes in these industries could reduce the demand for our services, decreasing our competitive position, or potentially render certain of our service offerings obsolete, change client buying patterns or decision making or require us to make unplanned modifications to our service offerings, which could require additional time and investment. If we fail to accurately anticipate the application of the laws and regulations affecting our clients and the industries they serve, if anticipated changes in regulation impact client buying patterns, or if such laws and regulations decrease our competitive position or limit the applicability of our service offerings, our results of operations and financial condition could be adversely impacted.
8
If we are unable to successfully recruit, retain and incentivize our senior-level employees, our ability to win new client engagements and compete effectively could be adversely affected.
We rely heavily on a group of senior-level employees and business development professionals. We believe our future success is dependent on our ability to successfully recruit and retain their services. Competition for skilled employees is intense, and retention of our employees, particularly senior revenue-generators, is a key factor affecting our ability to continue to grow organically and achieve our long-term strategic initiatives. The professional services industry has low barriers to entry making it easy for employees to start their own businesses or work independently. In addition, it is relatively easy for employees to change employers. In addition, our senior-level employees and business development professionals may develop strong bonds with the clients they serve. In the event that such professionals leave us, we may lose clients who decide they prefer to continue working with a particular professional.
The costs associated with recruiting, training and retaining employees are significant, and restrictive covenants prevalent in the professional services industry often prevent senior-level employees from generating revenue quickly upon hire. If we are unable to successfully recruit and retain our senior-level employees, we could lose existing clients, experience an adverse effect on our ability to win new client engagements, or experience difficulty meeting client needs in our current engagements, and our results of operations could be adversely affected.
Although we offer various incentive compensation programs, including share-based compensation designed to retain and incentivize our senior-level employees, there can be no assurance that these programs will be effective. Further, limitations on the amount of shares available under our equity compensation plans or a sustained decline in our stock price, which would require us to grant more shares in order to deliver the desired level of value, could also affect our ability to offer adequate share-based compensation as incentives to our senior-level employees. If we are unable to successfully incentivize our senior-level employees, those employees could leave us, and our results of operations could be adversely affected
Risks Related to Capital and Financing
We cannot be assured that we will have access to sufficient sources of capital to meet our cash needs.
We rely on our current cash and cash equivalents, cash flows from operations and borrowings under our credit agreement to fund our short-term and anticipated long-term operating and investing activities. Our credit agreement provides a $400 million revolving credit facility. At our option, subject to the terms and conditions in the credit agreement, we may elect to increase commitments under the credit facility up to an aggregate amount of $500 million. The credit facility becomes due and payable in full upon maturity in March 2022. At December 31, 2017, we had $132.9 million in borrowings outstanding under the credit facility and approximately $263.4 million available. There can be no assurance that the credit facility will continue to be sufficient to meet the future needs of our business, particularly if a decline in our financial performance were to occur. In addition, there is no assurance that we will be able to refinance or extend this facility on similar or more favorable economic terms. If this occurs, and we are unable to otherwise increase our cash flows from operations, raise additional capital or obtain debt financing from other sources, we may be unable to meet our future cash needs, including, for example, funding our acquisitions and other strategic and capital investments. Furthermore, certain financial institutions that are lenders under our credit facility could be adversely impacted by significant economic turmoil or financial market disruptions and therefore could become unable to meet their commitments under our credit facility, which in turn would reduce the amounts available to us under that facility.
If we are unable to collect receivables in a timely manner, our operating cash flows could be adversely affected.
For the majority of our engagements, we do not receive retainers prior to performing services on a client’s behalf. In certain cases, particularly in our Disputes, Forensics and Legal Technology segment, we may be engaged by a client’s counsel for privilege or other reasons, which may cause a delay in the remittance of our invoices. If the average time it takes our clients to pay our invoices increases, or if the financial condition of any of our clients were to deteriorate, impairing their ability to make payments due to us, our operating cash flows would be adversely impacted which may require us to fund a greater portion of our working capital needs with borrowings under our credit facility or other capital sources.
Our failure to comply with the covenants in our credit agreement could have a material adverse effect on our financial condition and liquidity.
Our credit agreement contains financial covenants requiring that we maintain, among other things, certain levels of fixed charge and debt coverage. Poor financial performance could cause us to be in default of these covenants. While we were in compliance with these covenants at December 31, 2017, there can be no assurance that we will remain in compliance in the future. Our borrowings under the credit facility tend to be higher during the first half of the year to fund annual incentive payments, and as a result, our consolidated leverage ratio is expected to increase from December 31, 2017 levels. If we fail to comply with the covenants in our credit agreement, this could result in our having to seek an amendment or waiver from our lenders to avoid the termination of their commitments and/or the acceleration of the maturity of outstanding amounts under the credit facility. The cost of our obtaining an amendment or waiver could be significant, and further, there can be no assurance that we would be able to obtain an amendment or
9
waiver. If our lenders were unwilling to enter into an amendment or provide a waiver, all amounts outstanding under our credit facility would become immediately due and payable.
We have variable rate indebtedness which subjects us to interest rate risk and may cause our annual debt service obligations to increase significantly.
Borrowings under our credit facility are based on short term variable rates of interest which expose us to interest rate risk. While market interest rates have remained low for some time, these rates could increase, adversely impacting our interest expense, cash outflows and results of operations. From time to time, we use derivative instruments for non-trading purposes, primarily consisting of interest rate swap agreements, to manage our interest rate exposure by achieving a desired proportion of fixed rate versus variable rate borrowings. There can be no assurance, however, that our derivative instruments will be successful in reducing the risks inherent in exposure to interest rate fluctuations.
Risks Related to our Business Operations
Our results of operations and consequently our business may suffer if we are not able to maintain current pricing, compensation costs and productivity levels.
Our revenues and profitability are largely based on the pricing of our services, compensation costs and the number of hours our client-service employees work on client engagements. Accordingly, if we are not able to maintain adequate pricing for our services or appropriately manage our compensation costs and productivity levels, our results of operations may suffer. Pricing, compensation costs and productivity levels are affected by a number of factors, including:
|
|
• |
Our ability to predict future demand for our services and maintain the appropriate staffing levels; |
|
|
• |
Our ability to transition client-service employees from completed client engagements to new client engagements; |
|
|
• |
Our clients’ perceptions of our ability to add value through our services; |
|
|
• |
Our competitors’ pricing of services and compensation levels; |
|
|
• |
The market demand for our services and our ability to successfully balance our supply of skills and resources with client demand; |
|
|
• |
The market rate for employee compensation costs; |
|
|
• |
Our ability to manage our human capital resources particularly as we increase the size and diversity of our workforce and expand into new service offerings as part of our growth strategies; |
|
|
• |
The economic, political and regulatory environment; |
|
|
• |
Our ability to accurately estimate and appropriately manage professional hours and other aspects of fixed-fee engagements and discounted fees which may result in the costs of providing such services exceeding the fees collected; and |
|
|
• |
Our failure to meet key performance improvement measures embedded within certain contracts that could trigger penalties. |
Some of the work we do involves greater risk than ordinary engagements which could negatively impact our business.
We do work for clients that for financial, legal, reputational or other reasons may present higher than normal risks. While we attempt to identify and mitigate our exposure with respect to higher-risk engagements and higher-risk clients, these efforts may be ineffective and an actual or alleged error or omission on our part or the part of our client or other third parties on one or more of these higher-risk engagements could have a material adverse impact on our business and financial condition. Examples of higher-risk engagements include, but are not limited to:
|
|
• |
Interim management engagements, including those for hospitals and other healthcare providers; |
|
|
• |
Engagements where we assist clients in complying with healthcare-related regulatory requirements; |
|
|
• |
Engagements where we serve as an independent monitor or as an independent review organization or which otherwise subject us to heightened requirements relating to our independence from our client; |
|
|
• |
Financial advisory engagements; |
|
|
• |
Engagements where we provide transactional or valuation related services; |
10
|
|
• |
Engagements where we deliver project management services for large construction projects; |
|
|
• |
Engagements where we receive or process or host sensitive data, including personal consumer or private health information; |
|
|
• |
Engagements where we deliver a compliance effectiveness opinion; |
|
|
• |
Engagements involving independent consultants’ reports issued pursuant to consent or similar orders to which our clients may be subject or in support of financings and business transactions; and |
|
|
• |
Engagements for governmental clients or where our work product will be relied upon by governmental agencies which regulate our clients. |
Our international operations create special risks that could negatively impact our business.
We have offices outside the U.S., including countries in Europe, the Middle East and Asia, and conduct business in many other countries. We expect to continue to expand globally and our international revenues may account for an increasing portion of our revenues in the future. Our international operations carry special financial, business, legal and reputational risks, including:
|
|
• |
Cultural and language differences in conducting business; |
|
|
• |
Employment and labor laws and related factors that could, among other things, result in lower utilization, higher compensation costs and cyclical fluctuations of utilization and revenues and affect our ability to realign resources with demand for our services; |
|
|
• |
Currency fluctuations that could adversely affect our financial position and operating results; |
|
|
• |
Compliance with varying legal and regulatory requirements, and other barriers to conducting business; |
|
|
• |
Impact on consulting spend from international firms and global economies affected by the United Kingdom’s withdrawal from the European Union (or “Brexit”), European sovereign debt crisis and the political, economic and commercial responses related to such events; |
|
|
• |
Risks associated with engagements performed by employees and independent contractors with governmental officials and agencies, including the risks arising from the anti-bribery and corruption regulations; |
|
|
• |
Greater difficulties in managing and staffing foreign operations, including in higher risk geographies; |
|
|
• |
Greater personal security risks to employees traveling to or located in unstable locations; |
|
|
• |
Difficulties developing talent and leadership capabilities in emerging markets, where depth of skilled employees is often limited and competition for these resources is intense, can be expensive and may be unsuccessful; |
|
|
• |
Successful entry and execution in new markets; |
|
|
• |
Restrictions on the repatriation of earnings; and |
|
|
• |
Potentially adverse tax consequences, such as net operating loss carry forwards that cannot be realized or higher effective tax rates. |
If we are not able to successfully mitigate the special risks associated with our international operations, our business prospects and results of operations could be negatively impacted.
If we are unable to effectively execute on long-term growth objectives, our results of operations and our share value could be adversely affected.
Achievement of our long-term growth objectives may require additional investments in technology, people and acquisitions. These investments may be significantly different in size, nature and complexity in comparison to those we have made in the past, which could inherently create more risk around those investment decisions than would otherwise be the case. Specifically:
|
|
• |
Incentive compensation programs designed to motivate growth may result in innovation or investments that drive near-term growth, but that do not achieve longer-term growth and profitability objectives, or may incentivize an increase in risk compared to our current risk tolerance. |
|
|
• |
Investments in acquisitions may result in growth in businesses that may add to near-term revenues and earnings, but may negatively impact shareholder return over the long-term if they do not perform as expected, or may otherwise create higher longer-term risks, including new legal, compliance, profitability or regulatory implications. |
11
|
|
• |
The businesses and services added through these investments may extend beyond the knowledge, expertise or resources of our current management team, which could result in unintended risks. |
If we are unable to successfully maintain a sales pipeline and to attract business from new or existing clients, our results of operations could be materially and adversely affected.
Many of our client engagement agreements are short term in nature (less than one year) or can be terminated by our clients with little or no notice and without penalty. For example, in our litigation-related engagements, if the litigation is settled, our services usually are no longer necessary and our engagement is promptly terminated. Some of our services involve multiple engagements or stages. In those engagements, there is a risk that a client may choose not to retain us for the additional stages of an engagement or that a client will cancel or delay additional planned engagements. When contracts are terminated or not renewed, we lose the anticipated revenues and it may take significant time to replace the revenues lost or redeploy resources. Also, companies in the industries we serve may combine or be acquired by other companies. If a current client merges or consolidates with a company that relies on another provider for the services we offer, we may lose future revenue from that client and the opportunity to gain additional work. For all these reasons, we rely heavily on our senior-level employees’ ability to develop new business opportunities for our services.
In the past, we have derived significant revenues from events as inherently unpredictable as the Dodd-Frank Act, healthcare reform, the credit crisis and significant natural disasters including major hurricanes and earthquakes. Those events, in addition to being unpredictable, often have impacts that decline over time as clients adjust to and compensate for the challenges they face. These factors also limit our ability to predict future revenues and human capital resource needs especially for large engagements that may end abruptly due to factors beyond our control which in turn could adversely impact our results of operations.
Unsuccessful client engagements could result in damage to our professional reputation or legal liability which could have a material adverse effect on our business.
Our professional reputation and that of our client-service employees is critical to our ability to successfully compete for new client engagements and attract and retain employees. In addition, our client engagements subject us to the risk of legal liability. Any public assertion or litigation alleging that our services were deficient or that we breached any of our obligations to a client could expose us to significant legal liabilities, distract our management and damage our reputation. Our professional liability insurance may not cover every type of claim or liability that could potentially arise from our client engagements. In addition, the limits of our insurance coverage may not be enough to cover a particular claim or a group of claims and the costs of defense. Any factors that damage our professional reputation could have a material adverse effect on our business.
We may not be able to maintain the equity in our brand name.
We believe that the Navigant brand is an important part of our overall effort to attract and retain clients and that the importance of brand recognition will increase as competition for our services increases. We may expand our marketing activities to promote and strengthen our brand and may need to increase our marketing budget, hire additional marketing and public relations personnel or expend additional amounts to protect our brand and otherwise to create and maintain client brand loyalty. In addition, our brand and corporate reputation are potentially susceptible to material damage by events such as disputes with clients, cybersecurity breaches, delivery failures, political issues involving our clients and the services we provide to those clients, compliance violations, government investigations or legal proceedings. Similarly, our reputation could be damaged by actions or statements of current or former clients, directors, employees, competitors, vendors, alliance or joint venture partners, legislators or government regulators, as well as members of the investment community or the media, including social media influencers. There is a risk that negative or inaccurate information about Navigant, even if based on rumor or misunderstanding, could adversely affect our business. If we fail to effectively promote, protect and maintain the Navigant brand, or incur excessive expenses in doing so, our business and results of operations could be adversely impacted. Damage to our reputation could be difficult, expensive and time-consuming to repair, could make potential or existing clients reluctant to select us for new engagements, resulting in a loss of business, and could adversely affect our recruitment and retention efforts. Damage to our reputation could also reduce the value of the Navigant brand name and could reduce investor confidence in us, materially adversely affecting our share price.
We encounter professional conflicts of interest.
If we are unable to accept new client engagements for any reason, including business and legal conflicts, our client-service employees may become underutilized or discontented, which may adversely affect our future results of operations, as well as our ability to retain these consultants. In addition, although we have systems and procedures to identify potential conflicts of interest prior to accepting a new client engagement, there is no guarantee that all potential conflicts of interest will be identified, and undetected conflicts may result in damage to our professional reputation and result in legal liability which may adversely impact our business.
12
We may be exposed to potential risks if we are unable to achieve and maintain effective internal controls.
If we fail to achieve and maintain adequate internal control over financial reporting or fail to implement necessary new or improved controls that provide reasonable assurance of the reliability of our financial reporting and the preparation of our financial statements for external purposes, we may fail to meet our public reporting requirements on a timely basis, suffer harm to our reputation, may be unable to adequately or accurately report on our business and our results of operations or may be required to restate our financial statements. Even with adequate internal controls, we may not prevent or detect all misstatements or fraud. Also, internal controls that are currently adequate may in the future become inadequate because of changes in conditions or changes in regulatory standards, and the degree of compliance with our policies or procedures may deteriorate.
Acquired businesses may not achieve expected results which could adversely affect our results of operations.
We have grown our business, in part, through the acquisition of complementary businesses. The substantial majority of the purchase price we pay for acquired businesses is related to goodwill and intangible assets. We may not be able to realize the value of those assets or otherwise realize anticipated synergies unless we are able to effectively integrate the businesses we acquire. We face multiple challenges in integrating acquired businesses and their personnel, including differences in corporate cultures and management styles, retention of personnel, conflict issues with clients, and the need to divert managerial resources and focus that would otherwise be dedicated to our current businesses. Additionally, certain senior-level employees, as sellers of the acquired businesses, are bound by non-competition covenants that expire after a specific amount of time from the date of acquisition. When these covenants expire, any loss of these senior-level employees could significantly impact the acquired businesses and their successful integration. Any failure to successfully integrate acquired businesses and retain personnel could cause the acquired businesses to fail to achieve their expected results, which would in turn adversely affect our financial performance and may require a possible impairment of the acquired assets.
We may also be adversely impacted by liabilities we assume from a company we acquire. We may fail to identify or adequately assess the magnitude of certain liabilities, shortcomings or other circumstances prior to acquiring a company, including potential exposure to regulatory sanctions or liabilities resulting from an acquisition target’s previous activities. Should these events occur, our expected benefit from such transactions may not be realized. Additionally, the financing of acquisitions through cash, borrowings or common stock could also impair our liquidity or cause significant dilution of our shareholders.
Goodwill and other intangible assets represent a significant portion of our assets, and an impairment of these assets could have a material adverse effect on our financial condition and results of operations.
Because we have acquired a significant number of businesses, goodwill and other intangible assets represent a significant portion of our total assets. Under generally accepted accounting principles, we are required to perform an annual impairment test at the reporting unit level on our goodwill and, on a quarterly basis, we are required to assess the recoverability of both our goodwill and long-lived intangible assets. We consider our operating segments to be our reporting units. We may need to perform an impairment test more frequently if events occur or circumstances indicate that the carrying amount of these assets may not be recoverable. These events or circumstances could include a significant change in the business climate, attrition of key personnel, a prolonged decline in our stock price and market capitalization, legal factors, operating performance indicators, competition, sale or disposition of a significant portion of one of our businesses, and other factors. If the fair market value of one of our reporting units or other long-lived intangible assets is less than the carrying amount of the related assets, we could be required to record an impairment charge in the future. The valuation of our reporting units requires judgment in estimating future cash flows, discount rates and other factors. In making these judgments, we evaluate the financial health of our reporting units, including such factors as market performance, changes in our client base and projected growth rates. Because these factors are ever changing, due to market and general business conditions, we cannot predict whether, and to what extent, our goodwill and long-lived intangible assets may be impaired in future periods. At December 31, 2017, we had goodwill of $637.3 million and net intangible assets of $21.1 million. The amount of any future impairment could be significant and could have a material adverse effect on our financial results. See Note 5 — Goodwill and Intangible Assets, Net to the notes to our consolidated financial statements.
Changes in our level of taxes, as well as adverse outcomes in audits, investigations and tax proceedings, or changes in tax laws or in their interpretation or enforcement, could have a material adverse effect on our effective income tax rate, results of operations, cash flows and financial condition.
We are subject to taxes in numerous jurisdictions. We calculate and provide for taxes in each tax jurisdiction in which we operate. Tax accounting often involves complex matters and requires our judgment to determine our provision for income taxes and other tax liabilities. We are subject to ongoing audits, investigations and tax proceedings in various jurisdictions. Tax authorities have disagreed with, and may in the future take positions opposing, the judgments we make, including with respect to our intercompany transactions. We regularly assess the likely outcomes of our audits, investigations and tax proceedings to determine the appropriateness of our tax liabilities. However, our judgments may not be sustained as a result of these audits, investigations and tax
13
proceedings, and the amounts ultimately paid could be materially different from the amounts recorded and reflected in our consolidated financial statements.
Our effective income tax rate could be adversely affected in the future by the expiration of current tax benefits, changes in the mix of earnings in countries with differing statutory tax rates, challenges to our intercompany transactions, changes in the valuation of deferred tax assets and liabilities and changes in tax laws, regulations and policies, or in their interpretation or enforcement. Additionally, the process of evaluation of and compliance with changes in tax laws and policies may be onerous and expensive. A number of jurisdictions where we do business, including the United States, are considering, or undergoing changes in their relevant tax, accounting and other laws, regulations, policies and interpretations. Changes in tax laws, treaties or regulations, and their interpretation or enforcement, have become more unpredictable, particularly as taxing jurisdictions face an increasing number of political, budgetary and other fiscal challenges. Tax rates in the jurisdictions in which we operate may change as a result of macroeconomic and other factors outside of our control, making it increasingly difficult for multinational corporations like ourselves to operate with certainty about taxation in many jurisdictions. As a result, we could be materially adversely affected by future changes in tax law or policy (or in their interpretation or enforcement) in the jurisdictions where we operate, including the U.S., which could have a material adverse effect on our effective income tax rate, results of operations, cash flows and financial condition.
Our effective tax rate may fluctuate in the future as a result of the Tax Cuts and Jobs Act (“Tax Reform”), which was enacted on December 22, 2017. Tax Reform introduces significant changes to U.S. income tax law that will have a meaningful impact on our provision for income taxes. Accounting for the income tax effects of Tax Reform requires significant judgments and estimates in the interpretation and calculations of the provisions of Tax Reform. We continue to examine the impact Tax Reform may have on our business. Notwithstanding the overall reduction in federal corporate income tax rate as a result of Tax Reform, the overall impact of this new legislation is uncertain and our business and financial condition could be adversely affected.
Due to the timing of the enactment and the complexity involved in applying the provisions of Tax Reform, we made reasonable estimates of the effects and recorded provisional amounts in our financial statements for the year ended December 31, 2017. The U.S. Treasury Department, the Internal Revenue Service (“IRS”), and other standard-setting bodies may issue guidance on how the provisions of Tax Reform will be applied or otherwise administered that is different from our interpretation. As we collect and prepare necessary data, and interpret Tax Reform and any additional guidance issued by the IRS or other standard-setting bodies, we may make adjustments to the provisional amounts that could materially affect our financial position and results of operations as well as our effective tax rate in the period in which the adjustments are made.
Future changes in tax laws, treaties or regulations, and their interpretation or enforcement, may be unpredictable, particularly as taxing jurisdictions face an increasing number of political, budgetary and other fiscal challenges. Tax rates in the jurisdictions in which we operate may change as a result of macroeconomic and other factors outside of our control, making it increasingly difficult for multinational corporations like ourselves to operate with certainty about taxation in many jurisdictions. As a result, we could be materially adversely affected by future changes in tax law or policy (or in their interpretation or enforcement) in the jurisdictions where we operate, including the United States, which could have a material adverse effect on our effective income tax rate, results of operations, cash flows and financial condition.
We are subject to unpredictable risks of litigation.
Although we seek to avoid litigation whenever possible, from time to time we are party to various lawsuits and claims. Disputes may arise, for example, from client engagements, employment issues, regulatory actions, business acquisitions and real estate and other commercial transactions. There can be no assurances that any lawsuits or claims will be immaterial in the future. Any material lawsuits or claims could adversely affect our business and reputation. Additionally, regardless of the merits of claims, the cost to defend current and future litigation may be significant and may be time-consuming and divert management’s attention and resources.
Our work with governmental clients has inherent risks related to the governmental contracting process.
We work for various U.S., state, local and foreign governmental entities and agencies. These engagements have special risks and characteristics that include, but are not limited to, the following:
|
|
• |
Governmental agencies generally reserve the right to audit our contract costs, including allocated indirect costs, and conduct inquiries and investigations of our business practices with respect to governmental contracts. If the governmental entity finds that the costs are not reimbursable, then we will not be allowed to bill for them or the cost must be refunded to the governmental entity if it has already been paid to us. Findings from an audit also may result in our being required to prospectively adjust previously agreed rates for work which would affect our future profit margins. |
|
|
• |
If a governmental client discovers improper or illegal activities in the course of its audits or investigations, we may become subject to various civil and criminal penalties and administrative sanctions, which may include termination of contracts, forfeiture of profits, suspension of payments, fines and suspensions or debarment from doing business with other agencies of that government. |
|
|
• |
The terms and conditions of government contracts tend to be more onerous and are often more difficult to negotiate than other types of contracts with our clients. |
14
|
|
• |
Government entities typically fund projects through appropriated monies. Government entities usually reserve the right to change the scope of or terminate projects for lack of approved funding (or at their convenience). Budget deficits or shortfalls, government spending reductions or suspensions or other debt constraints could result in projects we have with government entities being reduced in price or scope or terminated altogether. |
|
|
• |
Government spending may also be subject to political conflict. For example, the absence of bipartisan agreement on the federal government budget led to temporary suspension of certain federal programs in January 2018. |
|
|
• |
Political and economic factors, such as pending elections, the outcome of recent elections, changes in leadership among key executive or legislative decision makers, revisions of government tax or other policies and reduced tax revenues, may affect our ability to win contract awards with governmental entities as well as the number and terms of contracts we have with government entities. |
The impact of any of the occurrences or conditions described above could affect not only our relationship with the particular governmental agency involved, but also other agencies of the same or other governmental entities as well as other non-governmental clients. Depending on the size of the engagement or the magnitude of the potential costs, penalties or negative publicity involved, any of these occurrences or conditions could have a material adverse effect on our business or results of operations.
Our revenues, operating income (loss) and cash flows are likely to fluctuate.
We experience periodic fluctuations in our revenues, operating income (loss) and cash flows and expect that this will continue to occur in the future due to timing and duration of our client engagements, utilization of our consultants, the types of engagements we are working on at different times, the geographic locations of our clients or where the services are rendered, the length of billing and collection cycles, hiring, business and asset acquisitions including the integration of those acquired businesses into our firm, and general economic factors beyond our control. We may also experience future fluctuations in our cash flows because of increases in employee compensation, including changes to our incentive compensation structure and the timing of incentive payments, which we generally pay during the first quarter of each year, or hiring or retention payments or bonuses which are paid throughout the year.
The expansion and growth of our business process management services and the evolution of our service offerings into new areas subject us to different operational risks than our traditional consulting and expert businesses.
As part of our long-term strategy, we plan to continue to expand our services and solutions into new areas. Expanding into new areas and providing services to new types of clients may expose us to additional operational, regulatory or other risks, including overestimating the demand for our services and solutions or underestimating the competition from other market participants. Additionally, we may fail to properly anticipate the cost of entry or additional expenses related to our new services. We could also incur liability if we fail to comply with laws or regulations applicable to the new services we provide our clients. These challenges may prevent the expansion and growth of our business from becoming profitable, which, in turn could affect our reputation, business and results of operations.
Our Technology, Data & Process businesses, in particular, our business process management services, present different operational risks when compared to our traditional consulting and expert businesses. For example, our business process management services involve managing the revenue cycle function for all or certain portions of our physician and hospital clients’ businesses, including the operation, management or oversight of billing, coding and accounts receivable departments that are critical to our clients’ financial performance. In addition, certain of our businesses, most significantly our business process management services business, utilize offshore personnel, including personnel in India, which exposes us to additional operational risks, including special risks associated with conducting business internationally. Disruptions in service delivery, regulatory compliance concerns, data privacy and security concerns, particularly in the billing and coding areas, labor disputes, technology issues or other performance problems could damage our clients’ businesses, expose us to enhanced regulatory scrutiny and claims, and harm our reputation and our business.
If our pricing estimates do not accurately anticipate the cost, risk and complexity of performing our work, our contracts could have delivery inefficiencies or be unprofitable.
Our pricing for our fixed fee engagements, particularly in connection with our business process management services engagements that have multi-year pricing agreements, is highly dependent on our forecasts and predictions about the level of effort and cost necessary to deliver the applicable services and solutions. Our estimates are based on available data at the time the fees are set, and could turn out to be materially inaccurate. If we do not accurately estimate the effort, costs or timing for meeting our contractual commitments and/or completing projects to a client’s satisfaction, our contracts could yield lower margins than planned, or
15
be unprofitable. In addition, we may fail to accurately assess the risks associated with potential contracts. This could result in existing contracts and contracts entered into in the future being less profitable than expected or unprofitable, which could have an adverse effect on our overall profitability.
We could be adversely impacted by changes in accounting standards as well as estimates and assumptions by management related to significant accounting matters.
Generally accepted accounting principles and related accounting pronouncements, implementation guidelines and interpretations with regard to a wide range of matters are highly complex and require management to make estimates and assumptions that affect the amounts reported in the consolidated financial statements and the related notes. Examples include: determination of the allowance for doubtful accounts, accruals for incentive-based compensation, the fair value of acquisition-related contingent consideration, revenue recognition, the measurement of deferred tax assets, estimation of future performance for recording expenses associated with performance-based equity incentive awards, and the assessment of recoverability of intangible assets and goodwill. Changes in these rules or their interpretation or changes in the underlying estimates and assumptions made by management could significantly change our reported or expected financial performance or financial condition. For example, changes in accounting standards and the application of existing accounting standards particularly related to the measurement of fair value as compared to carrying value for our reporting units could have an adverse effect on our financial condition and results of operations. Factors that could lead to impairment of goodwill and intangible assets include significant adverse changes in the business climate and declines in the financial condition of a reporting unit. In addition, new accounting guidance also may require systems and other changes that could increase our general and administrative expenses and/or adversely impact our financial statements. For example, implementing current or future accounting guidance related to revenue recognition, leases and other areas impacted by the current convergence project between the Financial Accounting Standards Board and the International Accounting Standards Board could require us to make significant changes to our accounting and financial reporting systems and could result in adverse changes to our financial statements.
Risks Related to Technology
We have invested in specialized technology and other intellectual property for which we may fail to fully recover our investment or which maybe inadequate to serve the needs of our business or become obsolete.
We have invested in developing specialized technology and intellectual property, including proprietary systems, processes and methodologies, that we believe provide us a competitive advantage in serving our current clients and winning new client engagements. Many of our service offerings rely on specialized technology or intellectual property that is subject to rapid change, and to the extent that this technology and intellectual property is rendered obsolete and of no further use to us or our clients, our ability to continue offering these services, and grow our revenues, could be adversely affected. There is no assurance that we will be able to develop competitive, innovative or improved technology or technology and intellectual property or that our technology and intellectual property will effectively compete with the intellectual property developed by our competitors. If we are unable to develop new technology and intellectual property or if our competitors develop better technology or intellectual property, our revenues and results of operations could be adversely affected. Moreover, if we fail to adequately protect our intellectual property rights from unauthorized use or infringement by third parties, our business could be adversely affected.
In addition, the scale and complexity of our business and new service offerings may require additional information systems that we may not be able to implement in a timely or cost effective manner. This may impair our ability to achieve our operating objectives and retain our competitive position, which in turn could adversely affect our results of operations.
Information system failures or service interruptions could affect our ability to provide services to our clients.
We may be subject to disruption to our operating systems, technology or ability to communicate with our workforce and clients as a result of events that are beyond our control, including but not limited to the possibility of failures at third-party data centers, worker strikes, disruptions to the internet, political instability, natural disasters, malicious attacks, or other conditions. While we have taken steps to prevent such events and have developed disaster recovery processes, there can be no assurance that these steps will be effective in every situation. Such disruptions could adversely affect our ability to fulfill client engagements and as a result may damage our reputation and adversely affect our business and results of operations.
If the integrity of our information systems is compromised by a cyber security event, our reputation, business and results of operations could be adversely affected.
We depend on information systems to manage and run our business. Additionally, certain services we provide require us to store, transmit or process sensitive or confidential client information, including personal consumer information and health or other personally identifiable information. If any person, including any of our employees or third-party vendors with whom we contract for data hosting services, negligently disregards or intentionally breaches the information security controls we have implemented to
16
protect confidential information, our clients’ data, or if our own data or those security controls prove to be ineffective against intrusion, we could incur legal liability and may also be subject to regulatory enforcement actions, fines and/or criminal prosecution in multiple jurisdictions. Our potential liability in the event of a security breach of client data or our own data could be significant and depending on the circumstances giving rise to the breach, this liability may not be subject to a contractual limit of liability or an exclusion of consequential or indirect damages. Any unauthorized disclosure of sensitive, personal or confidential client information, whether through systems failure, employee negligence, fraud or misappropriation, could damage our reputation and cause us to lose clients. Similarly, unauthorized access to or through our information systems, including an intentional attack by any person who may develop and deploy viruses, worms or other malicious software programs, could result in negative publicity, legal liability, significant remediation costs and damage to our reputation and could have a material adverse effect on our business and results of operations. The nature of these threats and the methods used by persons seeking to disrupt or access our information systems are rapidly evolving, which makes it increasingly difficult to anticipate, prevent or mitigate these risks. The costs and operational focus required for implementing additional protective measures may also be significant and adversely affect our business and results of operations.
We may experience difficulties in implementing new business and financial systems.
We recently transitioned certain of our business and financial systems to new platforms. The integration of new modules within our enterprise resource systems could disrupt our ability to timely and accurately process and report key aspects of our revenue cycle, including billing and accounts receivable. Any such disruption could adversely affect our results of operations or financial condition and cause harm to our reputation.
None.
Our principal executive offices are leased and are located in Chicago, Illinois. We have approximately 40 other operating leases for offices with at least 20 employees, principally in the U.S., which are utilized across our reporting segments. Our office space needs in certain geographic areas may change as our business expands or where we determine virtual work environments are appropriate.
We are party to a variety of legal proceedings that arise in the normal course of our business. While the results of these legal proceedings cannot be predicted with certainty, we believe that the final outcome of these proceedings will not have a material adverse effect, individually or in the aggregate, on our results of operations or financial condition.
Not applicable.
Executive Officers of the Registrant
The following are our executive officers at February 23, 2018:
|
Name |
|
Title |
|
Age |
|
|
|
Julie M. Howard |
|
Chairman and Chief Executive Officer |
|
|
55 |
|
|
Lee A. Spirer |
|
Executive Vice President and Chief Growth and Transformation Officer |
|
|
51 |
|
|
Stephen R. Lieberman |
|
Executive Vice President and Chief Financial Officer |
|
|
53 |
|
|
Monica M. Weed |
|
Executive Vice President, General Counsel and Secretary |
|
|
57 |
|
Julie M. Howard, 55, has served as our Chairman and Chief Executive Officer since May 2014 and Chief Executive Officer and a member of our board of directors since March 2012. Ms. Howard served as our President from 2006 to March 2012 and our Chief Operating Officer from 2003 to March 2012. From 2001 to 2003, Ms. Howard was our Vice President and Human Capital Officer. Prior to 2001, Ms. Howard held a variety of consulting and operational positions, including with Navigant. Ms. Howard is currently a member of the board of directors of Innerworkings Inc. and ManpowerGroup Inc. Ms. Howard also serves on the Medical Center Board for Ann & Robert H. Lurie Children’s Hospital of Chicago and is a founding member of the Women’s Leadership and Mentoring Alliance (WLMA). Ms. Howard is a past member of the board of directors of Kemper Corporation and the Association of Management Consulting Firms, the Dean’s Advisory Board of the Business School of the University of Wisconsin – Madison and the
17
Board of Governors for the Metropolitan Planning Council of Chicago. Ms. Howard is a graduate of the University of Wisconsin, with a Bachelor of Science degree in Finance. She has also completed several post-graduate courses within the Harvard Business School Executive Education program, focusing in finance and management.
Lee A. Spirer, 51, has served as our Executive Vice President and Chief Growth and Transformation Officer since April 2017. Mr. Spirer served as our Executive Vice President and Global Business Leader from November 2012 to April 2017. Mr. Spirer has served in a variety of strategic and operational roles in a range of professional and business services organizations. From April 2009 to May 2012, Mr. Spirer served as Senior Vice President and Global Business Head of Kroll Risk & Compliance Solutions, and prior to that, from September 2005 to February 2008, Mr. Spirer served as Senior Vice President and Global Leader of Corporate Strategy and Development for Dun & Bradstreet Corporation. From June 2001 to September 2005, Mr. Spirer held several senior management roles at IBM Business Consulting Services, last serving as General Manager, Global Financial Markets. In addition, from March 2008 to April 2009 and again from June 2012 to October 2012, Mr. Spirer served as Managing Partner of LAS Advisory Services, advising private equity and venture capital firms on a variety of strategic and operational issues. Mr. Spirer is a graduate of The Wharton School with a Master’s degree in Business Administration and Brandeis University with a Bachelor’s degree in Economics, with high honors and Phi Beta Kappa.
Stephen R. Lieberman, 53, has served as our Executive Vice President and Chief Financial Officer since April 2016. Prior to joining Navigant, from January 2012 to April 2016, Mr. Lieberman served as Senior Vice President, Finance and Chief Financial Officer, Latin America for Laureate Education, Inc., a global network of private higher education institutions. From March 2011 to January 2012, Mr. Lieberman served as Senior Vice President, Finance for Dana Holding Corporation, a vehicle component supplier, and prior to that, from September 2006 to October 2010, he served as Vice President and Treasurer of United Airlines. Mr. Lieberman also spent nearly 15 years at General Motors in various capacities, including Treasurer and Controller General for the auto manufacturer’s Mexico operations and the Treasurer of the Asia Pacific Regional Treasury Center, Greater China. Mr. Lieberman received a Bachelor of Science degree in Electrical Engineering and a Master’s degree in Business Administration from the University of Michigan.
Monica M. Weed, 57, has served as our Executive Vice President since October 2013 and General Counsel and Secretary since November 2008. Previously, Ms. Weed served as Associate General Counsel for Baxter Healthcare Corporation from March 2006 to October 2008. From March 2004 to March 2006, Ms. Weed served as Special Counsel, Rights Agent and Litigation Trustee to Information Resources, Inc. Litigation Contingent Payment Rights Trust, a publicly traded litigation trust. From 1991 through 2004, Ms. Weed served in a variety of legal roles, including Executive Vice President, General Counsel and Corporate Secretary for Information Resources, Inc., an international market research provider to the consumer-packaged goods industry. She started her legal career at the law firm of Sonnenschein Nath & Rosenthal LLP (now Dentons). Ms. Weed received a Bachelor of Arts in Classics from Northwestern University, a law degree from the Northwestern University School of Law and a Master’s degree in Business Administration from the Kellogg Graduate School of Management, Northwestern University.
18
|
Item 5. |
Market for Registrant’s Common Equity, Related Stockholder Matters and Issuer Purchases of Equity Securities. |
Market Information
Our common stock is traded on the New York Stock Exchange under the symbol “NCI.” The following table sets forth, for the periods indicated, the high and low closing sale prices per share of our common stock.
|
|
|
High |
|
|
Low |
|
||
|
2017 |
|
|
|
|
|
|
|
|
|
Fourth quarter |
|
$ |
19.89 |
|
|
$ |
15.23 |
|
|
Third quarter |
|
$ |
20.39 |
|
|
$ |
14.62 |
|
|
Second quarter |
|
$ |
24.47 |
|
|
$ |
18.99 |
|
|
First quarter |
|
$ |
26.45 |
|
|
$ |
22.04 |
|
|
2016 |
|
|
|
|
|
|
|
|
|
Fourth quarter |
|
$ |
27.86 |
|
|
$ |
19.44 |
|
|
Third quarter |
|
$ |
20.58 |
|
|
$ |
15.95 |
|
|
Second quarter |
|
$ |
16.82 |
|
|
$ |
15.07 |
|
|
First quarter |
|
$ |
17.23 |
|
|
$ |
14.07 |
|
Holders
As of February 19, 2018, there were 156 holders of record of our shares of our common stock.
Shares of our common stock that are registered in the name of a broker or other nominee are listed as a single shareholder on our record listing, even though they are held on behalf of a number of individual shareholders. As such, our actual number of beneficial shareholders is higher than the number of our shareholders of record.
As of December 31, 2017, there were 45,385,233 shares of our common stock issued and outstanding.
Dividends
We did not declare or pay any dividends during the years ended December 31, 2017 and 2016. Dividend and other capital structure policy issues are reviewed on a periodic basis by our board of directors. In addition, the covenants in our credit agreement may limit our ability to pay dividends in the future.
Shareholder Return Performance Graph
The following graph compares the yearly percentage change in the cumulative total shareholder return on our common stock against the New York Stock Exchange Market Index (“NYSE Index”) and the peer group described below. The graph assumes that $100 was invested on December 31, 2012 in each of our common stock, the NYSE Index and the peer group. The graph also assumes that all dividends, if paid, were reinvested.
Note: The stock price performance shown below is not necessarily indicative of future stock price performance.
19
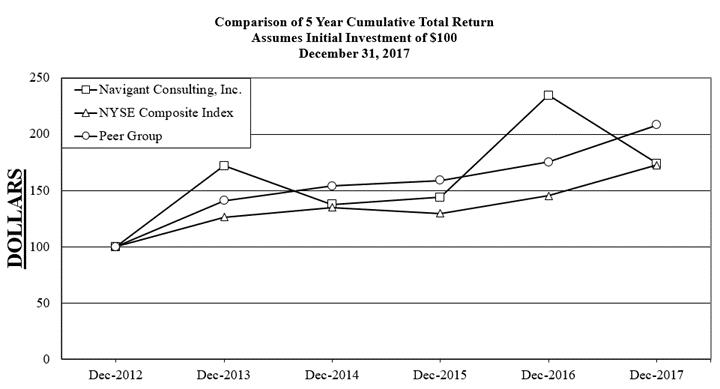
|
|
Navigant |
|
NYSE |
|
Peer |
|
||||||
|
Measurement Period |
Consulting |
|
Index |
|
Group (a) |
|
||||||
|
|
Inc. |
|
|
|
|
|
||||||
|
FYE 12/31/12 |
$ |
|
100.00 |
|
$ |
|
100.00 |
|
$ |
|
100.00 |
|
|
FYE 12/31/13 |
|
|
172.04 |
|
|
|
126.40 |
|
|
|
141.05 |
|
|
FYE 12/31/14 |
|
|
137.72 |
|
|
|
135.09 |
|
|
|
154.08 |
|
|
FYE 12/31/15 |
|
|
143.91 |
|
|
|
129.70 |
|
|
|
159.02 |
|
|
FYE 12/31/16 |
|
|
234.59 |
|
|
|
145.33 |
|
|
|
175.38 |
|
|
FYE 12/31/17 |
|
|
173.92 |
|
|
|
172.78 |
|
|
|
208.27 |
|
|
a) |
The peer group consists of the following companies: The Advisory Board Company, CBIZ Inc., CRA International Inc. (formerly known as Charles River Associates, Inc.), Exponent, Inc., FTI Consulting, Inc., Gartner Group, Inc., Heidrick & Struggles International Inc., Hill International, Inc., Huron Consulting Group Inc., ICF International, Inc., Korn/Ferry International, MAXIMUS, Inc., Resources Connection, Inc., and Tetra Tech, Inc., and except as noted below, is the same peer group that is used by the compensation committee of our board of directors for purposes of evaluating executive compensation decisions. The peer group is weighted by market capitalization. The Corporate Executive Board Company, and TRC Companies were excluded from the performance graph, notwithstanding having been included in the compensation committee’s peer group for 2017, as their stock ceased trading following the completion of mergers with Gartner Group, Inc. and New Partners IV, L.P., respectively. |
The foregoing performance graph is being furnished as part of this report solely in accordance with the requirement under Rule 14a-3(b)(9) to furnish our shareholders with such information, and therefore, shall not be deemed to be filed or incorporated by reference into any filings by Navigant under the Securities Act of 1933, as amended (“Securities Act”) or the Securities Exchange Act of 1934, as amended (“Exchange Act”).
20
Purchases of Equity Securities by the Issuer and Affiliated Purchasers
The following table sets forth repurchases of our common stock during the fourth quarter of 2017:
|
|
|
|
|
|
|
|
|
|
|
Total Number of |
|
|
Approximate |
|
||
|
|
|
|
|
|
|
|
|
|
|
Shares Purchased as |
|
|
Dollar Value of |
|
||
|
|
|
|
|
|
|
|
|
|
|
Part of Publicly |
|
|
Shares That May Yet be |
|
||
|
|
Total Number of |
|
|
Average Price |
|
|
Announced Plans or |
|
|
Purchased Under the Plans or |
|
|||||
|
Period |
Shares Purchased |
|
|
Paid per Share |
|
|
Programs |
|
|
Programs(a) |
|
|||||
|
Oct 1 - 31, 2017 |
|
|
346,489 |
|
|
$ |
17.07 |
|
|
|
346,489 |
|
|
$ |
72,690,566 |
|
|
Nov 1 - 30, 2017 |
|
|
289,763 |
|
|
$ |
17.86 |
|
|
|
289,763 |
|
|
$ |
67,516,093 |
|
|
Dec 1 - 31, 2017 |
|
|
202,008 |
|
|
$ |
19.33 |
|
|
|
202,008 |
|
|
$ |
63,611,698 |
|
|
Total |
|
|
838,260 |
|
|
$ |
17.89 |
|
|
|
838,260 |
|
|
$ |
63,611,698 |
|
|
(a) |
On April 19, 2017, our board of directors increased the amount available under the Company’s stock repurchase authorization to $100 million and extended the authorization through December 31, 2019. |
21
The following five-year financial and operating data should be read in conjunction with the information set forth under “Item 7 — Management’s Discussion and Analysis of Financial Condition and Results of Operations” and our consolidated financial statements and related notes thereto appearing elsewhere in this report. During the year ended December 31, 2013, we sold the United Kingdom (“U.K.”) financial services advisory business and, as such, the results have been reclassified to discontinued operations to reflect this transaction. During the year ended December 31, 2017, we recognized a $29.7 million net tax benefit as a result of Tax Reform, which was signed into law December 22, 2017. Further information on the tax impacts of Tax Reform is presented in Note 15 – Income Taxes to the notes to our consolidated financial statements. The amounts are shown in thousands, except for per share data.
|
|
For the year ended |
|
||||||||||||||||||||||
|
|
December 31, |
|
||||||||||||||||||||||
|
|
2017 |
|
|
2016 |
|
|
2015 |
|
|
2014 |
|
|
2013 |
|
||||||||||
|
Revenues before reimbursements |
$ |
|
939,639 |
|
|
$ |
|
938,746 |
|
|
$ |
|
833,808 |
|
|
$ |
|
766,552 |
|
|
$ |
|
734,433 |
|
|
Reimbursements |
|
|
92,688 |
|
|
|
|
95,734 |
|
|
|
|
85,678 |
|
|
|
|
93,065 |
|
|
|
|
101,152 |
|
|
Total revenues |
|
|
1,032,327 |
|
|
|
|
1,034,480 |
|
|
|
|
919,486 |
|
|
|
|
859,617 |
|
|
|
|
835,585 |
|
|
Cost of services before reimbursable expenses |
|
|
654,586 |
|
|
|
|
631,935 |
|
|
|
|
571,894 |
|
|
|
|
519,157 |
|
|
|
|
487,967 |
|
|
Reimbursable expenses |
|
|
92,688 |
|
|
|
|
95,734 |
|
|
|
|
85,678 |
|
|
|
|
93,065 |
|
|
|
|
101,152 |
|
|
Total cost of services |
|
|
747,274 |
|
|
|
|
727,669 |
|
|
|
|
657,572 |
|
|
|
|
612,222 |
|
|
|
|
589,119 |
|
|
General and administrative expenses |
|
|
166,922 |
|
|
|
|
168,954 |
|
|
|
|
147,462 |
|
|
|
|
136,057 |
|
|
|
|
127,079 |
|
|
Depreciation expense |
|
|
28,826 |
|
|
|
|
27,742 |
|
|
|
|
23,612 |
|
|
|
|
19,580 |
|
|
|
|
16,180 |
|
|
Amortization expense |
|
|
8,960 |
|
|
|
|
11,507 |
|
|
|
|
8,613 |
|
|
|
|
5,959 |
|
|
|
|
6,826 |
|
|
Other operating costs (benefit): |
|
|
|
|
|
|
|
|
|
|
|
|
|
|
|
|
|
|
|
|
|
|
|
|
|
Contingent acquisition liability adjustments, net |
|
|
2,213 |
|
|
|
|
1,330 |
|
|
|
|
(13,047 |
) |
|
|
|
(4,992 |
) |
|
|
|
(5,399 |
) |
|
Office consolidation, net |
|
|
242 |
|
|
|
|
542 |
|
|
|
|
2,766 |
|
|
|
|
725 |
|
|
|
|
348 |
|
|
Loss (gain) on disposition of assets |
|
|
- |
|
|
|
|
- |
|
|
|
|
283 |
|
|
|
|
(541 |
) |
|
|
|
(1,715 |
) |
|
Deferred debt issuance costs write off |
|
|
145 |
|
|
|
|
- |
|
|
|
|
- |
|
|
|
|
- |
|
|
|
|
- |
|
|
Goodwill impairment |
|
|
- |
|
|
|
|
- |
|
|
|
|
- |
|
|
|
|
122,045 |
|
|
|
|
- |
|
|
Other impairment |
|
|
- |
|
|
|
|
- |
|
|
|
|
98 |
|
|
|
|
1,343 |
|
|
|
|
- |
|
|
Other costs |
|
|
1,620 |
|
|
|
|
- |
|
|
|
|
- |
|
|
|
|
- |
|
|
|
|
- |
|
|
Operating income (loss) |
|
|
76,125 |
|
|
|
|
96,736 |
|
|
|
|
92,127 |
|
|
|
|
(32,781 |
) |
|
|
|
103,147 |
|
|
Interest expense |
|
|
4,970 |
|
|
|
|
5,235 |
|
|
|
|
4,916 |
|
|
|
|
5,918 |
|
|
|
|
4,433 |
|
|
Interest income |
|
|
(345 |
) |
|
|
|
(141 |
) |
|
|
|
(250 |
) |
|
|
|
(274 |
) |
|
|
|
(463 |
) |
|
Other expense (income), net |
|
|
919 |
|
|
|
|
(1,769 |
) |
|
|
|
(692 |
) |
|
|
|
(167 |
) |
|
|
|
175 |
|
|
Income (loss) from continuing operations before income tax (benefit) expense |
|
|
70,581 |
|
|
|
|
93,411 |
|
|
|
|
88,153 |
|
|
|
|
(38,258 |
) |
|
|
|
99,002 |
|
|
Income tax (benefit) expense |
|
|
(4,371 |
) |
|
|
|
35,313 |
|
|
|
|
27,808 |
|
|
|
|
(1,351 |
) |
|
|
|
43,890 |
|
|
Net income (loss) from continuing operations |
|
|
74,952 |
|
|
|
|
58,098 |
|
|
|
|
60,345 |
|
|
|
|
(36,907 |
) |
|
|
|
55,112 |
|
|
Income (loss) from discontinued operations, net of tax |
|
|
- |
|
|
|
|
- |
|
|
|
|
- |
|
|
|
|
509 |
|
|
|
|
(2,919 |
) |
|
Net income (loss) |
$ |
|
74,952 |
|
|
$ |
|
58,098 |
|
|
$ |
|
60,345 |
|
|
$ |
|
(36,398 |
) |
|
$ |
|
52,193 |
|
|
|
|
|
|
|
|
|
|
|
|
|
|
|
|
|
|
|
|
|
|
|
|
|
|
|
|
Basic per share data |
|
|
|
|
|
|
|
|
|
|
|
|
|
|
|
|
|
|
|
|
|
|
|
|
|
Net income (loss) from continuing operations |
$ |
|
1.61 |
|
|
$ |
|
1.23 |
|
|
$ |
|
1.26 |
|
|
$ |
|
(0.76 |
) |
|
$ |
|
1.11 |
|
|
Income (loss) from discontinued operations, net of tax |
|
|
- |
|
|
|
|
- |
|
|
|
|
- |
|
|
|
|
0.01 |
|
|
|
|
(0.06 |
) |
|
Net income (loss) |
$ |
|
1.61 |
|
|
$ |
|
1.23 |
|
|
$ |
|
1.26 |
|
|
$ |
|
(0.75 |
) |
|
$ |
|
1.05 |
|
|
Shares used in computing per basic share data |
|
|
46,593 |
|
|
|
|
47,343 |
|
|
|
|
47,906 |
|
|
|
|
48,741 |
|
|
|
|
49,771 |
|
|
|
|
|
|
|
|
|
|
|
|
|
|
|
|
|
|
|
|
|
|
|
|
|
|
|
|
Diluted per share data |
|
|
|
|
|
|
|
|
|
|
|
|
|
|
|
|
|
|
|
|
|
|
|
|
|
Net income (loss) from continuing operations |
$ |
|
1.55 |
|
|
$ |
|
1.19 |
|
|
$ |
|
1.23 |
|
|
$ |
|
(0.76 |
) |
|
$ |
|
1.08 |
|
|
Income (loss) from discontinued operations, net of tax |
|
|
- |
|
|
|
|
- |
|
|
|
|
- |
|
|
|
|
0.01 |
|
|
|
|
(0.06 |
) |
|
Net income (loss) |
$ |
|
1.55 |
|
|
$ |
|
1.19 |
|
|
$ |
|
1.23 |
|
|
$ |
|
(0.75 |
) |
|
$ |
|
1.02 |
|
|
Shares used in computing per diluted share data |
|
|
48,226 |
|
|
|
|
48,813 |
|
|
|
|
49,224 |
|
|
|
|
48,741 |
|
|
|
|
50,951 |
|
|
|
|
|
|
|
|
|
|
|
|
|
|
|
|
|
|
|
|
|
|
|
|
|
|
|
|
|
At December 31, |
|
||||||||||||||||||||||
|
Balance Sheet Data |
2017 |
|
|
2016 |
|
|
2015 |
|
|
2014 |
|
|
2013 |
|
||||||||||
|
Cash and cash equivalents |
$ |
|
8,449 |
|
|
$ |
|
8,291 |
|
|
$ |
|
8,895 |
|
|
$ |
|
2,648 |
|
|
$ |
|
1,968 |
|
|
Working capital |
|
|
142,530 |
|
|
|
|
124,834 |
|
|
|
|
111,344 |
|
|
|
|
70,501 |
|
|
|
|
73,040 |
|
|
Total assets |
|
|
1,080,264 |
|
|
|
|
1,054,797 |
|
|
|
|
1,015,896 |
|
|
|
|
903,493 |
|
|
|
|
904,197 |
|
|
Total non-current liabilities |
|
|
226,249 |
|
|
|
|
245,346 |
|
|
|
|
278,418 |
|
|
|
|
200,506 |
|
|
|
|
169,260 |
|
|
Total stockholders' equity |
|
|
687,334 |
|
|
|
|
634,477 |
|
|
|
|
593,538 |
|
|
|
|
542,591 |
|
|
|
|
597,075 |
|
22
This Management’s Discussion and Analysis of Financial Condition and Results of Operations relates to, and should be read in conjunction with, our consolidated financial statements included elsewhere in this report. In addition to historical information, this discussion and analysis contains forward-looking statements that involve risks, uncertainties and assumptions, which could cause actual results to differ materially from management’s expectations. Please see the sections of this report entitled “Forward-Looking Statements” and “Risk Factors.”
Overview
We are a specialized, global professional services firm that helps clients take control of their future. With a focus on markets and clients facing transformational change and significant regulatory or legal pressures, we primarily serve clients in the healthcare, energy and financial services industries.
Our clients’ demand for our services ultimately drives our revenues and expenses. We derive our revenues from fees on services provided. The majority of our revenues are generated on a time and materials basis, though we also have engagements where fees are a fixed amount (either in total or for a period of time). We may also earn incremental revenues, in addition to hourly or fixed fees, which are contingent on the attainment of certain event-based or performance-based contractual milestones or outcomes. Variations in our quarterly or yearly revenues and resulting operating profit margins may occur depending on the timing of such contractual outcomes and our ability to consider these revenues earned and realized. Revenues are also earned on a per unit or subscription basis, generally for our technology-based service offerings.
Our most significant expenses are client-service employee compensation, which includes salaries, incentive compensation, amortization of sign-on and retention incentive payments, share-based compensation and benefits. Client-service employee compensation is included in cost of services before reimbursable expenses, in addition to technology costs, sales and marketing expenses and the direct costs of recruiting and training client-service employees.
Our most significant overhead expenses included in general and administrative expense are administrative compensation and office-related expenses. Administrative compensation includes salaries, incentive compensation, share-based compensation and benefits for corporate management and other non-billable employees that indirectly support client engagements. Office-related expenses primarily consist of rent for our offices. General and administrative expense includes bad debt expense, technology, finance, human capital management, marketing and legal expenses. Certain non-billable employees who support the reporting segments are recorded in cost of services before reimbursable expenses.
We periodically review and adjust our employees’ total compensation (which may include salaries, annual cash incentive compensation, other cash and share-based compensation, and benefits) to ensure that it is competitive within the industry and is consistent with our performance. We also monitor and adjust our bill rates for our service offerings and within the various industries we serve, depending on market conditions.
Hiring and Retention
Because our ability to derive fees is largely reliant on the hiring and retention of employees, the average number of full-time employees and our ability to keep client-service employees utilized are important drivers of the business. We use full-time equivalent (“FTE”) as a measure of our client-service employees. The number of Client-Service FTE is client-service employees adjusted for part-time status and takes into account hiring and attrition which occurred during the reporting period. Our average utilization rate as defined below provides a benchmark for how well we are managing our Consulting FTE levels in response to changing demand.
Client-Service FTE levels and related compensation in excess of demand drive additional costs that can negatively impact operating profit margin. From time to time, we engage independent contractors and hire project employees to supplement our Client-Service FTE on certain engagements, which allows us to adjust staffing in response to changes in demand for our services and manage our costs accordingly.
In connection with recruiting activities and business acquisitions, our general policy is to obtain non-solicitation covenants from senior and some mid-level client-service employees. Most of these covenants have restrictions that extend 12 months beyond the termination of employment. We utilize these contractual agreements and other agreements to reduce the risk of attrition and to safeguard our existing clients, employees and projects.
23
We continue to invest in technology infrastructure to support our evolving service offerings, including investment in more sophisticated technology infrastructure to enable our technology-based services as they expand and change over time and to deliver scalable technology solutions to meet the demands of our clients.
Acquisitions
For details regarding our recent acquisitions, see Note 3 — Acquisitions to the notes to our consolidated financial statements. Any material impact our acquisitions may have had on our results from operations or segment results for the periods presented has been included in our discussion below.
Key Operating Metrics
The following key operating metrics provide additional operating information related to our continuing business and reporting segments. These key operating metrics may not be comparable to similarly-titled metrics at other companies. Our Technology, Data & Process businesses are comprised of technology enabled professional services, including business process management services and data analytics, legal technology solutions and data services and insurance claims processing, market research and benchmarking businesses.
|
|
• |
Average FTE is our average headcount during the reporting period adjusted for part-time status. Average FTE is further split between the following categories: |
•Client-Service FTE — combination of Consulting FTE and Technology, Data & Process FTE defined as follows:
|
|
• |
Consulting FTE — individuals assigned to client services who record time to client engagements; and |
|
|
• |
Technology, Data & Process FTE — individuals in businesses primarily dedicated to maintaining and delivering the services described above and are not included in average bill rate and average utilization metrics described below. |
|
|
• |
Non-billable FTE — individuals assigned to administrative, analytics and support functions, including office services, corporate functions and certain practice support functions. |
|
|
• |
Period-end FTE — represents our headcount at the last day of the reporting period adjusted for part-time status. Consulting, Technology, Data & Process and Non-billable criteria also apply to period-end FTE. |
|
|
• |
Average utilization rate is calculated by dividing the number of hours of our Consulting FTE who recorded time to client engagements during a period by the total available working hours for these consultants during the same period (1,850 hours annually). Hours related to Technology, Data & Process FTE are excluded from average utilization rate. |
|
|
• |
Billable hours are the number of hours our Consulting FTE recorded time to client engagements during the reporting period. Hours related to Technology, Data & Process FTE are excluded from billable hours. |
|
|
• |
Segment operating profit represents total revenues less cost of services excluding long-term compensation expense attributable to Client-Service employees. Long-term compensation expense attributable to Client-Service employees includes share-based compensation expense and compensation expense attributable to retention incentives. |
All Client-Service FTE, utilization and average bill rate metric data provided in this report exclude the impact of independent contractors and project employees.
Results of Operations
Overview
Key highlights of our results of operations for the years ended December 31, 2017 and 2016 were:
Revenues before reimbursements (“RBR”) were comparable to the prior year period, with higher RBR in our Healthcare segment and contributions from the November 2016 acquisition of Ecofys within the Energy segment offset by lower RBR in our Financial Services Advisory and Compliance and Disputes, Forensics and Legal Technology segments. Event-based fees for the years
24
ended December 31, 2017 and 2016 were $23.1 million and $14.4 million, respectively which includes mass tort claims work within the Disputes, Forensics and Legal Technology segment. The increase in event-based fees primarily relates to fees earned within our Healthcare segment. See Segment Results below for further discussion on RBR. Cost of services before reimbursable expenses increased 3.6% while general and administrative expenses decreased 1.2%. Net income for the years ended December 31, 2017 and 2016 was $75.0 million and $58.1 million, respectively. Our effective income tax rate for the years ended December 31, 2017 and 2016 was a benefit of 6.2% and expense of 37.8%, respectively. Net income increased mainly due to the tax rate which was impacted by a $29.7 million net tax benefit recorded during the year ended December 31, 2017, as a result of Tax Reform, which was signed into law December 22, 2017. See income tax expense below for further details.
Key highlights of our results of operations for the years ended December 31, 2016 and 2015 were:
RBR increased 12.6%, of which nearly three-quarters was organic growth contributed from our Healthcare, Financial Services Advisory and Compliance and Energy segments. The remaining increase was mainly due to contributions from acquisitions within our Healthcare and Energy segments. Event-based fees for the years ended December 31, 2016 and 2015 were $14.4 million and $7.7 million, respectively. The increase primarily relates to mass tort claims work within the Disputes, Forensics and Legal Technology segment. See Segment Results below for further discussion on RBR. Additionally, cost of services before reimbursable expenses increased 10.5% reflecting both organic and acquisition growth in Client-Service FTE. General and administrative expenses increased 14.6% reflecting additional Non-billable FTE hires to support growth of the business. In addition, for the year ended December 31, 2016 other operating costs were $1.9 million as compared to other operating benefit for the year ended December 31, 2015 of $9.9 million (see Note 13 – Other Operating Costs (Benefit) to the notes to our consolidated financial statements). Net income for the years ended December 31, 2016 and 2015 was $58.1 million and $60.3 million, respectively. Our effective income tax rate for the years ended December 31, 2016 and 2015 was 37.8% and 31.5%, respectively.
|
|
|
|
|
|
|
|
|
|
|
|
|
|
|
2017 over |
|
|
2016 over |
|
||
|
|
|
|
|
|
|
|
|
|
|
|
|
|
|
2016 |
|
|
2015 |
|
||
|
|
|
For the year ended |
|
|
Increase |
|
|
Increase |
|
|||||||||||
|
|
|
December 31, |
|
|
(Decrease) |
|
|
(Decrease) |
|
|||||||||||
|
|
|
2017 |
|
|
2016 |
|
|
2015 |
|
|
Percentage |
|
|
Percentage |
|
|||||
|
Key operating metrics: |
|
|
|
|
|
|
|
|
|
|
|
|
|
|
|
|
|
|
|
|
|
Average FTE |
|
|
|
|
|
|
|
|
|
|
|
|
|
|
|
|
|
|
|
|
|
-Consulting |
|
|
1,894 |
|
|
|
1,760 |
|
|
|
1,568 |
|
|
|
7.6 |
|
|
|
12.2 |
|
|
-Technology, Data & Process |
|
|
2,999 |
|
|
|
2,721 |
|
|
|
2,562 |
|
|
|
10.2 |
|
|
|
6.2 |
|
|
-Non-billable |
|
|
924 |
|
|
|
838 |
|
|
|
703 |
|
|
|
10.3 |
|
|
|
19.2 |
|
|
Period end FTE |
|
|
|
|
|
|
|
|
|
|
|
|
|
|
|
|
|
|
|
|
|
-Consulting |
|
|
1,905 |
|
|
|
1,908 |
|
|
|
1,677 |
|
|
|
(0.2 |
) |
|
|
13.8 |
|
|
-Technology, Data & Process |
|
|
3,037 |
|
|
|
2,753 |
|
|
|
2,897 |
|
|
|
10.3 |
|
|
|
(5.0 |
) |
|
-Non-billable |
|
|
955 |
|
|
|
895 |
|
|
|
755 |
|
|
|
6.7 |
|
|
|
18.5 |
|
|
Average bill rate |
|
$ |
287 |
|
|
$ |
291 |
|
|
$ |
288 |
|
|
|
(1.4 |
) |
|
|
1.0 |
|
|
Utilization |
|
|
72 |
|
% |
|
75 |
|
% |
|
75 |
|
% |
|
(4.0 |
) |
|
|
- |
|
Key Operating Metrics
Average FTE – Consulting increased 7.6% for the year ended December 31, 2017 compared to the year ended December 31, 2016, mainly due to the acquisition of Ecofys within our Energy segment in November 2016, as well as additional hiring within certain growth areas including our Healthcare segment and the global construction and information security practices within our Disputes, Forensics and Legal Technology segment. Average FTE – Technology, Data & Process increased 10.2% for the year ended December 31, 2017 compared to the year ended December 31, 2016, mainly to support additional business process management services work within our Healthcare segment. A portion of the increase in Average FTE – Technology, Data & Process was due to the expansion of our team located in India. Average Non-billable FTE increased 10.3% for the years ended December 31, 2017 compared to the year ended December 31, 2016. The increase primarily relates to the centralization of an analytic team located both in the U.S. and in India which was done to create cross company efficiencies for corporate and practice support functions. The increase is partially offset by a reduction in administrative FTE. Utilization levels were 72% and 75% for the years ended December 31, 2017 and 2016, respectively, and average bill rate decreased 1.4% to $287 over the same periods mainly due to changes in project mix. Utilization and bill rate are further described below under Segment Results.
25
Average FTE — Consulting increased 12.2% for the year ended December 31, 2016 compared to the year ended December 31, 2015, mainly due to the acquisition of McKinnis Consulting Services LLC (“McKinnis”) within our Healthcare segment in December 2015 and the acquisition of Ecofys within our Energy segment in November 2016, as well as additional hiring within our Healthcare, Financial Services Advisory and Compliance and Energy segments. Average FTE — Technology, Data & Process increased 6.2% for the year ended December 31, 2016 compared to the year ended December 31, 2015 mainly due to the acquisition of RevenueMed within our Healthcare segment in February 2015, which added 1,500 Client-Service FTE (Average FTE reflects partial year of ownership). Period end FTE – Technology, Data & Process as of December 31, 2016 and 2015 decreased 5.0% reflecting full impact of 1,500 Client-Service FTE acquired from RevenueMed which was more than offset by actions taken in 2015 to realign resource with demand for these types of services. Average Non-billable FTE were up 19.2% for the year ended December 31, 2016 compared to the year ended December 31, 2015 mainly due to new hires made to support the growth of the business. Utilization levels were 75% for each of the years ended December 31, 2016 and 2015, and average bill rate increased 1.0% to $291 for the year ended December 31, 2016 compared to the year ended December 31, 2015.
Results for the year ended December 31, 2017 compared to the year ended December 31, 2016
Revenue before Reimbursements. See Segment Results below for further discussion on RBR.
Cost of Services before Reimbursable Expenses. Cost of services before reimbursable expenses increased 3.6% for the year ended December 31, 2017 compared to the year ended December 31, 2016. The increase was primarily due to higher compensation and benefits expenses resulting from Client-Service FTE increases discussed in “Key Operating Metrics” above as well as annual wage increases. In addition, technology and outside services expense increased during the same period. These increases were partially offset by lower incentive-based compensation due to lower operating performance. Severance expense relating to Client-Service FTE was $6.1 million and $4.2 million for the years ended December 31, 2017 and 2016, respectively, as part of certain performance improvement initiatives.
General and Administrative Expenses. General and administrative expenses decreased 1.2% for the year ended December 31, 2017 compared to the year ended December 31, 2016. The decrease is mainly a result of our cost saving initiatives. Compensation and benefits were down despite higher severance expense and higher Non-billable FTE. Corporate meetings, re-branding costs and bad debt expense were also lower for the year ended December 31, 2017 compared to the year ended December 31, 2016. These decreases were partially offset by higher facilities expenses due to duplicate rent expense related to our Chicago headquarters move (as we occupied our old Chicago offices until completion of the build-out of the new space), our San Francisco office consolidation and computer expenses related to cloud computing and Enterprise Resource Planning (“ERP”) system implementation costs. Severance expense for the years ended December 31, 2017 and 2016 was $1.6 million and $0.3 million, respectively. Bad debt expense for the years ended December 31, 2017 and 2016 was $7.8 million and $8.8 million, respectively.
General and administrative expenses were 17.8% of RBR for the year ended December 31, 2017 as compared to 18.0% for the year ended December 31, 2016.
Depreciation Expense. The increase in depreciation expense of 3.9% for the year ended December 31, 2017 compared to the year ended December 31, 2016 was primarily due to increased leasehold improvements, technology and software spending.
Amortization Expense. Amortization expense decreased 22.1% for the year ended December 31, 2017 compared to the year ended December 31, 2016. The decrease was primarily due to reduced amortization relating to certain intangible assets as their useful lives came to term, partially offset by the allocation of purchase price to intangible assets of recent acquisitions.
Other Operating Costs (Benefit):
Contingent Acquisition Liability Adjustment, Net. During the years ended December 31, 2017 and 2016, we recorded costs of $2.2 million and $1.3 million, respectively, relating to fair value adjustments to our estimated deferred contingent acquisition liabilities. For additional information, see Note 16 – Fair Value to the notes to our consolidated financial statements.
Other Costs. During the year ended December 31, 2017 we recorded one-time costs of $1.6 million relating to a legal matter.
Interest Expense. Interest expense decreased 5.1% or $0.3 million for the year ended December 31, 2017 compared to the year ended December 31, 2016. The decrease was mainly due to lower financing fees, imputed interest and average borrowings, partially offset by higher interest rates. Average borrowing rates were 2.6% and 2.3% for the years ended December 31, 2017 and 2016, respectively.
26
Other Income, Net. The decrease of 152.0% or $2.7 million for the year ended December 31, 2017 compared to the year ended December 31, 2016 was primarily due to the losses resulting from non-functional currency transactions occurring in our U.K.-based entity where the local currency (the U.K. Pound Sterling) strengthened relative to the U.S. dollar.
Income Tax Expense. Our effective income tax rate fluctuates based on the mix of income earned in various tax jurisdictions, including U.S. state and foreign jurisdictions which have different income tax rates, as well as various book-to-tax permanent differences. The rate is also impacted by discrete items which may not be consistent from year to year.
The effective income tax rate for the years ended December 31, 2017 and 2016 was a benefit of 6.2% and an expense of 37.8%, respectively, due to the impact of Tax Reform enacted on December 22, 2017. During the year ended December 31, 2017, we recognized a $29.8 million tax benefit as a result of revaluing the U.S. ending net deferred tax liabilities from 35% to the newly enacted U.S. corporate income tax rate of 21%. The lower enacted rate is expected to drive lower effective tax rates in the future. The tax benefit was partially offset by net tax expense of $0.1 million for the deemed mandatory repatriation of undistributed earnings. Further information on the components of the effective tax rates for the years ended December 31, 2017 and 2016, is presented in Note 15 – Income Taxes to the notes to our consolidated financial statements.
Results for the year ended December 31, 2016 compared to the year ended December 31, 2015
Revenue before Reimbursements. See Segment Results below for further discussion on RBR.
Cost of Services before Reimbursable Expenses. Cost of services before reimbursable expenses increased 10.5% for the year ended December 31, 2016 compared to the year ended December 31, 2015. The increase was primarily due to higher compensation and benefits expense resulting from Client-Service FTE increases discussed in “Key Operating Metrics” above as well as annual wage increases. In addition, training and meeting expenses, and recruiting and retention costs were higher for the year ended December 31, 2016 compared to the year ended December 31, 2015. Incentive-based compensation also increased due to improved operating performance. Severance expense relating to Client-Service FTE decreased for the year ended December 31, 2016 compared to the corresponding period in 2015 at $4.2 million and $5.9 million, respectively.
General and Administrative Expenses. General and administrative expenses increased 14.6% for the year ended December 31, 2016 compared to the year ended December 31, 2015. The increase was mainly due to higher compensation and benefits expense as a result of higher Non-billable FTE, as discussed above. Incentive-based compensation also increased for the year ended December 31, 2016 compared to the year ended December 31, 2015, due to improved operating performance. Training and meeting expenses were also higher for the year ended December 31, 2016 compared to the year ended December 31, 2015, due in part to a firm-wide leadership meeting held during the second quarter of 2016, while no such meeting was held in the corresponding period of 2015. Facilities expenses increased related to rent expense for our new corporate headquarters in Chicago, for which we took possession of in October 2016 to build out the new office space. In addition, bad debt expense increased to $8.8 million for the year ended December 31, 2016 compared to $2.6 million for the year ended December 31, 2015 as a result of higher days sales outstanding (“DSO”) for the year ended December 31, 2016. These increases were partially offset by a decrease in cloud storage costs partly as a result of higher allocation to our Technology, Data & Process businesses and legal expenses.
General and administrative expenses were 18.0% and 17.7% of RBR for the years ended December 31, 2016 and 2015, respectively. The increase was primarily due to the reasons discussed above.
Depreciation Expense. The increase in depreciation expense of 17.5% for the year ended December 31, 2016 compared to the year ended December 31, 2015 was primarily due to increased technology infrastructure spending, software, and leasehold improvements.
Amortization Expense. Amortization expense increased 33.6% for the year ended December 31, 2016 compared to the year ended December 31, 2015. The increase was primarily due to the allocation of purchase price to intangible assets of recent acquisitions, partially offset by reduced amortization relating to certain intangible assets as their useful lives came to term.
Other Operating Costs (Benefit):
Contingent Acquisition Liability Adjustment, Net. During the year ended December 31, 2016 we recorded costs of $1.3 million compared to benefits of $13.0 million during the year ended December 31, 2015 relating to fair value adjustments to our estimated deferred contingent acquisition liabilities. The adjustments made during the year ended December 31, 2015 primarily related to our Cymetrix acquisition. For additional information, see Note 16 – Fair Value to the notes to our consolidated financial statements.
Office Consolidation, Net. During the years ended December 31, 2016 and 2015, we recorded costs of $0.5 million and $2.8 million, respectively. The costs during the year ended December 31, 2016 related to the consolidation of office space acquired in
27
Denver, Colorado following the McKinnis acquisition. The costs during the year ended December 31, 2015 primarily related to our new consolidated office space in New York City and included duplicate rent expense as we occupied our old New York City offices until completion of the build-out of the new office space in April 2015.
Interest Expense. Interest expense increased 6.5% or $0.3 million for the year ended December 31, 2016 compared to the year ended December 31, 2015. The increase was mainly due to a higher average debt balance in 2016 due to the McKinnis acquisition which was offset by lower imputed interest relating to the deferred contingent consideration payable to the Cymetrix selling stockholders. Average borrowing rates were 2.3% and 2.2% for the years ended December 31, 2016 and 2015, respectively.
Other Income, Net. The increase of 155.6% or $1.1 million for the year ended December 31, 2016 compared to the year ended December 31, 2015 was primarily due to the gains resulting from non-functional currency transactions occurring in our U.K.-based entity where the local currency (the U.K. Pound Sterling) weakened, partially offset by a 2015 legal settlement received.
Income Tax Expense. Our effective income tax rate fluctuates based on the mix of income earned in various tax jurisdictions, including U.S. state and foreign jurisdictions which have different income tax rates, as well as various book-to-tax permanent differences. The rate is also impacted by discrete items which may not be consistent from year to year.
The effective income tax rate for the years ended December 31, 2016 and 2015 was 37.8% and 31.5% respectively. The increase in the effective income tax rate for the year ended December 31, 2016 compared to the year ended December 31, 2015 primarily relates to discrete items recorded during the year ended December 31, 2015, including a nontaxable deferred contingent acquisition liability fair value adjustment, favorable state-enacted legislative changes and favorable income tax settlements recorded during the year ended December 31, 2015, which reduced income tax expense by approximately $6.2 million.
Segment Results
Our operating segments are the same as our reporting segments. Our performance is assessed and resources are allocated based on the following four reporting segments:
|
|
• |
Healthcare |
|
|
• |
Energy |
|
|
• |
Financial Services Advisory and Compliance |
|
|
• |
Disputes, Forensics and Legal Technology |
The following information includes segment RBR, segment total revenues and segment operating profit all on a continuing basis. Certain unallocated expense amounts related to specific reporting segments have been excluded from the calculation of segment operating profit to be consistent with the information used by management to evaluate segment performance (see Note 4 — Segment Information to the notes to our consolidated financial statements). Segment operating profit represents total revenues less cost of services excluding long-term compensation expense attributable to client-service employees. Long-term compensation expense attributable to client-service employees includes share-based compensation expense and compensation expense related to retention incentives (see Note 9 — Supplemental Consolidated Balance Sheet Information to the notes to our consolidated financial statements). Key operating metric definitions are provided above.
28
The information presented does not necessarily reflect the results of segment operations that would have occurred had the reporting segments been stand-alone businesses.
|
Healthcare |
|
||||||||||||||||||||||||
|
|
|
|
|
|
|
|
|
|
|
|
|
|
|
|
|
|
|
|
2017 over |
|
|
2016 over |
|
||
|
|
|
|
|
|
|
|
|
|
|
|
|
|
|
|
|
|
|
|
2016 |
|
|
2015 |
|
||
|
|
|
|
|
For the year ended |
|
|
Increase |
|
|
Increase |
|
||||||||||||||
|
|
|
|
|
December 31, |
|
|
(Decrease) |
|
|
(Decrease) |
|
||||||||||||||
|
|
|
|
|
2017 |
|
|
2016 |
|
|
2015 |
|
|
Percentage |
|
|
Percentage |
|
||||||||
|
Revenues before reimbursements (in 000s) |
|
|
|
$ |
|
370,266 |
|
|
$ |
|
354,268 |
|
|
$ |
|
288,798 |
|
|
|
4.5 |
|
|
|
22.7 |
|
|
Total revenues (in 000s) |
|
|
|
$ |
|
404,120 |
|
|
$ |
|
389,233 |
|
|
$ |
|
313,884 |
|
|
|
3.8 |
|
|
|
24.0 |
|
|
Segment operating profit (in 000s) |
|
|
|
$ |
|
111,188 |
|
|
$ |
|
115,163 |
|
|
$ |
|
90,869 |
|
|
|
(3.5 |
) |
|
|
26.7 |
|
|
Key segment operating metrics: |
|
|
|
|
|
|
|
|
|
|
|
|
|
|
|
|
|
|
|
|
|
|
|
|
|
|
Segment operating profit margin |
|
|
|
|
|
30.0 |
|
% |
|
|
32.5 |
|
% |
|
|
31.5 |
|
% |
|
(7.7 |
) |
|
|
3.2 |
|
|
Average FTE - Consulting |
|
|
|
|
|
626 |
|
|
|
|
587 |
|
|
|
|
443 |
|
|
|
6.6 |
|
|
|
32.5 |
|
|
Average FTE - Technology, Data & Process |
|
|
|
|
|
2,663 |
|
|
|
|
2,466 |
|
|
|
|
2,287 |
|
|
|
8.0 |
|
|
|
7.8 |
|
|
Average utilization rates based on 1,850 hours |
|
|
|
|
|
74 |
|
% |
|
|
77 |
|
% |
|
|
76 |
|
% |
|
(3.9 |
) |
|
|
1.3 |
|
|
Average bill rate |
|
|
|
$ |
|
274 |
|
|
$ |
|
271 |
|
|
$ |
|
274 |
|
|
|
1.1 |
|
|
|
(1.1 |
) |
The Healthcare segment provides consulting services and business process management services. Clients of this segment include healthcare providers, payers and life sciences companies. We help clients respond to market legislative changes such as the shift to an outcomes and value-based reimbursements model, ongoing industry consolidation and reorganization, Medicaid expansion, the implementation of a new electronic health records system and product planning and commercialization expertise.
Year ended December 31, 2017 compared to the year ended December 31, 2016
RBR for this segment increased 4.5% for the year ended December 31, 2017 compared to the year ended December 31, 2016. The RBR increase was driven by an increase in our business process management services engagements and increased demand by life sciences companies for commercialization solutions, as well as higher demand from providers for large strategy-led transformation projects in the first half of the year. In addition, event-based fees were $10.6 million and $3.2 million for the years ended December 31, 2017 and 2016, respectively.
Average FTE – Consulting increased 6.6% for the year ended December 31, 2017 compared to the year ended December 31, 2016 mainly due to additional campus hiring to meet the higher demand discussed above. Average FTE – Technology, Data & Process increased 8.0% for the year ended December 31, 2017 compared to the year ended December 31, 2016 due to the increase in business process management services engagements discussed above partially offset by a transfer of personnel to the Financial Services Advisory and Compliance segment. A portion of this increase in Average FTE – Technology, Data & Process was due to the expansion of our team located in India. Utilization decreased 3.9% for the year ended December 31, 2017 compared to the year ended December 31, 2016 as hiring preceded slower than expected sales cycle. Average bill rate increased 1.1% to $274 mainly due to a change in project mix.
For the year ended December 31, 2017 compared to the year ended December 31, 2016, segment operating profit decreased $4.0 million and segment operating profit margin decreased 2.5 percentage points, respectively. The decrease was mainly due to higher compensation and benefits related to increased Client-Service FTE, partially offset by an increase in RBR, mainly within the business process management services practice. In addition, a higher percentage of the segment’s business came from lower margin engagements.
Year ended December 31, 2016 compared to the year ended December 31, 2015
RBR for this segment increased 22.7% for the year ended December 31, 2016 compared to the year ended December 31, 2015. RBR for the year ended December 31, 2016 reflected the benefit of acquisitions made during the year ended December 31, 2015. Over half of the year-over-year RBR increase was due to organic growth, driven by strong demand for large strategy-led transformation projects and revenue cycle consulting engagements.
Average FTE – Consulting increased 32.5% for the year ended December 31, 2016 compared to the year ended December 31, 2015 mainly due to the 76 professionals added from the McKinnis acquisition and additional hiring to meet the higher client demand. Average FTE – Technology, Data & Process increased 7.8% for the year ended December 31, 2016 compared to the year ended December 31, 2015 which was primarily due to the fact that the year ended December 2015 reflected partial period employment of
29
approximately 1,500 professionals acquired in February 2015 as part of the RevenueMed acquisition. Utilization increased 1.3% for the same period. Average bill rate decreased slightly to $271 for the year ended December 31, 2016 compared to the year ended December 31, 2015 mainly due to increased leverage of resources and a change in project mix.
For the year ended December 31, 2016 compared to the year ended December 31, 2015, segment operating profit and segment operating profit margin increased $24.3 million and 1.0 percentage point, respectively. These increases were attributable to the impact of higher RBR partially offset by higher compensation and benefits expense, incentive-based compensation and retention and training costs mainly related to acquired FTE as well as new hires.
|
Energy |
|
||||||||||||||||||||||||
|
|
|
|
|
|
|
|
|
|
|
|
|
|
|
|
|
|
|
|
2017 over |
|
|
2016 over |
|
||
|
|
|
|
|
|
|
|
|
|
|
|
|
|
|
|
|
|
|
|
2016 |
|
|
2015 |
|
||
|
|
|
|
|
For the year ended |
|
|
Increase |
|
|
Increase |
|
||||||||||||||
|
|
|
|
|
December 31, |
|
|
(Decrease) |
|
|
(Decrease) |
|
||||||||||||||
|
|
|
|
|
2017 |
|
|
2016 |
|
|
2015 |
|
|
Percentage |
|
|
Percentage |
|
||||||||
|
Revenues before reimbursements (in 000s) |
|
|
|
$ |
|
124,492 |
|
|
$ |
|
115,940 |
|
|
$ |
|
106,023 |
|
|
|
7.4 |
|
|
|
9.4 |
|
|
Total revenues (in 000s) |
|
|
|
$ |
|
146,425 |
|
|
$ |
|
133,612 |
|
|
$ |
|
124,491 |
|
|
|
9.6 |
|
|
|
7.3 |
|
|
Segment operating profit (in 000s) |
|
|
|
$ |
|
33,783 |
|
|
$ |
|
32,637 |
|
|
$ |
|
31,380 |
|
|
|
3.5 |
|
|
|
4.0 |
|
|
Key segment operating metrics: |
|
|
|
|
|
|
|
|
|
|
|
|
|
|
|
|
|
|
|
|
|
|
|
|
|
|
Segment operating profit margin |
|
|
|
|
|
27.1 |
|
% |
|
|
28.1 |
|
% |
|
|
29.6 |
|
% |
|
(3.6 |
) |
|
|
(5.1 |
) |
|
Average FTE - Consulting |
|
|
|
|
|
453 |
|
|
|
|
377 |
|
|
|
|
344 |
|
|
|
20.2 |
|
|
|
9.6 |
|
|
Average FTE - Technology, Data & Process |
|
|
|
|
|
59 |
|
|
|
|
62 |
|
|
|
|
65 |
|
|
|
(4.8 |
) |
|
|
(4.6 |
) |
|
Average utilization rates based on 1,850 hours |
|
|
|
|
|
66 |
|
% |
|
|
72 |
|
% |
|
|
74 |
|
% |
|
(8.3 |
) |
|
|
(2.7 |
) |
|
Average bill rate |
|
|
|
$ |
|
206 |
|
|
$ |
|
205 |
|
|
$ |
|
199 |
|
|
|
0.5 |
|
|
|
3.0 |
|
The Energy segment provides advisory services to utilities, governmental agencies, manufacturers and investors. We provide our clients with advisory solutions in business strategy and planning, distributed energy resources and renewables, energy efficiency and demand response, and grid modernization. In addition, we provide a broad array of benchmarking and research services.
Year ended December 31, 2017 compared to the year ended December 31, 2016
RBR for this segment increased 7.4% for the year ended December 31, 2017 compared to the year ended December 31, 2016, mainly due to the contributions from the November 2016 acquisition of Ecofys, partially offset by lower RBR related to a lower volume of services provided to U.S. federal governmental agencies.
Average FTE – Consulting increased 20.2% for the year ended December 31, 2017 compared to the year ended December 31, 2016, mainly due to the acquisition of Ecofys. Average FTE – Technology, Data & Process decreased 4.8% for the year ended December 31, 2017 compared to the year ended December 31, 2016. Utilization decreased 8.3% due to lower utilization levels at Ecofys which we expect to improve over time as we work to align the Ecofys and Navigant models, as well as lower utilization in other consulting practices. Average bill rate remained relatively flat at for the year ended December 31, 2017 compared to the year ended December 31, 2016.
For the year ended December 31, 2017 compared to the year ended December 31, 2016, segment operating profit increased $1.1 million and segment operating profit margin decreased 1.0 percentage point. The increase in segment operating profit was attributable to contributions from the Ecofys acquisition and lower incentive-based compensation offset by lower organic RBR and higher severance expense. Severance expense was $1.0 million and $0.5 million for the years ended December 31, 2017 and 2016, respectively.
Year ended December 31, 2016 compared to the year ended December 31, 2015
RBR for this segment increased 9.4% for the year ended December 31, 2016 compared to the year ended December 31, 2015. RBR for the year ended December 31, 2016 reflected the November 2016 acquisition of Ecofys. Nearly two-thirds of the year-over-year RBR increase was due to organic growth, primarily due to an increase in demand for strategy and operations and energy efficiency evaluation and standards engagements driven by ongoing penetration of key client accounts.
30
Average FTE — Consulting increased 9.6% for the year ended December 31, 2016 compared to the year ended December 31, 2015 primarily due to the Ecofys acquisition and additional hires to support increased demand for the segment’s service offerings as noted above. Average FTE — Technology, Data & Process decreased 4.6% for the year ended December 31, 2016 compared to the year ended December 31, 2015 mainly due to resource alignment. Utilization decreased 2.7% for the year ended December 31, 2016 compared to the year ended December 31, 2015 mainly due to delays in expected sales pipeline conversion. Average bill rate increased 3.0% to $205 for the year ended December 31, 2016 compared to the year ended December 31, 2015, due to bill rate increases and changes in project mix.
For the year ended December 31, 2016 compared to the year ended December 31, 2015, segment operating profit increased $1.3 million mainly due to the Ecofys acquisition. Segment operating profit margin decreased 1.5 percentage points for the year ended December 31, 2016 compared to the year ended December 31, 2015 as the costs of new hires outpaced associated RBR growth for the year and certain engagements were accepted at lower margin levels.
|
Financial Services Advisory and Compliance |
|
||||||||||||||||||||||||
|
|
|
|
|
|
|
|
|
|
|
|
|
|
|
|
|
|
|
|
2017 over |
|
|
2016 over |
|
||
|
|
|
|
|
|
|
|
|
|
|
|
|
|
|
|
|
|
|
|
2016 |
|
|
2015 |
|
||
|
|
|
|
|
For the year ended |
|
|
Increase |
|
|
Increase |
|
||||||||||||||
|
|
|
|
|
December 31, |
|
|
(Decrease) |
|
|
(Decrease) |
|
||||||||||||||
|
|
|
|
|
2017 |
|
|
2016 |
|
|
2015 |
|
|
Percentage |
|
|
Percentage |
|
||||||||
|
Revenues before reimbursements (in 000s) |
|
|
|
$ |
|
140,336 |
|
|
$ |
|
152,166 |
|
|
$ |
|
124,359 |
|
|
|
(7.8 |
) |
|
|
22.4 |
|
|
Total revenues (in 000s) |
|
|
|
$ |
|
159,410 |
|
|
$ |
|
173,391 |
|
|
$ |
|
142,959 |
|
|
|
(8.1 |
) |
|
|
21.3 |
|
|
Segment operating profit (in 000s) |
|
|
|
$ |
|
53,772 |
|
|
$ |
|
63,464 |
|
|
$ |
|
49,130 |
|
|
|
(15.3 |
) |
|
|
29.2 |
|
|
Key segment operating metrics: |
|
|
|
|
|
|
|
|
|
|
|
|
|
|
|
|
|
|
|
|
|
|
|
|
|
|
Segment operating profit margin |
|
|
|
|
|
38.3 |
|
% |
|
|
41.7 |
|
% |
|
|
39.5 |
|
% |
|
(8.2 |
) |
|
|
5.6 |
|
|
Average FTE - Consulting |
|
|
|
|
|
309 |
|
|
|
|
308 |
|
|
|
|
293 |
|
|
|
0.3 |
|
|
|
5.1 |
|
|
Average FTE - Technology, Data & Process |
|
|
|
|
|
94 |
|
|
|
|
- |
|
|
|
|
- |
|
|
|
100.0 |
|
|
|
- |
|
|
Average utilization rates based on 1,850 hours |
|
|
|
|
|
78 |
|
% |
|
|
78 |
|
% |
|
|
76 |
|
% |
|
- |
|
|
|
2.6 |
|
|
Average bill rate |
|
|
|
$ |
|
296 |
|
|
$ |
|
301 |
|
|
$ |
|
275 |
|
|
|
(1.7 |
) |
|
|
9.5 |
|
The Financial Services Advisory and Compliance segment provides strategic, operational, valuation, risk management, investigative and compliance advisory services to clients primarily in the highly-regulated financial services industry, including major financial and insurance institutions. This segment also provides anti-corruption solutions and anti-money laundering consulting, litigation support, tax compliance and valuation services to clients in a broad variety of industries.
Year ended December 31, 2017 compared to the year ended December 31, 2016
RBR for this segment decreased 7.8% for the year ended December 31, 2017 compared to the year ended December 31, 2016, due to the conclusion of certain engagements as well as fewer compliance and controls engagements from financial institutions.
Average FTE – Consulting was relatively flat for the year ended December 31, 2017 compared to the year ended December 31, 2016. Average FTE – Technology, Data & Process increased 100% for the year ended December 31, 2017 compared to the year ended December 31, 2016, due to a transfer of personnel from the Healthcare segment. Utilization remained at 78% for the year ended December 31, 2017 compared to the year ended December 31, 2016. Average bill rate decreased 1.7% to $296, mainly due to a change in project mix.
For the year ended December 31, 2017 compared to the year ended December 31, 2016, segment operating profit and segment operating profit margin decreased $9.7 million and 3.4 percentage points, respectively. The decreases were driven by lower RBR, higher compensation and benefits expense due to annual wage increases, partially offset by lower incentive-based compensation. In addition to fewer engagements for the year ended December 31, 2017, certain new engagements were less profitable than similar engagements for the year ended December 31, 2016 due to competitive pricing on flexible resources.
Year ended December 31, 2016 compared to the year ended December 31, 2015
RBR for this segment increased 22.4% for the year ended December 31, 2016 compared to the year ended December 31, 2015. The year-over-year increase in RBR was primarily due to increased demand for financial crimes consulting expertise and compliance engagements from major financial institutions.
Average FTE – Consulting increased 5.1% for the year ended December 31, 2016 compared to the year ended December 31, 2015 to meet demand needs. Average bill rate increased 9.5% to $301 for the year ended December 31, 2016 compared to the year
31
ended December 31, 2015 mainly due to a change in project mix. Utilization increased 2.6% for the year ended December 31, 2016 compared to the year ended December 31, 2015 mainly due to the higher volume of work associated with the demand discussed above.
For the year ended December 31, 2016 compared to the year ended December 31, 2015, segment operating profit and segment operating profit margin increased $14.3 million and 2.2 percentage points, respectively, mainly due to higher RBR driven by higher demand, higher bill rates and utilization, and use of flexible resources, partially offset by higher compensation and benefits expense due to an increase in FTE – Consulting, annual wage increases and higher incentive-based compensation.
|
Disputes, Forensics and Legal Technology |
|
||||||||||||||||||||||||
|
|
|
|
|
|
|
|
|
|
|
|
|
|
|
|
|
|
|
|
2017 over |
|
|
2016 over |
|
||
|
|
|
|
|
|
|
|
|
|
|
|
|
|
|
|
|
|
|
|
2016 |
|
|
2015 |
|
||
|
|
|
|
|
For the year ended |
|
|
Increase |
|
|
Increase |
|
||||||||||||||
|
|
|
|
|
December 31, |
|
|
(Decrease) |
|
|
(Decrease) |
|
||||||||||||||
|
|
|
|
|
2017 |
|
|
2016 |
|
|
2015 |
|
|
Percentage |
|
|
Percentage |
|
||||||||
|
Revenues before reimbursements (in 000s) |
|
|
|
$ |
|
304,545 |
|
|
$ |
|
316,372 |
|
|
$ |
|
314,628 |
|
|
|
(3.7 |
) |
|
|
0.6 |
|
|
Total revenues (in 000s) |
|
|
|
$ |
|
322,372 |
|
|
$ |
|
338,244 |
|
|
$ |
|
338,152 |
|
|
|
(4.7 |
) |
|
|
- |
|
|
Segment operating profit (in 000s) |
|
|
|
$ |
|
97,564 |
|
|
$ |
|
108,685 |
|
|
$ |
|
102,449 |
|
|
|
(10.2 |
) |
|
|
6.1 |
|
|
Key segment operating metrics: |
|
|
|
|
|
|
|
|
|
|
|
|
|
|
|
|
|
|
|
|
|
|
|
|
|
|
Segment operating profit margin |
|
|
|
|
|
32.0 |
|
% |
|
|
34.4 |
|
% |
|
|
32.6 |
|
% |
|
(7.0 |
) |
|
|
5.5 |
|
|
Average FTE - Consulting |
|
|
|
|
|
505 |
|
|
|
|
488 |
|
|
|
|
487 |
|
|
|
3.5 |
|
|
|
0.2 |
|
|
Average FTE - Technology, Data & Process |
|
|
|
|
|
182 |
|
|
|
|
192 |
|
|
|
|
210 |
|
|
|
(5.2 |
) |
|
|
(8.6 |
) |
|
Average utilization rates based on 1,850 hours |
|
|
|
|
|
73 |
|
% |
|
|
73 |
|
% |
|
|
75 |
|
% |
|
- |
|
|
|
(2.7 |
) |
|
Average bill rate |
|
|
|
$ |
|
363 |
|
|
$ |
|
371 |
|
|
$ |
|
373 |
|
|
|
(2.2 |
) |
|
|
(0.5 |
) |
The Disputes, Forensics and Legal Technology segment’s professional services include accounting, regulatory, construction and computer forensic expertise, as well as valuation and economic analysis. In addition to these capabilities, our professionals use technological tools to perform eDiscovery services and to deliver custom technology, data analytic and cyber-security solutions. The clients of this segment principally include companies along with their in-house counsel and law firms, as well as accounting firms, corporate boards and government agencies.
Year ended December 31, 2017 compared to the year ended December 31, 2016
RBR for this segment decreased 3.7% for the year ended December 31, 2017 compared to the year ended December 31, 2016 due to reduced processing volumes for legal technology solutions and general weakness in commercial litigation engagements partially offset by continued demand for our global expertise in complex industrial, infrastructure and commercial project matters and cyber-security solutions.
Average FTE – Consulting increased 3.5% for the year ended December 31, 2017 compared to the year ended December 31, 2016 due to new hires within targeted growth areas and Average FTE – Technology, Data & Process decreased 5.2% over the same period due to aligning resources with demand for legal technology solutions. Average bill rate decreased 2.2% to $363 for the year ended December 31, 2017 compared to the year ended December 31, 2016, mainly due to changes in project mix. Utilization remained at 73% for the same periods.
For the year ended December 31, 2017 compared to the year ended December 31, 2016, segment operating profit and segment operating profit margin decreased $11.1 million and 2.4 percentage points, respectively, primarily due to lower RBR and higher severance expense. Severance expense for the years ended December 31, 2017 and 2016 was $3.2 million and $1.7 million, respectively.
Year ended December 31, 2016 compared to the year ended December 31, 2015
RBR for this segment increased 0.6% for the year ended December 31, 2016 compared to the year ended December 31, 2015. The year-over-year increase in RBR was mainly due to strong demand for our global expertise in complex industrial, infrastructure and commercial project matters and an increase in event-based fees associated with mass tort claims work offset by a decline in demand due to the ongoing competitive environment for legal technology solutions. In addition, the segment experienced declines as a result of large engagements that ended during the year ended December 31, 2016.
Average FTE — Consulting was relatively flat for the year ended December 31, 2016 compared to the year ended December 31, 2015 as personnel reductions taken during the year ended December 31, 2015 were offset by new hires within certain strategic growth
32
areas during the year ended December 31, 2016. Average FTE — Technology, Data & Process decreased 8.6% over the same periods due to the reasons discussed above. Average bill rate was relatively flat at $371 for the year ended December 31, 2016, compared to the year ended December 31, 2015. Utilization decreased 2.7% for the same periods due to a shift in project mix driven by the change in demand discussed above.
For the year ended December 31, 2016 compared to the year ended December 31, 2015, segment operating profit and segment operating profit margin increased $6.2 million and 1.8 percentage points, respectively, mainly due to higher event-based fees associated with mass tort claims work for which certain costs of services were incurred in prior periods and lower compensation and benefits expenses as a result of cost management actions taken during the year ended December 31, 2015. For the years ended December 31, 2016 and 2015, severance expense was $1.7 million and $4.4 million, respectively.
Unaudited Quarterly Results
The following table sets forth certain unaudited quarterly financial information. The unaudited quarterly financial information was prepared on the same basis as the audited consolidated financial statements contained elsewhere in this report. The data includes all normal recurring adjustments necessary for the fair presentation of the information for the periods presented, when read in conjunction with our consolidated financial statements and related notes thereto. Results for any quarter are not necessarily indicative of results for the full year or for any future quarter. During the fourth quarter 2017, we recognized a $29.7 million net tax benefit as a result of Tax Reform, which was signed into law December 22, 2017. Further information on the tax impacts of Tax Reform is presented in Note 15 – Income Taxes to the notes to our consolidated financial statements.
The amounts in the following table are in thousands, except for per share data:
|
|
|
|
|
|
|
|
|
|
|
|
|
|
|
|
|
|
|
|
|
|
|
|
|
|
|
|
|
|
|
|
|
|
|
|
|
|
|
|
|
|
|
|
|
|
Dec. 31, |
|
|
Sep. 30, |
|
|
June 30, |
|
|
Mar. 31, |
|
|
Dec. 31, |
|
|
Sep. 30, |
|
|
June 30, |
|
|
Mar. 31, |
|
|
||||||||||||||||
|
|
|
2017 |
|
|
2017 |
|
|
2017 |
|
|
2017 |
|
|
2016 |
|
|
2016 |
|
|
2016 |
|
|
2016 |
|
|
||||||||||||||||
|
|
Revenues before reimbursements |
$ |
|
230,685 |
|
|
$ |
|
237,505 |
|
|
$ |
|
235,238 |
|
|
$ |
|
236,211 |
|
|
$ |
|
239,671 |
|
|
$ |
|
237,115 |
|
|
$ |
|
238,485 |
|
|
$ |
|
223,475 |
|
|
|
|
Reimbursements |
|
|
24,683 |
|
|
|
|
24,771 |
|
|
|
|
21,608 |
|
|
|
|
21,626 |
|
|
|
|
26,430 |
|
|
|
|
24,294 |
|
|
|
|
23,198 |
|
|
|
|
21,812 |
|
|
|
|
Total revenues |
|
|
255,368 |
|
|
|
|
262,276 |
|
|
|
|
256,846 |
|
|
|
|
257,837 |
|
|
|
|
266,101 |
|
|
|
|
261,409 |
|
|
|
|
261,683 |
|
|
|
|
245,287 |
|
|
|
|
Cost of services before reimbursable expenses |
|
|
159,216 |
|
|
|
|
161,597 |
|
|
|
|
168,721 |
|
|
|
|
165,052 |
|
|
|
|
163,968 |
|
|
|
|
156,061 |
|
|
|
|
157,966 |
|
|
|
|
153,940 |
|
|
|
|
Reimbursable expenses |
|
|
24,683 |
|
|
|
|
24,771 |
|
|
|
|
21,608 |
|
|
|
|
21,626 |
|
|
|
|
26,430 |
|
|
|
|
24,294 |
|
|
|
|
23,198 |
|
|
|
|
21,812 |
|
|
|
|
Total cost of services |
|
|
183,899 |
|
|
|
|
186,368 |
|
|
|
|
190,329 |
|
|
|
|
186,678 |
|
|
|
|
190,398 |
|
|
|
|
180,355 |
|
|
|
|
181,164 |
|
|
|
|
175,752 |
|
|
|
|
General and administrative expenses |
|
|
39,532 |
|
|
|
|
44,180 |
|
|
|
|
41,726 |
|
|
|
|
41,484 |
|
|
|
|
42,490 |
|
|
|
|
42,126 |
|
|
|
|
44,507 |
|
|
|
|
39,831 |
|
|
|
|
Depreciation expense |
|
|
6,785 |
|
|
|
|
6,742 |
|
|
|
|
7,826 |
|
|
|
|
7,473 |
|
|
|
|
7,197 |
|
|
|
|
7,008 |
|
|
|
|
7,015 |
|
|
|
|
6,522 |
|
|
|
|
Amortization expense |
|
|
2,247 |
|
|
|
|
2,175 |
|
|
|
|
2,219 |
|
|
|
|
2,319 |
|
|
|
|
2,790 |
|
|
|
|
2,905 |
|
|
|
|
2,891 |
|
|
|
|
2,921 |
|
|
|
|
Other operating costs (benefit): |
|
|
|
|
|
|
|
|
|
|
|
|
|
|
|
|
|
|
|
|
|
|
|
|
|
|
|
|
|
|
|
|
|
|
|
|
|
|
|
|
|
|
Contingent acquisition liability adjustments, net |
|
|
- |
|
|
|
|
1,014 |
|
|
|
|
- |
|
|
|
|
1,199 |
|
|
|
|
- |
|
|
|
|
480 |
|
|
|
|
850 |
|
|
|
|
- |
|
|
|
|
Office consolidation, net |
|
|
280 |
|
|
|
|
- |
|
|
|
|
- |
|
|
|
|
(38 |
) |
|
|
|
368 |
|
|
|
|
- |
|
|
|
|
174 |
|
|
|
|
- |
|
|
|
|
Deferred debt issuance costs write off |
|
|
- |
|
|
|
|
- |
|
|
|
|
- |
|
|
|
|
145 |
|
|
|
|
- |
|
|
|
|
- |
|
|
|
|
- |
|
|
|
|
- |
|
|
|
|
Other costs |
|
|
- |
|
|
|
|
1,620 |
|
|
|
|
- |
|
|
|
|
- |
|
|
|
|
- |
|
|
|
|
- |
|
|
|
|
- |
|
|
|
|
- |
|
|
|
|
Operating income |
|
|
22,625 |
|
|
|
|
20,177 |
|
|
|
|
14,746 |
|
|
|
|
18,577 |
|
|
|
|
22,858 |
|
|
|
|
28,535 |
|
|
|
|
25,082 |
|
|
|
|
20,261 |
|
|
|
|
Interest expense |
|
|
1,254 |
|
|
|
|
1,367 |
|
|
|
|
1,280 |
|
|
|
|
1,069 |
|
|
|
|
1,236 |
|
|
|
|
1,310 |
|
|
|
|
1,429 |
|
|
|
|
1,260 |
|
|
|
|
Interest income |
|
|
(109 |
) |
|
|
|
(124 |
) |
|
|
|
(81 |
) |
|
|
|
(31 |
) |
|
|
|
(31 |
) |
|
|
|
(35 |
) |
|
|
|
(36 |
) |
|
|
|
(39 |
) |
|
|
|
Other (income) expense, net |
|
|
430 |
|
|
|
|
104 |
|
|
|
|
602 |
|
|
|
|
(217 |
) |
|
|
|
(635 |
) |
|
|
|
(350 |
) |
|
|
|
(444 |
) |
|
|
|
(340 |
) |
|
|
|
Income before income tax expense |
|
|
21,050 |
|
|
|
|
18,830 |
|
|
|
|
12,945 |
|
|
|
|
17,756 |
|
|
|
|
22,288 |
|
|
|
|
27,610 |
|
|
|
|
24,133 |
|
|
|
|
19,380 |
|
|
|
|
Income tax (benefit) expense |
|
|
(22,070 |
) |
|
|
|
6,891 |
|
|
|
|
4,148 |
|
|
|
|
6,660 |
|
|
|
|
8,784 |
|
|
|
|
10,435 |
|
|
|
|
9,356 |
|
|
|
|
6,738 |
|
|
|
|
Net income |
$ |
|
43,120 |
|
|
$ |
|
11,939 |
|
|
$ |
|
8,797 |
|
|
$ |
|
11,096 |
|
|
$ |
|
13,504 |
|
|
$ |
|
17,175 |
|
|
$ |
|
14,777 |
|
|
$ |
|
12,642 |
|
|
|
|
|
|
|
|
|
|
|
|
|
|
|
|
|
|
|
|
|
|
|
|
|
|
|
|
|
|
|
|
|
|
|
|
|
|
|
|
|
|
|
|
|
|
|
Basic net income per share |
$ |
|
0.94 |
|
|
$ |
|
0.26 |
|
|
$ |
|
0.19 |
|
|
$ |
|
0.24 |
|
|
$ |
|
0.29 |
|
|
$ |
|
0.36 |
|
|
$ |
|
0.31 |
|
|
$ |
|
0.27 |
|
|
|
|
Shares used in computing basic per share data |
|
|
45,708 |
|
|
|
|
46,619 |
|
|
|
|
47,113 |
|
|
|
|
46,932 |
|
|
|
|
47,026 |
|
|
|
|
47,369 |
|
|
|
|
47,550 |
|
|
|
|
47,425 |
|
|
|
|
|
|
|
|
|
|
|
|
|
|
|
|
|
|
|
|
|
|
|
|
|
|
|
|
|
|
|
|
|
|
|
|
|
|
|
|
|
|
|
|
|
|
|
Diluted net income per share |
$ |
|
0.91 |
|
|
$ |
|
0.25 |
|
|
$ |
|
0.18 |
|
|
$ |
|
0.23 |
|
|
$ |
|
0.28 |
|
|
$ |
|
0.35 |
|
|
$ |
|
0.30 |
|
|
$ |
|
0.26 |
|
|
|
|
Shares used in computing diluted per share data |
|
|
47,223 |
|
|
|
|
48,017 |
|
|
|
|
48,696 |
|
|
|
|
48,969 |
|
|
|
|
48,618 |
|
|
|
|
48,763 |
|
|
|
|
48,841 |
|
|
|
|
49,031 |
|
|
|
|
|
|
|
|
|
|
|
|
|
|
|
|
|
|
|
|
|
|
|
|
|
|
|
|
|
|
|
|
|
|
|
|
|
|
|
|
|
|
|
|
|
33
Operating results fluctuate from quarter to quarter as a result of a number of factors, including the significance of client engagements commenced and completed during a quarter, timing of acquisitions, the number of business days in a quarter, employee hiring and utilization rates. The timing of revenues varies from quarter to quarter due to various factors, including the ability of clients to terminate engagements without penalty, attaining certain contractual outcomes, the size and scope of assignments, and general economic conditions. Because a significant percentage of our expenses are relatively fixed, a variation in the number of client assignments, or the timing of the initiation or the completion of client assignments, can cause significant variations in operating results from quarter to quarter. Operating results are also impacted by other operating costs (benefit). In addition, interest expense and interest income fluctuate from quarter to quarter as a result of balance changes in cash and debt. Other (income) expense will fluctuate from quarter to quarter due to the impact of foreign currency translations for transactions recorded in non-functional currencies.
Liquidity and Capital Resources
Our cash flow activities were as follows (in thousands) for the years ended December 31,
|
|
|
2017 |
|
|
2016 |
|
|
2015 |
|
|||
|
Net cash provided by operating activities |
|
$ |
104,235 |
|
|
$ |
110,027 |
|
|
$ |
83,079 |
|
|
Net cash used in investing activities |
|
$ |
(44,462 |
) |
|
$ |
(51,526 |
) |
|
$ |
(117,412 |
) |
|
Net cash (used in) provided by financing activities |
|
$ |
(60,398 |
) |
|
$ |
(58,798 |
) |
|
$ |
40,811 |
|
Generally, our primary sources of cash include cash flows from operations and borrowings under our credit facility. First quarter operating cash requirements are generally higher due to payment of our annual incentive bonuses while subsequent quarters’ operating cash requirements are generally lower. Our cash equivalents are primarily limited to money market accounts or ‘A’ rated securities, with maturity dates of 90 days or less.
We calculate accounts receivable DSO by dividing the accounts receivable balance, net of reserves and deferred revenue credits, at the end of the quarter, by daily revenues. Daily revenues are calculated by taking quarterly revenue divided by 90 days, approximately equal to the number of days in a quarter. DSO was 85 days at December 31, 2017, compared to 81 days at December 31, 2016. The increase in DSO reflects the impact of lower daily revenues for the three months ended December 31, 2017 without a similar decrease in accounts receivable. DSO was 76 days at December 31, 2015, and increased to 81 days at December 31, 2016, mainly due to slower collections for select client engagements and milestone billing arrangements.
Operating Activities
Net cash provided by operating activities was $104.2 million for the year ended December 31, 2017 compared to $110.0 million and $83.1 million in 2016 and 2015, respectively. The decrease in cash provided by operating activities for the year ended December 31, 2017 compared to the year ended December 31, 2016 was primarily due to lower operating income partially offset by lower investment in working capital. The increase in cash provided by operating activities for the year ended December 31, 2016 compared to the year ended December 31, 2015 was primarily due to overall company growth and other changes in operating assets and liabilities including lower sign-on bonuses granted and higher incentive-based compensation accruals during the year ended December 31, 2016, partially offset by higher accounts receivable balances for the year ended December 31, 2016. As noted above, DSO at December 31, 2016 was higher than at December 31, 2015.
Investing Activities
Net cash used in investing activities was $44.5 million for the year ended December 31, 2017 compared to $51.5 million and $117.4 million for the years ended December 31, 2016 and 2015. The decrease in cash used in investing activities for the year ended December 31, 2017 compared to December 31, 2016 was primarily due to lower acquisition related payments for the year ended December 31, 2017 (see Note 3 — Acquisitions to the notes to our consolidated financial statements), partially offset by an increase in capital expenditures related to the build-out of our new corporate headquarters in Chicago during the year ended December 31, and technology spending. Cash used in investing activities decreased during the year ended December 31, 2016 compared to the year ended December 31, 2015 mainly due to lower acquisition related costs and lower capital expenditures primarily relating to leasehold improvements associated with the consolidation of our offices located in New York City during the year ended December 31, 2015.
Financing Activities
Net cash used in financing activities was $60.4 million and $58.8 million for the years ended December 31, 2017 and 2016, respectively, compared to net cash provided by financing activities of $40.8 million for the year ended December 31, 2015. The cash used in financing activities during the year ended December 31, 2017 compared to the year ended December 31, 2016 increased mainly due to a higher volume of share repurchases and higher contingent acquisition liability payments, partially offset by lower repayment of debt during 2017. Cash used in financing activities compared to cash provided by financing activities for the years
34
ended December 31, 2016 and 2015, respectively, was mainly due to higher debt borrowings made in 2015 to finance the McKinnis acquisition (see Note 3 – Acquisitions to the notes to our consolidated financial statements).
During the year ended December 31, 2017, we purchased 2,322,415 shares of our common stock in the open market for $43.0 million compared to 1,436,147 shares of our common stock in the open market for $25.1 million and 1,589,072 shares for $24.0 million during the years ended December 31, 2016 and 2015, respectively.
Debt, Commitments and Capital
For further information regarding our debt, see Note 12 – Bank Debt to the notes to our consolidated financial statements.
At December 31, 2017, we had total contractual obligations of $291.2 million. The following table shows the components of our significant commitments at December 31, 2017 by the scheduled years of payments (in thousands):
|
Contractual Obligations |
|
Total |
|
|
2018 |
|
|
2019 to 2020 |
|
|
2021 to 2022 |
|
|
Thereafter |
|
|||||
|
Deferred acquisition liabilities (a) |
|
$ |
5,870 |
|
|
$ |
3,930 |
|
|
$ |
1,940 |
|
|
$ |
- |
|
|
$ |
- |
|
|
Revolving credit facility (b) (c) |
|
|
132,944 |
|
|
|
- |
|
|
|
- |
|
|
|
- |
|
|
|
132,944 |
|
|
Lease commitments |
|
|
152,347 |
|
|
|
27,537 |
|
|
|
48,579 |
|
|
|
31,243 |
|
|
|
44,988 |
|
|
Total contractual obligations |
|
$ |
291,161 |
|
|
$ |
31,467 |
|
|
$ |
50,519 |
|
|
$ |
31,243 |
|
|
$ |
177,932 |
|
|
|
a) |
At December 31, 2017, we had $5.9 million in liabilities relating to deferred acquisition liability obligations which were recorded at estimated fair value and discounted to present value. Settlement of certain of the liabilities is contingent upon acquired businesses meeting performance targets. Assuming each of these acquisitions reaches their maximum target, our maximum deferred contingent acquisition liability would have been $6.9 million at December 31, 2017. |
|
|
b) |
Interest incurred on amounts we borrow under the credit facility varies based on relative borrowing levels, fluctuations in the variable interest rates and the spread we pay over those interest rates. As such, we are unable to quantify our future obligations relating to interest on the credit facility. See Note 12 – Bank Debt to the notes to our consolidated financial statements for further information on our credit facility. |
|
|
c) |
At December 31, 2017, we had $3.6 million of unused letters of credit under our credit facility, which have been included as a reduction in the available borrowings. The letters of credit are primarily related to the requirements of certain lease agreements for office space. |
Since the inception of our share repurchase program in the fourth quarter of 2011 through December 31, 2017, we repurchased an aggregate of 10,896,375 shares of our common stock for approximately $169.1 million under our share repurchase program. At December 31, 2017, we had approximately $63.6 million remaining for share repurchases under the remaining board authorization. On April 19, 2017, our board of directors authorized an increase in our share repurchase authorization to $100.0 million for the 32-month period ending December 31, 2019, effective May 1, 2017. See Part II, Item 5 of this report for additional information on the share repurchases.
As further discussed in Note 15 – Income Taxes to the notes to our consolidated financial statements, on December 22, 2017, Tax Reform became law. The legislation significantly changes U.S. tax law by, among other things, lowering corporate income tax rates, implementing a territorial tax system and imposing a repatriation tax on deemed repatriated earnings of foreign subsidiaries. Tax Reform permanently reduces the U.S. corporate income tax rate from a maximum of 35% to a flat 21% rate, effective January 1, 2018. Tax Reform may impact future cash flows as a result of the change in corporate tax rate and the impact it may have on cash paid taxes.
During the year ended December 31, 2016, we retired 8,000,000 shares of treasury stock. As a result, within the stockholders’ equity accounts on our consolidated balance sheets, treasury stock was reduced by the fair value of the shares calculated using the weighted average treasury stock inventory price, common stock was reduced for the aggregate par value of the shares retired, with the difference recorded as a reduction to retained earnings.
We believe that our current cash and cash equivalents, future cash flows from operations and borrowings under our credit facility will provide adequate liquidity to fund anticipated short-term and long-term operating activities. However, in the event we make significant cash expenditures in the future for major acquisitions or other unanticipated activities, we may require more liquidity than is currently available to us under our credit facility and may need to raise additional funds through debt or equity financing, as appropriate. In addition, if our lenders are not able to fund their commitments due to disruptions in the financial markets or otherwise, our liquidity could be negatively impacted.
35
Off-balance Sheet Arrangements
We do not maintain any off-balance sheet arrangements, transactions, obligations or other relationships with unconsolidated entities that would be expected to have a material current or future impact on our financial condition or results of operations.
Critical Accounting Policies
The preparation of the financial statements requires management to make estimates and assumptions that affect amounts reported therein. We base our estimates on historical experience and on various assumptions that are believed to be reasonable under the circumstances, the results of which form the basis for making judgments about the carrying values of assets and liabilities that are not readily apparent from other sources. Actual results may differ from these estimates under different assumptions or conditions. We believe the following critical accounting policies affect our more significant judgments and estimates used in the preparation of our consolidated financial statements:
Revenue Recognition
We recognize revenues when evidence of an arrangement exists, the price of work is fixed or determinable, work is performed and collectability is reasonably assured. We generate the majority of our revenues from providing services under the following types of arrangements: time and material, fixed-fee, units of production and event or performance-based.
For our time and material arrangements, revenue is recognized based on the number of hours worked by our Client-Service FTE at the contracted bill rates. In some cases, our time and materials engagements are subject to a maximum fee amount not to be exceeded, in which case we periodically evaluate the progress of work performed to ensure that the maximum amount billable to the client is not expected to be exceeded. Additionally, revenue is recognized on our units of production arrangements in a similar manner based on measures such as the number of items processed at agreed-upon rates.
With our fixed-fee arrangements, we are contracted to complete a pre-determined set of professional services for a pre-determined fee. However, the fee and engagement scope can be adjusted based on a mutual agreement between us and the client. In many cases, the recording of fixed revenue amounts requires us to make an estimate of the total amount of work to be performed, and revenues are then recognized as efforts are expended based on hours worked unless another method such as output or straight-line is more representative of revenue earned.
We also have certain arrangements in which the fees are dependent on the completion of contractually defined outcomes. In many cases, this fee is earned in addition to an hourly or fixed-fee, but is not recognized until certain contractual milestones or outcomes are met. Contractually defined outcomes may be event-based (for example the completion of a deal for our client) or performance-based (for example based on obtaining a key performance indicator). Variations in our quarterly or yearly revenues and resulting operating profit margins may occur depending on the timing of such contractual outcomes and our ability to consider these revenues earned and realized.
We may provide multiple deliverables under the terms of one or multiple arrangements. Arrangements under these scenarios are evaluated in order to determine whether one or more units of accounting are present and revenue is allocated appropriately to each unit of accounting.
Reimbursable expenses for our engagements include travel, out-of-pocket and independent contractor costs. Such expenses are passed through to clients as contractually allowed. Typically, reimbursable expenses are recognized as revenue during the period in which the expenses are incurred.
Revenues recognized for services performed but not yet billed are recorded as engagements in process within accounts receivable. Advance payments and retainers are recorded as deferred revenue within other current liabilities and are recognized as services are provided. Any taxes assessed on revenues relating to services provided to our clients are recorded on a net basis.
Business Combinations
We recognize and measure identifiable assets acquired, liabilities assumed and any non-controlling interest in the acquiree as of the acquisition date at fair value. Fair value measurements require extensive use of estimates and assumptions, including estimates of future cash flows to be generated by the acquired assets. In addition, we recognize and measure contingent consideration at fair value as of the acquisition date. Contingent consideration obligations that are classified as liabilities are remeasured at fair value each reporting period with the changes in fair value resulting from either the passage of time, revised expectations of performance, or ultimate settlement to the amount or timing of the initial measurement recognized in the consolidated statements of comprehensive income.
36
Goodwill and Intangible Assets
Goodwill represents the difference between the purchase price of the acquired business and the related fair value of the net assets acquired, which is accounted for by the acquisition method of accounting. Intangible assets consist of identifiable intangibles other than goodwill. Identifiable intangible assets other than goodwill include customer lists and relationships, employee non-compete agreements, backlog revenue and trade names. These assets are subject to changes in events or circumstances that could impact their carrying value.
Goodwill is tested for impairment annually during the second quarter. In addition to our annual goodwill test, on a periodic basis, we are required to consider whether it is more likely than not that the fair value has fallen below the carrying amount of an asset, thus requiring us to perform an interim goodwill impairment test. We consider elements and other factors including, but not limited to:
|
|
• |
adverse changes in the business climate in which we operate; |
|
|
• |
attrition of key personnel; |
|
|
• |
unanticipated competition; |
|
|
• |
our market capitalization in comparison to our book value; |
|
|
• |
our recent operating performance; and/or |
|
|
• |
our financial projections. |
The goodwill impairment test is performed at a reporting unit level. A reporting unit, as defined by Accounting Standards Codification 350 (“ASC 350”), is an operating segment of a business or one level below if discrete financial information is available and regularly reviewed by segment management. At December 31, 2017, we had four operating segments which are also considered to be our reporting units, as follows: Healthcare, Energy, Financial Services Advisory and Compliance, and Disputes, Forensics and Legal Technology.
Financial Accounting Standards Board Accounting Standards Update (“ASU”) No. 2011-08, “Intangibles — Goodwill and Other (Topic 350): Testing Goodwill for Impairment” (“ASU Topic 350”) requires an entity to perform an annual assessment to determine whether goodwill is impaired. We performed a quantitative impairment test that compares the fair value of the reporting unit to its carrying value. The fair value is determined using a discounted cash flow analysis (“income approach”) and a comparable company analysis (“market approach”).
We determine the fair value of a reporting unit by using an equal weighting of estimated fair value using the income and market approaches. The income approach uses estimated future cash flows and terminal values. Assumptions used to determine future cash flows include: forecasted growth rates; profit margins; longer-term historical performance and cost of capital. Our assumptions are consistent with our internal projections and operating plans. Our internal projections and operating plans and thus our estimated fair value may be impacted by the overall economic environment. Our assumptions may change as a result of, among other things: changes in our estimated business future growth rate; profit margin; long-term outlook; market valuations of comparable companies; the ability to retain key personnel; changes in operating segments; competitive environment and weighted average cost of capital. Under the market approach for determining fair value, we adopt certain assumptions that market participants would use in pricing the asset or liability, including assumptions about risk or the risks inherent in the inputs to the valuation. Inputs to the valuation can be readily observable, market-corroborated or unobservable. Wherever possible, we use valuation techniques that maximize the use of observable inputs and minimize the use of unobservable inputs; however, due to the use of our own assumptions about the inputs in measuring fair value, our goodwill impairment testing also makes use of significant unobservable inputs. The fair value of our reporting units is also impacted by our overall market capitalization and may be impacted by volatility in our stock price and assumed control premium, among other things.
If the carrying value exceeds the fair value, an impairment charge is recorded to reduce the carrying value to the implied fair value.
Intangible assets with definite lives are amortized based on the estimated period of consumption. Changes in these estimations may result in additional or accelerated amortization expense. We review these assets for impairment whenever events or changes in circumstances indicate an asset’s carrying value may not be recoverable.
Further information regarding our goodwill balances and current year impairment testing and review can be found in Note 5 — Goodwill and Intangible Assets, Net to the notes to our consolidated financial statements.
37
Our income tax expense, deferred tax assets and liabilities, and reserves for unrecognized tax benefits reflect management’s best assessment of estimated future taxes to be paid. We are subject to income taxes in the U.S. and a number of foreign jurisdictions. Significant judgments and estimates are required in determining the consolidated income tax expense.
Deferred income tax assets and liabilities are recorded for future tax consequences attributable to temporary differences between the financial statement carrying amounts of existing assets and liabilities and their respective tax bases. In evaluating our ability to recover our deferred tax assets within the jurisdiction from which they arise, we consider all available positive and negative evidence, including scheduled reversals of deferred tax liabilities, projected future taxable income, tax-planning strategies, and results of recent operations.
On December 22, 2017, the President of the United States signed into law Tax Reform. The legislation significantly changes U.S. tax law by, among other things, lowering corporate income tax rates, implementing a territorial tax system and imposing a repatriation tax on deemed repatriated earnings of foreign subsidiaries. Tax Reform permanently reduces the U.S. corporate income tax rate from a maximum of 35% to a flat 21% rate, effective January 1, 2018.
On December 22, 2017, the SEC staff issued Staff Accounting Bulletin No. 118 (“SAB 118”) to address the application of U.S. GAAP in situations when a registrant does not have the necessary information available, prepared, or analyzed (including computations) in reasonable detail to complete the accounting for certain income tax effects of Tax Reform. We recognized the provisional tax impacts related to deemed repatriated earnings and the revaluation of deferred tax assets and liabilities and included these amounts in our consolidated financial statements for the year ended December 31, 2017. The ultimate impact may differ from these provisional amounts, possibly materially, due to, among other things, additional analysis, changes in interpretations and assumptions we made, additional regulatory guidance that may be issued, and actions we may take as a result of Tax Reform. The accounting is expected to be complete when our 2017 U.S. corporate income tax return is filed in 2018. (See Note 15 – Income Taxes to the notes to our consolidated financial statements.)
Recent Accounting Pronouncements
See Note 2 – Summary of Significant Accounting Policies to the notes to our consolidated financial statements for further information on our accounting policies and recent accounting pronouncements.
Our primary exposure to market risk relates to changes in interest rates and foreign currencies. The interest rate risk is associated with borrowings under our credit facility and our investment portfolio, classified as cash equivalents. The foreign currency risk is associated with our operations in foreign countries.
Borrowings under our credit facility bear interest, in general, based on a variable rate equal to an applicable base rate (equal to the higher of a reference prime rate or one half of one percent above the federal funds rate) or LIBOR, in each case plus an applicable margin. We are exposed to interest rate risk relating to the fluctuations in LIBOR. We use interest rate swap agreements to manage our exposure to fluctuations in LIBOR.
At December 31, 2017, our interest rate derivatives effectively fixed our LIBOR base rate on $37.5 million of our debt. Based on borrowings under our credit facility at December 31, 2017 and after giving effect to the impact of our interest rate derivatives, our interest rate exposure was limited to $95.4 million of debt, and each quarter point change in market interest rates would have resulted in approximately a $0.2 million change in annual interest expense.
At December 31, 2017, our cash equivalents were primarily limited to money market accounts or ‘A’ rated securities, with maturity dates of 90 days or less. These financial instruments are subject to interest rate risk and will decline in value if interest rates rise. Because of the short periods to maturity of these instruments, an increase in interest rates would not have a material effect on our financial position or results of operations.
We operate in various foreign countries, which exposes us to market risk associated with foreign currency exchange rate fluctuations. At December 31, 2017, we had net assets of approximately $32.7 million with a functional currency of the U.K. Pound Sterling and $12.6 million with a functional currency of the Canadian Dollar and $8.8 million with a functional currency of the Euro related to our non-U.S. operations. At December 31, 2017, we had net liabilities denominated in non-functional currencies of approximately $8.9 million. As such, a ten percent change in the value of the local currencies would have resulted in a $0.9 million foreign currency gain or loss in our results of operations. Excess cash balances held outside the U.S. are immaterial to our overall financial position, and therefore, we have limited exposure to repatriating funds back to the U.S.
38
Our consolidated financial statements are in this report as pages F-3 through F-32 An index to such information appears on page F-1.
None.
|
(1) |
Evaluation of Disclosure Controls and Procedures |
We maintain disclosure controls and procedures (as defined in Rules 13a-15(e) and 15d-15(e) of the Securities Exchange Act of 1934 (“Exchange Act”)) that are designed to ensure that information required to be disclosed in our reports filed or submitted under the Exchange Act is recorded, processed, summarized and reported within the time frames specified in SEC rules and forms, and that such information is accumulated and communicated to our management, including our principal executive officer and principal financial officer, as appropriate, to allow timely decisions regarding required disclosure. Any system of controls and procedures, no matter how well designed and operated, can provide only reasonable assurance of achieving the desired control objectives.
An evaluation of the effectiveness of the design and operation of the disclosure controls and procedures, as of the end of the period covered by this report, was made under the supervision and with the participation of our management including our principal executive officer and principal financial officer. Based upon this evaluation, our principal executive officer and principal financial officer have concluded that our disclosure controls and procedures were effective.
|
(2) |
Management’s Annual Report on Internal Control over Financial Reporting |
Our management is responsible for establishing and maintaining adequate internal control over financial reporting (as defined in Exchange Act Rules 13a-15(f) and 15d-15(f)). Because of its inherent limitations, internal control over financial reporting may not prevent or detect misstatements. Also, projections of any evaluation of effectiveness to future periods are subject to the risk that controls may become inadequate because of changes in conditions, or that the degree of compliance with the policies or procedures may deteriorate.
Management conducted an evaluation of the effectiveness of our internal control over financial reporting at December 31, 2017 based on the framework published by the Committee of Sponsoring Organizations of the Treadway Commission, Internal Control — Integrated Framework (2013). In the course of its evaluation, management concluded that we maintained effective control over financial reporting at December 31, 2017.
KPMG LLP, the independent registered public accounting firm that audited our consolidated financial statements included in this report, has issued a report on our internal control over financial reporting. See “Report of Independent Registered Public Accounting Firm” on page F-2.
|
(3) |
Changes in Internal Control over Financial Reporting |
There has been no change in our internal control over financial reporting during the fourth quarter of 2017 that has materially affected, or is reasonably likely to materially affect, our internal control over financial reporting.
None.
39
Report of Independent Registered Public Accounting Firm
To the stockholders and board of directors
Navigant Consulting, Inc.:
Opinion on Internal Control Over Financial Reporting
We have audited Navigant Consulting, Inc. and subsidiaries’ (the Company) internal control over financial reporting as of December 31, 2017, based on criteria established in Internal Control – Integrated Framework (2013) issued by the Committee of Sponsoring Organizations of the Treadway Commission. In our opinion, the Company maintained, in all material respects, effective internal control over financial reporting as of December 31, 2017, based on criteria established in Internal Control – Integrated Framework (2013) issued by the Committee of Sponsoring Organizations of the Treadway Commission.
We also have audited, in accordance with the standards of the Public Company Accounting Oversight Board (United States) (PCAOB), the consolidated balance sheets of the Company as of December 31, 2017 and 2016, the related consolidated statements of comprehensive income, stockholders’ equity, and cash flows for each of the years in the three-year period ended December 31, 2017, and the related notes and financial statement schedule as listed in the accompanying index (collectively, the consolidated financial statements), and our report dated February 23, 2018 expressed an unqualified opinion on those consolidated financial statements.
Basis for Opinion
The Company’s management is responsible for maintaining effective internal control over financial reporting and for its assessment of the effectiveness of internal control over financial reporting, included in the accompanying Management’s Annual Report on Internal Controls over Financial Reporting. Our responsibility is to express an opinion on the Company’s internal control over financial reporting based on our audit. We are a public accounting firm registered with the PCAOB and are required to be independent with respect to the Company in accordance with the U.S. federal securities laws and the applicable rules and regulations of the Securities and Exchange Commission and the PCAOB.
We conducted our audit in accordance with the standards of the PCAOB. Those standards require that we plan and perform the audit to obtain reasonable assurance about whether effective internal control over financial reporting was maintained in all material respects. Our audit of internal control over financial reporting included obtaining an understanding of internal control over financial reporting, assessing the risk that a material weakness exists, and testing and evaluating the design and operating effectiveness of internal control based on the assessed risk. Our audit also included performing such other procedures as we considered necessary in the circumstances. We believe that our audit provides a reasonable basis for our opinion.
Definition and Limitations of Internal Control Over Financial Reporting
A company’s internal control over financial reporting is a process designed to provide reasonable assurance regarding the reliability of financial reporting and the preparation of financial statements for external purposes in accordance with generally accepted accounting principles. A company’s internal control over financial reporting includes those policies and procedures that (1) pertain to the maintenance of records that, in reasonable detail, accurately and fairly reflect the transactions and dispositions of the assets of the company; (2) provide reasonable assurance that transactions are recorded as necessary to permit preparation of financial statements in accordance with generally accepted accounting principles, and that receipts and expenditures of the company are being made only in accordance with authorizations of management and directors of the company; and (3) provide reasonable assurance regarding prevention or timely detection of unauthorized acquisition, use, or disposition of the company’s assets that could have a material effect on the financial statements.
Because of its inherent limitations, internal control over financial reporting may not prevent or detect misstatements. Also, projections of any evaluation of effectiveness to future periods are subject to the risk that controls may become inadequate because of changes in conditions, or that the degree of compliance with the policies or procedures may deteriorate.
(signed) KPMG LLP
Chicago, Illinois
February 23, 2018
40
Certain information required by this Item will be included under the headings “Election of Directors,” “Corporate Governance” and “Section 16(a) Beneficial Ownership Reporting Compliance” in the definitive proxy statement for our annual meeting of shareholders (“2018 Proxy Statement”) and is incorporated herein by reference.
See “Executive Officers of the Registrant” in Part I of this report for information regarding our executive officers.
The information under the headings “Compensation Discussion and Analysis,” “Compensation Committee Report,” “Executive Compensation,” “Director Compensation” and “Compensation Committee Interlocks and Insider Participation” in the 2018 Proxy Statement is incorporated herein by reference.
|
Item 12. |
Security Ownership of Certain Beneficial Owners and Management and Related Stockholder Matters. |
Certain information required by this Item will be included under the headings “Stock Ownership of Directors, Executive Officers and Principal Holders” and “Securities Authorized for Issuance Under Equity Compensation Plans” in the 2018 Proxy Statement and is incorporated herein by reference.
The information under the headings “Corporate Governance” and “Certain Relationships and Related Party Transactions” in the 2018 Proxy Statement is incorporated herein by reference.
The information under the heading “Independent Registered Public Accounting Firm” in the 2018 Proxy Statement is incorporated herein by reference.
41
(a) The consolidated financial statements and financial statement schedule filed as part of this report are listed in the accompanying Index to the Consolidated Financial Statements.
(b) The exhibits filed as part of this report are listed below:
Exhibits:
|
Exhibit No. |
|
Description |
|
|
|
|
|
2.1 |
|
|
|
|
|
|
|
2.2 |
|
|
|
|
|
|
|
2.3 |
|
|
|
|
|
|
|
3.1 |
|
|
|
|
|
|
|
3.2 |
|
|
|
|
|
|
|
3.3 |
|
|
|
|
|
|
|
10.1† |
|
|
|
|
|
|
|
10.2† |
|
|
|
|
|
|
|
10.3† |
|
|
|
|
|
|
|
10.4† |
|
|
|
|
|
|
|
10.5† |
|
|
|
|
|
|
|
10.6† |
|
|
|
10.7† |
|
|
|
|
|
|
|
10.8† |
|
|
|
|
|
|
|
10.9† |
|
|
|
|
|
|
|
10.10† |
|
42
|
Exhibit No. |
|
Description |
|
|
|
|
|
|
|
|
|
10.11† |
|
|
|
|
|
|
|
10.12† |
|
|
|
|
|
|
|
10.13† |
|
|
|
|
|
|
|
10.14† |
|
|
|
|
|
|
|
10.15† |
|
|
|
|
|
|
|
10.16† |
|
|
|
|
|
|
|
10.17† |
|
|
|
|
|
|
|
10.18† |
|
|
|
|
|
|
|
10.19† |
|
|
|
|
|
|
|
10.20† |
|
|
|
|
|
|
|
10.21† |
|
|
|
|
|
|
|
10.22† |
|
|
|
|
|
|
|
10.23† |
|
|
|
|
|
|
|
10.24† |
|
|
|
|
|
|
|
10.25† |
|
|
|
|
|
|
|
10.26† |
|
|
|
|
|
|
|
10.27† |
|
|
|
|
|
|
|
10.28† |
|
|
|
|
|
|
|
10.29 |
|
|
|
21.1 |
|
43
|
Exhibit No. |
|
Description |
|
|
|
|
|
|
|
|
|
23.1 |
|
|
|
|
|
|
|
31.1 |
|
Certification of Chief Executive Officer required by Rule 13a-14(a) of the Exchange Act. |
|
|
|
|
|
31.2 |
|
Certification of Chief Financial Officer required by Rule 13a-14(a) of the Exchange Act. |
|
|
|
|
|
32.1 |
|
|
|
|
|
|
|
101 |
|
Interactive Data File. |
|
† |
Indicates a management contract or compensatory plan or arrangement. |
44
Pursuant to the requirements of Section 13 or 15(d) of the Securities Exchange Act of 1934, the Registrant has duly caused this report to be signed on its behalf by the undersigned, thereunto duly authorized.
|
Navigant Consulting, Inc. |
|
|
|
/s/ JULIE M. HOWARD |
|
Julie M. Howard |
|
Chairman and Chief Executive Officer |
Date: February 23, 2018
Pursuant to the requirements of the Securities Exchange Act of 1934, this report has been signed below by the following persons on behalf of the Registrant and in the capacity and on the dates indicated.
|
Signature |
|
Title |
|
Date |
|
|
|
|
|
|
|
/s/ JULIE M. HOWARD Julie M. Howard |
|
Chairman and Chief Executive Officer and Director (Principal Executive Officer) |
|
February 23, 2018 |
|
|
|
|
|
|
|
/s/ STEPHEN R. LIEBERMAN Stephen R. Lieberman |
|
Executive Vice President and Chief Financial Officer (Principal Financial Officer) |
|
February 23, 2018 |
|
|
|
|
|
|
|
/s/ SCOTT S. HARPER Scott S. Harper |
|
Vice President and Controller (Principal Accounting Officer) |
|
February 23, 2018 |
|
|
|
|
|
|
|
/s/ KEVIN M. BLAKELY Kevin M. Blakely |
|
Director |
|
February 23, 2018 |
|
|
|
|
|
|
|
/s/ CYNTHIA A. GLASSMAN Hon. Cynthia A. Glassman |
|
Director |
|
February 23, 2018 |
|
|
|
|
|
|
|
/s/ STEPHAN A. JAMES Stephan A. James |
|
Director |
|
February 23, 2018 |
|
|
|
|
|
|
|
/s/ SAMUEL K. SKINNER Samuel K. Skinner |
|
Director |
|
February 23, 2018 |
|
|
|
|
|
|
|
/s/ JAMES R. THOMPSON Governor James R. Thompson |
|
Director |
|
February 23, 2018 |
|
|
|
|
|
|
|
/s/ MICHAEL L. TIPSORD Michael L. Tipsord |
|
Director |
|
February 23, 2018 |
|
|
|
|
|
|
|
/s/ KATHLEEN E. WALSH Kathleen E. Walsh |
|
Director |
|
February 23, 2018 |
|
|
|
|
|
|
|
Randy H. Zwirn |
|
Director |
|
February 23, 2018 |
45
NAVIGANT CONSULTING, INC. AND SUBSIDIARIES
INDEX TO THE CONSOLIDATED FINANCIAL STATEMENTS
|
|
Page |
|
F-2 |
|
|
Consolidated Financial Statements at December 31, 2017 and 2016, and for each of the years in the three-year period ended December 31, 2017: |
|
|
F-3 |
|
|
F-4 |
|
|
F-5 |
|
|
F-6 |
|
|
F-7 |
|
|
F-7 |
|
|
F-7 |
|
|
F-14 |
|
|
F-15 |
|
|
F-17 |
|
|
F-19 |
|
|
F-19 |
|
|
F-19 |
|
|
F-23 |
|
|
F-25 |
|
|
F-25 |
|
|
F-25 |
|
|
F-26 |
|
|
F-27 |
|
|
F-28 |
|
|
F-31 |
|
|
F-32 |
|
|
F-32 |
|
|
Financial Statement Schedule — |
|
|
S-1 |
F-1
Report of Independent Registered Public Accounting Firm
To the stockholders and board of directors
Navigant Consulting, Inc.:
Opinion on the Consolidated Financial Statements
We have audited the accompanying consolidated balance sheets of Navigant Consulting, Inc. and subsidiaries (the Company) as of December 31, 2017 and 2016, the related consolidated statements of comprehensive income, stockholders’ equity, and cash flows for each of the years in the three‑year period ended December 31, 2017, and the related notes and financial statement schedule as listed in the accompanying index (collectively, the consolidated financial statements). In our opinion, the consolidated financial statements present fairly, in all material respects, the financial position of the Company as of December 31, 2017 and 2016, and the results of its operations and its cash flows for each of the years in the three‑year period ended December 31, 2017, in conformity with U.S. generally accepted accounting principles.
We also have audited, in accordance with the standards of the Public Company Accounting Oversight Board (United States) (PCAOB), the Company’s internal control over financial reporting as of December 31, 2017, based on criteria established in Internal Control – Integrated Framework (2013) issued by the Committee of Sponsoring Organizations of the Treadway Commission, and our report dated February 23, 2018 expressed an unqualified opinion on the effectiveness of the Company’s internal control over financial reporting.
Basis for Opinion
These consolidated financial statements are the responsibility of the Company’s management. Our responsibility is to express an opinion on these consolidated financial statements based on our audits. We are a public accounting firm registered with the PCAOB and are required to be independent with respect to the Company in accordance with the U.S. federal securities laws and the applicable rules and regulations of the Securities and Exchange Commission and the PCAOB.
We conducted our audits in accordance with the standards of the PCAOB. Those standards require that we plan and perform the audit to obtain reasonable assurance about whether the consolidated financial statements are free of material misstatement, whether due to error or fraud. Our audits included performing procedures to assess the risks of material misstatement of the consolidated financial statements, whether due to error or fraud, and performing procedures that respond to those risks. Such procedures included examining, on a test basis, evidence regarding the amounts and disclosures in the consolidated financial statements. Our audits also included evaluating the accounting principles used and significant estimates made by management, as well as evaluating the overall presentation of the consolidated financial statements. We believe that our audits provide a reasonable basis for our opinion.
(signed) KPMG LLP
We have served as the Company’s auditor since 1996.
Chicago, Illinois
February 23, 2018
F-2
NAVIGANT CONSULTING, INC. AND SUBSIDIARIES
(In thousands, except per share data)
|
|
December 31, |
|
|
December 31, |
|
||||
|
|
2017 |
|
|
2016 |
|
||||
|
ASSETS |
|
|
|
|
|
|
|
|
|
|
Current assets: |
|
|
|
|
|
|
|
|
|
|
Cash and cash equivalents |
$ |
|
8,449 |
|
|
$ |
|
8,291 |
|
|
Accounts receivable, net |
|
|
267,841 |
|
|
|
|
261,755 |
|
|
Prepaid expenses and other current assets |
|
|
32,921 |
|
|
|
|
29,762 |
|
|
Total current assets |
|
|
309,211 |
|
|
|
|
299,808 |
|
|
Non-current assets: |
|
|
|
|
|
|
|
|
|
|
Property and equipment, net |
|
|
89,169 |
|
|
|
|
82,953 |
|
|
Intangible assets, net |
|
|
21,053 |
|
|
|
|
28,727 |
|
|
Goodwill |
|
|
637,287 |
|
|
|
|
625,027 |
|
|
Other assets |
|
|
23,544 |
|
|
|
|
18,282 |
|
|
Total assets |
$ |
|
1,080,264 |
|
|
$ |
|
1,054,797 |
|
|
LIABILITIES AND STOCKHOLDERS' EQUITY |
|
|
|
|
|
|
|
|
|
|
Current liabilities: |
|
|
|
|
|
|
|
|
|
|
Accounts payable |
$ |
|
12,398 |
|
|
$ |
|
11,871 |
|
|
Accrued liabilities |
|
|
13,895 |
|
|
|
|
16,144 |
|
|
Accrued compensation-related costs |
|
|
96,773 |
|
|
|
|
106,779 |
|
|
Income tax payable |
|
|
4,720 |
|
|
|
|
1,564 |
|
|
Other current liabilities |
|
|
38,895 |
|
|
|
|
38,616 |
|
|
Total current liabilities |
|
|
166,681 |
|
|
|
|
174,974 |
|
|
Non-current liabilities: |
|
|
|
|
|
|
|
|
|
|
Deferred income tax liabilities |
|
|
61,131 |
|
|
|
|
77,737 |
|
|
Other non-current liabilities |
|
|
32,174 |
|
|
|
|
32,579 |
|
|
Bank debt non-current |
|
|
132,944 |
|
|
|
|
135,030 |
|
|
Total non-current liabilities |
|
|
226,249 |
|
|
|
|
245,346 |
|
|
Total liabilities |
|
|
392,930 |
|
|
|
|
420,320 |
|
|
Stockholders' equity: |
|
|
|
|
|
|
|
|
|
|
Common stock, $0.001 par value per share; 150,000 shares authorized; 58,047 and 57,325 shares issued as of December 31, 2017 and 2016, respectively |
|
|
58 |
|
|
|
|
57 |
|
|
Additional paid-in capital |
|
|
659,825 |
|
|
|
|
644,519 |
|
|
Treasury stock, 12,661 and 10,339 shares as of December 31, 2017 and 2016, respectively |
|
|
(224,366 |
) |
|
|
|
(181,361 |
) |
|
Retained earnings |
|
|
270,995 |
|
|
|
|
196,468 |
|
|
Accumulated other comprehensive loss |
|
|
(19,178 |
) |
|
|
|
(25,206 |
) |
|
Total stockholders' equity |
|
|
687,334 |
|
|
|
|
634,477 |
|
|
Total liabilities and stockholders' equity |
$ |
|
1,080,264 |
|
|
$ |
|
1,054,797 |
|
See accompanying notes to consolidated financial statements.
F-3
NAVIGANT CONSULTING, INC. AND SUBSIDIARIES
CONSOLIDATED STATEMENTS OF COMPREHENSIVE INCOME
(In thousands, except per share data)
|
|
|
For the year ended |
|
||||||||||||
|
|
|
December 31, |
|
||||||||||||
|
|
|
2017 |
|
|
2016 |
|
|
2015 |
|
||||||
|
Revenues before reimbursements |
|
$ |
|
939,639 |
|
|
$ |
|
938,746 |
|
|
$ |
|
833,808 |
|
|
Reimbursements |
|
|
|
92,688 |
|
|
|
|
95,734 |
|
|
|
|
85,678 |
|
|
Total revenues |
|
|
|
1,032,327 |
|
|
|
|
1,034,480 |
|
|
|
|
919,486 |
|
|
Cost of services before reimbursable expenses |
|
|
|
654,586 |
|
|
|
|
631,935 |
|
|
|
|
571,894 |
|
|
Reimbursable expenses |
|
|
|
92,688 |
|
|
|
|
95,734 |
|
|
|
|
85,678 |
|
|
Total cost of services |
|
|
|
747,274 |
|
|
|
|
727,669 |
|
|
|
|
657,572 |
|
|
General and administrative expenses |
|
|
|
166,922 |
|
|
|
|
168,954 |
|
|
|
|
147,462 |
|
|
Depreciation expense |
|
|
|
28,826 |
|
|
|
|
27,742 |
|
|
|
|
23,612 |
|
|
Amortization expense |
|
|
|
8,960 |
|
|
|
|
11,507 |
|
|
|
|
8,613 |
|
|
Other operating costs (benefit): |
|
|
|
|
|
|
|
|
|
|
|
|
|
|
|
|
Contingent acquisition liability adjustments, net |
|
|
|
2,213 |
|
|
|
|
1,330 |
|
|
|
|
(13,047 |
) |
|
Office consolidation, net |
|
|
|
242 |
|
|
|
|
542 |
|
|
|
|
2,766 |
|
|
Loss on disposition of assets |
|
|
|
- |
|
|
|
|
- |
|
|
|
|
283 |
|
|
Deferred debt issuance costs write off |
|
|
|
145 |
|
|
|
|
- |
|
|
|
|
- |
|
|
Other impairment |
|
|
|
- |
|
|
|
|
- |
|
|
|
|
98 |
|
|
Other costs |
|
|
|
1,620 |
|
|
|
|
- |
|
|
|
|
- |
|
|
Operating income |
|
|
|
76,125 |
|
|
|
|
96,736 |
|
|
|
|
92,127 |
|
|
Interest expense |
|
|
|
4,970 |
|
|
|
|
5,235 |
|
|
|
|
4,916 |
|
|
Interest income |
|
|
|
(345 |
) |
|
|
|
(141 |
) |
|
|
|
(250 |
) |
|
Other (income) expense, net |
|
|
|
919 |
|
|
|
|
(1,769 |
) |
|
|
|
(692 |
) |
|
Income before income tax expense |
|
|
|
70,581 |
|
|
|
|
93,411 |
|
|
|
|
88,153 |
|
|
Income tax (benefit) expense |
|
|
|
(4,371 |
) |
|
|
|
35,313 |
|
|
|
|
27,808 |
|
|
Net income |
|
$ |
|
74,952 |
|
|
$ |
|
58,098 |
|
|
$ |
|
60,345 |
|
|
Basic net income per share |
|
$ |
|
1.61 |
|
|
$ |
|
1.23 |
|
|
$ |
|
1.26 |
|
|
Shares used in computing basic per share data |
|
|
|
46,593 |
|
|
|
|
47,343 |
|
|
|
|
47,906 |
|
|
Diluted net income per share |
|
$ |
|
1.55 |
|
|
$ |
|
1.19 |
|
|
$ |
|
1.23 |
|
|
Shares used in computing diluted per share data |
|
|
|
48,226 |
|
|
|
|
48,813 |
|
|
|
|
49,224 |
|
|
Net income |
|
$ |
|
74,952 |
|
|
$ |
|
58,098 |
|
|
$ |
|
60,345 |
|
|
Other comprehensive income (loss), net of tax |
|
|
|
|
|
|
|
|
|
|
|
|
|
|
|
|
Unrealized net gain (loss), foreign currency translation |
|
|
|
5,858 |
|
|
|
|
(8,720 |
) |
|
|
|
(4,473 |
) |
|
Unrealized net gain (loss) on interest rate derivatives |
|
|
|
100 |
|
|
|
|
(72 |
) |
|
|
|
(317 |
) |
|
Reclassification adjustment on interest rate derivatives included in interest expense and income tax expense |
|
|
|
70 |
|
|
|
|
146 |
|
|
|
|
314 |
|
|
Other comprehensive gain (loss), net of tax |
|
|
|
6,028 |
|
|
|
|
(8,646 |
) |
|
|
|
(4,476 |
) |
|
Total comprehensive income, net of tax |
|
$ |
|
80,980 |
|
|
$ |
|
49,452 |
|
|
$ |
|
55,869 |
|
See accompanying notes to consolidated financial statements.
F-4
NAVIGANT CONSULTING, INC. AND SUBSIDIARIES
CONSOLIDATED STATEMENTS OF STOCKHOLDERS’ EQUITY
(In thousands)
|
|
|
Common Stock Shares |
|
|
Treasury Stock Shares |
|
|
Common Stock Par Value |
|
|
Additional Paid-In Capital |
|
|
Treasury Stock Cost |
|
|
Accumulated Other Comprehensive Income (Loss) |
|
|
Retained Earnings |
|
|
Total Stock-holders' Equity |
|
||||||||
|
Balance at December 31, 2014 |
|
|
63,708 |
|
|
|
(15,491 |
) |
|
$ |
64 |
|
|
$ |
611,882 |
|
|
$ |
(275,608 |
) |
|
$ |
(12,084 |
) |
|
$ |
218,337 |
|
|
$ |
542,591 |
|
|
Comprehensive income (loss) |
|
|
- |
|
|
|
- |
|
|
|
- |
|
|
|
- |
|
|
|
- |
|
|
|
(4,476 |
) |
|
|
60,345 |
|
|
|
55,869 |
|
|
Issuances of common stock related to business combinations |
|
|
- |
|
|
|
177 |
|
|
|
- |
|
|
|
- |
|
|
|
3,000 |
|
|
|
- |
|
|
|
- |
|
|
|
3,000 |
|
|
Issuances of common stock |
|
|
488 |
|
|
|
- |
|
|
|
- |
|
|
|
5,974 |
|
|
|
- |
|
|
|
- |
|
|
|
- |
|
|
|
5,974 |
|
|
Tax benefits on stock options exercised and restricted stock units vested |
|
|
- |
|
|
|
- |
|
|
|
- |
|
|
|
311 |
|
|
|
- |
|
|
|
- |
|
|
|
- |
|
|
|
311 |
|
|
Vesting of restricted stock and restricted stock units, net of forfeitures and tax withholdings |
|
|
269 |
|
|
|
- |
|
|
|
- |
|
|
|
(1,811 |
) |
|
|
5 |
|
|
|
- |
|
|
|
- |
|
|
|
(1,806 |
) |
|
Share-based compensation expense |
|
|
- |
|
|
|
- |
|
|
|
- |
|
|
|
10,328 |
|
|
|
- |
|
|
|
- |
|
|
|
- |
|
|
|
10,328 |
|
|
Additional paid-in capital recorded through compensation expense |
|
|
- |
|
|
|
- |
|
|
|
- |
|
|
|
1,292 |
|
|
|
- |
|
|
|
- |
|
|
|
- |
|
|
|
1,292 |
|
|
Repurchases of common stock |
|
|
- |
|
|
|
(1,589 |
) |
|
|
- |
|
|
|
- |
|
|
|
(24,021 |
) |
|
|
- |
|
|
|
- |
|
|
|
(24,021 |
) |
|
Balance at December 31, 2015 |
|
|
64,465 |
|
|
|
(16,903 |
) |
|
$ |
64 |
|
|
$ |
627,976 |
|
|
$ |
(296,624 |
) |
|
$ |
(16,560 |
) |
|
$ |
278,682 |
|
|
$ |
593,538 |
|
|
Comprehensive income (loss) |
|
|
- |
|
|
|
- |
|
|
|
- |
|
|
|
- |
|
|
|
- |
|
|
|
(8,646 |
) |
|
|
58,098 |
|
|
|
49,452 |
|
|
Issuances of common stock |
|
|
290 |
|
|
|
- |
|
|
|
- |
|
|
|
4,299 |
|
|
|
- |
|
|
|
- |
|
|
|
- |
|
|
|
4,299 |
|
|
Tax benefits on stock options exercised and restricted stock units vested |
|
|
- |
|
|
|
- |
|
|
|
- |
|
|
|
1,218 |
|
|
|
- |
|
|
|
- |
|
|
|
- |
|
|
|
1,218 |
|
|
Vesting of restricted stock units, net of forfeitures and tax withholdings |
|
|
570 |
|
|
|
- |
|
|
|
1 |
|
|
|
(3,983 |
) |
|
|
- |
|
|
|
- |
|
|
|
- |
|
|
|
(3,982 |
) |
|
Share-based compensation expense |
|
|
- |
|
|
|
- |
|
|
|
- |
|
|
|
13,071 |
|
|
|
- |
|
|
|
- |
|
|
|
- |
|
|
|
13,071 |
|
|
Additional paid-in capital recorded through compensation expense |
|
|
- |
|
|
|
- |
|
|
|
- |
|
|
|
1,938 |
|
|
|
- |
|
|
|
- |
|
|
|
- |
|
|
|
1,938 |
|
|
Repurchases of common stock |
|
|
- |
|
|
|
(1,436 |
) |
|
|
- |
|
|
|
- |
|
|
|
(25,057 |
) |
|
|
- |
|
|
|
- |
|
|
|
(25,057 |
) |
|
Treasury stock retirement |
|
|
(8,000 |
) |
|
|
8,000 |
|
|
|
(8 |
) |
|
|
- |
|
|
|
140,320 |
|
|
|
- |
|
|
|
(140,312 |
) |
|
|
- |
|
|
Balance at December 31, 2016 |
|
|
57,325 |
|
|
|
(10,339 |
) |
|
$ |
57 |
|
|
$ |
644,519 |
|
|
$ |
(181,361 |
) |
|
$ |
(25,206 |
) |
|
$ |
196,468 |
|
|
$ |
634,477 |
|
|
Cumulative-effect adjustment resulting from the adoption of ASU 2016-09 (Note 2) |
|
|
- |
|
|
|
- |
|
|
|
- |
|
|
|
719 |
|
|
|
- |
|
|
|
- |
|
|
|
(425 |
) |
|
|
294 |
|
|
Comprehensive income |
|
|
- |
|
|
|
- |
|
|
|
- |
|
|
|
- |
|
|
|
- |
|
|
|
6,028 |
|
|
|
74,952 |
|
|
|
80,980 |
|
|
Issuances of common stock |
|
|
254 |
|
|
|
- |
|
|
|
1 |
|
|
|
3,918 |
|
|
|
- |
|
|
|
- |
|
|
|
- |
|
|
|
3,919 |
|
|
Vesting of restricted stock units, net of forfeitures and tax withholdings |
|
|
468 |
|
|
|
- |
|
|
|
- |
|
|
|
(4,915 |
) |
|
|
- |
|
|
|
- |
|
|
|
- |
|
|
|
(4,915 |
) |
|
Share-based compensation expense |
|
|
- |
|
|
|
- |
|
|
|
- |
|
|
|
13,037 |
|
|
|
- |
|
|
|
- |
|
|
|
- |
|
|
|
13,037 |
|
|
Additional paid-in capital recorded through compensation expense |
|
|
- |
|
|
|
- |
|
|
|
- |
|
|
|
2,547 |
|
|
|
- |
|
|
|
- |
|
|
|
- |
|
|
|
2,547 |
|
|
Repurchases of common stock |
|
|
- |
|
|
|
(2,322 |
) |
|
|
- |
|
|
|
- |
|
|
|
(43,005 |
) |
|
|
- |
|
|
|
- |
|
|
|
(43,005 |
) |
|
Balance at December 31, 2017 |
|
|
58,047 |
|
|
|
(12,661 |
) |
|
$ |
58 |
|
|
$ |
659,825 |
|
|
$ |
(224,366 |
) |
|
$ |
(19,178 |
) |
|
$ |
270,995 |
|
|
$ |
687,334 |
|
See accompanying notes to consolidated financial statements
F-5
NAVIGANT CONSULTING, INC. AND SUBSIDIARIES
CONSOLIDATED STATEMENTS OF CASH FLOWS
(In thousands)
|
|
|
For the year ended |
|
||||||||||||
|
|
|
December 31, |
|
||||||||||||
|
|
|
2017 |
|
|
2016 |
|
|
2015 |
|
||||||
|
Cash flows from operating activities: |
|
|
|
|
|
|
|
|
|
|
|
|
|
|
|
|
Net income |
|
$ |
|
74,952 |
|
|
$ |
|
58,098 |
|
|
$ |
|
60,345 |
|
|
Adjustments to reconcile net income to net cash provided by operating activities: |
|
|
|
|
|
|
|
|
|
|
|
|
|
|
|
|
Depreciation expense |
|
|
|
28,826 |
|
|
|
|
27,742 |
|
|
|
|
23,612 |
|
|
Amortization expense |
|
|
|
8,960 |
|
|
|
|
11,507 |
|
|
|
|
8,613 |
|
|
Share-based compensation expense |
|
|
|
13,037 |
|
|
|
|
13,071 |
|
|
|
|
10,328 |
|
|
Deferred income taxes |
|
|
|
(16,463 |
) |
|
|
|
(2,154 |
) |
|
|
|
13,807 |
|
|
Allowance for doubtful accounts receivable |
|
|
|
7,755 |
|
|
|
|
8,815 |
|
|
|
|
2,578 |
|
|
Contingent acquisition liability adjustments, net |
|
|
|
2,213 |
|
|
|
|
1,330 |
|
|
|
|
(13,047 |
) |
|
Other, net |
|
|
|
3,113 |
|
|
|
|
(159 |
) |
|
|
|
2,598 |
|
|
Changes in assets and liabilities (net of acquisitions): |
|
|
|
|
|
|
|
|
|
|
|
|
|
|
|
|
Accounts receivable |
|
|
|
(11,773 |
) |
|
|
|
(49,972 |
) |
|
|
|
(27,875 |
) |
|
Prepaid expenses and other assets |
|
|
|
(6,712 |
) |
|
|
|
4,189 |
|
|
|
|
(5,575 |
) |
|
Accounts payable |
|
|
|
1,058 |
|
|
|
|
1,630 |
|
|
|
|
(2,271 |
) |
|
Accrued liabilities |
|
|
|
1,158 |
|
|
|
|
874 |
|
|
|
|
476 |
|
|
Accrued compensation-related costs |
|
|
|
(10,589 |
) |
|
|
|
14,447 |
|
|
|
|
6,875 |
|
|
Income taxes payable |
|
|
|
3,248 |
|
|
|
|
5,773 |
|
|
|
|
(4,081 |
) |
|
Other liabilities |
|
|
|
5,452 |
|
|
|
|
14,836 |
|
|
|
|
6,696 |
|
|
Net cash provided by operating activities |
|
|
|
104,235 |
|
|
|
|
110,027 |
|
|
|
|
83,079 |
|
|
Cash flows from investing activities: |
|
|
|
|
|
|
|
|
|
|
|
|
|
|
|
|
Purchases of property and equipment |
|
|
|
(38,650 |
) |
|
|
|
(28,665 |
) |
|
|
|
(39,094 |
) |
|
Acquisitions of businesses, net of cash acquired |
|
|
|
(5,000 |
) |
|
|
|
(15,426 |
) |
|
|
|
(64,037 |
) |
|
Other acquisition payments |
|
|
|
- |
|
|
|
|
(5,500 |
) |
|
|
|
- |
|
|
Payments of acquisition liabilities |
|
|
|
- |
|
|
|
|
(1,165 |
) |
|
|
|
(13,546 |
) |
|
Other, net |
|
|
|
(812 |
) |
|
|
|
(770 |
) |
|
|
|
(735 |
) |
|
Net cash used in investing activities |
|
|
|
(44,462 |
) |
|
|
|
(51,526 |
) |
|
|
|
(117,412 |
) |
|
Cash flows from financing activities: |
|
|
|
|
|
|
|
|
|
|
|
|
|
|
|
|
Issuances of common stock |
|
|
|
3,919 |
|
|
|
|
4,299 |
|
|
|
|
5,974 |
|
|
Repurchases of common stock |
|
|
|
(43,005 |
) |
|
|
|
(25,057 |
) |
|
|
|
(24,021 |
) |
|
Payments of contingent acquisition liabilities |
|
|
|
(10,330 |
) |
|
|
|
(828 |
) |
|
|
|
(4,592 |
) |
|
Repayments to banks |
|
|
|
(457,200 |
) |
|
|
|
(410,197 |
) |
|
|
|
(332,455 |
) |
|
Borrowings from banks |
|
|
|
452,524 |
|
|
|
|
375,708 |
|
|
|
|
397,320 |
|
|
Payments of debt issuance costs |
|
|
|
(1,297 |
) |
|
|
|
- |
|
|
|
|
- |
|
|
Other, net |
|
|
|
(5,009 |
) |
|
|
|
(2,723 |
) |
|
|
|
(1,415 |
) |
|
Net cash (used in) provided by financing activities |
|
|
|
(60,398 |
) |
|
|
|
(58,798 |
) |
|
|
|
40,811 |
|
|
Effect of exchange rate changes on cash and cash equivalents |
|
|
|
783 |
|
|
|
|
(307 |
) |
|
|
|
(231 |
) |
|
Net increase (decrease) in cash and cash equivalents |
|
|
|
158 |
|
|
|
|
(604 |
) |
|
|
|
6,247 |
|
|
Cash and cash equivalents at beginning of the period |
|
|
|
8,291 |
|
|
|
|
8,895 |
|
|
|
|
2,648 |
|
|
Cash and cash equivalents at end of the period |
|
$ |
|
8,449 |
|
|
$ |
|
8,291 |
|
|
$ |
|
8,895 |
|
Supplemental Consolidated Cash Flow Information
|
|
|
For the year ended |
|
||||||||||||
|
|
|
December 31, |
|
||||||||||||
|
|
|
2017 |
|
|
2016 |
|
|
2015 |
|
||||||
|
Interest paid |
|
$ |
|
4,237 |
|
|
$ |
|
3,692 |
|
|
$ |
|
3,183 |
|
|
Income taxes paid, net of refunds |
|
$ |
|
15,553 |
|
|
$ |
|
22,752 |
|
|
$ |
|
16,733 |
|
|
Impact of Tax Cuts and Jobs Act on deferred income tax balances |
|
$ |
|
29,900 |
|
|
$ |
|
- |
|
|
$ |
|
- |
|
See accompanying notes to consolidated financial statements.
F-6
NAVIGANT CONSULTING, INC. AND SUBSIDIARIES
NOTES TO CONSOLIDATED FINANCIAL STATEMENTS
Navigant Consulting, Inc. (“Navigant,” “we,” “us,” or “our”) (NYSE: NCI) is a specialized, global professional services firm that helps clients take control of their future. Navigant’s professionals apply deep industry knowledge, substantive technical expertise, and an enterprising approach to help clients build, manage, and/or protect their business interests. With a focus on markets and clients facing transformational change and significant regulatory or legal pressures, Navigant primarily serves clients in the healthcare, energy, and financial services industries. Across a range of advisory, consulting, outsourcing, and technology/analytics services, we believe our practitioners bring sharp insight that pinpoints opportunities and delivers powerful results.
We do not believe that any material subsequent events occurred during this period that requires disclosure in the notes to the consolidated financial statements.
We are headquartered in Chicago, Illinois and have offices in various cities within the U.S., as well as offices in countries in Europe, the Middle East, and Asia. Our non-U.S. subsidiaries, in the aggregate, represented approximately 10%, 9% and 9% of our total revenues for the years ended December 31, 2017, 2016 and 2015, respectively.
Principles of Consolidation
The consolidated financial statements include our accounts and those of our subsidiaries. All significant intercompany transactions have been eliminated in consolidation.
Use of Estimates
The preparation of financial statements in conformity with accounting principles generally accepted in the United States of America requires management to make estimates and assumptions that affect the amounts reported in the consolidated financial statements and the related notes. Actual results could differ from those estimates and may affect future results of operations and cash flows. Examples include: determination of the allowance for doubtful accounts, accruals for incentive compensation, the fair value of deferred contingent acquisition liabilities, revenue-related percentage of completion estimates, the measurement of deferred tax assets, estimating future performance for recording expense associated with our performance based long-term incentive plan, and the assessment of recoverability of intangible assets and goodwill. We base our estimates on historical trends, current experience and other assumptions that we believe are reasonable.
Cash and Cash Equivalents
Cash equivalents are comprised of liquid instruments with original maturity dates of 90 days or less.
Fair Value of Financial Instruments
We consider the recorded value of our financial assets and liabilities, which consist primarily of cash and cash equivalents, accounts receivable and accounts payable, to approximate the fair value of the respective assets and liabilities at December 31, 2017 and 2016 based upon the short-term nature of the assets and liabilities. In addition, the fair value of our bank debt considers counterparty and our own credit risk and as of December 31, 2017, approximated carrying value as it bears interest at variable rates. As noted below, we maintain interest rate derivatives which are recorded at fair value (see Note 16 — Fair Value).
Accounts Receivable Realization
We maintain allowances for doubtful accounts for estimated losses resulting from our clients’ inability to make required cash payments of amounts due to us or for disputes that affect our ability to fully collect our billed accounts receivable or for potential fee reductions negotiated by clients. Our estimation is based on historical collection and our review and assessment of our clients’ likelihood to make required cash payments of amounts due to us. Estimated losses may vary from actual results. If our clients’ financial condition were to deteriorate, resulting in an impairment of their ability to make payments, additional allowances may be required. If the billed amounts become uncollectable or collectability is doubtful, an allowance is recorded to general and administrative expense. If the collectability of unbilled amounts is not assured or certain pricing adjustments are made, an allowance is recorded as a reduction to revenue.
F-7
We record property and equipment at cost. We compute depreciation using the straight-line method based on the estimated useful lives of the assets, ranging from three to seven years for software, furniture, fixtures and equipment. We compute amortization of leasehold improvements over the shorter of the remaining lease term or the estimated useful life of the asset. The lease term of our leaseholds expire at various dates through 2028. During the years ended December 31, 2017, 2016 and 2015, we capitalized compensation costs related to internally developed software for internal use of $1.6 million, $1.4 million and $1.5 million, respectively. We capitalize internally developed software costs during the development stage.
Client-Facing Software
Prepaid expenses and other assets also include investments in capitalized client-facing software which is utilized to deliver services to or licensed to our clients. These amounts are amortized into cost of services before reimbursable expenses over their estimated remaining useful life. During the years ended December 31, 2017, 2016 and 2015, we capitalized compensation costs related to internally developed client-facing software of $0.1 million, $0.1 million, and nil, respectively. We capitalize internally developed software costs during the development stage.
Operating Leases
We lease office space under operating leases. Some of the lease agreements contain one or more of the following provisions or clauses: tenant allowances, rent holidays, lease premiums, and rent escalation clauses. For the purpose of recognizing these provisions on a straight-line basis over the terms of the leases, we use the date of initial possession to begin amortization, which is generally when we enter the space and begin to make improvements in preparation of intended use.
For tenant allowances and rent holidays, we record a deferred rent liability and amortize the deferred rent over the terms of the leases as reductions to rent expense. For scheduled rent escalation clauses during the lease term or for rental payments commencing at a date other than the date of initial occupancy, we record minimum rental expenses on a straight-line basis over the terms of the leases.
In addition, some of our operating leases contain exit clauses, which include termination fees associated with exiting a lease prior to the expiration of the lease term. We record termination obligations when we give notice to the landlord that we have elected to exercise the early termination clause of such agreement.
Notes Receivable, Prepaid Sign-on and Retention Bonuses
We grant and pay sign-on and retention bonuses to attract and retain certain senior-level consultants and administrative personnel. Generally, we require grantees to sign incentive recovery agreements, which obligate the grantees to fulfill a service term, typically between one to five years. If such service term is not fulfilled, the monetary equivalent of the uncompleted service term is required to be paid back to us. We record paid sign-on and retention bonuses to current and non-current other assets and the bonuses are amortized as compensation expense over the service period as defined by the incentive recovery agreements.
We also issue notes receivable in the form of unsecured employee loans with terms that are generally three to five years. These loans are issued to recruit and retain certain senior-level consultants. The principal amount and accrued interest is either paid by the consultant or forgiven by us over the terms of the loans, so long as the consultant continues employment and complies with certain contractual requirements. The expense associated with the forgiveness of the principal amount of the loans and accrued interest is recorded as compensation expense over the service period, which is consistent with the term of the loans. The accrued interest is calculated based on the loan’s effective interest rate and is recorded as interest income.
The collectability of the unsecured employee loans is reviewed on a quarterly basis based on our assessment of the employee’s ability to repay the loan should the contractual requirements of the loan not be fulfilled.
Goodwill and Intangible Assets
Goodwill represents the difference between the purchase price of the acquired business and the related fair value of the net assets acquired, which is accounted for by the acquisition method of accounting. Intangible assets consist of identifiable intangibles other than goodwill. Identifiable intangible assets, other than goodwill, include customer lists and relationships, employee non-compete agreements, backlog revenue and trade names. These assets are subject to changes in events or circumstances that could impact their carrying value.
F-8
Goodwill is tested for impairment annually during the second quarter. In addition to our annual goodwill test, on a periodic basis, we are required to consider whether it is more likely than not that the fair value has fallen below the carrying amount of an asset and thus requiring us to perform an interim goodwill impairment test. We consider elements and other factors including, but not limited to:
|
|
• |
adverse changes in the business climate in which we operate; |
|
|
• |
attrition of key personnel; |
|
|
• |
unanticipated competition; |
|
|
• |
our market capitalization in comparison to our book value; |
|
|
• |
our recent operating performance; and/or |
|
|
• |
our financial projections. |
The goodwill impairment test is performed at a reporting unit level. A reporting unit, as defined by ASC Topic 350, is an operating segment of a business or one level below an operating segment if discrete financial information is available and regularly reviewed by segment management. At December 31, 2017, we had four operating segments which were also considered to be our reporting units, as follows: Healthcare; Energy; Financial Services Advisory and Compliance; and Disputes, Forensics and Legal Technology.
ASC Topic 350 requires an entity to perform an annual assessment to determine whether goodwill is impaired. We performed a quantitative impairment test compares the fair value of the reporting unit to its carrying value. The fair value is determined using a discounted cash flow analysis (income approach) and a comparable company analysis (market approach).
We determine the fair value of a reporting unit by using an equal weighting of estimated fair value using the income and market approaches. The income approach uses estimated future cash flows and terminal values. Assumptions used to determine future cash flows include: forecasted growth rates; profit margins; longer-term historical performance and cost of capital. Our assumptions are consistent with our internal projections and operating plans. Our internal projections and operating plans and thus our estimated fair value may be impacted by the overall economic environment. Our assumptions may change as a result of, among other things: changes in our estimated business future growth rate; profit margin; long-term outlook; market valuations of comparable companies; the ability to retain key personnel; changes in operating segments; competitive environment and weighted average cost of capital. Under the market approach for determining fair value, we adopt certain assumptions that market participants would use in pricing the asset or liability, including assumptions about risk or the risks inherent in the inputs to the valuation. Inputs to the valuation can be readily observable, market-corroborated or unobservable. Wherever possible, we use valuation techniques that maximize the use of observable inputs and minimize the use of unobservable inputs; however, due to the use of our own assumptions about the inputs in measuring fair value, our goodwill impairment testing also makes use of significant unobservable inputs. The fair value of our reporting units is also impacted by our overall market capitalization and may be impacted by volatility in our stock price and assumed control premium, among other things.
If the carrying value exceeds the fair value, an impairment charge is recorded to reduce the carrying value to the implied fair value.
Intangible assets with definite lives are amortized based on the estimated period of consumption. We review these assets for impairment whenever events or changes in circumstances indicate an asset’s carrying value may not be recoverable.
Further information regarding our goodwill balances and current year impairment testing and review can be found in Note 5 — Goodwill and Intangible Assets, Net.
Revenue Recognition
We recognize revenues when evidence of an arrangement exists, the price of work is fixed or determinable, work is performed and collectability is reasonably assured. We generate the majority of our revenues from providing services under the following types of arrangements: time and material, fixed-fee, units of production and event or performance-based.
F-9
For our time and material arrangements, revenue is recognized based on the number of hours worked by our Client-Service FTE at the contracted bill rates. In some cases, our time and materials engagements are subject to a maximum fee amount not to be exceeded, in which case we periodically evaluate the progress of work performed to ensure that the maximum amount billable to the client is not expected to be exceeded. Additionally, revenue is recognized on our units of production arrangements in a similar manner based on measures such as the number of items processed at agreed-upon rates.
With our fixed-fee arrangements, we are contracted to complete a pre-determined set of professional services for a pre-determined fee. However, the fee and engagement scope can be adjusted based on a mutual agreement between us and the client. In many cases, the recording of fixed revenue amounts requires us to make an estimate of the total amount of work to be performed, and revenues are then recognized as efforts are expended based on hours worked unless another method such as output or straight-line is more representative of revenue earned.
We also have certain arrangements in which the fees are dependent on the completion of contractually defined outcomes. In many cases, this fee is earned in addition to an hourly or fixed-fee, but is not recognized until certain contractual milestones or outcomes are met. Contractually defined outcomes may be event-based (for example the completion of a deal for our client) or performance-based (for example based on obtaining a key performance indicator). Variations in our quarterly or yearly revenues and resulting operating profit margins may occur depending on the timing of such contractual outcomes and our ability to consider these revenues earned and realized.
We may provide multiple deliverables under the terms of one or multiple arrangements. Arrangements under these scenarios are evaluated in order to determine whether one or more units of accounting are present and revenue is allocated appropriately to each unit of accounting.
Reimbursable expenses for our engagements include travel, out-of-pocket and independent contractor costs. Such expenses are passed through to clients as contractually allowed. Typically, reimbursable expenses are recognized as revenue during the period in which the expenses are incurred.
Revenues recognized for services performed but not yet billed are recorded as engagements in process within accounts receivable. Advance payments and retainers are recorded as deferred revenue within other current liabilities and are recognized as services are provided. Any taxes assessed on revenues relating to services provided to our clients are recorded on a net basis.
Legal
We record legal expenses as incurred. Potential exposures related to unfavorable outcomes of legal matters are accrued for when they become probable and reasonably estimable.
Share-Based Compensation
We recognize the cost resulting from all share-based compensation arrangements, including stock options, restricted stock awards and restricted stock units that we grant under our long-term incentive plans in our consolidated financial statements based on their grant date fair value. The expense is recognized over the requisite service period or performance period of the award. Awards with a graded vesting period based on service are expensed on a straight-line basis for the entire award. Awards with performance-based vesting conditions which require the achievement of a specific company financial performance goal at the end of the performance period and required service period are recognized over the performance period. Each reporting period, we reassess the probability of achieving the respective performance goal. If the goals are not expected to be met, no compensation cost is recognized and any previously recognized amount recorded is reversed. If the award contains market-based vesting conditions, the compensation cost is based on the grant date fair value and expected achievement of market condition and is not subsequently reversed if it is later determined that the condition is not likely to be met or is expected to be lower than initial expectations.
The grant date fair value of stock options is based on the Black-Scholes-Merton pricing model. The Black-Scholes-Merton option-pricing model requires judgmental assumptions including volatility and expected term, both based on historical experience. The risk-free interest rate is based on U.S. Treasury interest rates whose term is consistent with the expected term of the option.
The grant date fair value of restricted stock and restricted stock units is based on the closing price of the underlying stock on the date of the grant.
At the time of the grant, we make an estimation of expected forfeitures based upon past experience. Compensation expense is recorded only for those awards expected to vest. Our forfeiture rate is reviewed periodically and may change from year to year.
F-10
We account for income taxes in accordance with FASB ASC Topic 740, Income Taxes. Our income tax expense, deferred tax assets and liabilities, and reserves for unrecognized tax benefits reflect management’s best assessment of estimated tax obligations. We are subject to income taxes in the U.S. and a number of foreign jurisdictions. Significant judgments and estimates are required in determining the consolidated income tax expense. On December 22, 2017, the President of the United States signed into law the Tax Cuts and Jobs Act (“Tax Reform”). Further information on the tax impacts of Tax Reform is included in Note 15 – Income Taxes to the notes to our consolidated financial statements.
Deferred income taxes arise from temporary differences between the tax and financial statement recognition of revenue and expense. In evaluating our ability to recover our deferred tax assets within the jurisdiction from which they arise, we consider all available positive and negative evidence, including scheduled reversals of deferred tax liabilities, projected future taxable income, tax-planning strategies, and results of recent operations. When appropriate, we evaluate the need for a valuation allowance to reduce deferred tax assets. The evaluation of the need for a valuation allowance requires management judgment and could impact our financial results and effective tax rate. We record interest and penalties as a component of our income tax provision. Such amounts were not material during any of the years ended December 31, 2017, 2016 or 2015.
Treasury Stock
We account for treasury stock transactions at cost and for the reissuance of treasury stock using the average cost method.
Foreign Currency Transactions
Assets and liabilities of our foreign subsidiaries whose functional currency is not the U.S. Dollar (“USD”) are translated into USD using the exchange rates in effect at period end. Revenue and expense items are translated using the average exchange rates for the period. These currency translation adjustments are reflected within stockholders’ equity as a component of accumulated other comprehensive loss.
Our foreign subsidiaries have various assets and liabilities, primarily receivables and payables, which are denominated in currencies other than their functional currency. These balance sheet items are subject to re-measurement, the impact of which is recorded in other income, net in the consolidated statements of comprehensive income (loss). We recognized $1.4 million loss in the year ended December 31, 2017 and $1.7 million and $0.1 million gains for the years ended December 31, 2016, and 2015, respectively.
Interest Rate Derivatives
We maintain interest rate swaps that are designated as cash flow hedges to manage the market risk from changes in interest rates on a portion of our variable rate loans. We recognize derivative instruments which are cash flow hedges as assets or liabilities at fair value, with the related gain or loss reflected within stockholders’ equity as a component of accumulated other comprehensive loss. Such instruments are recorded at fair value at each reporting date on a recurring basis. Changes in fair value as calculated are recorded in other comprehensive income (loss) (see Note 11 — Derivatives and Hedging Activity) only to the extent of effectiveness. Any ineffectiveness on the instruments would be recognized in the consolidated statements of comprehensive income (loss). The differentials to be received or paid under the instruments are recognized in earnings over the life of the contract as adjustments to interest expense. During the years ended December 31, 2017, 2016 and 2015, we recorded no gain or loss due to ineffectiveness and recorded $0.1 million, $0.2 million and $0.5 million, respectively, in interest expense associated with differentials paid under the instrument. Based on the net fair value of our interest rate swaps at December 31, 2017, we expect no material expense related to these instruments for the year ending December 31, 2018.
All of our derivative instruments are transacted under International Swaps and Derivatives Association (ISDA) master agreements. These agreements permit the net settlement of amounts owed in the event of default and certain other termination events, and it is our policy to net all derivative assets and liabilities on the consolidated balance sheets. As of December 31, 2017 and 2016, all of our derivative instruments were held with counterparties that are lenders under our credit agreement.
F-11
Accounting for Business Combinations
We use the acquisition method of accounting under the authoritative guidance on business combinations. Each acquired company’s operating results are included in our consolidated financial statements starting on the date of acquisition. The purchase price is equivalent to the fair value of consideration transferred. Tangible and identifiable intangible assets acquired and liabilities assumed as of the date of acquisition are recorded at fair value as of the acquisition date. Goodwill is recognized for the excess of purchase price over the net fair value of assets acquired and liabilities assumed. Deferred contingent consideration, which is primarily based on the business achieving certain performance targets, is recognized at its fair value on the acquisition date, and changes in fair value are recognized in earnings until settled. For the years ended December 31, 2017 and 2016, we recorded costs of $2.2 million and $1.3 million, respectively, and during the year ended December 31, 2015, we recorded a benefit of $13.0 million, in other operating costs (benefit) for these fair value adjustments. The fair value of the contingent consideration is based on our estimations of future performance of the business and is determined based on Level 3 observable inputs. Further information regarding our contingent acquisition liability balances can be found in Note 16 — Fair Value.
Impairment of Long-Lived Assets
We review long-lived assets such as property and equipment and definite-lived intangible assets whenever events or changes in circumstances indicate that the carrying amount of an asset may not be recoverable. These events or changes in circumstances may include a significant deterioration of operating results, changes in business plans such as a disposition, or changes in anticipated future cash flows. If an impairment indicator is present, we evaluate recoverability of assets to be held and used by a comparison of the carrying value of the assets to future undiscounted net cash flows expected to be generated by the assets. We group assets at the lowest level for which there are identifiable cash flows that are largely independent of the cash flows generated by other asset groups. If the total of the expected undiscounted future cash flows is less than the carrying amount of the asset group, we estimate the fair value of the asset group to determine whether an impairment loss should be recognized. An impairment loss is recognized for the difference between the fair value and carrying value of the asset group.
Comprehensive Income
Comprehensive income consists of net income (loss), unrealized foreign currency translation adjustments and unrealized net loss and/or gain on interest rate derivatives.
Discontinued Operations
The results of operations for business components meeting the criteria for discontinued operations are presented as such in our consolidated statements of comprehensive income (loss). For periods prior to the designation as discontinued operations, we reclassify the results of operations to discontinued operations. In addition, the net gain or loss (including any impairment loss) on the disposal is presented as discontinued operations when recognized. The change in presentation for discontinued operations does not have any impact on our financial condition or results of operations. We combine the cash flows and assets and liabilities attributable to discontinued operations with the respective cash flows and assets and liabilities from continuing operations to the extent that they are immaterial.
Recently Adopted Accounting Pronouncements
On January 1, 2017, we adopted Financial Accounting Standards Board (“FASB”) Accounting Standards Update (“ASU”) 2016-09, Compensation-Stock Compensation (Topic 718): Improvements to Employee Share-Based Payment Accounting. As required by the standard, excess tax benefits and deficiencies recognized on share-based compensation expense are recorded in the consolidated statement of comprehensive income as a component of income tax expense. Previously, these amounts were recorded as a component of additional paid-in capital on the consolidated balance sheet. We elected to apply the change in presentation to the consolidated statement of cash flows prospectively to classify excess tax benefits as an operating activity rather than a financing activity. Upon adoption, we determined that we did not have previously unrecognized excess tax benefits to be recognized on a modified retrospective transition method as an adjustment to retained earnings. We will continue to classify cash paid related to shares withheld to satisfy tax-withholding requirements as a financing activity, as required by the standard. We made a policy election to account for forfeitures as they occur, rather than estimating the expected forfeitures over the course of the vesting period. The cumulative-effect adjustment to retained earnings as of the date of adoption was $0.4 million, with a reduction in the related deferred tax liability of $0.3 million. ASU 2016-09 also requires that excess tax benefits and deficiencies be prospectively excluded from assumed future proceeds in the calculation of diluted weighted average shares when calculating diluted earnings per share utilizing the treasury stock method. We applied this change prospectively, and it did not have a material impact on our consolidated financial statements.
F-12
During the first quarter of 2017, we early adopted the FASB ASU 2017-04, Intangibles – Goodwill and Other: Simplifying the Test for Goodwill Impairment (Topic 350), which simplifies the goodwill impairment test by eliminating step 2, which is the step requiring companies to perform a hypothetical purchase price allocation to measure goodwill. Instead, under the new standard, impairment will be measured using the difference between the fair value of a reporting unit with its carrying amount. Any impairment charge will be recognized for the amount by which the carrying amount exceeds the reporting unit’s fair value, taking into consideration income tax effects from any deductible goodwill on the carrying amount of the reporting unit. This standard was applied prospectively. The adoption did not have a material effect on our consolidated financial statements or related disclosures.
During the third quarter of 2017, we early adopted the FASB ASU 2017-12, Derivatives and Hedging (Topic 815): Targeted Improvements to Accounting for Hedging Activities and applied the standard prospectively. This update eliminates the requirement to separately measure and report hedge ineffectiveness and requires that all items that affect earnings be presented in the same income statement line as the hedged item. The update also provides alternatives for applying hedge accounting to additional hedging strategies and measuring the hedged item in fair value hedges of interest rate risk. The updated presentation and disclosure guidance were applied prospectively. The adoption did not have a material impact on our consolidated financial statements or related disclosures.
On January 1, 2016, we adopted the FASB ASU 2015-03, Simplifying the Presentation of Debt Issuance Costs (Subtopic 835-30). This update includes amendments that change the presentation of debt issuance costs in financial statements. ASU 2015-03 requires an entity to present such costs in the balance sheet as a direct deduction from the related debt liability rather than as an asset. Amortization of the costs will continue to be reported as interest expense. In August 2015, the FASB issued ASU 2015-15, which clarified the guidance in ASU 2015-03 that for a line-of-credit (revolving credit) arrangement the SEC staff would not object to an entity deferring and presenting debt issuance costs as an asset and subsequently amortizing the deferred debt issuance costs ratably over the term. We adopted this standard as of January 1, 2016; however, since our credit facility is a revolving credit arrangement we will continue to present our current net debt issuance cost balance in other assets. Our net debt issuance cost as of December 31, 2017 was $1.6 million.
On January 1, 2016, we adopted the FASB ASU 2015-16, Business Combinations (Topic 805). This update requires the acquirer in a business combination to recognize to the income statement adjustments to provisional amounts that are identified during the measurement period in the reporting period in which adjustment amounts are determined. The adjustments are calculated as if the accounting had been completed at the acquisition date. Prior to this update, an acquirer was required to restate prior period financial statements as of the acquisition date for adjustments to provisional amounts. This standard was adopted by us on January 1, 2016, and will be applied, as needed, to acquisitions after this date.
Recent Accounting Pronouncements Not Yet Adopted
In May 2014, the FASB issued ASU 2014-09, Revenue from Contracts with Customers (Topic 606). This update is intended to improve the financial reporting requirements for revenue from contracts with customers by providing a principle-based approach. The core principle of the standard is that revenue should be recognized when the transfer of promised goods or services is made in an amount that the entity expects to be entitled to in exchange for the transfer of goods and services. The update also requires disclosures enabling users of financial statements to understand the nature, amount, timing and uncertainty of revenue and cash flows arising from contracts with customers. This guidance is effective January 1, 2018 and we have selected to adopt the new standard using the cumulative catch-up transition method. We are close to completion on our assessment and are in the process of quantifying its impact on our consolidated financial statements. We believe that the most significant impact from our adoption of this guidance will be to certain contracts that include event-based variable consideration. Currently we recognize event-based variable fees based when contractual milestones or obligations have been met. However, Topic 606 will require us to estimate and recognize the revenue from event-based variable fees over the period of performance to the extent that it is probable that a significant reversal will not occur.
In February 2016, the FASB issued ASU 2016-02, Leases (Topic 842). This update amends the requirements for assets and liabilities recognized for all leases longer than twelve months. Lessees will be required to recognize a lease liability measured on a discounted basis, which is the lessee’s obligation to make lease payments arising from the lease, and a right-of-use asset, which is an asset that represents the lessee’s right to use, or control the use of, a specified asset for the lease term. This standard will be effective for financial statements issued by public companies for the annual and interim periods beginning after December 15, 2018. Early adoption of the standard is permitted. The standard will require a modified retrospective approach for leases existing at or entered into after the beginning of the earliest comparative period presented. We are currently evaluating the potential impact of our adoption of this guidance on our consolidated financial statements. We currently believe the most significant changes will be related to the recognition of new right-of-use assets and lease liabilities on our consolidated balance sheets for real estate operating leases.
In August 2016, the FASB issued ASU 2016-15, Statement of Cash Flow (Topic 230). This update is intended to reduce diversity in practice in how certain transactions are classified in the statement of cash flows. The update provides new guidance regarding the classification of debt prepayment or debt extinguishment costs, settlement of zero-coupon debt instruments, contingent consideration payments made after a business combination, proceeds from the settlement of insurance claims, proceeds from the settlement of corporate-owned life insurance policies including bank-owned life insurance policies, distributions received from equity method investments, beneficial interests in securitized transactions, and separately identifiable cash flows and application of the predominance principle. This standard will be effective for financial statements issued by public companies for the annual and interim periods beginning after December 15, 2017. Early adoption of the standard is permitted. The standard will be applied in a
F-13
retrospective approach for each period presented. We have completed an initial evaluation of the impact of our adoption of this standard and have determined that the manner in which we classify our contingent acquisition liability payments in the consolidated statement of cash flows will change. Based on our initial evaluation, adoption of this standard may require an immaterial reclassification of a portion of the payments previously reported as financing activities for comparative periods in the statement of cash flows within our consolidated financial statements issued for periods beginning on or after January 1, 2018. Under this guidance, portions of these payments will be reclassified from financing activities to operating activities. We will continue to evaluate the potential impact of this guidance on our consolidated financial statements, but our preliminary assessments of the impact of this guidance are subject to change.
In January 2017, the FASB issued ASU 2017-01, Business Combinations: Clarifying the Definition of a Business (Topic 805), which provides a new framework for determining whether transactions should be accounted for as acquisitions (or disposals) of assets or businesses. This standard will be effective for public companies for annual and interim periods beginning after December 15, 2017. Early adoption is permitted effective for transactions not yet reported in financial statements issued or made available for issuance. We are currently evaluating the potential impact of this guidance on our consolidated financial statements.
In May 2017, the FASB issued ASU 2017-09, Compensation – Stock Compensation (Topic 718): Scope of Modification Accounting. This update clarifies which changes to the terms and conditions of a share-based payment award require an entity to apply modification accounting. Specifically, an entity would not apply modification accounting if the fair value, vesting conditions, and classification as an equity or liability instrument are the same before and after the modification. This standard will be effective for financial statements issued by public companies for the annual and interim periods beginning after December 15, 2017. Early adoption of the standard is permitted. The standard will be applied prospectively to awards modified on or after the adoption date. We are currently evaluating the potential impact of our adoption of this guidance on our consolidated financial statements.
2016 Acquisitions
During the year ended December 31, 2016, we acquired three businesses, including Ecofys Investments B.V. (“Ecofys”) for an aggregate purchase price of $19.1 million, of which $17.6 million was paid in cash at closing. Ecofys was integrated into our Energy segment, and the other two acquired businesses were integrated into our Healthcare segment. None of these acquisitions were material to our consolidated financial position.
2015 Acquisitions
On December 31, 2015, we acquired McKinnis Consulting Services, LLC (“McKinnis”) to further expand our healthcare business. McKinnis specialized in providing revenue cycle assessment, strategy and optimization assistance for healthcare providers. The acquisition included approximately 70 professionals and was integrated into our Healthcare segment. We paid $45.7 million at closing, including $42.7 million in cash (net of cash acquired) and $3.0 million (or 176,758 shares) in our common stock. The purchase agreement also provides for a deferred contingent acquisition payment to the selling members of McKinnis in an amount up to $10.0 million based on the business achieving certain performance targets over the one-year period ending December 31, 2016. We estimated deferred contingent consideration fair value on the closing date to be $8.3 million which was recorded in other non-current liabilities at net present value using a risk-adjusted discount rate. Based on a review of the business operating performance, the fair value of the deferred contingent acquisition liability was recorded at its maximum performance target of $10.0 million for the year ended December 31, 2016 and was settled during the second quarter of 2017. A working capital adjustment, including a $5.5 million payment to the selling members for undistributed cash held in the business as of the closing, was settled during the year ended December 31, 2016. As part of our purchase price allocation, we recorded $13.0 million in identifiable intangible assets, $45.5 million in goodwill and other net assets of $1.0 million.
On February 23, 2015, we acquired RevenueMed, Inc. (“RevenueMed”) to expand the business process management service capabilities within our Healthcare segment. RevenueMed specialized in providing coding, revenue cycle management, and business process management services to healthcare providers. This acquisition included approximately 1,500 professionals primarily located in India and was integrated into the Technology, Data & Process business within our Healthcare segment. We paid $21.3 million in cash (net of cash acquired) at closing. The purchase agreement also provided for a deferred contingent acquisition payment to the selling stockholders of RevenueMed in an amount up to $4.0 million based on the business achieving certain performance targets over the six-month period beginning January 1, 2015 and ending June 30, 2015, which was settled on October 1, 2015 for $4.0 million cash. We estimated deferred contingent consideration fair value on the closing date to be $3.8 million which was recorded in other current liabilities at net present value using a risk-adjusted discount rate. As part of our purchase price allocation, we recorded $7.3 million in identifiable intangible assets, $14.4 million in goodwill, $1.4 million of internally developed software and other net assets of $2.6 million. Other net assets included a liability for uncertain tax positions of $1.3 million, and based on the indemnification terms of the purchase agreement, which entitles us to indemnification if tax is due, an offsetting receivable from RevenueMed was recorded in prepaid expenses and other current assets.
F-14
See Note 16 — Fair Value for additional information regarding deferred contingent consideration fair value adjustments.
Unaudited Pro Forma Information
The following supplemental pro forma financial information was prepared as if the 2016 acquisitions noted above had occurred as of January 1, 2016. The following table was prepared for comparative purposes only and does not purport to be indicative of what would have occurred had the acquisitions been made at that time or of results which may occur in the future (in thousands, except per share data).
|
|
|
For the year ended |
|
|||||
|
|
|
December 31, |
|
|||||
|
|
|
2017 |
|
|
2016 |
|
||
|
Total revenues |
|
$ |
1,032,327 |
|
|
$ |
1,056,958 |
|
|
Net income |
|
$ |
74,952 |
|
|
$ |
57,243 |
|
|
Basic net income per basic share |
|
$ |
1.61 |
|
|
$ |
1.21 |
|
|
Shares used in computing net income per basic share |
|
|
46,593 |
|
|
|
47,343 |
|
|
Diluted net income per diluted share |
|
$ |
1.55 |
|
|
$ |
1.17 |
|
|
Shares used in computing net income per diluted share |
|
|
48,226 |
|
|
|
48,813 |
|
Our business is assessed and resources are allocated based on the following four reportable segments:
|
|
• |
The Healthcare segment provides consulting services and business process management services. Clients of this segment include healthcare providers, payers and life sciences companies. We help clients respond to market legislative changes such as the shift to an outcomes and value-based reimbursements model, ongoing industry consolidation and reorganization, Medicaid expansion, the implementation of a new electronic health records system and product planning and commercialization expertise. |
|
|
• |
The Energy segment provides advisory services to utilities, governmental agencies, manufacturers and investors. We provide our clients with advisory solutions in business strategy and planning, distributed energy resources and renewables, energy efficiency and demand response, and grid modernization. In addition, we provide a broad array of benchmarking and research services. |
|
|
• |
The Financial Services Advisory and Compliance segment provides strategic, operational, valuation, risk management, investigative and compliance advisory services to clients primarily in the highly-regulated financial services industry, including major financial and insurance institutions. This segment also provides anti-corruption solutions and anti-money laundering consulting, litigation support, tax compliance and valuation services to clients in a broad variety of industries. |
|
|
• |
The Disputes, Forensics and Legal Technology segment’s professional services include accounting, regulatory, construction, and computer forensic expertise, as well as valuation and economic analysis. In addition to these capabilities, our professionals use technological tools to perform eDiscovery services and to deliver custom technology, data analytic and cyber-security solutions. The clients of this segment principally include companies along with their in-house counsel and law firms, as well as accounting firms, corporate boards and government agencies. |
The following information includes segment revenues before reimbursements, segment total revenues and segment operating profit. Certain unallocated expense amounts related to specific reporting segments have been excluded from segment operating profit to be consistent with the information used by management to evaluate segment performance. Segment operating profit represents total revenues less cost of services excluding long-term compensation expense attributable to client-service employees. Long-term compensation expense attributable to client-service employees includes share-based compensation expense and compensation expense attributed to certain retention incentives (see Note 8 — Share-Based Compensation Expense and Note 9 — Supplemental Consolidated Balance Sheet Information).
The information presented does not necessarily reflect the results of segment operations that would have occurred had the reporting segments been stand-alone businesses.
F-15
Information on the segment operations has been summarized as follows (in thousands):
|
|
|
For the year ended |
|
||||||||||||
|
|
|
December 31, |
|
||||||||||||
|
|
|
2017 |
|
|
2016 |
|
|
2015 |
|
||||||
|
Revenues before reimbursements: |
|
|
|
|
|
|
|
|
|
|
|
|
|
|
|
|
Healthcare |
|
$ |
|
370,266 |
|
|
$ |
|
354,268 |
|
|
$ |
|
288,798 |
|
|
Energy |
|
|
|
124,492 |
|
|
|
|
115,940 |
|
|
|
|
106,023 |
|
|
Financial Services Advisory and Compliance |
|
|
|
140,336 |
|
|
|
|
152,166 |
|
|
|
|
124,359 |
|
|
Disputes, Forensics and Legal Technology |
|
|
|
304,545 |
|
|
|
|
316,372 |
|
|
|
|
314,628 |
|
|
Total revenues before reimbursements |
|
$ |
|
939,639 |
|
|
$ |
|
938,746 |
|
|
$ |
|
833,808 |
|
|
|
|
|
|
|
|
|
|
|
|
|
|
|
|
|
|
|
Total revenues: |
|
|
|
|
|
|
|
|
|
|
|
|
|
|
|
|
Healthcare |
|
$ |
|
404,120 |
|
|
$ |
|
389,233 |
|
|
$ |
|
313,884 |
|
|
Energy |
|
|
|
146,425 |
|
|
|
|
133,612 |
|
|
|
|
124,491 |
|
|
Financial Services Advisory and Compliance |
|
|
|
159,410 |
|
|
|
|
173,391 |
|
|
|
|
142,959 |
|
|
Disputes, Forensics and Legal Technology |
|
|
|
322,372 |
|
|
|
|
338,244 |
|
|
|
|
338,152 |
|
|
Total revenues |
|
$ |
|
1,032,327 |
|
|
$ |
|
1,034,480 |
|
|
$ |
|
919,486 |
|
|
|
|
|
|
|
|
|
|
|
|
|
|
|
|
|
|
|
Segment operating profit: |
|
|
|
|
|
|
|
|
|
|
|
|
|
|
|
|
Healthcare |
|
$ |
|
111,188 |
|
|
$ |
|
115,163 |
|
|
$ |
|
90,869 |
|
|
Energy |
|
|
|
33,783 |
|
|
|
|
32,637 |
|
|
|
|
31,380 |
|
|
Financial Services Advisory and Compliance |
|
|
|
53,772 |
|
|
|
|
63,464 |
|
|
|
|
49,130 |
|
|
Disputes, Forensics and Legal Technology |
|
|
|
97,564 |
|
|
|
|
108,685 |
|
|
|
|
102,449 |
|
|
Total segment operating profit |
|
|
|
296,307 |
|
|
|
|
319,949 |
|
|
|
|
273,828 |
|
|
|
|
|
|
|
|
|
|
|
|
|
|
|
|
|
|
|
Segment reconciliation to income before income tax expense: |
|
|
|
|
|
|
|
|
|
|
|
|
|
|
|
|
Reconciling items: |
|
|
|
|
|
|
|
|
|
|
|
|
|
|
|
|
General and administrative expenses |
|
|
|
166,922 |
|
|
|
|
168,954 |
|
|
|
|
147,462 |
|
|
Depreciation expense |
|
|
|
28,826 |
|
|
|
|
27,742 |
|
|
|
|
23,612 |
|
|
Amortization expense |
|
|
|
8,960 |
|
|
|
|
11,507 |
|
|
|
|
8,613 |
|
|
Other operating costs (benefit), net |
|
|
|
4,220 |
|
|
|
|
1,872 |
|
|
|
|
(9,900 |
) |
|
Long-term compensation expense attributable to client-service employees (including share-based compensation expense) |
|
|
|
11,254 |
|
|
|
|
13,138 |
|
|
|
|
11,914 |
|
|
Operating income |
|
|
|
76,125 |
|
|
|
|
96,736 |
|
|
|
|
92,127 |
|
|
Interest and other expense, net |
|
|
|
5,544 |
|
|
|
|
3,325 |
|
|
|
|
3,974 |
|
|
Income before income tax expense |
|
$ |
|
70,581 |
|
|
$ |
|
93,411 |
|
|
$ |
|
88,153 |
|
Total assets allocated by segment include accounts receivable, net, certain retention-related prepaid assets, intangible assets and goodwill. The remaining assets are unallocated. Allocated assets by segment were as follows (in thousands):
|
|
|
December 31, |
|
|
December 31, |
|
||
|
|
|
2017 |
|
|
2016 |
|
||
|
Healthcare |
|
$ |
399,268 |
|
|
$ |
391,859 |
|
|
Energy |
|
|
115,478 |
|
|
|
120,311 |
|
|
Financial Services Advisory and Compliance |
|
|
95,534 |
|
|
|
98,846 |
|
|
Disputes, Forensics and Legal Technology |
|
|
343,248 |
|
|
|
330,239 |
|
|
Unallocated assets |
|
|
126,736 |
|
|
|
113,542 |
|
|
Total assets |
|
$ |
1,080,264 |
|
|
$ |
1,054,797 |
|
F-16
Total revenues and assets by geographic region were as follows (shown in thousands):
|
|
|
For the year ended |
|
|||||||||
|
|
|
December 31, |
|
|||||||||
|
|
|
2017 |
|
|
2016 |
|
|
2015 |
|
|||
|
Total revenue: |
|
|
|
|
|
|
|
|
|
|
|
|
|
United States |
|
$ |
931,649 |
|
|
$ |
938,224 |
|
|
$ |
833,527 |
|
|
United Kingdom |
|
|
50,700 |
|
|
|
55,626 |
|
|
|
62,099 |
|
|
Other |
|
|
49,978 |
|
|
|
40,630 |
|
|
|
23,860 |
|
|
Total |
|
$ |
1,032,327 |
|
|
$ |
1,034,480 |
|
|
$ |
919,486 |
|
|
|
|
December 31, |
|
|
December 31, |
|
||
|
Total assets: |
|
2017 |
|
|
2016 |
|
||
|
United States |
|
$ |
966,547 |
|
|
$ |
952,572 |
|
|
United Kingdom |
|
|
64,463 |
|
|
|
62,156 |
|
|
Other |
|
|
49,254 |
|
|
|
40,069 |
|
|
Total |
|
$ |
1,080,264 |
|
|
$ |
1,054,797 |
|
Changes made to our goodwill balances during the years ended December 31, 2017 and 2016 were as follows (in thousands):
|
|
|
Healthcare |
|
|
Energy |
|
|
Financial Services Advisory and Compliance |
|
|
Disputes, Forensics and Legal Technology |
|
|
Total Company |
|
|||||
|
Gross goodwill at December 31, 2016 |
|
$ |
272,032 |
|
|
$ |
77,924 |
|
|
$ |
53,784 |
|
|
$ |
348,757 |
|
|
$ |
752,497 |
|
|
Acquisitions |
|
|
5,837 |
|
|
|
- |
|
|
|
- |
|
|
|
- |
|
|
|
5,837 |
|
|
Adjustments |
|
|
9 |
|
|
|
1,231 |
|
|
|
(35 |
) |
|
|
(154 |
) |
|
|
1,051 |
|
|
Foreign currency translation |
|
|
252 |
|
|
|
954 |
|
|
|
713 |
|
|
|
3,453 |
|
|
|
5,372 |
|
|
Gross goodwill at December 31, 2017 |
|
|
278,130 |
|
|
|
80,109 |
|
|
|
54,462 |
|
|
|
352,056 |
|
|
|
764,757 |
|
|
Accumulated goodwill impairment |
|
|
- |
|
|
|
- |
|
|
|
- |
|
|
|
(122,045 |
) |
|
|
(122,045 |
) |
|
Accumulated amortization |
|
|
- |
|
|
|
- |
|
|
|
- |
|
|
|
(5,425 |
) |
|
|
(5,425 |
) |
|
Net goodwill at December 31, 2017 |
|
$ |
278,130 |
|
|
$ |
80,109 |
|
|
$ |
54,462 |
|
|
$ |
224,586 |
|
|
$ |
637,287 |
|
|
|
|
Healthcare |
|
|
Energy |
|
|
Financial Services Advisory and Compliance |
|
|
Disputes, Forensics and Legal Technology |
|
|
Total Company |
|
|||||
|
Gross goodwill at December 31, 2015 |
|
$ |
264,163 |
|
|
$ |
76,566 |
|
|
$ |
55,341 |
|
|
$ |
354,604 |
|
|
$ |
750,674 |
|
|
Acquisitions |
|
|
8,057 |
|
|
|
2,122 |
|
|
|
- |
|
|
|
- |
|
|
|
10,179 |
|
|
Adjustments |
|
|
(12 |
) |
|
|
- |
|
|
|
(35 |
) |
|
|
(153 |
) |
|
|
(200 |
) |
|
Foreign currency translation |
|
|
(176 |
) |
|
|
(764 |
) |
|
|
(1,522 |
) |
|
|
(5,694 |
) |
|
|
(8,156 |
) |
|
Gross goodwill at December 31, 2016 |
|
|
272,032 |
|
|
|
77,924 |
|
|
|
53,784 |
|
|
|
348,757 |
|
|
|
752,497 |
|
|
Accumulated goodwill impairment |
|
|
- |
|
|
|
- |
|
|
|
- |
|
|
|
(122,045 |
) |
|
|
(122,045 |
) |
|
Accumulated amortization |
|
|
- |
|
|
|
- |
|
|
|
- |
|
|
|
(5,425 |
) |
|
|
(5,425 |
) |
|
Net goodwill at December 31, 2016 |
|
$ |
272,032 |
|
|
$ |
77,924 |
|
|
$ |
53,784 |
|
|
$ |
221,287 |
|
|
$ |
625,027 |
|
During the year ended December 31, 2017, we recorded an adjustment to goodwill of $1.2 million related to the Ecofys acquisition in connection with working capital adjustments made during the period.
F-17
We performed our annual goodwill impairment test as of May 31, 2017 (see Note 2 – Summary of Significant Accounting Policies and Recent Accounting Pronouncements for further information on goodwill testing procedures). The key assumptions included: internal projections completed during our first quarter 2017 forecasting process; profit margin improvement generally consistent with our longer-term historical performance; assumptions regarding contingent revenue; revenue growth consistent with our longer-term historical performance, also considering our near-term investment plans and growth objectives; discount rates based on comparable discount rates for our peer group; revenue and EBITDA multiples comparable to multiples for our peer group; Navigant-specific risk considerations; control premium; and cost of capital based on our historical experience.
Based on our assumptions, at that time, the estimated fair value exceeded the net asset carrying value for each of our reporting units as of May 31, 2017. Accordingly, there was no indication of impairment of our goodwill for any of our reporting units. As of May 31, 2017, the estimated fair value of our Healthcare, Energy, Financial Services Advisory and Compliance, and Disputes, Forensics and Legal Technology reporting units exceeded the fair value of invested capital by 30%, 38%, 70%, and 21%, respectively.
We have reviewed our most recent financial projections and considered the impact of changes to our business and market conditions on our goodwill valuation and determined that no events or conditions have occurred or are expected to occur that would trigger a need to perform an interim goodwill impairment test. We will continue to monitor the factors and key assumptions used in determining the fair value of each of our reporting units. There can be no assurance that goodwill or intangible assets will not be impaired in the future. We will perform our next annual goodwill impairment test as of May 31, 2018.
Intangible assets consisted of (in thousands):
|
|
|
December 31, |
|
|
December 31, |
|
||
|
|
|
2017 |
|
|
2016 |
|
||
|
Intangible assets: |
|
|
|
|
|
|
|
|
|
Customer lists and relationships |
|
$ |
109,624 |
|
|
$ |
106,536 |
|
|
Non-compete agreements |
|
|
24,217 |
|
|
|
23,407 |
|
|
Other |
|
|
28,985 |
|
|
|
28,274 |
|
|
Intangible assets, at cost |
|
|
162,826 |
|
|
|
158,217 |
|
|
Less: accumulated amortization |
|
|
(141,773 |
) |
|
|
(129,490 |
) |
|
Intangible assets, net |
|
$ |
21,053 |
|
|
$ |
28,727 |
|
Our intangible assets have estimated remaining useful lives ranging up to seven years which approximate the estimated periods of consumption. We will amortize the remaining net book values of intangible assets over their remaining useful lives. At December 31, 2017, our intangible assets categories were as follows (in thousands, except year data):
|
Category |
|
Weighted Average Remaining Years |
|
|
Amount |
|
||
|
Customer lists and relationships, net |
|
|
4.8 |
|
|
$ |
17,787 |
|
|
Non-compete agreements, net |
|
|
3.0 |
|
|
|
1,981 |
|
|
Other intangible assets, net |
|
|
2.5 |
|
|
|
1,285 |
|
|
Total intangible assets, net |
|
|
4.5 |
|
|
$ |
21,053 |
|
Total amortization expense was $9.0 million, $11.5 million and $8.6 million for the years ended December 31, 2017, 2016 and 2015, respectively. The estimated annual aggregate amortization expense to be recorded in the next five years related to intangible assets at December 31, 2017 is as follows (in thousands):
|
Year Ending December 31, |
|
Amount |
|
|
|
2018 |
|
$ |
6,771 |
|
|
2019 |
|
|
4,609 |
|
|
2020 |
|
|
3,542 |
|
|
2021 |
|
|
3,694 |
|
|
2022 |
|
|
676 |
|
F-18
The components of basic and diluted shares (in thousands and based on the weighted average days outstanding for the periods) were as follows:
|
|
|
For the year ended December 31, |
|
|||||||||
|
|
|
2017 |
|
|
2016 |
|
|
2015 |
|
|||
|
Basic shares |
|
|
46,593 |
|
|
|
47,343 |
|
|
|
47,906 |
|
|
Employee stock options |
|
|
151 |
|
|
|
129 |
|
|
|
111 |
|
|
Restricted stock units |
|
|
1,424 |
|
|
|
1,262 |
|
|
|
1,130 |
|
|
Contingently issuable shares |
|
|
58 |
|
|
|
79 |
|
|
|
77 |
|
|
Diluted shares |
|
|
48,226 |
|
|
|
48,813 |
|
|
|
49,224 |
|
|
Antidilutive shares (1) |
|
|
184 |
|
|
|
136 |
|
|
|
212 |
|
|
(1) |
Stock options with exercise prices greater than the average market price of our common stock during the respective time periods were excluded from the computation of diluted shares because the impact of including the shares subject to these stock options in the diluted share calculation would have been antidilutive. |
For the year ended December 31, 2017
During the year ended December 31, 2017, we repurchased 2,322,415 shares of our common stock at a weighted average price of $18.52. During the year ended December 31, 2017, $2.5 million relating to accrued incentive compensation liabilities for the 2016 performance year was recorded as additional paid-in capital at the time of grant of the restricted stock units in 2017.
During the year ended December 31, 2017, we adopted FASB ASU 2016-09, Compensation-Stock Compensation (Topic 718): Improvements to Employees Share-Based Payment Accounting. As a result of this adoption, we recorded a cumulative-effect adjustment to retained earnings as of the date of adoption was $0.4 million, with a reduction in the related deferred tax liability of $0.3 million. See Note 2 – Summary of Significant Accounting Policies and Recent Accounting Pronouncements for more information.
For the year ended December 31, 2016
During the year ended December 31, 2016, we repurchased 1,436,147 shares of our common stock at a weighted average price of $17.45. During the year ended December 31, 2016, $1.9 million relating to accrued incentive compensation liabilities for the 2015 performance year was recorded as additional paid-in capital at the time of grant of the restricted stock units in 2016.
During the year ended December 31, 2016, we retired 8,000,000 shares of treasury stock. As a result, within the stockholders’ equity accounts on our consolidated balance sheets, treasury stock was reduced by $140.3 million for the value of the shares calculated using the weighted average treasury stock inventory price, common stock was reduced $8.0 thousand for the aggregate par value of the shares retired, and $140.3 million was recorded as a reduction to retained earnings.
For the year ended December 31, 2015
During the year ended December 31, 2015, we repurchased 1,589,072 shares of our common stock at a weighted average price of $15.12 and issued 176,758 of common stock having a fair value of $3.0 million relating to the McKinnis acquisition (see Note 3 – Acquisitions). During the year ended December 31, 2015, $1.3 million relating to accrued incentive compensation liabilities for the 2014 performance year was recorded as additional paid-in capital at the time of grant of the restricted stock units in 2015.
Summary
On May 16, 2017, our shareholders approved the Navigant Consulting, Inc. 2017 Long-Term Incentive Plan (“2017 Plan”). The purposes of the 2017 Plan are: (i) to align the interests of our shareholders and recipients of awards under the 2017 Plan by increasing the proprietary interest of such recipients in the Company’s growth and success; (ii) to advance the interests of the Company by attracting and retaining officers, other employees, non-employee directors, consultants, independent contractors and agents; and (iii) to motivate such persons to act in the long-term best interests of the Company and our shareholders. The 2017 Plan allows for awards of stock options, stock appreciation rights, restricted stock and restricted stock units, and performance awards.
As of December 31, 2017, 2,571,868 shares remained available for future issuance under the 2017 Plan.
F-19
We record share-based compensation expense for restricted stock units, stock options and the discount given on employee stock purchase plan transactions. Our long-term incentive program for our senior-level employees currently provides for either an award of restricted stock units or deferred cash. The aggregate value of the awards granted to eligible recipients is determined based on our financial performance for the prior fiscal year, and the awards vest three years following the date of grant. Based on financial performance during the year ended December 31, 2017, we have no cost accrued in other compensation expense related to this program for awards to be granted in 2018.
The amounts attributable to each category of share-based compensation expense were as follows (in thousands):
|
|
|
For the year ended |
|
|||||||||
|
|
|
December 31, |
|
|||||||||
|
|
|
2017 |
|
|
2016 |
|
|
2015 |
|
|||
|
Amortization of restricted stock unit awards |
|
$ |
11,983 |
|
|
$ |
11,876 |
|
|
$ |
9,379 |
|
|
Amortization of stock option awards |
|
|
684 |
|
|
|
864 |
|
|
|
672 |
|
|
Discount given on employee stock purchase transactions through our Employee Stock Purchase Plan |
|
|
370 |
|
|
|
331 |
|
|
|
277 |
|
|
Total share-based compensation expense |
|
$ |
13,037 |
|
|
$ |
13,071 |
|
|
$ |
10,328 |
|
Total share-based compensation expense consisted of the following (in thousands):
|
|
|
For the year ended |
|
|||||||||
|
|
|
December 31, |
|
|||||||||
|
|
|
2017 |
|
|
2016 |
|
|
2015 |
|
|||
|
Cost of services before reimbursable expenses |
|
$ |
7,305 |
|
|
$ |
7,794 |
|
|
$ |
6,407 |
|
|
General and administrative expenses |
|
|
5,732 |
|
|
|
5,277 |
|
|
|
3,921 |
|
|
Total share-based compensation expense |
|
$ |
13,037 |
|
|
$ |
13,071 |
|
|
$ |
10,328 |
|
Share-based compensation expense attributable to client-service employees was included in cost of services before reimbursable expenses. Share-based compensation expense attributable to corporate management and support personnel was included in general and administrative expenses.
Income tax benefit recorded in the accompanying consolidated statements of comprehensive income (loss) related to share-based compensation expense for the years ended December 31, 2017 and 2016 was $4.7 million and $4.9 million, respectively. The income tax benefit for the year ended December 31, 2017 reflects our effective tax rate adjusted for the impact of Tax Reform (see Note 15 – Income Taxes).
At December 31, 2017, we had $11.8 million of total compensation costs related to unvested share-based awards that have not been recognized as share-based compensation expense. The compensation costs will be recognized as an expense over the remaining vesting periods. The weighted average remaining vesting period is approximately two years. These grants include certain awards that vest based on relative achievement of pre-established performance criteria.
Restricted Stock Units Outstanding
The measurement price of our restricted stock units is the market price of our common stock at the date of grant of the awards.
At December 31, 2017, we had $11.6 million of total compensation costs related to unvested restricted stock units that have not been recognized as share-based compensation expense. Those compensation costs will be recognized as an expense over the remaining vesting periods of the awards. The weighted average remaining vesting period of these awards is approximately two years.
The following table summarizes information regarding restricted stock units outstanding as of December 31, 2017:
|
Range of Measurement Date Prices |
|
Outstanding Shares (000s) |
|
|
Weighted Average Measurement Date Price |
|
||
|
$10.00 — $14.99 |
|
|
681 |
|
|
$ |
14.00 |
|
|
$15.00 — $19.99 |
|
|
915 |
|
|
|
15.78 |
|
|
$20.00 and above |
|
|
708 |
|
|
|
22.75 |
|
|
Total restricted stock units outstanding |
|
|
2,304 |
|
|
$ |
17.39 |
|
F-20
The following table summarizes restricted stock unit activity for the year ended December 31, 2017:
|
|
|
Number of Shares (000s) |
|
|
Weighted Average Measurement Date Price |
|
||
|
Restricted stock units outstanding at beginning of the period |
|
|
2,299 |
|
|
$ |
15.74 |
|
|
Granted |
|
|
796 |
|
|
|
22.21 |
|
|
Vested |
|
|
(681 |
) |
|
|
17.54 |
|
|
Forfeited |
|
|
(110 |
) |
|
|
14.07 |
|
|
Restricted stock units outstanding at end of period |
|
|
2,304 |
|
|
$ |
17.39 |
|
During the year ended December 31, 2017, we granted 795,515 restricted stock units. At the time of grant, the awards had a fair value of $17.7 million. Of the restricted stock units granted, 117,371 restricted stock units vest based upon the achievement of certain performance criteria or market conditions. Of the restricted stock units vested, 69,729 were performance-based or based on market conditions.
Stock Options Outstanding
At December 31, 2017, the intrinsic value of the stock options outstanding and stock options exercisable was $3.0 million and $2.2 million, respectively, based on a market price of $19.41 per share for our common stock at December 31, 2017.
The following table summarizes stock option activity for the year ended December 31, 2017:
|
|
|
Number of Shares (000s) |
|
|
Weighted Average Exercise Price |
|
||
|
Options outstanding beginning of the period |
|
|
701 |
|
|
$ |
14.09 |
|
|
Exercised |
|
|
(87 |
) |
|
|
10.75 |
|
|
Options outstanding at end of the period |
|
|
614 |
|
|
$ |
14.56 |
|
|
Options exercisable at end of the period |
|
|
439 |
|
|
$ |
14.50 |
|
The following table summarizes information regarding stock options outstanding at December 31, 2017:
|
Range of Exercise Prices |
|
Outstanding Shares (000s) |
|
|
Weighted Average Exercise Price |
|
|
Remaining Exercise Period (years) |
|
|||
|
$10.00 — $14.99 |
|
|
343 |
|
|
$ |
13.32 |
|
|
|
1.7 |
|
|
$15.00 — $19.99 |
|
|
271 |
|
|
|
16.14 |
|
|
|
3.6 |
|
|
Total |
|
|
614 |
|
|
$ |
14.56 |
|
|
|
2.5 |
|
The following table summarizes information regarding stock options exercisable at December 31, 2017:
|
Range of Measurement Date Prices |
|
Outstanding Shares (000s) |
|
|
Average Measurement Date Price |
|
|
Remaining Exercise Period (years) |
|
|||
|
$10.00 — $14.99 |
|
|
297 |
|
|
$ |
13.31 |
|
|
|
1.5 |
|
|
$15.00 — $19.99 |
|
|
142 |
|
|
|
16.98 |
|
|
|
3.1 |
|
|
Total |
|
|
439 |
|
|
$ |
14.50 |
|
|
|
2.0 |
|
F-21
The following table summarizes the information regarding stock options outstanding, under the plan at December 31, 2017:
|
Plan Category |
|
Outstanding Shares (000s) |
|
|
Weighted Average Exercise Price |
|
|
Shares Remaining Available for Future Issuances (000s) |
|
|||
|
Long-Term Incentive Plan (2017 Plan) |
|
|
614 |
|
|
$ |
14.56 |
|
|
|
2,572 |
|
|
Total |
|
|
614 |
|
|
$ |
14.56 |
|
|
|
2,572 |
|
Stock Option Grants
The fair value of each option grant is estimated at the grant date using the Black-Scholes-Merton option-pricing model. No such grants were issued during the year ended December 31, 2017. The weighted average fair value of options granted and the assumptions used in the Black-Scholes-Merton option-pricing model were as follows:
|
|
|
|
2016 |
|
|
2015 |
|
||
|
Fair value of options granted |
|
|
$ |
4.85 |
|
|
$ |
4.59 |
|
|
Expected volatility |
|
|
|
33 |
% |
|
|
36 |
% |
|
Risk-free interest rate |
|
|
|
1.6 |
% |
|
|
1.8 |
% |
|
Forfeiture rate |
|
|
|
0 |
% |
|
|
0 |
% |
|
Dividend yield |
|
|
|
0 |
% |
|
|
0 |
% |
|
Contractual or expected lives (years) |
|
|
|
5.0 |
|
|
|
5.0 |
|
We estimated a zero forfeiture rate for these stock option grants as the awards have short vesting terms and have a low probability of forfeiture based on the recipients of the stock options.
During the years ended December 31, 2017, 2016, and 2015, we received $0.6 million, $1.3 million, and $3.5 million, respectively, of cash from employee stock option exercises. Additionally, during the years ended December 31, 2017, 2016, and 2015, we generated tax benefits of $0.3 million, $0.2 million, and $0.2 million, respectively, related to employee stock option exercises.
Employee Stock Purchase Plan
On May 3, 2006, our shareholders approved an employee stock purchase plan that became effective on January 1, 2007. The employee stock purchase plan permits employees to purchase shares of our common stock each quarter at 90 percent of the market value. The market value of shares purchased for this purpose is determined to be the closing market price on the last day of each calendar quarter. The plan is considered compensatory and, as such, the purchase discount from market price purchased by employees is recorded as compensation expense. During the years ended December 31, 2017, 2016 and 2015, we recorded $0.4 million, $0.3 million, and $0.3 million, respectively, of compensation expense related to the discount given on employee stock purchases through our employee stock purchase plan. During the years ended December 31, 2017, 2016 and 2015, we issued 183,029, 178,857, and 191,377 shares, respectively, of our common stock pursuant to this plan.
The maximum number of shares of our common stock remaining at December 31, 2017 that can be issued under the employee stock purchase plan was 2,605,983 shares, which includes 2.5 million additional shares authorized by shareholders on May 16, 2017, subject to certain adjustments. The employee stock purchase plan will expire on the date that all of the shares available under it are purchased by or issued to employees.
During the years ended December 31, 2017, 2016, and 2015, we received $3.3 million, $3.0 million, and $2.5 million, respectively, of cash from employee stock purchases.
F-22
Accounts Receivable, Net
The components of accounts receivable were as follows (in thousands):
|
|
December 31, |
|
|
December 31, |
|
||||
|
|
2017 |
|
|
2016 |
|
||||
|
Billed amounts |
$ |
|
194,694 |
|
|
$ |
|
183,656 |
|
|
Engagements in process |
|
|
102,026 |
|
|
|
|
100,779 |
|
|
Allowance for uncollectible billed amounts |
|
|
(18,274 |
) |
|
|
|
(14,967 |
) |
|
Allowance for uncollectible engagements in process |
|
|
(10,605 |
) |
|
|
|
(7,713 |
) |
|
Accounts receivable, net |
$ |
|
267,841 |
|
|
$ |
|
261,755 |
|
Receivables attributable to engagements in process represent balances for services that have been performed and earned but have not been billed to the client. Services are generally billed on a monthly basis for the prior month’s services. Our allowance for uncollectible accounts is based on historical experience and management judgment and may change based on market conditions or specific client circumstances.
Prepaid Expenses and Other Current Assets
The components of prepaid expenses and other current assets were as follows (in thousands):
|
|
December 31, |
|
|
December 31, |
|
||||
|
|
2017 |
|
|
2016 |
|
||||
|
Notes receivable - current |
$ |
|
3,047 |
|
|
$ |
|
2,636 |
|
|
Prepaid recruiting and retention incentives - current |
|
|
8,705 |
|
|
|
|
9,173 |
|
|
Other prepaid expenses and other current assets |
|
|
21,169 |
|
|
|
|
17,953 |
|
|
Prepaid expenses and other current assets |
$ |
|
32,921 |
|
|
$ |
|
29,762 |
|
Other Assets
The components of other assets were as follows (in thousands):
|
|
December 31, |
|
|
December 31, |
|
||||
|
|
2017 |
|
|
2016 |
|
||||
|
Notes receivable - non-current |
$ |
|
6,260 |
|
|
$ |
|
2,943 |
|
|
Capitalized client-facing assets |
|
|
1,803 |
|
|
|
|
1,733 |
|
|
Prepaid recruiting and retention incentives - non-current |
|
|
8,611 |
|
|
|
|
11,116 |
|
|
Prepaid expenses and other non-current assets |
|
|
6,870 |
|
|
|
|
2,490 |
|
|
Other assets |
$ |
|
23,544 |
|
|
$ |
|
18,282 |
|
Notes receivable, current and non-current, represent unsecured employee loans. These loans were issued to recruit or retain certain senior-level client-service employees. During the years ended December 31, 2017 and 2016, we issued loans aggregating to $7.5 million and $1.3 million, respectively. The principal amount and accrued interest on these loans is either paid by the employee or forgiven by us over the term of the loans so long as the employee remains continuously employed by us and complies with certain contractual requirements. The expense associated with the forgiveness of the principal amount of the loans is amortized as compensation expense over the terms of the loans.
Capitalized client-facing assets include software and hardware that is used by our clients as part of their engagements. These amounts are amortized into cost of services before reimbursable expenses over their estimated remaining useful life.
Prepaid recruiting and retention incentives, current and non-current, include sign-on and retention bonuses that are generally recoverable from an employee if the employee voluntarily terminates employment or if the employee’s employment is terminated for “cause” prior to fulfilling his or her obligations to us. These amounts are amortized as compensation expense over the periods in which they are recoverable from the employees, which periods are generally up to six years. During the years ended December 31, 2017 and 2016, we granted $8.7 million and $12.4 million, respectively, in sign-on and retention bonuses.
F-23
The components of property and equipment, net were as follows (in thousands):
|
|
|
December 31, |
|
|
December 31, |
|
||
|
|
|
2017 |
|
|
2016 |
|
||
|
Furniture, fixtures and equipment |
|
$ |
72,776 |
|
|
$ |
69,210 |
|
|
Software |
|
|
93,883 |
|
|
|
83,766 |
|
|
Leasehold improvements |
|
|
57,689 |
|
|
|
57,128 |
|
|
Property and equipment, at cost |
|
|
224,348 |
|
|
|
210,104 |
|
|
Less: accumulated depreciation and amortization |
|
|
(135,179 |
) |
|
|
(127,151 |
) |
|
Property and equipment, net |
|
$ |
89,169 |
|
|
$ |
82,953 |
|
During the year ended December 31, 2017, we invested $38.7 million in property and equipment ($3.5 million of which was accrued), including $18.0 million in leasehold improvements related primarily to the build-out of our new Chicago corporate headquarters, $15.2 million in our technology infrastructure and software, $5.4 million in furniture and other equipment. In addition, we acquired $0.1 million in property and equipment as part of our business acquisitions. During the year ended December 31, 2017, we retired $21.2 million of fully-depreciated assets.
Other Current Liabilities
The components of other current liabilities were as follows (in thousands):
|
|
December 31, |
|
|
December 31, |
|
||||
|
|
2017 |
|
|
2016 |
|
||||
|
Deferred acquisition liabilities - current |
$ |
|
3,897 |
|
|
$ |
|
10,780 |
|
|
Deferred revenue |
|
|
27,979 |
|
|
|
|
21,258 |
|
|
Deferred rent - current |
|
|
3,341 |
|
|
|
|
2,894 |
|
|
Other current liabilities |
|
|
3,678 |
|
|
|
|
3,684 |
|
|
Total other current liabilities |
$ |
|
38,895 |
|
|
$ |
|
38,616 |
|
Other Non-Current Liabilities
The components of other non-current liabilities were as follows (in thousands):
|
|
December 31, |
|
|
December 31, |
|
||||
|
|
2017 |
|
|
2016 |
|
||||
|
Deferred acquisition liabilities - non-current |
$ |
|
1,972 |
|
|
$ |
|
943 |
|
|
Deferred rent - non-current |
|
|
28,534 |
|
|
|
|
19,776 |
|
|
Other non-current liabilities |
|
|
1,668 |
|
|
|
|
11,860 |
|
|
Total other non-current liabilities |
$ |
|
32,174 |
|
|
$ |
|
32,579 |
|
Deferred acquisition liabilities, current and non-current, at December 31, 2017 consisted of cash obligations related to contingent and definitive purchase price considerations recorded at fair value and net present value, respectively. During the year ended December 31, 2017, $10.0 million was paid for settlement of a deferred acquisition liability to the selling members of McKinnis, which we acquired in December 2015. During the year ended December 31, 2017, we recorded $2.0 million in definitive acquisition liabilities related to a small business acquisition made during the year. During the year ended December 31, 2017, we recorded a fair value adjustment which increased deferred contingent acquisition liabilities by $2.2 million. See Note 16 – Fair Value for additional information regarding deferred contingent consideration fair value adjustments.
The current and non-current portions of deferred rent relate to tenant allowances and incentives on lease arrangements for our office facilities that expire at various dates through 2028. During the year ended December 31, 2017, we recorded $4.8 million and $2.3 million in deferred rent related to tenant allowances granted under the leases for our new Chicago and San Francisco office spaces, respectively.
During the year ended December 31, 2017, we reclassified $2.5 million of performance-based long-term incentive compensation liabilities to equity upon grant of the related restricted stock units. As part of our long-term incentive program for select senior-level client- service employees and leaders, we grant restricted stock units which vest three years from the grant date. The value of equity granted is based on the relative achievement of certain performance targets during the year prior to grant.
F-24
During the year ended December 31, 2017, $6.9 million of uncertain tax positions in other non-current liabilities were resolved with tax agreements and tax accounting method changes (see Note 15 – Income Taxes).
Deferred revenue represents advance billings to our clients for services that have not yet been performed and earned.
The activity in accumulated other comprehensive loss was as follows (in thousands):
|
|
|
For the year ended |
|
||||||||||||
|
|
|
December 31, |
|
||||||||||||
|
|
|
2017 |
|
|
2016 |
|
|
2015 |
|
||||||
|
Unrealized loss on foreign exchange: |
|
|
|
|
|
|
|
|
|
|
|
|
|
|
|
|
Balance at beginning of period |
|
$ |
|
(25,166 |
) |
|
$ |
|
(16,446 |
) |
|
$ |
|
(11,973 |
) |
|
Unrealized gain (loss) on foreign exchange |
|
|
|
5,858 |
|
|
|
|
(8,720 |
) |
|
|
|
(4,473 |
) |
|
Balance at end of period |
|
$ |
|
(19,308 |
) |
|
$ |
|
(25,166 |
) |
|
$ |
|
(16,446 |
) |
|
|
|
|
|
|
|
|
|
|
|
|
|
|
|
|
|
|
Unrealized gain (loss) on derivatives: |
|
|
|
|
|
|
|
|
|
|
|
|
|
|
|
|
Balance at beginning of period |
|
$ |
|
(40 |
) |
|
$ |
|
(114 |
) |
|
$ |
|
(111 |
) |
|
Unrealized gain (loss) on derivatives in period, net of reclassification |
|
|
|
100 |
|
|
|
|
(72 |
) |
|
|
|
(317 |
) |
|
Reclassified to interest expense |
|
|
|
116 |
|
|
|
|
244 |
|
|
|
|
523 |
|
|
Income tax expense |
|
|
|
(46 |
) |
|
|
|
(98 |
) |
|
|
|
(209 |
) |
|
Balance at end of period |
|
$ |
|
130 |
|
|
$ |
|
(40 |
) |
|
$ |
|
(114 |
) |
|
|
|
|
|
|
|
|
|
|
|
|
|
|
|
|
|
|
|
|
2017 |
|
|
2016 |
|
|
2015 |
|
||||||
|
Accumulated other comprehensive loss at December 31, |
|
|
|
(19,178 |
) |
|
|
|
(25,206 |
) |
|
|
|
(16,560 |
) |
During the year ended December 31, 2017, the interest rate derivatives outstanding were as follows (summarized based on month of execution):
|
|
|
Number of |
|
|
|
|
|
|
|
|
|
|
Total Notional Amount |
|
||
|
Month executed |
|
Contracts |
|
|
Beginning Date |
|
Maturity Date |
|
Rate |
|
|
(millions) |
|
|||
|
June 2015 |
|
|
1 |
|
|
June 30, 2015 |
|
June 30, 2018 |
|
1.40% |
|
|
$ |
5.0 |
|
|
|
April 2017 |
|
|
2 |
|
|
April 13, 2017 |
|
April 30, 2020 |
|
1.81% |
|
|
$ |
15.0 |
|
|
|
July 2017 |
|
|
4 |
|
|
July 31, 2017 |
|
July 31, 2020 |
|
1.78% |
|
|
$ |
17.5 |
|
|
We expect the interest rate derivatives to be highly effective against changes in cash flows related to changes in interest rates and have recorded the derivatives as a cash flow hedge. As a result, gains or losses related to fluctuations in the fair value of the interest rate derivatives are recorded as a component of accumulated other comprehensive loss and reclassified into interest expense as the variable interest expense on our bank debt is recorded. There was no ineffectiveness related to the interest rate derivatives during the year ended December 31, 2017. For the year ended December 31, 2017, 2016 and 2015, we recorded $0.1 million, $0.2 million, and $0.5 million, respectively, in interest expense associated with differentials received or paid under the interest rate derivatives.
On March 28, 2017, we entered into a new credit agreement with a syndicate of banks, amending and extending the maturity date of the five-year, $400 million revolving credit facility provided under our prior credit agreement. As amended and restated, the credit facility matures on March 28, 2022. At our option, subject to the terms and conditions specified in the credit agreement, we may
F-25
elect to increase commitments under the credit facility up to an aggregate amount of $500 million. Borrowings and repayments under the credit facility may be made in multiple currencies including United States (U.S.) Dollars, Canadian Dollars, United Kingdom (U.K.) Pound Sterling and Euro.
At December 31, 2017, we had aggregate borrowings outstanding of $132.9 million, compared to $135.0 million at December 31, 2016. Based on our financial covenants at December 31, 2017, approximately $263.4 million in additional borrowings were available to us under the credit facility. At December 31, 2017, we had $3.6 million of unused letters of credit under our credit facility, which have been included as a reduction in the available borrowings above. The letters of credit are primarily related to the requirements of certain lease agreements for office space.
At our option, borrowings under the credit facility bear interest at a variable rate equal to an applicable base rate or LIBOR, in each case plus an applicable margin. For LIBOR loans, the applicable margin varies depending upon our consolidated leverage ratio (the ratio of total funded debt to adjusted EBITDA, as defined in the credit agreement). At December 31, 2017, the applicable margins on LIBOR and base rate loans were 1.00% and 0.00%, respectively. Depending upon our performance and financial condition, our LIBOR loans will have applicable margins varying between 1.00% and 2.00%, and our base rate loans have applicable margins varying between 0.00% and 1.00%. Our average borrowing rate (including the impact of our interest rate derivatives; see Note 11 — Derivatives and Hedging Activity) was 2.6% and 2.3% for the years ended December 31, 2017 and 2016, respectively.
Our credit agreement contains certain financial covenants, including covenants that require that we maintain a consolidated leverage ratio of not greater than 3.5:1, with certain exceptions as defined in the agreement, and a consolidated interest coverage ratio (the ratio of the sum of adjusted EBIT, as defined in the credit agreement, to cash interest expense) of not less than 2.0:1. At December 31, 2017, under the definitions in the credit agreement, our consolidated leverage ratio was 0.9 and our consolidated interest coverage ratio was 23.0. In addition, the credit agreement contains customary affirmative and negative covenants (subject to exceptions), including covenants that in certain circumstances limit our ability to incur liens or other encumbrances, make investments and acquisitions, incur indebtedness, enter into mergers, consolidations and asset dispositions, pay cash dividends after the occurrence of an event of default, change the nature of our business and engage in transactions with affiliates, as well as customary provisions with respect to events of default. We were in compliance with the covenants contained in our credit agreement at December 31, 2017; however, there can be no assurances that we will remain in compliance in the future.
Other operating costs (benefit) for the years ended December 31, 2017, 2016, and 2015 consisted of the following (shown in thousands):
|
|
|
2017 |
|
|
2016 |
|
|
2015 |
|
|||
|
Office consolidation, net: |
|
|
|
|
|
|
|
|
|
|
|
|
|
Adjustments to office closure obligations, discounted and net of expected sublease income |
|
$ |
141 |
|
|
$ |
509 |
|
|
$ |
1,354 |
|
|
Rent expense during office consolidation |
|
|
- |
|
|
|
- |
|
|
|
1,247 |
|
|
Accelerated depreciation |
|
|
101 |
|
|
|
33 |
|
|
|
165 |
|
|
Contingent acquisition liability adjustments, net |
|
|
2,213 |
|
|
|
1,330 |
|
|
|
(13,047 |
) |
|
Loss on disposition of assets |
|
|
- |
|
|
|
- |
|
|
|
283 |
|
|
Deferred debt issuance costs write off |
|
|
145 |
|
|
|
- |
|
|
|
- |
|
|
Other impairment |
|
|
- |
|
|
|
- |
|
|
|
98 |
|
|
Other costs |
|
|
1,620 |
|
|
|
- |
|
|
|
- |
|
|
Other operating costs (benefit) |
|
$ |
4,220 |
|
|
$ |
1,872 |
|
|
$ |
(9,900 |
) |
Office Consolidation, Net
During the year ended December 31, 2015, we recorded a cost of $2.6 million related to our new consolidated office space in New York City which we took possession of on October 22, 2014. The cost includes future rent expense, net of expected sublease income, accelerated depreciation and deferred rent relating to the old office space and rent expense for duplicate rent as we occupied our old New York City offices until completion of the build-out of the new space.
F-26
As of December 31, 2017, we have recorded $1.7 million in current and non-current liabilities for office consolidation expenses. The activity for the years ended December 31, 2017 and 2016 is as follows (shown in thousands):
|
|
|
Office Space Reductions |
|
|
|
Balance at December 31, 2015 |
|
$ |
3,083 |
|
|
Cost to operations during the year ended December 31, 2016 |
|
|
509 |
|
|
Utilized during the year ended December 31, 2016 |
|
|
(532 |
) |
|
Balance at December 31, 2016 |
|
$ |
3,060 |
|
|
Benefit to operations during the year ended December 31, 2017 |
|
|
(40 |
) |
|
Utilized during the year ended December 31, 2017 |
|
|
(1,340 |
) |
|
Balance at December 31, 2017 |
|
$ |
1,680 |
|
We monitor our estimates for office closure obligations and related expected sublease income, if any, on a periodic basis. Additionally, we continue to consider all options with respect to the abandoned offices, including settlements with the property owners and the timing of termination clauses under the respective lease. Such estimates are subject to market conditions and may be adjusted in future periods as necessary. Of the $1.7 million liability recorded at December 31, 2017, we expect to pay $0.9 million in cash relating to these obligations during the next twelve months. The office closure obligations have been discounted to net present value.
Contingent Acquisition Liability Adjustment, Net
Contingent acquisition liabilities are initially estimated based on expected performance at the acquisition date and subsequently reviewed each quarter (see Note 16 – Fair Value).
Other Costs
During the year ended December 31, 2017, we recorded one-time costs of $1.6 million relating to a legal matter.
We lease office facilities under operating lease arrangements that expire at various dates through 2028. We lease office facilities under operating leases that include fixed or minimum payments plus, in some cases, scheduled base rent increases over the terms of the leases and additional rents based on the Consumer Price Index. Certain leases provide for monthly payments of real estate taxes, insurance and other operating expenses applicable to the property.
Future minimum annual lease payments for the years subsequent to December 31, 2017 and in the aggregate are as follows (shown in thousands):
|
Year ending December 31, |
|
Amount |
|
|
|
2018 |
|
$ |
27,537 |
|
|
2019 |
|
|
25,187 |
|
|
2020 |
|
|
23,392 |
|
|
2021 |
|
|
18,522 |
|
|
2022 |
|
|
12,721 |
|
|
Thereafter |
|
|
44,988 |
|
|
|
|
$ |
152,347 |
|
Rent expense for operating leases was $32.1 million, $29.8 million and $28.6 million for the years ended December 31, 2017, 2016 and 2015, respectively.
F-27
The sources of income before income taxes are as follows (shown in thousands):
|
|
|
For the year ended |
|
|||||||||
|
|
|
December 31, |
|
|||||||||
|
|
|
2017 |
|
|
2016 |
|
|
2015 |
|
|||
|
United States |
|
$ |
64,631 |
|
|
$ |
81,226 |
|
|
$ |
81,049 |
|
|
Foreign |
|
|
5,950 |
|
|
|
12,185 |
|
|
|
7,104 |
|
|
Income before income tax expense (benefit) |
|
$ |
70,581 |
|
|
$ |
93,411 |
|
|
$ |
88,153 |
|
Income tax expense (benefit) consists of the following (shown in thousands):
|
|
|
For the year ended |
|
|||||||||
|
|
|
December 31, |
|
|||||||||
|
|
|
2017 |
|
|
2016 |
|
|
2015 |
|
|||
|
Federal: |
|
|
|
|
|
|
|
|
|
|
|
|
|
Current |
|
$ |
7,278 |
|
|
$ |
28,359 |
|
|
$ |
10,357 |
|
|
Deferred |
|
|
(18,152 |
) |
|
|
(1,102 |
) |
|
|
11,163 |
|
|
Total |
|
|
(10,874 |
) |
|
|
27,257 |
|
|
|
21,520 |
|
|
State: |
|
|
|
|
|
|
|
|
|
|
|
|
|
Current |
|
|
2,891 |
|
|
|
6,649 |
|
|
|
1,915 |
|
|
Deferred |
|
|
1,688 |
|
|
|
(310 |
) |
|
|
2,900 |
|
|
Total |
|
|
4,579 |
|
|
|
6,339 |
|
|
|
4,815 |
|
|
Foreign: |
|
|
|
|
|
|
|
|
|
|
|
|
|
Current |
|
|
1,923 |
|
|
|
2,459 |
|
|
|
1,729 |
|
|
Deferred |
|
|
1 |
|
|
|
(742 |
) |
|
|
(256 |
) |
|
Total |
|
|
1,924 |
|
|
|
1,717 |
|
|
|
1,473 |
|
|
Total federal, state and foreign income tax expense (benefit) |
|
$ |
(4,371 |
) |
|
$ |
35,313 |
|
|
$ |
27,808 |
|
Income tax expense (benefit) differs from the amounts estimated by applying the statutory income tax rates to income before income taxes as follows:
|
|
|
For the year ended |
|
|||||||||
|
|
|
December 31, |
|
|||||||||
|
|
|
2017 |
|
|
2016 |
|
|
2015 |
|
|||
|
Federal tax expense at the statutory rate |
|
|
35.0 |
% |
|
|
35.0 |
% |
|
|
35.0 |
% |
|
State tax expense at the statutory rate, net of federal tax benefits |
|
|
4.7 |
|
|
|
4.5 |
|
|
|
4.8 |
|
|
Foreign taxes |
|
|
(0.6 |
) |
|
|
(1.9 |
) |
|
|
(0.9 |
) |
|
Effect of change in accounting for stock compensation |
|
|
(2.4 |
) |
|
|
- |
|
|
|
- |
|
|
Effect of enacted tax rate changes |
|
|
(42.0 |
) |
|
|
- |
|
|
|
(0.6 |
) |
|
Effect of contingent earn-out adjustment |
|
|
- |
|
|
|
- |
|
|
|
(6.9 |
) |
|
Effect of valuation allowances |
|
|
0.4 |
|
|
|
(0.7 |
) |
|
|
0.8 |
|
|
Effect of permanent differences, net |
|
|
0.4 |
|
|
|
0.6 |
|
|
|
0.6 |
|
|
Effect of other transactions, net |
|
|
(1.7 |
) |
|
|
0.3 |
|
|
|
(1.3 |
) |
|
|
|
|
(6.2) |
% |
|
|
37.8 |
% |
|
|
31.5 |
% |
F-28
Deferred income taxes result from temporary differences between years in the recognition of certain expense items for income tax and financial reporting purposes. The source and income tax effects of these differences (shown in thousands) are as follows:
|
|
|
For the year ended |
|
|||||
|
|
|
December 31, |
|
|||||
|
|
|
2017 |
|
|
2016 |
|
||
|
Deferred tax assets (liabilities) attributable to: |
|
|
|
|
|
|
|
|
|
Allowance for uncollectible receivables |
|
$ |
4,600 |
|
|
$ |
5,231 |
|
|
Deferred revenue |
|
|
3,284 |
|
|
|
3,427 |
|
|
Accrued compensation |
|
|
1,884 |
|
|
|
1,601 |
|
|
Accrued office consolidation costs |
|
|
224 |
|
|
|
644 |
|
|
Interest rate derivatives |
|
|
- |
|
|
|
26 |
|
|
Share-based compensation |
|
|
8,072 |
|
|
|
10,403 |
|
|
Unsecured employee loans |
|
|
1,055 |
|
|
|
785 |
|
|
Deferred rent |
|
|
4,806 |
|
|
|
8,683 |
|
|
Foreign net operating losses |
|
|
1,723 |
|
|
|
1,417 |
|
|
Other |
|
|
854 |
|
|
|
2,171 |
|
|
Deferred tax assets before foreign valuation allowance |
|
|
26,502 |
|
|
|
34,388 |
|
|
Foreign valuation allowance |
|
|
(1,729 |
) |
|
|
(1,410 |
) |
|
Deferred tax assets |
|
|
24,773 |
|
|
|
32,978 |
|
|
Goodwill and intangible assets — domestic acquisition cost |
|
|
(72,918 |
) |
|
|
(95,708 |
) |
|
Goodwill and intangible assets — foreign acquisition cost |
|
|
(652 |
) |
|
|
(620 |
) |
|
Depreciation and amortization |
|
|
(10,370 |
) |
|
|
(10,965 |
) |
|
Prepaid expenses |
|
|
(1,964 |
) |
|
|
(3,422 |
) |
|
Deferred tax liabilities |
|
|
(85,904 |
) |
|
|
(110,715 |
) |
|
Net deferred tax liabilities |
|
$ |
(61,131 |
) |
|
$ |
(77,737 |
) |
When appropriate, we evaluate the need for a valuation allowance to reduce deferred tax assets. The evaluation of the need for a valuation allowance requires management judgment and could impact our financial results and effective tax rate. Management has determined that it is more likely than not, due to the uncertainty surrounding certain of our international business operations, that sufficient future taxable income will not be available to realize certain deferred tax assets, therefore management recognized a full valuation allowance for those deferred tax assets in the financial statements.
On January 1, 2017, we adopted FASB ASU 2016-09, Compensation-Stock Compensation (Topic 718): Improvements to Employee Share-Based Payment Accounting. As required by the standard, excess tax benefits and deficiencies recognized in share-based compensation expense are recorded in the consolidated statement of comprehensive income as a component of income tax expense. Previously, these amounts were recorded as a component of additional paid-in capital on the consolidated balance sheet. During the year ended December 31, 2017, excess tax benefits of $1.7 million related to exercised and vested share-based compensation awards reduced income tax expense in the consolidated statement of comprehensive income. See Note 2 – Summary of Significant Accounting Policies and Recent Accounting Pronouncements for further information.
Unrecognized Tax Benefits
A reconciliation of the beginning and ending amount of unrecognized tax benefits is as follows:
|
|
|
Amount |
|
|
|
|
|
(in thousands) |
|
|
|
Balance at January 1, 2017 |
|
$ |
10,360 |
|
|
Additions based on tax positions related to the current year |
|
|
228 |
|
|
Additions based on tax positions of prior years |
|
|
- |
|
|
Reductions based on tax positions of prior years |
|
|
(8,879 |
) |
|
Settlements |
|
|
(47 |
) |
|
Balance at December 31, 2017 |
|
$ |
1,662 |
|
F-29
Of the $1.7 million of our accrual for uncertain tax positions at December 31, 2017, $0.4 million would impact our effective income tax rate if recognized. We believe that only a specific resolution of the matters with the taxing authorities or the expiration of the applicable statute of limitations would provide sufficient evidence for management to conclude that the deductibility is more likely than not sustainable.
We recognize interest and penalties accrued related to uncertain tax positions as income tax expense. The total amount of interest and penalties accrued as of December 31, 2017 and December 31, 2016 was $0.3 million and $0.6 million, respectively.
During the year ended December 31, 2016, we increased our accrual for uncertain tax positions by $8.7 million due to a tax accounting method change that was resolved during the year ended December 31, 2017.
During the year ended December 31, 2015, we acquired a liability for uncertain tax positions of $1.3 million in connection with our acquisition of the Indian subsidiary of RevenueMed. Based on the indemnification terms of the purchase agreement, which entitle us to indemnification if tax is due, an offsetting receivable from RevenueMed was recorded. As a result, we estimate that the settlement or other disposition of this matter will not have an impact on our effective income tax rate.
We are subject to U.S. federal income tax as well as income tax in multiple state and foreign jurisdictions. We have substantially concluded all U.S. federal and material state income tax matters for years through 2013. We are currently under audit with the Internal Revenue Service for the year 2014. Our Indian subsidiary which we acquired from RevenueMed is currently under either audit or tax appeals with its local taxing authority for all statutory tax years 2009 through 2014.
On December 22, 2017, the President of the United States signed into law Tax Reform. The legislation significantly changes U.S. tax law by, among other things, lowering corporate income tax rates, implementing a territorial tax system and imposing a repatriation tax on deemed repatriated earnings of foreign subsidiaries. Tax Reform permanently reduces the U.S. corporate income tax rate from a maximum of 35% to a flat 21% rate, effective January 1, 2018.
The Company uses the asset and liability method of accounting for income taxes. Under this method, deferred tax assets and liabilities are recognized for the future tax consequences attributable to differences between the financial statement carrying amounts of existing assets and liabilities and their respective tax basis. Deferred tax assets and liabilities are measured using enacted tax rates expected to apply to taxable income in the years in which those temporary differences are expected to reverse. As a result of the reduction in the U.S. corporate income tax rate from 35% to 21% under Tax Reform, the Company revalued its ending net deferred tax liabilities at December 31, 2017 and recognized a provisional $29.8 million tax benefit in the Company’s consolidated statement of comprehensive income for the year ended December 31, 2017.
Tax Reform provided for a one-time deemed mandatory repatriation of post-1986 undistributed foreign subsidiary earnings and profits (“E&P”) through the year ended December 31, 2017. The Company had an estimated $5.6 million of undistributed foreign E&P subject to the deemed mandatory repatriation and recognized a provisional $0.9 million of income tax expense in the Company’s consolidated statement of comprehensive income for the year ended December 31, 2017. After the utilization of deemed foreign tax credits, the Company expects to pay additional U.S. federal cash taxes of approximately $0.1 million on the deemed mandatory repatriation, payable over eight years.
While Tax Reform provides for a territorial tax system, beginning in 2018, it includes two new U.S. tax base erosion provisions, the global intangible low-taxed income (“GILTI”) provisions and the base-erosion and anti-abuse tax (“BEAT”) provisions.
The GILTI provisions require the Company to include in its U.S. income tax return foreign subsidiary earnings in excess of an allowable return on the foreign subsidiary’s tangible assets. The Company has elected to account for GILTI tax in the period in which it is incurred, and therefore has not provided any deferred tax impacts of GILTI in its consolidated financial statements for the year ended December 31, 2017.
The BEAT provisions in Tax Reform eliminates the deduction of certain base-erosion payments made to related foreign corporations, and imposes a minimum tax if greater than regular tax. The Company believes it has not made a material amount of base-erosion payments and has not included any tax impacts of BEAT in its consolidated financial statements for the year ended December 31, 2017.
On December 22, 2017, the SEC staff issued Staff Accounting Bulletin No. 118 (“SAB 118”) to address the application of U.S. GAAP in situations when a registrant does not have the necessary information available, prepared, or analyzed (including computations) in reasonable detail to complete the accounting for certain income tax effects of Tax Reform. The Company has recognized the provisional tax impacts related to deemed repatriated earnings and the revaluation of deferred tax assets and liabilities and included these amounts in its consolidated financial statements for the year ended December 31, 2017. Included in the provisional amount is $0.1 million for the income tax on the deemed repatriation of unremitted foreign earnings. We have computed the amount based on information available to us; however, we have not yet completed our analysis of the components of the computation, including the amount of our foreign earnings and profits subject to U.S. income tax. In addition, we have included in the provisional
F-30
amount a tax benefit of $29.8 million for the revaluation of deferred tax assets and liabilities. We have also computed this amount based on information available to us; however; there is still uncertainty as to the application of Tax Reform, in particular as it relates to executive compensation. We also anticipate that the completion of our 2017 income tax returns by the fourth quarter of 2018 will impact the provisional amounts we have recorded. As we complete our analysis of U.S. tax reform in 2018, the ultimate impact may differ from these provisional amounts, possibly materially, due to, among other things, additional analysis, changes in interpretations and assumptions the Company has made, additional regulatory guidance that may be issued, and actions the Company may take as a result of Tax Reform. The accounting is expected to be complete when the 2017 U.S. corporate income tax return is filed in 2018.
As a result of the deemed mandatory repatriation provisions in Tax Reform, the Company included an estimated $5.6 million of undistributed earnings in income subject to U.S. tax at reduced tax rates. The Company does not intend to distribute earnings in a taxable manner, and therefore intends to limit distributions to earnings previously taxed in the U.S., or earnings that would qualify for the 100% dividends received deduction provided for in Tax Reform, and earnings that would not result in any significant foreign taxes. As a result, the Company has not recognized a deferred tax liability on its investment in foreign subsidiaries.
Fair value is defined as the price that would be received on the sale of an asset or paid to transfer a liability in an orderly transaction between market participants at the measurement date (exit price). The inputs used to measure fair value are classified into the following hierarchy:
Level 1: Unadjusted quoted prices in active markets for identical assets or liabilities.
Level 2: Unadjusted quoted prices in active markets for similar assets or liabilities, or unadjusted quoted prices for identical or similar assets or liabilities in markets that are not active, or inputs other than quoted prices that are observable for the asset or liability.
Level 3: Unobservable inputs for the asset or liability.
We endeavor to utilize the best available information in measuring fair value. Financial assets and liabilities are classified in their entirety based on the lowest level of input that is significant to the fair value measurement. As circumstances change, we will reassess the level in which the inputs are included in the fair value hierarchy.
We utilize a third-party to value our interest rate derivatives. The interest rate derivatives are used to hedge the risk of variability from interest payments on our borrowings (see Note 11 — Derivatives and Hedging Activity). A majority of the inputs used in determining the fair value of the derivatives is derived mainly from Level 2 observations which include counterparty quotations in over-the-counter markets. However, the credit valuation adjustments associated with the derivatives utilize Level 3 inputs, such as estimates of current credit spreads, to evaluate the likelihood of default by ourselves and our counterparties. We determined that these adjustments are not significant to the overall valuation of our derivatives. As a result, our interest rate derivatives are classified in Level 2 in the fair value hierarchy.
In certain instances our acquisitions provide for deferred contingent acquisition payments. These deferred payments are recorded at fair value at the time of acquisition and are included in other current and/or non-current liabilities on our consolidated balance sheets. We estimate the fair value of our deferred contingent acquisition liabilities using a probability-weighted discounted cash flow model. This fair value measure is based on significant inputs not observed in the market and thus represents a Level 3 measurement. Fair value measurements characterized within Level 3 of the fair value hierarchy are measured based on unobservable inputs that are supported by little or no market activity and reflect our own assumptions in measuring fair value.
The significant unobservable inputs used in the fair value measurements of our deferred contingent acquisition liabilities are our measures of the future profitability and related cash flows and discount rates. The fair value of the deferred contingent acquisition liabilities is reassessed on a quarterly basis based on assumptions provided to us by segment and business area leaders together with our corporate development and finance departments. Any change in the fair value estimate is recorded in the earnings of that period. During the years ended December 31, 2017 and 2016, we recorded costs of $2.2 million and $1.3 million, respectively, in other operating costs (benefit) for a net increase in the liability, reflecting changes in the fair value estimate of the deferred contingent acquisition liability (see Note 3 – Acquisitions). The following table summarizes the changes in deferred contingent acquisition liabilities (in thousands):
F-31
|
|
|
For the year ended |
|
|||||
|
|
|
December 31, |
|
|||||
|
|
|
2017 |
|
|
2016 |
|
||
|
Beginning Balance |
|
$ |
1,723 |
|
|
$ |
8,782 |
|
|
Acquisitions |
|
|
- |
|
|
|
1,668 |
|
|
Accretion of acquisition-related contingent consideration |
|
|
264 |
|
|
|
771 |
|
|
Remeasurement of acquisition-related contingent consideration |
|
|
2,213 |
|
|
|
1,330 |
|
|
Payments |
|
|
(330 |
) |
|
|
(828 |
) |
|
Reclassification to definitive consideration liability |
|
|
- |
|
|
|
(10,000 |
) |
|
Ending Balance |
|
$ |
3,870 |
|
|
$ |
1,723 |
|
At December 31, 2017, the carrying value of our bank debt approximated fair value as it bears interest at variable rates, and we believe our credit risk is consistent with when the debt originated. We consider the recorded value of our other financial assets and liabilities, which consist primarily of cash and cash equivalents, accounts receivable and accounts payable, to approximate the fair value of the respective assets and liabilities at December 31, 2017 based upon the short-term nature of the assets and liabilities.
Our financial assets and liabilities measured at fair value on a recurring basis at December 31, 2017 and December 31, 2016 (in thousands):
|
|
|
Quoted Prices in |
|
|
|
|
|
|
|
|
|
|
|
|
|
|
|
|
|
Active Markets for |
|
|
Significant Other |
|
|
Significant |
|
|
|
|
|
|||
|
|
|
Identical Assets |
|
|
Observable Inputs |
|
|
Unobservable Inputs |
|
|
|
|
|
|||
|
|
|
(Level 1) |
|
|
(Level 2) |
|
|
(Level 3) |
|
|
Total |
|
||||
|
At December 31, 2017 |
|
|
|
|
|
|
|
|
|
|
|
|
|
|
|
|
|
Interest rate derivatives, net |
|
$ |
- |
|
|
$ |
(213 |
) |
|
$ |
- |
|
|
$ |
(213 |
) |
|
Deferred contingent acquisition liabilities |
|
$ |
- |
|
|
$ |
- |
|
|
$ |
3,870 |
|
|
$ |
3,870 |
|
|
At December 31, 2016 |
|
|
|
|
|
|
|
|
|
|
|
|
|
|
|
|
|
Interest rate derivatives, net |
|
$ |
- |
|
|
$ |
64 |
|
|
$ |
- |
|
|
$ |
64 |
|
|
Deferred contingent acquisition liabilities |
|
$ |
- |
|
|
$ |
- |
|
|
$ |
1,723 |
|
|
$ |
1,723 |
|
We sponsor 401(k) savings plans for eligible U.S. employees and currently match a certain percentage of participant contributions pursuant to the terms of the plans, which contributions are limited to a percent of the participant’s eligible compensation, up to the annual limit specified by the Internal Revenue Service. We, as sponsor of the plans, use independent third parties to provide administrative services to the plans. We have the right to terminate the plans at any time. Our matching contributions were $9.5 million, $9.0 million, and $8.6 million for the years ended December 31, 2017, 2016 and 2015, respectively.
We sponsor other retirement plans for certain of our foreign subsidiaries’ employees. During the years ended December 31, 2017, 2016 and 2015, we recorded expense of $2.7 million, $2.7 million and $2.2 million, respectively, related to such plans.
We are a party to a variety of legal proceedings that arise in the normal course of our business. While the results of these legal proceedings cannot be predicted with certainty, we believe that the final outcome of these proceedings will not have a material adverse effect, individually or in the aggregate, on our results of operations or financial condition.
F-32
NAVIGANT CONSULTING, INC. AND SUBSIDIARIES
VALUATION AND QUALIFYING ACCOUNTS
Years ended December 31, 2017, 2016 and 2015
|
|
|
|
|
|
|
Additions |
|
|
|
|
|
|
|
|
|
|||||
|
|
|
Balance at |
|
|
|
|
|
|
Charged to |
|
|
|
|
|
|
Balance |
|
|||
|
|
|
Beginning |
|
|
Charged to |
|
|
Other |
|
|
|
|
|
|
at End |
|
||||
|
Description |
|
of Year |
|
|
Expenses |
|
|
Accounts (1) |
|
|
Deductions (2) |
|
|
of Year |
|
|||||
|
|
|
(in thousands) |
|
|||||||||||||||||
|
Year ended December 31, 2017 |
|
|
|
|
|
|
|
|
|
|
|
|
|
|
|
|
|
|
|
|
|
Allowance for doubtful accounts and uncollectable engagements in process |
|
$ |
22,680 |
|
|
$ |
7,755 |
|
|
$ |
2,830 |
|
|
$ |
(4,386 |
) |
|
$ |
28,879 |
|
|
Year ended December 31, 2016 |
|
|
|
|
|
|
|
|
|
|
|
|
|
|
|
|
|
|
|
|
|
Allowance for doubtful accounts and uncollectable engagements in process |
|
$ |
17,279 |
|
|
$ |
8,815 |
|
|
$ |
2,216 |
|
|
$ |
(5,630 |
) |
|
$ |
22,680 |
|
|
Year ended December 31, 2015 |
|
|
|
|
|
|
|
|
|
|
|
|
|
|
|
|
|
|
|
|
|
Allowance for doubtful accounts and uncollectable engagements in process |
|
$ |
17,839 |
|
|
$ |
2,578 |
|
|
$ |
1,362 |
|
|
$ |
(4,500 |
) |
|
$ |
17,279 |
|
|
(1) |
Represents estimated provision for uncollectible engagements in process recorded as a reduction to revenues. |
|
(2) |
Represents write-offs. |
See accompanying report of independent registered public accounting firm.
S-1