Attached files
| file | filename |
|---|---|
| EX-99.2 - EX-99.2 - AMERICAN WOODMARK CORP | d525787dex992.htm |
| EX-99.1 - EX-99.1 - AMERICAN WOODMARK CORP | d525787dex991.htm |
| 8-K - 8-K - AMERICAN WOODMARK CORP | d525787d8k.htm |
Exhibit 99.3
NON-GAAP FINANCIAL MEASURES
We have included certain financial measures in this offering memorandum that have not been prepared in a manner that complies with GAAP, including EBITDA, EBITDA margin, Adjusted EBITDA, Adjusted EBITDA margin, net debt and Free Cash Flow. The presentation of this financial information is not intended to be considered in isolation or as a substitute for, or superior to, the financial information prepared and presented in accordance with GAAP, and other companies may define such measures differently. Please see “Summary —Summary Financial and Other Data —Summary Historical and Pro Forma Financial and Operating Information of American Woodmark” for a discussion of EBITDA, EBITDA margin, Adjusted EBITDA, Adjusted EBITDA margin, net debt and Free Cash Flow.
We provide these non-GAAP financial measures because we believe they provide greater transparency and represent supplemental information used by management in its financial and operational decision making. We believe that these non-GAAP financial measures facilitate operating performance comparisons from period to period by eliminating potential differences caused by the existence and timing of certain expense items that would not otherwise be apparent on a GAAP basis. These non-GAAP performance measures should be considered in addition to, and not as a substitute for, results prepared in accordance with GAAP. Our non-GAAP performance measures may be different from those reported by other companies, including RSI.
CERTAIN DEFINITIONS
In this offering memorandum, unless otherwise specified or the context requires otherwise:
| • | “American Woodmark”, the “Company”, “we”, “our” and “us” refer to American Woodmark Corporation and its subsidiaries and affiliates as of the date hereof. |
| • | “Note Issuance” refers to, collectively, the (i) execution and delivery of the Indenture (as defined herein) and related documents, (ii) issuance of the Notes and Guarantees offered hereby and (iii) payment of fees, costs and expenses in connection with the issuance of the Notes and Guarantees. |
| • | “Refinancing Transactions” refers to, collectively, the (i) Conditional Redemption (as defined herein), (ii) Tender Offer and Consent Solicitation (as defined herein), (iii) Make-Whole Redemption (as defined herein), (iv) repayment of the outstanding balance of loans under the Senior Secured Revolving Facility and (v) payment of fees, commissions and expenses in connection with the foregoing. |
| • | “RSI” refers to RSI Home Products, Inc. and its subsidiaries as of the closing of the RSI Acquisition. |
| • | “RSI Acquisition” refers to the merger on December 29, 2017 of Alliance Merger Sub, Inc., a Delaware corporation and wholly-owned subsidiary of American Woodmark (“Acquisition Sub”), with and into RSI, with RSI continuing as a wholly-owned subsidiary of American Woodmark, pursuant to the terms of the Agreement and Plan of Merger dated as of November 30, 2017 by and among American Woodmark, RSI, Acquisition Sub and Ronald M. Simon, as the stockholder representative (together with all exhibits, attachments and schedules thereto, the “Acquisition Agreement”), and the consummation of the other transactions contemplated by the Acquisition Agreement. |
| • | “RSI Notes” refer to RSI’s existing 6 1⁄2% Senior Secured Second Lien Notes due 2023. |
| • | “RSI Notes Indenture” refers to the Indenture, dated as of March 16, 2015, by and among RSI, Wells Fargo Bank, National Association, as trustee and collateral agent, and the guarantors from time to time party thereto, pursuant to which the RSI Notes were issued, as may be amended from time to time. |
| • | “RSI Transactions” refers to, collectively, the: (i) entry by the Company into the Senior Secured Credit Facilities (including the initial borrowings thereunder and the use of the proceeds thereof), (ii) RSI Acquisition, (iii) repayment and termination of American Woodmark’s revolving credit facility available under that certain Credit Agreement, dated as of December 2, 2009 (the “2009 Revolving Facility”), by and between American Woodmark and Wells Fargo Bank, National Association (as amended, amended and restated, modified or supplemented after the date thereof), and (iv) payment of fees, commissions and expenses in connection with the foregoing. |
1
| • | “Senior Secured Credit Facilities” refers to, collectively, the $250 million initial term loan facility (the “Senior Secured Initial Term Loan”), the $250 million delayed draw term loan facility (the “Senior Secured Delayed Draw Term Loan” and, together with the Senior Secured Initial Term Loan, the “Senior Secured Term Loans”) and the $100 million revolving credit facility (the “Senior Secured Revolving Facility”) available under that certain Credit Agreement, dated as of December 29, 2017, among American Woodmark, the lenders from time to time party thereto and Wells Fargo Bank, National Association, as administrative agent. |
| • | “Transactions” refers to, collectively, the: (i) RSI Transactions, (ii) Refinancing Transactions, and (iii) Note Issuance. |
DISCLOSURE REGARDING FORWARD-LOOKING STATEMENTS
This offering memorandum contains statements concerning our expectations, plans, objectives, future financial performance, and other statements that are not historical facts. These statements may be “forward-looking statements” within the meaning of the Private Securities Litigation Reform Act of 1995. In most cases, the reader can identify forward-looking statements by words such as “anticipate,” “estimate,” “forecast,” “expect,” “believe,” “should,” “could,” “would,” “plan,” “may,” “intend,” “prospect,” “goal,” “will,” “predict,” “potential” or other similar words. Forward-looking statements contained in this offering memorandum are based on current expectations and our actual results may differ materially from those projected in any forward-looking statements. In addition, we participate in an industry that is subject to rapidly changing conditions and there are numerous factors that could cause us to experience a decline in sales and/or earnings or deterioration in financial condition. Factors that could cause actual results to differ materially from those in forward-looking statements made in this offering memorandum include but are not limited to:
| • | the loss of or a reduction in business from one or more of our key customers; |
| • | negative developments in the U.S. housing market or general economy and the impact of such developments on our and our customers’ business, operations and access to financing; |
| • | competition from other manufacturers and the impact of such competition on pricing and promotional levels; |
| • | an inability to develop new products or respond to changing consumer preferences and purchasing practices; |
| • | a failure to effectively manage manufacturing operations, alignment and capacity or an inability to maintain the quality of our products; |
| • | the impairment of goodwill, other intangible assets or our long-lived assets; |
| • | an inability to obtain raw materials in a timely manner or fluctuations in raw material and energy costs; |
| • | information systems interruptions or intrusions or the unauthorized release of confidential information concerning customers, employees or other third parties; |
| • | the cost of compliance with, or liabilities related to, environmental or other governmental regulations or changes in governmental or industry regulatory standards, especially with respect to health and safety and the environment; |
| • | a failure to attract and retain certain members of management or other key employees or other negative labor developments, including increases in the cost of labor; |
| • | risks associated with the implementation of our growth strategy; |
| • | risks related to sourcing and selling products internationally and doing business globally; |
2
| • | unexpected costs resulting from a failure to maintain acceptable quality standards; |
| • | changes in tax laws or the interpretations of existing tax laws; |
| • | the occurrence of significant natural disasters, including earthquakes, fires, floods, and hurricanes or tropical storms; |
| • | the unavailability of adequate capital for our business to grow and compete; |
| • | increased buying power of large customers and the impact on our ability to maintain or raise prices; |
| • | the effect of the RSI Acquisition on our ability to retain customers, maintain relationships with suppliers and hire and retain key personnel; |
| • | our ability to successfully integrate RSI into our business and operations and the risk that the anticipated economic benefits, costs savings and other synergies in connection with the RSI Acquisition are not fully realized or take longer to realize than expected; and |
| • | limitations on operating our business as a result of covenant restrictions under our indebtedness, and our ability to pay amounts due under our Senior Secured Credit Facilities and the Notes offered hereby. |
Other risks that could cause actual results to differ materially from those in forward-looking statements are set forth under the heading “Risk Factors” beginning on page 19. Any forward-looking statement speaks only as of the date of this offering memorandum, and we undertake no obligation to update any forward-looking statement to reflect events or circumstances occurring after the date on which it is made. Prospective purchasers are cautioned not to place undue reliance on these forward-looking statements that speak only as of the date hereof.
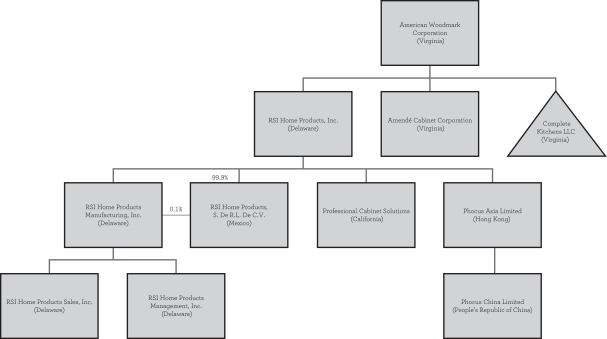
Our Organizational Structure
The following chart summarizes our current organizational structure.
3
SUMMARY FINANCIAL AND OTHER DATA
Summary Historical and Pro Forma Financial and Operating Information of American Woodmark
The following summary historical consolidated statements of operations data for the years ended April 30, 2017, 2016 and 2015 and summary historical consolidated balance sheet data as of April 30, 2017 and 2016 have been derived from American Woodmark’s historical audited consolidated financial statements and the related notes included in this offering memorandum. The summary historical consolidated balance sheet data as of April 30, 2015 is derived from our audited consolidated financial statements and related notes which are not included in this offering memorandum. The summary historical consolidated financial information of American Woodmark as of October 31, 2017 and for the six-month periods ended October 31, 2017 and 2016 have been derived from American Woodmark’s historical unaudited condensed consolidated financial statements and the related notes included in this offering memorandum. In the opinion of American Woodmark’s management, the unaudited condensed consolidated financial statements and the related notes of American Woodmark have been prepared on the same basis as its audited consolidated financial statements and the related notes and include all adjustments, consisting of normal recurring adjustments, necessary for a fair statement of the financial position of American Woodmark as of October 31, 2017 and its results of operations for the six-month periods ended October 31, 2017 and 2016. Results of interim periods are not necessarily indicative of the results expected for a full year or for future periods.
The following summary consolidated financial information should be read together with the information included in “Management’s Discussion and Analysis of Financial Condition and Results of Operation of American Woodmark” and American Woodmark’s consolidated financial statements and the related notes included elsewhere in this offering memorandum. The summary consolidated financial information in this section is not intended to replace American Woodmark’s consolidated financial statements and the related notes. American Woodmark’s historical results are not necessarily indicative of future performance.
The summary unaudited pro forma condensed combined balance sheet information gives effect to the Transactions as if they had been consummated on October 31, 2017, and includes pro forma adjustments based on American Woodmark management’s preliminary valuations of certain tangible and intangible assets. The summary unaudited pro forma condensed combined statements of operations information gives effect to the Transactions as if they had been consummated on May 1, 2016.
The summary unaudited pro forma condensed combined statement of operations information for the twelve months ended October 31, 2017 has been derived by combining the sum of (1) American Woodmark’s unaudited pro forma condensed combined statement of operations information for the fiscal year ended April 30, 2017 plus (2) American Woodmark’s unaudited pro forma condensed combined statement of operations information for the six months ended October 31, 2017 less (3) American Woodmark’s unaudited pro forma condensed combined statement of operations information for the six months ended October 31, 2016. Pro forma operating results for the periods presented herein are not necessarily indicative of results for a full year or for any other period.
The following summary unaudited pro forma condensed combined financial information has been prepared by applying the acquisition method of accounting with American Woodmark treated as the acquirer for accounting purposes and is dependent on certain valuations and other analyses that have yet to progress to a stage where there is sufficient information for a definitive measurement. Accordingly, any pro forma adjustments, including the allocation of the purchase price, are preliminary, have been made solely for the purpose of providing summary unaudited pro forma condensed combined financial information and may be revised as additional information becomes available and additional analysis is performed. The following summary unaudited pro forma condensed combined financial information has been derived from, and should be read in conjunction with, the historical consolidated financial statements and the related notes of both American Woodmark and RSI included elsewhere in this offering memorandum, together with the more detailed unaudited pro forma condensed combined financial information provided in the section entitled “Unaudited Pro Forma Condensed Combined Financial Information”. The following summary unaudited pro forma condensed combined financial information is subject to risks and uncertainties, including those discussed in the section of this offering memorandum entitled “Risk Factors”. See “Risk Factors —Risks Related to the RSI Acquisition —
4
The pro forma financial information included in this offering memorandum are presented for illustrative purposes only and may not be an indication of American Woodmark’s financial condition or results of operations following the RSI Acquisition”.
The summary unaudited pro forma condensed combined financial information set forth below has been presented for informational purposes only and is not necessarily indicative of what the combined financial condition or results of operations actually would have been had the RSI Acquisition been completed as of the assumed dates or for the periods presented. In addition, the summary unaudited pro forma condensed combined financial information presented below does not purport to project the combined financial condition or operating results for any future period.
| American Woodmark Historical Consolidated Financial Information |
Pro
Forma (Non-GAAP) Twelve Months Ended October 31, |
|||||||||||||||||||||||
| Year Ended April 30, | Six Months Ended October 31, |
|||||||||||||||||||||||
| 2015 | 2016 | 2017 | 2016 | 2017 | 2017(a) | |||||||||||||||||||
| (dollars in thousands, other than percentages and ratios) | ||||||||||||||||||||||||
| Statement of Operations Information |
||||||||||||||||||||||||
| Net sales |
$ | 825,465 | $ | 947,045 | $ | 1,030,248 | $ | 522,226 | $ | 551,596 | $ | 1,628,644 | ||||||||||||
| Cost of sales & distributions |
672,933 | 747,351 | 805,612 | 406,757 | 435,767 | 1,236,777 | ||||||||||||||||||
| Gross profit |
152,532 | 199,694 | 224,636 | 115,469 | 115,829 | 391,867 | ||||||||||||||||||
| Sales & marketing expense |
64,304 | 66,489 | 70,979 | 33,609 | 36,230 | 97,319 | ||||||||||||||||||
| General & administrative expense |
33,773 | 40,045 | 45,419 | 21,607 | 17,950 | 124,031 | ||||||||||||||||||
| Operating income |
54,695 | 93,160 | 108,238 | 60,253 | 61,649 | 170,517 | ||||||||||||||||||
| Interest & other (income) expense |
308 | 1,374 | (687 | ) | (137 | ) | (1,186 | ) | 37,450 | |||||||||||||||
| Net income |
$ | 35,499 | $ | 58,723 | $ | 71,199 | $ | 39,298 | $ | 42,036 | $ | 92,483 | ||||||||||||
| Key Balance Sheet Items (as of period end) |
||||||||||||||||||||||||
| Cash and cash equivalents |
$ | 149,541 | $ | 174,463 | $ | 176,978 | $ | 155,644 | $ | 162,545 | $ | 102,019 | ||||||||||||
| Total assets |
398,835 | 466,360 | 501,273 | 494,510 | 513,305 | 1,719,036 | ||||||||||||||||||
| Total liabilities |
169,062 | 185,599 | 148,824 | 179,241 | 138,162 | 1,167,431 | ||||||||||||||||||
| Total liabilities and shareholders’ equity |
398,835 | 466,360 | 501,273 | 494,510 | 513,305 | 1,719,036 | ||||||||||||||||||
| Other Key Performance Metrics |
||||||||||||||||||||||||
| Net cash provided by operating activities |
$ | 60,164 | $ | 74,604 | $ | 77,080 | $ | 40,146 | $ | 41,838 | ||||||||||||||
| Net cash used by investing activities |
(56,606 | ) | (40,773 | ) | (53,744 | ) | (50,417 | ) | (31,136 | ) | ||||||||||||||
| Net cash provided by (used in) financing activities |
10,283 | (8,909 | ) | (20,821 | ) | (8,548 | ) | (25,135 | ) | |||||||||||||||
| Capital expenditures |
20,015 | 28,685 | 21,811 | 10,354 | 20,660 | |||||||||||||||||||
| EBITDA(b) |
69,347 | 108,363 | 127,367 | 69,205 | 72,664 | 255,979 | ||||||||||||||||||
| EBITDA margin(b) |
8 | % | 11 | % | 12 | % | 13 | % | 13 | % | 16 | % | ||||||||||||
| Net debt (as of period end)(c) |
(126,655 | ) | (150,744 | ) | (160,101 | ) | (130,149 | ) | (143,038 | ) | 755,432 | |||||||||||||
| Adjusted EBITDA(b) |
73,237 | 113,548 | 133,966 | 71,028 | 74,357 | 268,139 | ||||||||||||||||||
| Adjusted EBITDA margin(b) |
9 | % | 12 | % | 13 | % | 14 | % | 13 | % | 16 | % | ||||||||||||
| Ratio of total debt to Adjusted EBITDA(b) |
0.31x | 0.21x | 0.13x | 0.36x | 0.24x | 3.20x | ||||||||||||||||||
| Ratio of net debt to Adjusted EBITDA(c) |
(1.73x | ) | (1.33x | ) | (1.20x | ) | (1.83x | ) | (1.95x | ) | 2.82x | |||||||||||||
| Free Cash Flow(d) |
40,149 | 45,919 | 55,269 | 29,792 | 21,178 | |||||||||||||||||||
| (a) | Due to transitions out of select markets, RSI’s net sales declined in the third quarter of 2017. This trend continued in the fourth quarter of 2017, which we expect to have a modest effect on RSI’s operating results in the fourth quarter of 2017. |
| (b) | EBITDA, EBITDA margin, Adjusted EBITDA and Adjusted EBITDA margin are measurements of operational performance that are not prepared and presented in accordance with GAAP. While we believe that the presentation of these non-GAAP measures will enhance an investor’s understanding of our operating performance, the use of these non-GAAP measures as an analytical tool has limitations and should not be considered in isolation, or as substitutes for an analysis of our results of operations as reported in accordance with GAAP. We define EBITDA as net income adjusted to exclude interest income and add back such items as: interest expense, income tax provision, and depreciation and amortization. We define EBITDA margin as EBITDA divided by net sales. We define Adjusted EBITDA as EBITDA adjusted to exclude such items as: restructuring charges, stock based compensation, corporate business development |
5
| expense and loss on disposal of property, plant and equipment. We define Adjusted EBITDA margin as Adjusted EBITDA divided by net sales. EBITDA, EBITDA margin, Adjusted EBITDA and Adjusted EBITDA margin should not be considered as alternatives to comparable GAAP measures of profitability and may not be comparable with the measures as defined by other companies. |
The table below reconciles EBITDA, EBITDA margin, Adjusted EBITDA and Adjusted EBITDA margin to net income.
Reconciliation of Net Income (GAAP) to EBITDA (Non-GAAP), EBITDA Margin (Non-GAAP),
Adjusted EBITDA (Non-GAAP) and Adjusted EBITDA Margin (Non-GAAP)
| Year Ended April 30, | Six Months Ended October 31, |
Pro Forma (Non-GAAP) Twelve Months Ended October 31, |
||||||||||||||||||||||
| 2015 | 2016 | 2017 | 2016 | 2017 | 2017 | |||||||||||||||||||
| (dollars in thousands, other than percentages) | ||||||||||||||||||||||||
| Net income (GAAP)(1) |
$ | 35,499 | $ | 58,723 | $ | 71,199 | $ | 39,298 | $ | 42,036 | $ | 92,483 | ||||||||||||
| Less: |
||||||||||||||||||||||||
| Interest income |
81 | 257 | 1,125 | 387 | 1,253 | 567 | ||||||||||||||||||
| Add: |
||||||||||||||||||||||||
| Interest expense |
515 | 378 | 885 | 329 | 105 | 39,593 | ||||||||||||||||||
| Income tax provision |
18,888 | 33,063 | 37,726 | 21,092 | 20,799 | 40,584 | ||||||||||||||||||
| Depreciation and amortization |
14,526 | 16,456 | 18,682 | 8,873 | 10,977 | 83,886 | ||||||||||||||||||
|
|
|
|
|
|
|
|
|
|
|
|
|
|||||||||||||
| EBITDA (Non-GAAP) |
$ | 69,347 | $ | 108,363 | $ | 127,367 | $ | 69,205 | $ | 72,664 | $ | 255,979 | ||||||||||||
|
|
|
|
|
|
|
|
|
|
|
|
|
|||||||||||||
| EBITDA Margin (Non-GAAP) |
8 | % | 11 | % | 12 | % | 13 | % | 13 | % | 16 | % | ||||||||||||
| Restructuring charges |
$ | 240 | $ | — | $ | — | $ | — | $ | — | $ | — | ||||||||||||
| Stock based compensation |
3,497 | 3,609 | 3,469 | 1,649 | 1,609 | 8,220 | ||||||||||||||||||
| Corporate business development expense |
— | — | 2,686 | — | — | — | ||||||||||||||||||
| Loss on disposal of property, plant and equipment |
153 | 1,576 | 444 | 174 | 84 | 343 | ||||||||||||||||||
| Facility closure and restructuring |
— | — | — | — | — | 4,467 | ||||||||||||||||||
| Non-recurring/other non-cash charges |
— | — | — | — | — | (870 | ) | |||||||||||||||||
|
|
|
|
|
|
|
|
|
|
|
|
|
|||||||||||||
| Adjusted EBITDA (Non-GAAP) |
$ | 73,237 | $ | 113,548 | $ | 133,966 | $ | 71,028 | $ | 74,357 | $ | 268,139 | ||||||||||||
|
|
|
|
|
|
|
|
|
|
|
|
|
|||||||||||||
| Adjusted EBITDA margin (Non-GAAP) |
9 | % | 12 | % | 13 | % | 14 | % | 13 | % | 16 | % | ||||||||||||
| (1) | Net income is in accordance with GAAP except for Pro Forma Twelve Months Ended October 31, 2017. |
6
| (c) | Net debt is a measurement of liquidity and financial health that is not prepared and presented in accordance with GAAP. While we believe that the presentation of this non-GAAP measure will enhance an investor’s understanding of our financial position, the use of this non-GAAP measure as an analytical tool has limitations and should not be considered in isolation, or as a substitute for an analysis of our results of operations as reported in accordance with GAAP. We define net debt as total long-term debt less cash and cash equivalents. |
| Reconciliation of Net Debt (Non-GAAP) (dollars in thousands) |
As of April 30, | As of October 31, |
Pro Forma As of October 31, |
|||||||||||||||||
| 2015 | 2016 | 2017 | 2016 | 2017 | ||||||||||||||||
| Economic Development Loans |
$ | 4,957 | $ | 3,689 | $ | 4,439 | 9,132 | 8,607 | ||||||||||||
| Capital Lease Obligations |
7,929 | 7,165 | 6,848 | 2,199 | 2,807 | |||||||||||||||
| Other long term debt, net of debt issuance costs |
— | 2,865 | 5,590 | 14,164 | 6,383 | |||||||||||||||
| 2009 Revolving Facility |
10,000 | 10,000 | — | — | ||||||||||||||||
| Senior Secured Revolving Facility |
— | — | — | — | ||||||||||||||||
| Senior Secured Initial Term Loan, net of debt issuance costs |
— | — | — | — | 243,534 | |||||||||||||||
| Senior Secured Delayed Draw Term Loan, net of deferred issuance costs |
— | — | — | — | 249,300 | |||||||||||||||
| RSI Employee Notes |
— | — | — | — | 3,020 | |||||||||||||||
|
|
|
|
|
|
|
|
|
|
|
|||||||||||
| Total Credit Facilities and Capital Lease Obligations |
22,886 | 23,719 | 16,877 | 25,495 | 513,651 | |||||||||||||||
| Notes due 2026 offered hereby |
— | — | — | — | 343,800 | |||||||||||||||
| RSI Notes |
— | — | — | — | — | |||||||||||||||
|
|
|
|
|
|
|
|
|
|
|
|||||||||||
| Total debt (GAAP) |
22,886 | 23,719 | 16,877 | 25,495 | 857,451 | |||||||||||||||
| Less: Cash and cash equivalents |
149,541 | 174,463 | 176,978 | 155,644 | 102,019 | |||||||||||||||
|
|
|
|
|
|
|
|
|
|
|
|||||||||||
| Net debt (Non-GAAP) |
$ | (126,655 | ) | $ | (150,744 | ) | $ | (160,101 | ) | $ | (130,149 | ) | $ | 755,432 | ||||||
|
|
|
|
|
|
|
|
|
|
|
|||||||||||
| (d) | Free Cash Flow is a measurement of liquidity and financial health that is not prepared and presented in accordance with GAAP. While we believe that the presentation of this non-GAAP measure will enhance an investor’s understanding of our financial position, the use of this non-GAAP measure as an analytical tool has limitations and should not be considered in isolation, or as a substitute for an analysis of our results of operations or cash flows as reported in accordance with GAAP. We define free cash flow as net cash provided by operating activities less capital expenditures. |
| Reconciliation of Free Cash Flow (Non-GAAP) (dollars in thousands) |
Year Ended April 30, | Six Months Ended October 31, |
||||||||||||||||||
| 2015 | 2016 | 2017 | 2016 | 2017 | ||||||||||||||||
| Net cash provided by operating activities (GAAP) |
$ | 60,164 | $ | 74,604 | $ | 77,080 | $ | 40,146 | $ | 41,838 | ||||||||||
| Less: |
||||||||||||||||||||
| Capital expenditures |
20,015 | 28,685 | 21,811 | 10,354 | 20,660 | |||||||||||||||
|
|
|
|
|
|
|
|
|
|
|
|||||||||||
| Free Cash Flow (Non-GAAP) |
$ | 40,149 | $ | 45,919 | $ | 55,269 | $ | 29,792 | $ | 21,178 | ||||||||||
|
|
|
|
|
|
|
|
|
|
|
|||||||||||
7
Summary Historical Financial and Operating Information of RSI
The summary historical consolidated statements of operations of RSI for the years ended December 31, 2016, January 2, 2016 and January 3, 2015 and summary historical consolidated balance sheet as of December 31, 2016 and January 2, 2016 have been derived from RSI’s historical audited consolidated financial statements and the related notes included in this offering memorandum. The selected consolidated balance sheet as of January 3, 2015 is derived from RSI’s audited consolidated financial statements and the related notes which are not included in this offering memorandum. The summary historical consolidated financial information of RSI as of September 30, 2017 and for the nine-month periods ended September 30, 2017 and October 1, 2016 have been derived from RSI’s historical unaudited condensed consolidated financial statements and the related notes included in this offering memorandum. In the opinion of management, the unaudited condensed consolidated financial statements and the related notes of RSI have been prepared on the same basis as its audited consolidated financial statements and the related notes and include all adjustments, consisting of normal recurring adjustments, necessary for a fair statement of the financial position of RSI as of September 30, 2017 and its results of operations for the nine-month periods ended September 30, 2017 and 2016. Results of interim periods are not necessarily indicative of the results expected for a full year or for future periods.
The following summary consolidated financial information should be read together with the information included in “Management’s Discussion and Analysis of Financial Condition and Results of Operation of RSI” and RSI’s consolidated financial statements and the related notes included elsewhere in this offering memorandum. The summary consolidated financial information in this section is not intended to replace RSI’s consolidated financial statements and the related notes. RSI’s historical results are not necessarily indicative of future performance.
| Year Ended | Nine Months Ended | |||||||||||||||||||
| (dollars in thousands, other
than |
January 3, 2015 |
January 2, 2016 |
December 31, 2016 |
October 1, 2016 |
September 30, 2017 |
|||||||||||||||
| Statement of Operations Information |
||||||||||||||||||||
| Net sales |
$ | 540,033 | $ | 595,527 | $ | 598,094 | $ | 457,546 | $ | 428,478 | ||||||||||
| Cost of sales |
374,851 | 418,015 | 420,160 | 322,368 | 304,520 | |||||||||||||||
| Gross profit |
165,182 | 177,512 | 177,934 | 135,178 | 123,958 | |||||||||||||||
| Operating income |
98,865 | 80,079 | 136,535 | 108,598 | 78,618 | |||||||||||||||
| Interest expense, net |
39,463 | 39,306 | 38,641 | 29,248 | 29,207 | |||||||||||||||
| Net income |
$ | 39,113 | $ | 4,380 | $ | 65,605 | $ | 51,752 | $ | 33,067 | ||||||||||
| Key Balance Sheet Items (as of period end) |
||||||||||||||||||||
| Cash and cash equivalents |
$ | 88,182 | $ | 47,509 | $ | 49,293 | $ | 80,941 | ||||||||||||
| Total assets |
281,543 | 268,256 | 271,344 | 290,437 | ||||||||||||||||
| Total liabilities |
593,458 | 664,014 | 650,978 | 637,004 | ||||||||||||||||
| Other Key Performance Metrics |
||||||||||||||||||||
| Net cash provided by operating activities |
$ | 53,760 | $ | 67,871 | $ | 80,360 | $ | 54,137 | $ | 42,940 | ||||||||||
| Net cash used in investing activities |
(10,668 | ) | (19,161 | ) | (28,327 | ) | (21,878 | ) | (11,042 | ) | ||||||||||
| Net cash provided by (used in) financing activities |
1,012 | (89,383 | ) | (50,249 | ) | (322 | ) | (250 | ) | |||||||||||
| Capital expenditures |
11,873 | 19,756 | 28,339 | 21,890 | 11,153 | |||||||||||||||
| EBITDA (a) |
111,334 | 58,861 | 151,351 | 119,336 | 92,500 | |||||||||||||||
| EBITDA margin (a) |
21 | % | 10 | % | 25 | % | 26 | % | 22 | % | ||||||||||
| Adjusted EBITDA (a) |
127,849 | 140,039 | 142,113 | 106,205 | 95,113 | |||||||||||||||
| Adjusted EBITDA margin (a) |
24 | % | 24 | % | 24 | % | 23 | % | 22 | % | ||||||||||
| Free Cash Flow (b) |
41,887 | 48,115 | 52,021 | 32,247 | 31,787 | |||||||||||||||
8
| (a) | EBITDA, EBITDA margin, Adjusted EBITDA and Adjusted EBITDA margin are measurements of operational performance that are not prepared and presented in accordance with GAAP. While we believe that the presentation of these non-GAAP measures will enhance an investor’s understanding of our operating performance, the use of these non-GAAP measures as an analytical tool has limitations and should not be considered in isolation, or as substitutes for an analysis of our results of operations as reported in accordance with GAAP. We define EBITDA as net income adjusted to exclude interest income and add back such items as: interest expense, income tax provision, and depreciation and amortization. We define EBITDA margin as EBITDA divided by net sales. We define Adjusted EBITDA as EBITDA adjusted to exclude such items as: stock based compensation, debt and equity related transaction costs, facility closure and restructuring costs, and other noncash/nonrecurring charges. We define Adjusted EBITDA margin as Adjusted EBITDA divided by net sales. EBITDA, EBITDA margin, Adjusted EBITDA and Adjusted EBITDA margin should not be considered as alternatives to comparable GAAP measures of profitability and may not be comparable with the measures as defined by other companies. |
The table below reconciles EBITDA, EBITDA margin, Adjusted EBITDA and Adjusted EBITDA margin to net income.
Reconciliation of Net Income (GAAP) to EBITDA (Non-GAAP), EBITDA Margin (Non-GAAP), Adjusted EBITDA (Non-GAAP) and Adjusted EBITDA margin (Non-GAAP)
| Year Ended | Nine Months Ended | |||||||||||||||||||
| January 3, 2015 |
January 2, 2016 |
December 31, 2016 |
October 1, 2016 |
September 30, 2017 |
||||||||||||||||
| (dollars in thousands, other than percentages) | ||||||||||||||||||||
| Net income (GAAP) |
$ | 39,113 | $ | 4,380 | $ | 65,605 | $ | 51,752 | $ | 33,067 | ||||||||||
| Less: |
||||||||||||||||||||
| Interest income |
15 | 24 | 52 | 40 | 148 | |||||||||||||||
| Add: |
||||||||||||||||||||
| Interest expense |
39,478 | 39,330 | 38,693 | 29,288 | 29,355 | |||||||||||||||
| Income tax provision |
19,737 | 1,521 | 31,955 | 27,320 | 17,773 | |||||||||||||||
| Depreciation and amortization |
13,021 | 13,654 | 15,150 | 11,016 | 12,453 | |||||||||||||||
|
|
|
|
|
|
|
|
|
|
|
|||||||||||
| EBITDA (Non-GAAP) |
$ | 111,334 | $ | 58,861 | $ | 151,351 | $ | 119,336 | $ | 92,500 | ||||||||||
|
|
|
|
|
|
|
|
|
|
|
|||||||||||
| EBITDA Margin (Non-GAAP) |
21 | % | 10 | % | 25 | % | 26 | % | 22 | % | ||||||||||
| Stock compensation expense (benefit) |
$ | 11,403 | $ | 37,353 | $ | (12,608 | ) | $ | (14,881 | ) | $ | (780 | ) | |||||||
| Debt & equity related transaction costs |
425 | 43,235 | 22 | 22 | 1,416 | |||||||||||||||
| Facility closure & restructuring costs |
4,135 | 782 | 1,661 | 171 | 2,977 | |||||||||||||||
| Non-recurring/other non-cash charges (income) |
552 | (192 | ) | 1,687 | 1,557 | (1,000 | ) | |||||||||||||
|
|
|
|
|
|
|
|
|
|
|
|||||||||||
| Adjusted EBITDA (Non-GAAP) |
$ | 127,849 | $ | 140,039 | $ | 142,113 | $ | 106,205 | $ | 95,113 | ||||||||||
|
|
|
|
|
|
|
|
|
|
|
|||||||||||
| Adjusted EBITDA margin (Non-GAAP) |
24 | % | 24 | % | 24 | % | 23 | % | 22 | % | ||||||||||
| (b) | Free Cash Flow is a measurement of liquidity and financial health that is not prepared and presented in accordance with GAAP. While we believe that the presentation of this non-GAAP measure will enhance an investor’s understanding of our financial position, the use of this non-GAAP measure as an analytical tool has limitations and should not be considered in isolation, or as a substitute for an analysis of our results of operations or cash flows as reported in accordance with GAAP. We define free cash flow as net cash provided by operating activities less capital expenditures. |
9
| Reconciliation of Free Cash
Flow |
Year Ended | Nine Months Ended | ||||||||||||||||||
| January 3, 2015 |
January 2, 2016 |
December 31, 2016 |
October 1, 2016 |
September 30, 2017 |
||||||||||||||||
| Net cash provided by operating activities (GAAP) |
$ | 53,760 | $ | 67,871 | $ | 80,360 | $ | 54,137 | $ | 42,940 | ||||||||||
| Less: |
||||||||||||||||||||
| Capital expenditures |
11,873 | 19,756 | 28,339 | 21,890 | 11,153 | |||||||||||||||
|
|
|
|
|
|
|
|
|
|
|
|||||||||||
| Free Cash Flow (Non-GAAP) |
$ | 41,887 | $ | 48,115 | $ | 52,021 | $ | 32,247 | $ | 31,787 | ||||||||||
|
|
|
|
|
|
|
|
|
|
|
|||||||||||
10
Risks Related to American Woodmark’s Business and Industry
Because of the concentration of our sales to our two largest customers, the loss of either customer or a significant reduction in orders from either customer could adversely affect our financial results.
Home Depot and Lowe’s collectively accounted for approximately 53% and 58% of our pro forma net sales in fiscal 2017 and 2016, respectively. We do not typically enter into long-term sales contracts with Home Depot or Lowe’s and our sales usually occur on a “purchase order” basis. Our customers can make significant changes in their purchase volumes and can seek to significantly affect the prices we receive for our products and services and the other terms and conditions on which we do business. They have discontinued, and may in the future choose to discontinue, purchasing some or all of our products with little or no notice. In the past, purchase volumes from our customers, including Home Depot and Lowe’s, have fluctuated substantially, and we expect such fluctuations to occur from time to time in the future. Any reduction in, or termination of, our sales to either Home Depot or Lowe’s could have a material adverse effect on our business, financial condition or results of operations.
In addition, the potential for orders from these large retail customers to increase significantly from time to time requires us to have sufficient manufacturing capacity. These large retailers also impose strict logistics and performance obligations. Failure to comply with these obligations may result in these customers reducing or stopping their purchase of our products.
We could also experience delays or defaults in payment from Home Depot or Lowe’s, which could adversely affect our business, financial condition or results of operations. The loss of a substantial portion of our order volumes or revenue from either Home Depot or Lowe’s for any reason would have a material adverse effect on our business, financial condition, or results of operations.
Our business primarily relies on U.S. home improvement, repair and remodel and new home construction activity levels, all of which are impacted by risks associated with fluctuations in the housing market. Downward changes in the general economy, the housing market or other business conditions could adversely affect our results of operations, cash flows and financial condition.
Our business primarily relies on home improvement, repair and remodel, and new home construction activity levels in the United States. The housing market is sensitive to changes in economic conditions and other factors, such as the level of employment, access to labor, consumer confidence, consumer income, availability of financing and interest rate levels. Adverse changes in any of these conditions generally, or in any of the markets where we operate, could decrease demand and could adversely impact our businesses by: causing consumers to delay or decrease homeownership; making consumers more price conscious resulting in a shift in demand to smaller, less expensive homes; making consumers more reluctant to make investments in their existing homes, including large kitchen and bath repair and remodel projects; or making it more difficult to secure loans for major renovations. Although the U.S. new home construction market is improving, demand for new homes is still recovering after the 2007-2009 U.S. economic recession and continues to remain below historical levels.
Prolonged economic downturns may adversely impact our sales, earnings and liquidity.
Our industry historically has been cyclical in nature and has fluctuated with economic cycles. During economic downturns, our industry could experience longer periods of recession and greater declines than the general economy. We believe that our industry is significantly influenced by economic conditions generally and particularly by housing activity, consumer confidence, the level of personal discretionary spending, demographics and credit availability. These factors may affect not only the ultimate consumer of our products, but also may impact home centers, builders and our other primary customers. As a result, a worsening of economic conditions could adversely affect our sales and earnings as well as our cash flow and liquidity.
The U.S. cabinetry industry is highly competitive, and we may not be able to compete successfully.
We operate within the highly competitive U.S. cabinetry industry, which is characterized by competition from a number of other manufacturers. Competition is further intensified during economic downturns. We
11
compete with numerous large national and regional home products companies for, among other things, customers, orders from Home Depot and Lowe’s, raw materials and skilled management and labor resources. Purchase volumes from our main home center customers have fluctuated substantially from time to time in the past, and we expect such fluctuations to occur from time to time in the future.
Some of our competitors have greater financial, marketing and other resources than we do and, therefore, may be able to adapt to changes in customer preferences more quickly, devote more resources to the marketing and sale of their products, generate greater national brand recognition or adopt more aggressive pricing policies than we can.
In addition, some of our competitors may resort to price competition to sustain or gain market share and manufacturing capacity utilization, and we may have to adjust the prices on some of our products to stay competitive, which could reduce our revenues. We may not ultimately succeed in competing with other manufacturers and distributors in our market, which may have a material adverse effect on our business, financial condition or results of operations.
Our failure to develop new products or respond to changing consumer preferences and purchasing practices could have a material adverse effect on our business, financial condition or results of operations.
The U.S. cabinetry industry is subject to changing consumer trends, demands and preferences. The uncertainties associated with developing and introducing new products, such as gauging changing consumer preferences and successfully developing, manufacturing, marketing and selling new products, could lead to, among other things, rejection of a new product line, reduced demand and price reductions for our products. If our products do not keep up with consumer trends, demands and preference, we could lose market share, which could have a material adverse effect on our business, financial condition or results of operations.
Changes to consumer shopping habits and potential trends toward “online” purchases could also impact our ability to compete as we currently sell our products mainly through our distribution channel. Further, the volatile and challenging economic environment of recent years has caused shifts in consumer trends, demands, preferences and purchasing practices and changes in the business models and strategies of our customers. Shifts in consumer preferences, which may or may not be long-term, have altered the quantity, type and prices of products demanded by the end-consumer and our customers. If we do not timely and effectively identify and respond to these changing consumer preferences and purchasing practices, our relationships with our customers could be harmed, the demand for our products could be reduced and our market share could be negatively affected.
We may fail to fully realize the anticipated benefits of our growth strategy within the dealer and homebuilder channels.
Part of our growth strategy depends on expanding our business in the dealer and homebuilder channels. We may fail to compete successfully against other companies that are already established providers within the dealer and homebuilder channels. Demand for our products within the homebuilder and dealer channels may not grow, or might even decline. In addition, we may not accurately gauge consumer preferences and successfully develop, manufacture and market our products at a national level. Further, the implementation of our growth strategy may place additional demands on our administrative, operational and financial resources and may divert management’s attention away from our existing business and increase the demands on our financial systems and controls. If our management is unable to effectively manage growth, our business, financial condition or results of operations could be adversely affected. If our growth strategy is not successful then our revenue and earnings may not grow as anticipated or may decline, we may not be profitable, our reputation and brand may be damaged. In addition, we may change our financial strategy or other components of our overall business strategy if we believe our current strategy is not effective, if our business or markets change, or for other reasons, which may cause fluctuations in our financial results.
Manufacturing expansion to add capacity, manufacturing realignments, and other cost savings programs could result in a decrease in our near-term earnings.
We continually review our manufacturing operations. These reviews could result in the expansion of capacity, manufacturing realignments and various cost savings programs. Effects of manufacturing expansion,
12
realignments or cost savings programs could result in a decrease in our short-term earnings until the additional capacity is in place, cost reductions are achieved and/or production volumes stabilize. Such manufacturing expansions, realignments and programs involve substantial planning, often require capital investments, and may result in charges for fixed asset impairments or obsolescence and substantial severance costs. We also cannot assure you that we will achieve all of the intended cost savings. Our ability to achieve cost savings and other benefits within expected time frames is subject to many estimates and assumptions. These estimates and assumptions are subject to significant economic, competitive, and other uncertainties, some of which are beyond our control. If these estimates and assumptions are incorrect, if we experience delays, or if other unforeseen events occur, our business, financial condition, and results of operations could be materially and adversely affected. In addition, downturns in the economy could potentially have a larger impact on American Woodmark as a result of this added capacity.
We may record future goodwill impairment charges or other asset impairment charges which could negatively impact our future results of operations and financial condition.
In our third quarter reporting period we will have recorded significant goodwill as a result of the RSI Acquisition, and goodwill and other acquired intangible assets represent a substantial portion of our assets. We also have long-lived assets consisting of property and equipment and other identifiable intangible assets which we review both on an annual basis as well as when events or circumstances indicate that the carrying amount of an asset may not be recoverable. If a determination is made that a significant impairment in value of goodwill, other intangible assets or long-lived assets has occurred, such determination could require us to impair a substantial portion of our assets. Asset impairments could have a material adverse effect on our financial condition and results of operations.
Fluctuating raw material and energy costs could have a material adverse effect on our business and results of operations.
We purchase various raw materials, including, among others, wood, wood-based and resin products, which are subject to price fluctuations that could materially increase our manufacturing costs. Further, increases in energy costs increase our production costs and also the cost to transport our products, each of which could have a material adverse effect on our business and results of operations. In addition, some of our suppliers have consolidated and other suppliers may do so in the future. Combined with increased demand, such consolidation could increase the price of our supplies and raw materials.
We also may be unwilling or unable to pass on to customers commensurate cost increases. Competitive considerations and customer resistance to price increases may delay or make us unable to adjust selling prices. To the extent we are unable to either reengineer or otherwise offset increased costs or are unwilling or unable to build price increases into our sales prices, our margins will be negatively affected. Even if we are able to increase our selling prices, sustained price increases for our products may lead to sales declines and loss of market share, particularly if our competitors do not increase their prices. Conversely, when raw materials or energy prices decline, we may receive customer pressure to reduce our sales prices.
These prices are market-based and fluctuate based on factors beyond our control. We do not have long- term fixed supply agreements and do not hedge against price fluctuations. We, therefore, cannot predict our raw materials costs for the coming year.
The inability to obtain raw materials from suppliers in a timely manner would adversely affect our ability to manufacture and market our products.
Our ability to offer a wide variety of products depends on our ability to obtain an adequate supply of components from manufacturers and other suppliers, particularly wood-based and resin products. Failure by our suppliers to provide us with quality products on commercially reasonable terms, and to comply with legal requirements for business practices, could have a material adverse effect on our business, financial condition or results of operations. Furthermore, we rely heavily or, in certain cases, exclusively, on outside suppliers for some of our key components. While we do not rely exclusively on any one supplier for any particular raw materials, loss of a major supplier could increase our costs to obtain raw materials until we obtain an adequate alternative source of materials.
13
We typically do not enter into long-term contracts with our suppliers or sourcing partners. Instead, most raw materials and sourced goods are obtained on a “purchase order” basis. Although these components are generally obtainable in sufficient quantities from other sources, resourcing them from another supplier could take time. Financial, operating, or other difficulties encountered by our suppliers or sourcing partners or changes in our relationships with them could result in manufacturing or sourcing interruptions, delays and inefficiencies, and prevent us from manufacturing enough products to meet customer demands.
Our operations may be adversely affected by information systems interruptions or intrusions.
We rely on a number of information technology systems to process, transmit, store and manage information to support our business activities. Increased global cybersecurity vulnerabilities, threats and more sophisticated and targeted attacks pose a risk to its information technology systems. We have established security policies, processes and layers of defense designed to help identify and protect against intentional and unintentional misappropriation or corruption of its systems and information and disruption of its operations. Despite these efforts, systems may be damaged, disrupted, or shut down due to attacks by unauthorized access, malicious software, undetected intrusion, hardware failures, or other events, and in these circumstances our disaster recovery planning may be ineffective or inadequate. These breaches or intrusions could lead to business interruption, exposure of proprietary or confidential information, data corruption, damage to our reputation, exposure to litigation and increased operational costs. Such events could have a material adverse impact on our business, financial condition and results of operation. In addition, we could be adversely affected if any of its significant customers or suppliers experience any similar events that disrupt their business operations or damage their reputation.
Increased compliance costs or liabilities associated with environmental regulations could have a material adverse effect on our business, financial condition or results of operations.
Our facilities are subject to numerous environmental laws, regulations and permits, including those governing emissions to air, discharges to water, storage, treatment and disposal of waste, remediation of contaminated sites and protection of worker health and safety. We may not be in complete compliance with these laws, regulations or permits at all times. Our efforts to comply with environmental requirements do not remove the risk that we may incur material liabilities, fines or penalties for, among other things, releases of regulated materials occurring on or emanating from current or formerly owned or operated properties or any associated offsite disposal location, or for contamination discovered at any of our properties from activities conducted by previous occupants. Liability for environmental contamination or a release of hazardous materials may be joint and several, so that we may be held responsible for more than our share of the contamination or other damages, or even for the entire share.
Changes in environmental laws and regulations or the discovery of previously unknown contamination or other liabilities relating to our properties and operations could result in significant environmental liabilities that could impact our business, financial condition or results of operation. In addition, we may incur capital and other costs to comply with increasingly stringent environmental laws and enforcement policies. These laws, including, for example, the regulations relating to formaldehyde emissions promulgated by the California Air Resources Board, require us to rely on compliance by our suppliers of raw materials. Should a supplier fail to comply with such regulations, notify us of non-compliance, or provide us with a product that does not comply, we could be subject to disruption in our business and incur substantial liabilities.
Unauthorized disclosure of confidential information provided to us by customers, employees or third parties could harm our business.
We rely on the internet and other electronic methods to transmit confidential information and stores confidential information on our networks. If there were a disclosure of confidential information provided by, or concerning, our employees, customers or other third parties, including through inadvertent disclosure, unapproved dissemination, or unauthorized access, our reputation could be harmed and we could be subject to civil or criminal liability and regulatory actions.
14
Changes in government and industry regulatory standards could have a material adverse effect on our business, financial condition or results of operations.
Government regulations pertaining to health and safety and environmental concerns continue to emerge, domestically as well as internationally. These regulations include the Occupational Safety and Health Administration and other worker safety regulations for the protection of employees, as well as regulations for the protection of consumers. It is necessary for us to comply with current requirements (including requirements that do not become effective until a future date), and even more stringent requirements could be imposed on our products or processes. Compliance with these regulations may require us to alter our manufacturing and installation processes and our sourcing. Such actions could increase our capital expenditures and adversely impact our business, financial condition or results of operations, and our inability to effectively and timely meet such regulations could adversely impact our competitive position.
The loss of certain members of our management may have an adverse effect on our operating results.
Our success will depend, in part, on the efforts of our senior management and other key employees. These individuals possess sales, marketing, engineering, manufacturing, financial and administrative skills and know-how that are critical to the operation of our business. If we lose or suffer an extended interruption in the services of one or more of our senior officers or other key employees, our financial condition and results of operations may be negatively affected. Moreover, the pool of qualified individuals may be highly competitive and we may not be able to attract and retain qualified personnel to replace or succeed members of our senior management or other key employees, should the need arise. The loss of the services of any key personnel, or our inability to hire new personnel with the requisite skills, could impair our ability to develop new products or enhance existing products, sell products to our customers or manage our business effectively.
We could continue to pursue growth opportunities through either acquisitions, mergers or internally developed projects, which may be unsuccessful or may adversely affect future financial condition and operating results.
We could continue to pursue opportunities for growth through either acquisitions, mergers or internally developed projects as part of our growth strategy. We cannot assure you that we will be successful in integrating an acquired business or that an internally developed project will perform at the levels we anticipate. American Woodmark may pay for future acquisitions using cash, stock, the assumption of debt, or a combination of these. Future acquisitions could result in dilution to existing shareholders and to earnings per share. In addition, we may fail to identify significant liabilities or risks associated with a given acquisition that could adversely affect our future financial condition and operating results or result in us paying more for the acquired business or assets than they are worth.
Our ability to operate and our growth potential could be materially and adversely affected if we cannot employ, train and retain qualified personnel at a competitive cost.
Many of the products that we manufacture and assemble require manual processes in plant environments. We believe that our success depends upon our ability to attract, employ, train and retain qualified personnel with the ability to design, manufacture and assemble these products. In addition, our ability to expand our operations depends in part on our ability to increase our skilled labor force as the housing market continues to recover in the United States. A significant increase in the wages paid by competing employers could result in a reduction of our qualified labor force, increases in the wage rates that we must pay, or both. In addition, we believe that our success depends in part on our ability to quickly and effectively train additional workforce to handle the increased volume and production while minimizing labor inefficiencies and maintaining product quality in a housing market recovery. If either of these events were to occur, our cost structure could increase, our margins could decrease, and any growth potential could be impaired.
We manufacture our products internationally and are exposed to risks associated with doing business globally.
We manufacture our products in the United States and Mexico and sell our products in the United States. Accordingly, we are subject to risks associated with potential disruption caused by changes in political,
15
monetary, economic and social environments, including civil and political unrest, terrorism, possible expropriation, local labor conditions, changes in laws, regulations and policies of foreign governments and trade disputes with the United States, and compliance with U.S. laws affecting activities of U.S. companies abroad, including tax laws, economic sanctions and enforcement of contract and intellectual property rights.
We are also subject to the Foreign Corrupt Practices Act and other anti-bribery laws. While we have implemented safeguards and policies to discourage these practices by our employees and agents, our existing safeguards and policies to assure compliance and any future improvements may prove to be less than effective and our employees or agents may engage in conduct for which we might be held responsible. If employees violate our policies, we may be subject to regulatory sanctions. Violations of these laws or regulations could result in sanctions including fines, debarment from export privileges and penalties and could have a material adverse effect on our business, financial condition or results of operations.
We hedge certain foreign currency transactions; however, a change in the value of the currencies will impact our financial statements when translated into U.S. dollars. In addition, fluctuations in currency can adversely impact the cost position in local currency of our products, making it more difficult for us to compete. Our success will depend, in part, on our ability to effectively manage our business through the impact of these potential changes.
In addition, we source raw materials and components from Asia where we have recently experienced higher manufacturing costs and longer lead times due to currency fluctuations, higher wage rates, labor shortages and higher raw material costs. Our international sourcing of materials could be harmed by a variety of factors including:
| • | introduction of non-native invasive organisms into new environments; |
| • | recessionary trends in international markets; |
| • | legal and regulatory changes and the burdens and costs of our compliance with a variety of laws, including export controls, import and customs trade restrictions and tariffs; |
| • | increases in transportation costs or transportation delays; |
| • | work stoppages and labor strikes; |
| • | fluctuations in exchange rates, particularly the value of the U.S. dollar relative to other currencies; and |
| • | political unrest, terrorism and economic instability. |
If any of these or other factors were to render the conduct of our business in a particular country undesirable or impractical, our business, financial condition or results of operations could be materially adversely affected.
Our failure to maintain acceptable quality standards could result in significant unexpected costs.
Any failure to maintain acceptable quality standards could require us to recall or redesign such products, or pay substantial damages, any of which would result in significant unexpected costs. We may also have difficulty controlling the quality of products or components sourced from other manufacturers, so we are exposed to risks relating to the quality of such products and to limitations on our recourse against such suppliers. Further, any claim or product recall could result in adverse publicity against us, which could decrease our credibility, harm our reputations, adversely affect our sales, or increase our costs. Defects in our products could also result in decreased orders or sales to our customers, which could have a material adverse effect on our business, financial condition or results of operations.
New U.S. tax legislation could adversely affect us and our debt holders.
On December 22, 2017, President Trump signed into law legislation referred to as the “Tax Cuts and Jobs Act” (the “TCJA”). The TCJA is generally effective for taxable years beginning after December 31, 2017. The TCJA includes significant amendments to the Internal Revenue Code of 1986 (as amended, the “Code”), including amendments that significantly change the taxation of individuals and business entities, including the taxation of offshore earnings and the deductibility of interest. Some of the amendments could adversely affect our business and financial condition.
16
Although we are currently evaluating the impact of the TCJA on our business, significant uncertainty exists with respect to how the TCJA will affect our business. Some of this uncertainty will not be resolved until clarifying Treasury regulations are promulgated or other relevant authoritative guidance is published.
Prospective investors should consult their tax advisors about the TCJA and its potential impact before investing in the Notes offered hereby.
Future tax law changes or the interpretation of existing tax laws may materially impact our effective income tax rate and the resolution of unrecognized tax benefits.
Our businesses are subject to taxation in the United States as well as internationally. Tax legislation may be enacted that could have a material adverse impact on our worldwide income tax provision. Tax authorities in many jurisdictions routinely audit us. Because there are significant uncertainties in the outcome of such audits, the ultimate outcome from any audit could be materially different from amounts reflected in our income tax provisions and accruals. Future settlements of income tax audits may have a material adverse effect on earnings between the period of initial recognition of tax estimates in our financial statements and the point of ultimate tax audit settlement.
Natural disasters could have a material adverse effect on our business, financial condition or results of operations.
Many of our facilities are located in regions that are vulnerable to natural disasters and other risks, such as earthquakes, fires, floods, tropical storms and snow and ice, which at times have disrupted the local economy and posed physical risks to our property. In addition, the continued threat of terrorism and heightened security and military action in response to this threat, or any future acts of terrorism, may cause further disruptions to the economies of the United States and other countries. Our redundant, multiple site capacity may not be sufficient in the event of a natural disaster, terrorist act or other catastrophic event. Such disruptions could, among other things, disrupt our manufacturing or distribution facilities and result in delays or cancellations of customer orders for our products, which in turn could have a material adverse effect on our business, financial condition and results of operations. Further, if a natural disaster occurs in a region from which we derive a significant portion of our revenue, end-user customers in that region may delay or forego purchases of our products, which may materially and adversely impact our operating results for a particular period.
Our ability to grow and compete in the future will be adversely affected if adequate capital is not available to us or not available on terms favorable to us.
The ability of our business to grow and compete depends on the availability of adequate capital, which in turn depends in large part on our cash flow from operations and the availability of equity and debt financing. We cannot assure you that our cash flow from operations will be sufficient or that we will be able to obtain equity or debt financing on acceptable terms, if at all, to implement our growth strategy. As a result, we cannot assure you that adequate capital will be available to finance our current growth plans, take advantage of business opportunities or respond to competitive pressures, any of which could harm our business.
Certain of our customers have been expanding and may continue to expand through consolidation and internal growth, which may increase their buying power, which could materially and adversely affect our sales, results of operations and financial position.
Certain of our customers are large companies with significant buying power. In addition, potential further consolidation in the distribution channels could enhance the ability of certain of our customers to seek more favorable terms, including pricing, for the products that they purchase from us. Accordingly, our ability to maintain or raise prices in the future may be limited, including during periods of raw material and other cost increases. If we are forced to reduce prices or to maintain prices during periods of increased costs, or if we lose customers because of pricing or other methods of competition, our sales, operating results and financial position may be materially and adversely affected.
17
Risks Related to the RSI Acquisition
The pro forma financial information included in this offering memorandum are presented for illustrative purposes only and may not be an indication of American Woodmark’s financial condition or results of operations following the RSI Acquisition.
The pro forma financial information contained in this offering memorandum are presented for illustrative purposes only, are based on various adjustments, assumptions and preliminary estimates and may not be an indication of American Woodmark’s financial condition or results of operations following the RSI Acquisition for several reasons. See “Unaudited Pro Forma Condensed Combined Financial Information”. The actual financial condition and results of operations of the combined company following the RSI Acquisition may not be consistent with, or evident from, these pro forma financial statements. In addition, the assumptions used in preparing the pro forma financial information may not prove to be accurate, and other factors may affect American Woodmark’s financial condition or results of operations following the RSI Acquisition.
We may experience difficulties in integrating American Woodmark and RSI’s operations and realizing the expected benefits of the RSI Acquisition.
The success of the proposed RSI Acquisition will depend in part on our ability to realize the anticipated business opportunities and growth prospects from combining with RSI in an efficient and effective manner. We may never realize these business opportunities and growth prospects. Further, our management might have its attention diverted while trying to integrate operations and corporate and administrative infrastructures.
The integration process could take longer than anticipated and could result in the loss of key employees, the disruption of our and RSI’s ongoing businesses, tax costs or inefficiencies, or inconsistencies in standards, controls, information technology systems, procedures and policies, any of which could adversely affect our ability to maintain relationships with customers, employees or other third parties, or our ability to achieve the anticipated benefits of the transaction, and could harm our financial performance. If we are unable to successfully or timely integrate the operations of RSI’s business with our business, we may incur unanticipated liabilities and be unable to realize the revenue growth, synergies and other anticipated benefits resulting from the proposed transaction, and our business, results of operations and financial condition could be adversely affected.
The consummation of the RSI Acquisition could adversely affect RSI’s business, financial condition, and results of operations.
The consummation of the RSI Acquisition could disrupt RSI’s business and create uncertainty about it, which could have an adverse effect on RSI’s business, financial condition, and results of operations. These risks to RSI’s business include:
| • | potential uncertainty in the marketplace, which could lead current and prospective customers to purchase from other vendors or delay purchasing from RSI; |
| • | the possibility of disruption to RSI’s business and operations, including diversion of significant management time and resources towards the integration of RSI’s business with our business; |
| • | impairment of RSI’s ability to attract and retain key personnel; |
| • | difficulties maintaining relationships with employees, customers, and other business partners; and |
| • | potential future stockholder litigation relating to the RSI Acquisition and the related costs. |
American Woodmark and RSI’s important business relationships may be disrupted due to the RSI Acquisition, which could adversely affect American Woodmark’s and RSI’s business, respectively.
Some of the parties with which American Woodmark and RSI do business may be uncertain about their business relationships with the combined company as a result of the RSI Acquisition. For example, customers, partners, resellers, suppliers, vendors and others may consider entering into alternative business relationships with other parties. Some of RSI’s customers, partners, resellers, suppliers, vendors and others may decide to exercise their rights to terminate contracts that were triggered upon completion of the RSI Acquisition. These disruptions could have an adverse effect on RSI’s and/or American Woodmark’s businesses, financial condition or results of operations, or the prospects of the combined company.
18
SELECTED HISTORICAL CONSOLIDATED FINANCIAL INFORMATION OF RSI
The following selected consolidated statement of operations data for the years ended December 31, 2016, January 2, 2016 and January 3, 2015 and the selected consolidated balance sheet data as of December 31, 2016 and January 2, 2016 are derived from RSI’s audited consolidated financial statements and the related notes included in this offering memorandum. The selected consolidated balance sheet data as of January 3, 2015 is derived from RSI’s audited consolidated financial statements and the related notes which are not included in this offering memorandum.
The following selected consolidated statement of operations data for the nine months ended September 30, 2017 and October 1, 2016 and the selected consolidated balance sheet data as of September 30, 2017 are derived from RSI’s unaudited consolidated financial statements and the related notes included in this offering memorandum. The consolidated balance sheet data as of October 1, 2016 are derived from RSI’s unaudited consolidated financial statements and the related notes which are not included in this offering memorandum. In the opinion of management, the unaudited consolidated financial statements of RSI have been prepared on the same basis as the audited consolidated financial statements and include all adjustments, consisting of normal recurring adjustments, necessary for a fair statement of the financial position of RSI as of September 30, 2017 and its results of operations for the nine month periods ended September 30, 2017 and October 1, 2016. Results of interim periods are not necessarily indicative of the results expected for a full year or for future periods.
The following selected consolidated financial information should be read together with the information included in “Management’s Discussion and Analysis of Financial Condition and Results of Operation of RSI” and RSI’s consolidated financial statements and the related notes included in this offering memorandum. The selected consolidated financial information in this section is not intended to replace RSI’s consolidated financial statements and the related notes. RSI’s historical results are not necessarily indicative of future performance.
| Fiscal Year Ended | Nine Months Ended | |||||||||||||||||||
| January 3, 2015 |
January 2, 2016 |
December 31, 2016 |
October 1, 2016 |
September 30, 2017 |
||||||||||||||||
| (dollars in thousands) | ||||||||||||||||||||
| Consolidated Statements of Income Data |
||||||||||||||||||||
| Net sales |
$ | 540,033 | $ | 595,527 | $ | 598,094 | $ | 457,546 | $ | 428,478 | ||||||||||
| Cost of sales |
374,851 | 418,015 | 420,160 | 322,368 | 304,520 | |||||||||||||||
| Gross profit |
165,182 | 177,512 | 177,934 | 135,178 | 123,958 | |||||||||||||||
| Operating income |
98,865 | 80,079 | 136,535 | 108,598 | 78,618 | |||||||||||||||
| Net income |
39,113 | 4,380 | 65,605 | 51,752 | 33,067 | |||||||||||||||
| Consolidated Balance Sheet Data |
||||||||||||||||||||
| Cash and cash equivalents |
$ | 88,182 | $ | 47,509 | $ | 49,293 | $ | 80,941 | ||||||||||||
| Total assets |
281,543 | 268,256 | 271,344 | 290,437 | ||||||||||||||||
| Long term debt, less current maturities |
518,176 | 565,960 | 567,028 | 569,699 | ||||||||||||||||
| Stockholders’ deficit |
(311,915 | ) | (395,758 | ) | (379,634 | ) | (346,567 | ) | ||||||||||||
19
UNAUDITED PRO FORMA CONDENSED COMBINED FINANCIAL INFORMATION
On November 30, 2017, American Woodmark, Merger Sub, RSI and Ronald M. Simon, as the RSI stockholder representative, entered into the Merger Agreement, pursuant to which the parties agreed to merge Merger Sub with and into RSI pursuant to the terms and subject to the conditions set forth in the Merger Agreement, with RSI continuing as the surviving corporation and as a wholly owned subsidiary of American Woodmark. On December 29, 2017 (the “Acquisition Date”), American Woodmark consummated the RSI Acquisition pursuant to the terms of the Merger Agreement. As a result of the merger of Merger Sub with and into RSI, Merger Sub’s separate corporate existence ceased, and RSI continued as the surviving corporation a wholly owned subsidiary of American Woodmark.
In connection with the RSI Acquisition, on December 29, 2017, American Woodmark entered into the Senior Secured Credit Facilities consisting of the $100 million Senior Secured Revolving Facility, the $250 million Senior Secured Initial Term Loan and the $250 million Senior Secured Delayed Draw Term Loan. American Woodmark used the proceeds of the Senior Secured Initial Term Loan, together with cash on its balance sheet, to fund the cash portion of the RSI Acquisition consideration and its transaction fees and expenses. In addition, American Woodmark drew down $50 million from the Senior Secured Revolving Facility to provide ongoing working capital and for other general corporate purposes of American Woodmark and its subsidiaries.
At the closing of the RSI Acquisition, American Woodmark assumed approximately $589 million of RSI’s indebtedness, including accrued interest, consisting largely of the RSI Notes. The proceeds of the Notes to be issued hereby and an anticipated $250 million drawdown on the Senior Secured Delayed Draw Term Loan, together with cash on hand of American Woodmark and RSI, will be used to redeem or repurchase the RSI Notes, repay the outstanding balance of the Senior Secured Revolving Facility and pay fees, costs and expenses in connection with the foregoing.
The following unaudited pro forma condensed combined financial information has been prepared by applying the acquisition method of accounting with American Woodmark treated as the acquirer for accounting purposes and is dependent on certain valuations and other analyses that have yet to progress to a stage where there is sufficient information for a definitive measurement. Accordingly, any pro forma adjustments, including the allocation of the purchase price are preliminary, have been made solely for the purposes of providing unaudited pro forma condensed combined financial information and may be revised as additional information becomes available and additional analysis is performed.
The following unaudited pro forma condensed combined financial information presents the historical consolidated statements of operations and consolidated balance sheet of American Woodmark and the historical consolidated statements of operations and consolidated balance sheet of RSI adjusted to reflect the Transactions. The historical financial statements were prepared in conformity with GAAP. The unaudited pro forma condensed combined financial information is presented in accordance with the rules specified by Article 11 of Regulation S-X promulgated by the SEC, and has been prepared using the assumptions described in the notes thereto.
The pro forma condensed combined statement of income for the year ended April 30, 2017 combines the historical audited results of American Woodmark for the fiscal year ended April 30, 2017 and the unaudited results of RSI for the year ended April 1, 2017, which was derived from the audited results of RSI for the fiscal year ended December 31, 2016 less the unaudited results of RSI for the three months ended April 2, 2016 plus the unaudited results of RSI for the three months ended April 1, 2017. The pro forma condensed combined statement of income for the six months ended October 31, 2017 combines the historical unaudited results of American Woodmark for the six months ended October 31, 2017 and the historical unaudited results of RSI for the six months ended September 30, 2017. The pro forma condensed combined balance sheet as of October 31, 2017 combines the historical unaudited balance sheet of American Woodmark as of October 31, 2017 and the historical unaudited balance sheet of RSI as of September 30, 2017. The unaudited pro forma condensed combined balance sheet give effect to the Transactions as if they had occurred as of the balance sheet date. The unaudited pro forma condensed combined statements of operations give effect to the Transactions as if they had occurred on May 1, 2016, the beginning of the American Woodmark’s fiscal year ended April 30, 2017.
20
The historical financial statements have been adjusted in the Pro Forma Financial Statements to give effect to events that are (1) directly attributable to the pro forma events, (2) factually supportable, and (3) with respect to the statement of operations, expected to have a continuing impact on the combined company.
The unaudited pro forma condensed combined statements of income do not reflect cost savings expected to be realized from the elimination of certain expenses and synergies expected to be created or the costs to achieve such cost savings or synergies. Such costs may be material and no assurance can be given that cost savings or synergies will be realized.
The unaudited pro forma condensed combined financial information includes adjustments which are preliminary and may be revised. Acquisition accounting is dependent on certain valuations and other analyses that have yet to progress to a stage where there is sufficient information for a definitive measurement. Accordingly, any pro forma adjustments, including the allocation of the purchase consideration, are preliminary estimates, may be revised as additional information becomes available, and there can be no assurance that any such revisions will not result in material changes. The unaudited pro forma condensed combined financial statements have been prepared for illustrative purposes only. The pro forma information is not necessarily indicative of what the combined company’s condensed consolidated financial position or results of operations would actually have been had the pro forma events been completed as of the dates indicated. In addition, the unaudited pro forma condensed combined financial information does not purport to project the future financial position or operating results of the combined company. The pro forma information is based on the assumptions, adjustments and eliminations described in the accompanying notes to the unaudited pro forma combined condensed financial statements.
The following unaudited pro forma condensed combined financial information is presented:
| • | Unaudited pro forma condensed combined balance sheet as of October 31, 2017 |
| • | Unaudited pro forma condensed combined statement of income for the year ended April 30, 2017 |
| • | Unaudited pro forma condensed combined statements of income for the six months ended October 31, 2017 |
The unaudited pro forma condensed combined financial information should be read in conjunction with the historical audited annual and unaudited interim financial statements, including the notes thereto, of American Woodmark and RSI, included in the Financial Statements included in this Offering Memorandum. The unaudited pro forma condensed combined financial information is subject to risks and uncertainties, including those discussed in the section of this offering memorandum entitled “Risk Factors”. See “Risk Factors — Risk Related to the RSI Acquisition — The pro forma financial information included in this offering memorandum are presented for illustrative purposes only and may not be an indication of American Woodmark’s financial condition or results of operations following the RSI Acquisition”.
21
UNAUDITED PRO FORMA CONDENSED COMBINED STATEMENTS OF INCOME
SIX MONTHS ENDED OCTOBER 31, 2017
(in thousands)
| Historical | ||||||||||||||||||||||||||||||||||||
| American Woodmark |
RSI | |||||||||||||||||||||||||||||||||||
| Pro Forma Adjustments | ||||||||||||||||||||||||||||||||||||
| Six months ended October 31, 2017 |
Six months ended September 30, 2017 |
Reclassification Adjustments |
RSI Acquisition and Financing |
Assumed Refinancing |
Pro-Forma Combined |
|||||||||||||||||||||||||||||||
| Amount | Note | Amount | Note | Amount | Note | |||||||||||||||||||||||||||||||
| Net Sales |
$ | 551,596 | 280,927 | $ | — | $ | 832,523 | |||||||||||||||||||||||||||||
| Cost of sales and distribution |
435,767 | 201,501 | — | (77 | ) | C | — | 637,191 | ||||||||||||||||||||||||||||
|
|
|
|
|
|
|
|
|
|
|
|
|
|||||||||||||||||||||||||
| Gross Profit |
115,829 | 79,426 | — | 77 | — | 195,332 | ||||||||||||||||||||||||||||||
| Selling and marketing expenses |
36,230 | — | 11,989 | A | (22 | ) | D | — | 48,197 | |||||||||||||||||||||||||||
| General and administrative expenses |
17,950 | 23,983 | (11,989 | ) | A | 24,508 | E | — | 54,452 | |||||||||||||||||||||||||||
|
|
|
|
|
|
|
|
|
|
|
|
|
|||||||||||||||||||||||||
| Operating Income |
61,649 | 55,443 | — | (24,409 | ) | — | 92,683 | |||||||||||||||||||||||||||||
| Interest expense |
105 | 19,444 | 136 | B | 5,384 | F | (5,489 | ) | I | 19,580 | ||||||||||||||||||||||||||
| Other (income) expense |
(1,291 | ) | 798 | (136 | ) | B | 669 | G | 312 | J | 352 | |||||||||||||||||||||||||
|
|
|
|
|
|
|
|
|
|
|
|
|
|||||||||||||||||||||||||
| Income Before Income Taxes |
62,835 | 35,201 | — | (30,462 | ) | 5,177 | 72,751 | |||||||||||||||||||||||||||||
| Income tax expense (benefit) |
20,799 | 12,245 | — | (12,316 | ) | H | 2,093 | H | 22,821 | |||||||||||||||||||||||||||
|
|
|
|
|
|
|
|
|
|
|
|
|
|||||||||||||||||||||||||
| Net Income |
$ | 42,036 | $ | 22,956 | $ | — | $ | (18,146 | ) | $ | 3,084 | $ | 49,930 | |||||||||||||||||||||||
|
|
|
|
|
|
|
|
|
|
|
|
|
|||||||||||||||||||||||||
22
UNAUDITED PRO FORMA CONDENSED COMBINED STATEMENTS OF INCOME
YEAR ENDED APRIL 30, 2017
(in thousands)
| Historical | ||||||||||||||||||||||||||||||||||||
| American Woodmark |
RSI | |||||||||||||||||||||||||||||||||||
| Pro Forma Adjustments | ||||||||||||||||||||||||||||||||||||
| Year ended April 30, 2017 |
Year ended April 1, 2017 |
Reclassification Adjustments |
RSI Acquisition and Financing |
Assumed Refinancing |
Pro-Forma Combined |
|||||||||||||||||||||||||||||||
| Amount | Note | Amount | Note | Amount | Note | |||||||||||||||||||||||||||||||
| Net Sales |
$ | 1,030,248 | 596,107 | $ | — | $ | — | $ | — | $ | 1,626,355 | |||||||||||||||||||||||||
| Cost of sales and distribution |
805,612 | 417,853 | — | 365 | C | — | 1,223,830 | |||||||||||||||||||||||||||||
|
|
|
|
|
|
|
|
|
|
|
|
|
|||||||||||||||||||||||||
| Gross Profit |
224,636 | 178,254 | — | (365 | ) | — | 402,525 | |||||||||||||||||||||||||||||
| Selling and marketing expenses |
70,979 | — | 23,221 | A | 100 | D | — | 94,300 | ||||||||||||||||||||||||||||
| General and administrative expenses |
45,419 | 63,275 | (23,221 | ) | A | 46,413 | E | — | 131,886 | |||||||||||||||||||||||||||
|
|
|
|
|
|
|
|
|
|
|
|
|
|||||||||||||||||||||||||
| Operating Income |
108,238 | 114,979 | — | (46,878 | ) | — | 176,339 | |||||||||||||||||||||||||||||
| Interest expense |
885 | 38,657 | 54 | B | 10,768 | F | (10,560 | ) | I | 39,804 | ||||||||||||||||||||||||||
| Other (income) expense |
(1,572 | ) | (1,428 | ) | (54 | ) | B | 629 | G | 293 | J | (2,132 | ) | |||||||||||||||||||||||
|
|
|
|
|
|
|
|
|
|
|
|
|
|||||||||||||||||||||||||
| Income Before Income Taxes |
108,925 | 77,750 | — | (58,275 | ) | 10,267 | 138,667 | |||||||||||||||||||||||||||||
| Income tax expense (benefit) |
37,726 | 24,864 | (23,560 | ) | H | 4,151 | H | 43,181 | ||||||||||||||||||||||||||||
|
|
|
|
|
|
|
|
|
|
|
|
|
|||||||||||||||||||||||||
| Net Income |
$ | 71,199 | $ | 52,886 | $ | — | $ | (34,715 | ) | $ | 6,116 | $ | 95,486 | |||||||||||||||||||||||
|
|
|
|
|
|
|
|
|
|
|
|
|
|||||||||||||||||||||||||
23
UNAUDITED PRO FORMA CONDENSED COMBINED BALANCE SHEET
OCTOBER 31, 2017
(in thousands)
| Historical | Pro Forma Adjustments | |||||||||||||||||||||||||||||||||||
| American Woodmark |
RSI | Reclassification Adjustments |
RSI Acquisition and Financing |
Assumed Refinancing |
||||||||||||||||||||||||||||||||
| As of October 31, 2017 |
As of September 30, 2017 |
Amount | Note | Amount | Note | Amount | Note | Pro Forma Combined |
||||||||||||||||||||||||||||
| Current Assets |
||||||||||||||||||||||||||||||||||||
| Cash and cash equivalents |
$ | 162,545 | $ | 80,941 | $ | — | $ | (79,510 | ) | D | $ | (61,957 | ) | S | $ | 102,019 | ||||||||||||||||||||
| Investments — certificates of deposit |
57,500 | — | — | (49,500 | ) | E | — | 8,000 | ||||||||||||||||||||||||||||
| Customer receivables, net |
66,211 | 50,815 | — | — | — | 117,026 | ||||||||||||||||||||||||||||||
| Inventories |
46,723 | 63,601 | — | 3,889 | F | — | 114,213 | |||||||||||||||||||||||||||||
| Prepaid expenses and other |
9,189 | 9,019 | 1,476 | A | 13,594 | G, I | 14,003 | T | 47,281 | |||||||||||||||||||||||||||
| Prepaid income taxes |
— | 1,476 | (1,476 | ) | A | — | — | |||||||||||||||||||||||||||||
|
|
|
|
|
|
|
|
|
|
|
|
|
|||||||||||||||||||||||||
| Total Current Assets |
342,168 | 205,852 | — | (111,527 | ) | (47,954 | ) | 388,539 | ||||||||||||||||||||||||||||
| Property, plant and equipment, net |
121,732 | 61,288 | (8,359 | ) | B | 32,889 | H | — | 207,550 | |||||||||||||||||||||||||||
| Investments — certificates of deposit |
24,250 | — | — | (21,750 | ) | E | — | 2,500 | ||||||||||||||||||||||||||||
| Promotional displays, net |
4,729 | — | 8,359 | B | — | — | 13,088 | |||||||||||||||||||||||||||||
| Deferred income taxes |
10,140 | 10,797 | — | (20,937 | ) | I | — | — | ||||||||||||||||||||||||||||
| Other assets |
10,286 | 2,192 | — | — | — | 12,478 | ||||||||||||||||||||||||||||||
| Intangible Assets other than Goodwill |
— | 10,308 | — | 279,692 | J | — | 290,000 | |||||||||||||||||||||||||||||
| Goodwill |
— | — | — | 804,881 | K | — | 804,881 | |||||||||||||||||||||||||||||
|
|
|
|
|
|
|
|
|
|
|
|
|
|||||||||||||||||||||||||
| Total Assets |
$ | 513,305 | $ | 290,437 | $ | — | $ | 963,248 | $ | (47,954 | ) | $ | 1,719,036 | |||||||||||||||||||||||
|
|
|
|
|
|
|
|
|
|
|
|
|
|||||||||||||||||||||||||
| Current Liabilities |
||||||||||||||||||||||||||||||||||||
| Accounts payable |
$ | 38,739 | $ | 25,290 | $ | — | $ | 12,200 | L | $ | — | $ | 76,229 | |||||||||||||||||||||||
| Current maturities of long-term debt |
1,710 | 685 | — | 9,375 | M | 9,375 | U | 21,145 | ||||||||||||||||||||||||||||
| Accrued compensation and related expenses |
35,119 | — | 16,989 | C | — | — | 52,108 | |||||||||||||||||||||||||||||
| Accrued marketing expenses |
12,512 | — | — | — | — | 12,512 | ||||||||||||||||||||||||||||||
| Other accrued expenses |
12,130 | 35,250 | (16,989 | ) | C | 53 | N, I | (1,557 | ) | V | 28,887 | |||||||||||||||||||||||||
|
|
|
|
|
|
|
|
|
|
|
|
|
|||||||||||||||||||||||||
| Total Current Liabilities |
100,210 | 61,225 | — | 21,628 | 7,818 | 190,881 | ||||||||||||||||||||||||||||||
| Long Term Liabilities |
||||||||||||||||||||||||||||||||||||
| Long-term debt, less current maturities |
16,087 | 569,699 | — | 319,108 | O | (68,588 | ) | W | 836,306 | |||||||||||||||||||||||||||
| Defined benefit pension liabilities |
18,151 | — | — | — | — | 18,151 | ||||||||||||||||||||||||||||||
| Other long-term liabilities |
3,714 | 6,080 | — | (5,180 | ) | N, I | — | 4,614 | ||||||||||||||||||||||||||||
| Deferred income taxes |
— | — | — | 103,476 | I | 14,003 | T | 117,479 | ||||||||||||||||||||||||||||
|
|
|
|
|
|
|
|
|
|
|
|
|
|||||||||||||||||||||||||
| Total Liabilities |
138,162 | 637,004 | — | 439,032 | (46,767 | ) | 1,167,431 | |||||||||||||||||||||||||||||
| Shareholders’ Equity |
||||||||||||||||||||||||||||||||||||
| Preferred stock |
— | — | — | — | — | — | ||||||||||||||||||||||||||||||
| Common stock |
170,389 | 19 | — | 189,830 | P | — | 360,238 | |||||||||||||||||||||||||||||
| Additional paid in capital |
— | 67,515 | — | (67,515 | ) | Q | — | — | ||||||||||||||||||||||||||||
| Retained earnings |
244,683 | (414,101 | ) | — | 401,901 | R | (1,187 | ) | X | 231,296 | ||||||||||||||||||||||||||
| Defined benefit pension plans |
(39,929 | ) | — | — | — | — | (39,929 | ) | ||||||||||||||||||||||||||||
|
|
|
|
|
|
|
|
|
|
|
|
|
|||||||||||||||||||||||||
| Total Shareholders’ Equity |
375,143 | (346,567 | ) | — | 524,216 | (1,187 | ) | 551,605 | ||||||||||||||||||||||||||||
|
|
|
|
|
|
|
|
|
|
|
|
|
|||||||||||||||||||||||||
| Total Liabilities And Shareholders’ Equity |
$ | 513,305 | $ | 290,437 | $ | — | $ | 963,248 | $ | (47,954 | ) | $ | 1,719,036 | |||||||||||||||||||||||
|
|
|
|
|
|
|
|
|
|
|
|
|
|||||||||||||||||||||||||
24
NOTES TO UNAUDITED PRO FORMA
CONDENSED COMBINED FINANCIAL INFORMATION
(amounts in thousands except per share data)
| 1. | Description of the Transactions |
The Merger — On December 29, 2017 (the “Acquisition Date”), American Woodmark consummated the RSI Acquisition pursuant to the terms of the Merger Agreement. As a result of the merger of Merger Sub with and into RSI, Merger Sub’s separate corporate existence ceased, and RSI continued as the surviving corporation and a wholly owned subsidiary of American Woodmark.
As consideration for the RSI Acquisition, American Woodmark paid total accounting consideration of $553.2 million including (i) cash consideration of $ 363.3 million, net of cash acquired and (ii) 1,457,568 newly issued shares of American Woodmark common stock valued at $ 189.9 million based on $ 130.25 per share, which was the closing stock price on the Acquisition Date. The consideration paid is subject to a working capital adjustment by which the consideration will be adjusted upward or downward depending on whether the amount of working capital delivered at the Acquisition Date exceeds or is less than a target amount. The working capital adjustment has not yet been finalized and these pro forma financial statements do not reflect any adjustment to the estimated working capital reflected in the consideration paid at the Acquisition Date.
Senior Secured Credit Facilities — In connection with the RSI Acquisition, on December 29, 2017, American Woodmark entered into the Senior Secured Credit Facilities consisting of the $100 million Senior Secured Revolving Facility, the $250 million Senior Secured Initial Term Loan, and the $250 million Senior Secured Delayed Draw Term Loan. The borrowing rate on the Senior Secured Credit Facilities is a grid—based pricing based on the ratio of total funded debt under the Senior Secured Credit Facilities to EBITDA. The initial borrowing rate for the Senior Secured Credit Facilities is LIBOR plus 2.00% and an annual 0.25% commitment fee on the average daily undrawn portion of the Senior Secured Revolving Facility. Amounts borrowed under the Revolving Credit Facility are due December 29, 2022. American Woodmark used the proceeds of the Senior Secured Initial Term Loan, together with cash on its balance sheet, to fund the cash portion of the RSI Acquisition consideration and its transaction fees and expenses. In addition, American Woodmark drew down $50 million from the Senior Secured Revolving Facility to provide ongoing working capital and for other general corporate purposes of American Woodmark and its subsidiaries.
Senior Unsecured Notes — The proceeds of the Notes to be issued hereunder and the Senior Secured Delayed Draw Term Loan, together with cash on hand of American Woodmark and RSI, will be used to redeem or repurchase the RSI Notes, repay the outstanding balance of the Senior Secured Revolving Facility and pay fees, costs and expenses in connection with the foregoing.
| 2. | Basis of Presentation |
The accompanying unaudited pro forma condensed combined financial statements, or the “Pro Forma Statements,” and related notes were prepared using the acquisition method of accounting with American Woodmark considered the acquirer of RSI for accounting purposes. Accordingly, the consideration paid in the RSI Acquisition has been allocated to assets and liabilities of RSI based upon their estimated fair values as of the Acquisition Date. Any amount of the consideration that is in excess of the estimated fair values of assets acquired and liabilities assumed will be recorded as goodwill after the finalization of the purchase price allocation. Although management believes that the preliminary purchase price allocation herein is reasonable, there can be no assurance that finalization of such purchase price allocation will not result in material changes from the preliminary purchase price allocation included in the accompanying Pro Forma Financial Statements.
The historical financial statements have been adjusted in the Pro Forma Financial Statements to give effect to events that are (1) directly attributable to the pro forma events, (2) factually supportable, and (3) with respect to the statement of operations, expected to have a continuing impact on the combined company. The unaudited pro forma condensed combined statements of income does not reflect cost savings expected to be realized from the elimination of certain expenses and synergies expected to be created or the costs to achieve such cost savings or synergies. Such costs may be material and no assurance can be given that cost savings or synergies will be realized.
25
Certain pro forma adjustments have been made to align the accounting policies of RSI with American Woodmark where such RSI accounting policies are expected to change after the Acquisition Date. Further review may identify additional differences between the accounting policies of the two companies that, when conformed, could have a material impact on the financial statements of the combined company. However, at this time, we are not aware of any accounting policy differences that would have a material impact on the unaudited pro forma condensed combined financial statements of the combined company that are not reflected in the pro forma adjustments. Historically, American Woodmark has valued its inventory on a last-in, first-out basis (“LIFO”) and RSI has valued its inventory on a first-in, first-out basis (“FIFO”). American Woodmark’s management intends to maintain RSI’s FIFO valuation basis after the Acquisition Date. Therefore, a pro forma adjustment has not been made to conform RSI’s inventory valuation basis from FIFO to LIFO.
American Woodmark operates on a fiscal year basis which ends on April 30 of each year. Prior to the RSI Acquistion, RSI operated on a 52 to 53 week fiscal year, with its fiscal year ending on the Saturday closest to December 31. The pro forma condensed combined financial statements included herein are labeled based on American Woodmark’s convention. The pro forma condensed combined statement of income for the year ended April 30, 2017 combines the historical audited results of American Woodmark for the fiscal year ended April 30, 2017 and the unaudited results of RSI for the year ended April 1, 2017, which was derived from the audited results of RSI for the fiscal year ended December 31, 2016 less the unaudited results of RSI for the three months ended April 2, 2016 plus the unaudited results of RSI for the three months ended April 1, 2017. The pro forma condensed combined statement of income for the six months ended October 31, 2017 combines the historical unaudited results of American Woodmark for the six months ended October 31, 2017 and the historical unaudited results of RSI for the six months ended September 30, 2017. The pro forma condensed combined balance sheet as of October 31, 2017 combines the historical unaudited balance sheet of American Woodmark as of October 31, 2017 and the historical unaudited balance sheet of RSI as of September 30, 2017.
| 3. | Pro Forma Purchase Price Allocation |
American Woodmark has performed a preliminary valuation analysis of the fair value of RSI’s assets acquired and liabilities assumed as of the acquisition date. The following table summarizes the allocation of the preliminary purchase price as of the pro forma condensed combined balance sheet date, which is based on the accounting consideration of $553.2 million, to the estimated fair value of assets acquired and liabilities assumed as if the RSI acquisition had occurred on October 31, 2017:
| (in thousands) | ||||
| Customer receivables, net |
$ | 50,815 | ||
| Inventories |
67,490 | |||
| Prepaid expenses and other |
24,089 | |||
| Property, plant and equipment |
94,177 | |||
| Trademark intangibles |
10,000 | |||
| Customer relationship intangibles |
280,000 | |||
| Other non-current assets |
2,192 | |||
| Goodwill |
804,881 | |||
|
|
|
|||
| Total identifiable assets and goodwill acquired |
1,333,644 | |||
|
|
|
|||
| Accounts payable |
25,290 | |||
| Accrued compensation and related expenses |
16,989 | |||
| Other accrued expenses |
18,314 | |||
| Deferred Income Taxes |
113,616 | |||
| Other long-term liabilities |
900 | |||
| Debt |
605,332 | |||
|
|
|
|||
| Total liabilities assumed |
780,441 | |||
|
|
|
|||
| Total accounting consideration |
$ | 553,203 | ||
|
|
|
|||
This preliminary purchase price allocation has been used to prepare pro forma adjustments in the pro forma condensed combined balance sheet and statements of earnings. US GAAP permits companies to complete the
26
final determination of the fair value of assets and liabilities up to one year from the acquisition date. The final allocation may also result in changes to amortization periods assigned to the assets. Any potential adjustments made could be material in relation to the preliminary values.
| 4. | Reclassification Adjustments |
The reclassification adjustments to the historical presentation of RSI’s income statements and balance sheet were made to conform RSI’s presentation to American Woodmark’s presentation. Further review of RSI’s financial statements may result in additional reclassifications to conform to American Woodmark’s presentation. American Woodmark does not expect that any such revision would be material. The reclassification adjustments are presented below.
Reclassifications Reflected on the Unaudited Pro Forma Condensed Combined Statements of Income for the six months ended October 31, 2017 and year ended April 30, 2017
Adjustment A — Reclassifies certain sales and marketing expenses of RSI from general and administrative expenses to selling and marketing expenses to conform to American Woodmark’s presentation.
Adjustment B — Reclassifies interest income of RSI from interest expense to other (income) expense to conform to American Woodmark’s presentation.
Reclassifications Reflected on the Unaudited Pro Forma Condensed Combined Balance Sheet as of October 31, 2017
Adjustment A — Reclassifies prepaid income taxes of RSI to Prepaid Expenses and Other to conform to American Woodmark’s presentation.
Adjustment B — Reclassifies promotional displays of RSI from Property, Plant and Equipment, net to Promotional Displays, net to conform to American Woodmark’s presentation.
Adjustment C — Reclassifies compensation accruals of RSI from Other Accrued Expenses to Accrued Compensation and Related Expense to conform to American Woodmark’s presentation.
| 5. | Pro Forma Adjustments: RSI Acquisition and Financing |
The following pro forma adjustments have been reflected in the unaudited pro forma condensed combined financial information to reflect the acquisition of RSI and the related financing transactions to facilitate the acquisition, including the borrowing of the $250 million of Senior Secured Initial Term Loan and the drawdown of $50 million on the Senior Secured Revolving Facility. The pro forma adjustments are based on preliminary estimates and assumptions that are subject to change.
Pro Forma Adjustments Reflected on the Unaudited Pro Forma Condensed Combined Statements of Income for the six months ended October 31, 2017 and year ended April 30, 2017
Adjustment C
The following summarizes pro forma adjustments impacting Cost of Sales:
| Six months ended October 31, 2017 |
Year Ended April 30, 2017 |
|||||||||
| (in thousands) | ||||||||||
| C-1 |
Eliminate RSI’s historical depreciation expense for plant, property and equipment. |
$ | (4,799 | ) | $ | (9,088 | ) | |||
| C-2 |
Record depreciation expense for plant, property and equipment based on the preliminary estimated fair value of RSI’s plant, property and equipment acquired at the Acquisition Date. |
4,722 | 9,453 | |||||||
|
|
|
|
|
|||||||
| $ | (77 | ) | $ | 365 | ||||||
|
|
|
|
|
|||||||
See balance sheet adjustment H which describes the depreciation periods for property, plant and equipment.
27
Adjustment D
The following summarizes pro forma adjustments impacting Selling and Marketing expenses:
| Six months ended October 31, 2017 |
Year Ended April 30, 2017 |
|||||||||
| (in thousands) | ||||||||||
| D-1 |
Eliminate RSI’s historical depreciation expense for plant, property and equipment. |
$ | (1,363 | ) | $ | (2,488 | ) | |||
| D-2 |
Record depreciation expense for plant, property and equipment based on the preliminary estimated fair value of RSI’s plant, property and equipment acquired at the Acquisition Date. |
1,341 | 2,588 | |||||||
|
|
|
|
|
|||||||
| $ | (22 | ) | $ | 100 | ||||||
|
|
|
|
|
|||||||
See balance sheet adjustment H which describes the depreciation periods for property, plant and equipment.
Adjustment E
The following summarizes pro forma adjustments impacting General and Administrative expenses:
| Six months ended October 31, 2017 |
Year Ended April 30, 2017 |
|||||||||
| (in thousands) | ||||||||||
| E-1 |
Eliminate RSI’s historical depreciation expense for plant, property and equipment. |
$ | (495 | ) | $ | (1,018 | ) | |||
| E-2 |
Record depreciation expense for plant, property and equipment based on the preliminary estimated fair value of RSI’s plant, property and equipment acquired at the Acquisition Date. |
487 | 1,059 | |||||||
| E-3 |
Eliminate acquisition costs |
(484 | ) | (3,628 | ) | |||||
| E-4 |
Record amortization of trademarks intangible acquired |
1,667 | 3,333 | |||||||
| E-5 |
Record amortization of customer relationship intangible acquired |
23,333 | 46,667 | |||||||
|
|
|
|
|
|||||||
| $ | 24,508 | $ | 46,413 | |||||||
|
|
|
|
|
|||||||
See balance sheet adjustment H which describes the depreciation periods for property, plant and equipment. See balance sheet adjustment J which describes the amortization period for trademarks and customer relationship intangibles.
Adjustment F
The following summarizes pro forma adjustments impacting Interest Expense:
| Six months ended October 31, 2017 |
Year Ended April 30, 2017 |
|||||||||
| (in thousands) | ||||||||||
| F-1 |
Record estimated interest expense associated with Senior Secured Initial Term Loan. |
4,613 | 9,225 | |||||||
| F-2 |
Record commitment fee on Senior Secured Revolving Facility. |
125 | 250 | |||||||
| F-3 |
Record amortization on fees and costs for Senior Secured Credit Facilities. |
647 | 1,293 | |||||||
|
|
|
|
|
|||||||
| $ | 5,384 | $ | 10,768 | |||||||
|
|
|
|
|
|||||||
A one-eighth percent increase or decrease in the LIBOR based interest rate on the Senior Secured Initial Term Loan would cause a $312,500 annual increase or decrease, respectively, in the amount of pro forma interest expense.
28
Adjustment G
The pro forma adjustment is to reduce historical interest income to reflect estimated lower outstanding balances of cash and cash equivalents and investments in certificates of deposit due to the use of cash, in part, to acquire RSI.
Adjustment H
Reflects the income tax effect of pro forma adjustments based on historical statutory tax rates.
Pro Forma Adjustments Reflected on the Unaudited Pro Forma Condensed Combined Balance Sheet as of October 31, 2017
The pro forma balance sheet adjustments include adjustments to record the preliminary estimates of the fair value of assets acquired and liabilities assumed associated with the RSI Acquisition (as shown in Note 3), offset by elimination of RSI’s historical values as of the acquisition had occurred on October 31, 2017.
Adjustment D
The following summarizes pro forma adjustments impacting Cash:
| (in thousands) | ||||||
| D1 | $(444,295) | Cash consideration component for RSI Acquisition. | ||||
| D2 | 50,000 | Draw down of Senior Secured Revolving Facility at Closing Date. | ||||
| D3 | 250,000 | Proceeds of Senior Secured Initial Term Loan. | ||||
| D4 | (6,465) | Record payment of estimated debt issuance costs related to the Senior Secured Credit Facilities. | ||||
| D5 | 71,250 | Reclass amounts from Investments in CDs to cash to partially fund RSI Acquisition. | ||||
|
|
|
|||||
| $ | (79,510 | ) | ||||
|
|
|
|||||
Adjustment E
Adjustments reflect redemption of investments in certificates of deposit to fund, in part, the RSI Acquisition.
Adjustment F
Represents the estimated adjustment to step up RSI’s inventory to fair value. The estimated fair value of RSI inventories includes raw materials at historical cost (which approximated fair value) and finished goods and certain work-in-process at estimated fair value determined based on the estimated selling price of the inventory less the remaining manufacturing and selling costs and a normal profit margin on those manufacturing and selling efforts. The estimated fair value of finished goods inventory reflects a stepped-up value from historical cost at the Acquisition Date of $3.9 million, which will increase cost of sales over approximately 1 month as the inventory is sold. This increase is not reflected in the pro forma condensed combined statements of income because it does not have a continuing impact.
Adjustment G
Adjustment to assign no value to RSI’s tooling inventory to conform to American Woodmark’s policy of expensing such items when purchased.
Adjustment H
Adjustment to step-up RSI’s property, plant and equipment to preliminary estimated fair value. The fair value of property plant and equipment includes $4.7 million for buildings and $89.5 million for equipment. Estimated useful lives are 15 years for buildings and 7 years for equipment. The fair value and useful lives calculations are preliminary and subject to change after American Woodmark finalizes its review of the specific types, nature, age, condition and location of RSI’s property, plant and equipment.
29
Adjustment I
Adjusts tax assets and liabilities resulting from the acquisition of RSI. The pro forma condensed combined balance sheet as of October 31, 2017 includes the following tax balances resulting from the purchase price allocation: taxes receivable of $19.3 million (included in prepaid expenses and other), taxes payable of $78,000 (included in other accrued expenses), $900,000 included in other long-term liabilities, and deferred income tax liabilities of $113.6 million. The estimated increase in deferred tax liabilities to $113.6 million stems primarily from acquired intangibles based on an estimated tax rate of 40.43%. This estimate of deferred income tax balances is preliminary and subject to change based on management’s final determination of the fair value of assets acquired and liabilities assumed by jurisdiction.
The following table presents the pro forma adjustments made to arrive at the pro forma tax balances:
| Pro-Forma Tax Adjustments |
||||
| (in thousands) | ||||
| Prepaid expenses and other |
$ | 17,831 | ||
| Deferred income taxes (within Total Assets) (a) |
(20,937 | ) | ||
| Other accrued expenses |
78 | |||
| Other long-term liabilities |
(400 | ) | ||
| Deferred income taxes (within Total Liabilities) (a) |
103,476 | |||
| (a) | Includes reclassification of deferred tax asset of $10.1 million included on American Woodmark’s historical October 31, 2017 balance sheet to deferred tax liability to reflect a net deferred tax liability in the pro forma condensed combined balance sheet. |
Adjustment J
The following summarizes pro forma adjustments impacting Intangible Assets other than goodwill:
| (in thousands) | ||||||
| J1 | $(10,308) | Eliminate RSI historical balance of intangible assets other than goodwill. | ||||
| J2 | 10,000 | Record preliminary estimated trademark intangible based on preliminary purchase price allocation for RSI Acquisition. | ||||
| J3 | 280,000 | Record preliminary estimated customer relationship intangible based on preliminary purchase price allocation for RSI Acquisition. | ||||
|
|
|
|||||
| $279,692 | ||||||
|
|
|
|||||
As part of the preliminary valuation analysis, American Woodmark identified intangible assets, including trademarks and customer relationships. The fair value of identifiable intangible assets is determined primarily using the “income approach”, which requires a forecast of all of the expected future cash flows. Trademarks and customer relationship intangibles are estimated to have a useful life of three years and six years, respectively. These preliminary estimates of fair value and estimated useful lives will likely differ from final amounts Woodmark will calculate after completing a detailed valuation analysis, and the difference could have a material impact on the accompanying unaudited pro forma condensed combined financial statements.
Adjustment K
Records preliminary estimated goodwill based on preliminary purchase price allocation as if the acquisition of RSI had occurred on October 31, 2017.
Adjustment L
Represents transaction costs not reflected in the historical balance sheets. The adjustment results in a reduction of equity (See Adjustment R). No adjustment has been made to the Unaudited Pro Forma Condensed Combined Statements of Income for the six months ended October 31, 2017 and the year ended April 30, 2017 because the costs are non-recurring in nature.
30
Adjustment M
Reflects the current portion of the Senior Secured Initial Term Loan.
Adjustment N
Represents the write-off of RSI’s historical balance of accrued rent, which is not an assumed liability.
Adjustment O
The following summarizes pro forma adjustments to Long Term Debt less Current Maturities:
| (in thousands) | ||||||
| O1 | $ 34,948 | Record fair value adjustment of RSI Debt less historical debt issuance costs. | ||||
| O2 | 250,000 | Record Senior Secured Initial Term Loan. | ||||
| O3 | (9,375) | Reclass current portion of Senior Secured Initial Term Loan | ||||
| O4 | (6,465) | Record estimated debt issuance costs related to the Senior Secured Credit Facilities. | ||||
| O5 | 50,000 | Record draw down of Senior Secured Revolving Facility at Closing Date. | ||||
|
|
|
|||||
| $319,108 | ||||||
|
|
|
|||||
Adjustment P
The following tables details the adjustments to common stock:
| (in thousands) | ||||||
| P1 | $ (19) | Eliminate historical RSI on stock. | ||||
| P2 | 189,849 | Record fair value of American Woodmark common stock issued as part of consideration for RSI Acquisition. | ||||
|
|
|
|||||
| $189,830 | ||||||
|
|
|
|||||
Adjustment Q
Represents the elimination of RSI’s additional paid in capital.
Adjustment R
The following summarizes pro forma adjustments impacting Retained Earnings:
| (in thousands) | ||||||
| R1 | $414,101 | Eliminate historical RSI balance of retained earnings | ||||
| R2 | (12,200) | Record estimated acquisition expenses not reflected in the historical financial statements. | ||||
|
|
|
|||||
| $401,901 | ||||||
|
|
|
|||||
| 6. | Pro Forma Adjustments: Refinancing Transactions |
The following pro forma adjustments have been reflected in the unaudited pro forma condensed combined financial information to reflect the assumed refinancing transaction, including the issuance of the Notes offered hereby and the drawdown of $250 million on the Senior Secured Delayed Draw Term Loan, repayment of amounts outstanding under the Senior Secured Revolving Facility and the redemption or repurchase of the RSI Notes. The pro forma adjustments are based on preliminary estimates and assumptions that are subject to change.
31
Pro Forma Adjustments Reflected on the Unaudited Pro Forma Condensed Combined Statements of Income for the six months ended October 31, 2017 and year ended April 30, 2017
Adjustment I
The following summarizes pro forma adjustments to Interest Expense:
| Six months ended October 31, 2017 |
Year Ended April 30, 2017 |
|||||||||
| (in thousands) | ||||||||||
| I-1 |
Eliminate historical RSI interest expense associated with RSI Notes. |
$ | (18,688 | ) | $ | (37,012 | ) | |||
| I-2 |
Eliminate historical RSI amortization of debt issuance costs associated with the RSI Notes. |
(579 | ) | (1,102 | ) | |||||
| I-3 |
Record estimated interest expense associated with assumed issuance of Senior Delayed Draw Term Loan and the Notes |
13,363 | 26,725 | |||||||
| I-4 |
Record estimated amortization of debt issuance costs of assumed issuance of the Notes. |
415 | 829 | |||||||
|
|
|
|
|
|||||||
| $ | (5,489 | ) | $ | (10,560 | ) | |||||
|
|
|
|
|
|||||||
A one-eighth percent increase or decrease in the LIBOR based interest rate on the Senior Delayed Draw Term Loan would cause a $312,500 annual increase or decrease, respectively, in the amount of pro forma interest expense.
Adjustment J
The pro forma adjustment is to reduce historical interest income to reflect estimated lower outstanding balances of cash and cash equivalents and investments in certificates of deposit due to the use of cash, in part, to acquire RSI.
Pro Forma Adjustments Reflected on the Unaudited Pro Forma Condensed Combined Balance Sheet as of October 31, 2017
Adjustment S
The following summarizes pro forma adjustments to cash:
| S1 | $250,000 | Estimated proceeds from assumed drawdown of Senior Secured Delayed Draw Term Loan. | ||||
| S2 | 350,000 | Estimated proceeds from assumed issuance of Notes offered hereby. | ||||
| S3 | (576,557) | Assumed repurchase of RSI Notes and payment of accrued interest. | ||||
| S4 | (28,500) | Estimated tender premium and estimated expenses related to assumed repurchase of RSI Notes. | ||||
| S5 | (50,000) | Assumed repayment of Senior Secured Revolving Facility. | ||||
| S6 | (6,200) | Record payment of estimated debt issuance costs related to assumed issuance of Notes offered hereby. | ||||
| S7 | (700) | Record payment of estimated debt issuance costs related to assumed drawdown of Senior Delayed Draw Term Loan. | ||||
|
|
|
|||||
| $(61,957) | ||||||
|
|
|
Adjustment T
Represents the estimated tax effect of the refinancing transaction primarily related to the anticipated repurchase premium on the RSI Notes.
Adjustment U
Reflects the current portion of the assumed Senior Secured Delayed Draw Term Loan.
32
Adjustment V
Pro forma adjustment to reflect the assumed payment of accrued interest on RSI Notes.
Adjustment W
The following summarizes the pro forma adjustments to long-term debt, less current maturities:
| (in thousands) | ||||||
| W1 | $(575,000) | Record at par value assumed repurchase of RSI Notes. | ||||
| W2 | (27,313) | Write-off fair value step-up on RSI Notes. | ||||
| W3 | 250,000 | Record assumed draw down of Senior Secured Delayed Draw Term Loan. | ||||
| W4 | (9,375) | Reclass current portion of Senior Secured Delayed Draw Term Loan. | ||||
| W5 | 350,000 | Record assumed issuance of Notes issued hereby. | ||||
| W6 | (6,200) | Record estimated debt issuance costs related to assumed issuance of Notes offered hereby. | ||||
| W7 | (700) | Record payment of estimated debt issuance costs related to assumed drawdown of Senior Delayed Draw Term Loan. | ||||
| W8 | (50,000) | Record assumed repayment of Senior Secured Revolving Facility. | ||||
|
|
|
|||||
| $(68,588) | ||||||
|
|
|
|||||
Adjustment X
Represents the estimated loss (including transaction expenses) on repurchase of RSI Notes.
33
On December 22, 2017, the TCJA was signed into law. Among other changes is a permanent reduction in the federal corporate income tax rate from 35% to 21% effective January 1, 2018. As a result of the reduction in the corporate income tax rate, the Company will need to revalue its net deferred tax asset at December 31, 2017. The Company estimates that this will result in a reduction in the value of our net deferred tax asset, which will be recorded as additional income tax expense in the third quarter of fiscal 2018, however the Company is still in the process of analyzing the final legislation and determining an estimate of the financial impact.
At October 31, 2017, $41.5 million remained authorized by the Company’s Board of Directors to repurchase the Company’s common shares. The Company purchased a total of 251,241 and 58,371 common shares, for aggregate purchase prices of $23.5 million and $5.5 million, during the first six months of fiscal 2018 and during November 2017, respectively, under the authorizations. On December 1, 2017, the Company announced that it was suspending its stock repurchase program in conjunction with the then proposed RSI Acquisition.
34
MANAGEMENT’S DISCUSSION AND ANALYSIS OF FINANCIAL CONDITION AND RESULTS OF OPERATIONS OF RSI
Introduction
Management’s discussion and analysis of RSI’s financial condition and results of operations is provided as a supplement to the RSI audited consolidated financial statements and unaudited condensed consolidated financial statements and related notes included elsewhere in this offering memorandum to help provide an understanding of our financial condition and results of operations.
The statements in this discussion regarding industry outlook, our expectations regarding our future performance, liquidity and capital resources and other non-historical statements in this discussion are forward-looking statements. These forward-looking statements are subject to numerous risks and uncertainties, including, but not limited to, the risks and uncertainties described in “Risk Factors” and “Disclosure Regarding Forward-Looking Statements.” Actual results may differ materially from those contained in any forward-looking statements.
The following presentation is based on the historical financial statements of RSI and its subsidiaries and not on any pro forma financial data and before special items relating to the merger with American Woodmark.
Overview
RSI is a leading manufacturer of kitchen, bath and home storage cabinets in North America. RSI manufactures kitchen, bath and home storage cabinetry, along with bath countertops, for use in the residential repair and remodeling, and new residential construction markets. RSI currently serves three primarily channels (1) home centers, (2) kitchen and bath dealers and distributors and (3) national and regional homebuilders. RSI holds a leading position in the home center channel, and are actively growing our position within the dealer and homebuilder channels.
RSI is based in Anaheim, California with sales offices in Mooresville, North Carolina and Roswell, Georgia. It has manufacturing and distribution centers in the United States in California, North Carolina and Texas and in Tijuana, Mexico, as well as supply sourcing offices in Hong Kong and the People’s Republic of China.
Prior to the merger with American Woodmark on December 29, 2017, RSI operated on a 52 to 53 week fiscal year, with its fiscal year ending on the Saturday closest to December 31. Fiscal year 2017 (“2017”) ended on December 30, 2017 and fiscal year 2016 (“2016”) ended on December 31, 2016. 2017 and 2016 contain 52 weeks. Each fiscal quarter within 2017 and 2016 contains 13 weeks. The third quarter of 2017 ended on September 30, 2017 and the third quarter of 2016 ended on October 1, 2016. Consolidated statements of income, balance sheets and statements of cash flow references are to our year- end dates, unless the context requires otherwise.
35
Results of Operations for the Nine Months Ended September 30, 2017 and October 1, 2016
Nine Months Ended September 30, 2017 Compared to Nine Months Ended October 1, 2016
The following table summarizes RSI’s consolidated results of operations for the nine months ended 2017 and 2016.
| Nine Months Ended | ||||||||||||
| September 30, 2017 (unaudited) |
October 1, 2016 (unaudited) |
% Change |
||||||||||
| Net sales |
$ | 428,478,000 | $ | 457,546,000 | (6.4 | )% | ||||||
| Cost of goods sold |
304,520,000 | 322,368,000 | (5.5 | ) | ||||||||
| Selling, general and administrative expenses (including stock- based compensation expense (benefit) of $(780,000) and ($14,881,000) in the nine months of 2017 and 2016, respectively) |
45,340,000 | 26,580,000 | 70.6 | |||||||||
| Other expense (income) |
(1,429,000 | ) | 278,000 | (614.0 | ) | |||||||
| Interest expense, net |
29,207,000 | 29,248,000 | (0.1 | ) | ||||||||
| Income tax expense |
17,773,000 | 27,320,000 | (34.9 | ) | ||||||||
| Net income |
$ | 33,067,000 | $ | 51,752,000 | (36.1 | )% | ||||||
First Nine Months of fiscal year 2017 Compared to First Nine Months of fiscal year 2016
Net sales. Net sales decreased by $29.0 million, or 6.4%, to $428.5 million as compared to the first nine months of 2016 net sales of $457.5 million. Net sales decreased primarily due to declines in RSI’s home center kitchen category driven by a change in RSI’s customer’s promotional strategy coupled with a transition out of selected east coast markets, a decline in RSI’s dealer/distributor channel and a decline in RSI’s special order Designer Series due to the re-launch of the program. The decline relating to transitions out of selected east coast markets impacted RSI’s third quarter of 2017 and continued to impact the fourth quarter of 2017, which we expect to result in modest declines in RSI’s operating results for the fourth quarter of 2017. These decreases were partially offset by the growth in RSI’s builder channel driven by higher demand in both the single-family and multi-family housing markets in Southern California, combined with growth in RSI’s home center bath category from improved sell through of new products.
Cost of goods sold. Cost of goods sold decreased $17.8 million, or 5.5%, to $304.5 million as compared to the first nine months of 2016. Cost of goods sold as a percentage of nets sales was 71.1% in the first nine months of 2017 compared to 70.5% in the first nine months of 2016. The increase in the cost of goods sold percentage was driven by the deleveraging of fixed costs on lower volumes and costs associated with the Designer Series program which were partially offset by selective 2016 price adjustments.
Selling, general and administrative expenses. Selling, general and administrative expenses increased $18.8 million, or 70.6%, to $45.3 million as compared to the first nine months of 2016. As a percentage of net sales, selling, general and administrative expenses increased to 10.6% as compared to 5.8% in the first nine months of 2016. The increase in expenses was primarily due to a benefit in 2016 related to changes in the intrinsic value of RSI’s liability-classified outstanding stock options of $14.1 million, which did not recur in 2017, $2.6 million in costs related to the start-up of a North Carolina manufacturing facility and the restructuring costs of RSI’s Texas manufacturing facility, and higher legal and other professional service fees related to a potential capital transaction of $1.4 million.
Other expense. Other expense decreased from $0.3 million in the first nine months of 2016 to other income of $1.4 million in the first nine months of 2017. This decrease in expense was primarily due to an adjustment to the market value of RSI’s forward contracts to purchase pesos.
Interest expense. Interest expense totaled $29.2 million in the first nine months of 2017 and 2016.
Income taxes. RSI’s effective income tax rates were 35.0% and 34.6% for the first nine months of 2017 and 2016.
36
RSI Liquidity and Capital Resources as of and for the Nine Months Ended September 30, 2017 and October 1, 2016
Liquidity
RSI’s primary liquidity needs are to support working capital requirements, fund capital expenditures, pay dividends and pay interest on its bonds and notes payable. RSI’s principal sources of liquidity are cash and cash equivalents on hand, cash provided by operating activities, borrowings under its former senior secured credit facilities, notes payable and the issuance of bonds.
RSI had $80.9 million and $49.3 million of cash and cash equivalents on hand at September 30, 2017 and December 31, 2016, respectively.
Capital Resources
As of September 30, 2017, RSI had a $75.0 million senior secured credit facility that was scheduled to expire in March 2020 and has since been cancelled. The interest rate under this facility was variable based on LIBOR or the Prime rate plus the applicable rate spread at the time of borrowing. There was no balance outstanding at September 30, 2017 on the senior secured credit facility. There was a $3.7 million standby letter of credit outstanding at September 30, 2017 related to RSI’s partially self- insured workers’ compensation program.
At September 30, 2017, RSI’s total debt was $578.0 million, excluding the net balance of deferred financing costs reflected in consolidated balance sheets, which consisted of $575.0 million in bonds and $3.0 million in notes payable.
Cash Flows
The following table summarizes RSI’s cash flows for the first nine months 2017 and 2016.
| Nine Months Ended | ||||||||
| September 30, 2017 (unaudited) |
October 1, 2016 (unaudited) |
|||||||
| Net cash provided by operating activities |
$ | 42,940,000 | $ | 54,137,000 | ||||
| Net cash used in investing activities |
(11,042,000 | ) | (21,878,000 | ) | ||||
| Net cash used in financing activities |
(250,000 | ) | (322,000 | ) | ||||
|
|
|
|
|
|||||
| Net increase in cash |
$ | 31,648,000 | $ | 31,937,000 | ||||
|
|
|
|
|
|||||
Net cash provided by operating activities in the first nine months of 2017 was $42.9 million compared to $54.1 million in the first nine months of 2016. This decrease was primarily due to lower net income in the first nine months of 2017 as compared to the first nine months of 2016 after adjusting for non-cash depreciation, amortization and stock-based compensation expense (benefit). In addition, the first nine months of 2016 included a positive impact in operating cash from more effective accounts payable management that was put in place at the end of 2015.
Net cash used in investing activities in the first nine months of 2017 decreased by $10.8 million compared to the first nine months of 2016 primarily due to lower expenditures for displays and manufacturing equipment as the prior year included expenditures for displays to support new product introductions and investments for added capacity for business growth.
Net cash used in financing activities in the first nine months of 2017 and 2016 was $0.3 million each for notes payable repayments.
37
RSI Results of Operations for the Years Ended December 31, 2016 and January 2, 2016
2016 Compared to 2015
The following table summarizes RSI’s consolidated results of operations for 2016 and 2015.
| Fiscal Years Ended | ||||||||||||
| December 31, 2016 |
January 2, 2016 |
% Change |
||||||||||
| Net sales |
$ | 598,094,000 | $ | 595,527,000 | 0.4 | % | ||||||
| Cost of goods sold |
420,160,000 | 418,015,000 | 0.5 | |||||||||
| Selling, general and administrative expenses (including stock-based compensation (benefit) expense of ($12,608,000) and $37,353,000 in the 2016 and 2015, respectively) |
41,399,000 | 97,433,000 | (57.5 | ) | ||||||||
| Other expense (income) |
334,000 | (481,000 | ) | (169.4 | ) | |||||||
| Loss on extinguishment of debt |
— | 35,353,000 | n/m | |||||||||
| Interest expense, net |
38,641,000 | 39,306,000 | (1.7 | ) | ||||||||
| Income tax expense |
31,955,000 | 1,521,000 | 2,000.9 | |||||||||
| Net income |
$ | 65,605,000 | $ | 4,380,000 | 1,397.8 | % | ||||||
2016 Compared to 2015
Net sales. Net sales increased by $2.6 million, or 0.4%, to $598.1 million as compared to 2015 of $595.5 million. Net sales increased primarily due to the new business launches of RSI’s special order Designer Series program at Home Depot and its new special order bath program at Lowes, combined with sales growth in our dealer/distributor channel and RSI’s stock kitchen category. These increases were partially offset by the declines in RSI’s builder channel and in its Home Center stock bath category related to lower promotional activity and the non-recurrence of the 2015 load-ins to support new product introductions.
Cost of goods sold. Cost of goods sold increased $2.1 million, or 0.5%, to $420.2 million as compared to 2015. Cost of goods sold as a percentage of nets sales for 2016 was 70.2%, which was flat compared to 2015. The favorable operational performance and selective price adjustments, which were offset by costs associated with new business launches and continued wage pressures.
Selling, general and administrative expenses. Selling, general and administrative expenses decreased $56.0 million, or 57.5%, to $41.4 million as compared to 2015. As a percentage of net sales, selling, general and administrative expenses decreased to 6.9% as compared to 16.4% in 2015. The decrease in expenses was primarily due to lower non-cash stock-based compensation expense resulting from changes in the intrinsic value of RSI’s liability classified outstanding stock options of $25.4 million, lower special bonuses paid to certain option holders of $20.2 million, as well as legal and other professional service fees related to capital transactions of $7.9 million.
Loss on extinguishment of debt. Loss on extinguishment of debt was $35.4 million or 5.9% of net sales for 2015. These non-recurring expenses related to the early repayment of RSI’s 2018 bonds issued in February 2013 and the write-off of the unamortized deferred financing costs associated with the bonds.
Interest expense. Interest expense decreased $0.7 million, or 1.7%, to $38.6 million as compared to 2015. This decrease was primarily due to lower amortization of debt issuance costs.
Income taxes. RSI’s effective income tax rates for 2016 and 2015 were 32.8% and 25.8%, respectively.
RSI Liquidity and Capital Resources as of and for the Years Ended December 31, 2016 and January 2, 2016
Liquidity
RSI’s primary liquidity needs are to support working capital requirements, fund capital expenditures, pay dividends and pay interest on its bonds and notes payable. Our principal sources of liquidity are cash and cash equivalents on hand, cash provided by operating activities, borrowings under its former senior secured credit facilities, notes payable and the issuance of bonds.
38
RSI had $49.3 million and $47.5 million of cash and cash equivalents on hand at December 31, 2016 and January 2, 2016, respectively.
Capital Resources
As of December 31, 2016, RSI had a $75.0 million senior secured credit facility which was set to expire in March 2020 and has since been cancelled. The interest rate under this facility is variable based on LIBOR or the Prime rate plus the applicable rate spread at the time of borrowing. There was no balance outstanding at December 31, 2016 on the senior secured credit facility. There was a $3.7 million standby letter of credit outstanding at December 31, 2016 related to RSI’s partially self-insured workers compensation program.
At December 31, 2016, our total debt was $575.9 million, excluding the net balance of deferred financing costs reflected in consolidated balance sheets, which consist of $575.0 million in bonds and $0.9 million in notes payable.
Cash Flows
The following table summarizes our cash flows for 2016 and 2015.
| Fiscal Years Ended | ||||||||
| December 31, 2016 | January 2, 2016 | |||||||
| Net cash provided by operating activities |
$ | 80,360,000 | $ | 67,871,000 | ||||
| Net cash used in investing activities |
(28,327,000 | ) | (19,161,000 | ) | ||||
| Net cash used in financing activities |
(50,249,000 | ) | (89,383,000 | ) | ||||
|
|
|
|
|
|||||
| Net increase (decrease) in cash |
$ | 1,784,000 | $ | (40,673,000 | ) | |||
|
|
|
|
|
|||||
Net cash provided by operating activities in 2016 was $80.4 million compared to $67.9 million in 2015. This increase was primarily due to a reduction in inventory during 2016.
Net cash used in investing activities in 2016 increased by $9.1 million compared to 2015 primarily due to higher expenditures for manufacturing equipment used to add capacity in preparation for business growth and expenditures for displays to support new product introductions.
Net cash used in financing activities in 2016 was $50.2 million compared to $89.4 million in 2015. Net cash used in 2016 was primarily related to a distribution to shareholders of $50.0 million and $0.5 million in notes payable repayments, offset by $0.3 million in proceeds from the issuance of common stock. Net cash used in 2015 consisted of $100.0 million distribution to shareholders, the repayment of the $525.0 million 2018 bonds, $28.3 million early retirement premium associated with the 2018 bonds, $11.0 million in debt issuance costs and $0.7 million in notes payable repayments, offset by $575.0 million bond issuance proceeds from the issuance of the 2023 bonds and proceeds from the issuance of common stock of $0.6 million.
39
RSI Results of Operations for the Years Ended January 2, 2016 and January 3, 2015
2015 Compared to 2014
The following table summarizes our consolidated results of operations for 2015 and 2014.
| Fiscal Years Ended | ||||||||||||
| January 2, 2016 |
January 3, 2015(1) |
% Change |
||||||||||
| Net sales |
$ | 595,527,000 | $ | 540,033,000 | 10.3 | % | ||||||
| Cost of goods sold |
418,015,000 | 374,851,000 | 11.5 | |||||||||
| Selling, general and administrative expenses (including stock-based compensation expense of $37,353,000 and $11,403,000, respectively) |
97,433,000 | 66,317,000 | 46.9 | |||||||||
| Other (income) expense |
(481,000 | ) | 552,000 | (187.1 | ) | |||||||
| Loss on extinguishment of debt |
35,353,000 | — | n/m | |||||||||
| Interest expense, net |
39,306,000 | 39,463,000 | (0.4 | ) | ||||||||
| Income tax expense |
1,521,000 | 19,737,000 | (92.3 | ) | ||||||||
|
|
|
|
|
|
|
|||||||
| Net income |
$ | 4,380,000 | $ | 39,113,000 | (88.8 | )% | ||||||
|
|
|
|
|
|
|
|||||||
| (1) | RSI operates on a 52/53 week fiscal year. Fiscal year 2014 contained an extra operating week. |
2015 Compared 2014
Net sales. Net sales increased by $55.5 million, or 10.3%, to $595.5 million as compared to 2014 net sales of $540.0 million. Net sales increased primarily due to strong sales growth and new product introductions in RSI’S home center channel led by its bath and kitchen categories and the continued growth in its builder and dealer channel.
Cost of goods sold. Cost of goods sold increased $43.2 million, or 11.5%, to $418.0 million as compared to 2014. As a percentage of net sales, cost of sales increased to 70.2% in 2015 from 69.4% in 2014. The higher cost of goods sold percentage was driven primarily by sales mix, increased costs due to new product introductions and higher labor and overhead input costs. These items were partially offset by stabilizing hardwood material costs, the benefits of RSI’s VICO ® initiatives and price increases on selected items beginning in March 2014.
Selling, general and administrative expenses. Selling, general and administrative expenses increased $31.1 million, or 46.9%, to $97.4 million as compared to 2014. As a percentage of net sales, selling, general and administrative expenses increased to 16.4% as compared to 12.3% in 2014. The increase in expenses was primarily due to higher stock based compensation expense resulting primarily from special bonuses paid to certain option holders in 2015 of $27.0 million, as well as non-recurring legal and professional service fees relating to capital transactions of $7.9 million. These increases were partially offset by the $3.1 million in costs related to the closure and relocation of a Mexico manufacturing facility in 2014.
Loss on extinguishment of debt. Loss on extinguishment of debt of $35.4 million was 5.9% of net sales for 2015. These non-recurring expenses are related to the early repayment of RSI’s $525.0 million bonds issued in February 2013 and the write-off of the unamortized deferred financing costs associated with the bonds.
Interest expense. Interest expense decreased $0.2 million, or 0.4%, to $39.3 million as compared to 2014. This decrease was primarily due to lower amortization of debt issuance costs and one less week of interest expense in 2015 totaling $1.5 million. These decreases were offset by the additional interest expense on RSI’s $575.0 million of 6.5% notes issued in March 2015 as compared to RSI’s $525.0 million of 6.875% notes which were extinguished in March 2015.
Income taxes. RSI’s effective income tax rates were 25.8% and 33.5% for 2015 and 2014, respectively.
40
RSI Liquidity and Capital Resources as of and for the Years Ended January 2, 2016 and January 3, 2015
Liquidity
RSI’s primary liquidity needs are to support working capital requirements, fund capital expenditures, pay dividends, and pay interest on RSI’s bonds and notes payable. RSI’s principal sources of liquidity are cash and cash equivalents on hand, cash provided by operating activities, borrowings under its former senior secured credit facilities, notes payable and the issuance of bonds.
RSI had $47.5 million and $88.2 million of cash and cash equivalents on hand at January 2, 2016 and January 3, 2015, respectively.
Capital Resources
As of January 2, 2016, RSI had a $75.0 million senior secured credit facility which was set to expire in March 2020 and has since been cancelled. The interest rate under this facility was variable based on LIBOR or the Prime rate plus the applicable rate spread at the time of borrowing. There was no balance outstanding at January 2, 2016 on the senior secured credit facility. There was a $3.7 million standby letter of credit outstanding at January 2, 2016 related to RSI’s partially self-insured workers compensation program.
At January 2, 2016, RSI’s total debt was $576.0 million which consisted of $575.0 million in bonds and $1.0 million in notes payable.
Cash Flows
The following table summarizes our cash flows for 2015 and 2014.
| Fiscal Years Ended | ||||||||
| January 2, 2016 | January 3, 2015(1) | |||||||
| Net cash provided by operating activities |
$ | 67,871,000 | $ | 53,760,000 | ||||
| Net cash used in investing activities |
(19,161,000 | ) | (10,668,000 | ) | ||||
| Net cash (used in) provided by financing activities |
(89,383,000 | ) | 1,012,000 | |||||
|
|
|
|
|
|||||
| Net increase (decrease) in cash |
$ | (40,673,000 | ) | $ | 44,104,000 | |||
|
|
|
|
|
|||||
| (1) | RSI operates on a 52/53 week fiscal year. Fiscal year 2014 contained an extra operating week. |
Net cash provided by operating activities in 2015 increased by $14.1 million compared to 2014, primarily due to an increase in net income after adjusting for non-cash items and the early retirement premium for the 2018 bonds. Also contributing to the increase in operating cash was more effective accounts payable management. These items were partially offset by an increase in inventory resulting from upcoming promotional events and an increase in accounts receivable driven by higher sales recognized in the later portion of the fourth quarter of 2015.
Net cash used in investing activities in 2015 increased by $8.5 million compared to 2014 primarily due to higher expenditures for manufacturing equipment to add capacity in preparation for business growth and expenditures for displays to support new product introductions.
Net cash used in financing activities in 2015 was $89.4 million compared to net cash provided by financing activities in 2014 of $1.0 million. Net cash used in 2015 consisted of $100.0 million distribution to shareholders, the repayment of the $525.0 million 2018 bonds, $28.3 million early retirement premium associated with the 2018 bonds and $11.0 million in debt issuance costs, offset by $575.0 million bond issuance proceeds from the issuance of the 2023 bonds. Net cash provided in 2014 was primarily due to proceeds from the issuance of common stock of $2.4 million, partially offset by the payment of notes payable of $1.4 million.
41
Our Company
We manufacture and distribute kitchen, bath and home organization products for the remodeling and new home construction markets. Our products are sold on a national basis directly to home centers, builders and distributors and through a network of independent dealers. We presently operate 18 manufacturing facilities and seven primary service centers across the country.
American Woodmark was incorporated in 1980 by the four principal managers of the Boise Cascade Cabinet Division through a leveraged buyout of that division. We operated privately until 1986 when we became a public company through a registered public offering of common stock.
Our Business Excluding RSI
We offer framed stock and stock plus cabinets in over 420 different cabinet lines, ranging in price from relatively inexpensive to medium-priced styles. These cabinets are offered in a broad range of sizes, construction and decorative options to achieve a broad range of design layouts. To satisfy the fashion and style needs of the market place we offer over 90 door designs with a targeted range of painted and stained finishes on maple, cherry and oak as well as engineered fronts under the Duraform mark.
These products are sold under the brand names of American Woodmark, Simply Woodmark, Timberlake, Shenandoah Cabinetry, Shenandoah Value Series, and Waypoint Living Spaces.
The products are sold on a national basis across the United States to the remodeling and new home construction markets. We service these markets through three primary channels: home centers, builders and distributors, and independent dealers. We provide complete turnkey installation services to our direct builder customers via our network of seven primary service centers that are strategically located throughout the United States. We distribute these products to each market channel directly from four assembly plants through a third party logistics network.
The RSI Acquisition
On December 29, 2017, we completed the acquisition of RSI, a leading manufacturer of kitchen and bath cabinetry and home organization products, for consideration consisting of 1,457,568 newly issued shares of American Woodmark common stock, approximately $354 million in net cash (subject to certain customary post-closing working capital, indebtedness and seller expense true ups), and the assumption of approximately $589 million of RSI debt, including accrued interest. We refer to this acquisition as the “RSI Acquisition.”
Founded in 1989 by Ron Simon with a vision of creating value for customers by providing high quality products at affordable prices not otherwise widely available in the industry, RSI had grown to one of the largest in-stock and value-based cabinet makers in North America providing kitchen, bathroom, home and garage organization cabinetry, counter tops and accessories with over 100 styles and finishes to home centers, builders, dealers and remodeling contractors.
RSI sells products under the brand names of American Classics by RSI, Estate by RSI, Continental Cabinets, Insignia by RSI, Architectural Bath, MasterBath by RSI, VillaBath by RSI, Designer Series and RSI Professional Cabinet Solutions. RSI also sells products under key customer’s private label brands, such as Hampton Bay, Glacier Bay, Blue Hawk, Style Selections, Home Decorators Collection and Project Source.
Our Competitive Strengths
Market Leader with Nationwide Manufacturing and Distribution Network
We believe our combined company holds the number two market position in the United States cabinet market with an estimated 10% market share. We are one of a select number of market participants with a national manufacturing and distribution footprint, including 18 manufacturing facilities and seven primary service centers across the United States and Mexico. Our operating footprint provides us an ability to service our builder,
42
dealer and home center customers on a national basis, and with the acquisition of RSI, we offer a broader set of products to serve our customers across a variety of price points. Facilities are primarily located in or near major metropolitan markets to facilitate efficient product distribution to our customers. We believe the scale and breadth of our operations differentiate us and result in a significant competitive advantage providing superior customer service, low-cost distribution and on-time delivery.
Comprehensive Product Offering with Diversified End Markets
We believe that the diversity of our product portfolio across categories, channels and end markets benefits our financial performance, both in periods of growth and cyclicality. Our stock and stock-plus offering provide made-to-order products for customers looking for a designer product, which can be used for both new home construction and remodeling applications. The addition of the in-stock offering with our acquisition of RSI allows us to further serve our existing end markets through the addition of a lower price point product that is well-suited for areas of growing demand such as new home construction targeting the first-time homebuyer. We also offer turnkey cabinet solutions for our builder customers which we believe is a unique aspect of our service platform. Our turnkey solution provides in-house design and measurement as well as installation service using independent contractors. We believe the ability to leverage our labor and expertise is a value-added service to our builder customers which has helped strengthen our position in the new home construction market.
Deep Relationships with Leading Retailers
We have built strong and stable relationships with a base of long-standing, blue-chip customers across home centers, builders and independent dealers and distributors. We have an average relationship length of fifteen years with our top ten customers, including long-standing relationships with Home Depot and Lowe’s. We believe our customers value our national manufacturing and distribution footprint, which allows us to meet the most demanding logistics and performance obligations. We believe our focus on providing exceptional customer service and a quality product at a competitive price have enabled us to establish ourselves as a vendor of choice.
Best-in-Class Manufacturing Capabilities
We operate 18 manufacturing facilities across the United States and Mexico. Our vertically-integrated production and assembly lines, standardized product construction and investments in automation, have allowed us to continuously improve productivity and efficiency. We have standardized our raw material inputs and a number of our production processes, which reduces logistical requirements and provides increased economies of scale in sourcing these inputs. The RSI acquisition increases our manufacturing capacity to support additional growth. In addition, RSI’s production of labor-intensive manufacturing and fabrication processes in Mexico offer a low cost alternative to Asian manufacturers, while providing a higher quality product with lower transportation costs. We believe there are opportunities to transition certain inputs currently processed by our vendors to our facilities in Mexico.
Strong Free Cash Flow and Conservative Credit Profile
We believe that our efficient operating model has allowed us to generate consistent free cash flow (defined as net cash provided by operating activities less capital expenditures). We expect that the acquisition of RSI will allow us to continue to realize strong free cash flow conversion driven by our increased scale, operating efficiencies from leveraging RSI’s low-cost manufacturing capabilities and limited capital expenditure requirements.
From the beginning of fiscal year 2015 through October 31, 2017 our legacy business generated cumulative free cash flow of $162.5 million which was primarily used to invest in operations and fund growth. From fiscal year 2015 to the twelve months ended October 31, 2017, we grew Adjusted EBITDA by 87.5% and while maintaining a ratio of net debt to Adjusted EBITDA below 1.0:1.0. See “Summary—Summary Financial and Other Data”. For the twelve-month period ended October 31, 2017 pro forma for the acquisition of RSI, the combined company had a solid credit profile with a ratio of net debt to Adjusted EBITDA of 2.82 to 1.00. See “Unaudited Pro Forma Condensed Combined Financial Information”. RSI similarly has a history of strong free cash flow generation delivering cumulative free cash flow of $173.8 million from the beginning of RSI’s fiscal year 2014 through September 30, 2017.
43
As we continue our focus on operational excellence, we expect to realize further increases in profitability, positioning us to continue to realize strong free cash flow which we will use to reduce debt incurred to fund our acquisition of RSI.
Experienced Management Team
We have assembled an executive team from leading organizations with a deep base of management experience within industrial manufacturing companies. Our Chief Executive Officer, Cary Dunston, joined our team in 2006 and was named Chief Executive Officer in 2015. Mr. Dunston has a broad range of experience in manufacturing and supply chain management including the implementation of continuous improvement programs and Lean Manufacturing initiatives. Our team has identified and begun to execute on opportunities for operational improvement that has yielded increased profitability. These initiatives are focused on manufacturing productivity, strategic sourcing and new product development. The addition of RSI’s talented employee base will further add to the experience and expertise of the combined company’s management team.
Business Strategy
For the past several years, our strategy has focused on increasing operational efficiency to drive enhanced profitability, leveraging our differentiated service platform to grow revenue, particularly in our new construction business, and continuing to deepen relationships within our existing customer base. We believe that the acquisition of RSI provides an opportunity to make further progress in each of these areas, while also expanding our product offering into the in-stock category which we expect will provide strategic growth opportunities. The key elements of our strategy are described further below.
Expand our Product Offering to Capitalize on Growth Opportunities
Our current manufacturing platform is well positioned to serve the middle- to higher-end stock and stock plus categories, and the addition of RSI provides a low-cost manufacturing base to profitably serve the more value-oriented in-stock and stock categories. The lower price point offering provides us the ability to continue to serve the nation’s top single-family builders as they increasingly focus on attracting the first-time homebuyer. RSI’s low-cost manufacturing platform is specifically designed and engineered to service the in-stock and lower- to middle-end stock categories with very little overlap with our legacy product lines. While the RSI acquisition establishes us as a leader in the in-stock category, we remain committed to opportunistically expanding into the higher-end semi-custom category, particularly for the long-term growth of our dealer business.
Enhance Margins and Free Cash Flow Generation Through Operational Excellence
We have undertaken several initiatives focused on driving increased profitability including rightsizing our operating footprint and outsourcing certain manufacturing functions. We have made, and will continue to make, investments in new technologies to improve quality and reduce cost throughout our vertically integrated platform. In addition, we have introduced and are continuing to evaluate new, lower cost materials for key cabinet components. We believe our focus on operational improvement has driven the increase in our Adjusted EBITDA margin by over 400 bps from 9% for the fiscal year ended April 30, 2015 to 13% for the twelve-month period ended October 31, 2017. We believe that the RSI acquisition provides us the ability to leverage their low-cost manufacturing capabilities to further expand our profit margins and free cash flow.
Leverage Our Platform and Existing Customer Relationships to Expand into the Multifamily Market
We currently have a limited presence in the multifamily new construction end market, which accounted for approximately 30% of total housing starts in 2016 according to the U.S. Census Bureau. We believe this is an underserved market where we are well-positioned to expand our presence by leveraging our national footprint and differentiated service platform to offer customers a turnkey solution, including design, measurement and installation services. We believe our turnkey offering is a core competitive advantage for us, and intend to pursue growth opportunities in the multifamily segment by offering differentiated service while leveraging our lower-cost product to profitably meet the demand of value-focused builders in this market.
44
Continue to Deepen Relationships within the Home Center Channel
The home centers, Lowe’s and The Home Depot, represent a key distribution channel in the home improvement industry and as such are key customers of both our legacy business and RSI. Our relationships with Lowe’s and The Home Depot date back to the 1980s, and we believe we have established ourselves as a key vendor in the product categories that we serve. With the acquisition of RSI, we are able to continue to provide the home centers differentiated service through our national distribution footprint, logistical expertise and customer service, enhanced by our expanded product offering. Our long-standing relationships with both home centers allows us to hold strategic discussions focused on growing our businesses together. One such strategic opportunity is to offer a value based, reduced lead-time product offering to the rapidly growing, professional (Pro) contractor business. In addition, we will continue to collaborate with our home center partners on new technologies designed to enhance the overall customer experience.
Our Market
Demand for cabinets in the United States totaled $12.7 billion in 2014 and is projected to total $17.3 billion in 2019, representing annual increases of 6.3%. Kitchen cabinet demand is forecasted to rise 6.5% per year through 2019 to $14.4 billion, while bathroom cabinet demand is projected to rise 5.8% per year through 2019 to $1.9 billion. The housing market is still recovering with the continued release of pent-up demand driving future growth. Cabinet sales in the residential market are expected to increase 6.8% annually through 2019 to $14.1 billion, the fastest growth rate of any segment of the U.S. cabinet market, driven by a rebound in new residential construction and continued consumer interest in Repair and Remodel (“R&R”) projects.(1)
The two primary drivers of cabinet and home storage spending are R&R and new residential construction. We believe that approximately 63% of the cabinetry market relates to R&R and approximately 37% relates to new residential construction. The new residential construction market is expected to grow to 1.3 million starts by 2018 and the R&R market is expected to see 5% to 6% annual growth by 2018. We believe that growth in the R&R market is fueled by continued credit availability, improvements in the job market and recovering home prices, which drive consumer confidence and home improvement spending. We also believe that as first time home buyers continue to enter both the new construction and existing home markets, deferred R&R spending will be released.
The cabinetry market consisted of the following product categories for the year ended December 31, 2016: in-stock (9%), stock (28%), stock plus (13%), semi-custom (25%), custom (12%) and bath (13%), based in part on internal estimates.
Cabinet products are generally distributed through three main channels: (1) the home center channel, (2) the dealer channel and (3) the homebuilder channel. The home center channel, which consists of large retailers such as Lowe’s and Home Depot, accounted for approximately 18% of U.S. cabinetry sales in 2016, with the dealer channel and builder channel accounting for approximately 37% and 45%, respectively, during that same period.
Our Products
We offer a wide variety of products that fall into product lines including kitchen cabinetry, bath cabinetry, office cabinetry, home organization and hardware. Our cabinetry products are available in a variety of designs, finishes and finish colors and door styles.
We offer products in the following categories: in-stock, stock and stock plus. In-stock products represent cash and carry products sold through home centers. Stock products utilize higher grade materials with more options as compared to in-stock and are all special ordered and shipped directly to the home from the factory. Stock plus products represent the highest price point of the stock product category and feature more optionality in terms of design and finish. Our home organization products are exclusively in-stock products. Our kitchen cabinetry and bath cabinetry are offered across all three product categories (in-stock, stock and stock plus) and our office cabinetry is offered in both stock and stock plus. Our in-stock products are sold through home centers, while our stock and stock plus products are sold through home centers, builders and independent dealers.
| (1) | All market data contained in this paragraph obtained from the Freedonia Report. |
45
Our Customers
We have three main categories of customers:
| • | home center customers, largely through Home Depot and Lowe’s; |
| • | builders and distributors; and |
| • | independent dealers. |
Our net sales for these categories of customers for fiscal 2017 are as follows:
Home Center Customers
Contractors, builders, remodelers and DIY homeowners use our products primarily for R&R projects. Products for R&R projects are predominately purchased through home centers such as Home Depot and Lowe’s. Due to the market presence, store network and customer reach of these large home centers, our strategy (both American Woodmark and RSI) has been to develop long-term strategic relationships with both Home Depot and Lowe’s to distribute our products. Home Depot and Lowe’s have been American Woodmark customers since 1980 and 1985, respectively, and RSI customers since 1990, and Home Depot has recognized both American Woodmark and RSI as a Partner of the Year on multiple occasions. During the fiscal year ended April 30, 2017 (fiscal 2017), Home Depot and Lowe’s accounted for approximately 34% of American Woodmark’s net sales. For the year ended April 30, 2017, these two customers accounted for approximately 87% of RSI’s sales. On a pro forma basis, during our fiscal 2017, Home Depot and Lowe’s accounted for approximately 53% of the combined company’s sales.
Builders & Distributors
The Builder and Distributor business represents a large portion of our overall revenue and has historically been a strategic component of our go-to-market strategy. We serve the majority of the top US builders with a high degree of geographic concentration around major metro areas where single family starts are most robust. Our various service center locations serve the function of being close to the business and enable us to deliver exceptional service to our builder partners.
Independent Dealers & Other
In 2010, we expanded our business into the dealer channel with the launch of the Waypoint Living Spaces brand. Today we sell this brand to over 1,200 regional and local dealers across the country. The dealer channel of the market is the largest by volume, characterized by a high degree of entrepreneurship and one that rewards suppliers that deliver great service. Our ability to provide superior value delivered with exceptional service has helped drive our expansion into this channel and will continue to be a strong growth and market share opportunity for years to come.
46
Manufacturing, Distribution and Service
Our manufacturing facilities are strategically located to serve our customers, which enhances our ability to provide high quality, value priced products with low production costs. We manufacture our products across 18 facilities located in Maryland, Indiana, West Virginia, Tennessee, Georgia, Arizona, Kentucky, Virginia, California, Texas, North Carolina and Tijuana, Mexico. The geographic distribution of our facilities throughout the United States, together with our third party logistics network for the American Woodmark business and beneficial freight arrangement with home centers for the RSI business, enable us to provide a “short supply chain” to our U.S. customers. The ordering patterns of Home Depot and Lowe’s, our two biggest customers, require suppliers to have sufficient manufacturing capacity to meet demand and to serve a large number (frequently hundreds to thousands) of stores. They impose strict logistics and performance obligations on us. As enhanced with the RSI Acquisition, the scale and strategic locations of our manufacturing facilities help us to meet these demands of the home center customers, as well as providing a logistics platform that we can leverage for builders and dealers. We distribute our products through distribution centers located in our manufacturing facilities to maximize efficiency. Our vertically-integrated production and assembly lines, standardized product construction and investments in automation, have allowed us to continuously improve productivity and develop an expertise in wood processing and yield-maximizing technologies. We have standardized our raw material inputs and a number of our production processes, which reduces logistical requirements to manufacture and gives us increased economies of scale in sourcing these inputs. Certain of our inputs are also partially processed by our vendors, which reduces cost. In addition, RSI’s production of labor-intensive manufacturing and fabrication processes in its three Tijuana, Mexico facilities have enabled it to keep overall labor costs low while maintaining higher quality, greater speed-to-market and transportation cost advantage over Asian manufacturers. We plan to leverage these skills and our manufacturing capabilities to reduce the cost of manufacturing at our facilities in the future. We believe this will allow us to further enhance our cost position and increase our market share.
We provide complete turnkey installation services to our direct builder customers via our network of seven primary service centers that are strategically located throughout the United States in Virginia, Texas, North Carolina, Georgia, Florida, Arizona and California.
We regularly evaluate our organizational productivity and supply chains and assess opportunities to reduce costs and enhance quality. We strive to improve quality, speed and flexibility to meet changing and uncertain market conditions, as well as manage cost inflation, including wages and medical costs. Our success depends in part on refining our cost structure and supply chains to respond flexibly to market pressures, our ability to protect profitability and cash flow, and our ability to meet and grow demand effectively.
We believe our investments in manufacturing and distribution, coupled with our ongoing commitment to operational excellence, provide us with a strong platform for future growth.
Properties
We lease our Corporate Office located in Winchester, Virginia and a Corporate Office located in Anaheim, California. In addition, we lease 9 manufacturing facilities in the United States and Mexico and own 9 manufacturing facilities located primarily in the eastern and southern United States. We also lease 7 primary service centers, 11 satellite service centers, and 6 additional offices located throughout the United States that support the sale and distribution of products to each market channel. We consider our properties suitable for our business and adequate for our needs and believe that, if necessary, we could find additional and/or replacement facilities to lease without suffering a material adverse effect on our business.
47
Primary properties as of January 26, 2018 include:
| LOCATION |
DESCRIPTION | |
| American Woodmark |
||
| Allegany County, MD |
Manufacturing Facility | |
| Austin, TX |
Satellite Service Center* | |
| Berryville, VA |
Service Center* | |
| Bradenton, FL |
Satellite Service Center* | |
| Commerce City, CO |
Satellite Service Center* | |
| Coppell, TX |
Service Center* | |
| Fort Myers, FL |
Satellite Service Center* | |
| Gas City, IN |
Manufacturing Facility | |
| Hardy County, WV |
Manufacturing Facility* | |
| Houston, TX |
Satellite Service Center* | |
| Humboldt, TN |
Manufacturing Facility | |
| Huntersville, NC |
Service Center* | |
| Jackson, GA |
Manufacturing Facility | |
| Kingman, AZ |
Manufacturing Facility | |
| Kennesaw, GA |
Service Center* | |
| Las Vegas, NV |
Satellite Service Center* | |
| Montgomeryville, PA |
Satellite Service Center* | |
| Monticello, KY |
Manufacturing Facility | |
| Orange, VA |
Manufacturing Facility | |
| Orlando, FL |
Service Center* | |
| Phoenix, AZ |
Service Center* | |
| Raleigh, NC |
Satellite Service Center* | |
| Rancho Cordova, CA |
Service Center* | |
| San Antonio, TX |
Satellite Service Center* | |
| Tampa, FL |
Satellite Service Center* | |
| Toccoa, GA |
Manufacturing Facility | |
| Tucson, AZ |
Satellite Service Center* | |
| Winchester, VA |
Corporate Office* | |
| Winchester, VA |
Office (Customer Service)* | |
| Winchester, VA |
Office (IT)* | |
| Winchester, VA |
Office (Product Development/Logistics)* | |
| RSI |
||
| Anaheim, CA |
Corporate Office/Manufacturing Facility* | |
| Lincolnton, NC |
Manufacturing Facility* | |
| Dallas, TX |
Manufacturing Facility* | |
| Dallas, TX |
Manufacturing Facility | |
| Tijuana, Mexico |
Manufacturing Facility* | |
| Mira Loma, CA |
Manufacturing Facility* | |
| Tijuana, Mexico |
Manufacturing Facility* | |
| Tijuana, Mexico |
Manufacturing Facility* | |
| Hamlet, NC |
Manufacturing Facility* | |
| Roswell, GA |
Office (Sales)* | |
| Mooresville, NC |
Office (Sales)* | |
| * | Leased facility. |
48
Raw Materials and Suppliers
The primary raw materials used in our products include hard maple, soft maple, oak, and cherry lumber and plywood. Additional raw materials include paint, particleboard, medium density fiberboard, high density fiberboard, manufactured components and hardware. We purchase these and other raw materials from more than one source and believe them to be readily available. We rely on outside suppliers for some of our key components and do not typically enter into long-term contracts with our suppliers or sourcing partners. We source a portion of our components from third parties in Asia. The distances involved in these arrangements, together with the differences in business practices, shipping and deliver requirements, and laws and regulations add complexity to our supply chain logistics and increase the potential for interruptions in our production scheduling. In addition, prices and availability of these components may be affected by world market conditions and government policies.
Environmental Matters and Regulatory Matters
Our operations are subject to federal, state and local environmental laws and regulations relating to, among other things, the generation, storage, handling, emission, transportation and discharge of regulated materials into the environment. Permits are required for certain of our operations, and these permits are subject to revocation, modification and renewal by issuing authorities. Governmental authorities have the power to enforce compliance with their regulations, and violations may result in the payment of fines or the entry of injunctions, or both. We may also incur liability for investigation and clean-up of soil or groundwater contamination on or emanating from current or formerly owned and operated properties, or at offsite locations at which regulated materials are located where we are identified as a responsible party. Discovery of currently unknown conditions could require responses that could result in significant costs. We monitor changes in these laws and believe that we are in material compliance with applicable laws.
Intellectual Property
We maintain trademarks, copyrights and trade secrets. We sell many of our products under a number of registered and unregistered trademarks, which we believe are widely recognized in our industry. We rely on trade secrets and confidentiality agreements to develop and maintain our competitive position. Monitoring the unauthorized use of our intellectual property is difficult, and the steps we have taken may not prevent unauthorized use of our intellectual property. The disclosure or misappropriation of our intellectual property could harm our ability to protect our rights and our competitive position. If we must litigate to protect our rights, we may incur significant expenses and divert significant attention from our business operations. To date, we have not relied on patents in operating our business.
Competition
We operate in a highly fragmented industry that is composed of several thousand local, regional and national manufacturers. Most of our competitors compete on a local or regional basis, but others, like us, compete on a national basis as well. Our competitors include large consolidated operations as well as relatively small, local cabinetwork manufacturers. Moreover, companies in other building products industries may compete with us. Our major competitors include Fortune Brands Home & Security, Inc. and Masco Corporation. Competitive factors within the industry include pricing, quality, product availability, service, delivery time, and relationships with customers. Our principal means for competition is our breadth and variety of product offerings, expanded service capabilities, geographic reach, competitive price points for our products and affordable quality. We are the second largest manufacturer of kitchen, bath and home organization products in the United States.
Seasonality
Our historic business has been subject to seasonal influences, with higher sales typically realized in our second and fourth fiscal quarters. General economic forces and changes in our customer mix have reduced seasonal fluctuations in revenue over the past few years. RSI’s historic net sales vary from quarter to quarter primarily due to the timing of Home Depot and Lowe’s customer promotions, product roll-outs, and their inventory management. However, RSI historically did not have significant recurring seasonality impacts on its business.
49
Employees
As of December 31, 2017, we employed approximately 10,040 full-time employees, and approximately 236 of the RSI employees in Anaheim, California were unionized. We believe that our employee relations and relationship with the union representing the RSI employees in Anaheim are good.
Legal Proceedings
From time to time, we have become and may in the future become subject to various pending and threatened legal and administrative proceedings and claims arising in the normal course of business. It is not possible to predict the outcome of the pending actions and, as with any litigation, it is possible that some of these actions could be decided unfavorably to us. While any litigation contains an element of uncertainty, we, after consultation with legal counsel, believe that the outcome of such proceedings or claims that are pending or known to be threatened will not have a material adverse effect on our consolidated financial position, liquidity or results of operations.
50
Report of Independent Auditors
To the Board of Directors of RSI Home Products, Inc.
We have audited the accompanying consolidated financial statements of RSI Home Products, Inc. and its subsidiaries, which comprise the consolidated balance sheets as of December 31, 2016 and January 2, 2016, and the related consolidated statements of income, of stockholders’ deficit and redeemable common stock, and of cash flows for the years then ended.
Management’s Responsibility for the Consolidated Financial Statements
Management is responsible for the preparation and fair presentation of the consolidated financial statements in accordance with accounting principles generally accepted in the United States of America; this includes the design, implementation, and maintenance of internal control relevant to the preparation and fair presentation of consolidated financial statements that are free from material misstatement, whether due to fraud or error.
Auditors’ Responsibility
Our responsibility is to express an opinion on the consolidated financial statements based on our audits. We conducted our audits in accordance with auditing standards generally accepted in the United States of America. Those standards require that we plan and perform the audit to obtain reasonable assurance about whether the consolidated financial statements are free from material misstatement.
An audit involves performing procedures to obtain audit evidence about the amounts and disclosures in the consolidated financial statements. The procedures selected depend on our judgment, including the assessment of the risks of material misstatement of the consolidated financial statements, whether due to fraud or error. In making those risk assessments, we consider internal control relevant to the Company’s preparation and fair presentation of the consolidated financial statements in order to design audit procedures that are appropriate in the circumstances, but not for the purpose of expressing an opinion on the effectiveness of the Company’s internal control. Accordingly, we express no such opinion. An audit also includes evaluating the appropriateness of accounting policies used and the reasonableness of significant accounting estimates made by management, as well as evaluating the overall presentation of the consolidated financial statements. We believe that the audit evidence we have obtained is sufficient and appropriate to provide a basis for our audit opinion.
Opinion
In our opinion, the consolidated financial statements referred to above present fairly, in all material respects, the financial position of RSI Home Products, Inc. and its subsidiaries as of December 31, 2016 and January 2, 2016, and the results of their operations and their cash flows for the years then ended in accordance with accounting principles generally accepted in the United States of America.
Emphasis of Matter
As discussed in Note 1 to the consolidated financial statements, the Company changed the manner in which it accounts for debt issuance costs and the manner in which it accounts for deferred income taxes in 2016. Our opinion is not modified with respect to this matter.
/s/ PricewaterhouseCoopers LLP
Irvine, California
March 6, 2017, except for the change in the manner in which the Company accounts for deferred income taxes discussed in Note 1 to the consolidated financial statements, as to which the date is January 28, 2018
51
Board of Directors
RSI Home Products, Inc.
Anaheim, California
Report on the Financial Statements
We have audited the accompanying consolidated financial statements of RSI Home Products, Inc. and its subsidiaries, which comprise the consolidated statements of income, stockholders’ deficit and redeemable common stock, and cash flows for the year ended January 3, 2015, and the related notes to the consolidated financial statements (collectively, the financial statements).
Management’s Responsibility for the Financial Statements
Management is responsible for the preparation and fair presentation of these financial statements in accordance with accounting principles generally accepted in the United States of America; this includes the design, implementation and maintenance of internal control relevant to the preparation and fair presentation of financial statements that are free from material misstatement, whether due to fraud or error.
Auditor’s Responsibility
Our responsibility is to express an opinion on these financial statements based on our audit. We conducted our audit in accordance with auditing standards generally accepted in the United States of America. Those standards require that we plan and perform the audit to obtain reasonable assurance about whether the financial statements are free from material misstatement.
An audit involves performing procedures to obtain audit evidence about the amounts and disclosures in the financial statements. The procedures selected depend on the auditor’s judgment, including the assessment of the risks of material misstatement of the financial statements, whether due to fraud or error. In making those risk assessments, the auditor considers internal control relevant to the entity’s preparation and fair presentation of the financial statements in order to design audit procedures that are appropriate in the circumstances, but not for the purpose of expressing an opinion on the effectiveness of the entity’s internal control. Accordingly, we express no such opinion. An audit also includes evaluating the appropriateness of accounting policies used and the reasonableness of significant accounting estimates made by management, as well as evaluating the overall presentation of the financial statements.
We believe that the audit evidence we have obtained is sufficient and appropriate to provide a basis for our audit opinion.
Opinion
In our opinion, the financial statements referred to above present fairly, in all material respects, the results of the operations and cash flows of RSI Home Products, Inc. and its subsidiaries for the year ended January 3, 2015 in accordance with accounting principles generally accepted in the United States of America.
/s/ RSM US LLP
Irvine, California
February 16, 2015
52
RSI HOME PRODUCTS, INC.
| December 31, 2016 |
January 2, 2016 |
|||||||
| ASSETS |
||||||||
| Current Assets |
||||||||
| Cash and cash equivalents |
$ | 49,293,000 | $ | 47,509,000 | ||||
| Acounts receivable, net of rebates and allowances of $8,856,000 in 2016 and $8,422,000 in 2015 |
61,894,000 | 64,103,000 | ||||||
| Inventories |
61,777,000 | 69,853,000 | ||||||
| Prepaid income taxes |
4,396,000 | — | ||||||
| Prepaid expenses and other current assets |
6,465,000 | 7,275,000 | ||||||
|
|
|
|
|
|||||
| Total current assets |
183,825,000 | 188,740,000 | ||||||
| Property and equipment, net |
61,790,000 | 44,749,000 | ||||||
| Other assets |
3,310,000 | 4,855,000 | ||||||
| Intangible assets, net |
11,746,000 | 13,745,000 | ||||||
| Deferred income taxes |
10,673,000 | 16,167,000 | ||||||
|
|
|
|
|
|||||
| Total assets |
$ | 271,344,000 | $ | 268,256,000 | ||||
|
|
|
|
|
|||||
| LIABILITIES AND STOCKHOLDERS’ DEFICIT |
||||||||
| Current Liabilities |
||||||||
| Accounts payable |
$ | 25,853,000 | $ | 24,378,000 | ||||
| Income taxes payable |
— | 950,000 | ||||||
| Current portion of long-term debt |
365,000 | 455,000 | ||||||
| Other accrued liabilities |
51,459,000 | 66,790,000 | ||||||
|
|
|
|
|
|||||
| Total current liabilities |
77,677,000 | 92,573,000 | ||||||
| Senior secured notes |
566,503,000 | 565,419,000 | ||||||
| Long-term debt, net of current portion |
525,000 | 541,000 | ||||||
| Other non-current liabilities |
6,273,000 | 5,481,000 | ||||||
|
|
|
|
|
|||||
| Total liabilities |
650,978,000 | 664,014,000 | ||||||
|
|
|
|
|
|||||
| Commitments and contingencies (Notes 5, 8 and 9) |
||||||||
| Stockholders’ Deficit |
||||||||
| Common stock — Class A Voting — par value $0.001, authorized: |
||||||||
| 2016 and 2015 — 40,000,000 shares; issued and outstanding: |
||||||||
| 2016 — 19,050,063 shares, 2015 — 16,512,091 shares |
19,000 | 17,000 | ||||||
| Common stock — Class B Voting — par value $0.001, authorized: |
||||||||
| 2016 and 2015 — 25,000,000 shares; issued and outstanding: |
||||||||
| 2016 - none, 2015 — 2,537,972 shares |
— | 3,000 | ||||||
| Common stock — Class C Nonvoting — par value $0.001, authorized: |
||||||||
| 2016 and 2015 — 25,000,000 shares; issued and outstanding: |
||||||||
| 2016 - 251,980 shares, 2015 — 229,920 shares |
— | — | ||||||
| Additional paid-in capital |
67,515,000 | 66,995,000 | ||||||
| Accumulated deficit |
(447,168,000 | ) | (462,773,000 | ) | ||||
|
|
|
|
|
|||||
| Total stockholders’ deficit |
(379,634,000 | ) | (395,758,000 | ) | ||||
|
|
|
|
|
|||||
| Total liabilities and stockholders’ deficit |
$ | 271,344,000 | $ | 268,256,000 | ||||
|
|
|
|
|
|||||
See notes to consolidated financial statements
53
RSI HOME PRODUCTS, INC.
CONSOLIDATED STATEMENTS OF INCOME
| Years Ended | ||||||||||||
| December 31, 2016 |
January 2, 2016 |
January 3, 2015 |
||||||||||
| Net sales |
$ | 598,094,000 | $ | 595,527,000 | $ | 540,033,000 | ||||||
| Cost of sales |
420,160,000 | 418,015,000 | 374,851,000 | |||||||||
|
|
|
|
|
|
|
|||||||
| Gross profit |
177,934,000 | 177,512,000 | 165,182,000 | |||||||||
| Selling, general and administrative (including stock-based compensation expense (benefit) of $(12,608,000), $37,353,000 and $11,403,000 in 2016, 2015 and 2014, respectively) |
41,399,000 | 97,433,000 | 66,317,000 | |||||||||
|
|
|
|
|
|
|
|||||||
| Operating income |
136,535,000 | 80,079,000 | 98,865,000 | |||||||||
| Other expense (income) |
334,000 | (481,000 | ) | 552,000 | ||||||||
| Loss on extinguishment of debt |
— | 35,353,000 | — | |||||||||
| Interest expense, net |
38,641,000 | 39,306,000 | 39,463,000 | |||||||||
|
|
|
|
|
|
|
|||||||
| Income before income taxes |
97,560,000 | 5,901,000 | 58,850,000 | |||||||||
| Provision for income taxes |
31,955,000 | 1,521,000 | 19,737,000 | |||||||||
|
|
|
|
|
|
|
|||||||
| Net income |
$ | 65,605,000 | $ | 4,380,000 | $ | 39,113,000 | ||||||
|
|
|
|
|
|
|
|||||||
See notes to consolidated financial statements
54
RSI HOME PRODUCTS, INC.
CONSOLIDATED STATEMENTS OF STOCKHOLDERS’ DEFICIT AND REDEEMABLE COMMON STOCK
| Common Stock | ||||||||||||||||||||||||
| Class A Voting Shares |
Amount | Class B Voting Shares |
Amount | Class C Non- Voting Shares |
Amount | |||||||||||||||||||
| Balance, December 28, 2013 |
18,764,034 | $ | 19,000 | — | $ | — | — | $ | — | |||||||||||||||
| Issuance of common stock |
42,000 | — | — | — | 66,228 | — | ||||||||||||||||||
| Remeasurement of redeemable Class C common stock |
— | — | — | — | — | — | ||||||||||||||||||
| Reclassification of Class C common stock to permanent equity |
— | — | — | — | 131,000 | — | ||||||||||||||||||
| Net income |
— | — | — | — | — | — | ||||||||||||||||||
|
|
|
|
|
|
|
|
|
|
|
|
|
|||||||||||||
| Balance, January 3, 2015 |
18,806,034 | 19,000 | — | — | 197,228 | — | ||||||||||||||||||
| Dividends |
— | — | — | — | — | — | ||||||||||||||||||
| Conversion of common stock |
(2,293,943 | ) | (2,000 | ) | 2,537,972 | 3,000 | (235,739 | ) | — | |||||||||||||||
| Issuance of common stock |
— | — | — | — | 268,431 | — | ||||||||||||||||||
| Net income |
— | — | — | — | — | — | ||||||||||||||||||
|
|
|
|
|
|
|
|
|
|
|
|
|
|||||||||||||
| Balance, January 2, 2016 |
16,512,091 | 17,000 | 2,537,972 | 3,000 | 229,920 | — | ||||||||||||||||||
| Dividends |
— | — | — | — | — | — | ||||||||||||||||||
| Conversion of common stock |
2,537,972 | 2,000 | (2,537,972 | ) | (3,000 | ) | — | — | ||||||||||||||||
| Issuance of common stock |
— | — | — | — | 22,060 | — | ||||||||||||||||||
| Net income |
— | — | — | — | — | — | ||||||||||||||||||
|
|
|
|
|
|
|
|
|
|
|
|
|
|||||||||||||
| Balance, December 31, 2016 |
19,050,063 | $ | 19,000 | — | $ | — | 251,980 | $ | — | |||||||||||||||
|
|
|
|
|
|
|
|
|
|
|
|
|
|||||||||||||
See notes to consolidated financial statements.
55
RSI HOME PRODUCTS, INC.
CONSOLIDATED STATEMENTS OF STOCKHOLDERS’ DEFICIT AND REDEEMABLE COMMON STOCK
| Common Stock | ||||||||||||||||||||
| Additional Paid-in Capital |
Accumulated Deficit |
Total Stockholders’ Deficit |
Redeemable Class C Nonvoting Shares |
Amount | ||||||||||||||||
| Balance, December 28, 2013 |
49,504,000 | $ | (404,137,000 | ) | $ | (354,614,000 | ) | 56,000 | $ | 645,000 | ||||||||||
| Issuance of common stock |
1,962,000 | — | 1,962,000 | 75,000 | 979,000 | |||||||||||||||
| Remeasurement of redeemable |
||||||||||||||||||||
| Class C common stock |
(297,000 | ) | — | (297,000 | ) | — | 297,000 | |||||||||||||
| Reclassification of Class C common stock to permanent equity |
1,921,000 | — | 1,921,000 | (131,000 | ) | (1,921,000 | ) | |||||||||||||
| Net income |
— | 39,113,000 | 39,113,000 | — | — | |||||||||||||||
|
|
|
|
|
|
|
|
|
|
|
|||||||||||
| Balance, January 3, 2015 |
53,090,000 | (365,024,000 | ) | (311,915,000 | ) | — | — | |||||||||||||
| Dividends |
— | (100,000,000 | ) | (100,000,000 | ) | — | — | |||||||||||||
| Conversion of common stock |
— | — | 1,000 | — | — | |||||||||||||||
| Issuance of common stock |
13,905,000 | (2,129,000 | ) | 11,776,000 | — | — | ||||||||||||||
| Net income |
— | 4,380,000 | 4,380,000 | — | — | |||||||||||||||
|
|
|
|
|
|
|
|
|
|
|
|||||||||||
| Balance, January 2, 2016 |
66,995,000 | (462,773,000 | ) | (395,758,000 | ) | — | — | |||||||||||||
| Dividends |
— | (50,000,000 | ) | (50,000,000 | ) | — | — | |||||||||||||
| Conversion of common stock |
— | — | (1,000 | ) | — | — | ||||||||||||||
| Issuance of common stock |
520,000 | — | 520,000 | — | — | |||||||||||||||
| Net income |
— | 65,605,000 | 65,605,000 | — | — | |||||||||||||||
|
|
|
|
|
|
|
|
|
|
|
|||||||||||
| Balance, December 31, 2016 |
67,515,000 | $ | (447,168,000 | ) | $ | (379,634,000 | ) | — | $ | — | ||||||||||
|
|
|
|
|
|
|
|
|
|
|
|||||||||||
See notes to consolidated financial statements.
56
RSI HOME PRODUCTS, INC.
CONSOLIDATED STATEMENTS OF CASH FLOWS
| Years Ended | ||||||||||||
| December 31, 2016 |
January 2, 2016 |
January 3, 2015 |
||||||||||
| Cash Flows From Operating Activities |
||||||||||||
| Net income |
$ | 65,605,000 | $ | 4,380,000 | $ | 39,113,000 | ||||||
| Adjustments to reconcile net income to net cash provided by operating activities: |
||||||||||||
| Depreciation |
11,818,000 | 10,133,000 | 10,133,000 | |||||||||
| Amortization of slotting fees |
1,333,000 | 1,420,000 | 482,000 | |||||||||
| Amortization of intangible assets |
1,999,000 | 2,101,000 | 2,406,000 | |||||||||
| Amortization of debt issuance costs |
1,284,000 | 1,486,000 | 2,371,000 | |||||||||
| Write-off of prior debt issuance costs |
— | 325,000 | — | |||||||||
| Loss on extinguishment of debt |
— | 35,353,000 | — | |||||||||
| Stock-based compensation |
(12,608,000 | ) | 37,353,000 | 11,403,000 | ||||||||
| Change in fair value of foreign currency hedge |
334,000 | (481,000 | ) | 552,000 | ||||||||
| Loss (gain) on disposal of property and equipment |
53,000 | 62,000 | (57,000 | ) | ||||||||
| Deferred taxes |
5,493,000 | (3,430,000 | ) | (4,761,000 | ) | |||||||
| Change in operating assets and liabilities: |
||||||||||||
| Accounts receivable |
2,209,000 | (6,832,000 | ) | (11,295,000 | ) | |||||||
| Inventories |
8,076,000 | (9,371,000 | ) | (189,000 | ) | |||||||
| Prepaid income taxes |
(4,396,000 | ) | — | — | ||||||||
| Prepaid expenses and other current assets |
645,000 | 2,556,000 | (4,715,000 | ) | ||||||||
| Other assets |
(1,338,000 | ) | (3,966,000 | ) | (211,000 | ) | ||||||
| Income taxes payable |
(950,000 | ) | (1,187,000 | ) | 4,037,000 | |||||||
| Accounts payable |
1,474,000 | 10,097,000 | 2,414,000 | |||||||||
| Other accrued liabilities |
(671,000 | ) | (12,128,000 | ) | 2,077,000 | |||||||
|
|
|
|
|
|
|
|||||||
| Net cash provided by operating activities |
80,360,000 | 67,871,000 | 53,760,000 | |||||||||
|
|
|
|
|
|
|
|||||||
| Cash Flows From Investing Activities |
||||||||||||
| Capital expenditures — property and equipment |
(28,339,000 | ) | (19,756,000 | ) | (11,873,000 | ) | ||||||
| Proceeds from sale of property and equipment |
12,000 | 595,000 | 1,205,000 | |||||||||
|
|
|
|
|
|
|
|||||||
| Net cash used in investing activities |
(28,327,000 | ) | (19,161,000 | ) | (10,668,000 | ) | ||||||
|
|
|
|
|
|
|
|||||||
| Cash Flows From Financing Activities |
||||||||||||
| Proceeds from senior secured notes |
— | 575,000,000 | — | |||||||||
| Repayment of senior secured notes |
— | (525,000,000 | ) | — | ||||||||
| Payment of tender offer premium and call premium on senior secured notes |
— | (28,299,000 | ) | — | ||||||||
| Payments on unsecured notes payable |
(521,000 | ) | (709,000 | ) | (1,178,000 | ) | ||||||
| Payments on bank term loan and financing |
— | — | (182,000 | ) | ||||||||
| Debt issuance costs |
— | (10,975,000 | ) | — | ||||||||
| Dividends |
(50,000,000 | ) | (100,000,000 | ) | — | |||||||
| Issuance of common stock |
272,000 | 600,000 | 2,372,000 | |||||||||
|
|
|
|
|
|
|
|||||||
| Net cash (used in) provided by financing activities |
(50,249,000 | ) | (89,383,000 | ) | 1,012,000 | |||||||
|
|
|
|
|
|
|
|||||||
| Net increase (decrease) in cash |
1,784,000 | (40,673,000 | ) | 44,104,000 | ||||||||
|
|
|
|
|
|
|
|||||||
| Cash and cash equivalents |
||||||||||||
| Beginning |
47,509,000 | 88,182,000 | 44,078,000 | |||||||||
|
|
|
|
|
|
|
|||||||
| Ending |
$ | 49,293,000 | $ | 47,509,000 | $ | 88,182,000 | ||||||
|
|
|
|
|
|
|
|||||||
| Supplemental Disclosures of Cash Flow Information |
||||||||||||
| Cash payments for: |
||||||||||||
| Interest |
$ | 37,765,000 | $ | 38,596,000 | $ | 36,529,000 | ||||||
|
|
|
|
|
|
|
|||||||
| Income taxes, net of refunds |
$ | 32,146,000 | $ | 7,027,000 | $ | 19,966,000 | ||||||
|
|
|
|
|
|
|
|||||||
| Supplemental Schedule of Noncash Investing and Financing Activities |
||||||||||||
| Equipment acquired under financing agreement |
$ | 262,000 | $ | — | $ | 51,000 | ||||||
|
|
|
|
|
|
|
|||||||
| Notes payable issued on options exercised and canceled |
$ | 153,000 | $ | 359,000 | $ | 222,000 | ||||||
|
|
|
|
|
|
|
|||||||
| Net change to property and equipment through accrued expense |
$ | 323,000 | $ | 1,216,000 | $ | — | ||||||
|
|
|
|
|
|
|
|||||||
See notes to consolidated financial statements.
57
RSI HOME PRODUCTS, INC.
NOTES TO CONSOLIDATED FINANCIAL STATEMENTS
NOTE 1 NATURE OF ORGANIZATION AND SUMMARY OF SIGNIFICANT ACCOUNTING POLICIES
Nature of organization
RSI Home Products, Inc. (“RSI”) was founded in 1989. RSI and its subsidiaries are collectively referred to herein as the “Company”. RSI, through its wholly owned subsidiaries, is engaged primarily in the manufacture and distribution of stock and made-to-order bath and kitchen cabinets and cultured marble tops to national home centers, home builders, dealers and distributors throughout the United States and Canada.
Fiscal year
The Company operates on a 52 to 53 week fiscal year, with its year ending on the Saturday closest to December 31. The years ended December 31, 2016 and January 2, 2016 each contained 52 weeks. The year ended January 3, 2015 contained 53 weeks.
Basis of presentation and consolidation
The accompanying consolidated financial statements have been prepared in accordance with accounting principles generally accepted in the United States of America (“GAAP”). The consolidated financial statements include the accounts of RSI and its wholly owned subsidiaries. All intercompany accounts and transactions have been eliminated in consolidation.
Use of estimates
The preparation of consolidated financial statements in conformity with GAAP requires management to make estimates and assumptions that affect the amounts reported in the consolidated financial statements and notes thereto. Actual results could differ from those estimates.
Revenue recognition
For sales to home centers, dealers and distributors, the Company records revenue when persuasive evidence of an arrangement exists, delivery has occurred, the price is fixed or determinable and collectability is reasonably assured. The Company recognizes revenue for home center customers when delivery has occurred and title and risk of loss has transferred. The Company performs the installation for its home builder customers and records revenue when the cabinets are installed. Revenue is recorded net of applicable provisions for discounts, sales incentives, returns, allowances and taxes. The Company provides certain sales incentives to its customers for co-op advertising, volume rebates, program slotting fees and discounted sales terms. The Company records these sales incentives as a reduction of revenue during the same period in which it records the related sales, and presents sales net of these allowances in the consolidated statements of income.
Debt issuance cost
Deferred debt issuance costs are amortized to interest expense over the life of the related indebtedness using the effective interest method. The net carrying value of unamortized debt issuance costs associated with the senior secured notes are recorded as a reduction to the corresponding indebtedness.
Cost of sales
Cost of sales includes all input costs associated with the manufacture and distribution of the Company’s products including inbound freight costs and outbound shipping and handling costs, if applicable. In addition, the Company includes all depreciation and amortization associated with assets used to manufacture its products and make them saleable.
Cash and cash equivalents
Cash and cash equivalents include highly liquid investments with original maturities of three months or less when purchased.
58
RSI HOME PRODUCTS, INC.
NOTES TO CONSOLIDATED FINANCIAL STATEMENTS — (Continued)
Foreign currency
The financial statements of the Company’s foreign subsidiaries are measured using the U.S. dollar as the functional currency. For subsidiaries with transactions that are denominated in a currency other than the functional currency, the remeasurement of assets and liabilities to the functional currency is included in determining net income. Remeasurement gains recorded to net income were $138,000 and $551,000 for the years ended December 31, 2016 and January 2, 2016, respectively. Remeasurement losses recorded to net income were insignificant for the year ended January 3, 2015.
Accounts receivable
Accounts receivable are carried at original invoice amount less estimates made for allowances, including doubtful receivables. Taking into consideration all relevant factors including actual sales activity for qualifying products, the Company also estimates and records allowances related to discounts and rebates granted to certain customers based on specific arrangements. Management determines the allowance for doubtful accounts by identifying troubled accounts and using historical experience applied to an aging of accounts. Accounts receivable are written off when deemed uncollectible. Recoveries of accounts receivable previously written off are recorded when received.
Concentration of risks
Financial instruments that potentially subject the Company to concentrations of risk consist primarily of cash and cash equivalents, accounts receivable and foreign exchange forward contracts. The Company maintains its cash and cash equivalents with major financial institutions and such balances may, at times, exceed Federal Deposit Insurance Corporation insurance limits. The Company has not experienced any losses in such accounts and believes it is not exposed to any significant risk on cash.
The Company does not require collateral to secure its accounts receivable. Two customers accounted for approximately 84% and 85% of outstanding accounts receivable as of December 31, 2016 and January 2, 2016, respectively, and 86%, 87% and 86% of net sales for the years ended December 31, 2016, January 2, 2016 and January 3, 2015, respectively.
Counterparties to the Company’s foreign exchange forward contracts are major financial institutions. The Company is potentially exposed to credit loss in the event of nonperformance by these counterparties. The Company does not use derivative instruments for trading or speculative purposes.
Inventories
Inventories consist primarily of raw materials and finished goods, which are stated at the lower of cost or market. The Company uses standard cost to value inventory which approximates actual cost on a first-in, first out basis. The Company evaluates its inventory and, if necessary, records an adjustment for all slow-moving or obsolete inventory items.
Property and equipment and intangible assets, subject to amortization
Property and equipment is stated at cost less accumulated depreciation. Provision for depreciation is calculated using the straight-line method based upon the estimated useful lives of depreciable assets. Depreciation is discontinued when a property is identified as held-for-sale. Leasehold improvements are being amortized over the remaining lease term or estimated useful life of the asset, whichever is shorter. Displays
59
RSI HOME PRODUCTS, INC.
NOTES TO CONSOLIDATED FINANCIAL STATEMENTS — (Continued)
represent costs incurred to promote the sale of the Company’s products. The cost of maintenance and repair is charged to expense as incurred. The estimated useful lives of the property and equipment are as follows:
| Years | ||||
| Buildings |
18-20 | |||
| Machinery and equipment |
5-7 | |||
| Data processing equipment and software |
3-5 | |||
| Forklifts and vehicles |
5-7 | |||
| Office furniture and equipment |
7 | |||
| Displays |
2-5 | |||
Changes in circumstances, such as dramatic loss of market share or loss of a major customer, could result in the actual useful lives differing from initial estimates. In those cases where the Company determines that the useful life of a long-lived asset should be revised, the Company will amortize or depreciate the net book value over its revised remaining useful life.
Intangible assets include customer relationships, trademarks/trade names and a favorable lease. These assets are being amortized on a straight-line basis over their estimated useful lives, as follows:
| Years | ||||
| Customer relationships |
13 | |||
| Trademark/Trade name |
13 | |||
| Favorable lease |
7 | |||
The Company reviews long-lived assets for impairment when events or changes in circumstances indicate that their related carrying amounts may not be recoverable. Long-lived assets evaluated for impairment are grouped with other assets to the lowest level for which identifiable cash flows are largely independent of the cash flows of other groups of assets and liabilities. If the sum of the projected undiscounted cash flows (excluding interest charges) is less than the carrying value of the assets, the assets will be written down to the estimated fair value and such loss is recognized in the period in which the determination is made.
Advertising expense
Advertising expense primarily consists of trade show costs and point-of-purchase merchandising brochures and materials. The Company includes these costs in selling, general and administrative expenses as incurred. Advertising expenses for the years ended December 31, 2016, January 2, 2016 and January 3, 2015 were $2,109,000, $1,414,000 and $1,053,000, respectively.
Customer program costs
The Company incurs various costs associated with new product programs awarded by its customers, including costs to obtain favorable product placement (“slotting fees”) and to promote the sale of its products (“displays”).
The Company capitalizes slotting fees, provided the payments are supported by a time based arrangement with the retailer, and amortizes the associated payments over the appropriate term of the arrangement not to exceed 36 months. During the years ended December 31, 2016, January 2, 2016 and January 3, 2015, the Company incurred costs for slotting fees of $222,000, $4,000,000 and $30,000, respectively. The amortization of slotting fees is treated as a reduction of net sales. The total amortization of slotting fees for the years ended December 31, 2016, January 2, 2016 and January 3, 2015 was $1,333,000, $1,420,000 and $482,000, respectively. The unamortized costs of $1,556,000 and $2,889,000 as of December 31, 2016 and January 2, 2016, respectively, are reported in other assets in the consolidated balance sheets.
60
RSI HOME PRODUCTS, INC.
NOTES TO CONSOLIDATED FINANCIAL STATEMENTS — (Continued)
During the years ended December 31, 2016, January 2, 2016 and January 3, 2015, the Company incurred costs for displays of $7,732,000, $4,330,000 and $1,115,000, respectively. The unamortized costs of displays of $9,785,000 and $4,171,000 as of December 31, 2016 and January 2, 2016, respectively, are reported in property and equipment in the consolidated balance sheets. The depreciation of displays is included in selling, general and administrative expenses. The total depreciation of displays for the years ended December 31, 2016, January 2, 2016 and January 3, 2015 was $2,118,000, $1,398,000 and $1,235,000, respectively.
Income taxes
Deferred taxes are provided on a liability method whereby deferred tax assets are recognized for deductible temporary differences and operating loss and tax credit carryforwards. Deferred tax liabilities are recognized for taxable temporary differences. Temporary differences are the differences between the reported amounts of assets and liabilities and their tax bases. Deferred tax assets are reduced by a valuation allowance when, in the opinion of management, it is more likely than not that some portion or all of the deferred tax assets will not be realized. Deferred tax assets and liabilities are adjusted for the effects of changes in tax laws and rates on the date of enactment.
The Company recognizes tax liabilities when, despite the Company’s belief that its tax return positions are supportable, the Company believes that certain positions may not be fully sustained upon review by tax authorities. Benefits from tax positions are measured at the largest amount of benefit that is greater than fifty percent likely of being realized upon settlement. To the extent that the final tax outcome of these matters is different than the amounts recorded, such differences will impact income tax expense in the period in which such determination is made.
The Company recognizes interest and penalties related to unrecognized tax benefits within the provision for income taxes line in the consolidated statements of income. Accrued interest and penalties are included with the related tax liability in other non-current liabilities in the consolidated balance sheets.
Stock-based compensation
The Company uses the intrinsic value method in measuring stock-based liability awards. Intrinsic value is the amount by which the fair value of the underlying stock exceeds the exercise price of the option. Currently, there is no active market for the Company’s common shares and fair value is determined by the Company with the assistance of external valuation experts. Stock-based compensation is amortized over the vesting period of the award. Since the Company has a past practice of settling its vested stock options predominantly in cash and unsecured promissory notes, the Company accounts for its option plan using liability accounting. The related liability is adjusted to represent the intrinsic value of vested awards at each balance sheet date. Changes in the fair value of the Company’s stock from one measurement date to the next will affect the carrying value of the previously reported liability. Since the Company utilizes the intrinsic value method and grants options with an exercise price at or above fair value at the time of issuance, there is no intrinsic value on the grant date.
Although the Company has a practice of settling stock options predominantly in cash and unsecured promissory notes, the current stock option plan does not require the Company to do so. In situations where the Company elects to settle options, the settlement amounts have been calculated using a non-contractual formulaic approach. Settlements and the calculated formulaic value are mutually agreed upon between the option holder and the Company. The calculated formulaic value has historically been lower than the intrinsic value of the settled awards. If all the fully vested stock options as of December 31, 2016 were settled in cash and unsecured promissory notes, the total payment before any tax benefit would be $19,222,000.
Fair value of financial instruments
Fair value is defined as the exchange price that would be received for an asset or paid to transfer a liability (an exit price) in the principal or most advantageous market for the asset or liability in an orderly transaction
61
RSI HOME PRODUCTS, INC.
NOTES TO CONSOLIDATED FINANCIAL STATEMENTS — (Continued)
between market participants at the measurement date. Assets and liabilities that are measured at fair value are reported using a three-level fair value hierarchy that prioritizes the inputs used to measure fair value. This hierarchy maximizes the use of observable inputs and minimizes the use of unobservable inputs.
The three levels of inputs used to measure fair value are as follows:
| • | Level 1: Inputs to the valuation are unadjusted quoted prices in active markets for identical assets or liabilities. |
| • | Level 2: Inputs to the valuation may include quoted prices for similar assets and liabilities in active or inactive markets, and inputs other than quoted prices, such as interest rates and yield curves, that are observable for the asset or liability for substantially the full term of the financial instrument. |
| • | Level 3: Inputs to the valuation are unobservable and significant to the fair value measurement. Level 3 inputs shall be used to measure fair value only to the extent that observable inputs are not available. |
The estimated fair values of the Company’s short-term financial instruments, including cash and cash equivalents, accounts receivable and accounts payable arising in the ordinary course of business, approximate their individual carrying amounts due to the relatively short period of time between their origination and expected realization. The foreign exchange forward contracts were marked to market and therefore represented fair value. The fair values of these contracts are determined based on inputs that are readily available in public markets or can be derived from information available in publicly quoted markets. This valuation methodology is considered level 2 in the fair value hierarchy. For liabilities such as long-term debt not accounted for at fair value and without quoted market prices, fair value was based upon borrowing rates available to the Company for bank loans with the same remaining maturities and similar terms and collateral requirements. As such, the fair value of long-term debt approximated its carrying value.
The fair value of the Company’s senior secured notes is estimated based upon the quoted market prices for the same issue if available, or similar issues. This valuation methodology is considered level 2 in the fair value hierarchy. The carrying amount and estimated fair value of the senior secured notes as of December 31, 2016 was $575,000,000 and $603,750,000, respectively. The carrying amount and estimated fair value of the senior secured notes as of January 2, 2016 was $575,000,000 and $593,688,000, respectively.
The following table sets forth the fair value of the Company’s assets and liabilities measured at fair value on a recurring basis as of December 31, 2016 and January 2, 2016 based on the three-tier fair value hierarchy:
| Level 1 | Level 2 | Level 3 | Total | |||||||||||||
| December 31, 2016 |
||||||||||||||||
| Foreign exchange forward contracts |
$ | — | $ | 404,000 | $ | — | $ | 404,000 | ||||||||
|
|
|
|
|
|
|
|
|
|||||||||
| January 2, 2016 |
||||||||||||||||
| Foreign exchange forward contracts |
$ | — | $ | 71,000 | $ | — | $ | 71,000 | ||||||||
|
|
|
|
|
|
|
|
|
|||||||||
Derivatives and hedging
Forward contracts
In the normal course of business the Company is subject to risk from adverse fluctuations in foreign exchange rates. The Company manages these risks through the use of derivative financial instruments, primarily foreign exchange forward contracts.
The Company recognizes its outstanding derivative financial instruments in the consolidated balance sheets at their fair values. The Company does not designate these instruments as accounting hedges. The changes in
62
RSI HOME PRODUCTS, INC.
NOTES TO CONSOLIDATED FINANCIAL STATEMENTS — (Continued)
the fair value of these instruments are recorded in other expense (income) in the consolidated statements of income.
At December 31, 2016, the Company held contracts maturing from January 2017 to June 2017 to purchase 197.0 million Mexican pesos at exchange rates ranging from 20.6 to 21.2 Mexican pesos to the U.S. dollar. At January 2, 2016, the Company held contracts maturing from January 2016 to March 2016 to purchase 102.0 million Mexican pesos at exchange rates ranging from 17.2 to 17.3 Mexican pesos to the U.S. dollar. The Company recorded the fair value of these contracts of $404,000 and $71,000 at December 31, 2016 and January 2, 2016, respectively, in other accrued liabilities in the consolidated balance sheets.
Recently issued accounting pronouncements
New accounting pronouncements adopted
On August 27, 2014, the Financial Accounting Standards Board (“FASB”) issued Accounting Standards Update No. 2014-15, “Disclosure of Uncertainties about an Entity’s Ability to Continue as a Going Concern”, which requires management to assess a company’s ability to continue as a going concern and to provide related footnote disclosures in certain circumstances. Before this new standard, there was minimal guidance in U.S. GAAP specific to going concern. Under the new standard, disclosures are required when conditions give rise to substantial doubt about a company’s ability to continue as a going concern within one year from the financial statement issuance date. The new standard applies to all companies and is effective for the annual period ending after December 15, 2016, and all annual and interim periods thereafter. Accordingly, the Company adopted this new standard in 2016.
In April 2015, the FASB issued Accounting Standards Update ASU No. 2015-03, “Interest — Imputation of Interest (Subtopic 835-30) — Simplifying the Presentation of Debt Issuance Costs” (“ASU 2015-03”). In June 2015, the FASB issued ASU No. 2015-15, “Interest — Imputation of Interest (Subtopic 835-30) — Presentation and Subsequent Measurement of Debt Issuance Costs Associated with Line-of-Credit Arrangements — Amendments to SEC Paragraphs Pursuant to Staff Announcement at June 18, 2015 EITF Meeting” (“ASU 2015-15”). ASU 2015-03 and ASU 2015-15 require that debt issuance costs related to a recognized debt liability be presented in the balance sheet as a direct deduction from the carrying amount of the related debt liability. During the year ended December 31, 2016, the Company retrospectively adopted these new standards, resulting in a reclassification of $9,581,000 of debt issuance costs as of January 2, 2016.
In November 2015, the FASB issued ASU No. 2015-17, “Balance Sheet Classification of Deferred Taxes (Topic 740)” (“ASU 2015-17”), which requires that deferred tax assets and liabilities be presented as non-current in the balance sheet. ASU 2015-17 is effective for annual reporting periods beginning after December 15, 2016 (and interim periods within those fiscal years) with early adoption permitted. The Company adopted ASU 2015-17 at the beginning of fiscal 2017 on a retrospective basis. Accordingly, we reclassified $12,902,000 and $18,157,000 from current assets to non-current assets as of December 31, 2016 and January 2, 2016, respectively and $2,229,000 and $1,990,000 from non-current liabilities to non-current assets as of December 31, 2016 and January 2, 2016, respectively.
In March 2016, the FASB issued ASU No. 2016-09, “Compensation-Stock Compensation (Topic 718): Improvements to Employee Share-Based Payment Accounting” (“ASU 2016-09”), which provides for improvements to employee share-based payment accounting. ASU 2016-09 simplifies several aspects of the accounting for employee share-based payment transactions, including the accounting for income taxes, forfeitures, and statutory tax withholding requirements, as well as classification in the statement of cash flows. ASU 2016-09 is effective for annual reporting periods beginning after December 15, 2016 (and interim periods within those fiscal years). Early adoption is permitted. The Company adopted ASU 2016-09 at the beginning of fiscal 2017. The adoption did not have a material impact on the consolidated financial statements.
63
RSI HOME PRODUCTS, INC.
NOTES TO CONSOLIDATED FINANCIAL STATEMENTS — (Continued)
New accounting pronouncements not yet adopted
In May 2014, the FASB issued ASU No. 2014-09, “Revenue From Contracts with Customers (Topic 606)” (“ASU 2014-09”), which requires that a company recognizes revenue when it transfers promised goods or services to customers in an amount that reflects the consideration to which the company expects to be entitled in exchange for those goods or services. ASU 2014-09 was originally effective for annual reporting periods (including interim reporting periods within those periods) beginning after December 15, 2016. In August 2015, the FASB issued ASU No. 2015-14, “Revenue from Contracts with Customers (Topic 606): Deferral of Effective Date”, which defers the effective date of ASU 2014-09 by one year. ASU 2014-09 is now effective for annual reporting periods (including interim reporting periods within those periods) beginning after December 15, 2017. In 2016, the SEC provided specific guidance for public business entities that otherwise would not meet the definition of a public business entity except for inclusion of its financial statements in another entity’s filing with the Commission. Such public business entities may apply ASU No. 2014-09 for annual reporting periods beginning after December 15, 2018, and interim reporting periods within annual reporting periods beginning after December 15, 2019. Therefore, the Company does not plan on adopting ASU 2014-09 until fiscal 2019. The Company has not yet completed an assessment of the impact of this standard on the consolidated financial statements.
In July 2015, the FASB issued ASU No. 2015-11, “Inventory (Topic 330): Simplifying the Measurement of Inventory” (“ASU 2015-11”). Upon adoption by an entity, ASU 2015-11 will simplify the subsequent measurement of inventory by replacing the current lower of cost or market test with a lower of cost or net realizable value test. The new guidance applies only to inventories for which cost is determined by methods other than last-in-first-out (LIFO) and the retail inventory method. For inventory within the scope of ASU 2015-11, entities will be required to compare the cost of inventory to only one measure, its net realizable value, and not the three measures required by current guidance (“market,” “subject to a floor,” and a “ceiling”). When evidence exists that the net realizable value of inventory is less than its cost (due to damage, physical deterioration, obsolescence, changes in price levels or other causes), entities will recognize the difference as a loss in earnings in the period in which it occurs. ASU 2015-11 is effective for public entities for fiscal years beginning after December 15, 2016, and interim periods within the year of adoption. Early adoption is permitted. The Company adopted ASU 2015-11 prospectively at the beginning of fiscal 2017. The adoption did not have a material impact on the consolidated financial statements.
In February 2016, the FASB issued ASU No. 2016-02, “Leases (Topic 842)” (“ASU 2016-02”), which supersedes the lease requirements in Accounting Standards Codification Topic 840, Leases. ASU 2016-02 requires lessees to recognize assets and liabilities on the balance sheet for most leases and provide enhanced disclosures. Leases will continue to be classified as either finance or operating. ASU 2016-02 is effective for annual reporting periods beginning after December 15, 2018 (and interim periods within those fiscal years). In 2016, the SEC provided specific guidance for public business entities that otherwise would not meet the definition of a public business entity except for inclusion of its financial statements in another entity’s filing with the Commission. Such public business entities may apply ASU No. 2016-02 for annual reporting periods beginning after December 15, 2019, and interim reporting periods within annual reporting periods beginning after December 15, 2019. Therefore, the Company does not plan on adopting ASU 2016-02 until fiscal 2020. The new standard must be adopted using a modified retrospective transition, requiring application at the beginning of the earliest comparative period presented. The Company has not yet completed an assessment of the impact of this standard on the consolidated financial statements.
64
RSI HOME PRODUCTS, INC.
NOTES TO CONSOLIDATED FINANCIAL STATEMENTS — (Continued)
NOTE 2 INVENTORIES
Inventories consisted of the following as of:
| December 31, 2016 |
January 2, 2016 |
|||||||
| Raw materials |
$ | 46,352,000 | $ | 50,777,000 | ||||
| Finished goods |
15,425,000 | 19,076,000 | ||||||
|
|
|
|
|
|||||
| $ | 61,777,000 | $ | 69,853,000 | |||||
|
|
|
|
|
|||||
NOTE 3 PROPERTY AND EQUIPMENT, NET
Property and equipment consisted of the following as of:
| December 31, 2016 |
January 2, 2016 |
|||||||
| Buildings |
$ | 2,840,000 | $ | 2,678,000 | ||||
| Land |
940,000 | 940,000 | ||||||
| Machinery and equipment |
129,489,000 | 113,554,000 | ||||||
| Data processing equipment and software |
20,396,000 | 18,654,000 | ||||||
| Displays |
12,937,000 | 7,830,000 | ||||||
| Forklifts and vehicles |
11,767,000 | 10,921,000 | ||||||
| Office furniture and equipment |
3,035,000 | 2,612,000 | ||||||
| Leasehold improvements |
6,790,000 | 6,130,000 | ||||||
|
|
|
|
|
|||||
| 188,194,000 | 163,319,000 | |||||||
| Less accumulated depreciation and amortizati |
126,404,000 | 118,570,000 | ||||||
|
|
|
|
|
|||||
| Net |
61,790,000 | $ | 44,749,000 | |||||
|
|
|
|
|
|||||
Depreciation expense for the years ended December 31, 2016, January 2, 2016 and January 3, 2015 was $11,818,000, $10,133,000 and $10,133,000, respectively.
NOTE 4 INTANGIBLE ASSETS, NET
Intangible assets consisted of the following as of:
| December 31, 2016 | ||||||||||||
| Gross Carrying Value |
Accumulated Amortization |
Net Carrying Value |
||||||||||
| Customer relationships |
$ | 20,785,000 | $ | 10,792,000 | $ | 9,993,000 | ||||||
| Trademark/Trade name |
3,581,000 | 1,859,000 | 1,722,000 | |||||||||
| Favorable lease |
873,000 | 842,000 | 31,000 | |||||||||
|
|
|
|
|
|
|
|||||||
| $ | 25,239,000 | $ | 13,493,000 | $ | 11,746,000 | |||||||
|
|
|
|
|
|
|
|||||||
65
RSI HOME PRODUCTS, INC.
NOTES TO CONSOLIDATED FINANCIAL STATEMENTS — (Continued)
| January 2, 2016 | ||||||||||||
| Gross Carrying Value |
Accumulated Amortization |
Net Carrying Value |
||||||||||
| Customer relationships |
$ | 20,785,000 | $ | 9,193,000 | $ | 11,592,000 | ||||||
| Trademark/Trade name |
3,581,000 | 1,584,000 | 1,997,000 | |||||||||
| Favorable lease |
873,000 | 717,000 | 156,000 | |||||||||
|
|
|
|
|
|
|
|||||||
| $ | 25,239,000 | $ | 11,494,000 | $ | 13,745,000 | |||||||
|
|
|
|
|
|
|
|||||||
The remaining weighted-average life of amortizing intangibles as of December 31, 2016 was 6 years.
Amortization expense for the years ended December 31, 2016, January 2, 2016 and January 3, 2015 related to intangible assets was $1,999,000, $2,101,000 and $2,406,000, respectively.
Estimated amortization related to the remaining intangible assets at December 31, 2016 is as follows:
| Fiscal Years Ending |
Amount | |||
| 2017 |
$ | 1,905,000 | ||
| 2018 |
1,874,000 | |||
| 2019 |
1,874,000 | |||
| 2020 |
1,874,000 | |||
| 2021 |
1,874,000 | |||
| Thereafter |
2,345,000 | |||
|
|
|
|||
| $ | 11,746,000 | |||
|
|
|
|||
NOTE 5 OTHER ACCRUED LIABILITIES
Other accrued liabilities consisted of the following as of:
| December 31, 2016 |
January 2, 2016 |
|||||||
| Stock-based liability awards |
$ | 19,907,000 | $ | 33,082,000 | ||||
| Accrued compensation |
9,667,000 | 11,584,000 | ||||||
| Accrued interest |
10,993,000 | 11,365,000 | ||||||
| Other accrued expenses |
10,892,000 | 10,759,000 | ||||||
|
|
|
|
|
|||||
| $ | 51,459,000 | $ | 66,790,000 | |||||
|
|
|
|
|
|||||
Accrued compensation consists of earned but unpaid payroll, incentive compensation and vacation.
Other accrued expenses consist primarily of amounts accrued for self-insurance for workers’ compensation and medical insurance, capital expenditures and consulting agreements.
The Company is partially self-insured related to workers’ compensation claims up to $500,000 per claim for its employees in the United States. As of December 31, 2016 and January 2, 2016, approximately $2,231,000 and $2,600,000, respectively, has been provided for reported but unresolved workers’ compensation claims, and the reserve is included in the consolidated balance sheets. Total expense for workers’ compensation, including insurance premiums, net of refunds received, was approximately $1,678,000, $2,180,000 and $1,214,000 for the years ended December 31, 2016, January 2, 2016 and January 3, 2015, respectively.
The Company is self-insured for up to $250,000 per claim under its medical benefit programs in the United States. This amount increased from $200,000 effective January 1, 2016. Total expense under the program for the years ended December 31, 2016, January 2, 2016 and January 3, 2015 was $5,924,000, $6,918,000 and
66
RSI HOME PRODUCTS, INC.
NOTES TO CONSOLIDATED FINANCIAL STATEMENTS — (Continued)
$4,749,000, respectively. The Company provides for a reserve for actual unpaid claims and an estimate of claims incurred but not reported. At December 31, 2016 and January 2, 2016, $632,000 and $732,000, respectively, had been provided for future costs and is included in the consolidated balance sheets.
NOTE 6 LINES OF CREDIT AND LONG-TERM DEBT
Long-term debt consisted of the following as of:
| December 31, 2016 |
January 2, 2016 |
|||||||
| $575 million senior secured notes |
$ | 575,000,000 | $ | 575,000,000 | ||||
| Unsecured notes payable(a) |
670,000 | 996,000 | ||||||
| Other |
220,000 | — | ||||||
| Less unamortized debt issuance costs |
(8,497,000 | ) | (9,581,000 | ) | ||||
|
|
|
|
|
|||||
| 567,393,000 | 566,415,000 | |||||||
| Less current portion |
365,000 | 455,000 | ||||||
|
|
|
|
|
|||||
| Net |
$ | 567,028,000 | $ | 565,960,000 | ||||
|
|
|
|
|
|||||
| (a) | Notes due to former and current employees for the cancellation and subsequent settlement of vested stock options. The five year notes bear interest at rates ranging from 1.01% to 1.97% per annum and are due in annual installments of principal and interest on their respective anniversary dates, with final payments of all notes due through June 30, 2021. All are unsecured and subordinated to the credit facilities. |
As of December 31, 2016, aggregate maturities of long-term debt, excluding unamortized debt issuance costs, were as follows:
| Fiscal Years Ending |
Amount | |||
| 2017 |
$ | 365,000 | ||
| 2018 |
192,000 | |||
| 2019 |
171,000 | |||
| 2020 |
104,000 | |||
| 2021 |
52,000 | |||
| Thereafter |
575,006,000 | |||
|
|
|
|||
| $ | 575,890,000 | |||
|
|
|
|||
$575 Million Senior Secured Notes
On March 16, 2015, the Company issued $575,000,000 of senior secured second lien notes due 2023 (the “2023 Notes”) with major financial institutions as initial purchasers (1) to repay the existing senior secured second lien notes due in 2018 (the “2018 Notes”), including accrued and unpaid interest, a tender offer premium and a call premium, and (2) for general corporate purposes. The 2023 Notes bear interest at 6.5% per annum and mature on March 15, 2023. Interest on the 2023 Notes is payable semi-annually, in cash in arrears, on March 15 and September 15 of each year, commencing September 15, 2015. The 2023 Notes are subject to redemption, at the option of the Company, in whole or in part, at any time on or after March 15, 2018, at various redemption prices plus accrued and unpaid interest to the redemption dates. The 2023 Notes are fully and unconditionally guaranteed by each of the Company’s wholly-owned domestic subsidiaries, subject to certain exceptions.
The Company incurred $35,353,000 in expense related to the early extinguishment of debt as a result of the prepayment of the 2018 Notes, which included a tender offer premium of $26,597,000, a call premium of $1,702,000 and the write-off of $7,054,000 in unamortized deferred debt issuance costs.
67
RSI HOME PRODUCTS, INC.
NOTES TO CONSOLIDATED FINANCIAL STATEMENTS — (Continued)
The 2023 Notes contain customary covenants, including covenants that limit or restrict the Company’s ability to incur debt, pay dividends, repurchase or make other distributions in respect to its capital stock, make other restricted payments, create liens, sell assets, engage in transactions with affiliates, consolidate or merge into other companies, or convey, transfer or lease to other companies.
$75 Million Credit Facility
On February 22, 2013, the Company entered into an agreement with three financial institutions (collectively, the “Lenders”) whereby the Lenders provided a revolving credit facility to the Company for a total of $75,000,000 (the “Credit Facility”). The Credit Facility also includes a letter of credit commitment from the lenders. Advances under the Credit Facility bear interest at selected variable rates, as defined, plus a margin based on the Company’s financial position. The principal amount of the revolving loans shall be repaid on the maturity date. The credit arrangement is secured by substantially all assets of the Company and expires on August 22, 2017.
On March 16, 2015, the Company amended and restated the Credit Facility, to among other things, extend the maturity date to March 16, 2020.
The Credit Facility contains customary covenants, including covenants that limit or restrict the Company’s ability to incur debt, create liens, consolidate or merge into other companies, sell or lease assets, pay or prepay subordinated debt, engage in sale and leaseback transactions, pay dividends, repurchase or make other distributions in respect to its capital stock and engage in transactions with affiliates. The Credit Facility also requires the Company to maintain certain minimum financial ratios and other financial measures. As of December 31, 2016 and January 2, 2016, there were no outstanding loan balances under this facility.
As of December 31, 2016 and January 2, 2016, the Company had $3,725,000 of outstanding letters of credit related to its self-insured workers’ compensation program (see Note 5).
As of December 31, 2016, the Company was compliant with all of its debt covenants.
For the year ended January 2, 2016, the Company incurred $10,975,000 of debt issuance costs in connection with the issuance of the 2023 Notes and the amendment and restatement of the Credit Facility. The unamortized balance of $9,581,000 as of January 2, 2016 was reclassified from other assets to senior secured notes on the consolidated balance sheets. Amortization expense of debt issuance costs was $1,284,000, $1,486,000 and $2,371,000 for the years ended December 31, 2016, January 2, 2016 and January 3, 2015, respectively, and is included in interest expense in the consolidated statements of income.
Net interest expense including amortization of debt issuance costs was $38,641,000, $39,306,000 and $39,463,000 for the years ended December 31, 2016, January 2, 2016 and January 3, 2015, respectively. Interest expense for the year ended January 2, 2016 included a write-off of unamortized deferred debt issuance costs of $325,000 related to the amendment and restatement of the Credit Facility.
68
RSI HOME PRODUCTS, INC.
NOTES TO CONSOLIDATED FINANCIAL STATEMENTS — (Continued)
NOTE 7 INCOME TAXES
The provision for income taxes consists of the following components:
| 2016 | 2015 | 2014 | ||||||||||
| Current Provision |
||||||||||||
| Federal |
$ | 21,871,000 | $ | 3,756,000 | $ | 20,689,000 | ||||||
| State |
3,860,000 | 655,000 | 3,164,000 | |||||||||
| Foreign |
731,000 | 540,000 | 763,000 | |||||||||
|
|
|
|
|
|
|
|||||||
| Total current |
26,462,000 | 4,951,000 | 24,616,000 | |||||||||
|
|
|
|
|
|
|
|||||||
| Deferred Provision |
||||||||||||
| Federal |
5,196,000 | (2,927,000 | ) | (4,032,000 | ) | |||||||
| State |
509,000 | (468,000 | ) | (641,000 | ) | |||||||
| Foreign |
(212,000 | ) | (35,000 | ) | (206,000 | ) | ||||||
|
|
|
|
|
|
|
|||||||
| Total deferred |
5,493,000 | (3,430,000 | ) | (4,879,000 | ) | |||||||
|
|
|
|
|
|
|
|||||||
| Total provision for income taxes |
$ | 31,955,000 | $ | 1,521,000 | $ | 19,737,000 | ||||||
|
|
|
|
|
|
|
|||||||
Taxes based on income differ from the amount obtained by applying the statutory federal income tax rate to income before taxes as follows:
| 2016 | 2015 | 2014 | ||||||||||
| Computed provision for taxes based on income at the federal statutory rate |
$ | 34,146,000 | $ | 2,065,000 | $ | 20,597,000 | ||||||
| State income taxes, net of federal income tax benefit |
2,839,000 | 122,000 | 1,640,000 | |||||||||
| Domestic manufacturing deduction |
(2,532,000 | ) | (495,000 | ) | (2,087,000 | ) | ||||||
| Tax credits and other |
(2,498,000 | ) | (171,000 | ) | (413,000 | ) | ||||||
|
|
|
|
|
|
|
|||||||
| $ | 31,955,000 | $ | 1,521,000 | $ | 19,737,000 | |||||||
|
|
|
|
|
|
|
|||||||
69
RSI HOME PRODUCTS, INC.
NOTES TO CONSOLIDATED FINANCIAL STATEMENTS — (Continued)
Components of the Company’s deferred tax assets and liabilities are as follows:
| 2016 | 2015 | |||||||
| Deferred tax assets |
||||||||
| Inventory uniform capitalization adjustment |
$ | 819,000 | $ | 1,143,000 | ||||
| Inventory reserves |
181,000 | 180,000 | ||||||
| Vacation accrual |
813,000 | 745,000 | ||||||
| Workers’ compensation |
877,000 | 925,000 | ||||||
| State income taxes |
342,000 | 144,000 | ||||||
| Stock-based compensation |
7,823,000 | 13,001,000 | ||||||
| Bonus and commission accrual |
248,000 | 688,000 | ||||||
| Other reserves |
1,039,000 | 860,000 | ||||||
| Intangible amortization |
1,497,000 | 1,498,000 | ||||||
| Accrued expenses and other |
1,354,000 | 1,453,000 | ||||||
| Deferred rent |
1,768,000 | 1,041,000 | ||||||
| Foreign tax credt |
254,000 | — | ||||||
| Business development costs and displays |
112,000 | — | ||||||
|
|
|
|
|
|||||
| Total deferred tax assets |
17,127,000 | 21,678,000 | ||||||
|
|
|
|
|
|||||
| Deferred tax liabilities |
||||||||
| Property and equipment |
6,116,000 | 5,115,000 | ||||||
| Prepaid supplies and other |
338,000 | 332,000 | ||||||
| Slotting fees and displays |
— | 64,000 | ||||||
|
|
|
|
|
|||||
| Total deferred tax liabilities |
6,454,000 | 5,511,000 | ||||||
|
|
|
|
|
|||||
| Net deferred tax assets |
$ | 10,673,000 | $ | 16,167,000 | ||||
|
|
|
|
|
|||||
The Company evaluates the realizability of its deferred tax assets and assesses the need for a valuation allowance on an ongoing basis. In evaluating its deferred tax assets, the Company considers whether it is more likely than not that the deferred income tax assets will be realized. The ultimate realization of deferred tax assets depends upon generating sufficient future taxable income prior to the expiration of the tax attributes. This assessment requires significant judgment. Given the merits of objectively verifiable evidence, including a history of income for both GAAP accounting and income taxes, the Company has determined that there is no need for a valuation allowance as of December 31, 2016 and January 2, 2016.
The following table summarizes the activity related to the Company’s unrecognized tax benefits for the fiscal years ended:
| 2016 | 2015 | |||||||
| Unrecognized tax benefits, beginning balance |
$ | 2,456,000 | $ | 3,592,000 | ||||
| Gross increases (decreases)-tax positions in prior period |
18,000 | (61,000 | ) | |||||
| Gross increases-tax positions in current period |
81,000 | — | ||||||
| Lapse of statute of limitations |
(1,256,000 | ) | (1,075,000 | ) | ||||
|
|
|
|
|
|||||
| Unrecognized tax benefits, ending balance |
$ | 1,299,000 | $ | 2,456,000 | ||||
|
|
|
|
|
|||||
The Company recognizes interest and/or penalties related to income tax matters in income tax expense. As of December 31, 2016 and January 2, 2016, the Company had approximately $319,000 and $641,000, respectively, of accrued interest and penalties related to uncertain tax positions.
The Company believes that it is reasonably possible that approximately $647,000 of its unrecognized tax benefits may be recognized by the end of its next fiscal year as a result of a lapse of the statute of limitations.
70
RSI HOME PRODUCTS, INC.
NOTES TO CONSOLIDATED FINANCIAL STATEMENTS — (Continued)
The tax years ended December 28, 2013 to December 31, 2016 remain open to examination by the major taxing jurisdictions to which the Company is subject. The Company has received notice from the State of North Carolina that they will conduct an examination of the tax years 2013, 2014 and 2015. The Company does not believe that unrecognized tax benefits as of December 31, 2016 will significantly increase or decrease within the next 12 months.
NOTE 8 COMMITMENTS AND CONTINGENCIES
Operating leases
The Company leases certain facilities under operating lease agreements, which expire on various dates through August 2029 and require minimum annual rentals ranging from $1,000 to $446,000 per month. Certain of these leases provide for rent escalations and renewal options. For leases with stated rent escalations, the Company recognizes rent expense ratably over the lease term. The difference between the ratable rent expense and the amount paid is included in other non-current liabilities in the consolidated balance sheets. The majority of these leases obligate the Company to pay costs of maintenance, utilities and property taxes.
Minimum future rental payments under operating leases at December 31, 2016 are as follows:
| Fiscal Years Ending |
Amount | |||
| 2017 |
$ | 14,066,000 | ||
| 2018 |
13,852,000 | |||
| 2019 |
12,847,000 | |||
| 2020 |
13,098,000 | |||
| 2021 |
10,650,000 | |||
| Thereafter |
40,721,000 | |||
|
|
|
|||
| $ | 105,234,000 | |||
|
|
|
|||
Rent expense for the years ended December 31, 2016, January 2, 2016 and January 3, 2015 was $13,582,000, $12,037,000 and $11,492,000, respectively.
Legal matters
The Company is involved in various claims and legal actions arising in the ordinary course of business. In the opinion of management, the ultimate disposition of these matters will not have a material adverse impact on the Company’s financial position, results of operations or cash flows. As of December 31, 2016, there was no litigation or contingency with at least a reasonable possibility of a material loss.
NOTE 9 RETIREMENT PLANS
The Company has a defined-contribution 401(k) profit sharing plan (“401(k) plan”) for all non-union employees. Employees are eligible to contribute to the 401(k) plan 60 days after starting employment. Under the 401(k) plan, employees may contribute up to 60 percent of their compensation, subject to an annual contribution limit prescribed by the Internal Revenue Service. The Company has elected to make safe harbor matching contributions of up to four percent of each participant’s eligible compensation. The Company’s safe harbor contributions vest immediately. The Company incurred matching contribution expense for the years ended December 31, 2016, January 2, 2016 and January 3, 2015 of $1,381,000, $1,004,000 and $1,306,000, respectively.
71
RSI HOME PRODUCTS, INC.
NOTES TO CONSOLIDATED FINANCIAL STATEMENTS — (Continued)
NOTE 10 STOCKHOLDERS’ DEFICIT
On May 22, 2015, the Company amended and restated its certificate of incorporation which authorizes the respective classes and shares of corporate stock as follows:
Shares
The total number of shares of all classes of stock which the Company has authority to issue is 100,000,000, of which 90,000,000 shares are Common Stock, consisting of 40,000,000 shares of Class A Voting Common Stock, par value $0.001 per share (“Class A Common Stock”), 25,000,000 shares of Class B Voting Common Stock, par value $0.001 per share (“Class B Common Stock”), 25,000,000 shares of Class C Non-Voting Common Stock, par value $0.001 per share (“Class C Common Stock” together with the Class A Common Stock and the Class B Common Stock, the “Common Stock”), and 10,000,000 shares of Preferred Stock, par value $0.001 per share (“Preferred Stock”).
Preferred Stock
The shares of Preferred Stock may be issued from time to time in one or more series. The Board of Directors (“the Board”) is expressly authorized to fix and determine by resolution or resolutions the number of shares of each series of Preferred Stock and the designation thereof, and the voting and other powers, preferences and relative, participating, optional or other special rights.
Common Stock
The rights, preferences, privileges and restrictions granted to and imposed on the Common Stock are as follows:
Relative Rights
Except as any provision of law or any provision in the Eighth Amended and Restated Certificate of Incorporation may otherwise provide, each share of Common Stock, without distinction as to class, shall have the same rights, privileges, interests and attributes, and shall be subject to the same limitations, as every other share of Common Stock.
Voting
Each holder of shares of Class A Common Stock shall be entitled to notice of and to attend all special and annual meetings of the stockholders of the Company and to cast one vote for each outstanding share of Class A Common Stock so held upon any matter or thing (including, without limitation, the election of one or more directors) properly considered and acted upon by the stockholders.
Each holder of shares of Class B Common Stock shall be entitled to notice of and to attend all special and annual meetings of the stockholders of the Company and to cast one vote for each outstanding share of Class B Common Stock so held upon any matter or thing (including, without limitation, the election of one or more directors) properly considered and acted upon by the stockholders.
Except as required by law, holders of shares of Class C Common Stock shall not be entitled to vote on any matter submitted to a vote of the stockholders of the Company.
Dividends
Except as to the Special Dividend, as defined in the Eighth Amended and Restated Certificate of Incorporation, in the aggregate amount of $50,000,000, all dividends payable on the Common Stock in cash, property or shares of capital stock shall be payable to all holders of Common Stock, without distinction as to class. Holders of Class B Common Stock shall not be entitled to receive any Special Dividend payable in cash or property to holders of Class A Common Stock and Class C Common Stock.
72
RSI HOME PRODUCTS, INC.
NOTES TO CONSOLIDATED FINANCIAL STATEMENTS — (Continued)
Liquidation
In the event of any liquidation, the holders of the Common Stock and holders of any class or series of stock entitled to participate therewith, in whole or in part, as to the distribution of assets in such event, shall become entitled to participate, pro-rata, in the distribution of any assets of the Company remaining after the Company shall have paid, or provided for payment of, all debts and liabilities of the Company and after the Company shall have paid, or set aside for payment, to the holders of any class of stock having preference over the Common Stock, in the event of any liquidation, the full preferential amounts, if any, to which they are entitled.
Transaction with BIC Investors, LLC
On May 27, 2015 (the “Closing Date”), the Company and its stockholders (the “Stockholders”) entered into a stock purchase agreement (the “Agreement”) with BIC Investors, LLC (“BIC”).
The Agreement provided, subject to its terms and conditions, for the Stockholders to sell to BIC 2,293,943 shares of Class A Common Stock and 235,739 shares of Class C Common Stock (the “Purchased Shares”). Holders of vested Class C stock options exercised 253,671 options and participated in this transaction, resulting in additional non-cash stock-based compensation expense of $9,115,000 to settle the liability awards. Pursuant to the Eighth Amended and Restated Certificate of Incorporation, the Purchased Shares were automatically converted to 2,537,972 shares of Class B Common Stock immediately prior to the transfer and delivery to BIC. The Aggregate Purchase Price was $130,000,000.
In connection with the BIC transaction, the Company entered into an investor rights agreement with BIC. This agreement included a provision that provided BIC the right, if a qualified Initial Public Offering was not consummated by the sixth anniversary of the transaction in 2021, to request the Company to initiate a sale process of the Company or at the Board’s discretion to repurchase the BIC stock holdings at fair value. As the potential repurchase feature is within the full control of the Board, the Company has accounted for the BIC investment as permanent equity.
Conversion of Common Stock
All issued and outstanding shares of Class B Common Stock shall automatically be converted into the same number of shares of Class A Common Stock on the earlier to occur of (i) payment of the Special Dividend, and (ii) an initial public offering of Common Stock. In the case of clause (i), immediately upon such payment and, in the case of clause (ii), immediately prior to such initial public offering.
During 2016 the Company paid the $50,000,000 Special Dividend and all issued and outstanding shares of Class B Common Stock were converted to Class A Common Stock.
Redemption
At December 28, 2013, Class C Common Stock contained a mandatory redemption feature in the event that the employee stockholder’s employment with the Company was to terminate, and these shares were recorded at the redemption price. Effective June 25, 2014, holders of Class C Common Stock irrevocably amended and restated their Stockholders’ Agreements to eliminate the mandatory redemption feature contained in such agreements with respect to the Class C Common Stock and instead provide the Company the option to purchase some or all of the employee stockholder’s Class C Common Stock upon the termination of such holder’s employment. As a result, 131,000 shares of Class C Common Stock were remeasured to fair value as of June 25, 2014 and reclassified from temporary equity to permanent equity at the carrying amount of $1,921,000.
Stock Option Plans
As of December 31, 2016, the Company had one stock-based compensation plan, the 2013 Stock Incentive Plan, which replaced the 1995 Stock Option Plan and the 2002 Non-Employee Director Stock Plan.
73
RSI HOME PRODUCTS, INC.
NOTES TO CONSOLIDATED FINANCIAL STATEMENTS — (Continued)
2013 Stock Incentive Plan
The 2013 Stock Incentive Plan (the “2013 Plan” or the “Plan”) was effective October 1, 2013 and replaced all other stock option and/or award plans of the Company. The terms of any grants made under a prior plan shall continue to be governed by the terms of the plan under which the grant was made. The Plan is administered by the Board and the Board may designate a committee to operate and administer the Plan. The Plan covers employees and directors of the Company or any affiliate, and consultants and advisors who render bona fide services to the Company unrelated to the offer or sale of securities. The Plan authorizes grants of options to purchase up to 10,000,000 shares of authorized and unissued Class A Common Stock or shares of Class A Common Stock held in treasury less any shares outstanding under the previous stock incentive plans, subject to capitalization adjustments. Grants under the Plan may be in the form of non-qualified stock options, incentive stock options, stock appreciation rights, restricted stock units or a combination thereof, at the discretion of the Board. Under the Plan, options generally vest over five years and expire ten years from the grant date.
All options must be priced at least equal to 100% of the fair market value of the shares on the date the option is granted. The Company has historically utilized a stock valuation methodology for the granting of options (establishing an exercise price) using an approach that determines the Company’s enterprise value using a multiple of EBITDA and subtracting outstanding debt and adding excess cash to arrive at equity value, and then dividing by the number of outstanding common shares, common share equivalents and exercisable option shares.
1995 Stock Option Plan
The 1995 Stock Option Plan, as amended on August 2, 2000 and February 19, 2002 (“1995 Plan”) was administered by the Board. The Company’s Board could grant nonqualified stock options to officers, key employees and directors. The 1995 Plan authorized grants of options to purchase up to 10,000,000 shares of authorized but unissued Class C Common Stock. Stock options were granted with an exercise price equal to or greater than the stock’s fair market value (as determined by the Board) at the date of grant. Stock options were exercisable beginning two years after the grant date with respect to 40% of the total number of shares, and 20% on each of the three succeeding years. Stock options granted under the 1995 Plan have a term of ten years from the date of grant.
This plan was replaced by the 2013 Stock Incentive Plan effective October 1, 2013. However, the terms of the grants already made under this plan continue to be governed by the 1995 Plan.
A summary of the shares reserved for options outstanding and available for grant under each plan as of December 31, 2016 is as follows:
| Options Originally Authorized (000’s) |
Options Outstanding (000’s) |
Options Available for Grant (000’s) |
||||||||||
| 1995 Nonqualified Stock Option Plan |
10,000 | 1,927 | — | |||||||||
|
|
|
|
|
|
|
|||||||
| 2013 Stock Incentive Plan (replaces previous stock option plans) |
10,000 | 2,272 | (a) | 7,728 | ||||||||
|
|
|
|
|
|
|
|||||||
| (a) | The 2013 Stock Incentive Plan replaces prior stock option plans and the current outstanding options include the option grants for the 1995 Plan. |
74
RSI HOME PRODUCTS, INC.
NOTES TO CONSOLIDATED FINANCIAL STATEMENTS — (Continued)
Stock option activity for the years ended December 31, 2016, January 2, 2016 and January 3, 2015 are as follows:
| 2013 Stock Incentive Plan (excludes options granted
under 1995 |
Options (000’s) |
Weighted Average Exercise Price |
Weighted Average Remaining Contractual Term (Years) |
|||||||||
| Outstanding at December 28, 2013 |
1,025 | $ | 23.82 | 9.79 | ||||||||
| Granted |
5 | 23.82 | — | |||||||||
| Exercised |
— | — | — | |||||||||
| Cancelled |
— | — | — | |||||||||
| Forfeited/expired |
— | — | — | |||||||||
| Outstanding at January 3, 2015 |
1,030 | $ | 23.82 | 8.78 | ||||||||
|
|
|
|
|
|
|
|||||||
| Granted |
200 | 25.23 | — | |||||||||
| Exercised |
— | — | — | |||||||||
| Cancelled |
— | — | — | |||||||||
| Forfeited/expired |
— | — | — | |||||||||
|
|
|
|
|
|
|
|||||||
| Outstanding at January 2, 2016 |
1,230 | $ | 21.18 | 8.04 | ||||||||
| Granted |
25 | 29.75 | — | |||||||||
| Exercised |
— | — | — | |||||||||
| Cancelled |
— | — | — | |||||||||
| Forfeited/expired |
(910 | ) | 20.68 | — | ||||||||
|
|
|
|
|
|
|
|||||||
| Outstanding at December 31, 2016 |
345 | $ | 20.14 | 7.84 | ||||||||
|
|
|
|
|
|
|
|||||||
| Options exercisable at December 31, 2016 |
77 | $ | 15.57 | 6.80 | ||||||||
|
|
|
|
|
|
|
|||||||
| Vested and expected to vest at December 31, 2016 |
199 | $ | 19.17 | 7.62 | ||||||||
|
|
|
|
|
|
|
|||||||
75
RSI HOME PRODUCTS, INC.
NOTES TO CONSOLIDATED FINANCIAL STATEMENTS — (Continued)
| 1995 Stock Incentive Plan |
Options (000’s) |
Weighted Average Exercise Price |
Weighted Average Remaining Contractual Term (Years) |
|||||||||
| Outstanding at December 28, 2013 |
3,061 | $ | 9.29 | 5.50 | ||||||||
| Granted |
— | — | — | |||||||||
| Exercised |
(140 | ) | 9.71 | — | ||||||||
| Cancelled |
(115 | ) | 9.32 | — | ||||||||
| Forfeited/expired |
(294 | ) | 11.57 | — | ||||||||
|
|
|
|
|
|
|
|||||||
| Outstanding at January 3, 2015 |
2,512 | $ | 9.00 | 4.46 | ||||||||
| Granted |
— | — | — | |||||||||
| Exercised |
(310 | ) | 8.67 | — | ||||||||
| Cancelled |
(88 | ) | 9.27 | — | ||||||||
| Forfeited/expired |
(74 | ) | 12.88 | — | ||||||||
|
|
|
|
|
|
|
|||||||
| Outstanding at January 2, 2016 |
2,040 | $ | 8.27 | 3.72 | ||||||||
| Granted |
— | — | — | |||||||||
| Exercised |
(22 | ) | 9.31 | — | ||||||||
| Cancelled |
(69 | ) | 10.66 | — | ||||||||
| Forfeited/expired |
(22 | ) | 7.68 | — | ||||||||
|
|
|
|
|
|
|
|||||||
| Outstanding at December 31, 2016 |
1,927 | $ | 5.16 | 2.92 | ||||||||
|
|
|
|
|
|
|
|||||||
| Options exercisable at December 31, 2016 |
1,823 | $ | 5.20 | 2.72 | ||||||||
|
|
|
|
|
|
|
|||||||
| Vested and expected to vest at December 31, 2016 |
1,870 | $ | 5.18 | 2.81 | ||||||||
|
|
|
|
|
|
|
|||||||
The aggregate intrinsic value of the options exercisable and options vested and expected to vest at December 31, 2016 was $24,597,000 and $26,001,000, respectively.
During the years ended December 31, 2016, January 2, 2016 and January 3, 2015, the Company canceled options for 69,256, 88,092 and 115,450 shares of common stock, respectively, from current and former employees. The cancellation values represent a formulaic amount agreed upon between the option holder and the Company. The agreed value paid by the Company for the cancellation of the option grants was paid out in cash and subordinated promissory notes, with consideration totaling $361,000, $582,000 and $375,000, during the years ended December 31, 2016, January 2, 2016 and January 3, 2015, respectively (see Note 6).
For the year ended December 31, 2016, the Company paid a dividend of $2.98 per share, totaling $50,000,000 to holders of Class A Common and Class C Common Stock. The Board authorized an equitable adjustment for option holders in the form of a reduction of the exercise price for all outstanding stock options. This resulted in additional stock-based compensation expense of $6,843,000.
For the year ended January 2, 2016, the Company paid a cash dividend of $5.26 per share, totaling $100,000,000 to holders of Class A Common Stock and Class C Common Stock. The Board authorized an equitable adjustment for option holders in the form of a reduction of the exercise price for unvested stock options and a cash bonus to vested option holders. This resulted in additional stock-based compensation expense of $17,889,000.
At December 31, 2016, there was $1,478,000 of total unrecognized compensation cost related to unvested stock options granted under the plans. This cost is expected to be recognized over a weighted-average period of 2.06 years. Because the options are accounted for as liability awards, future compensation cost will vary with changes in the fair value of the underlying common stock and forfeiture rates.
Stock-based compensation expense (expense reversal) is included in selling, general and administrative expense in the accompanying consolidated statements of income and totaled $(12,608,000), $37,353,000 and
76
RSI HOME PRODUCTS, INC.
NOTES TO CONSOLIDATED FINANCIAL STATEMENTS — (Continued)
$11,403,000 for each of the years ended December 31, 2016, January 2, 2016 and January 3, 2015, respectively. The total income tax (provision) benefit recognized in the consolidated statements of income for stock-based compensation arrangements was $(4,765,000), $13,843,000 and $4,309,000 for each of the years ended December 31, 2016, January 2, 2016 and January 3, 2015, respectively.
NOTE 11 SUBSEQUENT EVENTS
The Company has evaluated all events or transactions that occurred after the balance sheet date of December 31, 2016 through March 6, 2017, the date the consolidated financial statements were available to be issued, and has determined that no subsequent events require disclosure in the consolidated financial statements.
NOTE 12 SUBSEQUENT EVENTS (Unaudited)
On November 30, 2017, American Woodmark Corporation (“Woodmark”) and the Company entered into an Agreement and Plan of Merger. On December 29, 2017, Woodmark consummated the previously announced acquisition of the Company. At the closing of the Acquisition, Woodmark assumed the Company’s indebtedness consisting primarily of the Company’s privately placed 6.5% Senior Secured Second Lien Notes due 2023 issued in March 2015.
On December 22, 2017, the Tax Cuts and Jobs Act (“The Act”), was signed into law by President Trump. The Act includes a number of provisions, including the lowering of the U.S. corporate tax rate from 35 percent to 21 percent, effective January 1, 2018 and the establishment of a territorial-style system for taxing foreign-source income of domestic multinational corporations. The Company is in the process of quantifying the tax impacts of The Act. As a result of The Act, the Company expects there will be one-time adjustments for the re-measurement of deferred tax assets (liabilities) and the deemed repatriation tax on the unremitted foreign earnings and profits. The Company is in the process of quantifying the impact of the Act.
77
CONDENSED CONSOLIDATED BALANCE SHEETS
(Unaudited)
| September 30, 2017 |
December 31, 2016 |
|||||||
| ASSETS |
||||||||
| Current Assets |
||||||||
| Cash and cash equivalents |
$ | 80,941,000 | $ | 49,293,000 | ||||
| Acounts receivable, net of rebates and allowances of $10,752,000 in 2017 and $8,856,000 in 2016 |
50,815,000 | 61,894,000 | ||||||
| Inventories |
63,601,000 | 61,777,000 | ||||||
| Prepaid income taxes |
1,476,000 | 4,396,000 | ||||||
| Prepaid expenses and other current assets |
9,019,000 | 6,465,000 | ||||||
|
|
|
|
|
|||||
| Total current assets |
205,852,000 | 183,825,000 | ||||||
| Property and equipment, net |
61,288,000 | 61,790,000 | ||||||
| Other assets |
2,192,000 | 3,310,000 | ||||||
| Intangible assets, net |
10,308,000 | 11,746,000 | ||||||
| Deferred income taxes |
10,797,000 | 10,673,000 | ||||||
|
|
|
|
|
|||||
| Total assets |
$ | 290,437,000 | $ | 271,344,000 | ||||
|
|
|
|
|
|||||
| LIABILITIES AND STOCKHOLDERS’ DEFICIT |
||||||||
| Current Liabilities |
||||||||
| Accounts payable |
$ | 25,290,000 | $ | 25,853,000 | ||||
| Current portion of long-term debt |
685,000 | 365,000 | ||||||
| Other accrued liabilities |
35,250,000 | 51,459,000 | ||||||
|
|
|
|
|
|||||
| Total current liabilities |
61,225,000 | 77,677,000 | ||||||
| Senior secured notes |
567,365,000 | 566,503,000 | ||||||
| Long-term debt, net of current portion |
2,334,000 | 525,000 | ||||||
| Other non-current liabilities |
6,080,000 | 6,273,000 | ||||||
|
|
|
|
|
|||||
| Total liabilities |
637,004,000 | 650,978,000 | ||||||
|
|
|
|
|
|||||
| Commitments and contingencies (Note 8) |
||||||||
| Stockholders’ Deficit |
||||||||
| Common stock — Class A Voting — par value $0.001, authorized: |
||||||||
| 2017 and 2016 — 40,000,000 shares; issued and outstanding: |
||||||||
| 2017 — 19,050,063 shares, 2016 — 19,050,063 shares |
19,000 | 19,000 | ||||||
| Common stock — Class C Nonvoting — par value $0.001, authorized: |
||||||||
| 2017 and 2016 — 25,000,000 shares; issued and outstanding: |
||||||||
| 2017—251,980 shares, 2016 — 251,980 shares |
— | — | ||||||
| Additional paid-in capital |
67,515,000 | 67,515,000 | ||||||
| Accumulated deficit |
(414,101,000 | ) | (447,168,000 | ) | ||||
|
|
|
|
|
|||||
| Total stockholders’ deficit |
(346,567,000 | ) | (379,634,000 | ) | ||||
|
|
|
|
|
|||||
| Total liabilities and stockholders’ deficit |
$ | 290,437,000 | $ | 271,344,000 | ||||
|
|
|
|
|
|||||
See notes to condensed consolidated financial statements.
78
RSI HOME PRODUCTS, INC.
CONDENSED CONSOLIDATED STATEMENTS OF INCOME
(Unaudited)
| Nine Months Ended | ||||||||
| September 30, 2017 |
October 1, 2016 |
|||||||
| Net sales |
$ | 428,478,000 | $ | 457,546,000 | ||||
| Cost of sales |
304,520,000 | 322,368,000 | ||||||
|
|
|
|
|
|||||
| Gross profit |
123,958,000 | 135,178,000 | ||||||
| Selling, general and administrative (including stock-based compensation benefit of $(780,000) and $(14,881,000) in 2017 and 2016, respectively) |
45,340,000 | 26,580,000 | ||||||
|
|
|
|
|
|||||
| Operating income |
78,618,000 | 108,598,000 | ||||||
| Other (income) expense |
(1,429,000 | ) | 278,000 | |||||
| Interest expense, net |
29,207,000 | 29,248,000 | ||||||
|
|
|
|
|
|||||
| Income before income taxes |
50,840,000 | 79,072,000 | ||||||
| Provision for income taxes |
17,773,000 | 27,320,000 | ||||||
|
|
|
|
|
|||||
| Net income |
$ | 33,067,000 | $ | 51,752,000 | ||||
|
|
|
|
|
|||||
See notes to condensed consolidated financial statements.
79
RSI HOME PRODUCTS, INC.
CONDENSED CONSOLIDATED STATEMENTS OF CASH FLOWS
(Unaudited)
| Nine Months Ended | ||||||||
| September 30, 2017 |
October 1, 2016 |
|||||||
| Cash Flows From Operating Activities |
||||||||
| Net income |
$ | 33,067,000 | $ | 51,752,000 | ||||
| Adjustments to reconcile net income to net cash provided by operating activities: |
||||||||
| Depreciation |
10,015,000 | 8,517,000 | ||||||
| Amortization of slotting fees |
1,000,000 | 1,000,000 | ||||||
| Amortization of intangible assets |
1,438,000 | 1,499,000 | ||||||
| Amortization of debt issuance costs |
1,010,000 | 956,000 | ||||||
| Stock-based compensation |
(780,000 | ) | (14,881,000 | ) | ||||
| Change in fair value of foreign currency hedge |
(1,429,000 | ) | 278,000 | |||||
| (Gain) loss on disposal of property and equipment |
(11,000 | ) | 53,000 | |||||
| Deferred taxes |
(124,000 | ) | (10,000 | ) | ||||
| Change in operating assets and liabilities: |
||||||||
| Accounts receivable |
11,079,000 | 1,593,000 | ||||||
| Inventories |
(1,824,000 | ) | 6,362,000 | |||||
| Prepaid expenses and other current assets |
(3,701,000 | ) | 146,000 | |||||
| Other assets |
(1,430,000 | ) | (1,345,000 | ) | ||||
| Income taxes payable |
2,920,000 | 2,046,000 | ||||||
| Accounts payable |
(563,000 | ) | 2,781,000 | |||||
| Other accrued liabilities |
(7,727,000 | ) | (6,610,000 | ) | ||||
|
|
|
|
|
|||||
| Net cash provided by operating activities |
42,940,000 | 54,137,000 | ||||||
|
|
|
|
|
|||||
| Cash Flows From Investing Activities |
||||||||
| Capital expenditures — property and equipment |
(11,153,000 | ) | (21,890,000 | ) | ||||
| Proceeds from sale of property and equipment |
111,000 | 12,000 | ||||||
|
|
|
|
|
|||||
| Net cash used in investing activities |
(11,042,000 | ) | (21,878,000 | ) | ||||
|
|
|
|
|
|||||
| Cash Flows From Financing Activities |
||||||||
| Payments on unsecured notes payable |
(250,000 | ) | (372,000 | ) | ||||
| Issuance of common stock |
— | 50,000 | ||||||
|
|
|
|
|
|||||
| Net cash used in financing activities |
(250,000 | ) | (322,000 | ) | ||||
|
|
|
|
|
|||||
| Net increase in cash |
31,648,000 | 31,937,000 | ||||||
| Cash and cash equivalents |
||||||||
| Beginning |
49,293,000 | 47,509,000 | ||||||
|
|
|
|
|
|||||
| Ending |
$ | 80,941,000 | $ | 79,446,000 | ||||
|
|
|
|
|
|||||
| Supplemental Schedule of Noncash Investing and Financing Activities |
| |||||||
| Equipment acquired under financing agreement |
$ | — | $ | 262,000 | ||||
|
|
|
|
|
|||||
| Notes payable issued on options exercised and canceled |
$ | 2,473,000 | $ | 153,000 | ||||
|
|
|
|
|
|||||
See notes to condensed consolidated financial statements.
80
NOTES TO CONDENSED CONSOLIDATED FINANCIAL STATEMENTS
(Unaudited)
| NOTE | 1 NATURE OF ORGANIZATION AND BASIS OF PRESENTATION |
RSI Home Products, Inc. (“RSI”) was founded in 1989. RSI and its subsidiaries are collectively referred to herein as the “Company”. RSI, through its wholly owned subsidiaries, is engaged primarily in the manufacture and distribution of stock and made-to-order bath and kitchen cabinets and cultured marble tops to national home centers, home builders, dealers and distributors throughout the United States and Canada.
The accompanying unaudited condensed consolidated financial statements have been prepared in accordance with U.S generally accepted accounting principles (“U.S. GAAP”) for interim financial information. Accordingly, they do not include all of the information and footnotes required by U.S. GAAP for complete consolidated financial statements. In the opinion of management, all adjustments (consisting of normal recurring accruals) considered necessary for a fair statement have been included. Operating results for the nine months ended September 30, 2017 are not necessarily indicative of the results that may be expected for the fiscal year ending December 30, 2017. The unaudited condensed consolidated financial statements should be read in conjunction with the audited consolidated financial statement and notes for the fiscal year ended December 31, 2016.
NOTE 2 RECENTLY ISSUED ACCOUNTING PRONOUNCEMENTS
New accounting pronouncements adopted
In July 2015, the FASB issued ASU No. 2015-11, “Inventory (Topic 330): Simplifying the Measurement of Inventory” (“ASU 2015-11”). Upon adoption by an entity, ASU 2015-11 will simplify the subsequent measurement of inventory by replacing the current lower of cost or market test with a lower of cost or net realizable value test. The new guidance applies only to inventories for which cost is determined by methods other than last-in-first-out (LIFO) and the retail inventory method. For inventory within the scope of ASU 2015-11, entities will be required to compare the cost of inventory to only one measure, its net realizable value, and not the three measures required by current guidance (“market,” “subject to a floor,” and a “ceiling”). When evidence exists that the net realizable value of inventory is less than its cost (due to damage, physical deterioration, obsolescence, changes in price levels or other causes), entities will recognize the difference as a loss in earnings in the period in which it occurs. ASU 2015-11 is effective for public entities for fiscal years beginning after December 15, 2016, and interim periods within the year of adoption. Early adoption is permitted. The Company adopted the provisions of ASU 2015-11 prospectively at the beginning of fiscal 2017. The adoption did not have a material impact on the consolidated financial statements.
In November 2015, the FASB issued ASU No. 2015-17, “Balance Sheet Classification of Deferred Taxes (Topic 740)” (“ASU 2015-17”), which requires that deferred tax assets and liabilities be presented as non-current in the balance sheet. ASU 2015-17 is effective for annual reporting periods beginning after December 15, 2016 (and interim periods within those fiscal years) with early adoption permitted. The Company adopted ASU 2015-17 at the beginning of fiscal 2017 on a retrospective basis. Accordingly, we reclassified $12,902,000 from current assets to non-current assets and $2,229,000 from non-current liabilities to non-current assets as of December 31, 2016.
In March 2016, the FASB issued ASU No. 2016-09, “Compensation-Stock Compensation (Topic 718): Improvements to Employee Share-Based Payment Accounting” (“ASU 2016-09”), which provides for improvements to employee share-based payment accounting. ASU 2016-09 simplifies several aspects of the accounting for employee share-based payment transactions, including the accounting for income taxes, forfeitures, and statutory tax withholding requirements, as well as classification in the statement of cash flows. ASU 2016-09 is effective for annual reporting periods beginning after December 15, 2016 (and interim periods within those fiscal years). Early adoption is permitted. The Company adopted ASU 2016-09 at the beginning of fiscal 2017. The adoption did not have a material impact on the consolidated financial statements.
81
RSI HOME PRODUCTS, INC.
NOTES TO CONDENSED CONSOLIDATED FINANCIAL STATEMENTS — (Continued)
(Unaudited)
New accounting pronouncements, not yet adopted
In May 2014, the FASB issued ASU No. 2014-09, “Revenue From Contracts with Customers (Topic 606)” (“ASU 2014-09”), which requires that a company recognizes revenue when it transfers promised goods or services to customers in an amount that reflects the consideration to which the company expects to be entitled in exchange for those goods or services. ASU 2014-09 was originally effective for annual reporting periods (including interim reporting periods within those periods) beginning after December 15, 2016. In August 2015, the FASB issued ASU No. 2015-14, “Revenue from Contracts with Customers (Topic 606): Deferral of Effective Date”, which defers the effective date of ASU 2014-09 by one year. ASU 2014-09 is now effective for annual reporting periods (including interim reporting periods within those periods) beginning after December 15, 2017. In 2016, the SEC provided specific guidance for public business entities that otherwise would not meet the definition of a public business entity except for inclusion of its financial statements in another entity’s filing with the Commission. Such public business entities may apply ASU No. 2014-09 for annual reporting periods beginning after December 15, 2018, and interim reporting periods within annual reporting periods beginning after December 15, 2019. Therefore, the Company does not plan on adopting ASU 2014-09 until fiscal 2019. The Company has not yet completed an assessment of the impact of this standard on the consolidated financial statements.
In February 2016, the FASB issued ASU No. 2016-02, “Leases (Topic 842)” (“ASU 2016-02”), which supersedes the lease requirements in Accounting Standards Codification Topic 840, Leases. ASU 2016-02 requires lessees to recognize assets and liabilities on the balance sheet for most leases and provide enhanced disclosures. Leases will continue to be classified as either finance or operating. ASU 2016-02 is effective for annual reporting periods beginning after December 15, 2018 (and interim periods within those fiscal years). In 2016, the SEC provided specific guidance for public business entities that otherwise would not meet the definition of a public business entity except for inclusion of its financial statements in another entity’s filing with the Commission. Such public business entities may apply ASU No. 2016-02 for annual reporting periods beginning after December 15, 2019, and interim reporting periods within annual reporting periods beginning after December 15, 2019. Therefore, the Company does not plan on adopting ASU 2016-02 until fiscal 2020. The new standard must be adopted using a modified retrospective transition, requiring application at the beginning of the earliest comparative period presented. The Company has not yet completed an assessment of the impact of this standard on the consolidated financial statements.
| NOTE | 3 FAIR VALUE OF FINANCIAL INSTRUMENTS |
Fair value is defined as the exchange price that would be received for an asset or paid to transfer a liability (an exit price) in the principal or most advantageous market for the asset or liability in an orderly transaction between market participants at the measurement date. Assets and liabilities that are measured at fair value are reported using a three-level fair value hierarchy that prioritizes the inputs used to measure fair value. This hierarchy maximizes the use of observable inputs and minimizes the use of unobservable inputs.
The three levels of inputs used to measure fair value are as follows:
| • | Level 1: Inputs to the valuation are unadjusted quoted prices in active markets for identical assets or liabilities. |
| • | Level 2: Inputs to the valuation may include quoted prices for similar assets and liabilities in active or inactive markets, and inputs other than quoted prices, such as interest rates and yield curves, that are observable for the asset or liability for substantially the full term of the financial instrument. |
| • | Level 3: Inputs to the valuation are unobservable and significant to the fair value measurement. Level 3 inputs shall be used to measure fair value only to the extent that observable inputs are not available. |
The estimated fair values of the Company’s short-term financial instruments, including cash and cash equivalents, accounts receivable and accounts payable arising in the ordinary course of business, approximate
82
RSI HOME PRODUCTS, INC.
NOTES TO CONDENSED CONSOLIDATED FINANCIAL STATEMENTS — (Continued)
(Unaudited)
their individual carrying amounts due to the relatively short period of time between their origination and expected realization. The foreign exchange forward contracts were marked to market and therefore represented fair value. The fair values of these contracts are determined based on inputs that are readily available in public markets or can be derived from information available in publicly quoted markets. This valuation methodology is considered level 2 in the fair value hierarchy. For liabilities such as long-term debt not accounted for at fair value and without quoted market prices, fair value was based upon borrowing rates available to the Company for bank loans with the same remaining maturities and similar terms and collateral requirements. As such, the fair value of long-term debt approximated its carrying value.
The fair value of the Company’s senior secured notes is estimated based upon the quoted market prices for the same issue if available, or similar issues. This valuation methodology is considered level 2 in the fair value hierarchy. The carrying amount and estimated fair value of the senior secured notes as of September 30, 2017 was $575,000,000 and $606,625,000, respectively. The carrying amount and estimated fair value of the senior secured notes as of December 31, 2016 was $575,000,000 and $603,750,000, respectively.
The following table sets forth the fair value of the Company’s assets and liabilities measured at fair value on a recurring basis as of September 30, 2017 and December 31, 2016 based on the three-tier fair value hierarchy:
| Level 1 | Level 2 | Level 3 | Total | |||||||||||||
| September 30, 2017 |
||||||||||||||||
| Foreign exchange forward contracts |
$ | — | $ | 1,025,000 | $ | — | $ | 1,025,000 | ||||||||
|
|
|
|
|
|
|
|
|
|||||||||
| December 31, 2016 |
||||||||||||||||
| Foreign exchange forward contracts |
$ | — | $ | (404,000 | ) | $ | — | $ | (404,000 | ) | ||||||
|
|
|
|
|
|
|
|
|
|||||||||
NOTE 4 DERIVATIVES AND HEDGING
Forward contracts
In the normal course of business the Company is subject to risk from adverse fluctuations in foreign exchange rates. The Company manages these risks through the use of derivative financial instruments, primarily foreign exchange forward contracts.
The Company recognizes its outstanding derivative financial instruments in the condensed consolidated balance sheets at their fair values. The Company does not designate these instruments as accounting hedges. The changes in the fair value of these instruments are recorded in other (income) expense in the condensed consolidated statements of income.
At September 30, 2017, the Company held contracts maturing from October 2017 to December 2017 to purchase 103.0 million Mexican pesos at exchange rates ranging from 18.3 to 18.5 Mexican pesos to the U.S. dollar. At December 31, 2016, the Company held contracts maturing from January 2017 to June 2017 to purchase 197.0 million Mexican pesos at exchange rates ranging from 20.6 to 21.2 Mexican pesos to the U.S. dollar. The Company recorded the fair value of these contracts of $1,025,000 and $(404,000) at September 30, 2017 and December 31, 2016, respectively, in other assets and other accrued liabilities in the condensed consolidated balance sheets.
83
RSI HOME PRODUCTS, INC.
NOTES TO CONDENSED CONSOLIDATED FINANCIAL STATEMENTS — (Continued)
(Unaudited)
NOTE 5 INVENTORIES
Inventories consisted of the following as of:
| September 30, 2017 |
December 31, 2016 |
|||||||
| Raw materials |
$ | 48,819,000 | $ | 46,352,000 | ||||
| Finished goods |
14,782,000 | 15,425,000 | ||||||
|
|
|
|
|
|||||
| $ | 63,601,000 | $ | 61,777,000 | |||||
|
|
|
|
|
|||||
NOTE 6 OTHER ACCRUED LIABILITIES
Other accrued liabilities consisted of the following as of:
| September 30, 2017 |
December 31, 2016 |
|||||||
| Stock-based liability awards |
$ | 14,576,000 | $ | 19,907,000 | ||||
| Accrued compensation |
11,753,000 | 9,667,000 | ||||||
| Accrued interest |
1,674,000 | 10,993,000 | ||||||
| Other accrued expenses |
7,247,000 | 10,892,000 | ||||||
|
|
|
|
|
|||||
| $ | 35,250,000 | $ | 51,459,000 | |||||
|
|
|
|
|
|||||
Accrued compensation consists of earned but unpaid payroll, incentive compensation and vacation.
Other accrued expenses consist primarily of amounts accrued for self-insurance for workers’ compensation and medical insurance, capital expenditures and consulting agreements.
The Company is partially self-insured related to workers’ compensation claims up to $500,000 per claim for its employees in the United States. As of September 30, 2017 and December 31, 2016, approximately $2,386,000 and $2,231,000, respectively, has been provided for reported but unresolved workers’ compensation claims, and the reserve is included in the condensed consolidated balance sheets. Total expense for workers’ compensation, including insurance premiums, net of refunds received, was approximately $1,363,000 and $1,622,000 for the nine months ended September 30, 2017 and October 1, 2016, respectively.
The Company is self-insured for up to $250,000 per claim under its medical benefit programs in the United States. Total expense under the program for the nine months ended September 30, 2017 and October 1, 2016 was $5,589,000 and $4,293,000, respectively. The Company provides for a reserve for actual unpaid claims and an estimate of claims incurred but not reported. At September 30, 2017 and December 31, 2016, $702,000 and $632,000, respectively, had been provided for future costs and is included in the condensed consolidated balance sheets.
84
RSI HOME PRODUCTS, INC.
NOTES TO CONDENSED CONSOLIDATED FINANCIAL STATEMENTS — (Continued)
(Unaudited)
NOTE 7 LINES OF CREDIT AND LONG-TERM DEBT
Long-term debt consisted of the following as of:
| September 30, 2017 |
December 31, 2016 |
|||||||
| Senior secured notes |
$ | 575,000,000 | $ | 575,000,000 | ||||
| Unsecured notes payable(a) |
2,827,000 | 670,000 | ||||||
| Other |
192,000 | 220,000 | ||||||
| Less unamortized debt issuance costs |
(7,635,000 | ) | (8,497,000 | ) | ||||
|
|
|
|
|
|||||
| 570,384,000 | 567,393,000 | |||||||
| Less current portion |
685,000 | 365,000 | ||||||
|
|
|
|
|
|||||
| Net |
$ | 569,699,000 | $ | 567,028,000 | ||||
|
|
|
|
|
|||||
| (a) | Notes due to former and current employees for the cancellation and subsequent settlement of vested stock options. The five year notes bear interest at rates ranging from 1.01% to 2.12% per annum and are due in annual installments of principal and interest on their respective anniversary dates, with final payments of all notes due through June 30, 2022. All are unsecured and subordinated to the credit facilities. |
As of September 30, 2017 and December 31, 2016, aggregate maturities of long-term debt, excluding unamortized debt issuance costs, were as follows:
| Years Ending |
September 30, 2017 |
December 31, 2016 |
||||||
| 2017 |
$ | 137,000 | $ | 365,000 | ||||
| 2018 |
667,000 | 192,000 | ||||||
| 2019 |
647,000 | 171,000 | ||||||
| 2020 |
580,000 | 104,000 | ||||||
| 2021 |
528,000 | 52,000 | ||||||
| Thereafter |
575,460,000 | 575,006,000 | ||||||
|
|
|
|
|
|||||
| $ | 578,019,000 | $ | 575,890,000 | |||||
|
|
|
|
|
|||||
Senior Secured Notes
On March 16, 2015, the Company issued $575,000,000 of senior secured second lien notes due 2023 (the “2023 Notes”) with major financial institutions as initial purchasers (1) to repay the existing senior secured second lien notes due in 2018 (the “2018 Notes”), including accrued and unpaid interest, a tender offer premium and a call premium, and (2) for general corporate purposes. The 2023 Notes bear interest at 6.5% per annum and mature on March 15, 2023. Interest on the 2023 Notes is payable semi-annually, in cash in arrears, on March 15 and September 15 of each year, commencing September 15, 2015. The 2023 Notes are subject to redemption, at the option of the Company, in whole or in part, at any time on or after March 15, 2018, at various redemption prices plus accrued and unpaid interest to the redemption dates. The 2023 Notes are fully and unconditionally guaranteed by each of the Company’s wholly-owned domestic subsidiaries, subject to certain exceptions.
The 2023 Notes contain customary covenants, including covenants that limit or restrict the Company’s ability to incur debt, pay dividends, repurchase or make other distributions in respect to its capital stock, make other restricted payments, create liens, sell assets, engage in transactions with affiliates, consolidate or merge into other companies, or convey, transfer or lease to other companies.
85
RSI HOME PRODUCTS, INC.
NOTES TO CONDENSED CONSOLIDATED FINANCIAL STATEMENTS — (Continued)
(Unaudited)
$75 Million Credit Facility
On February 22, 2013, the Company entered into an agreement with three financial institutions (collectively, the “Lenders”) whereby the Lenders provided a revolving credit facility to the Company for a total of $75,000,000 (the “Credit Facility”). The Credit Facility also includes a letter of credit commitment from the lenders. Advances under the Credit Facility bear interest at selected variable rates, as defined, plus a margin based on the Company’s financial position. The principal amount of the revolving loans shall be repaid on the maturity date. The credit arrangement is secured by substantially all assets of the Company and expires on August 22, 2017.
On March 16, 2015, the Company amended and restated the Credit Facility, to among other things, extend the maturity date to March 16, 2020.
The Credit Facility contains customary covenants, including covenants that limit or restrict the Company’s ability to incur debt, create liens, consolidate or merge into other companies, sell or lease assets, pay or prepay subordinated debt, engage in sale and leaseback transactions, pay dividends, repurchase or make other distributions in respect to its capital stock and engage in transactions with affiliates. The Credit Facility also requires the Company to maintain certain minimum financial ratios and other financial measures. As of September 30, 2017 and December 31, 2016, there were no outstanding loan balances under this facility.
As of September 30, 2017 and December 31, 2016, the Company had $3,725,000 of outstanding letters of credit related to its self-insured workers’ compensation program (see Note 6).
As of September 30, 2017 and December 31, 2016, the Company was compliant with all of its debt covenants.
Amortization expense of debt issuance costs was $1,009,000 and $956,000 for the nine months ended September 30, 2017 and October 1, 2016, respectively, and is included in interest expense in the condensed consolidated statements of income.
NOTE 8 COMMITMENTS AND CONTINGENCIES
Operating leases
The Company leases certain facilities under operating lease agreements, which expire on various dates through August 2029 and require minimum annual rentals ranging from $1,000 to $446,000 per month. Certain of these leases provide for rent escalations and renewal options. For leases with stated rent escalations, the Company recognizes rent expense ratably over the lease term. The difference between the ratable rent expense and the amount paid is included in other liabilities in the condensed consolidated balance sheets. The majority of these leases obligate the Company to pay costs of maintenance, utilities and property taxes.
Rent expense for the nine months ended September 30, 2017 and October 1, 2016 was $10,993,000 and $10,082,000, respectively.
Legal matters
The Company is involved in various claims and legal actions arising in the ordinary course of business. In the opinion of management, the ultimate disposition of these matters will not have a material adverse impact on the Company’s financial position, results of operations or cash flows. As of September 30, 2017, there was no litigation or contingency with at least a reasonable possibility of a material loss either individually or in the aggregate.
NOTE 9 SUBSEQUENT EVENTS
The Company has evaluated all events or transactions that have occurred after the balance sheet date of September 30, 2017 through January 28, 2018, the date the condensed consolidated financial statements were available to be issued.
86
RSI HOME PRODUCTS, INC.
NOTES TO CONDENSED CONSOLIDATED FINANCIAL STATEMENTS — (Continued)
(Unaudited)
On November 30, 2017, American Woodmark Corporation (“Woodmark”) and the Company entered into an Agreement and Plan of Merger. On December 29, 2017, Woodmark consummated the previously announced acquisition of the Company. At the closing of the Acquisition, Woodmark assumed the Company’s indebtedness consisting primarily of the Company’s privately placed 6.5% Senior Secured Second Lien Notes due 2023 issued in March 2015.
On December 22, 2017, the Tax Cuts and Jobs Act (“The Act”), was signed into law by President Trump. The Act includes a number of provisions, including the lowering of the U.S. corporate tax rate from 35 percent to 21 percent, effective January 1, 2018 and the establishment of a territorial-style system for taxing foreign-source income of domestic multinational corporations. The Company is in the process of quantifying the tax impacts of The Act. As a result of The Act, the Company expects there will be one-time adjustments for the re-measurement of deferred tax assets (liabilities) and the deemed repatriation tax on the unremitted foreign earnings and profits. The Company is in the process of quantifying the impact of the Act.
87