Attached files
| file | filename |
|---|---|
| EX-32.2 - CERTIFICATION - Aly Energy Services, Inc. | alye_ex322.htm |
| EX-32.1 - CERTIFICATION - Aly Energy Services, Inc. | alye_ex321.htm |
| EX-31.2 - CERTIFICATION - Aly Energy Services, Inc. | alye_ex312.htm |
| EX-31.1 - CERTIFICATION - Aly Energy Services, Inc. | alye_ex311.htm |
| EX-10.5 - FORM OF STOCK OPTION AGREEMENT - Aly Energy Services, Inc. | alye_ex105.htm |
| EX-10.4 - 2017 STOCK OPTION PLAN - Aly Energy Services, Inc. | alye_ex104.htm |
| EX-10.3 - EMPLOYMENT AGREEMENT - Aly Energy Services, Inc. | alye_ex103.htm |
| EX-10.2 - EMPLOYMENT AGREEMENT - Aly Energy Services, Inc. | alye_ex102.htm |
| EX-10.1 - EMPLOYMENT AGREEMENT - Aly Energy Services, Inc. | alye_ex101.htm |
| EX-4.1 - SECOND AMENDED AND RESTATED CREDIT AGREEMENT - Aly Energy Services, Inc. | alye_ex41.htm |
| EX-2.3 - SECURITIES EXCHANGE AGREEMENT - Aly Energy Services, Inc. | alye_ex23.htm |
UNITED STATES
SECURITIES AND EXCHANGE COMMISSION
WASHINGTON, D.C. 20549
FORM 10-K
x Annual Report Pursuant to Section 13 or 15 (d) of the Securities Exchange Act of 1934
for the Period Ended December 31, 2016
or
¨ Transition Report Pursuant to Section 13 or 15 (d) of the Securities Exchange Act of 1934
for the Transition Period From ____________ to ____________
Commission File Number 33-92894
| ALY ENERGY SERVICES, INC. |
| (Exact name of registrant as specified in its charter) |
| Delaware |
| 75-2440201 |
| (State or other jurisdiction of |
| (I.R.S. Employer |
|
|
|
|
| 3 Riverway, Suite 920 |
| 77056 |
| (Address of Principal Executive Offices) |
| (Zip Code) |
(713)-333-4000
(Registrant’s Telephone Number, including area code.)
Securities registered pursuant to Section 12(b) of the Act:
| Title of Each Class | Names of Each Exchange on which Registered | |
| Common Stock, $0.001 par value per share | None |
Securities registered pursuant to Section 12(g) of the Act: None
Indicate by check mark if the registrant is a well-known seasoned issuer, as defined in Rule 405 of the Securities Act. Yes ¨ No x
Indicate by check mark if the registrant is not required to file reports pursuant to Section 13 or Section 15(d) of the Act. Yes x No ¨
Indicate by check mark whether the registrant (1) has filed all reports required to be filed by Section 13 or 15(d) of the Securities Exchange Act of 1934 during the preceding 12 months (or for such shorter period that the registrant was required to file such reports), and (2) has been subject to such filing requirements for the past 90 days. Yes ¨ No x
Indicate by check mark whether the registrant has submitted electronically and posted on its corporate Web site, if any, every Interactive Data File required to be submitted and posted pursuant to Rule 405 of Regulation S-T (§ 232.405 of this chapter) during the preceding 12 months (or for such shorter period that the registrant was required to submit and post such files). Yes ¨ No x
Indicate by check mark if disclosure of delinquent filers pursuant to Item 405 of Regulation S-K (§ 229.405 of this chapter) is not contained herein, and will not be contained, to the best of registrant’s knowledge, in definitive proxy or information statements incorporated by reference in Part III of this Form 10-K or any amendment to this Form 10-K. ¨
Indicate by check mark whether the registrant is a large accelerated filer, an accelerated filer, a non-accelerated filer, smaller reporting company or an emerging growth company. See the definitions of “large accelerated filer,” “accelerated filer,” “smaller reporting company,” and “emerging growth company” in Rule 12b-2 of the Exchange Act.
| Large accelerated filer | ¨ | Accelerated filer | ¨ | |
| Non-accelerated filer | ¨ | Smaller reporting company | x | |
| Emerging growth company | ¨ | |||
If an emerging growth company, indicate by check mark if the registrant has elected not to use the extended transition period for complying with any new or revised financial accounting standards provided pursuant to Section 13(a) of the Exchange Act. ¨
Indicate by check mark whether the registrant is a shell company (as defined in Rule 12b-2 of the Exchange Act). Yes ¨ No x
The aggregate market value of common stock held by non-affiliates of the registrant was approximately $0.9 million as of June 30, 2017, the last business day of the registrant’s most recently completed second fiscal quarter, based upon the closing sales price of the registrant’s common stock on that date.
At August 31, 2017, the registrant had 13,818,795 shares of common stock, $0.001 par value, outstanding.
Documents Incorporated by Reference: None
ALY ENERGY SERVICES, INC.
(A Delaware Corporation)
| 2 |
CAUTIONARY NOTE REGARDING FORWARD-LOOKING STATEMENTS
This Current Report on Form 10-K (this “Report”) contains certain statements and information that may constitute “forward-looking statements” within the meaning of Section 27A of the Securities Act of 1933, as amended (the “Securities Act”), and Section 21E of the Securities Exchange Act of 1934, as amended (the “Exchange Act”). The words “anticipate,” “believe,” “ensure,” “expect,” “if,” “intend,” “plan,” “estimate,” “project,” “forecasts,” “predict,” “outlook,” “aim,” “will,” “could,” “should,” “potential,” “would,” “may,” “probable,” “likely,” and similar expressions that convey the uncertainty of future events or outcomes, and the negative thereof, are intended to identify forward-looking statements. Forward-looking statements, which are not generally historical in nature, include those that express a belief, expectation or intention regarding our future activities, plans and goals and our current expectations with respect to, among other things:
· projected operating or financial results, including any accretion/dilution to earnings and cash flow; · any plans to obtain financing to fund future operations; · prospects for services and expected activity in potential and existing areas of operations; · the effects of competition in areas of operations; · the outlook of oil and gas prices; · the current economic conditions and expected trends in the industry we serve; · the amount, nature and timing of capital expenditures and availability of capital resources; · future financial condition or results of operations and future revenue and expenses; and · business strategy and other plans and objectives for future operations.
Forward-looking statements are not assurances of future performance and actual results could differ materially from our historical experience and our present expectations or projections. These forward-looking statements are based on management’s current expectations and beliefs, forecasts for our existing operations, experience, expectations and perception of historical trends, current conditions, anticipated future developments and their effect on us, and other factors believed to be appropriate. Although management believes the expectations and assumptions reflected in these forward-looking statements are reasonable as and when made, no assurance can be given that these assumptions are accurate or that any of these expectations will be achieved (in full or at all). Our forward-looking statements involve significant risks, contingencies and uncertainties, most of which are difficult to predict and many of which are beyond our control. Known material factors that could cause actual results to differ materially from those in the forward-looking statements include, but are not limited to, the following:
· conditions in the oil and natural gas industry, especially oil and natural gas prices and capital expenditures by oil and natural gas companies; · volatility in oil and natural gas prices; · fluctuations in the domestic land-based rig count; · changes in laws and regulations; · our ability to implement price increases or maintain pricing on our core services; · risks that we may not be able to reduce, and we may experience increases in, the costs of labor, fuel, equipment and supplies employed in our businesses; · industry capacity; · asset impairments or other charges; · the periodic low demand for our services and resulting operating losses and negative cash flows; · our highly competitive industry as well as operating risks, which are primarily self-insured, and the possibility that our insurance may not be adequate to cover all of our losses or liabilities; · significant costs and potential liabilities resulting from compliance with applicable laws, including those resulting from environmental, health and safety laws and regulations; · our historically high employee turnover rate and our ability to replace or add workers, including executive officers and skilled workers;
3 Table of Contents
· our ability to incur debt or long-term lease obligations; · our ability to implement technological developments and enhancements; · severe weather impacts on our business; · our ability to successfully identify, make and integrate future acquisitions and our ability to finance such acquisitions; · our ability to finance future growth of our operations through investments in new equipment and service offerings; · our ability to achieve the benefits expected from disposition transactions; · the loss of one or more of our larger customers; · our ability to generate sufficient cash flow to meet future debt service obligations; · our inability to achieve our financial, capital expenditure and operational projections, including quarterly and annual projections of revenue and/or operating income, and our inaccurate assessment of future activity levels, customer demand, and pricing stability which may not materialize (whether for Aly Energy Services, Inc. as a whole or for geographic regions and/or certain business operations individually); · business opportunities (or lack thereof) that may be presented to our company and may be pursued; · our ability to respond to changing or declining market conditions, including our ability to reduce the costs of labor, fuel, equipment and supplies employed and used in our businesses; · our ability to maintain sufficient liquidity; · adverse impact of litigation; and · other factors affecting our business described in “Item 1A. Risk Factors” in our Annual Report on Form 10-K for the year ended December 31, 2016 and in the other reports we file with the Securities and Exchange Commission.
Should one or more of the factors, risks or uncertainties described above materialize (or the other consequences of such a development worsen), or should underlying assumptions prove incorrect, actual results and plans could differ materially from those expressed in any forward-looking statements. You are cautioned not to place undue reliance on these statements, which speak only as of the date of this Report.
| 4 |
| Table of Contents |
General
Throughout this report, we refer to Aly Energy Services, Inc., together with its subsidiaries, as “we,” “our”, “us,” “Aly Energy” or “the Company.” References to financial results and operations of the Company are limited to continuing operations unless otherwise specified.
We provide a variety of oilfield services to owners and operators of oil and gas wells. Generally, these services fall within the category of surface rental equipment or solids control services.
On July 17, 2012, Munawar “Micki” Hidayatallah founded Aly Energy with the strategic objective of creating an oilfield services company that serves exploration and production companies from well planning to plug and abandonment. We have grown our business both through organic growth resulting from investment in existing operations and through the strategic acquisition of certain businesses operating in our industry.
To date, we have acquired three businesses:
· Austin Chalk Petroleum Services Corp. (“Austin Chalk”) - In October 2012, we acquired Austin Chalk a provider of high performance, explosion-resistant rental equipment used primarily in land-based horizontal drilling. Austin Chalk currently offers a robust inventory of surface rental equipment as well as roustabout services, including the rig-up and rig-down of equipment and the hauling of equipment to and from the customer’s location; · United Centrifuge LLC and the leased fixed assets associated with that business (collectively “United”) - United, acquired in April 2014, operates within the solids control sector of the oilfield services industry, offering its customers the option of renting centrifuges and auxiliary solids control equipment without personnel or the option of paying for a full-service solids control package which includes operators on-site 24 hours a day. United owns centrifuges which are differentiated from the competition due to the ability to remove the rotating assembly from a centrifuge within 45 minutes while on the rig site thereby minimizing customer down time; and · Evolution Guidance Systems Inc. (“Evolution”) - In July 2014, we acquired Evolution which specialized as an operator of Measurement-While-Drilling (“MWD”) downhole tools. Effective October 26, 2016, we abandoned these operations as a part of a restructuring event (see “Note 2 – Recent Developments” in the notes to our consolidated financial statements for further detail).
Business Outlook
Our core businesses depend on our customers’ willingness to make expenditures to produce, develop and explore for oil and natural gas. Industry conditions are influenced by numerous factors, such as oil and natural gas prices, the supply of and demand for oil and natural gas, domestic and worldwide economic conditions, political instability in oil producing countries and available supply of and demand for the services we provide. Oil and natural gas prices began a rapid and substantial decline in the fourth quarter of 2014. Depressed commodity price conditions persisted and worsened during 2015 and that trend continued into 2016. As a result, the rig count and demand for our products and services declined substantially, and the prices we are able to charge our customers for our products and services have also declined substantially. While we have reshaped our organizational and cost structure to mitigate the negative impact of these declines and to improve our ability to react to future declines, we continued to experience negative operating results and cash flows from operations through 2016.
Oil prices have improved off the low point of 2016 with the November 2016 decision by OPEC to curtail the cartel’s oil production, the Baker Hughes U.S. land drilling rig count has increased significantly from its low point in mid-2016, and our revenue has improved substantially during the first six months of 2017. We believe that stability in oil prices at an attractive price to our customers coupled with the increases in drilling activity during the first half of 2017 will result in further increases in demand for our services and will provide us opportunities to increase the price of our products and services, particularly in 2018. However, with increased demand for oilfield services broadly, the demand for qualified employees and the demand for the sub-rental equipment we require to increase our activity will increase and we may experience increases in costs which we cannot completely offset with price increases to our customers. As of June 30, 2017, based on our expectations of improved activity levels and pricing throughout the remainder of 2017 and 2018, we believe that we will be able to service our debt obligations and ongoing operations through operating cash flow and, if necessary, availability under our credit facility.
| 5 |
| Table of Contents |
Operational Restructuring
Our activity is tied directly to the rig count and, even though we instituted significant cost cutting measures beginning in 2015, we were unable to cut costs enough to match the decline in our business. As a result, as of December 31, 2015, we were in default of our credit agreement with Wells Fargo Bank, National Association (“Wells Fargo”).
Throughout 2015, in an effort to mitigate the significant declines in pricing and utilization of our equipment, we committed to a reorganization initiative to strengthen our sales and marketing efforts, consolidate support functions, and operate more efficiently. The reorganization effort included, but was not limited to, training our salesforce to enable the cross-selling of our product lines in certain geographical markets, sharing a common support services infrastructure across all reporting units, reducing headcount and wage rates, and rebranding and launching a new web site to increase awareness of our service lines. We recognized some benefit from these measures in late 2015 resulting in increased gross margins and lower selling, general and administrative expenses when compared to the first half of 2015.
During the year ended December 31, 2016, we entered into a series of forbearance agreements with our lender. Under the forbearance agreements, among other provisions, the lenders agreed to forbear from exercising their remedies under the credit agreement. These forbearance agreements permitted us to operate within the parameters of our normal course of business despite the continuing default under the credit agreement. Without these forbearance agreements, our outstanding debt would have been immediately due and payable. Throughout 2016, we remained in default and we did not have sufficient liquidity to repay all of the outstanding debt to the lender at any point during the year ($20.1 million as of December 31, 2015). As such, we may have been forced to file for protection under Chapter 11 of the U.S. Bankruptcy Code.
In early 2016, we were hopeful that a successful operational restructuring would facilitate negotiations to modify the terms of our existing credit facility with Wells Fargo. Our operational restructuring in 2016 consisted of severe cost cuts which were incremental to the year-over-year cost cuts already achieved in 2015 when compared to 2014. In 2016, significant cost savings were primarily generated by:
· reductions of our employee base, both field employees and sales and administrative employees, to a headcount of approximately 50 as of December 31, 2016 from approximately 125 as of December 31, 2015, · reduction in employer contributions to employee benefits, · closures of certain operating yards and administrative facilities, · strategic decision to cease operations in the northeast which resulted in the reduction of costs related to operating in an incremental market, · modifications to insurance policies, including general liability and workers’ compensation policies, resulting in a $0.5 million or 15.5% reduction in the cost of insurance to $0.6 million for the year ended December 31, 2016 from $1.1 million for the year ended December 31, 2015, · minimization of repair and maintenance activities, resulting in a $0.4 million or 50.0% reduction of repair and maintenance expenses to $0.4 million for the year ended December 31, 2016 from $0.8 million for the year ended December 31, 2015, and · elimination of investments in equipment, unless required to service an existing customer, resulting in a reduction of capital expenditures to $0.4 million for the year ended December 31, 2016 from $2.5 million for the year ended December 31, 2015.
We also achieved significant cost savings from the decrease in third party costs, such as sub-rental equipment and trucking, and other variable costs which declined with the decrease in activity.
In order to further support our working capital needs, we identified and sold idle and underutilized assets. During 2016, we realized aggregate proceeds from sales of approximately $0.8 million of which $0.5 million and $0.3 million was used to fund working capital needs and pay down debt, respectively (see “Note 4 – Reduction in Value of Assets and Other Charges” in the notes to our consolidated financial statements).
Capital Restructuring
Despite our successful operational restructuring efforts, particularly during the first half of 2016, the decline in our activity levels and the declines in customer pricing outpaced the impact of our cost reductions and it became evident that a capital restructuring would also be necessary to continue operations and position our business for an industry turnaround.
In the second quarter of 2016, certain of the Company’s principal stockholders (“Shareholder Group”) began negotiations with Wells Fargo with the objective of consummating a recapitalization transaction (the “Recapitalization”) whereby our obligations under the credit agreement and the outstanding capital leases in favor of Wells Fargo’s equipment finance affiliate and certain other obligations of Aly Energy (collectively the “Aly Senior Obligations”) would be restructured. In August 2016, the Shareholder Group was introduced to a third party, Tiger Finance, LLC (“Tiger”), to provide bridge financing and to extend forbearance until such date as sufficient capital could be raised to complete the Recapitalization.
| 6 |
| Table of Contents |
In September 2016, the Shareholder Group formed Permian Pelican, LLC (“Pelican”) with the objective of raising capital and executing the steps necessary to complete the restructuring, inclusive of successfully effecting the exchange of the Aly Operating redeemable preferred stock, Aly Centrifuge redeemable preferred stock, Aly Centrifuge subordinated debt and liability for a contingent payment into approximately 10% of our common stock on a fully diluted basis.
Effective January 31, 2017, the Recapitalization was completed through the execution and delivery of a Securities Exchange Agreement and a Second Amended and Restated Credit Agreement. As a result of the Recapitalization, the Company became a “Controlled Company” as defined under the listing standards of the principal national securities exchanges; however, since the Shareholder Group’s proportionate interest did not change significantly, a change in control did not occur and the transaction was accounted for at historical cost.
As a result of the Recapitalization, the credit facility, now with Pelican, consisted of a term loan of $5.1 million and a revolving credit facility of up to $1.0 million as of January 31, 2017. Availability under the revolving credit facility is determined by a borrowing base calculated as 80% of eligible receivables (receivables less than 90 days old).
Subsequent to the Recapitalization, we entered into several further amendments to capitalize on improved market conditions and increased activity in our business:
· Amendment No. 1, effective March 1, 2017, provided for a delayed draw term loan to be added to the credit facility for the purpose of financing capital expenditures. The agreement permitted us to draw on the delayed draw term loan from time-to-time up until the maturity date of the facility in order to fund up to 80% of the cost of capital expenditures subject to a $0.5 million limit on aggregate borrowings. · Amendment No. 2, effective May 23, 2017, increased the maximum revolving credit amount from $1.0 million to $1.8 million and extended the final maturity date of the facility to December 31, 2019. In consideration of the increase in the revolving credit facility and the extension of the final maturity date, we agreed to issue to Pelican, the lender, as an amendment fee, 1,200 shares of our Series A Convertible Preferred Stock. · Amendment No. 3, effective June 15, 2017, modified maximum potential borrowings under each of the revolving credit facility and the delayed draw term loan without changing the aggregate available borrowings under the credit facility. The amendment reduced the maximum revolving credit amount from $1.8 million to $1.0 million and increased the maximum delayed draw loan borrowings from $0.5 million to $1.3 million and the amendment also increased permitted draws on the delayed draw loan from 80% of the cost of capital expenditures being funded to 90% of the cost of capital expenditures being funded.
To the extent there is free cash flow as defined in the credit agreement, principal payments of 50% of such free cash flow are due annually. The maturity date of all remaining outstanding balances under the credit facility is December 31, 2019.
The obligations under the credit facility are guaranteed by all of our subsidiaries and secured by substantially all of our assets. The credit agreement contains customary events of default and covenants including restrictions on our ability to incur additional indebtedness, make capital expenditures, pay dividends or make other distributions, grant liens and sell assets. The credit facility does not include any financial covenants. We are in full compliance with the credit facility as of June 30, 2017.
As of June 30, 2017, there were outstanding borrowings of $5.0 million, $0.8 million, and $0.3 million on the term loan, revolving credit facility, and delayed draw term loan, respectively. As of June 30, 2017, we have the availability to borrow an incremental $0.2 million under the revolving credit facility and, if we have capital expenditures which are eligible to be financed, an incremental $1.0 million under the delayed draw term loan to finance 90% of such expenditures.
For a discussion of the accounting treatment for the Recapitalization, see “Note 2 – Recent Developments” in the notes to our consolidated financial statements included elsewhere in this document.
Strategy
Since 2012, we have made significant investments to expand operations and capitalize on organic growth opportunities in existing and expansion markets. We consistently seek opportunities to bundle product offerings and to cross sell services across markets and product lines, which we believe increases client retention and the utilization of our equipment.
| 7 |
| Table of Contents |
Our growth strategy focuses on pursuing organic growth and, when capital resources are available, acquiring existing businesses. The strategy consists of the following elements:
· increase inventory of rental products and increase capacity to provide services; · add new and differentiated product and service offerings; · expand into new geographic markets; and, · diversify and grow our customer base.
Products and Services
We are a provider of solids control systems and surface rental equipment. Our equipment and services are primarily designed for and used in land-based horizontal drilling. Our equipment includes centrifuges and auxiliary solids control equipment, mud circulating tanks (400 and 500 barrel capacity) and auxiliary surface rental equipment (e.g. portable mud mixing plants, and containment systems). In conjunction with the rental of some of our solids control packages, we provide personnel at the customer’s well site to operate our equipment. We also provide personnel to rig-up/rig-down and haul our equipment to and from the customer’s location.
Our Rental Products:
Centrifuges: We currently own approximately 54 centrifuges. We provide two different sizes of centrifuges to meet varying client specifications (i.e. SS1000 and SS2000). We believe our centrifuges provide a competitive advantage because the rotating assembly within each centrifuge can be removed and replaced on a customer’s well site within 45 minutes if it fails thereby minimizing downtime.
Mud Circulating Tanks (“MCTs”): We currently own approximately 60 vertical 400-barrel MCTs and approximately 125 500-barrel MCTs. We developed vertical 400-barrel MCTs as an innovative solution that minimizes location size, which we believe is an attractive feature for customers. The majority of our 500-barrel MCTs are highly mobile with rounded bottoms and customized jet-lines to ensure more consistent mud and easier cleanout at the completion of a job. In addition to the 500-barrel MCTs we own, we sub-rent 500-barrel MCTs (approximately 235 sub-rented as of June 30, 2017) in order to satisfy demand for our services. MCTs are typically rented to customers with auxiliary equipment such as diesel or electric mud pumps, hoses, and wooden mats.
Mud Mixing Plants (“MMPs”): We own 9 MMPs ranging in size from 100-barrel capacity to 500-barrel capacity. We believe that the large 400-barrel and 500-barrel capacity MMPs, which are designed and fabricated in-house, are unique and offer significant advantages to our customers.
Containment Systems: Containment systems consist of berms and plastic linings constructed to ensure that all products and chemicals present on the well site, particularly those which might be environmentally undesirable if spilled, are contained. We believe the demand for containment systems will continue to increase as environmental regulations tighten.
Solids control equipment rental: We provide a variety of solids control equipment used in and critical to wellsite activities including shakers, vertical dryers, waste removal units, and/or various tanks.
Our Service Offerings Which Include Personnel:
Solids Control Services: When a customer’s solids control operations are complex, we provide operators on-site 24 hours a day at an additional day rate. In these instances, we typically rent a full package of solids control equipment to the customer, which may include two centrifuges, shakers, vertical dryers, waste removal units, and/or various tanks.
Hauling of Equipment and Rig-Up/Rig-Down Services: We offer hauling of our rental equipment to the well site and rig-up/rig-down of such equipment.
Fabricating Capabilities
We fabricate certain equipment in our rental fleet, including 400-barrel MCTs and MMPs. Fabrication primarily takes place in our facility in Giddings, Texas. Items fabricated in-house are typically unique and we believe our ability to fabricate such products in-house provides us with cost efficiencies that result in a competitive advantage.
Geographic Markets
We operate primarily in Texas (West Texas and South Texas), Oklahoma, New Mexico, and Louisiana.
| 8 |
| Table of Contents |
Competition
We experience significant competition in our business. The markets in which we operate are highly fragmented and there are a large number of companies in these markets offering rental equipment and services that overlap with our offerings. We believe the principal differentiators among competitors in the sectors and markets in which we operate are safety record, service quality, existence of unique attributes of equipment that benefit the customer, customer relationships, response time and price.
The level of our revenue, earnings and cash flows are substantially dependent upon, and affected by, the level of U.S. oil and natural gas exploration, development and production activity, as well as the equipment capacity in any particular region.
Customers
We provide equipment and services to several well-known, established operators, such as EOG Resources, Inc., Pioneer Natural Resources, Sanchez Oil and Gas Corporation, Encana, Continental Resources, Inc. and Devon Energy Corporation.
For the years ended December 31, 2016 and 2015, our top three customers represented approximately 43.5% and 35.4% of total revenue, respectively.
If we are unable to continue to provide services to our top three existing customers and sales to new or other existing customers do not increase sufficiently, our business and operations could be materially adversely affected.
Raw Materials
We purchase a wide variety of raw materials, parts and components that are made by other manufacturers and suppliers for our use. We are not dependent on any single source of supply for those parts, supplies or materials.
Safety
Our record and reputation for safety is important to all aspects of our business. In the oilfield services industry, an important competitive factor in establishing and maintaining long-term customer relationships is having an experienced, skilled and well-trained work force. In recent years, many of our larger customers have placed an added emphasis on the safety records and quality management systems of their vendors.
We commit substantial resources toward employee safety and quality management. We believe our policies and procedures provide a solid framework to ensure our employees minimize the hazards inherent in our work environment, meet regulatory requirements and exceed customer expectations.
Employees
As of July 24, 2017, we employed approximately 50 individuals. The corporate cost center employs four individuals, including the chairman, the chief executive officer, the chief operating officer and the chief financial officer, approximately 40 individuals work primarily in the field, and the remaining employees provide selling, general, and administrative services. We believe we have good relationships with our employees.
| 9 |
| Table of Contents |
Seasonality
We have historically experienced a slowdown during the Thanksgiving and Christmas holiday seasons and demand in the fourth quarter sometimes slows during this period as our customers exhaust their annual spending budgets.
Intangibles
We are not dependent on any significant patents, trademarks, licenses, franchises, concessions, royalty agreements or labor contracts. In the last two years, we have not spent or incurred a material amount on research and development activities.
Governmental Regulation
Our business is impacted by federal, state and local laws and other regulations relating to the oil and natural gas industry, as well as laws and regulations relating to worker safety and environmental protection. We cannot predict the level of enforcement of existing laws and regulations or how such laws and regulations may be interpreted by enforcement agencies or court rulings, whether additional laws and regulations will be adopted, or the effect such changes may have on us, our business or financial condition.
In addition, our customers are impacted by laws and regulations relating to the exploration for and production of natural resources such as oil and natural gas. These regulations are subject to change, and new regulations may curtail or eliminate our customers’ activities in certain areas where we currently operate. We cannot determine the extent to which new legislation may impact our customers’ activity levels, and ultimately, the demand for our services.
Environmental Matters
Our operations, and those of our customers, are subject to extensive laws, regulations and treaties relating to air and water quality, generation, storage and handling of hazardous materials, and emission and discharge of materials into the environment. We believe we are in substantial compliance with all regulations affecting our business. Historically, our expenditures in furtherance of our compliance with these laws, regulations and treaties have not been material, and we do not expect the cost of compliance to be material in the future.
Access to Company Reports
We make available, free of charge, on our website, www.alyenergy.com, our annual report on Form 10-K, quarterly reports on Form 10-Q, current reports on Form 8-K, and all amendments to those reports on the same day as they are filed with the Securities and Exchange Commission.
| 10 |
| Table of Contents |
We face numerous risk factors. The following list contains risk factors that we believe are significant to our current and future operations. Additional risk factors that are either not known by us or that we currently deem immaterial may also impact our current and future operating results and financial condition.
Risks Related to Our Business
Our business depends on domestic drilling activity and spending by the oil and natural gas industry in the United States. From late 2014 through most of 2016, our business was severely negatively affected by the significant and rapid decline in domestic drilling activity. We may be adversely affected by industry conditions that are beyond our control in 2017 and beyond.
We depend on our customers’ willingness to make expenditures to explore for and to develop and produce oil and natural gas in the United States. Our customers’ willingness to undertake these activities depends largely upon prevailing industry conditions that are influenced by numerous factors over which management has no control, such as:
§ domestic and worldwide economic conditions; § the supply of and demand for oil and natural gas; § the level of prices, and expectations about future prices, of oil and natural gas; § the cost of exploring for, developing, producing and delivering oil and natural gas; § the expected rates of declining current production; § the discovery rates of new oil and natural gas reserves; § available pipeline, storage and other transportation capacity; § federal, state and local regulation of exploration and drilling activities; § weather conditions, including hurricanes that can affect oil and natural gas operations over a wide area; § political instability in oil and natural gas producing countries; § technical advances affecting energy consumption; § the price and availability of alternative fuels; § the ability of oil and natural gas producers to raise equity capital and debt financing; and, § merger and divestiture activity among oil and natural gas producers.
Current and anticipated oil and natural gas prices, the related level of drilling activity, and general production spending in the areas in which we have operations are the primary drivers of demand for our services. The level of oil and natural gas exploration and production activity in the United States is volatile and this volatility could have a material adverse effect on the level of activity by our customers. A reduction by our customers of activity levels from late 2014 through most of 2016 has caused and may continue to cause a decline in the demand for our services and has adversely affected and may continue to adversely affect the prices that we can charge or collect for our services. In addition, any prolonged substantial reduction in oil and natural gas prices would likely affect oil and natural gas production levels and, therefore, affect demand for the services we provide. Moreover, a decrease in the development rate of oil and natural gas reserves in our market areas, whether due to increased governmental regulation of or limitations on exploration and drilling activity or other factors, may also have an adverse impact on our business, even in an environment of stronger oil and natural gas prices.
From the second half of 2014 through most of 2016, oil prices declined dramatically resulting in a significant reduction in the land-based drilling rig count in the United States. Our customers have sought and received significant price reductions from us and our competitors in 2014, 2015 and 2016, which has materially adversely affected our financial results. Although we believe some oil and natural gas exploration and production companies, including our customers, are beginning to increase their drilling-related capital budgets in 2017, the timing and magnitude of a beneficial impact, if any, from this increase is highly uncertain.
Competition within the oilfield services industry may adversely affect our ability to market our services.
The oilfield services industry is competitive and fragmented and includes numerous small companies capable of competing in our markets on a local basis as well as several large companies that possess substantially greater financial and other resources than us. Some of our competitors hold significant market share in the markets in which we operate, which may make it difficult for us to successfully sell competing products and services. Our larger competitors may have greater resources which could allow them to compete more effectively than us and they may benefit from economies of scale which enable them to offer products and services at a lower cost than us. Our operations may be adversely affected if our current competitors or new market entrants introduce new products or services with better features, performance, prices or other characteristics, or that better address environmental concerns, than our products and services. Competitive pressures also may result in significant price competition that could have a material adverse effect on our results of operations and financial condition.
| 11 |
| Table of Contents |
We operate in a highly competitive industry, with intense price competition, which may intensify as our competitors expand their operations.
The market for oilfield services in which we operate is highly competitive and includes numerous small companies capable of competing effectively in our markets on a local basis, as well as several large companies that possess substantially greater financial resources than we do. Contracts are traditionally awarded on the basis of competitive bids or direct negotiations with customers. The principal competitive factors in our markets are product and service quality and availability, responsiveness, experience, equipment quality, reputation for safety and price. The competitive environment has intensified as recent mergers among exploration and production companies have reduced the number of available customers. The fact that drilling rigs and other vehicles and oilfield services equipment are mobile and can be moved from one market to another in response to market conditions heightens the competition in the industry. We may be competing for work against competitors that may be better able to withstand industry downturns and may be better suited to compete on the basis of price, retain skilled personnel and acquire new equipment and technologies, all of which could affect our revenue and profitability.
We may be unable to implement price increases or maintain existing prices on our core services.
We periodically seek to increase the prices of our services to offset rising costs and to generate higher returns for our stockholders. Currently, the prices we are able to charge for our services and the demand for such services are severely depressed. Even when industry conditions are favorable, we operate in a very competitive industry and, as a result, we are not always successful in raising, or maintaining, our existing prices. Additionally, during periods of increased market demand, a significant amount of new surface rental and solids control equipment may enter the market, which also puts pressure on the pricing of our services and limits our ability to increase or maintain prices. Furthermore, during periods of declining pricing for our services, we may not be able to reduce our costs accordingly, which could further adversely affect our profitability. Even when we are able to increase our prices, we may not be able to do so at a rate that is sufficient to offset such rising costs. In periods of high demand for oilfield services, a tighter labor market may result in higher labor costs. During such periods, our labor costs could increase at a greater rate than our ability to raise prices for our services. Also, we may not be able to successfully increase prices without adversely affecting our activity levels. The inability to maintain our prices or to increase our prices as costs increase could have a material adverse effect on our business, financial position and results of operations.
Increased prices charged by manufacturers of our products and/or interruptions in deliveries of products could adversely affect our profitability, margins, and revenue.
We depend upon a number of vendors for supplies and equipment. Increased prices charged by our manufacturers could materially and adversely impact our results of operations. In addition, interruptions or a work stoppage by our manufacturers could adversely affect our operations until arrangements with alternate suppliers could be made. Such alternate arrangements may be less favorable to us and could further adversely affect our results of operations.
We may not be able to grow successfully through future acquisitions or to integrate the businesses we do acquire effectively.
Our long-term business strategy includes growth through the acquisition of other businesses. However, we may not be able to identify attractive acquisition opportunities or successfully acquire identified targets on terms favorable to us in 2017 and beyond. Competition for acquisition opportunities may be substantial and may cause us to refrain from making acquisitions. In addition, we may not be successful in integrating future acquisitions into our existing operations, which may result in unforeseen operational difficulties, diminished financial performance or our inability to report financial results and may require a disproportionate amount of our management’s attention. If we fail to manage future acquisitions effectively, our results of operations could be adversely affected.
Acquisitions that we complete could present a number of risks, including but not limited to:
§ incorrect assumptions regarding the future results of acquired operations or assets or expected cost reductions or other synergies expected to be realized as a result of acquiring operations or assets; § failure to integrate the operations or management of any acquired operations or assets successfully and timely; § potential loss of key employees and customers of the acquired companies; § potential lack of experience operating in a geographic market or product line of the acquired business; § an increase in our expenses, particularly overhead expenses, and working capital requirements; § the possible inability to achieve the intended objectives of the business combination; and § the diversion of management’s attention from existing operations or other priorities.
| 12 |
| Table of Contents |
We may not realize the anticipated benefits of acquisitions or divestitures.
We continually seek opportunities to increase efficiency and value through various transactions, including purchases or sales of assets or businesses. These transactions are intended to result in the offering of new services or products, the entry into new markets, the generation of income or cash, the creation of efficiencies or the reduction of risk. Whether we realize the anticipated benefits from an acquisition or any other transactions depends, in part, upon our ability to timely and efficiently integrate the operations of the acquired business, the performance of the underlying product and service portfolio, and the management team and other personnel of the acquired operations. Accordingly, our financial results could be adversely affected from unanticipated performance issues, legacy liabilities, transaction-related charges, amortization of expenses related to intangibles, charges for impairment of long-term assets, credit guarantees, partner performance and indemnifications. In addition, the financing of any future acquisition completed by us could adversely impact our capital structure or increase our leverage. While we believe that we have established appropriate and adequate procedures and processes to mitigate these risks, there is no assurance that these transactions will be successful. We also may make strategic divestitures from time to time. These transactions may result in continued financial involvement in the divested businesses, such as guarantees or other financial arrangements, following the transaction. Nonperformance by those divested businesses could affect our future financial results through additional payment obligations, higher costs or asset write-downs. Except as required by law or applicable securities exchange listing standards, we do not expect to ask our shareholders to vote on any proposed acquisition or divestiture. Moreover, we generally do not announce our acquisitions or divestitures until we have entered into a preliminary or definitive agreement.
We may require additional capital in the future, which may not be available to us or the terms of such financings may negatively impact our business.
We may need to raise additional funds through debt or equity financings. Adequate funds may not be available when needed or may not be available on favorable terms. If funding is insufficient at any time in the future, we may be unable to support and grow our ongoing operations, meet our debt obligations, fund acquisitions, take advantage of business opportunities or respond to competitive pressures, any of which could materially and adversely affect our business.
Existing and future debt service requirements may impose a significant burden on us, which may adversely affect our results of operations and financial condition. In the future, we may incur debt which requires us to meet or maintain certain financial ratios, which could limit our flexibility and adversely affect our business.
Our near-term capital requirements will primarily depend on our ability to maintain adequate working capital levels and to maintain and refurbish our equipment fleet. Future capital requirements will primarily depend on the frequency, timing, size and success of future equipment purchases and business acquisitions.
We depend on significant customers for a substantial portion of our revenue.
We derive a significant amount of our revenue from exploration and production companies and drilling contractors that are active in our markets. For the year ended December 31, 2016, our top three customers accounted for approximately 43.5% of total revenue. If we fail to retain a number of our large existing customers or if we incur significant price reductions in order to retain the business of key customers, our business and operations could be adversely affected. Moreover, if any of these customers fails to remain competitive in their respective markets, encounters financial or operational problems or consolidates with a third party, our revenue and profitability may decline.
We are subject to the credit risk of our customers.
We provide credit to our customers in the normal course of business and generally do not require collateral in extending such credit. This exposure, coupled with material instances of default, could have an adverse effect on our business, financial condition, results of operations and cash flows. In addition, we may need to undertake collection efforts that could cause our business from certain customers to decline, or the collection of certain receivables could become impossible, requiring us to write them off. The current oilfield industry conditions are resulting in an increased number of bankruptcies among companies that could use our services, which may impact the demand for our services.
Historically, we have experienced a high employee turnover rate. Any difficulty we experience replacing or adding workers could adversely affect our business.
We believe that the high turnover rate in our industry is attributable to the nature of oilfield services work, which is physically demanding and performed outdoors. As a result, workers may choose to pursue employment in fields that offer a more desirable work environment at wage rates that are competitive with ours. The potential inability or lack of desire by workers to commute to our facilities and job sites, as well as the competition for workers from competitors or other industries, are factors that could negatively affect our ability to attract and retain workers. We may not be able to recruit, train and retain an adequate number of workers to replace departing workers. The inability to maintain an adequate workforce could have a material adverse effect on our business, financial condition and results of operations.
| 13 |
| Table of Contents |
If we are unable to attract and retain senior management, qualified sales personnel, and a sufficient number of field personnel, our operations, financial condition and prospects will be materially adversely affected.
Our future success depends in part on the contributions of our existing management team and key personnel and on our ability to attract and retain qualified new personnel. We cannot assure you that we will be able to retain our key senior managerial and sales personnel or that we will be able to attract, integrate and retain other such personnel that we may require in the future. If we are unable to attract and retain key personnel in the future, our business, operations, financial condition, results of operations and prospects could be materially adversely affected.
Companies in our industry, including us, are dependent upon the available labor pool of skilled employees. We compete with other oilfield services businesses and other employers to attract and retain qualified personnel with the technical skills and experience required to provide our customers with the highest quality service. We are also subject to the Fair Labor Standards Act, which governs such matters as minimum wage, overtime and other working conditions, and which can increase our labor costs or subject us to liabilities to our employees. A shortage in the labor pool of skilled workers or other general inflationary pressures or changes in applicable laws and regulations could make it more difficult for us to attract and retain personnel and could require us to enhance our wage and benefits packages. Labor costs may increase in the future or we may not be able to reduce wages when demand and pricing falls, and such changes could have a material adverse effect on our business, financial condition and results of operations.
Our future financial results could be adversely impacted by the further reduction in value of our assets or other charges.
We have recorded reductions in the value of our assets in the past. We periodically evaluate our long-lived assets, including our property and equipment, intangible assets, and goodwill for impairment. In performing these assessments, we project future cash flows on a discounted basis for goodwill, and on an undiscounted basis for other long-lived assets, and compare these cash flows to the carrying amount of the related assets. These cash flow projections are based on our current operating plans, estimates and other judgmental assumptions. We perform the assessment of potential impairment for our property and equipment whenever facts and circumstances indicate that the carrying value of those assets may not be recoverable due to various external or internal factors. If conditions in our industry do not improve or worsen, we could record additional impairment charges in future periods, which could have a material adverse effect on our financial position and results of operations. These cash flow projections are based on our current operating plans, estimates and judgmental assumptions. During 2016 and 2015, our continuing operations recorded $17.7 million and $11.4 million respectively, in a reduction in value of assets and, if conditions in our industry worsen or do not improve, we may record additional impairment charges in future periods, which could have a material adverse effect on our financial position and results of operations.
Severe weather could have a material adverse effect on our business.
Our business could be materially and adversely affected by severe weather. Our customers’ oil and natural gas operations located in Louisiana and parts of Texas may be adversely affected by hurricanes and tropical storms, resulting in reduced demand for our services. Furthermore, our customers’ operations may be adversely affected by seasonal weather conditions. Adverse weather can also directly impede our own operations. Repercussions of severe weather conditions may include:
|
| · | curtailment of services; |
|
| · | weather-related damage to facilities and equipment, resulting in suspension of operations; |
|
| · | inability to deliver equipment, personnel and products to job sites in accordance with contract schedules; and |
|
| · | loss of productivity. |
These constraints could delay our operations and materially increase our operating and capital costs. Unusually warm winters may also adversely affect the demand for our services by decreasing the demand for natural gas.
Our operations are subject to hazards inherent in the oil and natural gas industry.
The operational risks inherent in our industry could expose us to substantial liability for personal injury, wrongful death, property damage, loss of oil and natural gas production, pollution and other environmental damages. The frequency and severity of such incidents will affect our operating costs, insurability and relationships with customers, employees and regulators. In particular, our customers may elect not to retain our services if they view our safety record as unacceptable, which could cause us to lose substantial revenue.
| 14 |
| Table of Contents |
We do not have insurance against all foreseeable risks, either because insurance is not available or because of the high premium costs. We evaluate certain of our risks and insurance coverage annually. After carefully weighing the costs, risks, and benefits of retaining versus insuring various risks, we occasionally opt to retain certain risks not covered by our insurance policies. The occurrence of an event not fully insured against, or the failure of an insurer to meet its insurance obligations, could result in substantial losses. In addition, we may not be able to maintain adequate insurance in the future at rates we consider reasonable and there can be no assurance that insurance will be available to cover any or all of these risks, or, even if available, that it will be adequate or that insurance premiums or other costs will not rise significantly in the future, so as to make such insurance costs prohibitive. In addition, our insurance is subject to coverage limits and some policies exclude coverage for damages resulting from environmental contamination.
We are subject to federal, state and local regulation regarding issues of health, safety and protection of the environment. Under these regulations, we may become liable for penalties, damages or costs of remediation. Any changes in laws and government regulations could increase our costs of doing business.
Our operations and the operations of our customers are subject to extensive and frequently changing regulation. More stringent legislation or regulation or taxation of drilling activity could directly curtail such activity or increase the cost of drilling, resulting in reduced levels of drilling activity and therefore reduced demand for our services. Numerous federal, state and local departments and agencies are authorized by statute to issue, and have issued, rules and regulations binding upon participants in the oil and gas industry. Our operations and the markets in which we participate are affected by these laws and regulations and may be affected by changes to such laws and regulations in the future, which may cause us to incur materially increased operating costs or realize materially lower revenue, or both.
Laws protecting the environment generally have become more stringent over time and are expected to continue to do so, which could lead to material increases in costs for future environmental compliance and remediation. The modification or interpretation of existing laws or regulations, or the adoption of new laws or regulations, could curtail exploratory or developmental drilling for oil and natural gas and could limit well site services opportunities. Additionally, environmental groups have advocated increased regulation in certain areas in which we currently operate or in which we may operate in the future. These initiatives could lead to more stringent permitting requirements, increased regulation, possible enforcement actions against the regulated community, and a moratorium or delays on permitting, which could adversely affect our well site service opportunities.
Some environmental laws and regulations may impose strict liability, which means that in some situations we could be exposed to liability as a result of our conduct that was lawful at the time it occurred as a result of conduct of, or conditions caused by, prior operators or other third parties. Clean-up costs and other damages, arising as a result of environmental laws, and costs associated with changes in environmental laws and regulations could be substantial and could have a material adverse effect on our financial condition. In addition, the occurrence of a significant event not fully insured or indemnified against could have a material adverse effect on our financial condition and operations.
Increased regulation of hydraulic fracturing could result in reductions or delays in oil and gas production by our customers, which could adversely impact our revenue.
A significant portion of our customers’ oil and gas production is developed from unconventional sources, such as shales, that require hydraulic fracturing as part of the completion process. Hydraulic fracturing involves the injection of water, sand and chemicals under pressure into the formation to stimulate gas production. We do not engage in any hydraulic fracturing activities although many of our customers do. If additional levels of regulation and permits were required through the adoption of new laws and regulations at the federal or state level that could lead to delays, increased operating costs and prohibitions for our customers, such regulations could reduce demand for our services and materially adversely affect our results of operations.
Climate change legislation, regulatory initiatives and litigation could result in increased operating costs and reduced demand for the services we provide.
In recent years, the U.S. Congress has considered legislation to restrict or regulate emissions of greenhouse gases, or GHGs, such as carbon dioxide and methane that may be contributing to global warming. In addition, almost half of the states, either individually or through multi-state regional initiatives, have begun to address GHG emissions, primarily through the planned development of emission inventories or regional GHG cap and trade programs.
Although it is not possible at this time to accurately estimate how potential future laws or regulations addressing GHG emissions would impact our business, either directly or indirectly, any future federal or state laws or implementing regulations that may be adopted to address GHG emissions could require us to incur increased operating costs and could adversely affect demand for the natural gas our customers extract using our services. Moreover, incentives to conserve energy or use alternative energy sources could reduce demand for oil and natural gas, resulting in a decrease in demand for our services. We cannot predict with any certainty at this time how these possibilities may affect our operations.
| 15 |
| Table of Contents |
We may be subject to litigation, which, if adversely determined, could result in substantial losses.
We may be, from time-to-time, during the ordinary course of business, subject to various litigation claims and legal disputes, including contract, lease, employment, and regulatory claims. Certain litigation claims may not be covered entirely or at all by our insurance policies or our insurance carriers may seek to deny coverage or impose significant deductibles. In addition, litigation claims can be expensive to defend and may divert our attention from the operations of our business. Further, litigation, even if without merit, can attract adverse media attention. As a result, litigation can have a material adverse effect on our business, financial condition, results of operations, and cash flows and, because we cannot predict the outcome of any action, it is possible that adverse judgments or settlements could significantly reduce our earnings or result in losses.
Governmental taxation policies could adversely affect our business, financial condition, and results of operations.
Substantive changes in federal and state tax laws could materially and adversely affect our results of operations. In addition, the final determination of our income tax liabilities involves the interpretation of various federal and state laws and regulations, as well as the significant use of estimates and assumptions regarding the scope of past, current and future operations and results achieved and the timing and nature of income earned and expenditures incurred. Changes in the operating environment, including changes in or interpretation of tax law and currency/repatriation controls, could affect the determination of our income tax liabilities for a tax year.
If we fail to maintain an effective system of internal control over financial reporting, we may be unable to accurately report our financial results or prevent fraud, and investor confidence in our company and the market price of our common stock may be adversely affected.
Our reporting obligations as a public company place a significant strain on our management, operational and financial resources and systems. We may experience difficulty in maintaining management, legal and financial controls, collecting financial data and preparing financial statements, books of account and corporate records and instituting business practices required for us as a publicly traded and reporting company. It may be difficult to design and implement effective internal control over financial reporting for combined operations following the addition of other businesses which we may acquire in the future. In addition, differences in existing controls of acquired businesses may result in weaknesses that require remediation when internal controls over financial reporting are combined.
As directed by Section 404 of the Sarbanes-Oxley Act of 2002, we would be required to include a report from management on the effectiveness of our internal control over financial reporting in our annual reports once we ceased to be a “smaller reporting company” under applicable SEC rules. Although we are not required to assess internal control over financial reporting, we have included such report in this filing.
In connection with our report from management on the effectiveness of our internal control over financial reporting, management identified certain control deficiencies that represent material weaknesses as of December 31, 2016. Due to these material weaknesses, our management has concluded that our internal control over financial reporting is not effective. This conclusion could adversely impact the market price of our common stock due to a loss of investor confidence in the reliability of our reporting processes.
| 16 |
| Table of Contents |
Risks Related to Debt
Our indebtedness, which is currently collateralized by substantially all of our assets, could restrict our operations and make us more vulnerable to adverse economic conditions.
Our credit agreement with Pelican, and any replacement or future indebtedness, could have important consequences to our stockholders. For example, it could:
§ require us to maintain compliance under various covenants which are not achievable in light of current industry conditions; § require us to raise additional capital; § impair our ability to make investments and obtain additional financing for working capital, capital expenditures, acquisitions or other general corporate purposes; § limit our ability to use operating cash flow in other areas of our business because we must dedicate a substantial portion of these funds to make principal and interest payments on our indebtedness; § make us more vulnerable to a downturn in our business, our industry or the economy in general as a substantial portion of our operating cash flow will be required to make principal and interest payments on our indebtedness, making it more difficult to react to changes in our business and in industry and market conditions; or, § put us at a competitive disadvantage to competitors that have less debt.
We may not be able to generate sufficient cash flow to meet our debt service and other obligations.
Our ability to make payments on our indebtedness and fund planned capital expenditures depends on our ability to generate cash flow. Due to the cyclical nature of the industry we operate in, our cash flow from operations can vary significantly from year to year. Consequently, our cash flow may be insufficient to service our debt and that could negatively impact our business, financial condition and results of operations. During 2015 and 2016, our cash flow from operations was not sufficient to service our debt based upon how our credit agreement was structured at the time.
During fiscal year 2016, we had negative cash flows from operations, and this trend could continue if conditions in our industry continue or worsen. If that situation were to recur, we might need to sell assets, seek additional equity or change our business direction to service our debt and there can be no assurance that we could execute these actions in a timely manner sufficient to allow us to service our debt.
Our variable rate indebtedness subjects us to interest rate risk, which could cause our debt service obligations to increase significantly.
Borrowings under our credit agreement with Pelican bear interest at variable rates, exposing us to interest rate risk. We have decided not to hedge against the interest rate risk associated with the borrowings under our credit facility. As such, our debt service obligations could increase significantly in the event of large increases in interest rates.
Risks Related to Ownership of our Common Stock
The concentration of our capital stock ownership limits the ability of other stockholders to influence corporate matters.
As a result of the Recapitalization, Pelican owns 100% of our outstanding Series A Convertible Preferred Stock, which represents the substantial majority of our fully diluted capital stock. Pelican further owns virtually all of our secured debt, which aggregated to $20.2 million and $6.1 million as of December 31, 2016 and June 30, 2017, respectively. This significant concentration of share ownership may adversely affect the trading price for our common stock because investors often perceive disadvantages in owning stock in companies with controlling stockholders. Also, subject to certain SEC regulations and if Pelican were to convert the preferred stock, Pelican could begin selling shares of our common stock. These sales, or the market perception that the holders of a large number of shares intend to sell shares, could reduce the market price of our common stock.
In addition, Pelican will be able to control our management and affairs and matters requiring stockholder approval, including the election of directors and the approval of significant corporate transactions, such as mergers, consolidations or the sale of substantially all of our assets. Consequently, this concentration of ownership will have the effect of delaying or preventing a change of control, including a merger, consolidation or other business combination involving us, or discouraging a potential acquirer from making a tender offer or otherwise attempting to obtain control, even if that change of control would benefit our other stockholders.
| 17 |
| Table of Contents |
As a “controlled company” under the rules of the national securities exchanges, our stockholders will not have all of the corporate governance protections customarily available to stockholders of other publicly held companies.
A company in which over 50% of the voting power is held by a single company qualifies as a “controlled company” under the listing standards of the principal national securities exchanges and, as such, is exempt from compliance with certain corporate governance requirements generally applicable to publicly traded companies. In the event that we are able to cause our common stock to be listed by a national securities exchange, we will be entitled, and would intend, to qualify as a “controlled company” under those listing standards. As such, we would be exempt from compliance with requirements that (1) a majority of our Board of Directors consist of independent directors, (2) we have a nominating/corporate governance committee that is composed entirely of independent directors with a written charter addressing the committee’s purpose and responsibilities, (3) we have a compensation committee that is composed entirely of independent directors with a written charter addressing the committee’s purpose and responsibilities and (4) we perform an annual performance evaluation of the nominating/corporate governance committee and compensation committee. We would intend to utilize these exemptions while we are a controlled company. As a result, we will not have a majority of independent directors nor will we establish a nominating and corporate governance committee or a compensation committee. Accordingly, our stockholders will not have all of the corporate governance protections that are customarily available to stockholders of publicly held companies which are not “controlled companies.”
The Recapitalization resulted in substantial dilution to our stockholders, and future issuances will result in additional dilution.
Consummation of the Recapitalization resulted in substantial dilution to our existing stockholders, whose aggregate percentage ownership declined from 100% to 9.9%. Further, we may need to raise significant additional funds through equity financings to repay debt, to expand our operations or to execute our acquisition strategy. Holders of our common stock could experience substantial dilution if we issue additional capital stock in the future. Our future capital requirements will primarily depend on our ability to service our debt from operating cash flow and the frequency, timing, and size of future growth opportunities.
Certain provisions of our corporate documents and Delaware law, as well as change of control provisions in our debt agreements, could delay or prevent a change of control, even if that change would be beneficial to stockholders, or could have a material negative impact on our business.
Certain provisions in our certificate of incorporation, bylaws and debt agreements may have the effect of deterring transactions involving a change in control, including transactions in which stockholders might receive a premium for their shares.
In addition to the risks of having a controlling stockholder as described in the risk factor “The concentration of our capital stock ownership limits the ability of other stockholders to influence corporate matters,” our certificate of incorporation provides authorization to issue up to 10,000,000 shares of preferred stock with such designations, rights and preferences as may be determined from time to time by our board of directors. The authorization of preferred shares empowers our board, without further stockholder approval, to issue preferred shares with dividend, liquidation, conversion, voting or other rights which could adversely affect the voting power or other rights of the holders of the common stock. If issued, the preferred stock could also dilute the holders of our common stock and could be used to discourage, delay or prevent a change of control.
We are also a Delaware corporation subject to Section 203 of the Delaware General Corporation Law (the “DGCL”). In general, Section 203 of the DGCL prevents an “interested stockholder” (as defined in the DGCL) from engaging in a “business combination” (as defined in the DGCL) with us for three years following the date that person becomes an interested stockholder unless one or more of the following occurs:
|
| · | Before that person became an interested stockholder, our board of directors approved the transaction in which the interested stockholder became an interested stockholder or approved the business combination; |
|
| · | Upon consummation of the transaction that resulted in the interested stockholder becoming an interested stockholder, the interested stockholder owned at least 85% of our voting stock outstanding at the time the transaction commenced, excluding for purposes of determining the voting stock outstanding stock held by certain directors and employee stock plans; or |
|
| · | Following the transaction in which that person became an interested stockholder, the business combination is approved by our board of directors and authorized at a meeting of stockholders by the affirmative vote of the holders of at least 66 2/3% of our outstanding voting stock not owned by the interested stockholder. |
| 18 |
| Table of Contents |
The DGCL generally defines “interested stockholder” as any person who, together with affiliates and associates, is the owner of 15% or more of our outstanding voting stock or is our affiliate or associate and was the owner of 15% or more of our outstanding voting stock at any time within the three-year period immediately before the date of determination.
All of these factors could materially adversely affect the price of our common stock.
Because we have no current plans to pay dividends on our common stock, investors must look solely to stock appreciation for a return on their investment in us.
We do not anticipate paying any cash dividends on our common stock in the foreseeable future. We currently intend to retain all future earnings to service debt and fund the development and growth of our business. Any payment of future dividends will be at the discretion of our board of directors and will depend on, among other things, our earnings, financial condition, capital requirements, level of indebtedness, statutory and contractual restrictions applying to the payment of dividends and other considerations that the board of directors deems relevant. For example, our credit agreement limits our ability to pay dividends. Investors may need to rely on sales of their common stock after price appreciation, which may never occur, as the only way to realize a return on their investment. Investors seeking cash dividends should not purchase our common stock.
Because our common stock is subject to the “penny stock” rules, brokers cannot generally solicit the purchase of our common stock, which adversely affects its liquidity and market price.
The SEC has adopted regulations, which generally define “penny stock” to be an equity security that has a market price of less than $5.00 per share, subject to specific exemptions. The market price of our common stock on the Over-The-Counter Bulletin Board (“Bulletin Board”) is substantially less than $5.00 per share and therefore we are considered a “penny stock” according to SEC rules. This designation requires any broker-dealer selling these securities to disclose certain information concerning the transaction, obtain a written agreement from the purchaser and determine that the purchaser is reasonably suitable to purchase the securities. These rules limit the ability of broker-dealers to solicit purchases of our common stock and therefore reduce the liquidity of the public market for our shares.
Moreover, as a result of apparent regulatory pressure from the SEC and the Financial Industry Regulatory Authority, a growing number of broker-dealers decline to permit investors to purchase and sell or otherwise make it difficult to sell shares of penny stocks. This may have a depressive effect upon our common stock price.
Due to factors beyond our control, our stock price may be volatile.
The market price of our common stock can be affected by:
|
| § | actual or anticipated variations in our results of operations; |
|
| § | changes in earnings estimates; or |
|
| § | changes in market valuations of similar companies. |
Item 1B: Unresolved Staff Comments
None.
| 19 |
| Table of Contents |
Our corporate headquarters are located at 3 Riverway, Suite 920, Houston, Texas, 77056 and consist of approximately 2,291 square feet of office space under a lease that expires on January 31, 2020. This facility accommodates our executive offices.
We lease facilities and administrative offices in the various geographic areas in which we operate. We believe that our existing facilities are suitable and adequate and that we have sufficient capacity to meet our current anticipated needs. As of June 30, 2017, we leased properties in Texas and Pennsylvania as follows:
| Location |
| Type of Facility |
| Size |
| Lease or Owned |
| Expiration of Lease |
|
| ||||||||
| 3 Riverway, Suite 920 Houston, TX 77056 |
| Corporate office |
| 2,291 sq. ft. |
| Leased |
| January 31, 2020 |
|
| ||||||||
| 1080 Private Rd 7703 Giddings, TX 78942 |
| Administrative offices, fabrication/repair shop, equipment yard |
| 6.5 acres, 3,600 sq. ft. office space, 5,000 sq. ft. shop |
| Leased |
| December 31, 2017 |
|
| ||||||||
| 6126 PR 902 Celina, TX 75009 |
| Fabrication/repair shop, equipment yard |
| 1,813 sq. ft. office space, 5,518 sq. ft. shop |
| Leased |
| July 1, 2018 |
|
| ||||||||
| 792 McCollum Rd. Montrose, PA 18801 |
| Administrative offices, equipment yard |
| Small acreage site |
| Leased |
| September 30, 2017 |
|
| ||||||||
| 12 Free Soil Rd. Mt Morris, PA 15349 |
| Equipment yard |
| Small acreage site |
| Month to Month |
| N/A |
|
| ||||||||
| State Hwy. 85 West/CR 4715 Dilley, TX 78017 |
| Administrative offices, fabrication/repair shop, equipment yard |
| 5.5 acres, 400 sq. ft. building space |
| Month to Month |
| N/A |
|
| ||||||||
| 5039 North Chadbourne San Angelo, TX 76903 |
| Administrative offices, equipment yard |
| 2.25 acres, 1,000 sq. ft. of office space |
| Leased |
| May 31, 2018 |
During 2016, we abandoned a lease in connection with our operational restructuring efforts. There were no cancellation, transfer or assignment charges in the years ended December 31, 2016 and 2015.
During 2017, our lease for the office and shop space utilized by our discontinued operations was assumed by a third party. During the third quarter of 2017, we will cease leasing properties in Celina, Texas, Montrose, Pennsylvania, and Mt. Morris, Pennsylvania. The idle equipment previously stored at these facilities will be transported to Texas to satisfy increasing customer demand. We do not anticipate any cancellation, transfer or assignment charges will be incurred.
| 20 |
| Table of Contents |
In 2015, we ceased compensating our employees on a day rate basis in order to ensure full compliance with the Fair Labor Standards Act (“FLSA”). Certain former employees of Aly Centrifuge, Inc. who were paid a day rate for their work prior to February 2015 alleged that we failed to pay overtime when they worked over 40 hours per week. During the years ended December 31, 2016 and 2015, certain of these employees pursued legal action against us based on such allegations:
· In February 2015, multiple plaintiffs filed a proposed collective action against us alleging overtime violations under the FLSA. We settled this matter for business purposes with no admission of liability. The settlement amount was fully accrued as of December 31, 2015 and the case was fully paid and dismissed with prejudice, by the end of January 2016. · In August 2016, several former employees filed a lawsuit against us alleging overtime violations of the FLSA. In May 2017, we settled the matter for business purposes with no admission of liability. The settlement amount was fully accrued as of December 31, 2016 and, as of June 30, 2017, the settlement was fully paid and the case had been dismissed with prejudice. · We are currently in the early stages of arbitration with five prior employees who allege overtime violations of the FLSA. We are exploring settlement options to resolve this matter as well as preparing to defend the arbitration should settlement not be feasible. An estimated settlement amount was fully accrued as of December 31, 2016.
The Company entered into certain employment agreements in connection with the acquisition of United and Evolution in 2014 which provided for specified severance obligations of the Company in the event of a termination of employment of the subject employees. The Company also entered into a similar employment agreement in 2014 in connection with the recruitment of an additional employee for the solids control operations. During 2015 and 2016, the employment of these individuals terminated, and the Company did not pay the severance obligations that were contemplated by the employment agreements in the event that the cessation of employment would be determined to have been a termination by the Company “without cause.” As of December 31, 2016, the aggregate unpaid severance obligation under these agreements was approximately $0.7 million.
We are subject to various other legal proceedings and claims incidental to or arising in the ordinary course of our business. While many of these matters involve inherent uncertainty, we believe that the liability, if any, ultimately incurred with respect to such proceedings and claims will not have a material adverse effect on our consolidated financial position as a whole or on our liquidity, capital resources or results of operations. We will continue to evaluate proceedings and claims involving us on a quarter-by-quarter basis and will establish and adjust any reserves as appropriate to reflect our assessment of the then-current status of the matters.
Item 4. Mine Safety Disclosures
Not Applicable.
| 21 |
| Table of Contents |
Market Information
Commencing May 23, 2013, our common stock was listed on the OTCQB under the symbol “ALYE.” We became delinquent in our filings with the SEC in August 2016. Due to the lack of publicly available financial information, OTCQB subsequently moved the listing of our common stock to OTC Pink and, as of May 1, 2017, ceased to list our common stock.
The following table indicates the quarterly high and low bid price for our common stock on the OTCQB and OTC Pink for the years ended December 31, 2016 and 2015 and for the period from January 1, 2017 to May 1, 2017. Such inter-dealer quotations do not necessarily represent actual transactions and do not reflect retail mark-ups, markdowns or commissions.
| Fiscal Year 2017 |
| High |
|
| Low |
| ||
|
|
|
|
|
|
|
| ||
| 2nd Quarter (April 1 - May 1, 2017) |
| $ | 0.08 |
|
| $ | 0.03 |
|
| 1st Quarter (January 1 - March 31, 2017) |
| $ | 0.12 |
|
| $ | 0.01 |
|
|
|
|
|
|
|
|
|
|
|
| Fiscal Year 2016 |
| High |
|
| Low |
| ||
|
|
|
|
|
|
|
|
|
|
| 4th Quarter (October 1 - December 31, 2016) |
| $ | 0.08 |
|
| $ | 0.01 |
|
| 3rd Quarter (July 1 - September 30, 2016) |
| $ | 0.11 |
|
| $ | 0.08 |
|
| 2nd Quarter (April 1 - June 30, 2016) |
| $ | 0.20 |
|
| $ | 0.09 |
|
| 1st Quarter (January 1 - March 31, 2016) |
| $ | 1.00 |
|
| $ | 1.00 |
|
|
|
|
|
|
|
|
|
|
|
| Fiscal Year 2015 |
| High |
|
| Low |
| ||
|
|
|
|
|
|
|
|
|
|
| 4th Quarter (October 1 - December 31, 2015) |
| $ | 2.00 |
|
| $ | 0.80 |
|
| 3rd Quarter (July 1 - September 30, 2015) |
| $ | 4.80 |
|
| $ | 2.00 |
|
| 2nd Quarter (April 1 - June 30, 2015) |
| $ | 6.40 |
|
| $ | 4.80 |
|
| 1st Quarter (January 1 - March 31, 2015) |
| $ | 14.60 |
|
| $ | 5.60 |
|
The last reported sales price of our common stock on the OTC Pink was on May 1, 2017 for $0.08 per share.
Our peer group includes, but is not limited to, the following companies: Basic Energy Services Inc., ENSERVCO Corporation, Flotek Industries, Inc., Key Energy Services, Inc., Oil States International, Inc., and Superior Energy Services, Inc.
Holders
The number of holders of record of our common stock as of July 24, 2017 was 89. This number does not include an undetermined number of stockholders whose stock is held in “street” or “nominee” name.
Dividends
In the past, we have not distributed earnings to our common stockholders. Our board of directors has complete discretion on whether to pay dividends and, as such, will make any future decisions regarding dividends. We currently intend to retain and use any future earnings for servicing our debt and for developing and expanding our business and we do not anticipate paying any cash dividends in the foreseeable future. Even if our board of directors decides to pay dividends, the form, frequency and amount will depend upon our future operations and earnings, capital requirements and surplus, general financial condition, contractual restrictions and other factors that the board of directors may deem relevant.
| 22 |
| Table of Contents |
Stock Options
As of December 31, 2016 and 2015, we had a stock-based compensation plan available to grant incentive stock options, non-qualified stock options and restricted stock to employees and non-employee members of the board of directors.
As of December 31, 2016 and 2015, options to purchase 242,507 and 330,111 common shares under the Plan were outstanding and $0.3 million and $0.5 million of total unrecognized compensation cost related to non-vested stock option awards, respectively. Such amount will be recognized in the future upon occurrence of a Liquidity Event that results in a vesting of the options. No options were granted during the years ended December 31, 2016 and 2015. No options were vested as of December 31, 2016 and 2015. During the year ended December 31, 2016 forfeited options totaled 87,604. There were no forfeited options during the year ended December 31, 2015.
Effective April 4, 2017, the 2017 Stock Option Plan (the “2017 Plan”) was approved by the board of directors. On May 30, we granted approximately 16.9 million common shares under the 2017 Plan which was the maximum amount authorized. The option contract term is 10 years and the exercise price is $0.10. The options vested and became exercisable immediately upon grant. The Company is in the process of determining the value of these options.
Recent Sales of Unregistered Securities
On May 23, 2017 and in consideration of the increase in the revolving credit facility and the extension of the final maturity date, the Company agreed to issue Pelican an amendment fee of 1,200 shares of our Series A Convertible Preferred Stock.
On January 31, 2017, we completed the Recapitalization which resulted in the issuance of 7,111,981 shares of our common stock to the former holders of Aly Operating redeemable preferred stock, Aly Centrifuge redeemable preferred stock, Aly Centrifuge subordinated debt, and liability for contingent payment (an aggregate of six individual entities and persons).
On January 31, 2017, we issued 16,092 shares of our Series A Convertible Preferred Stock to Pelican in exchange for a $16.1 million reduction of the Aly Senior Obligations which Pelican acquired on December 12, 2016 in connection with the Recapitalization.
We issued 82,649 shares of our common stock during the year ended December 31, 2015, to one of our directors in respect of his arrangement of certain issuances of common stock.
On September 30, 2015, we closed a private offering and issued 1,047,424 shares of our common stock to multiple accredited investors at a price of $3.20 per share.
On January 12, 2015, we issued 50,000 shares of our common stock in a private placement at a price of $11.00 per share for gross proceeds of approximately $0.6 million. The proceeds were used for general working capital requirements.
Equity Repurchases
We have not repurchased any of our equity securities during the past two years; however, as of December 31, 2016 and 2015, we held 225 shares of treasury stock.
Authorized Shares
As of August 31, 2017, we have approximately 13.8 million shares of common stock outstanding.
On May 18, 2016, we filed an amendment to our certificate of formation reducing our authorized common stock from 100 million to 25 million shares and also reducing our authorized preferred stock from 25 million shares to 10 million shares.
On December 21, 2015, we filed an amendment to our certificate of formation reducing our authorized common stock from 200 million to 100 million shares and also authorizing 25 million shares of preferred stock to be issued in one or more series.
Common Authorized Shares. Authorized common shares total 25,000,000 with a par value of $0.001 per share, of which, 6,707,039 and 6,706,814 were issued and outstanding, respectively as of December 31, 2016 and 6,707,039 and 6,706,814 were issued and outstanding, respectively as of December 31, 2015. Common stock held in treasury as of December 31, 2016 and 2015 were 225 shares.
| 23 |
| Table of Contents |
On January 31, 2017, we completed the Recapitalization which resulted in the issuance of 7,111,981 shares of our common stock to the former holders of Aly Operating redeemable preferred stock, Aly Centrifuge redeemable preferred stock, Aly Centrifuge subordinated debt, and liability for contingent payment (an aggregate of six individual entities and persons).
Preferred Authorized Shares. Authorized preferred shares total 10,000,000 with a par value of $0.001 per share, of which, none were issued and outstanding as of December 31, 2016 and 2015.
As a result of the Recapitalization, the Company allocated 20,000 of its authorized shares from available authorized preferred shares to Series A Convertible Preferred Stock and issued 16,092 shares on January 31, 2017. The Series A Convertible Preferred Stock have a par value of $0.001 per share, a face value of $16.1 million, which have no determinable market value as of January 31, 2017. The conversion feature provides that each Series A Convertible Preferred share shall be convertible into 3332.64 common shares at the option of the shareholder and retains a liquidation preference equal to $1,000 per share. All shares vote on an as if converted basis, whereby Pelican, who owns 100% of the Series A Convertible Preferred Stock controls the substantial majority of votes of Aly Energy. (See further discussion in “Note 11 – Controlling Shareholder and Other Related Party Transactions” in the notes to our consolidated financial statements.)
On May 23, 2017 and in consideration of the increase in the revolving credit facility and the extension of the final maturity date, the Company agreed to issue Pelican an amendment fee of 1,200 shares of our Series A Convertible Preferred Stock.
Item 6. Selected Financial Data
As a smaller reporting company, we are not required to provide the information required by this Item.
Item 7. Management’s Discussion and Analysis of Financial Condition and Results of Operations
The following discussion and analysis of our financial condition and results of operations is intended to assist you in understanding our business and results of operations together with our present financial condition. Unless otherwise noted, all discussion and analysis relates to continuing operations. This section should be read in conjunction with the audited consolidated financial statements and the related notes thereto included elsewhere in “Item 8. Financial Statements and Supplementary Data” in this Form 10-K. This section contains forward-looking statements that involve risks and uncertainties. Our actual results may differ materially from those discussed in any forward-looking statement because of various factors, including, without limitation, those described in the sections titled “Cautionary Note Regarding Forward-Looking Statements” and Part I, Item 1A “Risk Factors” of this Form 10-K.
| 24 |
| Table of Contents |
History of Our Business
On July 17, 2012, Munawar “Micki” Hidayatallah founded Aly Energy with the strategic objective of creating an oilfield services company that serves exploration and production companies from well planning to plug and abandonment. We have grown our business both through organic growth resulting from investment in existing operations and through the strategic acquisition of certain businesses operating in our industry.
To date, we have acquired three businesses:
· Austin Chalk Petroleum Services Corp. (“Austin Chalk”) - In October 2012, we acquired Austin Chalk a provider of high performance, explosion-resistant rental equipment used primarily in land-based horizontal drilling. Austin Chalk currently offers a robust inventory of surface rental equipment as well as roustabout services, including the rig-up and rig-down of equipment and the hauling of equipment to and from the customer’s location; · United Centrifuge LLC and the leased fixed assets associated with that business (collectively “United”) - United, acquired in April 2014, operates within the solids control sector of the oilfield services industry, offering its customers the option of renting centrifuges and auxiliary solids control equipment without personnel or the option of paying for a full-service solids control package which includes operators on-site 24 hours a day. United owns centrifuges which are differentiated from the competition due to the ability to remove the rotating assembly from a centrifuge within 45 minutes while on the rig site thereby minimizing customer down time; and · Evolution Guidance Systems Inc. (“Evolution”) - In July 2014, we acquired Evolution which specialized as an operator of Measurement-While-Drilling (“MWD”) downhole tools. Effective October 26, 2016, we abandoned these operations as a part of a restructuring event (see “Note 2 – Recent Developments” in the notes to our consolidated financial statements for further detail).
Subsequent to the acquisition of each of these businesses, we have made significant investments to expand their operations and capitalize on organic growth opportunities in existing and expansion markets. We consistently seek opportunities to bundle product offerings and to cross sell services across markets and product lines, which we believe improves client retention and increases the utilization of our equipment.
Overview of Our Business
We are a provider of solids control systems and surface rental equipment. Our equipment and services are primarily designed for and used in land-based horizontal drilling. Our equipment includes centrifuges and auxiliary solids control equipment, mud circulating tanks (400 and 500 barrel capacity) and auxiliary surface rental equipment, portable mud mixing plants and containment systems. In conjunction with the rental of some of our solids control packages, we provide personnel at the customer’s well site to operate our equipment. We also provide personnel to rig-up/rig-down and haul our equipment to and from the customer’s location. We operate primarily in Texas (West Texas and South Texas), Oklahoma, New Mexico, and Louisiana. Our primary operating yards, shop and repair facilities, and division management are located in Giddings, Texas, San Angelo, Texas, and Houston, Texas.
We derive the majority of our revenue from day rates or hourly rates charged for the rental of our equipment and for the services provided by our personnel. The price we charge for our services depends on both the level of activity within the geographic area in which we operate and also the competitive environment.
Our operating costs do not fluctuate in direct proportion to changes in revenue. Our operating expenses consist of both fixed and variable costs. Although most variable costs are highly correlated with revenue and activity, certain variable costs, such as sub-rental equipment expenses and third-party trucking expenses, can be reduced as a percentage of revenue by our investment in new rental and transportation equipment.
| 25 |
| Table of Contents |
Industry Trends
We operate in the commodity-driven, cyclical oil and gas industry. From 2011 through mid-2014, the industry operated in an environment where crude oil prices were relatively stable and, except for comparatively short intervals, generally traded at prices at or in excess of $100 per barrel. However, subsequent to the third quarter of 2014, crude oil prices declined significantly due to a variety of factors, including, but not limited to, continued growth in U.S. oil production, weakened outlooks for the global economy and continued strong international crude oil supply resulting in part from OPEC’s unexpected decision to maintain oil production levels. As a result of the weaker crude oil price environment, many crude oil development prospects became less economical for exploration and production operators, leading to a dramatic reduction in U.S. land-based rig count and weaker demand for oilfield services, such as the services we provide.
The decline in both oil prices and the U.S. land-based rig count continued during the first half of 2016. Barring a few brief rallies, the price of oil bottomed out in February 2016 at less than $30 per barrel and the U.S. land-based rig count reached its low of less than 400 rigs in July 2016. After reaching its low point, the price of oil then increased steadily for several months and has hovered between $45 per barrel and $50 per barrel since June 2016. With the price of oil fairly constant for the past twelve months at a level which is economical for exploration and production operators, the U.S. land-based rig count has increased steadily and, in July 2017, the count had increased to over 900 rigs, an increase of greater than 100% compared to its low of less than 400 rigs in July 2016.
The favorable impact of the recent increase in the U.S. land-based rig count on demand for our services has been magnified by an increase in the proportion of rigs drilling directional and horizontal wells. As illustrated in the graph below, the proportion of rigs drilling directional and horizontal wells as a percentage of total U.S. land-based rigs has increased from approximately 80% in the first quarter of 2014 to 92% in the second quarter of 2017. Rigs drilling directional and horizontal wells typically utilize oil-based or other sophisticated mud systems which creates demand for Aly’s specialized mud circulating tanks, pumps, containment systems, solids control and associated equipment.
Our financial performance is significantly affected by the price of oil and the U.S. land-based rig count, specifically the count of rigs drilling directional and horizontal wells. The graph below illustrates the trends in these key drivers from 2014 through mid-2017:
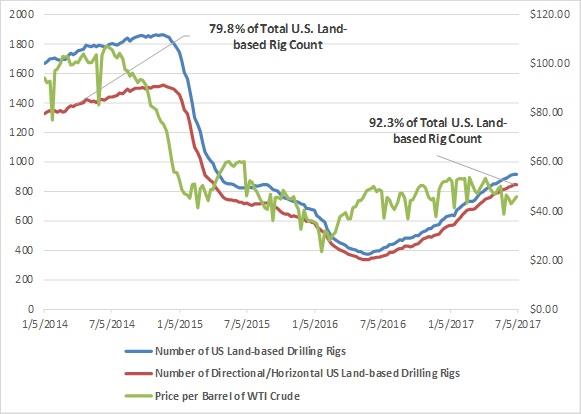
Source: Baker Hughes (Rig Counts) and Bloomberg (Price Per Barrel of WTI Crude)
| 26 |
| Table of Contents |
How We Evaluate Our Operations
We disclose and discuss EBITDA as a non-GAAP financial measure in our public releases, including quarterly earnings releases, investor conference calls and other filings with the Securities and Exchange Commission.
We define EBITDA as earnings (net income) before interest, income taxes, depreciation and amortization. Our measure of EBITDA may not be comparable to similarly titled measures presented by other companies, which may limit its usefulness as a comparative measure.
We also make certain adjustments to EBITDA for (i) non-cash charges, such as reduction in value of assets, bad debt expense, share-based compensation expense, and changes in fair value of our liability for contingent payments and (ii) certain expenses, such as severance, legal settlements, and professional fees and other expenses related to transactions outside the ordinary course of business, to derive a normalized EBITDA run-rate (“Adjusted EBITDA”), which we believe is a useful measure of operating results and the underlying cash generating capability of our business.
The following table provides the detailed components of EBITDA and Adjusted EBITDA as we define that term for the years ended December 31, 2016 and 2015, respectively (in thousands):
|
|
| For the Years Ended December 31, |
| |||||
|
|
| 2016 |
|
| 2015 |
| ||
|
|
| (unaudited) |
| |||||
|
|
|
|
|
|
|
| ||
| Components of EBITDA: |
|
|
|
|
|
| ||
|
|
|
|
|
|
|
| ||
| Net loss |
| $ | (22,135 | ) |
| $ | (15,894 | ) |
| Less: Loss from discontinued operations, net of income taxes |
|
| 2,491 |
|
|
| 1,950 |
|
|
|
|
|
|
|
|
|
|
|
| Net loss from continuing operations |
|
| (19,644 | ) |
|
| (13,944 | ) |
|
|
|
|
|
|
|
|
|
|
| Non-GAAP adjustments: |
|
|
|
|
|
|
|
|
|
|
|
|
|
|
|
|
|
|
| Depreciation and amortization |
|
| 5,299 |
|
|
| 5,950 |
|
| Interest expense, net |
|
| 2,378 |
|
|
| 1,961 |
|
| Debt modification fee |
|
| 629 |
|
|
| - |
|
| Interest expense - Pelican |
|
| 111 |
|
|
| - |
|
| Income tax benefit |
|
| (7,904 | ) |
|
| (3,372 | ) |
|
|
|
|
|
|
|
|
|
|
| EBITDA |
| $ | (19,131 | ) |
| $ | (9,405 | ) |
|
|
|
|
|
|
|
|
|
|
| Adjustments to EBITDA: |
|
|
|
|
|
|
|
|
|
|
|
|
|
|
|
|
|
|
| Reduction in value of assets |
|
| 17,736 |
|
|
| 11,405 |
|
| Expenses in connection with lender negotiations and Recapitalization |
|
| 472 |
|
|
| 14 |
|
| Employee-related reorganization expenses, including severance |
|
| 456 |
|
|
| 385 |
|
| Bad debt expense |
|
| 193 |
|
|
| 364 |
|
| Settlements and other losses |
|
| 127 |
|
|
| 590 |
|
| Fair value adjustments to contingent payment liability |
|
| (372 | ) |
|
| (1,065 | ) |
| Stock-based compensation |
|
| - |
|
|
| 100 |
|
| Gain on indemnification-preferred shares holdback |
|
| - |
|
|
| (124 | ) |
| Transaction costs |
|
| - |
|
|
| 221 |
|
|
|
|
|
|
|
|
|
|
|
| Adjusted EBITDA |
| $ | (519 | ) |
| $ | 2,485 |
|
| 27 |
| Table of Contents |
Because EBITDA and Adjusted EBITDA are not measures of financial performance calculated in accordance with GAAP, these metrics should not be considered in isolation or as a substitute for operating income, net income or loss, cash flows provided by operating, investing and financing activities, or other income or cash flow statement data prepared in accordance with GAAP.
EBITDA and Adjusted EBITDA are widely used by investors and other users of our financial statements as supplemental financial measures that, when viewed with our GAAP results and the accompanying reconciliation, we believe provide additional information that is useful to gain an understanding of our ability to service debt, pay income taxes and fund growth and maintenance capital expenditures. We also believe the disclosure of EBITDA and Adjusted EBITDA helps investors meaningfully evaluate and compare our cash flow generating capacity from quarter-to-quarter and year-to-year.
EBITDA and Adjusted EBITDA are also financial metrics used by management as (i) supplemental internal measures for planning and forecasting and for evaluating actual results against such expectations; (ii) significant criteria for incentive compensation paid to our executive officers and management; (iii) reference points to compare to the EBITDA and Adjusted EBITDA of other companies when evaluating potential acquisitions; and, (iv) assessments of our ability to service existing fixed charges and incur additional indebtedness.
Set forth below are the material limitations associated with using EBITDA and Adjusted EBITDA as non-GAAP financial measures compared to cash flows provided by and used in operating, investing and financing activities:
· EBITDA and Adjusted EBITDA do not reflect growth and maintenance capital expenditures, · EBITDA and Adjusted EBITDA do not reflect the interest, principal payments and other financing-related charges necessary to service the debt that we have incurred to finance acquisitions and invest in our fixed asset base, · EBITDA and Adjusted EBITDA do not reflect the payment of income taxes, and · EBITDA and Adjusted EBITDA do not reflect changes in our net working capital position.
Management compensates for the above-described limitations in using EBITDA and Adjusted EBITDA as non-GAAP financial measures by only using EBITDA and Adjusted EBITDA to supplement our GAAP results.
Business Outlook
Our core businesses depend on our customers’ willingness to make expenditures to produce, develop and explore for oil and natural gas. Industry conditions are influenced by numerous factors, such as oil and natural gas prices, the supply of and demand for oil and natural gas, domestic and worldwide economic conditions, political instability in oil producing countries and available supply of and demand for the services we provide. Oil and natural gas prices began a rapid and substantial decline in the fourth quarter of 2014. Depressed commodity price conditions persisted and worsened during 2015 and that trend continued into 2016. As a result, the rig count and demand for our products and services declined substantially, and the prices we are able to charge our customers for our products and services have also declined substantially. While we have reshaped our organizational and cost structure to mitigate the negative impact of these declines and to improve our ability to react to future declines, we continued to experience negative operating results and cash flows from operations through 2016.
Oil prices have improved off the low point of 2016 with the November 2016 decision by OPEC to curtail the cartel’s oil production, the Baker Hughes U.S. land drilling rig count has increased significantly from its low point in mid-2016, and our revenue has improved substantially during the first six months of 2017. We believe that stability in oil prices at an attractive price to our customers coupled with the increases in drilling activity during the first half of 2017 will result in further increases in demand for our services and will provide us opportunities to increase the price of our products and services, particularly in 2018. However, with increased demand for oilfield services broadly, the demand for qualified employees and the demand for the sub-rental equipment we require to increase our activity will increase and we may experience increases in costs which we cannot completely offset with price increases to our customers. As of June 30, 2017, based on our expectations of improved activity levels and pricing throughout the remainder of 2017 and 2018, we believe that we will be able to service our debt obligations and ongoing operations through operating cash flow and, if necessary, availability under our credit facility.
| 28 |
| Table of Contents |
Operational Restructuring
Our activity is tied directly to the rig count and, even though we instituted significant cost cutting measures beginning in 2015, we were unable to cut costs enough to match the decline in our business. As a result, as of December 31, 2015, we were in default of our credit agreement with Wells Fargo Bank, National Association (“Wells Fargo”).
Throughout 2015, in an effort to mitigate the significant declines in pricing and utilization of our equipment, we committed to a reorganization initiative to strengthen our sales and marketing efforts, consolidate support functions, and operate more efficiently. The reorganization effort included, but was not limited to, training our salesforce to enable the cross-selling of our product lines in certain geographical markets, sharing a common support services infrastructure across all reporting units, reducing headcount and wage rates, and rebranding and launching a new web site to increase awareness of our service lines. We recognized some benefit from these measures in late 2015 resulting in increased gross margins and lower selling, general and administrative expenses when compared to the first half of 2015.
During the year ended December 31, 2016, we entered into a series of forbearance agreements with our lender. Under the forbearance agreements, among other provisions, the lenders agreed to forbear from exercising their remedies under the credit agreement. These forbearance agreements permitted us to operate within the parameters of our normal course of business despite the continuing default under the credit agreement. Without these forbearance agreements, our outstanding debt would have been immediately due and payable. Throughout 2016, we remained in default and we did not have sufficient liquidity to repay all of the outstanding debt to the lender at any point during the year ($20.1 million as of December 31, 2015). As such, we may have been forced to file for protection under Chapter 11 of the U.S. Bankruptcy Code.
In early 2016, we were hopeful that a successful operational restructuring would facilitate negotiations to modify the terms of our existing credit facility with Wells Fargo. Our operational restructuring in 2016 consisted of severe cost cuts which were incremental to the year-over-year cost cuts already achieved in 2015 when compared to 2014. In 2016, significant cost savings were primarily generated by:
· reductions of our employee base, both field employees and sales and administrative employees, to a headcount of approximately 50 as of December 31, 2016 from approximately 125 as of December 31, 2015, · reduction in employer contributions to employee benefits, · closures of certain operating yards and administrative facilities, · strategic decision to cease operations in the northeast which resulted in the reduction of costs related to operating in an incremental market, · modifications to insurance policies, including general liability and workers’ compensation policies, resulting in a $0.5 million or 15.5% reduction in the cost of insurance to $0.6 million for the year ended December 31, 2016 from $1.1 million for the year ended December 31, 2015, · minimization of repair and maintenance activities, resulting in a $0.4 million or 50.0% reduction of repair and maintenance expenses to $0.4 million for the year ended December 31, 2016 from $0.8 million for the year ended December 31, 2015, and · elimination of investments in equipment, unless required to service an existing customer, resulting in a reduction of capital expenditures to $0.4 million for the year ended December 31, 2016 from $2.5 million for the year ended December 31, 2015.
We also achieved significant cost savings from the decrease in third party costs, such as sub-rental equipment and trucking, and other variable costs which declined with the decrease in activity.
In order to further support our working capital needs, we identified and sold idle and underutilized assets. During 2016, we realized aggregate proceeds from sales of approximately $0.8 million of which $0.5 million and $0.3 million was used to fund working capital needs and pay down debt, respectively (see “Note 4 – Reduction in Value of Assets and Other Charges” in the notes to our consolidated financial statements for further details).
| 29 |
| Table of Contents |
Capital Restructuring
Despite our successful operational restructuring efforts, particularly during the first half of 2016, the decline in our activity levels and the declines in customer pricing outpaced the impact of our cost reductions and it became evident that a capital restructuring would also be necessary to continue operations and position our business for an industry turnaround.
In the second quarter of 2016, certain of the Company’s principal stockholders (“Shareholder Group”) began negotiations with Wells Fargo with the objective of consummating a recapitalization transaction (the “Recapitalization”) whereby our obligations under the credit agreement and the outstanding capital leases in favor of Wells Fargo’s equipment finance affiliate and certain other obligations of Aly Energy (collectively the “Aly Senior Obligations”) would be restructured. In August 2016, the Shareholder Group approached a third party, Tiger Finance, LLC (“Tiger”), to provide bridge financing and to extend forbearance until such date as sufficient capital could be raised to complete the Recapitalization.
In September 2016, the Shareholder Group formed Permian Pelican, LLC (“Pelican”) with the objective of raising capital and executing the steps necessary to complete the restructuring, inclusive of successfully effecting the exchange of the Aly Operating redeemable preferred stock, Aly Centrifuge redeemable preferred stock, Aly Centrifuge subordinated debt and liability for a contingent payment into approximately 10% of our common stock on a fully diluted basis.
Effective January 31, 2017, the Recapitalization was completed through the execution and delivery of a Securities Exchange Agreement and a Second Amended and Restated Credit Agreement. As a result of the Recapitalization, the Company became a “Controlled Company” as defined under the listing standards of the principal national securities exchanges; however, since the Shareholder Group’s proportionate interest did not change significantly, a change in control did not occur and the transaction was accounted for at historical cost.
As a result of the Recapitalization, the credit facility, now with Pelican, consisted of a term loan of $5.1 million and a revolving facility of up to $1.0 million as of January 31, 2017. Availability under the revolving credit facility is determined by a borrowing base calculated as 80% of eligible receivables (receivables less than 90 days old).
Subsequent to the Recapitalization, we entered into several further amendments to capitalize on improved market conditions and increased activity in our business:
· Amendment No. 1, effective March 1, 2017, provided for a delayed draw term loan to be added to the credit facility for the purpose of financing capital expenditures. The agreement permitted us to draw on the delayed draw term loan from time-to-time up until the maturity date of the facility in order to fund up to 80% of the cost of capital expenditures subject to a $0.5 million limit on aggregate borrowings. · Amendment No. 2, effective May 23, 2017, increased the maximum revolving credit amount from $1.0 million to $1.8 million and extended the final maturity date of the facility to December 31, 2019. In consideration of the increase in the revolving credit facility and the extension of the final maturity date, we agreed to issue to Pelican, the lender, as an amendment fee, 1,200 shares of our Series A Convertible Preferred Stock. · Amendment No. 3, effective June 15, 2017, modified maximum potential borrowings under each of the revolving credit facility and the delayed draw term loan without changing the aggregate available borrowings under the credit facility. The amendment reduced the maximum revolving credit amount from $1.8 million to $1.0 million and increased the maximum delayed draw loan borrowings from $0.5 million to $1.3 million and the amendment also increased permitted draws on the delayed draw loan from 80% of the cost of capital expenditures being funded to 90% of the cost of capital expenditures being funded.
To the extent there is free cash flow as defined in the credit agreement, principal payments of 50% of such free cash flow are due annually. The maturity date of all remaining outstanding balances under the credit facility is December 31, 2019.
The obligations under the credit facility are guaranteed by all of our subsidiaries and secured by substantially all of our assets. The credit agreement contains customary events of default and covenants including restrictions on our ability to incur additional indebtedness, make capital expenditures, pay dividends or make other distributions, grant liens and sell assets. The credit facility does not include any financial covenants. We are in full compliance with the credit facility as of June 30, 2017.
As of June 30, 2017, there were outstanding borrowings of $5.0 million, $0.8 million, and $0.3 million on the term loan, revolving credit facility, and delayed draw term loan, respectively. As of June 30, 2017, we have the availability to borrow an incremental $0.2 million under the revolving credit facility and, if we have capital expenditures which are eligible to be financed, an incremental $1.0 million under the delayed draw term loan to finance 90% of such expenditures.
For a discussion of the accounting treatment for the Recapitalization, see “Note 2 – Recent Developments” in the notes to our consolidated financial statements included elsewhere in this document.
| 30 |
| Table of Contents |
Results of Operations
The following table summarizes the change in our results of operations for the year ended December 31, 2016 when compared to the year ended December 31, 2015 (in thousands):
|
|
| For the Years Ended December 31, |
|
| Variance |
| ||||||||||||||||||
|
|
| 2016 |
|
| % of Revenue |
|
| 2015 |
|
| % of Revenue |
|
| $ |
|
| % |
| ||||||
|
|
|
|
|
|
|
|
|
|
|
|
|
|
|
|
|
|
|
| ||||||
| Revenue |
| $ | 11,002 |
|
|
| 100.00 | % |
| $ | 25,484 |
|
|
| 100.00 | % |
| $ | (14,482 | ) |
|
| -56.83% |
|
|
|
|
|
|
|
|
|
|
|
|
|
|
|
|
|
|
|
|
|
|
|
|
|
|
|
| Expenses: |
|
|
|
|
|
|
|
|
|
|
|
|
|
|
|
|
|
|
|
|
|
|
|
|
| Operating expenses |
|
| 8,324 |
|
|
| 75.66 | % |
|
| 16,188 |
|
|
| 63.52 | % |
|
| (7,864 | ) |
|
| -48.58% |
|
| Depreciation and amortization |
|
| 5,299 |
|
|
| 48.16 | % |
|
| 5,950 |
|
|
| 23.35 | % |
|
| (651 | ) |
|
| -10.94% |
|
| Selling, general and administrative expenses |
|
| 4,073 |
|
|
| 37.02 | % |
|
| 7,296 |
|
|
| 28.63 | % |
|
| (3,222 | ) |
|
| -44.17% |
|
| Reduction in value of assets |
|
| 17,736 |
|
|
| 161.21 | % |
|
| 11,405 |
|
|
| 44.75 | % |
|
| 6,331 |
|
|
| 55.51 | % |
|
|
|
|
|
|
|
|
|
|
|
|
|
|
|
|
|
|
|
|
|
|
|
|
|
|
| Total expenses |
|
| 35,432 |
|
|
| 322.05 | % |
|
| 40,839 |
|
|
| 160.25 | % |
|
| (5,407 | ) |
|
| -13.24% |
|
|
|
|
|
|
|
|
|
|
|
|
|
|
|
|
|
|
|
|
|
|
|
|
|
|
|
| Loss from continuing operations |
|
| (24,430 | ) |
| NM |
|
|
| (15,355 | ) |
| NM |
|
|
| (9,075 | ) |
| NM |
| |||
|
|
|
|
|
|
|
|
|
|
|
|
|
|
|
|
|
|
|
|
|
|
|
|
|
|
| Other expense: |
|
|
|
|
|
|
|
|
|
|
|
|
|
|
|
|
|
|
|
|
|
|
|
|
| Debt modification fee |
|
| 629 |
|
|
| 5.72 | % |
|
| - |
|
|
| 0.00 | % |
|
| 629 |
|
| NM |
| |
| Interest expense, net |
|
| 2,378 |
|
|
| 21.62 | % |
|
| 1,961 |
|
|
| 7.70 | % |
|
| 417 |
|
|
| 21.25 | % |
| Interest expense - Pelican |
|
| 111 |
|
|
| 1.01 | % |
|
| - |
|
|
| 0.00 | % |
|
| 111 |
|
| NM |
| |
|
|
|
|
|
|
|
|
|
|
|
|
|
|
|
|
|
|
|
|
|
|
|
|
|
|
| Total other expense |
|
| 3,118 |
|
|
| 28.34 | % |
|
| 1,961 |
|
|
| 7.69 | % |
|
| 1,157 |
|
|
| 59.00 | % |
|
|
|
|
|
|
|
|
|
|
|
|
|
|
|
|
|
|
|
|
|
|
|
|
|
|
| Loss from continuing operations before income taxes |
|
| (27,548 | ) |
| NM |
|
|
| (17,316 | ) |
| NM |
|
|
| (10,232 | ) |
| NM |
| |||
|
|
|
|
|
|
|
|
|
|
|
|
|
|
|
|
|
|
|
|
|
|
|
|
|
|
| Income tax benefit |
|
| (7,904 | ) |
| NM |
|
|
| (3,372 | ) |
| NM |
|
|
| (4,533 | ) |
| NM |
| |||
|
|
|
|
|
|
|
|
|
|
|
|
|
|
|
|
|
|
|
|
|
|
|
|
|
|
| Net loss from continuing operations |
|
| (19,644 | ) |
| NM |
|
|
| (13,944 | ) |
| NM |
|
|
| (5,700 | ) |
| NM |
| |||
|
|
|
|
|
|
|
|
|
|
|
|
|
|
|
|
|
|
|
|
|
|
|
|
|
|
| Loss from discontinued operations, net of income taxes |
|
| 2,491 |
|
|
| 22.64 | % |
|
| 1,950 |
|
|
| 7.65 | % |
|
| 541 |
|
|
| 27.74 | % |
|
|
|
|
|
|
|
|
|
|
|
|
|
|
|
|
|
|
|
|
|
|
|
|
|
|
| Net loss |
| $ | (22,135 | ) |
| NM |
|
| $ | (15,894 | ) |
| NM |
|
| $ | (6,241 | ) |
| NM |
| |||
Results for the Year Ended December 31, 2016 Compared to the Year Ended December 31, 2015
Overview. Our results of operations depend on the demand for our services and our ability to provide high quality equipment and service to satisfy that demand while maintaining an efficient cost structure. During the fourth quarter of 2016, our total revenue was $2.2 million, which was a decline of 76.0% when compared to revenue of $9.0 million during the first quarter of 2015. The steady decline in revenue throughout 2015 and 2016 was a result of decreased activity, decreased pricing of our core products and services of approximately 40% to 50% when comparing the fourth quarter of 2016 to the first quarter of 2015 and the wind-down of our solids control operations in the northeast due to decreased demand in the area combined with high overhead costs. Despite significant declines in activity and pricing, by the end of 2016, after implementing significant cost cutting measures, we successfully achieved a more efficient cost structure in which operating expenses as a percentage of revenue decreased to 66.6% in the fourth quarter of 2016 from 71.8% in the first quarter of 2015 and in which our selling, general and administrative expenses decreased by 76.8% to $0.6 million from $2.4 million when comparing the fourth quarter of 2016 to the first quarter of 2015.
| 31 |
| Table of Contents |
Revenue. Our revenue for the year ended December 31, 2016 was $11.0 million, a decrease of 56.8%, compared to $25.5 million for the year ended December 31, 2015. Our activity is directly tied to drilling activity and, as discussed in the industry trends section above, the average U.S. land-based rig count for 2016 dropped almost 100% to approximately 485 rigs from the average in 2015 of approximately 940 rigs. This decrease in activity resulted in intense competition in the oilfield services sector, which, in turn, required us to reduce pricing significantly in order to retain existing customers and attract new customers. Pricing for our primary rental products decreased approximately 25% when comparing the year ended December 31, 2016 to the year ended December 31, 2015. In addition, demand for our services declined throughout 2015 and through most of 2016 resulting in reduced utilization of equipment and further contributing to our decline in revenue. During the fourth quarter of 2016, we ceased all operating activity in the northeast due to a significant decline in demand in the area. The resulting declines in revenue were minimally offset by increases in demand for our equipment in Texas, particularly in the Permian Basin, in the fourth quarter of 2016.
Operating Expenses. Our operating expenses for the year ended December 31, 2016 decreased to $8.3 million, or 75.7% of revenue, from $16.2 million, or 63.5% of revenue, for the year ended December 31, 2015. The decrease of $7.9 million from the year ended December 31, 2015 is primarily due to the decline in activity described above, specifically the resulting decline in payroll and other variable expenses, combined with a decrease of our reliance on third party sub-rental and trucking services. During 2016, payroll decreased due to both a decline in headcount, 50 as of December 31, 2016 compared to 125 as of December 31, 2015, and decreases in average wage rates. The increase in the percentage of operating expenses to revenue between the years is primarily due to the significant decline in pricing and the inability to reduce our costs to mirror the timing and magnitude of the reduction in customer pricing (see further discussion of cost cuts in “Operational Restructuring” section above).
Depreciation and Amortization. Depreciation and amortization expense decreased 10.9% to $5.3 million for the year ended December 31, 2016 compared to $6.0 million for the year ended December 31, 2015. The decrease is due primarily to the disposition of assets to Tiger in connection with the Recapitalization (see further discussion in “Note 2 – Recent Developments” in the notes to our consolidated financial statements).
Selling, General and Administrative Expenses. Selling, general and administrative expenses decreased to $4.1 million, or 37.0% of revenue, for the year ended December 31, 2016 compared to $7.3 million, or 28.6% of revenue, for the year ended December 31, 2015. Selling, general and administrative expenses consist primarily of overhead costs which we generally consider to be fixed. The year-over-year decline of $3.2 million, or 44.2%, reflects the severe cost cutting initiatives started in 2015 which continued in 2016. These initiatives, implemented in response to the massive downturn in the industry, included headcount and wage rate decreases, the reduction of executive management salaries and elimination of bonuses, and significant reductions in travel, entertainment and office expense. Selling, general and administrative expenses also include expenses that are either non-recurring or non-cash in nature with an aggregate value of $0.9 million and $0.5 million during the years ended December 31, 2016 and 2015, respectively (see further discussion in “How We Evaluate Our Operations” section above).
Reduction in Value of Assets. In the years ended December 31, 2016 and 2015, we recorded a reduction in value of assets of $17.7 million and $11.4 million, respectively. The primary component of the reduction in value during 2016 was a $15.6 million impairment charge on the transfer of equipment to Tiger in connection with the Recapitalization (see further discussion in “Note 2 – Recent Developments” in the notes to our consolidated financial statements). In addition, in 2016, we recorded a reduction in value of intangibles of $1.1 million and a reduction in value of property and equipment of $1.1 million. The reduction in the value of intangibles consisted of a $0.5 million reduction in an intangible associated with a non-compete which management determined was non-enforceable and a $0.6 million reduction in an intangible associated with a supply agreement which had no value subsequent to the liquidation of the supplier under bankruptcy proceedings. The $1.1 million reduction in value of property and equipment was in connection with asset sales and disposals completed during the year to fund working capital needs and repay debt. In 2015, we recorded a $11.1 million reduction in value of goodwill in connection with our annual impairment testing (see Critical Accounting Policies and Estimates – Valuation of Indefinite-Lived Intangible Assets) and a $0.3 million reduction in property and equipment.
Debt Modification Fee. During the year ended December 31, 2016, we recorded $0.6 million of expense due to a debt modification fee paid to Tiger in connection with the Recapitalization (see further discussion in “Note 2 – Recent Developments” in the notes to our consolidated financial statements).
Interest Expense, net. Interest expense and amortization of deferred loan costs was $2.4 million for the year ended December 31, 2016 compared to $2.0 million for the year ended December 31, 2015. The $0.4 million increase is due primarily to the quarterly ticking fee being accrued for a full year in 2016 compared to one quarter in 2015, the write-off of deferred loan costs related to the Recapitalization, and an increased interest rate on our primary credit facility. These increases were partially offset by interest being charged on a reduced outstanding debt balance subsequent to the debt modification effective in September 2015.
Interest Expense – Pelican. During the year ended December 31, 2016, we recorded $0.1 million of interest expense due to Pelican, a related party, in connection with the Recapitalization.
| 32 |
| Table of Contents |
Income Taxes. Income taxes increased to a benefit of $7.9 million, or an effective tax rate of 28.7%, for the year ended December 31, 2016 from a benefit of $3.4 million, or an effective tax rate of 19.5%, for the year ended December 31, 2015. The effective tax rate increased by 9.2% when comparing the year ended December 31, 2016 to the year ended December 31, 2015 due to goodwill impairment in 2015 which did not recur in 2016 offset by a valuation allowance taken in 2016. Management assesses the realizability of deferred tax assets on a quarterly basis. From its evaluation as of December 31, 2016, the Company has concluded that based on the weight of available evidence, it is not more likely than not to realize the benefit of its deferred tax assets. Therefore, the Company established a valuation allowance of $2.4 million for the year ended December 31, 2016. There was no valuation allowance recorded during the year ended December 31, 2015.
Discontinued Operations. Discontinued operations include Evolution which specialized as an operator of MWD downhole tools. Losses from discontinued operations, net of income taxes, were $2.5 million during 2016, as compared to $2.0 million during 2015. The increase in the loss from discontinued operations in 2016 is primarily due to a $2.6 million reduction in value of assets and a $3.3 million decrease in revenue partially offset by a corresponding decrease in operating expenses. See “Note 15 – Discontinued Operations” in the notes to our consolidated financial statements for additional detail.
Liquidity and Capital Resources
Net Cash Provided by Operating Activities. Cash flow used in operating activities was less than $0.1 million for the year ended December 31, 2016 as compared to cash provided by operations of $3.9 million for the year ended December 31, 2015. The decrease in 2016 was due primarily to a decrease in operating cash flow generated by discontinued operations and due to the recording of a valuation allowance, partially offset by a decrease in working capital.
Liquidity. As a result of the industry downturn, many customers have experienced a significant reduction in their liquidity and have faced challenges accessing the capital markets. Several energy service and equipment companies have declared bankruptcy, or have had to exchange equity for the forgiveness of debt, while others have been forced to sell assets in an effort to preserve liquidity. We faced similar challenges requiring us to undergo a capital restructuring. For a discussion of the Recapitalization and its restructuring of our credit facility, see “Note 2 – Recent Developments” in the notes to our consolidated financial statements included elsewhere in this document.
While as of December 31, 2016, our liquidity was limited solely to cash and cash equivalents of $0.7 million, the Recapitalization increased our liquidity. The table below reflects our liquidity as of June 30, 2017 (in thousands):
| Cash and cash equivalents |
| $ | 573 |
|
| Revolving facility availability (1), (3) |
|
| 250 |
|
| Delayed draw term loan availability (2), (3) |
|
| 975 |
|
|
|
|
|
|
|
| Total liquidity |
| $ | 1,798 |
|
____________
| (1) | Based on eligible receivables as of June 30, 2017. |
| (2) | Available to finance 90% of purchase price for capital expenditures, including 90% of purchase commitments in table below. |
| (3) | With Permian Pelican LLC, our controlling shareholder. |
Capital Expenditures. Capital expenditures are the main component of our investing activities. Cash capital expenditures for the year ended December 31, 2016 decreased to $0.4 million from $1.4 million for the year ended December 31, 2015 due to a significant decrease in expansionary capital expenditures and the minimization of maintenance capital expenditures. In 2017, our cash flows for capital expenditures are limited to maintenance capital expenditures and acquiring assets to replace equipment which we sub-rent to meet customer demand when our owned equipment is fully utilized. Although we do not budget acquisitions in the normal course of business, we regularly engage in discussions related to potential acquisitions of companies which provide oilfield services.
Credit Facility. As of June 30, 2017, we have availability to borrow an incremental $1.2 million under our credit facility with Pelican and, effective January 31, 2017 through the maturity date of December 31, 2019, principal payments on our credit facility are based solely on excess free cash flows, significantly reducing our overall debt service requirements. For a discussion of the Recapitalization and its restructuring of our credit facility, see “Note 2 – Recent Developments” in the notes to our consolidated financial statements included elsewhere in this document.
We have experienced significant growth during the beginning of 2017 and we believe that our cash flow from operations combined with access to capital through our lender and controlling shareholder, Pelican, will be sufficient to fund our working capital needs, contractual obligations and maintenance capital expenditures for the next twelve months.
| 33 |
| Table of Contents |
Contractual Obligations
The table below indicates our contractual obligations as of June 30, 2017 (in thousands):
|
|
| Total |
|
| Less than 1 Year |
|
| 1-3 Years |
|
| 3-5 Years |
|
| More than 5 Years |
| |||||
|
|
|
|
|
|
|
|
|
|
|
|
|
|
|
|
| |||||
| Long-term debt - Pelican (1) |
| $ | 6,052 |
|
| $ | - |
|
| $ | 6,052 |
|
| $ | - |
|
| $ | - |
|
| Interest on long-term debt - Pelican (2) |
|
| 681 |
|
|
| 272 |
|
|
| 409 |
|
|
| - |
|
|
| - |
|
| Severance obligations (3) |
|
| 676 |
|
|
| - |
|
|
| 676 |
|
|
| - |
|
|
| - |
|
| Purchase commitments (4) |
|
| 346 |
|
|
| 346 |
|
|
| - |
|
|
| - |
|
|
| - |
|
| Operating leases |
|
| 249 |
|
|
| 159 |
|
|
| 90 |
|
|
| - |
|
|
| - |
|
| Equipment financing |
|
| 7 |
|
|
| 7 |
|
|
| - |
|
|
| - |
|
|
| - |
|
|
|
|
|
|
|
|
|
|
|
|
|
|
|
|
|
|
|
|
|
|
|
| Total |
| $ | 8,011 |
|
| $ | 784 |
|
| $ | 7,227 |
|
| $ | - |
|
| $ | - |
|
________
| (1) | Maturity date is December 31, 2019 unless such debt is refinanced. |
| (2) | Interest payments on Pelican credit facility calculated at 4.5% per annum. |
| (3) | See "Note 9 - Commitments and Contingencies" for further detail. |
| (4) | Commitment to purchase eight diesel mud pumps. Purchase commitment is eligible to be financed under delayed draw term loan if necessary. |
Off-Balance Sheet Arrangements
We have no off-balance sheet arrangements, other than normal operating leases and employee contracts, that have or are likely to have a current or future material effect on our financial condition, changes in financial condition, revenue, expenses, results of operations, liquidity, capital expenditures, or capital resources.
Net Operating Losses
As of December 31, 2016, we had approximately $29.5 million of federal net operating loss carryforwards. Based on the weight of all available evidence including the future reversal of existing U.S. taxable temporary differences as of December 31, 2016, we believe that it is more likely than not that the benefit from certain federal and state net operating loss carryforwards and other deductible temporary differences will not be realized. In recognition of this risk, we have provided a valuation allowance of approximately $2.4 million on the net deferred tax asset as a result of the Company being in a cumulative three-year pre-tax book loss position and absence of other objectively verifiable positive evidence including reversal of existing taxable temporary differences in these certain state tax jurisdictions.
Critical Accounting Policies and Estimates
The accounting policies described below are considered critical in obtaining an understanding of our consolidated financial statements because their application requires significant estimates and judgments by management in preparing our consolidated financial statements. Management’s estimates and judgments are inherently uncertain and may differ significantly from actual results achieved. Management considers an accounting estimate to be critical if the following conditions apply:
· the estimate requires significant assumptions; and · changes in estimate could have a material effect on our consolidated results of operations or financial condition; or · if different estimates that could have been selected had been used, there could be a material effect on our consolidated results of operations or financial condition.
It is management’s view that the current assumptions and other considerations used to estimate amounts reflected in our consolidated financial statements are appropriate. However, actual results can differ significantly from those estimates under different assumptions and conditions.
| 34 |
| Table of Contents |
We have identified the following critical accounting policies that require a significant amount of estimation or judgment to accurately present our financial position, results of operations and cash flows:
· Revenue Recognition; · Allowance for Doubtful Accounts; · Estimates of Depreciable Lives; · Valuation of Long-lived Assets; · Valuation of Goodwill; · Contingencies; · Income Taxes; · Valuation of Contingent Payment Liability; · Valuation of Redeemable Preferred Stock; and · Cash Flow Estimates.
For a detailed discussion on the application of these and other accounting policies, see “Note 3 – Summary of Significant Accounting Policies” in the notes to our consolidated financial statements included elsewhere in this document.
Revenue Recognition: We generate revenue primarily from renting equipment at per-day rates. In connection with certain of our solids control operations, we also provide personnel to operate our equipment at the customer’s location at per-day or per-hour rates. In addition, we may provide equipment transportation and rig-up/rig-down services to the customer at flat rates per job or at an hourly rate. Our services are generally sold based upon purchase orders or contracts with customers that include fixed or determinable prices. We recognize revenue when services or equipment are provided and collectability is reasonably assured. We contract for a majority of our services on a day rate basis. We rent products on a day rate basis, and revenue from the sale of equipment is recognized when the title to the equipment has transferred to the customer.
Allowance for Doubtful Accounts: We maintain an allowance for doubtful accounts for estimated losses resulting from the inability of some of our customers to make required payments. These estimated allowances are periodically reviewed on a case by case basis, analyzing the customer’s payment history and information regarding the customer’s creditworthiness known to us. In addition, we provide an allowance for doubtful accounts which is based upon a review of outstanding receivables, historical collection information and existing economic conditions. Provisions for doubtful accounts are recorded when it is deemed probable that the customer will not make the required payments. If the financial condition of our customers deteriorates, resulting in their inability to make payments, additional allowances may be required.
Estimates of Depreciable Lives: We use the estimated depreciable lives of our long-lived assets to compute depreciation expense, to estimate future asset retirement obligations and to conduct impairment tests. We base the estimates of our depreciable lives on a number of factors, such as the environment in which the assets operate, industry factors including forecasted prices and competition, and the assumption that we provide the appropriate amount of capital expenditures while the asset is in operation to maintain economical operation of the asset and prevent untimely demise to scrap. The useful lives of our intangible assets are determined by the years over which we expect the assets to generate a benefit based on legal, contractual or other expectations.
We depreciate our operational assets over their depreciable lives to their salvage value, which is generally 20% of the acquisition cost. Typically, these assets contain a large amount of iron in their construction. We recognize a gain or loss upon ultimate disposal of the asset based on the difference between the carrying value of the asset on the disposal date and any proceeds we receive in connection with the disposal. Maintenance and repairs, which do not improve or extend the life of the related assets, are charged to expense when incurred. Refurbishments and renewals are capitalized when the value of the equipment is enhanced for an extended period.
We periodically analyze our estimates of the depreciable lives of our fixed assets to determine if the depreciable periods and salvage value continue to be appropriate. We also analyze useful lives and salvage value when events or conditions occur that could shorten the remaining depreciable life of the asset. We review the depreciable periods and salvage values for reasonableness, given current conditions. As a result, our depreciation expense is based upon estimates of depreciable lives of the fixed assets, the salvage value and economic factors, all of which require management to make significant judgments and estimates. If we determine that the depreciable lives should be different than originally estimated, depreciation expense may increase or decrease and impairments in the carrying values of our fixed assets may result, which could negatively impact our earnings.
| 35 |
| Table of Contents |
Valuation of Long-lived Assets: Our property and equipment and intangibles are tested for potential impairment when circumstances or events indicate a possible impairment may exist. These circumstances or events are referred to as “trigger events” and examples of such trigger events include, but are not limited to, an adverse change in market conditions, a significant decrease in benefits being derived from an acquired business, a change in the use of an asset, or a significant disposal of a particular asset or asset class.
If a trigger event occurs, an impairment test is performed based on an undiscounted cash flow analysis. To perform an impairment test, we make judgments, estimates and assumptions regarding long-term forecasts of revenue and expenses relating to the assets subject to review. Market conditions, energy prices, estimated depreciable lives of the assets, discount rate assumptions and legal factors impact our operations and have a significant effect on the estimates we use to determine whether our assets are impaired. If the results of the undiscounted cash flow analysis indicate that the carrying value of the assets being tested for impairment are not recoverable, then we record an impairment charge to write the carrying value of the assets down to their fair value. Using different judgments, assumptions or estimates, we could potentially arrive at a materially different fair value for the assets being tested for impairment, which may result in an impairment charge.
Valuation of Indefinite-Lived Intangible Assets: We periodically review our intangible assets not subject to amortization, including our goodwill, to determine whether an impairment of those assets may exist. These tests must be made on at least an annual basis, or more often if circumstances indicate that the assets may be impaired. These circumstances include, but are not limited to, significant adverse changes in the business climate.
The test for impairment of indefinite-lived intangible assets allows us to first assess the qualitative factors to determine whether it is “more likely than not” that the fair value of a reporting unit is less than its carrying amount as a basis for determining whether it is necessary to perform the two-step goodwill impairment test. If our qualitative analysis shows that it is “more likely than not” that the fair value of a reporting unit is less than its carrying amount, we will perform the two-step goodwill impairment test. In the first step, a fair value is calculated for each of our reporting units, and that fair value is compared to the current carrying value of the reporting unit, including the reporting unit’s goodwill. If the fair value of the reporting unit exceeds its carrying value, there is no potential impairment, and the second step is not performed. If the carrying value exceeds the fair value of the reporting unit, then the second step is required.
The second step of the test for impairment compares the implied fair value of the reporting unit’s goodwill to its current carrying value. The implied fair value of the reporting unit’s goodwill is determined in the same manner as the amount of goodwill that would be recognized in a business combination, with the purchase price being equal to the fair value of the reporting unit. If the implied fair value of the reporting unit’s goodwill is in excess of its carrying value, no impairment charge is recorded. If the carrying value of the reporting unit’s goodwill is in excess of its implied fair value, an impairment charge equal to the excess is recorded.
In determining the fair value of our reporting units, we use a weighted-average approach of three commonly used valuation techniques — a discounted cash flow method, a guideline companies method, and a similar transactions method. We assigned a weight to the results of each of these methods based on the facts and circumstances that are in existence for that testing period. We assigned more weight to the discounted cash flow method as we believe it is more representative of the future of the business.
In addition to the estimates made by management regarding the weighting of the various valuation techniques, the creation of the techniques themselves requires that we make significant estimates and assumptions. The discounted cash flow method, which was assigned the highest weight by management during the current year, requires us to make assumptions about future cash flows, future growth rates, tax rates in future periods, book-tax differences in the carrying value of our assets in future periods, and discount rates. The assumptions about future cash flows and growth rates are based on our current budgets for future periods, as well as our strategic plans, the beliefs of management about future activity levels, and analysts’ expectations about our revenue, profitability and cash flows in future periods. The assumptions about our future tax rates and book-tax differences in the carrying value of our assets in future periods are based on the assumptions about our future cash flows and growth rates, and management’s knowledge of and beliefs about tax law and practice in current and future periods. The assumptions about discount rates include an assessment of the specific risk associated with each reporting unit being tested, and were developed with the assistance of a third-party valuation consultant. The ultimate conclusions of the valuation techniques remain our responsibility.
Contingencies: We are periodically required to record other loss contingencies, which relate to lawsuits, claims, proceedings and tax-related audits in the normal course of our operations, on our consolidated balance sheet. We record a loss contingency for these matters when it is probable that a liability has been incurred and the amount of the loss can be reasonably estimated. We periodically review our loss contingencies to ensure that we have recorded appropriate liabilities on the balance sheet. We adjust these liabilities based on estimates and judgments made by management with respect to the likely outcome of these matters, including the effect of any applicable insurance coverage for litigation matters. Our estimates and judgments could change based on new information, changes in laws or regulations, changes in management’s plans or intentions, the outcome of legal proceedings, settlements or other factors. Actual results could vary materially from these reserves.
| 36 |
| Table of Contents |
Income Taxes: We account for deferred income taxes using the asset and liability method and provide income taxes for all significant temporary differences. Management determines our current tax liability as well as taxes incurred as a result of current operations, yet deferred until future periods. Current taxes payable represents our liability related to our income tax returns for the current year, while net deferred tax expense or benefit represents the change in the balance of deferred tax assets and liabilities reported on our consolidated balance sheets. Deferred tax assets and liabilities are measured using enacted tax rates expected to apply to taxable income in the years in which those temporary differences are expected to be recovered or settled. Our deferred tax calculation requires us to make certain estimates about our future operations. Changes in state, federal and foreign tax laws, as well as changes in our financial condition or the carrying value of existing assets and liabilities, could affect these estimates. The effect of a change in tax rates is recognized as income or expense in the period that the rate is enacted. Further, management makes certain assumptions about the timing of temporary tax differences for the differing treatment of certain items for tax and accounting purposes or whether such differences are permanent. The final determination of our tax liability involves the interpretation of local tax laws, tax treaties, and related authorities in each jurisdiction as well as the significant use of estimates and assumptions regarding the scope of future operations and results achieved and the timing and nature of income earned and expenditures incurred.
We record valuation allowances to reduce deferred tax assets if we determine that it is more likely than not (e.g., a likelihood of more than 50%) that some or all of the deferred tax assets will not be realized in future periods. To assess the likelihood, we use estimates and judgment regarding our future taxable income, as well as the jurisdiction in which this taxable income is generated, to determine whether a valuation allowance is required. The ultimate realization of the deferred tax assets depends on the ability to generate sufficient taxable income of the appropriate character and in the related jurisdiction in the future. Evidence supporting this ability can include our current financial position, our results of operations, both actual and forecasted results, the reversal of deferred tax liabilities, and tax planning strategies as well as the current and forecasted business economics of our industry. Additionally, we record uncertain tax positions in the financial statements at their net recognizable amount, based on the amount that management deems is more likely than not to be sustained upon ultimate settlement with the tax authorities in the domestic and international tax jurisdictions in which we operate.
If our estimates or assumptions regarding our current and deferred tax items are inaccurate or are modified, these changes could have potentially material negative impacts on our earnings.
Valuation of Contingent Payment Liability: In connection with the United Acquisition we recorded a contingent payment liability with an estimated fair value on the acquisition date of $3.5 million. The contingent consideration consisted of up to three future cash payments to the sellers in an amount equal to 5% of the gross revenue of the business acquired for each of the twelve-month periods ending on March 31, 2015, 2016, and 2017; provided, however, that the aggregate consideration would not exceed $5.0 million. The fair value of the liability for contingent payments represents the sum of (i) the known required payments for periods which have ended and (ii) the present value of projected required payments for future periods based upon our internal model and projections.
Valuation of Redeemable Preferred Stock: Two of our subsidiaries have redeemable preferred stock. At issuance, our redeemable preferred stock was recorded at fair value as follows:
· Aly Operating – valued as of the date of acquisition by discounting the sum of (i) the liquidation value at issuance and (ii) the future cumulative accrued dividends as of the date of optional redemption for a lack of marketability. · Aly Centrifuge – valued as of the date of acquisition by discounting the sum of (i) the value of the preferred stock without a conversion option using the option pricing method and (ii) the value of the conversion option using the Black-Scholes option pricing model for a lack of marketability.
Our redeemable preferred stock is classified outside of permanent equity in our consolidated balance sheet because the settlement provisions provided the holder the option to require us to redeem the preferred stock at a liquidation price plus any accrued dividends, as defined in the agreement.
Cash Flow Estimates: Our estimates of future cash flow are based on the most recent available market and operating data for the applicable asset base at the time we made the estimate. Significant management judgment is necessary to evaluate the impact of operating and macroeconomic changes on us. Critical assumptions include projected revenue growth, gross profit margins, selling, general and administrative expenses, working capital fluctuations, capital expenditures, discount rates and terminal growth rates. Our cash flow estimates are used for all our valuation based estimates detailed above.
Recently Issued Accounting Standards
For a discussion of new accounting standards, see “Note 3 – Summary of Significant Accounting Policies” in the notes to our consolidated financial statements included elsewhere in this document.
Item 7A. Quantitative and Qualitative Disclosures About Market Risk
As a smaller reporting company, we are not required to provide the information required by this Item.
| 37 |
| Table of Contents |
Item 8. Financial Statements and Supplementary Data
Index to Consolidated Financial Statements
| F-1 |
Report of Independent Registered Public Accounting Firm
To Board of Directors and Stockholders
Aly Energy Services, Inc.
We have audited the accompanying consolidated balance sheets of Aly Energy Services, Inc. and Subsidiaries (collectively the “Company”) as of December 31, 2016 and 2015, and the related consolidated statements of operations, changes in stockholders’ equity, and cash flows for each of the years then ended. These financial statements are the responsibility of the Company’s management. Our responsibility is to express an opinion on these financial statements based on our audits.
We conducted our audits in accordance with the auditing standards of the Public Company Accounting Oversight Board (United States). Those standards require that we plan and perform the audit to obtain reasonable assurance about whether the financial statements are free of material misstatement. The Company is not required to have, nor were we engaged to perform, an audit of its internal control over financial reporting. Our audits included consideration of internal control over financial reporting as a basis for designing audit procedures that are appropriate in the circumstances, but not for the purpose of expressing an opinion on the effectiveness of the Company’s internal control over financial reporting. Accordingly, we express no such opinion. An audit includes examining, on a test basis, evidence supporting the amounts and disclosures in the financial statements, assessing the accounting policies used and significant estimates made by management, as well as evaluating the overall financial statement presentation. We believe that our audits provide a reasonable basis for our opinion.
In our opinion, the financial statements referred to above present fairly, in all material respects, the financial position of Aly Energy Services, Inc. and Subsidiaries as of December 31, 2016 and 2015, and the results of their operations and their cash flows for each of the years then ended in conformity with accounting principles generally accepted in the United States of America.
/s/ RSM US LLP
Houston, TX
| F-2 |
| Table of Contents |
| CONSOLIDATED BALANCE SHEETS | ||||||||
| (in thousands, except share and per share amounts) | ||||||||
|
|
|
|
|
|
|
| ||
|
|
| December 31, |
| |||||
|
|
| 2016 |
|
| 2015 |
| ||
| ASSETS |
|
|
|
|
|
| ||
| Current assets |
|
|
|
|
|
| ||
| Cash and cash equivalents |
| $ | 681 |
|
| $ | 514 |
|
| Restricted cash |
|
| 30 |
|
|
| - |
|
| Accounts receivable, net |
|
| 1,120 |
|
|
| 3,688 |
|
| Unbilled receivables |
|
| 328 |
|
|
| 721 |
|
| Prepaid expenses and other current assets |
|
| 496 |
|
|
| 957 |
|
| Assets associated with discontinued operations |
|
| - |
|
|
| 3,428 |
|
| Total current assets |
|
| 2,655 |
|
|
| 9,308 |
|
|
|
|
|
|
|
|
|
|
|
| Property and equipment, net |
|
| 28,226 |
|
|
| 51,789 |
|
| Intangible assets, net |
|
| 4,931 |
|
|
| 7,409 |
|
| Other assets |
|
| 14 |
|
|
| 21 |
|
|
|
|
|
|
|
|
|
|
|
| Total Assets |
| $ | 35,826 |
|
| $ | 68,527 |
|
|
|
|
|
|
|
|
|
|
|
| LIABILITIES AND STOCKHOLDERS' EQUITY (DEFICIT) |
|
|
|
|
|
|
|
|
| Current liabilities |
|
|
|
|
|
|
|
|
| Accounts payable |
| $ | 912 |
|
| $ | 1,034 |
|
| Accrued expenses |
|
| 1,163 |
|
|
| 2,297 |
|
| Accrued interest and other - Pelican |
|
| 1,277 |
|
|
| - |
|
| Current portion of long-term debt |
|
| 1,593 |
|
|
| 20,353 |
|
| Current portion of long-term debt - Pelican |
|
| 18,880 |
|
|
| - |
|
| Current portion of contingent payment liability |
|
| 810 |
|
|
| 652 |
|
| Liabilities associated with discontinued operations |
|
| - |
|
|
| 1,211 |
|
| Total current liabilities |
|
| 24,635 |
|
|
| 25,547 |
|
|
|
|
|
|
|
|
|
|
|
| Long-term debt, net |
|
| 10 |
|
|
| 3,185 |
|
| Long-term debt, net - Pelican |
|
| 1,315 |
|
|
| - |
|
| Contingent payment liability, net |
|
| - |
|
|
| 530 |
|
| Deferred tax liabilities |
|
| - |
|
|
| 7,941 |
|
| Other long-term liabilities |
|
| 708 |
|
|
| 31 |
|
| Total liabilities |
|
| 26,668 |
|
|
| 37,234 |
|
|
|
|
|
|
|
|
|
|
|
| Commitments and contingencies (note 9) |
|
|
|
|
|
|
|
|
|
|
|
|
|
|
|
|
|
|
| Aly Operating redeemable preferred stock |
|
| 4,924 |
|
|
| 4,647 |
|
| Aly Centrifuge redeemable preferred stock |
|
| 10,080 |
|
|
| 9,755 |
|
|
|
|
| 15,004 |
|
|
| 14,402 |
|
|
|
|
|
|
|
|
|
|
|
| Stockholders' equity (deficit) |
|
|
|
|
|
|
|
|
| Preferred stock of $0.001 par value |
|
| - |
|
|
| - |
|
| Authorized-10,000,000; none issued and outstanding as of December 31, 2016 |
|
|
|
|
|
|
|
|
| Authorized-25,000,000; none issued and outstanding as of December 31, 2015 |
|
|
|
|
|
|
|
|
| Common stock of $0.001 par value |
|
| 7 |
|
|
| 7 |
|
| Authorized-25,000,000; Issued-6,707,039; Outstanding-6,706,814 as of December 31, 2016 |
|
|
|
|
|
|
|
|
| Authorized-100,000,000; Issued-6,707,039; Outstanding-6,706,814 as of December 31, 2015 |
|
|
|
|
|
|
|
|
| Additional paid-in-capital |
|
| 28,307 |
|
|
| 28,909 |
|
| Accumulated deficit |
|
| (34,158 | ) |
|
| (12,023 | ) |
| Treasury stock, 225 shares at cost |
|
| (2 | ) |
|
| (2 | ) |
| Total stockholders' equity (deficit) |
|
| (5,846 | ) |
|
| 16,891 |
|
|
|
|
|
|
|
|
|
|
|
| Total liabilities and stockholders' equity (deficit) |
| $ | 35,826 |
|
| $ | 68,527 |
|
The accompanying notes are an integral part of these consolidated financial statements.
| F-3 |
| Table of Contents |
| CONSOLIDATED STATEMENTS OF OPERATIONS | ||||||||
| (in thousands, except share and per share amounts) | ||||||||
|
|
|
|
|
|
|
| ||
|
|
| For the Years Ended |
| |||||
|
|
| 2016 |
|
| 2015 |
| ||
|
|
|
|
|
|
|
| ||
| Revenue |
| $ | 11,002 |
|
| $ | 25,484 |
|
|
|
|
|
|
|
|
|
|
|
| Expenses: |
|
|
|
|
|
|
|
|
| Operating expenses |
|
| 8,324 |
|
|
| 16,188 |
|
| Depreciation and amortization |
|
| 5,299 |
|
|
| 5,950 |
|
| Selling, general and administrative expenses |
|
| 4,073 |
|
|
| 7,296 |
|
| Reduction in value of assets |
|
| 17,736 |
|
|
| 11,405 |
|
|
|
|
|
|
|
|
|
|
|
| Total expenses |
|
| 35,432 |
|
|
| 40,839 |
|
|
|
|
|
|
|
|
|
|
|
| Loss from continuing operations |
|
| (24,430 | ) |
|
| (15,355 | ) |
|
|
|
|
|
|
|
|
|
|
| Other expense: |
|
|
|
|
|
|
|
|
| Debt modification fee |
|
| 629 |
|
|
| - |
|
| Interest expense, net |
|
| 2,378 |
|
|
| 1,961 |
|
| Interest expense - Pelican |
|
| 111 |
|
|
| - |
|
|
|
|
|
|
|
|
|
|
|
| Total other expense |
|
| 3,118 |
|
|
| 1,961 |
|
|
|
|
|
|
|
|
|
|
|
| Loss from continuing operations before income taxes |
|
| (27,548 | ) |
|
| (17,316 | ) |
|
|
|
|
|
|
|
|
|
|
| Income tax benefit |
|
| (7,904 | ) |
|
| (3,372 | ) |
|
|
|
|
|
|
|
|
|
|
| Net loss from continuing operations |
|
| (19,644 | ) |
|
| (13,944 | ) |
|
|
|
|
|
|
|
|
|
|
| Loss from discontinued operations, net of income taxes |
|
| 2,491 |
|
|
| 1,950 |
|
|
|
|
|
|
|
|
|
|
|
| Net loss |
| $ | (22,135 | ) |
| $ | (15,894 | ) |
|
|
|
|
|
|
|
|
|
|
| Preferred stock dividends |
|
| 728 |
|
|
| 687 |
|
| Accretion of preferred stock, net |
|
| (126 | ) |
|
| (127 | ) |
|
|
|
|
|
|
|
|
|
|
| Net loss available to common stockholders |
| $ | (22,737 | ) |
| $ | (16,454 | ) |
|
|
|
|
|
|
|
|
|
|
| Basic and diluted loss per share information: |
|
|
|
|
|
|
|
|
| Net loss from continuing operations available to common stockholders |
| $ | (3.02 | ) |
| $ | (2.45 | ) |
| Loss from discontinued operations, net of income taxes |
|
| (0.37 | ) |
|
| (0.33 | ) |
|
|
|
|
|
|
|
|
|
|
| Net loss available to common stockholders |
| $ | (3.39 | ) |
| $ | (2.78 | ) |
|
|
|
|
|
|
|
|
|
|
| Weighted-average shares - basic and diluted |
|
| 6,706,814 |
|
|
| 5,916,103 |
|
The accompanying notes are an integral part of these consolidated financial statements.
| F-4 |
| Table of Contents |
| CONSOLIDATED STATEMENTS OF CHANGES IN STOCKHOLDERS' EQUITY (DEFICIT) | ||||||||||||||||||||||||||||||||
| (in thousands, except share amounts) | ||||||||||||||||||||||||||||||||
|
| ||||||||||||||||||||||||||||||||
|
|
|
|
|
|
|
|
|
|
|
|
|
|
| Additional |
|
| Retained Earnings |
|
|
|
|
|
|
| ||||||||
|
|
| Shares of Common Stock |
|
|
|
|
| Paid-In- |
|
| (Accumulated |
|
| Treasury |
|
|
|
| ||||||||||||||
|
|
| Issued |
|
| Outstanding |
|
| In Treasury |
|
| Common Stock |
|
| Capital |
|
| Deficit) |
|
| Stock |
|
| Total |
| ||||||||
|
|
|
|
|
|
|
|
|
|
|
|
|
|
|
|
|
|
|
|
|
|
|
|
|
| ||||||||
| Balance as of January 1, 2015 |
|
| 5,511,341 |
|
|
| 5,511,116 |
|
|
| 225 |
|
| $ | 6 |
|
| $ | 24,917 |
|
| $ | 3,871 |
|
| $ | (2 | ) |
| $ | 28,792 |
|
| Issuance of common stock, net |
|
| 1,180,073 |
|
|
| 1,180,073 |
|
|
| - |
|
|
| 1 |
|
|
| 4,452 |
|
|
| - |
|
|
| - |
|
|
| 4,453 |
|
| Stock compensation expense |
|
| 15,625 |
|
|
| 15,625 |
|
|
| - |
|
|
| - |
|
|
| 100 |
|
|
| - |
|
|
| - |
|
|
| 100 |
|
| Preferred stock dividends |
|
| - |
|
|
| - |
|
|
| - |
|
|
| - |
|
|
| (687 | ) |
|
| - |
|
|
| - |
|
|
| (687 | ) |
| Accretion of preferred stock, net |
|
| - |
|
|
| - |
|
|
| - |
|
|
| - |
|
|
| 127 |
|
|
| - |
|
|
| - |
|
|
| 127 |
|
| Net loss |
|
| - |
|
|
| - |
|
|
| - |
|
|
| - |
|
|
| - |
|
|
| (15,894 | ) |
|
| - |
|
|
| (15,894 | ) |
|
|
|
|
|
|
|
|
|
|
|
|
|
|
|
|
|
|
|
|
|
|
|
|
|
|
|
|
|
|
|
|
|
|
| Balance as of December 31, 2015 |
|
| 6,707,039 |
|
|
| 6,706,814 |
|
|
| 225 |
|
| $ | 7 |
|
| $ | 28,909 |
|
| $ | (12,023 | ) |
| $ | (2 | ) |
| $ | 16,891 |
|
|
|
|
|
|
|
|
|
|
|
|
|
|
|
|
|
|
|
|
|
|
|
|
|
|
|
|
|
|
|
|
|
|
|
| Preferred stock dividends |
|
| - |
|
|
| - |
|
|
| - |
|
|
| - |
|
|
| (728 | ) |
|
| - |
|
|
| - |
|
|
| (728 | ) |
| Accretion of preferred stock, net |
|
| - |
|
|
| - |
|
|
| - |
|
|
| - |
|
|
| 126 |
|
|
| - |
|
|
| - |
|
|
| 126 |
|
| Net loss |
|
| - |
|
|
| - |
|
|
| - |
|
|
| - |
|
|
| - |
|
|
| (22,135 | ) |
|
| - |
|
|
| (22,135 | ) |
|
|
|
|
|
|
|
|
|
|
|
|
|
|
|
|
|
|
|
|
|
|
|
|
|
|
|
|
|
|
|
|
|
|
| Balance as of December 31, 2016 |
|
| 6,707,039 |
|
|
| 6,706,814 |
|
|
| 225 |
|
| $ | 7 |
|
| $ | 28,307 |
|
| $ | (34,158 | ) |
| $ | (2 | ) |
| $ | (5,846 | ) |
The accompanying notes are an integral part of these consolidated financial statements.
| F-5 |
| Table of Contents |
| CONSOLIDATED STATEMENTS OF CASH FLOWS | ||||||||
| (in thousands) | ||||||||
|
|
|
|
| |||||
|
|
| For the Years Ended |
| |||||
|
|
| 2016 |
|
| 2015 |
| ||
|
|
|
|
|
|
|
| ||
| Cash flows from operating activities: |
|
|
|
|
|
| ||
| Net loss |
| $ | (22,135 | ) |
| $ | (15,894 | ) |
| Loss from discontinued operations, net of income taxes |
|
| (2,491 | ) |
|
| (1,950 | ) |
|
|
|
|
|
|
|
|
|
|
| Net loss from continuing operations |
|
| (19,644 | ) |
|
| (13,944 | ) |
|
|
|
|
|
|
|
|
|
|
| Adjustments to reconcile net loss to net cash provided (used) by operating activities: |
|
|
|
|
|
|
|
|
| Depreciation and amortization |
|
| 5,299 |
|
|
| 5,950 |
|
| Amortization of deferred loan costs |
|
| 403 |
|
|
| 389 |
|
| Reduction in value of assets |
|
| 17,736 |
|
|
| 11,405 |
|
| Debt modification fee |
|
| 629 |
|
|
| - |
|
| Stock-based compensation |
|
| - |
|
|
| 100 |
|
| Bad debt expense |
|
| 193 |
|
|
| 364 |
|
| Fair value adjustments to contingent payment liability |
|
| (372 | ) |
|
| (1,065 | ) |
| Gain on indemnification-preferred shares holdback |
|
| - |
|
|
| (124 | ) |
| Deferred taxes |
|
| (7,941 | ) |
|
| (3,273 | ) |
| Changes in operating assets and liabilities: |
|
|
|
|
|
|
|
|
| Cash paid upon assumption of net liabilities from discontinued operations |
|
| (7 | ) |
|
| - |
|
| Receivables |
|
| 2,768 |
|
|
| 4,582 |
|
| Prepaid expenses and other assets |
|
| 471 |
|
|
| 217 |
|
| Accounts payable |
|
| (13 | ) |
|
| (2,101 | ) |
| Accrued interest and other - Pelican |
|
| 111 |
|
|
| - |
|
| Accrued expenses and other liabilities |
|
| 376 |
|
|
| 206 |
|
|
|
|
|
|
|
|
|
|
|
| Net cash provided by continuing operations |
|
| 9 |
|
|
| 2,706 |
|
| Net cash provided by (used in) discontinued operations |
|
| (47 | ) |
|
| 1,186 |
|
|
|
|
|
|
|
|
|
|
|
| Net cash provided by (used in) operating activities |
|
| (38 | ) |
|
| 3,892 |
|
|
|
|
|
|
|
|
|
|
|
| Cash flows from investing activities: |
|
|
|
|
|
|
|
|
| Purchases of property and equipment |
|
| (389 | ) |
|
| (1,427 | ) |
| Proceeds from disposal of property and equipment |
|
| 465 |
|
|
| 311 |
|
|
|
|
|
|
|
|
|
|
|
| Net cash provided by (used in) continuing operations |
|
| 76 |
|
|
| (1,116 | ) |
| Net cash provided by discontinued operations |
|
| 39 |
|
|
| 13 |
|
|
|
|
|
|
|
|
|
|
|
| Net cash provided by (used in) investing activities |
|
| 115 |
|
|
| (1,103 | ) |
|
|
|
|
|
|
|
|
|
|
| Cash flows from financing activities: |
|
|
|
|
|
|
|
|
| Proceeds from issuance of common stock, net |
|
| - |
|
|
| 3,863 |
|
| Proceeds from line of credit - Pelican |
|
| 494 |
|
|
| - |
|
| Repayment of long-term debt |
|
| (348 | ) |
|
| (7,311 | ) |
| Payment of contingent payment liability |
|
| - |
|
|
| (862 | ) |
| Payment of deferred loan costs |
|
| - |
|
|
| (24 | ) |
|
|
|
|
|
|
|
|
|
|
| Net cash provided by (used in) continuing operations |
|
| 146 |
|
|
| (4,334 | ) |
| Net cash used by discontinued operations |
|
| (9 | ) |
|
| (8 | ) |
|
|
|
|
|
|
|
|
|
|
| Net cash provided by (used in) financing activities |
|
| 137 |
|
|
| (4,342 | ) |
|
|
|
|
|
|
|
|
|
|
| Net increase (decrease) in cash, cash equivalents, and restricted cash |
|
| 214 |
|
|
| (1,553 | ) |
|
|
|
|
|
|
|
|
|
|
| Cash, cash equivalents, and restricted cash, beginning of period |
|
| 497 |
|
|
| 2,050 |
|
|
|
|
|
|
|
|
|
|
|
| Cash, cash equivalents, and restricted cash, end of period |
|
| 711 |
|
|
| 497 |
|
The accompanying notes are an integral part of these consolidated financial statements.
| F-6 |
| Table of Contents |
NOTE 1 — NATURE OF OPERATIONS AND BASIS OF PRESENTATION
Nature of Operations
Aly Energy Services, Inc., together with its subsidiaries (“Aly Energy” or “the Company”), provides oilfield services, including equipment rental and solids control services to exploration and production companies. The Company operates in select oil and natural gas basins of the contiguous United States. Throughout this report, we refer to Aly Energy and subsidiaries as “we”, “our” or “us”. References to financial results and operations of the Company in these notes to the consolidated financial statements are limited to continuing operations unless otherwise specified.
On October 26, 2012, we acquired all of the stock of Austin Chalk Petroleum Services Corp. (“Austin Chalk”). Austin Chalk provides surface rental equipment as well as roustabout services which include the rig-up and rig-down of equipment and the hauling of equipment to and from the customer’s location.
On April 15, 2014, we acquired the equity interests of United Centrifuge, LLC (“United”) as well as certain assets used in United’s business that were owned by related parties of United (collectively the “United Acquisition”). In connection with the United Acquisition, United merged with and into Aly Centrifuge Inc. (“Aly Centrifuge”), a wholly-owned subsidiary of Aly Energy. United operates within the solids control and fluids management sectors of the oilfield services and rental equipment industry, offering its customers the option of renting centrifuges and auxiliary solids control equipment without personnel or the option of paying for a full-service solids control package which includes operators on-site 24 hours a day.
Discontinued Operations
On July 1, 2014, we acquired all of the issued and outstanding stock of Evolution Guidance Systems Inc. (“Evolution”), an operator of Measurement-While-Drilling (“MWD”) downhole tools. From July 2014 through October 2016, Evolution provided directional drilling and MWD services to a variety of exploration and production companies. On October 26, 2016, we abandoned these operations as a part of a restructuring transaction. The abandonment of these operations meets the criteria established for recognition as discontinued operations under generally accepted accounting principles in the United States of America (“U.S. GAAP”). Therefore, the financial results of our directional drilling and MWD services are presented as discontinued operations in the Company’s consolidated financial statements. Assets and liabilities related to the discontinued operations are included in the line item “Assets associated with discontinued operations” and “Liabilities associated with discontinued operations”, respectively, on the consolidated balance sheets for all periods presented. The results of the discontinued operations are included in the line item “Loss from discontinued operations, net of income taxes” on the consolidated statements of operations for all periods presented. Cash flows from discontinued operations appear in the line items “Net cash provided (used) by discontinued operations” on the consolidated statements of cash flows”. See “Note 15 – Discontinued Operations” for more information.
Basis of Presentation
Aly Energy has three wholly-owned subsidiaries, Aly Operating Inc. (“Aly Operating”) of which Austin Chalk is a wholly-owned subsidiary, Aly Centrifuge and Evolution. We operate as one business segment which services customers within the United States.
The consolidated financial statements have been prepared in conformity with U.S. GAAP and include the accounts of Aly Energy Services, Inc. and each of its subsidiaries in the consolidated balance sheets as of December 31, 2016 and 2015 and the related consolidated statements of operations, stockholders’ equity (deficit), and cash flows for each of the years then ended. All significant intercompany transactions and account balances have been eliminated upon consolidation.
Reclassifications
Certain reclassifications, including a reclassification related to the adoption of ASU 2015-03, Interest - Imputation of Interest (Subtopic 835-30): Simplifying the Presentation of Debt Issuance Costs, have been made to prior period consolidated financial statements to conform to the current period presentations. These reclassifications had no effect on our consolidated results of operations or cash flows. See “Note 6 – Long-term Debt” for more information.
Subsequent Events
We conducted our subsequent events review through the date these consolidated financial statements were filed with the U.S. Securities and Exchange Commission (“SEC”).
| F-7 |
| Table of Contents |
NOTE 2 — RECENT DEVELOPMENTS
Operational Restructuring
Our activity is tied directly to the rig count and, even though we instituted significant cost cutting measures beginning in 2015, we were unable to cut costs enough to match the decline in our business. As a result, as of December 31, 2015, we were in default of our credit agreement with Wells Fargo Bank, National Association (“Wells Fargo”).
Throughout 2015, in an effort to mitigate the significant declines in pricing and utilization of our equipment, we committed to a reorganization initiative to strengthen our sales and marketing efforts, consolidate support functions, and operate more efficiently. The reorganization effort included, but was not limited to, training our salesforce to enable the cross-selling of our product lines in certain geographical markets, sharing a common support services infrastructure across all reporting units, reducing headcount and wage rates, and rebranding and launching a new web site to increase awareness of our service lines. We recognized some benefit from these measures in late 2015 resulting in increased gross margins and lower selling, general and administrative expenses when compared to the first half of 2015.
During the year ended December 31, 2016, we entered into a series of forbearance agreements with our lender. Under the forbearance agreements, among other provisions, the lenders agreed to forbear from exercising their remedies under the credit agreement. These forbearance agreements permitted us to operate within the parameters of our normal course of business despite the continuing default under the credit agreement. Without these forbearance agreements, our outstanding debt would have been immediately due and payable. Throughout 2016, we remained in default and we did not have sufficient liquidity to repay all of the outstanding debt to the lender at any point during the year ($20.1 million as of December 31, 2015). As such, we may have been forced to file for protection under Chapter 11 of the U.S. Bankruptcy Code.
In early 2016, we were hopeful that a successful operational restructuring would facilitate negotiations to modify the terms of our existing credit facility with Wells Fargo. Our operational restructuring in 2016 consisted of severe cost cuts which were incremental to the year-over-year cost cuts already achieved in 2015 when compared to 2014. In 2016, significant cost savings were primarily generated by:
|
| · | reductions of our employee base, both field employees and sales and administrative employees, to a headcount of approximately 50 as of December 31, 2016 from approximately 125 as of December 31, 2015, |
|
| · | reduction in employer contributions to employee benefits, |
|
| · | closures of certain operating yards and administrative facilities, |
|
| · | strategic decision to cease operations in the northeast which resulted in the reduction of costs related to operating in an incremental market, |
|
| · | modifications to insurance policies, including general liability and workers’ compensation policies, resulting in a $0.5 million or 15.5% reduction in the cost of insurance to $0.6 million for the year ended December 31, 2016 from $1.1 million for the year ended December 31, 2015, |
|
| · | minimization of repair and maintenance activities, resulting in a $0.4 million or 50.0% reduction of repair and maintenance expenses to $0.4 million for the year ended December 31, 2016 from $0.8 million for the year ended December 31, 2015, and |
|
| · | elimination of investments in equipment, unless required to service an existing customer, resulting in a reduction of capital expenditures to $0.4 million for the year ended December 31, 2016 from $2.5 million for the year ended December 31, 2015. |
We also achieved significant cost savings from the decrease in third party costs, such as sub-rental equipment and trucking, and other variable costs which declined with the decrease in activity.
In order to further support our working capital needs, we identified and sold idle and underutilized assets. During 2016, we realized aggregate proceeds from sales of approximately $0.8 million of which $0.5 million and $0.3 million was used to fund working capital needs and pay down debt, respectively (see “Note 4 – Reduction in Value of Assets and Other Charges”).
Capital Restructuring
Despite our successful operational restructuring efforts, particularly during the first half of 2016, the decline in our activity levels and the declines in customer pricing outpaced the impact of our cost reductions and it became evident that a capital restructuring would also be necessary to continue operations and position our business for an industry turnaround.
| F-8 |
| Table of Contents |
In the second quarter of 2016, certain of the Company’s principal stockholders (“Shareholder Group”) began negotiations with Wells Fargo with the objective of consummating a recapitalization transaction (the “Recapitalization”) whereby our obligations under the credit agreement and the outstanding capital leases in favor of Wells Fargo’s equipment finance affiliate and certain other obligations of Aly Energy (collectively the “Aly Senior Obligations”) would be restructured. In August 2016, the Shareholder Group was introduced to a third party, Tiger Finance, LLC (“Tiger”), to provide bridge financing and to extend forbearance until such date as sufficient capital could be raised to complete the Recapitalization.
In September 2016, the Shareholder Group formed Permian Pelican, LLC (“Pelican”) with the objective of raising capital and executing the steps necessary to complete the restructuring, inclusive of successfully effecting the exchange of the Aly Operating redeemable preferred stock, Aly Centrifuge redeemable preferred stock, Aly Centrifuge subordinated debt and liability for a contingent payment into approximately 10% of our common stock on a fully diluted basis.
Effective January 31, 2017, the Recapitalization was completed through the execution and delivery of a Securities Exchange Agreement and a Second Amended and Restated Credit Agreement, and as a result, the new credit facility, now with Pelican, consisted of a term loan of $5.1 million and a revolving facility of up to $1.0 million as of January 31, 2017. Availability under the revolving credit facility is determined by a borrowing base calculated as 80% of eligible receivables (receivables less than 90 days old).
Subsequent to the Recapitalization, we entered into several further amendments to capitalize on improved market conditions and increased activity in our business:
|
| · | Amendment No. 1, effective March 1, 2017, provided for a delayed draw term loan to be added to the credit facility for the purpose of financing capital expenditures. The agreement permitted us to draw on the delayed draw term loan from time-to-time up until the maturity date of the facility in order to fund up to 80% of the cost of capital expenditures subject to a $0.5 million limit on aggregate borrowings. |
|
| · | Amendment No. 2, effective May 23, 2017, increased the maximum revolving credit amount from $1.0 million to $1.8 million and extended the final maturity date of the facility to December 31, 2019. In consideration of the increase in the revolving credit facility and the extension of the final maturity date, we agreed to issue to Pelican, the lender, as an amendment fee, 1,200 shares of our Series A Convertible Preferred Stock. |
|
| · | Amendment No. 3, effective June 15, 2017, modified maximum potential borrowings under each of the revolving credit facility and the delayed draw term loan without changing the aggregate available borrowings under the credit facility. The amendment reduced the maximum revolving credit amount from $1.8 million to $1.0 million and increased the maximum delayed draw loan borrowings from $0.5 million to $1.3 million and the amendment also increased permitted draws on the delayed draw loan from 80% of the cost of capital expenditures being funded to 90% of the cost of capital expenditures being funded. |
To the extent there is free cash flow as defined in the credit agreement, principal payments of 50% of such free cash flow are due annually. The maturity date of all remaining outstanding balances under the credit facility is December 31, 2019.
The obligations under the credit facility are guaranteed by all of our subsidiaries and secured by substantially all of our assets. The credit agreement contains customary events of default and covenants including restrictions on our ability to incur additional indebtedness, make capital expenditures, pay dividends or make other distributions, grant liens and sell assets. The credit facility does not include any financial covenants. We are in full compliance with the credit facility as of June 30, 2017.
As of June 30, 2017, there were outstanding borrowings of $5.0 million, $0.8 million, and $0.3 million on the term loan, revolving credit facility, and delayed draw term loan, respectively. As of June 30, 2017, we have the availability to borrow an incremental $0.2 million under the revolving credit facility and, if we have capital expenditures which are eligible to be financed, an incremental $1.0 million under the delayed draw term loan to finance 90% of such expenditures.
Unaudited Consolidated Pro Forma Balance Sheet
The following unaudited consolidated pro forma financial information gives effect to the Recapitalization, in a transaction accounted for as both a troubled debt restructuring and extinguishment of debt and other liabilities held as of December 31, 2016. The Company’s capital structure was significantly impacted as a result of the Recapitalization which was completed on January 31, 2017.
The unaudited consolidated pro forma financial information presented herein is based on the historical consolidated financial statements of the Company after giving effect to the Recapitalization and the assumptions and adjustments as described below.
| F-9 |
| Table of Contents |
To complete the transaction, the Company’s directors and principal stockholders formed and organized Pelican. Pursuant to the Recapitalization, Pelican agreed to acquire the Company’s outstanding secured indebtedness with Wells Fargo and its equipment affiliate, provided the Company was successful in effecting the exchange of the Aly Operating redeemable preferred stock, Aly Centrifuge redeemable preferred stock, Aly Centrifuge subordinated debt and liability for a contingent payment into approximately 10% of our common stock on a fully diluted basis.
The Recapitalization consisted of three restructuring events which took place in the period beginning October 26, 2016 and ending on January 31, 2017. The first two restructuring events occurred before December 31, 2016 and any impact is presented in the Company’s historical consolidated financial statements. Below is a description of each event:
The first restructuring event occurred on October 26, 2016 when Tiger acquired the Aly Senior Obligations from Wells Fargo and its equipment affiliate. Simultaneously, Tiger entered into an assignment agreement with Pelican whereby it agreed to sell the Aly Senior Obligations to Pelican on the conditions that (i) Pelican provide $0.5 million of unsecured working capital financing to the Company pending the closing and (ii) the Company transfer to Tiger (in consideration of Tiger’s reduction of the Aly Senior Obligations in the amount of $2.0 million) certain excess equipment and vehicles which the Company was not utilizing and considered unnecessary for its continuing operations.
As a result of the above, we transferred property and equipment with an estimated fair value of $2.6 million, inclusive of $0.4 million of assets associated with discontinued operations, to Tiger and recognized a corresponding reduction in the Aly Senior Obligations of $2.0 million and debt modification fee of $0.6 million. Property and equipment transferred had an aggregate net book value of $18.6 million resulting in our recording an impairment charge of $16.0 million, inclusive of a $0.4 million impairment associated with discontinued operations (see further discussion in “Note 4 – Reduction in Value of Assets and Other Charges” and “Note 15 – Discontinued Operations”). As part of this transaction and upon satisfaction of such conditions, Tiger extended the forbearance period to December 9, 2016.
The second restructuring event occurred on December 12, 2016 when Pelican acquired the Aly Senior Obligations from Tiger. As the new holder of the Aly Senior Obligations, Pelican further extended the forbearance period for the obligations to January 31, 2017, provided the Company was successful in completing the third and final restructuring event on or before such date.
Effective January 31, 2017, the final restructuring event occurred and the Recapitalization was completed which resulted in the following:
|
| · | an exchange of certain of the Company’s outstanding obligations (namely, Aly Operating redeemable preferred stock, Aly Centrifuge redeemable preferred stock, Aly Centrifuge subordinated debt and its contingent payment liability) for approximately 10% of our common stock, or 7,111,981 common shares, on a fully diluted basis; |
|
| · | an exchange of certain amendments to the Aly Senior Obligations (namely, a $16.1 million principal reduction, removal of restrictive covenants and extended maturity of payment obligations) for shares of our Series A Convertible Preferred Stock which represented approximately 80% of our common stock, or 53,628,842 common shares, on a fully diluted basis as of January 31, 2017 (liquidation preference of $16.1 million, or $1,000 per share); and |
|
| · | the formation of a new credit agreement with Pelican (consisting of a $5.1 million term loan and $1.0 million revolving credit facility) with an extended maturity date of December 31, 2018. |
The Recapitalization had a significant impact to our capital structure and to our consolidated financial statements, including a significant dilutive effect to those shareholders who held common stock immediately before the transaction was completed. The unaudited consolidated pro forma balance sheet as of December 31, 2016 gives effect to the Recapitalization impact on the capital structure as if it occurred on December 31, 2016.
The unaudited consolidated pro forma balance sheet was prepared in accordance with the regulations of the SEC. The pro forma adjustments reflecting the Recapitalization are based upon troubled debt restructuring (“TDR”) and debt extinguishment accounting in accordance with GAAP and upon the assumptions set forth below.
The historical consolidated financial information has been adjusted to give pro forma effect to events that are (i) directly attributable to the Recapitalization and (ii) factually supportable. The pro forma adjustments are based on management’s estimates of the fair value of equity exchanged and have been prepared to illustrate the estimated effect of the Recapitalization and certain other adjustments.
| F-10 |
| Table of Contents |
The unaudited consolidated pro forma balance sheet does not give effect to the potential impact of current financial conditions, regulatory matters, operating efficiencies or other savings or expenses that may be associated with the Recapitalization. The unaudited consolidated pro forma balance sheet has been prepared for illustrative purposes only and is not necessarily indicative of the financial position in future periods or the financial position that would have been realized had the Company completed the Recapitalization during the specified period.
The following unaudited consolidated pro forma balance sheet presents the completion of the Recapitalization as of December 31, 2016. Adjustments have been recorded within the unaudited consolidated pro forma balance sheet to reflect the effects of the Recapitalization in accordance with ASC 470, including (i) the exchange of debt and equity securities accounted for as a troubled debt restructuring and (ii) the issuance of preferred shares in exchange for the extinguishment of long-term debt and other obligations and for the issuance of a new credit facility (in thousands):
|
|
|
|
|
| Recapitalization Adjustments |
|
|
| ||||||||||||
|
|
| As of |
|
| TDR Pro |
|
|
|
| Credit Facility |
|
|
|
|
|
| ||||
|
|
| December 31, |
|
| Forma |
|
|
|
| Pro Forma |
|
|
|
|
| |||||
|
|
| 2016 |
|
| Adjustments (i) |
|
| Notes |
| Adjustments (ii) |
|
| Notes |
| Pro Forma |
| ||||
| ASSETS |
|
|
|
|
|
|
|
|
|
|
|
|
|
|
|
| ||||
| Current assets |
|
|
|
|
|
|
|
|
|
|
|
|
|
|
|
| ||||
| Cash and cash equivalents |
| $ | 681 |
|
| $ | - |
|
|
|
| $ | - |
|
|
|
| $ | 681 |
|
| Restricted cash |
|
| 30 |
|
|
|
|
|
|
|
|
|
|
|
|
|
|
| 30 |
|
| Receivables, net |
|
| 1,448 |
|
|
|
|
|
|
|
|
|
|
|
|
|
|
| 1,448 |
|
| Prepaid expenses and other current assets |
|
| 496 |
|
|
| (31 | ) |
| (b) |
|
|
|
|
|
|
|
| 465 |
|
| Total current assets |
|
| 2,655 |
|
|
| (31 | ) |
|
|
|
| - |
|
|
|
|
| 2,624 |
|
|
|
|
|
|
|
|
|
|
|
|
|
|
|
|
|
|
|
|
|
|
|
| Property and equipment, net |
|
| 28,226 |
|
|
|
|
|
|
|
|
|
|
|
|
|
|
| 28,226 |
|
| Intangible assets, net |
|
| 4,931 |
|
|
|
|
|
|
|
|
|
|
|
|
|
|
| 4,931 |
|
| Other assets |
|
| 14 |
|
|
|
|
|
|
|
|
|
|
|
|
|
|
| 14 |
|
|
|
|
|
|
|
|
|
|
|
|
|
|
|
|
|
|
|
|
|
|
|
| Total Assets |
| $ | 35,826 |
|
| $ | (31 | ) |
|
|
| $ | - |
|
|
|
| $ | 35,795 |
|
|
|
|
|
|
|
|
|
|
|
|
|
|
|
|
|
|
|
|
|
|
|
| LIABILITIES AND STOCKHOLDERS' EQUITY (DEFICIT) |
|
|
|
|
|
|
|
|
|
|
|
|
|
|
|
|
|
|
|
|
| Current liabilities |
|
|
|
|
|
|
|
|
|
|
|
|
|
|
|
|
|
|
|
|
| Accounts payable |
| $ | 912 |
|
| $ | - |
|
|
|
| $ | - |
|
|
|
| $ | 912 |
|
| Accrued expenses |
|
| 1,163 |
|
|
| (263 | ) |
| (a) |
|
|
|
|
|
|
|
| 900 |
|
| Accrued interest and other - Pelican |
|
| 1,277 |
|
|
|
|
|
|
|
|
| (1,277 | ) |
| (c) |
|
| - |
|
| Current portion of long-term debt |
|
| 1,593 |
|
|
| (1,500 | ) |
| (a) |
|
|
|
|
| (c) |
|
| 93 |
|
| Current portion of long-term debt - Pelican |
|
| 18,880 |
|
|
|
|
|
|
|
|
| (18,880 | ) |
| (c) (d) |
|
| - |
|
| Current portion of contingent payment liability |
|
| 810 |
|
|
| (810 | ) |
| (a) |
|
|
|
|
|
|
|
| - |
|
| Total current liabilities |
|
| 24,635 |
|
|
| (2,573 | ) |
|
|
|
| (20,157 | ) |
|
|
|
| 1,905 |
|
|
|
|
|
|
|
|
|
|
|
|
|
|
|
|
|
|
|
|
|
|
|
| Long-term debt, net |
|
| 10 |
|
|
|
|
|
|
|
|
|
|
|
|
|
|
| 10 |
|
| Long-term debt, net - Pelican |
|
| 1,315 |
|
|
|
|
|
|
|
|
| 4,235 |
|
| (c) (d) |
|
| 5,550 |
|
| Other long-term liabilities |
|
| 708 |
|
|
|
|
|
|
|
|
|
|
|
|
|
|
| 708 |
|
| Total liabilities |
|
| 26,668 |
|
|
| (2,573 | ) |
|
|
|
| (15,922 | ) |
|
|
|
| 8,173 |
|
|
|
|
|
|
|
|
|
|
|
|
|
|
|
|
|
|
|
|
|
|
|
|
|
|
|
|
|
|
|
|
|
|
|
|
|
|
|
|
|
|
|
|
|
| Aly Operating redeemable preferred stock |
|
| 4,924 |
|
|
| (4,924 | ) |
| (b) |
|
|
|
|
|
|
|
| - |
|
| Aly Centrifuge redeemable preferred stock |
|
| 10,080 |
|
|
| (10,080 | ) |
| (b) |
|
|
|
|
|
|
|
| - |
|
|
|
|
| 15,004 |
|
|
| (15,004 | ) |
|
|
|
| - |
|
|
|
|
| - |
|
|
|
|
|
|
|
|
|
|
|
|
|
|
|
|
|
|
|
|
|
|
|
| Stockholders' equity (deficit) |
|
|
|
|
|
|
|
|
|
|
|
|
|
|
|
|
|
|
|
|
| Series A Convertible Preferred Stock |
|
| - |
|
|
|
|
|
|
|
|
| 6,435 |
|
| (c) |
|
| 6,435 |
|
| Common stock of $0.001 par value |
|
| 7 |
|
|
| 7 |
|
| (a)(b) |
|
|
|
|
|
|
|
| 14 |
|
| Additional paid-in-capital |
|
| 28,307 |
|
|
| 15,164 |
|
| (a)(b) |
|
| 9,487 |
|
| (c) |
|
| 52,958 |
|
| Accumulated deficit |
|
| (34,158 | ) |
|
| 2,375 |
|
| (a)(b) |
|
|
|
|
|
|
|
| (31,783 | ) |
| Treasury stock, 225 shares at cost |
|
| (2 | ) |
|
|
|
|
|
|
|
|
|
|
|
|
|
| (2 | ) |
| Total stockholders' equity (deficit) |
|
| (5,846 | ) |
|
| 17,546 |
|
|
|
|
| 15,922 |
|
|
|
|
| 27,622 |
|
|
|
|
|
|
|
|
|
|
|
|
|
|
|
|
|
|
|
|
|
|
|
| Total liabilities and stockholders' equity (deficit) |
| $ | 35,826 |
|
| $ | (31 | ) |
|
|
| $ | - |
|
|
|
| $ | 35,795 |
|
| F-11 |
| Table of Contents |
Except for the Pelican exchange, each exchange was accounted for as a troubled debt restructuring (“TDR”) since an equity interest in the Company was issued to fully satisfy each debt. A gain on TDR is recognized for the excess of the carrying amount of the debt over the fair value of each equity interest granted. The impact of the Recapitalization occurring subsequent to December 31, 2016 includes a “gain on the extinguishment of debt and other liabilities” from the debtors of Aly Centrifuge subordinated debt and the contingent payment liability and a “gain on the extinguishment of redeemable preferred stock” from the holders of Aly Operating redeemable preferred stock and Aly Centrifuge redeemable preferred stock. The share price of common stock as of January 31, 2017 of $0.12 per share was used as the basis of fair value for each equity interested granted.
The TDR pro forma adjustments in column (i) and in the below table are as follows:
|
| (a) | Represents the exchange of subordinated debt and contingent payment liability for common stock resulting in a gain of $2.4 million, or $0.36 per share, on the consolidated statement of operations and recorded as an “Issuance of common stock in exchange for the extinguishment of debt and other liabilities” on the consolidated statement of changes in stockholders’ equity (deficit). |
| Gain on the Extinguishment of Debt and Other Liabilities | |||||||
|
|
|
|
|
|
| ||
| Debt and Other Obligations Extinguished |
| Common Stock Issued |
|
| Gain | ||
|
|
|
|
|
|
| ||
| Subordinated Debt and accrued interest of $1.5 million and $0.3 million, respectively |
|
| 1,200,000 |
|
| $1.6 million | |
|
|
|
|
|
|
|
| |
| Contingent payment liability of $0.8 million |
|
| 457,494 |
|
| $0.8 million | |
|
| (b) | Represents the exchange of Aly Operating redeemable preferred stock and Aly Centrifuge redeemable preferred stock for common stock resulting in a gain of $14.4 million, or $2.14 per share, and recorded as an “Issuance of common stock in exchange for the extinguishment of redeemable preferred stock” on the consolidated statement of changes in stockholders’ equity (deficit). |
| Gain on the Extinguishment of Redeemable Preferred Stock | |||||||
|
|
|
|
|
|
| ||
| Redeemable Preferred Stock and Other Obligations |
| Common Stock Issued |
|
| Gain Included in
Additional Paid-in Capital | ||
|
|
|
|
|
|
| ||
| Aly Centifuge preferred and accrued dividends of $8.9 million and $1.2 million, respectively |
|
| 3,039,517 |
|
| $9.8 million | |
|
|
|
|
|
|
|
| |
| Aly Operating preferred and accrued dividends of $4.0 million and $0.9 million, respectively |
|
| 2,414,971 |
|
| $4.6 million | |
| F-12 |
| Table of Contents |
Given the nature of the related party relationship between the Company and Pelican, the extinguishment of our Aly Senior Obligations was accounted for as a capital transaction whereby we issued Series A Convertible Preferred Stock in exchange for the extinguishment of our Aly Senior Obligations and the issuance of a new credit facility; which resulted in a gain on the extinguishment of debt and other liabilities calculated as the amount above the estimated fair value of the equity interest granted. The share price of common stock as of January 31, 2017 of $0.12 per share was used as the basis of fair value for the equity interested granted.
The credit facility pro forma adjustments in column (ii) and in the below table are as follows:
|
| (c) | Represents the partial extinguishment and exchange of our Aly Senior Obligations ($16.1 million principal reduction) for shares of our Series A Convertible Preferred Stock resulting in a gain of $9.5 million recorded as an “Issuance of preferred shares in exchange for the extinguishment of debt and other liabilities - Pelican” on the consolidated statement of changes in stockholders’ equity (deficit). The components of Aly Senior Obligations are as follows (in thousands): |
| Aly Senior Obligations as of December 31, 2016 (c) | ||||
|
|
|
|
| |
| Debt and Other Obligations Extinguished |
| Amount |
| |
|
|
|
|
| |
| Credit facility |
| $ | 17,772 |
|
| Accrued fees and interest on credit facility |
|
| 1,254 |
|
| Capital lease obligations |
|
| 1,930 |
|
| Accrued interest on capital lease obligations |
|
| 19 |
|
| Line of credit - Pelican |
|
| 498 |
|
|
|
|
|
|
|
| Total |
| $ | 21,473 |
|
|
| (d) | Represents the recording of our new credit agreement with Pelican consisting of a $5.1 million term loan and $0.5 million outstanding under a revolving credit facility (which was $5.0 million and $0.8 million, respectively, as of June 30, 2017 in addition to $0.3 million outstanding under a delayed draw term loan with Pelican) upon the full extinguishment of our old credit facility. |
| F-13 |
| Table of Contents |
NOTE 3 — SUMMARY OF SIGNIFICANT ACCOUNTING POLICIES
Use of Estimates
The preparation of consolidated financial statements in conformity with U.S. GAAP requires management to make certain estimates and assumptions. These estimates and assumptions affect the reported amounts of assets and liabilities, the disclosure of contingent assets and liabilities at the balance sheet date and the amounts of revenue and expenses recognized during the reporting period. Areas where critical accounting estimates are made by management include:
|
| · | Allowance for doubtful accounts, |
|
| · | Depreciation and amortization of property and equipment and intangible and other assets, |
|
| · | Impairment of property and equipment, intangible and other assets, and goodwill, |
|
| · | Litigation settlement accrual, |
|
| · | Contingent payment liability, and |
|
| · | Income taxes. |
The Company analyzes its estimates based on historical experience and various other indicative assumptions that it believes to be reasonable under the circumstances. Under different assumptions or conditions, the actual results could differ, possibly materially from those previously estimated. Many of the conditions impacting these assumptions are outside of the Company’s control.
Revenue Recognition
We generate revenue primarily from renting equipment at per-day rates. In connection with certain of our solids control operations, we also provide personnel to operate our equipment at the customer’s location at per-day or per-hour rates. In addition, we may provide equipment transportation and rig-up/rig-down services to the customer at flat rates per job or at an hourly rate. Revenue is recognized when it is realized or realizable and earned and when collectability is reasonably assured.
We present our revenue net of any sales tax charged to our customers which is required to be remitted to local or state governmental taxing authorities. Reimbursements for the purchase of supplies, equipment, personnel services, shipping and other services provided at the request of our customers are recorded as revenue when incurred. The related costs are recorded as operating expenses when incurred.
Major Customers and Concentration of Credit Risk
The Company’s assets that are potentially exposed to concentrations of credit risk consist primarily of cash and trade receivables.
The financial institutions in which the Company transacts business are large, investment grade financial institutions which are “well capitalized” under applicable regulatory capital adequacy guidelines, thereby minimizing its exposure to credit risks for deposits in excess of federally insured amounts.
The majority of the Company’s trade receivables are due from major and independent oil and gas companies operating within the U.S. land-based oil and gas industry. The industry has been, and will likely continue to be, characterized by significant volatility which may negatively impact our customers from time-to-time. The Company evaluates the financial strength of its customers quarterly and provides allowances for probable credit losses when deemed necessary.
During the year ended December 31, 2016, the Company derived revenue from over 50 unique customers of which the top three customers generated approximately $4.8 million, or 43.5%, of our revenue. Amounts due from these customers included in accounts receivable and unbilled receivables as of December 31, 2016 are approximately $0.6 million.
During the year ended December 31, 2015, approximately $9.0 million or 35.4% of our revenue were derived from three customers. One of those customers accounted for 16.2% of our revenue. Amounts due from these customers included in accounts receivable and unbilled receivables as of December 31, 2015 are approximately $1.0 million.
| F-14 |
| Table of Contents |
Cash and Cash Equivalents
For purposes of the consolidated statements of cash flows, cash is defined as cash on-hand and balances in operating bank accounts. We consider all highly liquid investments purchased with an original maturity of three months or less to be cash equivalents. Restricted cash serves as collateral for the Company’s corporate credit card program.
Accounts Receivable, Unbilled Receivables and Allowance for Doubtful Accounts
Accounts receivable and unbilled receivables are stated at the amount which has been or will be billed to customers. Once billed, customer payments are typically due within 30 days. We provide an allowance for doubtful accounts based upon a review of outstanding receivables, historical collection information, existing economic conditions and specific identification. Provisions for doubtful accounts are recorded when it is deemed probable that the customer will not make the required payments. As of December 31, 2016 and 2015, the allowance for doubtful accounts was approximately $0.6 million and $0.4 million, respectively.
Property and Equipment
Property and equipment are recorded at cost less accumulated depreciation and amortization. The cost of property and equipment currently in service less its residual value is depreciated, including property and equipment financed by capital leases, on a straight-line basis over the estimated useful lives of the related assets. A residual value of 20% is used for asset types deemed to have a salvage value. Typically, these assets contain a large amount of iron in their construction. Leasehold improvements are amortized on a straight-line basis over the shorter of their economic lives or the lease term.
Estimated useful lives of property and equipment are as follows:
| Machinery and equipment | 1 - 20 years |
| Vehicles, trucks and trailers | 5 - 7 years |
| Office furniture, fixtures and equipment | 3 - 7 years |
| Leasehold improvements | Remaining lease term |
| Buildings | 20 years |
When property and equipment are sold or otherwise disposed of, the asset account and related accumulated depreciation account are relieved, and the impact of any resulting gain or loss is recognized within “Reduction in value of assets” in the consolidated statement of operations for the period. Maintenance and repairs, which do not improve or extend the life of the related assets, are charged to expense when incurred. Refurbishments and renewals are capitalized when the value of the equipment is enhanced for an extended period.
Reduction in Value of Long-Lived Assets
Long-lived assets, such as property and equipment and purchased intangibles subject to amortization, are reviewed for impairment whenever events or changes in circumstances indicate that the carrying amount of such assets may not be recoverable. Recoverability of assets to be held and used is assessed by a comparison of the carrying amount of such assets to their fair value calculated, in part, by the estimated undiscounted future cash flows expected to be generated by the assets. Cash flow estimates are based upon, among other things, historical results adjusted to reflect the best estimate of future market rates, utilization levels, and operating performance. Estimates of cash flows may differ from actual cash flows due to, among other things, changes in economic conditions or changes in an asset’s operating performance. The Company’s assets are grouped by reporting unit for the impairment testing, which represents the lowest level of identifiable cash flows. If the asset grouping’s fair value is less than the carrying amount of those items, impairment losses are recorded in the amount by which the carrying amount of such assets exceeds the fair value. Assets to be disposed of are reported at the lower of the carrying amount or fair value less estimated costs to sell. The net carrying value of assets not fully recoverable is reduced to fair value. The estimate of fair value represents the Company’s best estimate based on industry trends and reference to market transactions and is subject to variability. The oil and gas industry is cyclical and estimates of the period over which future cash flows will be generated, as well as the predictability of these cash flows, can have a significant impact on the carrying values of these assets and, in periods of prolonged down cycles, may result in impairment charges. Due to the steep downturn in the oilfield services industry which began in late 2014 and continued throughout much of 2016, we evaluated recoverability quarterly. For each quarter, our estimated undiscounted net cash flow exceeded the carrying amount of the assets, and, as such, no impairment losses were recognized; however, in the quarters ended June 30, 2016 and September 30, 2016, we recognized an impairment in connection with the Recapitalization and an impairment in connection with our discontinued operations. See “Note 4 – Reduction in Value of Assets and Other Charges” and “Note 15 – Discontinued Operations“ for a further discussion of the reduction in value recorded during 2016 and 2015.
| F-15 |
| Table of Contents |
Intangible Assets
The Company’s intangible assets with finite lives include customer relationships, trade names, non-compete agreements, and various other contractual agreements. The value of customer relationships is estimated using the income approach, specifically the excess earnings method. The excess earnings method consists of discounting to present value the projected cash flows attributable to the customer relationships, with consideration given to customer contract renewals, the importance or lack thereof of existing customer relationships to the Company’s business plan, income taxes and required rates of return. The value of trade names is estimated using the relief-from-royalty method of the income approach. This approach is based on the assumption that in lieu of ownership, a company would be willing to pay a royalty in order to exploit the related benefits of this intangible asset. For contractual agreements, the specific terms of the agreements were utilized to determine the fair value attributable to the arrangement.
The Company amortizes intangible assets based upon a straight-line basis because the pattern of economic benefits consumption cannot otherwise be reliably estimated. Estimated useful lives of intangible assets are as follows:
| Customer relationships | 2 - 10 years |
| Tradename | 4 - 10 years |
| Non-compete | 4 - 5 years |
| Supply agreements | 4 years |
Intangible assets subject to amortization are reviewed for impairment and are tested for recoverability whenever events or changes in circumstances indicate that the carrying amount may not be recoverable. For instance, a significant change in business climate or a loss of a significant customer, among other things, may trigger the need for an impairment test of intangible assets. An impairment loss is recognized if the carrying amount of an intangible asset is not recoverable and its carrying amount exceeds its fair value. See “Note 4 – Reduction in Value of Assets and Other Charges” and “Note 15 – Discontinued Operations“ for a further discussion of the reduction in value recorded during 2016 and 2015.
Goodwill
The carrying amount of goodwill is tested annually for impairment in the fourth quarter and whenever events or circumstances indicate its carrying value may not be recoverable. Impairment testing is conducted at the reporting unit level.
Our detailed impairment testing involves comparing the fair value of our reporting units to their respective carrying values, including goodwill. Fair value reflects the price a market participant would be willing to pay in a potential sale. If the fair value exceeds carrying value, then it is concluded that no goodwill impairment has occurred. If the carrying value exceeds the fair value, a second step is required to measure possible goodwill impairment loss. The second step includes valuing our tangible and intangible assets and liabilities as if we had been acquired in a business combination. Then, the implied fair value of our goodwill is compared to the carrying value of that goodwill. If the carrying value of our goodwill exceeds the implied fair value of the goodwill, we recognize an impairment loss in an amount equal to the excess, not to exceed the carrying value.
Our detailed impairment analysis employs the use of discounted cash flow models. Significant management judgment is necessary to evaluate the impact of operating and macroeconomic changes on our business. Critical assumptions include projected revenue growth, gross profit margins, selling, general and administrative expenses, working capital fluctuations, capital expenditures, discount rates and terminal growth rates. We use the capital asset pricing model to estimate the discount rates used in the discounted cash flow models.
During the fourth quarter of 2015, we completed goodwill impairment testing. A severe industry downturn in 2015 due to sustained price depression for oil and natural gas, among other macroeconomic factors, negatively impacted utilization of our equipment and pricing for our products and services throughout the year. The cash flow model utilized in our detailed impairment analysis reflected our belief that we would continue to face significant challenges over the next twelve to eighteen months. The resulting carrying value was in excess of our fair value and we determined that all of the goodwill associated with the acquisition of Austin Chalk and the United Acquisition in the amount of $11.1 million was fully impaired. As of December 31, 2016, there was no goodwill recorded. See also “Note 15 – Discontinued Operations“ for discussion of goodwill associated with discontinued operations.
| F-16 |
| Table of Contents |
Income Taxes
We account for income taxes utilizing the asset and liability method. Under this method, deferred tax assets and liabilities are recognized for the future tax consequences attributable to differences between the financial statement carrying amounts of existing assets and liabilities and their respective tax bases. Deferred tax assets and liabilities are measured using enacted tax rates expected to apply to taxable income in the years in which those temporary differences are expected to be recovered or settled. The effect on deferred tax assets and liabilities of a change in tax rates is recognized as income or expense in the period that includes the enactment date.
The ultimate realization of deferred tax assets is dependent upon the generation of future taxable income during the periods in which those temporary differences become deductible. In assessing the likelihood and extent that deferred tax assets will be realized, consideration is given to projected future taxable income and tax planning strategies. A valuation allowance is recorded when, in the opinion of management, it is more-likely-than-not that some portion or all of the deferred tax assets will not be realized.
We recognize the financial statement effects of a tax position when it is more-likely-than-not, based on the technical merits, that the position will be sustained upon examination. A tax position that meets the more-likely-than-not recognition threshold is measured as the largest amount of tax benefit that is greater than 50% likely of being realized upon ultimate settlement with a taxing authority. Previously recognized tax positions are reversed in the first period in which it is no longer more-likely-than-not that the tax position would be sustained upon examination.
Income tax related interest and penalties, if applicable, are recorded as a component of the provision for income tax expense. However, there were no amounts recognized relating to interest and penalties in the consolidated statements of operations for the years ended December 31, 2016 and 2015. We had no uncertain tax positions as of December 31, 2016 and 2015.
Contingent Payment Liability
The aggregate consideration for the United Acquisition of $24.5 million included contingent consideration of an estimated fair value on the acquisition date of $3.5 million. The contingent consideration consisted of up to three future cash payments to the sellers in an amount equal to 5% of the gross revenue of the business acquired for each of the twelve-month periods ending on March 31, 2015, 2016, and 2017; provided, however, that the aggregate consideration would not exceed $5.0 million.
On May 31, 2015, we made the first cash payment of $0.9 million, or 5% of the gross revenue of the business acquired for the twelve-month period ended March 31, 2015. We did not make the second cash payment of $0.7 million, or 5% of gross revenue of the business acquired for the twelve-month period ended March 31, 2016, which was due on May 31, 2016.
On January 31, 2017, in connection with the Recapitalization (see further discussion in “Note 2 – Recent Developments”), the sellers converted both the second payment obligation of $0.7 million, which was past due, and the estimated future obligation of $0.1 million, or 5% of estimated gross revenue of the business for the twelve-month period ended March 31, 2017, into 457,494 shares of common stock. This conversion was accounted for as a trouble debt restructuring, see further details in “Note 2 – Recent Developments”.
Fair Value Measurements
We measure the fair value of our liability for contingent payments on a recurring basis. Fair value is defined as the price that would be received to sell an asset or paid to transfer a liability (i.e., exit price) in an orderly transaction between market participants at the measurement date. Additionally, we are required to provide disclosure and categorize assets and liabilities measured at fair value into one of three distinct levels depending on the assumptions (i.e., inputs) used in the valuation. Level 1 provides the most reliable measure of fair value while Level 3 generally requires significant management judgment. Financial assets and liabilities are classified in their entirety based on the lowest level of input significant to the fair value measurement. The fair value hierarchy is defined as follows:
Level 1—Valuations are based on unadjusted quoted prices in active markets for identical assets or liabilities.
Level 2—Valuations are based on quoted prices for similar assets or liabilities in active markets, or quoted prices in markets that are not active for which significant inputs are observable, either directly or indirectly.
Level 3—Valuations are based on prices or valuation techniques that require inputs that are both unobservable and significant to the overall fair value measurement. Inputs reflect management’s best estimate of what market participants would use in valuing the asset or liability at the measurement date.
| F-17 |
| Table of Contents |
The fair value of the liability for contingent payments represents the sum of (i) the known required payments for periods which have ended and (ii) the present value of projected required payments for future periods based upon our internal model and projections. Due to the industry downturn which began in late 2014 and continued through much of 2016, both actual and projected utilization levels and pricing were significantly lower than the peaks experienced in 2014. Consequently, both the actual revenue and the projected revenue on which the payments are based declined significantly during the years ended December 31, 2016 and 2015 resulting in decreases to the fair value of the liability being recorded in both years.
As of December 31, 2016, the fair value of the liability for contingent payments included (i) the past due payment for the year ended March 31, 2016, (ii) the calculated payment for the nine months ended December 31, 2016, and (iii) the fair value of the liability for the estimated additional cash payment due for the three months ended March 31, 2017.
The following table provides a roll forward of the fair value of our liability for contingent payments which includes Level 3 measurements (in thousands):
|
|
| For the Years Ended December 31, |
| |||||
|
|
| 2016 |
|
| 2015 |
| ||
|
|
|
|
|
|
|
| ||
| Fair value, beginning of period |
| $ | 1,182 |
|
| $ | 3,109 |
|
| Changes in fair value |
|
| (372 | ) |
|
| (1,065 | ) |
| Payments |
|
| - |
|
|
| (862 | ) |
| Fair value, end of period |
| $ | 810 |
|
| $ | 1,182 |
|
Stock-Based Compensation
From time-to-time, we issue time-based vesting and performance-based vesting stock options, time-based vesting and performance-based vesting restricted stock units, and restricted stock awards to our employees as part of those employees’ compensation and as a retention tool for non-employee directors. We calculate the fair value of the awards on the grant date and amortize that fair value to compensation expense ratably over the vesting period of the award, net of estimated and actual forfeitures. The grant date fair value of our restricted stock awards and restricted stock units is determined using our stock price on the grant date. The fair value of our stock option awards are estimated using a Black-Scholes fair value model. The valuation of our stock options requires us to estimate the expected term of award, which we estimate using the simplified method, as we do not have sufficient historical exercise information. Additionally, the valuation of our stock option awards is also dependent on historical stock price volatility. In view of our being listed on the Over-the-Counter Bulletin Board, volatility is calculated based on historical stock price volatility of our peer group with a lookback period equivalent to the expected term of the award. Fair value of performance based stock options and restricted stock units is estimated in the same manner as our time-based awards and assumes that performance goals will be achieved and the awards will vest. If the performance based awards do not vest, any previously recognized compensation costs will be reversed. We record share-based compensation as a component of general and administrative or direct operating expense based on the role of the applicable individual. Historically we have not recognized any compensation expense for share-based compensation; however, under our new plan, we anticipate compensation costs for any issued awards. See further discussion in “Note 12 – Stock-Based Compensation”.
Earnings per Share
Basic earnings per share is computed by dividing income available to common stockholders by the weighted average number of shares of common stock outstanding during the period. Diluted earnings per share is computed in the same manner as basic earnings per share except that the denominator is increased to include the number of additional shares of common stock that could have been outstanding assuming the exercise of outstanding stock options and restricted stock or other convertible instruments, as appropriate.
During 2016 and 2015, the Company incurred losses from continuing operations; therefore, the impact of any incremental shares would be anti-dilutive.
| F-18 |
| Table of Contents |
Accounting Standards Recently Adopted
In November 2016, the FASB issued ASU No. 2016-18 Statement of Cash Flows (Topic 230), Restricted Cash. This standard provides guidance on the presentation of restricted cash and restricted cash equivalents in the statement of cash flows. Restricted cash and restricted cash equivalents should be included with cash and cash equivalents when reconciling the beginning-of-period and end-of-period amounts shown on the statements of cash flows. The amendments of this ASU should be applied using a retrospective transition method and are effective for reporting periods beginning after December 15, 2017, with early adoption permitted. Other than the revised statement of cash flows presentation of restricted cash, the adoption of ASU 2016-18 did not have an impact on our consolidated financial statements.
In November 2015, the FASB issued ASU 2015-17, Income Taxes: Balance Sheet Classification of Deferred Taxes, which eliminates the existing requirement for organizations to present deferred tax assets and liabilities as current and noncurrent in a classified balance sheet and now requires that all deferred tax assets and liabilities be classified as noncurrent. The ASU is effective for annual periods beginning after December 15, 2016, with early application permitted. We elected to early adopt the provisions of this ASU and classified our deferred tax balances as a non-current liability as of December 31, 2016 and 2015. The adoption has no effect on net income or cash flows.
In September 2015, the FASB issued ASU 2015-16, Business Combinations: Simplifying the Accounting for Measurement-Period Adjustments, which requires that an acquirer recognize adjustments to provisional amounts that are identified during the measurement period in the reporting period in which the adjustment amounts are determined. The amendments in the ASU require that the acquirer record, in the same period’s financial statements, the effect on earnings of changes in depreciation, amortization, or other income effects, if any, as a result of the change to the provisional amounts, calculated as if the accounting had been completed at the acquisition date. The amendments are effective for annual reporting periods beginning after December 15, 2015. The adoption of ASU 2015-16 did not have an impact on our financial condition or results of operations.
In August 2015, the FASB issued ASU 2015-15, Interest - Imputation of Interest: Presentation and Subsequent Measurement of Debt Issuance Costs Associated with Line-of-Credit Arrangements, which adds comments from the Securities and Exchange Commission (SEC) addressing ASU 2015-03, as discussed above, and debt issuance costs related to line-of-credit arrangements. The SEC commented it would not object to an entity deferring and presenting debt issuance costs as an asset and subsequently amortizing the deferred debt issuance costs ratably over the term of the line-of-credit arrangement, regardless of whether there are any outstanding borrowings on the line-of-credit arrangement. We adopted ASU 2015-15 in connection with our adoption of ASU 2015-03 effective January 1, 2016. The adoption of ASU 2015-15 did not have an impact on our financial condition or results of operations.
In April 2015, the FASB issued ASU 2015-03, Interest - Imputation of Interest (Subtopic 835-30): Simplifying the Presentation of Debt Issuance Costs. The amendments in the ASU change the balance sheet presentation requirements for debt issuance costs by requiring them to be presented as a direct reduction to the carrying amount of the related debt liability. The amendments are effective for financial statements issued for fiscal years beginning after December 15, 2015, and interim periods within those fiscal years. Early adoption is permitted. Transitioning to the new guidance requires retrospective application. We implemented the required change to the presentation of our debt issuance costs in the first quarter of fiscal year 2016, as expected such change did not have a material impact to our consolidated financial statements.
In November 2014, the FASB issued ASU 2014-16, Determining Whether the Host Contract in a Hybrid Financial Instrument Issued in the Form of a Share Is More Akin to Debt or to Equity, which clarifies how to evaluate the economic characteristics and risks of a host contract in a hybrid financial instrument that is issued in the form of a share. Specifically, the ASU requires that an entity consider all relevant terms and features in evaluating the nature of the host contract and clarifies that the nature of the host contract depends upon the economic characteristics and the risks of the entire hybrid financial instrument. An entity should assess the substance of the relevant terms and features, including the relative strength of the debt-like or equity-like terms and features given the facts and circumstances, when considering how to weight those terms and features. The adoption of ASU 2014-16 did not have an impact on our financial condition or results of operations.
In August 2014, the FASB issued ASU 2014-15, Presentation of Financial Statements – Going Concern (Subtopic 205-40): Disclosure of Uncertainties about an Entity’s Ability to Continue as a Going Concern, which defines management’s responsibility to evaluate whether there is substantial doubt about the company’s ability to continue as a going concern and provides guidance on the related footnote disclosure. Management should evaluate whether there are conditions or events that raise substantial doubt about the company’s ability to continue as a going concern within one year after the date the annual or interim financial statements are issued. We adopted these provisions in the first quarter of 2016 and will provide such disclosures as required if there are conditions and events that raise substantial doubt about our ability to continue as a going concern, as expected such change did not have a material impact to our consolidated financial statements.
In June 2014, the FASB issued Accounting Standards Update No. 2014-12, Compensation — Stock Compensation (Topic 718), Accounting for Share-Based Payments When the Terms of an Award Provide That a Performance Target Could Be Achieved after the Requisite Service Period (a consensus of the FASB Emerging Issues Task Force). The guidance applies to all reporting entities that grant their employees share-based payments in which the terms of the award provide that a performance target that affects vesting could be achieved after the requisite service period. The amendments require that a performance target that affects vesting and that could be achieved after the requisite service period is treated as a performance condition. For all entities, the amendments in this Update are effective for annual periods and interim periods within those annual periods beginning after December 15, 2015. Earlier adoption is permitted. The effective date is the same for both public business entities and all other entities. The adoption of ASU 2014-12 did not have an impact on our financial condition or results of operations.
| F-19 |
| Table of Contents |
Accounting Standards Not Yet Adopted
In August 2016, the FASB issued ASU 2016-15, “Statement of Cash Flows (Topic 230), Classification of Certain Cash Receipts and Cash Payments (a consensus of the FASB Emerging Issues Task Force) (ASU 2016-15)”, that clarifies how entities should classify certain cash receipts and cash payments on the statement of cash flows. The guidance also clarifies how the predominance principle should be applied when cash receipts and cash payments have aspects of more than one class of cash flows. The guidance will be effective for annual periods beginning after December 15, 2017 and interim periods within those annual periods. Early adoption is permitted. The Company is evaluating the effect of ASU 2016-15 on its consolidated financial statements.
In March 2016, the FASB Issued ASU 2016-09, Compensation—Stock Compensation (Topic 718): Improvements to Employee Share-Based Payment Accounting. The updated guidance changes how companies account for certain aspects of share-based payment awards to employees, including the accounting for income taxes, forfeitures, and statutory tax withholding requirements, as well as classification in the statement of cash flows. The Company will adopt the accounting guidance as of January 1, 2017. The adoption of this ASU will not have a material impact on the Company’s consolidated financial statements.
In February 2016, the FASB issued ASU 2016-02, Leases (Topic 842), which will replace the existing lease guidance. The standard is intended to provide enhanced transparency and comparability by requiring lessees to record right-of-use assets and corresponding lease liabilities on the balance sheet. Additional disclosure requirements include qualitative disclosures along with specific quantitative disclosures with the objective of enabling users of financial statements to assess the amount, timing, and uncertainty of cash flows arising from leases. ASU 2016-02 is effective for the Company for annual reporting periods beginning after December 15, 2018, including interim periods within those fiscal years, with early adoption permitted. The new standard is required to be applied with a modified retrospective approach to each prior reporting period presented. We are currently evaluating the standard to determine the impact of its adoption on the consolidated financial statements.
ASU 2014-09. In May 2014, the FASB issued ASU 2014-09, Revenue from Contracts with Customers (Topic 606). The objective of this ASU is to establish the principles to report useful information to users of financial statements about the nature, amount, timing, and uncertainty of revenue from contracts with customers. The core principle is to recognize revenue to depict the transfer of promised goods or services to customers in an amount that reflects the consideration to which the entity expects to be entitled in exchange for those goods or services. ASU 2014-09 must be adopted using either a full retrospective method or a modified retrospective method. During a July 2015 meeting, the FASB affirmed a proposal to defer the effective date of the new revenue standard for all entities by one year. As a result, ASU 2014-09 is effective for the Company for interim and annual reporting periods beginning after December 15, 2017 with early adoption permitted for interim and annual reporting periods beginning after December 15, 2016. We are currently evaluating the standard to determine the impact of its adoption on the consolidated financial statements, however, management believes that the impact to the financial statements will not be material.
NOTE 4 — REDUCTION IN VALUE OF ASSETS AND OTHER CHARGES
During 2016 and 2015, the Company recorded $17.7 million and $11.4 million in expense related to reduction in value of assets, respectively. See also “Note 15 – Discontinued Operations” for a discussion of the reduction in value of assets associated with discontinued operations.
The components of reduction in value of assets are as follows (in thousands):
|
|
| For the Years Ended December 31, |
| |||||
|
|
| 2016 |
|
| 2015 |
| ||
|
|
|
|
|
|
|
| ||
| Reduction in value of property and equipment: |
|
|
|
|
|
| ||
| Impairment in connection with Recapitalization |
| $ | 15,562 |
|
| $ | - |
|
| Loss on disposal of assets |
|
| 1,087 |
|
|
| 262 |
|
| Reduction in value of intangibles |
|
| 1,087 |
|
|
| - |
|
| Impairment of goodwill |
|
| - |
|
|
| 11,143 |
|
|
|
|
|
|
|
|
|
|
|
| Total reduction in value of assets |
| $ | 17,736 |
|
| $ | 11,405 |
|
Impairment of Property and Equipment – Recapitalization
During 2016, the Company recorded an impairment charge of $15.6 million as part of the Recapitalization in which idle and underutilized equipment with a net book value of $18.2 million was transferred to Tiger as an inducement to provide bridge financing. Among other things, the Company received an extended forbearance agreement and a reduction in debt of $2.0 million as consideration for the sale of these assets (see below “Debt Modification Fee – Recapitalization” for further discussion).
| F-20 |
| Table of Contents |
Loss on Disposal of Assets
During the first quarter of 2016, the Company recorded a loss on the disposal of property and equipment of $0.3 million when the Company sold idle and underutilized equipment and vehicles with a net book value of $0.8 million for cash proceeds of approximately $0.5 million. Due to the depressed market for oilfield services, these assets were sold for proceeds significantly less than the net book value resulting in higher losses than normal. These assets were sold within the basket of permitted asset sales, as defined in our credit facility, and the Company used the proceeds to fund working capital needs created by the significant deterioration in the industry throughout 2015.
During the third quarter of 2016, the Company recorded a loss on the disposal of property and equipment of $0.8 million when the Company sold idle and underutilized equipment and vehicles with a net book value of $1.1 million for cash proceeds of approximately $0.3 million. Due to the depressed market for oilfield services, these assets were sold for proceeds significantly less than the net book value resulting in higher losses than normal. Wells Fargo provided the required consent to sell the assets subject to all proceeds, net of commission, being immediately used to pay down outstanding balances owed to Wells Fargo under the terms of our credit facility.
During 2015, the Company recorded a loss on the disposal of property and equipment of $0.3 million when the Company sold idle and underutilized equipment and vehicles with a net book value of $0.6 million for cash proceeds of approximately $0.3 million. Due to the depressed market for oilfield services, these assets were sold for proceeds significantly less than the net book value resulting in higher losses than normal. These assets were sold within the basket of permitted asset sales, as defined in our credit facility, and the Company used the proceeds to fund working capital needs created by the significant deterioration in the industry.
Impairment of Goodwill
During 2015, the Company determined that the implied fair value of the goodwill for its surface rental and solids control reporting units was less than its carrying value and the Company recorded an aggregate $11.1 million impairment charge. The reduction in value of goodwill in these reporting units was primarily driven by the significant deterioration of market conditions during 2015 combined with a forecast as of December 31, 2015 which did not indicate a timely recovery sufficient to support the carrying values of goodwill. As of December 31, 2016 and 2015, there was no goodwill remaining on the consolidated balance sheets.
Reduction in Value of Intangibles
During 2016, the Company recorded $1.1 million reduction in value of intangibles which consisted of a $0.5 million reduction in an intangible associated with a non-compete which management determined was non-enforceable and a $0.6 million reduction in an intangible associated with a supply agreement which had no value subsequent to the liquidation of the supplier under bankruptcy proceedings. As of December 31, 2016, these intangibles were recorded with no value on the consolidated balance sheet. As of December 31, 2015, the non-compete and the supply agreement were recorded at $0.7 million and $1.0 million, respectively, on the consolidated balance sheet.
Debt Modification Fee – Recapitalization
In connection with our transfer of property and equipment to Tiger, we received certain modifications to our credit facility, including a $2.0 million reduction in our principal outstanding on the Aly Senior Obligations and an extension of the forbearance period to December 9, 2016. We recorded a debt modification fee of $0.6 million as the property and equipment transferred to Tiger had a fair value exceeding the reduction of our obligations.
Professional Fees - Recapitalization
During 2016, in connection with forbearance agreements and other negotiations with its former lender, Wells Fargo, and in connection with the Recapitalization, the Company recorded an aggregate of $0.5 million of charges, primarily for professional fees, which are included in selling, general and administrative expenses on the consolidated statement of operations. The charges include $0.2 million of expenses the Company incurred for financial advisors that Wells Fargo required the Company to retain and $0.1 million of legal and other professional fees. In addition, the charges in 2016 include $0.2 million of expenses the Company incurred for professionals engaged by Wells Fargo whom the Company was required to pay under the terms of our credit facility. On December 12, 2016, these fees were assumed by Pelican and, on January 31, 2017, included within the Aly Senior Obligations refinanced in connection with the Recapitalization. These fees are included in “Accrued interest and other – Pelican” on our consolidated balance sheet as of December 31, 2016.
Severance Expense – Operational Restructuring
During 2016 and 2015, the Company recorded $0.5 million and $0.3 million, respectively, in charges relating to severance due to the significant downturn in the industry. In 2016, we ceased making cash severance payments due to our limited liquidity and we do not know when or if we will be able to satisfy the remaining outstanding severance claims. As such, the accrued severance liability balance of $0.7 million as of December 31, 2016, which includes a liability of $0.2 million assumed by Aly Energy related to discontinued operations, is included in other long-term liabilities on the consolidated balance sheet. As of December 31, 2015, an accrued severance liability of $0.1 is included in accrued expenses on the consolidated balance sheet.
| F-21 |
| Table of Contents |
NOTE 5 — LONG-LIVED ASSETS
Property and Equipment
Major classifications of property and equipment are as follows (in thousands):
|
|
| As of December 31, |
| |||||
|
|
| 2016 |
|
| 2015 |
| ||
|
|
|
|
|
|
|
| ||
|
|
|
|
|
|
|
| ||
| Machinery and equipment |
| $ | 31,541 |
|
| $ | 53,677 |
|
| Vehicles, trucks & trailers |
|
| 4,523 |
|
|
| 5,699 |
|
| Office furniture, fixtures and equipment |
|
| 544 |
|
|
| 544 |
|
| Leasehold improvements |
|
| 203 |
|
|
| 213 |
|
| Buildings |
|
| 212 |
|
|
| 212 |
|
|
|
|
|
|
|
|
|
|
|
|
|
|
| 37,023 |
|
|
| 60,345 |
|
| Less: Accumulated depreciation and amortization |
|
| (8,807 | ) |
|
| (8,758 | ) |
|
|
|
|
|
|
|
|
|
|
|
|
|
| 28,216 |
|
|
| 51,587 |
|
| Assets not yet placed in service |
|
| 10 |
|
|
| 202 |
|
|
|
|
|
|
|
|
|
|
|
| Property and equipment, net |
| $ | 28,226 |
|
| $ | 51,789 |
|
See “Note 4 – Reduction in Value of Assets and Other Charges” for further discussion on asset disposals during the years ended December 31, 2016 and 2015.
Depreciation and amortization expense related to property and equipment for the years ended December 31, 2016 and 2015 was $3.9 million and $4.4 million, respectively.
Intangible Assets
Intangible assets consist of the following (in thousands):
|
|
| Customer Relationships |
|
| Tradename |
|
| Non-Compete |
|
| Supply Agreements |
|
| Total |
| |||||
|
|
|
|
|
|
|
|
|
|
|
|
|
|
|
|
| |||||
| As of December 31, 2016: |
|
|
|
|
|
|
|
|
|
|
|
|
|
|
| |||||
| Cost |
| $ | 5,323 |
|
| $ | 2,174 |
|
| $ | 492 |
|
| $ | - |
|
| $ | 7,989 |
|
| Less: Accumulated amortization |
|
| (1,900 | ) |
|
| (749 | ) |
|
| (409 | ) |
|
| - |
|
|
| (3,058 | ) |
|
|
|
|
|
|
|
|
|
|
|
|
|
|
|
|
|
|
|
|
|
|
| Net book value |
| $ | 3,423 |
|
| $ | 1,425 |
|
| $ | 83 |
|
| $ | - |
|
| $ | 4,931 |
|
|
|
|
|
|
|
|
|
|
|
|
|
|
|
|
|
|
|
|
|
|
|
| As of December 31, 2015: |
|
|
|
|
|
|
|
|
|
|
|
|
|
|
|
|
|
|
|
|
| Cost |
| $ | 5,322 |
|
| $ | 2,174 |
|
| $ | 1,651 |
|
| $ | 1,686 |
|
| $ | 10,833 |
|
| Less: Accumulated amortization |
|
| (1,367 | ) |
|
| (531 | ) |
|
| (806 | ) |
|
| (720 | ) |
|
| (3,424 | ) |
|
|
|
|
|
|
|
|
|
|
|
|
|
|
|
|
|
|
|
|
|
|
| Net book value |
| $ | 3,955 |
|
| $ | 1,643 |
|
| $ | 845 |
|
| $ | 966 |
|
| $ | 7,409 |
|
| F-22 |
| Table of Contents |
Estimated amortization expense for the next five years and thereafter is as follows (in thousands):
| For the Year Ending December 31, |
|
|
| |
| 2017 |
| $ | 831 |
|
| 2018 |
|
| 750 |
|
| 2019 |
|
| 750 |
|
| 2020 |
|
| 750 |
|
| 2021 |
|
| 750 |
|
| Thereafter |
|
| 1,100 |
|
|
|
|
|
|
|
|
|
| $ | 4,931 |
|
Total amortization expense for the years ended December 31, 2016 and 2015 was approximately $1.4 million and $1.6 million, respectively.
See further discussion of reduction in value of intangibles during the years ended December 31, 2016 and 2015 in “Note 4 – Reduction in Value of Assets and Other Charges” and “Note 15 – Discontinued Operations”.
NOTE 6 — LONG-TERM DEBT
Credit Facility: Term Loan, Delayed Draw Term Loan, and Revolving Credit Facility
Our primary credit facility with Wells Fargo consisted of a term loan, a delayed draw term loan, and a revolving credit facility (“Credit Facility”, as amended). Obligations under the Credit Facility were as follows:
|
| · | Term loan – In 2014, our original principal balance on the term loan was $25.0 million; this loan required principal payments each quarter of $1.3 million. |
|
| · | Delayed draw term loan – In 2014, our original availability under the delayed draw term loan was $5.0 million; the full availability of the loan was reached in May 2015 and beginning in June 2015 the principal balance of $5.0 required scheduled principal payments each quarter of $0.3 million. |
|
| · | Revolving credit facility – In 2014, our original availability under the revolving credit facility was $5.0 million; however, after subsequent amendments, our availability was reduced to $1.0 million as of December 31, 2015 and then to zero as of December 31, 2016. There were no outstanding borrowings under the revolving credit facility as of December 31, 2016 and 2015. |
Borrowings under the Credit Facility were subject to interest at the annual base rate at the greater of:
|
| (i) | the Wells Fargo’s Prime Rate, plus a margin of 1.75%, |
|
| (ii) | the Federal Funds Rate plus 0.5%, plus a margin of 1.75% or |
|
| (iii) | the one-month LIBOR rate on such day plus 1.00%, plus a margin of 1.75%. |
Beginning in July 2016, our rate increased to the default rate of 7.25% in connection with the subsequent amendments and forbearance agreements. For the years ended December 31, 2016 and 2015, interest rates on our borrowings under the Credit Facility ranged from 5.25% to 7.25% and 4.24% to 5.25%, respectively.
The obligations under the Credit Facility were guaranteed by all of our subsidiaries and secured by substantially all of our assets. The credit agreement contained customary events of default and covenants including restrictions on our ability to incur additional indebtedness, make capital expenditures, pay dividends or make other distributions, grant liens and sell assets.
Effective September 30, 2015, we entered into an amendment to the Credit Facility (“Amendment”). In connection with the execution of the Amendment, we used the proceeds of $3.4 million from a private offering to make the regularly scheduled principal payment of $1.5 million due on September 30, 2015 and to make a prepayment of $1.9 million on the term loan.
| F-23 |
| Table of Contents |
The Amendment modified multiple components of the Credit Facility including, but not limited to, the terms listed below. The Amendment:
|
| (i) | waived our covenant default as of June 30, 2015; |
|
| (ii) | deferred all further principal payments on outstanding borrowings under the Credit Facility until March 31, 2017; |
|
| (iii) | revised certain financial covenants to facilitate our compliance with such covenants during the downturn in the oilfield services industry; and, |
|
| (iv) | reduced the size of the revolving credit facility to $1.0 million. |
Due to the significant downturn in the oilfield services industry throughout 2015, as of December 31, 2015, we were not in compliance with certain financial covenants set forth in our Credit Facility due to our poor financial results.
On March 31, 2016, we completed the execution and delivery of a forbearance agreement and amendment to the Credit Facility. Among other provisions, the lenders agreed to forbear from exercising their remedies under the Credit Facility until the earlier of July 10, 2016 or the date on which forbearance was terminated due to specified events, including (i) the occurrence of other defaults under the Credit Facility, (ii) our failure to hire an independent financial advisor prior to April 10, 2016 or (iii) our failure to present a detailed plan for asset sales or equity capital acceptable to the lenders yielding net cash proceeds to us of at least $2.5 million by May 25, 2016. We hired an independent financial advisor and such advisor commenced the engagement prior to the deadline of April 10, 2016. In conjunction with agreeing to forbear from exercising their remedies under the Credit Facility, the lenders reduced the revolving credit portion of the Credit Facility to zero thereby eliminating our ability to borrow additional funds under the Credit Facility.
On May 13, 2016, we further amended the Credit Facility and the forbearance agreement related to such facility to increase our basket of permitted asset sales to $0.6 million in any calendar year provided that any proceeds from permitted asset sales be deposited in a blocked deposit account with Wells Fargo. We also acknowledged that we were unable to comply with certain financial covenants as of March 31, 2016.
On August 5, 2016, we entered into a new agreement with Wells Fargo, the Limited Forbearance Agreement, in which Wells Fargo agreed to forbear from exercising their remedies under the credit agreement until August 31, 2016, conditioned upon the following, among other items: (i) hiring a Chief Restructuring Officer (“CRO”) on terms acceptable to the lender; (ii) having the CRO provide an initial cash forecast budget prior to August 10, 2016 and weekly updates thereafter; (iii) not incurring a variance of more than 10% from the cash flow budgets; and, (iv) paying accrued interest monthly effective July 21, 2016 at the default rate specified in the Credit Facility. As mandated, effective August 5, 2016, our board selected Chris Quinn to serve as CRO of the Company. On October 5, 2016, Wells Fargo extended the forbearance period until October 19, 2016.
On October 26, 2016, in connection with the Recapitalization, the Aly Senior Obligations, which included the Credit Facility and the outstanding equipment financing and capital leases in favor of Wells Fargo and Well Fargo Equipment Finance, respectively, were acquired by Tiger. Simultaneously, we entered into the Third Limited Forbearance Agreement which extended the forbearance period to December 9, 2016 and reduced the Aly Senior Obligations in the amount of $2.0 million, conditioned upon the following, among other items: (i) Tiger entering into an assignment agreement with Pelican; (ii) Pelican providing $500,000 of unsecured working capital financing to the Company pending the closing; and, (iii) the Company transferring to Tiger certain excess equipment and vehicles which the Company was not utilizing and did not consider as necessary for its operations. The Company recorded a debt modification fee of $0.6 million in connection with the execution of the Third Limited Forbearance Agreement.
Effective December 12, 2016, the Aly Senior Obligations were acquired by Pelican. See further discussion in “Note 7 – Long-term Debt – Pelican”.
Subordinated Note Payable
On August 15, 2014, we completed a bulk equipment purchase for total consideration of $10.3 million of which $2.0 million was in the form of a subordinated note payable (“Subordinated Note Payable”).
On March 18, 2015, the outstanding Subordinated Note Payable was amended to extend the final maturity date to June 30, 2017 and to increase the interest rate to 10% per annum. Subsequent to an aggregate principal and interest payment of approximately $0.6 million on March 31, 2015, additional payments of interest and principal were not required until June 30, 2017. The Subordinated Note Payable was generally subordinated in right of payment to our indebtedness to its lenders.
In connection with the Recapitalization, the Subordinated Note Payable was converted into 1,200,000 common shares of the Company. This conversion was accounted for as a trouble debt restructuring, see further details in “Note 2 – Recent Developments”. As of January 31, 2017, there were no further obligations due under the Subordinated Note Payable.
| F-24 |
| Table of Contents |
Equipment Financing and Capital Leases
We finance the purchase of certain vehicles and equipment using long-term equipment loans and using non-cancelable capital leases. Repayment occurs over the term of the loan or lease, typically three to five years, in equal monthly installments which include principal and interest.
Effective June 30, 2016, the Company entered into an amendment for each capital lease outstanding with Wells Fargo Equipment Finance, aggregating $1.9 million, whereby the maturity date was extended by six months and principal payments suspended for a period of six months.
Effective October 26, 2016, our equipment financing and capital leases with Wells Fargo Equipment Finance were included in the Aly Senior Obligations which were acquired by Tiger, then subsequently acquired on December 12, 2016 by Pelican. See further discussion in “Note 7 – Long-term Debt – Pelican”.
In January 2017, in order to reduce our debt service obligations, we returned certain underutilized and idle vehicles under capital leases with a net book value of $0.1 million to the lessor in exchange for the release of all outstanding obligations, aggregating to approximately $0.1 million, resulting in a reduction in value of assets of approximately $38,000.
As of January 31, 2017, we had one remaining capital lease with a balance of approximately $9,000 which was assumed by the continuing operations of the Company in connection with our discontinued operations effective December 31, 2016.
Deferred Loan Costs
Costs incurred to obtain financing are capitalized and amortized on a straight-line basis over the term of the loan, which approximates the effective interest method. The amortization of these costs is classified within interest expense on the accompanying consolidated statements of operations and was approximately $0.3 million and $0.4 million for the years ended December 31, 2016 and 2015, respectively. During 2016, in connection with various amendments to our credit facility and in connection with the Recapitalization, we incurred an aggregate charge of $0.1 million, classified within interest expense, to write-off all remaining unamortized deferred loan costs. There were no new deferred loan costs recorded in connection with the Recapitalization.
As a result of the adoption of Accounting Standards Update (“ASU”) 2015-03, “Simplifying the Presentation of Debt Issuance Costs” on January 1, 2016, the Company reclassified debt issuance costs of $0.8 million and retrospectively reclassified debt issuance costs of $0.4 million as a reduction in the carrying amount of the related Credit Facility as of December 31, 2016 and December 31, 2015, respectively.
There were no deferred loan costs recorded on the consolidated balance sheet as of December 31, 2016. Deferred loan costs and accumulated amortization were $1.0 million and $0.6 million, respectively, as of December 31, 2015.
Long-term debt consists of the following (in thousands):
|
|
| December 31, 2016 |
|
| December 31, 2015 |
| ||||||||||
|
|
| Current |
|
| Long-Term |
|
| Current |
|
| Long-Term |
| ||||
|
|
|
|
|
|
|
|
|
|
|
|
|
| ||||
| Credit facility |
|
|
|
|
|
|
|
|
|
|
|
| ||||
| Term loan |
| $ | - |
|
| $ | - |
|
| $ | 15,573 |
|
| $ | - |
|
| Delayed draw term loan |
|
| - |
|
|
| - |
|
|
| 4,500 |
|
|
| - |
|
| Subordinated note payable |
|
| 1,500 |
|
|
| - |
|
|
| - |
|
|
| 1,500 |
|
| Equipment financing and capital leases |
|
| 93 |
|
|
| 10 |
|
|
| 683 |
|
|
| 1,685 |
|
|
|
|
| 1,593 |
|
|
| 10 |
|
|
| 20,756 |
|
|
| 3,185 |
|
| Less: Deferred loan costs, net |
|
| - |
|
|
| - |
|
|
| (403 | ) |
|
| - |
|
| Total |
| $ | 1,593 |
|
| $ | 10 |
|
| $ | 20,353 |
|
| $ | 3,185 |
|
As of December 31, 2016 and December 31, 2015, we had approximately $0.1 million and $2.4 million outstanding under equipment financing and capital leases, respectively. The gross amount of equipment held under capital leases was approximately $0.3 million and $3.5 million as of December 31, 2016 and 2015, respectively. Accumulated amortization of that same equipment was $0.2 million and $1.0 million as of December 31, 2016 and 2015, respectively.
| F-25 |
| Table of Contents |
NOTE 7 — LONG-TERM DEBT – PELICAN
Line of Credit – Pelican
On October 26, 2016, we entered into an agreement with Tiger and Pelican, in conjunction with the Recapitalization transaction, requiring Pelican to provide a working capital line of credit of $0.5 million. As of December 31, 2016, there was $0.5 million outstanding under the line and no further availability to borrow under the line.
Borrowings under the line accrued interest at a rate of 5% per annum. The line was unsecured and had a maturity date of January 31, 2017.
On January 31, 2017, in conjunction with the Recapitalization transaction, the line matured and the balance was aggregated with the Aly Senior Obligations in the new credit facility with Pelican.
Credit Facility - Pelican: Term Loan, Delayed Draw Term Loan, and Revolving Credit Facility
Effective October 26, 2016, our Credit Facility with Wells Fargo was included in the Aly Senior Obligations which were acquired by Tiger, then subsequently acquired on December 12, 2016 by Pelican. During this time, interest and ticking fees continued to accrue and there were no modifications to the components of the Credit Facility as a result of these transactions; however, a Fourth Limited Forbearance Agreement was executed with Pelican. The agreement extended the forbearance period to January 31, 2017, conditioned upon the Company using its best efforts to consummate a recapitalization plan, satisfactory to Pelican, that would, at a minimum, result in the conversion of Aly Operating redeemable preferred stock, Aly Centrifuge redeemable preferred stock, subordinated note payable, and contingent payment liability into common stock prior to January 31, 2017. The agreement also waived the requirement, previously imposed by wells Fargo, to continue retaining the CRO.
Effective January 31, 2017, the Recapitalization was completed and the Credit Facility was amended in its entirety. The amended facility consisted of a term loan of $5.1 million and a revolving credit facility of up to $1.0 million (“Pelican Credit Facility”, as amended).
Availability under the revolving credit facility is determined by a borrowing base calculated as 80% of eligible receivables (less than 90 days old). Borrowings under the Pelican Credit Facility are subject to monthly interest payments at an annual base rate of the six-month LIBOR rate on the last day of the calendar month plus a margin of 3.0%. To the extent there is free cash flow, as defined in the credit agreement, principal payments of 50% of such free cash flow are due annually.
Subsequent to the Recapitalization, we entered into several further amendments to capitalize on improved market conditions and increased activity in our business:
|
| · | Amendment No. 1, effective March 1, 2017, provided for a delayed draw term loan to be added to the Pelican Credit Facility for the purpose of financing capital expenditures. The amendment permitted us to draw on an added delayed draw term loan from time-to-time up until December 31, 2018 in order to fund up to 80% of the cost of capital expenditures subject to a $0.5 million limit on aggregate borrowings. |
|
| · | Amendment No. 2, effective May 23, 2017, increased the maximum revolving credit amount from $1.0 million to $1.8 million and extended the final maturity date of the facility to December 31, 2019. In consideration of the increase in the revolving credit facility and the extension of the final maturity date, we agreed to issue to Pelican an amendment fee of 1,200 shares of our Series A Convertible Preferred Stock. |
|
| · | Amendment No. 3, effective June 15, 2017, modified maximum potential borrowings under each of the revolving credit facility and the delayed draw term loan without changing the aggregate available borrowings under the credit facility. The amendment reduced the maximum revolving credit amount from $1.8 million to $1.0 million and increased the maximum delayed draw loan borrowings from $0.5 million to $1.3 million and the amendment also increased permitted draws on the delayed draw loan from 80% of the cost of capital expenditures being funded to 90% of the cost of capital expenditures being funded. |
The obligations under the Pelican Credit Facility are guaranteed by all of our subsidiaries and secured by substantially all of our assets. The Pelican Credit Facility contains customary events of default and covenants including restrictions on our ability to incur additional indebtedness, make capital expenditures, pay dividends or make other distributions, grant liens and sell assets. The Pelican Credit Facility does not include any financial covenants. We are in full compliance with the credit facility as of June 30, 2017.
Under the Pelican Credit Facility, as of June 30, 2017, we have the availability to borrow an incremental $0.2 million under the revolving credit facility and, if we have capital expenditures which are eligible to be financed, an incremental $1.0 million under the delayed draw term loan to finance 90% of such expenditures.
| F-26 |
| Table of Contents |
Equipment Financing and Capital Leases - Pelican
Effective December 12, 2016, Pelican acquired the Aly Senior Obligations which included $1.9 million of outstanding equipment financing and capital leases plus associated accrued interest.
On January 31, 2017, in connection with the Recapitalization, the Aly Senior Obligations, including the equipment financing and capital leases, were refinanced under the Pelican Credit Facility. Future borrowings required for equipment financing are likely to be funded through the delayed term loan included in the Pelican Credit Facility.
Long-term debt – Pelican consists of the following (in thousands):
|
|
| December 31, 2016 |
| |||||
|
|
| Current |
|
| Long-Term |
| ||
|
|
|
|
|
|
|
| ||
| Credit facility |
|
|
|
|
|
| ||
| Term loan |
| $ | 13,339 |
|
| $ | - |
|
| Delayed draw term loan |
|
| 4,433 |
|
|
| - |
|
| Line of credit - Pelican |
|
| 494 |
|
|
| - |
|
| Equipment financing and capital leases |
|
| 614 |
|
|
| 1,315 |
|
|
|
|
| 18,880 |
|
|
| 1,315 |
|
| Less: Deferred loan costs, net |
|
| - |
|
|
| - |
|
| Total |
| $ | 18,880 |
|
| $ | 1,315 |
|
As of December 31, 2016, we had $1.9 million outstanding under equipment financing and capital leases with Pelican. The gross amount of equipment held under such equipment financing and capital leases and related accumulated amortization was $3.3 million and $1.6 million, respectively, as of December 31, 2016. There were no borrowings outstanding under equipment financing and capital leases with Pelican during 2015.
The completion of the Recapitalization on January 31, 2017, coupled with the Company’s current forecasts, cash-on-hand, cash flow from operations and borrowing capacity under the Pelican Credit Facility, the Company expects to have sufficient liquidity and capital resources to meet its obligations for at least the next twelve months; however, our forecasts are based on many factors outside the Company’s control. See further details at “Note 2 – Recent Developments” in the Recapitalization and Unaudited Consolidated Pro Forma Balance Sheet sections.
NOTE 8 — INCOME TAXES
The provision for income taxes consists of the following (in thousands):
|
|
| For the Years Ended |
| |||||
|
|
| 2016 |
|
| 2015 |
| ||
|
|
|
|
|
|
|
| ||
| Current provision: |
|
|
|
|
|
| ||
| Federal |
| $ | - |
|
| $ | - |
|
| State |
|
| 33 |
|
|
| (99 | ) |
|
|
|
|
|
|
|
|
|
|
| Total current provision |
|
| 33 |
|
|
| (99 | ) |
|
|
|
|
|
|
|
|
|
|
| Deferred benefit: |
|
|
|
|
|
|
|
|
| Federal |
|
| (7,298 | ) |
|
| (2,857 | ) |
| State |
|
| (639 | ) |
|
| (416 | ) |
|
|
|
|
|
|
|
|
|
|
| Total deferred benefit |
|
| (7,937 | ) |
|
| (3,273 | ) |
|
|
|
|
|
|
|
|
|
|
| Provision for income taxes |
| $ | (7,904 | ) |
| $ | (3,372 | ) |
| F-27 |
| Table of Contents |
The following table reconciles the statutory tax rates to our effective tax rate:
|
|
| For the Years Ended |
| |||||
|
|
| 2016 |
|
| 2015 |
| ||
|
|
|
|
|
|
|
| ||
| Federal statutory rate |
|
| 34.00 | % |
|
| 34.00 | % |
| State taxes, net of federal benefit |
|
| 1.85 | % |
|
| 1.35 | % |
| Goodwill impairment |
|
| -0.33 | % |
|
| -21.88 | % |
| Change in valuation allowance |
|
| -8.60 | % |
|
| 0.00 | % |
| Other |
|
| 1.79 | % |
|
| 6.01 | % |
|
|
|
|
|
|
|
|
|
|
| Effective income tax rate |
|
| 28.71 | % |
|
| 19.48 | % |
We currently project a loss for the year ended December 31, 2016, for federal income tax purposes and in certain state income tax jurisdictions. As of December 31, 2016, we had a gross net operating loss (“NOL”) carryforward for U.S. federal income tax purposes of approximately $29.5 million. This NOL will begin to expire in 2033 if not utilized. We will carryforward the net federal NOL of approximately $10.0 million. We also have state NOL carryforwards that will affect state taxes of approximately $0.9 million as of December 31, 2016. State NOLs begin to expire in 2034. Carryback provisions are not allowed by all states, accordingly the state NOLs also give rise to a deferred tax asset.
In assessing the realizability of deferred tax assets, management considers whether it is more likely than not that some portion or all of the deferred tax assets will not be realized. The Company has evaluated the available evidence and the likelihood of realizing the benefit of its net deferred tax assets. Management considers cumulative losses and other negative evidence as well as positive evidence such as the scheduled reversal of deferred tax liabilities, future profitability, and tax planning strategies in making this assessment. From its evaluation, the Company has concluded that based on the weight of available evidence, it is not more likely than not to realize the benefit of its deferred tax assets. Therefore, the Company established a valuation allowance of $2.4 million for the year ended December 31, 2016. Should the factors underlying management’s analysis change, future valuation adjustments to net deferred tax assets may be necessary. The benefit from any reversal of the valuation allowance will be charged directly to income tax expense. As of December 31, 2015, no valuation allowance was necessary.
Deferred income taxes reflect the net tax effects of temporary differences between the carrying amounts of assets and liabilities for financial reporting purposes and the amounts used for income taxes. Components of our deferred income taxes as of December 31, 2016 and 2015 are as follows (in thousands):
|
|
| For the Years Ended |
| |||||
|
|
| 2016 |
|
| 2015 |
| ||
|
|
|
|
|
|
|
| ||
| Deferred tax assets: |
|
|
|
|
|
| ||
| Allowance for doubtful accounts |
| $ | 191 |
|
| $ | 148 |
|
| Net operating loss |
|
| 10,024 |
|
|
| 5,514 |
|
| Start-up costs |
|
| 17 |
|
|
| 18 |
|
| State net operating loss, net of federal benefit |
|
| 604 |
|
|
| 344 |
|
| Accrued compensation |
|
| 220 |
|
|
| 42 |
|
| Charitable contributions and other |
|
| 26 |
|
|
| 19 |
|
|
|
|
|
|
|
|
|
|
|
| Total deferred tax assets |
|
| 11,082 |
|
|
| 6,085 |
|
|
|
|
|
|
|
|
|
|
|
| Deferred tax liabilities: |
|
|
|
|
|
|
|
|
| Prepaid assets |
|
| 32 |
|
|
| 28 |
|
| Property and equipment |
|
| 7,334 |
|
|
| 11,539 |
|
| Intangibles |
|
| 1,208 |
|
|
| 2,013 |
|
| State deferreds, net of federal benefit |
|
| 139 |
|
|
| 446 |
|
| Total deferred tax liabilities |
|
| 8,713 |
|
|
| 14,026 |
|
|
|
|
|
|
|
|
|
|
|
| Net deferred tax assets (liabilities) before valuation allowance |
|
| 2,369 |
|
|
| (7,941 | ) |
| Valuation allowance |
|
| (2,369 | ) |
|
| - |
|
|
|
|
|
|
|
|
|
|
|
| Net deferred tax liabilities after valuation allowance |
| $ | - |
|
| $ | (7,941 | ) |
We follow accounting guidance under ASC 740-10 Income Taxes related to uncertainty in income tax positions, which clarifies the accounting and disclosure requirements for uncertainty in tax positions. We assessed our filing positions in all significant jurisdictions where we are required to file income tax returns for all open tax years and determined no liability existed or there was no liability for uncertain positions. Our major taxing jurisdictions include the U.S. federal income taxes and the Texas franchise tax. Our federal tax returns remain open for tax years 2012 forward and our state tax returns remain open for tax years 2011 forward. None of our federal or state income tax returns are currently under examination by the Internal Revenue Service or state authorities.
| F-28 |
| Table of Contents |
NOTE 9 — COMMITMENTS AND CONTINGENCIES
Litigation
We are subject to certain claims arising in the ordinary course of business. Management does not believe that any claims will have a material adverse effect on our financial position or results of operations.
In 2015, we ceased compensating our employees on a day rate basis in order to ensure full compliance with the Fair Labor Standards Act (“FLSA”). Certain former employees of Aly Centrifuge, Inc. who were paid a day rate for their work prior to February 2015 alleged that we failed to pay overtime when they worked over 40 hours per week. During the years ended December 31, 2016 and 2015, certain of these employees pursued legal action against us based on such allegations:
|
| · | In February 2015, multiple plaintiffs filed a proposed collective action against us alleging overtime violations under the FLSA. We settled this matter for business purposes with no admission of liability. The settlement amount was fully accrued as of December 31, 2015 and the case was fully paid and dismissed with prejudice, by the end of January 2016. |
|
| · | In August 2016, several former employees filed a lawsuit against us alleging overtime violations of the FLSA. In May 2017, we settled the matter for business purposes with no admission of liability. The settlement amount was fully accrued as of December 31, 2016 and, as of June 30, 2017, the settlement was fully paid and the case had been dismissed with prejudice. |
|
| · | We are currently in the early stages of arbitration with five prior employees who allege overtime violations of the FLSA. We are exploring settlement options to resolve this matter as well as preparing to defend the arbitration should settlement not be feasible. An estimated settlement amount was fully accrued as of December 31, 2016. |
The Company entered into certain employment agreements in connection with the acquisition of United and Evolution in 2014 which provided for specified severance obligations of the Company in the event of a termination of employment of the subject employees. The Company also entered into a similar employment agreement in 2015 in connection with the recruitment of an additional employee for the solids control operations. During 2015 and 2016, the employment of these individuals terminated, and the Company did not pay the severance obligations that were contemplated by the employment agreements in the event that the cessation of employment would be determined to have been a termination by the Company “without cause.” As of December 31, 2016, the aggregate unpaid severance obligation under these agreements was approximately $0.7 million.
Contractual Commitments
We have numerous contractual commitments in the ordinary course of business including debt service requirements and operating leases. We lease land, facilities and equipment from non-affiliates. Certain of these leases extend to 2020.
Operating Leases
We lease certain property and equipment under non-cancelable operating leases. The terms of our operating leases generally range from one to five years. Lease expense under all operating leases totaled approximately $0.4 million and $0.5 million for the years ended December 31, 2016 and 2015, respectively. As of December 31, 2016, the future minimum lease payments under non-cancelable operating leases were as follows (in thousands):
| Year Ending December 31, |
|
|
| |
| 2017 |
| $ | 190 |
|
| 2018 |
|
| 73 |
|
| 2019 |
|
| 55 |
|
| 2020 |
|
| 5 |
|
|
|
| $ | 323 |
|
NOTE 10 — REDEEMABLE PREFERRED STOCK
Two of our subsidiaries have redeemable preferred stock outstanding as of December 31, 2016. Aly Operating issued redeemable preferred stock in connection with the acquisition of Austin Chalk (“Aly Operating Redeemable Preferred Stock”) and Aly Centrifuge issued redeemable preferred stock in connection with the acquisition of United (“Aly Centrifuge Redeemable Preferred Stock”).
On January 31, 2017, in connection with the Recapitalization, the Aly Operating Redeemable Preferred Stock, the Aly Centrifuge Redeemable Preferred Stock and all accrued dividends on such stock were converted into 5,454,487 shares of common stock.
| F-29 |
| Table of Contents |
Aly Operating Redeemable Preferred Stock
As part of the acquisition of Austin Chalk, Aly Operating agreed to issue up to 4 million shares of Aly Operating Redeemable Preferred Stock, with a par value of $0.01, to the seller, with a fair value and liquidation value of $3.8 million and $4.0 million, respectively. The preferred stock was valued as of the date of acquisition by discounting the sum of (i) the liquidation value at issuance and (ii) the future cumulative accrued dividends as of the date of optional redemption for a lack of marketability.
The Aly Operating Redeemable Preferred Stock was entitled to a cumulative paid-in-kind dividend of 5% per year on its liquidation preference, compounded quarterly. Aly Operating was not required to pay cash dividends.
The following table describes the changes in Aly Operating Redeemable Preferred Stock (in thousands, except for shares) for the years ended December 31, 2016 and 2015:
|
|
| Carrying Value of Aly Operating Redeemable Preferred Stock |
|
| Number of Outstanding Aly Operating Redeemable Preferred Shares |
|
| Liquidation Value of Aly Operating Redeemable Preferred Stock |
| |||
|
|
|
|
|
|
|
|
|
|
| |||
| January 1, 2015 |
| $ | 4,382 |
|
|
| 4,000,000 |
|
| $ | 4,458 |
|
| Accrued dividends |
|
| 227 |
|
|
| - |
|
|
| 227 |
|
| Accretion |
|
| 38 |
|
|
| - |
|
|
| - |
|
|
|
|
|
|
|
|
|
|
|
|
|
|
|
| December 31, 2015 |
|
| 4,647 |
|
|
| 4,000,000 |
|
|
| 4,685 |
|
| Accrued dividends |
|
| 239 |
|
|
| - |
|
|
| 239 |
|
| Accretion |
|
| 38 |
|
|
| - |
|
|
| - |
|
|
|
|
|
|
|
|
|
|
|
|
|
|
|
| December 31, 2016 |
| $ | 4,924 |
|
|
| 4,000,000 |
|
| $ | 4,924 |
|
The Aly Operating Redeemable Preferred Stock is classified outside of permanent equity in our consolidated balance sheet because the settlement provisions provided the holder the option to require Aly Operating to redeem the Aly Operating Redeemable Preferred Stock at the liquidation price plus any accrued dividends upon a liquidity event, as defined in the agreement, or upon an initial public offering, as defined in the agreement.
On January 31, 2017, the Aly Operating Redeemable Preferred Stock and all accrued dividends were converted into 2,414,971 shares of common stock in connection with the Recapitalization. This conversion was accounted for as a trouble debt restructuring, see further details in “Note 2 – Recent Developments”.
Aly Centrifuge Redeemable Preferred Stock
On April 15, 2014, as part of the United Acquisition, Aly Centrifuge issued 5,000 shares of Aly Centrifuge Redeemable Preferred Stock, with a par value of $0.01, to the sellers in the transaction, with a fair value and liquidation value of $5.1 million and $5.0 million, respectively. The preferred stock was valued as of the date of acquisition by discounting the sum of (i) the value of the preferred stock without a conversion option using the option pricing method and (ii) the value of the conversion option using the Black-Scholes option pricing model for a lack of marketability. In 2015, Aly Centrifuge asserted an indemnification claim of 124 shares against shares that were subject to an eighteen-month holdback for general indemnification purposes pursuant to the purchase agreement.
On August 15, 2014, in connection with a bulk equipment purchase, Aly Centrifuge issued an additional 4,000 shares of Aly Centrifuge Redeemable Preferred Stock, with a par value of $0.01, to the sellers in the transaction, with a fair value and liquidation value of $4.3 million and $4.0 million, respectively. The preferred stock was valued as of the date of the equipment purchase by discounting the sum of (i) the value of the preferred stock without a conversion option using the option pricing method and (ii) the value of the conversion option using the Black-Scholes option pricing model for a lack of marketability.
The Aly Centrifuge Redeemable Preferred Stock was entitled to a cumulative paid-in-kind dividend of 5% per year on its liquidation preference, compounded quarterly. Aly Centrifuge was not required to pay cash dividends.
| F-30 |
| Table of Contents |
The following table describes the changes in the Aly Centrifuge Redeemable Preferred Stock (in thousands, except for shares) for the years ended December 31, 2016 and 2015:
|
|
| Carrying Value of Aly Centrifuge Redeemable Preferred Stock |
|
| Number of Outstanding Aly Centrifuge Redeemable Preferred Shares |
|
| Liquidation Value of Aly Centrifuge Redeemable Preferred Stock |
| |||
|
|
|
|
|
|
|
|
|
|
| |||
| January 1, 2015 |
| $ | 9,584 |
|
|
| 9,000 |
|
| $ | 9,254 |
|
| Holdback adjustment |
|
| (124 | ) |
|
| (124 | ) |
|
| (124 | ) |
| Accrued dividends |
|
| 460 |
|
|
| - |
|
|
| 460 |
|
| Amortization |
|
| (165 | ) |
|
| - |
|
|
| - |
|
|
|
|
|
|
|
|
|
|
|
|
|
|
|
| December 31, 2015 |
|
| 9,755 |
|
|
| 8,876 |
|
|
| 9,590 |
|
|
|
|
|
|
|
|
|
|
|
|
|
|
|
| Accrued dividends |
|
| 489 |
|
|
| - |
|
|
| 489 |
|
| Amortization |
|
| (164 | ) |
|
| - |
|
|
| - |
|
|
|
|
|
|
|
|
|
|
|
|
|
|
|
| December 31, 2016 |
| $ | 10,080 |
|
|
| 8,876 |
|
| $ | 10,079 |
|
The Aly Centrifuge Redeemable Preferred Stock is classified outside of permanent equity in our consolidated balance sheet because the settlement provisions provided the holder the option to require Aly Centrifuge to redeem the Aly Centrifuge Redeemable Preferred Stock at the liquidation price plus any accrued dividends.
Aly Centrifuge Redeemable Preferred Stock also included a conversion feature; specifically, the right to exchange into shares of our common stock on any date, from time-to-time, at the option of the holder, into the number of shares equal to the quotient of (i) the sum of (A) the liquidation preference plus (B) an amount per share equal to accrued but unpaid dividends not previously added to the liquidation preference on such share of preferred stock, divided by (ii) 1,000, and (iii) multiplied by the exchange rate in effect at such time (“Conversion Feature”). The exchange rate in effect as of December 31, 2016 was 71.4285 or $14.00 per share of our common stock.
On January 31, 2017, the Aly Centrifuge Redeemable Preferred Stock and all accrued dividends were converted into 3,039,517 shares of common stock in connection with the Recapitalization; however, the shares were not converted according to the terms of the Conversion Feature but instead the conversion rate was negotiated independently as a part of the Recapitalization. This conversion was accounted for as a trouble debt restructuring, see further details in “Note 2 – Recent Developments”.
NOTE 11 — CONTROLLING SHAREHOLDER AND RELATED PARTY TRANSACTIONS
From time-to-time, the Company engages in business transactions with its controlling shareholder, Pelican, and other related parties.
Controlling Shareholder – Pelican
On December 12, 2016, Pelican purchased our Aly Senior Obligations, which aggregated $21.5 million as of December 31, 2016 from Tiger for $5.1 million as a part of the Recapitalization. Effective January 31, 2017, the Recapitalization was completed and resulted in the following:
|
| · | Pelican’s contribution of approximately $16.1 million of the Aly Senior Obligations into shares of Aly Energy Convertible Preferred Stock that represented approximately 80% of our common stock, or 53,628,842 common shares, on a fully diluted basis as of January 31, 2017. The preferred shares carry a liquidation preference of $1,000 per share or $16.1 million upon issuance. |
|
| · | Amendment of the Company’s credit agreement acquired by Pelican into a new credit agreement (consisting of a $5.1 million term loan and $1.0 million revolving credit arrangement) with an extended maturity date of December 31, 2018. |
| F-31 |
| Table of Contents |
On January 31, 2017 upon completion of the Recapitalization, Pelican had the power to vote the substantial majority of the Company’s outstanding common stock. Currently six of our board members and all four of our executive officers hold an ownership interest in Pelican.
On May 23, 2017 and in consideration of the increase in the revolving credit facility and the extension of the final maturity date, the Company agreed to issue Pelican an amendment fee of 1,200 shares of our Series A Convertible Preferred Stock.
See “Note 7 – Long-term Debt – Pelican” and “Note 2 – Recent Developments” for details of the Aly Senior Obligations, Recapitalization and Unaudited Consolidated Pro Forma Balance Sheet.
Other Related Party Transactions
One of our directors, Tim Pirie, who was appointed March 3, 2015, was one of the sellers of United to us in April 2014. Part of the acquisition price was payable in contingent consideration of which $0.9 million was paid in 2015. Of that amount, approximately $0.1 million was allocable to Mr. Pirie. We did not make any contingent payments during 2016. As of December 31, 2016, we estimated the fair value of future payments to be $0.8 million of which approximately $0.2 million would be allocable to Mr. Pirie. On January 31, 2017, in connection with the Recapitalization, the aggregate contingent payment liability was converted into 457,494 shares of the Company’s common stock of which Mr. Pirie controls all of the voting rights to 326,834 shares. See further discussion in “Note 2 – Recent Developments” and “Note 3 – Summary of Significant Accounting Principles (Contingent Payment Liability)”.
As part of the acquisition price of United, the sellers also received Aly Centrifuge redeemable preferred stock. On January 31, 2017, the outstanding Aly Centrifuge redeemable preferred stock and accrued PIK dividends were converted into 3,039,517 shares of the Company’s common stock of which Mr. Pirie controls all of the voting rights to 593,815 shares. See further discussion in “Note 2 – Recent Developments” and “Note 10 – Redeemable Preferred Stock (Aly Centrifuge Redeemable Preferred Stock)”.
We issued 82,649 shares of our common stock during the year ended December 31, 2015, to one of our directors in respect of his arrangement of certain issuances of common stock to non-U.S. investors.
NOTE 12 — STOCK-BASED COMPENSATION
Stock-Based Payments
We issued 15,625 shares of our stock during the year ended December 31, 2015 as part of compensation to one of our former employees in accordance with his employment agreement. In connection with this issuance, we recognized stock-based compensation expense of $0.1 million for the year ended December 31, 2015.
Stock Options
As of December 31, 2016 and 2015, we had a stock-based compensation plan available to grant incentive stock options, non-qualified stock options and restricted stock to employees and non-employee members of the board of directors.
The Omnibus Incentive Plan (the “Plan”) was approved by the board of directors on May 2, 2013. On May 2, 2013, we granted 338,474 common shares under the Plan, which was the maximum number authorized. On June 5, 2015, a majority of our stockholders approved an amendment to our Plan to increase the maximum authorized shares to 750,000 common shares.
The option contract term is 10 years and the exercise price is $4.00. The options vest and are exercisable if a “Liquidity Event” occurs and certain conditions are met. A Liquidity Event is defined as an IPO or a change of control, as defined in the plan. Pursuant to the plan, an IPO is defined as an underwritten public offering of shares. If the first Liquidity Event is an IPO, then the options vest and are exercisable immediately if the IPO is effected at a price of $8.00 per share or greater. If the IPO is effected at a price less than $8.00 per share, but the stock price post-IPO reaches $8.00 per share during the six-month period immediately following the IPO, then the options vest and are exercisable. If the IPO is effected at a price less than $8.00 per share and the share price does not reach $8.00 per share prior to the sixth month anniversary of the IPO, the options do not vest and expire. If the first Liquidity Event to occur is a change of control, then the options vest if the change of control takes place at a price of at least $8.00 per share. If such change in control occurs at a price less than $8.00 per share, the options do not vest and expire.
| F-32 |
| Table of Contents |
The fair value of each option award granted under the Plan is estimated on the date of grant using the Monte Carlo simulation method. The same Monte Carlo simulation method is used to determine the derived service period of five years. In addition, expected volatilities have been based on comparable public company data, with consideration given to our limited historical data. We make estimates with respect to employee termination and forfeiture rates of the options within the valuation model. The risk-free rate is based on the approximate U.S. Treasury yield rate in effect at the time of grant. For options granted prior to the Share Exchange, the calculation of our stock price involved the use of different valuation techniques, including a combination of an income and/or market approach. Determination of the fair value was a matter of judgment and often involved the use of significant estimates and assumptions.
As of December 31, 2016 and 2015, options to purchase 242,507 and 330,111 common shares under the Plan were outstanding and $0.3 million and $0.5 million of total unrecognized compensation cost related to non-vested stock option awards, respectively. Such amount will be recognized in the future upon occurrence of a Liquidity Event that results in a vesting of the options. No options were granted during the years ended December 31, 2016 and 2015. No options were vested as of December 31, 2016 and 2015. During the year ended December 31, 2016, forfeited options totaled 87,604. No forfeitures occurred in the year ended December 31, 2015.
Effective April 4, 2017, the 2017 Stock Option Plan (the “2017 Plan”) was approved by the board of directors. On May 30, we granted approximately 16.9 million common shares under the 2017 Plan which was the maximum amount authorized. The option contract term is 10 years and the exercise price is $0.10. The options vested and became exercisable immediately upon grant. The Company is in the process of determining the value of these options.
NOTE 13 — STOCKHOLDERS’ EQUITY (DEFICIT)
Common Shares
Authorized common shares total 25,000,000 with a par value of $0.001 per share, of which, 6,707,039 and 6,706,814 were issued and outstanding, respectively, as of December 31, 2016 and 6,707,039 and 6,706,814 were issued and outstanding, respectively, as of December 31, 2015. Common stock held in treasury as of December 31, 2016 and 2015 were 225 shares.
On January 12, 2015, we issued 50,000 shares of our common stock in a private placement at a price of $11.00 per share for gross proceeds of approximately $0.6 million. In connection with the private placement we incurred approximately $37,000 in issuance costs which have been netted against proceeds in the consolidated statement of changes in stockholders’ equity (deficit).
On June 24, 2015, we initiated a private offering to accredited investors. On September 30, 2015, we closed the offering and issued 1,047,424 shares of common stock to multiple accredited investors at a price of $3.20 per share.
We issued 82,649 shares of our common stock during the year ended December 31, 2015, to one of our directors in respect of his arrangement of certain issuances of common stock to non-U.S. investors.
On January 31, 2017, we completed the Recapitalization which resulted in the issuance of 7,111,981 shares of our common stock to the former holders of Aly Operating redeemable preferred stock, Aly Centrifuge redeemable preferred stock, Aly Centrifuge subordinated debt, and liability for contingent payment (an aggregate of six individual entities and persons).
Preferred Shares
Authorized preferred shares total 10,000,000 with a par value of $0.001 per share, of which, none were issued and outstanding as of December 31, 2016 and 2015.
As a result of the Recapitalization, the Company allocated 20,000 of its authorized shares from available authorized preferred shares to Series A Convertible Preferred Stock and issued 16,092 shares on January 31, 2017. The Series A Convertible Preferred Stock have a par value of $0.001 per share, a face value of $16.1 million, which has no determinable market value as of January 31, 2017. The conversion feature provides that each Series A Preferred share shall be convertible into 3332.64 common shares at the option of the shareholder and retains a liquidation preference equal to $1,000 per share. All shares vote on an as if converted basis, whereby Pelican, who owns 100% of the Series A Convertible Preferred Stock, controls the substantial majority of votes of Aly Energy (See further discussion in “Note 11 – Controlling Shareholder and Other Related Party Transactions”).
On May 23, 2017 and in consideration of the increase in the revolving credit facility and the extension of the final maturity date, the Company agreed to issue Pelican an amendment fee of 1,200 shares of our Series A Convertible Preferred Stock.
| F-33 |
| Table of Contents |
NOTE 14 — SUPPLEMENTAL CASH FLOW INFORMATION
Supplemental cash flows and non-cash investing and financing activities are as follows (in thousands):
|
|
| For the Years Ended |
| |||||
|
|
| 2016 |
|
| 2015 |
| ||
| Supplemental disclosure of cash flow information: |
|
|
|
|
|
| ||
| Cash paid for interest |
| $ | 973 |
|
| $ | 1,590 |
|
| Cash paid for interest - discontinued operations |
|
| 1 |
|
|
| 1 |
|
| Cash paid for income taxes, net |
|
| 2 |
|
|
| 109 |
|
|
|
|
|
|
|
|
|
|
|
| Non-cash investing and financing activities: |
|
|
|
|
|
|
|
|
| Purchase of equipment through a capital lease obligation |
| $ | - |
|
| $ | 1,068 |
|
| Accretion of preferred stock liquidation preference, net |
|
| 126 |
|
|
| 127 |
|
| Paid-in-kind dividends on preferred stock |
|
| 728 |
|
|
| 687 |
|
| Common shares issued for transaction cost of equity raise |
|
| - |
|
|
| 590 |
|
| Exchange of property and equipment for reduction in debt in connection with Recapitalization |
|
| 2,000 |
|
|
| - |
|
| Principal payments financed through disposition of assets |
|
| 301 |
|
|
| - |
|
| Assumption of Aly Senior Obligations by Pelican in connection with the Recapitalization |
| 20,867 |
|
| - |
| ||
NOTE 15 — DISCONTINUED OPERATIONS
On October 26, 2016, we abandoned the operations of Evolution, our directional drilling and MWD business, as a part of the Recapitalization (See further discussion in “Note 2 – Recent Developments”). The abandonment of these operations meets the criteria established for recognition as discontinued operations under generally accepted accounting principles in U.S. GAAP.
The following table summarizes the components of loss from discontinued operations, net of income taxes included in the consolidated statements of operations (in thousands):
|
|
| For the Years Ended |
| |||||
|
|
| 2016 |
|
| 2015 |
| ||
|
|
|
|
|
|
|
| ||
| Revenue |
| $ | 250 |
|
| $ | 3,618 |
|
|
|
|
|
|
|
|
|
|
|
| Expenses: |
|
|
|
|
|
|
|
|
| Operating expenses |
|
| 124 |
|
|
| 3,239 |
|
| Depreciation and amortization |
|
| 572 |
|
|
| 780 |
|
| Selling, general and administrative expenses |
|
| 222 |
|
|
| 1,713 |
|
| Reduction in value of assets |
|
| 2,591 |
|
|
| 3 |
|
|
|
|
|
|
|
|
|
|
|
| Total expenses |
|
| 3,509 |
|
|
| 5,735 |
|
|
|
|
|
|
|
|
|
|
|
| Loss from discontinued operations |
|
| (3,259 | ) |
|
| (2,117 | ) |
|
|
|
|
|
|
|
|
|
|
| Interest expense, net |
|
| 1 |
|
|
| 2 |
|
|
|
|
|
|
|
|
|
|
|
| Loss from discontinued operations before income taxes |
|
| (3,260 | ) |
|
| (2,119 | ) |
|
|
|
|
|
|
|
|
|
|
| Income tax benefit |
|
| (769 | ) |
|
| (169 | ) |
|
|
|
|
|
|
|
|
|
|
| Loss from discontinued operations, net of income taxes |
| $ | (2,491 | ) |
| $ | (1,950 | ) |
| F-34 |
| Table of Contents |
The reduction in value of assets included in the loss from discontinued operations consisted of the following (in thousands):
|
|
| For the Years Ended |
| |||||
|
|
| 2016 |
|
| 2015 |
| ||
|
|
|
|
|
|
|
| ||
| Reduction in value of property and equipment: |
|
|
|
|
|
| ||
| Impairment in connection with Recapitalization |
| $ | 1,676 |
|
| $ | - |
|
| Loss on disposal of assets |
|
| - |
|
|
| 3 |
|
| Reduction in value of intangibles |
|
| 651 |
|
|
| - |
|
| Impairment of goodwill |
|
| 264 |
|
|
| - |
|
| Total reduction in value of assets |
| $ | 2,591 |
|
| $ | 3 |
|
On October 26, 2016, in connection with the Recapitalization and the abandonment of the Evolution assets, we recorded an impairment of property and equipment. The value remaining for intangibles and goodwill associated with these discontinued operations was reduced to zero.
For the year ended December 31, 2015, the loss from discontinued operations includes $0.3 million in charges relating to severance. As of December 31, 2015, the remaining unpaid severance liability of $0.2 million is included in liabilities associated with discontinued operations on the consolidated balance sheet. The liability was assumed by Aly Energy on December 31, 2016 and is included in other long-term liabilities on the consolidated balance sheet as of December 31, 2016.
The following summarizes the assets and liabilities associated with discontinued operations as of December 31, 2015 (in thousands):
|
|
| As of |
| |
|
|
| 2015 |
| |
|
|
|
|
| |
| Current assets |
| $ | 222 |
|
| Property and equipment, net |
|
| 1,933 |
|
| Intangible assets, net |
|
| 1,004 |
|
| Goodwill |
|
| 264 |
|
| Other assets |
|
| 5 |
|
|
|
|
|
|
|
| Total assets |
| 3,428 |
| |
|
|
|
|
|
|
| Current liabilities |
| 436 |
| |
| Deferred tax liabilities |
|
| 754 |
|
| Other liabilities |
|
| 21 |
|
|
|
|
|
|
|
| Total liabilities |
| 1,211 |
| |
|
|
|
|
|
|
| Net assets |
| $ | 2,217 |
|
By December 31, 2016, the abandonment of these operations and sell-off of the remaining assets was completed with approximately $0.2 million of remaining liabilities assumed by the continuing operations of the Company.
| F-35 |
| Table of Contents |
Item 9. Changes In and Disagreements With Accountants on Accounting and Financial Disclosure
None.
Item 9A. Controls and Procedures
Evaluation of Disclosure Controls and Procedures
Our management, under supervision and with the participation of the Company’s Principal Executive Officer and Principal Financial Officer, evaluated the effectiveness of our disclosure controls and procedures, as defined under Exchange Act Rule 13a-15(e). Based upon this evaluation, the Principal Executive Officer and Principal Financial Officer concluded that, as of December 31, 2016, because of the material weaknesses in our internal control over financial reporting (“ICFR”) described below, our disclosure controls and procedures were not effective.
Disclosure controls and procedures are controls and other procedures that are designed to ensure that required information to be disclosed in our reports filed or submitted under the Securities Exchange Act is recorded, processed, summarized and reported within the time periods specified in the Securities and Exchange Commission’s rules and forms. Disclosure controls and procedures include, without limitation, controls and procedures designed to ensure that required information to be disclosed in our reports filed under the Exchange Act is accumulated and communicated to our management, including our principal executive officer and our principal financial officer, as appropriate, to allow timely decisions regarding required disclosure.
Management’s Report on Internal Control over Financial Reporting
Our management is responsible for establishing and maintaining adequate internal control over financial reporting, as defined under Exchange Act Rules 13a-15(f) and 14d-14(f). Our internal control over financial reporting is designed to provide reasonable assurance regarding the reliability of financial reporting and the preparation of financial statements for external purposes in accordance with generally accepted accounting principles.
All internal control systems, no matter how well designed, have inherent limitations and may not prevent or detect misstatements. Therefore, even those systems determined to be effective can only provide reasonable assurance with respect to financial reporting reliability and financial statement preparation and presentation. In addition, projections of any evaluation of effectiveness to future periods are subject to risk that controls become inadequate because of changes in conditions and that the degree of compliance with the policies or procedures may deteriorate.
Management assessed the effectiveness of our internal control over financial reporting as of December 31, 2016. In making the assessment, management used the criteria issued by the Committee of Sponsoring Organizations of the Treadway Commission (COSO) in Internal Control-Integrated Framework 2013. Based on its assessment, management concluded that, as of December 31, 2016, our internal control over financial reporting was not effective and that material weaknesses in ICFR existed as more fully described below.
As defined by Auditing Standard No. 5, “An Audit of Internal Control Over Financial Reporting that is Integrated with an Audit of Financial Statements” established by the Public Company Accounting Oversight Board (“PCAOB”), a material weakness is a deficiency or combination of deficiencies that results in more than a remote likelihood that a material misstatement of annual or interim financial statements will not be prevented or detected. In connection with the assessment described above, management identified the following control deficiencies that represent material weaknesses as of December 31, 2016:
|
| 1) | Lack of an independent audit committee. This factor may be counter to corporate governance practices as defined by the various stock exchanges and may lead to less supervision over management; |
|
| 2) | Insufficient written policies and procedures, and personnel, for accounting and financial reporting with respect to the requirements and application of US GAAP and SEC disclosure requirements, specifically to address technical accounting around complex transactions; |
|
| 3) | Control over information technology applications and the processing of transactions, specifically segregation of duties and elevated access privileges; and |
|
| 4) | Controls were not designed and in place to ensure that all disclosures required were originally addressed in our financial statements or other required reports filed or submitted under the Securities Exchange Act. |
| 38 |
| Table of Contents |
Management’s Remediation Initiatives
As of December 31, 2016, management assessed the effectiveness of our internal control over financial reporting. Based on that evaluation, it was concluded that during the period covered by this report, the internal controls and procedures were not effective due to deficiencies that existed in the design or operation of our internal controls over financial reporting. However, management believes these weaknesses did not have an effect on our financial results. During the course of our evaluation, we did not discover any fraud involving management or any other personnel who play a significant role in our disclosure controls and procedures or internal controls over financial reporting.
Due to a lack of financial and personnel resources, we are not able to, and do not intend to, immediately take any action to remediate these material weaknesses. We will not be able to do so until, if ever, we acquire sufficient financing and staff to do so. We will implement further controls as circumstances, cash flows, and working capital permits. Notwithstanding the assessment that our ICFR was not effective and that there were material weaknesses as identified in this report, we believe that our financial statements contained in our Annual Report on Form 10-K for the period ended December 31, 2016, fairly presents our financial position, results of operations, and cash flows for the periods covered, as identified, in all material respects.
Management believes that the material weaknesses set forth above were the result of the scale of our operations and intrinsic to our small size.
Changes in Internal Control over Financial Reporting
During the period covered by this report, there were no changes (including corrective actions with regard to significant deficiencies or material weaknesses) in our internal controls over financial reporting that occurred that have materially affected, or are reasonably likely to materially affect, our internal control over financial reporting.
This Annual Report does not include an attestation report of our independent registered public accounting firm regarding internal control over financial reporting due to an exemption provided by the Dodd-Frank Wall Street Reform and Consumer Protection Act (the “Dodd-Frank Act”) enacted into law in July 2010. The Dodd-Frank Act provides smaller public companies and debt-only issuers with a permanent exemption from the requirement to obtain an external audit on the effectiveness of internal financial reporting controls provided in Section 404(b) of the Sarbanes-Oxley Act. Aly Energy is a smaller reporting company and is eligible for this exemption under the Dodd-Frank Act.
None.
| 39 |
| Table of Contents |
Item 10. Directors, Executive Officers and Corporate Governance
The table below sets forth information about our directors and executive officers:
| Name |
| Age |
| Position |
|
| ||||
| Munawar H. Hidayatallah |
| 73 |
| Chairman |
| Shauvik Kundagrami |
| 53 |
| Chief Executive Officer and Vice-Chairman |
| Greg Price |
| 65 |
| President and Chief Operating Officer |
| Alya Hidayatallah |
| 42 |
| Chief Financial Officer |
| Bryan Dutt |
| 57 |
| Director |
| Kouros Sariri |
| 61 |
| Director |
| Saeed M. Sheikh |
| 80 |
| Director |
| Timothy J. Pirie |
| 51 |
| Director |
| Zane Tankel |
| 77 |
| Director |
Munawar H. “Micki” Hidayatallah has served on the board of directors of Aly Operating since it was founded in July 2012 and has served as a director of Aly Energy since the Share Exchange. From July 2012 until May 2017, Mr. Hidayatallah served as the Company’s chief executive officer. From 2001 to 2011, he served as chairman, chief executive officer and a director of Allis-Chalmers Energy Inc. (“Allis-Chalmers”), where he was responsible for the overall management of the company. From 2004 to 2010, Allis-Chalmers’ revenue increased by more than tenfold (from $47.7 million to $659.7 million) and market capitalization increased by over seven times (from $72.2 million to $565.4 million). In February 2011, Archer Ltd. acquired Allis-Chalmers for $1.1 billion. Mr. Hidayatallah is a qualified chartered accountant and serves as a director of Stewart & Stevenson LLC and as its vice chairman of financial affairs.
Shauvik Kundagrami has served as the Company’s chief executive officer since May 2017 and joined the board of directors in December 2016. Prior to joining the Company, he served as co-head of the energy group at The Royal Bank of Canada for the prior 10 years.
Greg Price was elected as President and chief operating officer of the Company in December 2016. From April 2016 until such date, he served as a Special Advisor to the CEO of the Company. From 2005 to 2016, he served in various positions, including President of Directional Drilling Services and President of Rental Tubular Division, at Allis-Chalmers Energy Inc., which was acquired in 2011 and subsequently named Archer.
Alya H. Hidayatallah became chief financial officer of Aly Operating in January 2013 and has served as our chief financial officer since the Share Exchange. Previously, from 2005 through 2012, she served as director of planning and budgeting at Allis-Chalmers, which was acquired in 2011 and subsequently named Archer. From 2000 until 2004, Ms. Hidayatallah was an investment banker in the financial restructuring group of Houlihan Lokey Howard & Zukin. Ms. Hidayatallah graduated summa cum laude with a degree in Business Economics from the University of California at Los Angeles in 1997. Ms. Hidayatallah is Mr. Hidayatallah’s daughter.
Bryan Dutt is the Founder and President of Ironman Energy Capital Management, LLC, which he founded in 1999. Ironman has three SEC registered private partnership funds which specialize in upstream energy securities. Mr. Dutt joined our board of directors in December 2016.
Kouros Sariri joined the board of directors of Aly Operating in October 2012, and has served as our director since the Share Exchange. Mr. Sariri is the founder and CEO of Frequency Management International (“FMI”) Inc. Founded in 2003, FMI is a manufacturer of high reliability & extreme environment electronic components used in advanced electronic system applications. In 2003, Mr. Sariri also founded Chronos Technology (merged with FMI) which serves in a research and development capacity, conducting advanced research for NASA and DOE in the area of extreme environment electronic solutions and the related manufacturing processes. Innovations envisioned and introduced by Mr. Sariri have been used in commercial satellites and scientific/robotic space missions as well as in numerous oil, gas and geothermal fields worldwide. FMI is a globally recognized brand for the high reliability solutions used successfully in LWD, MWD, wire-line and digital oilfield systems.
Saeed M. Sheikh joined the board of directors of Aly Operating in October 2012 and has served as our director since the Share Exchange. He founded Star Trading & Marine, Inc., a transportation and shipping company, in 1973 and has served as its president since inception. In October 2013, Mr. Sheikh was appointed to serve as Ambassador at Large for the Government of Pakistan.
| 40 |
| Table of Contents |
Timothy J. Pirie has over 25 years of oilfield experience. In 2003, he founded United Oilfield International, a Canadian solids control equipment& service provider with operations in Canada, United States and Peru and remained as president and director from its inception until its acquisition by the Company in 2014. He also founded Canadian Nitrogen Services in 2005 and has been president and director since its inception. It is a Canadian based N2 pumping service utilizing membrane technology with operations in Canada, United States and Saudi Arabia. In 2013 was a founder of Decisive Dividend Corporation, a publicly traded Canadian corporation. Mr. Pirie is also a founder and director of a privately held engineering / construction company currently working on E&P projects in the Middle East and a founder of Petro Toro Inc., a Peruvian focused Oil & Gas Exploration Company.
Zane Tankel has served on the board of directors of Aly Energy since October 2012, and has served as our director since the Share Exchange. Mr. Tankel is the Chairman and CEO of Apple-Metro, Inc., a multi-unit operator of family restaurants in the New York metropolitan area, which he co-founded in 1994. Mr. Tankel was a director of Morton’s Restaurant Group, Inc., a New York Stock Exchange company, from February 2006 until February 2012, and a director of Allis-Chalmers Energy Inc. from February 2007 until February 2011, as well as the Caribbean Restaurant Group, the San Juan, Puerto Rico based owner/operator of Burger King restaurants in and around the Caribbean.
Board Committees and Charters
Because Pelican owns substantially in excess of a majority of our issued and outstanding voting stock, we are a “controlled company” within the meaning of the Nasdaq corporate governance standards. Under the rules pertaining to “controlled companies,” we are required to have an audit committee made up entirely of independent directors, but we are not required to maintain a compensation committee or a nominating committee, and we no longer do so.
Our Board has established an Audit Committee comprised of Mr. Hidayatallah. The Audit Committee is governed by a written charter. The full text of the Audit Committee charter is available on our website located at www.alyenergy.com or in print to any interested party who requests it. Requests should be sent in writing to the attention of the Secretary at 3 Riverway, Suite 920, Houston, Texas 77056, 713-333-4000. The Audit Committee assists our Board in fulfilling its oversight responsibility relating to (i) the integrity of our financial statements and other financial information furnished by the Company, (ii) our compliance with legal and regulatory requirements, (iii) our system of internal accounting and financial controls, (iv) our independent registered public accounting firm’s qualifications, performance, compensation and independence, (v) the performance of our internal audit function, and (vi) compliance with our code of business conduct and ethics. Our board of directors has determined that Mr. Hidayatallah does not meet the independence standards of Audit Committee members prescribed by the NASDAQ Capital Market listing rules. However, our Board has determined that Mr. Hidayatallah qualifies as an “audit committee financial expert” under Item 407 of Regulation S-K promulgated by the SEC.
Code of Ethics
The board of directors has adopted a code of business ethics that applies to its directors, officers and management employees generally. A copy of this code of business ethics may be obtained, at no cost, from our investor relations website (www.alyenergy.com), by writing or by telephoning us at: Aly Energy Services, Inc., 3 Riverway, Suite 920, Houston, Texas 77056, 713-333-4000, Attn: Secretary.
Stockholder Communications
We do not have a formal policy regarding communications with our board of directors; however, stockholders may communicate with the board of directors by writing to us at: Aly Energy Services, Inc., 3 Riverway, Suite 920, Houston, Texas 77056, Attention: Chief Financial Officer. Stockholders who would like their submission directed to a member of the board of directors may so specify and the communication will be forwarded, as appropriate.
Board Assessment of Risk
The board of directors has an active role in overseeing management of our risks. The board of directors regularly receives reports from senior management on our areas of material risk, including our credit, liquidity, operational and legal and regulatory risks. Pursuant to its charter, the audit committee reviews our major financial risk exposures and the steps management has taken to monitor and control such exposures, and it also meets periodically with management to discuss policies with respect to risk assessment and risk management. While the audit committee oversees certain risks and the management of such risks, the entire board of directors is regularly informed through committee reports about such risks.
Board Diversity
While we do not have a formal policy on diversity, our board of directors considers diversity to include the skill set, background, reputation, type and length of business experience of our board of director’s members as well as a particular nominee’s contributions to that mix. Our board of directors believes that diversity brings a variety of ideas, judgments and considerations that benefit our stockholders and us. Although there are many other factors, the board of directors seeks individuals with experience in operating growing businesses.
| 41 |
| Table of Contents |
Item 11. Executive Compensation
Executive Compensation
The following table summarizes the overall compensation earned over each of the past two fiscal years ending December 31, 2016 by the persons named below (collectively the “Named Executive Officers”):
| Name and Principal Position |
| Year |
| Salary |
|
| Bonus |
|
| All Other Compensation |
|
| Total |
| ||||
|
|
|
|
|
|
|
|
|
|
|
|
|
|
| |||||
| Micki Hidayatallah |
| 2016 |
| $ | 53,673 | (1) |
| $ | - |
|
| $ | 20,000 | (2) |
| $ | 73,673 |
|
| Chairman and Chief Executive Officer |
| 2015 |
|
| 360,062 | (1) |
|
| - |
|
|
| 29,992 | (2) |
|
| 390,054 |
|
|
|
|
|
|
|
|
|
|
|
|
|
|
|
|
|
|
|
|
|
| Alya Hidayatallah |
| 2016 |
|
| 163,245 | (3) |
|
| - |
|
|
| - |
|
|
| 163,245 |
|
| Chief Financial Officer |
| 2015 |
|
| 186,254 | (3) |
|
| - |
|
|
| - |
|
|
| 186,254 |
|
|
|
|
|
|
|
|
|
|
|
|
|
|
|
|
|
|
|
|
|
| Mark Patterson |
| 2016 |
|
| 207,422 | (4) |
|
| - |
|
|
| 3,000 | (5) |
|
| 210,422 |
|
| President and Chief Operating Officer |
| 2015 |
|
| 232,892 | (4) |
|
| - |
|
|
| 3,000 | (5) |
|
| 235,892 |
|
________
| (1) | Mr. Hidayatallah accepted a voluntary reduction in salary in 2015 of 20% from the stated amount in his employment agreement. In January 2016, Mr. Hidayatallah accepted a voluntary reduction in salary to $25,000 per annum. Mr. Hidayatallah resigned as Chief Executive Officer in May 2017. |
| (2) | Reflects reimbursement of commuting expenses from Los Angeles to Houston. |
| (3) | Ms. Hidayatallah accepted a voluntary reduction in salary in 2015 of 10% from the stated amount in her employment agreement. In May 2016, the Board reduced Ms. Hidayatallah's salary by an incremental 20%. |
| (4) | Mr. Patterson accepted a voluntary reduction in salary in 2015 of 10% from the stated amount in his employment agreement. In May 2016, the Board reduced Mr. Patterson's salary by an incremental 20%. In September 2016, although the Company ceased paying Mr. Patterson a cash salary, the Company continued to accrue his salary and will satisfy such liability if and when it is able to do so. Mr. Patterson's employment agreement expired on December 31, 2016 and was not renewed. |
| (5) | Reflects personal use of company automobile. |
Executive Employment Agreements
On May 30, 2017, we executed employment agreements with each of Shauvik Kundagrami, Greg Price and Alya Hidayatallah. The employment agreements provide for the following:
|
| · | Annual base salaries of $300,000 to Shauvik Kundagrami and $200,000 to each of Greg Price and Alya Hidayatallah |
|
| · | Target EBITDA to be set annually by the board |
|
| · | If the Company achieves EBITDA target (after giving effect to deductions for executive bonuses), bonus will equal 100% of base salary |
|
| · | If the Company does not achieve such target but achieves EBITDA target prior to giving effect to deductions for execution bonuses, a lesser bonus will be determined at discretion of the board |
|
| · | Severance (salary continuation for 12 months) to be paid for termination without cause or termination by executive for good reason (which includes a change of control). A terminated executive will receive 50% of bonus (when and if otherwise earned by management) if terminated in first six months of year and 100% of bonus if terminated in second six months of year. |
|
| · | Stock option plan grants as described under “Adoption of Equity Awards Plan” below. |
| 42 |
| Table of Contents |
Director Compensation
During the year ended December 31, 2016, we compensated each of our independent directors in the amount of $5,000 for their service during the year.
Adoption of Equity Awards Plan
On April 4, 2017, we adopted a 2017 Stock Option Plan (the “Stock Option Plan”) and reserved an aggregate of 16,861,908 shares of common stock (20% of our outstanding shares on a fully diluted basis) for the issuance of shares pursuant to options to be granted under the Stock Option Plan.
On May 30, 2017, we granted stock options under the Stock Option Plan to Micki Hidayatallah (our Chairman), Shauvik Kundagrami (our CEO), Greg Price (our President and COO) and Alya Hidayatallah (our CFO) to purchase 5,058,572 shares, 5,058,572 shares, 3,372,382 shares and 3,372,382 shares, respectively, at an exercise price of $.10 per share. The options are fully vested and expire 10 years from the date of grant.
Security Ownership of Certain Beneficial Owners and Management
The following table sets forth information regarding beneficial ownership of our common stock as of June 30, 2017 by (i) each person or group who is known by us to beneficially own more than 10% of our common stock; (ii) each director; (iii) each of the Named Executive Officers and (iv) all such executive officers and directors as a group. Except as indicated in the footnotes to this table, the persons named in the table to our knowledge have sole voting and investment power with respect to all shares of securities shown as beneficially owned by them. Unless otherwise noted in the table below, each of our executive officers, directors and principal stockholders may be contacted at 3 Riverway, Suite 920, Houston, Texas 77056. The information in this table is based upon 88,308,715 common shares which is comprised of 13,818,795 shares of common stock outstanding as of June 30, 2017, 57,628,011 additional shares of common stock issuable if all of the outstanding shares of our Series A Convertible Preferred Stock were converted into common shares and 16,861,908 shares of common stock issuable upon exercise of stock options.
|
|
|
|
|
| Common Stock |
| |||||
| Name |
|
|
|
| Number of Shares Beneficially Owned |
|
| Percent of Class |
| ||
|
|
|
|
|
|
|
|
|
|
| ||
| Permian Pelican LLC |
| (1 | ) |
|
| 57,628,011 |
|
|
| 65.26 | % |
| Munawar H. Hidayatallah |
| (2 | ) |
|
| 5,712,701 |
|
|
| 6.47 | % |
| Shauvik Kundagrami |
| (3 | ) |
|
| 5,058,572 |
|
|
| 5.73 | % |
| Greg Price |
| (4 | ) |
|
| 3,376,362 |
|
|
| 3.82 | % |
| Alya Hidayatallah |
| (5 | ) |
|
| 3,372,382 |
|
|
| 3.82 | % |
| Timothy J. Pirie |
| (6 | ) |
|
| 931,843 |
|
|
| 1.06 | % |
| Zane Tankel |
| (7 | ) |
|
| 297,834 |
|
|
| 0.34 | % |
| Kouros Sariri |
| (8 | ) |
|
| 164,804 |
|
|
| 0.19 | % |
| Saeed M. Sheikh |
| (9 | ) |
|
| 122,817 |
|
|
| 0.14 | % |
| Bryan Dutt |
| (10 | ) |
|
| 105,065 |
|
|
| 0.12 | % |
|
|
|
|
|
|
|
|
|
|
|
|
|
| All directors and officers as a group |
|
|
|
|
| 19,037,315 |
|
|
| 21.56 | % |
__________
| (1) | Permian Pelican LLC ("Pelican") owns 17,292 shares of the Company's Series A Convertible Preferred Stock which are convertible into an aggregate of 57,628,011 shares of common stock (approximately 65.3% of fully diluted shares). Munawar H. Hidayatallah and Ali Afdhal are the sole managers of Pelican and therefore share voting and dispositive power over the shares owned by Pelican. |
| (2) | Mr. Hidayatallah and his spouse beneficially own 447,750 shares of common stock and an additional 206,379 shares of common stock are owned by a trust for which Mr. Hidayatallah is a trustee. Mr. Hidayatallah also has options to acquire an additional 5,058,572 shares of common stock. Mr. Hidayatallah owns approximately 9.8% of the membership interests of Pelican and may be deemed to indirectly own such proportionate amount of shares of common stock owned by Pelican. |
| (3) | Mr. Kundagrami has options to acquire 5,058,572 shares of common stock. Mr. Kundagrami owns approximately 9.8% of the membership interests of Pelican and may be deemed to indirectly own such proportionate amount of the shares of common stock owned by Pelican. |
| (4) | Mr. Price has options to acquire 3,372,382 shares of common stock. Mr. Price owns approximately 0.2% of the membership interests of Pelican and may be deemed to indirectly own such proportionate amount of the shares of common stock owned by Pelican. |
| (5) | Ms. Hidayatallah has options to acquire 3,372,382 shares of common stock. Ms. Hidayatallah owns approximately 0.2% of the membership interests of Pelican and may be deemed to indirectly own such proportionate amount of the shares of common stock owned by Pelican. |
| (6) | Canadian Nitrogen Services Ltd, in which Mr. Pirie has a beneficial ownership interest, owns 920,649 shares of common stock. In addition, Mr. Pirie owns 11,194 shares of common stock. |
| (7) | Mr. Tankel owns approximately 4.1% of the membership interests of Pelican and may be deemed to indirectly own such proportionate amount of the shares of common stock owned by Pelican. |
| (8) | Mr. Sariri owns approximately 1.4% of the membership interests of Pelican and may be deemed to indirectly own such proportionate amount of the shares of common stock owned by Pelican. |
| (9) | Mr. Sheikh owns approximately 1.4% of the membership interests of Pelican and may be deemed to indirectly own such proportionate amount of the shares of common stock owned by Pelican. |
| (10) | Ironman Energy Master Fund, in which Mr. Dutt has a beneficial ownership interest, owns 105,065 shares of common stock. Mr. Dutt owns approximately 8.8% of the membership interests of Pelican and may be deemed to indirectly own such proportionate amount of the shares of common stock owned by Pelican. |
| 43 |
| Table of Contents |
Item 13. Certain Relationships and Related Transactions and Director Independence
Recapitalization
As described in Item 1 of this Report, we consummated a recapitalization transaction with Pelican, a newly formed entity organized by certain of the Company’s directors and principal stockholders. Pursuant to the recapitalization, on December 12, 2016, Pelican agreed to acquire the Company’s outstanding secured indebtedness provided that the Company was successful in effecting the exchange of the Aly Operating preferred stock, Aly Centrifuge preferred stock, Aly Centrifuge subordinated debt and liability for a contingent payment into approximately 10% of our common stock on a fully diluted basis. Effective January 31, 2017, the recapitalization was completed and resulted in the following:
|
| · | Pelican’s contribution of approximately $16.1 million of the Aly Senior Obligations into shares of Aly Energy convertible preferred stock that represented approximately 80% of our common stock on a fully diluted basis as of January 31, 2017. |
|
|
|
|
|
| · | Amendment of the Company’s credit agreement acquired by Pelican into a new credit agreement (consisting of a $5.1 million term loan and $1.0 million revolving credit arrangement) with an extended maturity date of December 31, 2018. |
Director Independence
Using the definition of independence set forth in the rules of Nasdaq, all of our directors except Mr. Hidayatallah (our former chief executive officer) and Mr. Kundragrami (our current chief executive officer) are independent.
Item 14. Principal Accountant Fees and Services
Our independent auditors for the year ending December 31, 2016, RSM US LLP (“RSM”) have no direct interest in us and have been our auditors since October 13, 2015.
Audit and audit related fees by RSM related to their audit of our December 31, 2016 consolidated financial statements and their review of those consolidated financial statements included in the Company’s quarterly reports on Form 10-Q totaled approximately $170,000.
| 44 |
| Table of Contents |
| Exhibit Number |
| Exhibit Description |
|
|
|
|
| 2.1 |
| Share Exchange Agreement, dated May 14, 2013, by and among Preferred Voice, Inc., Aly Energy Services, Inc. and the stockholders of Aly Energy Services, Inc. (1) |
| 2.2 |
| Stock Purchase Agreement, dated as of September 27, 2012, by and between Aly Energy Services, Inc. and Kurt Chew (1) |
|
| ||
| 3.1 |
| Certificate of Incorporation, filed on August 3, 1992 with the Secretary of State of Delaware (1) |
| 3.2 |
| Certificate of Amendment, filed on May 2, 1994 with the Secretary of State of Delaware (1) |
| 3.3 |
| Certificate of Amendment, filed on March 21, 1995 with the Secretary of State of Delaware (1) |
| 3.4 |
| Certificate of Amendment, filed on July 27, 1995 with the Secretary of State of Delaware (1) |
| 3.5 |
| Certificate of Amendment, filed on March 7, 1997 with the Secretary of State of Delaware (1) |
| 3.6 |
| Certificate of Amendment, filed on April 27, 2007 with the Secretary of State of Delaware (1) |
| 3.7 |
| Certificate of Amendment, filed on May 14, 2013 with the Secretary of State of Delaware (1) |
| 3.8 |
| Certificate of Amendment, filed on April 10, 2014 with the Secretary of State of Delaware (2) |
| 3.9 |
| Certificate of Amendment, filed on June 18, 2015 with the Secretary of State of Delaware (6) |
| 3.10 |
| Certificate of Amendment, filed on December 21, 2015 with the Secretary of State of Delaware (7) |
| 3.11 |
| Certificate of Amendment, filed on May 18, 2016 with the Secretary of State of Delaware (8) |
| 3.12 |
| Certificate of Designation of Convertible Preferred Stock, filed on February 10, 2017 with the Secretary of State of Delaware (7) |
| 3.13 |
| Bylaws of the Registrant (1) |
|
| ||
|
| ||
|
| ||
|
| ||
|
| ||
|
| Form of Stock Option Agreement under Aly Energy Services, Inc. 2017 Stock Option Plan (4) | |
| 21.1 |
| List of Subsidiaries (5) |
|
| ||
|
| ||
|
| ||
|
|
| 45 |
| Table of Contents |
| 101.INS ** |
| XBRL Instance Document |
|
| ||
| 101.SCH ** |
| XBRL Taxonomy Extension Schema Document |
|
| ||
| 101.CAL ** |
| XBRL Taxonomy Extension Calculation Linkbase Document |
|
| ||
| 101.DEF ** |
| XBRL Taxonomy Extension Definition Linkbase Document |
|
| ||
| 101.LAB ** |
| XBRL Taxonomy Extension Label Linkbase Document |
|
| ||
| 101.PRE ** |
| XBRL Taxonomy Extension Presentation Linkbase Document |
________
** XBRL (Extensible Business Reporting Language) information is furnished and not filed or a part of a registration statement or prospectus for purposes of Sections 11 or 12 of the Securities Act of 1933, as amended, is deemed not filed for purposes of Section 18 of the Securities Exchange Act of 1934, as amended, and otherwise is not subject to liability under these sections.
| (1) | Filed as exhibit to Report on Form 8-K, dated May 15, 2013 |
| (2) | Filed as exhibit to Report on Form 8-K, dated April 16, 2014 |
| (3) | Filed as exhibit to Report on Form 8-K/A, dated July 31, 2013 |
| (4) | Filed herewith |
| (5) | Filed as exhibit to Report on Form 10-K for year ended December 31, 2014 |
| (6) | Filed as exhibit to Report on Form 8-K, dated June 22, 2015 |
| (7) | Filed as exhibit to Report on Form 8-K, dated December 29, 2015 |
| (8) | Filed as exhibit to Report on Form 8-K dated May 23, 2016 |
| (9) | Filed as exhibit to Report on Form 8-K dated February 16, 2017 |
| 46 |
| Table of Contents |
Pursuant to the requirements of the Securities Exchange Act of 1934, the registrant has duly caused this report to be signed on its behalf by the undersigned thereunto duly authorized.
|
| ALY ENERGY SERVICES, INC. |
| |
| Date: August 31, 2017 | By: | /s/ Shauvik Kundagrami | |
|
|
| Shauvik Kundagrami | |
| Vice-Chairman and Chief Executive Officer | |||
| (Principal Executive Officer) | |||
Pursuant to the requirements of the Securities Exchange Act of 1934, this report has been signed below by the following persons on behalf of the registrant in the capacities and on the dates indicated.
| Signature | Title | Date | ||
| /s/ Munawar H. Hidayatallah | Chairman | August 31, 2017 | ||
| Munawar H. Hidayatallah | ||||
| /s/ Shauvik Kundagrami | Vice-Chairman and Chief Executive Officer | August 31, 2017 | ||
| Shauvik Kundagrami | (principal executive officer) | |||
| /s/ Greg Price | President and Chief Operating Officer | August 31, 2017 | ||
| Greg Price | ||||
|
|
|
|
|
|
| /s/ Alya Hidayatallah |
| Chief Financial Officer, |
| August 31, 2017 |
| Alya Hidayatallah |
| (principal financial and accounting officer) |
|
|
|
|
|
|
|
|
| /s/ Bryan Dutt |
| Director |
| August 31, 2017 |
| Bryan Dutt |
|
|
|
|
|
|
|
|
|
|
| /s/ Kouros Sariri |
| Director |
| August 31, 2017 |
| Kouros Sariri |
|
|
|
|
|
|
|
|
|
|
| /s/ Saeed M. Sheikh |
| Director |
| August 31, 2017 |
| Saeed M. Sheikh |
|
|
|
|
|
|
|
|
|
|
| /s/ Zane Tankel |
| Director |
| August 31, 2017 |
| Zane Tankel |
|
|
|
|
|
|
|
|
|
|
| /s/ Timothy J. Pirie |
| Director |
| August 31, 2017 |
| Timothy J. Pirie |
|
|
|
|
| 47 |