Attached files
| file | filename |
|---|---|
| 8-K - FORM 8-K - STONERIDGE INC | v472708_8-k.htm |
Exhibit 99.1
J.P. Morgan Auto Conference Investor Presentation August 9, 2017
2 Forward - Looking Statements Statements in this presentation that are not historical facts are forward - looking statements, which involve risks and uncertaint ies that could cause actual events or results to differ materially from those expressed or implied by the statements. Important factors that may cause actual results to differ materially from those in th e f orward - looking statements include, among other factors, the loss or bankruptcy of a major customer; the costs and timing of facility closures, business realignment or similar actions; a significant change in m edi um - and heavy - duty truck, automotive or agricultural and off - highway vehicle production; our ability to achieve cost reductions that offset or exceed customer - mandated selling price reductions; a significa nt change in general economic conditions in any of the various countries in which Stoneridge operates; labor disruptions at Stoneridge’s facilities or at any of Stoneridge’s significant customers or supplier s; the ability of suppliers to supply Stoneridge with parts and components at competitive prices on a timely basis; the amount of Stoneridge’s indebtedness and the restrictive covenants contained in the agreements g ove rning its indebtedness, including its asset - based credit facility and senior secured notes; customer acceptance of new products; capital availability or costs, including changes in interest rates or mar ket perceptions; the failure to achieve successful integration of any acquired company or business; the occurrence or non - occurrence of circumstances beyond Stoneridge’s control; and the items described in “ Risk Factors” and other uncertainties or risks discussed in Stoneridge’s periodic and current reports filed with the Securities and Exchange Commission. Important factors that could cause the performance of the commercial vehicle and automotive industry to differ materially fro m t hose in the forward - looking statements include factors such as (1) continued economic instability or poor economic conditions in the United States and global markets, (2) changes in economic conditions, ho using prices, foreign currency exchange rates, commodity prices, including shortages of and increases or volatility in the price of oil, (3) changes in laws and regulations, (4) the state of the credi t m arkets, (5) political stability, (6) international conflicts and (7) the occurrence of force majeure events. These factors should not be construed as exhaustive and should be considered with the other cautionary statements in Stonerid ge’ s filings with the Securities and Exchange Commission. Forward - looking statements are not guarantees of future performance; Stoneridge’s actual results of operations, financial condit ion and liquidity, and the development of the industry in which Stoneridge operates may differ materially from those described in or suggested by the forward - looking statements contained in this presenta tion. In addition, even if Stoneridge’s results of operations, financial condition and liquidity, and the development of the industry in which Stoneridge operates are consistent with the forward - looking statemen ts contained in this presentation, those results or developments may not be indicative of results or developments in subsequent periods. This presentation contains time - sensitive information that reflects management’s best analysis only as of the date of this prese ntation. Any forward - looking statements in this presentation speak only as of the date of this presentation, and Stoneridge undertakes no obligation to update such statements. Comparisons of results for cur ren t and any prior periods are not intended to express any future trends or indications of future performance, unless expressed as such, and should only be viewed as historical data. Stoneridge does not undertake any obligation to publicly update or revise any forward - looking statement as a result of new infor mation, future events or otherwise, except as otherwise required by law. Rounding Disclosure: There may be slight immaterial differences between figures represented in our public filings compared t o w hat is shown in this presentation. The differences are the a result of rounding due to the representation of values in millions rather than thousands in public filings.
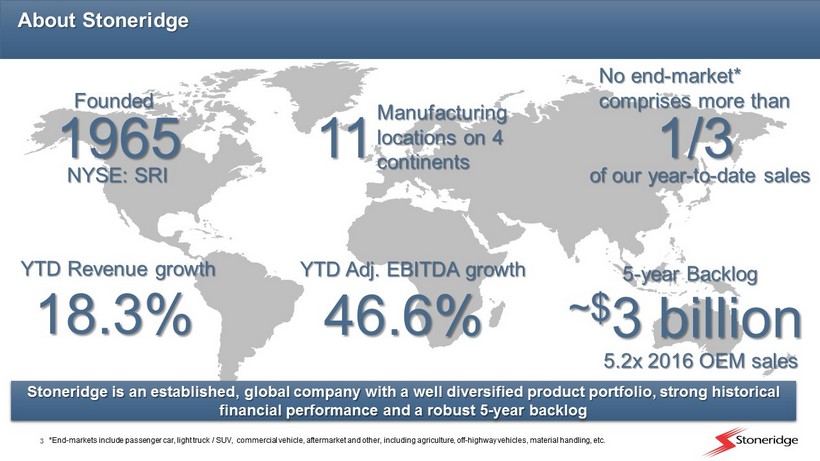
3 About Stoneridge 11 Manufacturing locations on 4 continents 18.3% 1965 NYSE: SRI ~$ 3 billion 5 - year Backlog YTD Revenue g rowth Stoneridge is an established, global company with a well diversified product portfolio, strong historical financial performance and a robust 5 - year backlog YTD Adj. EBITDA growth 46.6% 1/3 o f our year - to - date sales No end - market* comprises more than *End - markets include passenger car, light truck / SUV, commercial vehicle, aftermarket and other, including agriculture, off - hig hway vehicles, material handling, etc. 5.2x 2016 OEM sales Founded

4 10.9% of YTD Sales 32.8% of YTD Sales 56.3% of YTD Sales Organization Overview Stoneridge, Inc. (NYSE: SRI) Driver Information Systems Vision Systems Telematics Systems Tachograph Systems Electronic Control Units (ECU) Electronic Logging Devices Power & Switch Modules ELECTRONICS High Performance Actuators Sensors: Particle Matter (Soot), Temperature, Speed, Position, Pressure, Fluid Level, Torque Evaporative Emission Reduction and Solenoid Control Valves CONTROL DEVICES Track & Trace Telematics Safety & Security Electronic Modules Alarm & Remote Access Audio PST SRE SCD PST 2017 YTD Sales: $413.4m
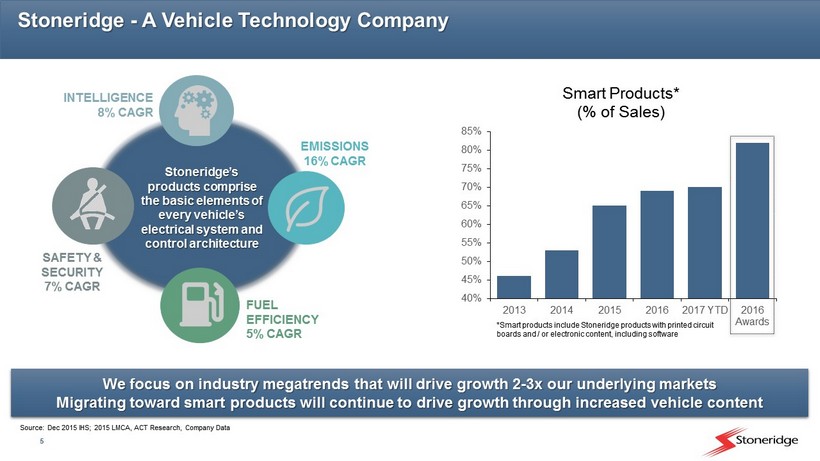
5 Stoneridge - A Vehicle Technology Company We focus on industry megatrends that will drive growth 2 - 3x our underlying markets Migrating toward smart products will continue to drive growth through increased vehicle content 40% 45% 50% 55% 60% 65% 70% 75% 80% 85% 2013 2014 2015 2016 2017 YTD 2016 Awards Smart Products* (% of Sales) *Smart products include Stoneridge products with printed circuit boards and / or electronic content, including software INTELLIGENCE 8% CAGR SAFETY & SECURITY 7% CAGR EMISSIONS 16% CAGR FUEL EFFICIENCY 5% CAGR Stoneridge’s products comprise the basic elements of every vehicle’s electrical system and control architecture Source: Dec 2015 IHS; 2015 LMCA, ACT Research, Company Data
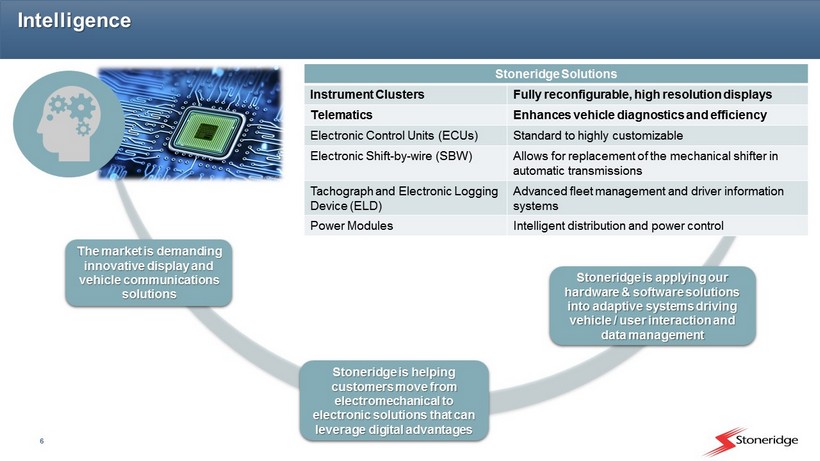
6 Intelligence Stoneridge is helping customers move from electromechanical to electronic solutions that can leverage digital advantages Stoneridge Solutions Instrument Clusters Fully reconfigurable, high resolution displays Telematics E nhances vehicle diagnostics and efficiency Electronic Control Units (ECUs) Standard to highly customizable Electronic Shift - by - wire (SBW) Allows for replacement of the mechanical shifter in automatic transmissions Tachograph and Electronic Logging Device (ELD) Advanced fleet management and driver information systems Power Modules Intelligent distribution and power control The market is demanding innovative display and vehicle communications solutions Stoneridge is applying our hardware & software solutions into adaptive systems driving vehicle / user interaction and data management
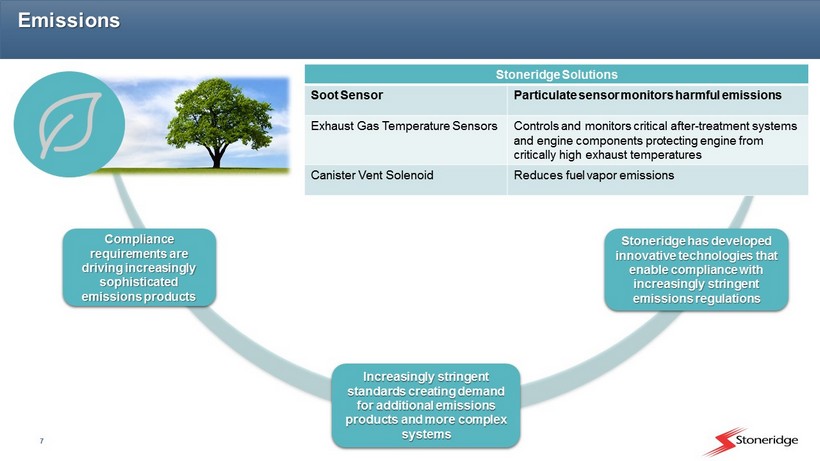
7 Emissions Compliance requirements are driving increasingly sophisticated emissions products Increasingly stringent standards creating demand for additional emissions products and more complex systems Stoneridge has developed innovative technologies that enable compliance with increasingly stringent emissions regulations Stoneridge Solutions Soot Sensor P articulate sensor monitors harmful emissions Exhaust Gas Temperature Sensors Controls and monitors critical after - treatment systems and engine components protecting engine from critically high exhaust temperatures Canister Vent Solenoid Reduces fuel vapor emissions
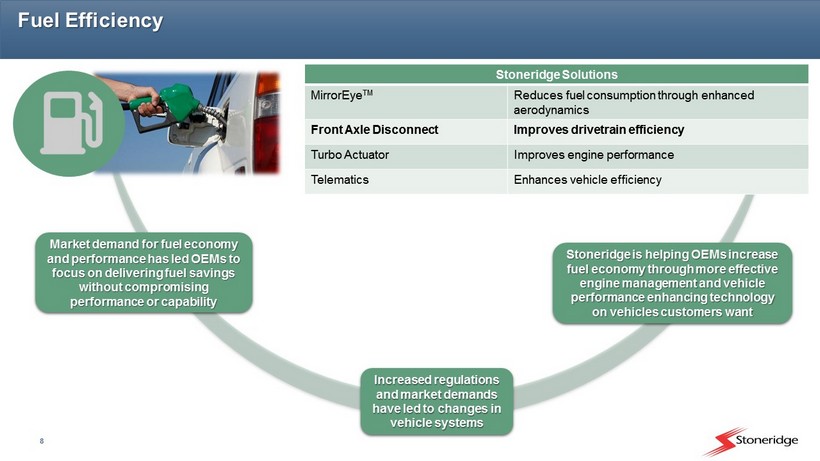
8 Fuel Efficiency Stoneridge Solutions Mirror Eye TM Reduces fuel consumption through enhanced aerodynamics Front Axle Disconnect Improves drivetrain efficiency Turbo Actuator Improves engine performance Telematics E nhances vehicle efficiency Market demand for fuel economy and performance has led OEMs to focus on delivering fuel savings without compromising performance or capability Increased regulations and market demands have led to changes in vehicle systems Stoneridge is helping OEMs increase fuel economy through more effective engine management and vehicle performance enhancing technology on vehicles customers want
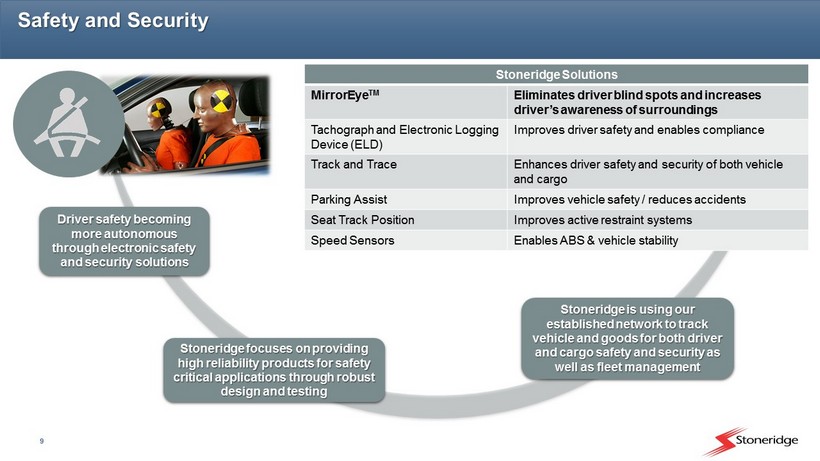
9 Safety and Security Stoneridge Solutions Mirror Eye TM Eliminates driver blind spots and increases driver’s awareness of surroundings Tachograph and Electronic Logging Device (ELD) Improves driver safety and enables compliance Track and Trace E nhances driver safety and security of both vehicle and cargo Parking Assist I mproves vehicle safety / reduces accidents Seat Track Position Improves active restraint systems Speed Sensors Enables ABS & vehicle stability Driver safety becoming more autonomous through electronic safety and security solutions Stoneridge focuses on providing high reliability products for safety critical applications through robust design and testing Stoneridge is using our established network to track vehicle and goods for both driver and cargo safety and security as well as fleet management

10 Financial Summary
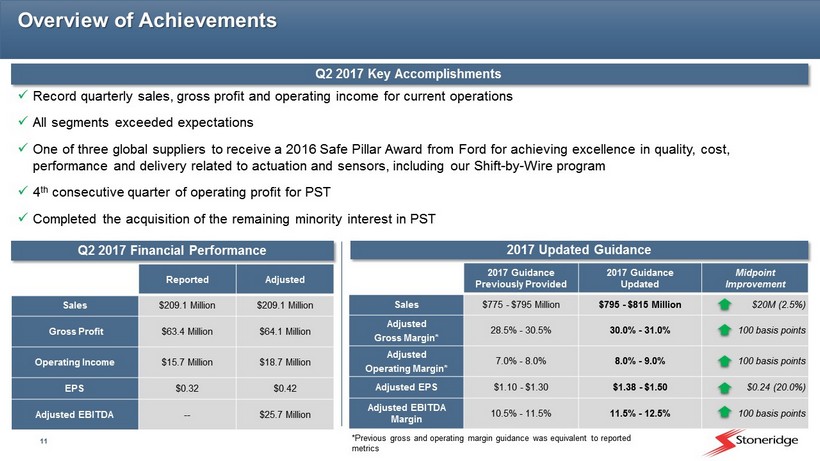
11 Overview of Achievements x Record quarterly sales, gross profit and operating income for current operations x All segments exceeded expectations x One of three global suppliers to receive a 2016 Safe Pillar Award from Ford for achieving excellence in quality, cost, performance and delivery related to actuation and sensors, including our Shift - by - Wire program x 4 th consecutive quarter of operating profit for PST x Completed the acquisition of the remaining minority interest in PST Q 2 2017 Key Accomplishments Q 2 2017 Financial Performance 2017 Updated Guidance 2017 Guidance Previously Provided 2017 Guidance Updated Midpoint Improvement Sales $775 - $795 Million $795 - $815 Million $20M (2.5%) Adjusted Gross Margin* 28.5% - 30.5% 30.0% - 31.0% 100 basis points Adjusted Operating Margin* 7.0% - 8.0% 8.0% - 9.0% 100 basis points Adjusted EPS $1.10 - $1.30 $1.38 - $1.50 $0.24 (20.0%) Adjusted EBITDA Margin 10.5% - 11.5% 11.5% - 12.5% 100 basis points *Previous gross and operating margin guidance was equivalent to reported metrics Reported Adjusted Sales $209.1 Million $209.1 Million Gross Profit $63.4 Million $64.1 Million Operating Income $15.7 Million $18.7 Million EPS $0.32 $0.42 Adjusted EBITDA -- $25.7 Million
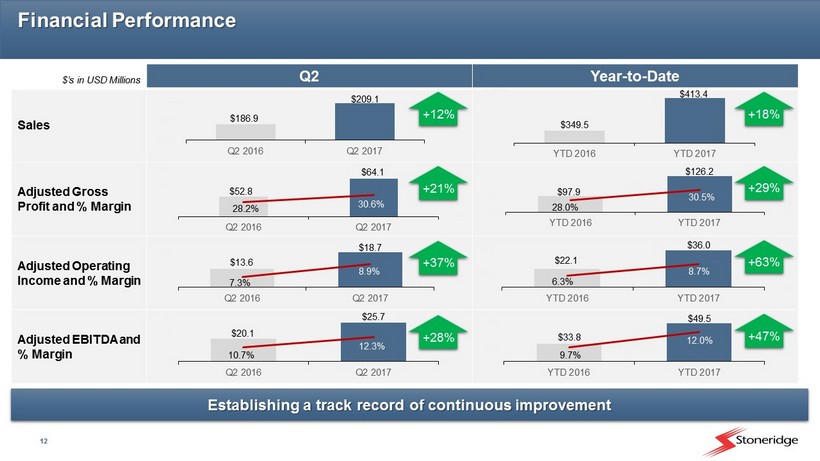
12 Financial Performance $’s in USD Millions Q2 Year - to - Date Sales Adjusted Gross Profit and % Margin Adjusted Operating Income and % Margin Adjusted EBITDA and % Margin $33.8 $49.5 9.7% 12.0% $20.0 $30.0 $40.0 $50.0 YTD 2016 YTD 2017 7.5% 9.5% 11.5% 13.5% $22.1 $36.0 6.3% 8.7% $8.0 $18.0 $28.0 $38.0 YTD 2016 YTD 2017 4.0% 9.0% $97.9 $126.2 28.0% 30.5% $75.0 $95.0 $115.0 YTD 2016 YTD 2017 25.0% 30.0% 35.0% $20.1 $25.7 10.7% 12.3% $12.0 $17.0 $22.0 $27.0 Q2 2016 Q2 2017 8.5% 10.5% 12.5% 14.5% $13.6 $18.7 7.3% 8.9% $8.0 $13.0 $18.0 Q2 2016 Q2 2017 6.0% 8.0% 10.0% $186.9 $209.1 $170.0 $190.0 $210.0 Q2 2016 Q2 2017 +12% $349.5 $413.4 $325.0 $375.0 $425.0 YTD 2016 YTD 2017 +18% $52.8 $64.1 28.2% 30.6% $40.0 $50.0 $60.0 $70.0 Q2 2016 Q2 2017 23.0% 28.0% 33.0% 38.0% +21% +37% +28% +29% +63% +47% Establishing a track record of continuous improvement

13 $60.0 Million $80.0 Million $100.0 Million $120.0 Million $140.0 Million Q3 2015 Q3 2016 Q4 2015 Q4 2016 Q1 2016 Q1 2017 Q2 2016 Q2 2017 Sales 13.9% 14.7% 13.3% 14.2% 14.5% 15.9% 16.7% 17.3% $5.0 Million $10.0 Million $15.0 Million $20.0 Million $25.0 Million Q3 2015 Q3 2016 Q4 2015 Q4 2016 Q1 2016 Q1 2017 Q2 2016 Q2 2017 Operating Income Control Devices Segment Update 2 - year sales CAGR of 16.5% Shift - by - wire launch in Q1 2016 Favorability relative to IHS estimates in Shift - by - Wire volume in the first half of 2017, specifically related to China Expansion of sales in Asia Growth in global demand for emissions sensors Front - axle disconnect growth tied to favorable light truck and SUV market conditions in North America 2 - year operating income CAGR of 28.9% Operational efficiency driving reduced material, labor and quality costs Design and development focused on extensions of existing technologies Control Devices is positioned for continued strong performance

14 4.8% 6.5% 7.7% 4.9% 6.4% 8.7% 6.8% 6.8% $0.0 Million $5.0 Million $10.0 Million Q3 2015 Q3 2016 Q4 2015 Q4 2016 Q1 2016 Q1 2017 Q2 2016 Q2 2017 Adjusted Operating Income* $50.0 Million $60.0 Million $70.0 Million $80.0 Million $90.0 Million Q3 2015 Q3 2016 Q4 2015 Q4 2016 Q1 2016 Q1 2017 Q2 2016 Q2 2017 Sales Electronics Segment Update *Q1 2017 and Q2 2017 adjusted to remove certain non - recurring expenses related to the acquisition of Orlaco Electronics performance facilitates the development of smart products that will drive growth across all segments 2 - year sales CAGR of 13.1% Improvement in the North American commercial vehicle market Orlaco acquisition Roll - off of certain programs, as expected, in 2017 – ramp - up of awarded replacement programs in 2018 2 - year adjusted operating income CAGR of 31.5% Favorable product mix, including addition of Orlaco Design and development offsetting margin expansion as we focus on future growth opportunities MirrorEye, fully configurable instrument clusters and connectivity products
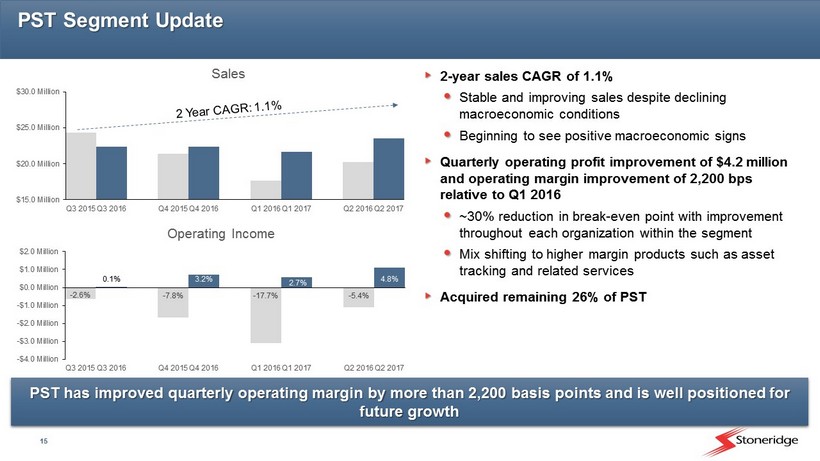
15 $15.0 Million $20.0 Million $25.0 Million $30.0 Million Q3 2015 Q3 2016 Q4 2015 Q4 2016 Q1 2016 Q1 2017 Q2 2016 Q2 2017 Sales PST Segment Update PST has improved quarterly operating margin by more than 2,200 basis points and is well positioned for future growth - 2.6% 0.1% - 7.8% 3.2% - 17.7% 2.7% - 5.4% 4.8% -$4.0 Million -$3.0 Million -$2.0 Million -$1.0 Million $0.0 Million $1.0 Million $2.0 Million Q3 2015 Q3 2016 Q4 2015 Q4 2016 Q1 2016 Q1 2017 Q2 2016 Q2 2017 Operating Income 2 - year sales CAGR of 1.1% Stable and improving sales despite declining macroeconomic conditions Beginning to see positive macroeconomic signs Quarterly operating profit improvement of $4.2 million and operating margin improvement of 2,200 bps relative to Q1 2016 ~30% reduction in break - even point with improvement throughout each organization within the segment Mix shifting to higher margin products such as asset tracking and related services Acquired remaining 26% of PST
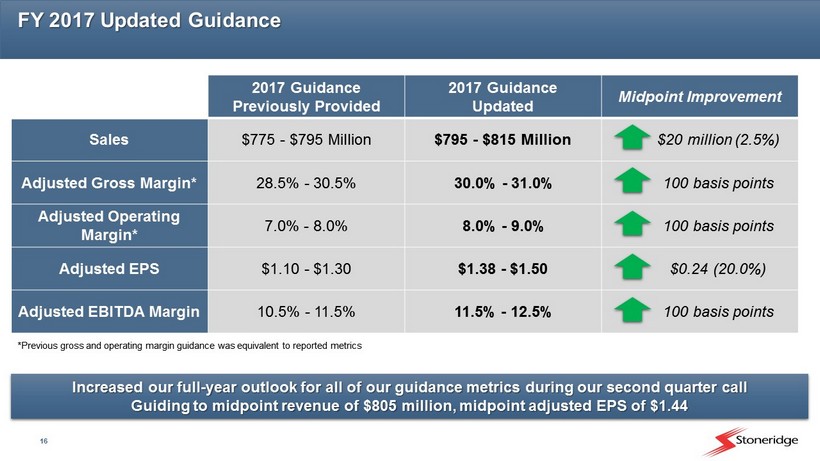
16 2017 Guidance Previously Provided 2017 Guidance Updated Midpoint Improvement Sales $775 - $795 Million $795 - $815 Million $20 million (2.5%) Adjusted Gross Margin* 28.5% - 30.5% 30.0% - 31.0% 100 basis points Adjusted Operating Margin* 7.0% - 8.0% 8.0% - 9.0% 100 basis points Adjusted EPS $1.10 - $1.30 $1.38 - $1.50 $0.24 (20.0%) Adjusted EBITDA Margin 10.5% - 11.5% 11.5% - 12.5% 100 basis points FY 2017 Updated Guidance Increased our full - year outlook for all of our guidance metrics during our second quarter call Guiding to midpoint revenue of $805 million, midpoint adjusted EPS of $1.44 *Previous gross and operating margin guidance was equivalent to reported metrics
17 Summary Stoneridge is a well - established, global, automotive technology company We are well diversified globally, by segment and by end - market with no one end - market* comprising more than 1/3 of our sales We are positioned to outpace vehicle market growth by 2 – 3x over the next 5 years by focusing on megatrends that outperform the underlying market and migrating our portfolio of products to smart products that will increase content per vehicle We deliver on our commitments and have established a trend of strong financial performance Our 2017 guidance was recently raised across each guided financial metric as a result of a strong first half of the year and the anticipation of continued strong results in the second half of the year *End - markets include passenger car, light truck / SUV, commercial vehicle, aftermarket and other, including agriculture, off - hig hway vehicles, material handling, etc.
18 Reconciliations to US GAAP
19 Reconciliations to US GAAP This document contains information about Stoneridge's financial results which is not presented in accordance with accounting principles generally accepted in the United States ("GAAP"). Such non - GAAP financial measures are reconciled to their closest GAAP financial measures in the appendix of this document. The provision of these non - GAAP financial measures for 2017 is not intended to indicate that Stoneridge is explicitly or implicitly providing projections on those non - GAAP financial measures, and actual results for such measures are likely to vary from those presented. The reconciliations include all information reasonably available to the Company at the date of this document and the adjustments that management can reasonably predict.
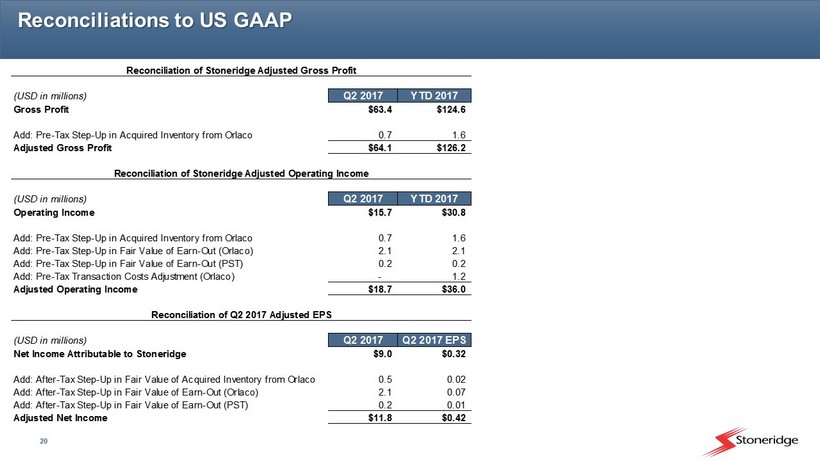
20 Reconciliations to US GAAP Reconciliation of Stoneridge Adjusted Gross Profit (USD in millions) Q2 2017 YTD 2017 Gross Profit $63.4 $124.6 Add: Pre-Tax Step-Up in Acquired Inventory from Orlaco 0.7 1.6 Adjusted Gross Profit $64.1 $126.2 Reconciliation of Stoneridge Adjusted Operating Income (USD in millions) Q2 2017 YTD 2017 Operating Income $15.7 $30.8 Add: Pre-Tax Step-Up in Acquired Inventory from Orlaco 0.7 1.6 Add: Pre-Tax Step-Up in Fair Value of Earn-Out (Orlaco) 2.1 2.1 Add: Pre-Tax Step-Up in Fair Value of Earn-Out (PST) 0.2 0.2 Add: Pre-Tax Transaction Costs Adjustment (Orlaco) - 1.2 Adjusted Operating Income $18.7 $36.0 Reconciliation of Q2 2017 Adjusted EPS Reconciliation of Q2 Adjusted EBITDA (USD in millions) Q2 2017 Q2 2017 EPS Net Income Attributable to Stoneridge $9.0 $0.32 Add: After-Tax Step-Up in Fair Value of Acquired Inventory from Orlaco 0.5 0.02 Add: After-Tax Step-Up in Fair Value of Earn-Out (Orlaco) 2.1 0.07 Add: After-Tax Step-Up in Fair Value of Earn-Out (PST) 0.2 0.01 Adjusted Net Income $11.8 $0.42
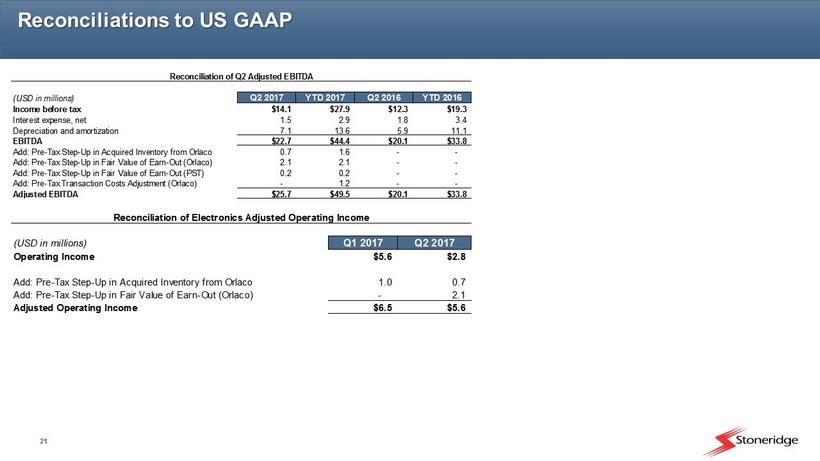
21 Reconciliations to US GAAP Reconciliation of Q2 Adjusted EBITDA (USD in millions) Q2 2017 YTD 2017 Q2 2016 YTD 2016 Income before tax $14.1 $27.9 $12.3 $19.3 Interest expense, net 1.5 2.9 1.8 3.4 Depreciation and amortization 7.1 13.6 5.9 11.1 EBITDA $22.7 $44.4 $20.1 $33.8 Add: Pre-Tax Step-Up in Acquired Inventory from Orlaco 0.7 1.6 - - Add: Pre-Tax Step-Up in Fair Value of Earn-Out (Orlaco) 2.1 2.1 - - Add: Pre-Tax Step-Up in Fair Value of Earn-Out (PST) 0.2 0.2 - - Add: Pre-Tax Transaction Costs Adjustment (Orlaco) - 1.2 - - Adjusted EBITDA $25.7 $49.5 $20.1 $33.8 Reconciliation of Electronics Adjusted Operating Income (USD in millions) Q1 2017 Q2 2017 Operating Income $5.6 $2.8 Add: Pre-Tax Step-Up in Acquired Inventory from Orlaco 1.0 0.7 Add: Pre-Tax Step-Up in Fair Value of Earn-Out (Orlaco) - 2.1 Adjusted Operating Income $6.5 $5.6